Embed Size (px)
Citation preview
Constituent Screening forCoal Combustion Wastes
Work Assignment 3-43Contract No. 68-W-98-085
Prepared for:
U.S. Environmental Protection AgencyOffice of Solid Waste
Research Triangle Park, NC 27709
Prepared by:
RTIP.O. Box 12194
Research Triangle Park, NC 27709
October 2002

Constituent Screening for Coal Combustion Wastes
Work Assignment No. 3-43Contract No. 68-W-98-085
Prepared for:
U.S. Environmental Protection AgencyOffice of Solid Waste
Research Triangle Park, NC 27709
Prepared by:
RTIP.O. Box 12194
Research Triangle Park, NC 27709
October 2002
iii
Table of Contents
Section Page
1.0 Problem Formulation . . . . . . . . . . . . . . . . . . . . . . . . . . . . . . . . . . . . . . . . . . . . . . . . . . . 1-1
2.0 Analysis . . . . . . . . . . . . . . . . . . . . . . . . . . . . . . . . . . . . . . . . . . . . . . . . . . . . . . . . . . . . . 2-12.1 Waste Constituents of Concern . . . . . . . . . . . . . . . . . . . . . . . . . . . . . . . . . . . . . 2-2
2.1.1 Selection and Grouping of Waste Types of Concern . . . . . . . . . . . . . . . 2-32.1.2 Selection of Appropriate Analyte Data for Screening . . . . . . . . . . . . . . 2-42.1.3 Development of Waste Constituent Concentrations for Screening . . . . 2-5
2.2 Human Health Benchmarks . . . . . . . . . . . . . . . . . . . . . . . . . . . . . . . . . . . . . . . . 2-72.3 Ecological Receptors, Endpoints, and Benchmarks . . . . . . . . . . . . . . . . . . . . 2-112.4 Exposure Assessment . . . . . . . . . . . . . . . . . . . . . . . . . . . . . . . . . . . . . . . . . . . . 2-12
2.4.1 Human Health-Based Numbers (HBNs) . . . . . . . . . . . . . . . . . . . . . . . 2-122.4.2 Ecological Chemical Stressor Concentration Limits (CSCLs) . . . . . . 2-132.4.3 Media-Specific Exposure Concentrations . . . . . . . . . . . . . . . . . . . . . . 2-15
2.5 Risk Calculations . . . . . . . . . . . . . . . . . . . . . . . . . . . . . . . . . . . . . . . . . . . . . . . 2-17
3.0 Risk Characterization . . . . . . . . . . . . . . . . . . . . . . . . . . . . . . . . . . . . . . . . . . . . . . . . . . 3-13.1 Human Health Results—Groundwater Pathways . . . . . . . . . . . . . . . . . . . . . . . 3-1
3.1.1 Groundwater-to-Drinking-Water Pathway . . . . . . . . . . . . . . . . . . . . . . 3-13.1.2 Groundwater-to-Surface-Water Pathway . . . . . . . . . . . . . . . . . . . . . . . 3-43.1.3 Summary and Conclusions: Groundwater Pathway Analysis . . . . . . . . 3-7
3.2 Human Health Results—Aboveground Pathways . . . . . . . . . . . . . . . . . . . . . . . 3-73.3 Ecological Risk Results . . . . . . . . . . . . . . . . . . . . . . . . . . . . . . . . . . . . . . . . . . 3-10
3.3.1 Soil Pathways . . . . . . . . . . . . . . . . . . . . . . . . . . . . . . . . . . . . . . . . . . . . 3-103.3.2 Surface Water Pathways . . . . . . . . . . . . . . . . . . . . . . . . . . . . . . . . . . . 3-123.3.3 Ecological Risk Conclusions and Recommendations . . . . . . . . . . . . . 3-16
3.4 Conclusions and Recommendations . . . . . . . . . . . . . . . . . . . . . . . . . . . . . . . . 3-173.4.1 Aboveground Pathways . . . . . . . . . . . . . . . . . . . . . . . . . . . . . . . . . . . . 3-173.4.2 Groundwater Pathways . . . . . . . . . . . . . . . . . . . . . . . . . . . . . . . . . . . . 3-193.4.3 Constituents Not Addressed in the Screening Analysis . . . . . . . . . . . . 3-20
4.0 References . . . . . . . . . . . . . . . . . . . . . . . . . . . . . . . . . . . . . . . . . . . . . . . . . . . . . . . . . . . 4-1
Appendix A–CCW Constituent Data . . . . . . . . . . . . . . . . . . . . . . . . . . . . . . . . . . . . . . . . . . . . A-1Appendix B–Human Health Benchmarks . . . . . . . . . . . . . . . . . . . . . . . . . . . . . . . . . . . . . . . . . B-1Appendix C–Chemical Stressor Concentration Limits (CSCLs) for Ecological Screening . . . C-1Appendix D–Calculation of Health-Based Numbers (HBNs) . . . . . . . . . . . . . . . . . . . . . . . . . D-1Appendix E–Chemical-Specific Inputs . . . . . . . . . . . . . . . . . . . . . . . . . . . . . . . . . . . . . . . . . . . E-1Appendix F–Biota Factors . . . . . . . . . . . . . . . . . . . . . . . . . . . . . . . . . . . . . . . . . . . . . . . . . . . . . F-1Appendix G–Human Exposure Factors . . . . . . . . . . . . . . . . . . . . . . . . . . . . . . . . . . . . . . . . . . G-1Appendix H–Site Data . . . . . . . . . . . . . . . . . . . . . . . . . . . . . . . . . . . . . . . . . . . . . . . . . . . . . . . H-1Appendix I–Tabulated Human Health Screening Results . . . . . . . . . . . . . . . . . . . . . . . . . . . . . I-1Appendix J–Tabulated Ecological Risk Screening Results . . . . . . . . . . . . . . . . . . . . . . . . . . . . J-1
iv
List of Figures
Figure Page
1-1. Conceptual model of CCW risk assessment for landfills and surface impoundments . 1-32-1. Comparison of 1998 and 2002 CCW porewater concentration data . . . . . . . . . . . . . . . 2-82-2. Comparison of 1998 and 2002 CCW TCLP data . . . . . . . . . . . . . . . . . . . . . . . . . . . . . 2-92-3. Comparison of 1998 and 2002 CCW landfill whole waste concentration data . . . . . . 2-102-4. Soil dilution factors from the 1998 aboveground risk analysis for CCW landfills. . . 2-173-1. CCW surface impoundment porewater screening risk levels for the
groundwater-to-drinking-water pathway . . . . . . . . . . . . . . . . . . . . . . . . . . . . . . . . . . . . 3-23-2 CCW landfill leachate screening risk levels for the groundwater-to-
drinking-water pathway . . . . . . . . . . . . . . . . . . . . . . . . . . . . . . . . . . . . . . . . . . . . . . . . . 3-33-3. CCW surface impoundment porewater screening risk levels for the
surface water (fish consumption) and drinking water pathways . . . . . . . . . . . . . . . . . . 3-53-4. CCW landfill leachate screening risk levels for the surface water
(fish consumption) and drinking water pathways. . . . . . . . . . . . . . . . . . . . . . . . . . . . . . 3-63-5. Comparison of 1998 and 2002 aboveground human health risk results for the
soil pathway . . . . . . . . . . . . . . . . . . . . . . . . . . . . . . . . . . . . . . . . . . . . . . . . . . . . . . . . . . 3-93-6. CCW landfill aboveground ecological screening risks: Soil pathway . . . . . . . . . . . . 3-113-7. CCW surface impoundment ecological screening risks: Groundwater-to-surface-
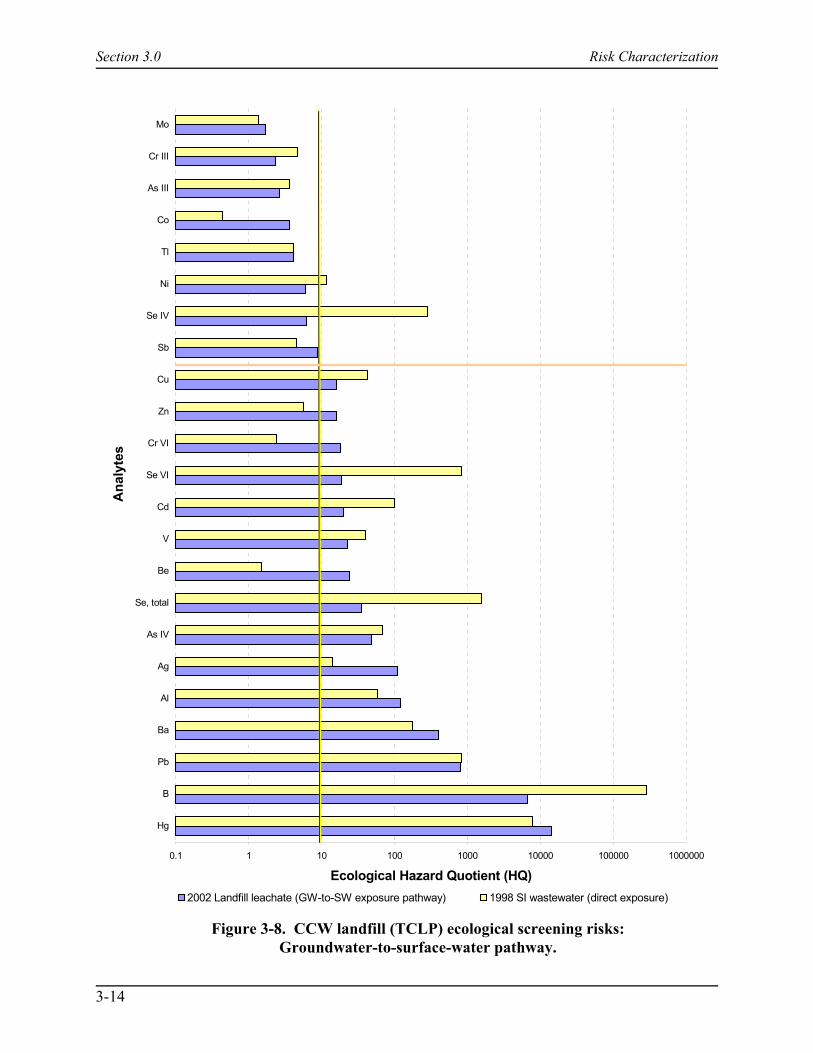
water pathway . . . . . . . . . . . . . . . . . . . . . . . . . . . . . . . . . . . . . . . . . . . . . . . . . . . . . . . 3-133-8. CCW landfill (TCLP) ecological screening risks: Groundwater-to-surface-
water pathway . . . . . . . . . . . . . . . . . . . . . . . . . . . . . . . . . . . . . . . . . . . . . . . . . . . . . . . 3-143-9. CCW landfill aboveground ecological screening risks: Sediment pathway . . . . . . . . 3-15

v
List of Tables
Table Page
2-1. Constituents Addressed in the Screening Analysis . . . . . . . . . . . . . . . . . . . . . . . . . . . . 2-22-2. Waste Types in CCW Constituent Database . . . . . . . . . . . . . . . . . . . . . . . . . . . . . . . . . 2-32-3. Comparison/Hierarchy of Leaching Methods Represented in CCW
Constituent Database . . . . . . . . . . . . . . . . . . . . . . . . . . . . . . . . . . . . . . . . . . . . . . . . . . . 2-52-4. Ecological Receptors Assessed in Each Medium . . . . . . . . . . . . . . . . . . . . . . . . . . . . 2-112-5. CSCL Exposure Assumptions for Mammals and Birds . . . . . . . . . . . . . . . . . . . . . . . 2-152-6. Comparison of IWEM and CCW Landfill Areas . . . . . . . . . . . . . . . . . . . . . . . . . . . . 2-162-7. Comparison of IWEM and CCW Surface Impoundment Areas . . . . . . . . . . . . . . . . . 2-163-1 Summary of Screening Results: Constituents Exceeding Human Health
Screening Criteria for Groundwater Pathways . . . . . . . . . . . . . . . . . . . . . . . . . . . . . . . 3-83-2. CCW Screening Results Summary . . . . . . . . . . . . . . . . . . . . . . . . . . . . . . . . . . . . . . . 3-183-3. Summary of CCW Screening Results: Groundwater Pathway Exceedances . . . . . . . 3-193-4. CCW Constituents/Measurements Not Addressed in Screening Because of
Lack of Benchmarks . . . . . . . . . . . . . . . . . . . . . . . . . . . . . . . . . . . . . . . . . . . . . . . . . . 3-21

Section 1.0 Problem Formulation
1-1
Constituent Screening for Coal Combustion Wastes
This report presents the methodology and results from RTI's screening and selection ofconstituents of concern for the coal combustion wastes (CCW) risk assessment. RTI developedand applied a risk-based methodology for selecting CCW chemical constituents, waste types,receptors, and exposure pathways for detailed modeling or additional study. Screening wasconducted for the following receptors and pathways of concern:
# Human health impacts from groundwater contamination# Human health impacts from aboveground contamination# Ecological impacts from groundwater contamination# Ecological impacts from aboveground contamination.
Previous risk assessment results for CCW (U.S. EPA, 1998) indicated concern for thegroundwater pathway and limited concern for aboveground pathways for human and ecologicalreceptors. The primary purpose of this risk assessment is to update those results byincorporating new waste characterization data received since 1998 and by applying current dataand methodologies to the risk assessment. The initial step in this process is screening andconstituent selection for a more detailed analysis.
1.0 Problem FormulationFor more than 10 years, the U.S. Environmental Protection Agency (EPA) has conducted
risk assessments to assist regulators, industry, and the public in evaluating the environmentalrisks associated with CCW landfills, surface impoundments, other disposal procedures, andbeneficial uses. In April 2000, the Agency determined that certain coal combustion waste wouldbe subject to Resource Conservation and Recovery Act (RCRA) Subtitle D regulation, but didnot specify the regulatory options at that time. This screening analysis is a first step towardidentifying and quantifying human health and ecological risks that may be associated withcurrent management practices for high-volume CCW: fly ash, bottom ash, boiler slag, flue gasdesulfurization (FGD) sludge, and wastes from fluidized-bed combustion (FBC) units. TheseCCW risk assessments will assist the Agency in developing specific CCW regulatory options forthese waste streams under RCRA Subtitle D regulation. Details on EPA's CCW project,including work conducted to date, can be found athttp://www.epa.gov./epaoswer/other/fossil/index.htm.
Section 1.0 Problem Formulation
1-2
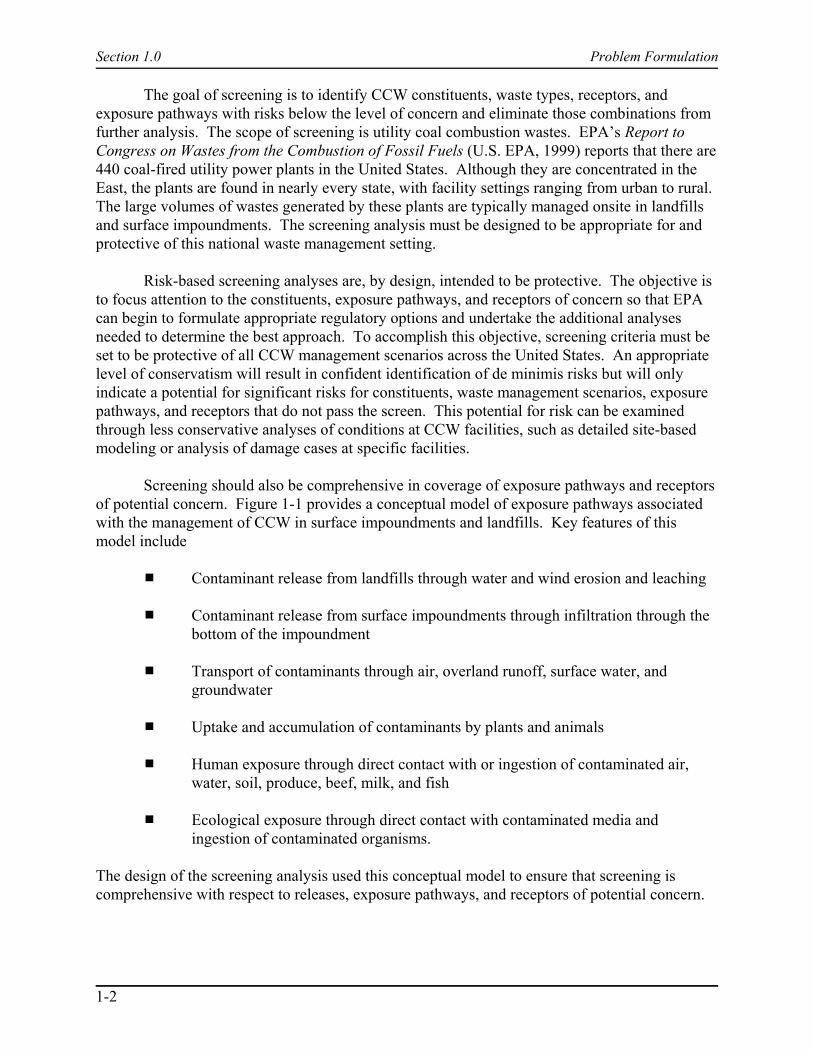
The goal of screening is to identify CCW constituents, waste types, receptors, andexposure pathways with risks below the level of concern and eliminate those combinations fromfurther analysis. The scope of screening is utility coal combustion wastes. EPA’s Report toCongress on Wastes from the Combustion of Fossil Fuels (U.S. EPA, 1999) reports that there are440 coal-fired utility power plants in the United States. Although they are concentrated in theEast, the plants are found in nearly every state, with facility settings ranging from urban to rural. The large volumes of wastes generated by these plants are typically managed onsite in landfillsand surface impoundments. The screening analysis must be designed to be appropriate for andprotective of this national waste management setting.
Risk-based screening analyses are, by design, intended to be protective. The objective isto focus attention to the constituents, exposure pathways, and receptors of concern so that EPAcan begin to formulate appropriate regulatory options and undertake the additional analysesneeded to determine the best approach. To accomplish this objective, screening criteria must beset to be protective of all CCW management scenarios across the United States. An appropriatelevel of conservatism will result in confident identification of de minimis risks but will onlyindicate a potential for significant risks for constituents, waste management scenarios, exposurepathways, and receptors that do not pass the screen. This potential for risk can be examinedthrough less conservative analyses of conditions at CCW facilities, such as detailed site-basedmodeling or analysis of damage cases at specific facilities.
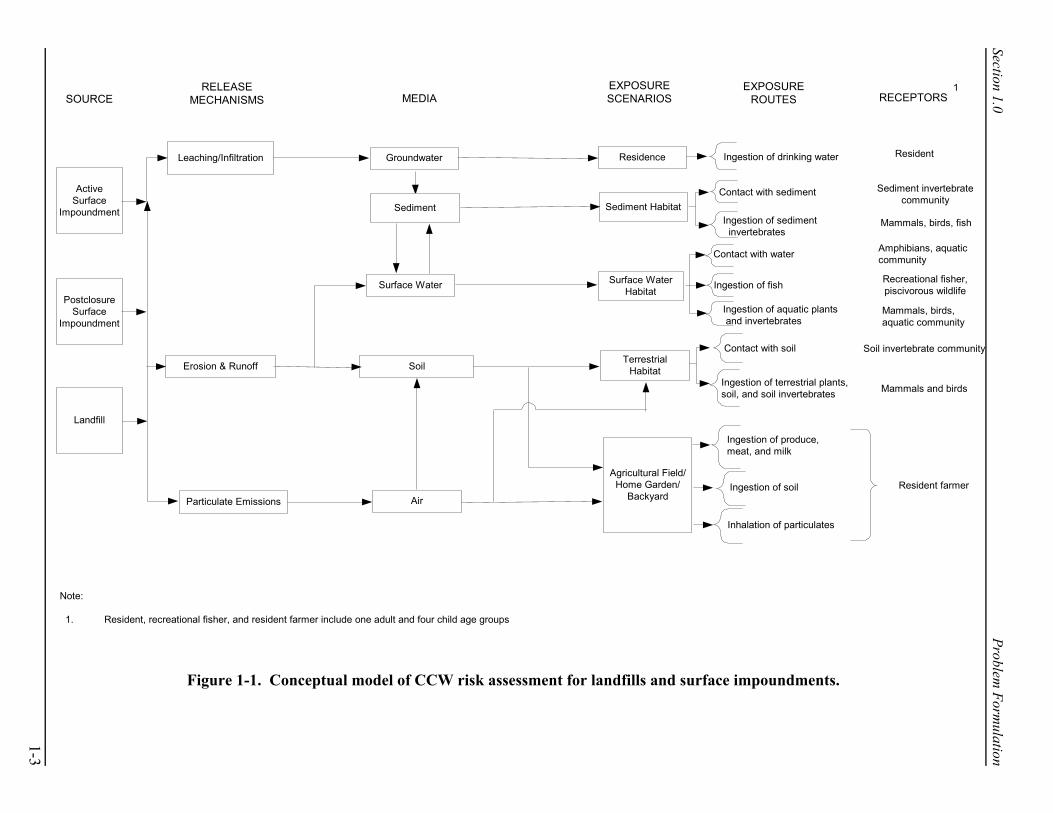
Screening should also be comprehensive in coverage of exposure pathways and receptorsof potential concern. Figure 1-1 provides a conceptual model of exposure pathways associatedwith the management of CCW in surface impoundments and landfills. Key features of thismodel include
# Contaminant release from landfills through water and wind erosion and leaching
# Contaminant release from surface impoundments through infiltration through thebottom of the impoundment
# Transport of contaminants through air, overland runoff, surface water, andgroundwater
# Uptake and accumulation of contaminants by plants and animals
# Human exposure through direct contact with or ingestion of contaminated air,water, soil, produce, beef, milk, and fish
# Ecological exposure through direct contact with contaminated media andingestion of contaminated organisms.
The design of the screening analysis used this conceptual model to ensure that screening iscomprehensive with respect to releases, exposure pathways, and receptors of potential concern.
1-3
Section 1.0 Problem
Formulation
SOURCERELEASE
MECHANISMS MEDIAEXPOSURESCENARIOS
EXPOSUREROUTES RECEPTORS
Erosion & Runoff Soil
Leaching/Infiltration Groundwater Residence
PostclosureSurface
Impoundment
Ingestion of drinking water Resident
1
Agricultural Field/Home Garden/
Backyard
TerrestrialHabitat
Surface WaterHabitat
Ingestion of produce,meat, and milk
Contact with soil Soil invertebrate community
Surface Water Ingestion of fish
Inhalation of particulates
Ingestion of soil Resident farmer
Recreational fisher,piscivorous wildlife
Particulate Emissions Air
Note:
1. Resident, recreational fisher, and resident farmer include one adult and four child age groups
Ingestion of terrestrial plants,soil, and soil invertebrates Mammals and birds
Contact with water Amphibians, aquaticcommunity
Ingestion of aquatic plants and invertebrates
Mammals, birds,aquatic community
SedimentContact with sediment Sediment invertebrate
community
Ingestion of sediment invertebrates
Mammals, birds, fish
ActiveSurface
Impoundment
Landfill
Sediment Habitat
Figure 1-1. Conceptual model of CCW risk assessment for landfills and surface impoundments.
Section 2.0 Analysis
1For the groundwater-to-surface-water pathway, the analysis assumes human exposure occurs through theconsumption of contaminated fish. Ecological exposure occurs through direct contact to contaminated surface waterand sediment and consumption of aquatic organisms.
2-1
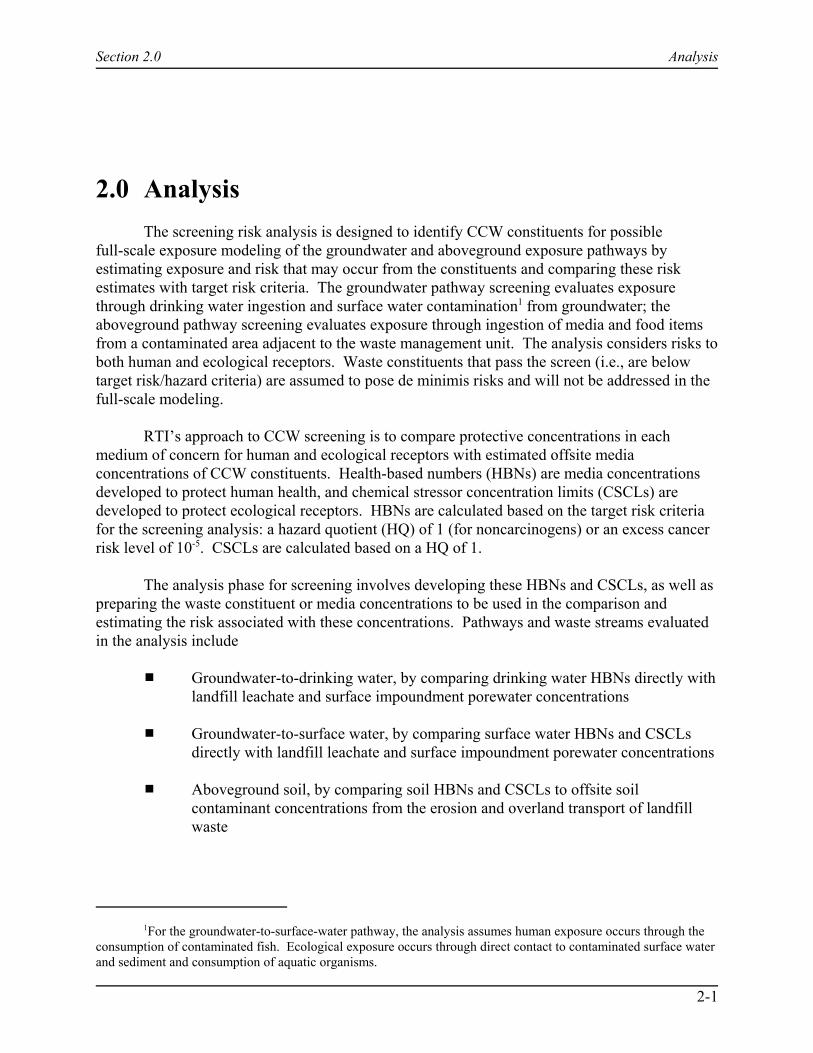
2.0 AnalysisThe screening risk analysis is designed to identify CCW constituents for possible
full-scale exposure modeling of the groundwater and aboveground exposure pathways byestimating exposure and risk that may occur from the constituents and comparing these riskestimates with target risk criteria. The groundwater pathway screening evaluates exposurethrough drinking water ingestion and surface water contamination1 from groundwater; theaboveground pathway screening evaluates exposure through ingestion of media and food itemsfrom a contaminated area adjacent to the waste management unit. The analysis considers risks toboth human and ecological receptors. Waste constituents that pass the screen (i.e., are belowtarget risk/hazard criteria) are assumed to pose de minimis risks and will not be addressed in thefull-scale modeling.
RTI’s approach to CCW screening is to compare protective concentrations in eachmedium of concern for human and ecological receptors with estimated offsite mediaconcentrations of CCW constituents. Health-based numbers (HBNs) are media concentrationsdeveloped to protect human health, and chemical stressor concentration limits (CSCLs) aredeveloped to protect ecological receptors. HBNs are calculated based on the target risk criteriafor the screening analysis: a hazard quotient (HQ) of 1 (for noncarcinogens) or an excess cancerrisk level of 10-5. CSCLs are calculated based on a HQ of 1.
The analysis phase for screening involves developing these HBNs and CSCLs, as well aspreparing the waste constituent or media concentrations to be used in the comparison andestimating the risk associated with these concentrations. Pathways and waste streams evaluatedin the analysis include
# Groundwater-to-drinking water, by comparing drinking water HBNs directly withlandfill leachate and surface impoundment porewater concentrations
# Groundwater-to-surface water, by comparing surface water HBNs and CSCLsdirectly with landfill leachate and surface impoundment porewater concentrations
# Aboveground soil, by comparing soil HBNs and CSCLs to offsite soilcontaminant concentrations from the erosion and overland transport of landfillwaste
Section 2.0 Analysis
2-2
# Aboveground sediments, by comparing sediment CSCLs to sediment contaminantconcentrations from the erosion and overland transport of landfill waste andcontaminated soil.
Direct ecological exposure to surface impoundment waters was not considered because no newdata were available. Results for this pathway from the 1998 CCW ecological risk assessment areprovided in the summary table and figures in Section 3.0.
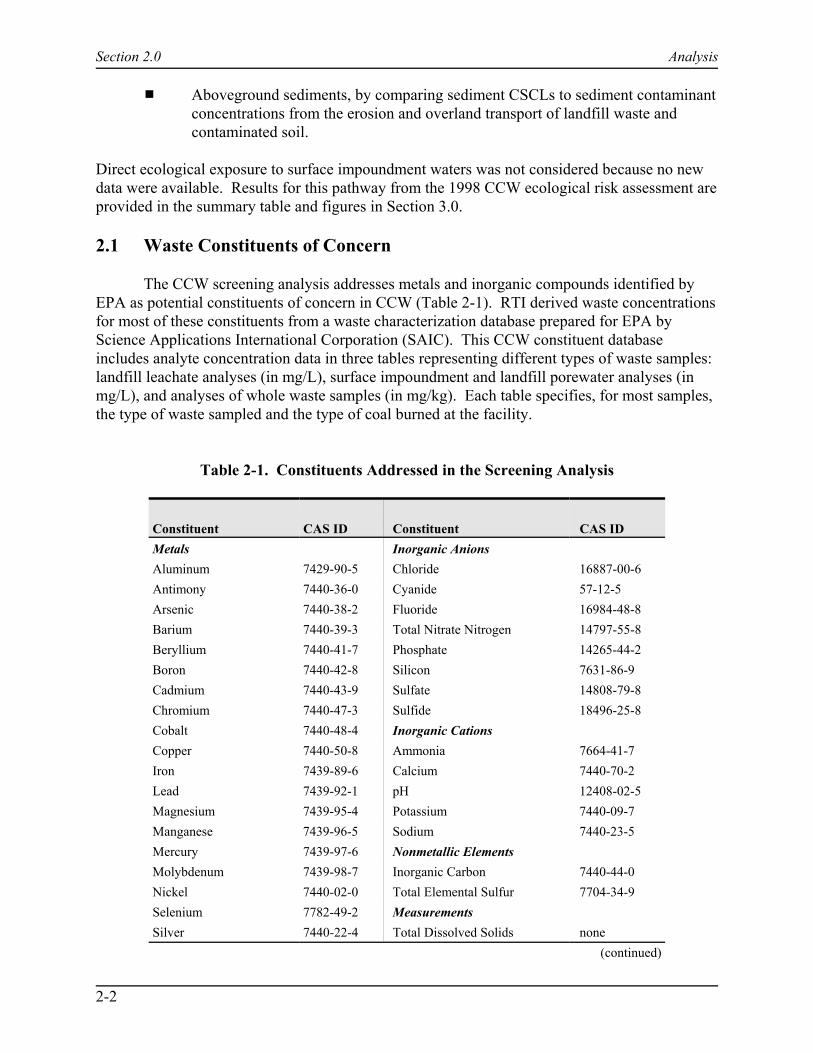
2.1 Waste Constituents of Concern
The CCW screening analysis addresses metals and inorganic compounds identified byEPA as potential constituents of concern in CCW (Table 2-1). RTI derived waste concentrationsfor most of these constituents from a waste characterization database prepared for EPA byScience Applications International Corporation (SAIC). This CCW constituent databaseincludes analyte concentration data in three tables representing different types of waste samples:landfill leachate analyses (in mg/L), surface impoundment and landfill porewater analyses (inmg/L), and analyses of whole waste samples (in mg/kg). Each table specifies, for most samples,the type of waste sampled and the type of coal burned at the facility.
Table 2-1. Constituents Addressed in the Screening Analysis
Constituent CAS ID Constituent CAS IDMetals Inorganic AnionsAluminum 7429-90-5 Chloride 16887-00-6Antimony 7440-36-0 Cyanide 57-12-5Arsenic 7440-38-2 Fluoride 16984-48-8Barium 7440-39-3 Total Nitrate Nitrogen 14797-55-8Beryllium 7440-41-7 Phosphate 14265-44-2Boron 7440-42-8 Silicon 7631-86-9Cadmium 7440-43-9 Sulfate 14808-79-8Chromium 7440-47-3 Sulfide 18496-25-8Cobalt 7440-48-4 Inorganic CationsCopper 7440-50-8 Ammonia 7664-41-7Iron 7439-89-6 Calcium 7440-70-2Lead 7439-92-1 pH 12408-02-5Magnesium 7439-95-4 Potassium 7440-09-7Manganese 7439-96-5 Sodium 7440-23-5Mercury 7439-97-6 Nonmetallic ElementsMolybdenum 7439-98-7 Inorganic Carbon 7440-44-0Nickel 7440-02-0 Total Elemental Sulfur 7704-34-9Selenium 7782-49-2 MeasurementsSilver 7440-22-4 Total Dissolved Solids none
(continued)
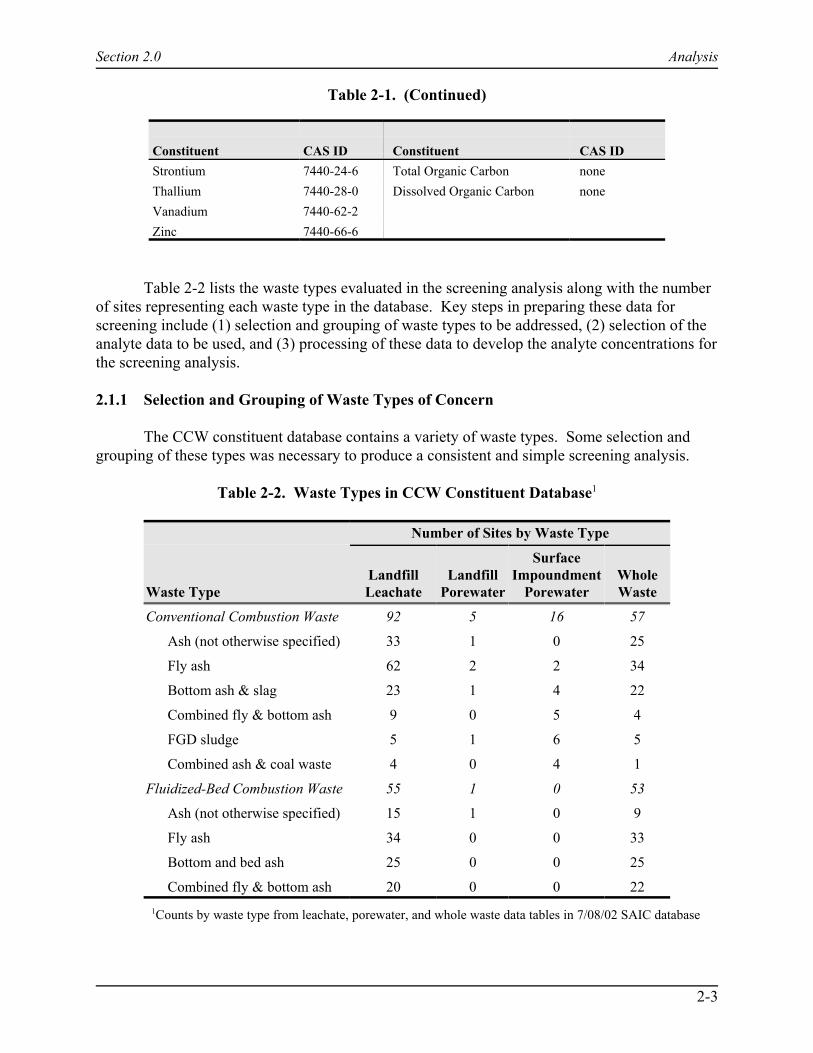
Table 2-1. (Continued)
Section 2.0 Analysis
Constituent CAS ID Constituent CAS ID
2-3
Strontium 7440-24-6 Total Organic Carbon noneThallium 7440-28-0 Dissolved Organic Carbon noneVanadium 7440-62-2Zinc 7440-66-6
Table 2-2 lists the waste types evaluated in the screening analysis along with the numberof sites representing each waste type in the database. Key steps in preparing these data forscreening include (1) selection and grouping of waste types to be addressed, (2) selection of theanalyte data to be used, and (3) processing of these data to develop the analyte concentrations forthe screening analysis.
2.1.1 Selection and Grouping of Waste Types of Concern
The CCW constituent database contains a variety of waste types. Some selection andgrouping of these types was necessary to produce a consistent and simple screening analysis.
Table 2-2. Waste Types in CCW Constituent Database1
Waste Type
Number of Sites by Waste Type
LandfillLeachate
LandfillPorewater
SurfaceImpoundment
PorewaterWholeWaste
Conventional Combustion Waste 92 5 16 57
Ash (not otherwise specified) 33 1 0 25
Fly ash 62 2 2 34
Bottom ash & slag 23 1 4 22
Combined fly & bottom ash 9 0 5 4
FGD sludge 5 1 6 5
Combined ash & coal waste 4 0 4 1
Fluidized-Bed Combustion Waste 55 1 0 53
Ash (not otherwise specified) 15 1 0 9
Fly ash 34 0 0 33
Bottom and bed ash 25 0 0 25
Combined fly & bottom ash 20 0 0 221Counts by waste type from leachate, porewater, and whole waste data tables in 7/08/02 SAIC database

Section 2.0 Analysis
2-4
The analysis excludes coal waste (e.g., mill rejects, coal gob, storage pile runoff) becauseit is not coal combustion waste and, therefore, is out of scope for the analysis. Mixed ash andcoal waste are included. Mine-filled waste is included under the assumption that it isrepresentative of wastes destined for mine waste disposal and that similar waste could bedisposed of in landfills and surface impoundments. However, porewater from mine wastedisposal sites is excluded from the analysis because acidic conditions characteristic of minedisposal sites are not characteristic of the CCW landfills and surface impoundments that are thesubject of this analysis.
Combustion ash types in the CCW constituent database include fly ash, bottom ash, bedash, slag, combined fly and bottom ash, and coal ash not otherwise specified. The analysiscombines data for these ash types, as appropriate, for landfills and surface impoundments at thesame site. However, units holding FBC wastes, FGD sludges, and codisposed ash and coalwaste are addressed separately because the composition and chemistry of these wastes are likelyto be different from those of coal combustion ash. That is, the analyte concentration data forFBC wastes, FGD sludges, and combined ash and coal waste are not mixed with analyteconcentration data for ash from conventional coal combustion units.
2.1.2 Selection of Appropriate Analyte Data for Screening
CCW analyte concentration data represent (1) leachate from landfills and surfaceimpoundments and (2) whole waste in landfills, as follows.
# Whole waste analyte concentrations (in mg/kg) represent landfill wasteconcentrations for screening the aboveground pathways.
# Analyte concentrations (in mg/L) in porewater sampled from surfaceimpoundment sediments represent surface impoundment leachate affecting thegroundwater pathways.
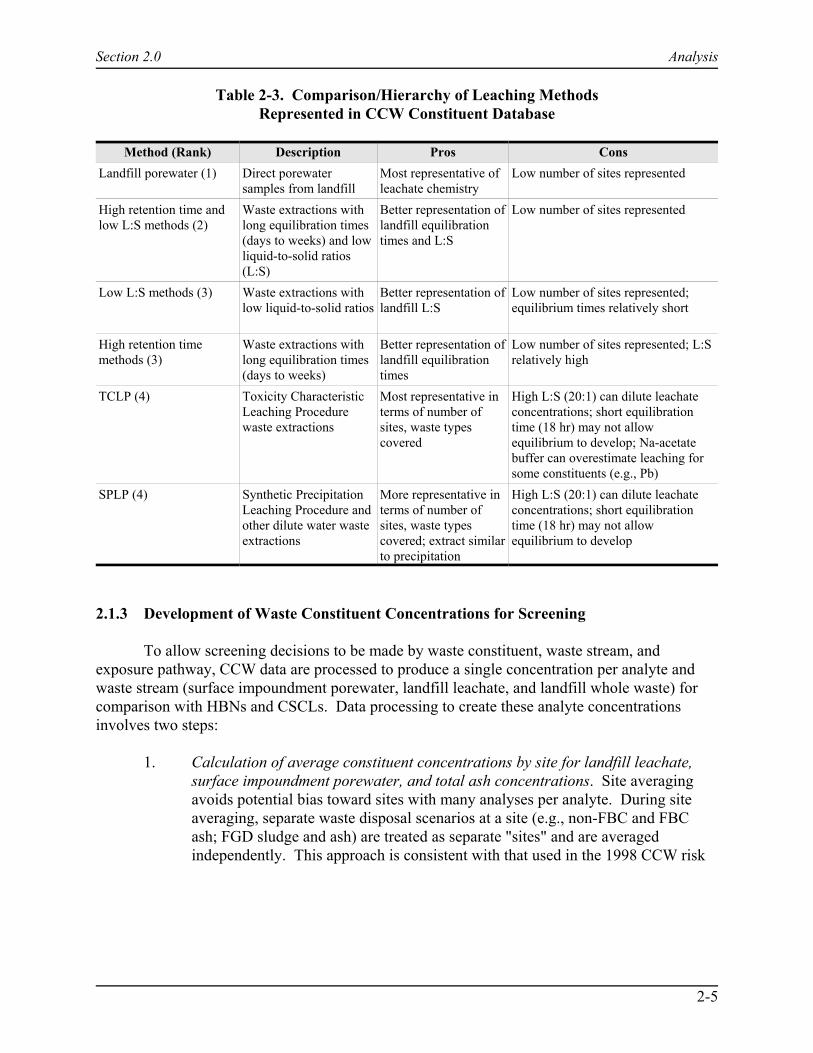
# To represent landfill leachate, the leachate table in the CCW constituentconcentration database includes analyte concentrations from several leachingmethods. Data are also available from landfill porewater analyses at six sites inthe porewater data table. Table 2-3 describes the method types included in thedatabase, along with the decision hierarchy used when several types of leachingdata are available for a disposal site.
As shown in Table 2-3, the methods thought to best represent long-term waste monofillporewater composition (i.e., methods with long equilibration times and low liquid-to-solid ratios)represent only a few sites, with most sites having toxic characteristic leaching procedure (TCLP)and/or synthetic precipitation leaching procedure (SPLP) measurements. To best represent CCWlandfill waste concentration at a wide variety of sites, the hierarchy rank shown in Table 2-3 isused to select the best method for a particular site. For sites where two or more methods areavailable in the same rank (which often occurs for SPLP and TCLP analyses), the screeninganalysis uses the method with the highest analyte concentrations. This ensures that the data usedin the screening analysis are the best that are available and represent a broad variety wastedisposal conditions.
Section 2.0 Analysis
2-5
Table 2-3. Comparison/Hierarchy of Leaching MethodsRepresented in CCW Constituent Database
Method (Rank) Description Pros ConsLandfill porewater (1) Direct porewater
samples from landfillMost representative ofleachate chemistry
Low number of sites represented
High retention time andlow L:S methods (2)
Waste extractions withlong equilibration times(days to weeks) and lowliquid-to-solid ratios(L:S)
Better representation oflandfill equilibrationtimes and L:S
Low number of sites represented
Low L:S methods (3) Waste extractions withlow liquid-to-solid ratios
Better representation oflandfill L:S
Low number of sites represented;equilibrium times relatively short
High retention timemethods (3)
Waste extractions withlong equilibration times(days to weeks)
Better representation oflandfill equilibrationtimes
Low number of sites represented; L:Srelatively high
TCLP (4) Toxicity CharacteristicLeaching Procedurewaste extractions
Most representative interms of number ofsites, waste typescovered
High L:S (20:1) can dilute leachateconcentrations; short equilibrationtime (18 hr) may not allowequilibrium to develop; Na-acetatebuffer can overestimate leaching forsome constituents (e.g., Pb)
SPLP (4) Synthetic Precipitation Leaching Procedure andother dilute water wasteextractions
More representative interms of number ofsites, waste typescovered; extract similarto precipitation
High L:S (20:1) can dilute leachateconcentrations; short equilibrationtime (18 hr) may not allowequilibrium to develop
2.1.3 Development of Waste Constituent Concentrations for Screening
To allow screening decisions to be made by waste constituent, waste stream, andexposure pathway, CCW data are processed to produce a single concentration per analyte andwaste stream (surface impoundment porewater, landfill leachate, and landfill whole waste) forcomparison with HBNs and CSCLs. Data processing to create these analyte concentrationsinvolves two steps:
1. Calculation of average constituent concentrations by site for landfill leachate,surface impoundment porewater, and total ash concentrations. Site averagingavoids potential bias toward sites with many analyses per analyte. During siteaveraging, separate waste disposal scenarios at a site (e.g., non-FBC and FBCash; FGD sludge and ash) are treated as separate "sites" and are averagedindependently. This approach is consistent with that used in the 1998 CCW risk
Section 2.0 Analysis
2 Appendix A contains figures showing how site-averaged 90th percentile concentrations and 90th percentileconcentrations taken across all analyses (nonaveraged concentrations) compare with HBNs for surface impoundmentporewater, TCLP leachate, and whole waste concentrations.
3Although 90th percentile concentrations are used for screening, 95th percentile concentrations are presentedin these figures for purposes of comparison to the available data from the 1998 risk analysis.
2-6
analysis. As in 1998, nondetects are averaged at one-half the reported detectionlimit.2
2. Selection of screening concentrations from site-averaged values. For thescreening calculations, the analysis uses the 90th percentile of the site-averagedconcentrations across all sites for landfill leachate, surface impoundmentporewater, and total ash concentrations.
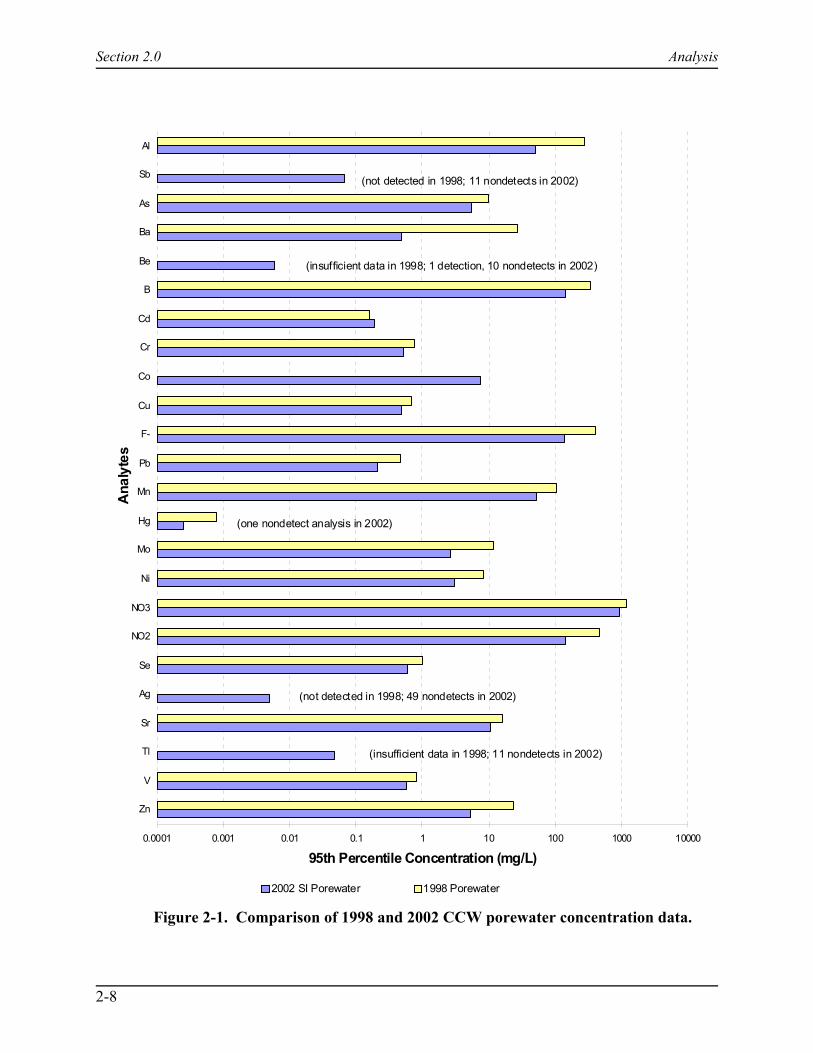
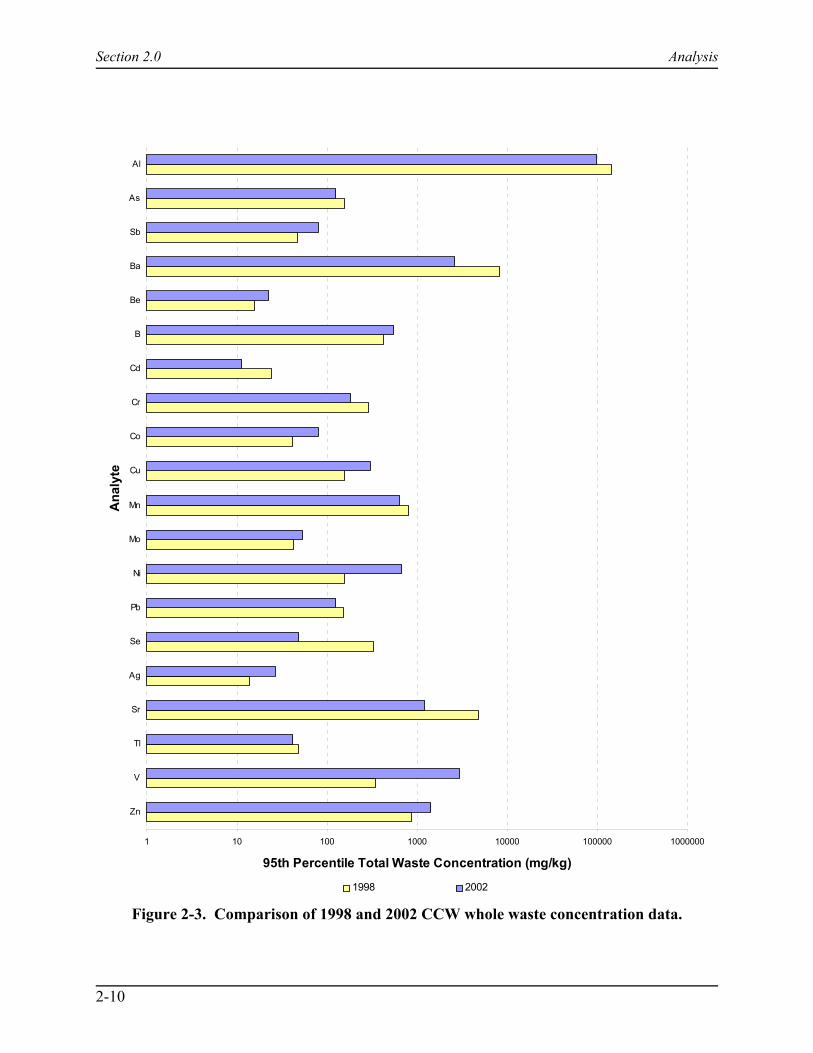
Figures 2-1 through 2-3 compare the 1998 and 2002 95th percentile constituentconcentrations for the porewater, landfill leachate (TCLP), and whole waste data sets.3 The 2002data set includes all of the 1998 data sets along with additional analyses that EPA has receivedfrom industry and state sources since 1998. Although the 2002 porewater data set includes onlysurface impoundment porewater, the smaller 1998 data set includes a few landfill leachate andmine waste leachate porewater samples. The mine waste porewater samples were excluded in2002 because this disposal environment tends to produce acidic leachate not characteristic of theonsite landfills and surface impoundments that are the subject of this analysis.
SAIC prepared the waste characterization database for EPA in 2002. The 2002 wastecharacterization database includes all of the coal combustion waste characterization data used byEPA in its risk assessments supporting the March 1999 Report to Congress (RTC) on Wastesfrom the Combustion of Fossil Fuels. In addition to the data set from the March 1999 RTC,SAIC supplemented the database in 2002 with the following:
# Data submitted with public comments to EPA on the 1999 RTC
# Data submitted with public comments to EPA concerning the May 22, 2002, FinalRegulatory Determination
# Data collected by and provided to EPA since the end of the public commentperiod on the Final Regulatory Determination
# Data identified from literature searches.
The primary sources of these additional data include the electric power industry, stateregulatory agencies, and scientific literature. The additional data represent a significantexpansion in the quantity and scope of characterization data available to EPA for analysis. Forexample, the data set used for the risk assessments supporting the RTC covered approximately50 coal combustion waste generation and/or disposal sites. With the addition of thesupplemental data, the 2002 waste characterization database now covers approximately 140sites.
Section 2.0 Analysis
2-7
Although comparable for many constituents, the larger 2002 data set has several distinctdifferences from the 1998 data set:
# Porewater data in 2002 are consistently lower than 1998 values (Figure 2-1).Barium concentrations are almost 2 orders of magnitude lower in 2002. All otheranalytes show less than an order-of-magnitude difference, with the largestdifferences occurring for arsenic, molybdenum, nickel, and zinc. Only cadmiumshows a slightly higher value in 2002. Porewater data are limited for antimony,beryllium, mercury, and thallium to a few nondetect analyses in both data sets.Although silver has a larger data set, all values are below detection in 1998 and2002.
# TCLP data were limited to four metals in 1998 (Figure 2-2). Concentrations ofarsenic, nickel, and chromium are an order of magnitude or more higher in 2002,while selenium shows lower concentrations in the more recent data set.
# Whole waste data do not show a consistent pattern from 1998 to 2002 and tend toagree more closely than porewater or TCLP data (Figure 2-3). The largestdifferences can be seen for barium, selenium, and strontium, which have higher1998 concentrations, and nickel and vanadium, which have higher 2002concentrations.
Barium, selenium, and strontium show consistently lower 1998 values for all three wastecategories.
2.2 Human Health Benchmarks
HBNs for the residential well screening are based on human health benchmarks fromapproved EPA sources selected based on the following order of preference (which is consistentwith previous EPA Office of Solid Waste [OSW] risk assessments):
# Integrated Risk Information System (IRIS)# Superfund Technical Support Center Provisional Benchmarks# Health Effects Assessment Summary Tables (HEAST)# EPA health assessment documents# Various other EPA health benchmark sources# Agency for Toxic Substances and Disease Registry (ATSDR) minimal risk levels
(MRLs)# California Environmental Protection Agency (CalEPA) chronic inhalation
reference exposure levels (RELs) and cancer potency factors# Drinking water maximum contaminant levels (MCLs) or action levels.
Note that the hierarchy uses non-EPA sources as a last resort. MCLs are used for constituentslacking human health benchmarks from other sources. Where MCLs are lower than HBNs (e.g.,for nitrate), the MCL is used for screening. Appendix B provides a more detailed discussion ofthe rationale, data sources, and human health benchmark values used for CCW screening.
Section 2.0 Analysis
2-8
0.0001 0.001 0.01 0.1 1 10 100 1000 10000
Zn
V
Tl
Sr
Ag
Se
NO2
NO3
Ni
Mo
Hg
Mn
Pb
F-
Cu
Co
Cr
Cd
B
Be
Ba
As
Sb
Al
Ana
lyte
s
95th Percentile Concentration (mg/L)
2002 SI Porewater 1998 Porewater
(not detected in 1998; 11 nondetects in 2002)
(insufficient data in 1998; 1 detection, 10 nondetects in 2002)
(one nondetect analysis in 2002)
(not detected in 1998; 49 nondetects in 2002)
(insufficient data in 1998; 11 nondetects in 2002)
Figure 2-1. Comparison of 1998 and 2002 CCW porewater concentration data.

Section 2.0 Analysis
2-9
0.001 0.01 0.1 1 10 100
Zn
V
Tl
Sr
Ag
Se
NO3
Ni
Mo
Hg
Mn
Pb
F-
CN
Cu
Co
Cr
Cd
B
Be
Ba
As
Sb
Al
Ana
lyte
s
95th Percentile Concentration (mg/L)
2002 TCLP/EP 1998 TCLP
Figure 2-2. Comparison of 1998 and 2002 CCW TCLP data.
Section 2.0 Analysis
2-10
1 10 100 1000 10000 100000 1000000
Zn
V
Tl
Sr
Ag
Se
Pb
Ni
Mo
Mn
Cu
Co
Cr
Cd
B
Be
Ba
Sb
As
Al
Ana
lyte
95th Percentile Total Waste Concentration (mg/kg)
1998 2002
Figure 2-3. Comparison of 1998 and 2002 CCW whole waste concentration data.

Section 2.0 Analysis
2-11
2.3 Ecological Receptors, Endpoints, and Benchmarks
Ecological CSCLs are taken directly from the 1998 fossil fuel combustion risk analysis,Non-groundwater Pathways, Human Health and Ecological Risk Analysis for Fossil FuelCombustion Phase 2 (FFC2) (U.S. EPA, 1998). The receptors and endpoints selected for the1998 analysis were evaluated and are considered appropriate for the goals of this screeninganalysis. As summarized in Table 2-4, the analysis considers both direct contact and ingestionendpoints and benchmarks.
Ecological receptors are exposed through direct contact with contaminants in surfacewater, sediment, and soil. The receptors selected to assess the direct contact exposure route foreach medium are shown in Table 2-4 and are described in Appendix C, along with the endpointsand benchmarks used to develop direct-contact CSCLs.
The derivation of ingestion CSCLs begins with the selection of appropriateecotoxicological data based on a hierarchy of data sources. The assessment endpoint for theecological screening analysis was population viability; therefore, the analysis developsbenchmarks from measures of reproductive-developmental success or, if unavailable, from othereffects that could conceivably impair population dynamics. Population-level benchmarks arepreferred over benchmarks for individual organisms; however, very few population-levelbenchmarks have been developed. Therefore, the ecological screening analysis uses benchmarksderived from individual organism studies, and protection is inferred at the population level.
Table 2-4. Ecological Receptors Assessed in Each Medium
Receptor Type
Surface Water(Leachate,Porewater)
Sediment(Whole Waste)
Soil(Whole Waste)
Direct Contact ExposureAquatic Community U
Sediment Community U
Soil Community U
Amphibians U
Aquatic Plants and Algae U
Terrestrial Plants U
Ingestion ExposureMammals U U
Birds U U
Section 2.0 Analysis
2-12
2.4 Exposure Assessment
Exposure assessment for CCW screening involves both deriving protective HBNs andCSCLs for human and ecological receptors and selecting conservative exposure concentrationsin the media of concern for the analysis.
The exposure scenarios assumed for CCW management (see Figure 1) define the mediaof concern for the analysis. Human exposure scenarios include:
# Drinking of groundwater contaminated by leachate from CCW landfills andsurface impoundments
# Consumption of fish by recreational fishers fishing in streams and lakescontaminated by CCW leachate through the groundwater-to-surface-waterpathway
# Exposure to a farmer through the consumption of soil, produce, beef, and milkcontaminated with constituents eroded by wind and water from a CCW landfilland deposited on an adjacent agricultural field and home garden
# Inhalation (by the farmer) of airborne particulates eroded from a CCW landfill bywind.
Ecological exposure scenarios occurring near CCW landfills or surface impoundments includedirect contact and ingestion exposure routes and follows:
# Direct contact with soil and sediment contaminated by erosion and overlandtransport from a CCW landfill
# Ingestion of plants, soil, and soil invertebrates contaminated with constituentseroded by wind and water from a CCW landfill and deposited on an adjacentterrestrial habitat
# Direct contact with surface water contaminated by CCW leachate through thegroundwater-to-surface-water pathway
# Ingestion of aquatic organisms in streams and lakes contaminated by CCWleachate through the groundwater-to-surface-water pathway.
The screening analysis calculates HBNs and CSCLs for the contaminated media in each of theseexposure scenarios.
2.4.1 Human Health-Based Numbers (HBNs)
HBNs represent media concentrations that are protective of human health from exposurepathways that are relevant to that particular medium. The CCW screening analysis uses HBNscalculated for groundwater and surface water exposure, as well as for the aboveground exposure
Section 2.0 Analysis
2-13
pathways described above. The CCW HBNs represent reasonable maximum exposure (RME)scenarios for an offsite receptor:
# Groundwater HBNs are protective for residential drinking water exposure from adomestic well immediately downgradient from a CCW landfill or surfaceimpoundment.
# Surface water HBNs are protective for fish caught (and consumed) by arecreational fisher from a river, lake, or stream adjacent to a CCW landfill orsurface impoundment.
# Aboveground HBNs are protective for a farmer living just downslope of an CCWlandfill. Exposure pathways for the farmer include inhalation of air contaminatedwith waste particulate matter blowing off the landfill; soil ingestion; consumptionof produce grown in contaminated soil and contaminated via air deposition; andconsumption of beef and milk from cattle eating grain, forage, and silage grownin contaminated soil and contaminated via air deposition.
Key features and assumptions of the HBN calculations include the following:
# HBNs are calculated based on a target cancer risk of 10-5 or target HQ of 1.
# The source size for estimating landfill particulate emissions is set at the 95th
percentile for landfill areas identified in the Electric Power Research Institute(EPRI) database (EPRI, 1997).
# The analysis considers exposures for one adult and three child receptor cohorts;exposure for each cohort is assumed to start at ages 3, 8, 15, and 20.
# Chemical properties (biouptake and bioaccumulation factors) are collected frombest available literature values (see Appendix E).
# Human exposure factors (e.g., body weight, exposure duration, exposurefrequency, consumption rates) are set at central-tendency values (seeAppendix G).
Appendix D provides details on the HBN calculations, including all assumptions and equations. Appendices E through H provide the input data used in the calculations and all data sources.
2.4.2 Ecological Chemical Stressor Concentration Limits (CSCLs)
The CCW ecological screening analysis parallels the human health screening analysisand addresses two routes of exposure for ecological receptors: direct contact with contaminatedmedia and ingestion of contaminated food items. Screening CSCLs incorporate chemical-specific assumptions protective of ecological receptors of concern. These media concentrationsare analogous to HBNs used in the human health screening. As with the HBNs, CSCLs can becompared directly with concentrations of constituents found in CCW, leachate, and porewater, orwith conservative offsite media concentrations to estimate risk.
Section 2.0 Analysis
2-14
The analysis derives CSCLs for each chemical and receptor to the extent that supportingdata are available. The lowest (most sensitive) CSCL for each chemical in each medium is usedto calculate HQs in the screening analysis. For example, several receptors (soil invertebrates,terrestrial plants, mammals, and birds) can be exposed to chemicals in soils; the analysis uses thelowest (most conservative) soil CSCL for these receptors.
The CCW CSCLs come from a compilation of data from sources meeting predetermineddata quality objectives. The analysis uses the lowest CSCL for each receptor in each medium,and different CSCLs reflect different effects levels.
# Mammal and bird CSCLs are all based on no-observed-adverse-effects-level(NOAEL) dose benchmarks.
# Soil CSCLs are mostly based on low effects levels (i.e., they are concentrations atwhich adverse effects would be expected, but these effects would not be expectedto impair the receptor’s ability to maintain its function in the ecosystem).
# Sediment CSCLs are based on lowest observed effects levels (LOAELs, whichare less conservative than NOAELs) for some chemicals, and on threshold effectslevels (TELs) for others. TELs are the geometric mean of the 15th percentileeffects data and the 50th percentile no effects data and can be thought of as anintermediate value between a NOAEL and a LOAEL.
# Surface water CSCLs are National Ambient Water Quality Criteria (NAWQC),secondary chronic values (SCVs) derived using methods similar to the NAWQC, or Great Lake Initiative final chronic values (FCVs). As such, they generallyreflect low effects values.
# Amphibian CSCLs consist of the geometric mean of LC50 data. They are basedon the only data available: acute exposure data. Although this is a departurefrom the methods used for other CSCLs, amphibians are generally sensitivereceptors and need to be addressed with the best data available.
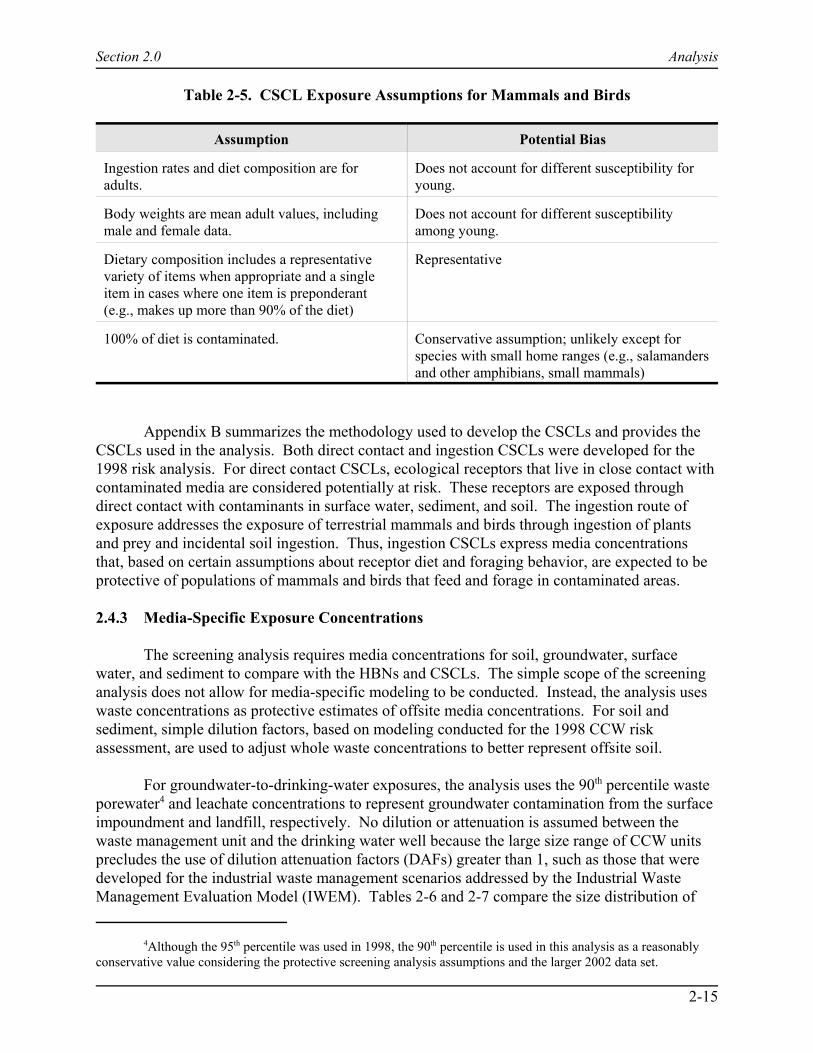
The CSCLs for mammals and birds are calculated based on several assumptions aboutexposure (see Table 2-5). In general, the assumptions used for this analysis are representative(as opposed to conservative) with the exception of the percentage of diet that is contaminated;the analysis assumes that 100 percent of each receptor’s diet is contaminated.
Section 2.0 Analysis
4Although the 95th percentile was used in 1998, the 90th percentile is used in this analysis as a reasonablyconservative value considering the protective screening analysis assumptions and the larger 2002 data set.
2-15
Table 2-5. CSCL Exposure Assumptions for Mammals and Birds
Assumption Potential Bias
Ingestion rates and diet composition are foradults.
Does not account for different susceptibility foryoung.
Body weights are mean adult values, includingmale and female data.
Does not account for different susceptibilityamong young.
Dietary composition includes a representativevariety of items when appropriate and a singleitem in cases where one item is preponderant(e.g., makes up more than 90% of the diet)
Representative
100% of diet is contaminated. Conservative assumption; unlikely except forspecies with small home ranges (e.g., salamandersand other amphibians, small mammals)
Appendix B summarizes the methodology used to develop the CSCLs and provides theCSCLs used in the analysis. Both direct contact and ingestion CSCLs were developed for the1998 risk analysis. For direct contact CSCLs, ecological receptors that live in close contact withcontaminated media are considered potentially at risk. These receptors are exposed throughdirect contact with contaminants in surface water, sediment, and soil. The ingestion route ofexposure addresses the exposure of terrestrial mammals and birds through ingestion of plantsand prey and incidental soil ingestion. Thus, ingestion CSCLs express media concentrationsthat, based on certain assumptions about receptor diet and foraging behavior, are expected to beprotective of populations of mammals and birds that feed and forage in contaminated areas.
2.4.3 Media-Specific Exposure Concentrations
The screening analysis requires media concentrations for soil, groundwater, surfacewater, and sediment to compare with the HBNs and CSCLs. The simple scope of the screeninganalysis does not allow for media-specific modeling to be conducted. Instead, the analysis useswaste concentrations as protective estimates of offsite media concentrations. For soil andsediment, simple dilution factors, based on modeling conducted for the 1998 CCW riskassessment, are used to adjust whole waste concentrations to better represent offsite soil.
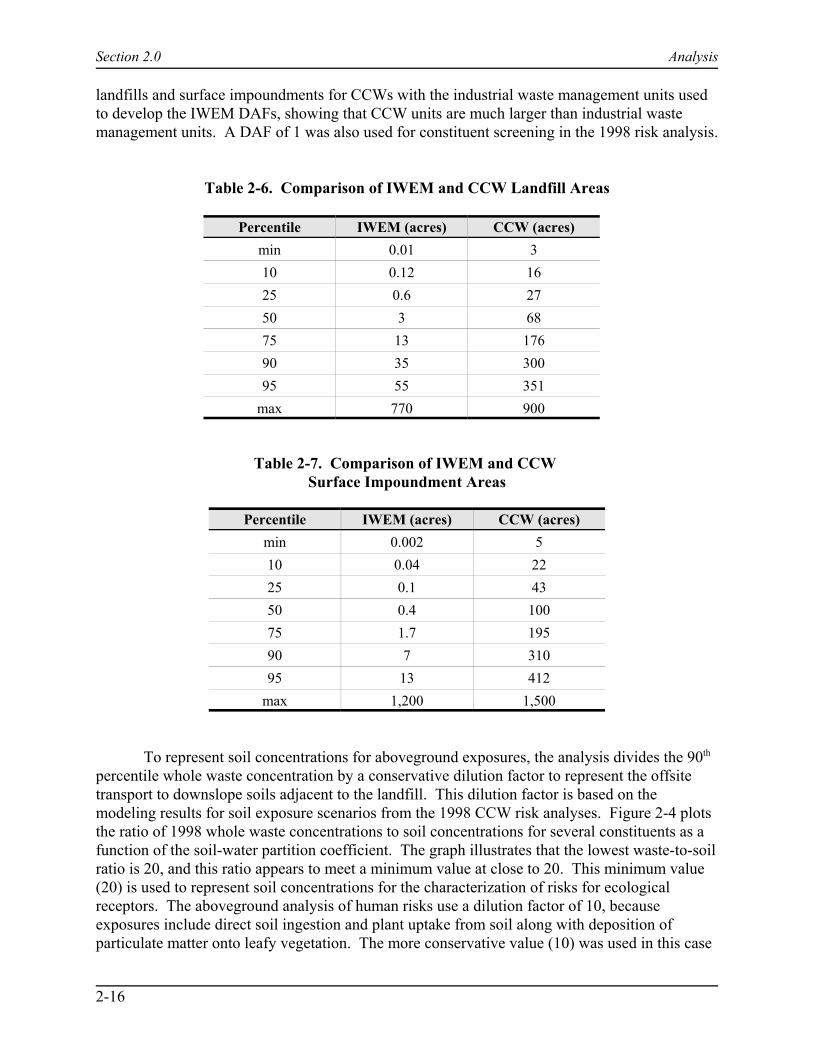
For groundwater-to-drinking-water exposures, the analysis uses the 90th percentile wasteporewater4 and leachate concentrations to represent groundwater contamination from the surfaceimpoundment and landfill, respectively. No dilution or attenuation is assumed between thewaste management unit and the drinking water well because the large size range of CCW unitsprecludes the use of dilution attenuation factors (DAFs) greater than 1, such as those that weredeveloped for the industrial waste management scenarios addressed by the Industrial WasteManagement Evaluation Model (IWEM). Tables 2-6 and 2-7 compare the size distribution of
Section 2.0 Analysis
2-16
landfills and surface impoundments for CCWs with the industrial waste management units usedto develop the IWEM DAFs, showing that CCW units are much larger than industrial wastemanagement units. A DAF of 1 was also used for constituent screening in the 1998 risk analysis.
Table 2-6. Comparison of IWEM and CCW Landfill Areas
Percentile IWEM (acres) CCW (acres)min 0.01 310 0.12 1625 0.6 2750 3 6875 13 17690 35 30095 55 351
max 770 900
Table 2-7. Comparison of IWEM and CCW Surface Impoundment Areas
Percentile IWEM (acres) CCW (acres)min 0.002 510 0.04 2225 0.1 4350 0.4 10075 1.7 19590 7 31095 13 412
max 1,200 1,500
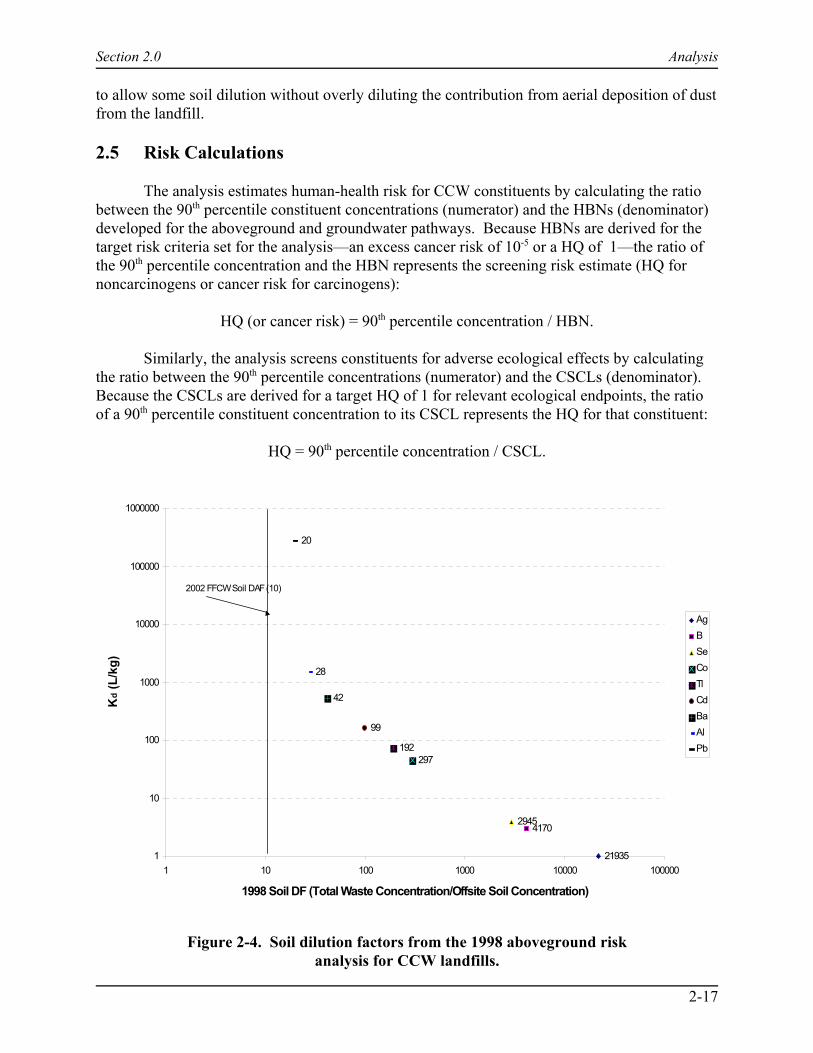
To represent soil concentrations for aboveground exposures, the analysis divides the 90th
percentile whole waste concentration by a conservative dilution factor to represent the offsitetransport to downslope soils adjacent to the landfill. This dilution factor is based on themodeling results for soil exposure scenarios from the 1998 CCW risk analyses. Figure 2-4 plotsthe ratio of 1998 whole waste concentrations to soil concentrations for several constituents as afunction of the soil-water partition coefficient. The graph illustrates that the lowest waste-to-soilratio is 20, and this ratio appears to meet a minimum value at close to 20. This minimum value(20) is used to represent soil concentrations for the characterization of risks for ecologicalreceptors. The aboveground analysis of human risks use a dilution factor of 10, becauseexposures include direct soil ingestion and plant uptake from soil along with deposition ofparticulate matter onto leafy vegetation. The more conservative value (10) was used in this case
Section 2.0 Analysis
2-17
21935
41702945
297192
99
42
28
20
1
10
100
1000
10000
100000
1000000
1 10 100 1000 10000 100000
1998 Soil DF (Total Waste Concentration/Offsite Soil Concentration)
Kd
(L/k
g)
AgBSeCoTlCdBaAlPb
2002 FFCW Soil DAF (10)
Figure 2-4. Soil dilution factors from the 1998 aboveground riskanalysis for CCW landfills.
to allow some soil dilution without overly diluting the contribution from aerial deposition of dustfrom the landfill.
2.5 Risk Calculations
The analysis estimates human-health risk for CCW constituents by calculating the ratiobetween the 90th percentile constituent concentrations (numerator) and the HBNs (denominator)developed for the aboveground and groundwater pathways. Because HBNs are derived for thetarget risk criteria set for the analysis—an excess cancer risk of 10-5 or a HQ of 1—the ratio ofthe 90th percentile concentration and the HBN represents the screening risk estimate (HQ fornoncarcinogens or cancer risk for carcinogens):
HQ (or cancer risk) = 90th percentile concentration / HBN.
Similarly, the analysis screens constituents for adverse ecological effects by calculatingthe ratio between the 90th percentile concentrations (numerator) and the CSCLs (denominator). Because the CSCLs are derived for a target HQ of 1 for relevant ecological endpoints, the ratioof a 90th percentile constituent concentration to its CSCL represents the HQ for that constituent:
HQ = 90th percentile concentration / CSCL.

Section 3.0 Risk Characterization
3-1
3.0 Risk CharacterizationRisk characterization for the CCW risk assessment involved estimating the risks to
human health and ecological receptors associated with exposure to CCW through the exposurepathways pictured in Figure 1-1 and described in Section 2.3. Consistent with the goals of thescreening analysis, screening results are used primarily to identify, with a high level ofconfidence, CCW constituents, waste streams, and exposure pathways of no further concern forthe CCW risk analysis. Constituents with risk levels that exceed the target risk criteria (10-5
excess cancer risk or an HQ of 1) cannot be eliminated from concern and will be investigatedfurther by EPA. However, the screening risk estimates for these constituents should not beconsidered accurate estimates of the risks currently posed to human and ecological receptors byCCW. The highly protective assumptions (e.g., RME scenarios, waste concentrations as mediaconcentrations) needed for protective screening of constituents of further concern have likelyresulted in overestimates of the actual risks posed by CCW constituents managed in landfills andsurface impoundments.
As described in Section 2.4, the screening analysis estimates risk by dividing media (orwaste) chemical concentrations by HBNs (for human health) or CSCLs (for ecological risks).This section characterizes these results with respect to the target risk criteria for humans andecological receptors, compares results with the results of the 1998 CCW risk assessment (U.S.EPA, 1998a,b), and evaluates differences. Although 95th percentile waste concentrations wereused in 1998, this analysis uses 90th percentile concentrations for screening decisions because ofthe conservatism of the screening assumptions and the larger, more comprehensive data setavailable to evaluate 2002 risks. The 95th percentile 2002 concentrations are also presented forcomparison with 90th percentile values and 1998 risk results.
3.1 Human Health Results—Groundwater Pathways
The screening analysis evaluates groundwater pathways for both landfills and surfaceimpoundments. Groundwater pathways screened for human health risks include thegroundwater-to-drinking water pathway for domestic wells and the groundwater-to-surface-water pathway for exposure through fish consumption by recreation fishers. The latter pathwayis significant because coal-fired power plants are often located adjacent to large bodies of waterthat are used for recreational fishing.
3.1.1 Groundwater-to-Drinking-Water Pathway
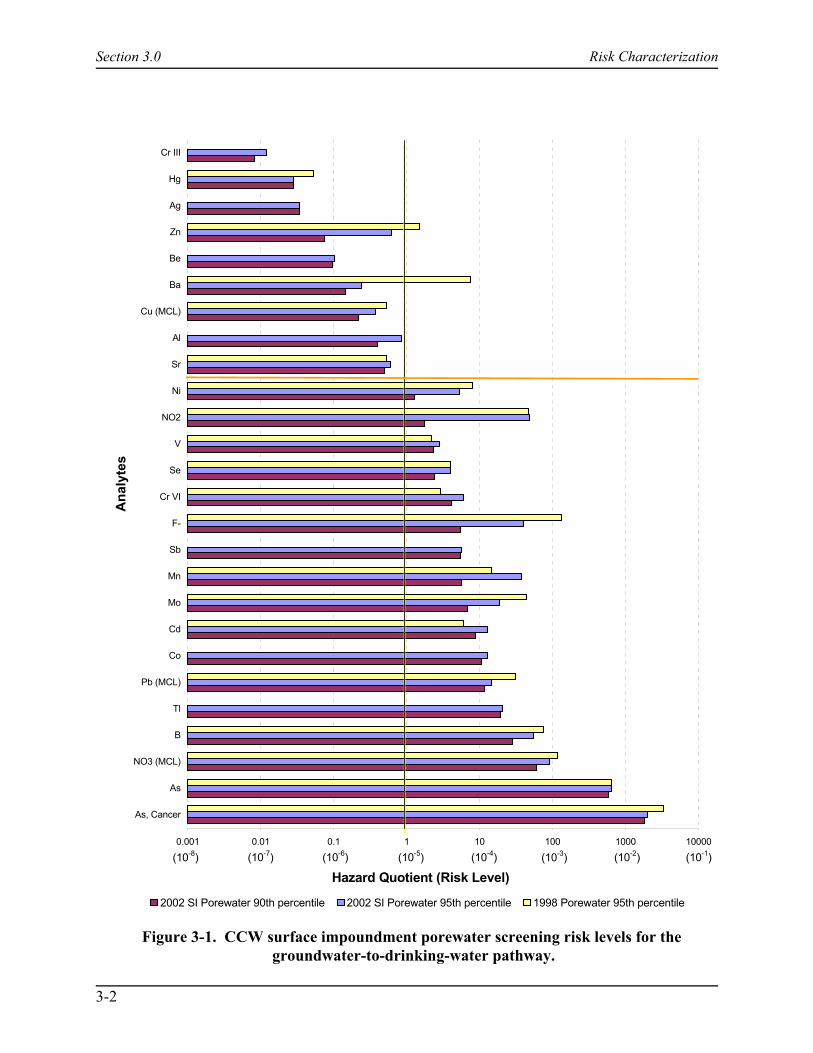
Figures 3-1 and 3-2 show the groundwater-to-drinking-water pathway screening resultsfor surface impoundments and landfills, respectively. Based on the screening criteria—HQ of 1for noncancer risk and a 10-5 cancer risk—16 of 24 constituents fail the screen for surface
Section 3.0 Risk Characterization
3-2
0.001 0.01 0.1 1 10 100 1000 10000
As, Cancer
As
NO3 (MCL)
B
Tl
Pb (MCL)
Co
Cd
Mo
Mn
Sb
F-
Cr VI
Se
V
NO2
Ni
Sr
Al
Cu (MCL)
Ba
Be
Zn
Ag
Hg
Cr III
Ana
lyte
s
Hazard Quotient (Risk Level)
2002 SI Porewater 90th percentile 2002 SI Porewater 95th percentile 1998 Porewater 95th percentile
(10-6) (10-5)(10-7)(10-8) (10-4) (10-3) (10-2) (10-1)
Figure 3-1. CCW surface impoundment porewater screening risk levels for the groundwater-to-drinking-water pathway.
Section 3.0 Risk Characterization
3-3
0.001 0.01 0.1 1 10 100 1000
As, Cancer
As
Sb
Tl
Pb (MCL)
Mo
B
Cd
Cr VI
V
F-
Se
NO2
Mn
Ba
Sr
Ni
Hg
NO3 (MCL)
Be
Ag
Zn
Al
Co
Cu (MCL)
CN
Cr III
Ana
lyte
s
Hazard Quotient (Risk Level)
2002 Leachate 90th percentile 2002 Leachate 95th percentile 1998 TCLP 95th percentile
(10-5)(10-6)(10-7)(10-8) (10-4) (10-3) (10-2)
Figure 3-2. CCW landfill leachate screening risk levels for the groundwater-to-drinking-water pathway.
Section 3.0 Risk Characterization
5 Manganese and hexavalent chromium also show lower HBNs in 2002 because of lower health benchmarksthan those used in 1998. Fluoride has a slightly higher HBN in 2002 because of EPA’s decision to use the adjustedreference dose (RfD) for skeletal fluorosis instead of the RfD for dental fluorosis.
3-4
impoundment porewater (Figure 3-1). These results are generally consistent with the 1998 CCWgroundwater risk analysis. Cobalt was not addressed in porewater in 1998, but does show ascreening exceedance in the 2002 results. Barium and zinc, which showed exceedances in 1998,do not exceed the screening criteria in 2002 because the waste concentrations in the 2002database are lower than in the 1998 database (see Figure 2-1).
Antimony and thallium surface impoundment porewater concentrations are all belowdetection limits in the 2002 data, as they were in 1998. However, because the detection limit ismore than twice the HBN for most of the analyses in the 2002 database, the 90th percentile of thenondetect values is above the screening criteria for these constituents. EPA elected not toconsider these nondetects quantitatively in the 1998 risk analysis. Although concentrations set atone-half of the detection limit do exceed the risk criteria in 2002, the values could be less thanthis assumed value.
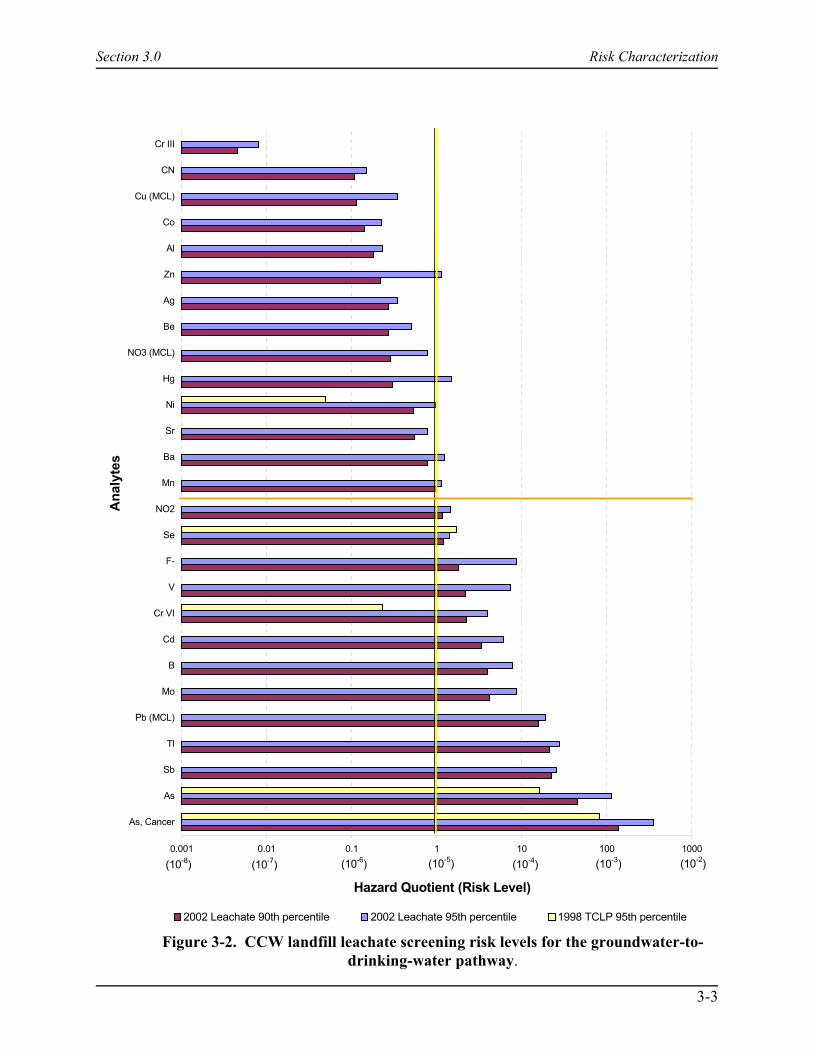
Figure 3-2 shows the 2002 landfill leachate screening risks and compares them with therisk results for the few constituents with TCLP leachate data in 1998. Constituents failing thelandfill leachate screen are similar to those failing the screen for surface impoundmentporewater, with 12 of 25 constituents failing the screen. Exceptions include nitrate, cobalt, andnickel, which fail for surface impoundment porewater only. Antimony and thallium, which havedetectable concentrations in the landfill leachate data set, fail the screen for both landfills.
Appendix D includes a comparison of the 1998 and 2002 drinking water HBNs. Aluminum and cobalt were not evaluated in 1998 because health benchmarks were not available. Aluminum screens out for both landfills and surface impoundments for the 2002 data set; cobaltscreens out in landfill leachate, but not in surface impoundment porewater. Most of theremaining constituents show lower HBNs in 2002 by a factor of 1.8, primarily because of thedifferences in exposure factors between the adult-only scenario assumed in 1998 and the childage cohorts used in 2002.5 However, the changes in HBNs from 1998 to 2002 did not affect theresults (in terms of number of exceedances). 3.1.2 Groundwater-to-Surface-Water Pathway
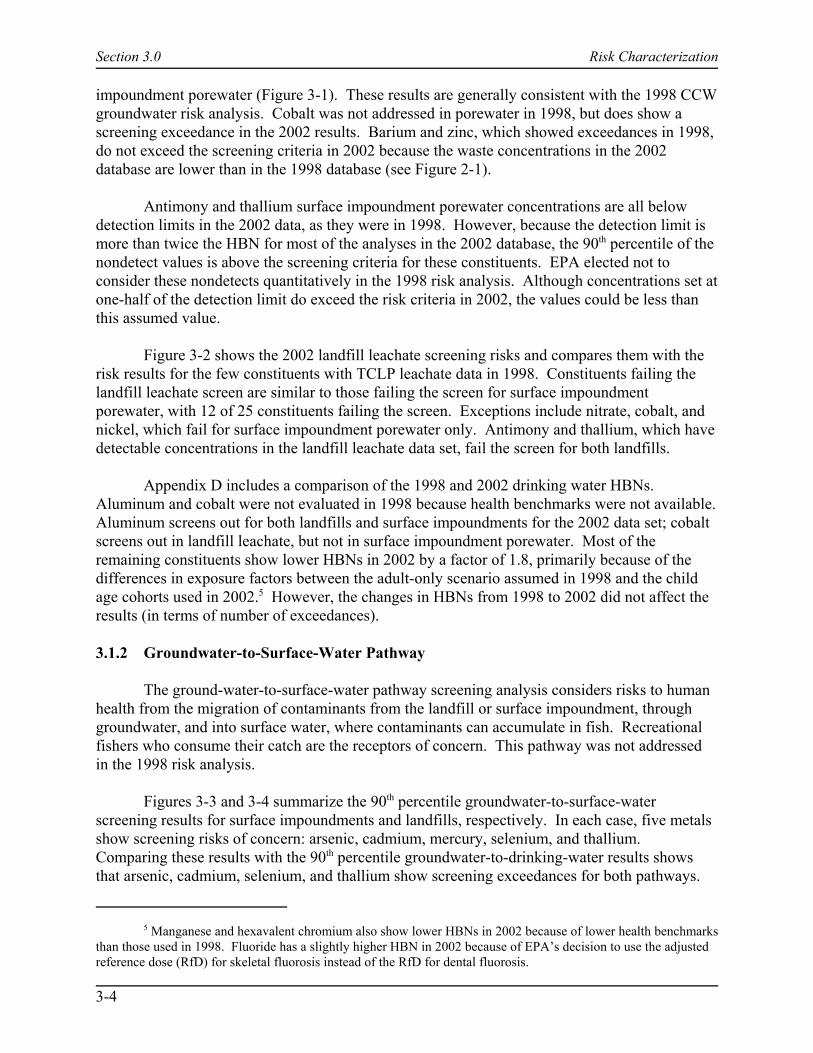
The ground-water-to-surface-water pathway screening analysis considers risks to humanhealth from the migration of contaminants from the landfill or surface impoundment, throughgroundwater, and into surface water, where contaminants can accumulate in fish. Recreationalfishers who consume their catch are the receptors of concern. This pathway was not addressedin the 1998 risk analysis.
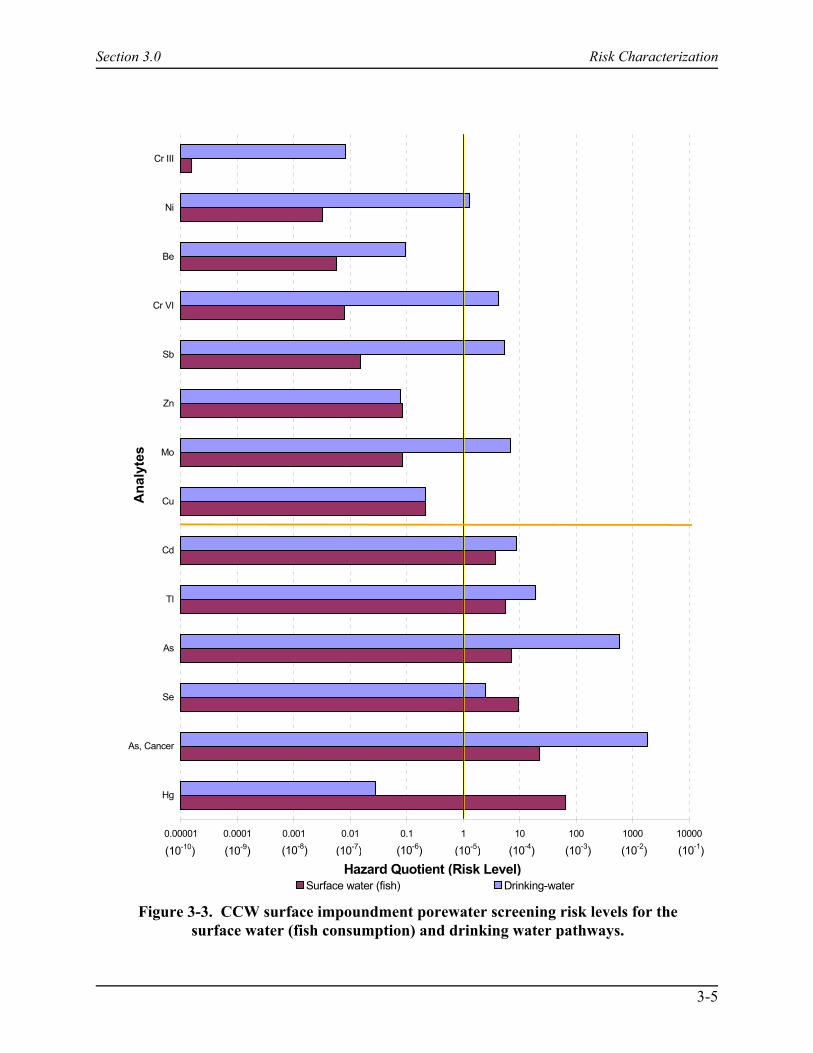
Figures 3-3 and 3-4 summarize the 90th percentile groundwater-to-surface-waterscreening results for surface impoundments and landfills, respectively. In each case, five metalsshow screening risks of concern: arsenic, cadmium, mercury, selenium, and thallium. Comparing these results with the 90th percentile groundwater-to-drinking-water results showsthat arsenic, cadmium, selenium, and thallium show screening exceedances for both pathways.
Section 3.0 Risk Characterization
3-5
0.00001 0.0001 0.001 0.01 0.1 1 10 100 1000 10000
Hg
As, Cancer
Se
As
Tl
Cd
Cu
Mo
Zn
Sb
Cr VI
Be
Ni
Cr III
Ana
lyte
s
Hazard Quotient (Risk Level)Surface water (fish) Drinking-water
(10-6) (10-5)(10-7)(10-8) (10-4) (10-3) (10-2) (10-1)(10-10) (10-9)
Figure 3-3. CCW surface impoundment porewater screening risk levels for thesurface water (fish consumption) and drinking water pathways.
Section 3.0 Risk Characterization
3-6
0.000001 0.00001 0.0001 0.001 0.01 0.1 1 10 100 1000
Hg
Tl
Se
As, Cancer
Cd
As
Zn
Cu
Sb
Mo
Be
Cr VI
Ni
CN
Cr III
Ana
lyte
s
Hazard Quotient (Risk Level)Surface-water (fish) Drinking Water
(10-5)(10-6)(10-7)(10-8) (10-4) (10-3) (10-2)(10-11) (10-9)(10-10)
Figure 3-4. CCW landfill leachate screening risk levelsfor the surface water (fish consumption) and drinking water pathways.
Section 3.0 Risk Characterization
Mercury, which tends to bioconcentrate in fish tissue, only exceeds the screening criterion forthe groundwater-to-surface-water pathway.
3.1.3 Summary and Conclusions: Groundwater Pathway Analysis
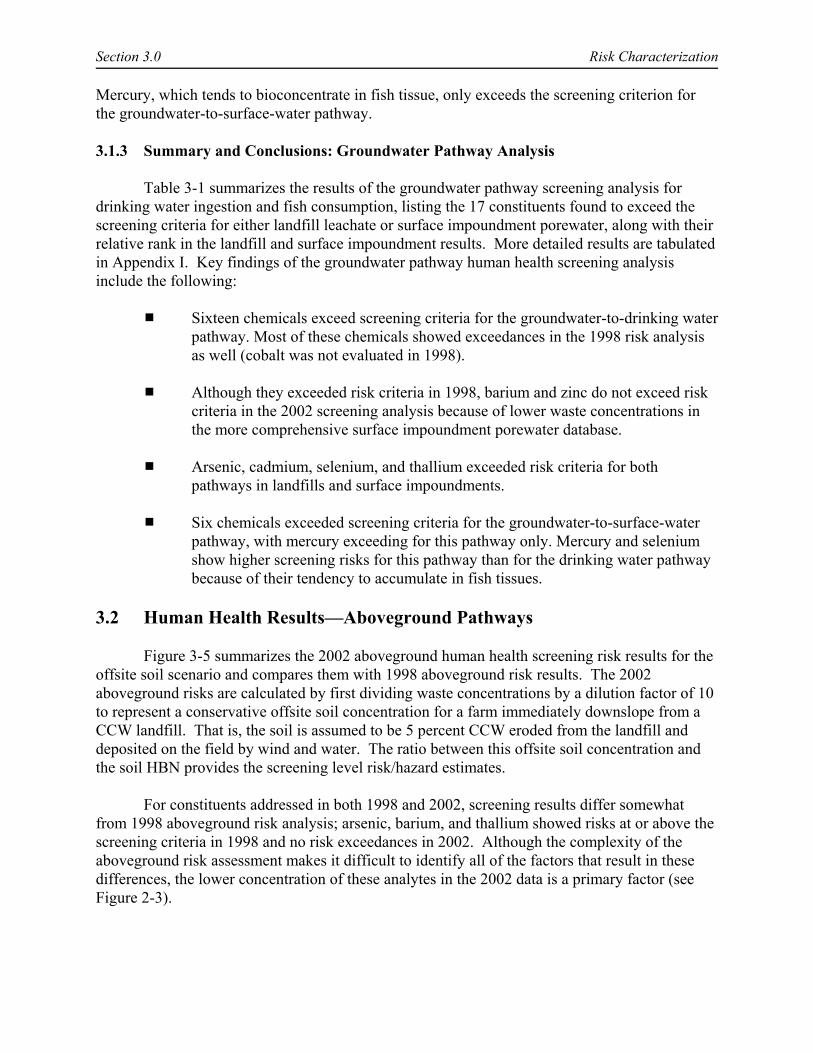
Table 3-1 summarizes the results of the groundwater pathway screening analysis fordrinking water ingestion and fish consumption, listing the 17 constituents found to exceed thescreening criteria for either landfill leachate or surface impoundment porewater, along with theirrelative rank in the landfill and surface impoundment results. More detailed results are tabulatedin Appendix I. Key findings of the groundwater pathway human health screening analysisinclude the following:
# Sixteen chemicals exceed screening criteria for the groundwater-to-drinking waterpathway. Most of these chemicals showed exceedances in the 1998 risk analysisas well (cobalt was not evaluated in 1998).
# Although they exceeded risk criteria in 1998, barium and zinc do not exceed riskcriteria in the 2002 screening analysis because of lower waste concentrations inthe more comprehensive surface impoundment porewater database.
# Arsenic, cadmium, selenium, and thallium exceeded risk criteria for bothpathways in landfills and surface impoundments.
# Six chemicals exceeded screening criteria for the groundwater-to-surface-waterpathway, with mercury exceeding for this pathway only. Mercury and seleniumshow higher screening risks for this pathway than for the drinking water pathwaybecause of their tendency to accumulate in fish tissues.
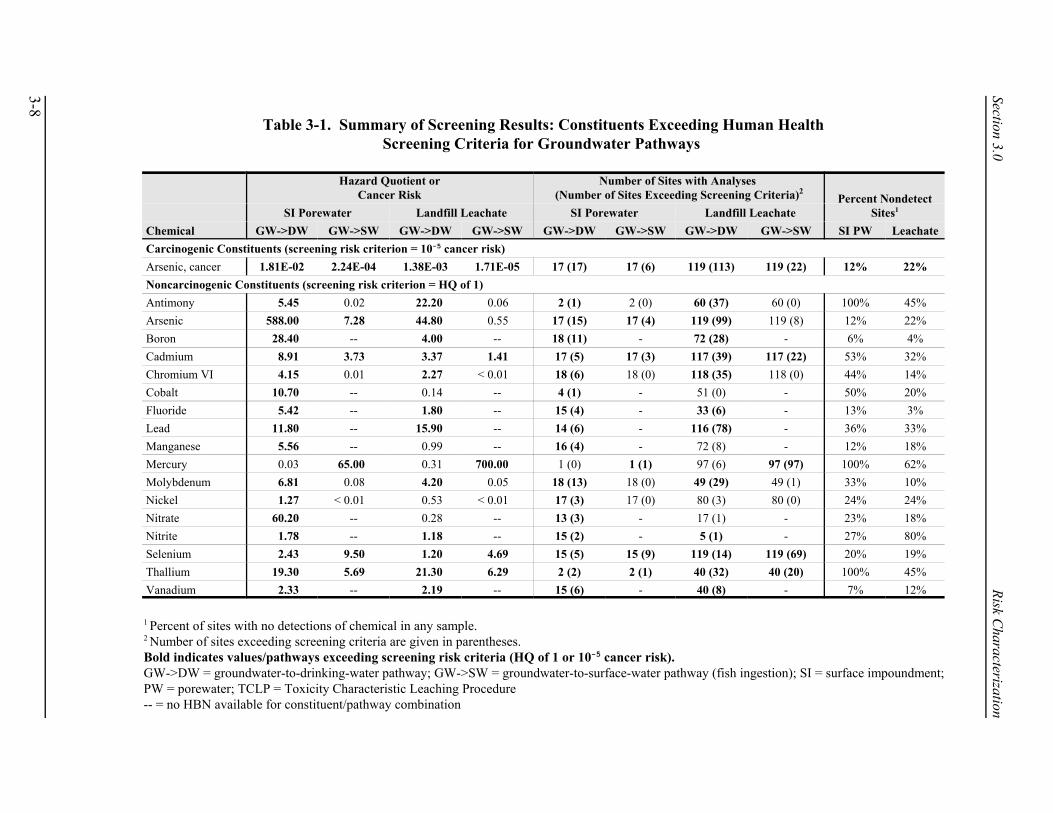
3.2 Human Health Results—Aboveground Pathways
Figure 3-5 summarizes the 2002 aboveground human health screening risk results for theoffsite soil scenario and compares them with 1998 aboveground risk results. The 2002aboveground risks are calculated by first dividing waste concentrations by a dilution factor of 10to represent a conservative offsite soil concentration for a farm immediately downslope from aCCW landfill. That is, the soil is assumed to be 5 percent CCW eroded from the landfill anddeposited on the field by wind and water. The ratio between this offsite soil concentration andthe soil HBN provides the screening level risk/hazard estimates.
For constituents addressed in both 1998 and 2002, screening results differ somewhatfrom 1998 aboveground risk analysis; arsenic, barium, and thallium showed risks at or above thescreening criteria in 1998 and no risk exceedances in 2002. Although the complexity of theaboveground risk assessment makes it difficult to identify all of the factors that result in thesedifferences, the lower concentration of these analytes in the 2002 data is a primary factor (seeFigure 2-3).
3-8
Section 3.0Risk C
haracterization
Table 3-1. Summary of Screening Results: Constituents Exceeding Human HealthScreening Criteria for Groundwater Pathways
Chemical
Hazard Quotient orCancer Risk
Number of Sites with Analyses (Number of Sites Exceeding Screening Criteria)2
Percent NondetectSites1SI Porewater Landfill Leachate SI Porewater Landfill Leachate
GW->DW GW->SW GW->DW GW->SW GW->DW GW->SW GW->DW GW->SW SI PW LeachateCarcinogenic Constituents (screening risk criterion = 10-5 cancer risk)Arsenic, cancer 1.81E-02 2.24E-04 1.38E-03 1.71E-05 17 (17) 17 (6) 119 (113) 119 (22) 12% 22%Noncarcinogenic Constituents (screening risk criterion = HQ of 1)Antimony 5.45 0.02 22.20 0.06 2 (1) 2 (0) 60 (37) 60 (0) 100% 45%Arsenic 588.00 7.28 44.80 0.55 17 (15) 17 (4) 119 (99) 119 (8) 12% 22%Boron 28.40 -- 4.00 -- 18 (11) - 72 (28) - 6% 4%Cadmium 8.91 3.73 3.37 1.41 17 (5) 17 (3) 117 (39) 117 (22) 53% 32%Chromium VI 4.15 0.01 2.27 < 0.01 18 (6) 18 (0) 118 (35) 118 (0) 44% 14%Cobalt 10.70 -- 0.14 -- 4 (1) - 51 (0) - 50% 20%Fluoride 5.42 -- 1.80 -- 15 (4) - 33 (6) - 13% 3%Lead 11.80 -- 15.90 -- 14 (6) - 116 (78) - 36% 33%Manganese 5.56 -- 0.99 -- 16 (4) - 72 (8) - 12% 18%Mercury 0.03 65.00 0.31 700.00 1 (0) 1 (1) 97 (6) 97 (97) 100% 62%Molybdenum 6.81 0.08 4.20 0.05 18 (13) 18 (0) 49 (29) 49 (1) 33% 10%Nickel 1.27 < 0.01 0.53 < 0.01 17 (3) 17 (0) 80 (3) 80 (0) 24% 24%Nitrate 60.20 -- 0.28 -- 13 (3) - 17 (1) - 23% 18%Nitrite 1.78 -- 1.18 -- 15 (2) - 5 (1) - 27% 80%Selenium 2.43 9.50 1.20 4.69 15 (5) 15 (9) 119 (14) 119 (69) 20% 19%Thallium 19.30 5.69 21.30 6.29 2 (2) 2 (1) 40 (32) 40 (20) 100% 45%Vanadium 2.33 -- 2.19 -- 15 (6) - 40 (8) - 7% 12%
1 Percent of sites with no detections of chemical in any sample.2 Number of sites exceeding screening criteria are given in parentheses.Bold indicates values/pathways exceeding screening risk criteria (HQ of 1 or 10-5 cancer risk).GW->DW = groundwater-to-drinking-water pathway; GW->SW = groundwater-to-surface-water pathway (fish ingestion); SI = surface impoundment;PW = porewater; TCLP = Toxicity Characteristic Leaching Procedure-- = no HBN available for constituent/pathway combination
Section 3.0 Risk Characterization
3-9
0.00000001 0.0000001 0.000001 0.00001 0.0001 0.001 0.01 0.1 1 10
As, cancer
Tl
B
Ag
Sb
As
Hg
Sr
Zn
Cr VI, cancer
Mo
Cr VI
V
Cd
Ni
Ba
Al
Se
Pb (SSL/PRG)
Mn
Co
Co, cancer
Be
Be, cancer
F-
Cd, cancer
Cr III
CN
NO3A
naly
tes
Hazard Quotient (Risk Level)2002 90th percentile 2002 95th percentile 1998 95th percentile
(10-5) (10-4)(10-6)(10-7)(10-8)(10-9)(10-10)(10-11)(10-12)(10-13)
1 Offsite soil = total waste concentrations/10
Figure 3-5. Comparison of 1998 and 2002 aboveground human health risk results for the soil pathway.

Section 3.0 Risk Characterization
6 The HQs shown in Figure 3-6 reflect a soil dilution factor of 20 applied to whole waste concentrations. The dilution factor was derived from the 1998 analysis by comparing whole waste concentrations to modeled offsitesoil concentrations (see Section 2.3.3).
3-10
More detailed results for the aboveground human health screening analysis are tabulatedin Appendix I. For human exposure through aboveground pathways, no exceedances occur forsoil concentrations based on the 90th percentile whole waste concentrations, with only slightexceedances (HQ at or less than 1.5) at the 95th percentile concentrations for mercury, thallium,boron, and silver (which did not exceed the risk criteria in 1998). Based on these results andconsidering the highly protective assumptions of the aboveground screening analysis, EPA doesnot believe that additional modeling or evaluation of aboveground human exposure pathways isnecessary.
3.3 Ecological Risk Results
Ecological screening assesses risks for soil and surface water pathways, consideringexposure through direct contact and ingestion. The surface water analysis includes exposure toboth contaminated water and sediments. Results for each pathway are discussed below.
3.3.1 Soil Pathways
In general, the soil pathway for ecological receptors addresses exposure through directcontact with soil and ingestion of terrestrial (i.e., soil-based) food and prey items. Figure 3-6shows ecological screening estimates calculated for soil pathways by dividing the 90th percentileoffsite soil concentrations by ecological CSCLs. The screening criterion for soil ecological riskis an HQ of 10. This is consistent with the approach used in 1998 bounding risk analysis andjustified as "strongly suggestive of de minimis ecological impacts” because of the highlyconservative nature of the screening ecological risk analysis. The 1998 CSCLs are conservativeboth in terms of the benchmark selection and the assumption of direct exposures. Moreover, thespatial scale of potential ecological effects based on the screening results is highly conservative(i.e., the area affected by landfills may be of limited significance ecologically). Because the2002 analysis uses the 1998 CSCLs along with protective assumptions about offsite soilconcentrations,6 the HQ of 10 was considered to be an appropriate criterion for this analysis.
As in 1998, all constituents except boron passed the ecological risk screen for soil. Boron wasexcluded in 1998 because its soil CSCL (based on toxicity to plants) is lower than typicalbackground soil levels across the United States. It is included for discussion in these resultsbecause boron is an important component of coal ash and because previous work (e.g., Carlsonand Adriano, 1993) indicates that the boron in coal ash is in a more available and toxic form forplant uptake than it is in typical soils. Aluminum also may be of concern (draft CSCLs are wellbelow whole waste concentrations), but the chemical form is especially important for this metalbecause of its widespread occurrence in aluminosilicate minerals in soil and CCW. Thescreening results indicate that chemicals other than boron and aluminum are not of potentialconcern for terrestrial wildlife exposed through these pathways.

Section 3.0 Risk Characterization
3-11
0.0001 0.001 0.01 0.1 1 10 100
B
Se
Hg
Ni
Cu
As
V
Zn
Cd
Sb
Pb
Cr
Ba
Mo
Co
Ana
lyte
s
Ecological Hazard Quotient (HQ)
2002 90th percentile 2002 95th percentile 1998 95th percentile
Boron CSCL < typical background
1 Offsite soil = total waste concentrations/20
Figure 3-6. CCW landfill aboveground ecological screening risks: Soil pathway.

Section 3.0 Risk Characterization
7 The 2002 CCW constituent database does not include impoundment water samples, and the directexposure pathway was not addressed.
3-12
3.3.2 Surface Water Pathways
The screening analysis assesses ecological receptor exposure to surface water andsediments for the groundwater-to-surface-water pathway. Porewater analyses for surfaceimpoundments and leachate analyses for landfills are used to assess groundwater-to-surface-water contamination. The screening analysis calculates HQs by dividing the 90th percentilewaste concentration by the appropriate CSCL. No dilution factor is applied in these resultsbecause this pathway was not assessed in the 1998 study, and data are therefore lacking tosupport estimation of a dilution factor.
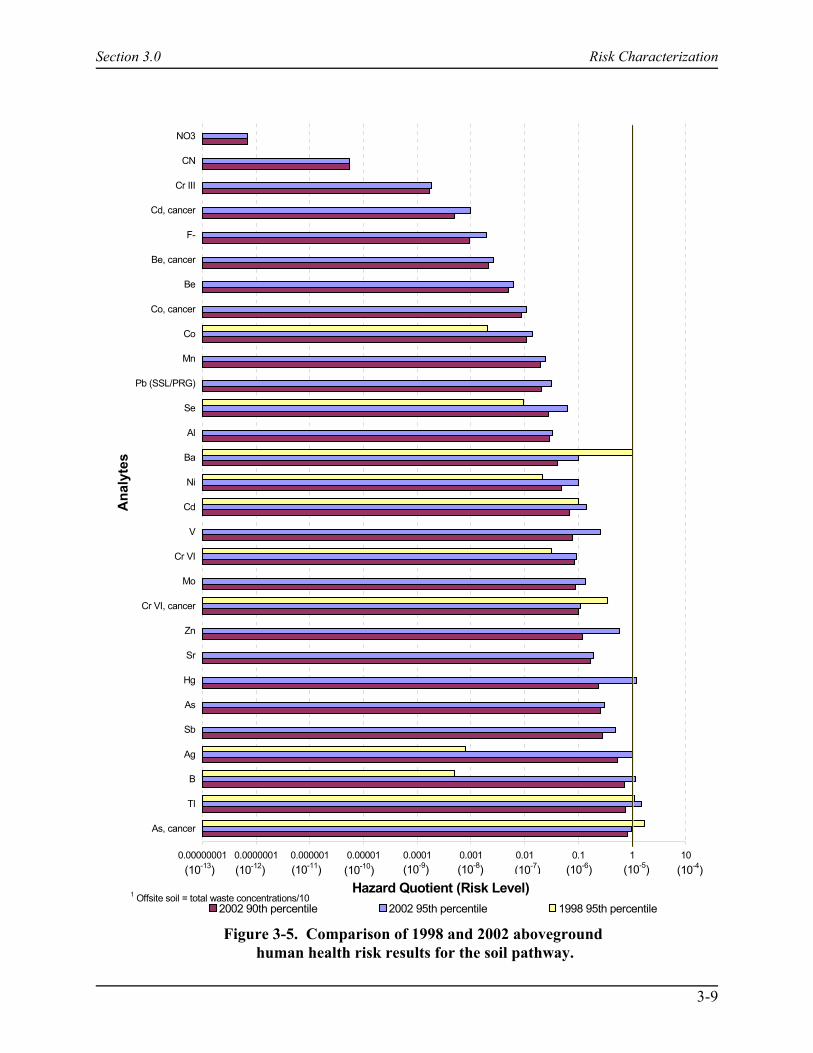
Figures 3-7 and 3-8 show the respective screening results for the groundwater-to-surface-water pathway. At the HQ criterion limit of 1, none of the constituents of concern are below thescreening criterion for landfills or for surface impoundments. However, considering theconservative nature of the CSCLs and the use of waste leachate and porewater concentrations torepresent surface water concentrations, a target HQ of 10 can be applied and a few metals (4surface impoundment porewater and 5 for landfill leachate) are below the screening criterion.
In the 1998 study, all but seven metals were below the risk criterion for the surface waterpathway—aluminum, arsenic, boron, cadmium, lead, mercury, selenium. (Aluminum and boronHQs greater than 1 were based on amphibian CSCLs derived from acute effects data.) However,the 1998 study estimated surface water exposure for ecological receptors based on surface waterconcentrations from aboveground transport (where risks were negligible) and concentrations inthe waters of the surface impoundments themselves (where risks were significant). Whilesurface impoundments may be used by mammals and birds in the area for feeding and foraging,there is no expectation that surface impoundments support aquatic communities (e.g., fish,aquatic invertebrates), and therefore risks to aquatic receptors were not considered in 1998 forexposures within surface impoundments.
The current surface water screening addresses exposure to receptors in offsite surfacewaterbodies impacted by groundwater, where both the aquatic communities and upper trophiclevel terrestrial receptors would need to be protected.7 Figures 3-7 and 3-8 show the 1998impoundment water results for comparison. If data were available to reassess ecological risksfor exposure in surface impoundment waters, we would follow a similar approach to the 1998study and restrict the analysis to terrestrial receptors that obtain food and prey from the surfaceimpoundments and exclude aquatic receptors living in the water column. However, in theabsence of new analytical data for impoundment water, the 1998 results are used for this 2002screening analysis.
Results for the sediment pathway are shown in Figure 3-9. Sediment HQs are calculatedby dividing 90th percentile whole-waste concentrations by sediment CSCLs. All chemicals forwhich CSCLs are available screen out for the sediment pathway. The sediment HQs inFigure 3-9 reflect a sediment concentration equivalent to 95th percentile whole wasteconcentrations diluted by a factor of 1,000. In a comparison, based on the 1998 wasteconcentrations and modeled sediment concentrations, the lowest dilution factor was 13,000 (i.e.,
Section 3.0 Risk Characterization
3-13
0.1 1 10 100 1000 10000 100000 1000000
B
Hg
As IV
Pb
Co
Al
Ba
Se, total
Cd
Se VI
As III
Cr VI
Cu
V
Ni
Ag
Se IV
Be
Zn
Cr III
Tl
Mo
Sb
Ana
lyte
s
Ecological Hazard Quotient (HQ)
2002 SI Porewater (GW-to-SW exposure pathway) 1998 SI Wastewater (direct exposure)
Figure 3-7. CCW surface impoundment ecological screening risks:Groundwater-to-surface-water pathway.
Section 3.0 Risk Characterization
3-14
0.1 1 10 100 1000 10000 100000 1000000
Hg
B
Pb
Ba
Al
Ag
As IV
Se, total
Be
V
Cd
Se VI
Cr VI
Zn
Cu
Sb
Se IV
Ni
Tl
Co
As III
Cr III
MoA
naly
tes
Ecological Hazard Quotient (HQ)2002 Landfill leachate (GW-to-SW exposure pathway) 1998 SI wastewater (direct exposure)
Figure 3-8. CCW landfill (TCLP) ecological screening risks:Groundwater-to-surface-water pathway.

Section 3.0 Risk Characterization
3-15
0.00001 0.0001 0.001 0.01 0.1 1
Pb
As
V
Sb
Ni
Ag
Hg
Cu
Cr
Cd
Ba
Zn
Mo
Ana
lyte
s
Ecological Hazard Quotient (HQ)
2002 90th percentile 2002 95th percentile 1998 95th percentile
Figure 3-9. CCW landfill aboveground ecological screening risks:Sediment pathway.
Section 3.0 Risk Characterization
3-16
the factor of 1,000 is clearly conservative). These results indicate no potential concern for thesediment pathway with respect to aboveground transport pathways. However, the potential forsediment contamination from groundwater-to-surface water discharge has not been assessed. Furthermore, eight potentially significant metals (aluminum, beryllium, boron, cobalt,molybdenum, selenium, thallium, and vanadium) are not assessed for the sediment pathwaybecause of a lack of toxicological benchmarks.
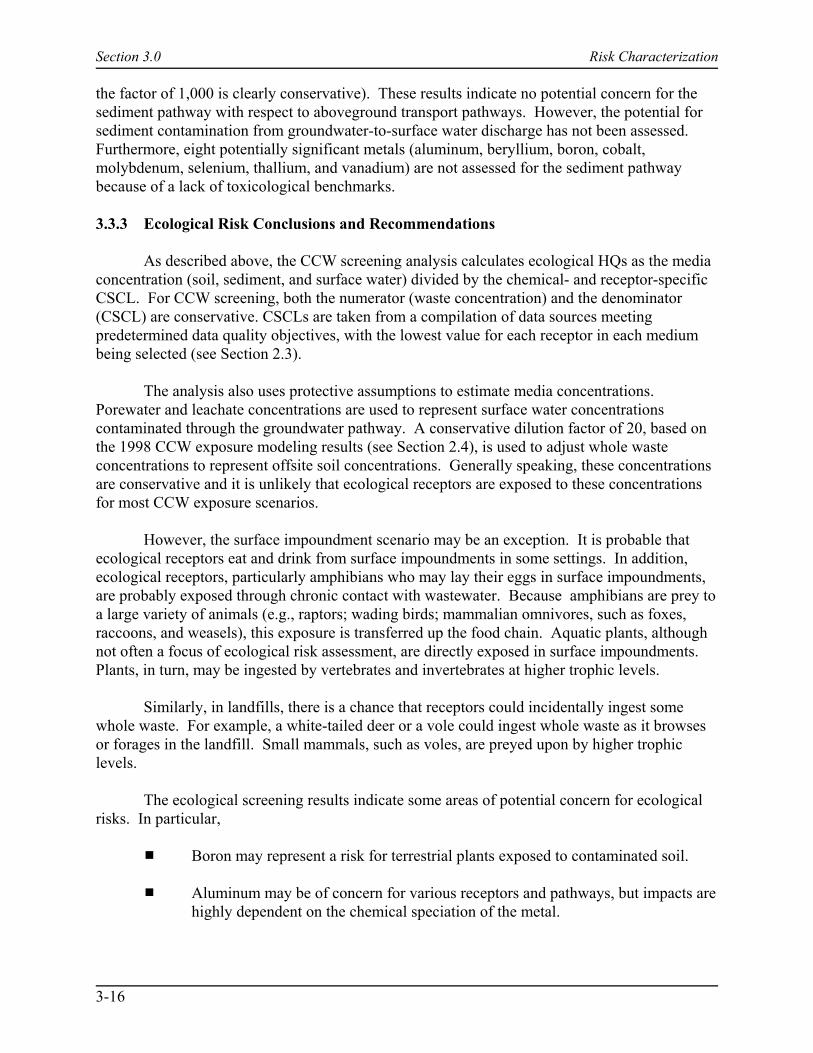
3.3.3 Ecological Risk Conclusions and Recommendations
As described above, the CCW screening analysis calculates ecological HQs as the mediaconcentration (soil, sediment, and surface water) divided by the chemical- and receptor-specificCSCL. For CCW screening, both the numerator (waste concentration) and the denominator(CSCL) are conservative. CSCLs are taken from a compilation of data sources meetingpredetermined data quality objectives, with the lowest value for each receptor in each mediumbeing selected (see Section 2.3).
The analysis also uses protective assumptions to estimate media concentrations.Porewater and leachate concentrations are used to represent surface water concentrationscontaminated through the groundwater pathway. A conservative dilution factor of 20, based onthe 1998 CCW exposure modeling results (see Section 2.4), is used to adjust whole wasteconcentrations to represent offsite soil concentrations. Generally speaking, these concentrationsare conservative and it is unlikely that ecological receptors are exposed to these concentrationsfor most CCW exposure scenarios.
However, the surface impoundment scenario may be an exception. It is probable thatecological receptors eat and drink from surface impoundments in some settings. In addition,ecological receptors, particularly amphibians who may lay their eggs in surface impoundments,are probably exposed through chronic contact with wastewater. Because amphibians are prey toa large variety of animals (e.g., raptors; wading birds; mammalian omnivores, such as foxes,raccoons, and weasels), this exposure is transferred up the food chain. Aquatic plants, althoughnot often a focus of ecological risk assessment, are directly exposed in surface impoundments. Plants, in turn, may be ingested by vertebrates and invertebrates at higher trophic levels.
Similarly, in landfills, there is a chance that receptors could incidentally ingest somewhole waste. For example, a white-tailed deer or a vole could ingest whole waste as it browsesor forages in the landfill. Small mammals, such as voles, are preyed upon by higher trophiclevels.
The ecological screening results indicate some areas of potential concern for ecologicalrisks. In particular,
# Boron may represent a risk for terrestrial plants exposed to contaminated soil.
# Aluminum may be of concern for various receptors and pathways, but impacts arehighly dependent on the chemical speciation of the metal.
Section 3.0 Risk Characterization
3-17
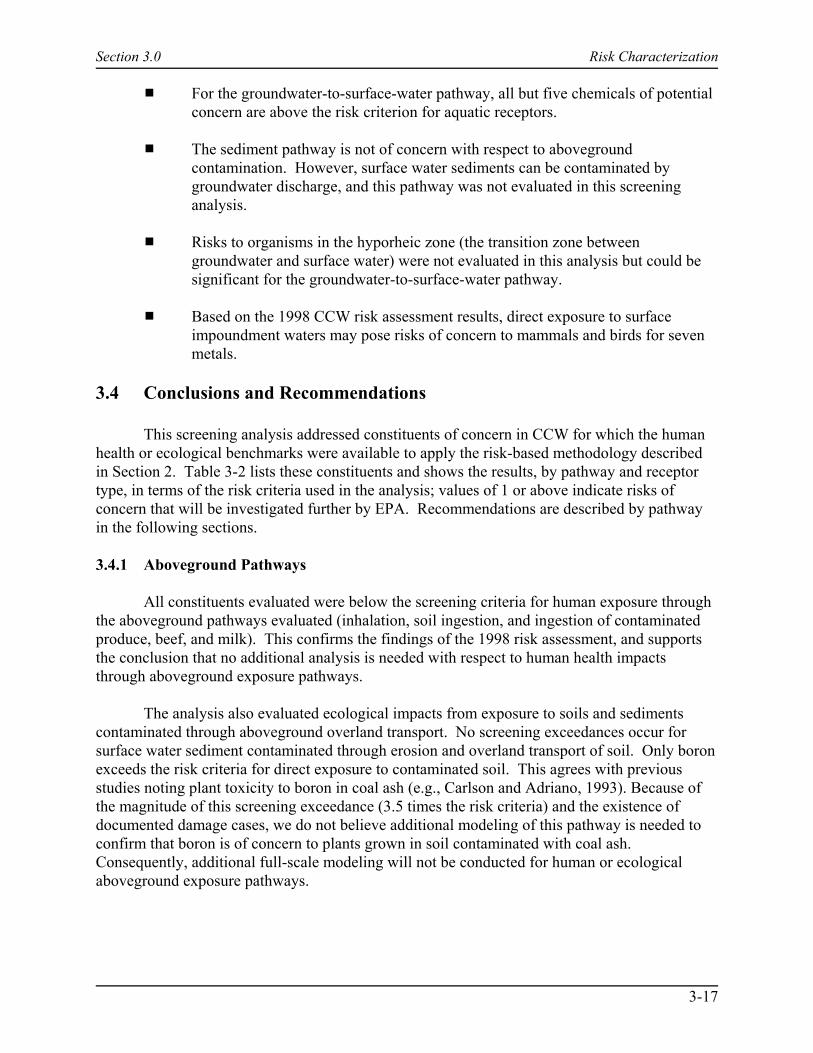
# For the groundwater-to-surface-water pathway, all but five chemicals of potentialconcern are above the risk criterion for aquatic receptors.
# The sediment pathway is not of concern with respect to abovegroundcontamination. However, surface water sediments can be contaminated bygroundwater discharge, and this pathway was not evaluated in this screeninganalysis.
# Risks to organisms in the hyporheic zone (the transition zone betweengroundwater and surface water) were not evaluated in this analysis but could besignificant for the groundwater-to-surface-water pathway.
# Based on the 1998 CCW risk assessment results, direct exposure to surfaceimpoundment waters may pose risks of concern to mammals and birds for sevenmetals.
3.4 Conclusions and Recommendations
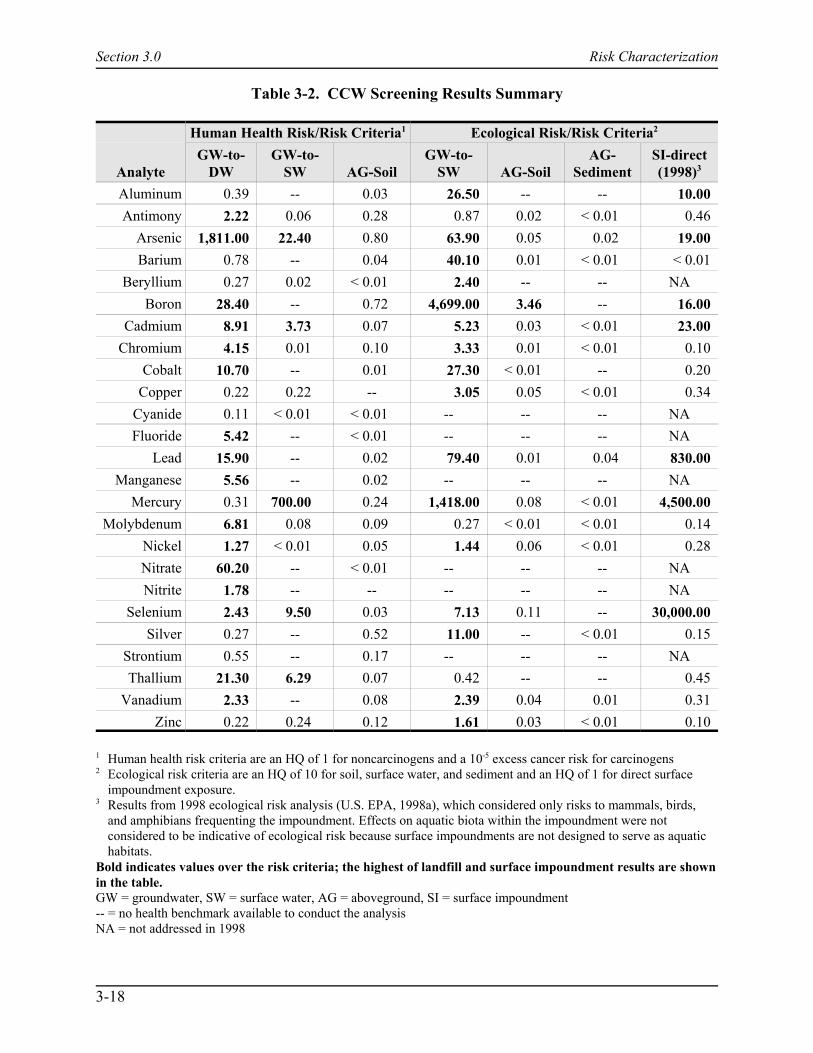
This screening analysis addressed constituents of concern in CCW for which the humanhealth or ecological benchmarks were available to apply the risk-based methodology describedin Section 2. Table 3-2 lists these constituents and shows the results, by pathway and receptortype, in terms of the risk criteria used in the analysis; values of 1 or above indicate risks ofconcern that will be investigated further by EPA. Recommendations are described by pathwayin the following sections.
3.4.1 Aboveground Pathways
All constituents evaluated were below the screening criteria for human exposure throughthe aboveground pathways evaluated (inhalation, soil ingestion, and ingestion of contaminatedproduce, beef, and milk). This confirms the findings of the 1998 risk assessment, and supportsthe conclusion that no additional analysis is needed with respect to human health impactsthrough aboveground exposure pathways.
The analysis also evaluated ecological impacts from exposure to soils and sedimentscontaminated through aboveground overland transport. No screening exceedances occur forsurface water sediment contaminated through erosion and overland transport of soil. Only boronexceeds the risk criteria for direct exposure to contaminated soil. This agrees with previousstudies noting plant toxicity to boron in coal ash (e.g., Carlson and Adriano, 1993). Because ofthe magnitude of this screening exceedance (3.5 times the risk criteria) and the existence ofdocumented damage cases, we do not believe additional modeling of this pathway is needed toconfirm that boron is of concern to plants grown in soil contaminated with coal ash.Consequently, additional full-scale modeling will not be conducted for human or ecologicalaboveground exposure pathways.
Section 3.0 Risk Characterization
3-18
Table 3-2. CCW Screening Results Summary
Analyte
Human Health Risk/Risk Criteria1 Ecological Risk/Risk Criteria2
GW-to-DW
GW-to-SW AG-Soil
GW-to-SW AG-Soil
AG-Sediment
SI-direct(1998)3
Aluminum 0.39 -- 0.03 26.50 -- -- 10.00Antimony 2.22 0.06 0.28 0.87 0.02 < 0.01 0.46
Arsenic 1,811.00 22.40 0.80 63.90 0.05 0.02 19.00Barium 0.78 -- 0.04 40.10 0.01 < 0.01 < 0.01
Beryllium 0.27 0.02 < 0.01 2.40 -- -- NABoron 28.40 -- 0.72 4,699.00 3.46 -- 16.00
Cadmium 8.91 3.73 0.07 5.23 0.03 < 0.01 23.00Chromium 4.15 0.01 0.10 3.33 0.01 < 0.01 0.10
Cobalt 10.70 -- 0.01 27.30 < 0.01 -- 0.20Copper 0.22 0.22 -- 3.05 0.05 < 0.01 0.34
Cyanide 0.11 < 0.01 < 0.01 -- -- -- NAFluoride 5.42 -- < 0.01 -- -- -- NA
Lead 15.90 -- 0.02 79.40 0.01 0.04 830.00Manganese 5.56 -- 0.02 -- -- -- NA
Mercury 0.31 700.00 0.24 1,418.00 0.08 < 0.01 4,500.00Molybdenum 6.81 0.08 0.09 0.27 < 0.01 < 0.01 0.14
Nickel 1.27 < 0.01 0.05 1.44 0.06 < 0.01 0.28Nitrate 60.20 -- < 0.01 -- -- -- NANitrite 1.78 -- -- -- -- -- NA
Selenium 2.43 9.50 0.03 7.13 0.11 -- 30,000.00Silver 0.27 -- 0.52 11.00 -- < 0.01 0.15
Strontium 0.55 -- 0.17 -- -- -- NAThallium 21.30 6.29 0.07 0.42 -- -- 0.45
Vanadium 2.33 -- 0.08 2.39 0.04 0.01 0.31Zinc 0.22 0.24 0.12 1.61 0.03 < 0.01 0.10
1 Human health risk criteria are an HQ of 1 for noncarcinogens and a 10-5 excess cancer risk for carcinogens2 Ecological risk criteria are an HQ of 10 for soil, surface water, and sediment and an HQ of 1 for direct surface
impoundment exposure.3 Results from 1998 ecological risk analysis (U.S. EPA, 1998a), which considered only risks to mammals, birds,
and amphibians frequenting the impoundment. Effects on aquatic biota within the impoundment were notconsidered to be indicative of ecological risk because surface impoundments are not designed to serve as aquatichabitats.
Bold indicates values over the risk criteria; the highest of landfill and surface impoundment results are shownin the table.GW = groundwater, SW = surface water, AG = aboveground, SI = surface impoundment-- = no health benchmark available to conduct the analysisNA = not addressed in 1998

Section 3.0 Risk Characterization
3-19
3.4.2 Groundwater Pathways
With respect to exposure through groundwater transport, 23 CCW constituents showedrisk above the screening criteria for human or ecological exposure. The screening analysisconfirms the results of the 1998 risk analysis that showed significant risks through thegroundwater-to-drinking-water pathway and suggests that risks are also significant for exposureto human and ecological receptors through the groundwater-to-surface-water pathway (whichwas not evaluated in 1998). The screening results support a full-scale modeling effort tocharacterize the nationwide distribution of risks through groundwater transport.
Table 3-3 summarizes the groundwater pathway screening results for these constituentsby showing the risk ranking, by pathway, for each constituent. This table also prioritizes the 23constituents of concern for the groundwater pathways by risk rank and number of pathways/receptors with screening exceedances. These priorities are intended to help plan and implementthe full-scale modeling effort. Full-scale modeling will address both groundwater impacts ondrinking water wells (for human receptors) and groundwater impacts on surface water quality(for human and ecological receptors). Waterbodies of concern include fishable streams, rivers,and lakes adjacent to CCW landfills and surface impoundments, as well as nearby groundwater-fed wetlands where sensitive ecological receptors may be present.
Table 3-3. Summary of CCW Screening Results: Groundwater Pathway Exceedances
Analyte
Human Health -Drinking Water
Human Health -Surface Water1
Ecological Risk -Surface Water Modeling
PriorityLF Rank SI Rank LF Rank SI Rank LF Rank SI RankArsenic 1 1 2 5 7 3 1Boron 6 3 - - 2 1 1Cadmium 7 7 5 4 11 9 1Lead 4 5 - - 3 4 1Mercury - - 1 1 1 2 1Selenium 11 13 3 3 8 8 1Thallium 3 4 4 2 - - 1Aluminum - - - - 5 6 2Antimony 2 10 - - - - 2Barium - - - - 4 7 2Cobalt 6 - - - 5 2Molybdenum 5 8 - - - - 2Chromium 8 12 - - 12 10 3Fluoride 10 11 - - - - 3Manganese 13 9 - - - - 3Vanadium 9 14 - - 10 12 3
(continued)
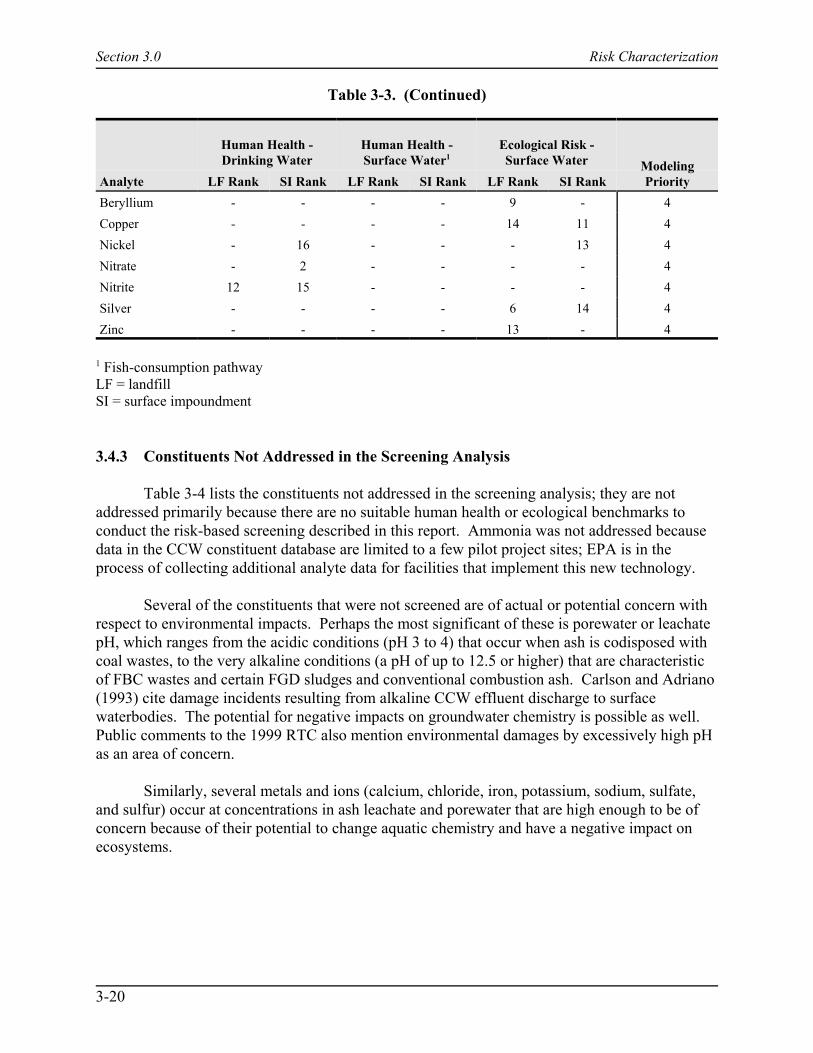
Table 3-3. (Continued)
Section 3.0 Risk Characterization
3-20
Analyte
Human Health -Drinking Water
Human Health -Surface Water1
Ecological Risk -Surface Water Modeling
PriorityLF Rank SI Rank LF Rank SI Rank LF Rank SI RankBeryllium - - - - 9 - 4Copper - - - - 14 11 4Nickel - 16 - - - 13 4Nitrate - 2 - - - - 4Nitrite 12 15 - - - - 4Silver - - - - 6 14 4Zinc - - - - 13 - 4
1 Fish-consumption pathwayLF = landfillSI = surface impoundment
3.4.3 Constituents Not Addressed in the Screening Analysis
Table 3-4 lists the constituents not addressed in the screening analysis; they are notaddressed primarily because there are no suitable human health or ecological benchmarks toconduct the risk-based screening described in this report. Ammonia was not addressed becausedata in the CCW constituent database are limited to a few pilot project sites; EPA is in theprocess of collecting additional analyte data for facilities that implement this new technology.
Several of the constituents that were not screened are of actual or potential concern withrespect to environmental impacts. Perhaps the most significant of these is porewater or leachatepH, which ranges from the acidic conditions (pH 3 to 4) that occur when ash is codisposed withcoal wastes, to the very alkaline conditions (a pH of up to 12.5 or higher) that are characteristicof FBC wastes and certain FGD sludges and conventional combustion ash. Carlson and Adriano(1993) cite damage incidents resulting from alkaline CCW effluent discharge to surfacewaterbodies. The potential for negative impacts on groundwater chemistry is possible as well.Public comments to the 1999 RTC also mention environmental damages by excessively high pHas an area of concern.
Similarly, several metals and ions (calcium, chloride, iron, potassium, sodium, sulfate,and sulfur) occur at concentrations in ash leachate and porewater that are high enough to be ofconcern because of their potential to change aquatic chemistry and have a negative impact onecosystems.
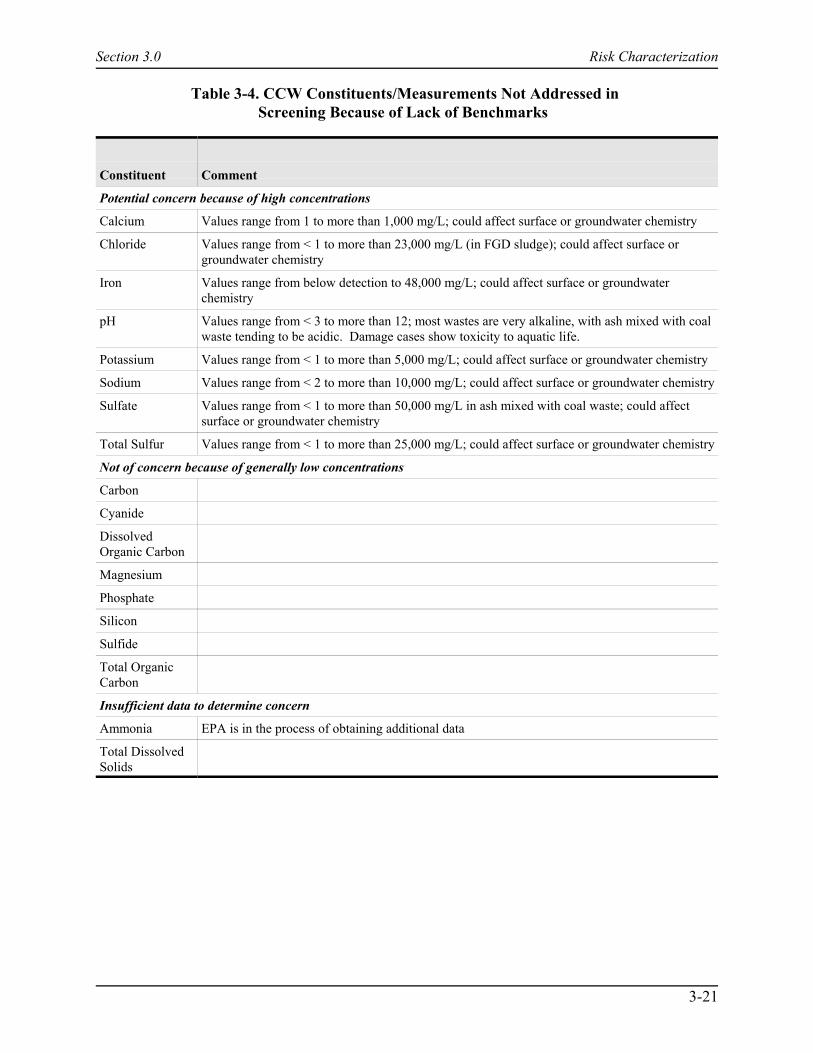
Section 3.0 Risk Characterization
3-21
Table 3-4. CCW Constituents/Measurements Not Addressed in Screening Because of Lack of Benchmarks
Constituent Comment
Potential concern because of high concentrations
Calcium Values range from 1 to more than 1,000 mg/L; could affect surface or groundwater chemistry
Chloride Values range from < 1 to more than 23,000 mg/L (in FGD sludge); could affect surface orgroundwater chemistry
Iron Values range from below detection to 48,000 mg/L; could affect surface or groundwaterchemistry
pH Values range from < 3 to more than 12; most wastes are very alkaline, with ash mixed with coalwaste tending to be acidic. Damage cases show toxicity to aquatic life.
Potassium Values range from < 1 to more than 5,000 mg/L; could affect surface or groundwater chemistry
Sodium Values range from < 2 to more than 10,000 mg/L; could affect surface or groundwater chemistry
Sulfate Values range from < 1 to more than 50,000 mg/L in ash mixed with coal waste; could affectsurface or groundwater chemistry
Total Sulfur Values range from < 1 to more than 25,000 mg/L; could affect surface or groundwater chemistry
Not of concern because of generally low concentrations
Carbon
Cyanide
DissolvedOrganic Carbon
Magnesium
Phosphate
Silicon
Sulfide
Total OrganicCarbon
Insufficient data to determine concern
Ammonia EPA is in the process of obtaining additional data
Total DissolvedSolids
Section 4.0 References
4-1
4.0 References
Carlson, C. L., and D. C. Adriano. 1993. Environmental impacts of coal combustion residues. J.Environ. Qual. 22:227-247.
EPRI (Electric Power Research Institute). 1997. Coal Combustion By-Products and Low-Volume Wastes Comanagement Survey. Palo Alto, CA. June.
U.S. EPA (Environmental Protection Agency). 1998a. Non-groundwater Pathways, HumanHealth and Ecological Risk Analysis for Fossil Fuel Combustion Phase 2 (FFC2): DraftFinal Report. Office of Solid Waste, Washington, DC. June.
U.S EPA (Environmental Protection Agency). 1998b. Technical Background Document for theSupplemental Report to Congress on Remaining Fossil Fuel Combustion Wastes:Ground-Water Pathway Human Health Risk Assessment. Revised Draft Final. Office ofSolid Waste, Washington, DC. June.
U.S. EPA (Environmental Protection Agency). 1999. Report to Congress: Wastes from theCombustion of Fossil Fuels. EPA 530-5-99-010. Office of Solid Waste and EmergencyResponse, Washington, DC. March.
Appendix A
FFCW Constituent Data

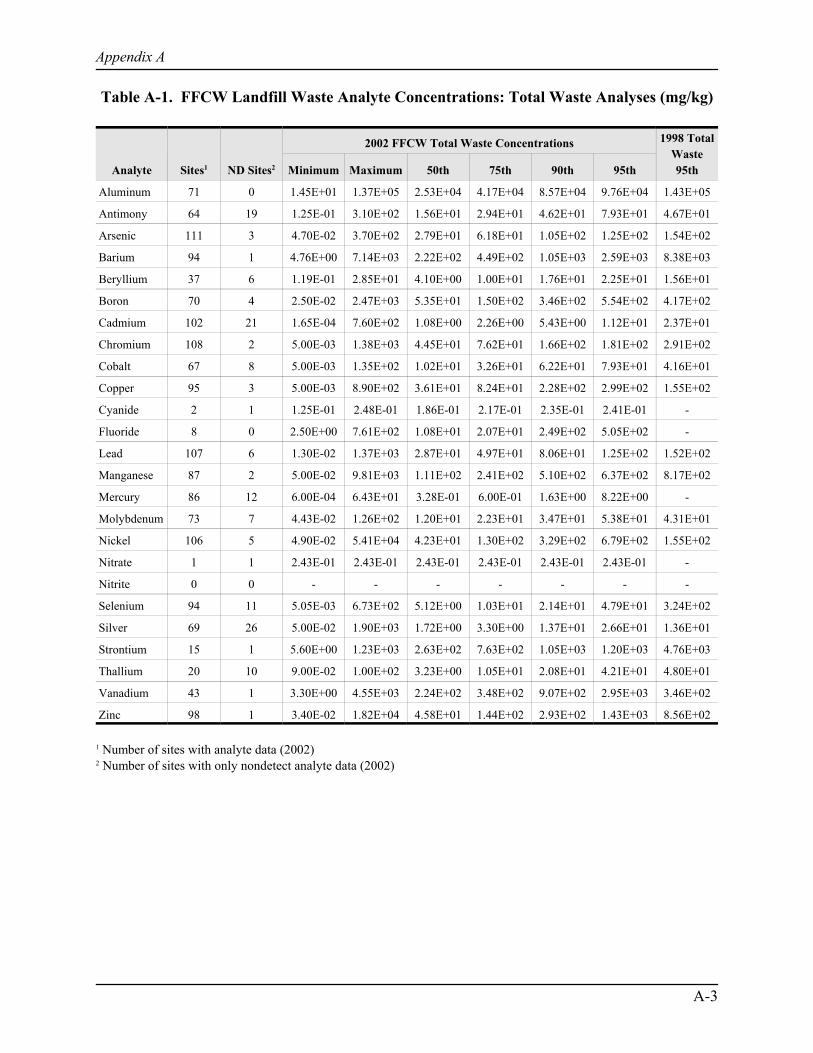
Appendix A
A-3
Table A-1. FFCW Landfill Waste Analyte Concentrations: Total Waste Analyses (mg/kg)
Analyte Sites1 ND Sites2
2002 FFCW Total Waste Concentrations 1998 TotalWaste95thMinimum Maximum 50th 75th 90th 95th
Aluminum 71 0 1.45E+01 1.37E+05 2.53E+04 4.17E+04 8.57E+04 9.76E+04 1.43E+05
Antimony 64 19 1.25E-01 3.10E+02 1.56E+01 2.94E+01 4.62E+01 7.93E+01 4.67E+01
Arsenic 111 3 4.70E-02 3.70E+02 2.79E+01 6.18E+01 1.05E+02 1.25E+02 1.54E+02
Barium 94 1 4.76E+00 7.14E+03 2.22E+02 4.49E+02 1.05E+03 2.59E+03 8.38E+03
Beryllium 37 6 1.19E-01 2.85E+01 4.10E+00 1.00E+01 1.76E+01 2.25E+01 1.56E+01
Boron 70 4 2.50E-02 2.47E+03 5.35E+01 1.50E+02 3.46E+02 5.54E+02 4.17E+02
Cadmium 102 21 1.65E-04 7.60E+02 1.08E+00 2.26E+00 5.43E+00 1.12E+01 2.37E+01
Chromium 108 2 5.00E-03 1.38E+03 4.45E+01 7.62E+01 1.66E+02 1.81E+02 2.91E+02
Cobalt 67 8 5.00E-03 1.35E+02 1.02E+01 3.26E+01 6.22E+01 7.93E+01 4.16E+01
Copper 95 3 5.00E-03 8.90E+02 3.61E+01 8.24E+01 2.28E+02 2.99E+02 1.55E+02
Cyanide 2 1 1.25E-01 2.48E-01 1.86E-01 2.17E-01 2.35E-01 2.41E-01 -
Fluoride 8 0 2.50E+00 7.61E+02 1.08E+01 2.07E+01 2.49E+02 5.05E+02 -
Lead 107 6 1.30E-02 1.37E+03 2.87E+01 4.97E+01 8.06E+01 1.25E+02 1.52E+02
Manganese 87 2 5.00E-02 9.81E+03 1.11E+02 2.41E+02 5.10E+02 6.37E+02 8.17E+02
Mercury 86 12 6.00E-04 6.43E+01 3.28E-01 6.00E-01 1.63E+00 8.22E+00 -
Molybdenum 73 7 4.43E-02 1.26E+02 1.20E+01 2.23E+01 3.47E+01 5.38E+01 4.31E+01
Nickel 106 5 4.90E-02 5.41E+04 4.23E+01 1.30E+02 3.29E+02 6.79E+02 1.55E+02
Nitrate 1 1 2.43E-01 2.43E-01 2.43E-01 2.43E-01 2.43E-01 2.43E-01 -
Nitrite 0 0 - - - - - - -
Selenium 94 11 5.05E-03 6.73E+02 5.12E+00 1.03E+01 2.14E+01 4.79E+01 3.24E+02
Silver 69 26 5.00E-02 1.90E+03 1.72E+00 3.30E+00 1.37E+01 2.66E+01 1.36E+01
Strontium 15 1 5.60E+00 1.23E+03 2.63E+02 7.63E+02 1.05E+03 1.20E+03 4.76E+03
Thallium 20 10 9.00E-02 1.00E+02 3.23E+00 1.05E+01 2.08E+01 4.21E+01 4.80E+01
Vanadium 43 1 3.30E+00 4.55E+03 2.24E+02 3.48E+02 9.07E+02 2.95E+03 3.46E+02
Zinc 98 1 3.40E-02 1.82E+04 4.58E+01 1.44E+02 2.93E+02 1.43E+03 8.56E+02
1 Number of sites with analyte data (2002)2 Number of sites with only nondetect analyte data (2002)
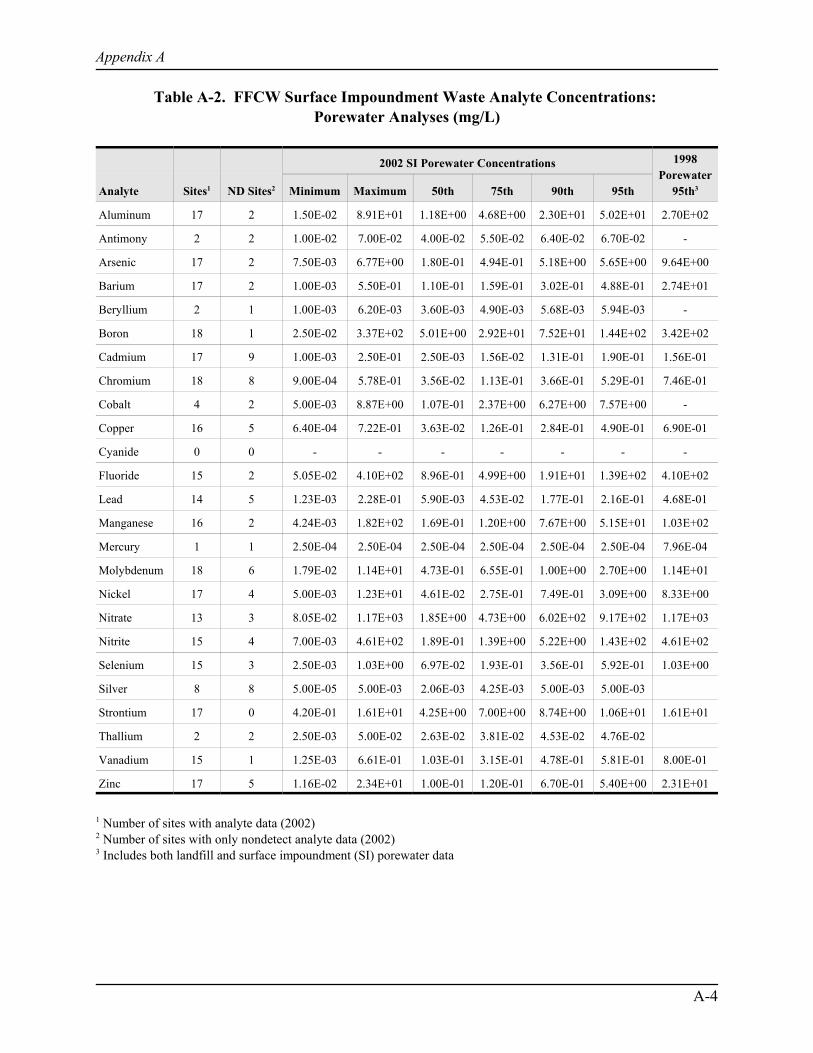
Appendix A
A-4
Table A-2. FFCW Surface Impoundment Waste Analyte Concentrations: Porewater Analyses (mg/L)
Analyte Sites1 ND Sites2
2002 SI Porewater Concentrations 1998Porewater
95th3Minimum Maximum 50th 75th 90th 95th
Aluminum 17 2 1.50E-02 8.91E+01 1.18E+00 4.68E+00 2.30E+01 5.02E+01 2.70E+02
Antimony 2 2 1.00E-02 7.00E-02 4.00E-02 5.50E-02 6.40E-02 6.70E-02 -
Arsenic 17 2 7.50E-03 6.77E+00 1.80E-01 4.94E-01 5.18E+00 5.65E+00 9.64E+00
Barium 17 2 1.00E-03 5.50E-01 1.10E-01 1.59E-01 3.02E-01 4.88E-01 2.74E+01
Beryllium 2 1 1.00E-03 6.20E-03 3.60E-03 4.90E-03 5.68E-03 5.94E-03 -
Boron 18 1 2.50E-02 3.37E+02 5.01E+00 2.92E+01 7.52E+01 1.44E+02 3.42E+02
Cadmium 17 9 1.00E-03 2.50E-01 2.50E-03 1.56E-02 1.31E-01 1.90E-01 1.56E-01
Chromium 18 8 9.00E-04 5.78E-01 3.56E-02 1.13E-01 3.66E-01 5.29E-01 7.46E-01
Cobalt 4 2 5.00E-03 8.87E+00 1.07E-01 2.37E+00 6.27E+00 7.57E+00 -
Copper 16 5 6.40E-04 7.22E-01 3.63E-02 1.26E-01 2.84E-01 4.90E-01 6.90E-01
Cyanide 0 0 - - - - - - -
Fluoride 15 2 5.05E-02 4.10E+02 8.96E-01 4.99E+00 1.91E+01 1.39E+02 4.10E+02
Lead 14 5 1.23E-03 2.28E-01 5.90E-03 4.53E-02 1.77E-01 2.16E-01 4.68E-01
Manganese 16 2 4.24E-03 1.82E+02 1.69E-01 1.20E+00 7.67E+00 5.15E+01 1.03E+02
Mercury 1 1 2.50E-04 2.50E-04 2.50E-04 2.50E-04 2.50E-04 2.50E-04 7.96E-04
Molybdenum 18 6 1.79E-02 1.14E+01 4.73E-01 6.55E-01 1.00E+00 2.70E+00 1.14E+01
Nickel 17 4 5.00E-03 1.23E+01 4.61E-02 2.75E-01 7.49E-01 3.09E+00 8.33E+00
Nitrate 13 3 8.05E-02 1.17E+03 1.85E+00 4.73E+00 6.02E+02 9.17E+02 1.17E+03
Nitrite 15 4 7.00E-03 4.61E+02 1.89E-01 1.39E+00 5.22E+00 1.43E+02 4.61E+02
Selenium 15 3 2.50E-03 1.03E+00 6.97E-02 1.93E-01 3.56E-01 5.92E-01 1.03E+00
Silver 8 8 5.00E-05 5.00E-03 2.06E-03 4.25E-03 5.00E-03 5.00E-03
Strontium 17 0 4.20E-01 1.61E+01 4.25E+00 7.00E+00 8.74E+00 1.06E+01 1.61E+01
Thallium 2 2 2.50E-03 5.00E-02 2.63E-02 3.81E-02 4.53E-02 4.76E-02
Vanadium 15 1 1.25E-03 6.61E-01 1.03E-01 3.15E-01 4.78E-01 5.81E-01 8.00E-01
Zinc 17 5 1.16E-02 2.34E+01 1.00E-01 1.20E-01 6.70E-01 5.40E+00 2.31E+01
1 Number of sites with analyte data (2002)2 Number of sites with only nondetect analyte data (2002)3 Includes both landfill and surface impoundment (SI) porewater data
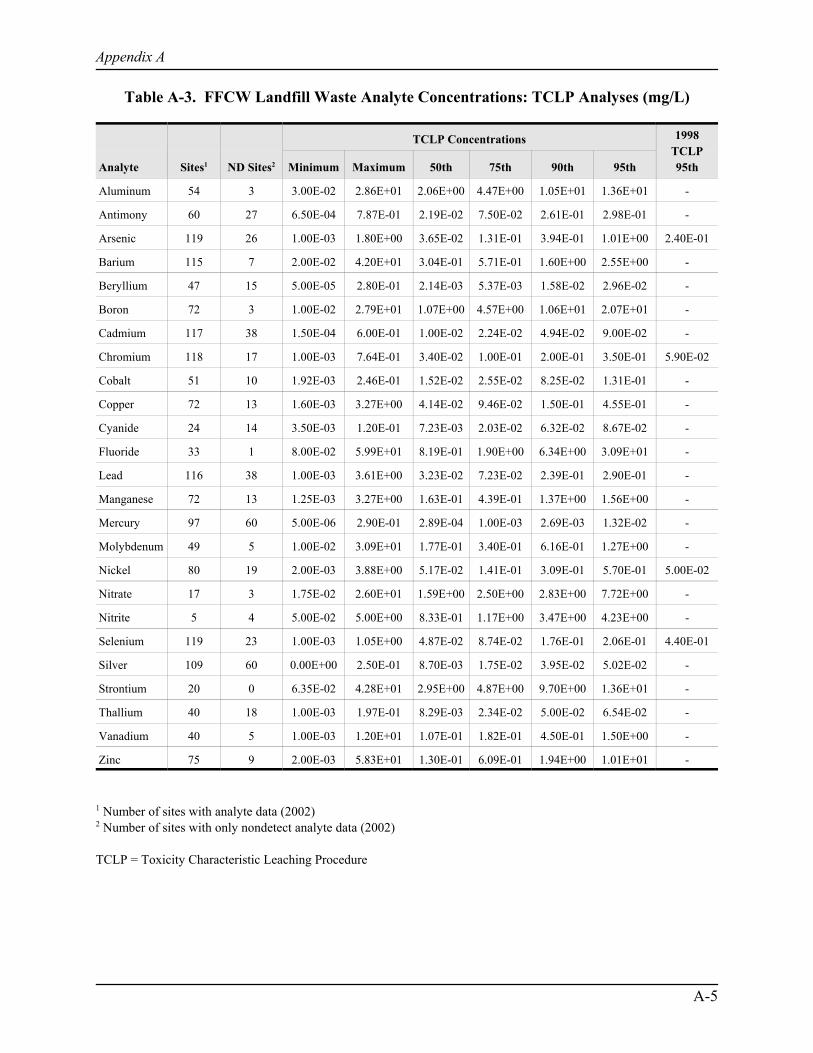
Appendix A
A-5
Table A-3. FFCW Landfill Waste Analyte Concentrations: TCLP Analyses (mg/L)
Analyte Sites1 ND Sites2
TCLP Concentrations 1998TCLP95thMinimum Maximum 50th 75th 90th 95th
Aluminum 54 3 3.00E-02 2.86E+01 2.06E+00 4.47E+00 1.05E+01 1.36E+01 -
Antimony 60 27 6.50E-04 7.87E-01 2.19E-02 7.50E-02 2.61E-01 2.98E-01 -
Arsenic 119 26 1.00E-03 1.80E+00 3.65E-02 1.31E-01 3.94E-01 1.01E+00 2.40E-01
Barium 115 7 2.00E-02 4.20E+01 3.04E-01 5.71E-01 1.60E+00 2.55E+00 -
Beryllium 47 15 5.00E-05 2.80E-01 2.14E-03 5.37E-03 1.58E-02 2.96E-02 -
Boron 72 3 1.00E-02 2.79E+01 1.07E+00 4.57E+00 1.06E+01 2.07E+01 -
Cadmium 117 38 1.50E-04 6.00E-01 1.00E-02 2.24E-02 4.94E-02 9.00E-02 -
Chromium 118 17 1.00E-03 7.64E-01 3.40E-02 1.00E-01 2.00E-01 3.50E-01 5.90E-02
Cobalt 51 10 1.92E-03 2.46E-01 1.52E-02 2.55E-02 8.25E-02 1.31E-01 -
Copper 72 13 1.60E-03 3.27E+00 4.14E-02 9.46E-02 1.50E-01 4.55E-01 -
Cyanide 24 14 3.50E-03 1.20E-01 7.23E-03 2.03E-02 6.32E-02 8.67E-02 -
Fluoride 33 1 8.00E-02 5.99E+01 8.19E-01 1.90E+00 6.34E+00 3.09E+01 -
Lead 116 38 1.00E-03 3.61E+00 3.23E-02 7.23E-02 2.39E-01 2.90E-01 -
Manganese 72 13 1.25E-03 3.27E+00 1.63E-01 4.39E-01 1.37E+00 1.56E+00 -
Mercury 97 60 5.00E-06 2.90E-01 2.89E-04 1.00E-03 2.69E-03 1.32E-02 -
Molybdenum 49 5 1.00E-02 3.09E+01 1.77E-01 3.40E-01 6.16E-01 1.27E+00 -
Nickel 80 19 2.00E-03 3.88E+00 5.17E-02 1.41E-01 3.09E-01 5.70E-01 5.00E-02
Nitrate 17 3 1.75E-02 2.60E+01 1.59E+00 2.50E+00 2.83E+00 7.72E+00 -
Nitrite 5 4 5.00E-02 5.00E+00 8.33E-01 1.17E+00 3.47E+00 4.23E+00 -
Selenium 119 23 1.00E-03 1.05E+00 4.87E-02 8.74E-02 1.76E-01 2.06E-01 4.40E-01
Silver 109 60 0.00E+00 2.50E-01 8.70E-03 1.75E-02 3.95E-02 5.02E-02 -
Strontium 20 0 6.35E-02 4.28E+01 2.95E+00 4.87E+00 9.70E+00 1.36E+01 -
Thallium 40 18 1.00E-03 1.97E-01 8.29E-03 2.34E-02 5.00E-02 6.54E-02 -
Vanadium 40 5 1.00E-03 1.20E+01 1.07E-01 1.82E-01 4.50E-01 1.50E+00 -
Zinc 75 9 2.00E-03 5.83E+01 1.30E-01 6.09E-01 1.94E+00 1.01E+01 -
1 Number of sites with analyte data (2002)2 Number of sites with only nondetect analyte data (2002)
TCLP = Toxicity Characteristic Leaching Procedure

Appendix A
A-6
0.001 0.01 0.1 1 10 100 1000 10000
As, Cancer
As
NO3 (MCL)
B
Tl
Pb (MCL)
Co
Cd
Mo
Mn
Sb
F-
Cr VI
Se
V
NO2
Ni
Sr
Al
Cu (MCL)
Ba
Be
Zn
Ag
Hg
Cr III
Ana
lyte
s
90th percentile concentration/health-based number (HBN)
Non-averaged Site-averaged
Figure A-1. Comparison of site-averaged and nonaveraged results for surface impoundmentporewater screening, groundwater-to-drinking-water pathway.
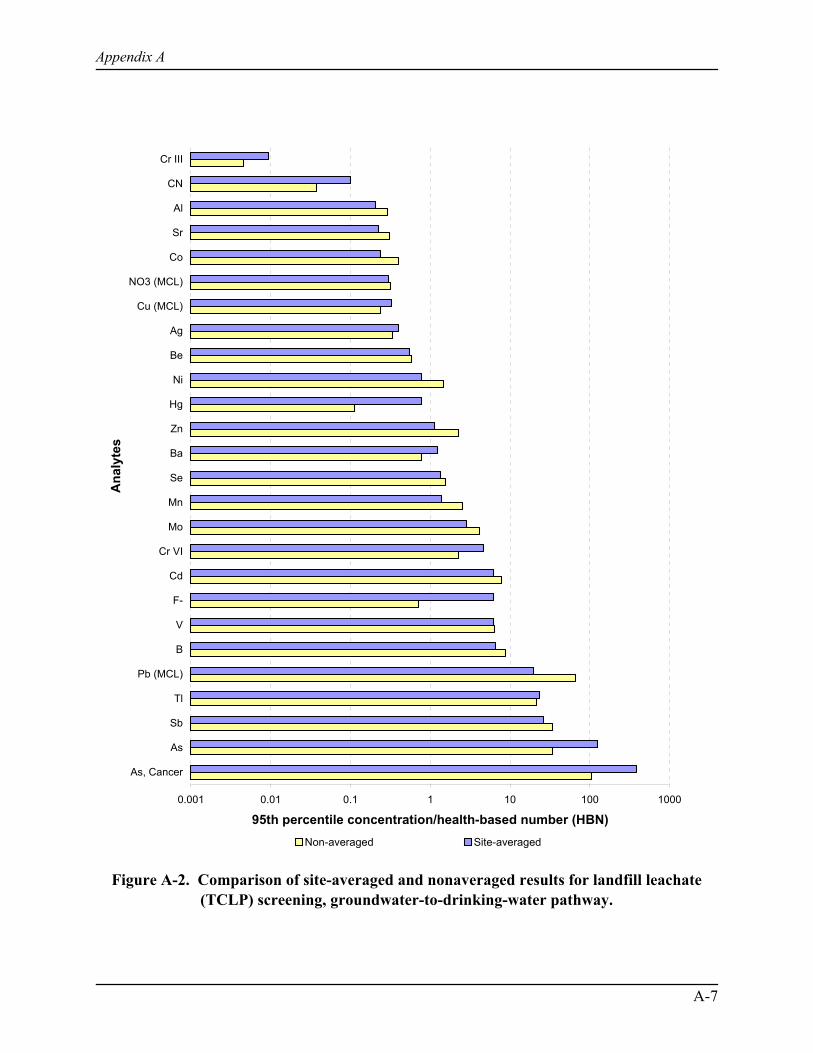
Appendix A
A-7
0.001 0.01 0.1 1 10 100 1000
As, Cancer
As
Sb
Tl
Pb (MCL)
B
V
F-
Cd
Cr VI
Mo
Mn
Se
Ba
Zn
Hg
Ni
Be
Ag
Cu (MCL)
NO3 (MCL)
Co
Sr
Al
CN
Cr III
Ana
lyte
s
95th percentile concentration/health-based number (HBN)Non-averaged Site-averaged
Figure A-2. Comparison of site-averaged and nonaveraged results for landfill leachate(TCLP) screening, groundwater-to-drinking-water pathway.
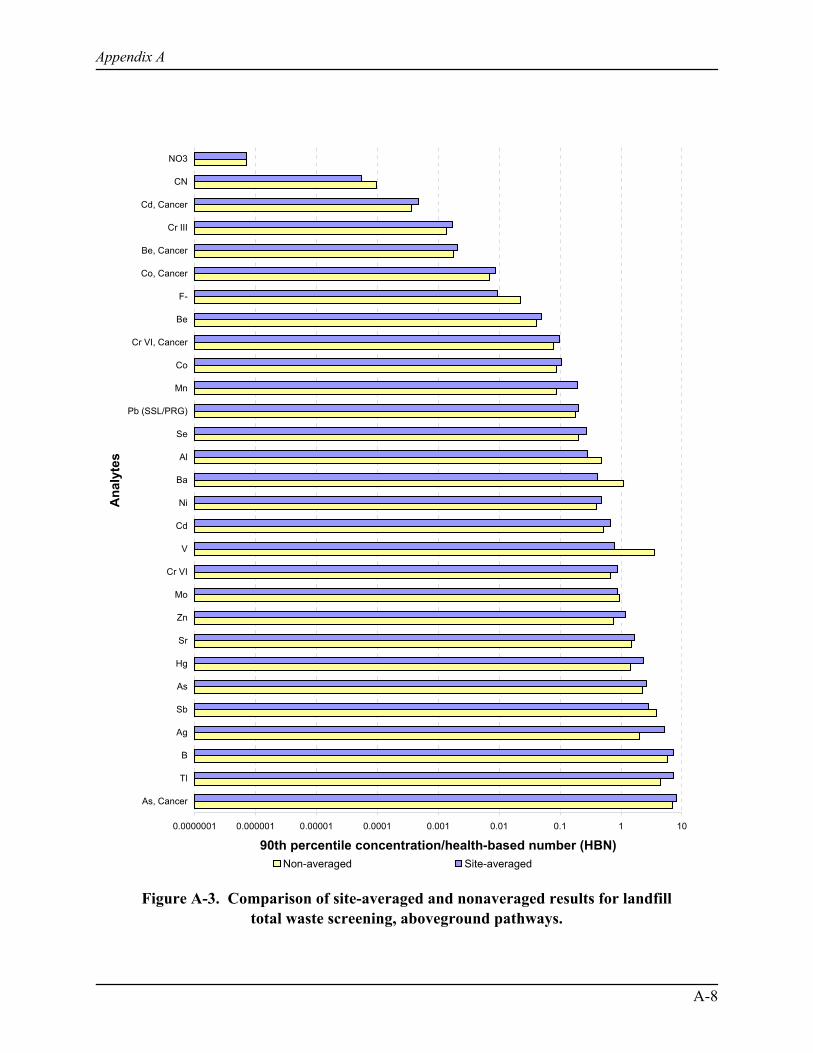
Appendix A
A-8
0.0000001 0.000001 0.00001 0.0001 0.001 0.01 0.1 1 10
As, Cancer
Tl
B
Ag
Sb
As
Hg
Sr
Zn
Mo
Cr VI
V
Cd
Ni
Ba
Al
Se
Pb (SSL/PRG)
Mn
Co
Cr VI, Cancer
Be
F-
Co, Cancer
Be, Cancer
Cr III
Cd, Cancer
CN
NO3
Ana
lyte
s
90th percentile concentration/health-based number (HBN)Non-averaged Site-averaged
Figure A-3. Comparison of site-averaged and nonaveraged results for landfilltotal waste screening, aboveground pathways.

Appendix B
Human Health Benchmarks

Appendix B September 2002
B-3
Appendix B
Human Health Benchmarks
The fossil fuel combustion waste (FFCW) risk assessment will require human healthbenchmarks to assess potential risks from chronic oral and inhalation exposures. The U.S.Environmental Protection Agency (EPA) uses reference doses (RfDs) and reference concentrations(RfCs) to evaluate noncancer risk from oral and inhalation exposures, respectively. Oral cancer slopefactors (CSFs), inhalation unit risk factors (URFs), and inhalation CSFs are used to evaluate risk forcarcinogens.
This appendix provides the human health benchmarks used in the FFCW screening and riskanalyses. Section B.1 describes the data sources and general hierarchy that RTI used to collect thesebenchmarks. Section B.2 provides the benchmarks along with discussions of individual human healthbenchmarks extracted from a variety of sources.
B.1 Methodology and Data Sources
Several sources of health benchmarks are available. RTI used health benchmarks developedby EPA to the extent that they were available. For chemicals for which EPA benchmarks were notavailable, we used available benchmarks from non-EPA sources. RTI obtained human healthbenchmarks from sources in the following order of preference:
# Integrated Risk Information System (IRIS)# Superfund Technical Support Center Provisional Benchmarks# Health Effects Assessment Summary Tables (HEAST)# EPA health assessment documents# Various other EPA health benchmark sources# Agency for Toxic Substances and Disease Registry (ATSDR) minimal risk levels
(MRLs)# California Environmental Protection Agency (CalEPA) chronic inhalation reference
exposure levels (RELs) and cancer potency factors.
Integrated Risk Information System (IRIS)
Benchmarks in IRIS are prepared and maintained by EPA, and RTI used values from IRISwhenever available. IRIS is EPA’s electronic database containing information on human health effects(U.S. EPA, 2002). Each chemical file contains descriptive and quantitative information on potentialhealth effects. Health benchmarks for chronic noncarcinogenic health effects include RfDs and RfCs. Cancer classification, oral CSFs, and inhalation URFs are included for carcinogenic effects. IRIS is theofficial repository of Agency-wide consensus of human health risk information.
Appendix B September 2002
B-4
Inhalation CSFs are not available from IRIS, so we calculated them from inhalation URFs(which are available from IRIS) using the following equation:
In this equation, 70 kg represents average body weight; 20 m3/d represents average inhalation rate; and1000 :g/mg is a units conversion factor (U.S. EPA, 1997). EPA uses these standard estimates ofbody weight and inhalation rate in the calculation of the URF; therefore, we used these values tocalculate inhalation CSFs.
Superfund Provisional Benchmarks
The Superfund Technical Support Center (EPA’s National Center for EnvironmentalAssessment [NCEA]) derives provisional RfCs, RfDs, and CSFs for certain chemicals. Theseprovisional health benchmarks can be found in Risk Assessment Issue Papers. Some of the provisionalvalues have been externally peer reviewed. These provisional values have not undergone EPA’s formalreview process for finalizing benchmarks and do not represent Agency-wide consensus information.
Health Effects Assessment Summary Tables (HEAST)
HEAST is a listing of provisional noncarcinogenic and carcinogenic health toxicity values (RfDs,RfCs, URFs, and CSFs) derived by EPA (U.S. EPA, 1997). Although the health toxicity values inHEAST have undergone review and have the concurrence of individual EPA program offices, eitherthey have not been reviewed as extensively as those in IRIS or their data set is not complete enough tobe listed in IRIS. HEAST benchmarks have not been updated in several years and do not representAgency-wide consensus information.
Other EPA Health Benchmarks
EPA has also derived health benchmark values in other risk assessment documents, such asHealth Assessment Documents (HADs), Health Effect Assessments (HEAs), Health and EnvironmentalEffects Profiles (HEEPs), Health and Environmental Effects Documents (HEEDs), Drinking WaterCriteria Documents, and Ambient Water Quality Criteria Documents. Evaluations of potentialcarcinogenicity of chemicals in support of reportable quantity adjustments were published by EPA’sCarcinogen Assessment Group (CAG) and may include cancer potency factor estimates. Healthbenchmarks derived by EPA for listing determinations (e.g., solvents) or studies (e.g., AirCharacteristic Study) are also available. Health toxicity values identified in these EPA documents areusually dated and are not recognized as Agency-wide consensus information or verified benchmarks.
Appendix B September 2002
B-5
ATSDR Minimal Risk Levels
The ATSDR MRLs are substance-specific health guidance levels for noncarcinogenicendpoints (ATSDR, 2002). An MRL is an estimate of the daily human exposure to a hazardoussubstance that is likely to be without appreciable risk of adverse noncancer health effects over aspecified duration of exposure. MRLs are based on noncancer health effects only and are not based ona consideration of cancer effects. MRLs are derived for acute, intermediate, and chronic exposuredurations for oral and inhalation routes of exposure. Inhalation and oral MRLs are derived in a mannersimilar to EPA’s RfCs and RfDs, respectively (i.e., ATSDR uses the no observed adverse effectlevel/uncertainty factor [NOAEL/UF] approach); however, MRLs are intended to serve as screeninglevels and are exposure duration-specific. Also, ATSDR uses EPA’s (1994) inhalation dosimetrymethodology in the derivation of inhalation MRLs.
CalEPA Cancer Potency Factors and Reference Exposure Levels
CalEPA has developed cancer potency factors for chemicals regulated under California’s HotSpots Air Toxics Program (CalEPA, 1999a). The cancer potency factors are analogous to EPA’s oraland inhalation CSFs. CalEPA has also developed chronic inhalation RELs, analogous to EPA’s RfC,for 120 substances (CalEPA, 1999b, 2000). CalEPA used EPA’s (1994) inhalation dosimetrymethodology in the derivation of inhalation RELs. The cancer potency factors and inhalation RELshave undergone internal peer review by various California agencies and have been the subject of publiccomment.
Surrogate Health Benchmarks
If no human health benchmarks were available from EPA or alternative sources, then RTIsought benchmarks for similar chemicals to use as surrogate data. For example, the health benchmarkof a mixture could serve as the surrogate benchmark for its components or a benchmark of a metal saltcould serve as the surrogate for an elemental metal.
B.2 Human Health Benchmarks
The chronic human health benchmarks used to calculate the health-based numbers (HBNs) inthe FFCW screening analysis are summarized in Table B-1, which provides the Chemical AbstractService Registry Number (CASRN), constituent name, RfD (mg/kg-d), RfC (mg/m3), oral CSF(mg/kg-d-1), inhalation URF [(:g/m3)-1], inhalation CSF (mg/kg-d-1), and reference for eachbenchmark. A key to the references cited and abbreviations used is provided at the end of the table.
For a majority of constituents, human health benchmarks were available from IRIS (U.S. EPA,2002), Superfund Provisional Benchmarks, or HEAST (U.S. EPA, 1997). Benchmarks also wereobtained from ATSDR (2002) or CalEPA (1999a, 1999b, 2000). This section describes benchmarksobtained from other sources, along with the Superfund Provisional values and special uses of IRISbenchmarks.

Appendix B September 2002
B-6
Provisional inhalation health benchmarks were developed in the Air Characteristic Study (U.S.EPA, 1999) for several constituents lacking IRIS, HEAST, alternative EPA, or ATSDR values. Forvanadium, the study on which the ATSDR acute inhalation MRL is based was used but was adjustedfor chronic exposure. Additional details on the derivation of this inhalation benchmark can be found inthe Revised Risk Assessment for the Air Characteristic Study (U.S. EPA, 1999).
The provisional RfD of 0.02 mg/kg-d developed by NCEA for the Superfund TechnicalSupport Center (U.S. EPA, 2001) was used for cobalt.
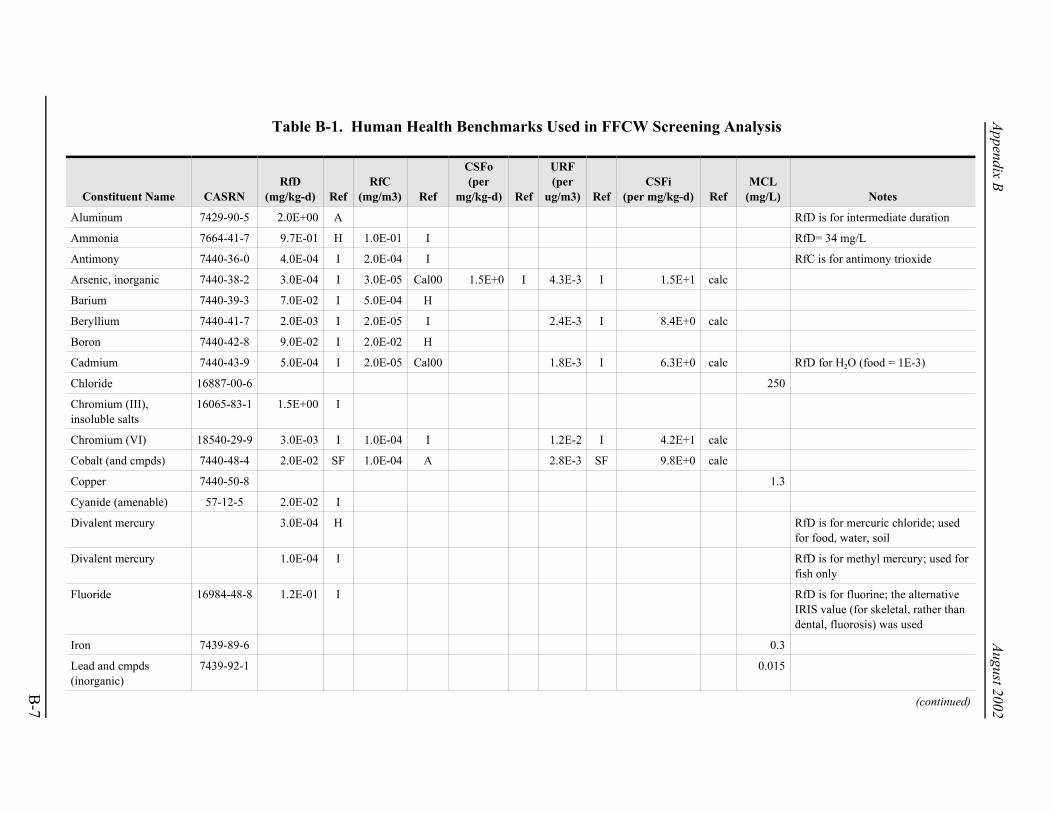
B-7
Appendix B August 2002
Table B-1. Human Health Benchmarks Used in FFCW Screening Analysis
Constituent Name CASRNRfD
(mg/kg-d) RefRfC
(mg/m3) Ref
CSFo(per
mg/kg-d) Ref
URF(per
ug/m3) RefCSFi
(per mg/kg-d) RefMCL
(mg/L) Notes
Aluminum 7429-90-5 2.0E+00 A RfD is for intermediate duration
Ammonia 7664-41-7 9.7E-01 H 1.0E-01 I RfD= 34 mg/L
Antimony 7440-36-0 4.0E-04 I 2.0E-04 I RfC is for antimony trioxide
Arsenic, inorganic 7440-38-2 3.0E-04 I 3.0E-05 Cal00 1.5E+0 I 4.3E-3 I 1.5E+1 calc
Barium 7440-39-3 7.0E-02 I 5.0E-04 H
Beryllium 7440-41-7 2.0E-03 I 2.0E-05 I 2.4E-3 I 8.4E+0 calc
Boron 7440-42-8 9.0E-02 I 2.0E-02 H
Cadmium 7440-43-9 5.0E-04 I 2.0E-05 Cal00 1.8E-3 I 6.3E+0 calc RfD for H2O (food = 1E-3)
Chloride 16887-00-6 250
Chromium (III),insoluble salts
16065-83-1 1.5E+00 I
Chromium (VI) 18540-29-9 3.0E-03 I 1.0E-04 I 1.2E-2 I 4.2E+1 calc
Cobalt (and cmpds) 7440-48-4 2.0E-02 SF 1.0E-04 A 2.8E-3 SF 9.8E+0 calc
Copper 7440-50-8 1.3
Cyanide (amenable) 57-12-5 2.0E-02 I
Divalent mercury 3.0E-04 H RfD is for mercuric chloride; usedfor food, water, soil
Divalent mercury 1.0E-04 I RfD is for methyl mercury; used forfish only
Fluoride 16984-48-8 1.2E-01 I RfD is for fluorine; the alternativeIRIS value (for skeletal, rather thandental, fluorosis) was used
Iron 7439-89-6 0.3
Lead and cmpds(inorganic)
7439-92-1 0.015
(continued)
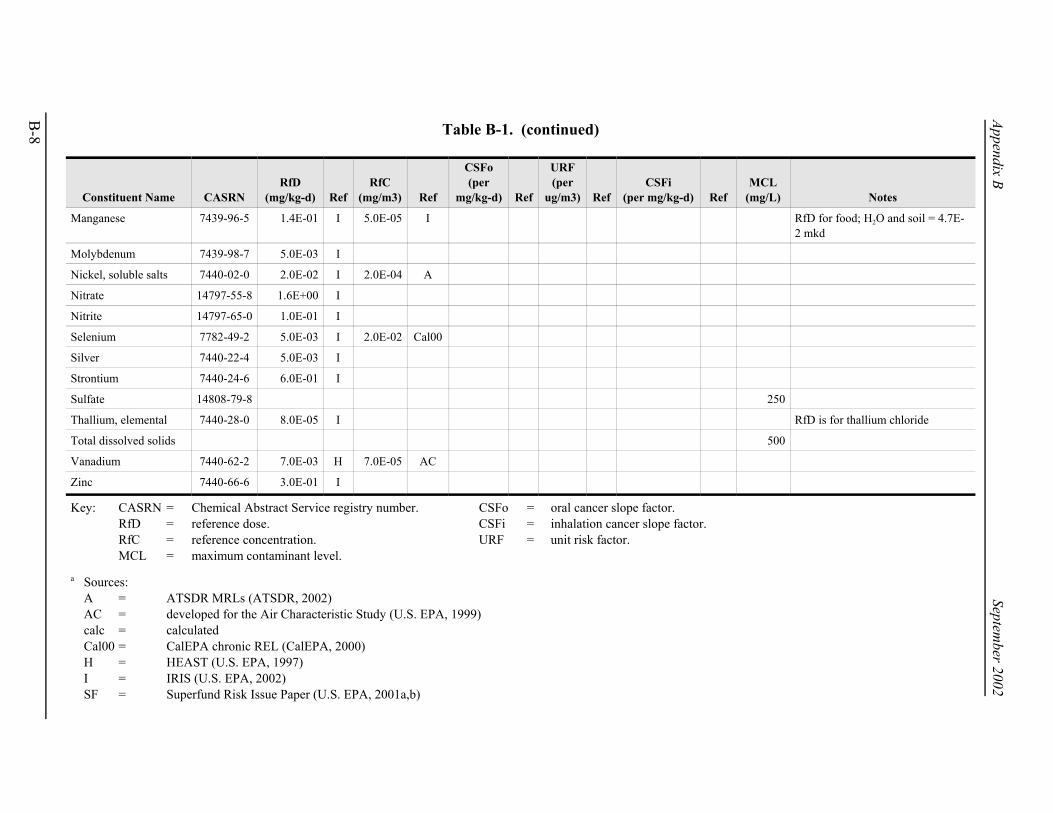
Appendix BSeptem
ber 2002
B-8 Table B-1. (continued)
Constituent Name CASRNRfD
(mg/kg-d) RefRfC
(mg/m3) Ref
CSFo(per
mg/kg-d) Ref
URF(per
ug/m3) RefCSFi
(per mg/kg-d) RefMCL
(mg/L) Notes
Manganese 7439-96-5 1.4E-01 I 5.0E-05 I RfD for food; H2O and soil = 4.7E-2 mkd
Molybdenum 7439-98-7 5.0E-03 I
Nickel, soluble salts 7440-02-0 2.0E-02 I 2.0E-04 A
Nitrate 14797-55-8 1.6E+00 I
Nitrite 14797-65-0 1.0E-01 I
Selenium 7782-49-2 5.0E-03 I 2.0E-02 Cal00
Silver 7440-22-4 5.0E-03 I
Strontium 7440-24-6 6.0E-01 I
Sulfate 14808-79-8 250
Thallium, elemental 7440-28-0 8.0E-05 I RfD is for thallium chloride
Total dissolved solids 500
Vanadium 7440-62-2 7.0E-03 H 7.0E-05 AC
Zinc 7440-66-6 3.0E-01 I
Key: CASRN = Chemical Abstract Service registry number. CSFo = oral cancer slope factor.RfD = reference dose. CSFi = inhalation cancer slope factor.RfC = reference concentration. URF = unit risk factor.MCL = maximum contaminant level.
a Sources:A = ATSDR MRLs (ATSDR, 2002)AC = developed for the Air Characteristic Study (U.S. EPA, 1999)calc = calculatedCal00 = CalEPA chronic REL (CalEPA, 2000)H = HEAST (U.S. EPA, 1997)I = IRIS (U.S. EPA, 2002)SF = Superfund Risk Issue Paper (U.S. EPA, 2001a,b)
Appendix B September 2002
B-9
For several constituents, IRIS benchmarks for similar chemicals were used as surrogate data. The rationale for these recommendations is as follows:
# The RfC for antimony trioxide (2E-04 mg/m3) was used as a surrogate for antimony.
# Fluoride was based on fluorine. The IRIS RfD for fluorine is based on soluble fluoride. The primary RfD cited in IRIS (6E-02 mg/kg-d) is for dental fluorosis, a cosmeticeffect. In this analysis, an alternative IRIS value (1.2E-01 mg/kg-d) for skeletalfluorosis in adults was used instead.
# The RfC for mercuric chloride (9E-05 mg/m3) was used as a surrogate for elementalmercury. The RfDs for mercuric chloride (3E-04 mg/kg-d) and methyl mercury (1E-04mg/kg-d) were used as surrogates for elemental mercury for assessing potential risksfrom food, soil, and water ingestion, and fish ingestion, respectively.
# Thallium was based on thallium chloride. There are several thallium salts that haveRfDs in IRIS. The lowest value among the thallium salts (8E-05 mg/kg-d) is routinelyused to represent thallium in risk assessments.
B.3 References
ATSDR (Agency for Toxic Substances and Disease Registry). 2002. Minimal Risk Levels (MRLs)for Hazardous Substances. Available online at http://www.atsdr.cdc.gov/mrls.html.
CalEPA (California Environmental Protection Agency). 1999a. Air Toxics Hot Spots Program RiskAssessment Guidelines: Part II. Technical Support Document for Describing AvailableCancer Potency Factors. Office of Environmental Health Hazard Assessment, Berkeley, CA. Available online at http://www.oehha.org/air/cancer_guide/hsca2.html.
CalEPA (California Environmental Protection Agency). 1999b. Air Toxics Hot Spots Program RiskAssessment Guidelines: Part III. Technical Support Document for the Determination ofNoncancer Chronic Reference Exposure Levels. SRP Draft. Office of EnvironmentalHealth Hazard Assessment, Berkeley, CA. Available online (in two sections) athttp://www.oehha.org/air/chronic_rels/ragsii.html,http://www.oehha.org/air/chronic_rels/RAGSp3draft.html.
CalEPA (California Environmental Protection Agency). 2000. Air Toxics Hot Spots Program RiskAssessment Guidelines: Part III. Technical Support Document for the Determination ofNoncancer Chronic Reference Exposure Levels. Office of Environmental Health HazardAssessment, Berkeley, CA. Available online (in four sections) athttp://www.oehha.org/air/chronic_rels/22RELS2k.html,http://www.oehha.org/air/chronic_rels/42kChREL.html,http://www.oehha.org/air/chronic_rels/Jan2001ChREL.html,http://www.oehha.org/air/chronic_rels/1201Crels.html.
Appendix B September 2002
B-10
U.S. EPA (Environmental Protection Agency). 1994. Methods for Derivation of InhalationReference Concentrations and Application of Inhalation Dosimetry. EPA/600/8-90-066F.Environmental Criteria and Assessment Office, Office of Health and EnvironmentalAssessment, Office of Research and Development, Research Triangle Park, NC.
U.S. EPA (Environmental Protection Agency). 1997. Health Effects Assessment Summary Tables(HEAST). EPA-540-R-97-036. FY 1997 Update. Office of Solid Waste and EmergencyResponse, Washington, DC.
U.S. EPA (Environmental Protection Agency). 1999. Revised Risk Assessment for the AirCharacteristic Study. EPA-530-R-99-019a. Volume 2. Office of Solid Waste,Washington, DC.
U.S. EPA (Environmental Protection Agency). 2001a. Risk Assessment Paper for Derivation of aProvisional RfD for Cobalt and Compounds (CASRN 7440-48-4). 00-122/3-16-01. National Center for Environmental Assessment. Superfund Technical Support Center,Cincinnati, OH.
U.S. EPA (Environmental Protection Agency). 2001b. Risk Assessment Paper for Derivation of aProvisional Carcinogenicity Assessment for Cobalt and Compounds (CASRN 7740-48-4). 00-122/3-16-01. National Center for Environmental Assessment. Superfund
U.S. EPA (Environmental Protection Agency). 2002. Integrated Risk Information System (IRIS). National Center for Environmental Assessment, Office of Research and Development,Washington, DC. Available online at http://www.epa.gov/iris/.

Appendix C
Chemical Stressor Concentration Limits(CSCLs) for Ecological Screening


Appendix C August 2002
C-3
Appendix C
Chemical Stressor Concentration Limits(CSCLs) for Ecological Screening
C.1 Introduction
The screening analysis for fossil fuel combustion wastes included an ecological screeninganalysis (ESA) that parallels the human health screening analysis. As described in Section 2.2.2 of thisreport, the ESA addressed two routes of exposure for ecological receptors, direct contact withcontaminated media and ingestion of contaminated food items. Screening hazard quotients (HQs) werecalculated using chemical-specific media concentrations assumed to be protective of ecologicalreceptors of concern. These media concentrations are referred to as chemical stressor concentrationlimits, or CSCLs. CSCLs are analogous to health-based numbers (HBNs) used in the human healthscreening. The CSCLs were compared directly with concentrations of constituents found in fossil fuelcombustion wastes, leachate, and pore water. Table C-1 shows the receptor types assessed for eachexposure route in each environmental medium and the type of waste data assumed to representexposure levels in each medium.
CSCLs were taken directly from the 1998 fossil fuel combustion risk analysis, Non-groundwater Pathways, Human Health and Ecological Risk Analysis for Fossil Fuel CombustionPhase 2 (FFC2) (U.S. EPA, 1998). The receptors and endpoints selected for the 1998 analysis wereevaluated and considered appropriate for the goals of this screening analysis. The CSCLs werederived for each chemical and receptor to the extent that supporting data were available.
Table C-1. Receptors Assessed in Each Medium
Receptor TypeSurface Water
(Leachate )Sediment
(Pore Water)Soil
(Whole Waste)
Direct Contact Exposure
Aquatic Community U
Sediment Community U
Soil Community U
Amphibians U
Aquatic Plants and Algae U
Terrestrial Plants U
Ingestion Exposure
Mammals U U
Birds U U
Appendix C August 2002
C-4
To calculate HQs in the screening analysis, the lowest (most sensitive) CSCL for each chemical in eachmedium was selected. For example, several receptors (soil invertebrates, terrestrial plants, mammals,and birds) are exposed to constituents in soils. The soil HQ for a given chemical was calculated usingwhichever soil CSCL was the lowest and would thus give the highest (most conservative) HQ. TableC-2 shows the CSCLs used to calculate HQs.
The following sections summarize methods used in the 1998 analysis to generate the CSCLsused in the ESA. Section C2.0 summarizes the derivation of CSCLs for media contact, and SectionC3.0 summarizes the derivation of the ingestion CSCLs.
C.2 CSCLs for the Direct Contact Exposure
Ecological receptors that live in close contact with contaminated media are considered to bepotentially at risk. These receptors are exposed through direct contact with contaminates in surfacewater, sediment, and soil. The receptors selected to assess the direct contact exposure route for eachmedium are shown in Table C-1. The CSCLs for receptor communities are not truly community-levelconcentration limits in that they do not consider predator-prey interactions. Rather, they are based onthe theory that protection of 95 percent of the species in the community will provide a sufficient level ofprotection for the community (see, for example, Stephan et al., 1985, for additional detail). Thefollowing sections summarize the CSCL derivation methods for each receptor assessed for the directcontact route of exposure.
C.2.1 Aquatic Community CSCLS
The aquatic community receptor comprises fish and aquatic invertebrates exposed throughdirect contact with constituents in surface water. For the aquatic community, the Final Chronic Value(FCV), developed either for the Great Lakes Water Quality Initiative (U.S. EPA, 1993) or theNational Ambient Water Quality Criteria (NAWQC) (U.S. EPA, 1995a, 1995b), was the preferredsource for the CSCL. If an FCV was unavailable and could not be calculated from available data, aSecondary Chronic Value (SCV) was estimated using methods developed for wildlife criteria for theGreat Lakes Initiative (e.g., 58 FR 20802; U.S. EPA, 1993). The SCV methodology is based on theoriginal species data set established for the NAWQC; however, it requires fewer data points andincludes statistically derived adjustment factors. For CSCL derivation, the minimum data set required atleast one data point for doughnuts.
C.2.2 Amphibian CSCLS
For amphibian populations, the development of CSCLs was severely limited by dataavailability. After a review of several compendia presenting amphibian ecotoxicity data (e.g., U.S. EPA,1996; Power et al., 1989), as well as primary literature sources, it was determined that the lack ofstandard methods on endpoints, species, and test durations made deriving a chronic CSCL foramphibians inappropriate. Consequently, an acute CSCL was derived for aqueous exposures inamphibians by taking a geometric mean of LC50 (i.e., concentration lethal to 50% of test subjects) dataidentified in studies with exposure durations less than 8 days. Although the use of acute effects levels isnot consistent with other benchmarks and CSCLs, the sensitivity of these receptors warrants theirinclusion even though chronic concentration limits have not yet been developed.
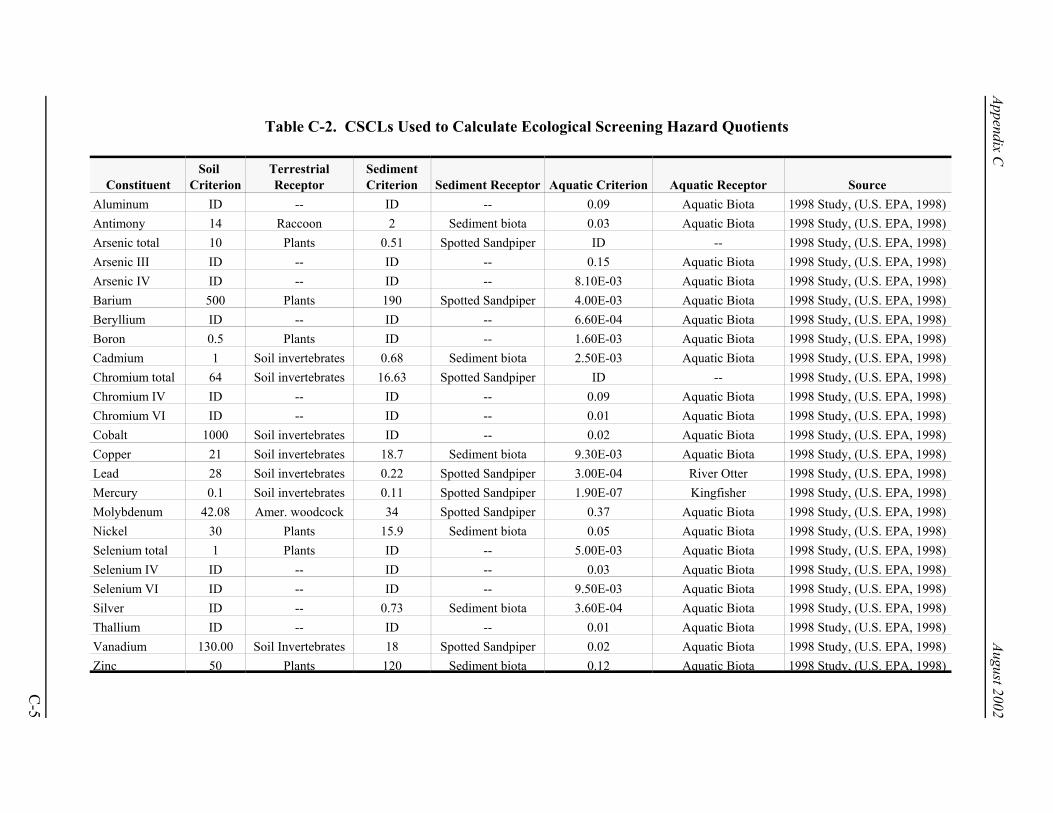
C-5
Appendix C
August 2002
Table C-2. CSCLs Used to Calculate Ecological Screening Hazard Quotients
ConstituentSoil
CriterionTerrestrialReceptor
SedimentCriterion Sediment Receptor Aquatic Criterion Aquatic Receptor Source
Aluminum ID -- ID -- 0.09 Aquatic Biota 1998 Study, (U.S. EPA, 1998)Antimony 14 Raccoon 2 Sediment biota 0.03 Aquatic Biota 1998 Study, (U.S. EPA, 1998)Arsenic total 10 Plants 0.51 Spotted Sandpiper ID -- 1998 Study, (U.S. EPA, 1998)Arsenic III ID -- ID -- 0.15 Aquatic Biota 1998 Study, (U.S. EPA, 1998)Arsenic IV ID -- ID -- 8.10E-03 Aquatic Biota 1998 Study, (U.S. EPA, 1998)Barium 500 Plants 190 Spotted Sandpiper 4.00E-03 Aquatic Biota 1998 Study, (U.S. EPA, 1998)Beryllium ID -- ID -- 6.60E-04 Aquatic Biota 1998 Study, (U.S. EPA, 1998)Boron 0.5 Plants ID -- 1.60E-03 Aquatic Biota 1998 Study, (U.S. EPA, 1998)Cadmium 1 Soil invertebrates 0.68 Sediment biota 2.50E-03 Aquatic Biota 1998 Study, (U.S. EPA, 1998)Chromium total 64 Soil invertebrates 16.63 Spotted Sandpiper ID -- 1998 Study, (U.S. EPA, 1998)Chromium IV ID -- ID -- 0.09 Aquatic Biota 1998 Study, (U.S. EPA, 1998)Chromium VI ID -- ID -- 0.01 Aquatic Biota 1998 Study, (U.S. EPA, 1998)Cobalt 1000 Soil invertebrates ID -- 0.02 Aquatic Biota 1998 Study, (U.S. EPA, 1998)Copper 21 Soil invertebrates 18.7 Sediment biota 9.30E-03 Aquatic Biota 1998 Study, (U.S. EPA, 1998)Lead 28 Soil invertebrates 0.22 Spotted Sandpiper 3.00E-04 River Otter 1998 Study, (U.S. EPA, 1998)Mercury 0.1 Soil invertebrates 0.11 Spotted Sandpiper 1.90E-07 Kingfisher 1998 Study, (U.S. EPA, 1998)Molybdenum 42.08 Amer. woodcock 34 Spotted Sandpiper 0.37 Aquatic Biota 1998 Study, (U.S. EPA, 1998)Nickel 30 Plants 15.9 Sediment biota 0.05 Aquatic Biota 1998 Study, (U.S. EPA, 1998)Selenium total 1 Plants ID -- 5.00E-03 Aquatic Biota 1998 Study, (U.S. EPA, 1998)Selenium IV ID -- ID -- 0.03 Aquatic Biota 1998 Study, (U.S. EPA, 1998)Selenium VI ID -- ID -- 9.50E-03 Aquatic Biota 1998 Study, (U.S. EPA, 1998)Silver ID -- 0.73 Sediment biota 3.60E-04 Aquatic Biota 1998 Study, (U.S. EPA, 1998)Thallium ID -- ID -- 0.01 Aquatic Biota 1998 Study, (U.S. EPA, 1998)Vanadium 130.00 Soil Invertebrates 18 Spotted Sandpiper 0.02 Aquatic Biota 1998 Study, (U.S. EPA, 1998)Zinc 50 Plants 120 Sediment biota 0.12 Aquatic Biota 1998 Study, (U.S. EPA, 1998)
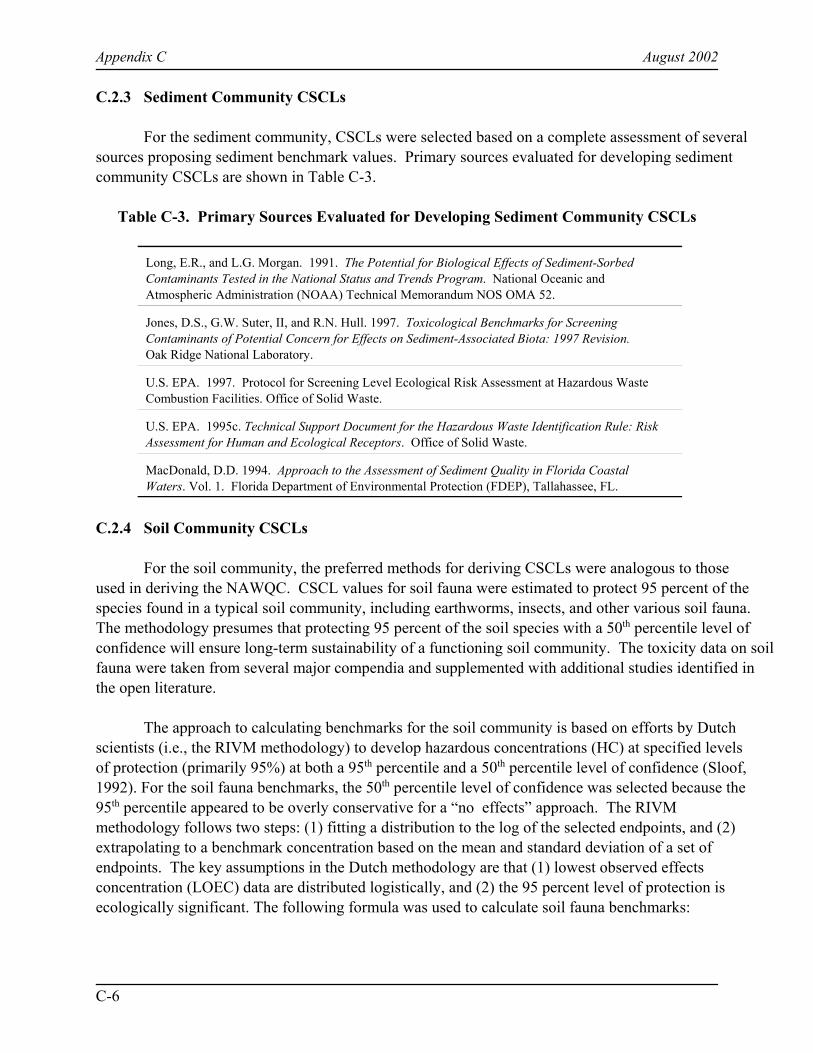
Appendix C August 2002
C-6
C.2.3 Sediment Community CSCLs
For the sediment community, CSCLs were selected based on a complete assessment of severalsources proposing sediment benchmark values. Primary sources evaluated for developing sedimentcommunity CSCLs are shown in Table C-3.
Table C-3. Primary Sources Evaluated for Developing Sediment Community CSCLs
Long, E.R., and L.G. Morgan. 1991. The Potential for Biological Effects of Sediment-SorbedContaminants Tested in the National Status and Trends Program. National Oceanic andAtmospheric Administration (NOAA) Technical Memorandum NOS OMA 52.
Jones, D.S., G.W. Suter, II, and R.N. Hull. 1997. Toxicological Benchmarks for ScreeningContaminants of Potential Concern for Effects on Sediment-Associated Biota: 1997 Revision. Oak Ridge National Laboratory.
U.S. EPA. 1997. Protocol for Screening Level Ecological Risk Assessment at Hazardous WasteCombustion Facilities. Office of Solid Waste.
U.S. EPA. 1995c. Technical Support Document for the Hazardous Waste Identification Rule: RiskAssessment for Human and Ecological Receptors. Office of Solid Waste.
MacDonald, D.D. 1994. Approach to the Assessment of Sediment Quality in Florida CoastalWaters. Vol. 1. Florida Department of Environmental Protection (FDEP), Tallahassee, FL.
C.2.4 Soil Community CSCLs
For the soil community, the preferred methods for deriving CSCLs were analogous to thoseused in deriving the NAWQC. CSCL values for soil fauna were estimated to protect 95 percent of thespecies found in a typical soil community, including earthworms, insects, and other various soil fauna. The methodology presumes that protecting 95 percent of the soil species with a 50th percentile level ofconfidence will ensure long-term sustainability of a functioning soil community. The toxicity data on soilfauna were taken from several major compendia and supplemented with additional studies identified inthe open literature.
The approach to calculating benchmarks for the soil community is based on efforts by Dutchscientists (i.e., the RIVM methodology) to develop hazardous concentrations (HC) at specified levelsof protection (primarily 95%) at both a 95th percentile and a 50th percentile level of confidence (Sloof,1992). For the soil fauna benchmarks, the 50th percentile level of confidence was selected because the95th percentile appeared to be overly conservative for a “no effects” approach. The RIVMmethodology follows two steps: (1) fitting a distribution to the log of the selected endpoints, and (2)extrapolating to a benchmark concentration based on the mean and standard deviation of a set ofendpoints. The key assumptions in the Dutch methodology are that (1) lowest observed effectsconcentration (LOEC) data are distributed logistically, and (2) the 95 percent level of protection isecologically significant. The following formula was used to calculate soil fauna benchmarks:

Appendix C August 2002
C-7
[ ]HC x k sm m5% 1− − (Eq. C-1)
where
HC5% = soil concentration protecting 95 percent of the soil species
xm = sample mean of the log LOEC data
kl = extrapolation constant for calculating the one-sided leftmost confidence limit for a95 percent protection level
sm = sample standard deviation of the log LOEC data.
Sufficient data were available to develop CSCLs using this methodology for four of the metalsof concern: cadmium, copper, lead, and zinc. For the remaining constituents, benchmark studiesidentifying effects to earthworms and other soil biota proposed by Oak Ridge National Laboratory(Efroymson et al., 1997a) or criteria developed by the Canadian Council of Ministers of theEnvironment (CCME, 1997) were used to estimate protective soil concentrations.
C.2.5 Algae and Aquatic Plants
For algae and aquatic plants, adverse effects concentrations are identified in the openliterature or from a data compilation presented in Toxicological Benchmarks for ScreeningPotential Contaminants of Concern for Effects on Aquatic Biota: 1996 Revision (Suter and Tsao,1996). For most contaminants, studies were not available for aquatic vascular plants, and lowesteffects concentrations were identified for algae. The CSCL for algae and aquatic plants wasbased on (1) a LOEC for vascular aquatic plants or (2) an effective concentration (ECxx) for a speciesof freshwater algae, frequently a species of green algae (e.g., Selenastrum capricornutum). Becauseof the lack of data for this receptor group and the differences between vascular aquatic plants and algaesensitivity, the lowest value of those identified was usually chosen.
C.2.6 Terrestrial Plant CSCLs
For the terrestrial plant community, ecotoxicological data were identified from a summarydocument prepared at the Oak Ridge National Laboratory: Toxicological Benchmarks for ScreeningPotential Contaminants of Concern for Effects on Terrestrial Plants: 1997 Revision (Efroymsonet al., 1997b). The measurement endpoints are generally limited to growth and yield parametersbecause (1) they are the most common class of response reported in phytotoxicity studies and,therefore, will allow for criterion calculations for a large number of constituents, and (2) they areecologically significant responses both in terms of plant populations and, by extension, the ability ofproducers to support higher trophic levels. As presented in Efroymson et al. (1997a), CSCLs forphytotoxicity were selected by rank ordering the LOEC values and then approximating the 10th
percentile. If there were 10 or fewer values for a chemical, the lowest LOEC was used. If there weremore than 10 values, the 10th percentile LOEC was used.

Appendix C August 2002
C-8
C.3 CSCLs for Ingestion Exposure
The ingestion route of exposure addresses the exposure of terrestrial mammals and birdsthrough ingestion of plants and prey and incidental soil ingestion. Thus, the CSCLs express mediaconcentrations that, based on certain assumptions about receptor diet and foraging behavior, areexpected to be protective of populations of mammals and birds feeding and foraging in contaminatedareas.
The derivation of ingestion CSCLs begins with the selection of appropriate ecotoxicologicaldata based on a hierarchy of data sources. The assessment endpoint for the ESA was populationviability, and therefore, the benchmarks were developed from measures of reproductive/developmentalsuccess or, if unavailable, from other effects that could conceivably impair population dynamics. Population-level benchmarks are preferred over benchmarks for individual organisms; however, veryfew population-level benchmarks have been developed. Therefore, the ESA used benchmarks derivedfrom individual organism studies, and protection was inferred at the population level.
Once the benchmark study was identified, the CSCL was calculated using a three-stepprocess. The remainder of this section outlines the basic technical approach used to convert avian ormammalian benchmarks (in daily doses) to the CSCL (in units of concentration) for surface water andsoil. The methods reflect exposure through the ingestion of contaminated plants, prey, and variousmedia and include parameters on accumulation (e.g., bioconcentration factors), uptake (e.g.,consumption rates), and dietary preferences.
STEP 1
Scale benchmark: The benchmarks derived for test species can be extrapolated to wildlifereceptor species within the same taxon using a cross-species scaling equation (Equation 2) (Sample etal., 1996). This is the default methodology EPA proposed for carcinogenicity assessments andreportable quantity documents for adjusting animal data to an equivalent human dose (57 FR 24152).
(Eq. C-2)
where
Benchmarkw = scaled ecological benchmark for species w (mg/kg/d)LOAELt = lowest observed adverse effects level for test species (mg/kg/d) bwt = body weight of the surrogate test species (kg)bww = body weight of the representative wildlife species (kg).
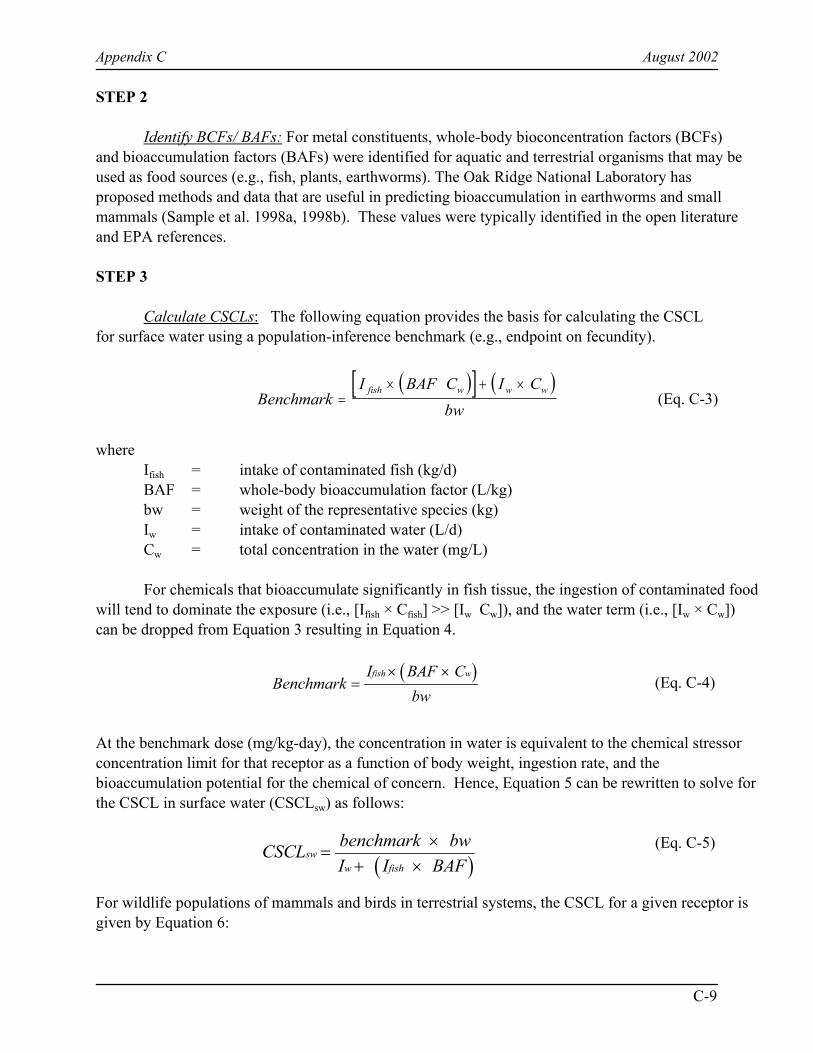
Appendix C August 2002
C-9
( )CSCL benchmark bw
I I BAFsw
w fish=
×+ ×
STEP 2
Identify BCFs/ BAFs: For metal constituents, whole-body bioconcentration factors (BCFs)and bioaccumulation factors (BAFs) were identified for aquatic and terrestrial organisms that may beused as food sources (e.g., fish, plants, earthworms). The Oak Ridge National Laboratory hasproposed methods and data that are useful in predicting bioaccumulation in earthworms and smallmammals (Sample et al. 1998a, 1998b). These values were typically identified in the open literatureand EPA references.
STEP 3
Calculate CSCLs: The following equation provides the basis for calculating the CSCLfor surface water using a population-inference benchmark (e.g., endpoint on fecundity).
(Eq. C-3)( )[ ] ( )
BenchmarkI BAF C I C
bwfish w w w
=× + ×
whereIfish = intake of contaminated fish (kg/d)BAF = whole-body bioaccumulation factor (L/kg)bw = weight of the representative species (kg)Iw = intake of contaminated water (L/d)Cw = total concentration in the water (mg/L)
For chemicals that bioaccumulate significantly in fish tissue, the ingestion of contaminated foodwill tend to dominate the exposure (i.e., [Ifish × Cfish] >> [Iw Cw]), and the water term (i.e., [Iw × Cw])can be dropped from Equation 3 resulting in Equation 4.
(Eq. C-4)( )Benchmark
I BAF Cbw
fish w=
× ×
At the benchmark dose (mg/kg-day), the concentration in water is equivalent to the chemical stressorconcentration limit for that receptor as a function of body weight, ingestion rate, and thebioaccumulation potential for the chemical of concern. Hence, Equation 5 can be rewritten to solve forthe CSCL in surface water (CSCLsw) as follows:
(Eq. C-5)
For wildlife populations of mammals and birds in terrestrial systems, the CSCL for a given receptor isgiven by Equation 6:
Appendix C August 2002
C-10
(Eq. C-6)( )CSCL benchmark bw
I BCF F xAB Isoil
food j j j soil=
×× +∑
wherebw = body weight (kg)Ifood = total daily food intake of species (kg/d)Isoil = total daily soil intake of species (kg/d)BCFj = bioaccumulation factor in food item j (assumed unitless)Fj = fraction of consisting of food item j (unitless)Abj = absorption of chemical in the gut from food item j.
C.4 References
CCME (Canadian Council of Ministers of the Environment). 1997. Recommended Canadian SoilQuality Guidelines. Science Policy and Environmental Quality Branch, Ecosystem ScienceDirectorate, Environment Canada, Ottawa, Ontario. ISBN 1-895-925-92-4.
Efroymson, R.A., M.E. Will, and G.W. Suter. 1997a. Toxicological Benchmarks forContaminants of Potential Concern for Effects on Soil and Litter Invertebrates andHeterotrophic Process: 1997 Revision. ES/ER/TM-126/R2. Oak Ridge NationalLaboratory, Oak Ridge, TN.
Efroymson, R.A., M.E. Will, G.W. Suter, and A.C. Wooten. 1997b. Toxicological Benchmarks forScreening Contaminants of Potential Concern for Effects on Terrestrial Plants: 1997Revision. ES/ER/TM-85/R3. Oak Ridge National Laboratory, Oak Ridge, TN.
Jones, D.S., G.W. Suter, II, and R.N. Hull. 1997. Toxicological Benchmarks for ScreeningContaminants of Potential Concern for Effects on Sediment-Associated Biota: 1997Revision. Oak Ridge National Laboratory.
Long, E.R., and L.G. Morgan. 1991. The Potential for Biological Effects of Sediment-SorbedContaminants Tested in the National Status and Trends Program. National Oceanic andAtmospheric Administration (NOAA) Technical Memorandum, NOS OMA 52.
MacDonald, D.D. 1994. Approach to the Assessment of Sediment Quality in Florida CoastalWaters, Volume 1. Florida Department of Environmental Protection (FDEP),Tallahassee, FL.
Power, T., K.L. Clark, A. Harfenist, and D.B. Peakall. 1989. A Review and Evaluation of theAmphibian Toxicological Literature. Technical Report Series No. 61. Canadian WildlifeService, Environment Canada, Hull, Quebec.
Appendix C August 2002
C-11
Sample, B.E., D.M. Opresko, and G.W. Suter, II. 1996. Toxicological Benchmarks for Wildlife:1996 Revision. ES/ER/TM-86/R3. Oak Ridge National Laboratory, Oak Ridge, TN.
Sample, B.E., J.J. Beauchamp, R.A. Efroymson, G.W. Suter, II, and T.L. Ashwood. 1998a. Development and Validation of Bioaccumulation Models for Earthworms. ES/ER/TM-220. Oak Ridge National Laboratory, Oak Ridge, TN.
Sample, B.E., J.J. Beauchamp, R.A. Efroymson, and G.W. Suter, II. 1998b. Development andValidation of Bioaccumulation Models for Small Mammals. ES/ER/TM-219. Oak RidgeNational Laboratory, Oak Ridge, TN.
Sloof, W. 1992. Ecotoxicological Effect Assessment: Deriving Maximum TolerableConcentrations (MTC) from Single Species Toxicity Data. Guidance Document. ReportNo. 719102.018. National Institute of Public Health and Environmental Protection (RIVM),Hilversum, the Netherlands.
Stephan, C.E., D.I. Mount, D.J. Hansen, J.H. Gentile, G. A. Chapman, and W.A. Brungs. 1985. Guidelines for Deriving Numerical National Ambient Water Quality Criteria for theProtection of Aquatic Organisms and Their Use. Office of Research and Development,U.S. Environmental Protection Agency. mg/l NTIS PB85-220749, Springfield, VA.
Suter, G.W., and C.L. Tsao. 1996. Toxicological Benchmarks for Screening Potential Contaminantsof Concern for Effects on Aquatic Biota: 1996 Revision. US Department of Energy, OakRidge National Laboratory. Oak Ridge, TN. June.
U.S. EPA (Environmental Protection Agency). 1993. Water Quality Guidance for the Great LakesSystem and Correction. Proposed Rule. 58 FR 20802.
U.S. EPA (Environmental Protection Agency). 1995a. Great Lakes Water Quality InitiativeCriteria Documents for the Protection of Aquatic Life in Ambient Water. EPA-820-B-95-004. Office of Water, Washington, DC.
U.S. EPA (Environmental Protection Agency). 1995b. Great Lakes Water Quality InitiativeCriteria Documents for the Protection of Wildlife DOT, Mercury, 2,3,78-TCDD, andPCBs. EPA-820-B-95-008. Office of Water, Washington, DC.
U.S. EPA (Environmental Protection Agency). 1995c. Technical Support Document for theHazardous Waste Identification Rule. Office of Solid Waste, Washington, DC.
U.S. EPA (Environmental Protection Agency). 1996. Water Quality Criteria Documents for theProtection of Aquatic Life in Ambient Water: 1995 Updates. EPA-820-B-96-001. Officeof Water, Washington, DC.
Appendix C August 2002
C-12
U.S. EPA (Environmental Protection Agency). 1997. Protocol for Screening Level Ecological RiskAssessment at Hazardous Waste Combustion Facilities, (Volumes 1 and 2). U.S. EPAOffice of Solid Waste. Internal Review Draft. February 28, 1997.
U.S. EPA (Environmental Protection Agency). 1998. Non-groundwater Pathways, Human Healthand Ecological Risk Analysis for Fossil Fuel Combustion Phase 2 (FFC2). Office of SolidWaste, Washington, DC.
U.S. EPA (Environmental Protection Agency). 1999. National Recommended Water QualityCriteria-Correction. EPA/822-Z-99-001. Office of Water, Washington, DC.
Appendix D
Calculation of Health-Based Numbers (HBNs)

Appendix D August 2002
D-3
Appendix D
Calculation of Health-Based Numbers (HBNs)
Management of fossil fuel combustionwaste (FFCW) can result in contaminantsmoving from a waste management unit(WMU) and contaminating nearby air, soil,groundwater, and surface water viamechanisms such as groundwater transport,overland transport, wind erosion, andsubsequent deposition. Individuals living nearWMUs may then come into contact withchemicals directly via inhalation of ambientair, ingestion of drinking water, or ingestion ofsoil. Chemicals may then contaminate fooditems via chemical uptake and accumulationin produce, animal products, or fish.
Health-based numbers (HBNs) forsoil, groundwater (as drinking water), andsurface water are used in this analysis toconsider risks and hazards to human receptors from chemicals that are released from FFCWmanagement units and move through the subsurface and aboveground environments. HBNs representconcentrations in environmental media that will not cause an exceedance of a target cancer risk of 10-5
or a hazard quotient (HQ) of 1.
The pathways included in the HBN calculations are summarized in Table D-1. The HBNs forsoil are based on a farmer scenario with receptors living at a site adjacent to an FFCW WMU,breathing contaminated air, ingesting contaminated soil, and raising their own crops, beef cattle, and/ordairy cattle. The HBN for groundwater is based on domestic use of groundwater as drinking water.Surface water HBNs are based on a recreational fisher scenario in which the receptor is assumed tolive at a different off-site location and to only be exposed to fish.
D.1 Methodology
All HBNs consider human receptors exposed to contaminated media and/or food items atdifferent ages to take into account changing exposure patterns with age. The specific receptorsconsidered were individuals exposed starting at ages 3, 8, 15, and 20. Depending on the start age, anappropriate exposure duration was selected for each receptor based on residency data. Each receptorwas exposed for the period of time determined by the exposure duration, and the model accounted for
Key Features of HBN Calculations
# HBNs calculated for groundwater (mg/L), surfacewater (mg/L), and soil (mg/kg)
# HBNs based on a target cancer risk of 10-5 and aHQ of 1
# Soil HBNs based on a farmer scenario, andconsider inhalation, direct ingestion, and indirectpathways
# Groundwater HBNs based on a residentialdrinking water scenario.
# Surface water HBNs based on a recreationalfisher scenario.
# Adult and child receptors first exposed at ages 3,8, 15 and 20.
# Exposure factors set at central tendency values.# Source size set at the 95th percentile of FFCW
landfills.
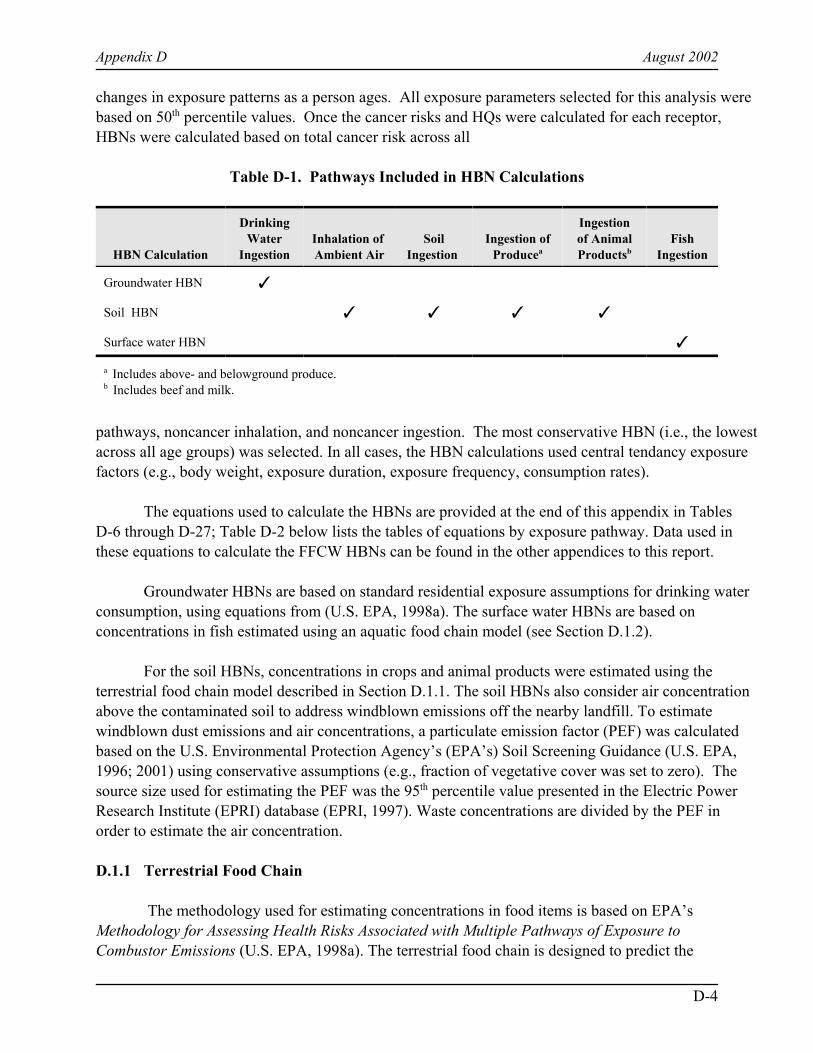
Appendix D August 2002
D-4
changes in exposure patterns as a person ages. All exposure parameters selected for this analysis werebased on 50th percentile values. Once the cancer risks and HQs were calculated for each receptor,HBNs were calculated based on total cancer risk across all
Table D-1. Pathways Included in HBN Calculations
HBN Calculation
DrinkingWater
IngestionInhalation of Ambient Air
SoilIngestion
Ingestion ofProducea
Ingestionof AnimalProductsb
FishIngestion
Groundwater HBN T
Soil HBN T T T T
Surface water HBN T
a Includes above- and belowground produce.b Includes beef and milk.
pathways, noncancer inhalation, and noncancer ingestion. The most conservative HBN (i.e., the lowestacross all age groups) was selected. In all cases, the HBN calculations used central tendancy exposurefactors (e.g., body weight, exposure duration, exposure frequency, consumption rates).
The equations used to calculate the HBNs are provided at the end of this appendix in TablesD-6 through D-27; Table D-2 below lists the tables of equations by exposure pathway. Data used inthese equations to calculate the FFCW HBNs can be found in the other appendices to this report.
Groundwater HBNs are based on standard residential exposure assumptions for drinking waterconsumption, using equations from (U.S. EPA, 1998a). The surface water HBNs are based onconcentrations in fish estimated using an aquatic food chain model (see Section D.1.2).
For the soil HBNs, concentrations in crops and animal products were estimated using theterrestrial food chain model described in Section D.1.1. The soil HBNs also consider air concentrationabove the contaminated soil to address windblown emissions off the nearby landfill. To estimatewindblown dust emissions and air concentrations, a particulate emission factor (PEF) was calculatedbased on the U.S. Environmental Protection Agency’s (EPA’s) Soil Screening Guidance (U.S. EPA,1996; 2001) using conservative assumptions (e.g., fraction of vegetative cover was set to zero). Thesource size used for estimating the PEF was the 95th percentile value presented in the Electric PowerResearch Institute (EPRI) database (EPRI, 1997). Waste concentrations are divided by the PEF inorder to estimate the air concentration.
D.1.1 Terrestrial Food Chain
The methodology used for estimating concentrations in food items is based on EPA’sMethodology for Assessing Health Risks Associated with Multiple Pathways of Exposure toCombustor Emissions (U.S. EPA, 1998a). The terrestrial food chain is designed to predict the

Appendix D August 2002
D-5
accumulation of a contaminant in the edible parts of a plant from uptake of contaminants in soil andthrough translocation and direct deposition of contaminants in air. Concentrations are predicted forthree main categories of food crops presumed to be eaten by humans: exposed
Table D-2. Key to Tables of Equations Used to Calculate HBNs
Equations for Air Pathway: Emissions, Dispersion, Air Concentrations, and Deposition Rates
D-6 Particulate Phase Air Concentration from Soil Emissions (mg/m3)D-7 Particulate Emissions Factor for Unlimited Mass–Commercial/Industrial
Scenario (m3/kg)D-8 Dispersion Factor (g/m2-s)/(kg/m2)D-9 Annual Wet Depositon from Particle Phase (g/m2-yr)D-10 Annual Dry Deposition from Particle Phase (g/m2-yr)
Equations for Indirect Soil Pathways: Produce, Beef, Milk, and Fish
D-11 Total Concentration in Above-Ground Vegetation (mg/kg - WW or DW)D-12 Aboveground Vegetation Concentration Due to Root Uptake (mg/kg - DW)D-13 Vegetative Concentration Due to Direct Deposition (mg/kg - DW)D-14 Concentration in Belowground Vegetation Due to Root Uptake (mg/kg - WW)D-15 Deposition Term for Plants (mg/m2-yr)D-16 Concentration in Beef Due to Plant and Soil Ingestion (mg/kg - WW)D-17 Concentration in Milk Due to Plant and Soil Ingestion (mg/kg - WW)D-18 Concentration in Fish at Different Trophic Levels (mg/kg)
Equations for Human Exposure
D-19 Daily Intake of Contaminant from Consumption of Aboveground Produce (mg/kg BW/day)D-20 Daily Intake of Contaminant from Consumption of Belowground Produce (mg/kg BW/day)D-21 Daily Intake of Contaminant from Consumption of Fish (mg/kg BW/day)D-22 Daily Intake of Contaminant from Incidental Ingestion of Soil (mg/kg BW/day) D-23 Daily Intake of Contaminant from Consumption of Drinking Water (mg/kg BW/day)D-24 Daily Intake of Contaminant from Ingestion of Animal Tissue Groups (mg/kg/BW/day)
Equations for Unit Risk Calculations and Health-based Numbers
D-25 Cancer Risk and Hazard Quotient Due to Inhalation (unitless)D-26 Cancer Risk and Hazard Quotient Due to Ingestion (unitless)D-27 Health-Based Concentration (ppm)
fruits and vegetables, protected fruits and vegetables, and root vegetables. The terms “exposed” and“protected” refer to whether or not the edible portion of the produce is exposed to the atmosphere. Examples include tomatoes (exposed vegetable), bananas (protected fruit), and potatoes (rootvegetables).
In addition, the terrestrial food chain estimates the contaminant concentration in farm crops forcattle. Vegetation consumed by cattle includes grain, forage, and silage. Grain is considered to be a
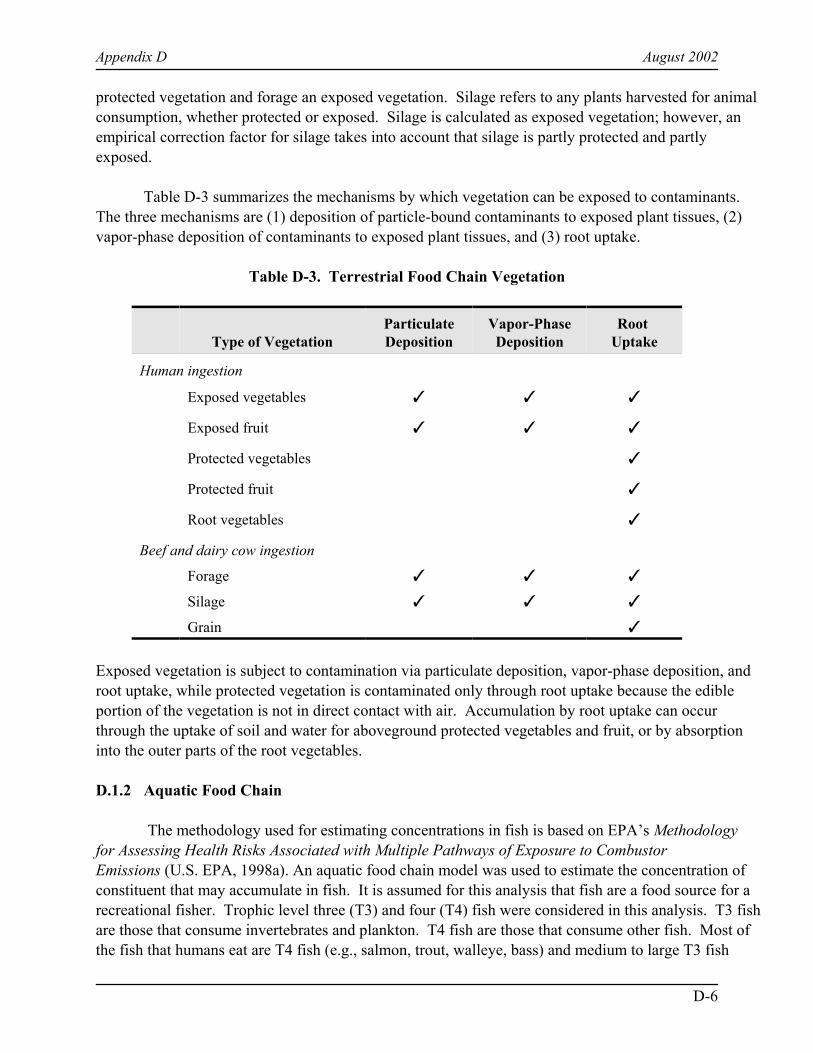
Appendix D August 2002
D-6
protected vegetation and forage an exposed vegetation. Silage refers to any plants harvested for animalconsumption, whether protected or exposed. Silage is calculated as exposed vegetation; however, anempirical correction factor for silage takes into account that silage is partly protected and partlyexposed.
Table D-3 summarizes the mechanisms by which vegetation can be exposed to contaminants. The three mechanisms are (1) deposition of particle-bound contaminants to exposed plant tissues, (2)vapor-phase deposition of contaminants to exposed plant tissues, and (3) root uptake.
Table D-3. Terrestrial Food Chain Vegetation
Type of VegetationParticulateDeposition
Vapor-PhaseDeposition
Root Uptake
Human ingestion
Exposed vegetables T T T
Exposed fruit T T T
Protected vegetables T
Protected fruit T
Root vegetables T
Beef and dairy cow ingestion
Forage T T T
Silage T T T
Grain T
Exposed vegetation is subject to contamination via particulate deposition, vapor-phase deposition, androot uptake, while protected vegetation is contaminated only through root uptake because the edibleportion of the vegetation is not in direct contact with air. Accumulation by root uptake can occurthrough the uptake of soil and water for aboveground protected vegetables and fruit, or by absorptioninto the outer parts of the root vegetables.
D.1.2 Aquatic Food Chain
The methodology used for estimating concentrations in fish is based on EPA’s Methodologyfor Assessing Health Risks Associated with Multiple Pathways of Exposure to CombustorEmissions (U.S. EPA, 1998a). An aquatic food chain model was used to estimate the concentration ofconstituent that may accumulate in fish. It is assumed for this analysis that fish are a food source for arecreational fisher. Trophic level three (T3) and four (T4) fish were considered in this analysis. T3 fishare those that consume invertebrates and plankton. T4 fish are those that consume other fish. Most ofthe fish that humans eat are T4 fish (e.g., salmon, trout, walleye, bass) and medium to large T3 fish

Appendix D August 2002
D-7
(e.g., carp, smelt, perch, catfish, sucker, bullhead, sauger). For metals other than mercury, thecalculation of contaminants in fish is based on the total concentration of contaminants in the waterbody(i.e., dissolved and suspended solids). For mercury, the calculation of contaminants in fish is based onthe dissolved concentration of methyl mercury in the waterbody.
Fish tissue concentrations are dependent on a bioconcentration factor (BCF), which is used toestimate the amount of constituent being transferred from the waterbody into the fish tissue. Specifically, BCFs reflect the ratio between the tissue concentration in fish and the appropriatewaterbody concentration. BCFs were developed for each constituent to reflect accumulation in eachtrophic level considered. They were also developed to estimate the concentration in the fish filet versusthe total fish. Human receptors consume only the filet portion of the fish, which has a lower lipidcontent. Because some constituents tend to accumulate in the fatty tissue, the concentration in the filetportion of the fish is sometimes lower than the concentration in the whole fish.
D.2 Health-Based Numbers
Table D-4 provides the HBNs for surface water and groundwater and compares thegroundwater numbers developed for the 2002 FFCW risk analysis to those developed for the 1998FFCW risk analysis (U.S. EPA, 1998b). (Surface water HBNs were not developed in 1998.)Constituents with groundwater HBNs in 2002 but not in 1998 include aluminum and cobalt. Most ofthe remaining constituents show lower groundwater HBNs in 2002 by a factor of 1.8, which is due tothe differences in exposure factors between the adult-only scenario assumed in 1998 and the child agecohorts used in 2002. Manganese and hexavalent chromium also show lower HBNs in 2002 becauseof lower health benchmarks than those used in 1998 (see Appendix A for the human healthbenchmarks used to calculate the HBNs). Fluoride shows a slightly higher HBN in 2002 because ofEPA’s decision to use the skeletal fluorosis reference dose (RfD) instead of the lower RfD for dentalfluorosis.
Table D-5 lists the 2002 soil HBNs along with the relative contribution of each exposurepathway to the HBN. Most of the soil HBNs are driven by the soil or milk ingestion pathways, withantimony and the noncancer beryllium HBNs mainly reflecting risk from the ingestion of contaminatedproduce. The cancer HBNs for beryllium, cadmium, chromium, and cobalt and the noncancer HBN forammonia are based entirely on inhalation benchmarks and therefore only reflect inhalation risks.
Table D-4. Groundwater and Surface Water HBNs
Chemical2002 Benchmark
Type
Groundwater HBN (mg/L)1
Surface WaterHBN2 (mg/L)2002 1998
Aluminum Noncancer 58.7 NA NA
Antimony Noncancer 0.012 0.021 NA
Arsenic Cancer 0.0029 0.0029 0.23
(continued)
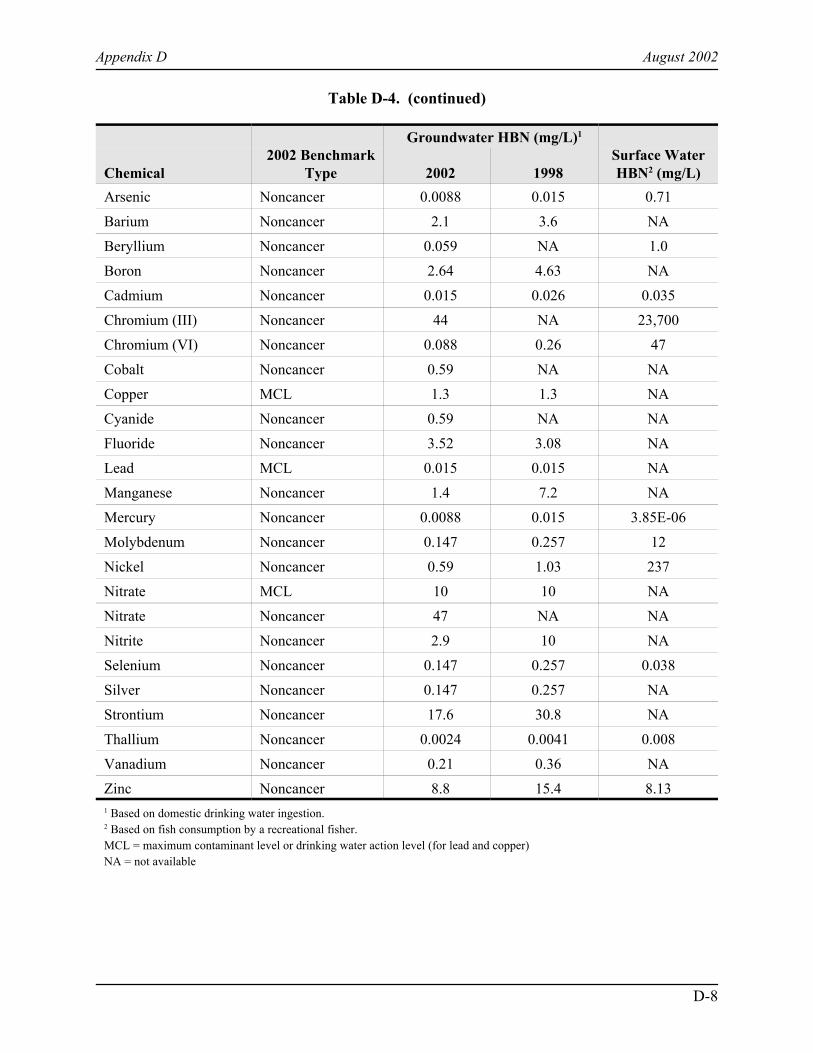
Table D-4. (continued)
Appendix D August 2002
Chemical2002 Benchmark
Type
Groundwater HBN (mg/L)1
Surface WaterHBN2 (mg/L)2002 1998
D-8
Arsenic Noncancer 0.0088 0.015 0.71
Barium Noncancer 2.1 3.6 NA
Beryllium Noncancer 0.059 NA 1.0
Boron Noncancer 2.64 4.63 NA
Cadmium Noncancer 0.015 0.026 0.035
Chromium (III) Noncancer 44 NA 23,700
Chromium (VI) Noncancer 0.088 0.26 47
Cobalt Noncancer 0.59 NA NA
Copper MCL 1.3 1.3 NA
Cyanide Noncancer 0.59 NA NA
Fluoride Noncancer 3.52 3.08 NA
Lead MCL 0.015 0.015 NA
Manganese Noncancer 1.4 7.2 NA
Mercury Noncancer 0.0088 0.015 3.85E-06
Molybdenum Noncancer 0.147 0.257 12
Nickel Noncancer 0.59 1.03 237
Nitrate MCL 10 10 NA
Nitrate Noncancer 47 NA NA
Nitrite Noncancer 2.9 10 NA
Selenium Noncancer 0.147 0.257 0.038
Silver Noncancer 0.147 0.257 NA
Strontium Noncancer 17.6 30.8 NA
Thallium Noncancer 0.0024 0.0041 0.008
Vanadium Noncancer 0.21 0.36 NA
Zinc Noncancer 8.8 15.4 8.131 Based on domestic drinking water ingestion.2 Based on fish consumption by a recreational fisher.MCL = maximum contaminant level or drinking water action level (for lead and copper)NA = not available
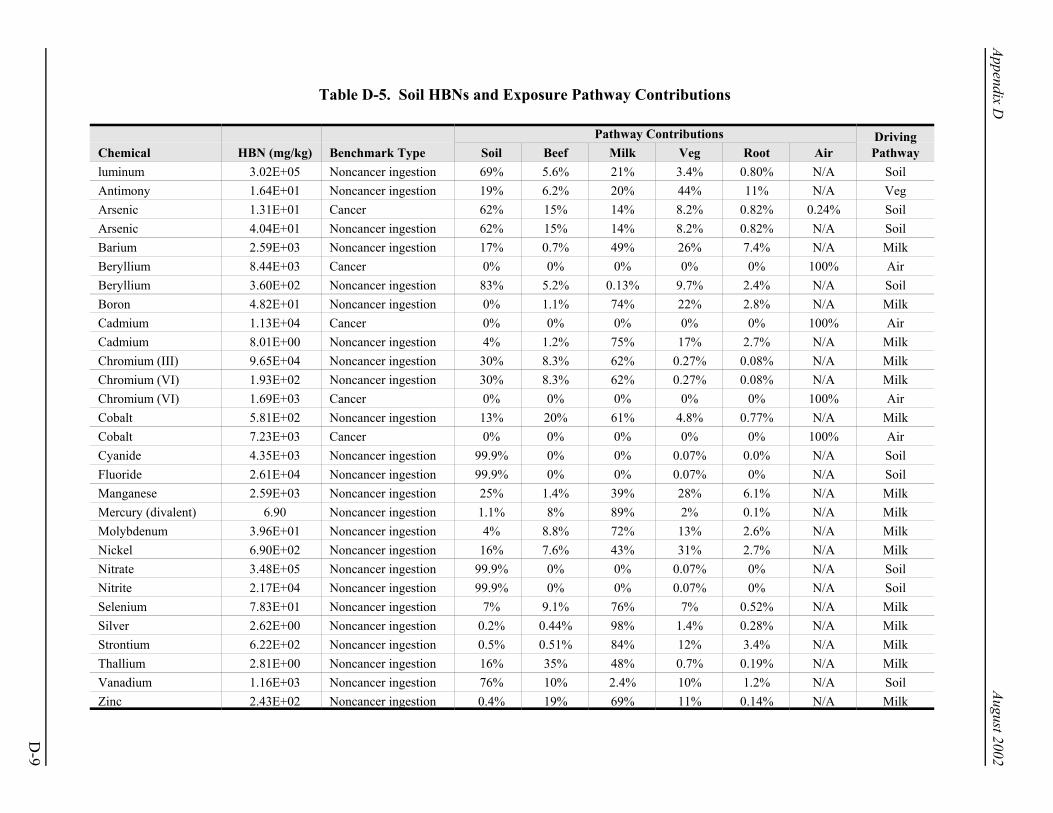
D-9
Appendix D
August 2002
Table D-5. Soil HBNs and Exposure Pathway Contributions
Chemical HBN (mg/kg) Benchmark TypePathway Contributions Driving
PathwaySoil Beef Milk Veg Root Airluminum 3.02E+05 Noncancer ingestion 69% 5.6% 21% 3.4% 0.80% N/A SoilAntimony 1.64E+01 Noncancer ingestion 19% 6.2% 20% 44% 11% N/A VegArsenic 1.31E+01 Cancer 62% 15% 14% 8.2% 0.82% 0.24% SoilArsenic 4.04E+01 Noncancer ingestion 62% 15% 14% 8.2% 0.82% N/A SoilBarium 2.59E+03 Noncancer ingestion 17% 0.7% 49% 26% 7.4% N/A MilkBeryllium 8.44E+03 Cancer 0% 0% 0% 0% 0% 100% AirBeryllium 3.60E+02 Noncancer ingestion 83% 5.2% 0.13% 9.7% 2.4% N/A SoilBoron 4.82E+01 Noncancer ingestion 0% 1.1% 74% 22% 2.8% N/A MilkCadmium 1.13E+04 Cancer 0% 0% 0% 0% 0% 100% AirCadmium 8.01E+00 Noncancer ingestion 4% 1.2% 75% 17% 2.7% N/A MilkChromium (III) 9.65E+04 Noncancer ingestion 30% 8.3% 62% 0.27% 0.08% N/A MilkChromium (VI) 1.93E+02 Noncancer ingestion 30% 8.3% 62% 0.27% 0.08% N/A MilkChromium (VI) 1.69E+03 Cancer 0% 0% 0% 0% 0% 100% AirCobalt 5.81E+02 Noncancer ingestion 13% 20% 61% 4.8% 0.77% N/A MilkCobalt 7.23E+03 Cancer 0% 0% 0% 0% 0% 100% AirCyanide 4.35E+03 Noncancer ingestion 99.9% 0% 0% 0.07% 0.0% N/A SoilFluoride 2.61E+04 Noncancer ingestion 99.9% 0% 0% 0.07% 0% N/A SoilManganese 2.59E+03 Noncancer ingestion 25% 1.4% 39% 28% 6.1% N/A MilkMercury (divalent) 6.90 Noncancer ingestion 1.1% 8% 89% 2% 0.1% N/A MilkMolybdenum 3.96E+01 Noncancer ingestion 4% 8.8% 72% 13% 2.6% N/A MilkNickel 6.90E+02 Noncancer ingestion 16% 7.6% 43% 31% 2.7% N/A MilkNitrate 3.48E+05 Noncancer ingestion 99.9% 0% 0% 0.07% 0% N/A SoilNitrite 2.17E+04 Noncancer ingestion 99.9% 0% 0% 0.07% 0% N/A SoilSelenium 7.83E+01 Noncancer ingestion 7% 9.1% 76% 7% 0.52% N/A MilkSilver 2.62E+00 Noncancer ingestion 0.2% 0.44% 98% 1.4% 0.28% N/A MilkStrontium 6.22E+02 Noncancer ingestion 0.5% 0.51% 84% 12% 3.4% N/A MilkThallium 2.81E+00 Noncancer ingestion 16% 35% 48% 0.7% 0.19% N/A MilkVanadium 1.16E+03 Noncancer ingestion 76% 10% 2.4% 10% 1.2% N/A SoilZinc 2.43E+02 Noncancer ingestion 0.4% 19% 69% 11% 0.14% N/A Milk
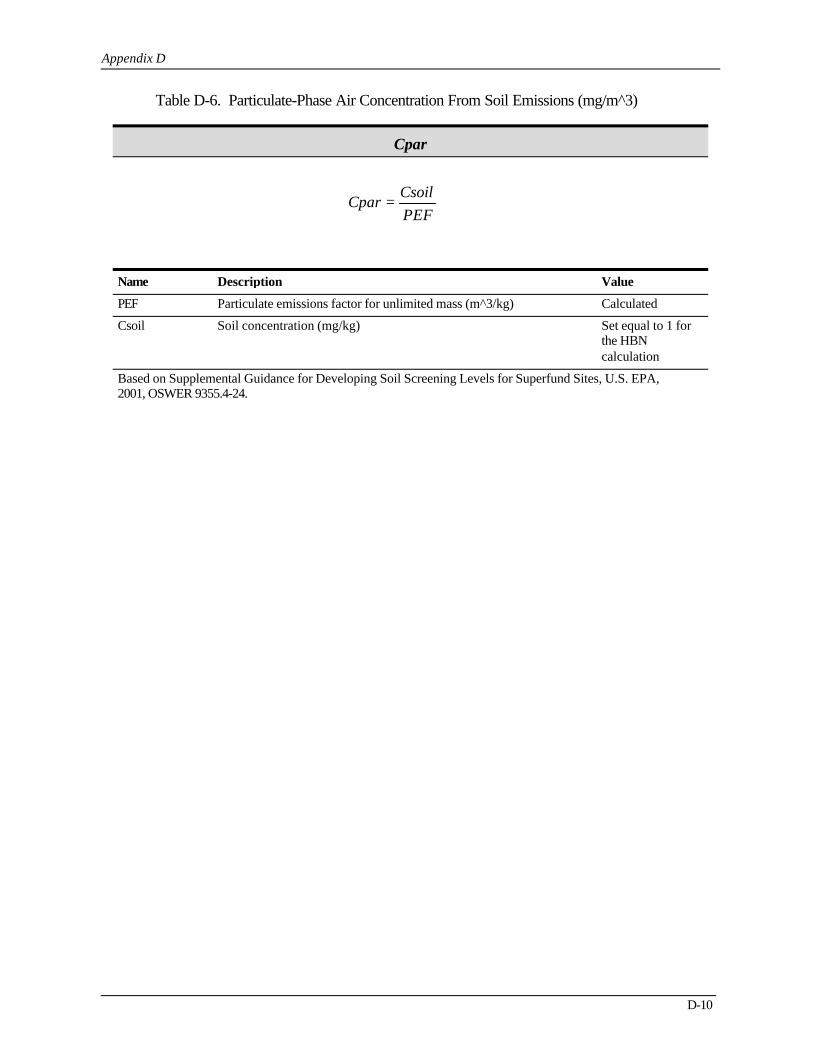
Table D-6. Particulate-Phase Air Concentration From Soil Emissions (mg/m^3)
Appendix D
Name Description Value
Cpar
PEFCsoil
Cpar =
PEF Particulate emissions factor for unlimited mass (m^3/kg) Calculated
Csoil Soil concentration (mg/kg) Set equal to 1 for the HBN calculation
Based on Supplemental Guidance for Developing Soil Screening Levels for Superfund Sites, U.S. EPA, 2001, OSWER 9355.4-24.
D-10
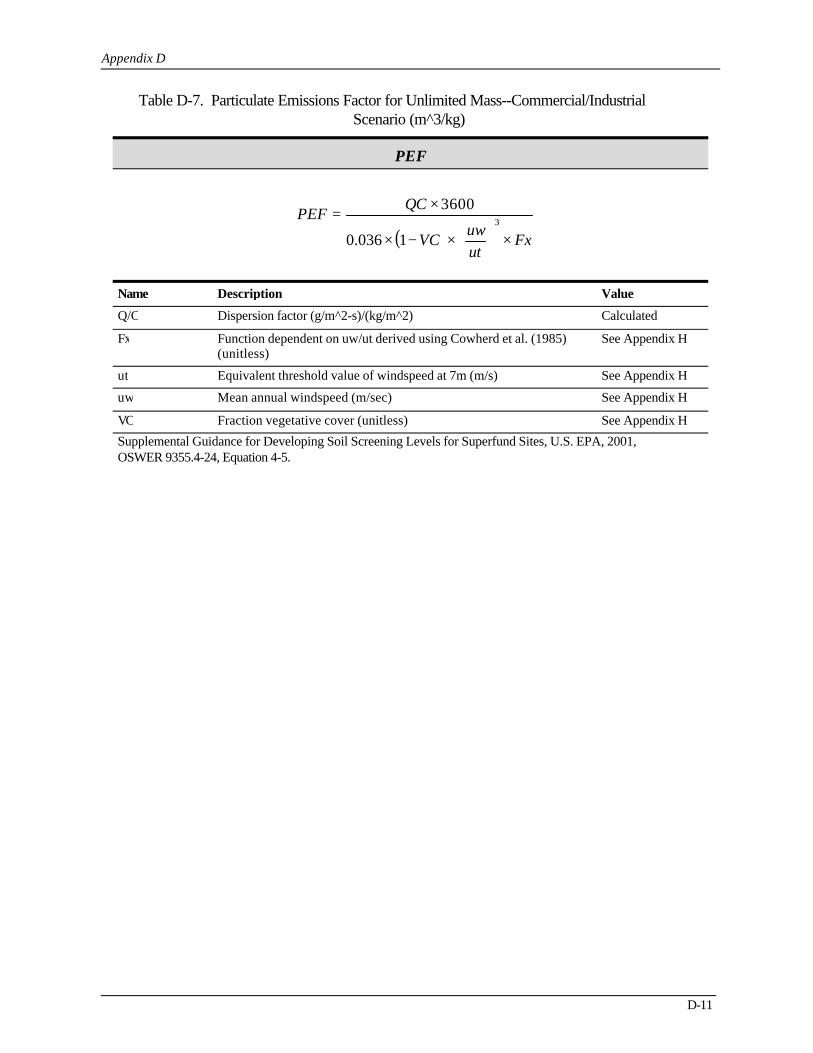
Table D-7. Particulate Emissions Factor for Unlimited Mass--Commercial/Industrial Scenario (m^3/kg)
Appendix D
Name Description Value
PEF
( ) Fxutuw
VC
QCPEF
×
×−×
×=
3
1036.0
3600
Q/C Dispersion factor (g/m^2-s)/(kg/m^2) Calculated
Fx Function dependent on uw/ut derived using Cowherd et al. (1985) (unitless)
See Appendix H
ut Equivalent threshold value of windspeed at 7m (m/s) See Appendix H
uw Mean annual windspeed (m/sec) See Appendix H
VC Fraction vegetative cover (unitless) See Appendix H
Supplemental Guidance for Developing Soil Screening Levels for Superfund Sites, U.S. EPA, 2001, OSWER 9355.4-24, Equation 4-5.
D-11
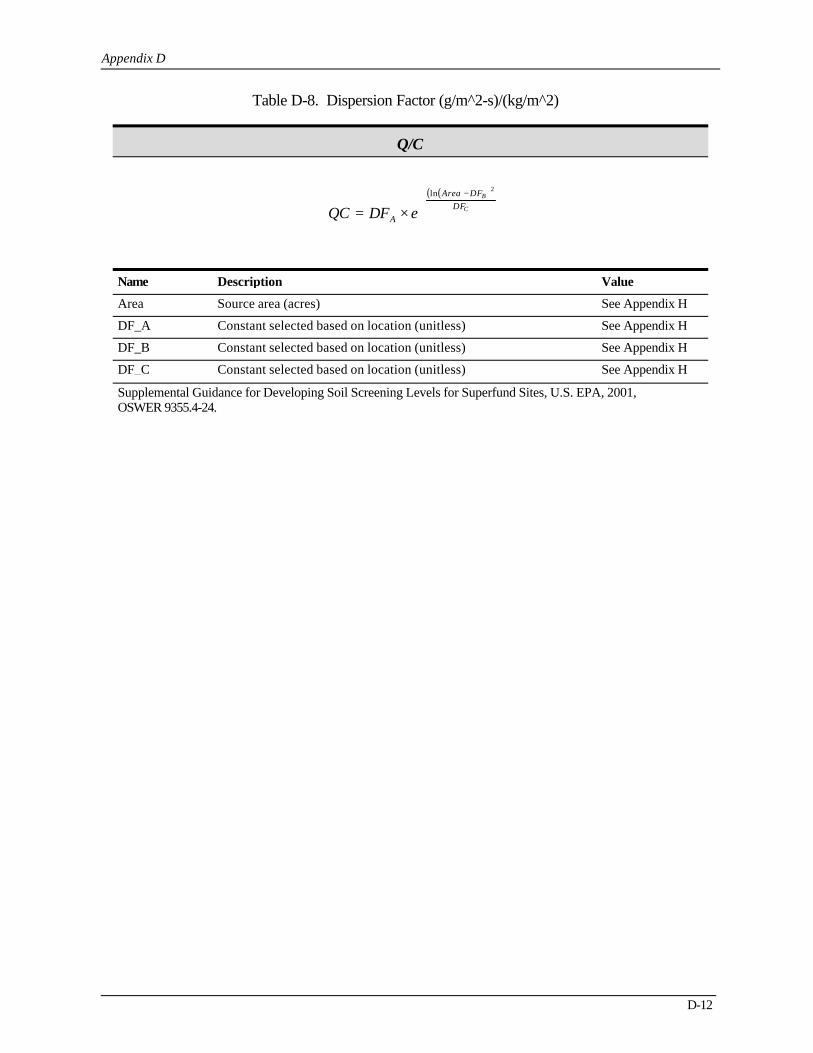
Table D-8. Dispersion Factor (g/m^2-s)/(kg/m^2)
Appendix D
Name Description Value
Q/C
( )( )
−
×= C
B
DFDFArea
A eDFQC
2ln
Area Source area (acres) See Appendix H
DF_A Constant selected based on location (unitless) See Appendix H
DF_B Constant selected based on location (unitless) See Appendix H
DF_C Constant selected based on location (unitless) See Appendix H
Supplemental Guidance for Developing Soil Screening Levels for Superfund Sites, U.S. EPA, 2001, OSWER 9355.4-24.
D-12
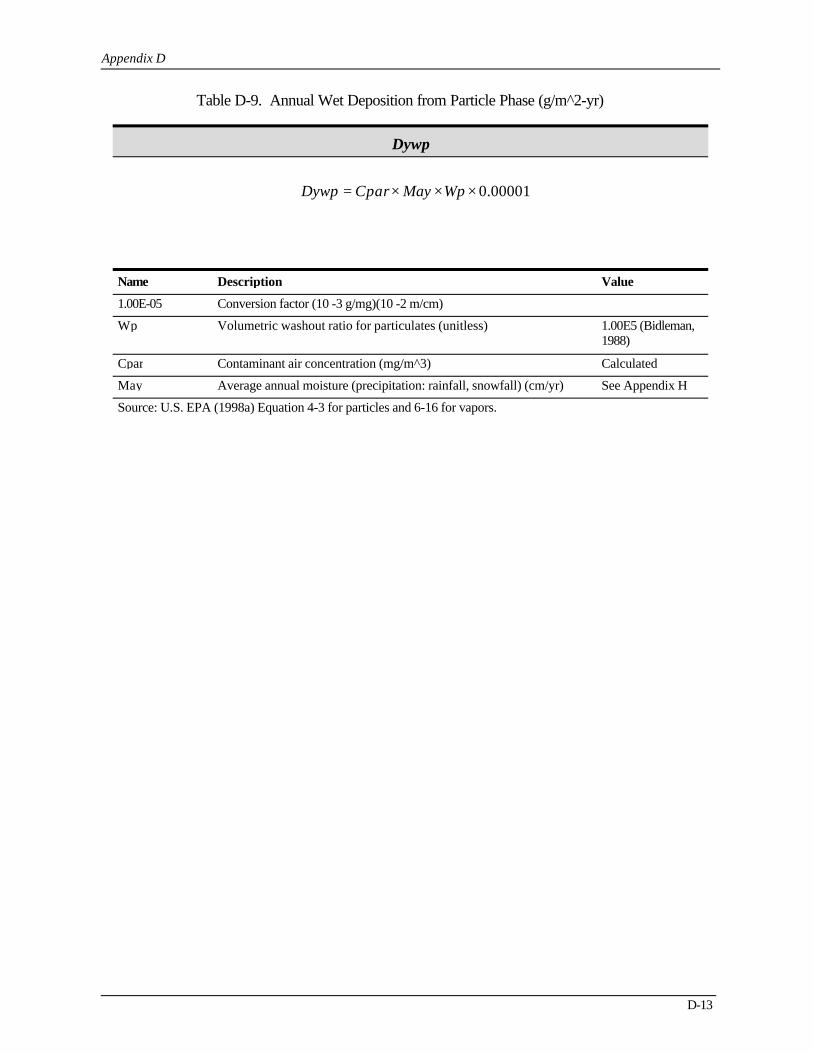
Table D-9. Annual Wet Deposition from Particle Phase (g/m^2-yr)
Appendix D
Name Description Value
Dywp
00001.0×××= WpMayCparDywp
1.00E-05 Conversion factor (10 -3 g/mg)(10 -2 m/cm)
Wp Volumetric washout ratio for particulates (unitless) 1.00E5 (Bidleman, 1988)
Cpar Contaminant air concentration (mg/m^3) Calculated
May Average annual moisture (precipitation: rainfall, snowfall) (cm/yr) See Appendix H
Source: U.S. EPA (1998a) Equation 4-3 for particles and 6-16 for vapors.
D-13
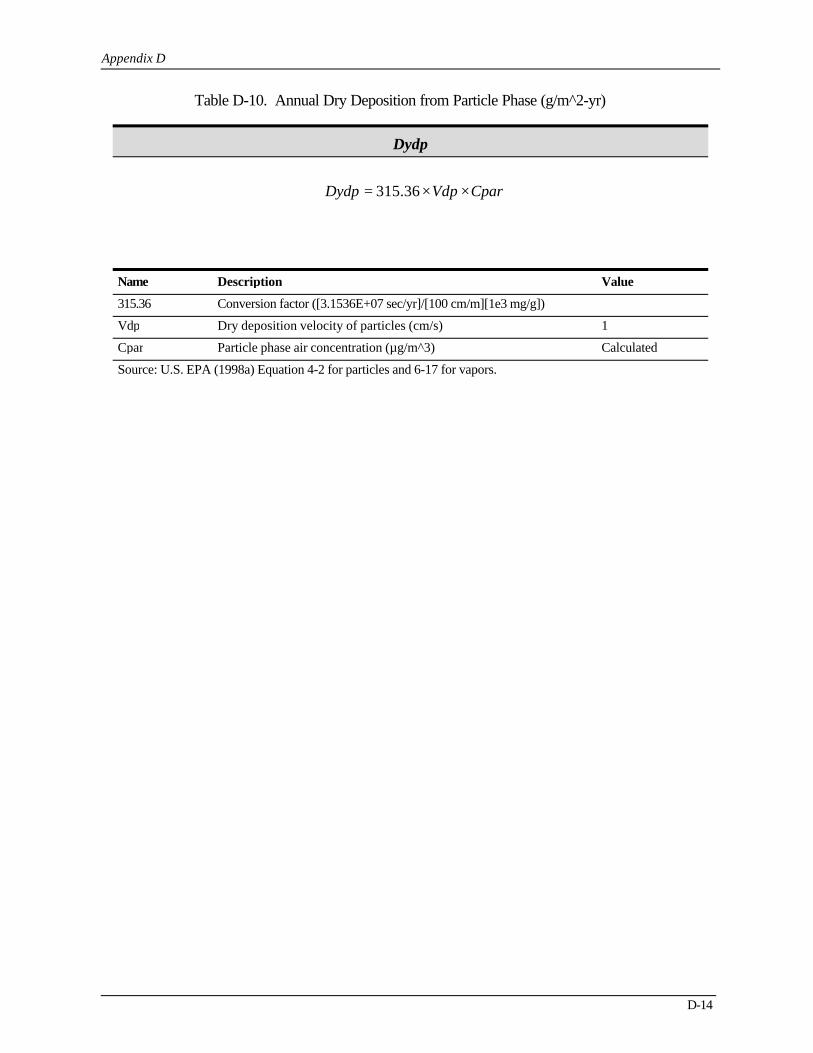
Table D-10. Annual Dry Deposition from Particle Phase (g/m^2-yr)
Appendix D
Name Description Value
Dydp
CparVdpDydp ××= 36.315
315.36 Conversion factor ([3.1536E+07 sec/yr]/[100 cm/m][1e3 mg/g])
Vdp Dry deposition velocity of particles (cm/s) 1
Cpar Particle phase air concentration (µg/m^3) Calculated
Source: U.S. EPA (1998a) Equation 4-2 for particles and 6-17 for vapors.
D-14
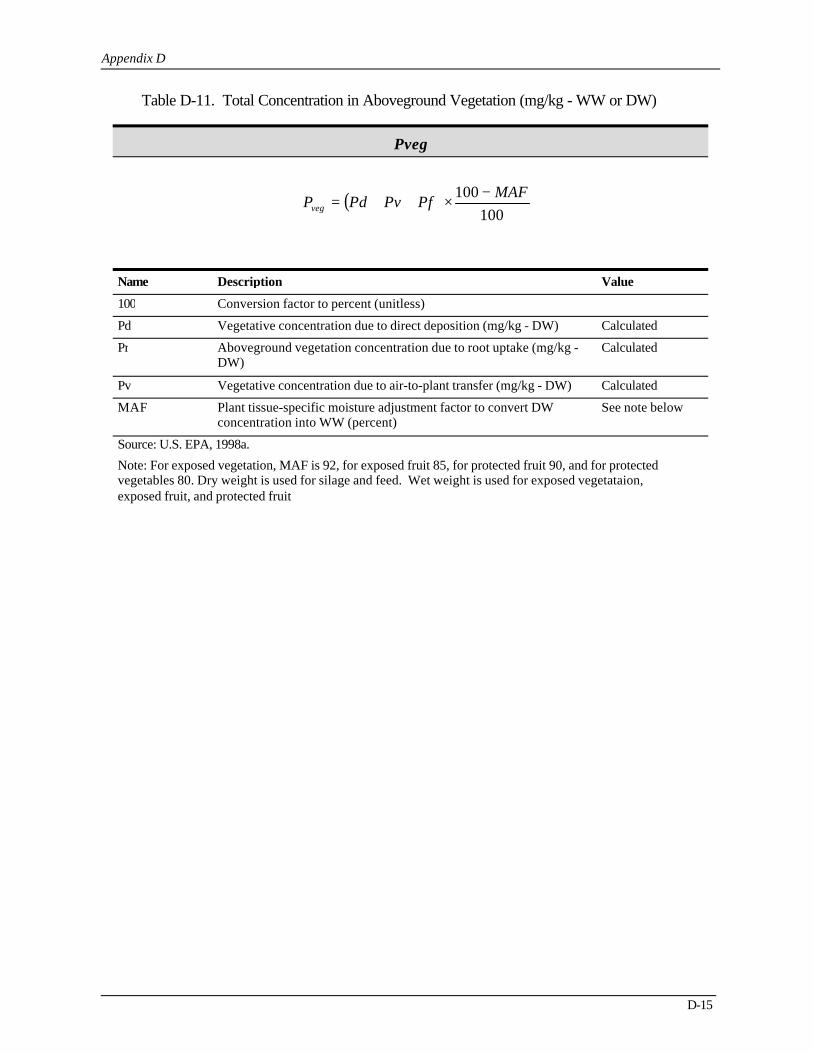
Table D-11. Total Concentration in Aboveground Vegetation (mg/kg - WW or DW)
Appendix D
Name Description Value
Pveg
( )100
100 MAFPfPvPdPveg
−×++=
100 Conversion factor to percent (unitless)
Pd Vegetative concentration due to direct deposition (mg/kg - DW) Calculated
Pr Aboveground vegetation concentration due to root uptake (mg/kg - DW)
Calculated
Pv Vegetative concentration due to air-to-plant transfer (mg/kg - DW) Calculated
MAF Plant tissue-specific moisture adjustment factor to convert DW concentration into WW (percent)
See note below
Source: U.S. EPA, 1998a.
Note: For exposed vegetation, MAF is 92, for exposed fruit 85, for protected fruit 90, and for protected vegetables 80. Dry weight is used for silage and feed. Wet weight is used for exposed vegetataion, exposed fruit, and protected fruit
D-15
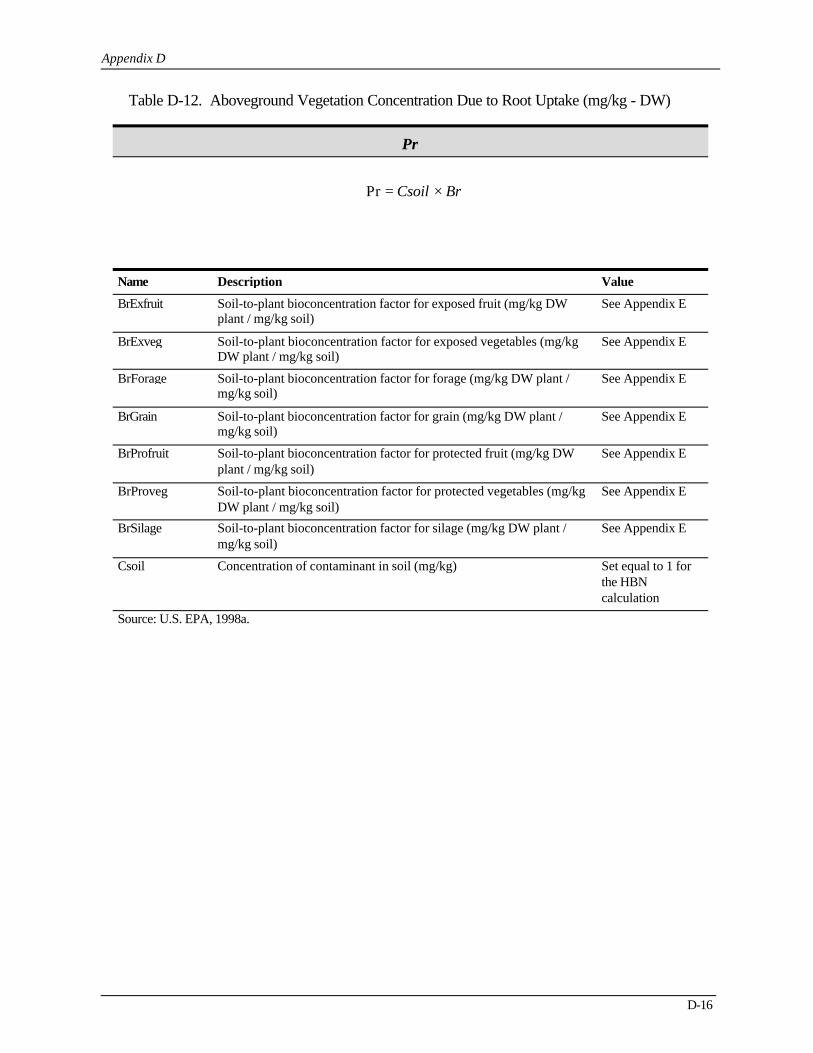
Table D-12. Aboveground Vegetation Concentration Due to Root Uptake (mg/kg - DW)
Appendix D
Name Description Value
Pr
BrCsoil ×=Pr
BrExfruit Soil-to-plant bioconcentration factor for exposed fruit (mg/kg DW plant / mg/kg soil)
See Appendix E
BrExveg Soil-to-plant bioconcentration factor for exposed vegetables (mg/kg DW plant / mg/kg soil)
See Appendix E
BrForage Soil-to-plant bioconcentration factor for forage (mg/kg DW plant / mg/kg soil)
See Appendix E
BrGrain Soil-to-plant bioconcentration factor for grain (mg/kg DW plant / mg/kg soil)
See Appendix E
BrProfruit Soil-to-plant bioconcentration factor for protected fruit (mg/kg DW plant / mg/kg soil)
See Appendix E
BrProveg Soil-to-plant bioconcentration factor for protected vegetables (mg/kg DW plant / mg/kg soil)
See Appendix E
BrSilage Soil-to-plant bioconcentration factor for silage (mg/kg DW plant / mg/kg soil)
See Appendix E
Csoil Concentration of contaminant in soil (mg/kg) Set equal to 1 for the HBN calculation
Source: U.S. EPA, 1998a.
D-16

Table D-13. Vegetative Concentration Due to Direct Deposition (mg/kg - DW)
Appendix D
Name Description Value
Pd
( )
KpParYpeRpDp
PdTpKpPar
×−××
=×−1
Dp Deposition term for plants (mg/m^2-yr) Calculated
KpPar Plant surface loss coefficient, particulate (1/yr) See Appendix E
Rp_exfruit Interception fraction for exposed fruit (unitless) See Appendix F
Rp_exveg Interception fraction for exposed vegetables (unitless) See Appendix F
Rp_forage Interception fraction for forage (unitless) See Appendix F
Rp_silage Interception fraction for silage (unitless) See Appendix F
Tp_exfruit Length of plant exposure to deposition for exposed fruit (yr) See Appendix F
Tp_exveg Length of plant exposure to deposition for exposed vegetables (yr) See Appendix F
Tp_forage Length of plant exposure to deposition for forage (yr) See Appendix F
Tp_silage Length of plant exposure to deposition for silage (yr) See Appendix F
Yp_exfruit Crop yield for exposed fruit (kg DW/m^2) See Appendix F
Yp_exveg Crop yield for exposed vegetables (kg DW/m^2) See Appendix F
Yp_forage Crop yield for forage (kg DW/m^2) See Appendix F
Yp_silage Crop yield for silage (kg DW/m^2) See Appendix F
Source: U.S. EPA, 1998a.
D-17
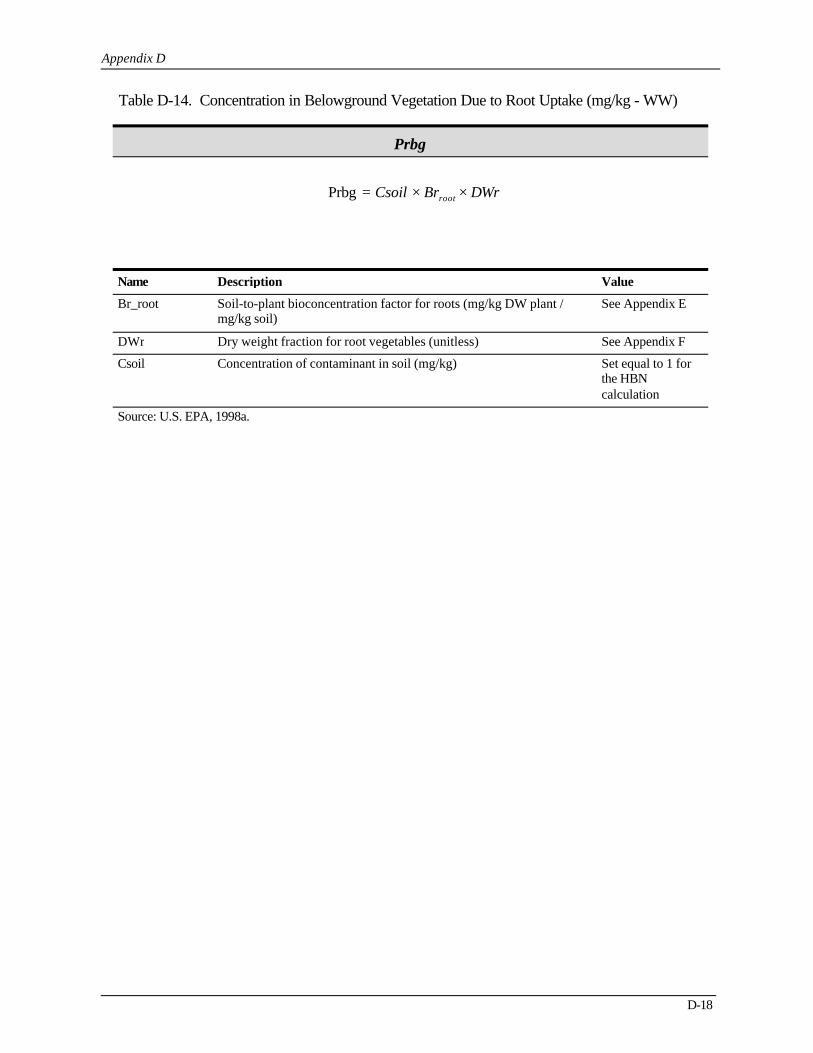
Table D-14. Concentration in Belowground Vegetation Due to Root Uptake (mg/kg - WW)
Appendix D
Name Description Value
Prbg
DWrBrCsoil root ××=Prbg
Br_root Soil-to-plant bioconcentration factor for roots (mg/kg DW plant / mg/kg soil)
See Appendix E
DWr Dry weight fraction for root vegetables (unitless) See Appendix F
Csoil Concentration of contaminant in soil (mg/kg) Set equal to 1 for the HBN calculation
Source: U.S. EPA, 1998a.
D-18
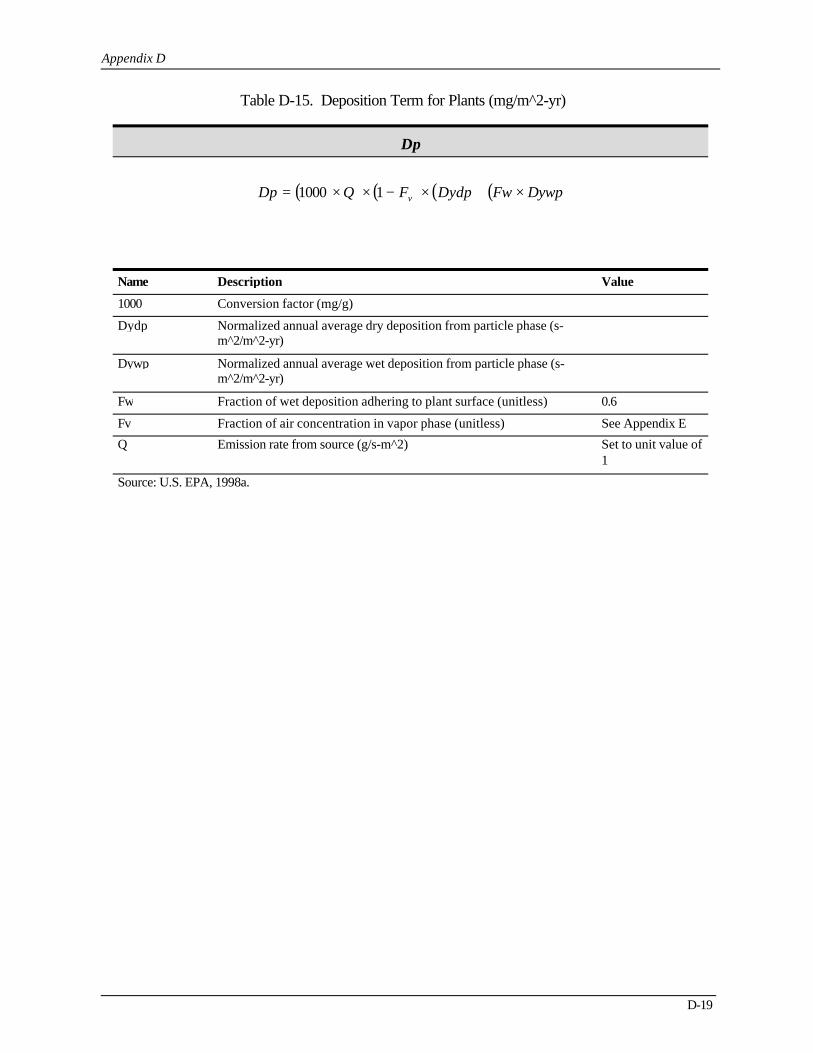
Table D-15. Deposition Term for Plants (mg/m^2-yr)
Appendix D
Name Description Value
Dp
( ) ( ) ( )( )DywpFwDydpFQDp v ×+×−××= 11000
1000 Conversion factor (mg/g)
Dydp Normalized annual average dry deposition from particle phase (s-m^2/m^2-yr)
Dywp Normalized annual average wet deposition from particle phase (s-m^2/m^2-yr)
Fw Fraction of wet deposition adhering to plant surface (unitless) 0.6
Fv Fraction of air concentration in vapor phase (unitless) See Appendix E
Q Emission rate from source (g/s-m^2) Set to unit value of 1
Source: U.S. EPA, 1998a.
D-19
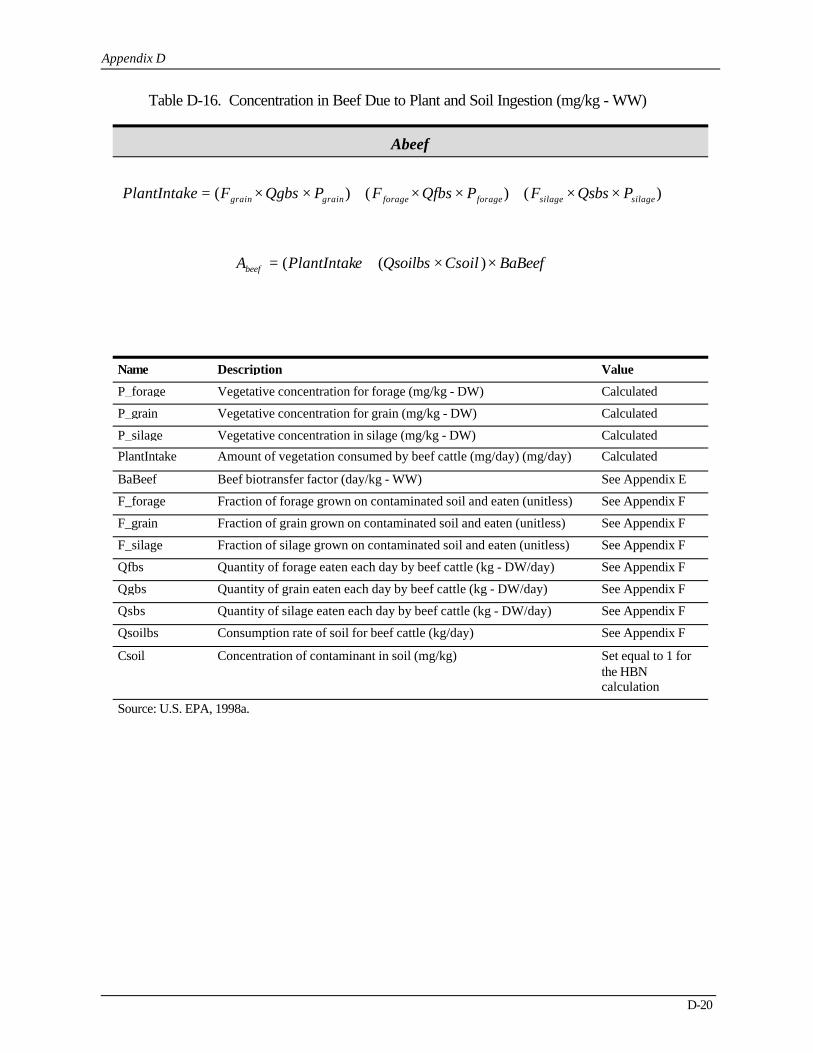
Table D-16. Concentration in Beef Due to Plant and Soil Ingestion (mg/kg - WW)
Appendix D
Name Description Value
Abeef
)()()( silagesilageforageforagegraingrain PQsbsFPQfbsFPQgbsFePlantIntak ××+××+××=
BaBeefCsoilQsoilbsePlantIntakAbeef ××+= )((
P_forage Vegetative concentration for forage (mg/kg - DW) Calculated
P_grain Vegetative concentration for grain (mg/kg - DW) Calculated
P_silage Vegetative concentration in silage (mg/kg - DW) Calculated
PlantIntake Amount of vegetation consumed by beef cattle (mg/day) (mg/day) Calculated
BaBeef Beef biotransfer factor (day/kg - WW) See Appendix E
F_forage Fraction of forage grown on contaminated soil and eaten (unitless) See Appendix F
F_grain Fraction of grain grown on contaminated soil and eaten (unitless) See Appendix F
F_silage Fraction of silage grown on contaminated soil and eaten (unitless) See Appendix F
Qfbs Quantity of forage eaten each day by beef cattle (kg - DW/day) See Appendix F
Qgbs Quantity of grain eaten each day by beef cattle (kg - DW/day) See Appendix F
Qsbs Quantity of silage eaten each day by beef cattle (kg - DW/day) See Appendix F
Qsoilbs Consumption rate of soil for beef cattle (kg/day) See Appendix F
Csoil Concentration of contaminant in soil (mg/kg) Set equal to 1 for the HBN calculation
Source: U.S. EPA, 1998a.
D-20
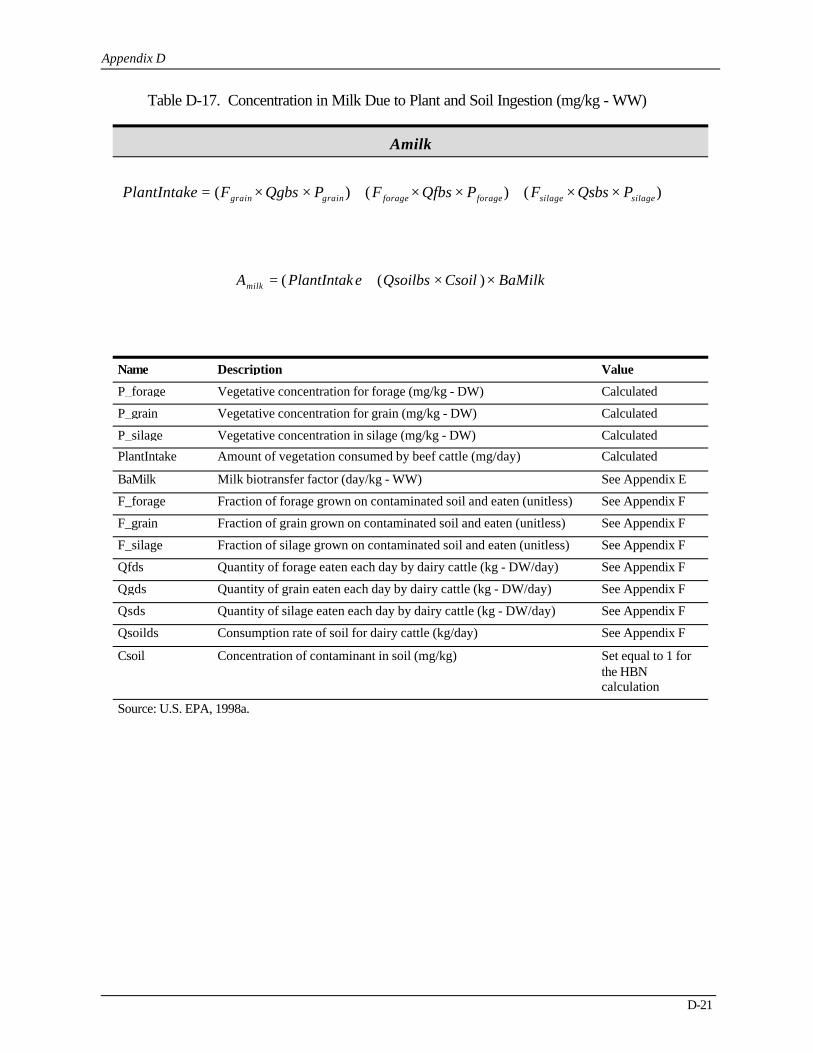
Table D-17. Concentration in Milk Due to Plant and Soil Ingestion (mg/kg - WW)
Appendix D
Name Description Value
Amilk
)()()( silagesilageforageforagegraingrain PQsbsFPQfbsFPQgbsFePlantIntak ××+××+××=
BaMilkCsoilQsoilbsePlantIntakAmilk ××+= )((
P_forage Vegetative concentration for forage (mg/kg - DW) Calculated
P_grain Vegetative concentration for grain (mg/kg - DW) Calculated
P_silage Vegetative concentration in silage (mg/kg - DW) Calculated
PlantIntake Amount of vegetation consumed by beef cattle (mg/day) Calculated
BaMilk Milk biotransfer factor (day/kg - WW) See Appendix E
F_forage Fraction of forage grown on contaminated soil and eaten (unitless) See Appendix F
F_grain Fraction of grain grown on contaminated soil and eaten (unitless) See Appendix F
F_silage Fraction of silage grown on contaminated soil and eaten (unitless) See Appendix F
Qfds Quantity of forage eaten each day by dairy cattle (kg - DW/day) See Appendix F
Qgds Quantity of grain eaten each day by dairy cattle (kg - DW/day) See Appendix F
Qsds Quantity of silage eaten each day by dairy cattle (kg - DW/day) See Appendix F
Qsoilds Consumption rate of soil for dairy cattle (kg/day) See Appendix F
Csoil Concentration of contaminant in soil (mg/kg) Set equal to 1 for the HBN calculation
Source: U.S. EPA, 1998a.
D-21
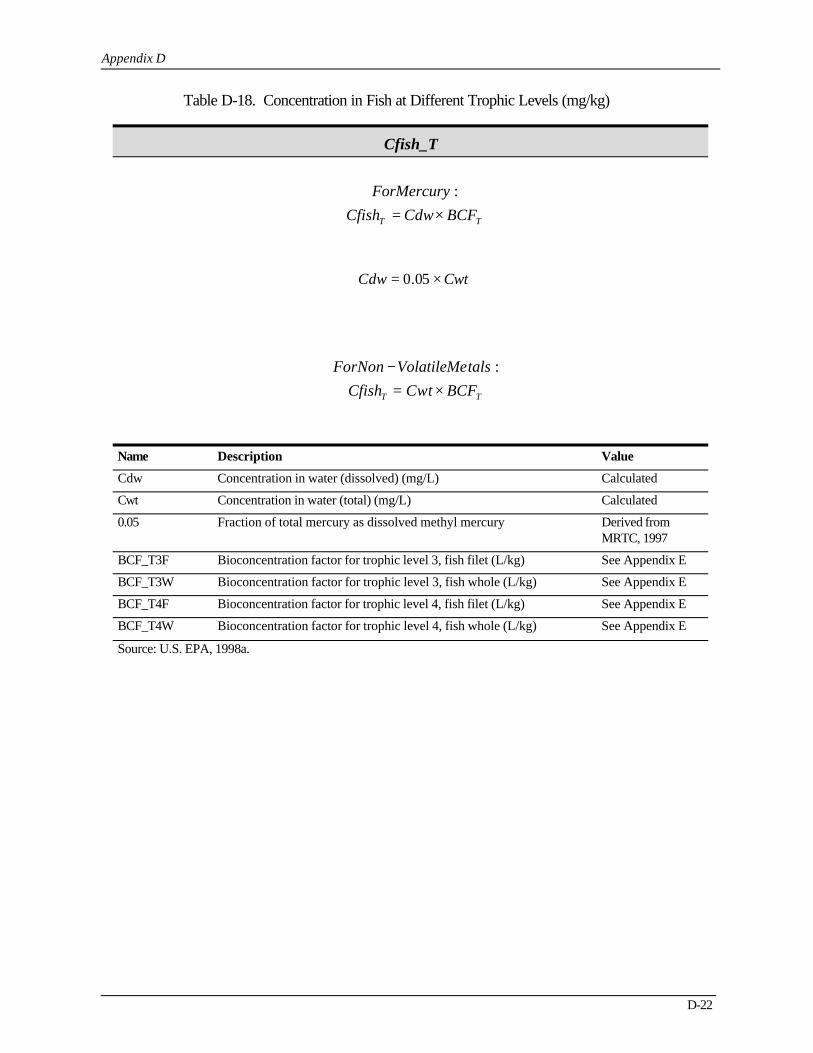
Table D-18. Concentration in Fish at Different Trophic Levels (mg/kg)
Appendix D
Name Description Value
Cfish_T
TT BCFCdwCfishForMercury
×=:
CwtCdw ×= 05.0
TT BCFCwtCfishtalsVolatileMeForNon
×=− :
Cdw Concentration in water (dissolved) (mg/L) Calculated
Cwt Concentration in water (total) (mg/L) Calculated
0.05 Fraction of total mercury as dissolved methyl mercury Derived from MRTC, 1997
BCF_T3F Bioconcentration factor for trophic level 3, fish filet (L/kg) See Appendix E
BCF_T3W Bioconcentration factor for trophic level 3, fish whole (L/kg) See Appendix E
BCF_T4F Bioconcentration factor for trophic level 4, fish filet (L/kg) See Appendix E
BCF_T4W Bioconcentration factor for trophic level 4, fish whole (L/kg) See Appendix E
Source: U.S. EPA, 1998a.
D-22
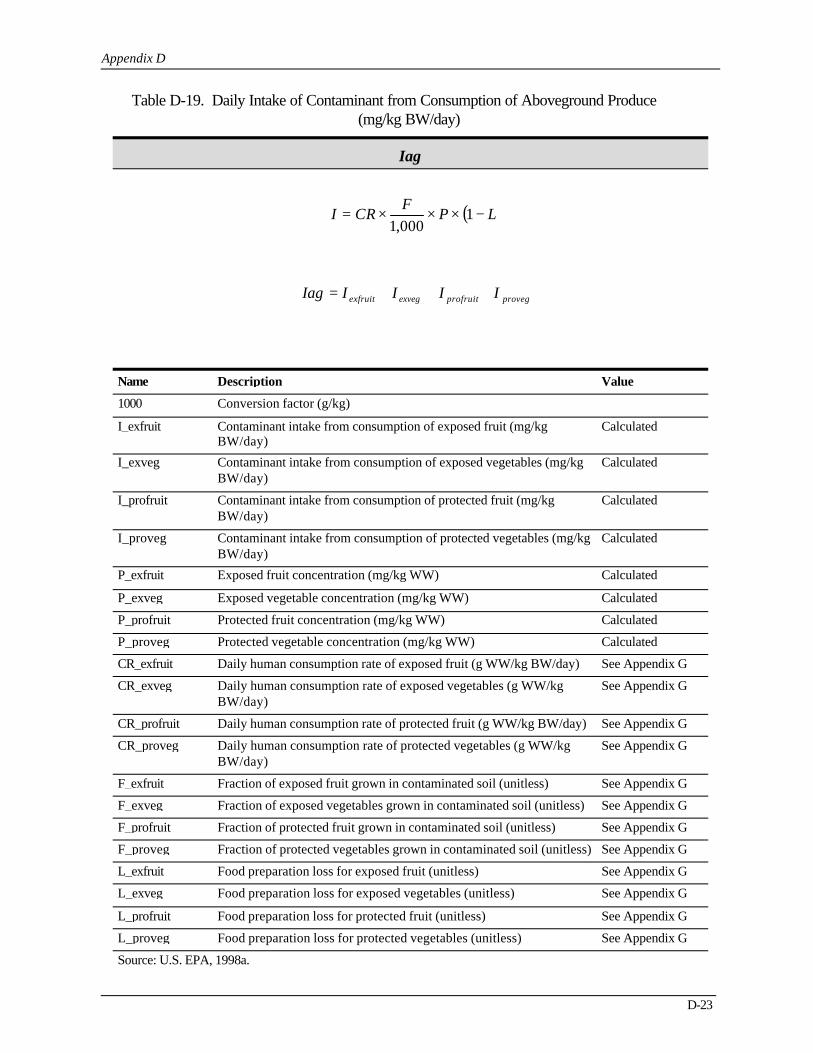
Table D-19. Daily Intake of Contaminant from Consumption of Aboveground Produce (mg/kg BW/day)
Appendix D
Name Description Value
Iag
( )LPF
CRI −×××= 1000,1
provegprofruitexvegexfruit IIIIIag +++=
1000 Conversion factor (g/kg)
I_exfruit Contaminant intake from consumption of exposed fruit (mg/kg BW/day)
Calculated
I_exveg Contaminant intake from consumption of exposed vegetables (mg/kg BW/day)
Calculated
I_profruit Contaminant intake from consumption of protected fruit (mg/kg BW/day)
Calculated
I_proveg Contaminant intake from consumption of protected vegetables (mg/kg BW/day)
Calculated
P_exfruit Exposed fruit concentration (mg/kg WW) Calculated
P_exveg Exposed vegetable concentration (mg/kg WW) Calculated
P_profruit Protected fruit concentration (mg/kg WW) Calculated
P_proveg Protected vegetable concentration (mg/kg WW) Calculated
CR_exfruit Daily human consumption rate of exposed fruit (g WW/kg BW/day) See Appendix G
CR_exveg Daily human consumption rate of exposed vegetables (g WW/kg BW/day)
See Appendix G
CR_profruit Daily human consumption rate of protected fruit (g WW/kg BW/day) See Appendix G
CR_proveg Daily human consumption rate of protected vegetables (g WW/kg BW/day)
See Appendix G
F_exfruit Fraction of exposed fruit grown in contaminated soil (unitless) See Appendix G
F_exveg Fraction of exposed vegetables grown in contaminated soil (unitless) See Appendix G
F_profruit Fraction of protected fruit grown in contaminated soil (unitless) See Appendix G
F_proveg Fraction of protected vegetables grown in contaminated soil (unitless) See Appendix G
L_exfruit Food preparation loss for exposed fruit (unitless) See Appendix G
L_exveg Food preparation loss for exposed vegetables (unitless) See Appendix G
L_profruit Food preparation loss for protected fruit (unitless) See Appendix G
L_proveg Food preparation loss for protected vegetables (unitless) See Appendix G
Source: U.S. EPA, 1998a.
D-23
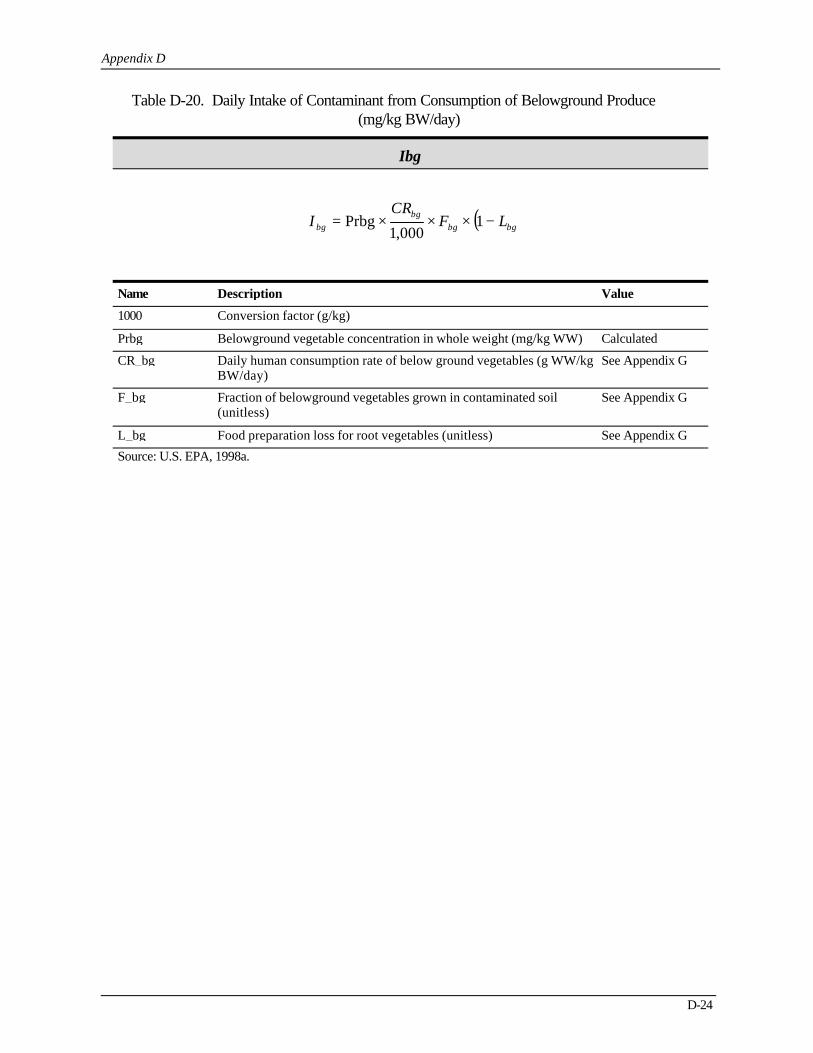
Table D-20. Daily Intake of Contaminant from Consumption of Belowground Produce (mg/kg BW/day)
Appendix D
Name Description Value
Ibg
( )bgbgbg
bg LFCR
I −×××= 1000,1
Prbg
1000 Conversion factor (g/kg)
Prbg Belowground vegetable concentration in whole weight (mg/kg WW) Calculated
CR_bg Daily human consumption rate of below ground vegetables (g WW/kg BW/day)
See Appendix G
F_bg Fraction of belowground vegetables grown in contaminated soil (unitless)
See Appendix G
L_bg Food preparation loss for root vegetables (unitless) See Appendix G
Source: U.S. EPA, 1998a.
D-24
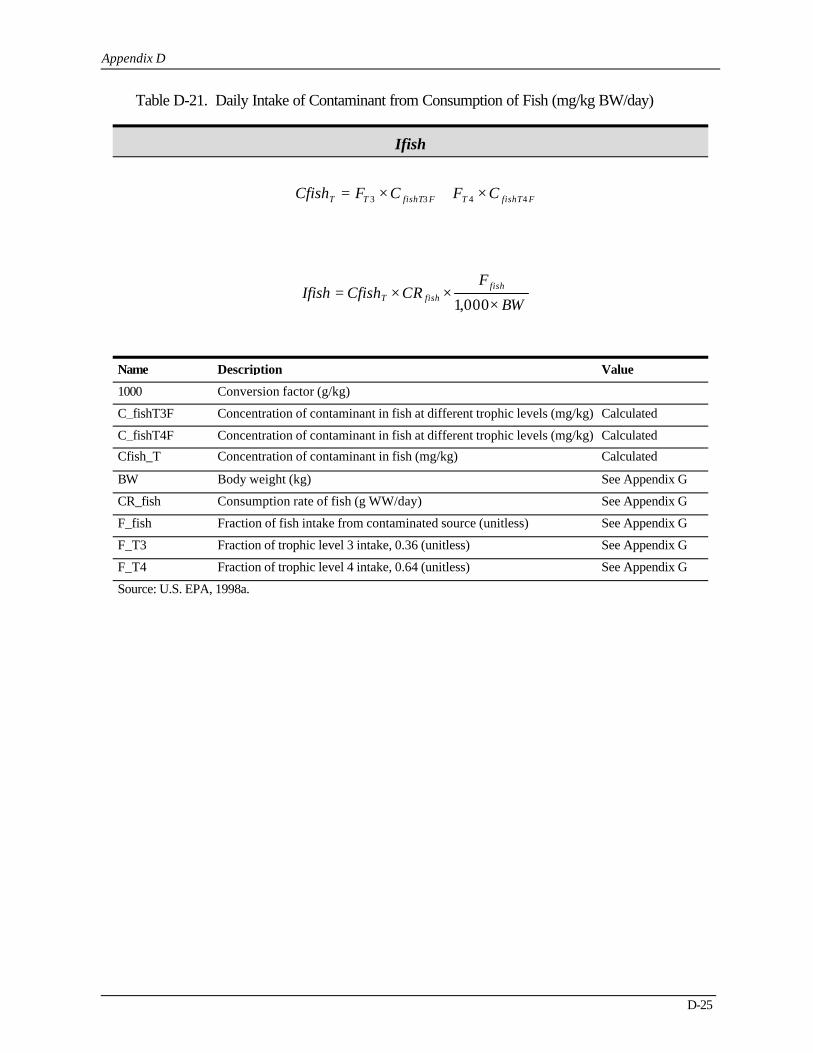
Table D-21. Daily Intake of Contaminant from Consumption of Fish (mg/kg BW/day)
Appendix D
Name Description Value
Ifish
FfishTTFfishTTT CFCFCfish 4433 ×+×=
BW
FCRCfishIfish fish
fishT ×××=
000,1
1000 Conversion factor (g/kg)
C_fishT3F Concentration of contaminant in fish at different trophic levels (mg/kg) Calculated
C_fishT4F Concentration of contaminant in fish at different trophic levels (mg/kg) Calculated
Cfish_T Concentration of contaminant in fish (mg/kg) Calculated
BW Body weight (kg) See Appendix G
CR_fish Consumption rate of fish (g WW/day) See Appendix G
F_fish Fraction of fish intake from contaminated source (unitless) See Appendix G
F_T3 Fraction of trophic level 3 intake, 0.36 (unitless) See Appendix G
F_T4 Fraction of trophic level 4 intake, 0.64 (unitless) See Appendix G
Source: U.S. EPA, 1998a.
D-25

Table D-22. Daily Intake of Contaminant from Incidental Ingestion of Soil (mg/kg BW/day)
Appendix D
Name Description Value
Isoil
000001.0×××
=BW
FCRsCsoilIsoil soil
0.000001 Conversion factor (kg/mg)
Isoil Daily intake of contaminant from incidental ingestion of soil (mg/kg BW/day)
Calculated
BW Body weight (kg) See Appendix G
CRs Soil ingestion rate (mg/day) See Appendix G
F_soil Fraction of contaminated soil that is ingested (unitless) See Appendix G
Csoil Concentration of contaminant in soil (mg/kg) Set equal to 1 for the HBN calculation
Source: U.S. EPA, 1998a.
D-26

Table D-23. Daily Intake of Contaminant from Consumption of Drinking Water (mg/kg BW/day)
Appendix D
Name Description Value
Idw
BWF
CrCIdw dwdwdw ××=
1000 Conversion factor (mL/L)
Cdw Concentration of contaminant in water (mg/L) Calculated
BW Body weight (kg) See Appendix G
CR_dw Consumption rate of water (L/day) See Appendix G
F_dw Fraction of drinking water ingested that is contaminated (unitless) See Appendix G
Source: U.S. EPA, 1998a.
D-27

Table D-24. Daily Intake of Contaminant from Ingestion of i-th Animal Tissue Group (mg/kg BW/day)
Appendix D
Name Description Value
Ianimal
LiFiCRi
AiIanimal ×××=000,1
1000 Conversion factor (g/kg)
Ai Concentration of contaminant in i-th animal tissue group (mg/kg WW) Calculated
CRi Daily human consumption rate of i-th animal tissue group (g WW/kg BW/day)
See Appendix G
Fi Fraction of animal tissue that is contaminated (unitless) See Appendix G
Li Contaminant loss factor (unitless) See Appendix G
Source: U.S. EPA, 1998a.
D-28

Table D-25. Cancer Risk and Hazard Quotient Due to Inhalation (unitless)
Appendix D
Name Description Value
Risk_Air
RfCCair
HQ Air =
BWATCSFEFiEDiBRiCair
Risk inhalAir ××
××××=
365
365 Conversion factor (days/yr)
Cair Concentration of contaminant in air (mg/m^3) Calculated
HQ_Air Noncancer hazard quotient for inhalation (unitless) Calculated
CSFInhal Inhalation cancer slope factor (mg/kg/day)-1 See Appendix B
RfC Noncancer reference concentration (mg/m^3) See Appendix B
AT Averaging time (yr) See Appendix G
Bri Breathing rate (m^3/day) See Appendix G
BW Body weight (kg) See Appendix G
EDi Exposure duration for inhalation (yr) See Appendix G
EFi Exposure frequency (days/yr) See Appendix G
D-29

Table D-26. Cancer Risk and Hazard Quotient Due to Ingestion (unitless)
Appendix D
Name Description Value
Risk_Oral
RfDI
HQOral =
365××××
=AT
CSFEFEDIRisk Oral
Oral
365 Conversion factor (days/yr)
HQ_Oral Noncancer hazard quotient for ingestion (unitless) Calculated
I Combined intake rate from soil, animal products and produce (mg/kg/day)
Calculated
CSFOral Oral cancer slope factor (mg/kg/day)-1 See Appendix B
RfD Noncancer reference dose (mg/kg/day) See Appendix B
AT Averaging time (yr) See Appendix G
ED Exposure duration for oral ingestion (yr) See Appendix G
EF Exposure frequency (days/yr) See Appendix G
D-30

Table D-27. Health-Based Concentration (ppm)
Appendix D
Name Description Value
CalcHBN
THQHQ
CHBNOral
NCOral×=
THQHQ
CHBN
InhalinhalNC ×=
TRRiskCHBNRisk ×=
THQ Target noncancer hazard quotient (unitless) 1
TR Target cancer risk (unitless) 1.00E-5
HQ_Inhal Noncancer hazard quotient for inhalation (unitless) Calculated
HQ_Oral Noncancer hazard quotient for ingestion (unitless) Calculated
Risk Total cancer risk (unitless) Calculated
C Constituent concentration in media (mg/L or mg/kg) Value set to unit concentration of 1
Backcalculation assuming linearity.
D-31
Appendix D August 2002
D-32
D.3 References
Bidleman, T.F. 1988. Atmospheric Processes. Environmental Science and Technology 22(4).
EPRI (Electric Power Research Institute). 1997. Coal Combustion and Low Volume WastesComanagement Survey. EPRI. Palo Alto, CA. June.
U.S. EPA (Environmental Protection Agency). 1996. Soil Screening Guidance TechnicalBackground Document. EPA/540/R/95/128. Office of Solid Waste and EmergencyResponse, Washington, DC. May.
U.S. EPA (Environmental Protection Agency). 1998a. Methodology for Assessing Health RisksAssociated with Multiple Pathways of Exposure to Combustor Emissions. EPA 600/R-98/137. National Center for Environmental Assessment, Cincinnati, OH. December.
U.S. EPA (Environmental Protection Agency). 1998b. Technical Background Document for theSupplemental Report to Congress on Remaining Fossil-Fuel Combustion Wastes—Ground-Water Pathway Human Health Risk Assessment. Revised Draft Final. Office ofSolid Waste, Washington, DC. June.
U.S. EPA (Environmental Protection Agency). 2001. Supplemental Guidance for Developing SoilScreening Levels for Superfund Sites: Peer Review Draft. OSWER 9355.4-24. Office ofSolid Waste and Emergency Response. March.

Appendix E
Chemical-Specific Inputs

Appendix E
E-3
Appendix E
Chemical-Specific InputsChemical-specific inputs used to develop the FFCW HBNs include the biouptake, biotranfer,
and bioconcentration factors needed to estimate exposure concentrations in produce, beef, milk, andfish. Values for these inputs are obtained from the best available literature source. Tables E-1 throughE-25 provide, for each chemical in the FFCW screening analysis, the values used in the analysis alongwith the source of each value.

Table E-1. Chemical-Specific Inputs for Aluminum (7429905)
Parameter Value Units Reference
Appendix E
CommentDescription
BaBeef 1.5E-3 (day/kg - WW) Baes et al., 1984Beef biotransfer factor
BaMilk 2.0E-4 (day/kg - WW) Baes et al., 1984Milk biotransfer factor
BCF_T3F NO DATA - -Bioconcentration factor for trophic level 3 fish, filet
BCF_T3W NO DATA - -Bioconcentration factor for trophic level 3 fish, whole
BCF_T4F NO DATA - -Bioconcentration factor for trophic level 4 fish, filet
BCF_T4W NO DATA - -Bioconcentration factor for trophic level 4 fish, whole
BrExfruit 6.5E-04 (ug/g DW plants)/(ug/g soil)
Baes et al., 1984Soil-to-plant bioconcentration factor, exposed fruit
BrExveg 4.0E-03 (ug/g DW plants)/(ug/g soil)
Baes et al., 1984Soil-to-plant bioconcentration factor, exposed vegetables
BrForage 4.0E-03 (ug/g DW plants)/(ug/g soil)
Baes et al., 1984Soil-to-plant bioconcentration factor, forage
BrGrain 6.5E-04 (ug/g DW plants)/(ug/g soil)
Baes et al., 1984Soil-to-plant bioconcentration factor, grain
BrProfruit 6.5E-04 (ug/g DW plants)/(ug/g soil)
Baes et al., 1984Soil-to-plant bioconcentration factor, protected fruit
BrProveg 6.5E-04 (ug/g DW plants)/(ug/g soil)
Baes et al., 1984Soil-to-plant bioconcentration factor, protected vegetables
BrRoot 4.0E-03 (ug/g DW plants)/(ug/g soil)
Baes et al., 1984Soil-to-plant bioconcentration factor, roots
BrSilage 4.0E-03 (ug/g DW plants)/(ug/g soil)
Baes et al., 1984Soil-to-plant bioconcentration factor, silage
Fv 0 (unitless) - Set to zero for nonvolatile chemicals.
Fraction of air concentration in vapor phase
KpPar 18.07 (1/yr) U.S. EPA, 1997bPlant surface loss coefficient, particulate
E-4
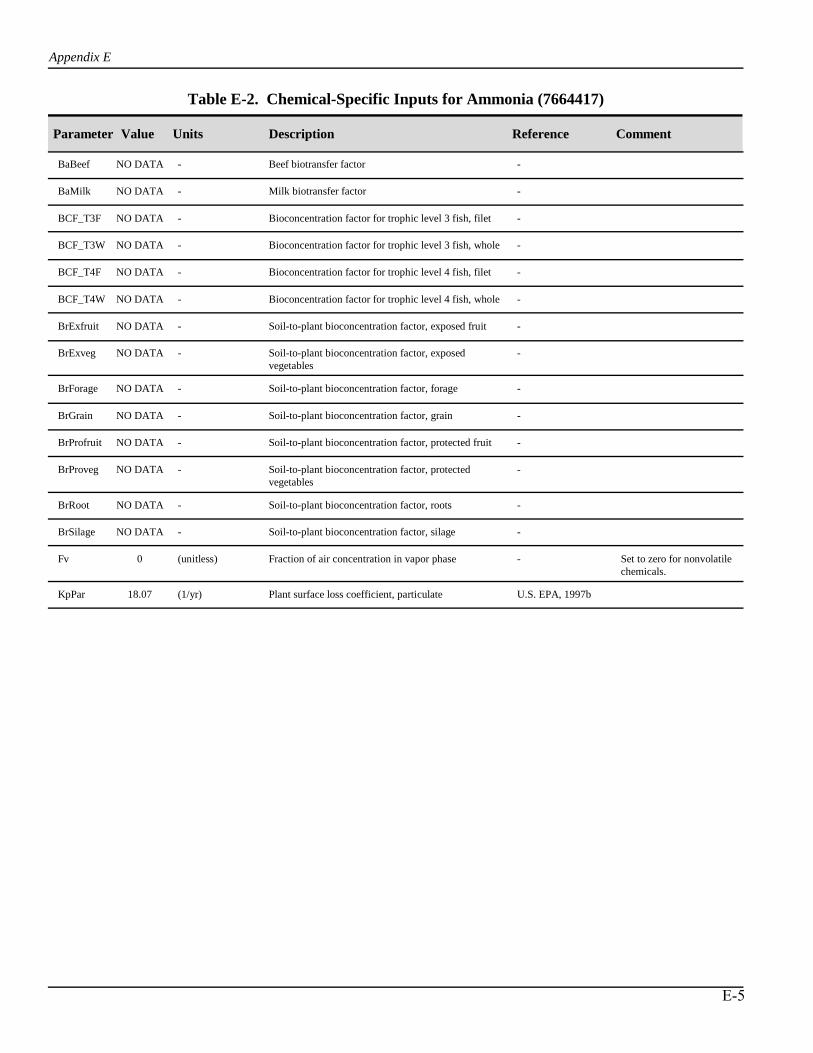
Table E-2. Chemical-Specific Inputs for Ammonia (7664417)
Parameter Value Units Reference
Appendix E
CommentDescription
BaBeef NO DATA - -Beef biotransfer factor
BaMilk NO DATA - -Milk biotransfer factor
BCF_T3F NO DATA - -Bioconcentration factor for trophic level 3 fish, filet
BCF_T3W NO DATA - -Bioconcentration factor for trophic level 3 fish, whole
BCF_T4F NO DATA - -Bioconcentration factor for trophic level 4 fish, filet
BCF_T4W NO DATA - -Bioconcentration factor for trophic level 4 fish, whole
BrExfruit NO DATA - -Soil-to-plant bioconcentration factor, exposed fruit
BrExveg NO DATA - -Soil-to-plant bioconcentration factor, exposed vegetables
BrForage NO DATA - -Soil-to-plant bioconcentration factor, forage
BrGrain NO DATA - -Soil-to-plant bioconcentration factor, grain
BrProfruit NO DATA - -Soil-to-plant bioconcentration factor, protected fruit
BrProveg NO DATA - -Soil-to-plant bioconcentration factor, protected vegetables
BrRoot NO DATA - -Soil-to-plant bioconcentration factor, roots
BrSilage NO DATA - -Soil-to-plant bioconcentration factor, silage
Fv 0 (unitless) - Set to zero for nonvolatile chemicals.
Fraction of air concentration in vapor phase
KpPar 18.07 (1/yr) U.S. EPA, 1997bPlant surface loss coefficient, particulate
E-5
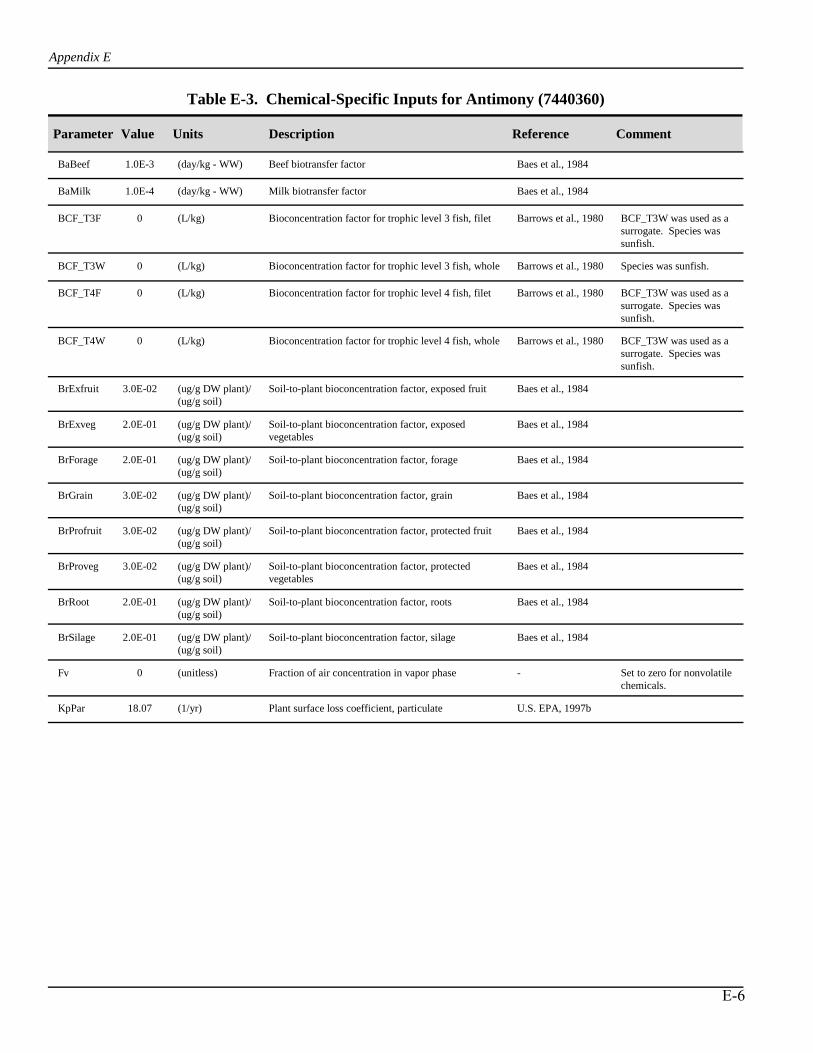
Table E-3. Chemical-Specific Inputs for Antimony (7440360)
Parameter Value Units Reference
Appendix E
CommentDescription
BaBeef 1.0E-3 (day/kg - WW) Baes et al., 1984Beef biotransfer factor
BaMilk 1.0E-4 (day/kg - WW) Baes et al., 1984Milk biotransfer factor
BCF_T3F 0 (L/kg) Barrows et al., 1980 BCF_T3W was used as a surrogate. Species was sunfish.
Bioconcentration factor for trophic level 3 fish, filet
BCF_T3W 0 (L/kg) Barrows et al., 1980 Species was sunfish.Bioconcentration factor for trophic level 3 fish, whole
BCF_T4F 0 (L/kg) Barrows et al., 1980 BCF_T3W was used as a surrogate. Species was sunfish.
Bioconcentration factor for trophic level 4 fish, filet
BCF_T4W 0 (L/kg) Barrows et al., 1980 BCF_T3W was used as a surrogate. Species was sunfish.
Bioconcentration factor for trophic level 4 fish, whole
BrExfruit 3.0E-02 (ug/g DW plant)/ (ug/g soil)
Baes et al., 1984Soil-to-plant bioconcentration factor, exposed fruit
BrExveg 2.0E-01 (ug/g DW plant)/ (ug/g soil)
Baes et al., 1984Soil-to-plant bioconcentration factor, exposed vegetables
BrForage 2.0E-01 (ug/g DW plant)/ (ug/g soil)
Baes et al., 1984Soil-to-plant bioconcentration factor, forage
BrGrain 3.0E-02 (ug/g DW plant)/ (ug/g soil)
Baes et al., 1984Soil-to-plant bioconcentration factor, grain
BrProfruit 3.0E-02 (ug/g DW plant)/ (ug/g soil)
Baes et al., 1984Soil-to-plant bioconcentration factor, protected fruit
BrProveg 3.0E-02 (ug/g DW plant)/ (ug/g soil)
Baes et al., 1984Soil-to-plant bioconcentration factor, protected vegetables
BrRoot 2.0E-01 (ug/g DW plant)/ (ug/g soil)
Baes et al., 1984Soil-to-plant bioconcentration factor, roots
BrSilage 2.0E-01 (ug/g DW plant)/ (ug/g soil)
Baes et al., 1984Soil-to-plant bioconcentration factor, silage
Fv 0 (unitless) - Set to zero for nonvolatile chemicals.
Fraction of air concentration in vapor phase
KpPar 18.07 (1/yr) U.S. EPA, 1997bPlant surface loss coefficient, particulate
E-6
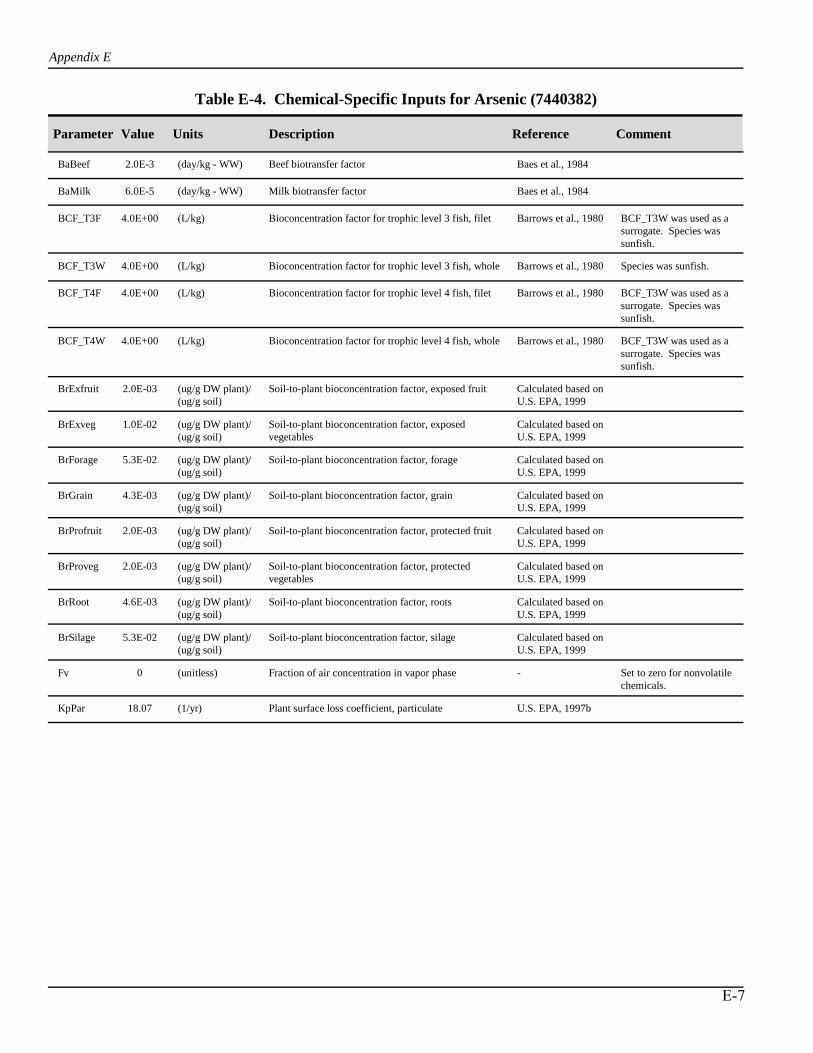
Table E-4. Chemical-Specific Inputs for Arsenic (7440382)
Parameter Value Units Reference
Appendix E
CommentDescription
BaBeef 2.0E-3 (day/kg - WW) Baes et al., 1984Beef biotransfer factor
BaMilk 6.0E-5 (day/kg - WW) Baes et al., 1984Milk biotransfer factor
BCF_T3F 4.0E+00 (L/kg) Barrows et al., 1980 BCF_T3W was used as a surrogate. Species was sunfish.
Bioconcentration factor for trophic level 3 fish, filet
BCF_T3W 4.0E+00 (L/kg) Barrows et al., 1980 Species was sunfish.Bioconcentration factor for trophic level 3 fish, whole
BCF_T4F 4.0E+00 (L/kg) Barrows et al., 1980 BCF_T3W was used as a surrogate. Species was sunfish.
Bioconcentration factor for trophic level 4 fish, filet
BCF_T4W 4.0E+00 (L/kg) Barrows et al., 1980 BCF_T3W was used as a surrogate. Species was sunfish.
Bioconcentration factor for trophic level 4 fish, whole
BrExfruit 2.0E-03 (ug/g DW plant)/ (ug/g soil)
Calculated based on U.S. EPA, 1999
Soil-to-plant bioconcentration factor, exposed fruit
BrExveg 1.0E-02 (ug/g DW plant)/ (ug/g soil)
Calculated based on U.S. EPA, 1999
Soil-to-plant bioconcentration factor, exposed vegetables
BrForage 5.3E-02 (ug/g DW plant)/ (ug/g soil)
Calculated based on U.S. EPA, 1999
Soil-to-plant bioconcentration factor, forage
BrGrain 4.3E-03 (ug/g DW plant)/ (ug/g soil)
Calculated based on U.S. EPA, 1999
Soil-to-plant bioconcentration factor, grain
BrProfruit 2.0E-03 (ug/g DW plant)/ (ug/g soil)
Calculated based on U.S. EPA, 1999
Soil-to-plant bioconcentration factor, protected fruit
BrProveg 2.0E-03 (ug/g DW plant)/ (ug/g soil)
Calculated based on U.S. EPA, 1999
Soil-to-plant bioconcentration factor, protected vegetables
BrRoot 4.6E-03 (ug/g DW plant)/ (ug/g soil)
Calculated based on U.S. EPA, 1999
Soil-to-plant bioconcentration factor, roots
BrSilage 5.3E-02 (ug/g DW plant)/ (ug/g soil)
Calculated based on U.S. EPA, 1999
Soil-to-plant bioconcentration factor, silage
Fv 0 (unitless) - Set to zero for nonvolatile chemicals.
Fraction of air concentration in vapor phase
KpPar 18.07 (1/yr) U.S. EPA, 1997bPlant surface loss coefficient, particulate
E-7

Table E-5. Chemical-Specific Inputs for Barium (7440393)
Parameter Value Units Reference
Appendix E
CommentDescription
BaBeef 1.5E-4 (day/kg - WW) Baes et al., 1984Beef biotransfer factor
BaMilk 3.5E-4 (day/kg - WW) Baes et al., 1984Milk biotransfer factor
BCF_T3F NO DATA - -Bioconcentration factor for trophic level 3 fish, filet
BCF_T3W NO DATA - -Bioconcentration factor for trophic level 3 fish, whole
BCF_T4F NO DATA - -Bioconcentration factor for trophic level 4 fish, filet
BCF_T4W NO DATA - -Bioconcentration factor for trophic level 4 fish, whole
BrExfruit 1.5E-02 (ug/g DW plant)/ (ug/g soil)
Baes et al., 1984Soil-to-plant bioconcentration factor, exposed fruit
BrExveg 1.5E-01 (ug/g DW plant)/ (ug/g soil)
Baes et al., 1984Soil-to-plant bioconcentration factor, exposed vegetables
BrForage 1.5E-01 (ug/g DW plant)/ (ug/g soil)
Baes et al., 1984Soil-to-plant bioconcentration factor, forage
BrGrain 1.5E-02 (ug/g DW plant)/ (ug/g soil)
Baes et al., 1984Soil-to-plant bioconcentration factor, grain
BrProfruit 1.5E-02 (ug/g DW plant)/ (ug/g soil)
Baes et al., 1984Soil-to-plant bioconcentration factor, protected fruit
BrProveg 1.5E-02 (ug/g DW plant)/ (ug/g soil)
Baes et al., 1984Soil-to-plant bioconcentration factor, protected vegetables
BrRoot 1.5E-01 (ug/g DW plant)/ (ug/g soil)
Baes et al., 1984Soil-to-plant bioconcentration factor, roots
BrSilage 1.5E-01 (ug/g DW plant)/ (ug/g soil)
Baes et al., 1984Soil-to-plant bioconcentration factor, silage
Fv 0 (unitless) - Set to zero for nonvolatile chemicals.
Fraction of air concentration in vapor phase
KpPar 18.07 (1/yr) U.S. EPA, 1997bPlant surface loss coefficient, particulate
E-8
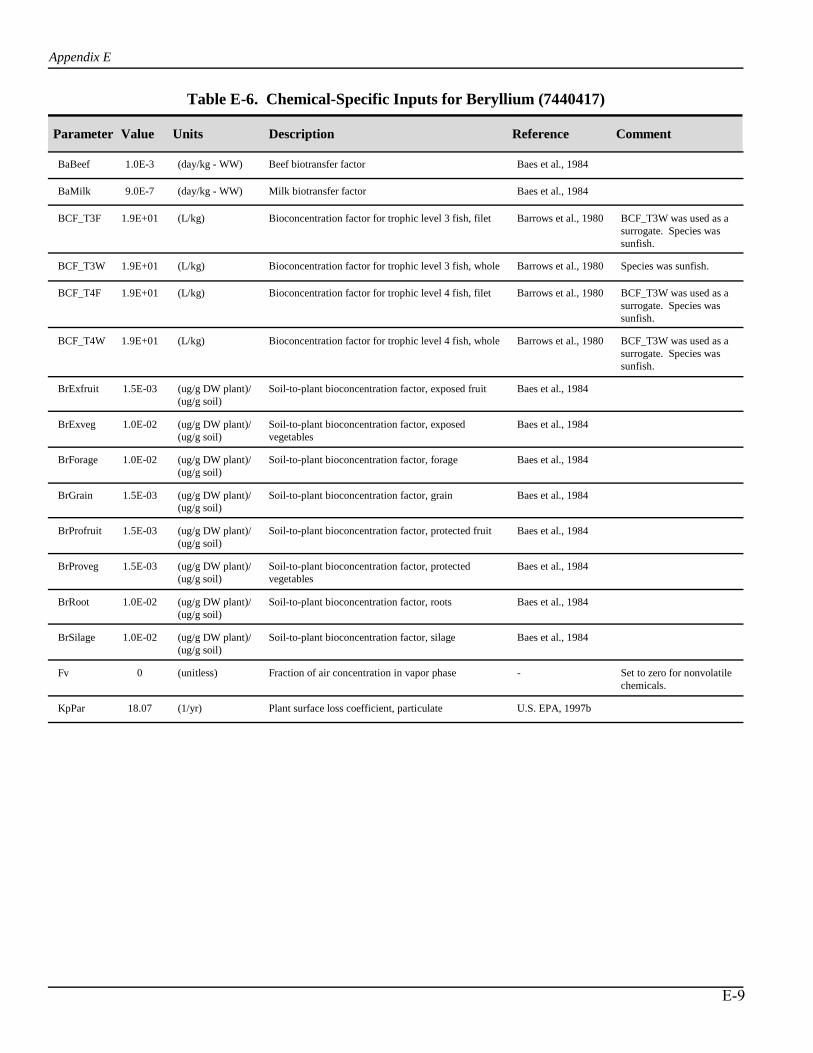
Table E-6. Chemical-Specific Inputs for Beryllium (7440417)
Parameter Value Units Reference
Appendix E
CommentDescription
BaBeef 1.0E-3 (day/kg - WW) Baes et al., 1984Beef biotransfer factor
BaMilk 9.0E-7 (day/kg - WW) Baes et al., 1984Milk biotransfer factor
BCF_T3F 1.9E+01 (L/kg) Barrows et al., 1980 BCF_T3W was used as a surrogate. Species was sunfish.
Bioconcentration factor for trophic level 3 fish, filet
BCF_T3W 1.9E+01 (L/kg) Barrows et al., 1980 Species was sunfish.Bioconcentration factor for trophic level 3 fish, whole
BCF_T4F 1.9E+01 (L/kg) Barrows et al., 1980 BCF_T3W was used as a surrogate. Species was sunfish.
Bioconcentration factor for trophic level 4 fish, filet
BCF_T4W 1.9E+01 (L/kg) Barrows et al., 1980 BCF_T3W was used as a surrogate. Species was sunfish.
Bioconcentration factor for trophic level 4 fish, whole
BrExfruit 1.5E-03 (ug/g DW plant)/ (ug/g soil)
Baes et al., 1984Soil-to-plant bioconcentration factor, exposed fruit
BrExveg 1.0E-02 (ug/g DW plant)/ (ug/g soil)
Baes et al., 1984Soil-to-plant bioconcentration factor, exposed vegetables
BrForage 1.0E-02 (ug/g DW plant)/ (ug/g soil)
Baes et al., 1984Soil-to-plant bioconcentration factor, forage
BrGrain 1.5E-03 (ug/g DW plant)/ (ug/g soil)
Baes et al., 1984Soil-to-plant bioconcentration factor, grain
BrProfruit 1.5E-03 (ug/g DW plant)/ (ug/g soil)
Baes et al., 1984Soil-to-plant bioconcentration factor, protected fruit
BrProveg 1.5E-03 (ug/g DW plant)/ (ug/g soil)
Baes et al., 1984Soil-to-plant bioconcentration factor, protected vegetables
BrRoot 1.0E-02 (ug/g DW plant)/ (ug/g soil)
Baes et al., 1984Soil-to-plant bioconcentration factor, roots
BrSilage 1.0E-02 (ug/g DW plant)/ (ug/g soil)
Baes et al., 1984Soil-to-plant bioconcentration factor, silage
Fv 0 (unitless) - Set to zero for nonvolatile chemicals.
Fraction of air concentration in vapor phase
KpPar 18.07 (1/yr) U.S. EPA, 1997bPlant surface loss coefficient, particulate
E-9

Table E-7. Chemical-Specific Inputs for Boron (7440428)
Parameter Value Units Reference
Appendix E
CommentDescription
BaBeef 8.0E-4 (day/kg - WW) Baes et al., 1984Beef biotransfer factor
BaMilk 1.5E-3 (day/kg - WW) Baes et al., 1984Milk biotransfer factor
BCF_T3F NO DATA - -Bioconcentration factor for trophic level 3 fish, filet
BCF_T3W NO DATA - -Bioconcentration factor for trophic level 3 fish, whole
BCF_T4F NO DATA - -Bioconcentration factor for trophic level 4 fish, filet
BCF_T4W NO DATA - -Bioconcentration factor for trophic level 4 fish, whole
BrExfruit 2.0E+00 (ug/g DW plant)/ (ug/g soil)
Baes et al., 1984Soil-to-plant bioconcentration factor, exposed fruit
BrExveg 4.0E+00 (ug/g DW plant)/ (ug/g soil)
Baes et al., 1984Soil-to-plant bioconcentration factor, exposed vegetables
BrForage 4.0E+00 (ug/g DW plant)/ (ug/g soil)
Baes et al., 1984Soil-to-plant bioconcentration factor, forage
BrGrain 2.0E+00 (ug/g DW plant)/ (ug/g soil)
Baes et al., 1984Soil-to-plant bioconcentration factor, grain
BrProfruit 2.0E+00 (ug/g DW plant)/ (ug/g soil)
Baes et al., 1984Soil-to-plant bioconcentration factor, protected fruit
BrProveg 2.0E+00 (ug/g DW plant)/ (ug/g soil)
Baes et al., 1984Soil-to-plant bioconcentration factor, protected vegetables
BrRoot 4.0E+00 (ug/g DW plant)/ (ug/g soil)
Baes et al., 1984Soil-to-plant bioconcentration factor, roots
BrSilage 4.0E+00 (ug/g DW plant)/ (ug/g soil)
Baes et al., 1984Soil-to-plant bioconcentration factor, silage
Fv 0 (unitless) - Set to zero for nonvolatile chemicals.
Fraction of air concentration in vapor phase
KpPar 18.07 (1/yr) U.S. EPA, 1997bPlant surface loss coefficient, particulate
E-10
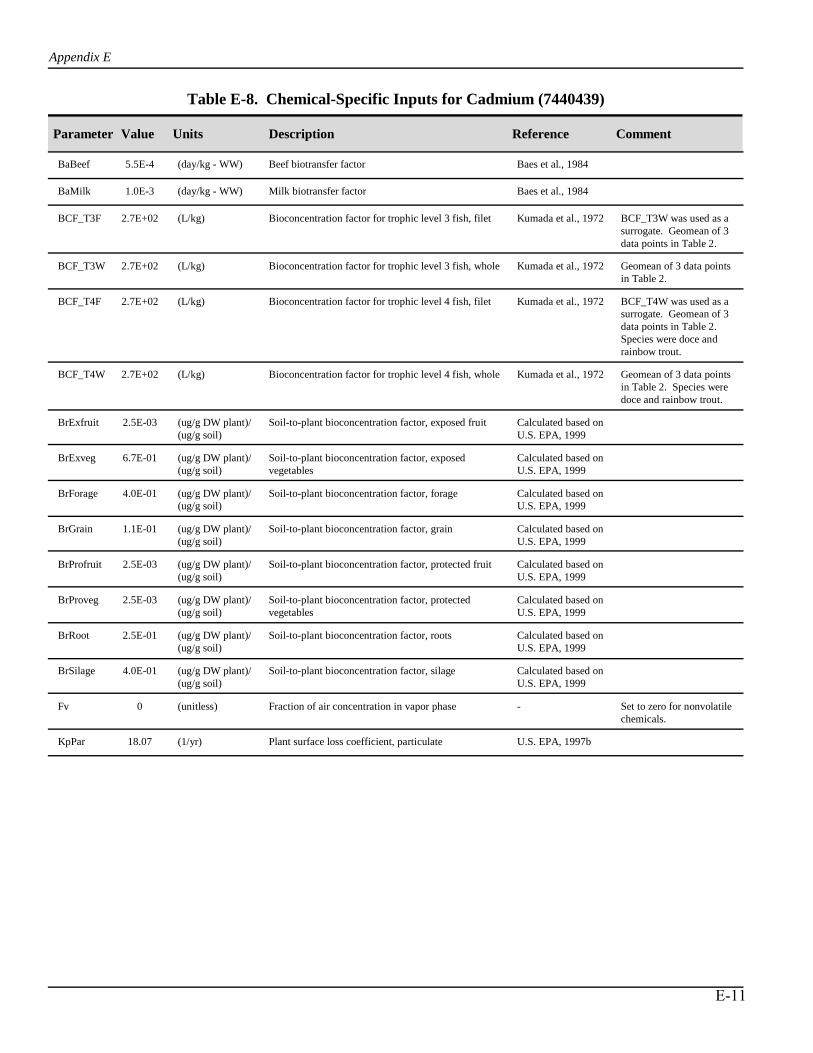
Table E-8. Chemical-Specific Inputs for Cadmium (7440439)
Parameter Value Units Reference
Appendix E
CommentDescription
BaBeef 5.5E-4 (day/kg - WW) Baes et al., 1984Beef biotransfer factor
BaMilk 1.0E-3 (day/kg - WW) Baes et al., 1984Milk biotransfer factor
BCF_T3F 2.7E+02 (L/kg) Kumada et al., 1972 BCF_T3W was used as a surrogate. Geomean of 3 data points in Table 2.
Bioconcentration factor for trophic level 3 fish, filet
BCF_T3W 2.7E+02 (L/kg) Kumada et al., 1972 Geomean of 3 data points in Table 2.
Bioconcentration factor for trophic level 3 fish, whole
BCF_T4F 2.7E+02 (L/kg) Kumada et al., 1972 BCF_T4W was used as a surrogate. Geomean of 3 data points in Table 2. Species were doce and rainbow trout.
Bioconcentration factor for trophic level 4 fish, filet
BCF_T4W 2.7E+02 (L/kg) Kumada et al., 1972 Geomean of 3 data points in Table 2. Species were doce and rainbow trout.
Bioconcentration factor for trophic level 4 fish, whole
BrExfruit 2.5E-03 (ug/g DW plant)/ (ug/g soil)
Calculated based on U.S. EPA, 1999
Soil-to-plant bioconcentration factor, exposed fruit
BrExveg 6.7E-01 (ug/g DW plant)/ (ug/g soil)
Calculated based on U.S. EPA, 1999
Soil-to-plant bioconcentration factor, exposed vegetables
BrForage 4.0E-01 (ug/g DW plant)/ (ug/g soil)
Calculated based on U.S. EPA, 1999
Soil-to-plant bioconcentration factor, forage
BrGrain 1.1E-01 (ug/g DW plant)/ (ug/g soil)
Calculated based on U.S. EPA, 1999
Soil-to-plant bioconcentration factor, grain
BrProfruit 2.5E-03 (ug/g DW plant)/ (ug/g soil)
Calculated based on U.S. EPA, 1999
Soil-to-plant bioconcentration factor, protected fruit
BrProveg 2.5E-03 (ug/g DW plant)/ (ug/g soil)
Calculated based on U.S. EPA, 1999
Soil-to-plant bioconcentration factor, protected vegetables
BrRoot 2.5E-01 (ug/g DW plant)/ (ug/g soil)
Calculated based on U.S. EPA, 1999
Soil-to-plant bioconcentration factor, roots
BrSilage 4.0E-01 (ug/g DW plant)/ (ug/g soil)
Calculated based on U.S. EPA, 1999
Soil-to-plant bioconcentration factor, silage
Fv 0 (unitless) - Set to zero for nonvolatile chemicals.
Fraction of air concentration in vapor phase
KpPar 18.07 (1/yr) U.S. EPA, 1997bPlant surface loss coefficient, particulate
E-11

Table E-9. Chemical-Specific Inputs for Chromium(III) (16065831)
Parameter Value Units Reference
Appendix E
CommentDescription
BaBeef 5.5E-3 (day/kg - WW) Baes et al., 1984Beef biotransfer factor
BaMilk 1.5E-3 (day/kg - WW) Baes et al., 1984Milk biotransfer factor
BCF_T3F 6.0E-01 (L/kg) Stephan, 1993 BCF_T4F was used as a surrogate. Geomean (as cited in Stephan, 1993) based on Buhler et al. (1977) and Calamari et al. (1982). Used chromium as a surrogate.
Bioconcentration factor for trophic level 3 fish, filet
BCF_T3W 6.0E-01 (L/kg) Stephan, 1993 BCF_T4F was used as a surrogate. Geomean (as cited in Stephan, 1993) based on Buhler et al. (1977) and Calamari et al. (1982). Used chromium as a surrogate.
Bioconcentration factor for trophic level 3 fish, whole
BCF_T4F 6.0E-01 (L/kg) Stephan, 1993 Geomean (as cited in Stephan, 1993) based on Buhler et al. (1977) and Calamari et al. (1982). Used chromium as a surrogate.
Bioconcentration factor for trophic level 4 fish, filet
BCF_T4W 6.0E-01 (L/kg) Stephan, 1993 BCF_T4F was used as a surrogate. Geomean (as cited in Stephan, 1993) based on Buhler et al. (1977) and Calamari et al. (1982). Used chromium as a surrogate.
Bioconcentration factor for trophic level 4 fish, whole
BrExfruit 1.4E-04 (ug/g DW plant)/ (ug/g soil)
Calculated based on U.S. EPA, 1999
Soil-to-plant bioconcentration factor, exposed fruit
BrExveg 5.8E-04 (ug/g DW plant)/ (ug/g soil)
Calculated based on U.S. EPA, 1999
Soil-to-plant bioconcentration factor, exposed vegetables
BrForage 1.9E-03 (ug/g DW plant)/ (ug/g soil)
Calculated based on U.S. EPA, 1999
Soil-to-plant bioconcentration factor, forage
BrGrain 9.0E-05 (ug/g DW plant)/ (ug/g soil)
Calculated based on U.S. EPA, 1999
Soil-to-plant bioconcentration factor, grain
BrProfruit 1.4E-04 (ug/g DW plant)/ (ug/g soil)
Calculated based on U.S. EPA, 1999
Soil-to-plant bioconcentration factor, protected fruit
BrProveg 1.4E-04 (ug/g DW plant)/ (ug/g soil)
Calculated based on U.S. EPA, 1999
Soil-to-plant bioconcentration factor, protected vegetables
BrRoot 9.5E-04 (ug/g DW plant)/ (ug/g soil)
Calculated based on U.S. EPA, 1999
Soil-to-plant bioconcentration factor, roots
BrSilage 1.9E-03 (ug/g DW plant)/ (ug/g soil)
Calculated based on U.S. EPA, 1999
Soil-to-plant bioconcentration factor, silage
Fv 0 (unitless) - Set to zero for nonvolatile chemicals.
Fraction of air concentration in vapor phase
KpPar 18.07 (1/yr) U.S. EPA, 1997bPlant surface loss coefficient, particulate
E-12

Table E-10. Chemical-Specific Inputs for Chromium(VI) (18540299)
Parameter Value Units Reference
Appendix E
CommentDescription
BaBeef 5.5E-3 (day/kg - WW) Baes et al., 1984Beef biotransfer factor
BaMilk 1.5E-3 (day/kg - WW) Baes et al., 1984Milk biotransfer factor
BCF_T3F 6.0E-01 (L/kg) Stephan, 1993 BCF_T4F was used as a surrogate. Geomean (as cited in Stephan, 1993) based on Buhler et al. (1977) and Calamari et al. (1982). Used chromium as a surrogate.
Bioconcentration factor for trophic level 3 fish, filet
BCF_T3W 6.0E-01 (L/kg) Stephan, 1993 BCF_T4F was used as a surrogate. Geomean (as cited in Stephan, 1993) based on Buhler et al. (1977) and Calamari et al. (1982). Used chromium as a surrogate.
Bioconcentration factor for trophic level 3 fish, whole
BCF_T4F 6.0E-01 (L/kg) Stephan, 1993 Geomean (as cited in Stephan, 1993) based on Buhler et al. (1977) and Calamari et al. (1982). Used chromium as a surrogate.
Bioconcentration factor for trophic level 4 fish, filet
BCF_T4W 6.0E-01 (L/kg) Stephan, 1993 BCF_T4F was used as a surrogate. Geomean (as cited in Stephan, 1993) based on Buhler et al. (1977) and Calamari et al. (1982). Used chromium as a surrogate.
Bioconcentration factor for trophic level 4 fish, whole
BrExfruit 1.4E-04 (ug/g DW plant)/ (ug/g soil)
Calculated based on U.S. EPA, 1999
Soil-to-plant bioconcentration factor, exposed fruit
BrExveg 5.8E-04 (ug/g DW plant)/ (ug/g soil)
Calculated based on U.S. EPA, 1999
Soil-to-plant bioconcentration factor, exposed vegetables
BrForage 1.9E-03 (ug/g DW plant)/ (ug/g soil)
Calculated based on U.S. EPA, 1999
Soil-to-plant bioconcentration factor, forage
BrGrain 9.0E-05 (ug/g DW plant)/ (ug/g soil)
Calculated based on U.S. EPA, 1999
Soil-to-plant bioconcentration factor, grain
BrProfruit 1.4E-04 (ug/g DW plant)/ (ug/g soil)
Calculated based on U.S. EPA, 1999
Soil-to-plant bioconcentration factor, protected fruit
BrProveg 1.4E-04 (ug/g DW plant)/ (ug/g soil)
Calculated based on U.S. EPA, 1999
Soil-to-plant bioconcentration factor, protected vegetables
BrRoot 9.5E-04 (ug/g DW plant)/ (ug/g soil)
Calculated based on U.S. EPA, 1999
Soil-to-plant bioconcentration factor, roots
BrSilage 1.9E-03 (ug/g DW plant)/ (ug/g soil)
Calculated based on U.S. EPA, 1999
Soil-to-plant bioconcentration factor, silage
Fv 0 (unitless) - Set to zero for nonvolatile chemicals.
Fraction of air concentration in vapor phase
KpPar 18.07 (1/yr) U.S. EPA, 1997bPlant surface loss coefficient, particulate
E-13
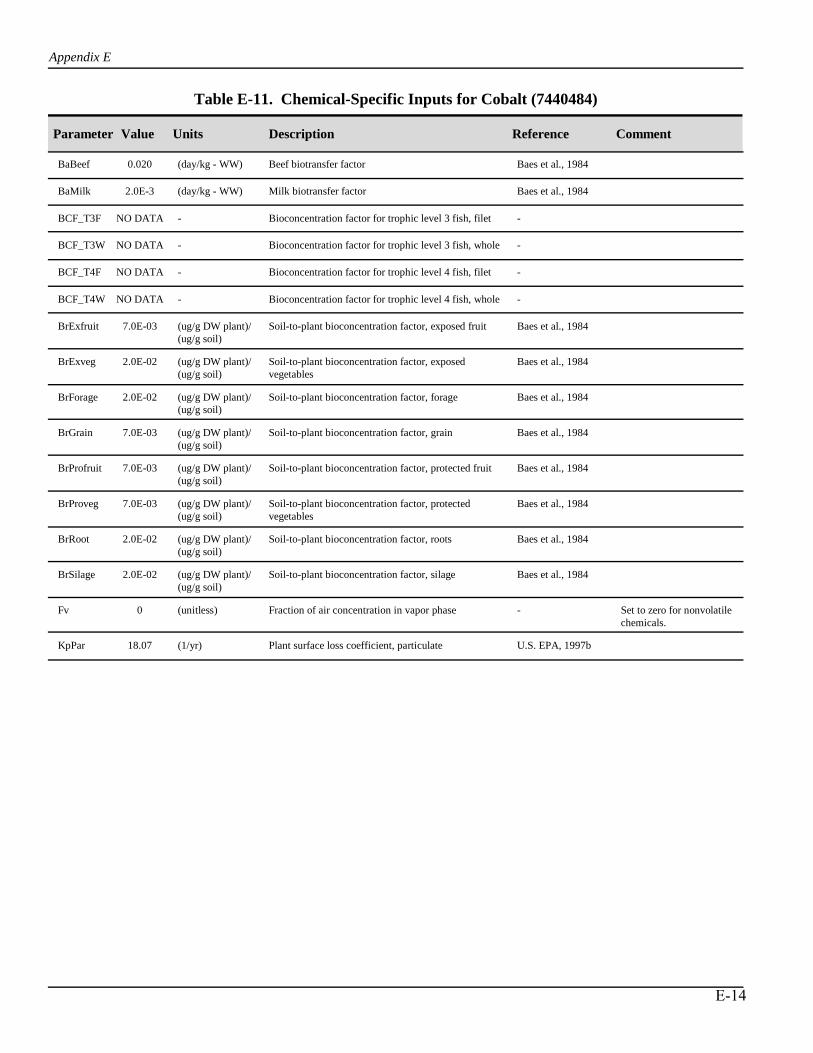
Table E-11. Chemical-Specific Inputs for Cobalt (7440484)
Parameter Value Units Reference
Appendix E
CommentDescription
BaBeef 0.020 (day/kg - WW) Baes et al., 1984Beef biotransfer factor
BaMilk 2.0E-3 (day/kg - WW) Baes et al., 1984Milk biotransfer factor
BCF_T3F NO DATA - -Bioconcentration factor for trophic level 3 fish, filet
BCF_T3W NO DATA - -Bioconcentration factor for trophic level 3 fish, whole
BCF_T4F NO DATA - -Bioconcentration factor for trophic level 4 fish, filet
BCF_T4W NO DATA - -Bioconcentration factor for trophic level 4 fish, whole
BrExfruit 7.0E-03 (ug/g DW plant)/ (ug/g soil)
Baes et al., 1984Soil-to-plant bioconcentration factor, exposed fruit
BrExveg 2.0E-02 (ug/g DW plant)/ (ug/g soil)
Baes et al., 1984Soil-to-plant bioconcentration factor, exposed vegetables
BrForage 2.0E-02 (ug/g DW plant)/ (ug/g soil)
Baes et al., 1984Soil-to-plant bioconcentration factor, forage
BrGrain 7.0E-03 (ug/g DW plant)/ (ug/g soil)
Baes et al., 1984Soil-to-plant bioconcentration factor, grain
BrProfruit 7.0E-03 (ug/g DW plant)/ (ug/g soil)
Baes et al., 1984Soil-to-plant bioconcentration factor, protected fruit
BrProveg 7.0E-03 (ug/g DW plant)/ (ug/g soil)
Baes et al., 1984Soil-to-plant bioconcentration factor, protected vegetables
BrRoot 2.0E-02 (ug/g DW plant)/ (ug/g soil)
Baes et al., 1984Soil-to-plant bioconcentration factor, roots
BrSilage 2.0E-02 (ug/g DW plant)/ (ug/g soil)
Baes et al., 1984Soil-to-plant bioconcentration factor, silage
Fv 0 (unitless) - Set to zero for nonvolatile chemicals.
Fraction of air concentration in vapor phase
KpPar 18.07 (1/yr) U.S. EPA, 1997bPlant surface loss coefficient, particulate
E-14

Table E-12. Chemical-Specific Inputs for Cyanide (57125)
Parameter Value Units Reference
Appendix E
CommentDescription
BaBeef NO DATA - -Beef biotransfer factor
BaMilk NO DATA - -Milk biotransfer factor
BCF_T3F NO DATA - -Bioconcentration factor for trophic level 3 fish, filet
BCF_T3W NO DATA - -Bioconcentration factor for trophic level 3 fish, whole
BCF_T4F NO DATA - -Bioconcentration factor for trophic level 4 fish, filet
BCF_T4W NO DATA - -Bioconcentration factor for trophic level 4 fish, whole
BrExfruit NO DATA - -Soil-to-plant bioconcentration factor, exposed fruit
BrExveg NO DATA - -Soil-to-plant bioconcentration factor, exposed vegetables
BrForage NO DATA - -Soil-to-plant bioconcentration factor, forage
BrGrain NO DATA - -Soil-to-plant bioconcentration factor, grain
BrProfruit NO DATA - -Soil-to-plant bioconcentration factor, protected fruit
BrProveg NO DATA - -Soil-to-plant bioconcentration factor, protected vegetables
BrRoot NO DATA - -Soil-to-plant bioconcentration factor, roots
BrSilage NO DATA - -Soil-to-plant bioconcentration factor, silage
Fv 0 (unitless) - Set to zero for nonvolatile chemicals.
Fraction of air concentration in vapor phase
KpPar 18.07 (1/yr) U.S. EPA, 1997bPlant surface loss coefficient, particulate
E-15

Table E-13. Chemical-Specific Inputs for Fluoride (16984488)
Parameter Value Units Reference
Appendix E
CommentDescription
BaBeef NO DATA - -Beef biotransfer factor
BaMilk NO DATA - -Milk biotransfer factor
BCF_T3F NO DATA - -Bioconcentration factor for trophic level 3 fish, filet
BCF_T3W NO DATA - -Bioconcentration factor for trophic level 3 fish, whole
BCF_T4F NO DATA - -Bioconcentration factor for trophic level 4 fish, filet
BCF_T4W NO DATA - -Bioconcentration factor for trophic level 4 fish, whole
BrExfruit NO DATA - -Soil-to-plant bioconcentration factor, exposed fruit
BrExveg NO DATA - -Soil-to-plant bioconcentration factor, exposed vegetables
BrForage NO DATA - -Soil-to-plant bioconcentration factor, forage
BrGrain NO DATA - -Soil-to-plant bioconcentration factor, grain
BrProfruit NO DATA - -Soil-to-plant bioconcentration factor, protected fruit
BrProveg NO DATA - -Soil-to-plant bioconcentration factor, protected vegetables
BrRoot NO DATA - -Soil-to-plant bioconcentration factor, roots
BrSilage NO DATA - -Soil-to-plant bioconcentration factor, silage
Fv 0 (unitless) - Set to zero for nonvolatile chemicals.
Fraction of air concentration in vapor phase
KpPar 18.07 (1/yr) U.S. EPA, 1997bPlant surface loss coefficient, particulate
E-16

Table E-14. Chemical-Specific Inputs for Manganese (7439965)
Parameter Value Units Reference
Appendix E
CommentDescription
BaBeef 4.0E-4 (day/kg - WW) Baes et al., 1984Beef biotransfer factor
BaMilk 3.5E-4 (day/kg - WW) Baes et al., 1984Milk biotransfer factor
BCF_T3F NO DATA - -Bioconcentration factor for trophic level 3 fish, filet
BCF_T3W NO DATA - -Bioconcentration factor for trophic level 3 fish, whole
BCF_T4F NO DATA - -Bioconcentration factor for trophic level 4 fish, filet
BCF_T4W NO DATA - -Bioconcentration factor for trophic level 4 fish, whole
BrExfruit 5.0E-02 (ug/g DW plants)/(ug/g soil)
Baes et al., 1984Soil-to-plant bioconcentration factor, exposed fruit
BrExveg 2.5E-01 (ug/g DW plants)/(ug/g soil)
Baes et al., 1984Soil-to-plant bioconcentration factor, exposed vegetables
BrForage 2.5E-01 (ug/g DW plants)/(ug/g soil)
Baes et al., 1984Soil-to-plant bioconcentration factor, forage
BrGrain 5.0E-02 (ug/g DW plants)/(ug/g soil)
Baes et al., 1984Soil-to-plant bioconcentration factor, grain
BrProfruit 5.0E-02 (ug/g DW plants)/(ug/g soil)
Baes et al., 1984Soil-to-plant bioconcentration factor, protected fruit
BrProveg 5.0E-02 (ug/g DW plants)/(ug/g soil)
Baes et al., 1984Soil-to-plant bioconcentration factor, protected vegetables
BrRoot 2.5E-01 (ug/g DW plants)/(ug/g soil)
Baes et al., 1984Soil-to-plant bioconcentration factor, roots
BrSilage 2.5E-01 (ug/g DW plants)/(ug/g soil)
Baes et al., 1984Soil-to-plant bioconcentration factor, silage
Fv 0 (unitless) - Set to zero for nonvolatile chemicals.
Fraction of air concentration in vapor phase
KpPar 18.07 (1/yr) U.S. EPA, 1997bPlant surface loss coefficient, particulate
E-17
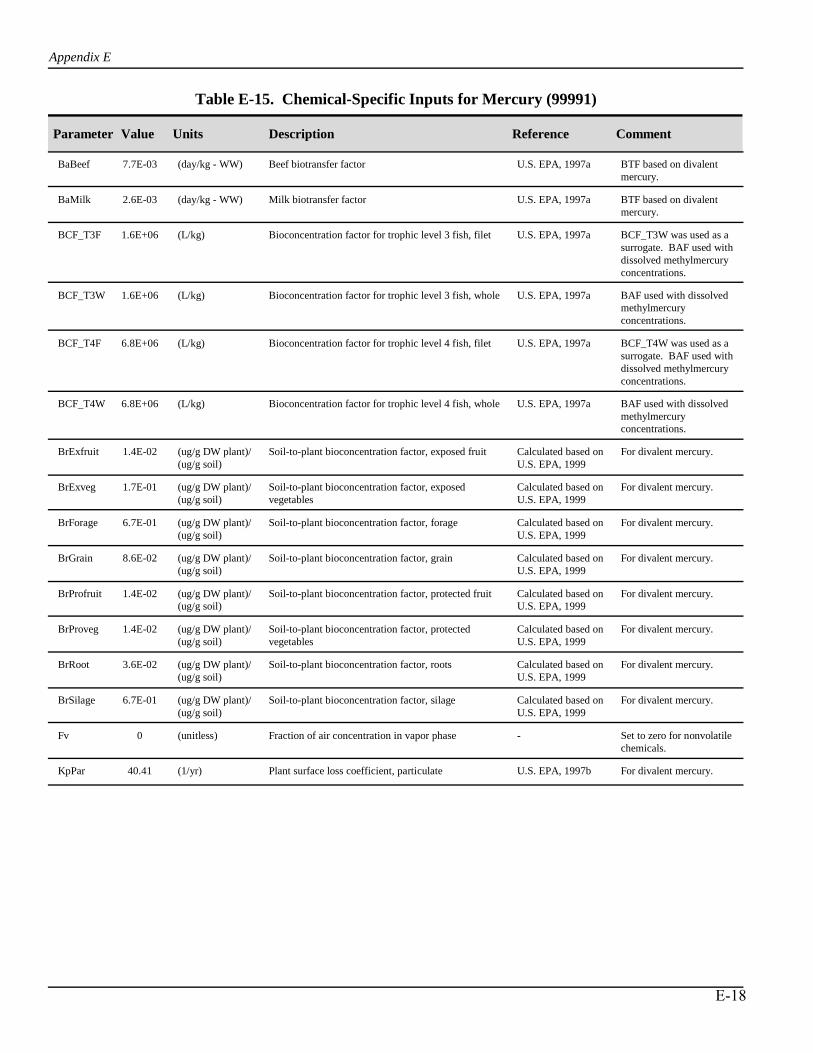
Table E-15. Chemical-Specific Inputs for Mercury (99991)
Parameter Value Units Reference
Appendix E
CommentDescription
BaBeef 7.7E-03 (day/kg - WW) U.S. EPA, 1997a BTF based on divalent mercury.
Beef biotransfer factor
BaMilk 2.6E-03 (day/kg - WW) U.S. EPA, 1997a BTF based on divalent mercury.
Milk biotransfer factor
BCF_T3F 1.6E+06 (L/kg) U.S. EPA, 1997a BCF_T3W was used as a surrogate. BAF used with dissolved methylmercury concentrations.
Bioconcentration factor for trophic level 3 fish, filet
BCF_T3W 1.6E+06 (L/kg) U.S. EPA, 1997a BAF used with dissolved methylmercury concentrations.
Bioconcentration factor for trophic level 3 fish, whole
BCF_T4F 6.8E+06 (L/kg) U.S. EPA, 1997a BCF_T4W was used as a surrogate. BAF used with dissolved methylmercury concentrations.
Bioconcentration factor for trophic level 4 fish, filet
BCF_T4W 6.8E+06 (L/kg) U.S. EPA, 1997a BAF used with dissolved methylmercury concentrations.
Bioconcentration factor for trophic level 4 fish, whole
BrExfruit 1.4E-02 (ug/g DW plant)/ (ug/g soil)
Calculated based on U.S. EPA, 1999
For divalent mercury.Soil-to-plant bioconcentration factor, exposed fruit
BrExveg 1.7E-01 (ug/g DW plant)/ (ug/g soil)
Calculated based on U.S. EPA, 1999
For divalent mercury.Soil-to-plant bioconcentration factor, exposed vegetables
BrForage 6.7E-01 (ug/g DW plant)/ (ug/g soil)
Calculated based on U.S. EPA, 1999
For divalent mercury.Soil-to-plant bioconcentration factor, forage
BrGrain 8.6E-02 (ug/g DW plant)/ (ug/g soil)
Calculated based on U.S. EPA, 1999
For divalent mercury.Soil-to-plant bioconcentration factor, grain
BrProfruit 1.4E-02 (ug/g DW plant)/ (ug/g soil)
Calculated based on U.S. EPA, 1999
For divalent mercury.Soil-to-plant bioconcentration factor, protected fruit
BrProveg 1.4E-02 (ug/g DW plant)/ (ug/g soil)
Calculated based on U.S. EPA, 1999
For divalent mercury.Soil-to-plant bioconcentration factor, protected vegetables
BrRoot 3.6E-02 (ug/g DW plant)/ (ug/g soil)
Calculated based on U.S. EPA, 1999
For divalent mercury.Soil-to-plant bioconcentration factor, roots
BrSilage 6.7E-01 (ug/g DW plant)/ (ug/g soil)
Calculated based on U.S. EPA, 1999
For divalent mercury.Soil-to-plant bioconcentration factor, silage
Fv 0 (unitless) - Set to zero for nonvolatile chemicals.
Fraction of air concentration in vapor phase
KpPar 40.41 (1/yr) U.S. EPA, 1997b For divalent mercury.Plant surface loss coefficient, particulate
E-18
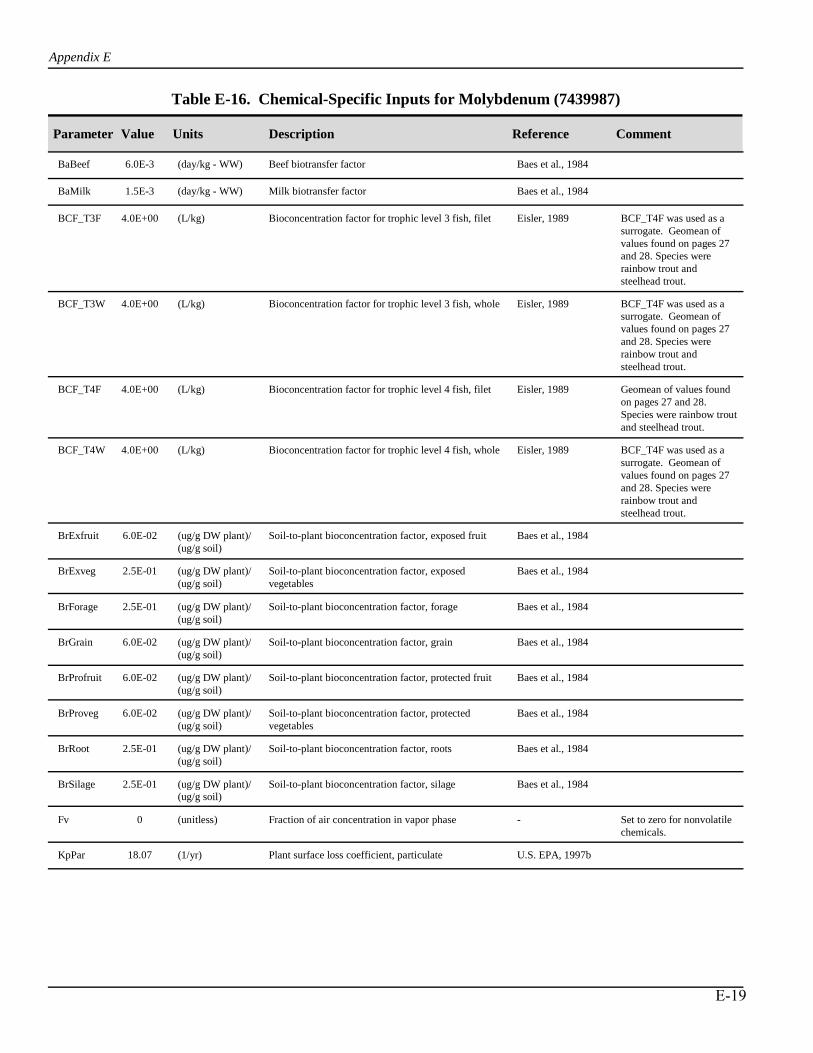
Table E-16. Chemical-Specific Inputs for Molybdenum (7439987)
Parameter Value Units Reference
Appendix E
CommentDescription
BaBeef 6.0E-3 (day/kg - WW) Baes et al., 1984Beef biotransfer factor
BaMilk 1.5E-3 (day/kg - WW) Baes et al., 1984Milk biotransfer factor
BCF_T3F 4.0E+00 (L/kg) Eisler, 1989 BCF_T4F was used as a surrogate. Geomean of values found on pages 27 and 28. Species were rainbow trout and steelhead trout.
Bioconcentration factor for trophic level 3 fish, filet
BCF_T3W 4.0E+00 (L/kg) Eisler, 1989 BCF_T4F was used as a surrogate. Geomean of values found on pages 27 and 28. Species were rainbow trout and steelhead trout.
Bioconcentration factor for trophic level 3 fish, whole
BCF_T4F 4.0E+00 (L/kg) Eisler, 1989 Geomean of values found on pages 27 and 28. Species were rainbow trout and steelhead trout.
Bioconcentration factor for trophic level 4 fish, filet
BCF_T4W 4.0E+00 (L/kg) Eisler, 1989 BCF_T4F was used as a surrogate. Geomean of values found on pages 27 and 28. Species were rainbow trout and steelhead trout.
Bioconcentration factor for trophic level 4 fish, whole
BrExfruit 6.0E-02 (ug/g DW plant)/ (ug/g soil)
Baes et al., 1984Soil-to-plant bioconcentration factor, exposed fruit
BrExveg 2.5E-01 (ug/g DW plant)/ (ug/g soil)
Baes et al., 1984Soil-to-plant bioconcentration factor, exposed vegetables
BrForage 2.5E-01 (ug/g DW plant)/ (ug/g soil)
Baes et al., 1984Soil-to-plant bioconcentration factor, forage
BrGrain 6.0E-02 (ug/g DW plant)/ (ug/g soil)
Baes et al., 1984Soil-to-plant bioconcentration factor, grain
BrProfruit 6.0E-02 (ug/g DW plant)/ (ug/g soil)
Baes et al., 1984Soil-to-plant bioconcentration factor, protected fruit
BrProveg 6.0E-02 (ug/g DW plant)/ (ug/g soil)
Baes et al., 1984Soil-to-plant bioconcentration factor, protected vegetables
BrRoot 2.5E-01 (ug/g DW plant)/ (ug/g soil)
Baes et al., 1984Soil-to-plant bioconcentration factor, roots
BrSilage 2.5E-01 (ug/g DW plant)/ (ug/g soil)
Baes et al., 1984Soil-to-plant bioconcentration factor, silage
Fv 0 (unitless) - Set to zero for nonvolatile chemicals.
Fraction of air concentration in vapor phase
KpPar 18.07 (1/yr) U.S. EPA, 1997bPlant surface loss coefficient, particulate
E-19
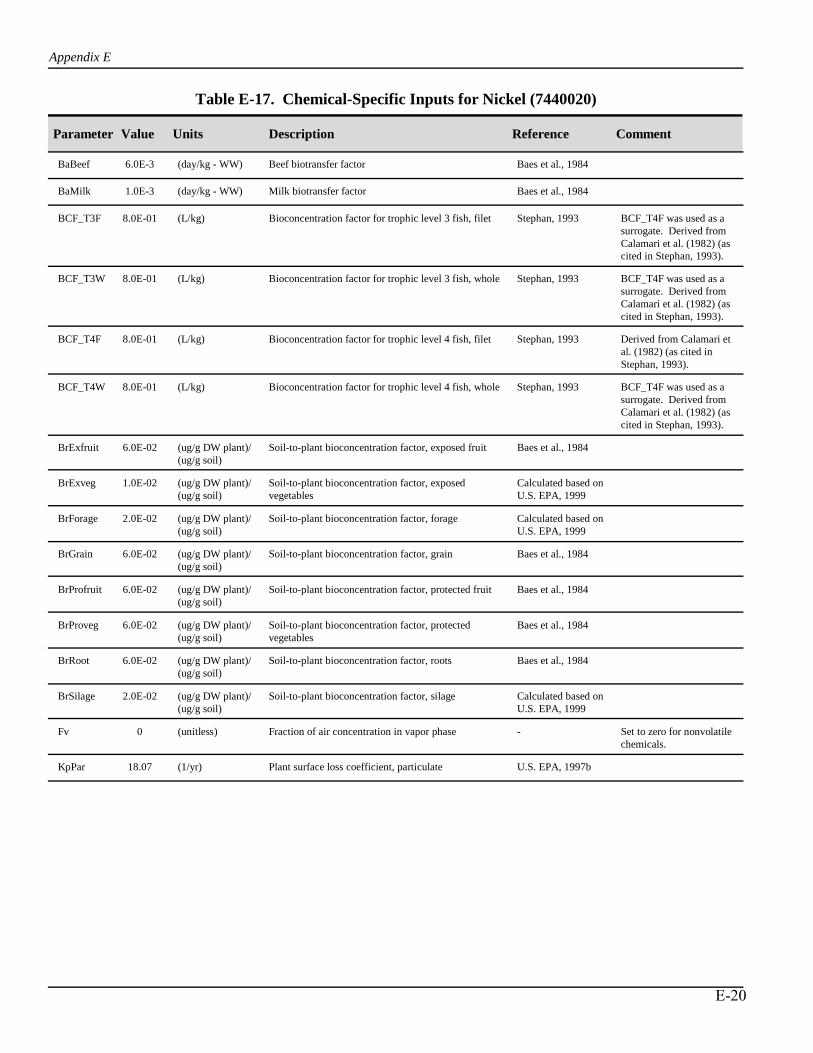
Table E-17. Chemical-Specific Inputs for Nickel (7440020)
Parameter Value Units Reference
Appendix E
CommentDescription
BaBeef 6.0E-3 (day/kg - WW) Baes et al., 1984Beef biotransfer factor
BaMilk 1.0E-3 (day/kg - WW) Baes et al., 1984Milk biotransfer factor
BCF_T3F 8.0E-01 (L/kg) Stephan, 1993 BCF_T4F was used as a surrogate. Derived from Calamari et al. (1982) (as cited in Stephan, 1993).
Bioconcentration factor for trophic level 3 fish, filet
BCF_T3W 8.0E-01 (L/kg) Stephan, 1993 BCF_T4F was used as a surrogate. Derived from Calamari et al. (1982) (as cited in Stephan, 1993).
Bioconcentration factor for trophic level 3 fish, whole
BCF_T4F 8.0E-01 (L/kg) Stephan, 1993 Derived from Calamari et al. (1982) (as cited in Stephan, 1993).
Bioconcentration factor for trophic level 4 fish, filet
BCF_T4W 8.0E-01 (L/kg) Stephan, 1993 BCF_T4F was used as a surrogate. Derived from Calamari et al. (1982) (as cited in Stephan, 1993).
Bioconcentration factor for trophic level 4 fish, whole
BrExfruit 6.0E-02 (ug/g DW plant)/ (ug/g soil)
Baes et al., 1984Soil-to-plant bioconcentration factor, exposed fruit
BrExveg 1.0E-02 (ug/g DW plant)/ (ug/g soil)
Calculated based on U.S. EPA, 1999
Soil-to-plant bioconcentration factor, exposed vegetables
BrForage 2.0E-02 (ug/g DW plant)/ (ug/g soil)
Calculated based on U.S. EPA, 1999
Soil-to-plant bioconcentration factor, forage
BrGrain 6.0E-02 (ug/g DW plant)/ (ug/g soil)
Baes et al., 1984Soil-to-plant bioconcentration factor, grain
BrProfruit 6.0E-02 (ug/g DW plant)/ (ug/g soil)
Baes et al., 1984Soil-to-plant bioconcentration factor, protected fruit
BrProveg 6.0E-02 (ug/g DW plant)/ (ug/g soil)
Baes et al., 1984Soil-to-plant bioconcentration factor, protected vegetables
BrRoot 6.0E-02 (ug/g DW plant)/ (ug/g soil)
Baes et al., 1984Soil-to-plant bioconcentration factor, roots
BrSilage 2.0E-02 (ug/g DW plant)/ (ug/g soil)
Calculated based on U.S. EPA, 1999
Soil-to-plant bioconcentration factor, silage
Fv 0 (unitless) - Set to zero for nonvolatile chemicals.
Fraction of air concentration in vapor phase
KpPar 18.07 (1/yr) U.S. EPA, 1997bPlant surface loss coefficient, particulate
E-20
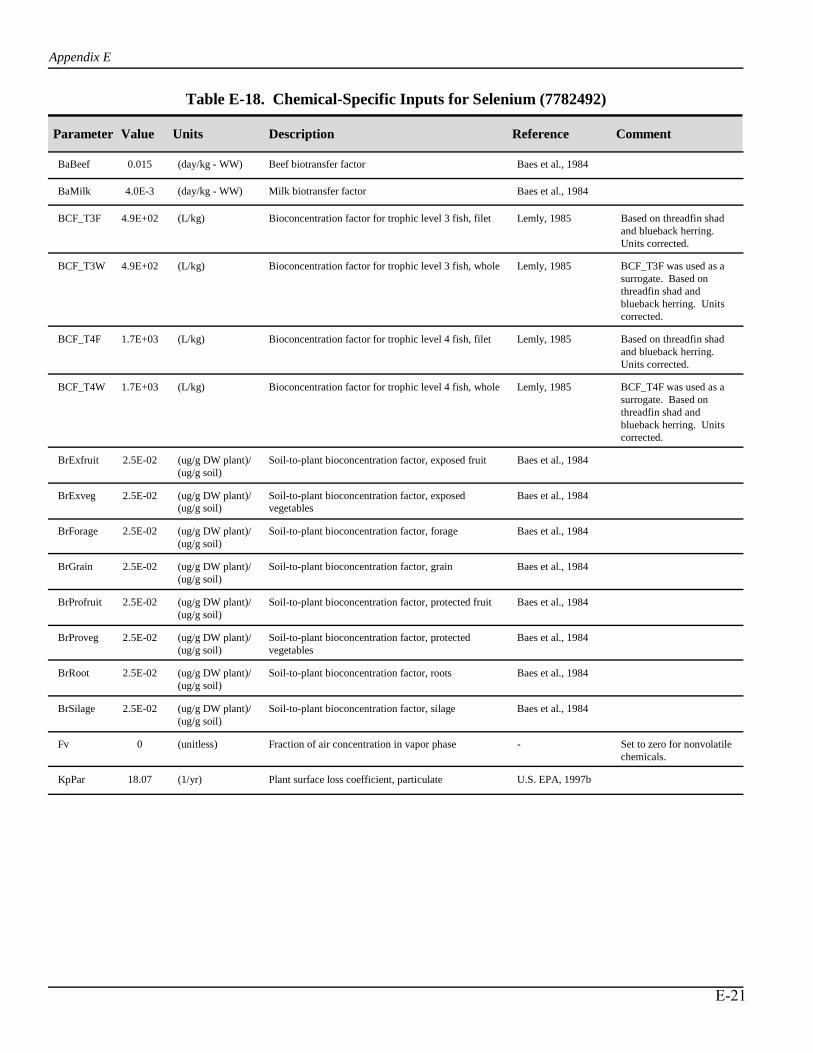
Table E-18. Chemical-Specific Inputs for Selenium (7782492)
Parameter Value Units Reference
Appendix E
CommentDescription
BaBeef 0.015 (day/kg - WW) Baes et al., 1984Beef biotransfer factor
BaMilk 4.0E-3 (day/kg - WW) Baes et al., 1984Milk biotransfer factor
BCF_T3F 4.9E+02 (L/kg) Lemly, 1985 Based on threadfin shad and blueback herring. Units corrected.
Bioconcentration factor for trophic level 3 fish, filet
BCF_T3W 4.9E+02 (L/kg) Lemly, 1985 BCF_T3F was used as a surrogate. Based on threadfin shad and blueback herring. Units corrected.
Bioconcentration factor for trophic level 3 fish, whole
BCF_T4F 1.7E+03 (L/kg) Lemly, 1985 Based on threadfin shad and blueback herring. Units corrected.
Bioconcentration factor for trophic level 4 fish, filet
BCF_T4W 1.7E+03 (L/kg) Lemly, 1985 BCF_T4F was used as a surrogate. Based on threadfin shad and blueback herring. Units corrected.
Bioconcentration factor for trophic level 4 fish, whole
BrExfruit 2.5E-02 (ug/g DW plant)/ (ug/g soil)
Baes et al., 1984Soil-to-plant bioconcentration factor, exposed fruit
BrExveg 2.5E-02 (ug/g DW plant)/ (ug/g soil)
Baes et al., 1984Soil-to-plant bioconcentration factor, exposed vegetables
BrForage 2.5E-02 (ug/g DW plant)/ (ug/g soil)
Baes et al., 1984Soil-to-plant bioconcentration factor, forage
BrGrain 2.5E-02 (ug/g DW plant)/ (ug/g soil)
Baes et al., 1984Soil-to-plant bioconcentration factor, grain
BrProfruit 2.5E-02 (ug/g DW plant)/ (ug/g soil)
Baes et al., 1984Soil-to-plant bioconcentration factor, protected fruit
BrProveg 2.5E-02 (ug/g DW plant)/ (ug/g soil)
Baes et al., 1984Soil-to-plant bioconcentration factor, protected vegetables
BrRoot 2.5E-02 (ug/g DW plant)/ (ug/g soil)
Baes et al., 1984Soil-to-plant bioconcentration factor, roots
BrSilage 2.5E-02 (ug/g DW plant)/ (ug/g soil)
Baes et al., 1984Soil-to-plant bioconcentration factor, silage
Fv 0 (unitless) - Set to zero for nonvolatile chemicals.
Fraction of air concentration in vapor phase
KpPar 18.07 (1/yr) U.S. EPA, 1997bPlant surface loss coefficient, particulate
E-21
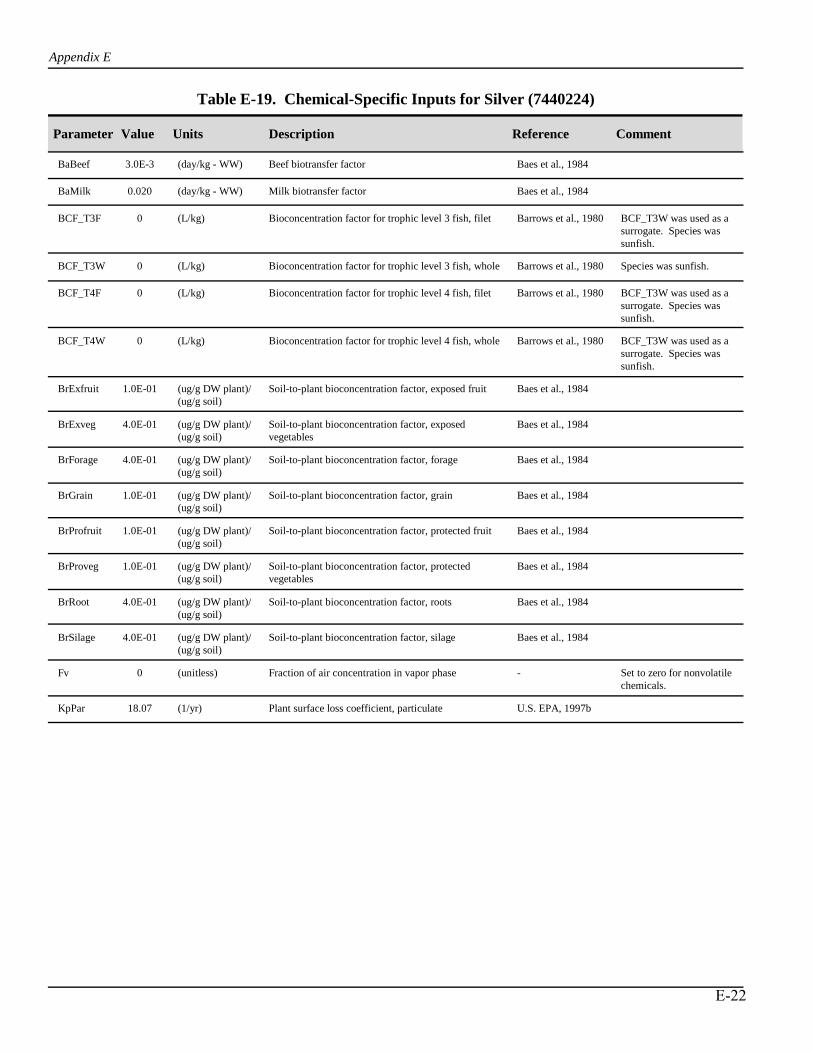
Table E-19. Chemical-Specific Inputs for Silver (7440224)
Parameter Value Units Reference
Appendix E
CommentDescription
BaBeef 3.0E-3 (day/kg - WW) Baes et al., 1984Beef biotransfer factor
BaMilk 0.020 (day/kg - WW) Baes et al., 1984Milk biotransfer factor
BCF_T3F 0 (L/kg) Barrows et al., 1980 BCF_T3W was used as a surrogate. Species was sunfish.
Bioconcentration factor for trophic level 3 fish, filet
BCF_T3W 0 (L/kg) Barrows et al., 1980 Species was sunfish.Bioconcentration factor for trophic level 3 fish, whole
BCF_T4F 0 (L/kg) Barrows et al., 1980 BCF_T3W was used as a surrogate. Species was sunfish.
Bioconcentration factor for trophic level 4 fish, filet
BCF_T4W 0 (L/kg) Barrows et al., 1980 BCF_T3W was used as a surrogate. Species was sunfish.
Bioconcentration factor for trophic level 4 fish, whole
BrExfruit 1.0E-01 (ug/g DW plant)/ (ug/g soil)
Baes et al., 1984Soil-to-plant bioconcentration factor, exposed fruit
BrExveg 4.0E-01 (ug/g DW plant)/ (ug/g soil)
Baes et al., 1984Soil-to-plant bioconcentration factor, exposed vegetables
BrForage 4.0E-01 (ug/g DW plant)/ (ug/g soil)
Baes et al., 1984Soil-to-plant bioconcentration factor, forage
BrGrain 1.0E-01 (ug/g DW plant)/ (ug/g soil)
Baes et al., 1984Soil-to-plant bioconcentration factor, grain
BrProfruit 1.0E-01 (ug/g DW plant)/ (ug/g soil)
Baes et al., 1984Soil-to-plant bioconcentration factor, protected fruit
BrProveg 1.0E-01 (ug/g DW plant)/ (ug/g soil)
Baes et al., 1984Soil-to-plant bioconcentration factor, protected vegetables
BrRoot 4.0E-01 (ug/g DW plant)/ (ug/g soil)
Baes et al., 1984Soil-to-plant bioconcentration factor, roots
BrSilage 4.0E-01 (ug/g DW plant)/ (ug/g soil)
Baes et al., 1984Soil-to-plant bioconcentration factor, silage
Fv 0 (unitless) - Set to zero for nonvolatile chemicals.
Fraction of air concentration in vapor phase
KpPar 18.07 (1/yr) U.S. EPA, 1997bPlant surface loss coefficient, particulate
E-22
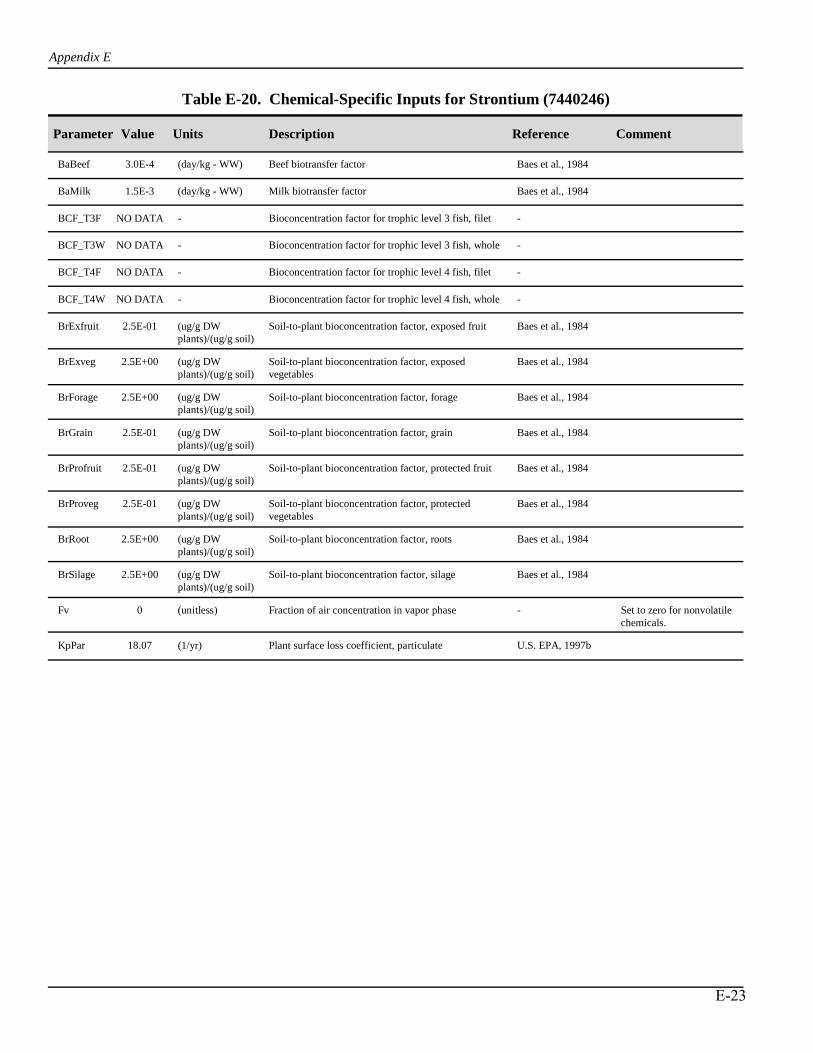
Table E-20. Chemical-Specific Inputs for Strontium (7440246)
Parameter Value Units Reference
Appendix E
CommentDescription
BaBeef 3.0E-4 (day/kg - WW) Baes et al., 1984Beef biotransfer factor
BaMilk 1.5E-3 (day/kg - WW) Baes et al., 1984Milk biotransfer factor
BCF_T3F NO DATA - -Bioconcentration factor for trophic level 3 fish, filet
BCF_T3W NO DATA - -Bioconcentration factor for trophic level 3 fish, whole
BCF_T4F NO DATA - -Bioconcentration factor for trophic level 4 fish, filet
BCF_T4W NO DATA - -Bioconcentration factor for trophic level 4 fish, whole
BrExfruit 2.5E-01 (ug/g DW plants)/(ug/g soil)
Baes et al., 1984Soil-to-plant bioconcentration factor, exposed fruit
BrExveg 2.5E+00 (ug/g DW plants)/(ug/g soil)
Baes et al., 1984Soil-to-plant bioconcentration factor, exposed vegetables
BrForage 2.5E+00 (ug/g DW plants)/(ug/g soil)
Baes et al., 1984Soil-to-plant bioconcentration factor, forage
BrGrain 2.5E-01 (ug/g DW plants)/(ug/g soil)
Baes et al., 1984Soil-to-plant bioconcentration factor, grain
BrProfruit 2.5E-01 (ug/g DW plants)/(ug/g soil)
Baes et al., 1984Soil-to-plant bioconcentration factor, protected fruit
BrProveg 2.5E-01 (ug/g DW plants)/(ug/g soil)
Baes et al., 1984Soil-to-plant bioconcentration factor, protected vegetables
BrRoot 2.5E+00 (ug/g DW plants)/(ug/g soil)
Baes et al., 1984Soil-to-plant bioconcentration factor, roots
BrSilage 2.5E+00 (ug/g DW plants)/(ug/g soil)
Baes et al., 1984Soil-to-plant bioconcentration factor, silage
Fv 0 (unitless) - Set to zero for nonvolatile chemicals.
Fraction of air concentration in vapor phase
KpPar 18.07 (1/yr) U.S. EPA, 1997bPlant surface loss coefficient, particulate
E-23
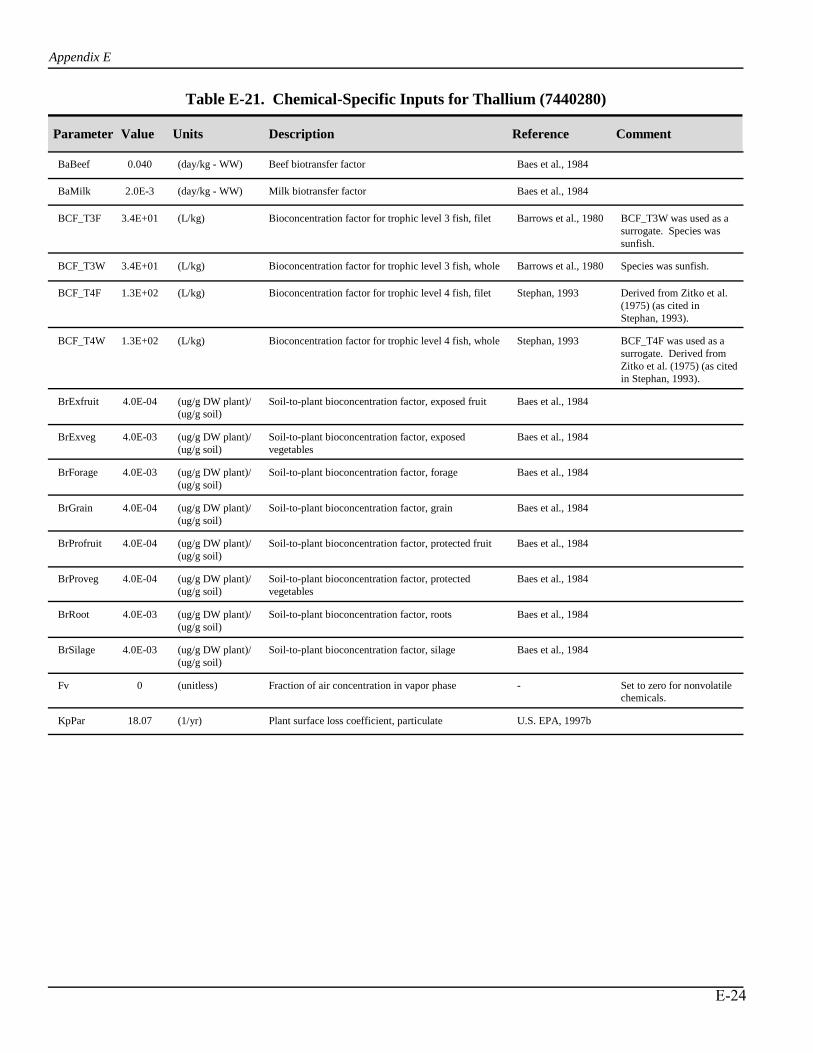
Table E-21. Chemical-Specific Inputs for Thallium (7440280)
Parameter Value Units Reference
Appendix E
CommentDescription
BaBeef 0.040 (day/kg - WW) Baes et al., 1984Beef biotransfer factor
BaMilk 2.0E-3 (day/kg - WW) Baes et al., 1984Milk biotransfer factor
BCF_T3F 3.4E+01 (L/kg) Barrows et al., 1980 BCF_T3W was used as a surrogate. Species was sunfish.
Bioconcentration factor for trophic level 3 fish, filet
BCF_T3W 3.4E+01 (L/kg) Barrows et al., 1980 Species was sunfish.Bioconcentration factor for trophic level 3 fish, whole
BCF_T4F 1.3E+02 (L/kg) Stephan, 1993 Derived from Zitko et al. (1975) (as cited in Stephan, 1993).
Bioconcentration factor for trophic level 4 fish, filet
BCF_T4W 1.3E+02 (L/kg) Stephan, 1993 BCF_T4F was used as a surrogate. Derived from Zitko et al. (1975) (as cited in Stephan, 1993).
Bioconcentration factor for trophic level 4 fish, whole
BrExfruit 4.0E-04 (ug/g DW plant)/ (ug/g soil)
Baes et al., 1984Soil-to-plant bioconcentration factor, exposed fruit
BrExveg 4.0E-03 (ug/g DW plant)/ (ug/g soil)
Baes et al., 1984Soil-to-plant bioconcentration factor, exposed vegetables
BrForage 4.0E-03 (ug/g DW plant)/ (ug/g soil)
Baes et al., 1984Soil-to-plant bioconcentration factor, forage
BrGrain 4.0E-04 (ug/g DW plant)/ (ug/g soil)
Baes et al., 1984Soil-to-plant bioconcentration factor, grain
BrProfruit 4.0E-04 (ug/g DW plant)/ (ug/g soil)
Baes et al., 1984Soil-to-plant bioconcentration factor, protected fruit
BrProveg 4.0E-04 (ug/g DW plant)/ (ug/g soil)
Baes et al., 1984Soil-to-plant bioconcentration factor, protected vegetables
BrRoot 4.0E-03 (ug/g DW plant)/ (ug/g soil)
Baes et al., 1984Soil-to-plant bioconcentration factor, roots
BrSilage 4.0E-03 (ug/g DW plant)/ (ug/g soil)
Baes et al., 1984Soil-to-plant bioconcentration factor, silage
Fv 0 (unitless) - Set to zero for nonvolatile chemicals.
Fraction of air concentration in vapor phase
KpPar 18.07 (1/yr) U.S. EPA, 1997bPlant surface loss coefficient, particulate
E-24
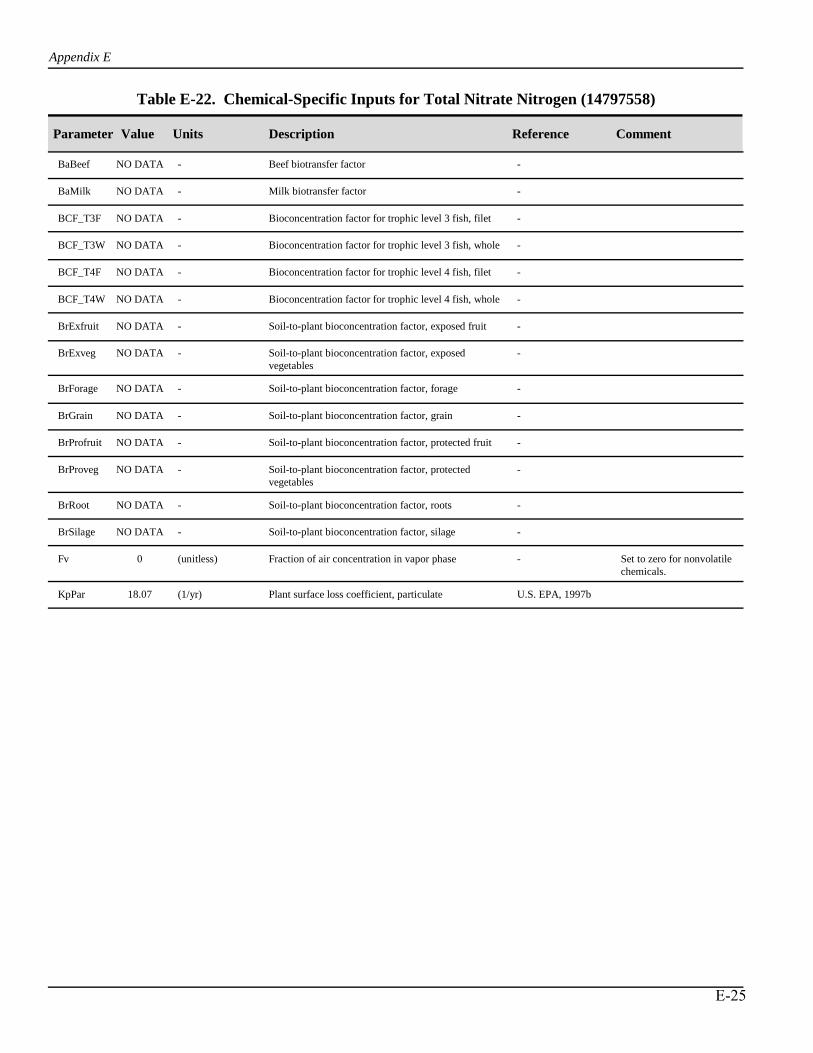
Table E-22. Chemical-Specific Inputs for Total Nitrate Nitrogen (14797558)
Parameter Value Units Reference
Appendix E
CommentDescription
BaBeef NO DATA - -Beef biotransfer factor
BaMilk NO DATA - -Milk biotransfer factor
BCF_T3F NO DATA - -Bioconcentration factor for trophic level 3 fish, filet
BCF_T3W NO DATA - -Bioconcentration factor for trophic level 3 fish, whole
BCF_T4F NO DATA - -Bioconcentration factor for trophic level 4 fish, filet
BCF_T4W NO DATA - -Bioconcentration factor for trophic level 4 fish, whole
BrExfruit NO DATA - -Soil-to-plant bioconcentration factor, exposed fruit
BrExveg NO DATA - -Soil-to-plant bioconcentration factor, exposed vegetables
BrForage NO DATA - -Soil-to-plant bioconcentration factor, forage
BrGrain NO DATA - -Soil-to-plant bioconcentration factor, grain
BrProfruit NO DATA - -Soil-to-plant bioconcentration factor, protected fruit
BrProveg NO DATA - -Soil-to-plant bioconcentration factor, protected vegetables
BrRoot NO DATA - -Soil-to-plant bioconcentration factor, roots
BrSilage NO DATA - -Soil-to-plant bioconcentration factor, silage
Fv 0 (unitless) - Set to zero for nonvolatile chemicals.
Fraction of air concentration in vapor phase
KpPar 18.07 (1/yr) U.S. EPA, 1997bPlant surface loss coefficient, particulate
E-25

Table E-23. Chemical-Specific Inputs for Total Nitrite Nitrogen (14797650)
Parameter Value Units Reference
Appendix E
CommentDescription
BaBeef NO DATA - -Beef biotransfer factor
BaMilk NO DATA - -Milk biotransfer factor
BCF_T3F NO DATA - -Bioconcentration factor for trophic level 3 fish, filet
BCF_T3W NO DATA - -Bioconcentration factor for trophic level 3 fish, whole
BCF_T4F NO DATA - -Bioconcentration factor for trophic level 4 fish, filet
BCF_T4W NO DATA - -Bioconcentration factor for trophic level 4 fish, whole
BrExfruit NO DATA - -Soil-to-plant bioconcentration factor, exposed fruit
BrExveg NO DATA - -Soil-to-plant bioconcentration factor, exposed vegetables
BrForage NO DATA - -Soil-to-plant bioconcentration factor, forage
BrGrain NO DATA - -Soil-to-plant bioconcentration factor, grain
BrProfruit NO DATA - -Soil-to-plant bioconcentration factor, protected fruit
BrProveg NO DATA - -Soil-to-plant bioconcentration factor, protected vegetables
BrRoot NO DATA - -Soil-to-plant bioconcentration factor, roots
BrSilage NO DATA - -Soil-to-plant bioconcentration factor, silage
Fv 0 (unitless) - Set to zero for nonvolatile chemicals.
Fraction of air concentration in vapor phase
KpPar 18.07 (1/yr) U.S. EPA, 1997bPlant surface loss coefficient, particulate
E-26

Table E-24. Chemical-Specific Inputs for Vanadium (7440622)
Parameter Value Units Reference
Appendix E
CommentDescription
BaBeef 2.5E-3 (day/kg - WW) Baes et al., 1984Beef biotransfer factor
BaMilk 2.0E-5 (day/kg - WW) Baes et al., 1984Milk biotransfer factor
BCF_T3F NO DATA - -Bioconcentration factor for trophic level 3 fish, filet
BCF_T3W NO DATA - -Bioconcentration factor for trophic level 3 fish, whole
BCF_T4F NO DATA - -Bioconcentration factor for trophic level 4 fish, filet
BCF_T4W NO DATA - -Bioconcentration factor for trophic level 4 fish, whole
BrExfruit 3.0E-03 (ug/g DW plants)/(ug/g soil)
Baes et al., 1984Soil-to-plant bioconcentration factor, exposed fruit
BrExveg 5.5E-03 (ug/g DW plants)/(ug/g soil)
Baes et al., 1984Soil-to-plant bioconcentration factor, exposed vegetables
BrForage 4.9E-03 (ug/g DW plant)/ (ug/g soil)
Calculated based on U.S. EPA, 1999
Soil-to-plant bioconcentration factor, forage
BrGrain 3.0E-03 (ug/g DW plants)/(ug/g soil)
Baes et al., 1984Soil-to-plant bioconcentration factor, grain
BrProfruit 3.0E-03 (ug/g DW plants)/(ug/g soil)
Baes et al., 1984Soil-to-plant bioconcentration factor, protected fruit
BrProveg 3.0E-03 (ug/g DW plants)/(ug/g soil)
Baes et al., 1984Soil-to-plant bioconcentration factor, protected vegetables
BrRoot 5.5E-03 (ug/g DW plants)/(ug/g soil)
Baes et al., 1984Soil-to-plant bioconcentration factor, roots
BrSilage 4.9E-03 (ug/g DW plant)/ (ug/g soil)
Calculated based on U.S. EPA, 1999
Soil-to-plant bioconcentration factor, silage
Fv 0 (unitless) - Set to zero for nonvolatile chemicals.
Fraction of air concentration in vapor phase
KpPar 18.07 (1/yr) U.S. EPA, 1997bPlant surface loss coefficient, particulate
E-27
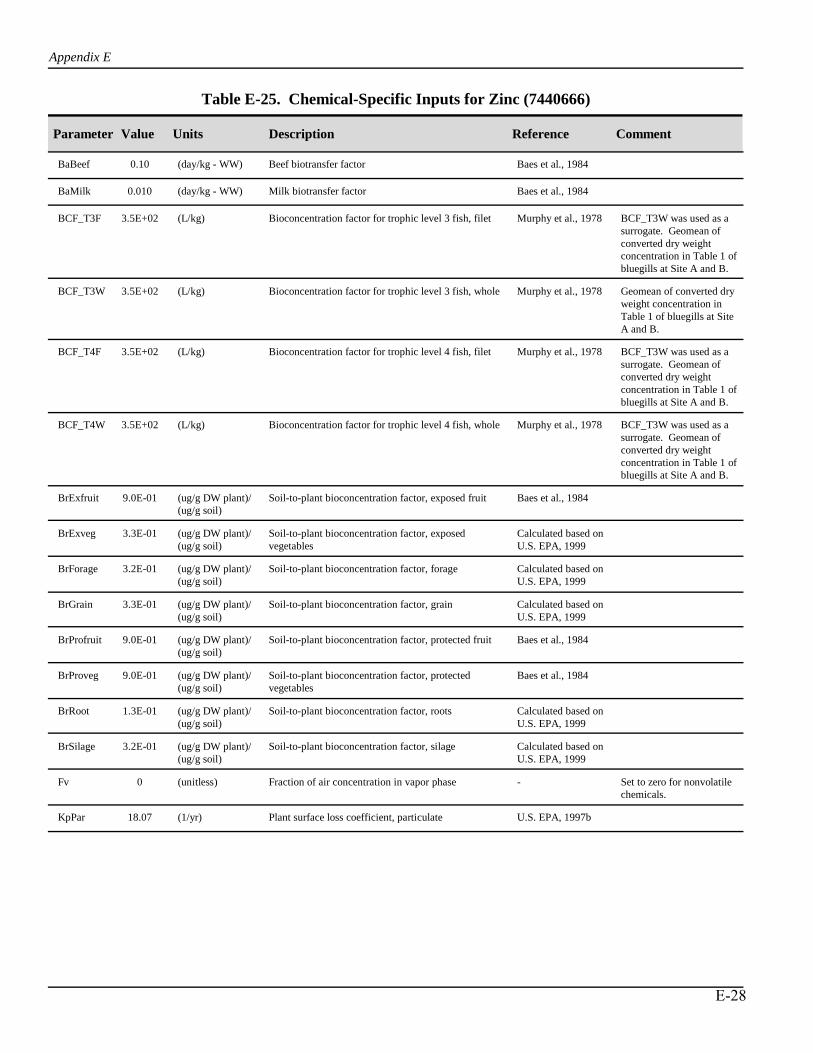
Table E-25. Chemical-Specific Inputs for Zinc (7440666)
Parameter Value Units Reference
Appendix E
CommentDescription
BaBeef 0.10 (day/kg - WW) Baes et al., 1984Beef biotransfer factor
BaMilk 0.010 (day/kg - WW) Baes et al., 1984Milk biotransfer factor
BCF_T3F 3.5E+02 (L/kg) Murphy et al., 1978 BCF_T3W was used as a surrogate. Geomean of converted dry weight concentration in Table 1 of bluegills at Site A and B.
Bioconcentration factor for trophic level 3 fish, filet
BCF_T3W 3.5E+02 (L/kg) Murphy et al., 1978 Geomean of converted dry weight concentration in Table 1 of bluegills at Site A and B.
Bioconcentration factor for trophic level 3 fish, whole
BCF_T4F 3.5E+02 (L/kg) Murphy et al., 1978 BCF_T3W was used as a surrogate. Geomean of converted dry weight concentration in Table 1 of bluegills at Site A and B.
Bioconcentration factor for trophic level 4 fish, filet
BCF_T4W 3.5E+02 (L/kg) Murphy et al., 1978 BCF_T3W was used as a surrogate. Geomean of converted dry weight concentration in Table 1 of bluegills at Site A and B.
Bioconcentration factor for trophic level 4 fish, whole
BrExfruit 9.0E-01 (ug/g DW plant)/ (ug/g soil)
Baes et al., 1984Soil-to-plant bioconcentration factor, exposed fruit
BrExveg 3.3E-01 (ug/g DW plant)/ (ug/g soil)
Calculated based on U.S. EPA, 1999
Soil-to-plant bioconcentration factor, exposed vegetables
BrForage 3.2E-01 (ug/g DW plant)/ (ug/g soil)
Calculated based on U.S. EPA, 1999
Soil-to-plant bioconcentration factor, forage
BrGrain 3.3E-01 (ug/g DW plant)/ (ug/g soil)
Calculated based on U.S. EPA, 1999
Soil-to-plant bioconcentration factor, grain
BrProfruit 9.0E-01 (ug/g DW plant)/ (ug/g soil)
Baes et al., 1984Soil-to-plant bioconcentration factor, protected fruit
BrProveg 9.0E-01 (ug/g DW plant)/ (ug/g soil)
Baes et al., 1984Soil-to-plant bioconcentration factor, protected vegetables
BrRoot 1.3E-01 (ug/g DW plant)/ (ug/g soil)
Calculated based on U.S. EPA, 1999
Soil-to-plant bioconcentration factor, roots
BrSilage 3.2E-01 (ug/g DW plant)/ (ug/g soil)
Calculated based on U.S. EPA, 1999
Soil-to-plant bioconcentration factor, silage
Fv 0 (unitless) - Set to zero for nonvolatile chemicals.
Fraction of air concentration in vapor phase
KpPar 18.07 (1/yr) U.S. EPA, 1997bPlant surface loss coefficient, particulate
E-28
Appendix E
E-29
References
Baes, C.F., III, R.D. Sharp, A.L. Sjoreen, and R.W. Shor. 1984. A Review and Analysis ofParameters for Assessing Transport of Environmentally Released Radionuclides ThroughAgriculture. ORNL-5786. Oak Ridge National Laboratory, Oak Ridge, TN. September.
Barrows, M.E., S.R. Petrocelli, K.J. Macek, and J.J. Carroll. 1980. Chapter 24: Bioconcentrationand elimination of selected water pollutants by bluegill sunfish (Lepomis macrochirus). In: Dynamics, Exposure and Hazard Assessment of Toxic Chemicals, R. Haque (ed.), AnnArbor Science Publishers Inc., Ann Arbor, MI. pp. 379-392.
Eisler, R. 1989. Molybdenum Hazards to Fish, Wildlife, and Invertebrates: A Synoptic Review.Contaminant Hazard Reviews, Report No. 19, Biological Report 85(1.19). Laurel, MD.August.
Kumada, H., S. Kimura, M. Yokote, and Y. Matida. 1972. Acute and chronic toxicity, uptake, andretention of cadmium in freshwater organisms. Bulletin of Freshwater Fisheries ResearchLaboratory 22(2):157-165. December 20.
Lemly, A.D. 1985. Toxicology of selenium in a freshwater reservoir: Implications for environmentalhazard evaluation and safety. Ecotoxicology and Environmental Safety 10:314-338.
Murphy, B.R., G.J. Atchison, and A.W. McIntosh. 1978. Cadmium and zinc in muscle of bluegill(Lepomis macrochirus) and largemouth bass (Micropterus salmoides) from an industriallycontaminated lake. Environmental Pollution 17:253-257.
Stephan, C.E. 1993. Derivation of Proposed Human Health and Wildlife BioaccumulationFactors for the Great Lakes Initiative (Draft). PB93-154672. Environmental ResearchLaboratory, Office of Research and Development, Duluth, MN. March.
U.S. EPA (Environmental Protection Agency). 1997a. Mercury Study Report to Congress. VolumeIII - Fate and Transport of Mercury in the Environment. EPA 452/R-97/005. Office of AirQuality Planning and Standards and Office of Research and Development, Washington, DC.
U.S. EPA (Environmental Protection Agency). 1997b. The Parameter Guidance Document. ACompanion Document to the Methodology for Assessing Health Risks Associated withMultiple Pathways Exposure to Combustor Emissions (Internal Draft). NCEA-0238. National Center for Environmental Assessment, Cincinnati, OH. March.
U.S. EPA (Environmental Protection Agency). 1999. Estimating Risk from the Use of AgriculturalFertilizers (Draft Report). Office of Solid Waste, Washington, DC. August. Web site athttp://www.epa.gov/epaoswer/hazwaste/recycle/fertiliz/risk/index.htm.

Appendix F
Biota Factors

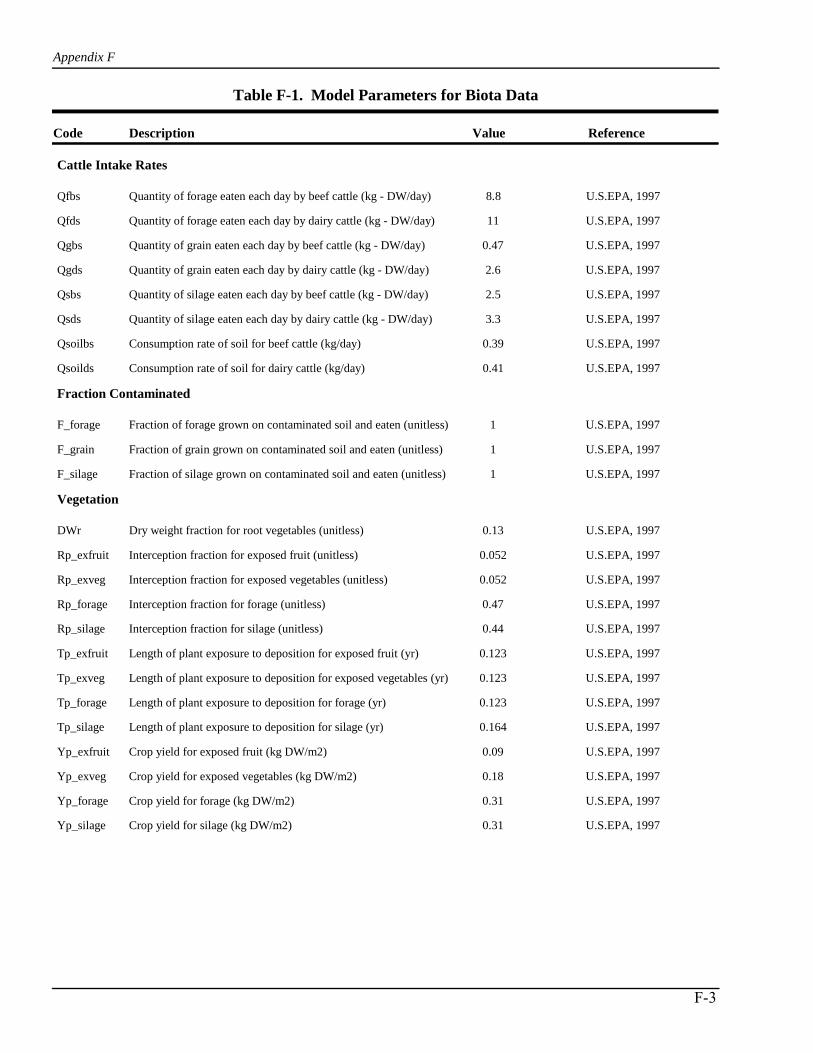
Code Description Value
Appendix F
Table F-1. Model Parameters for Biota Data
Reference
Cattle Intake Rates
Qfbs Quantity of forage eaten each day by beef cattle (kg - DW/day) 8.8 U.S.EPA, 1997
Qfds Quantity of forage eaten each day by dairy cattle (kg - DW/day) 11 U.S.EPA, 1997
Qgbs Quantity of grain eaten each day by beef cattle (kg - DW/day) 0.47 U.S.EPA, 1997
Qgds Quantity of grain eaten each day by dairy cattle (kg - DW/day) 2.6 U.S.EPA, 1997
Qsbs Quantity of silage eaten each day by beef cattle (kg - DW/day) 2.5 U.S.EPA, 1997
Qsds Quantity of silage eaten each day by dairy cattle (kg - DW/day) 3.3 U.S.EPA, 1997
Qsoilbs Consumption rate of soil for beef cattle (kg/day) 0.39 U.S.EPA, 1997
Qsoilds Consumption rate of soil for dairy cattle (kg/day) 0.41 U.S.EPA, 1997
Fraction Contaminated
F_forage Fraction of forage grown on contaminated soil and eaten (unitless) 1 U.S.EPA, 1997
F_grain Fraction of grain grown on contaminated soil and eaten (unitless) 1 U.S.EPA, 1997
F_silage Fraction of silage grown on contaminated soil and eaten (unitless) 1 U.S.EPA, 1997
Vegetation
DWr Dry weight fraction for root vegetables (unitless) 0.13 U.S.EPA, 1997
Rp_exfruit Interception fraction for exposed fruit (unitless) 0.052 U.S.EPA, 1997
Rp_exveg Interception fraction for exposed vegetables (unitless) 0.052 U.S.EPA, 1997
Rp_forage Interception fraction for forage (unitless) 0.47 U.S.EPA, 1997
Rp_silage Interception fraction for silage (unitless) 0.44 U.S.EPA, 1997
Tp_exfruit Length of plant exposure to deposition for exposed fruit (yr) 0.123 U.S.EPA, 1997
Tp_exveg Length of plant exposure to deposition for exposed vegetables (yr) 0.123 U.S.EPA, 1997
Tp_forage Length of plant exposure to deposition for forage (yr) 0.123 U.S.EPA, 1997
Tp_silage Length of plant exposure to deposition for silage (yr) 0.164 U.S.EPA, 1997
Yp_exfruit Crop yield for exposed fruit (kg DW/m2) 0.09 U.S.EPA, 1997
Yp_exveg Crop yield for exposed vegetables (kg DW/m2) 0.18 U.S.EPA, 1997
Yp_forage Crop yield for forage (kg DW/m2) 0.31 U.S.EPA, 1997
Yp_silage Crop yield for silage (kg DW/m2) 0.31 U.S.EPA, 1997
F-3

Appendix F
F-4
References
U.S. EPA (Environmental Protection Agency). 1997. The Parameter Guidance Document. ACompanion Document to the Methodology for Assessing Health Risks Associated withMultiple Pathways Exposure to Combustor Emissions (Internal Draft). NCEA-0238. National Center for Environmental Assessment, Cincinnati, OH, pp. 1-281. March.

Appendix G
Human Exposure Factors


Appendix G August 2002
G-3
Appendix G
Human Exposure Factors
Exposure factors are data that quantify human behavior patterns (e.g., ingestion rates of beefand fruit) and characteristics (e.g., body weight) that affect their exposure to environmentalcontaminants. These data can be used to construct realistic assumptions concerning an individual’sexposure to and subsequent intake of a contaminant in the environment. The exposure factors data alsoenable the U.S. Environmental Protection Agency (EPA) to determine the exposures of individuals whohave different lifestyles (e.g., a resident vs. a farmer, and a child vs. an adult).
Most human exposure factors used in the fossil fuel combustion waste (FFCW) screeninganalysis are based on national data provided in EPA’s Exposure Factors Handbook (EFH) (U.S.EPA, 1997a, 1997b, 1997c). The EFH summarizes data from relevant studies and providesrecommendations and associated confidence estimates on the values of exposure factors. The mainsources of information on food consumption rates are the U.S. Department of Agriculture (USDA)Nationwide Food Consumption Survey (NFCS) and the USDA Continuing Survey of Food Intakes byIndividuals (CSFII). EPA used data from the NFCS to generate consumer-only and per capita intakerates for various food items and food groups, and data from the CSFII to generate per capita intakerates (U.S. EPA, 1997b).
The exposure factors parameters used in the deterministic fossil fuel combustion waste(FFCW) screening analysis are summarized in Tables G-1a and G-1b.
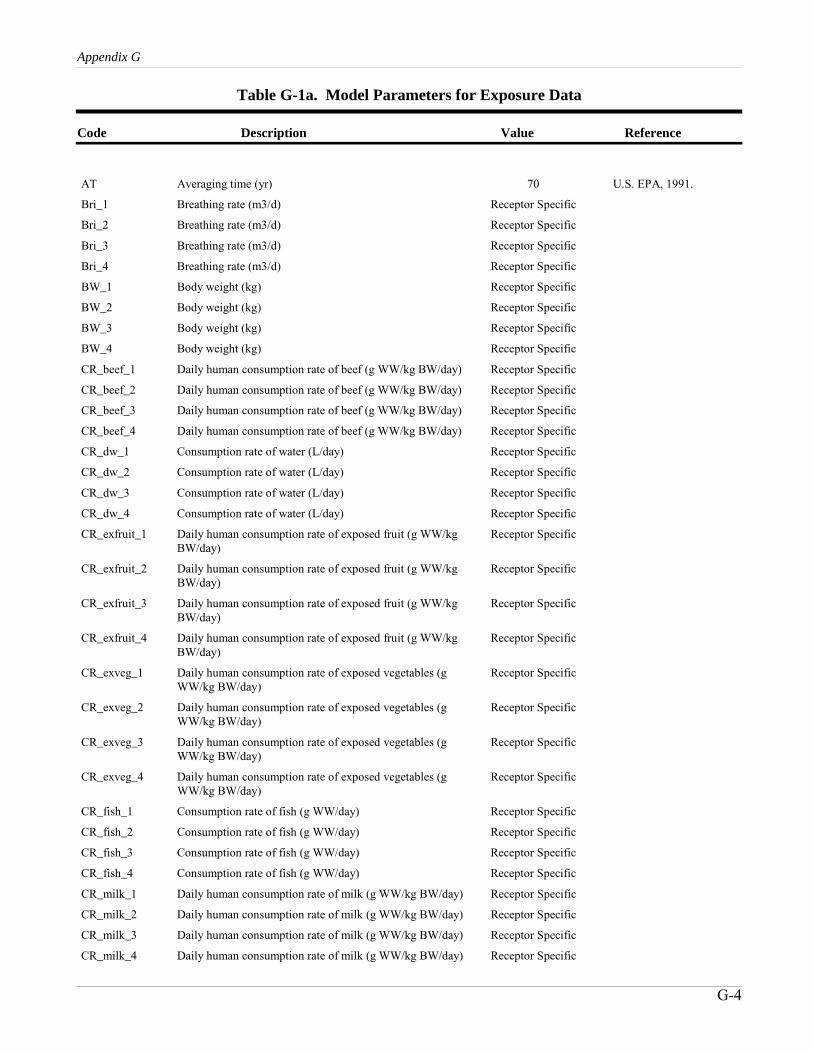
Code Description Value
Appendix G
Table G-1a. Model Parameters for Exposure Data
Reference
AT Averaging time (yr) 70 U.S. EPA, 1991.
Bri_1 Breathing rate (m3/d) Receptor Specific
Bri_2 Breathing rate (m3/d) Receptor Specific
Bri_3 Breathing rate (m3/d) Receptor Specific
Bri_4 Breathing rate (m3/d) Receptor Specific
BW_1 Body weight (kg) Receptor Specific
BW_2 Body weight (kg) Receptor Specific
BW_3 Body weight (kg) Receptor Specific
BW_4 Body weight (kg) Receptor Specific
CR_beef_1 Daily human consumption rate of beef (g WW/kg BW/day) Receptor Specific
CR_beef_2 Daily human consumption rate of beef (g WW/kg BW/day) Receptor Specific
CR_beef_3 Daily human consumption rate of beef (g WW/kg BW/day) Receptor Specific
CR_beef_4 Daily human consumption rate of beef (g WW/kg BW/day) Receptor Specific
CR_dw_1 Consumption rate of water (L/day) Receptor Specific
CR_dw_2 Consumption rate of water (L/day) Receptor Specific
CR_dw_3 Consumption rate of water (L/day) Receptor Specific
CR_dw_4 Consumption rate of water (L/day) Receptor Specific
CR_exfruit_1 Daily human consumption rate of exposed fruit (g WW/kgBW/day)
Receptor Specific
CR_exfruit_2 Daily human consumption rate of exposed fruit (g WW/kgBW/day)
Receptor Specific
CR_exfruit_3 Daily human consumption rate of exposed fruit (g WW/kgBW/day)
Receptor Specific
CR_exfruit_4 Daily human consumption rate of exposed fruit (g WW/kgBW/day)
Receptor Specific
CR_exveg_1 Daily human consumption rate of exposed vegetables (gWW/kg BW/day)
Receptor Specific
CR_exveg_2 Daily human consumption rate of exposed vegetables (gWW/kg BW/day)
Receptor Specific
CR_exveg_3 Daily human consumption rate of exposed vegetables (gWW/kg BW/day)
Receptor Specific
CR_exveg_4 Daily human consumption rate of exposed vegetables (gWW/kg BW/day)
Receptor Specific
CR_fish_1 Consumption rate of fish (g WW/day) Receptor Specific
CR_fish_2 Consumption rate of fish (g WW/day) Receptor Specific
CR_fish_3 Consumption rate of fish (g WW/day) Receptor Specific
CR_fish_4 Consumption rate of fish (g WW/day) Receptor Specific
CR_milk_1 Daily human consumption rate of milk (g WW/kg BW/day) Receptor Specific
CR_milk_2 Daily human consumption rate of milk (g WW/kg BW/day) Receptor Specific
CR_milk_3 Daily human consumption rate of milk (g WW/kg BW/day) Receptor Specific
CR_milk_4 Daily human consumption rate of milk (g WW/kg BW/day) Receptor Specific
G-4
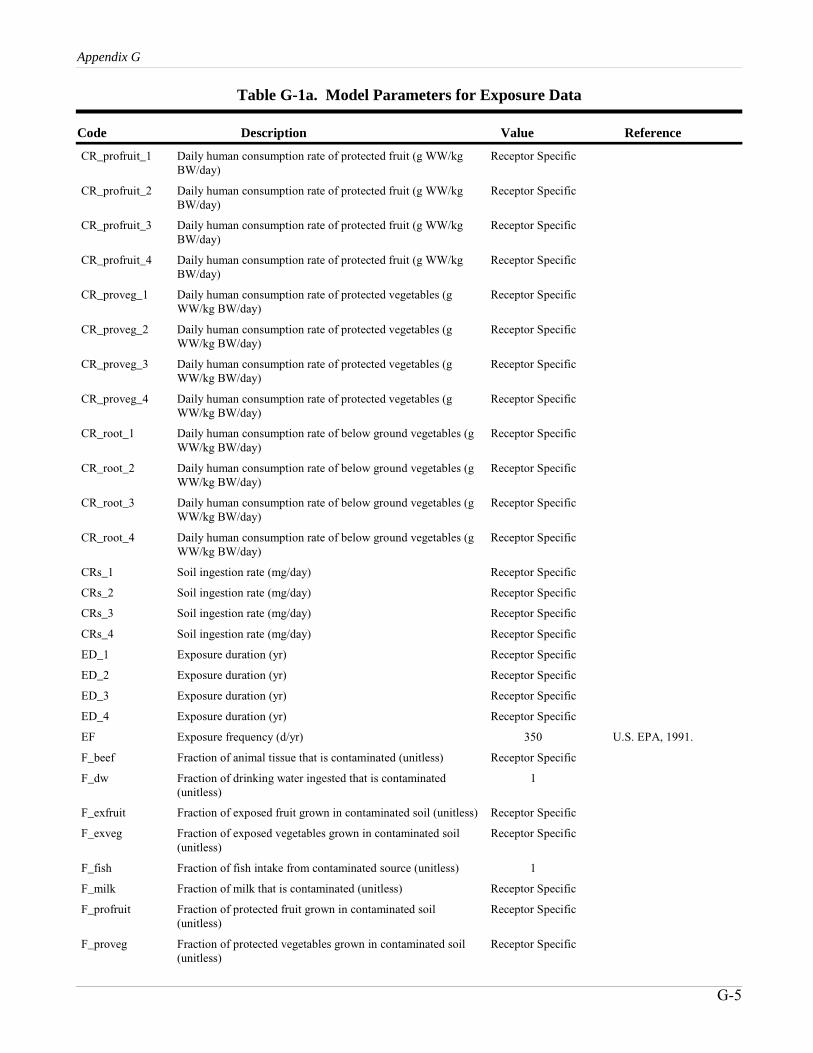
Code Description Value
Appendix G
Table G-1a. Model Parameters for Exposure Data
Reference
CR_profruit_1 Daily human consumption rate of protected fruit (g WW/kgBW/day)
Receptor Specific
CR_profruit_2 Daily human consumption rate of protected fruit (g WW/kgBW/day)
Receptor Specific
CR_profruit_3 Daily human consumption rate of protected fruit (g WW/kgBW/day)
Receptor Specific
CR_profruit_4 Daily human consumption rate of protected fruit (g WW/kgBW/day)
Receptor Specific
CR_proveg_1 Daily human consumption rate of protected vegetables (gWW/kg BW/day)
Receptor Specific
CR_proveg_2 Daily human consumption rate of protected vegetables (gWW/kg BW/day)
Receptor Specific
CR_proveg_3 Daily human consumption rate of protected vegetables (gWW/kg BW/day)
Receptor Specific
CR_proveg_4 Daily human consumption rate of protected vegetables (gWW/kg BW/day)
Receptor Specific
CR_root_1 Daily human consumption rate of below ground vegetables (gWW/kg BW/day)
Receptor Specific
CR_root_2 Daily human consumption rate of below ground vegetables (gWW/kg BW/day)
Receptor Specific
CR_root_3 Daily human consumption rate of below ground vegetables (gWW/kg BW/day)
Receptor Specific
CR_root_4 Daily human consumption rate of below ground vegetables (gWW/kg BW/day)
Receptor Specific
CRs_1 Soil ingestion rate (mg/day) Receptor Specific
CRs_2 Soil ingestion rate (mg/day) Receptor Specific
CRs_3 Soil ingestion rate (mg/day) Receptor Specific
CRs_4 Soil ingestion rate (mg/day) Receptor Specific
ED_1 Exposure duration (yr) Receptor Specific
ED_2 Exposure duration (yr) Receptor Specific
ED_3 Exposure duration (yr) Receptor Specific
ED_4 Exposure duration (yr) Receptor Specific
EF Exposure frequency (d/yr) 350 U.S. EPA, 1991.
F_beef Fraction of animal tissue that is contaminated (unitless) Receptor Specific
F_dw Fraction of drinking water ingested that is contaminated(unitless)
1
F_exfruit Fraction of exposed fruit grown in contaminated soil (unitless) Receptor Specific
F_exveg Fraction of exposed vegetables grown in contaminated soil(unitless)
Receptor Specific
F_fish Fraction of fish intake from contaminated source (unitless) 1
F_milk Fraction of milk that is contaminated (unitless) Receptor Specific
F_profruit Fraction of protected fruit grown in contaminated soil(unitless)
Receptor Specific
F_proveg Fraction of protected vegetables grown in contaminated soil(unitless)
Receptor Specific
G-5
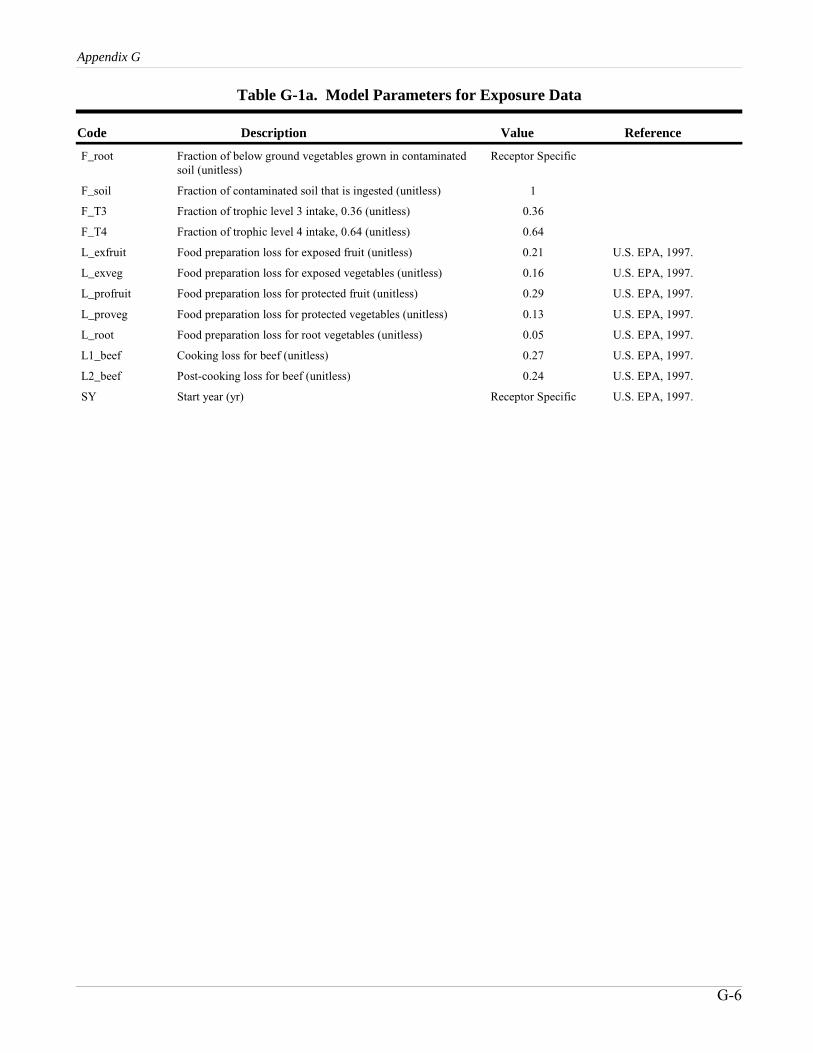
Code Description Value
Appendix G
Table G-1a. Model Parameters for Exposure Data
Reference
F_root Fraction of below ground vegetables grown in contaminatedsoil (unitless)
Receptor Specific
F_soil Fraction of contaminated soil that is ingested (unitless) 1
F_T3 Fraction of trophic level 3 intake, 0.36 (unitless) 0.36
F_T4 Fraction of trophic level 4 intake, 0.64 (unitless) 0.64
L_exfruit Food preparation loss for exposed fruit (unitless) 0.21 U.S. EPA, 1997.
L_exveg Food preparation loss for exposed vegetables (unitless) 0.16 U.S. EPA, 1997.
L_profruit Food preparation loss for protected fruit (unitless) 0.29 U.S. EPA, 1997.
L_proveg Food preparation loss for protected vegetables (unitless) 0.13 U.S. EPA, 1997.
L_root Food preparation loss for root vegetables (unitless) 0.05 U.S. EPA, 1997.
L1_beef Cooking loss for beef (unitless) 0.27 U.S. EPA, 1997.
L2_beef Post-cooking loss for beef (unitless) 0.24 U.S. EPA, 1997.
SY Start year (yr) Receptor Specific U.S. EPA, 1997.
G-6
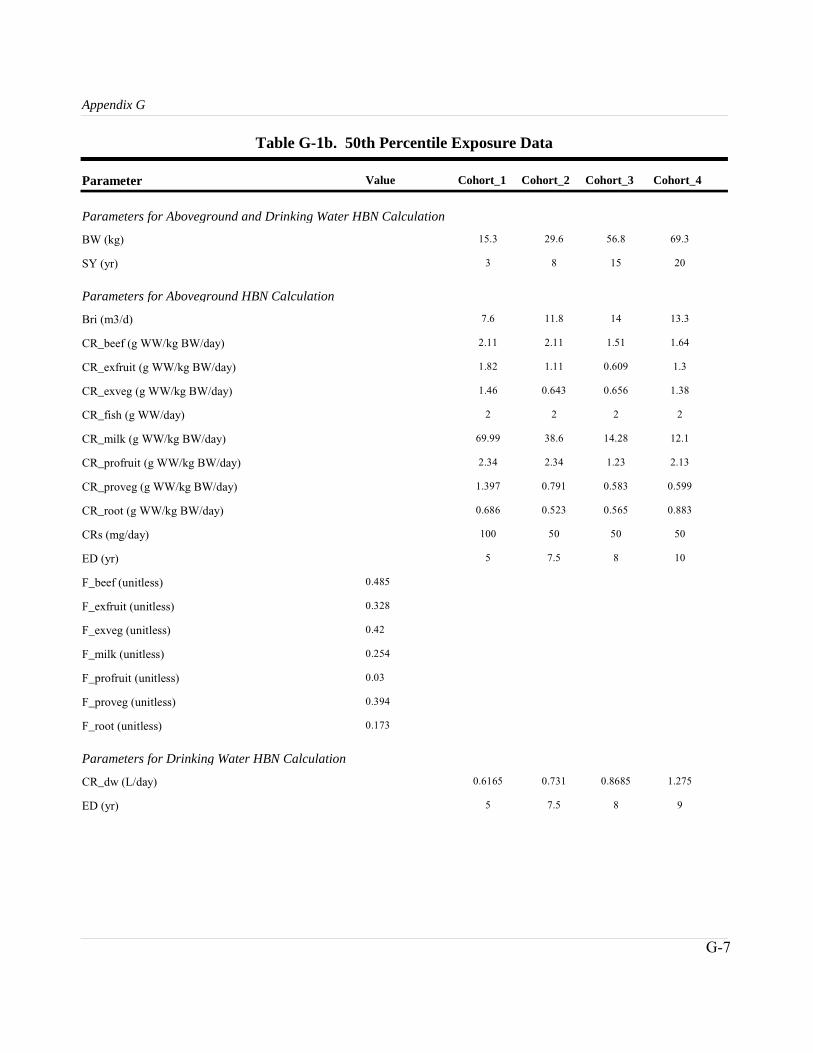
Parameter
Appendix G
Table G-1b. 50th Percentile Exposure Data
Cohort_1 Cohort_2 Cohort_3 Cohort_4Value
Parametersfor Aboveground and Drinking Water HBN Calculation
BW (kg) 15.3 29.6 56.8 69.3
SY (yr) 3 8 15 20
Parametersfor Aboveground HBN Calculation
Bri (m3/d) 7.6 11.8 14 13.3
CR_beef (g WW/kg BW/day) 2.11 2.11 1.51 1.64
CR_exfruit (g WW/kg BW/day) 1.82 1.11 0.609 1.3
CR_exveg (g WW/kg BW/day) 1.46 0.643 0.656 1.38
CR_fish (g WW/day) 2 2 2 2
CR_milk (g WW/kg BW/day) 69.99 38.6 14.28 12.1
CR_profruit (g WW/kg BW/day) 2.34 2.34 1.23 2.13
CR_proveg (g WW/kg BW/day) 1.397 0.791 0.583 0.599
CR_root (g WW/kg BW/day) 0.686 0.523 0.565 0.883
CRs (mg/day) 100 50 50 50
ED (yr) 5 7.5 8 10
F_beef (unitless) 0.485
F_exfruit (unitless) 0.328
F_exveg (unitless) 0.42
F_milk (unitless) 0.254
F_profruit (unitless) 0.03
F_proveg (unitless) 0.394
F_root (unitless) 0.173
Parametersfor Drinking Water HBN Calculation
CR_dw (L/day) 0.6165 0.731 0.8685 1.275
ED (yr) 5 7.5 8 9
G-7

Appendix G August 2002
G-8
References
U.S. EPA (Environmental Protection Agency). 1989. Risk Assessment Guidance for Superfund.Volume I: Human Health Evaluation Manual (Part A) (Interim Final). EPA/540/1-89/002.Prepared by U.S. Environmental Protection Agency, Office of Emergency and RemedialResponse, Washington, DC. December.
U.S. EPA (Environmental Protection Agency). 1997a. Exposure Factors Handbook, Volume I,General Factors. EPA/600/P-95/002Fa. Office of Research and Development, Washington,DC. August.
U.S. EPA (Environmental Protection Agency). 1997b. Exposure Factors Handbook, Volume II,Food Ingestion Factors. EPA/600/P-95/002Fa. Office of Research and Development,Washington, DC. August.
U.S. EPA (Environmental Protection Agency). 1997c. Exposure Factors Handbook, Volume III,Activity Factors. EPA/600/P-95/002Fa. Office of Research and Development, Washington,DC. August.

Appendix H
Site Data

Appendix H
H-3
Appendix H
Site Data
To estimate air dispersion and deposition, the HBN calculations require assumptions about sitemeteorology, ground cover, and waste management unit (WMU) size. Default values for most of thesevariables are from EPA’s Soil Screening Guidance and are designed to be protective for a nationwidescreening analysis. The WMU area used is the 95th percentile value from EPRI’s survey of FFCWonsite landfills. The landfill is also assumed to be uncovered.

Code Description Value
Appendix H
Table H-1. Model Parameters for Site Data
Reference
Meteorology
DF_A Dispersion factor constant selected based on location (unitless)
16.2302 U.S. EPA, 2001
DF_B Dispersion factor constant selected based on location (unitless)
18.7762 U.S. EPA, 2001
DF_C Dispersion factor constant selected based on location (unitless)
216.108 U.S. EPA, 2001
May Average annual moisture (precipitation: rainfall, snow) (cm/yr)
150 U.S. EPA, 1998
ut Equivalent threshold value of windspeed at 7m (m/s) 11.32 U.S. EPA, 2001
uw Mean annual windspeed (m/s) 4.69 U.S. EPA, 2001
Source
Area Source area 95th percentile (acres) 351.2 EPRI, 1997
Csoil Soil concentration (mg/kg) 1 Set equal to 1 for the HBN calculation
Fx Function dependent on uw/ut derived using Cowherd et al. (1985) (unitless)
0.194 U.S. EPA, 2001
VC Fraction vegetative cover (unitless) 0 Assumed protective value
H-4
Appendix H
H-5
References
U.S. EPA (Environmental Protection Agency). 1998. Methodology for Assessing Health RisksAssociated with Multiple Pathways of Exposure to Combustor Emissions. Update toEPA/600/6-90/003 Methodology for Assessing Health Risks Associated with IndirectExposure to Combustor Emissions. EPA 600/R-98/137. National Center for EnvironmentalAssessment, Cincinnati, OH. December.
U.S. EPA (Environmental Protection Agency). 2001. Supplemental Guidance for Developing SoilScreening Levels for Superfund Sites. Office of Solid Waste, Washington DC. March.
EPRI (Electric Power Research Institute). 1997. Coal Combustion and Low Volume WastesComanagement Survey. EPRI. Palo Alto, CA. June.


Appendix I
Tabulated Human Health Screening Results

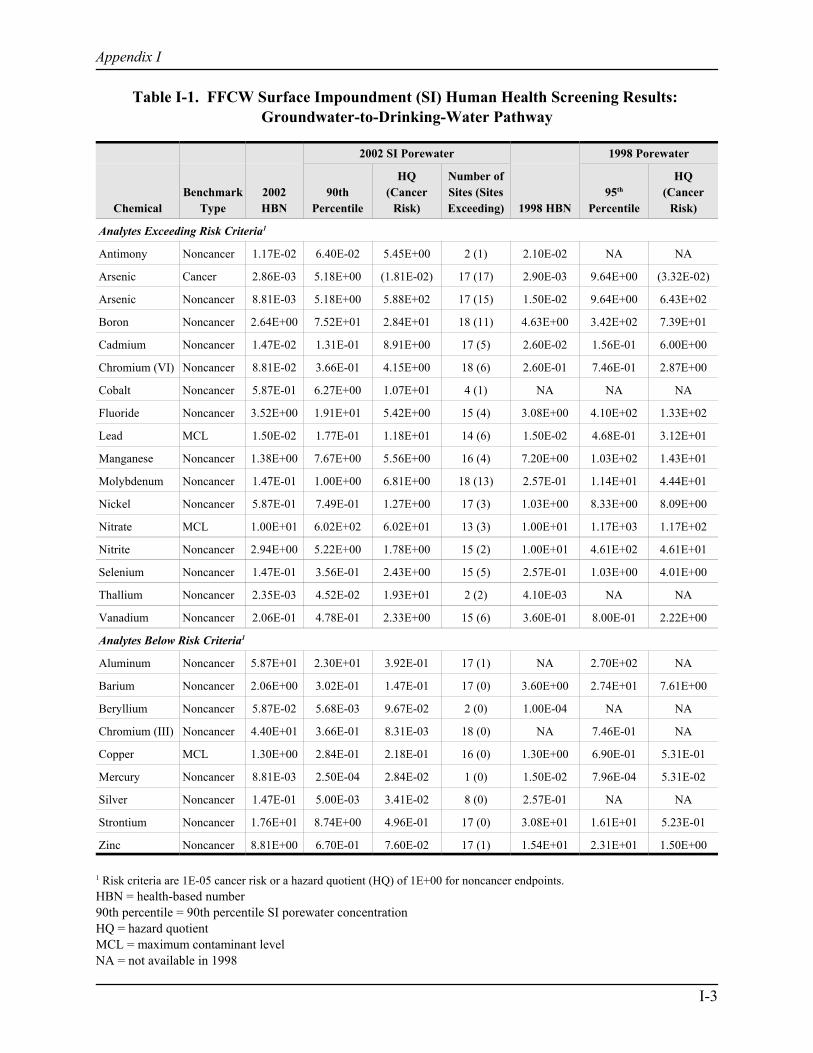
Appendix I
I-3
Table I-1. FFCW Surface Impoundment (SI) Human Health Screening Results: Groundwater-to-Drinking-Water Pathway
ChemicalBenchmark
Type2002HBN
2002 SI Porewater
1998 HBN
1998 Porewater
90thPercentile
HQ(Cancer
Risk)
Number ofSites (SitesExceeding)
95th
Percentile
HQ(Cancer
Risk)
Analytes Exceeding Risk Criteria1
Antimony Noncancer 1.17E-02 6.40E-02 5.45E+00 2 (1) 2.10E-02 NA NA
Arsenic Cancer 2.86E-03 5.18E+00 (1.81E-02) 17 (17) 2.90E-03 9.64E+00 (3.32E-02)
Arsenic Noncancer 8.81E-03 5.18E+00 5.88E+02 17 (15) 1.50E-02 9.64E+00 6.43E+02
Boron Noncancer 2.64E+00 7.52E+01 2.84E+01 18 (11) 4.63E+00 3.42E+02 7.39E+01
Cadmium Noncancer 1.47E-02 1.31E-01 8.91E+00 17 (5) 2.60E-02 1.56E-01 6.00E+00
Chromium (VI) Noncancer 8.81E-02 3.66E-01 4.15E+00 18 (6) 2.60E-01 7.46E-01 2.87E+00
Cobalt Noncancer 5.87E-01 6.27E+00 1.07E+01 4 (1) NA NA NA
Fluoride Noncancer 3.52E+00 1.91E+01 5.42E+00 15 (4) 3.08E+00 4.10E+02 1.33E+02
Lead MCL 1.50E-02 1.77E-01 1.18E+01 14 (6) 1.50E-02 4.68E-01 3.12E+01
Manganese Noncancer 1.38E+00 7.67E+00 5.56E+00 16 (4) 7.20E+00 1.03E+02 1.43E+01
Molybdenum Noncancer 1.47E-01 1.00E+00 6.81E+00 18 (13) 2.57E-01 1.14E+01 4.44E+01
Nickel Noncancer 5.87E-01 7.49E-01 1.27E+00 17 (3) 1.03E+00 8.33E+00 8.09E+00
Nitrate MCL 1.00E+01 6.02E+02 6.02E+01 13 (3) 1.00E+01 1.17E+03 1.17E+02
Nitrite Noncancer 2.94E+00 5.22E+00 1.78E+00 15 (2) 1.00E+01 4.61E+02 4.61E+01
Selenium Noncancer 1.47E-01 3.56E-01 2.43E+00 15 (5) 2.57E-01 1.03E+00 4.01E+00
Thallium Noncancer 2.35E-03 4.52E-02 1.93E+01 2 (2) 4.10E-03 NA NA
Vanadium Noncancer 2.06E-01 4.78E-01 2.33E+00 15 (6) 3.60E-01 8.00E-01 2.22E+00
Analytes Below Risk Criteria1
Aluminum Noncancer 5.87E+01 2.30E+01 3.92E-01 17 (1) NA 2.70E+02 NA
Barium Noncancer 2.06E+00 3.02E-01 1.47E-01 17 (0) 3.60E+00 2.74E+01 7.61E+00
Beryllium Noncancer 5.87E-02 5.68E-03 9.67E-02 2 (0) 1.00E-04 NA NA
Chromium (III) Noncancer 4.40E+01 3.66E-01 8.31E-03 18 (0) NA 7.46E-01 NA
Copper MCL 1.30E+00 2.84E-01 2.18E-01 16 (0) 1.30E+00 6.90E-01 5.31E-01
Mercury Noncancer 8.81E-03 2.50E-04 2.84E-02 1 (0) 1.50E-02 7.96E-04 5.31E-02
Silver Noncancer 1.47E-01 5.00E-03 3.41E-02 8 (0) 2.57E-01 NA NA
Strontium Noncancer 1.76E+01 8.74E+00 4.96E-01 17 (0) 3.08E+01 1.61E+01 5.23E-01
Zinc Noncancer 8.81E+00 6.70E-01 7.60E-02 17 (1) 1.54E+01 2.31E+01 1.50E+00
1 Risk criteria are 1E-05 cancer risk or a hazard quotient (HQ) of 1E+00 for noncancer endpoints.HBN = health-based number90th percentile = 90th percentile SI porewater concentrationHQ = hazard quotientMCL = maximum contaminant levelNA = not available in 1998
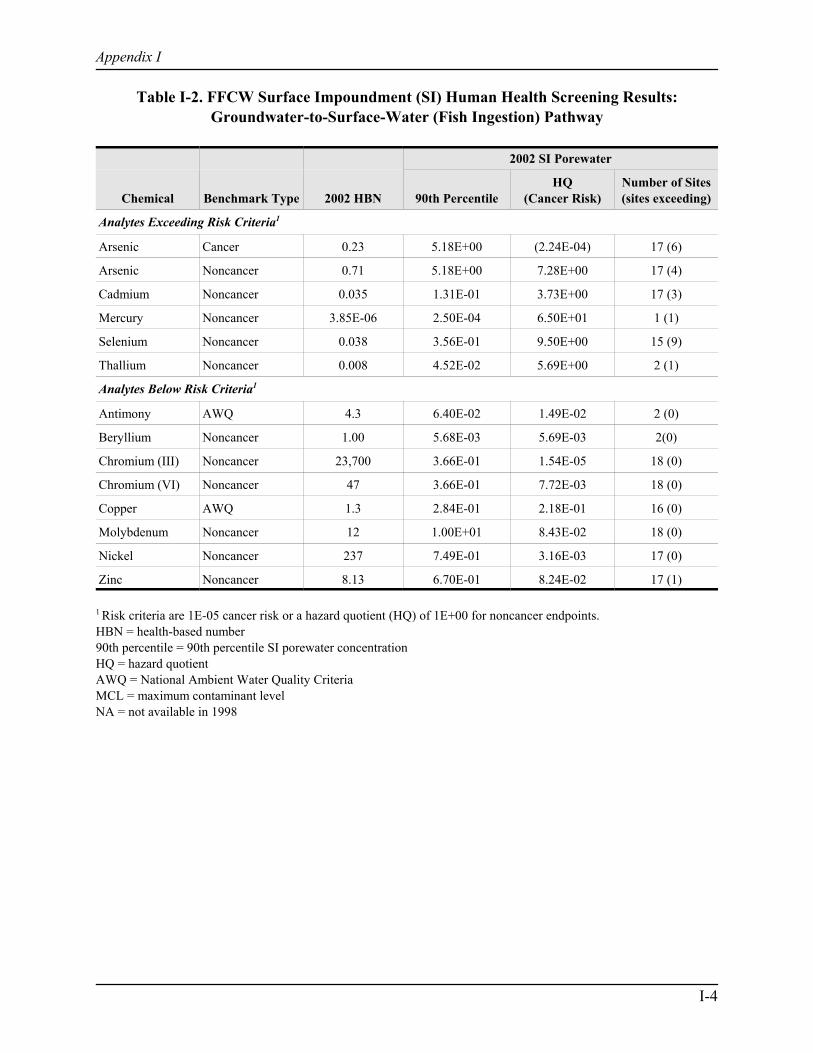
Appendix I
I-4
Table I-2. FFCW Surface Impoundment (SI) Human Health Screening Results:Groundwater-to-Surface-Water (Fish Ingestion) Pathway
Chemical Benchmark Type 2002 HBN
2002 SI Porewater
90th PercentileHQ
(Cancer Risk)Number of Sites(sites exceeding)
Analytes Exceeding Risk Criteria1
Arsenic Cancer 0.23 5.18E+00 (2.24E-04) 17 (6)
Arsenic Noncancer 0.71 5.18E+00 7.28E+00 17 (4)
Cadmium Noncancer 0.035 1.31E-01 3.73E+00 17 (3)
Mercury Noncancer 3.85E-06 2.50E-04 6.50E+01 1 (1)
Selenium Noncancer 0.038 3.56E-01 9.50E+00 15 (9)
Thallium Noncancer 0.008 4.52E-02 5.69E+00 2 (1)
Analytes Below Risk Criteria1
Antimony AWQ 4.3 6.40E-02 1.49E-02 2 (0)
Beryllium Noncancer 1.00 5.68E-03 5.69E-03 2(0)
Chromium (III) Noncancer 23,700 3.66E-01 1.54E-05 18 (0)
Chromium (VI) Noncancer 47 3.66E-01 7.72E-03 18 (0)
Copper AWQ 1.3 2.84E-01 2.18E-01 16 (0)
Molybdenum Noncancer 12 1.00E+01 8.43E-02 18 (0)
Nickel Noncancer 237 7.49E-01 3.16E-03 17 (0)
Zinc Noncancer 8.13 6.70E-01 8.24E-02 17 (1)
1 Risk criteria are 1E-05 cancer risk or a hazard quotient (HQ) of 1E+00 for noncancer endpoints.HBN = health-based number90th percentile = 90th percentile SI porewater concentrationHQ = hazard quotientAWQ = National Ambient Water Quality CriteriaMCL = maximum contaminant levelNA = not available in 1998
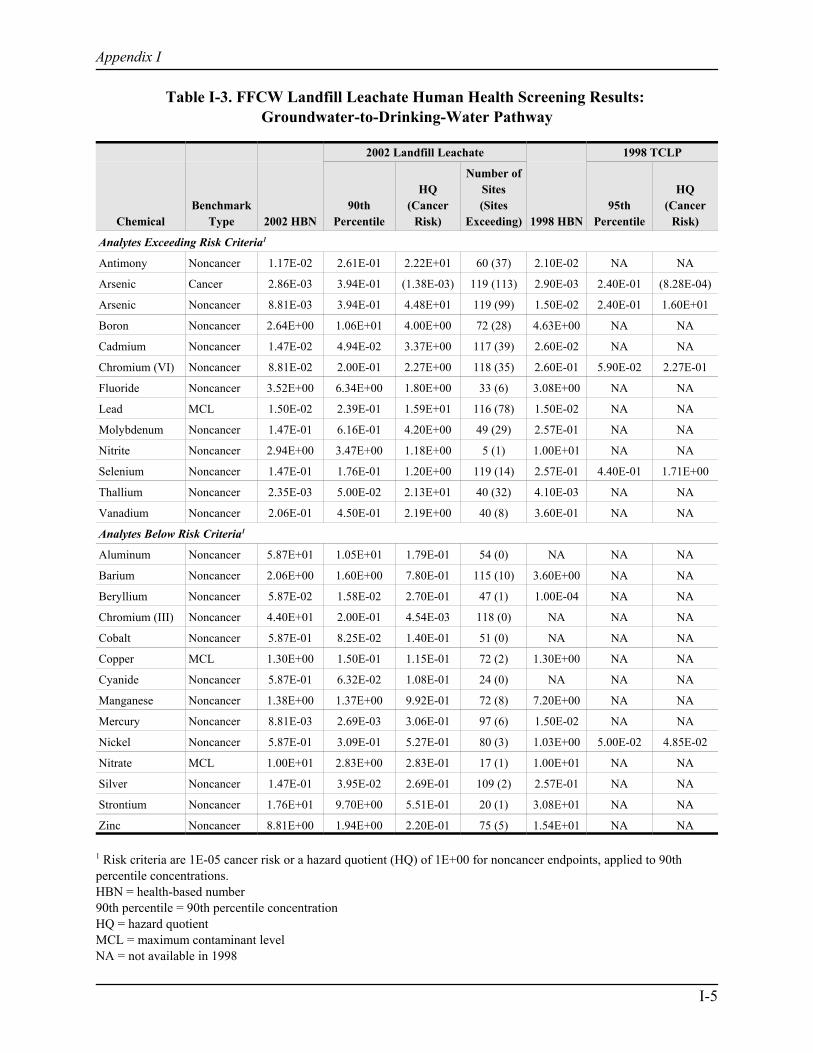
Appendix I
I-5
Table I-3. FFCW Landfill Leachate Human Health Screening Results: Groundwater-to-Drinking-Water Pathway
ChemicalBenchmark
Type 2002 HBN
2002 Landfill Leachate
1998 HBN
1998 TCLP
90thPercentile
HQ(Cancer
Risk)
Number ofSites(Sites
Exceeding)95th
Percentile
HQ(Cancer
Risk)
Analytes Exceeding Risk Criteria1
Antimony Noncancer 1.17E-02 2.61E-01 2.22E+01 60 (37) 2.10E-02 NA NA
Arsenic Cancer 2.86E-03 3.94E-01 (1.38E-03) 119 (113) 2.90E-03 2.40E-01 (8.28E-04)
Arsenic Noncancer 8.81E-03 3.94E-01 4.48E+01 119 (99) 1.50E-02 2.40E-01 1.60E+01
Boron Noncancer 2.64E+00 1.06E+01 4.00E+00 72 (28) 4.63E+00 NA NA
Cadmium Noncancer 1.47E-02 4.94E-02 3.37E+00 117 (39) 2.60E-02 NA NA
Chromium (VI) Noncancer 8.81E-02 2.00E-01 2.27E+00 118 (35) 2.60E-01 5.90E-02 2.27E-01
Fluoride Noncancer 3.52E+00 6.34E+00 1.80E+00 33 (6) 3.08E+00 NA NA
Lead MCL 1.50E-02 2.39E-01 1.59E+01 116 (78) 1.50E-02 NA NA
Molybdenum Noncancer 1.47E-01 6.16E-01 4.20E+00 49 (29) 2.57E-01 NA NA
Nitrite Noncancer 2.94E+00 3.47E+00 1.18E+00 5 (1) 1.00E+01 NA NA
Selenium Noncancer 1.47E-01 1.76E-01 1.20E+00 119 (14) 2.57E-01 4.40E-01 1.71E+00
Thallium Noncancer 2.35E-03 5.00E-02 2.13E+01 40 (32) 4.10E-03 NA NA
Vanadium Noncancer 2.06E-01 4.50E-01 2.19E+00 40 (8) 3.60E-01 NA NA
Analytes Below Risk Criteria1
Aluminum Noncancer 5.87E+01 1.05E+01 1.79E-01 54 (0) NA NA NA
Barium Noncancer 2.06E+00 1.60E+00 7.80E-01 115 (10) 3.60E+00 NA NA
Beryllium Noncancer 5.87E-02 1.58E-02 2.70E-01 47 (1) 1.00E-04 NA NA
Chromium (III) Noncancer 4.40E+01 2.00E-01 4.54E-03 118 (0) NA NA NA
Cobalt Noncancer 5.87E-01 8.25E-02 1.40E-01 51 (0) NA NA NA
Copper MCL 1.30E+00 1.50E-01 1.15E-01 72 (2) 1.30E+00 NA NA
Cyanide Noncancer 5.87E-01 6.32E-02 1.08E-01 24 (0) NA NA NA
Manganese Noncancer 1.38E+00 1.37E+00 9.92E-01 72 (8) 7.20E+00 NA NA
Mercury Noncancer 8.81E-03 2.69E-03 3.06E-01 97 (6) 1.50E-02 NA NA
Nickel Noncancer 5.87E-01 3.09E-01 5.27E-01 80 (3) 1.03E+00 5.00E-02 4.85E-02
Nitrate MCL 1.00E+01 2.83E+00 2.83E-01 17 (1) 1.00E+01 NA NA
Silver Noncancer 1.47E-01 3.95E-02 2.69E-01 109 (2) 2.57E-01 NA NA
Strontium Noncancer 1.76E+01 9.70E+00 5.51E-01 20 (1) 3.08E+01 NA NA
Zinc Noncancer 8.81E+00 1.94E+00 2.20E-01 75 (5) 1.54E+01 NA NA
1 Risk criteria are 1E-05 cancer risk or a hazard quotient (HQ) of 1E+00 for noncancer endpoints, applied to 90thpercentile concentrations.HBN = health-based number90th percentile = 90th percentile concentrationHQ = hazard quotientMCL = maximum contaminant levelNA = not available in 1998
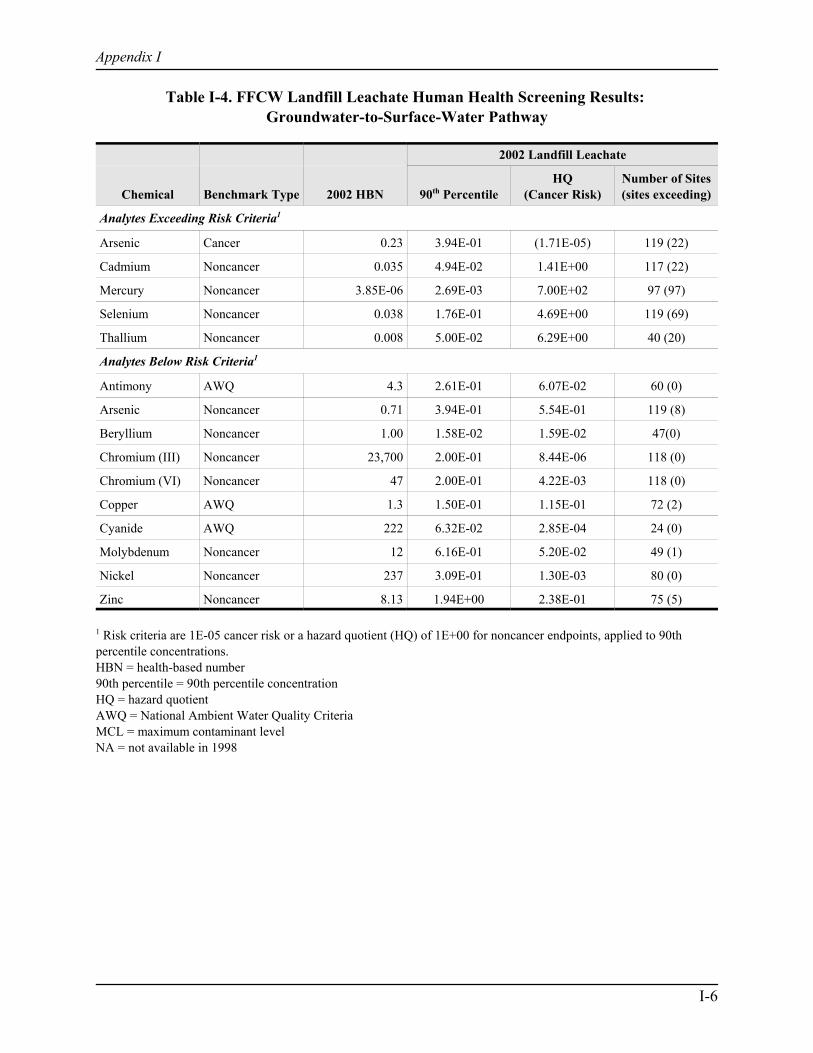
Appendix I
I-6
Table I-4. FFCW Landfill Leachate Human Health Screening Results: Groundwater-to-Surface-Water Pathway
Chemical Benchmark Type 2002 HBN
2002 Landfill Leachate
90th PercentileHQ
(Cancer Risk)Number of Sites(sites exceeding)
Analytes Exceeding Risk Criteria1
Arsenic Cancer 0.23 3.94E-01 (1.71E-05) 119 (22)
Cadmium Noncancer 0.035 4.94E-02 1.41E+00 117 (22)
Mercury Noncancer 3.85E-06 2.69E-03 7.00E+02 97 (97)
Selenium Noncancer 0.038 1.76E-01 4.69E+00 119 (69)
Thallium Noncancer 0.008 5.00E-02 6.29E+00 40 (20)
Analytes Below Risk Criteria1
Antimony AWQ 4.3 2.61E-01 6.07E-02 60 (0)
Arsenic Noncancer 0.71 3.94E-01 5.54E-01 119 (8)
Beryllium Noncancer 1.00 1.58E-02 1.59E-02 47(0)
Chromium (III) Noncancer 23,700 2.00E-01 8.44E-06 118 (0)
Chromium (VI) Noncancer 47 2.00E-01 4.22E-03 118 (0)
Copper AWQ 1.3 1.50E-01 1.15E-01 72 (2)
Cyanide AWQ 222 6.32E-02 2.85E-04 24 (0)
Molybdenum Noncancer 12 6.16E-01 5.20E-02 49 (1)
Nickel Noncancer 237 3.09E-01 1.30E-03 80 (0)
Zinc Noncancer 8.13 1.94E+00 2.38E-01 75 (5)
1 Risk criteria are 1E-05 cancer risk or a hazard quotient (HQ) of 1E+00 for noncancer endpoints, applied to 90thpercentile concentrations.HBN = health-based number90th percentile = 90th percentile concentrationHQ = hazard quotientAWQ = National Ambient Water Quality CriteriaMCL = maximum contaminant levelNA = not available in 1998
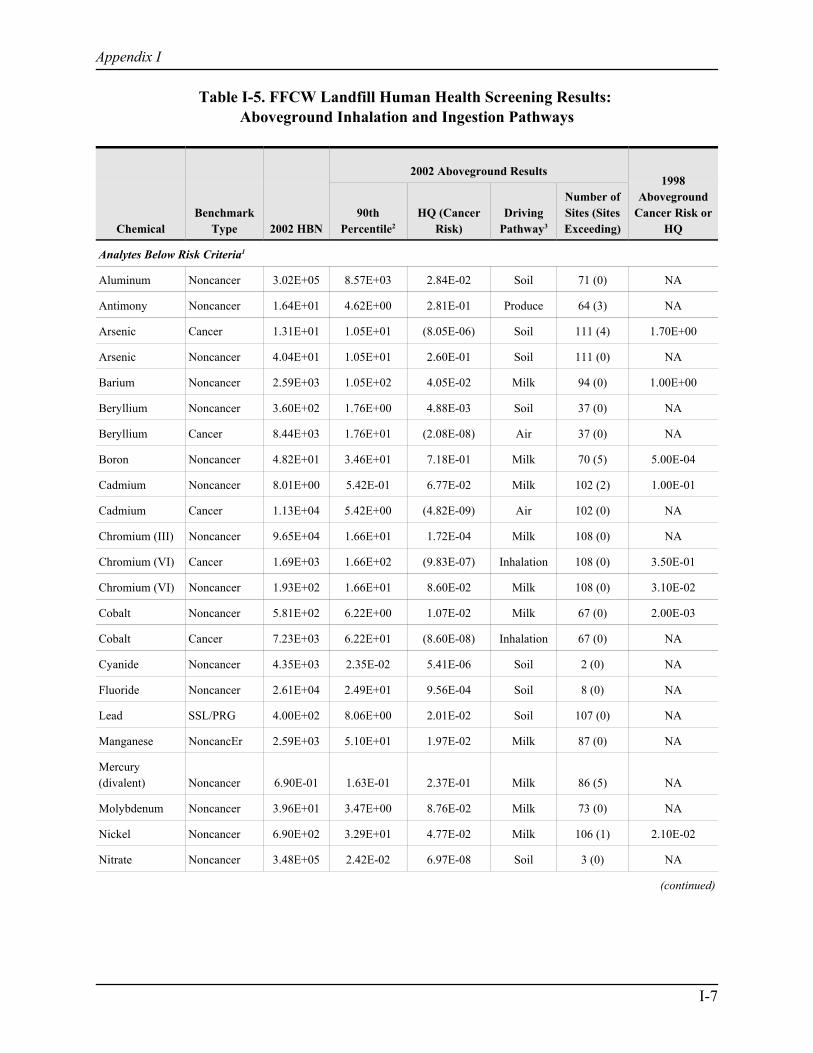
Appendix I
I-7
Table I-5. FFCW Landfill Human Health Screening Results: Aboveground Inhalation and Ingestion Pathways
ChemicalBenchmark
Type 2002 HBN
2002 Aboveground Results1998
AbovegroundCancer Risk or
HQ90th
Percentile2
HQ (CancerRisk)
DrivingPathway3
Number ofSites (SitesExceeding)
Analytes Below Risk Criteria1
Aluminum Noncancer 3.02E+05 8.57E+03 2.84E-02 Soil 71 (0) NA
Antimony Noncancer 1.64E+01 4.62E+00 2.81E-01 Produce 64 (3) NA
Arsenic Cancer 1.31E+01 1.05E+01 (8.05E-06) Soil 111 (4) 1.70E+00
Arsenic Noncancer 4.04E+01 1.05E+01 2.60E-01 Soil 111 (0) NA
Barium Noncancer 2.59E+03 1.05E+02 4.05E-02 Milk 94 (0) 1.00E+00
Beryllium Noncancer 3.60E+02 1.76E+00 4.88E-03 Soil 37 (0) NA
Beryllium Cancer 8.44E+03 1.76E+01 (2.08E-08) Air 37 (0) NA
Boron Noncancer 4.82E+01 3.46E+01 7.18E-01 Milk 70 (5) 5.00E-04
Cadmium Noncancer 8.01E+00 5.42E-01 6.77E-02 Milk 102 (2) 1.00E-01
Cadmium Cancer 1.13E+04 5.42E+00 (4.82E-09) Air 102 (0) NA
Chromium (III) Noncancer 9.65E+04 1.66E+01 1.72E-04 Milk 108 (0) NA
Chromium (VI) Cancer 1.69E+03 1.66E+02 (9.83E-07) Inhalation 108 (0) 3.50E-01
Chromium (VI) Noncancer 1.93E+02 1.66E+01 8.60E-02 Milk 108 (0) 3.10E-02
Cobalt Noncancer 5.81E+02 6.22E+00 1.07E-02 Milk 67 (0) 2.00E-03
Cobalt Cancer 7.23E+03 6.22E+01 (8.60E-08) Inhalation 67 (0) NA
Cyanide Noncancer 4.35E+03 2.35E-02 5.41E-06 Soil 2 (0) NA
Fluoride Noncancer 2.61E+04 2.49E+01 9.56E-04 Soil 8 (0) NA
Lead SSL/PRG 4.00E+02 8.06E+00 2.01E-02 Soil 107 (0) NA
Manganese NoncancEr 2.59E+03 5.10E+01 1.97E-02 Milk 87 (0) NA
Mercury(divalent) Noncancer 6.90E-01 1.63E-01 2.37E-01 Milk 86 (5) NA
Molybdenum Noncancer 3.96E+01 3.47E+00 8.76E-02 Milk 73 (0) NA
Nickel Noncancer 6.90E+02 3.29E+01 4.77E-02 Milk 106 (1) 2.10E-02
Nitrate Noncancer 3.48E+05 2.42E-02 6.97E-08 Soil 3 (0) NA
(continued)

Table I-5. (continued)
Appendix I
ChemicalBenchmark
Type 2002 HBN
2002 Aboveground Results1998
AbovegroundCancer Risk or
HQ90th
Percentile2
HQ (CancerRisk)
DrivingPathway3
Number ofSites (SitesExceeding)
I-8
Selenium Noncancer 7.83E+01 2.14E+00 2.74E-02 Milk 94 (0) 9.30E-03
Silver Noncancer 2.62E+00 1.37E+00 5.23E-01 Milk 69 (4) 8.00E-04
Strontium Noncancer 6.22E+02 1.05E+02 1.69E-01 Milk 15 (0) NA
Thallium Noncancer 2.81E+00 2.08E+00 7.39E-01 Milk 20 (2) 1.10E+00
Vanadium Noncancer 1.16E+03 9.07E+01 7.85E-02 Soil 43 (0) NA
Zinc Noncancer 2.43E+02 2.93E+01 1.21E-01 Milk 98 (3) NA
1 Risk criteria are 1.0E-05 cancer risk or a hazard quotient (HQ) of 1.0E+00 for noncancer endpoints, applied to 90th
percentile concentrations2 Soil concentrations (total waste/10) or total waste concentrations (for Be, Cd, Cr VI, and Co inhalation cancer risk) 3 See Appendix D, Table D-5 for relative contributions of ingestion pathways to risk estimatesHBN = health-based number90th percentile = 90th percentile concentrationHQ = hazard quotientMCL = maximum contaminant levelNA = not available

Appendix J
Tabulated Ecological Risk Screening Results

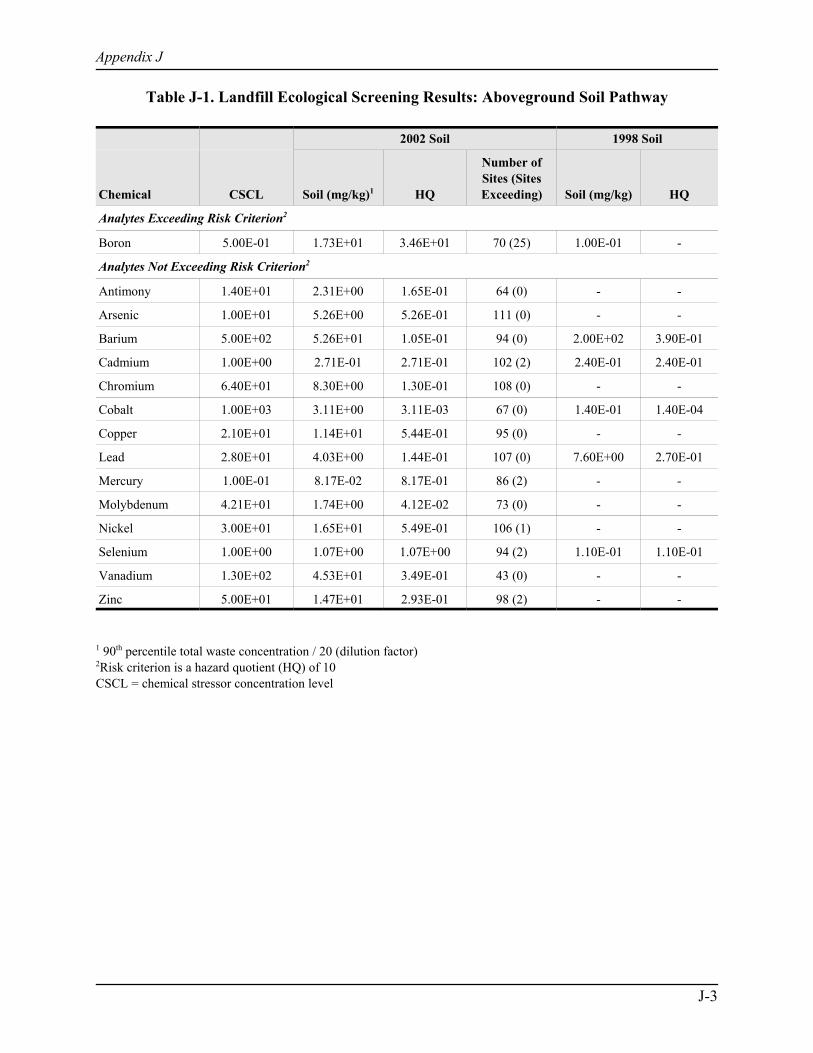
Appendix J
J-3
Table J-1. Landfill Ecological Screening Results: Aboveground Soil Pathway
Chemical CSCL
2002 Soil 1998 Soil
Soil (mg/kg)1 HQ
Number ofSites (SitesExceeding) Soil (mg/kg) HQ
Analytes Exceeding Risk Criterion2
Boron 5.00E-01 1.73E+01 3.46E+01 70 (25) 1.00E-01 -
Analytes Not Exceeding Risk Criterion2
Antimony 1.40E+01 2.31E+00 1.65E-01 64 (0) - -
Arsenic 1.00E+01 5.26E+00 5.26E-01 111 (0) - -
Barium 5.00E+02 5.26E+01 1.05E-01 94 (0) 2.00E+02 3.90E-01
Cadmium 1.00E+00 2.71E-01 2.71E-01 102 (2) 2.40E-01 2.40E-01
Chromium 6.40E+01 8.30E+00 1.30E-01 108 (0) - -
Cobalt 1.00E+03 3.11E+00 3.11E-03 67 (0) 1.40E-01 1.40E-04
Copper 2.10E+01 1.14E+01 5.44E-01 95 (0) - -
Lead 2.80E+01 4.03E+00 1.44E-01 107 (0) 7.60E+00 2.70E-01
Mercury 1.00E-01 8.17E-02 8.17E-01 86 (2) - -
Molybdenum 4.21E+01 1.74E+00 4.12E-02 73 (0) - -
Nickel 3.00E+01 1.65E+01 5.49E-01 106 (1) - -
Selenium 1.00E+00 1.07E+00 1.07E+00 94 (2) 1.10E-01 1.10E-01
Vanadium 1.30E+02 4.53E+01 3.49E-01 43 (0) - -
Zinc 5.00E+01 1.47E+01 2.93E-01 98 (2) - -
1 90th percentile total waste concentration / 20 (dilution factor) 2Risk criterion is a hazard quotient (HQ) of 10CSCL = chemical stressor concentration level

Appendix J
J-4
Table J-2. Surface Impoundment Ecological Screening Results: Direct Surface Impoundmentand Groundwater-to-Surface-Water Pathways
CSCL 2002 SI Porewater 1998 SI Water
Chemical (mg/L)
90th
Percentile(mg/L) HQ
Number ofSites (SitesExceeding)
95thPercentile
(mg/L) HQ
Analytes Exceeding Risk Criterion1
Aluminum 8.70E-02 2.30E+01 2.65E+02 17 (11) 5.11E+00 5.87E+01
Arsenic III 1.50E-01 5.18E+00 3.45E+01 17 (3) 5.50E-01 3.67E+00
Arsenic IV 8.10E-03 5.18E+00 6.39E+02 17 (11) 5.50E-01 6.79E+01
Barium 4.00E-03 3.02E-01 7.54E+01 17 (13) 7.12E-01 1.78E+02
Boron 1.60E-03 7.52E+01 4.70E+04 18 (18) 4.60E+02 2.88E+05
Cadmium 2.50E-03 1.31E-01 5.23E+01 17 (3) 2.50E-01 1.00E+02
Chromium VI 1.10E-02 3.66E-01 3.33E+01 18 (5) 2.67E-02 2.43E+00
Cobalt 2.30E-02 6.27E+00 2.73E+02 4 (1) 1.00E-02 4.35E-01
Copper 9.30E-03 2.84E-01 3.05E+01 16 (5) 3.90E-01 4.19E+01
Lead 3.01E-04 1.77E-01 5.88E+02 14 (10) 2.50E-01 8.31E+02
Mercury 1.90E-07 2.50E-04 1.32E+03 1 (1) 1.50E-03 7.89E+03
Nickel 5.20E-02 7.49E-01 1.44E+01 17 (3) 6.00E-01 1.15E+01
Selenium IV 2.80E-02 3.56E-01 1.27E+01 15 (3) 7.80E+00 2.79E+02
Selenium total 5.00E-03 3.56E-01 7.13E+01 15 (8) 7.80E+00 1.56E+03
Selenium VI 9.50E-03 3.56E-01 3.75E+01 15 (6) 7.80E+00 8.21E+02
Silver 3.60E-04 5.00E-03 1.39E+01 8 (3) 5.00E-03 1.39E+01
Vanadium 2.00E-02 4.78E-01 2.39E+01 15 (6) 8.00E-01 4.00E+01
Analytes Not Exceeding Risk Criterion1
Antimony 3.00E-02 6.40E-02 2.13E+00 2 (0) 1.37E-01 4.57E+00
Beryllium 6.60E-04 5.68E-03 8.61E+00 2 (0) 1.00E-03 1.52E+00
Chromium III 8.60E-02 3.66E-01 4.26E+00 18 (0) 4.00E-01 4.65E+00
Molybdenum 3.70E-01 1.00E+00 2.70E+00 18 (1) 5.00E-01 1.35E+00
Thallium 1.20E-02 4.52E-02 3.77E+00 2 (0) 5.00E-02 4.17E+00
Zinc 1.20E-01 6.70E-01 5.58E+00 17 (1) 6.70E-01 5.58E+00
1 Risk criterion is a hazard quotient (HQ) of 10 (for direct exposure to impoundment waters).SI = surface impoundmentCSCL = chemical stressor concentration level

Appendix J
J-5
Table J-3. Landfill Ecological Screening Results: Groundwater-to-Surface-Water Pathway
ChemicalCSCL(mg/L)
2002 - Landfill Leachate
90th Percentile(mg/L) HQ
Number of Sites(Sites Exceeding)
Analytes Exceeding Risk Criterion1
Aluminum 8.70E-02 1.05E+01 1.21E+02 54 (36)
Arsenic IV 8.10E-03 3.94E-01 4.87E+01 119 (40)
Barium 4.00E-03 1.60E+00 4.01E+02 115 (112)
Beryllium 6.60E-04 1.58E-02 2.40E+01 47 (11)
Boron 1.60E-03 1.06E+01 6.61E+03 72 (71)
Cadmium 2.50E-03 4.94E-02 1.98E+01 117 (25)
Chromium VI 1.10E-02 2.00E-01 1.82E+01 118 (27)
Copper 9.30E-03 1.50E-01 1.61E+01 72 (19)
Lead 3.01E-04 2.39E-01 7.94E+02 116 (102)
Mercury 1.90E-07 2.69E-03 1.42E+04 97 (97)
Selenium total 5.00E-03 1.76E-01 3.52E+01 119 (54)
Selenium VI 9.50E-03 1.76E-01 1.85E+01 119 (27)
Silver 3.60E-04 3.95E-02 1.10E+02 109 (77)
Vanadium 2.00E-02 4.50E-01 2.25E+01 40 (9)
Zinc 1.20E-01 1.94E+00 1.61E+01 75 (12)
Analytes Not Exceeding Risk Criterion1
Antimony 3.00E-02 2.61E-01 8.70E+00 60 (3)
Arsenic III 1.50E-01 3.94E-01 2.63E+00 119 (2)
Chromium III 8.60E-02 2.00E-01 2.33E+00 118 (0)
Cobalt 2.30E-02 8.25E-02 3.59E+00 51 (1)
Molybdenum 3.70E-01 6.16E-01 1.67E+00 49 (1)
Nickel 5.20E-02 3.09E-01 5.95E+00 80 (5)
Selenium IV 2.80E-02 1.76E-01 6.28E+00 119 (5)
Thallium 1.20E-02 5.00E-02 4.17E+00 40 (1)
1Risk criterion is a hazard quotient (HQ) of 10CSCL = chemical stressor concentration level
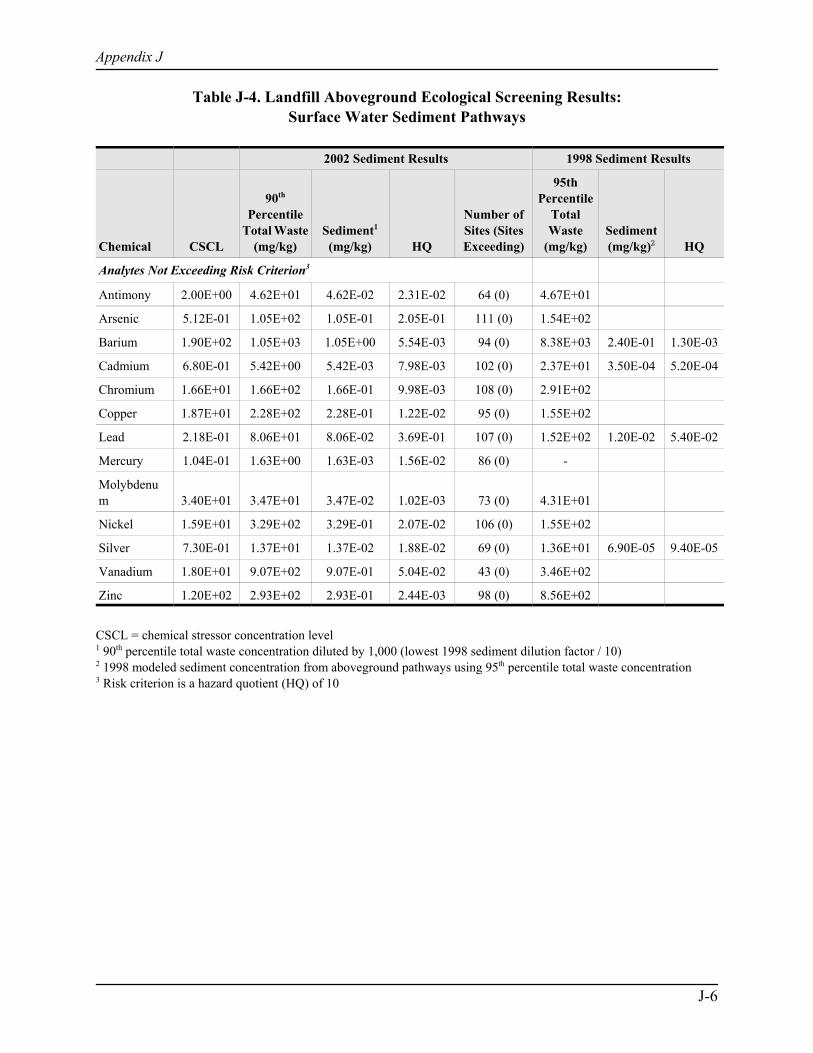
Appendix J
J-6
Table J-4. Landfill Aboveground Ecological Screening Results:Surface Water Sediment Pathways
2002 Sediment Results 1998 Sediment Results
Chemical CSCL
90th
PercentileTotal Waste
(mg/kg)Sediment1
(mg/kg) HQ
Number ofSites (SitesExceeding)
95thPercentile
TotalWaste
(mg/kg)Sediment(mg/kg) HQ
Analytes Not Exceeding Risk Criterion3
Antimony 2.00E+00 4.62E+01 4.62E-02 2.31E-02 64 (0) 4.67E+01
Arsenic 5.12E-01 1.05E+02 1.05E-01 2.05E-01 111 (0) 1.54E+02
Barium 1.90E+02 1.05E+03 1.05E+00 5.54E-03 94 (0) 8.38E+03 2.40E-01 1.30E-03
Cadmium 6.80E-01 5.42E+00 5.42E-03 7.98E-03 102 (0) 2.37E+01 3.50E-04 5.20E-04
Chromium 1.66E+01 1.66E+02 1.66E-01 9.98E-03 108 (0) 2.91E+02
Copper 1.87E+01 2.28E+02 2.28E-01 1.22E-02 95 (0) 1.55E+02
Lead 2.18E-01 8.06E+01 8.06E-02 3.69E-01 107 (0) 1.52E+02 1.20E-02 5.40E-02
Mercury 1.04E-01 1.63E+00 1.63E-03 1.56E-02 86 (0) -
Molybdenum 3.40E+01 3.47E+01 3.47E-02 1.02E-03 73 (0) 4.31E+01
Nickel 1.59E+01 3.29E+02 3.29E-01 2.07E-02 106 (0) 1.55E+02
Silver 7.30E-01 1.37E+01 1.37E-02 1.88E-02 69 (0) 1.36E+01 6.90E-05 9.40E-05
Vanadium 1.80E+01 9.07E+02 9.07E-01 5.04E-02 43 (0) 3.46E+02
Zinc 1.20E+02 2.93E+02 2.93E-01 2.44E-03 98 (0) 8.56E+02
CSCL = chemical stressor concentration level1 90th percentile total waste concentration diluted by 1,000 (lowest 1998 sediment dilution factor / 10)2 1998 modeled sediment concentration from aboveground pathways using 95th percentile total waste concentration3 Risk criterion is a hazard quotient (HQ) of 10


![[PPT]Coal Combustion - BGU · Web viewCoal Combustion Nadine Spitz Environmental Engineering Ben-Gurion University Contents What is coal? Formation, sources, applications. Coal combustion](https://img.pdfslide.net/doc/110x75/5ad704077f8b9a5b538c15a7/pptcoal-combustion-viewcoal-combustion-nadine-spitz-environmental-engineering.jpg)