Embed Size (px)
Citation preview
936 T H E L E A D I N G E D G E November 2 015 Special Section: R e s o u rce p l ay s I : R o c k p hy s i c s
Constraining seismic rock-property logs in organic shale reservoirs
AbstractOne of the major challenges of unconventional shale res-
ervoirs is to understand the effects of organic richness (total organic carbon, TOC), mineralogy, microcracks, pore shape, and effective stress on elastic properties. The generation of petrophysical parameters, such as TOC, and quantification of total and organic porosities through a physically consis-tent petrophysical model are described. Rock-matrix den-sity, which is a key parameter in determining total porosity, is estimated as a function of the amount of TOC and its level of maturity. Then the petrophysical parameters are used as inputs for rock-physics modeling to constrain the bedding-normal compressional-wave velocity as a function of various parameters (e.g., TOC, porosity, mineralogy, pore shapes, and microcrack density) in combination with effective stress. Modeling results on three shale plays from North America show that compressional-wave velocity in these specific for-mations is controlled mainly by variations in TOC, mineral-ogy, and pore shape. Shear-wave velocity in organic shales also was refined as a function of compressional-wave velocity and amount of TOC.
IntroductionSuccessful development of shale plays depends on a synergy
of integration that spans a wide range of disciplines. An inte-grated workflow for organic-rich shale reservoirs involves cal-ibration of core and well-log data, building petrophysical and rock-physics models, and finally characterizing the key reservoir parameters (TOC, porosity, and natural fractures) and mechan-ical properties necessary for a “frackability” evaluation from seismic data (Vernik and Milovac, 2011; Slatt et al., 2012). Seis-mic and petrophysical properties of organic-rich shale reservoirs and the relationships among those properties are important for exploration and reservoir management.
The main objective of this article is the application and veri-fication of the published petrophysical and rock-physics mod-els (Alfred and Vernik, 2012; Khadeeva and Vernik, 2014) to constrain the seismic rock-property logs in organic mudstones. Quality checks on input data are often the first and most impor-tant step toward an integrated shale reservoir-characterization workflow. It is also of interest to compare physical properties of different unconventional shale reservoirs and feasibility of their determination from seismic data.
The data set includes one vertical well each from the Bar-nett and Marcellus (both U.S.A.) and Eagle Ford (Mexico) shale plays. Each well has a standard set of wireline measure-ments, including gamma-ray (GR), deep resistivity, density, and sonic. Barnett and Marcellus wells have geochemical core data such on TOC and vitrinite reflectance (Ro), which is a well-accepted thermal maturity indicator. The shales
Malleswar Yenugu1 and Lev Vernik2
sampled have different mineral composition, TOC, and effective stress. However, all three data sets are character-ized by about the same thermal maturity based on Ro rang-ing from 1.3% to 1.6%, which places the organic mudstones studied in the wet-gas window. Published standard and seis-mic-petrophysics models help to quality-check and constrain the log data by selecting the relevant set of input parameters, some of which can be derived only from core measurements. TOC is measured in weight percent, and kerogen, K, is in volume fractions.
Respectively, the methodology used in this article is as follows:
• petrophysical analysis to determine key reservoir parame-ters, such as TOC and total porosity, and to estimate organic porosity
• rock-physics modeling to constrain VP as a function of min-eralogy, TOC, porosity, pore shape, crack density, and effec-tive stress
• prediction of VS as a function of VP and TOC
TOC and porosity estimation through a physically consistent model
One of the key challenges of organic-rich shale reservoirs is the determination of total porosity and its variation in the logged interval. Detailed microstructural studies (e.g., Loucks et al., 2012) show that two types of pore systems exist in unconventional shale reservoirs: (1) organic porosity and (2) inorganic porosity.
Hydrocarbons produced during transformation of kerogen are stored in porous organic matter, and the process is likely to be accompanied by significant overpressure generation and sub-horizontal microcrack development, at least during the early stages of thermal maturation (e.g., Vernik and Nur, 1992). The evolution of organic porosity is a function of thermal maturity, and because of the hydrophobic nature (oil wet) of mature kero-gen, this organic porosity is occupied by hydrocarbons. Water predominantly resides in the nonorganic phase of the rock (Alfred and Vernik, 2012). Therefore, understanding the poros-ity evolution in organic-rich shales is the key to an integrated workflow for unconventional shales. Clearly, porosity-log cal-culations using the conventional approach might be subject to errors because of the variable mineralogy and TOC and should be adjusted accordingly.
Alfred and Vernik (2012) propose a physically consistent petrophysical model that subdivides organic shale into organic and inorganic domains with their associated porosities. One of the main advantages of this model is that it is useful in con-straining the organic porosity created by the thermal matura-tion process. The petrophysical model predicts bulk density and total porosity as a function of mineralogy, TOC, and organic
1Ikon Science Americas.2Seismic Petrophysics LLC.
DOI information... http://dx.doi.org/10.1190/tle34101xxx.1.
November 2 01 5 T H E L E A D I N G E D G E 937Special Section: R e s o u rce p l ay s I : R o c k p hy s i c s
porosity. It is instructive to apply it to our shale data set, which is, as mentioned above, characterized by about the same level of thermal maturity.
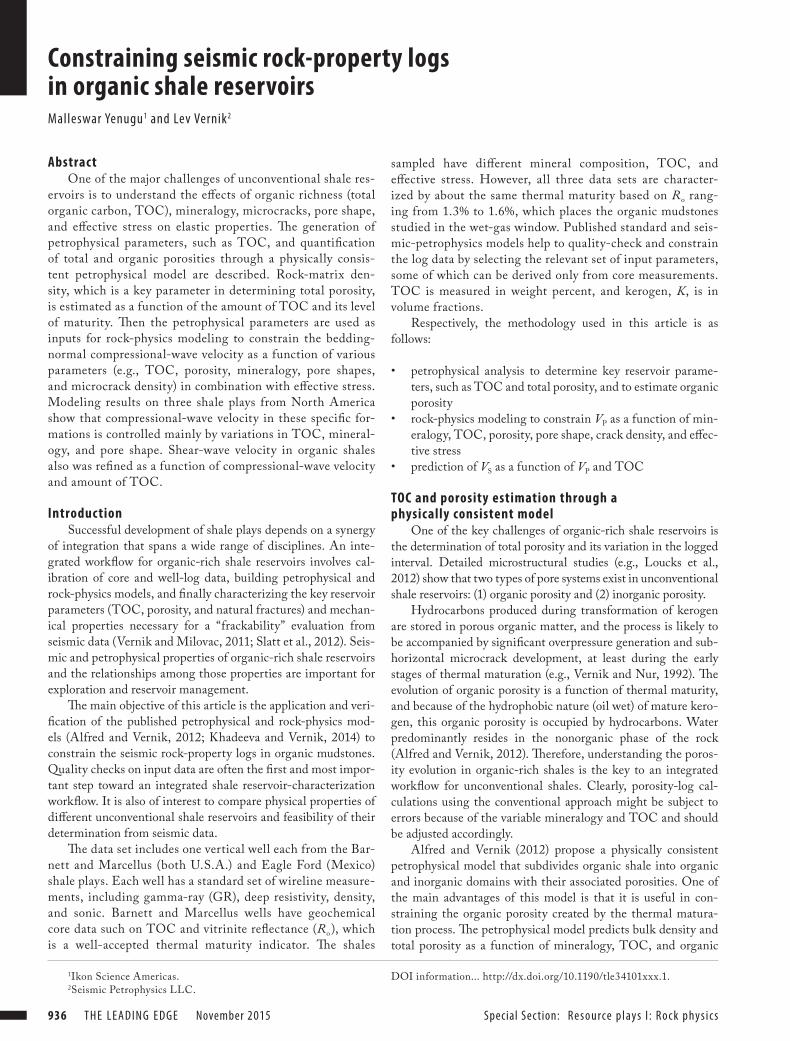
The TOC log in this model is computed based on the Passey et al. (1990) technique. Figure 1 shows well logs with predicted TOC log for a Marcellus Shale well. Core TOC measurements are shown as red balls in the same track with the predicted TOC log. We find a good correlation between predicted TOC log and core TOC measurements.
The total porosity of the system, based on the density log, is given by
φ =(ρm − ρb )(ρm − ρf )
, (1)
where φ is total porosity, ρm is matrix density, ρb is bulk density from log measurement, and ρf is fluid density. The matrix density in equation 1 is expressed as (Alfred and Vernik, 2012)
ρm =Ckρkρnk
TOC(ρnk − ρk )+Ckρk
, (2)
where Ck is the carbon content in kerogen, ρnk is solid density on a kerogen-free basis, and ρk is solid kerogen density. The more thermally mature the shale is, the more kerogen converts to hydrocarbons, resulting in the increase of both carbon concen-tration and kerogen density.
Table 1 gives input parameters for the petrophysical model based on available core data. We used the same set of input parameters for both Barnett and Marcellus shales. A different set of parameters (notably, the “nonkerogen” phase porosity, φnk, as well as ρk, Ck, and ρf) is used for Eagle Ford Shale.
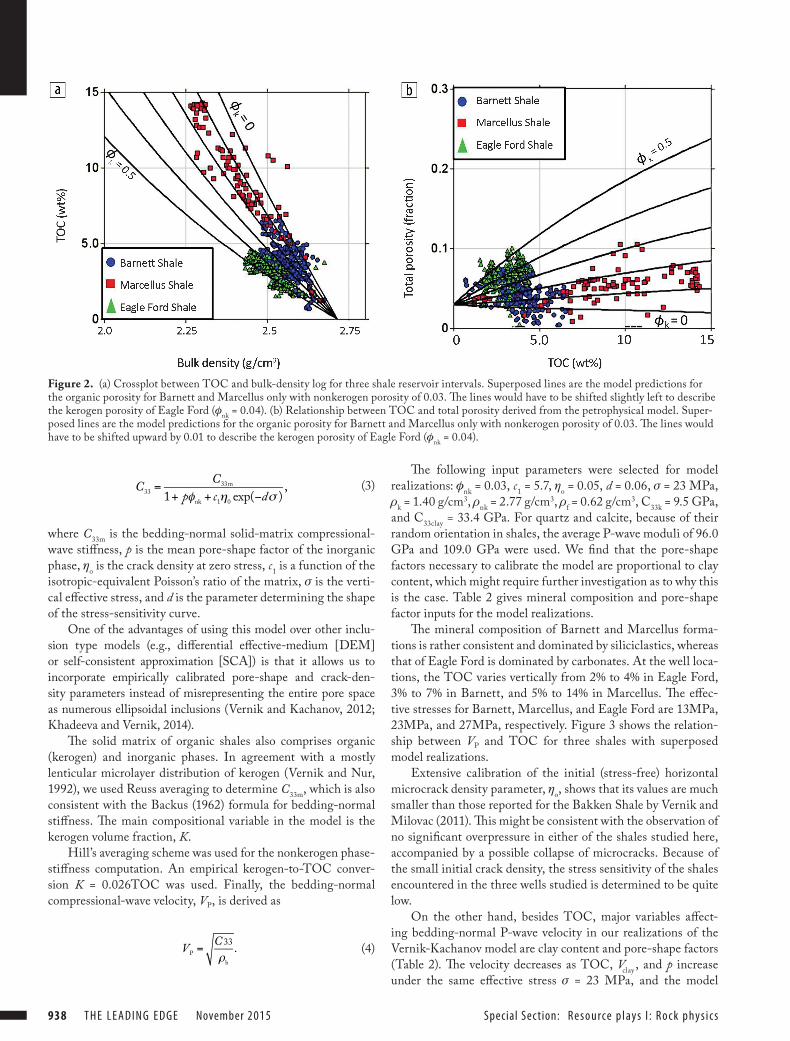
Figure 2 shows the petrophysical parameters (bulk density, TOC, and total porosity) estimated for three shale plays. The model lines for organic porosity (φk from 0 to 0.5), shown as a template, are computed from the input parameters for Barnett and Eagle Ford shales (Table 1). Even though the Eagle Ford cloud is added on the plots, a slightly different template will have to be computed to match the carbonate-rich mudstones of this formation.
Figure 2a illustrates the relation between bulk density and TOC logs, with organic porosity as a third variable. The lines of constant organic porosity can be deemed as maturity indica-tors at least up to the onset of the dry-gas window. Figure 2b similarly shows the relation between total porosity and TOC, with the organic porosity template applicable to Barnett and Marcellus only.
Both plots indicate that secondary (organic) porosity is generated in these shales as a function of thermal maturity, almost doubling the prematuration, inorganic porosity of 3% to 4%. It cannot be ruled out that at later maturation stages with high temperature and effective stress, the potential for further organic porosity generation might be weakened. At the same time, the potential for organic pore collapse is increased, which might result in organic porosity reduction.
Rock-physics modelComprehensive rock-physics models are quite useful in con-
straining seismic rock-property logs and predicting them from other log and seismic data. Reservoir properties such as miner-alogy, porosity, and TOC, as well as subhorizontal microcrack density and stress state, can significantly affect the bedding-nor-mal sound-wave velocities in organic shale reservoirs. Over the last two decades, more insight has been gained on the impact of solid organic matter on elastic properties (e.g., Vernik and Nur, 1992) as well as the effects of clay platelet orientation and pore geometry (e.g., Hornby et al., 1994).
Khadeeva and Vernik (2014) propose a more comprehen-sive petroelastic model to estimate P- and S-wave velocities as a function of solid matrix moduli, porosity, pore-shape factor, crack density, and effective stress. The model adapts the Vernik and Kachanov (2010) approach to the bedding-normal elastic stiffness of organic shale reservoirs and can be reduced to the noninteraction approximation (NIA) to pre-dict partially dry stiffnesses.
The compressional-wave stiffness in normal to bedding direction for a VTI medium, such as the vast majority of organic shales, in this approach is given by
Figure 1. Well-log template for Marcellus Shale well. Predicted TOC log with core data (red dots) is shown in the middle track. The VP-versus-resistivity separation is shaded and used in TOC log computation.
Table 1. Input parameters for the petrophysical model. Note that fluid density (ρf) is the effective fluid density of the rock.
ρnk(g/cm3)
φnk(fraction)
ρk(g/cm3)
Ckρf
(g/cm3)ρhc
(g/cm3)ρw
(g/cm3)Barnett and Marcellus 2.77 0.03 1.42 86 0.62 0.25 1.05
Eagle Ford 2.77 0.04 1.30 80 0.55 0.25 1.05
938 T H E L E A D I N G E D G E November 2 01 5 Special Section: R e s o u rce p l ay s I : R o c k p hy s i c s
C33 =C33m
1+ pφnk + c1η0 exp(−dσ ), (3)
where C33m is the bedding-normal solid-matrix compressional-wave stiffness, p is the mean pore-shape factor of the inorganic phase, ηo is the crack density at zero stress, c1 is a function of the isotropic-equivalent Poisson’s ratio of the matrix, σ is the verti-cal effective stress, and d is the parameter determining the shape of the stress-sensitivity curve.
One of the advantages of using this model over other inclu-sion type models (e.g., differential effective-medium [DEM] or self-consistent approximation [SCA]) is that it allows us to incorporate empirically calibrated pore-shape and crack-den-sity parameters instead of misrepresenting the entire pore space as numerous ellipsoidal inclusions (Vernik and Kachanov, 2012; Khadeeva and Vernik, 2014).
The solid matrix of organic shales also comprises organic (kerogen) and inorganic phases. In agreement with a mostly lenticular microlayer distribution of kerogen (Vernik and Nur, 1992), we used Reuss averaging to determine C33m, which is also consistent with the Backus (1962) formula for bedding-normal stiffness. The main compositional variable in the model is the kerogen volume fraction, K.
Hill’s averaging scheme was used for the nonkerogen phase-stiffness computation. An empirical kerogen-to-TOC conver-sion K = 0.026TOC was used. Finally, the bedding-normal compressional-wave velocity, VP, is derived as
VP =C 33
ρb
. (4)
The following input parameters were selected for model realizations: φnk = 0.03, c1 = 5.7, ηo = 0.05, d = 0.06, σ = 23 MPa, ρk = 1.40 g/cm3, ρnk = 2.77 g/cm3, ρf = 0.62 g/cm3, C33k = 9.5 GPa, and C33clay = 33.4 GPa. For quartz and calcite, because of their random orientation in shales, the average P-wave moduli of 96.0 GPa and 109.0 GPa were used. We find that the pore-shape factors necessary to calibrate the model are proportional to clay content, which might require further investigation as to why this is the case. Table 2 gives mineral composition and pore-shape factor inputs for the model realizations.
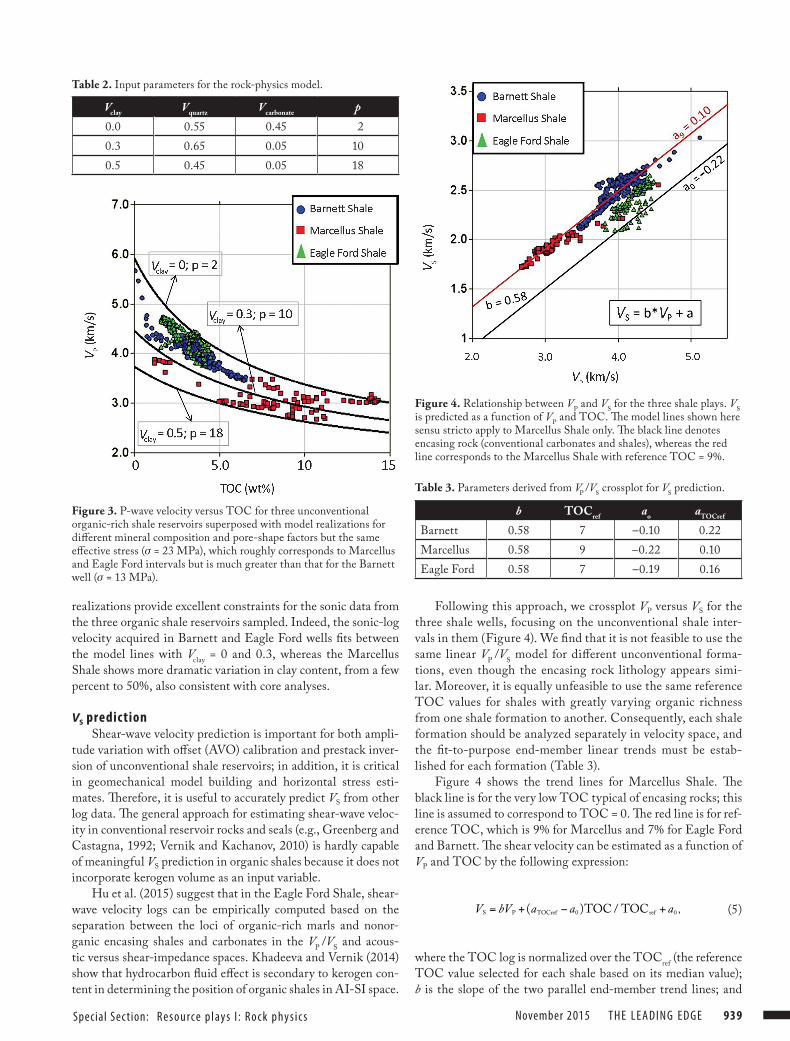
The mineral composition of Barnett and Marcellus forma-tions is rather consistent and dominated by siliciclastics, whereas that of Eagle Ford is dominated by carbonates. At the well loca-tions, the TOC varies vertically from 2% to 4% in Eagle Ford, 3% to 7% in Barnett, and 5% to 14% in Marcellus. The effec-tive stresses for Barnett, Marcellus, and Eagle Ford are 13MPa, 23MPa, and 27MPa, respectively. Figure 3 shows the relation-ship between VP and TOC for three shales with superposed model realizations.
Extensive calibration of the initial (stress-free) horizontal microcrack density parameter, ηo, shows that its values are much smaller than those reported for the Bakken Shale by Vernik and Milovac (2011). This might be consistent with the observation of no significant overpressure in either of the shales studied here, accompanied by a possible collapse of microcracks. Because of the small initial crack density, the stress sensitivity of the shales encountered in the three wells studied is determined to be quite low.
On the other hand, besides TOC, major variables affect-ing bedding-normal P-wave velocity in our realizations of the Vernik-Kachanov model are clay content and pore-shape factors (Table 2). The velocity decreases as TOC, Vclay , and p increase under the same effective stress σ = 23 MPa, and the model
Figure 2. (a) Crossplot between TOC and bulk-density log for three shale reservoir intervals. Superposed lines are the model predictions for the organic porosity for Barnett and Marcellus only with nonkerogen porosity of 0.03. The lines would have to be shifted slightly left to describe the kerogen porosity of Eagle Ford (φnk = 0.04). (b) Relationship between TOC and total porosity derived from the petrophysical model. Super-posed lines are the model predictions for the organic porosity for Barnett and Marcellus only with nonkerogen porosity of 0.03. The lines would have to be shifted upward by 0.01 to describe the kerogen porosity of Eagle Ford (φnk = 0.04).
November 2 01 5 T H E L E A D I N G E D G E 939Special Section: R e s o u rce p l ay s I : R o c k p hy s i c s
realizations provide excellent constraints for the sonic data from the three organic shale reservoirs sampled. Indeed, the sonic-log velocity acquired in Barnett and Eagle Ford wells fits between the model lines with Vclay = 0 and 0.3, whereas the Marcellus Shale shows more dramatic variation in clay content, from a few percent to 50%, also consistent with core analyses.
VS predictionShear-wave velocity prediction is important for both ampli-
tude variation with offset (AVO) calibration and prestack inver-sion of unconventional shale reservoirs; in addition, it is critical in geomechanical model building and horizontal stress esti-mates. Therefore, it is useful to accurately predict VS from other log data. The general approach for estimating shear-wave veloc-ity in conventional reservoir rocks and seals (e.g., Greenberg and Castagna, 1992; Vernik and Kachanov, 2010) is hardly capable of meaningful VS prediction in organic shales because it does not incorporate kerogen volume as an input variable.
Hu et al. (2015) suggest that in the Eagle Ford Shale, shear-wave velocity logs can be empirically computed based on the separation between the loci of organic-rich marls and nonor-ganic encasing shales and carbonates in the VP /VS and acous-tic versus shear-impedance spaces. Khadeeva and Vernik (2014) show that hydrocarbon fluid effect is secondary to kerogen con-tent in determining the position of organic shales in AI-SI space.
Following this approach, we crossplot VP versus VS for the three shale wells, focusing on the unconventional shale inter-vals in them (Figure 4). We find that it is not feasible to use the same linear VP /VS model for different unconventional forma-tions, even though the encasing rock lithology appears simi-lar. Moreover, it is equally unfeasible to use the same reference TOC values for shales with greatly varying organic richness from one shale formation to another. Consequently, each shale formation should be analyzed separately in velocity space, and the fit-to-purpose end-member linear trends must be estab-lished for each formation (Table 3).
Figure 4 shows the trend lines for Marcellus Shale. The black line is for the very low TOC typical of encasing rocks; this line is assumed to correspond to TOC = 0. The red line is for ref-erence TOC, which is 9% for Marcellus and 7% for Eagle Ford and Barnett. The shear velocity can be estimated as a function of VP and TOC by the following expression:
VS = bVP + (aTOCref − a0 )TOC / TOCref + a0 , (5)
where the TOC log is normalized over the TOCref (the reference TOC value selected for each shale based on its median value); b is the slope of the two parallel end-member trend lines; and
Figure 3. P-wave velocity versus TOC for three unconventional organic-rich shale reservoirs superposed with model realizations for different mineral composition and pore-shape factors but the same effective stress (σ = 23 MPa), which roughly corresponds to Marcellus and Eagle Ford intervals but is much greater than that for the Barnett well (σ = 13 MPa).
Figure 4. Relationship between VP and VS for the three shale plays. VS is predicted as a function of VP and TOC. The model lines shown here sensu stricto apply to Marcellus Shale only. The black line denotes encasing rock (conventional carbonates and shales), whereas the red line corresponds to the Marcellus Shale with reference TOC = 9%.
Table 2. Input parameters for the rock-physics model.
Vclay Vquartz Vcarbonate p0.0 0.55 0.45 20.3 0.65 0.05 100.5 0.45 0.05 18
Table 3. Parameters derived from VP /VS crossplot for VS prediction.
b TOCref ao aTOCref
Barnett 0.58 7 –0.10 0.22Marcellus 0.58 9 –0.22 0.10Eagle Ford 0.58 7 –0.19 0.16
940 T H E L E A D I N G E D G E November 2 01 5 Special Section: R e s o u rce p l ay s I : R o c k p hy s i c s
ao and aTOCref are the intercepts for 0% TOC and TOCref value, respectively. Table 3 lists those input parameters derived sepa-rately for each well and formation.
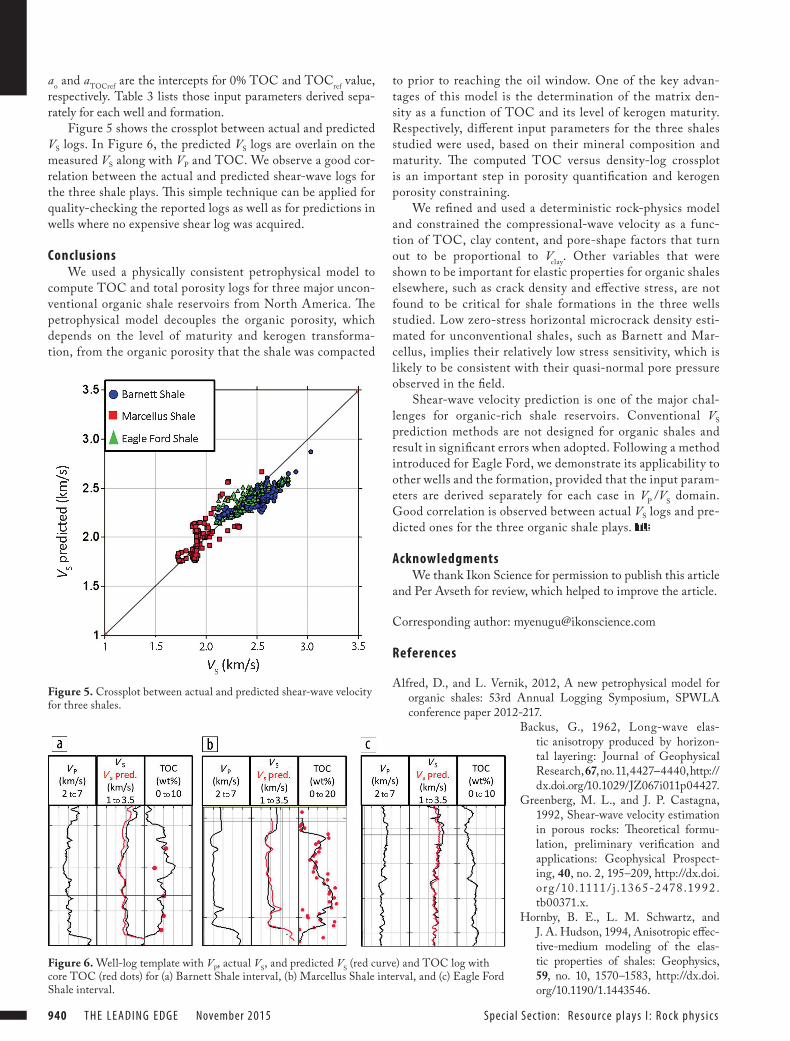
Figure 5 shows the crossplot between actual and predicted VS logs. In Figure 6, the predicted VS logs are overlain on the measured VS along with VP and TOC. We observe a good cor-relation between the actual and predicted shear-wave logs for the three shale plays. This simple technique can be applied for quality-checking the reported logs as well as for predictions in wells where no expensive shear log was acquired.
ConclusionsWe used a physically consistent petrophysical model to
compute TOC and total porosity logs for three major uncon-ventional organic shale reservoirs from North America. The petrophysical model decouples the organic porosity, which depends on the level of maturity and kerogen transforma-tion, from the organic porosity that the shale was compacted
to prior to reaching the oil window. One of the key advan-tages of this model is the determination of the matrix den-sity as a function of TOC and its level of kerogen maturity. Respectively, different input parameters for the three shales studied were used, based on their mineral composition and maturity. The computed TOC versus density-log crossplot is an important step in porosity quantification and kerogen porosity constraining.
We refined and used a deterministic rock-physics model and constrained the compressional-wave velocity as a func-tion of TOC, clay content, and pore-shape factors that turn out to be proportional to Vclay. Other variables that were shown to be important for elastic properties for organic shales elsewhere, such as crack density and effective stress, are not found to be critical for shale formations in the three wells studied. Low zero-stress horizontal microcrack density esti-mated for unconventional shales, such as Barnett and Mar-cellus, implies their relatively low stress sensitivity, which is likely to be consistent with their quasi-normal pore pressure observed in the field.
Shear-wave velocity prediction is one of the major chal-lenges for organic-rich shale reservoirs. Conventional VS prediction methods are not designed for organic shales and result in significant errors when adopted. Following a method introduced for Eagle Ford, we demonstrate its applicability to other wells and the formation, provided that the input param-eters are derived separately for each case in VP /VS domain. Good correlation is observed between actual VS logs and pre-dicted ones for the three organic shale plays.
AcknowledgmentsWe thank Ikon Science for permission to publish this article
and Per Avseth for review, which helped to improve the article.
Corresponding author: [email protected]
References
Alfred, D., and L. Vernik, 2012, A new petrophysical model for organic shales: 53rd Annual Logging Symposium, SPWLA conference paper 2012-217.
Backus, G., 1962, Long-wave elas-tic anisotropy produced by horizon-tal layering: Journal of Geophysical Research, 67, no. 11, 4427–4440, http://dx.doi.org/10.1029/JZ067i011p04427.
Greenberg, M. L., and J. P. Castagna, 1992, Shear-wave velocity estimation in porous rocks: Theoretical formu-lation, preliminary verification and applications: Geophysical Prospect-ing, 40, no. 2, 195–209, http://dx.doi.org/10 .1111/ j .1365-2478 .1992 .tb00371.x.
Hornby, B. E., L. M. Schwartz, and J. A. Hudson, 1994, Anisotropic effec-tive-medium modeling of the elas-tic properties of shales: Geophysics, 59, no. 10, 1570–1583, http://dx.doi.org/10.1190/1.1443546.
Figure 5. Crossplot between actual and predicted shear-wave velocity for three shales.
Figure 6. Well-log template with VP, actual VS, and predicted VS (red curve) and TOC log with core TOC (red dots) for (a) Barnett Shale interval, (b) Marcellus Shale interval, and (c) Eagle Ford Shale interval.
November 2 01 5 T H E L E A D I N G E D G E 941Special Section: R e s o u rce p l ay s I : R o c k p hy s i c s
Hu, R., L. Vernik, L. Nayvelt, and A. Dicman, 2015, Seismic inver-sion for organic richness and fracture gradient in unconventional reservoirs: Eagle Ford Shale, Texas: The Leading Edge, 34, no. 1, 80–84, http://dx.doi.org/10.1190/tle34010080.1.
Khadeeva, Y., and L. Vernik, 2014, Rock-physics model for uncon-ventional shales: The Leading Edge, 33, no. 3, 318–322, http://dx.doi.org/10.1190/tle33030318.1.
Loucks, R. G., R. M. Reed, S. C. Ruppel, and U. Hammes, 2012, Spectrum of pore types and networks in mudrocks and a descriptive classification for matrix-related mudrock pores: AAPG Bulletin, 96, no. 6, 1071–1098, http://dx.doi.org/10.1306/08171111061.
Passey, Q. R., S. Creaney, J. B. Kulla, F. J. Moretti, and J. D. Stroud, 1990, A practical model for organic richness from porosity and resistivity logs: AAPG Bulletin, 74, 1777–1794.
Slatt, R. M., P. R. Philp, Y. Abousleiman, P. Singh, R. Perez, R. Por-tas, K. J. Marfurt, S. Madrid-Arroyo, N. O’Brien, E. V. Eslinger, and E. T. Baruch, 2012, Pore-to-regional-scale integrated char-acterization workflow for unconventional gas shales, in J. A. Breyer, ed., Shale reservoirs — Giant resources for the 21st cen-tury: AAPG Memoir 97, 127–150.
Vernik, L., and M. Kachanov, 2010, Modeling elastic properties of siliciclastic rocks: Geophysics, 75, no. 6, E171–E182, http://dx.doi.org/10.1190/1.3494031.
Vernik, L., and M. Kachanov, 2012, On some controversial issues in rock physics: The Leading Edge, 31, no. 6, 636–642, http://dx.doi.org/10.1190/tle31060636.1.
Vernik, L., and J. Milovac, 2011, Rock physics of organic shales: The Leading Edge, 30, no. 3, 318–323, http://dx.doi.org/10.1190/1.3567263.
Vernik, L., and A. Nur, 1992, Petrophysical classification of silici-clastics for lithology and porosity prediction from seismic veloci-ties: AAPG Bulletin, 76, no. 9, 1295–1309.


![Review of Well Logs and Petrophysical Approaches for … quickly identified with the log curves [4, 10]. The well logs response analysis for shale gas reservoir ... 7 Sidewall Coring](https://img.pdfslide.net/doc/110x75/5ac838727f8b9aa1298c00f5/review-of-well-logs-and-petrophysical-approaches-for-quickly-identified-with.jpg)