Embed Size (px)
Citation preview

J. theor. Biol. (2003) 221, 309–325doi:10.1006/jtbi.2003.3071, available online at http://www.idealibrary.com on
n
+1E
002
Constraints-based models: Regulation of Gene Expression Reducesthe Steady-state Solution Space
MarkusW. Covertw and Bernhard O. Palssonnw
wDepartment of Bioengineering, University of California, San Diego, 9500 Gilman Drive,La Jolla, CA 92093-0412, U.S.A.
(Received on 17 December 2001, Accepted in revised form on 25 April 2002)
Constraints-based models have been effectively used to analyse, interpret, and predict thefunction of reconstructed genome-scale metabolic models. The first generation of thesemodels used ‘‘hard’’ non-adjustable constraints associated with network connectivity,irreversibility of metabolic reactions, and maximal flux capacities. These constraints restrictthe allowable behaviors of a network to a convex mathematical solution space whose edgesare extreme pathways that can be used to characterize the optimal performance of a networkunder a stated performance criterion. The development of a second generation of constraints-based models by incorporating constraints associated with regulation of gene expression wasdescribed in a companion paper published in this journal, using flux-balance analysis togenerate time courses of growth and by-product secretion using a skeleton representation ofcore metabolism. The imposition of these additional restrictions prevents the use of a subsetof the extreme pathways that are derived from the ‘‘hard’’ constraints, thus reducing thesolution space and restricting allowable network functions. Here, we examine the reductionof the solution space due to regulatory constraints using extreme pathway analysis. Theimposition of environmental conditions and regulatory mechanisms sharply reduces thenumber of active extreme pathways. This approach is demonstrated for the skeleton systemmentioned above, which has 80 extreme pathways. As regulatory constraints are applied tothe system, the number of feasible extreme pathways is reduced to between 26 and 2 extremepathways, a reduction of between 67.5 and 97.5%. The method developed here provides away to interpret how regulatory mechanisms are used to constrain network functions andproduce a small range of physiologically meaningful behaviors from all allowable networkfunctions.
r 2003 Elsevier Science Ltd. All rights reserved.
Introduction
The recent torrent of genome annotations andsubsequent metabolic reconstructions has ledto the development of mathematical modelingapproaches to analyse the integrated behavior ofmicrobial cells on a genome scale (Tomita et al.,
Corresponding author. Tel.: +1-858-534-5668; fax:-858-822-3120.-mail address: [email protected] (B.O. Palsson).
2-5193/03/$35.00
1999; Gombert & Nielsen, 2000; Varner, 2000;Covert et al., 2001a). A constraints-basedapproach to studying metabolic models in silicohas proven effective in the analysis of thesegenome-scale models (Palsson, 2000). The state-ment of governing constraints defines a solutionspace within which optimal solutions can befound using linear optimization (Varma &Palsson, 1994a; Bonarius et al., 1997; Edwardset al., 1999). This constraints-based approach
r 2003 Elsevier Science Ltd. All rights reserved.

M. W. COVERT AND B. O. PALSSON310
has been useful in generating hypotheses in silicowhich may be tested experimentally (Varma &Palsson, 1994b, c). The result thus far has beena surprising degree of correlation between thepredictions of genome-scale models and inde-pendently obtained experimental data (Edwards& Palsson, 2000; Edwards et al., 2001). Thestudy of the characteristics of the solution spaceuses principles of convex analysis (Schilling et al.,1999; Schilling & Palsson, 2000). ‘‘Extremepathways’’ are calculated as edges of the solutionspace, where the optimal solution must lie(Schilling et al., 2000a). Taken together, theformulation of ‘‘hard’’ constraints associatedwith network connectivity, reaction irreversibil-ity, and maximal flux restrictions, has led to theformulation and testing of what might be calledthe first generation of constraints-based modelsof biochemical reaction networks.
A logical next step in adding to the function-ality of these genome-scale models is to incor-porate regulation of gene expression. Severalapproaches have been used to model metabolicand regulatory events, beginning with Booleanrepresentation of genetic circuits (Thomas, 1973,1991; Kaufman et al., 1985; Kauffman, 1993;Thieffry & Thomas, 1995; Somogyi & Sniegoski,1996), which is advantageously simple but lacksthe ability to make quantitative predictions. Onthe other hand, deterministic approaches (Reich& Sel’kov, 1981; Fell, 1996; Heinrich & Schuster,1996; Wong et al., 1997; Stephanopoulos et al.,1998) may be combined with Boolean logic(McAdams & Shapiro, 1995), fuzzy logic (Leeet al., 1999), or cybernetic principles (Kompalaet al., 1986; Varner, 2000) to model regulatoryand metabolic events. Stochastic modelingapproaches have also been developed to accountfor the low concentrations, spatial isolation, andslow reaction rates which characterize metabolicreactions in a single cell (McAdams & Arkin,1997, 1998, 1999). Both deterministic andstochastic modeling approaches have been lim-ited by the lack of experimental methods todetermine kinetic and other parameters, as wellas the computational difficulties of developingthese models on a genome-scale (Bailey, 2001).
The constraints-based approach to modelingmicrobial metabolism has recently beenexpanded to incorporate regulatory constraints
(Covert et al., 2001b). Regulatory constraintsdiffer from the rigid physico-chemical con-straints in two important ways; they are (1)self-imposed, meaning that over time, evolutionhas selected the development of complex me-chanisms to restrict the allowable behaviors ofthese organisms under various conditions; and(2) time dependent, in that the state of theexternal and internal environment at a giventime point determines transcriptional activity.As a result of these two features, the effectsof transcriptional regulation can be treated astemporary constraints on the metabolic system.These constraints reduce the size of the solutionspace and change its shape from one environ-mental condition to another (Fig. 1).
In this paper we continue the work describedin an earlier manuscript published in this journal(Covert et al., 2001b), where regulatory eventsand gene expression were described using Boo-lean logic equations. For a given environment,we determine the corresponding regulatoryconstraints (e.g. repression of gene transcription)and eliminate extreme pathways that are incon-sistent with the imposed regulatory constraints.This procedure reduces the solution space andcustomizes it for the given environmental condi-tions. The inclusion of known regulatorymechanisms effectively moves us toward theformulation of second-generation constraints-based models of complex biochemical reactionnetworks: models that combine metabolicflux-balance formalism and regulation of geneexpression.
Methods
SAMPLE METABOLIC NETWORK
A skeleton network of core metabolism wasformulated earlier (Covert et al., 2001b). Itincludes 20 reactions, seven of which aregoverned by regulatory logic. This network is ahighly simplified representation of core meta-bolic processes (e.g. glycolysis, the pentosephosphate pathway, TCA cycle, fermentationpathways, amino acid biosynthesis and cellgrowth), along with corresponding regulation(e.g. catabolite repression, aerobic/anaerobicregulation, amino acid biosynthesis regulationand carbon storage regulation). A schematic of

P1
P2
P3
P4
P3
P4
P2
P3
P4
P1
P2
P3
P4
P1 is not permitted due to regulatory constraints
P1
P2
Flux
C
Flux B
Flux A
Flux AFlux B
Flux
C
Fig. 1. Regulatory constraints reduce the steady-statesolution space of a metabolic network. A solution spacebounded by invariant constraints on the network is shown.Extreme pathways may be calculated as the unique,systemically independent generating vectors for the space.In the space on top, all of the pathways are consideredavailable to the system (denoted by the highlighted grayboxes at right). Under certain environments however,regulatory constraints may cause one or more of theextreme pathways to be temporarily unavailable to thesystem, P1 in the case shown here. This results in a morerestricted space with a reduced volume and/or dimension(bottom), corresponding to a metabolic network with feweravailable behaviors.
REGULATION: SOLUTION SPACE REDUCTION 311
this skeleton network is shown in Fig. 2, togetherwith a table containing all of the relevantchemical reactions and regulatory rules whichgovern the transcriptional regulation.
EXTREME PATHWAYS
The steady-state behavior of a metabolicsystem may be characterized as
Sv ¼ 0; ð1Þ
where Sm�n (m metabolites� n fluxes) is thestoichiometric matrix for the network and vn�1 isa vector of the flux levels through each reactionin the system. Certain constraints on the system,
such as the thermodynamics of reactions or theconstraints associated with enzyme capacity (e.g.maximum metabolite uptake and/or secretionrates) may be represented as upper and lowerbounds on reaction flux levels. If reaction fluxesare also constrained to positive values by decom-posing reversible reactions in S into forward andreverse components, a solution space may begeometrically defined for the system as a convexpolyhedral cone in n-dimensional space (Schillinget al., 2000a). Such a space contains everypossible steady-state flux distribution availableto the system, subject to the given constraints.
A minimal set of generating vectors may bedetermined for the convex polyhedral cone usingprinciples of convex analysis. This set is approxi-mately analogous to a basis in linear algebra.The generating vectors span the null space ofS and are the edges of the cone (Schilling &Palsson, 1998). Given that the cone representsthe metabolic flux solution space at steady state,each generating vector or extreme ray corre-sponds to a particular pathway or active set offluxes in the metabolic network and is termed anextreme pathway. Every possible steady-stateflux distribution of a metabolic network maytherefore be represented as a positive combina-tion of extreme pathways:
C ¼ v : v ¼Xk
i¼1
aipi; aiX0;8i
( ); ð2Þ
where C is the polyhedral cone representingthe metabolic network at steady state and pi
represents the extreme pathway vectors (Schil-ling et al., 1999). The algorithm used to generateextreme pathways has been described in detail(Schilling et al., 2000b).
BOOLEAN LOGIC DESCRIPTION OF ENVIRONMENTAL
AND REGULATORY CONSTRAINTS
Boolean logic formalism can be used torepresent regulatory constraints (Covert et al.,2001b) where a gene is considered in one of twostates: active (ON) or inactive (OFF). Here, thisformalism is also used to describe environmentalconstraints where a substrate is considered eitherpresent in (ON) or absent from (OFF) theexternal medium. The regulatory rules are listed

Oxygen
A
B
ATP
Tc1
R1
C
Biomass
R4
R2a
Rz
2 NADH
0.2 C2 ATP3 NADH
10 ATP
2 ATP
3 D
3 E4 NADH
R6
R7
ATPNADH
O2
Rres
Fext
F
G
R5a,b
R3
Hext
Carbon2
Tc2 Tf
ThH R8a,b
2 ATP3 NADH
R2b
Dext
Eext
Td
Te
1 ATP2 NADH
TO2
Carbon1REACTION NAME REGULATION
Metabolic ReactionsA + ATP B R1 B 2 ATP + 2 NADH + C R2a IF NOT(RPb)C + 2 ATP + 2 NADH B R2b B F R3 C G R4 G 0.8 C + 2 NADH R5a IF NOT (RPo2)G 0.8 C + 2 NADH R5b IF RPo2C 2 ATP + 3 D R6 C + 4 NADH 3 E R7 IF NOT (RPb) G + ATP + 2 NADH H R8a IF NOT (RPh) H G + ATP + 2 NADH R8b NADH + O2 ATP Rres IF NOT (RPo2)Transport Processes Carbon1 → A Tc1Carbon2 A Tc2 IF NOT(RPc1)Fext F Tf D Dext TdE Eext TeHext H ThOxygen O2 To2Maintenance and Growth ProcessesC + F + H + 10 ATP Biomass GrowthRegulatory Proteins
RPo2 IF NOT(Oxygen)RPc1 IF Carbon1RPh IF ThRPb IFR2b
→ →
→ →
→ →
→
→ →
→ →
→ → → → →
→ →
→
Fig. 2. A schematic of the simplified core metabolic network, together with a table containing the stoichiometry of the20 metabolic reactions, seven of which are regulated by four regulatory proteins. This network is a highly simplifiedrepresentation of core metabolic processes, including a glycolytic pathway with primary substrates carbon1 (C1) andcarbon2 (C2), as well as a pentose phosphate pathway and a TCA cycle, through which ‘‘amino acid’’ H enters the system.Fermentation pathways as well as amino acid biosynthesis are also represented. The regulation modeled in this studyincludes simplified versions of catabolite repression (e.g. preferential uptake of C1 over C2), aerobic/anaerobic regulation,amino acid (H) biosynthesis regulation and carbon storage regulation, and is also listed. The Growth reaction is indicated bya dashed line.
M. W. COVERT AND B. O. PALSSON312
in Fig. 2. Using these restrictions, an extremepathway may be determined infeasible (1) if theexternal nutrient is absent from the externalmedium (e.g. pathways that have oxygen as aninput would be inoperative in a simulation in ananaerobic environment); or (2) when expressionof the gene responsible for producing a meta-bolic flux has been repressed (e.g. if extracellularcarbon1 is present, then pathways which utilizeTc2 are considered infeasible due to the repres-sion of Tc2 transcription by carbon1). Conver-sely, a pathway is feasible for a certain conditionif it is consistent with all the applicable environ-mental and regulatory constraints.
PHENOTYPIC PHASE PLANE ANALYSIS
Phenotypic phase planes (PhPPs) are two-dimensional representations of the solutionspace (Edwards & Palsson, 1999; Schilling et al.,2000a). Once the axes of the PhPP are set(generally uptake rates of two nutrients such asoxygen and a carbon source), flux maps whichare optimal with respect to growth may becalculated for each point in the plane. The linesin a PhPP demarcate a change in the flux map;
these lines are determined using the shadowprices (the dual solution in linear programming).PhPP analysis has recently been used to demon-strate the optimal growth of E. coli on succinateand acetate minimal media (Edwards et al., 2001).
Results
A total of 80 extreme pathways were calcu-lated for the simplified metabolic system shownin Fig. 2. They are all shown graphically in theAppendix. The numbering of the extreme path-ways is arbitrary and corresponds to the orderin which the algorithm generates them. Giventhe five inputs to the metabolic network andrepresenting these inputs using Boolean logic,considering each as ON if present or OFF ifabsent, there are a total of 25¼ 32 possibleenvironments which may be recognized by thecell. These environments are listed in Table 1.For each environment, the transcription of severalof the enzymes in the network may be restricteddue to regulation. The constraints imposed onthe metabolic system by both the substratesavailable to (i.e. the external environment) andthe enzymes expressed in the cell (i.e. the internal

Table 1A list of all the possible environments which can be recognized by the system shown in Fig. 1, of which six
environments do not enable the cell to produce biomass
Environments Repressed enzymes Pathways Pathway list
C1 C2 F H O2 R5b R8a Tc2 26 P2, P4, P5, P6, P8, P9, P10, P12, P29, P30,P31, P32, P33, P34, P35, P36, P37, P38,P45, P46, P47, P48, P49, P50, P51, P52Detail in Fig. 4.
C1 C2 F H R5a R8a Rres Tc2 10 P39, P40, P41, P42, P43, P44, P49, P50,P51, P52
C1 C2 F O2 R5b Tc2 8 P29, P30, P33, P34, P45, P46, P49, P50C1 C2 F R5a Rres Tc2 4 P41, P42, P49, P50C1 C2 H O2 R5b R8a Tc2 14 P2, P5, P6, P9, P10, P30, P31, P34, P35,
P37, P46, P47, P50, P51C1 C2 H R5a R8a Rres Tc2 5 P39, P42, P43, P50, P51C1 C2 O2 R5b Tc2 4 P30, P34, P46, P50 Detail in Fig. 3C1 C2 R5a Rres Tc2 2 P42, P50C1 F H O2 R5b R8a Tc2 26 P2, P4, P5, P6, P8, P9, P10, P12, P29, P30,
P31, P32, P33, P34, P35, P36, P37, P38,P45, P46, P47, P48, P49, P50, P51, P52
C1 F H R5a R8a Rres Tc2 10 P39, P40, P41, P42, P43, P44, P49, P50,P51, P52
C1 F O2 R5b Tc2 8 P29, P30, P33, P34, P45, P46, P49, P50C1 F R5a Rres Tc2 4 P41, P42, P49, P50C1 H O2 R5b R8a Tc2 14 P2, P5, P6, P9, P10, P30, P31, P34, P35,
P37, P46, P47, P50, P51C1 H R5a R8a Rres Tc2 5 P39, P42, P43, P50, P51C1 O2 R5b Tc2 4 P30, P34, P46, P50C1 R5a Rres Tc2 2 P42, P50
C2 F H O2 R5b R8a 26 P3, P4, P5, P7, P8, P9, P11, P12, P57, P58,P59, P60, P61, P62, P63, P64, P65, P66,P73, P74, P75, P76, P77, P78, P79, P80
C2 F H R5a R8a Rres 10 P67, P68, P69, P70, P71, P72, P77, P78,P79, P80
C2 F O2 R5b 8 P57, P58, P61, P62, P73, P74, P77, P78C2 F R5a Rres 4 P69, P70, P77, P78C2 H O2 R5b R8a 14 P3, P5, P7, P9, P11, P58, P59, P62, P63,
P65, P74, P75, P78, P79C2 H R5a R8a Rres 5 P67, P70, P71, P78, P79C2 O2 R5b 4 P58, P62, P74, P78C2 R5a Rres 2 P70, P78
F H O2 R5b R8a 5 P4, P5, P8, P9, P12F H R2a R5a R7 R8a Rres 0F O2 R5b 0F R5a Rres 0
H O2 R2a R5b R7 R8a 2 P5, P9H R2a R5a R7 R8a Rres 0
O2 R5b 00
Note: For each environment, there is a set of enzymes which are repressed under the given environmental conditions. The extreme
pathways which remain feasible even under the combination of environmental and regulatory constraints are listed. For a schematic of each
of the pathways, see the Appendix. C1¼ carbon1, C2¼ carbon2, O2¼oxygen. Two of the environments are shown in more detail in Figs 3
and 4 and are labeled correspondingly.
REGULATION: SOLUTION SPACE REDUCTION 313
environment) reduce the number of extremepathways accessible to the cell at a given time.
Several interesting observations may be madefrom Table 1: first, 21 extreme pathways (P1,P13–P28 and P53–56, enclosed by a box in the
Appendix), although stoichiometrically feasible,are always impossible due to regulatory con-straints. Pathways P13–28 and P53–56 areinfeasible due to the fact that Rres is onlyexpressed aerobically while R5b is only expressed

M. W. COVERT AND B. O. PALSSON314
anaerobically. Therefore, any pathway thatincludes a flux through both Rres and R5b iseliminated. Similarly, pathways P1 and P13 areeliminated because a flux through R2b activates aregulatory protein that represses transcriptionof R7. Therefore, R2b and R7 cannot both beexpressed together. Note that P13 is infeasiblein either case.
Another interesting observation from Table 1is that several environments have identical ornear-identical sets of available extreme path-ways. For example, the environment containingcarbon1 (C1), carbon2 (C2), F, H, and oxygen(O2) has an identical extreme pathway list tothat for the environment containing C1, F, H,and O2. The reason is that Tc2, the transport fluxfor C2, is repressed in the presence of C1.Furthermore, the extreme pathway list for theenvironment containing C2, F, H, and O2 issimilar to the pathway lists for the previouslymentioned environments, different only in thatthe pathways which utilize the Tc1 fluxin the former pathway list are replaced bypathways which utilize the Tc2 flux in the latter.
Finally, Table 1 shows that the highestnumber of extreme pathways available to thecell is 26; the lowest is 2, corresponding to areduction in the number of availableextreme pathways between 67.5 and 97.5%. Arelatively simple dual-substrate environmentand the most complex environment wereexamined in more detail to more closely in-vestigate the effect of regulation on availablepathways.
EXAMPLE 1: GROWTH ON C1, C2, AND O2
The metabolic network was given C1, C2, andO2 as inputs and allowed biomass, Dext and Eext
Fig. 3. Extreme pathway reduction by constraints, using gran example. (a) The 80 total extreme pathways calculated for twith the pathway figures in the Appendix. The number of pathalways inconsistent with the regulatory rules (dark gray), thegray), then by 6 as the regulation corresponding to the specpathways which are consistent with all the regulatory and envithe thick dark arrows represent active fluxes. (c) The solutionwith the pathways and the line of optimality (the pathway wprojection of the space, superimposed on a two-dimensionalregion at left lies outside of the space and is therefore infeasib
as outputs. These conditions reduce the numberof extreme pathways available to the cell (Fig. 3).Initially, all 80 pathways are considered, and arerepresented schematically in Fig. 3(a). Twenty-one of the extreme pathways are always re-stricted by regulation, as discussed earlier; theboxes representing these pathways are darkenedin gray. By considering only the pathways withappropriate inputs and outputs based on the cellenvironment, 49 more pathways are eliminated(shaded in light gray). Of the ten remainingpathways, six are inconsistent with the givenregulation (C1 catabolite repression of the C2transport protein Tc2 or regulation due to theaerobic environment) (shown in black) and theflux maps for the remaining four extreme path-ways are shown in Fig. 3(b).
The resulting solution space is projected inthree dimensions (C1 uptake rate, oxygen uptakerate and growth rate), as shown in Fig. 3(c), withthe four feasible extreme pathways labeled. Allthe volume defined by these edges is accessible tothe cell. The corresponding range of growth anduptake rates can be attained by the cell underthese conditions.
The two-dimensional PhPP for growth on C1and O2 is shown in Fig. 3(d). This PhPP has twofeasible phases between the lines shown, whichrepresent the four extreme pathways available tothe system. For this case, the two-dimensionalprojection of the extreme pathways lies on theregion boundaries of the PhPP; pathways 46 and50 are both fermentative and therefore overlapin the PhPP (oxygen uptake rate¼ 0). Pathway30 is the line of optimality (Edwards et al., 2001,2002) as none of the carbon is lost in secretion ofby-products; pathway 34 includes secretion ofDext and therefore gives a lower biomass yield(inset) than pathway 30.
owth of the sample system in a C1 and C2 aerobic medium ashe system are represented by a grid, arranged to correspondways is reduced by 21 when pathways are removed which aren by 49 due to the specific environmental constraints (lightific environment is considered (black). The four remainingronmental constraints are shown schematically in (b), wherespace of the system, projected on a three-dimensional space,ith the greatest growth yield) noted. (d) A two-dimensionalphenotypic phase plane for the C1 and oxygen uptake. Thele.
"

(a)
42
50
62
74 78
70
58
46
3430
241
59 80 60
76
78
2 3 4 21 22 23
5 6 7 8 25 26 27 28
9 10 11 12 29 30 31 32
13 14 15 16 33 34 35 36
17 18 19 20 37 38 39 40
41 42 43 44 61 62 63 64
45 46 47 48 65 66 67 68
49 50 51 52 69 70 71 72
53 54 55 56 73 74 75 76
57 58 60 77 78 79All possible extreme pathways Inconsistent regulation Environment-specificity:
C1, C2 and O2
Environment-specific regulation:
R5b, Tc2
1 2 3 4 21 22 23 24
5 6 7 8 25 26 27 28
9 10 11 12 29 30 31 32
13 14 15 16 33 34 35 36
17 18 19 20 37 38 39 40
41 42 43 44 61 62 63 64
45 46 47 48 65 66 67 68
49 50 51 52 69 70 71 72
53 54 55 56 73 74 75
57 58 59 77 78 79 80
1 2 3 4 21 22 23 24
5 6 7 8 25 26 27 28
9 10 11 12 29 30 31 32
13 14 15 16 33 34 35 36
17 18 19 20 37 38 39 40
41 42 43 44 61 62 63 64
45 46 47 48 65 66 67 68
49 50 51 52 69 70 71 72
53 54 55 56 73 74 75 76
57 58 59 60 77 79 80
Oxygen
A
B
ATP
Tc1
R1
C
Biomass
R4
R2a
Rz
2 NADH
0.2 C2 ATP3 NADH
10 ATP
2 ATP
3 D
3 E4 NADH
R6
R7
ATPNADH
O2
R
Fext
F
G
R3
H
Ca rbon2
Tc2 T f
T hH
2 ATP3 NADH
R2b
D
E
Td
Te
TO2
Carbon1
R5a
R8a
A
B
ATP
Tc1
R1
C
Biomass
R4
R2a
Rz
2 NADH0.2 C
2 ATP3 NADH
10 ATP
2 ATP
3 D
3 E4 NADH
R6
R7
ATPNADH
O2
RF
G
R
R3
H
Tc2 Tf
T hH
2 ATP3 NADH
R 2b
Dext
E
Td
Te
TO2
R8a
A
B
ATP
Tc1
R1
C
Biomass
R4
R2a
Rz
2 NADH
0.2 C2 ATP3 NADH
10 ATP
3 E4 NADH
R6
R7
ATPNADH
O2
R
F
F
G
R3
H
Ca rbon2
T c2 Tf
ThH
2 ATP3 NADH
R2b
D
E
Td
Te
TO2
Carbon1
Pathway 46
R5a
R8a
A
B
ATP
Tc1
R1
C
Biomass
R4
R2a
Rz
2 NADH0.2 C
2 ATP3 NADH
10 ATP
2 ATP
3 D
3 E4 NADH
R6
R7
ATPNADH
O2
R
F
F
G
R
R3
H
Ca rbon2
Tc2 Tf
ThH
2 ATP3 NADH
R 2b
Dext
E
Td
Te
TO2
Carbon1
Pathway 50
R8a
Pathway 30 Pathway 34
OxygenFext
Carbon1Carbon2
ext
5a,b
ext
ext
res
ext
ext
res
2 ATP
3 D
ext
ext
ext
5a,b
ext
res
ext
ext
(b)
ext
res
Oxygen Oxygen
REGULATION: SOLUTION SPACE REDUCTION 315

M. W. COVERT AND B. O. PALSSON316
EXAMPLE 2: GROWTH ON C1, C2, F, H, AND O2
The allowable extreme pathways for growthon a medium containing C1, C2, F, and H in anaerobic environment were determined. For thiscase, the environment offers no restrictionsFallpossible inputs are availableFand therefore therestriction of the solution space by elimination ofextreme pathways is entirely due to regulatoryeffects. From Table 1 it is shown that R2a, R5b,R7, R8a, and Tc2 are constrained to zero by theregulatory rules. Consequently, the 33 corre-sponding extreme pathways were removed fromthe solution space, resulting in a list of 26available pathways which may be used by thecell under these conditions [Fig. 4(b)]. Theseremaining pathways, normalized by the totalinput of C1, C2, F, and H for comparisonpurposes, are shown in Fig. 4(a).
The 26 allowable pathways shown in Fig. 4(a)may be grouped by biomass yield. In the top twosets, all pathways are optimal or very near-optimal in terms of biomass yield, with noby-product secretion. The middle pathway setsinvolve secretion of either D or E while biomassis generated, and the bottom set of pathwaysrepresents purely fermentative use of the net-work. Again, it is seen that even with a highernumber of allowable extreme pathways, theactual degree of variation in possible networkbehavior is surprisingly small once regulatoryconstraints are taken into account. The multi-plicity of extreme pathways with near-optimalbiomass yield gives the metabolic networkrobustness characteristics as the cell has manyalternatives with nearly the same outcome.
The reduced solution space is projected inthree and two dimensions, as shown in Fig. 4(c)and (d), respectively. The dimensions are thesame as in Fig. 3, with the exception of the C1uptake rate axis, which has been replaced by anormalized axis of all possible routes for
Fig. 4. Aerobic growth of the sample system in a complexwhich are feasible for this enviroment. The four boxes indicateand yield. Groups 1 and 2 are the sets of pathways with thecomplex medium, similar in format to Fig. 3(a). Note that no eexample, and reduction of the solution space is therefore onlynormalized by the combined uptake of C1, C2, F, and H in ordwhich are also similar in format to their counterparts in Fig. 3(cthe three-dimensional projection (dashed lines).
substrate uptake (C1+C2+F+H). The three-dimensional projection is bounded by the solidblack vectors, many of which overlap in theprojection (note that these extreme pathways donot actually overlap; however, in a projection ofthe high-dimensional solution space onto a lowerdimension, they share certain characteristicssuch as the relationship between growth, sub-strate uptake rate, and oxygen uptake rate). Fivepathways (P4, P9, P10, P34, P35, shown withdashed black lines) lie inside the three-dimen-sional projection. The structure of the solutionspace is more complex as compared to the simplegrowth condition analysed in Example 1.
The solution spaces are compared on the sameaxis to illustrate the concept of solution spacereduction further [Fig. 5(a)]. The solution spacediscussed in Example 1 is a subset of thespace defined by the complex medium. Figure5(b) and (c) shows cross sections of the spacewhere combined (C1+C2+F+H) uptake andoxygen uptake are set at a constant rate of5mmol�1 gDCWhr�1, respectively. The line ofoptimality, P30 in Example 1, is shifted to any ofthree pathways, P8, P29, and P32, in Example 2.These three pathways obtain similar growthyields but exhibit different behaviors in termsof substrate uptake. With slightly smaller growthyields, extreme pathways P5, P6, P30, and P31also bound the space and are in close proximityto the optimal pathways. The cross section wherethe oxygen uptake rate is constant (bottom) isalso unbounded, as shown by the dotted lines.
Discussion
Constraints-based models have been formu-lated to analyse, interpret, and predict cellbehavior from reconstructed metabolic networksunder given environmental conditions. Theyhave given useful and surprisingly predictiveresults (Edwards & Palsson, 2000; Edwards et al.,
medium. (a) A table summarizing the 26 extreme pathwayssignificant pathway groupings based on by-product secretionhighest growth yield. (b) Extreme pathway reduction in thenvironmental constraints are imposed upon the space in thisdue to regulatory constraints. Here the pathways have beener to be represented together in the plots shown in (c) and (d),) and (d), respectively. In (c), five extreme pathways lie inside
"

REGULATION: SOLUTION SPACE REDUCTION 317

M. W. COVERT AND B. O. PALSSON318

REGULATION: SOLUTION SPACE REDUCTION 319
2001). The constraints imposed on the recon-structed genome-scale metabolic networks thusfar have been the invariant constraints asso-ciated with stoichiometry, thermodynamics, andenzyme capacity (Palsson, 2000). These may beconsidered as first-generation constraints-basedmodels of metabolism.
Here we continue to develop second-genera-tion constraints-based models by including thetemporary and self-imposed constraints asso-ciated with regulation of gene expression andenvironmental conditions that further constrainallowable functions of the network. A Booleanlogic formalism was used to describe regulationand derived logic regulatory rules may be used inconjunction with extreme pathway analysis toexamine the effects of regulation on the allow-able range of network function. The mostimportant finding of this study is that theimposition of regulatory constraints significantlyreduces the size of the solution space. For theskeleton core metabolic network used, thenumber of extreme pathways was reduced from80 to as few as two, in some cases, as a result ofthe imposition of relatively simple environmentaland regulatory constraints. In a simulated richmedium, the skeleton network was uncon-strained with respect to the environment andyet 67.5% of the pathways were eliminated byregulation. This large reduction in the solutionspace seems to indicate that despite the complexinteraction of many genes to produce anintegrated cellular function, simple behaviorscan relatively easily be selected by the cell.
Another noteworthy observation that can bemade from these results regards the extremepathways that remain after regulatory con-straints are applied. In both examples givenhere, many fermentative pathways were leftavailable to the network despite the presence ofoxygen. Although these extreme pathways maybe unused, the ability to implement them with-out the delays associated with transcription and
Fig. 5. Diagrammatic representation of solution space reduon one another. The solution space of Example 1 is a subspacesolution space on the oxygen uptake rate–growth rate plan5mmol�1 gDCWhr�1. (c) Cross section of the solution spaceplane where the oxygen uptake rate is set at 5mmol�1 gDCW
3
translation would give the cell the ability torapidly adapt to oxygen deprivation.
Finally, the close proximity and even overlapof optimal and near-optimal extreme pathwaysto one another in the three- and two-dimensionalprojections of the solution space suggest that thesystem has numerous means by which to obtainits growth objectives. Extreme pathway analysisof metabolic networks at the genome scale hasindicated a high degree of pathway redundancy(Papin et al., 2002). Although regulatory con-straints greatly reduce such redundancy ashas been shown, it seems that a certain amountof flexibility is beneficial to the cell. Such flexibilitymay be useful to an organism, for example, incolonizing diverse and changing environments.
In summary, the application of transcriptionalregulatory constraints to metabolic networksresults in a large reduction of behaviors availableto the network under a given environment. Thepresent study leads to the formulation of asecond generation of constraints-based modelsthat can be used to interpret how regulation isused to keep a restricted portion of the totalsolution space accessible, and thereby, by theprocess of elimination, force a particular set ofphenotypic behaviors to be expressed.
The authors would like to acknowledge ChristopheSchilling for helpful discussions and Markus Herr-gard for assistance in drawing the figures. This workwas funded by the NIH (GM57089) and the NSF(MCB-9873384, BES-9814092, and BES-0120363).
REFERENCES
Bailey, J. E. (2001). Complex biology with no parameters.Nature Biotechnol. 19, 503–504.
Bonarius, H. P. J., Schmid, G. & Tramper, J. (1997).Flux analysis of underdetermined metabolic networks:the quest for the missing constraints. Trends Biotechnol.15, 308–314.
Covert, M. W., Schilling, C. H., Famili, I., Edwards,J. S., Goryanin, I. I., Selkov, E. & Palsson, B. O.(2001a). Metabolic Modeling of Microbial Strains insilico. Trends Biochem. Sci. 26, 179–186.
ction. (a) Schematic of the two solution spaces superimposedof the space of the complex medium. (b) Cross section of thee where the combined (C1+C2+F+H) uptake is set aton the combined (C1+C2+F+H) uptake rate–growth ratehr�1.

M. W. COVERT AND B. O. PALSSON320
Covert, M. W., Schilling, C. H. & Palsson, B. O.(2001b). Regulation of gene expression in flux balancemodels of metabolism. J. theor. Biol. 213, 73–88,doi:10.1006/jtbi.2001.2405.
Edwards, J. & Palsson, B. (1999). Properties of theHaemophilus influenzae Rd metabolic genotype. J. Biol.Chem. 274, 17 410–17 416.
Edwards, J. S. & Palsson, B. O. (2000). The E. coliMG1655 in silico metabolic genotype: its definition,characteristics, and capabilities. Proc. Natl Acad. Sci.97, 5528–5533.
Edwards, J. S., Ramakrishna, R., Schilling, C. H. &Palsson, B. O. (1999). Metabolic flux balance analysis.In: Metabolic Engineering (Lee, S. Y. & Papoutsakis,E. T., eds), pp. 13–57. New York: Marcel Dekker.
Edwards, J. S., Ibarra, R. U. & Palsson, B. O. (2001). Insilico predictions of Escherichia coli metabolic capabilitiesare consistent with experimental data. Nature Biotechnol.19, 125–130.
Edwards, J. S., Ramakrishna, R. & Palsson, B. O.(2002). Characterizing the metabolic phenotype: a pheno-type phase plane analysis. Biotechnol. Bioeng. 77, 27–36.
Fell, D. (1996). Understanding the Control of Metabolism.London: Portland Press.
Gombert, A. K. & Nielsen, J. (2000). Mathematical model-ling of metabolism. Curr. Opin. Biotechnol. 11, 180–186.
Heinrich, R. & Schuster, S. (1996). The Regulation ofCellular Systems. New York: Chapman & Hall.
Kauffman, S. A. (1993). The Origins of Order. New York:Oxford University Press.
Kaufman, M., Urbain, J. & Thomas, R. (1985). Towardsa logical analysis of the immune response. J. Theor. Biol.114, 527–561.
Kompala, D. S., Ramkrishna, D., Jansen, N. B. & Tsao,G. T. (1986). Investigation of Bacterial Growth on MixedSubstrates. Experimental Evaluation of Cybernetic Mod-els. Biotechnol. Bioeng. 28, 1044–1056.
Lee, B., Yen, J., Yang, L. & Liao, J. C. (1999).Incorporating qualitative knowledge in enzyme kineticmodels using fuzzy logic. Biotechnol. Bioeng. 62, 722–729.
McAdams, H. H. & Arkin, A. (1997). Stochastic mechan-isms in gene expression. Proc. Natl Acad. Sci. U.S.A. 94,814–819.
McAdams, H. H. & Arkin, A. (1998). Simulation ofprokaryotic genetic circuits. Ann. Rev. Biophys. Biomol.Struct. 27, 199–224.
McAdams, H. H. & Arkin, A. (1999). It’s a noisy business!Genetic regulation at the nanomolar scale. Trends Genet.15, 65–69.
McAdams, H. H. & Shapiro, L. (1995). Circuit simulationof genetic networks. Science 269, 651–656.
Palsson, B. O. (2000). The challenges of in silico biology.Nature Biotechnol. 18, 1147–1150.
Papin, J. A., Price, N. D., Edwards, J. S. & Palsson,B. O. The genome-scale metabolic extreme pathwaystructure in Haemophilus influenzae shows significantnetwork redundancy. J. theor. Biol. 215, 67–82,doi:10.1006/jtbi.2001.2496.
Reich, J. G. & Sel’kov, E. E. (1981). Energy Metabolism ofthe Cell. New York: Academic Press.
Schilling, C. H. & Palsson, B. O. (1998). The underlyingpathway structure of biochemical reaction networks.Proc. Natl Acad. Sci. U.S.A. 95, 4193–4198.
Schilling, C. H. & Palsson, B. O. (2000). Assesment ofthe Metabolic Capabilities of Haemophilus influenzae Rd
through a Genome-scale Pathway Analysis. J. theor. Biol.203, 249–283, doi:10.1006/jtbi.2000.1088.
Schilling, C. H., Schuster, S., Palsson, B. O. &Heinrich, R. (1999). Metabolic pathway analysis: basicconcepts and scientific applications in the post-genomicera. Biotechnol. Prog. 15, 296–303.
Schilling, C. H., Edwards, J. S., Letscher, D. &Palsson, B. O. (2000a). Combining pathway analysiswith flux balance analysis for the comprehensive study ofmetabolic systems. Biotechnol. Bioeng. 71, 286–306.
Schilling, C. H. Letscher, D. & Palsson, B. O. (2000b).Theory for the Systemic Definition of Metabolic Path-ways and their use in Interpreting Metabolic Functionfrom a Pathway-Oriented Perspective. J. theor. Biol. 203,229–248, doi:10.1006/jtbi.2000.1073.
Somogyi, R. & Sniegoski, C. A. (1996). Modeling thecomplexity of genetic networks: understanding multi-genic and pleitropic regulation. Complexity 1, 45–63.
Stephanopoulos, G., Aristodou, A. & Nielsen, J.(1998). Metabolic Engineering. New York: Academic Press.
Thieffry, D. & Thomas, R. (1995). Dynamical behaviourof biological regulatory networksFII. Immunity controlin bacteriophage lambda. Bull. Math. Biol. 57, 277–297.
Thomas, R. (1973). Boolean formalization of geneticcontrol circuits. J. theor. Biol. 42, 563–585.
Thomas, R. (1991). Regulatory networks seen as asyn-chronous automata: a logical description. J. theor. Biol.153, 1–23.
Tomita, M., Hashimoto, K., Takamashi, K., Shimizu,T., Matsuzaki, Y., Miyoshi, F., Saito, K., Tanida, S.,Yugi, K., Venter, J. C. & Hutchison, C. A. (1999). E-CELL: software environment for whole-cell simulation.Bioinformatics 15, 72–84.
Varma, A. & Palsson, B. O. (1994a). Metabolic fluxbalancing: basic concepts, scientific and practical use.Bio. Technol. 12, 994–998.
Varma, A. & Palsson, B. O. (1994b). Predictions for oxy-gen supply control to enhance population stability of eng-ineered production strains. Biotechnol. Bioeng. 43, 275–285.
Varma, A. & Palsson, B. O. (1994c). Stoichiometric fluxbalance models quantitatively predict growth and meta-bolic by-product secretion in wild-type E. coli W3110.Appl. Environ. Microbiol. 60, 3724–3731.
Varner, J. D. (2000). Large-scale prediction of phenotype:concept. Biotechnol. Bioeng. 69, 664–678.
Wong, P. Gladney, S. & Keasling, J. D. (1997).Mathematical model of the lac operon: inducer exclusion,catabolite repression, and diauxic growth on glucose andlactose. Biotechnol. Prog. 13, 132–143.
APPENDIX
The flux distribution maps for all 80 of theextreme pathways calculated for the samplenetwork are shown. The active fluxes are shownwith thick dark lines, inactive fluxes are denotedby thin light dotted lines and the biomass flux isshown with a dashed line. Note that reactionsR5a and R5b are isozymes. The 21 extremepathways which are infeasible under everyenvironmental condition are enclosed in boxes.

Fig. A1.
REGULATION: SOLUTION SPACE REDUCTION 321
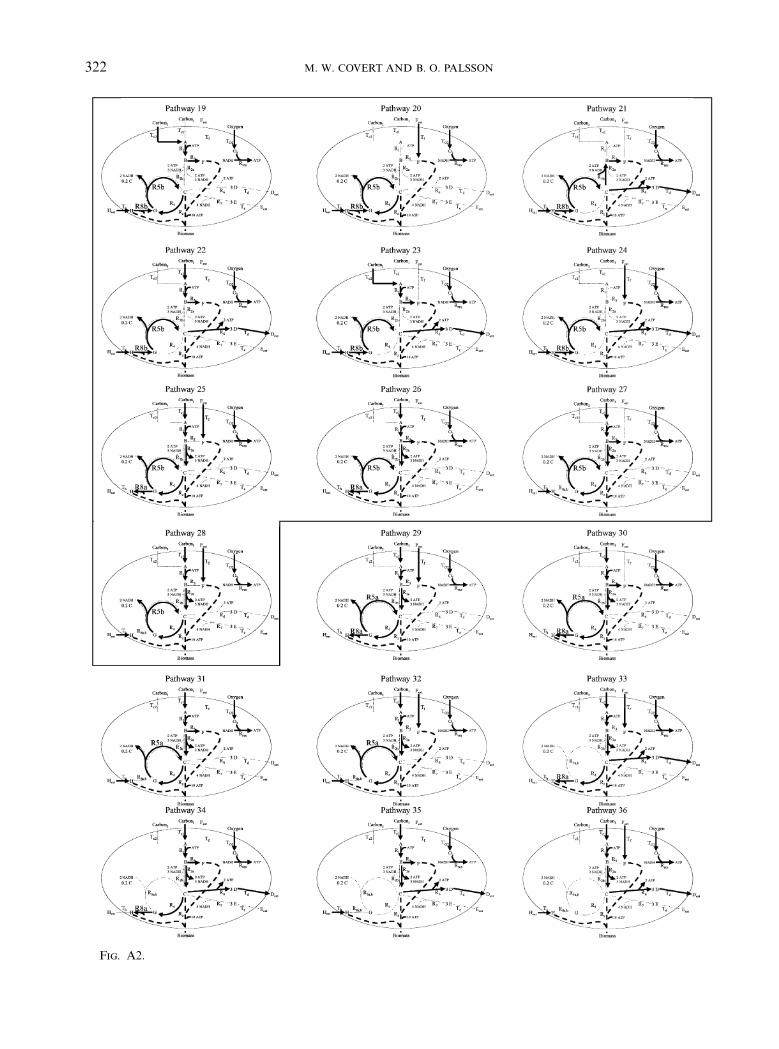
Fig. A2.
M. W. COVERT AND B. O. PALSSON322

Fig. A3.
REGULATION: SOLUTION SPACE REDUCTION 323

Fig. A4.
M. W. COVERT AND B. O. PALSSON324
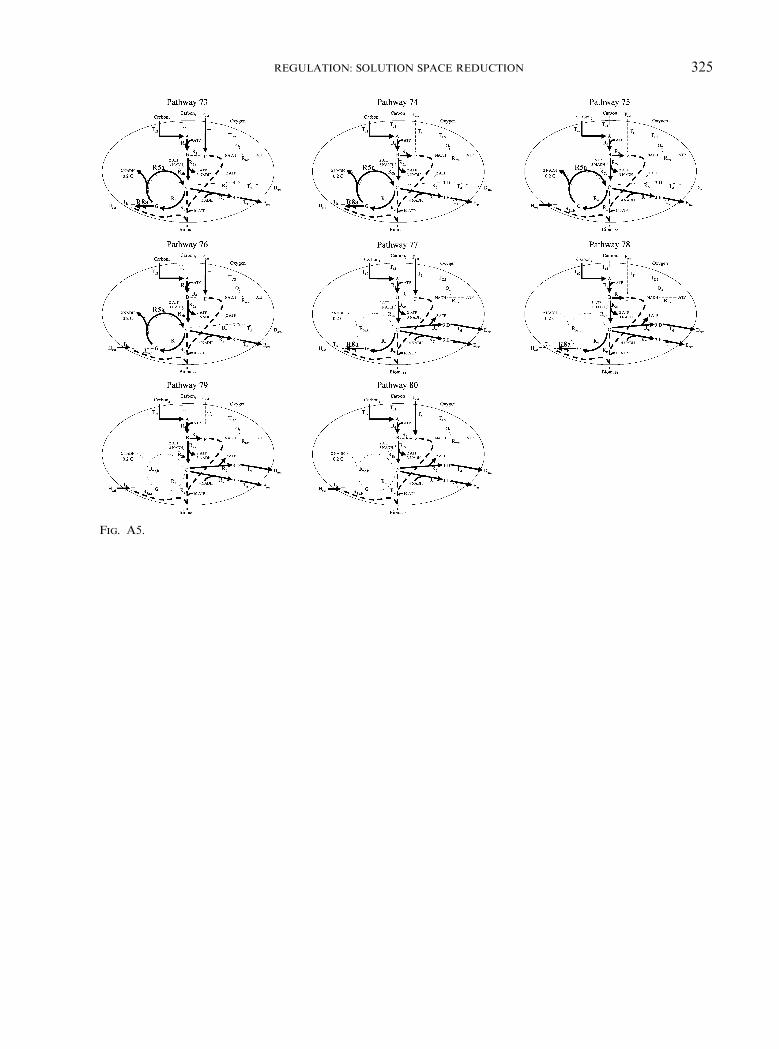
Fig. A5.
REGULATION: SOLUTION SPACE REDUCTION 325


![[Bernhard Ø. Palsson] Systems Biology Simulation](https://img.pdfslide.net/doc/110x75/577c7ebf1a28abe054a24a97/bernhard-o-palsson-systems-biology-simulation.jpg)