Embed Size (px)
Citation preview

International Journal of Advanced Research in ISSN: 2278-6236 Management and Social Sciences Impact Factor: 4.400
Vol. 3 | No. 12 | December 2014 www.garph.co.uk IJARMSS | 44
CONSTRAINTS OF VEGETABLES VALUE CHAIN IN ETHIOPIA: A GENDER
PERSPECTIVE Almaz Giziew*
Dr Workneh Negatu**
Dr Edilegnaw Wale***
Dr Gezahegn Ayele****
Abstract: Tomato and onion production play an important role in improving household’s
income, nutrition and food security. Despite its importance, the productivity of these crops is
very low compared to the potential yield. Cross-sectional data was collected from random
samples of 380 producers, 186 retailers and 293 wholesalers. A total of 550 male-headed
and 309 female-headed households were sampled. The data were analyzed using descriptive
statistics such as frequency, mean, percentage, t-test and chi-square were used to
summarize and compare the key variables between the two groups. Moreover, censored
Tobit model was employed to identify determinants of severity of production and marketing
constraints. The two households have different perceptions on tomato and onion value chain
constraints. Social and institutional factors created barriers for both FHH1 and MHH2
1 Female-headed households 2 Male-headed households
actors
in respect to tomato and onion marketing and production in each stage of the value chain.
Therefore, tomato and onion production and marketing policies need to take into account
determinants of severity of production and marketing constraints to enhance efficiency,
quality and linkages among actors. To address the existing gap of women in terms of low
agronomic practice, low yield and financial problem, specialized programs and intensive
training efforts need to be designed and executed for them.
Keywords: Constraint, Gender, Male-headed, female- headed, Value chain, Vegetable
*Center for Environment and Development, College of Development Studies, Addis Ababa University, Ethiopia **Center for Rural Development, College of Development Studies, Addis Ababa University, Ethiopia ***School of Agricultural, Earth and Environmental Sciences, Discipline of Agricultural Economics, University of KwaZulu-Natal, Pietermaritzburg, South Africa ****Deputy Country Coordinator, Ethiopia Scaling Seeds Technologies Partnership in Africa, Alliance for a green revolution in Africa(AGRA)
International Journal of Advanced Research in ISSN: 2278-6236 Management and Social Sciences Impact Factor: 4.400
Vol. 3 | No. 12 | December 2014 www.garph.co.uk IJARMSS | 45
1. INTRODUCTION
Analyses of vegetable value chain constraints in male-headed and female-headed
households are vital to improve the whole vegetable value chain. It has a significant role in
improving household income, nutrition and food security. From farming up to retailing,
vegetable production and marketing employs nearly twice as much labor as cereals per
hectare of land. Poor farmers, rural laborers and urban poor are beneficiaries from these
employment opportunities (Munguzwe and Tschirley, 2006).
Varieties of vegetable crops are grown in Ethiopia in different agro ecological zones, as a
source of income and food. Exports of vegetable products from Ethiopia have increased
from 25,300 tons in 2002/03 budget year and it’s doubled in 2009/10 (EHDA, 2011).
According to CSA (2008) 453,608.8 hectare (ha) was covered by vegetable. Onion and
tomato covered 15,628.44 ha and 5,341.58 ha, respectively. The estimated annual
production of vegetable was 18,124,613.5 quintal (Qt). Among these, onion and tomato
constituted 1,488,548.9Qt and 418,149.53Qt, respectively. Despite the enormous merits
and potentials, there is no empirical evidence to inform policy makers and agricultural
practitioners on hindering factors of production and marketing activities in male-headed
and female-headed actors on vegetable value chain. Therefore, it is significant to identify,
prioritize and analyze onion and tomato value chain constraints that affect both male and
female actors in each segments of the chain system. This will help both research and
development initiative, to improve onion and tomato value chain.
Different studies were conducted in the past to identify production and marketing
constraints of horticultural crops value chain (Abay, 2007; Adebisi-Adelani, 2011; Almaz,
2012; Ametemariam, 2009; Bezabih, 2008; Bezabih and Hadera, 2007; Bezabih and
Mengistu, 2011; Bako etal, 2013, Collins, et al, 2006; Dayanandan, 2012; Gor et al. 2012;
Hanemann and Ahmed 2006; Johnson, et al., 2004.; Kenneth, 2010; Madisa etal.,2010;
Ouma and John, 2010; Rutgers, 2010, Samantaray, 2009; Samuel, 2011; Suman, 2012 and
Tschirley, 2010). Nevertheless, none of these studies attempted to identify determinants of
obstacles to effective production and marketing of onion and tomato value chain in gender
perspective. The objective of this study is therefore, to identify determinants of level of
production and marketing constraints in onion and tomato value chain in men and women
International Journal of Advanced Research in ISSN: 2278-6236 Management and Social Sciences Impact Factor: 4.400
Vol. 3 | No. 12 | December 2014 www.garph.co.uk IJARMSS | 46
actors. Identifying such determinants in onion and tomato value chain is essential in the
process of vegetable production and marketing.
2. METHODOLOGY
The study was conducted in Dugda district, Ethiopia. Multistage sampling technique was
used to draw the sampling units of the study. Formal survey was conducted with onion and
tomato value chain system actors such as onion and tomato producers, wholesalers and
retailers. Formal survey for producers was conducted in Dugda district in eight different
Kebeles while six cities/towns (Meki, Adama, Modjo, Bishoftu, Dukem and Addis Ababa)
were identified for wholesalers and retailers survey.
2.1. Data collection techniques
Information on production and marketing constraints of onion and tomato was gathered
through focus group discussions, key informant interviews, observation, transact walks
(farm areas and markets) and formal survey with different actors in the chain. Information
on onion and tomato production and marketing constraints were collected from value chain
actors (producers, wholesalers and retailers).
Six focus group discussions (involving 6-12 members each with male and female actors
independently) and 25 key informant interviews were conducted with representatives from
onion and tomato value chain actors. Transact walks and observations were conducted at
major market centers and farm areas. A pilot survey was carried on 20 non-sampled
respondents on value chain actors to check suitability of questionnaire to socioeconomic
and cultural setups. Secondary data at six cities/towns were collected from district
Agricultural and Rural Development and in their respective Revenue offices, internet
browse, journal articles, books, published and unpublished research reports.
2.2. Sampling procedure
2.2.1. Producers
Producers: These are actors who produce and sale onion and /or tomato. They would either
have their own land or rented-in to produce both or one of the two crops in 2012/2013.
These farmers after they produced they sell either at farm gate or at distant market.
Producer survey was conducted in Dugda district, Ethiopia. Multistage sampling technique
was used to draw the sampling units of the study. At the first stage, Dugda district were
purposively selected. Dugda district has 39 kebeles and out of which 16 kebeles are major

International Journal of Advanced Research in ISSN: 2278-6236 Management and Social Sciences Impact Factor: 4.400
Vol. 3 | No. 12 | December 2014 www.garph.co.uk IJARMSS | 47
growers of onion and tomato. In the second stage, eight kebeles from onion and/or tomato
growers in the district were selected randomly. The sampling frame of this study was freshly
prepared in consultation with Development Agents of the selected kebeles and it included
the producers of onion or tomato or both in the kebeles of Dugda district. The third stage of
the sampling procedure, respective sampling frame was stratified as male-headed and
female-headed households. Finally, the number of respondents was determined by using
probability proportional to size sampling procedure. Then the predetermined size of the
sample farmers from each kebele was randomly selected using systematic random sampling
technique.
Out of the total 188 female and 1032 male producers, 100 female and 280 male
representative onion and tomato farmers were selected using simple random sampling
methods. Interviews were conducted from November to May 2013 using structured
questionnaire by trained interviewers.
This study applied sample size determination formula developed by Yamane (1967)
provided below. Determine the required sample size at 95% confidence level and 10% non-
response rate.
n = )(1 eN
N
+ 2
n= sample size for the research use
N= total number of households producing onion and tomato vegetables
e= margin of errors at 5% and 10% non-response rate
2.2.2. Traders
Traders (wholesalers and retailers): These are actors who trading onion and /or tomato
segment of the chains. They would either be licensed or unlicensed for both or one of the
two crops. They had more than 6 months at the time of surveying experience in trading of
both or one of the two crops.
To conduct formal survey with traders, sample frame was developed by taking account of
vegetable (tomato and onion) retailers and wholesalers in the six main open markets; Meki,
Adama, Modjo, Bishoftu, Dukem and Addis Ababa. It was estimated number of vegetable
retailers’ and wholesalers’ in Meki, Adama, Modjo, Bishoftu, Dukem and Addis Ababa. After
estimating the number of retailers and wholesalers, the sampling frame was stratified as
International Journal of Advanced Research in ISSN: 2278-6236 Management and Social Sciences Impact Factor: 4.400
Vol. 3 | No. 12 | December 2014 www.garph.co.uk IJARMSS | 48
male and female retailers and wholesalers. Finally, a proportion to size was taken. To this
effect, out of 400 onion and tomato wholesalers, a total of 293 wholesalers which was 42
female, 251 male were selected. Interviews were conducted in April 2013 using structured
questionnaire by trained interviewers.
Same procedures were followed to select retailers. Out of 294 onion and tomato retailers, a
total of 186 retailers were selected out of which 19 were male and 167 female retailers
were selected. All of these actors were selected on market day, Saturday and Thursday.
After estimating the number of these actors, a proportion to size were taken and simple
random sampling was employed to select actors. Interviews were conducted in April 2013
using structured questionnaire by trained interviewers. As it is mentioned in producers
sample determination, sample size was determined using a simplified formula provided by
Yamane (1967). Both licensed and unlicensed traders were included in the traders’ survey. A
total of 859 respondent were selected which were 550 male-headed and 309 female-
headed households.
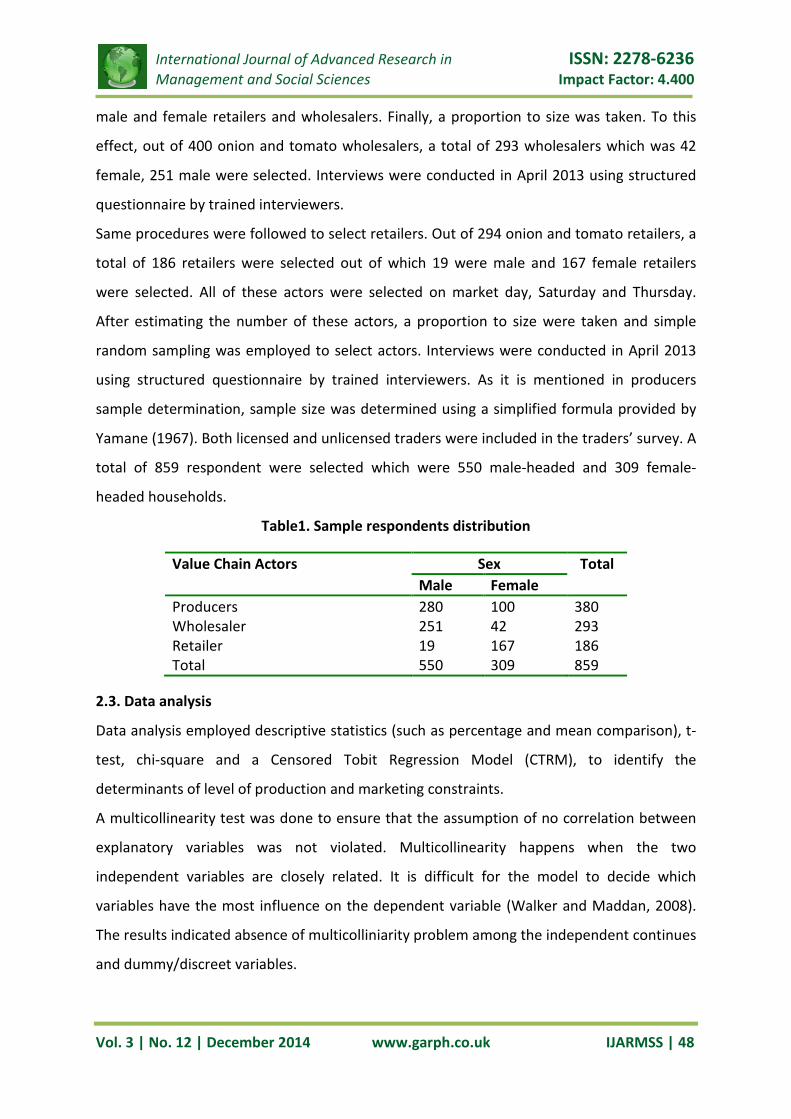
Table1. Sample respondents distribution
2.3. Data analysis
Data analysis employed descriptive statistics (such as percentage and mean comparison), t-
test, chi-square and a Censored Tobit Regression Model (CTRM), to identify the
determinants of level of production and marketing constraints.
A multicollinearity test was done to ensure that the assumption of no correlation between
explanatory variables was not violated. Multicollinearity happens when the two
independent variables are closely related. It is difficult for the model to decide which
variables have the most influence on the dependent variable (Walker and Maddan, 2008).
The results indicated absence of multicolliniarity problem among the independent continues
and dummy/discreet variables.
Value Chain Actors Sex Total Male Female
Producers 280 100 380 Wholesaler 251 42 293 Retailer 19 167 186 Total 550 309 859

International Journal of Advanced Research in ISSN: 2278-6236 Management and Social Sciences Impact Factor: 4.400
Vol. 3 | No. 12 | December 2014 www.garph.co.uk IJARMSS | 49
A Censored Tobit Regression Model (CTRM) statistical analysis, dependent variables are left
and right censored (Maguire and Marilyn, 2012; Niño-Zarazúa, 2012). The following CTRM
general equation was employed in this study:
iii xy εβ += '*
≥
≤
=
ayifb
ayaify
ayifa
y
i
ii
i
i
*
**
*
Where:
α- is the lower limit of the dependent variable
b- is the upper limit of the dependent variable
Yi*- is an observed (“latent”) variable
β- is a vector of unknown parameters
εi- is a disturbance term
χi- is a vector of explanatory variable
is i=1,….,n (indicate the observation)
2.4. Definition of Variables
2.4.1. Dependent Variable The production constraints for the study were identified and listed based on the review of
related literature and discussion with experts. However, the list of constraints to be included
in the study were finalized only after a relevancy rating procedure using a penal of experts
(farmers, wholesaler, retailers, exporters, development agents and agricultural experts) and
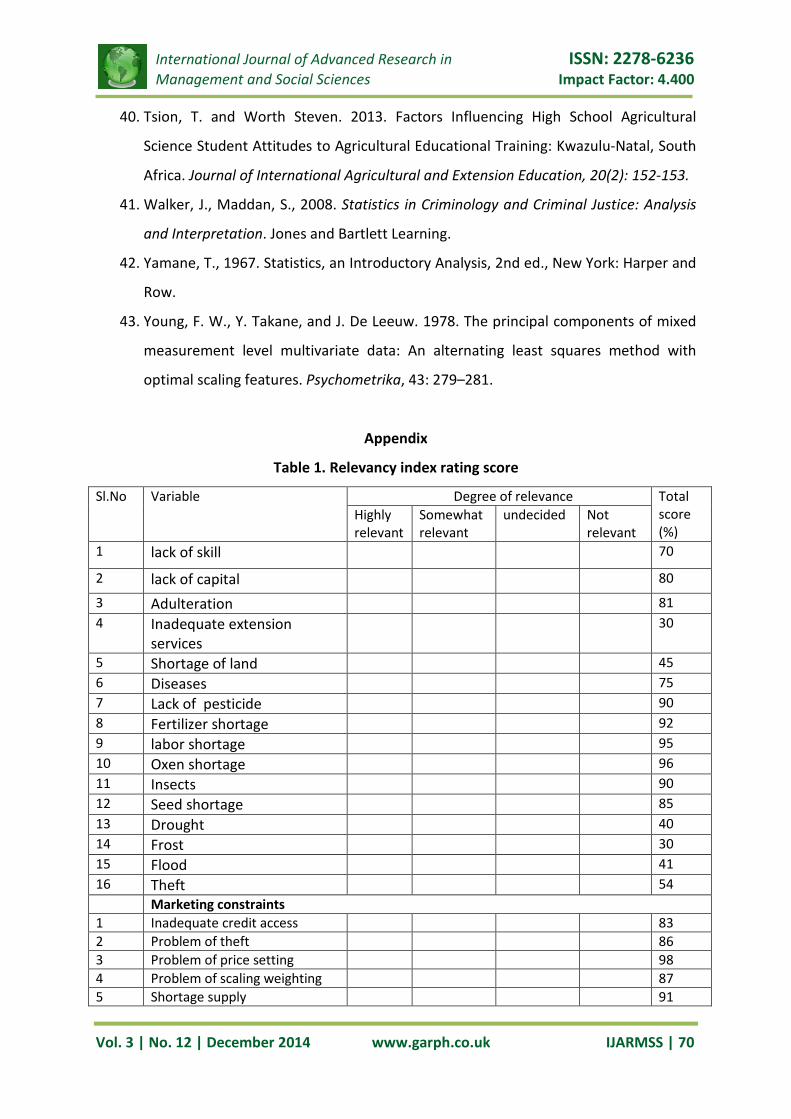
calculation of the Relevancy Index. Based on these assessments, sixteen production
constraints were identified and listed for Relevancy Ratings. Relevancy index of the
production constraints were selected based on relevancy rating done by a panel of experts.
For this procedure, the list of identified sixteen production constraints were subjected to
rating in a four-point continuum (Highly relevant, somewhat relevant, undecided and Not
relevant), respectively. The constraints with a Relevancy Index score of more than 50% were
included in the study (See Appendix Table 1). Meanwhile constraints with a Relevancy Index
score of less than 50% were excluded in the study. Based on the relevancy index, 11
production constraints were selected. In the past several scholars employed Relevancy
International Journal of Advanced Research in ISSN: 2278-6236 Management and Social Sciences Impact Factor: 4.400
Vol. 3 | No. 12 | December 2014 www.garph.co.uk IJARMSS | 50
Index to select variables (for instance Almaz et al, 2011; Tsion et al, 2009 and Tsion and
Worth, 2013). Calculation of the Relevancy Index is as follows:
RI (Relevance Index) = Obtainable score
X= Component loading on observed variable n.
×100----------------------------------------(1)
Potential score
The identified production constraints based on the relevancy index is treated as the
dependent variable and consider for the principal component analysis.
2.4.1.1. Production constraints
In this study, production constraints are treated as the dependent variable. For the purpose
of this study, the dependent variable was onion and tomato production constraints. During
the survey, sample producers were asked to rate the weight of production constraints
(shortage of seed, pesticide, fertilizer, labour, capital, lack of skill, shortage of ox, diseases
problem, insects problem, theft problem and adulteration (quality of seed) by giving 1, 2, 3
and 4 (no constraint, low constraint, medium constraint and high constraint weight,
respectively).
All 11 production constraints were keeping for principal component analysis (PCA). Principal
component analysis is a very efficient data reduction technique and used widely to find
pertinent statistical description of the data (Abdi and Williams, 2010). It is used to minimize
a set of original variables in to a single uncorrelated component which can represent the
initial variable. PCA quantifies categorical variables by reducing the dimensionality of the
data (Gupta et al., 2011; Young, Takane and Leeuw, 1978). In the past, scholars use PCA
technique to reduce data (for instance, Kasturiwale and Ingole, 2012; Awotide et al. 2012;
Mabuza, Ortmann & Wale, 2012; Onofrei, 2010). Accordingly, PCA was analysed using the
following formula.
PCi=A1X1 + A2X2 + … + AnXn----------------------------------------------------------------------------(2)
Where,
PCi= the subject’s score on principal component of the i’s constraint’ i=1……11
A= constraint weight for observed variable n
As shown in Table 2, the components are ordered so as to the first principal component (PC)
captures most of the variance, 2nd second most and so on. On the other hand, the first PC
retains the greatest amount of variation in the sample and the kth PC retains the kth greatest
International Journal of Advanced Research in ISSN: 2278-6236 Management and Social Sciences Impact Factor: 4.400
Vol. 3 | No. 12 | December 2014 www.garph.co.uk IJARMSS | 51
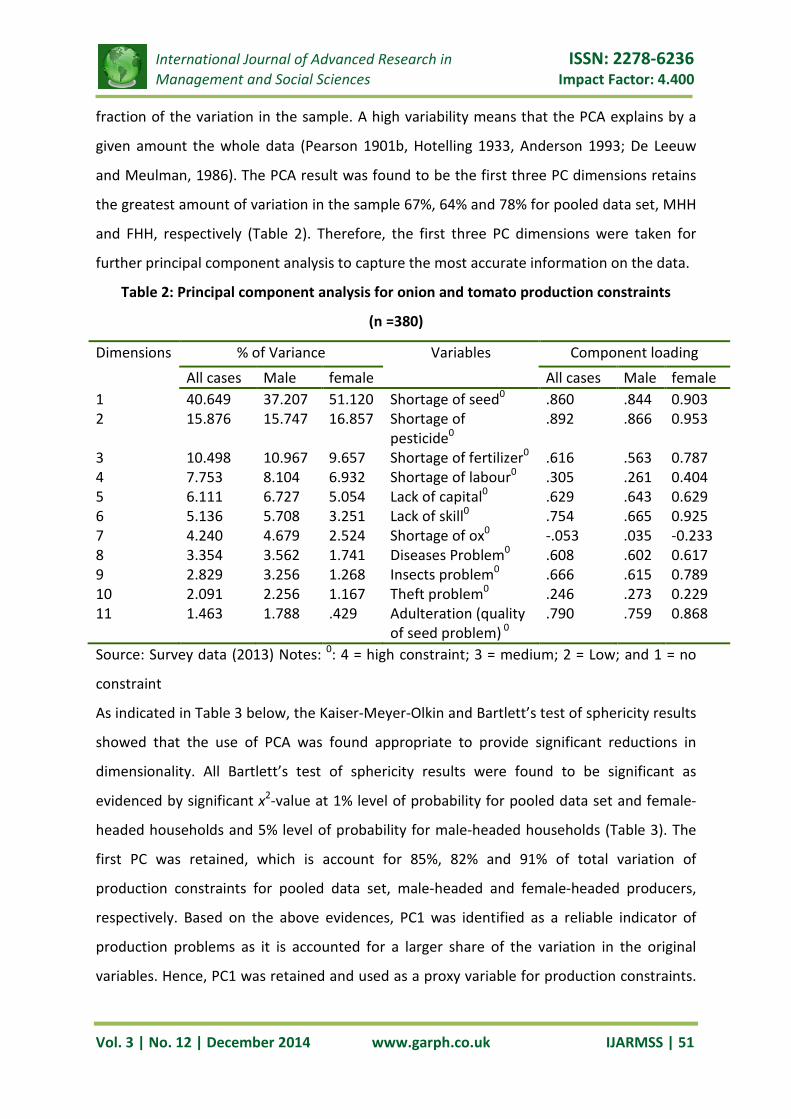
fraction of the variation in the sample. A high variability means that the PCA explains by a
given amount the whole data (Pearson 1901b, Hotelling 1933, Anderson 1993; De Leeuw
and Meulman, 1986). The PCA result was found to be the first three PC dimensions retains
the greatest amount of variation in the sample 67%, 64% and 78% for pooled data set, MHH
and FHH, respectively (Table 2). Therefore, the first three PC dimensions were taken for
further principal component analysis to capture the most accurate information on the data.
Table 2: Principal component analysis for onion and tomato production constraints
(n =380)
Dimensions % of Variance Variables Component loading All cases Male female All cases Male female
1 40.649 37.207 51.120 Shortage of seed0 .860 .844 0.903 2 15.876 15.747 16.857 Shortage of
pesticide0 .892 .866 0.953
3 10.498 10.967 9.657 Shortage of fertilizer0 .616 .563 0.787 4 7.753 8.104 6.932 Shortage of labour0 .305 .261 0.404 5 6.111 6.727 5.054 Lack of capital0 .629 .643 0.629 6 5.136 5.708 3.251 Lack of skill0 .754 .665 0.925 7 4.240 4.679 2.524 Shortage of ox0 -.053 .035 -0.233 8 3.354 3.562 1.741 Diseases Problem0 .608 .602 0.617 9 2.829 3.256 1.268 Insects problem0 .666 .615 0.789 10 2.091 2.256 1.167 Theft problem0 .246 .273 0.229 11 1.463 1.788 .429 Adulteration (quality
of seed problem) 0 .790 .759 0.868
Source: Survey data (2013) Notes: 0: 4 = high constraint; 3 = medium; 2 = Low; and 1 = no
constraint
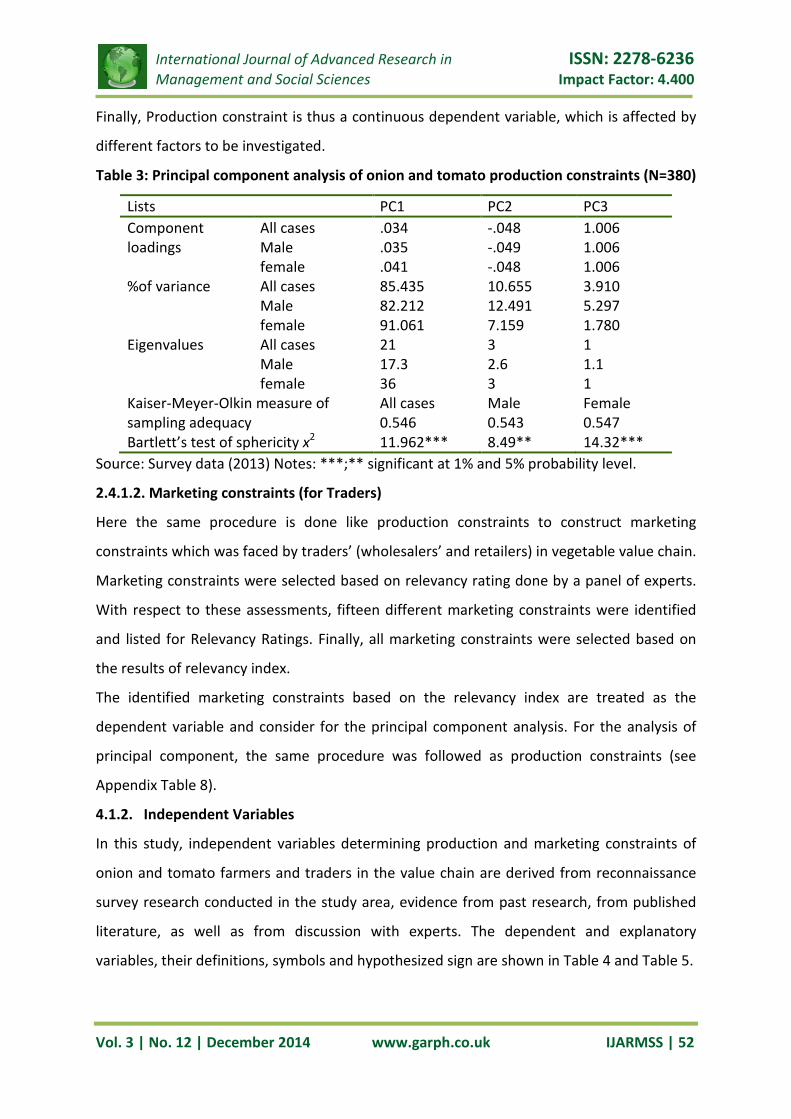
As indicated in Table 3 below, the Kaiser-Meyer-Olkin and Bartlett’s test of sphericity results
showed that the use of PCA was found appropriate to provide significant reductions in
dimensionality. All Bartlett’s test of sphericity results were found to be significant as
evidenced by significant x2-value at 1% level of probability for pooled data set and female-
headed households and 5% level of probability for male-headed households (Table 3). The
first PC was retained, which is account for 85%, 82% and 91% of total variation of
production constraints for pooled data set, male-headed and female-headed producers,
respectively. Based on the above evidences, PC1 was identified as a reliable indicator of
production problems as it is accounted for a larger share of the variation in the original
variables. Hence, PC1 was retained and used as a proxy variable for production constraints.
International Journal of Advanced Research in ISSN: 2278-6236 Management and Social Sciences Impact Factor: 4.400
Vol. 3 | No. 12 | December 2014 www.garph.co.uk IJARMSS | 52
Finally, Production constraint is thus a continuous dependent variable, which is affected by
different factors to be investigated.
Table 3: Principal component analysis of onion and tomato production constraints (N=380)
Lists PC1 PC2 PC3 Component loadings
All cases .034 -.048 1.006 Male .035 -.049 1.006 female .041 -.048 1.006
%of variance All cases 85.435 10.655 3.910 Male 82.212 12.491 5.297 female 91.061 7.159 1.780
Eigenvalues All cases 21 3 1 Male 17.3 2.6 1.1 female 36 3 1
Kaiser-Meyer-Olkin measure of sampling adequacy
All cases Male Female 0.546 0.543 0.547
Bartlett’s test of sphericity x2 11.962*** 8.49** 14.32*** Source: Survey data (2013) Notes: ***;** significant at 1% and 5% probability level.
2.4.1.2. Marketing constraints (for Traders)
Here the same procedure is done like production constraints to construct marketing
constraints which was faced by traders’ (wholesalers’ and retailers) in vegetable value chain.
Marketing constraints were selected based on relevancy rating done by a panel of experts.
With respect to these assessments, fifteen different marketing constraints were identified
and listed for Relevancy Ratings. Finally, all marketing constraints were selected based on
the results of relevancy index.
The identified marketing constraints based on the relevancy index are treated as the
dependent variable and consider for the principal component analysis. For the analysis of
principal component, the same procedure was followed as production constraints (see
Appendix Table 8).
4.1.2. Independent Variables
In this study, independent variables determining production and marketing constraints of
onion and tomato farmers and traders in the value chain are derived from reconnaissance
survey research conducted in the study area, evidence from past research, from published
literature, as well as from discussion with experts. The dependent and explanatory
variables, their definitions, symbols and hypothesized sign are shown in Table 4 and Table 5.

International Journal of Advanced Research in ISSN: 2278-6236 Management and Social Sciences Impact Factor: 4.400
Vol. 3 | No. 12 | December 2014 www.garph.co.uk IJARMSS | 53
Table 4. Symbol, definition and hypothesized sign of variables determine marketing
constraints
Table 5. Symbol, definition and hypothesized sign of variables determine production
constraints
Sl.No Definition Symbol Type of variable Hypothesized sign Marketing constraints in score CONST Continuous Dependent variable 1 Respondents age (in Years) AGEHH Continuous (+) 2 Gender (1= male ; 0= female) GENDR Dummy (-/+) 3 Educational level of household
head (1= unable to read & write, 2=read & write, 3= primary cycle,4= secondary cycle,5= tertiary cycle, 6=preparatory, 7=higher
EDUCA Discrete (-)
4 Family Labor (in man equivalent).
LABOR Continuous (-)
5 Traders’ participation in social organization in score.
SOCLP Continuous (-)
6 Distance from the nearest market (in km).
DSTMA Continuous (+)
7 Accessing of market information (1= yes; 0= No)
INFOR Dummy (-)
8 Marketing experience of household (years).
EXPER Continuous (-)
9 Ownership of mobile phone(1= yes; 0= No)
MOBIL Dummy (-)
Sl.No Definition Symbol Type of variable Hypothesized sign Production constraints in score CONST Continuous Dependent variable 1 Respondents age (in Years) AGEHH Continuous (-) 2 Educational level of household
head (1= unable to read & write, 2=read & write, 3= primary cycle,4= secondary cycle,5= tertiary cycle, 6=preparatory, 7=higher
EDUCA Discrete (-)
3 Family Labor (in man equivalent).
LABOR Continuous (-)
4 Actors getting extension service(1= yes; 0= No)
EXTSR Dummy (-)
5 Accessing of market information INFOR Dummy (-)
International Journal of Advanced Research in ISSN: 2278-6236 Management and Social Sciences Impact Factor: 4.400
Vol. 3 | No. 12 | December 2014 www.garph.co.uk IJARMSS | 54
3. RESULT AND DISCUSSIONS
3.1. Summary of Results of Descriptive Analysis
3.1.1. Producers
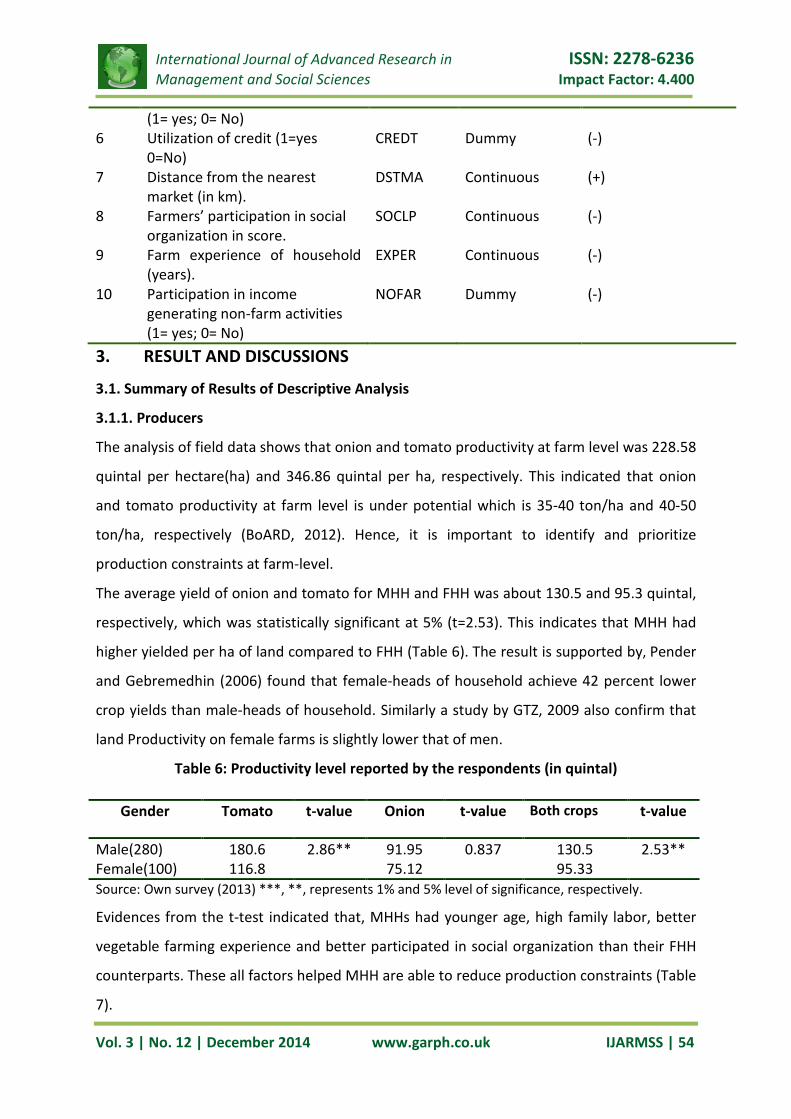
The analysis of field data shows that onion and tomato productivity at farm level was 228.58
quintal per hectare(ha) and 346.86 quintal per ha, respectively. This indicated that onion
and tomato productivity at farm level is under potential which is 35-40 ton/ha and 40-50
ton/ha, respectively (BoARD, 2012). Hence, it is important to identify and prioritize
production constraints at farm-level.
The average yield of onion and tomato for MHH and FHH was about 130.5 and 95.3 quintal,
respectively, which was statistically significant at 5% (t=2.53). This indicates that MHH had
higher yielded per ha of land compared to FHH (Table 6). The result is supported by, Pender
and Gebremedhin (2006) found that female-heads of household achieve 42 percent lower
crop yields than male-heads of household. Similarly a study by GTZ, 2009 also confirm that
land Productivity on female farms is slightly lower that of men.
Table 6: Productivity level reported by the respondents (in quintal)
Source: Own survey (2013) ***, **, represents 1% and 5% level of significance, respectively.
Evidences from the t-test indicated that, MHHs had younger age, high family labor, better
vegetable farming experience and better participated in social organization than their FHH
counterparts. These all factors helped MHH are able to reduce production constraints (Table
7).
(1= yes; 0= No) 6 Utilization of credit (1=yes
0=No) CREDT Dummy (-)
7 Distance from the nearest market (in km).
DSTMA Continuous (+)
8 Farmers’ participation in social organization in score.
SOCLP Continuous (-)
9 Farm experience of household (years).
EXPER Continuous (-)
10 Participation in income generating non-farm activities (1= yes; 0= No)
NOFAR Dummy (-)
Gender Tomato t-value Onion t-value Both crops t-value
Male(280) 180.6 2.86** 91.95 0.837 130.5 2.53** Female(100) 116.8 75.12 95.33
International Journal of Advanced Research in ISSN: 2278-6236 Management and Social Sciences Impact Factor: 4.400
Vol. 3 | No. 12 | December 2014 www.garph.co.uk IJARMSS | 55
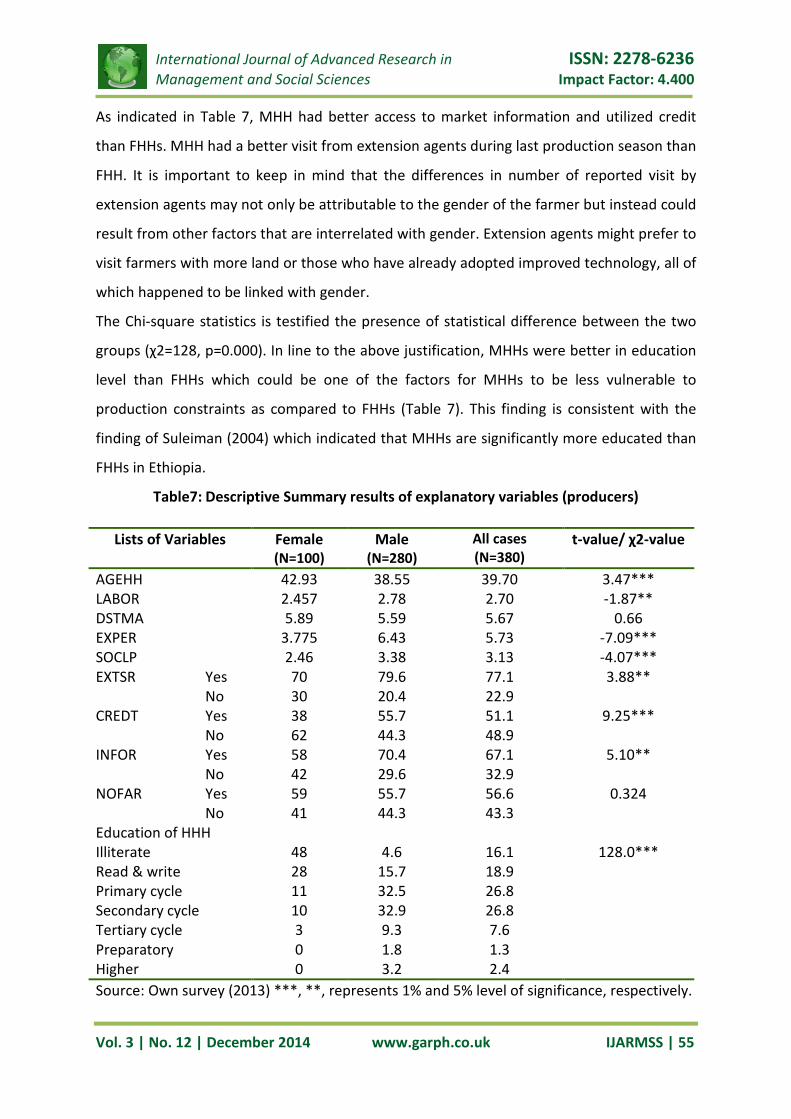
As indicated in Table 7, MHH had better access to market information and utilized credit
than FHHs. MHH had a better visit from extension agents during last production season than
FHH. It is important to keep in mind that the differences in number of reported visit by
extension agents may not only be attributable to the gender of the farmer but instead could
result from other factors that are interrelated with gender. Extension agents might prefer to
visit farmers with more land or those who have already adopted improved technology, all of
which happened to be linked with gender.
The Chi-square statistics is testified the presence of statistical difference between the two
groups (χ2=128, p=0.000). In line to the above justification, MHHs were better in education
level than FHHs which could be one of the factors for MHHs to be less vulnerable to
production constraints as compared to FHHs (Table 7). This finding is consistent with the
finding of Suleiman (2004) which indicated that MHHs are significantly more educated than
FHHs in Ethiopia.
Table7: Descriptive Summary results of explanatory variables (producers)
Source: Own survey (2013) ***, **, represents 1% and 5% level of significance, respectively.
Lists of Variables Female (N=100)
Male (N=280)
All cases (N=380)
t-value/ χ2-value
AGEHH 42.93 38.55 39.70 3.47*** LABOR 2.457 2.78 2.70 -1.87** DSTMA 5.89 5.59 5.67 0.66 EXPER 3.775 6.43 5.73 -7.09*** SOCLP 2.46 3.38 3.13 -4.07*** EXTSR Yes 70 79.6 77.1 3.88**
No 30 20.4 22.9 CREDT Yes 38 55.7 51.1 9.25***
No 62 44.3 48.9 INFOR Yes 58 70.4 67.1 5.10**
No 42 29.6 32.9 NOFAR Yes 59 55.7 56.6 0.324
No 41 44.3 43.3 Education of HHH Illiterate 48 4.6 16.1 128.0*** Read & write 28 15.7 18.9 Primary cycle 11 32.5 26.8 Secondary cycle 10 32.9 26.8 Tertiary cycle 3 9.3 7.6 Preparatory 0 1.8 1.3 Higher 0 3.2 2.4
International Journal of Advanced Research in ISSN: 2278-6236 Management and Social Sciences Impact Factor: 4.400
Vol. 3 | No. 12 | December 2014 www.garph.co.uk IJARMSS | 56
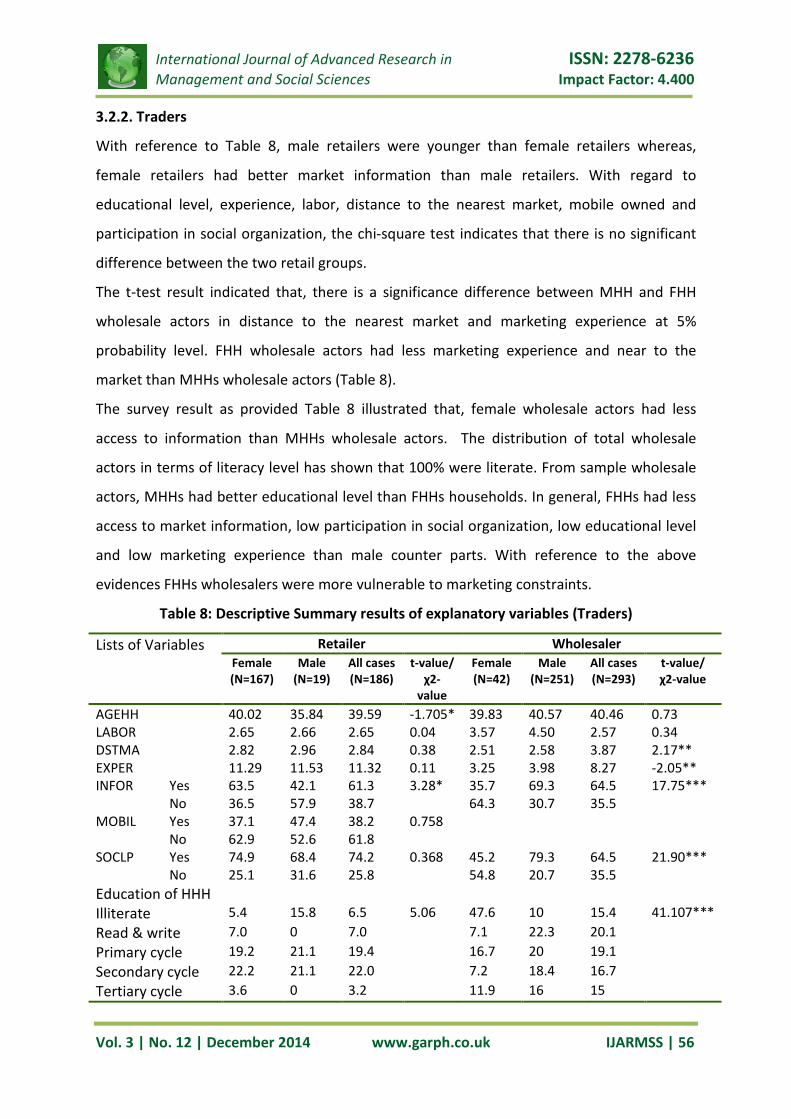
3.2.2. Traders
With reference to Table 8, male retailers were younger than female retailers whereas,
female retailers had better market information than male retailers. With regard to
educational level, experience, labor, distance to the nearest market, mobile owned and
participation in social organization, the chi-square test indicates that there is no significant
difference between the two retail groups.
The t-test result indicated that, there is a significance difference between MHH and FHH
wholesale actors in distance to the nearest market and marketing experience at 5%
probability level. FHH wholesale actors had less marketing experience and near to the
market than MHHs wholesale actors (Table 8).
The survey result as provided Table 8 illustrated that, female wholesale actors had less
access to information than MHHs wholesale actors. The distribution of total wholesale
actors in terms of literacy level has shown that 100% were literate. From sample wholesale
actors, MHHs had better educational level than FHHs households. In general, FHHs had less
access to market information, low participation in social organization, low educational level
and low marketing experience than male counter parts. With reference to the above
evidences FHHs wholesalers were more vulnerable to marketing constraints.
Table 8: Descriptive Summary results of explanatory variables (Traders)
Lists of Variables Retailer Wholesaler Female (N=167)
Male (N=19)
All cases (N=186)
t-value/ χ2-
value
Female (N=42)
Male (N=251)
All cases (N=293)
t-value/ χ2-value
AGEHH 40.02 35.84 39.59 -1.705* 39.83 40.57 40.46 0.73 LABOR 2.65 2.66 2.65 0.04 3.57 4.50 2.57 0.34 DSTMA 2.82 2.96 2.84 0.38 2.51 2.58 3.87 2.17** EXPER 11.29 11.53 11.32 0.11 3.25 3.98 8.27 -2.05** INFOR Yes 63.5 42.1 61.3 3.28*
35.7 69.3 64.5 17.75***
No 36.5 57.9 38.7 64.3 30.7 35.5 MOBIL Yes 37.1 47.4 38.2 0.758
No 62.9 52.6 61.8 SOCLP Yes 74.9 68.4 74.2 0.368 45.2 79.3 64.5 21.90***
No 25.1 31.6 25.8 54.8 20.7 35.5 Education of HHH Illiterate 5.4 15.8 6.5 5.06 47.6 10 15.4 41.107*** Read & write 7.0 0 7.0 7.1 22.3 20.1 Primary cycle 19.2 21.1 19.4 16.7 20 19.1 Secondary cycle 22.2 21.1 22.0 7.2 18.4 16.7 Tertiary cycle 3.6 0 3.2 11.9 16 15
International Journal of Advanced Research in ISSN: 2278-6236 Management and Social Sciences Impact Factor: 4.400
Vol. 3 | No. 12 | December 2014 www.garph.co.uk IJARMSS | 57
Preparatory 0 0 41.9 9.5 14.6 13.7 Higher 41.9 42.1 6.5 47.6 10 15.4 Source: Own survey (2013)*, **&*** =Significant at 10%, 5% and 1% probability level,
respectively.
3.2. Perception of Actors’ in Onion and Tomato Value Chain Constraints
3.2.1. Farmers’ perception on production constraints
Production and marketing development of vegetables was not without a problem.
Understanding problems and opportunities with priorities was very important for both
research and development initiatives. Production in value chain system is an important
component. There are influential factors that impede the production of onion and tomato
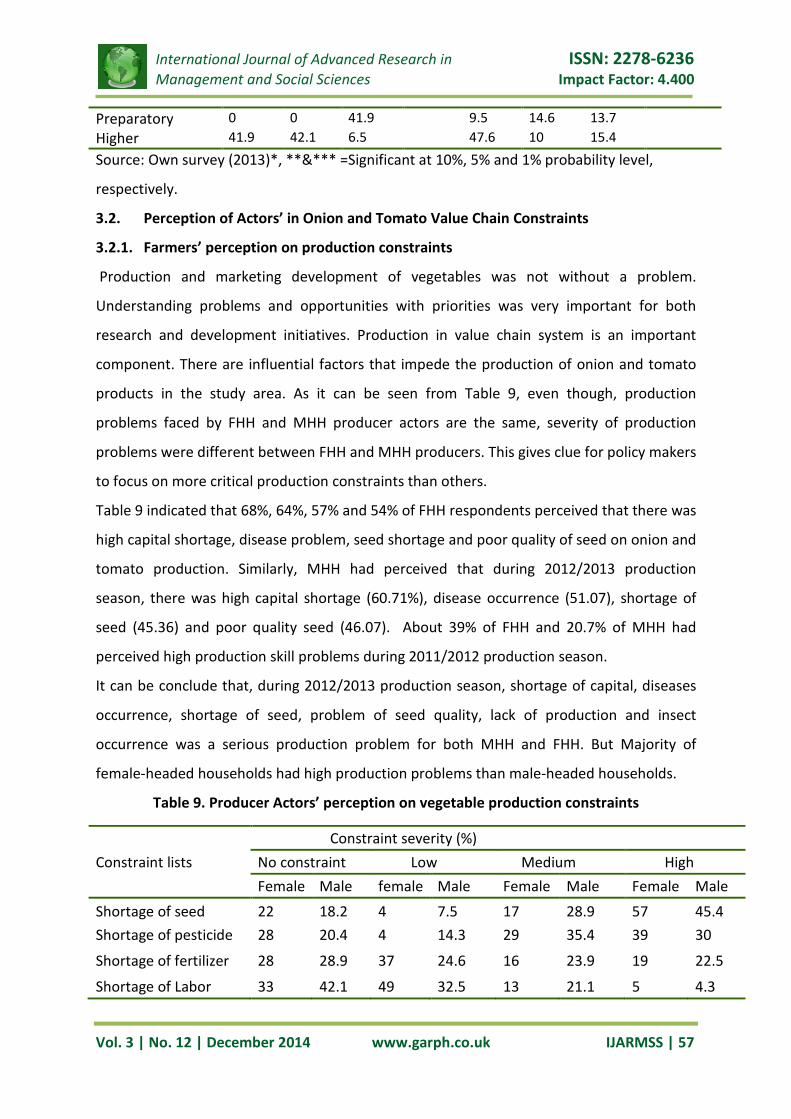
products in the study area. As it can be seen from Table 9, even though, production
problems faced by FHH and MHH producer actors are the same, severity of production
problems were different between FHH and MHH producers. This gives clue for policy makers
to focus on more critical production constraints than others.
Table 9 indicated that 68%, 64%, 57% and 54% of FHH respondents perceived that there was
high capital shortage, disease problem, seed shortage and poor quality of seed on onion and
tomato production. Similarly, MHH had perceived that during 2012/2013 production
season, there was high capital shortage (60.71%), disease occurrence (51.07), shortage of
seed (45.36) and poor quality seed (46.07). About 39% of FHH and 20.7% of MHH had
perceived high production skill problems during 2011/2012 production season.
It can be conclude that, during 2012/2013 production season, shortage of capital, diseases
occurrence, shortage of seed, problem of seed quality, lack of production and insect
occurrence was a serious production problem for both MHH and FHH. But Majority of
female-headed households had high production problems than male-headed households.
Table 9. Producer Actors’ perception on vegetable production constraints
Constraint lists Constraint severity (%) No constraint Low Medium High Female Male female Male Female Male Female Male
Shortage of seed 22 18.2 4 7.5 17 28.9 57 45.4 Shortage of pesticide 28 20.4 4 14.3 29 35.4 39 30
Shortage of fertilizer 28 28.9 37 24.6 16 23.9 19 22.5
Shortage of Labor 33 42.1 49 32.5 13 21.1 5 4.3

International Journal of Advanced Research in ISSN: 2278-6236 Management and Social Sciences Impact Factor: 4.400
Vol. 3 | No. 12 | December 2014 www.garph.co.uk IJARMSS | 58
Source: Own survey data (2013)
3.2.2. Traders’ perception on Marketing Problems
This study also identifies the bottlenecks of marketing functions in the study area. Value
chain actors (wholesalers and retailers) have given their perspectives on most severe
constraints affecting onion and tomato marketing and their responses are summarized in
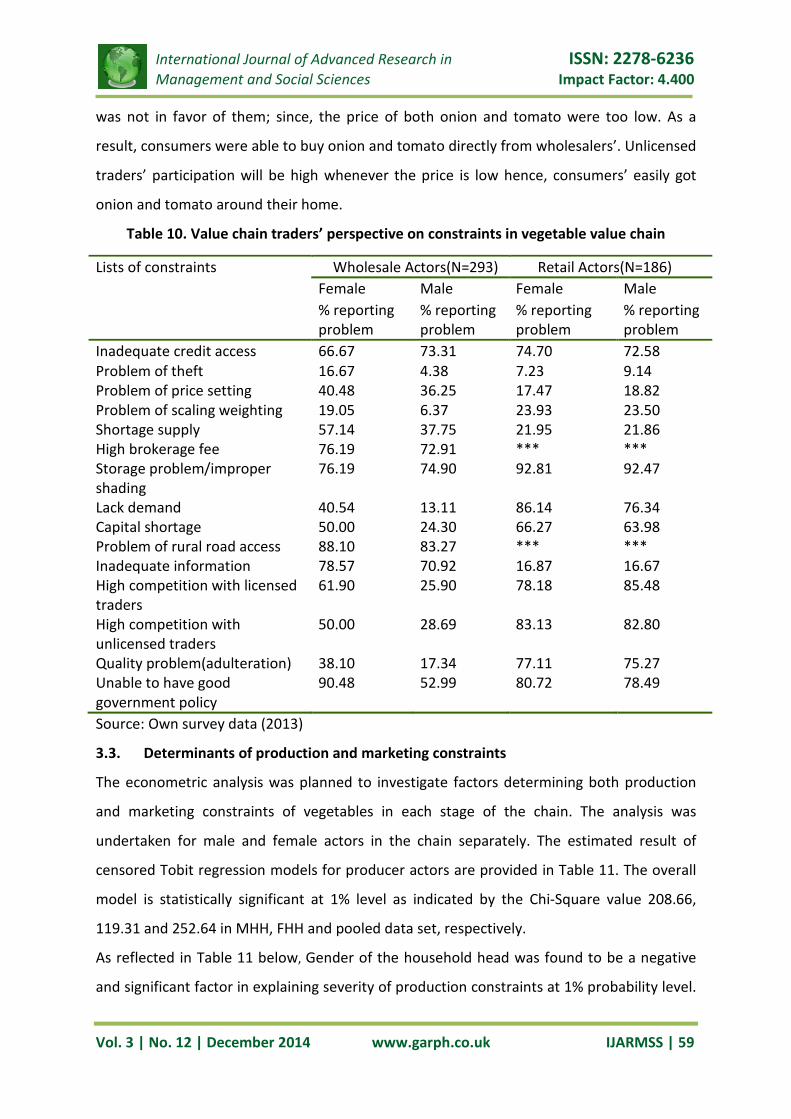
Table 10. The four most frequently reported constraints by female wholesale actors are
problem of unable to have good government vegetable policy (90.48%); problem of rural
road access (88.1%), inadequate information (78.6%), storage problem (76.2%) and high
brokerage fee (76.2%). Problem of road access (83.3%), storage problem (74.9%),
inadequate credit access (73.31%) and high brokerage fee (72.91%) are the four most
frequently reported constraints by male wholesale value chain actors. These results also
supported by focused group discussion with wholesalers’, except Addis and Mojo; wholesale
actors had poor storage system. The government has failed to provide them appropriate
marketing place. As a result, trading was undertaking unsuitable place. Due to poor rural
road access, vegetable loaded trucks frequently face accident; as a result, wholesalers lost
their tomato and onion. Moreover, the VAT system had also created its own problem on
vegetable trading in the study area.
Table 10 shows that 92.81%, 86.14%, 83.13%, and 80.72% female retail respondents
perceive the existence of improper shading, lack demand, high competition with unlicensed
traders and absence of good government policy in onion and tomato marketing,
respectively. Meanwhile, 92.47%, 85.48%, 82.80%, and 78.49% of male retailers perceived
that, improper shedding , high competition with licensed traders, high competition with
unlicensed traders and absence of good government policy were the major marketing
constraints. Retailers in a group discussion expressed that, 2012/2013 production season
Lack of Capital 7 12.5 8 9.3 17 17.5 68 60.7
Lack of skill 28 20.4 11 17.5 22 41.4 39 20.7 Shortage of ox 57 53.6 19 11.1 17 25.7 7 8.9 Diseases problem 0 1.4 23 22.5 13 25 64 51.1 Insects problem 0 1.0 24 22.1 30 35.7 46 41.1 Theft problem 5 5.7 78 63.2 6 17. 11 13.9 Problem of Adulteration (quality of seed)
5 3.6 30 28.2 11 22.14 54 46.1
International Journal of Advanced Research in ISSN: 2278-6236 Management and Social Sciences Impact Factor: 4.400
Vol. 3 | No. 12 | December 2014 www.garph.co.uk IJARMSS | 59
was not in favor of them; since, the price of both onion and tomato were too low. As a
result, consumers were able to buy onion and tomato directly from wholesalers’. Unlicensed
traders’ participation will be high whenever the price is low hence, consumers’ easily got
onion and tomato around their home.
Table 10. Value chain traders’ perspective on constraints in vegetable value chain
Source: Own survey data (2013)
3.3. Determinants of production and marketing constraints
The econometric analysis was planned to investigate factors determining both production
and marketing constraints of vegetables in each stage of the chain. The analysis was
undertaken for male and female actors in the chain separately. The estimated result of
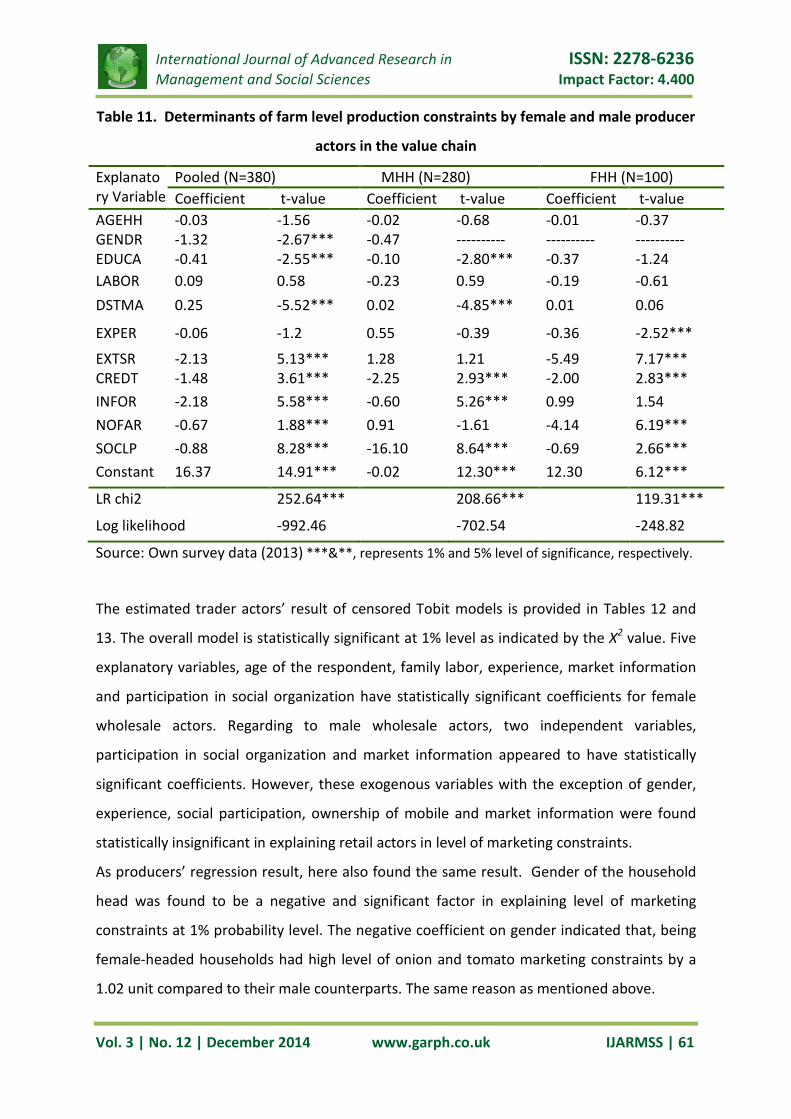
censored Tobit regression models for producer actors are provided in Table 11. The overall
model is statistically significant at 1% level as indicated by the Chi-Square value 208.66,
119.31 and 252.64 in MHH, FHH and pooled data set, respectively.
As reflected in Table 11 below, Gender of the household head was found to be a negative
and significant factor in explaining severity of production constraints at 1% probability level.
Lists of constraints Wholesale Actors(N=293) Retail Actors(N=186) Female Male Female Male % reporting problem
% reporting problem
% reporting problem
% reporting problem
Inadequate credit access 66.67 73.31 74.70 72.58 Problem of theft 16.67 4.38 7.23 9.14 Problem of price setting 40.48 36.25 17.47 18.82 Problem of scaling weighting 19.05 6.37 23.93 23.50 Shortage supply 57.14 37.75 21.95 21.86 High brokerage fee 76.19 72.91 *** *** Storage problem/improper shading
76.19 74.90 92.81 92.47
Lack demand 40.54 13.11 86.14 76.34 Capital shortage 50.00 24.30 66.27 63.98 Problem of rural road access 88.10 83.27 *** *** Inadequate information 78.57 70.92 16.87 16.67 High competition with licensed traders
61.90 25.90 78.18 85.48
High competition with unlicensed traders
50.00 28.69 83.13 82.80
Quality problem(adulteration) 38.10 17.34 77.11 75.27 Unable to have good government policy
90.48 52.99 80.72 78.49
International Journal of Advanced Research in ISSN: 2278-6236 Management and Social Sciences Impact Factor: 4.400
Vol. 3 | No. 12 | December 2014 www.garph.co.uk IJARMSS | 60
The negative coefficient on gender indicated that, being female-headed households more
vulnerable to onion and tomato production constraints by a 1.32 unit compared to their
male counterparts. This may be due to the female- headed households are vulnerable to
resource constraint like labor, capital and skill for onion and tomato farm operation.
As hypothesized, the censored Tobit regression result shows that participation in social
organization significantly affected both FHH and MHH farmers’ at less than 1% probability
level. The negative and significant relation between the variables indicates that FHH and
MHH producer gets a member in social organization by a one unit, severity of production
constraints decreased by a 0.69 unit and a 16.10 unit, respectively. In FHH and MHH, the
estimated coefficient for utilization of credit indicated a negative and significant relationship
between production constraints and utilization of credit, as expected. When a respondent
used credit, production constraints level decrease by a 2.25 and a 2.00 unit for MHH and
FHH, respectively (Table 11).
As prior expectation, access to market information and educational level of the respondent
had negative and significant influence on MHH at 1% significant level. The negative
association suggests that having information and educational level of the producers, the
more likely they decrease severity of production constraints. Hence, the variable indicates
that, severity of production constraints decreased by a 0.60 and a 0.10 unit with use of
market information and increase level of education, respectively (Table 11).
Distance from nearest market center was assumed to determine severity of production
constraints in MHH producers. The finding in Table 11 agrees with the hypothesis in that
farm distance to the nearest market is positively and significantly associated the probability
of severity of production constraints in vegetables at less than 1% significant level. As
distance decrease by a km, severity of production constraints decreases by a 0.02 unit.
The findings of this study pinpointed that FHH producers participated in non-farm activity,
farming experience in onion and tomato and contact with extension agents had negatively
related with severity of production constraints at less than 1% significance level. The result
from this test in the model shows that in FHH severity of production constraints decreased
by a 5.49, 4.14 and a 0.36 unit as increases vegetable farming experience by one year,
household heads had contact with extension agents and involved in non-farm activities,
respectively.
International Journal of Advanced Research in ISSN: 2278-6236 Management and Social Sciences Impact Factor: 4.400
Vol. 3 | No. 12 | December 2014 www.garph.co.uk IJARMSS | 61
Table 11. Determinants of farm level production constraints by female and male producer
actors in the value chain
Explanatory Variables
Pooled (N=380) MHH (N=280) FHH (N=100) Coefficient t-value Coefficient t-value Coefficient t-value
AGEHH -0.03 -1.56 -0.02 -0.68 -0.01 -0.37 GENDR -1.32 -2.67*** -0.47 ---------- ---------- ---------- EDUCA -0.41 -2.55*** -0.10 -2.80*** -0.37 -1.24 LABOR 0.09 0.58 -0.23 0.59 -0.19 -0.61 DSTMA 0.25 -5.52*** 0.02 -4.85*** 0.01 0.06
EXPER -0.06 -1.2 0.55 -0.39 -0.36 -2.52***
EXTSR -2.13 5.13*** 1.28 1.21 -5.49 7.17*** CREDT -1.48 3.61*** -2.25 2.93*** -2.00 2.83*** INFOR -2.18 5.58*** -0.60 5.26*** 0.99 1.54 NOFAR -0.67 1.88*** 0.91 -1.61 -4.14 6.19*** SOCLP -0.88 8.28*** -16.10 8.64*** -0.69 2.66*** Constant 16.37 14.91*** -0.02 12.30*** 12.30 6.12***
LR chi2 252.64*** 208.66*** 119.31***
Log likelihood -992.46 -702.54 -248.82
Source: Own survey data (2013) ***&**, represents 1% and 5% level of significance, respectively.
The estimated trader actors’ result of censored Tobit models is provided in Tables 12 and
13. The overall model is statistically significant at 1% level as indicated by the X2 value. Five
explanatory variables, age of the respondent, family labor, experience, market information
and participation in social organization have statistically significant coefficients for female
wholesale actors. Regarding to male wholesale actors, two independent variables,
participation in social organization and market information appeared to have statistically
significant coefficients. However, these exogenous variables with the exception of gender,
experience, social participation, ownership of mobile and market information were found
statistically insignificant in explaining retail actors in level of marketing constraints.
As producers’ regression result, here also found the same result. Gender of the household
head was found to be a negative and significant factor in explaining level of marketing
constraints at 1% probability level. The negative coefficient on gender indicated that, being
female-headed households had high level of onion and tomato marketing constraints by a
1.02 unit compared to their male counterparts. The same reason as mentioned above.
International Journal of Advanced Research in ISSN: 2278-6236 Management and Social Sciences Impact Factor: 4.400
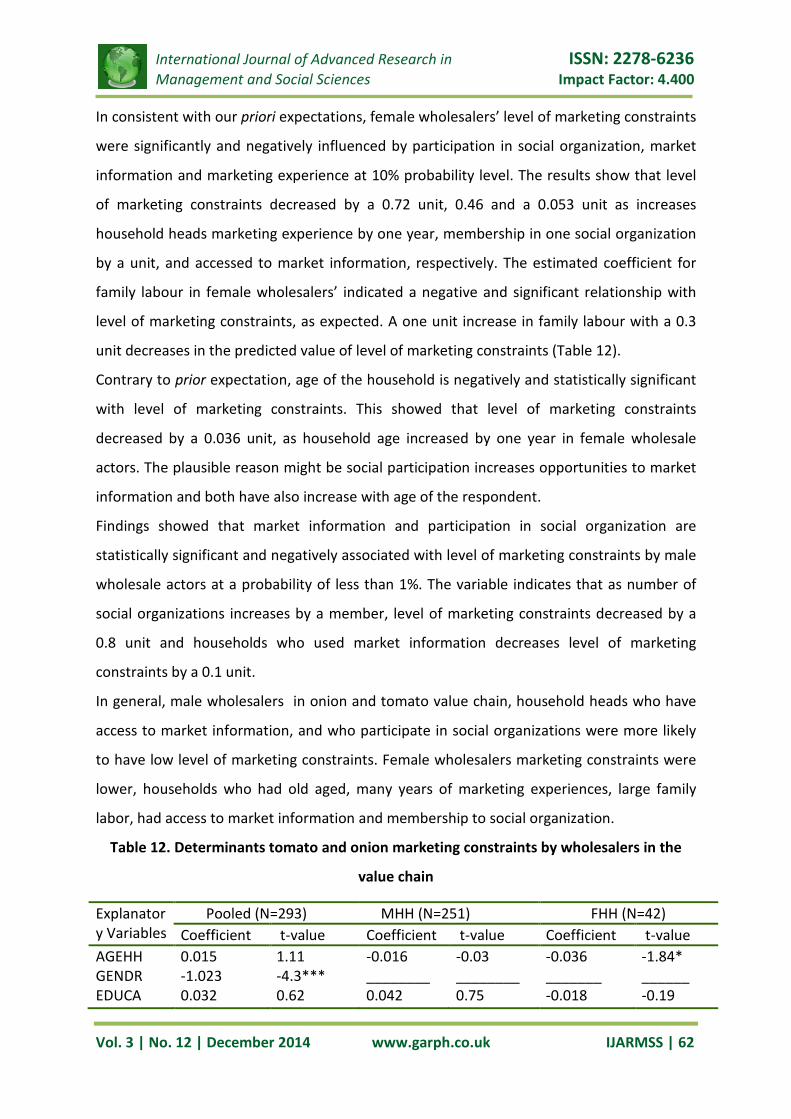
Vol. 3 | No. 12 | December 2014 www.garph.co.uk IJARMSS | 62
In consistent with our priori expectations, female wholesalers’ level of marketing constraints
were significantly and negatively influenced by participation in social organization, market
information and marketing experience at 10% probability level. The results show that level
of marketing constraints decreased by a 0.72 unit, 0.46 and a 0.053 unit as increases
household heads marketing experience by one year, membership in one social organization
by a unit, and accessed to market information, respectively. The estimated coefficient for
family labour in female wholesalers’ indicated a negative and significant relationship with
level of marketing constraints, as expected. A one unit increase in family labour with a 0.3
unit decreases in the predicted value of level of marketing constraints (Table 12).
Contrary to prior expectation, age of the household is negatively and statistically significant
with level of marketing constraints. This showed that level of marketing constraints
decreased by a 0.036 unit, as household age increased by one year in female wholesale
actors. The plausible reason might be social participation increases opportunities to market
information and both have also increase with age of the respondent.
Findings showed that market information and participation in social organization are
statistically significant and negatively associated with level of marketing constraints by male
wholesale actors at a probability of less than 1%. The variable indicates that as number of
social organizations increases by a member, level of marketing constraints decreased by a
0.8 unit and households who used market information decreases level of marketing
constraints by a 0.1 unit.
In general, male wholesalers in onion and tomato value chain, household heads who have
access to market information, and who participate in social organizations were more likely
to have low level of marketing constraints. Female wholesalers marketing constraints were
lower, households who had old aged, many years of marketing experiences, large family
labor, had access to market information and membership to social organization.
Table 12. Determinants tomato and onion marketing constraints by wholesalers in the
value chain
Explanatory Variables
Pooled (N=293) MHH (N=251) FHH (N=42) Coefficient t-value Coefficient t-value Coefficient t-value
AGEHH 0.015 1.11 -0.016 -0.03 -0.036 -1.84* GENDR -1.023 -4.3*** ________ ________ _______ ______ EDUCA 0.032 0.62 0.042 0.75 -0.018 -0.19

International Journal of Advanced Research in ISSN: 2278-6236 Management and Social Sciences Impact Factor: 4.400
Vol. 3 | No. 12 | December 2014 www.garph.co.uk IJARMSS | 63
Source: Own survey data (2013) ***, **&* represents 1%, 5%and 10% level of significance,
respectively.
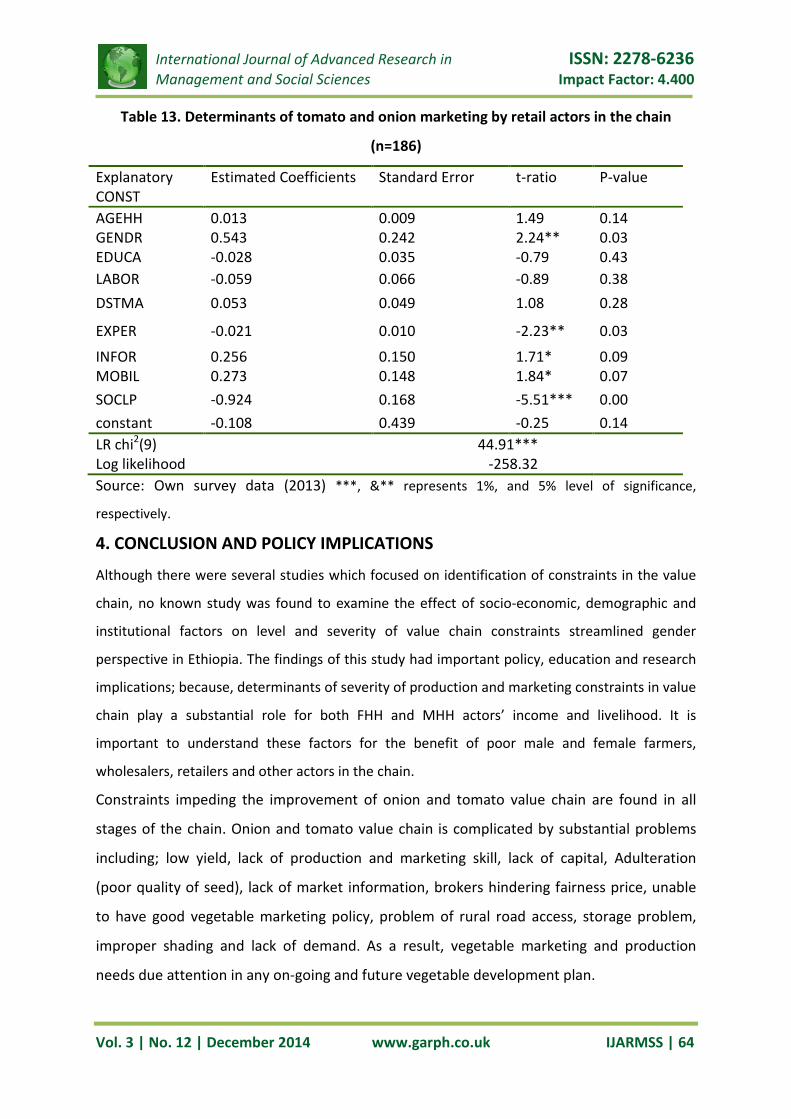
With respect to retailers’ econometric analysis (Table 13), censored Tobit regression models
were regressed to the retailers’ data as pooled set because the numbers of male retailers
were few in number (10.2%) whereas 89.8% were female retailers. Ametemariam (2009)
also found about 80% of vegetables retailers were women.
As displayed in Table 13, Gender of the household head was found to be a positive and
significant factor in explaining level of marketing constraints at 5% probability level. The
positive coefficient on gender indicated that, being male-headed households more
vulnerable to onion and tomato marketing constraints by a 0.54 unit compared to their
female counterparts.
As expected, social participation and experience of the retail actors are negatively related
and statistically significant with level of marketing constraints at 1% and 5% probability
level, respectively. This implies that, retail actors’ onion and tomato marketing experience
increases by one year and participation in social organization increases by one unit, level of
marketing constraints decreased by a 0.9 unit and a 0.02 unit, respectively.
In contrary to our prior expectation, ownership of mobile and market information is
positively associated and statistically significant with level of marketing constraints. This
revealed that level of marketing constraints decreased by a 0.27 and a 0.26 unit, as retailers
who had mobile phone and accessed market information.
LABOR -0.026 -0.39 0.001 0.01 -0.322 -2.17** DSTMA 0.006 0.15 0.009 0.13 -0.033 -0.51
EXPER -0.002 -0.12 0.010 0.25 -0.053 -1.75* INFOR -0.063 -0.38 -0.103 -6.00*** -0.461 -1.86* SOCLP -0.524 -2.6*** -0.831 -4.59*** -0.720 -1.98* constant 3.131 5.34*** 3.400 15.65*** 14.816 17.18***
LR chi2(8) 36.45 *** 15.18 *** 25.64*** Log likelihood -490.70 -424.53 -40.62
International Journal of Advanced Research in ISSN: 2278-6236 Management and Social Sciences Impact Factor: 4.400
Vol. 3 | No. 12 | December 2014 www.garph.co.uk IJARMSS | 64
Table 13. Determinants of tomato and onion marketing by retail actors in the chain
(n=186)
Explanatory CONST
Estimated Coefficients Standard Error t-ratio P-value
AGEHH 0.013 0.009 1.49 0.14 GENDR 0.543 0.242 2.24** 0.03 EDUCA -0.028 0.035 -0.79 0.43 LABOR -0.059 0.066 -0.89 0.38 DSTMA 0.053 0.049 1.08 0.28
EXPER -0.021 0.010 -2.23** 0.03
INFOR 0.256 0.150 1.71* 0.09 MOBIL 0.273 0.148 1.84* 0.07 SOCLP -0.924 0.168 -5.51*** 0.00 constant -0.108 0.439 -0.25 0.14 LR chi2(9) 44.91*** Log likelihood -258.32 Source: Own survey data (2013) ***, &** represents 1%, and 5% level of significance,
respectively.
4. CONCLUSION AND POLICY IMPLICATIONS
Although there were several studies which focused on identification of constraints in the value
chain, no known study was found to examine the effect of socio-economic, demographic and
institutional factors on level and severity of value chain constraints streamlined gender
perspective in Ethiopia. The findings of this study had important policy, education and research
implications; because, determinants of severity of production and marketing constraints in value
chain play a substantial role for both FHH and MHH actors’ income and livelihood. It is
important to understand these factors for the benefit of poor male and female farmers,
wholesalers, retailers and other actors in the chain.
Constraints impeding the improvement of onion and tomato value chain are found in all
stages of the chain. Onion and tomato value chain is complicated by substantial problems
including; low yield, lack of production and marketing skill, lack of capital, Adulteration
(poor quality of seed), lack of market information, brokers hindering fairness price, unable
to have good vegetable marketing policy, problem of rural road access, storage problem,
improper shading and lack of demand. As a result, vegetable marketing and production
needs due attention in any on-going and future vegetable development plan.
International Journal of Advanced Research in ISSN: 2278-6236 Management and Social Sciences Impact Factor: 4.400
Vol. 3 | No. 12 | December 2014 www.garph.co.uk IJARMSS | 65
The productivity level of onion and tomato in the study area is below its potential. Female-
headed producers had low yield compared to their male counterparts. This needs to be call
for urgent action at different levels in terms of research and extension efforts. To bring
about equitable and sustainable changes in the value chain, efforts should be made to
improve the yield of both male-headed and female-headed producers’ by providing;
improved seeds and technical support to farmers in agronomy practices. Moreover,
improved seed production, multiplication, distribution and farm trial should be
strengthened.
The extension services delivered to female and male headed farmers should be taking into
account the perceived rates of production and marketing constraints in the value chain.
Even though, women playing a central role in onion and tomato value chain and the
government has given due attention for gender equity and equality, women actors
(producers, and wholesalers) were more vulnerable to the marketing and production
constraints compared to their male counterparts. Technical support on entrepreneurship,
agronomic practices, adult education and saving and credit would be strengthening for
female actors in the value chain. Ethiopian Government in its Growth and Transformation
Plan (GTP) has taken different measures (legislative, political and socio-economic) to
empower women, but, practically they are still more disadvantaged. Therefore, continues
follow up and supervision should be taken. Therefore, government should give attention to
improve the inefficient market chain, through strengthening institutions like cooperatives
and unions since cooperatives are not actively involving in vegetable production and
marketing.
Even though, female and male wholesale actors had different perspectives on marketing
constraints in the value chain, the most frequently rated problems were road access in the
production area and storage problem. Due to poor road access, vegetable loaded trucks
frequently face accident; as a result, wholesalers lost their tomato and onion. Therefore, the
government should give attention on construction and upgrading rural roads.
The survey result also indicated that, improper shading was highly perceived problems by
retail actors. Except Mojo, retail stalls were poor and exposed to sun heat and rainfall.
Strong support should be made by the government, to improve market centers.
International Journal of Advanced Research in ISSN: 2278-6236 Management and Social Sciences Impact Factor: 4.400
Vol. 3 | No. 12 | December 2014 www.garph.co.uk IJARMSS | 66
Moreover, the regression result shows that, female-headed producers’ who had better
contact to extension agents, utilized credit, better participation in social organizations,
better onion and tomato farming experience and participated in non-farm activities had low
level of production constraints. In male-headed households, education, credit utilization,
market information and participated in social organization were important variables to
reduce severity of production constraints. Hence, to improve onion and tomato value chain,
institutional support should be improved; such as credit service, access to rural road, linking
farmers to the market, access to research and extension services.
In general, to address the existing gap of women in terms of access to market information,
low agronomic practice, low yield and financial problem, specialized programs and intensive
training efforts are to be designed and executed for them. They should be given technical
training on saving and credit schemes and agronomic practices. They should also be linked
to the market and given technical assistances as well.
5. REFERENCES
1. Abay Akalu, 2007. Vegetable marketing chain analysis in the case of Fogera Wereda,
in Amehara National regional state of Ethiopia. An MSc Thesis Presented to School of
Graduate Studies of Haramaya University.
2. Abdi Herve and Williams J. Lynne. 2010. Principal Component Analysis. Wiley
Interdisciplinary Reviews: Computational Statistics, 2(1).
3. Adebisi-Adelani O., F.B. Olajide-Taiwo, I.B. Adeoye and L.O. Olajide-Taiwo .2011.
Analysis of Production Constraints Facing Fadama Vegetable Farmers in Oyo State,
Nigeria.World Journal of Agricultural Sciences 7 (2): 189-192.
4. Almaz Giziew, Ranjan, S.K., Teklu Tesfaye. 2011. Adoption of improved chickpea
technology packages in East shewa, Ethiopia. Journal of agricultural extension
management : 12(1) .
5. Almaz Giziew. 2012. Domestic Value Chain For Fresh Vegetables: In the case of
Akaki-Kality Sub-City, Addis Ababa City Administration, Ethiopia.
6. Ametemariam Geberemicheal, 2009. Role of Women in Value-Chain Systems Of
Vegetables and Spices In Atsbi Wemberta Woreda, Eastern Zone Of Tigray, MSc
Thesis Mekelle university Ethiopia.
International Journal of Advanced Research in ISSN: 2278-6236 Management and Social Sciences Impact Factor: 4.400
Vol. 3 | No. 12 | December 2014 www.garph.co.uk IJARMSS | 67
7. Awotide Bola Amoke, Aliou Diagne b, Alexander Nimo Wiredu c,Vivian Ebihomon
Ojehomon .2012. Wealth Status And Agricultural Technology Adoption Among
Smallholder Rice Farmers In Nigeria. ISSN 1923-6662 (online). International Journal
of Sustainable Development 05: 02 Available at http://www.ssrn.com/link/OIDA-Intl-
Journal-Sustainable-Dev.html
8. Bako Makarau Shehu, Anna Garba Ogilvie, Thomas Wamagi Ishaku and Ayuba
Damina .2013. Farmers’ constraints to vegetable production in Jaba Local
Government Area of Kaduna State, Nigeria. Unique Research Journal of Agricultural
Sciences Vol. 1(4), pp. 063-069.
9. Berhanu Kuma. 2012. Market Access and Value Chain Analysis of Dairy Industry in
Ethiopia: The Case of Wolaita Zone. PhD Thesis, Haramaya University, Ethiopia
10. Bezabih Emana. 2008. Participatory Value Chain Analysis at Kombolcha District of
Eastern Hararghe, Ethiopia
11. Bezabih, E., and Hadera, G. 2007. Constraints and opportunities of horticulture
production and marketing in eastern Ethiopia. Dry Lands Coordination Group Report
No 46. Grensen 9b. Norway. 90p
12. Bezabih Emana and Mengistu Nigussie. 2011. Potato Value Chain Analysis And
Development In Ethiopia: Case of Tigray and SNNP Regions Addis Ababa Ethiopia.
13. BoARD, 2012. Dugda district Annual Report
14. CSA. 2008. Area and Production of Major Crops. Agricultural Sample Enumeration
Survey. Addis Ababa, Ethiopia
15. Dayanandan, R. 2012. Production And Marketing Of Horticulture Products Problems,
Prospects And Livelihood Options. Jm International Journal of Marketing Ma Jm.
International Journal of Marketing Ma Rnal of Marketing Management Nagement
Nagement 2 (4).
16. EHDA(Ethiopian Horticulture Development Agency). 2011. Exporting fruit and
vegetable from Ethiopia. Assessment of development potentials and investment
options in the export-oriented fruit and vegetable sector. Addis Ababa, Ethiopia. p51
17. Kasturiwale Hemant P., Ingole P.V. 2012. Component Extraction of Complex
Biomedical Signals and Performance analysis. International Journal of Computer
Science and Information Technologies, Vol. 3 (2) , 3544-3547
International Journal of Advanced Research in ISSN: 2278-6236 Management and Social Sciences Impact Factor: 4.400
Vol. 3 | No. 12 | December 2014 www.garph.co.uk IJARMSS | 68
18. Gor, CO , Agong S.G, Achieng L, Akuno W, and Andika D.2012. The Interface between
Mango Value Chain Analysis and the Socioeconomic Determinants. Afr. J. Hort. Sci.
6:1-16
19. Gujarati, D.N., 1995. Basic econometrics. 3rd edition, McGraw Hill, Inc., New York.
20. Gupta AK, Garg SK, Pal SK, Saxena M, Sharma A.,(2011). Development and
Characterization of SRM Microspheres of Repaglinide. Journal of Drug Delivery &
Therapeutics; 2011, 1(1): 71-77.
21. Greene, W.H., 2003. Econometric Analysis. 5th Edition. Prentice Hall. Inc, London.
1026p
22. Hamilton, L.C., 2009. Statistics with Stata updated for version 10. Duxbury Press,
Duxbury Resource Centre. Cengage Publisher. TX, USA. pp 1-504.
23. Hanemann L. Patrick Ahmed Md. Saleh, (2006) Constraints and Opportunities Facing
the Horticultural Sector in Bangladesh. Prepared for the World Bank
24. Mabuza M.L., Ortmann G.F. & Wale E. (2012): Determinants of farmers’ participation
in oyster mushroom production in Swaziland: Implications for promoting a
nonconventional agricultural enterprise, Agrekon: Agricultural Economics Research,
Policy and Practice in Southern Africa, 51:4, 19-40
25. Maddala, G.S., 1992. Introduction to Econometrics. Second Edition. New York:
Macmillan Publishing Company.
26. Maguire, J,G,Q., Marilyn, E.N., 2012. Quantitative tools: R and more.
<http://web.ict.kth.se/~maguire> (Accessed 15 December 2013).
27. Madisa M. E.; Assefa, Y. and Obopile, M. (2010) Assessment of Production
Constraints, Crop and Pest Management Practices in Peri-Urban Vegetable Farms of
Botswana. Egypt. Acad. J. biolog. Sci., 1(1): 1 – 11
28. Mesfin Astatkie, 2005. Analysis of factors Influencing Adoption of Triticale and its
Impact.The Case Farta Wereda. Msc. Thesis (Unpublished) Presented to School of
Graduate Studies of Alemaya University.
29. Munguzwe, H. and D. Tschirley, 2006. Policy synthesis food security research project.
Ministry of Agriculture and Cooperatives. Agricultural Consultative Forum, Michigan
State University and Market Access and Trade Enabling Policies (MATEP)
Programme, Lusaka, Zambia.
International Journal of Advanced Research in ISSN: 2278-6236 Management and Social Sciences Impact Factor: 4.400
Vol. 3 | No. 12 | December 2014 www.garph.co.uk IJARMSS | 69
30. Niño-Zarazúa, M., 2012. Quantitative analysis in social sciences: An brief introduction
for non-economists. <http://mpra.ub.uni-muenchen.de/39216/MPRA_paper
_39216.pdf. MPRA Paper No. 39216> (Accessed 15 December 2013).
31. Nwaru, J.C. (2004). Rural Credit Markets and Resource Use in Arable Crop Production
in Imo State of Nigeria.(Unpublished Doctorate Dissertation) Department of
Agricultural Economics, Michael Okpara University ofAgriculture, Umudike, Nigeria.
32. Nwaru, J. C. 2005. Determinants of Farm and Off-Farm Incomes and Savings of Food
Crop Farms in Imo State, Nigeria: Implications for Poverty Alleviation. The Nigerian
Agricultural Journal, 36, 26 – 42.
33. Onofrei Elena .2010. Identification of the most significant factors influencing thermal
comfort using Principal Component Analysis and selection of the fabric according to
the apparel end-use. University of Minho, Centre for Textile Science and Technology,
Campus de Azurém, 4800 - 058 Guimarães, Portugal.
34. Rutgers T., 2010. An Analysis of Supply Side Constraints on Ethiopian Red Pepper and
Paprika Capsicum Production and Export: a global value chain approach. Master
thesis International Development Studies Utrecht University
35. Samantaray S. K., S. Prusty and R. K. Raj. 2009. Constraints in Vegetable Production-
Experiences of Tribal Vegetable Growers. Indian Res. J. Ext. Edu. 9 (3).
36. Samuel Asgedom, Paul C. Struik, Ep Heuvelink and Woldeamlak Araia. 2011.
Opportunities and constraints of tomato production in Eritrea. African Journal of
Agricultural Research Vol. 6(4), pp. 956-967
37. Suleiman A. 2004. Smallholder Supply Response and Gender in Ethiopia: A Profit
Function Analysis. Department of Economics, University of Sheffield, United Kingdom
38. Suman R. S. 2012. Constraints With Regard To Improved Vegetable Production
Technologies. Indian Journal of Fundamental and Applied Life Sciences ISSN: 2231-
6345
39. Tsion Tesfaye., Ranjan, S.K., Teklu Tesfaye. 2009. Farmers training programme of
Ethiopian Institute of Agricultural Research: An appraisal. African Journal of
Agricultural Resource 4: 409-421.
International Journal of Advanced Research in ISSN: 2278-6236 Management and Social Sciences Impact Factor: 4.400
Vol. 3 | No. 12 | December 2014 www.garph.co.uk IJARMSS | 70
40. Tsion, T. and Worth Steven. 2013. Factors Influencing High School Agricultural
Science Student Attitudes to Agricultural Educational Training: Kwazulu-Natal, South
Africa. Journal of International Agricultural and Extension Education, 20(2): 152-153.
41. Walker, J., Maddan, S., 2008. Statistics in Criminology and Criminal Justice: Analysis
and Interpretation. Jones and Bartlett Learning.
42. Yamane, T., 1967. Statistics, an Introductory Analysis, 2nd ed., New York: Harper and
Row.
43. Young, F. W., Y. Takane, and J. De Leeuw. 1978. The principal components of mixed
measurement level multivariate data: An alternating least squares method with
optimal scaling features. Psychometrika, 43: 279–281.
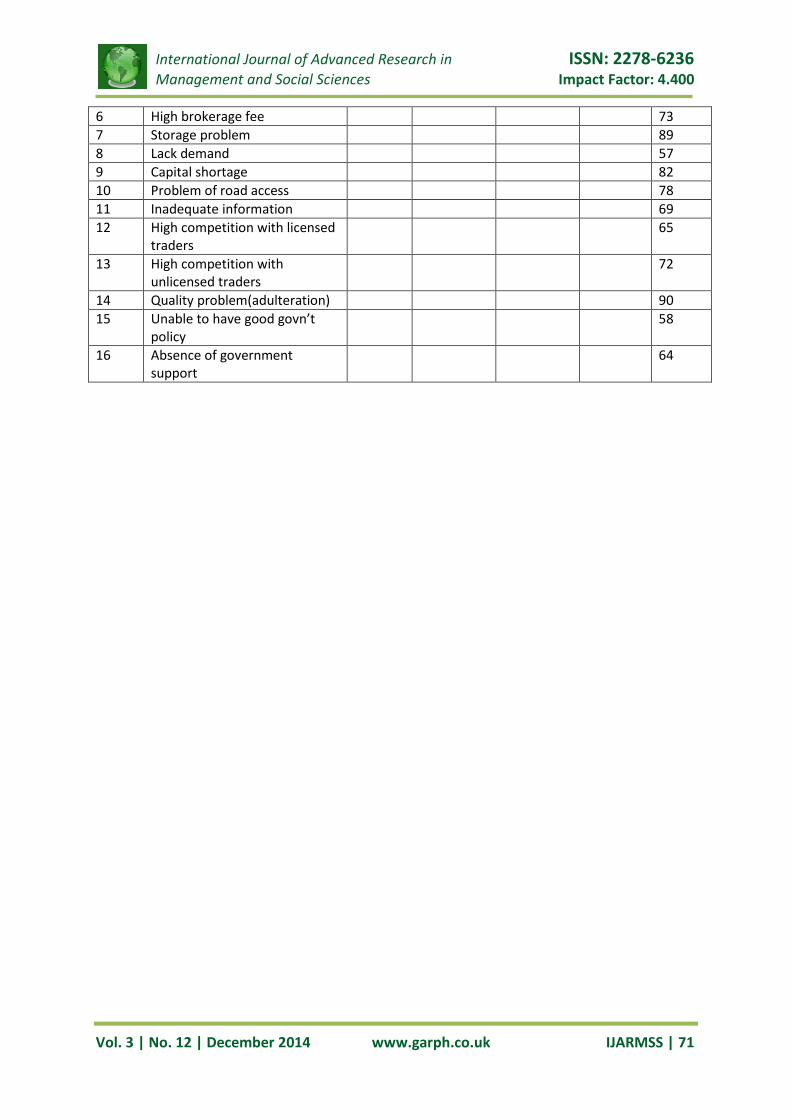
Appendix
Table 1. Relevancy index rating score
Sl.No Variable Degree of relevance Total score (%)
Highly relevant
Somewhat relevant
undecided Not relevant
1 lack of skill 70
2 lack of capital 80
3 Adulteration 81 4 Inadequate extension
services 30
5 Shortage of land 45 6 Diseases 75 7 Lack of pesticide 90 8 Fertilizer shortage 92 9 labor shortage 95 10 Oxen shortage 96 11 Insects 90 12 Seed shortage 85 13 Drought 40 14 Frost 30 15 Flood 41 16 Theft 54 Marketing constraints 1 Inadequate credit access 83 2 Problem of theft 86 3 Problem of price setting 98 4 Problem of scaling weighting 87 5 Shortage supply 91
International Journal of Advanced Research in ISSN: 2278-6236 Management and Social Sciences Impact Factor: 4.400
Vol. 3 | No. 12 | December 2014 www.garph.co.uk IJARMSS | 71
6 High brokerage fee 73 7 Storage problem 89 8 Lack demand 57 9 Capital shortage 82 10 Problem of road access 78 11 Inadequate information 69 12 High competition with licensed
traders 65
13 High competition with unlicensed traders
72
14 Quality problem(adulteration) 90 15 Unable to have good govn’t
policy 58
16 Absence of government support
64