Embed Size (px)
Citation preview
238 Georgia Notetaking Guide, Mathematics 3 Copyright © McDougal Littell/Houghton Mifflin Company.
Construct and Interpret Binomial Distributions
6.1Goal p Study probability distributions.
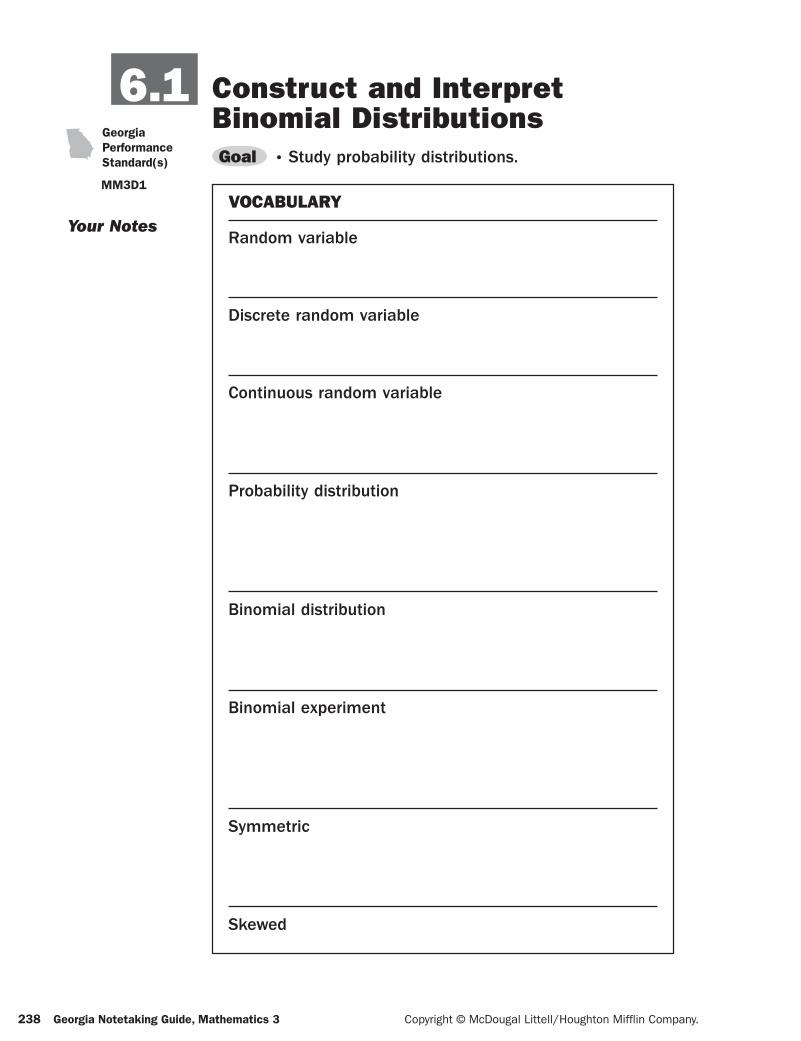
VOCABULARY
Random variable
Discrete random variable
Continuous random variable
Probability distribution
Binomial distribution
Binomial experiment
Symmetric
Skewed
GeorgiaPerformanceStandard(s)
MM3D1
Your Notes
ga3nt-06.indd 153 4/13/07 3:17:18 PM
ga3_ntg_06.indd 238ga3_ntg_06.indd 238 4/18/07 10:50:41 AM4/18/07 10:50:41 AM
Copyright © McDougal Littell/Houghton Mifflin Company. Georgia Notetaking Guide, Mathematics 3 239
Your Notes
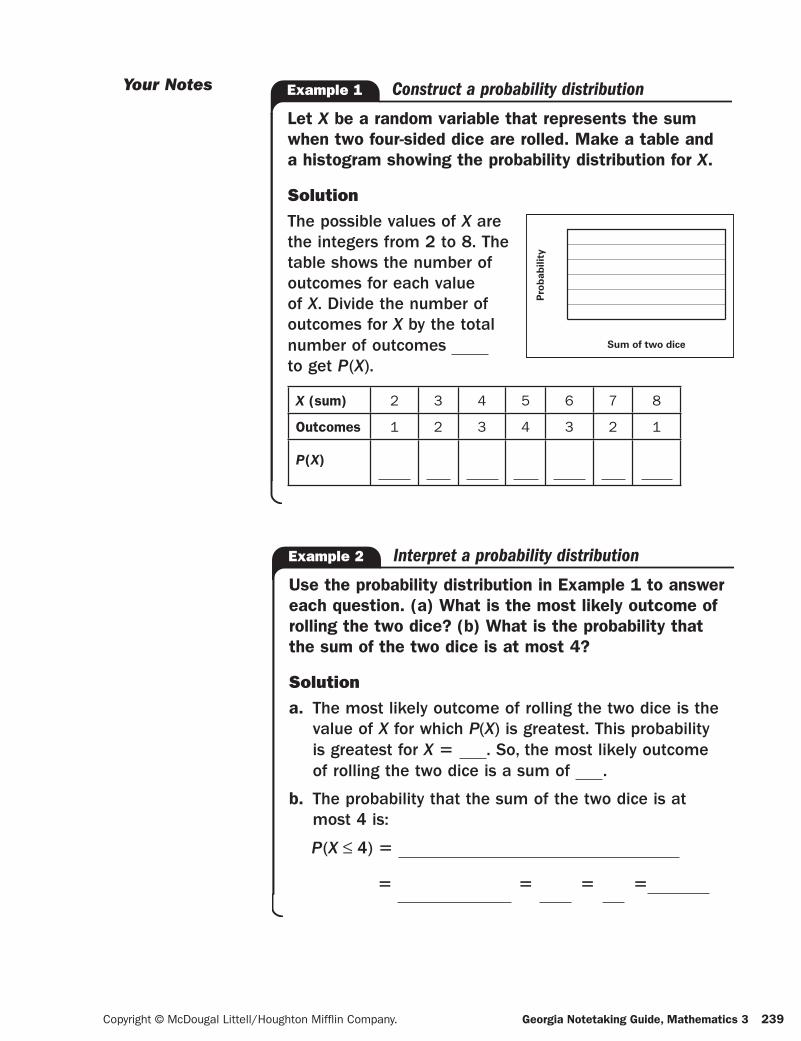
Let X be a random variable that represents the sum when two four-sided dice are rolled. Make a table and a histogram showing the probability distribution for X.
SolutionThe possible values of X are
Pro
ba
bil
ity
Sum of two dice
the integers from 2 to 8. The table shows the number of outcomes for each value of X. Divide the number of outcomes for X by the total number of outcomes to get P(X).
X (sum) 2 3 4 5 6 7 8
Outcomes 1 2 3 4 3 2 1
P(X)
Example 1 Construct a probability distribution
Use the probability distribution in Example 1 to answer each question. (a) What is the most likely outcome of rolling the two dice? (b) What is the probability that the sum of the two dice is at most 4?
Solutiona. The most likely outcome of rolling the two dice is the
value of X for which P(X) is greatest. This probability is greatest for X 5 . So, the most likely outcome of rolling the two dice is a sum of .
b. The probability that the sum of the two dice is at most 4 is:
P(X ≤ 4) 5
5 5 5 5
Example 2 Interpret a probability distribution
ga3nt-06.indd 154 4/13/07 3:17:19 PM
ga3_ntg_06.indd 239ga3_ntg_06.indd 239 4/18/07 10:50:42 AM4/18/07 10:50:42 AM
240 Georgia Notetaking Guide, Mathematics 3 Copyright © McDougal Littell/Houghton Mifflin Company.
Your Notes
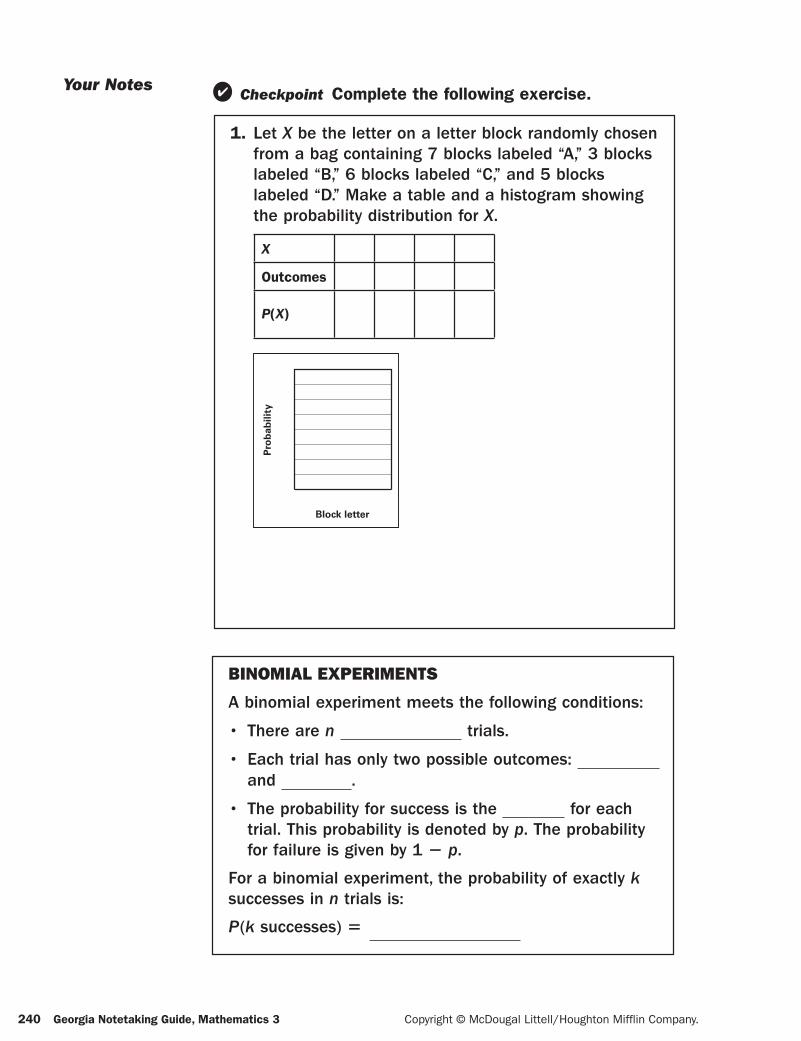
1. Let X be the letter on a letter block randomly chosen from a bag containing 7 blocks labeled “A,” 3 blocks labeled “B,” 6 blocks labeled “C,” and 5 blocks labeled “D.” Make a table and a histogram showing the probability distribution for X.
X
Outcomes
P(X)
Pro
ba
bil
ity
Block letter
Checkpoint Complete the following exercise.
BINOMIAL EXPERIMENTS
A binomial experiment meets the following conditions:
• There are n trials.
• Each trial has only two possible outcomes: and .
• The probability for success is the for each trial. This probability is denoted by p. The probability for failure is given by 1 2 p.
For a binomial experiment, the probability of exactly ksuccesses in n trials is:
P(k successes) 5
ga3nt-06.indd 155 4/13/07 3:17:20 PM
ga3_ntg_06.indd 240ga3_ntg_06.indd 240 4/18/07 10:50:43 AM4/18/07 10:50:43 AM
Copyright © McDougal Littell/Houghton Mifflin Company. Georgia Notetaking Guide, Mathematics 3 241
Your Notes
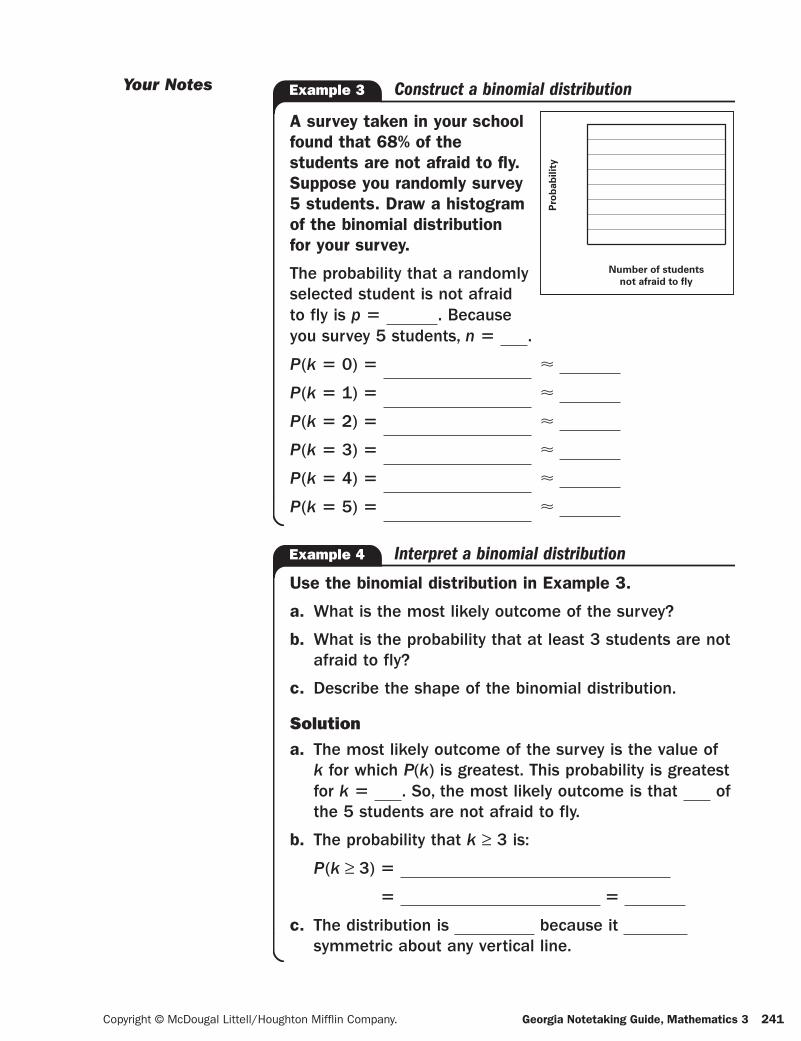
A survey taken in your school
Pro
ba
bil
ity
Number of students
not afraid to fly
found that 68% of the students are not afraid to fly. Suppose you randomly survey 5 students. Draw a histogram of the binomial distribution for your survey.
The probability that a randomly selected student is not afraid to fly is p 5 . Because you survey 5 students, n 5 .
P(k 5 0) 5 ø
P(k 5 1) 5 ø
P(k 5 2) 5 ø
P(k 5 3) 5 ø
P(k 5 4) 5 ø
P(k 5 5) 5 ø
Example 3 Construct a binomial distribution
Use the binomial distribution in Example 3.
a. What is the most likely outcome of the survey?
b. What is the probability that at least 3 students are not afraid to fly?
c. Describe the shape of the binomial distribution.
Solutiona. The most likely outcome of the survey is the value of
k for which P(k) is greatest. This probability is greatest for k 5 . So, the most likely outcome is that of the 5 students are not afraid to fly.
b. The probability that k ≥ 3 is:
P(k ≥ 3) 5
5 5
c. The distribution is because it symmetric about any vertical line.
Example 4 Interpret a binomial distribution
ga3nt-06.indd 156 4/13/07 3:17:21 PM
ga3_ntg_06.indd 241ga3_ntg_06.indd 241 4/18/07 10:50:45 AM4/18/07 10:50:45 AM
242 Georgia Notetaking Guide, Mathematics 3 Copyright © McDougal Littell/Houghton Mifflin Company.
Your Notes
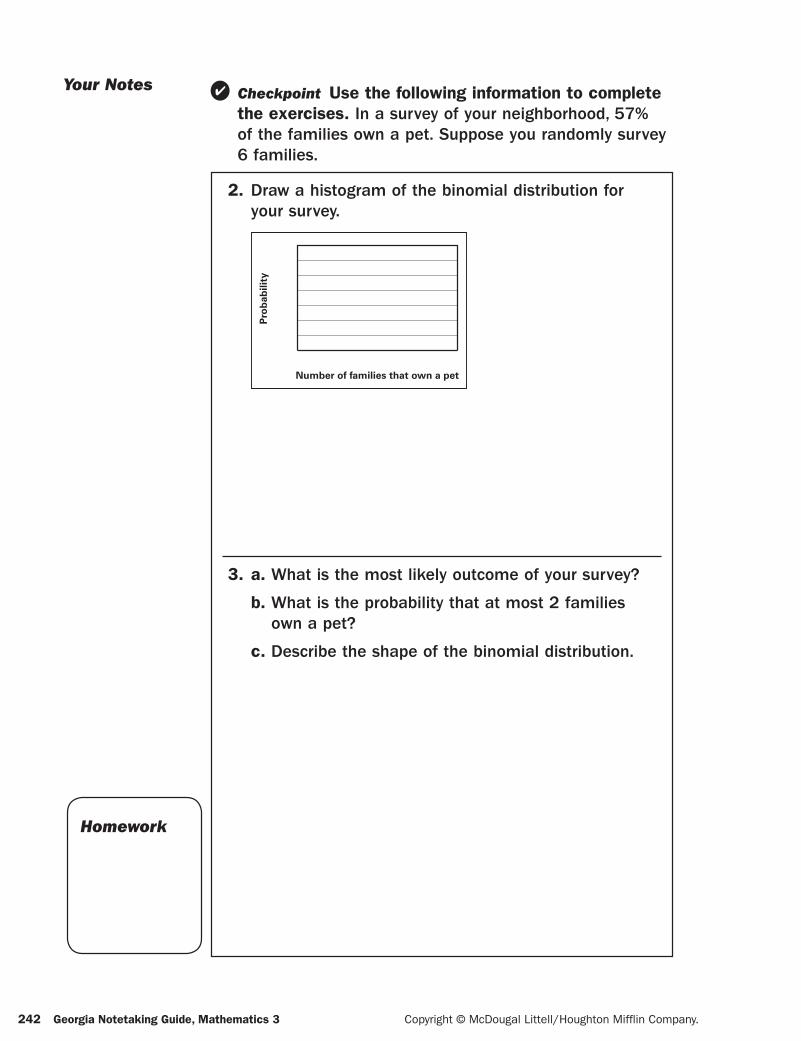
2. Draw a histogram of the binomial distribution for your survey.
Pro
ba
bil
ity
Number of families that own a pet
3. a. What is the most likely outcome of your survey?
b. What is the probability that at most 2 families own a pet?
c. Describe the shape of the binomial distribution.
Checkpoint Use the following information to complete the exercises. In a survey of your neighborhood, 57% of the families own a pet. Suppose you randomly survey 6 families.
Homework
ga3nt-06.indd 157 4/18/07 8:58:11 AM
ga3_ntg_06.indd 242ga3_ntg_06.indd 242 4/18/07 10:50:46 AM4/18/07 10:50:46 AM
Copyright © McDougal Littell/Houghton Mifflin Company. Georgia Notetaking Guide, Mathematics 3 243
Name ——————————————————————— Date ————————————
LESSON
6.1 PracticeDecide whether the random variable X is discrete or continuous. Explain.
1. X represents the amount of time it takes to download a fi le from the Internet.
2. X represents the number of fi sh caught during a fi shing tournament.
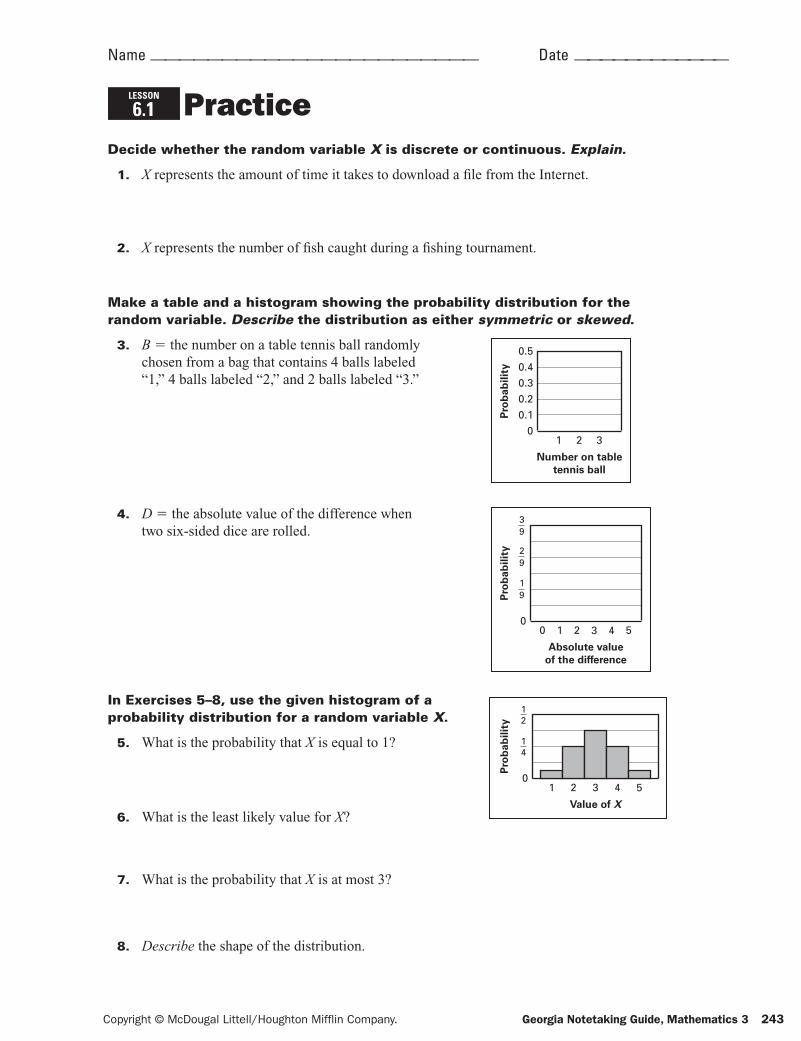
Make a table and a histogram showing the probability distribution for the random variable. Describe the distribution as either symmetric or skewed.
3. B 5 the number on a table tennis ball randomly
Pro
bab
ilit
y
Number on table
tennis ball
01 2 3
0.1
0.2
0.3
0.4
0.5chosen from a bag that contains 4 balls labeled “1,” 4 balls labeled “2,” and 2 balls labeled “3.”
4. D 5 the absolute value of the difference when P
rob
ab
ilit
y
Absolute value
of the difference
00 1 2 3 54
19
29
39two six-sided dice are rolled.
In Exercises 5–8, use the given histogram of a
Pro
bab
ilit
y
Value of X
01 2 3 4 5
14
12probability distribution for a random variable X.
5. What is the probability that X is equal to 1?
6. What is the least likely value for X?
7. What is the probability that X is at most 3?
8. Describe the shape of the distribution.
ga3_ntg_06.indd 243ga3_ntg_06.indd 243 4/18/07 10:50:47 AM4/18/07 10:50:47 AM
244 Georgia Notetaking Guide, Mathematics 3 Copyright © McDougal Littell/Houghton Mifflin Company.
Calculate the probability of tossing a coin 15 times and getting the given number of heads.
9. 4 10. 7 11. 10 12. 2
Calculate the probability of randomly guessing the given number of correct answers on a 20-question multiple choice exam that has choices A, B, C, and D for each question.
13. 5 14. 10 15. 15 16. 20
17. Automobile Accidents An automobile-safety researcher claims that 1 in 10 automobile accidents are caused by driver fatigue. What is the probability that at least three out of fi ve automobile accidents are caused by driver fatigue?
18. Pet Allergies An analyst claims that about 70% of U.S. households own either a cat or a dog, and an estimated 10% of the U.S. population is allergic to animals.
a. What is the probability that exactly 1 person in a class of 20 students owns either a cat or a dog? (Assume that no two students in the class come from the same household.)
b. What is the probability that at most 3 students in a class of 20 students are allergic to animals?
LESSON
6.1 Practice continued
Name ——————————————————————— Date ————————————
ga3_ntg_06.indd 244ga3_ntg_06.indd 244 4/18/07 10:50:48 AM4/18/07 10:50:48 AM
Copyright © McDougal Littell/Houghton Mifflin Company. Georgia Notetaking Guide, Mathematics 3 245
6.2 Use Normal DistributionsGoal p Study normal distributions.Georgia
PerformanceStandard(s)
MM3D2a, MM3D2b
Your Notes
VOCABULARY
Normal distribution
Normal curve
Standard normal distribution
z-score
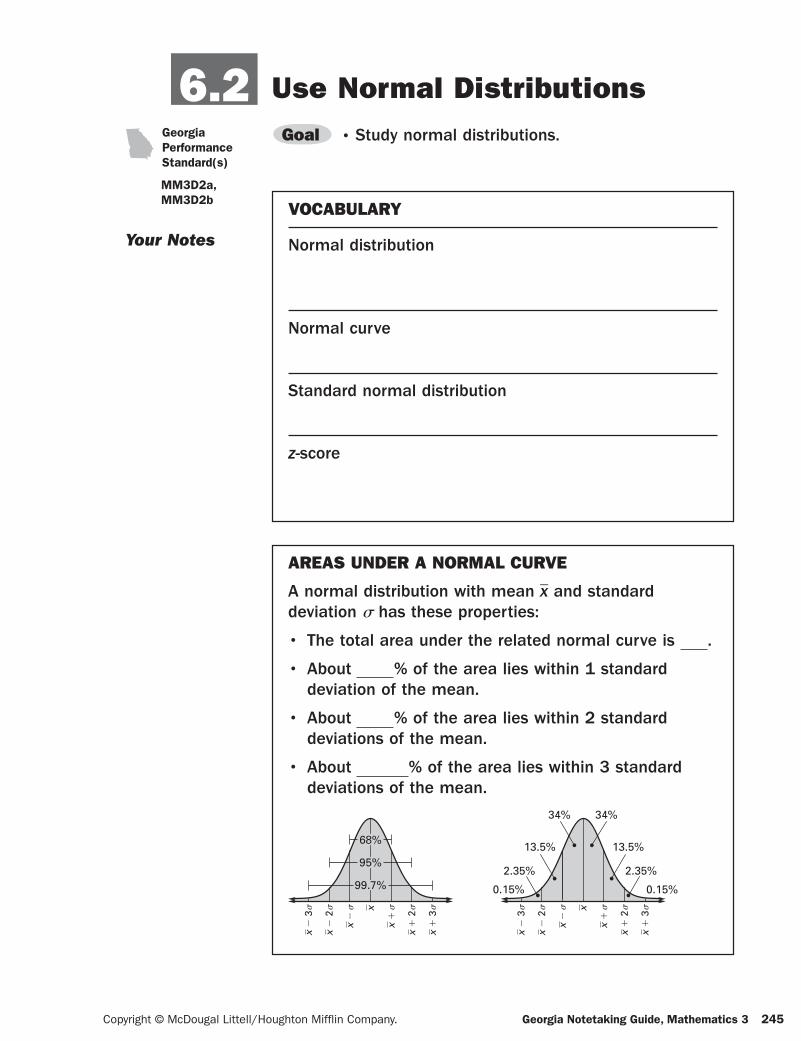
AREAS UNDER A NORMAL CURVE
A normal distribution with mean }x and standard deviation s has these properties:
• The total area under the related normal curve is .
• About % of the area lies within 1 standard deviation of the mean.
• About % of the area lies within 2 standard deviations of the mean.
• About % of the area lies within 3 standard deviations of the mean.
x2
3s
x2
2s
x2
s x
x1
s
x1
2s
x1
3s
68%
95%
99.7%
x2
3s
x2
2s
x2
s x
x1
s
x1
2s
x1
3s
2.35% 2.35%
0.15% 0.15%
13.5% 13.5%
34% 34%
ga3nt-06.indd 158 4/13/07 3:17:22 PM
ga3_ntg_06.indd 245ga3_ntg_06.indd 245 4/18/07 10:50:48 AM4/18/07 10:50:48 AM
246 Georgia Notetaking Guide, Mathematics 3 Copyright © McDougal Littell/Houghton Mifflin Company.
Your Notes
A normal distribution has mean
x2
3s
x2
2s
x2
s x
x1
s
x1
2s
x1
3s
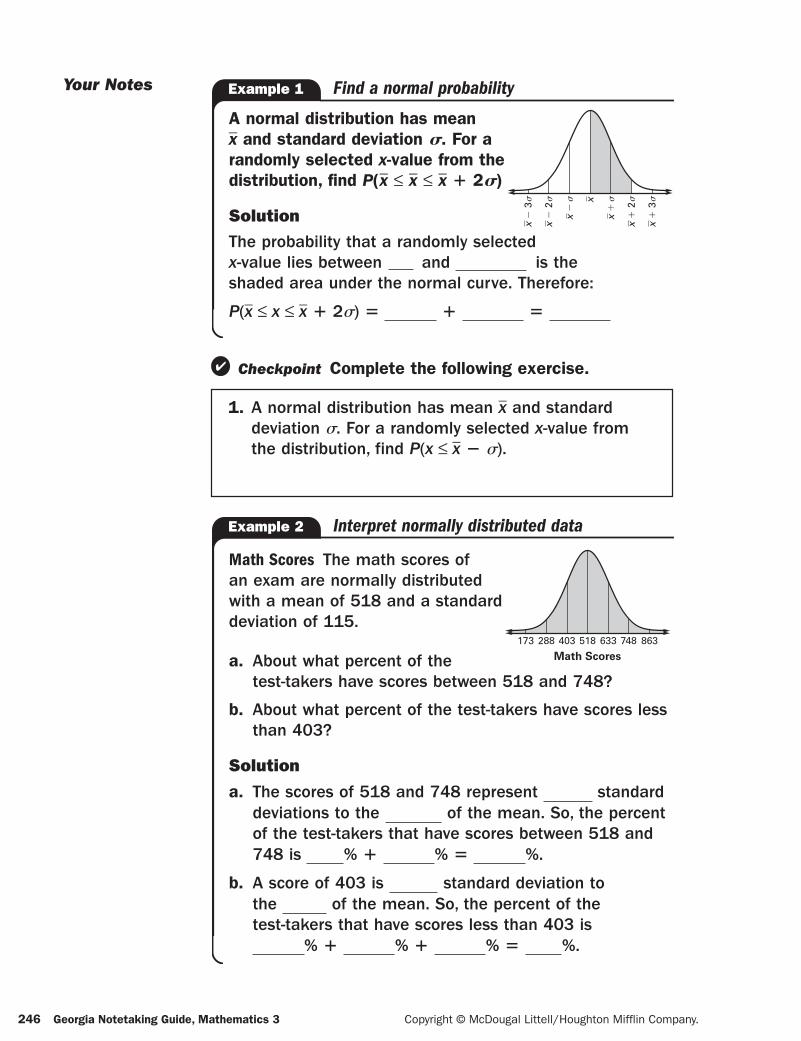
}x and standard deviation s. For a randomly selected x-value from the distribution, find P(}x ≤ }x ≤ }x 1 2s)
SolutionThe probability that a randomly selected x-value lies between and is the shaded area under the normal curve. Therefore:
P(}x ≤ x ≤ }x 1 2s) 5 1 5
Example 1 Find a normal probability
1. A normal distribution has mean }x and standard deviation s. For a randomly selected x-value from the distribution, find P(x ≤ }x 2 s).
Checkpoint Complete the following exercise.
Math Scores The math scores of
173 288 403 518
Math Scores
633 748 863
an exam are normally distributed with a mean of 518 and a standard deviation of 115.
a. About what percent of the test-takers have scores between 518 and 748?
b. About what percent of the test-takers have scores less than 403?
Solution
a. The scores of 518 and 748 represent standard deviations to the of the mean. So, the percent of the test-takers that have scores between 518 and 748 is % 1 % 5 %.
b. A score of 403 is standard deviation to the of the mean. So, the percent of the test-takers that have scores less than 403 is
% 1 % 1 % 5 %.
Example 2 Interpret normally distributed data
ga3nt-06.indd 159 4/13/07 3:17:23 PM
ga3_ntg_06.indd 246ga3_ntg_06.indd 246 4/18/07 10:50:50 AM4/18/07 10:50:50 AM
Copyright © McDougal Littell/Houghton Mifflin Company. Georgia Notetaking Guide, Mathematics 3 247
Your Notes
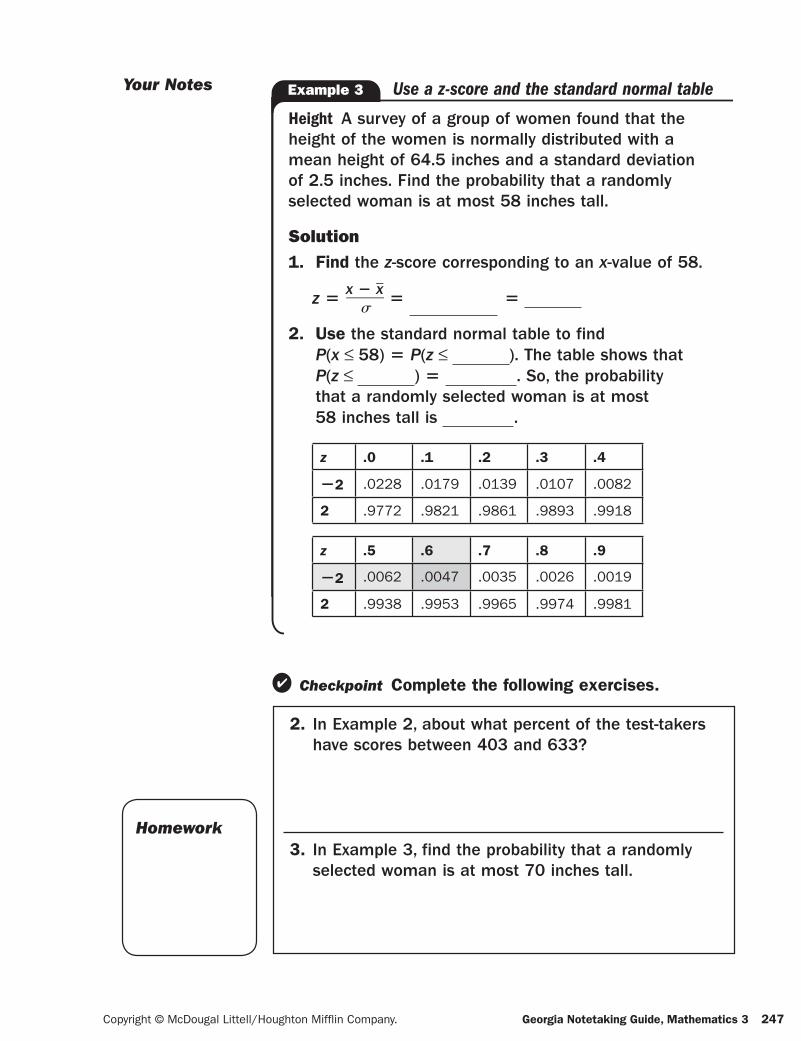
Height A survey of a group of women found that the height of the women is normally distributed with a mean height of 64.5 inches and a standard deviation of 2.5 inches. Find the probability that a randomly selected woman is at most 58 inches tall.
Solution1. Find the z-score corresponding to an x-value of 58.
z 5x 2 }x}
s5 5
2. Use the standard normal table to find P(x ≤ 58) 5 P(z ≤ ). The table shows that P(z ≤ ) 5 . So, the probability that a randomly selected woman is at most 58 inches tall is .
z .0 .1 .2 .3 .4
22 .0228 .0179 .0139 .0107 .0082
2 .9772 .9821 .9861 .9893 .9918
z .5 .6 .7 .8 .9
22 .0062 .0047 .0035 .0026 .0019
2 .9938 .9953 .9965 .9974 .9981
Example 3 Use a z-score and the standard normal table
2. In Example 2, about what percent of the test-takers have scores between 403 and 633?
3. In Example 3, find the probability that a randomly selected woman is at most 70 inches tall.
Checkpoint Complete the following exercises.
Homework
ga3nt-06.indd 160 4/13/07 3:17:24 PM
ga3_ntg_06.indd 247ga3_ntg_06.indd 247 4/18/07 10:50:51 AM4/18/07 10:50:51 AM
248 Georgia Notetaking Guide, Mathematics 3 Copyright © McDougal Littell/Houghton Mifflin Company.
A normal distribution has mean } x and standard deviation s. Find the indicated probability for a randomly selected x-value from the distribution.
1. P(x ≥ } x ) 2. P(x ≤ } x 2 2s) 3. P(x ≤ } x 1 3s)
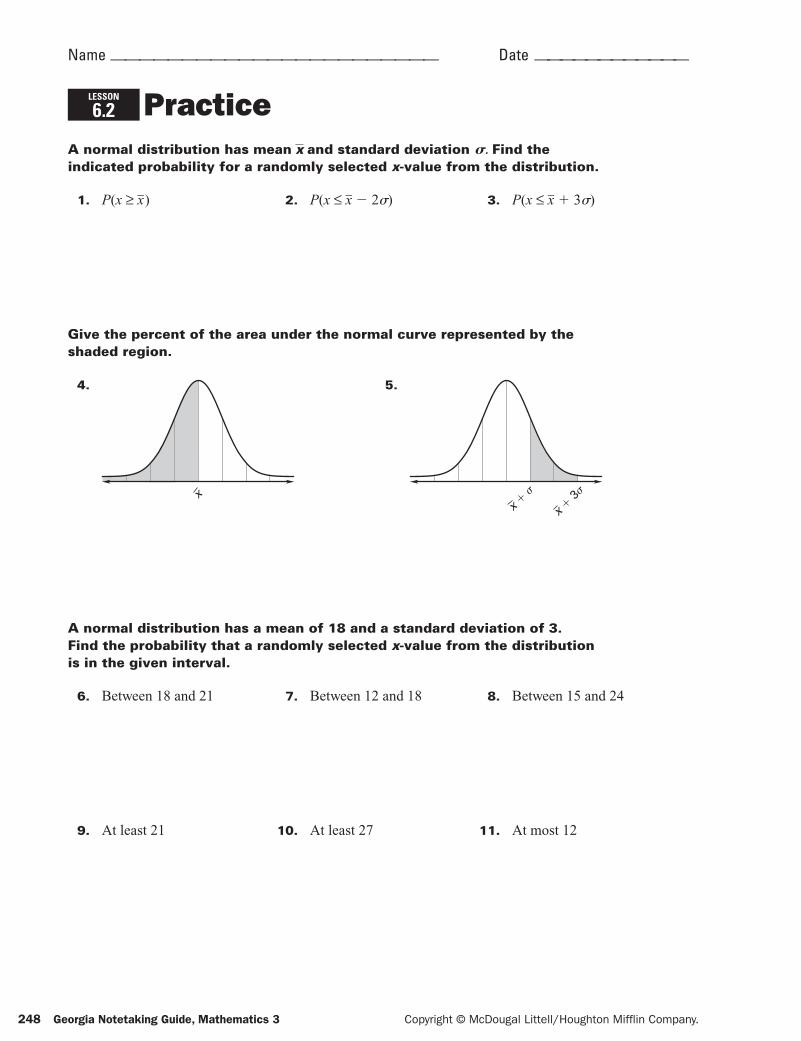
Give the percent of the area under the normal curve represented by the shaded region.
4.
x
5.
x 1 3s
x 1 s
A normal distribution has a mean of 18 and a standard deviation of 3. Find the probability that a randomly selected x-value from the distribution is in the given interval.
6. Between 18 and 21 7. Between 12 and 18 8. Between 15 and 24
9. At least 21 10. At least 27 11. At most 12
LESSON
6.2 Practice
Name ——————————————————————— Date ————————————
ga3_ntg_06.indd 248ga3_ntg_06.indd 248 4/18/07 10:50:52 AM4/18/07 10:50:52 AM
Copyright © McDougal Littell/Houghton Mifflin Company. Georgia Notetaking Guide, Mathematics 3 249
Name ——————————————————————— Date ————————————
LESSON
6.2 Practice continued
A normal distribution has a mean of 50 and a standard deviation of 5. Use the standard normal table to fi nd the indicated probability for a randomly selected x-value from the distribution.
12. P(x ≤ 50) 13. P(x ≤ 55) 14. P(x ≤ 40)
15. P(x ≤ 62) 16. P(x ≤ 47) 17. P(x ≤ 34)
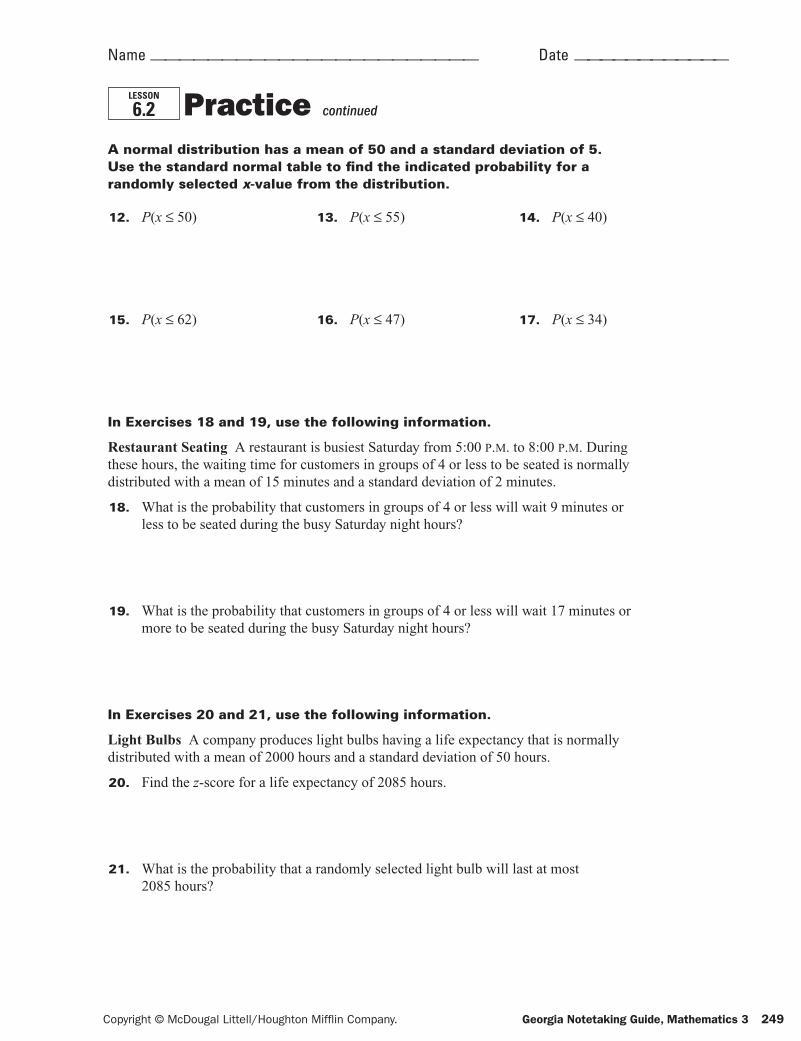
In Exercises 18 and 19, use the following information.
Restaurant Seating A restaurant is busiest Saturday from 5:00 P.M. to 8:00 P.M. During these hours, the waiting time for customers in groups of 4 or less to be seated is normally distributed with a mean of 15 minutes and a standard deviation of 2 minutes.
18. What is the probability that customers in groups of 4 or less will wait 9 minutes or less to be seated during the busy Saturday night hours?
19. What is the probability that customers in groups of 4 or less will wait 17 minutes or more to be seated during the busy Saturday night hours?
In Exercises 20 and 21, use the following information.
Light Bulbs A company produces light bulbs having a life expectancy that is normally distributed with a mean of 2000 hours and a standard deviation of 50 hours.
20. Find the z-score for a life expectancy of 2085 hours.
21. What is the probability that a randomly selected light bulb will last at most 2085 hours?
ga3_ntg_06.indd 249ga3_ntg_06.indd 249 4/18/07 10:50:53 AM4/18/07 10:50:53 AM
250 Georgia Notetaking Guide, Mathematics 3 Copyright © McDougal Littell/Houghton Mifflin Company.
6.3 Approximate Binomial Distributions and Test HypothesesGoal p Use normal distributions to approximate binomial
distributions.
GeorgiaPerformanceStandard(s)
MM3D2b, MM3D3
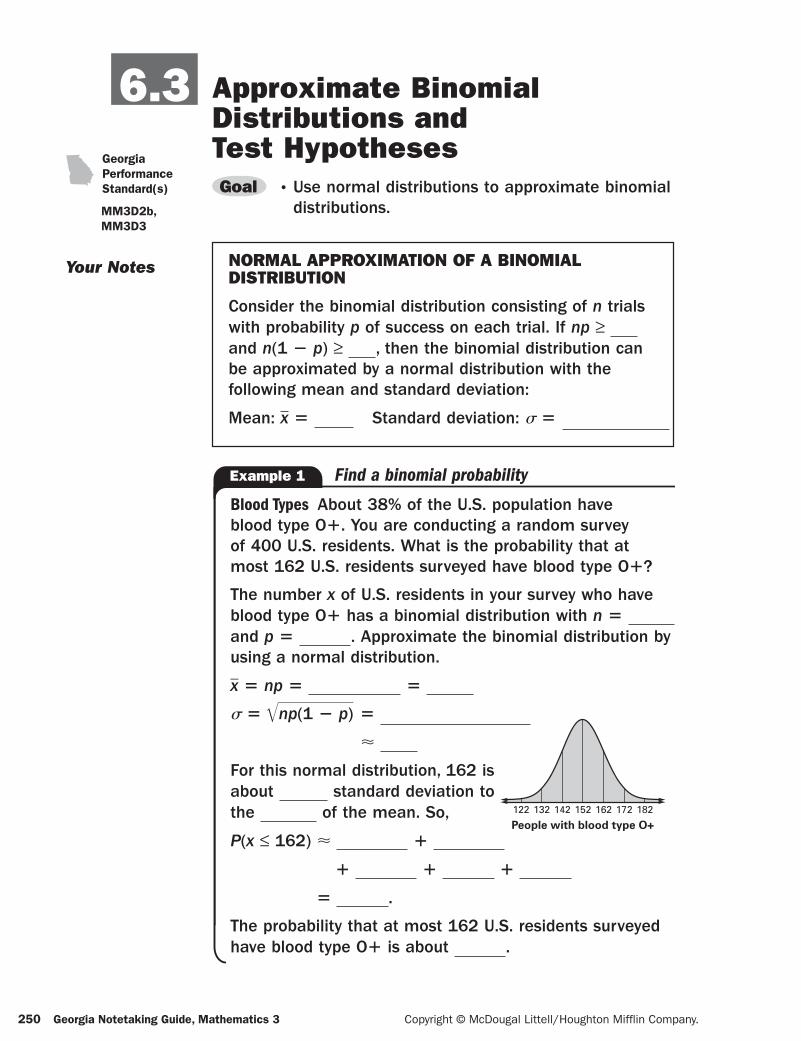
Your Notes NORMAL APPROXIMATION OF A BINOMIAL DISTRIBUTION
Consider the binomial distribution consisting of n trials with probability p of success on each trial. If np ≥and n(1 2 p) ≥ , then the binomial distribution can be approximated by a normal distribution with the following mean and standard deviation:
Mean: }x 5 Standard deviation: s 5
Blood Types About 38% of the U.S. population have blood type O1. You are conducting a random survey of 400 U.S. residents. What is the probability that at most 162 U.S. residents surveyed have blood type O1?
The number x of U.S. residents in your survey who have blood type O1 has a binomial distribution with n 5and p 5 . Approximate the binomial distribution by using a normal distribution.}x 5 np 5 5
s 5 Ï}
np(1 2 p) 5
ø
For this normal distribution, 162 is
122 132 142 152
People with blood type O+
162 172 182
about standard deviation to the of the mean. So,
P(x ≤ 162) ø 1
1 1 1
5 .
The probability that at most 162 U.S. residents surveyed have blood type O1 is about .
Example 1 Find a binomial probability
ga3nt-06.indd 161 4/13/07 3:17:25 PM
ga3_ntg_06.indd 250ga3_ntg_06.indd 250 4/18/07 10:50:54 AM4/18/07 10:50:54 AM
Copyright © McDougal Littell/Houghton Mifflin Company. Georgia Notetaking Guide, Mathematics 3 251
Your Notes
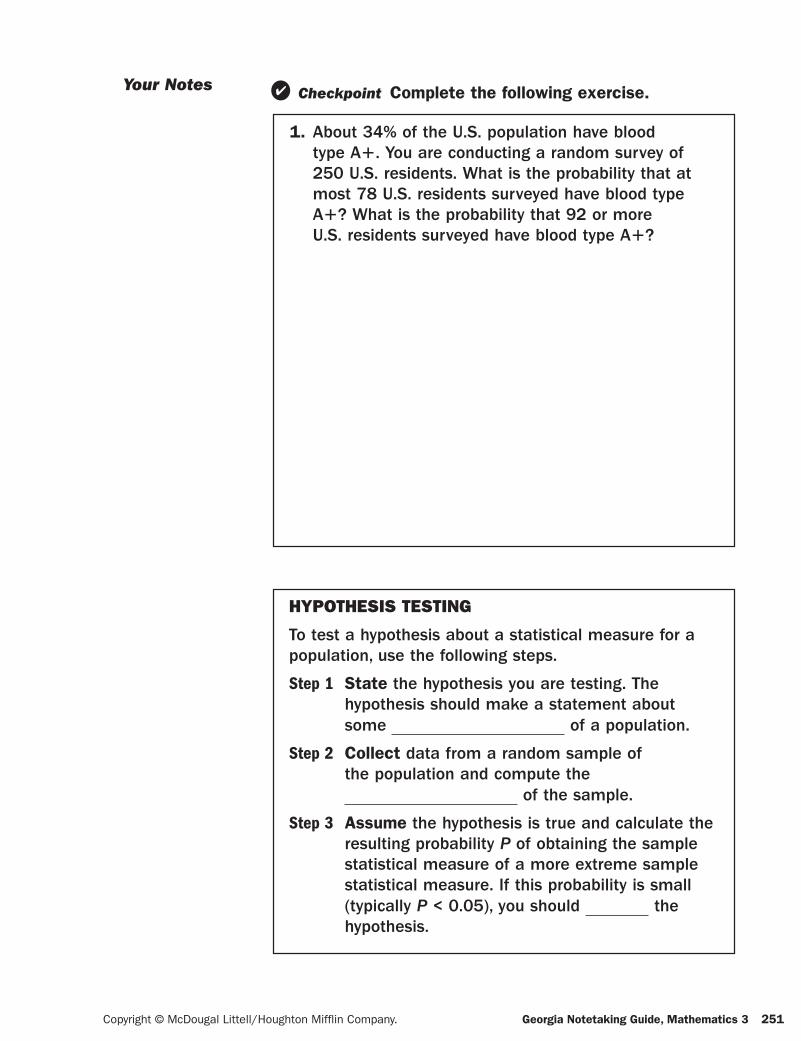
1. About 34% of the U.S. population have blood type A1. You are conducting a random survey of 250 U.S. residents. What is the probability that at most 78 U.S. residents surveyed have blood type A1? What is the probability that 92 or more U.S. residents surveyed have blood type A1?
Checkpoint Complete the following exercise.
HYPOTHESIS TESTING
To test a hypothesis about a statistical measure for a population, use the following steps.
Step 1 State the hypothesis you are testing. The hypothesis should make a statement about some of a population.
Step 2 Collect data from a random sample of the population and compute the
of the sample.
Step 3 Assume the hypothesis is true and calculate the resulting probability P of obtaining the sample statistical measure of a more extreme sample statistical measure. If this probability is small (typically P < 0.05), you should the hypothesis.
ga3nt-06.indd 162 4/13/07 3:17:26 PM
ga3_ntg_06.indd 251ga3_ntg_06.indd 251 4/18/07 10:50:55 AM4/18/07 10:50:55 AM
252 Georgia Notetaking Guide, Mathematics 3 Copyright © McDougal Littell/Houghton Mifflin Company.
Your Notes
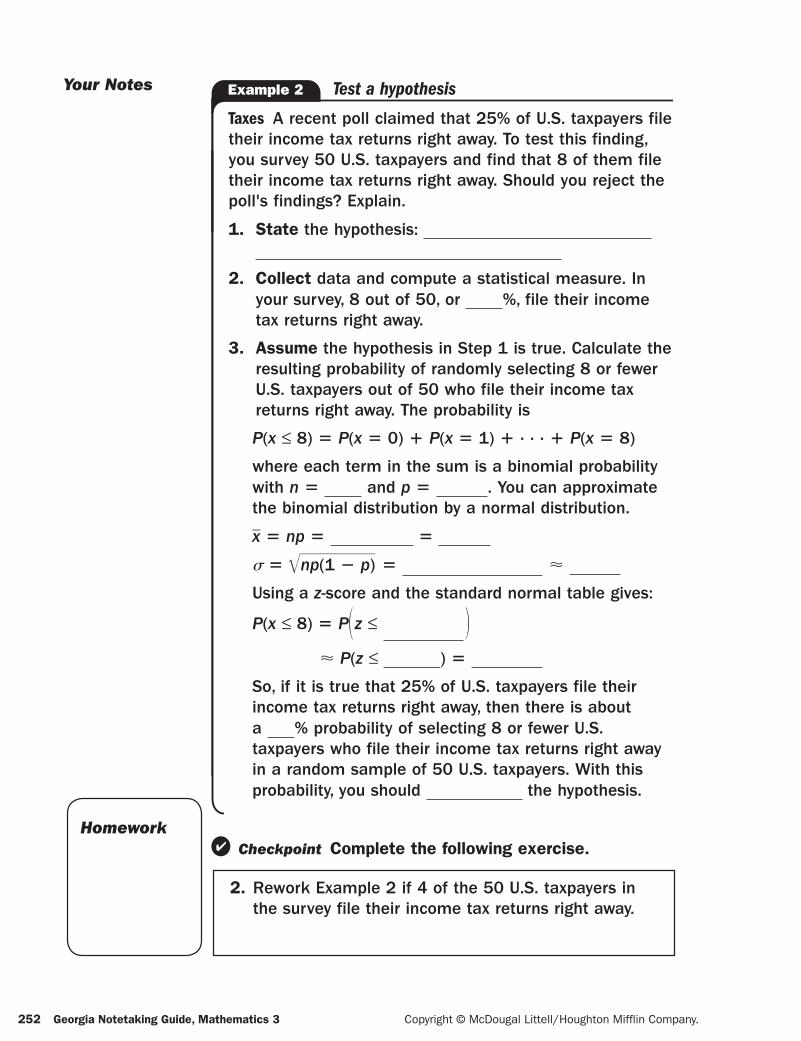
Taxes A recent poll claimed that 25% of U.S. taxpayers file their income tax returns right away. To test this finding, you survey 50 U.S. taxpayers and find that 8 of them file their income tax returns right away. Should you reject the poll's findings? Explain.
1. State the hypothesis:
2. Collect data and compute a statistical measure. In your survey, 8 out of 50, or %, file their income tax returns right away.
3. Assume the hypothesis in Step 1 is true. Calculate the resulting probability of randomly selecting 8 or fewer U.S. taxpayers out of 50 who file their income tax returns right away. The probability is
P(x ≤ 8) 5 P(x 5 0) 1 P(x 5 1) 1 . . . 1 P(x 5 8)
where each term in the sum is a binomial probability with n 5 and p 5 . You can approximate the binomial distribution by a normal distribution.}x 5 np 5 5
s 5 Ï}
np(1 2 p) 5 ø
Using a z-score and the standard normal table gives:
P(x ≤ 8) 5 P1z ≤ 2ø P(z ≤ ) 5
So, if it is true that 25% of U.S. taxpayers file their income tax returns right away, then there is about a % probability of selecting 8 or fewer U.S. taxpayers who file their income tax returns right away in a random sample of 50 U.S. taxpayers. With this probability, you should the hypothesis.
Example 2 Test a hypothesis
2. Rework Example 2 if 4 of the 50 U.S. taxpayers in the survey file their income tax returns right away.
Checkpoint Complete the following exercise.Homework
ga3nt-06.indd 163 4/13/07 3:17:26 PM
ga3_ntg_06.indd 252ga3_ntg_06.indd 252 4/18/07 10:50:56 AM4/18/07 10:50:56 AM
Copyright © McDougal Littell/Houghton Mifflin Company. Georgia Notetaking Guide, Mathematics 3 253
Name ——————————————————————— Date ————————————
LESSON
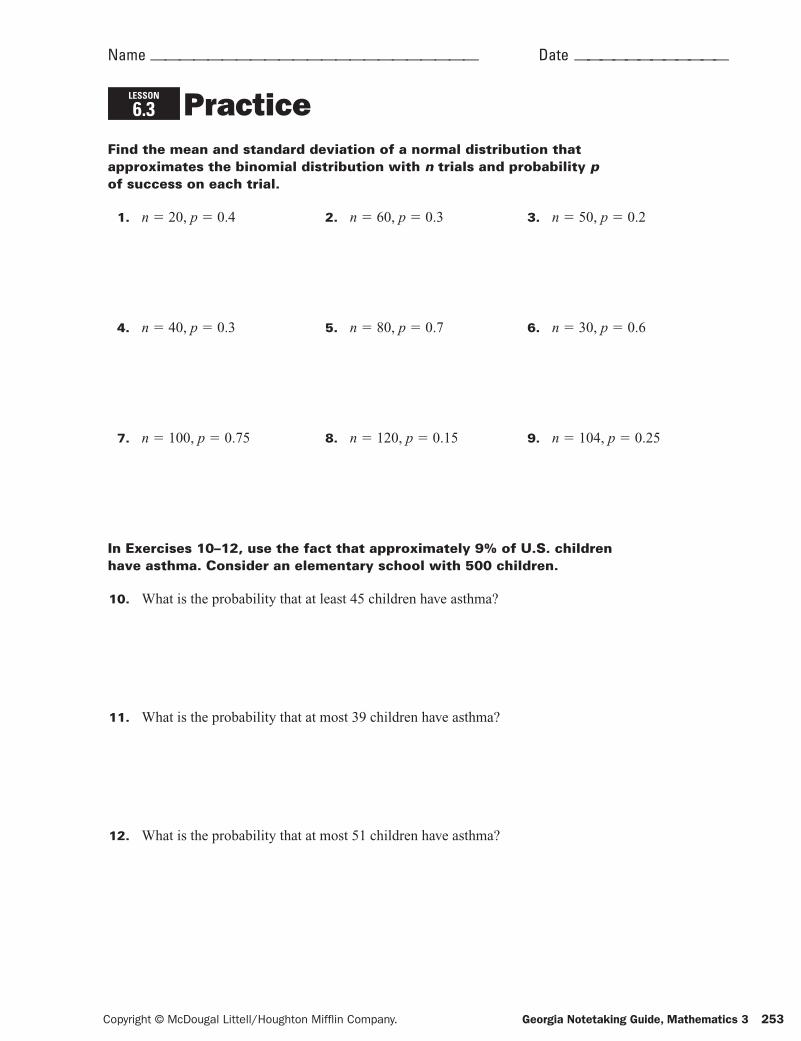
6.3 PracticeFind the mean and standard deviation of a normal distribution that approximates the binomial distribution with n trials and probability p of success on each trial.
1. n 5 20, p 5 0.4 2. n 5 60, p 5 0.3 3. n 5 50, p 5 0.2
4. n 5 40, p 5 0.3 5. n 5 80, p 5 0.7 6. n 5 30, p 5 0.6
7. n 5 100, p 5 0.75 8. n 5 120, p 5 0.15 9. n 5 104, p 5 0.25
In Exercises 10–12, use the fact that approximately 9% of U.S. children have asthma. Consider an elementary school with 500 children.
10. What is the probability that at least 45 children have asthma?
11. What is the probability that at most 39 children have asthma?
12. What is the probability that at most 51 children have asthma?
ga3_ntg_06.indd 253ga3_ntg_06.indd 253 4/18/07 10:50:57 AM4/18/07 10:50:57 AM
254 Georgia Notetaking Guide, Mathematics 3 Copyright © McDougal Littell/Houghton Mifflin Company.
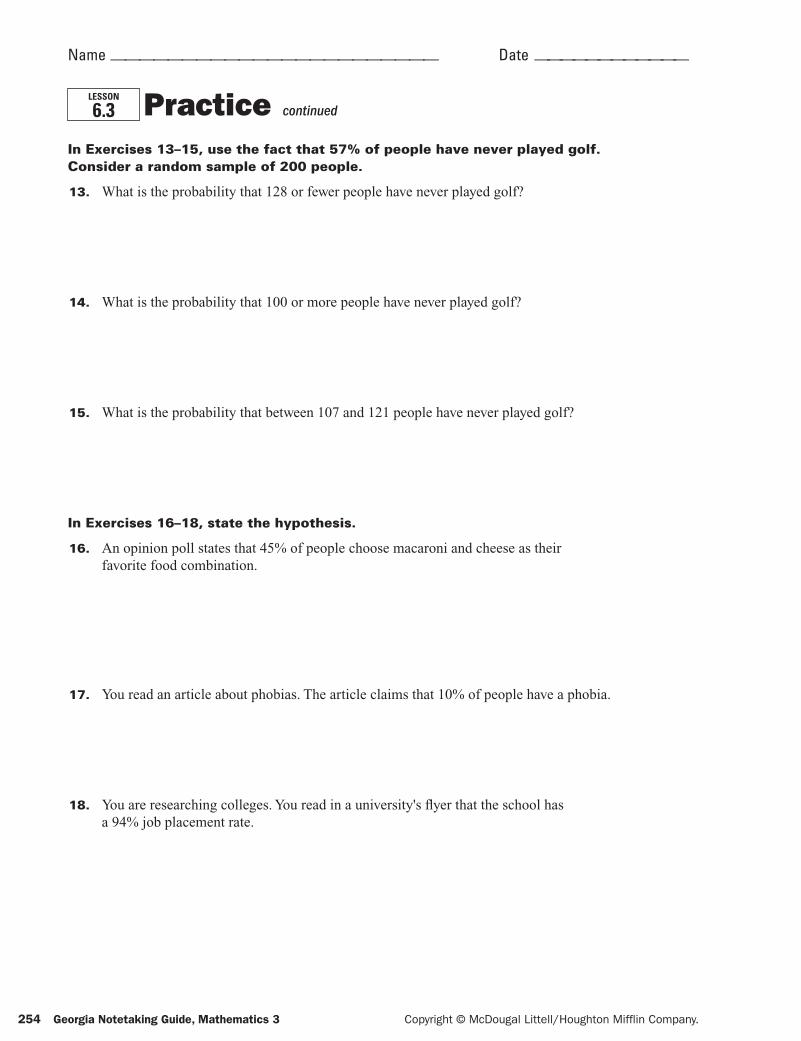
In Exercises 13–15, use the fact that 57% of people have never played golf. Consider a random sample of 200 people.
13. What is the probability that 128 or fewer people have never played golf?
14. What is the probability that 100 or more people have never played golf?
15. What is the probability that between 107 and 121 people have never played golf?
In Exercises 16–18, state the hypothesis.
16. An opinion poll states that 45% of people choose macaroni and cheese as their favorite food combination.
17. You read an article about phobias. The article claims that 10% of people have a phobia.
18. You are researching colleges. You read in a university's fl yer that the school has a 94% job placement rate.
LESSON
6.3 Practice continued
Name ——————————————————————— Date ————————————
ga3_ntg_06.indd 254ga3_ntg_06.indd 254 4/18/07 10:50:58 AM4/18/07 10:50:58 AM
Copyright © McDougal Littell/Houghton Mifflin Company. Georgia Notetaking Guide, Mathematics 3 255
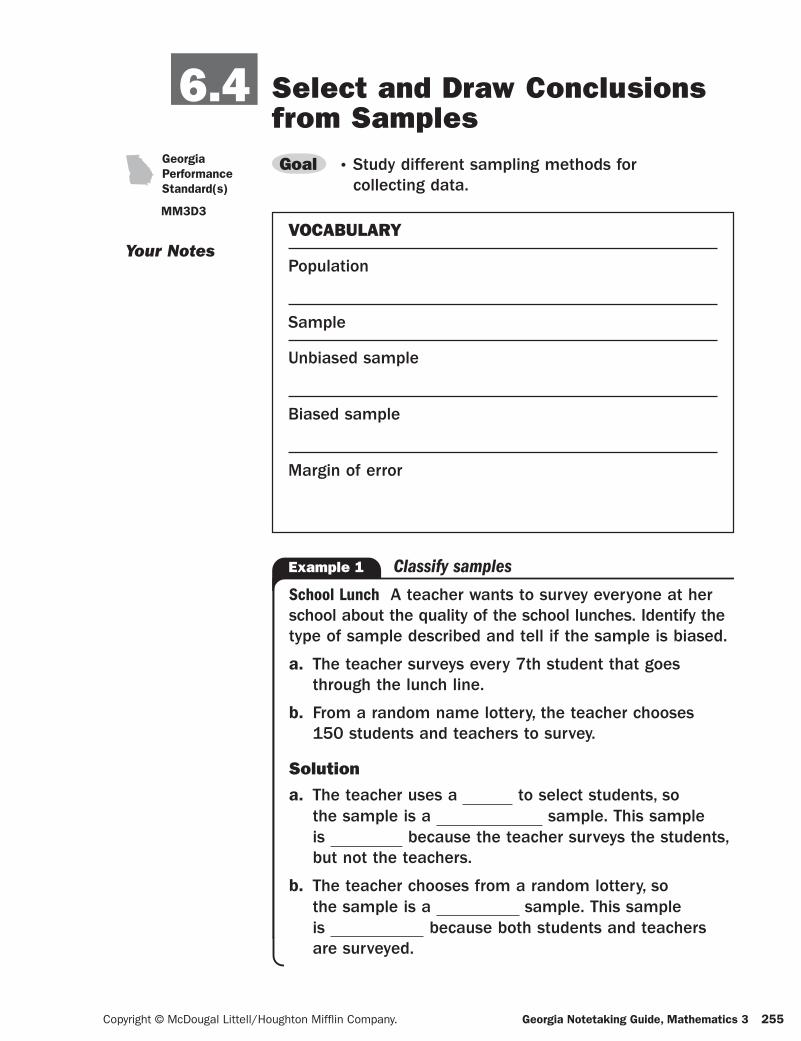
6.4 Select and Draw Conclusions from SamplesGoal p Study different sampling methods for
collecting data.
GeorgiaPerformanceStandard(s)
MM3D3
Your NotesVOCABULARY
Population
Sample
Unbiased sample
Biased sample
Margin of error
School Lunch A teacher wants to survey everyone at her school about the quality of the school lunches. Identify the type of sample described and tell if the sample is biased.
a. The teacher surveys every 7th student that goes through the lunch line.
b. From a random name lottery, the teacher chooses 150 students and teachers to survey.
Solution
a. The teacher uses a to select students, so the sample is a sample. This sample is because the teacher surveys the students, but not the teachers.
b. The teacher chooses from a random lottery, so the sample is a sample. This sample is because both students and teachers are surveyed.
Example 1 Classify samples
ga3nt-06.indd 164 4/13/07 3:17:27 PM
ga3_ntg_06.indd 255ga3_ntg_06.indd 255 4/18/07 10:50:58 AM4/18/07 10:50:58 AM
256 Georgia Notetaking Guide, Mathematics 3 Copyright © McDougal Littell/Houghton Mifflin Company.
Your Notes
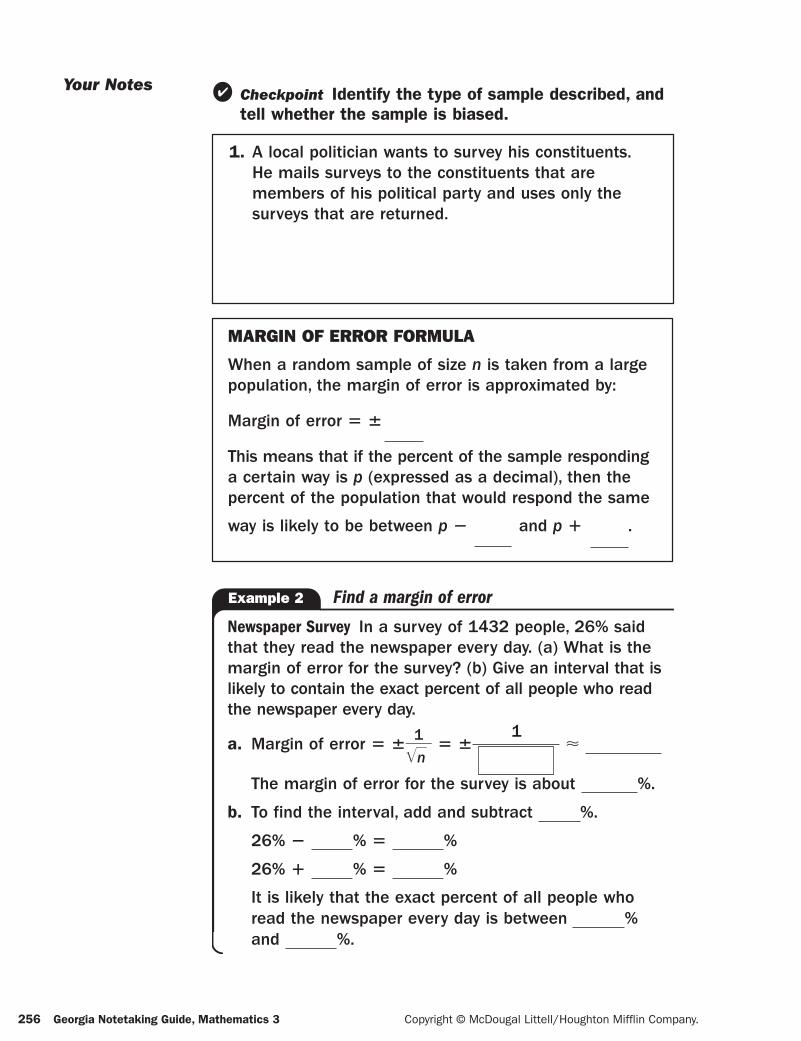
1. A local politician wants to survey his constituents. He mails surveys to the constituents that are members of his political party and uses only the surveys that are returned.
Checkpoint Identify the type of sample described, and tell whether the sample is biased.
MARGIN OF ERROR FORMULA
When a random sample of size n is taken from a large population, the margin of error is approximated by:
Margin of error 5 6
This means that if the percent of the sample responding a certain way is p (expressed as a decimal), then the percent of the population that would respond the same
way is likely to be between p 2 and p 1 .
Newspaper Survey In a survey of 1432 people, 26% said that they read the newspaper every day. (a) What is the margin of error for the survey? (b) Give an interval that is likely to contain the exact percent of all people who read the newspaper every day.
a. Margin of error 5 61
}Ï
}
n5 6
1ø
The margin of error for the survey is about %.
b. To find the interval, add and subtract %.
26% 2 % 5 %
26% 1 % 5 %
It is likely that the exact percent of all people who read the newspaper every day is between %and %.
Example 2 Find a margin of error
ga3nt-06.indd 165 4/13/07 3:17:28 PM
ga3_ntg_06.indd 256ga3_ntg_06.indd 256 4/18/07 10:50:59 AM4/18/07 10:50:59 AM
Copyright © McDougal Littell/Houghton Mifflin Company. Georgia Notetaking Guide, Mathematics 3 257
Your Notes
Homework
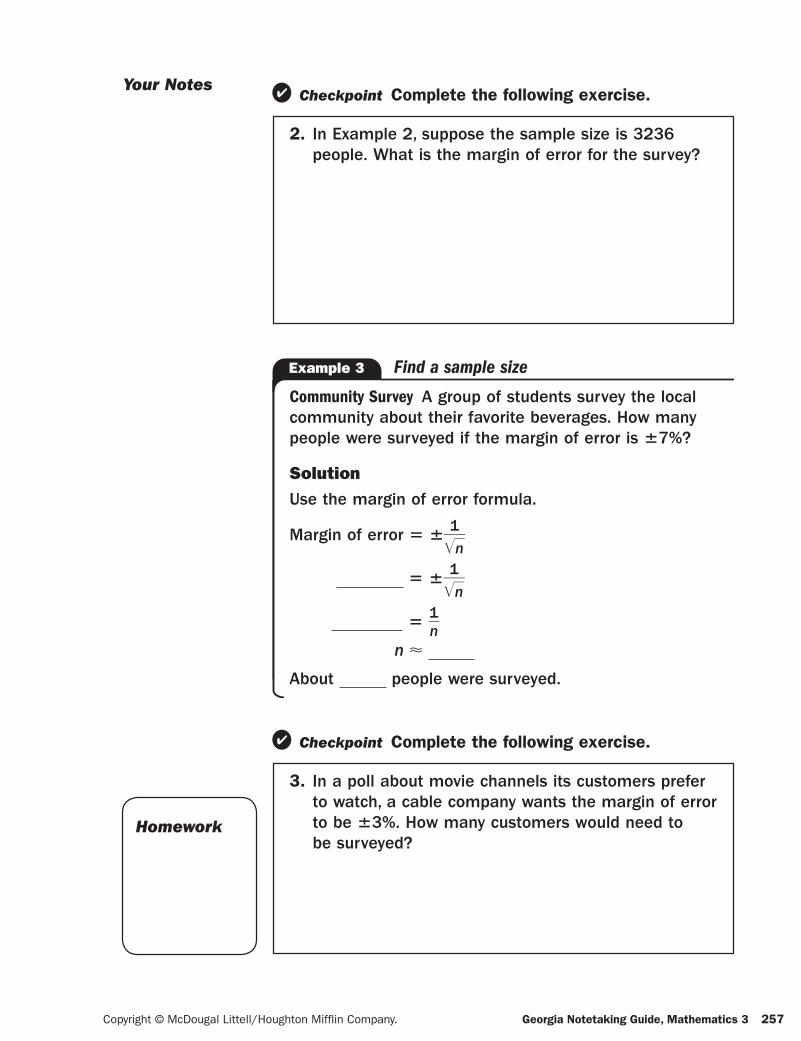
2. In Example 2, suppose the sample size is 3236 people. What is the margin of error for the survey?
Checkpoint Complete the following exercise.
Community Survey A group of students survey the local community about their favorite beverages. How many people were surveyed if the margin of error is 67%?
SolutionUse the margin of error formula.
Margin of error 5 61
}Ï
}
n
5 61
}Ï
}
n
51}n
n ø
About people were surveyed.
Example 3 Find a sample size
3. In a poll about movie channels its customers prefer to watch, a cable company wants the margin of error to be 63%. How many customers would need to be surveyed?
Checkpoint Complete the following exercise.
ga3nt-06.indd 166 4/13/07 3:17:29 PM
ga3_ntg_06.indd 257ga3_ntg_06.indd 257 4/18/07 10:51:00 AM4/18/07 10:51:00 AM
258 Georgia Notetaking Guide, Mathematics 3 Copyright © McDougal Littell/Houghton Mifflin Company.
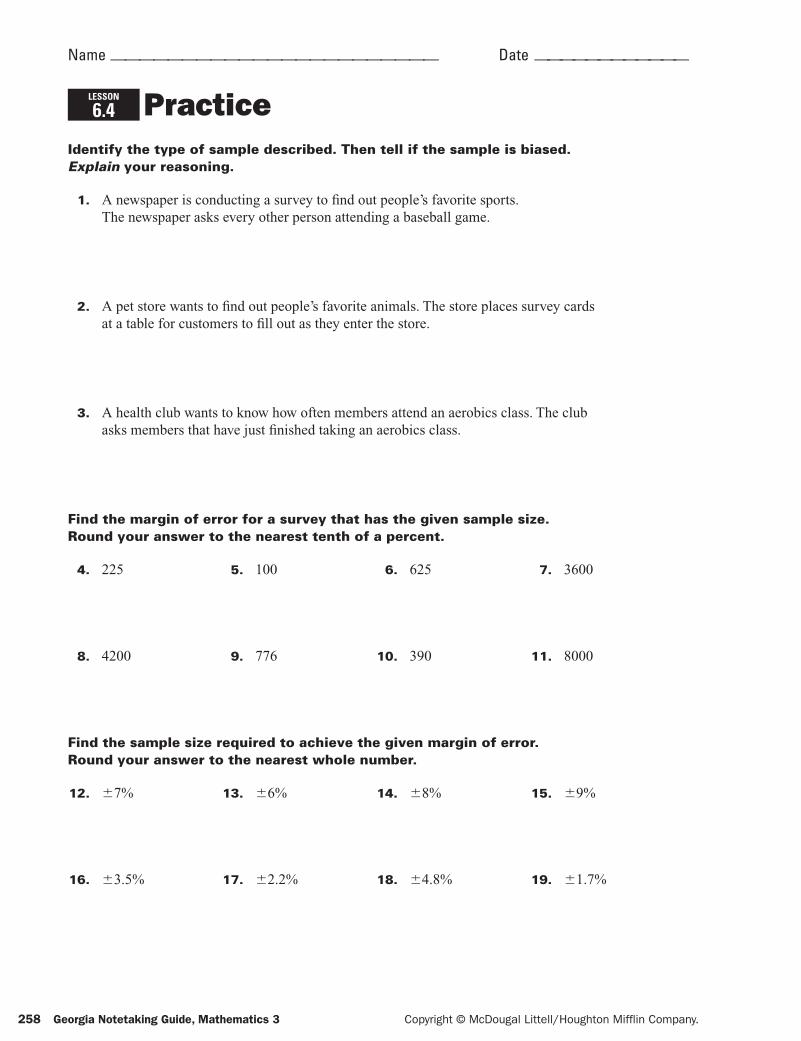
Identify the type of sample described. Then tell if the sample is biased. Explain your reasoning.
1. A newspaper is conducting a survey to fi nd out people’s favorite sports. The newspaper asks every other person attending a baseball game.
2. A pet store wants to fi nd out people’s favorite animals. The store places survey cards at a table for customers to fi ll out as they enter the store.
3. A health club wants to know how often members attend an aerobics class. The club asks members that have just fi nished taking an aerobics class.
Find the margin of error for a survey that has the given sample size. Round your answer to the nearest tenth of a percent.
4. 225 5. 100 6. 625 7. 3600
8. 4200 9. 776 10. 390 11. 8000
Find the sample size required to achieve the given margin of error. Round your answer to the nearest whole number.
12. 67% 13. 66% 14. 68% 15. 69%
16. 63.5% 17. 62.2% 18. 64.8% 19. 61.7%
LESSON
6.4 Practice
Name ——————————————————————— Date ————————————
ga3_ntg_06.indd 258ga3_ntg_06.indd 258 4/18/07 10:51:01 AM4/18/07 10:51:01 AM
Copyright © McDougal Littell/Houghton Mifflin Company. Georgia Notetaking Guide, Mathematics 3 259
Name ——————————————————————— Date ————————————
LESSON
6.4 Practice continued
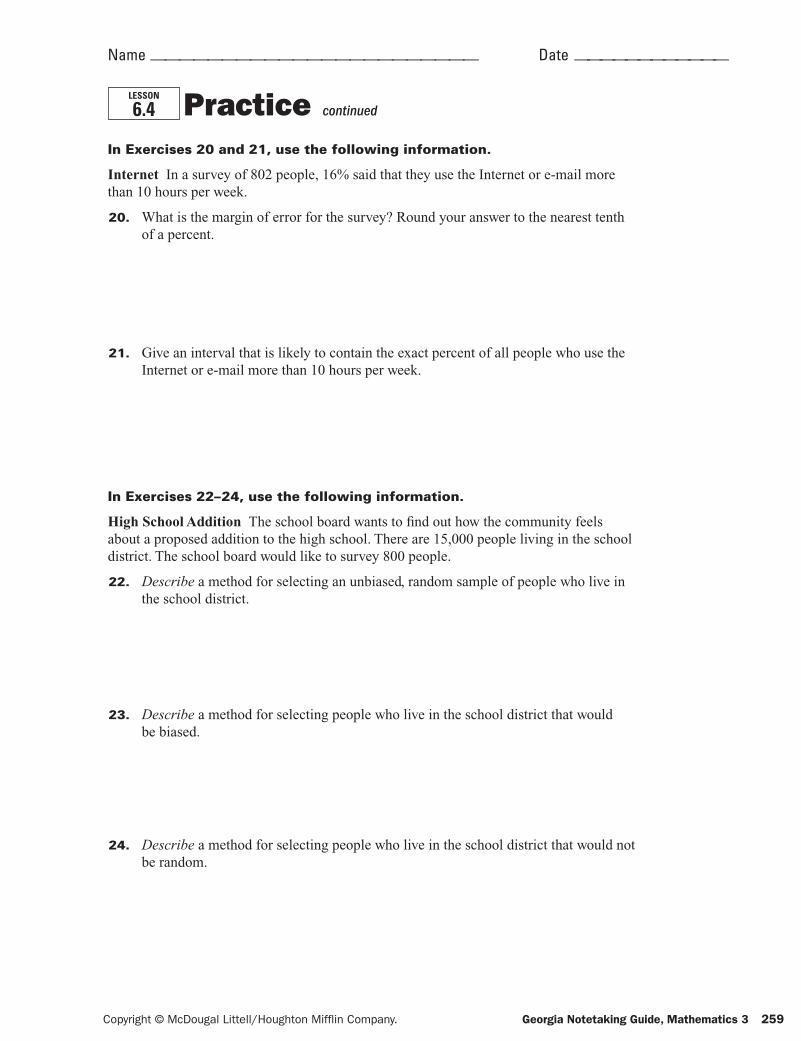
In Exercises 20 and 21, use the following information.
Internet In a survey of 802 people, 16% said that they use the Internet or e-mail more than 10 hours per week.
20. What is the margin of error for the survey? Round your answer to the nearest tenth of a percent.
21. Give an interval that is likely to contain the exact percent of all people who use the Internet or e-mail more than 10 hours per week.
In Exercises 22–24, use the following information.
High School Addition The school board wants to fi nd out how the community feels about a proposed addition to the high school. There are 15,000 people living in the school district. The school board would like to survey 800 people.
22. Describe a method for selecting an unbiased, random sample of people who live in the school district.
23. Describe a method for selecting people who live in the school district that would be biased.
24. Describe a method for selecting people who live in the school district that would not be random.
ga3_ntg_06.indd 259ga3_ntg_06.indd 259 4/18/07 10:51:02 AM4/18/07 10:51:02 AM
260 Georgia Notetaking Guide, Mathematics 3 Copyright © McDougal Littell/Houghton Mifflin Company.
6.5 Experimental and Observational StudiesGoal p Identify types of studies and flaws in experiments.Georgia
PerformanceStandard(s)
MM3D3
Your NotesVOCABULARY
Experimental study
Observational study
Tell whether the study is an experimental study or an observational study. Explain your reasoning.
You want to study the effect that listening to music has on the length of time an individual exercises. Each individual in your study runs on a treadmill. The length of time spent running is recorded. The control group is individuals who run on the treadmill without listening to music and the experimental group is individuals who run on the treadmill while listening to music.
Solution
The study is an study because
.
Example 1 Identify studies
ga3nt-06.indd 167 4/13/07 3:17:29 PM
ga3_ntg_06.indd 260ga3_ntg_06.indd 260 4/18/07 10:51:02 AM4/18/07 10:51:02 AM
Copyright © McDougal Littell/Houghton Mifflin Company. Georgia Notetaking Guide, Mathematics 3 261
Your Notes
Vitamins A researcher conducts an experiment to see if a new vitamin increases a person's energy level. The experimental group consists of college students who are given the vitamin daily. The control group consists of college professors who are not given the vitamin. The researcher finds that the energy level of the people in the experimental group is greater than those in the control group. As a result, the researcher concludes that the vitamin is effective. Identify any flaws in this experiment, and describe how they can be corrected.
On average, college students are likely to be younger than college professors. So, it could be rather than the vitamin that explains why the experimental group had more energy than the control group. To correct this flaw, the researcher could redesign the experiment so that
.
Example 2 Identify flaws in an experiment
1. You want to determine if the incumbent Republican candidate for governor is likely to be re-elected. The experimental group consists of registered Republican voters. The control group consists of registered Democrat voters. Tell whether the study is an experimental study or an observational study.Explain your reasoning.
2. You determine from your study in Exercise 1 that a majority of the Republican voters will vote for the incumbent candidate. Identify any flaws in this study and describe how they can be corrected.
Checkpoint Complete the following exercises.
Homework
ga3nt-06.indd 168 4/13/07 3:17:30 PM
ga3_ntg_06.indd 261ga3_ntg_06.indd 261 4/18/07 10:51:03 AM4/18/07 10:51:03 AM
262 Georgia Notetaking Guide, Mathematics 3 Copyright © McDougal Littell/Houghton Mifflin Company.
Determine which group is the experimental group and which group is the control group in the study.
1. A researcher is conducting a study to determine the effect the fl u vaccine has on preventing the fl u. The participants in the study are a group of people who received the fl u vaccine and a group of people who did not receive the fl u vaccine.
2. A school district is performing a study to determine whether or not an SAT prep course increases a student's SAT test score. The participants in the study are a group of students who do not take the prep course and a group of students who do take the prep course.
3. A researcher is conducting a study to determine the effects of caffeine on a person's heart rate. The participants in the study are a group of people who drink coffee daily and a group of people who drink coffee occasionally.
4. A lawn care company is conducting a study to determine whether a new lawn treatment is effective in stopping the growth of weeds. The company applies the treatment to only one half of a lawn.
In Exercises 5–8, tell whether the study is an experimental study or an observational study. Explain your reasoning.
5. A company wants to study the effect taking a vacation during different times of the year has on a worker's job performance upon returning. Each individual in the study takes a one-week vacation and upon returning, his or her job performance is monitored for one month. The control group consists of workers who choose to take a one-week vacation during the summer. The experimental group consists of workers who choose to take a one-week vacation during the winter.
LESSON
6.5 Practice
Name ——————————————————————— Date ————————————
ga3_ntg_06.indd 262ga3_ntg_06.indd 262 4/18/07 10:51:04 AM4/18/07 10:51:04 AM
Copyright © McDougal Littell/Houghton Mifflin Company. Georgia Notetaking Guide, Mathematics 3 263
Name ——————————————————————— Date ————————————
LESSON
6.5 Practice continued
6. You want to determine whether a name brand laundry detergent works better at cleaning clothes than a generic brand laundry detergent. Each individual in your study is given laundry detergent to clean clothes. You then ask the individuals to complete a survey about how well the detergent cleaned the clothes. The control group consists of individuals who use a generic brand laundry detergent. The experimental group consists of individuals who use a name brand laundry detergent.
7. A scientist wants to study the effect of sunlight on the growth of a plant. The scientist measures the height of each plant in the study after one week. The control group consists of plants that are subjected to 24 hours of darkness. The experimental group consists of plants that are subjected to 12 hours of sunlight and 12 hours of darkness.
8. A golf club manufacturer wants to study the effect a newly designed set of golf clubs has on a golfer's score. The manufacturer lets the participants of the study decide if they want to use new clubs or old clubs. The control group consists of participants who use old clubs. The experimental group consists of participants who use the new clubs.
9. Sunscreen A researcher is conducting a study to determine the effect a new sunscreen has on the prevention of skin cancer. The experimental group consists of lifeguards at an ocean resort. The control group consists of housekeepers at an ocean resort. Identify any fl aws in the experiment, and describe how they can be corrected.
ga3_ntg_06.indd 263ga3_ntg_06.indd 263 4/18/07 10:51:05 AM4/18/07 10:51:05 AM
264 Georgia Notetaking Guide, Mathematics 3 Copyright © McDougal Littell/Houghton Mifflin Company.
Words to ReviewGive an example of the vocabulary word.
Random variable
Continuous random variable
Binomial distribution
Symmetric
Discrete random variable
Probability distribution
Binomial experiment
Skewed
ga3nt-06.indd 169 4/13/07 3:17:30 PM
ga3_ntg_06.indd 264ga3_ntg_06.indd 264 4/18/07 10:51:05 AM4/18/07 10:51:05 AM
Copyright © McDougal Littell/Houghton Mifflin Company. Georgia Notetaking Guide, Mathematics 3 265
Normal distribution
Standard normal distribution
Population
Normal curve
z-score
Sample
ga3nt-06.indd 170 4/13/07 3:17:31 PM
ga3_ntg_06.indd 265ga3_ntg_06.indd 265 4/18/07 10:51:06 AM4/18/07 10:51:06 AM
266 Georgia Notetaking Guide, Mathematics 3 Copyright © McDougal Littell/Houghton Mifflin Company.
Unbiased sample
Margin of error
Observational study
Biased sample
Experimental study
ga3nt-06.indd 171 4/13/07 3:17:32 PM
ga3_ntg_06.indd 266ga3_ntg_06.indd 266 4/18/07 10:51:08 AM4/18/07 10:51:08 AM