Embed Size (px)
Citation preview
Constructed Wetlands and Links withSustainable Drainage Systems
R&D Technical Report P2-159/TR1
J. B. Ellis, R.B.E.Shutes and M.D.Revitt
Research Contractor:Urban Pollution Research CentreMiddlesex University, London

R&D TECHNICAL REPORT P2-159/TR1
Publishing OrganisationEnvironment Agency, Rio House, Waterside Drive, Aztec West, Almondsbury, BRISTOL,BS32 4UDTel: 01454 624400 Fax: 01454 624409Website: www.environment-agency.gov.uk
© Environment Agency 2003
ISBN 1 8570 59182
All rights reserved. No part of this document may be reproduced, stored in a retrieval system,or transmitted, in any for or by any means, electronic, mechanical, photocopying, recording orotherwise without the prior permission of the Environment Agency.
The views expressed in this document are not necessarily those of the Environment Agency.Its officers, servants or agents accept no liability whatsoever for any loss or damage arisingfrom the interpretation or use of the information, or reliance upon views contained herein.
Dissemination StatusInternal: Released to regionsExternal: Released to Public Domain
Statement of UseThis technical report contains a review of the design and use of constructed wetlands for thetreatment of stormwater runoff from impervious surfaces in urban areas and the linkagesbetween constructed wetlands and sustainable drainage systems. The information in thisdocument is for use by Environment Agency staff and others involved in the control andmanagement of surface water runoff from development.
KeywordsConstructed wetlands, urban stormwater runoff, urban runoff quality control, sustainabledrainage systems (SuDS), urban catchment management, decision support systems,multicriteria assessment.
Research ContractorThis document was produced under R&D Project P2-159 by:Urban Pollution Research Centre, Middlesex University, Bounds Green Road, London, N112NQ Tel: 02 08 411 5000 Fax: 02 08 411 6580 Website: www.mdx.ac.uk
Environment Agency’s Project ManagersThe Environment Agency’s Project Managers for Project P2-159 were:Dr Maxine Forshaw, National Centre for Ecotoxicology & Hazardous SubstancesBarry Winter and Doug Mills, Thames Region
R&D TECHNICAL REPORT P2-159/TR1 i
CONTENTS Page
1. INTRODUCTION 1
1.1 Surface Water Runoff and SuDS 1
1.2 Wetland Types and Definitions 4
1.3 Constructed Wetlands and Flow Systems 7
1.4 Pocket or Mini-Wetlands 10
1.5 Modular or Treatment-Train Systems 10
1.6 Wetland Processes 11
1.7 Defining Wetland Pollutant Removal Rates 20
2. URBAN WETLAND PERFORMANCE AND COSTS 23
2.1 Wetland Performance 23
2.2 Performance Indicators 33
2.3 Treatment, Performance and Maintenance Costs 35
3. URBAN WETLAND DESIGN 41
3.1 Introduction 41
3.2 Design Criteria 41
3.3 Substrate Structure 52
3.4 Planting Considerations 53
3.5 Pre and Post Treatment Structures 56
4. URBAN WETLAND RETROFITTING, OPERATIONAND MAINTENANCE 59
4.1 Retro-fitting 59
4.2 Wetland Operation and Maintenance Requirements 63
R&D TECHNICAL REPORT P2-159/TR1 ii
5. URBAN WETLANDS, WILDLIFE AND 68LANDSCAPE ENHANCEMENT
5.1 Multifunctional Use of Urban Wetlands 68
5.2 Landscape and Visual Issues 69
5.3 Landscape Development 70
5.4 Wetland Wildlife Considerations 73
6. SUDS IMPLEMENTATION AND CATCHMENTPLANNING 79
6.1 Introduction; The Need for Integrated Approaches 79
6.2 SuDS and the EU Water Framework Directive 80
6.3 Implementing SuDS within River BasinManagement Planning 85
7. DECISION SUPPORT APPROACHESFOR URBAN WETLANDS 94
7.1 Introduction: Towards a Multi-Criteria Approach 94
7.2 Defining Primary Criteria, Indicators and Benchmarks 95
7.3 Applying a Multi-Criteria Approach 97
7.4 Benchmark Indicator Standards 99
7.5 Multi-Criteria Assessment of a Wetland System 102
7.6 Matrix Approaches 105
7.7 Flow Chart SuDS Design Procedure 109
7.8 Wetland Design Procedure 109

R&D TECHNICAL REPORT P2-159/TR1 iii
8. DECISION SUPPORT APPROACHES FORURBAN STORM DRAINAGE SYSTEMS IN FRANCE 113
8.1 Introduction 113
8.2 Sewerage Programme Procedure in the Local Community 114
8.3 Criteria for Stormwater Source Control 117
8.4 Case Studies 122
9. RECOMMENDATIONS FOR FURTHER WORK 126
9.1 Introduction 126
9.2 Database and Monitoring 126
9.3 Operational Evaluation 127
9.4 Pollutant Pathways 128
9.5 Wetland Design and Management 128
9.6 Life-cycle Assessment 128
9.7 Wildlife/Amenity & Social/Urban Issues 129
REFERENCES 130
Appendix A Wetland Pollutant Efficiency Rates 141
Appendix B Kinetic Design Modelling of Wetlands 144
Appendix C Surface Water Discharges, Sediment Quality Standards andReceiving Water Classification in England & Wales 148
1. Discharge Standards and Consents for Surface Waters in England & Wales2. Receiving Water Classification in England & Wales3. Sediment Quality Standards
Appendix D French Water Quality Standards 153

R&D TECHNICAL REPORT P2-159/TR1 iv
Appendix E UK Wetland Locations and Detail 158
E1 Residential (and mixed) Catchment RunoffE2 Commercial/Industrial and Business Estate RunoffE3 Highway Catchment RunoffE4 Airport RunoffE5 Other Surface Runoff
List of Acronyms 174
Glossary 177
List of Tables and Figures (v)
EXECUTIVE SUMMARY (ix)
Acknowledgement (x)
R&D TECHNICAL REPORT P2-159/TR1 v
List of Tables
Table 1.1 Wetlands in UK Urban Surface Drainage Systems 3
Table 1.2 Scottish SuDS Database 3
Table 1.3a Wetland Pollutant Removal Mechanisms and their MajorControlling Factors 14
Table 1.3b Relative Importance of Wetland Pollutant Removal Mechanisms 14
Table 2.1 Percentage Metal Removal Efficiencies from Acid Mine Drainage byNatural Wetlands in Wales 23
Table 2.2 Metal Levels in a Natural Wetland Receiving Highway Runoff 24
Table 2.3 Reductions in Hydrocarbon Concentrations within a Semi-naturalWetland; the Welsh Harp Basin, NW London 24
Table 2.4 Percentage Pollutant Removals for Domestic Wastewater andArtificial Stormwater Wetland Systems in the UK 25
Table 2.5 Wetland Metal removal Efficiencies for Natural and ArtificialWetlands in the UK 27
Table 2.6 SuDS Pollutant Removal and Flow Attenuation Capacities 32
Table 2.7 Reported Removal Rates for US Stormwater Constructed Wetlands 31
Table 2.8 Removal rates for US Stormwater SSF and SF Wetlands 33
Table 2.9 Wetland and Dry/Wet Storage Basin Indicators 34
Table 2.10 Evaluation of Wetland Effectiveness Potential 35
Table 2.11 Distribution of Wetland Capital Costs 37
Table 2.12 Stormwater Wetlands in the Environment Agency Midlands Region 38
Table 2.13 Capital and Maintenance Costs for Highway Treatment Systems 39
Table 3.1 Kinetic Model Parameters for Wetland Design 47
Table 3.2 Plant Species Commonly Used in Constructed Wetlands 54
Table 3.3 Summary of the Main Methods Used to Establish the Common Reed(Phragmites australis) 55
Table 5.1 Conservation Value of Urban Wetlands 74
Table 6.1 Other Bodies with Important Roles in the WFD 82
R&D TECHNICAL REPORT P2-159/TR1 vi
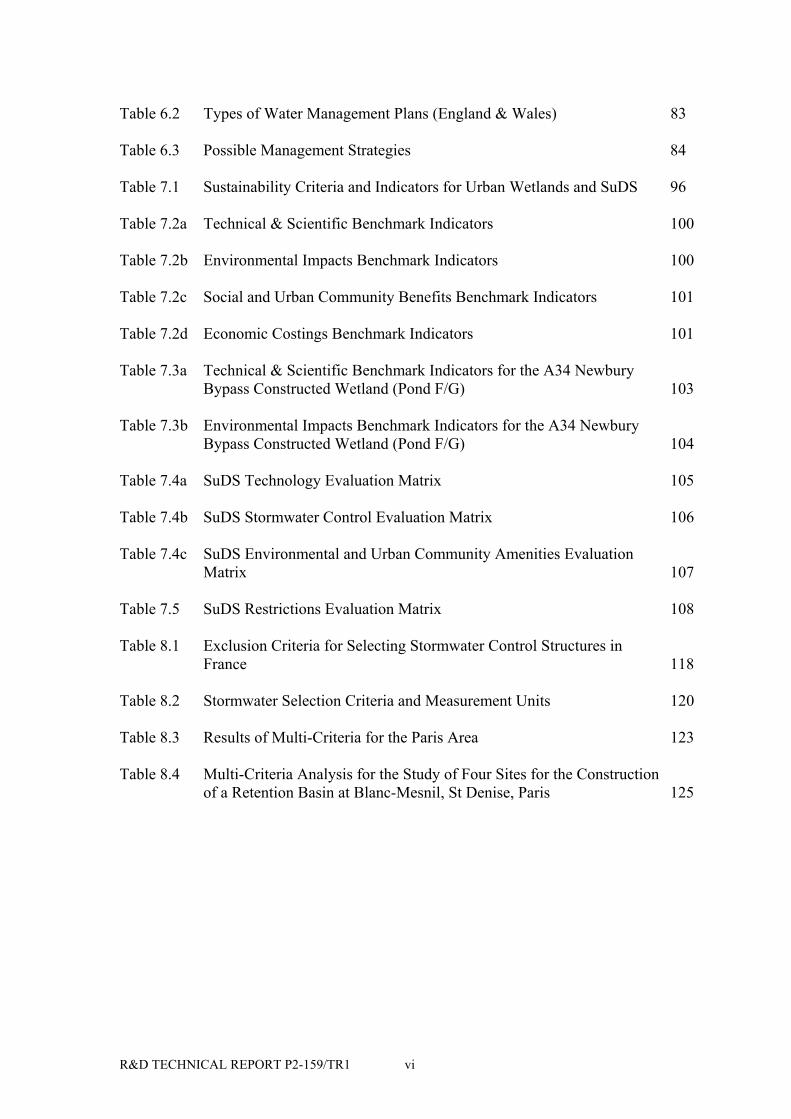
Table 6.2 Types of Water Management Plans (England & Wales) 83
Table 6.3 Possible Management Strategies 84
Table 7.1 Sustainability Criteria and Indicators for Urban Wetlands and SuDS 96
Table 7.2a Technical & Scientific Benchmark Indicators 100
Table 7.2b Environmental Impacts Benchmark Indicators 100
Table 7.2c Social and Urban Community Benefits Benchmark Indicators 101
Table 7.2d Economic Costings Benchmark Indicators 101
Table 7.3a Technical & Scientific Benchmark Indicators for the A34 NewburyBypass Constructed Wetland (Pond F/G) 103
Table 7.3b Environmental Impacts Benchmark Indicators for the A34 NewburyBypass Constructed Wetland (Pond F/G) 104
Table 7.4a SuDS Technology Evaluation Matrix 105
Table 7.4b SuDS Stormwater Control Evaluation Matrix 106
Table 7.4c SuDS Environmental and Urban Community Amenities EvaluationMatrix 107
Table 7.5 SuDS Restrictions Evaluation Matrix 108
Table 8.1 Exclusion Criteria for Selecting Stormwater Control Structures inFrance 118
Table 8.2 Stormwater Selection Criteria and Measurement Units 120
Table 8.3 Results of Multi-Criteria for the Paris Area 123
Table 8.4 Multi-Criteria Analysis for the Study of Four Sites for the Constructionof a Retention Basin at Blanc-Mesnil, St Denise, Paris 125
R&D TECHNICAL REPORT P2-159/TR1 vii
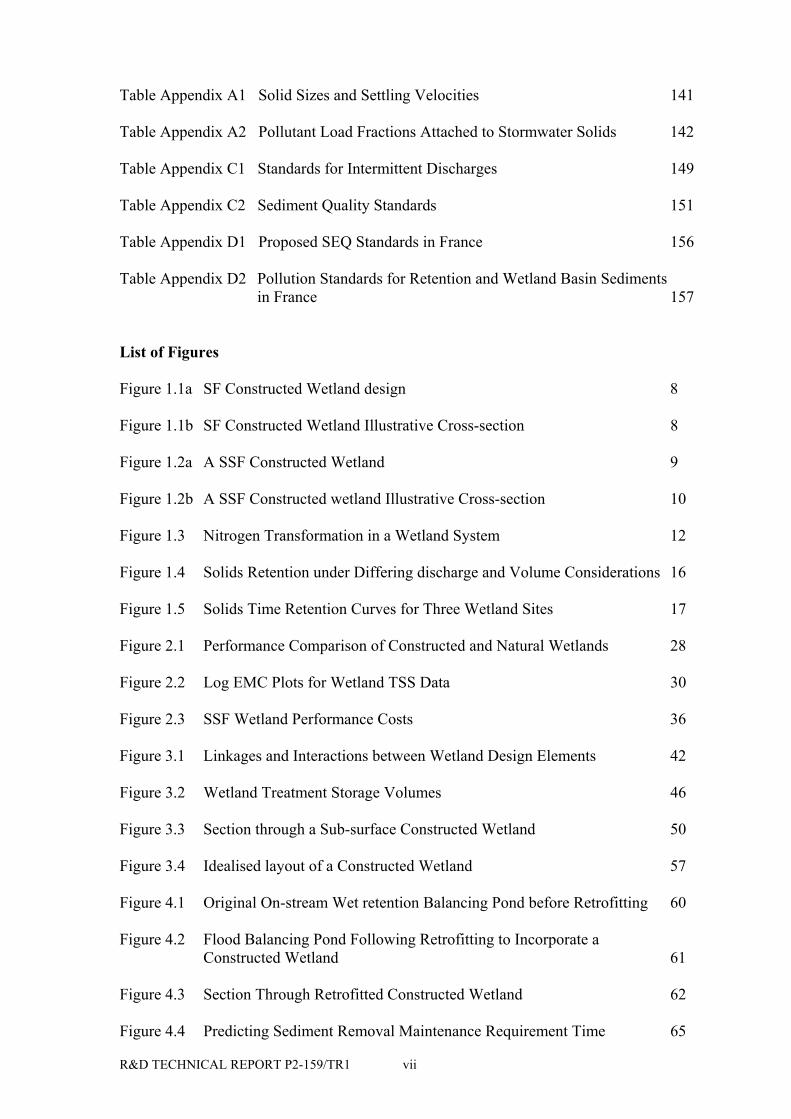
Table Appendix A1 Solid Sizes and Settling Velocities 141
Table Appendix A2 Pollutant Load Fractions Attached to Stormwater Solids 142
Table Appendix C1 Standards for Intermittent Discharges 149
Table Appendix C2 Sediment Quality Standards 151
Table Appendix D1 Proposed SEQ Standards in France 156
Table Appendix D2 Pollution Standards for Retention and Wetland Basin Sedimentsin France 157
List of Figures
Figure 1.1a SF Constructed Wetland design 8
Figure 1.1b SF Constructed Wetland Illustrative Cross-section 8
Figure 1.2a A SSF Constructed Wetland 9
Figure 1.2b A SSF Constructed wetland Illustrative Cross-section 10
Figure 1.3 Nitrogen Transformation in a Wetland System 12
Figure 1.4 Solids Retention under Differing discharge and Volume Considerations 16
Figure 1.5 Solids Time Retention Curves for Three Wetland Sites 17
Figure 2.1 Performance Comparison of Constructed and Natural Wetlands 28
Figure 2.2 Log EMC Plots for Wetland TSS Data 30
Figure 2.3 SSF Wetland Performance Costs 36
Figure 3.1 Linkages and Interactions between Wetland Design Elements 42
Figure 3.2 Wetland Treatment Storage Volumes 46
Figure 3.3 Section through a Sub-surface Constructed Wetland 50
Figure 3.4 Idealised layout of a Constructed Wetland 57
Figure 4.1 Original On-stream Wet retention Balancing Pond before Retrofitting 60
Figure 4.2 Flood Balancing Pond Following Retrofitting to Incorporate aConstructed Wetland 61
Figure 4.3 Section Through Retrofitted Constructed Wetland 62
Figure 4.4 Predicting Sediment Removal Maintenance Requirement Time 65
R&D TECHNICAL REPORT P2-159/TR1 viii
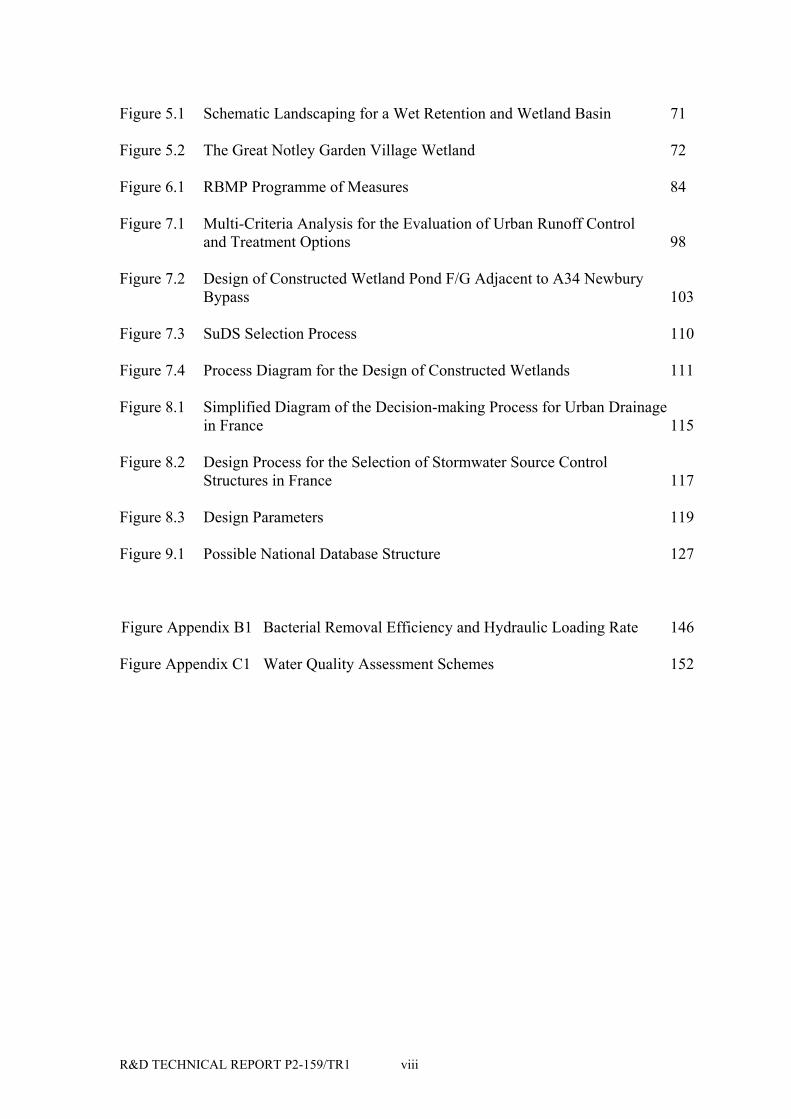
Figure 5.1 Schematic Landscaping for a Wet Retention and Wetland Basin 71
Figure 5.2 The Great Notley Garden Village Wetland 72
Figure 6.1 RBMP Programme of Measures 84
Figure 7.1 Multi-Criteria Analysis for the Evaluation of Urban Runoff Controland Treatment Options 98
Figure 7.2 Design of Constructed Wetland Pond F/G Adjacent to A34 NewburyBypass 103
Figure 7.3 SuDS Selection Process 110
Figure 7.4 Process Diagram for the Design of Constructed Wetlands 111
Figure 8.1 Simplified Diagram of the Decision-making Process for Urban Drainagein France 115
Figure 8.2 Design Process for the Selection of Stormwater Source ControlStructures in France 117
Figure 8.3 Design Parameters 119
Figure 9.1 Possible National Database Structure 127
Figure Appendix B1 Bacterial Removal Efficiency and Hydraulic Loading Rate 146
Figure Appendix C1 Water Quality Assessment Schemes 152
R&D TECHNICAL REPORT P2-159/TR1 ix
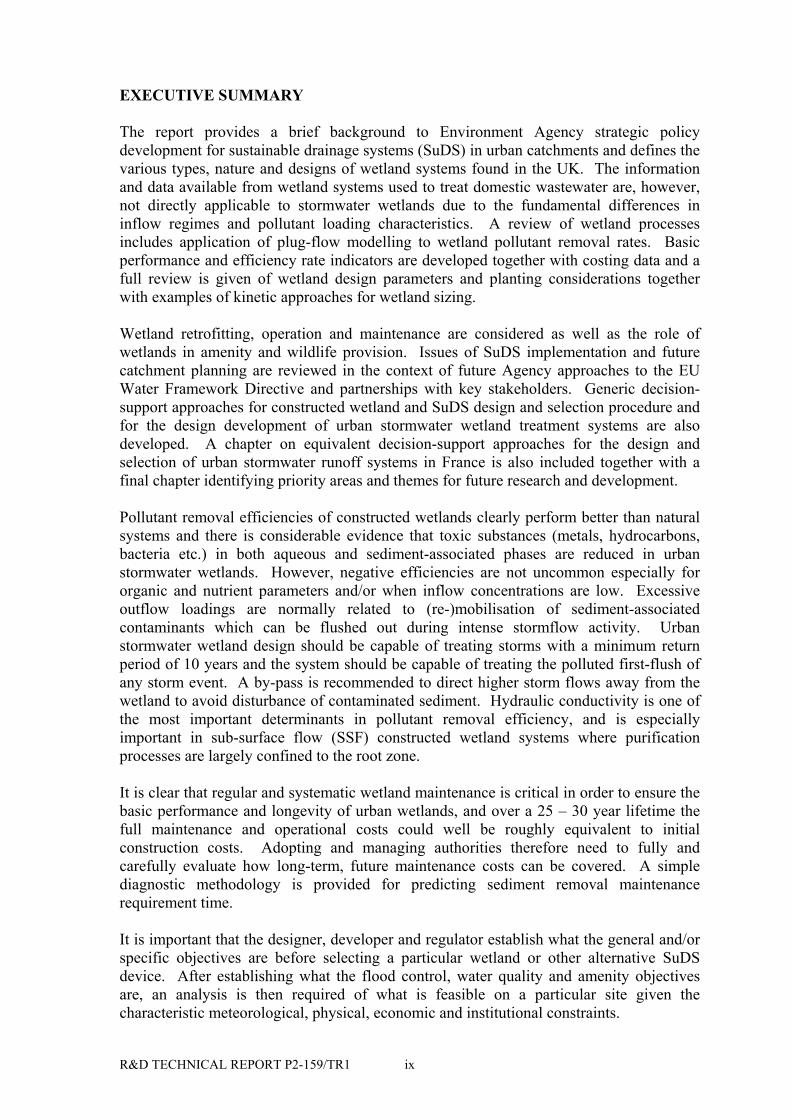
EXECUTIVE SUMMARY
The report provides a brief background to Environment Agency strategic policydevelopment for sustainable drainage systems (SuDS) in urban catchments and defines thevarious types, nature and designs of wetland systems found in the UK. The informationand data available from wetland systems used to treat domestic wastewater are, however,not directly applicable to stormwater wetlands due to the fundamental differences ininflow regimes and pollutant loading characteristics. A review of wetland processesincludes application of plug-flow modelling to wetland pollutant removal rates. Basicperformance and efficiency rate indicators are developed together with costing data and afull review is given of wetland design parameters and planting considerations togetherwith examples of kinetic approaches for wetland sizing.
Wetland retrofitting, operation and maintenance are considered as well as the role ofwetlands in amenity and wildlife provision. Issues of SuDS implementation and futurecatchment planning are reviewed in the context of future Agency approaches to the EUWater Framework Directive and partnerships with key stakeholders. Generic decision-support approaches for constructed wetland and SuDS design and selection procedure andfor the design development of urban stormwater wetland treatment systems are alsodeveloped. A chapter on equivalent decision-support approaches for the design andselection of urban stormwater runoff systems in France is also included together with afinal chapter identifying priority areas and themes for future research and development.
Pollutant removal efficiencies of constructed wetlands clearly perform better than naturalsystems and there is considerable evidence that toxic substances (metals, hydrocarbons,bacteria etc.) in both aqueous and sediment-associated phases are reduced in urbanstormwater wetlands. However, negative efficiencies are not uncommon especially fororganic and nutrient parameters and/or when inflow concentrations are low. Excessiveoutflow loadings are normally related to (re-)mobilisation of sediment-associatedcontaminants which can be flushed out during intense stormflow activity. Urbanstormwater wetland design should be capable of treating storms with a minimum returnperiod of 10 years and the system should be capable of treating the polluted first-flush ofany storm event. A by-pass is recommended to direct higher storm flows away from thewetland to avoid disturbance of contaminated sediment. Hydraulic conductivity is one ofthe most important determinants in pollutant removal efficiency, and is especiallyimportant in sub-surface flow (SSF) constructed wetland systems where purificationprocesses are largely confined to the root zone.
It is clear that regular and systematic wetland maintenance is critical in order to ensure thebasic performance and longevity of urban wetlands, and over a 25 – 30 year lifetime thefull maintenance and operational costs could well be roughly equivalent to initialconstruction costs. Adopting and managing authorities therefore need to fully andcarefully evaluate how long-term, future maintenance costs can be covered. A simplediagnostic methodology is provided for predicting sediment removal maintenancerequirement time.
It is important that the designer, developer and regulator establish what the general and/orspecific objectives are before selecting a particular wetland or other alternative SuDSdevice. After establishing what the flood control, water quality and amenity objectivesare, an analysis is then required of what is feasible on a particular site given thecharacteristic meteorological, physical, economic and institutional constraints.
R&D TECHNICAL REPORT P2-159/TR1 x
A decision support approach to evaluate the relative sustainability of SuDS structures, aswell as conventional pipe systems, has been developed utilising simple multicriteriaanalysis. The developed methodology identifies primary generic criteria based ontechnical/scientific performance, environmental impacts, social/urban community benefitsand economic costings. A range of secondary sub-criteria and benchmark “standards” arealso identified against which specific wetland or other SuDS structures and drainageoptions can be compared. A similar multicriteria decision support approach used by theAgence de L’Eau Seine-Normandie in France is also presented.
It is clear that substantial land value enhancement can be achieved through the provisionof well designed and landscaped wetland facilities on urban development sites which canoffer major community benefits as well as offsetting total investment costs. Waterfrontsites can increase unit process/rentals by 3% to 13% on average with some ground rentson commercial “wetland park” developments increasing by two to three times. Urbansocial/community benefits will only accrue if they are considered early on in the designand planning process as they are frequently difficult and costly to retrofit into existingstructures. Their success and long term community benefit is also essentially dependenton adoption agreements and continued, positive management either by public or privateagencies. There have been widespread concerns expressed over the provision of open-water bodies such as wet retention (flood storage) ponds and wetlands in urban areas.However, given an extensive plant cover, restricted access to deep water and contaminatedsediment areas can be safeguarded by barrier planting schemes and thus such concerns aremuch less appropriate in the case of constructed wetlands.
It is clear that constructed wetlands systems offer considerable potential as sustainableSuDS options for the control and treatment of urban stormwater runoff even given thattheir design and operational criteria is still an emerging engineering science. The reviewof current information has enabled a summary of the potential capabilities, performanceand range of social/urban community benefits that can accrue from their implementationwithin integrated urban catchment planning, and provides generic end-user approaches forthe quantification and evaluation of urban stormwater wetland sustainability.
Acknowledgement
Thanks is given to all those Environment Agency staff who provided freely of their timeand expertise during the completion of this report. However, the views expressed areentirely the responsibility of the authors and do not reflect future Environment Agencypolicy intentions. The work of Professor J-C Deutsch and Dr. J-M Mouchel of CEREVE,Ecole Nationale des Ponts et Chaussees, Paris in providing the draft material for thechapter relating to French stormwater systems and practices is gratefully acknowledged.The sections on French practice were considerably aided by the very helpful discussionswith staff of the Agence de L’Eau Seine-Normandie (AESN), with the comments of Mme.Nadine Aires being of particular value and insight.
R&D TECHNICAL REPORT P2-159/TR1 1
SuDS
1. INTRODUCTION
1.1 Surface Water Runoff and SuDS
The concepts of Best Practical Environmental Options (BPEOs) are central tostrategies for sustainable urban development and are intended to strike an appropriatebalance between the costs and benefits of measures to protect the environment (DoE,1996). Such practices are considered as reinforcing the water quality improvementsachieved under various (Protection, Conservation and Enhancement) statutory dutiessuch as Section 16 of the 1991 Water Resources Act, Section 12 of the 1991 LandDrainage Act and Section 4(3) of the 1995 Environment Act. However, control ofsurface water discharges is a discretionary power and the Environment Agency wouldseek to encourage a preventative approach so that at least the smaller discharges neednot be subject to regulation.
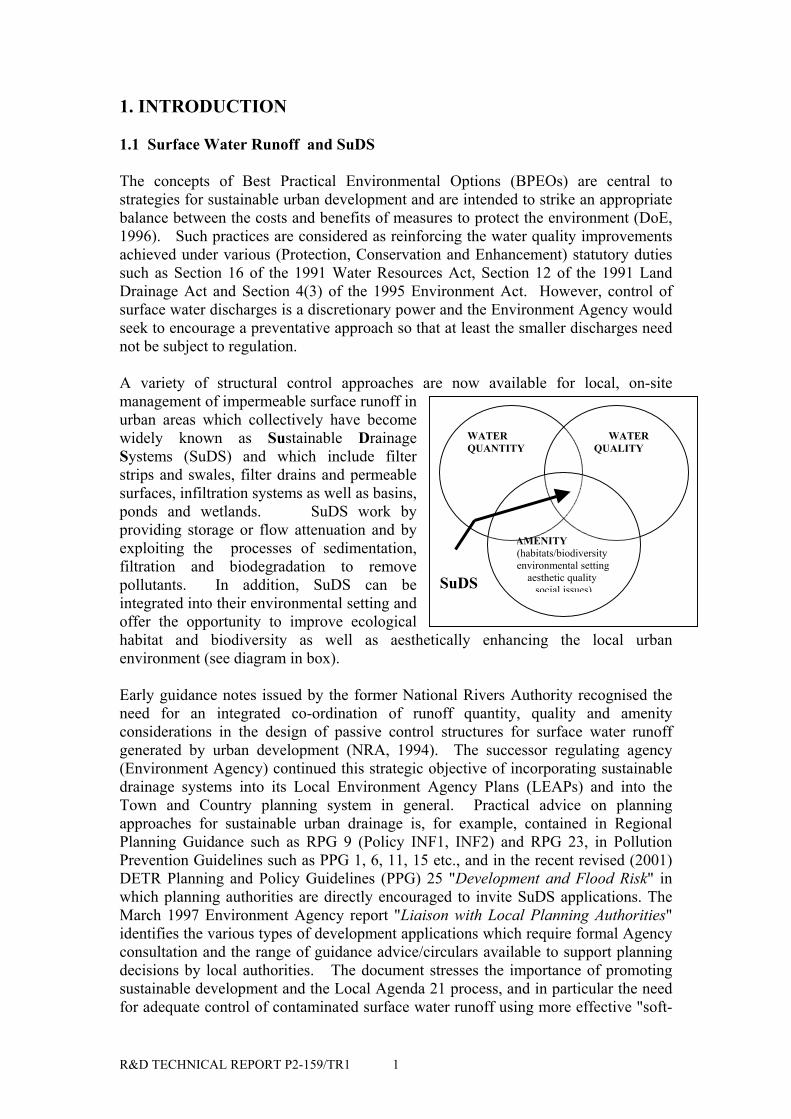
A variety of structural control approaches are now available for local, on-sitemanagement of impermeable surface runoff inurban areas which collectively have becomewidely known as Sustainable DrainageSystems (SuDS) and which include filterstrips and swales, filter drains and permeablesurfaces, infiltration systems as well as basins,ponds and wetlands. SuDS work byproviding storage or flow attenuation and byexploiting the processes of sedimentation,filtration and biodegradation to removepollutants. In addition, SuDS can beintegrated into their environmental setting andoffer the opportunity to improve ecologicalhabitat and biodiversity as well as aesthetically enhancing the local urbanenvironment (see diagram in box).
Early guidance notes issued by the former National Rivers Authority recognised theneed for an integrated co-ordination of runoff quantity, quality and amenityconsiderations in the design of passive control structures for surface water runoffgenerated by urban development (NRA, 1994). The successor regulating agency(Environment Agency) continued this strategic objective of incorporating sustainabledrainage systems into its Local Environment Agency Plans (LEAPs) and into theTown and Country planning system in general. Practical advice on planningapproaches for sustainable urban drainage is, for example, contained in RegionalPlanning Guidance such as RPG 9 (Policy INF1, INF2) and RPG 23, in PollutionPrevention Guidelines such as PPG 1, 6, 11, 15 etc., and in the recent revised (2001)DETR Planning and Policy Guidelines (PPG) 25 "Development and Flood Risk" inwhich planning authorities are directly encouraged to invite SuDS applications. TheMarch 1997 Environment Agency report "Liaison with Local Planning Authorities"identifies the various types of development applications which require formal Agencyconsultation and the range of guidance advice/circulars available to support planningdecisions by local authorities. The document stresses the importance of promotingsustainable development and the Local Agenda 21 process, and in particular the needfor adequate control of contaminated surface water runoff using more effective "soft-
WATERQUANTITY
WATER QUALITY
AMENITY(habitats/biodiversityenvironmental setting aesthetic quality
social issues)
R&D TECHNICAL REPORT P2-159/TR1 2
engineered" SuDS facilities such as grass swales, ponds and wetlands. Thecompanion 1997 consultation report (Thames Environment 21) of the EnvironmentAgency Thames Region set out the Agency strategic intention that planning policiesand development proposals should "require due consideration……of measures whichprevent and control pollution from (both point) and diffuse sources throughappropriate technologies and environmental management". In particular, "urbandrainage systems are a key issue affecting water quality and the biology and ecologyof urban watercourses" (Environment Agency Thames Region, 1997).
The NRA Thames Region, within its Agenda 21 strategy, was an early advocate ofsustainable approaches in schemes for new development in order to minimise theimpacts of surface water runoff (NRA Thames Region, 1995). In July 1998, ThamesWater issued a Policy Statement covering "Surface Water Source Control" whichcommitted the utility to principles for sustainable infrastructure development whichincluded reference to appropriate storage, attenuation and (bio)infiltration practices. Asuccession of CIRIA reports has also identified the potential benefits that can accrueto both developer and to the community from the adoption of sustainable drainageapproaches (including wetlands and ponds) for the control and management of urbanrunoff (CIRIA, 1992; 1993; 1996; 1997; 2000a and b). The impetus provided by thiswork has resulted in an alliance of the England & Wales, Scottish and N Irelandregulatory authorities to produce a guidance booklet and accompanying videodescribing the range of available alternative sustainable drainage approaches (SEPA,EA and E & HS, 2000). There is therefore an increasing general presumption withinthe UK water industry in favour of SuDS approaches to surface drainage that has beenembodied in guidance to local planning authorities and which is implicit in regulatorypolicy. This is likely to be reinforced by the terms of the EU Water FrameworkDirective (Article 11.3h) which contains a particular emphasis on the identificationand control of diffuse pollution including that generated from urban sources.
Wetlands have long been used for the treatment of domestic wastewater, industrial(particularly acid mine drainage) and agricultural effluents (Hammer, 1989; Crites,1988; Reed et al., 1995; Kadlec and Knight, 1996). The first UK wetland (reed bed)system for wastewater treatment was introduced in 1985 and there are now over 400such systems in operation with Severn Trent Water having 130 of this total in 1998(IWA, 2000). Reed bed treatment for domestic wastewater is now accepted within therevised Building Regulations (Part H2) for England & Wales and in the ScottishBuilding Standards Regulations (Part M, Technical Standards for Compliance) anddetailed guidance for building regulation requirements is available (Grant and Griggs,2001). More recently, increasing attention has been paid to the potential function ofwetland treatment systems as attractive and cost-effective Sustainable DrainageSystems (SuDS) for pollution control of urban stormwater surface runoff (Strecker etal., 1992; Moshiri, 1993; Olsen, 1993; Ellis et al., 1994a: Shutes et al., 1997; Shuteset al., 1999; CIRIA, 2000a and b).
In the Initial Report which preceded this Technical Report, over 100 wetland systemswere identified in the UK and which are currently used in the control andmanagement of urban surface runoff (UPRC/CEREVE, 2000). Table 1.1 shows thedistribution of these wetlands in terms of urban land use type, flow system and SuDScategories. The numbers would be considerably larger if all combinedretention/detention storage basins carrying self-seeded aquatic vegetation were to be

R&D TECHNICAL REPORT P2-159/TR1 3
included in the inventory. During the review of data for the CIRIA flood storagereservoir volume (Hall et al., 1993) for example, a total of 75 retention basins wereidentified in the Stort, Mole and Crane catchments. These varied in total storagecapacity from 525m3 up to 123,500m3 and a large number contained marginal aquaticvegetation which had primarily self-seeded. Wetlands were also found to comprisesome 30% of all SuDS types in a recent SEPA (1997) Scottish survey (Table 1.2). Ifvegetated systems incorporated into conventional wet retention/detention basins andother treatment train devices (shown in brackets in the table) are included in thedatabase, then 42% of Scottish SuDS possess wetland technologies at some level ofutilisation.
Table 1.1 Wetlands in UK Urban Surface Drainage Systems
Wetland Type Wetland Flow TypeLand UseType
TotalWetlandNumbers Constructed
WetlandsWetRetentionBasins
CombinedRetentionDetention
ExtendedDetentionBasins
SurfaceFlow
SubSurfaceFlow
VerticalFlow
ResidentialHousing
14 6 2 1 5 11 2 1Commercial
& Retail17 2 10 1 1 13 1
Industrial 12 6 1 5 11 1Highways &
Roads32 12 10 2 8 28 4
Mixed LandUse
14 8 9 16 1Leisure &Amenity
7 2 4 1 7Airport 7 3 4 4 2 1
TOTALS 103 39 40 4 20 90 11 2
Table 1.2. Scottish SuDS Database
ResidentialHousing
Leisure &Amenity
Industrial HighwaysAnd Roads
Commercial &Retail
Flood Storage (Retentionand/or Detention) Basins 5 4 (+1) 10 (+1) - 2 (+2)Wetlands 3 (+1) 1 4 (+1) 1 - (+1)Infiltration Basins 1 (+1) - 1 - -TOTALS 9 5 15 1 2
It is clear therefore, that wetlands are quite common components found in UK urbansurface water drainage systems and that there is an increasing use of and interest inthe application of artificial or constructed wetland technology for the treatment ofpotentially contaminated stormwater runoff within urban catchments.
R&D TECHNICAL REPORT P2-159/TR1 4
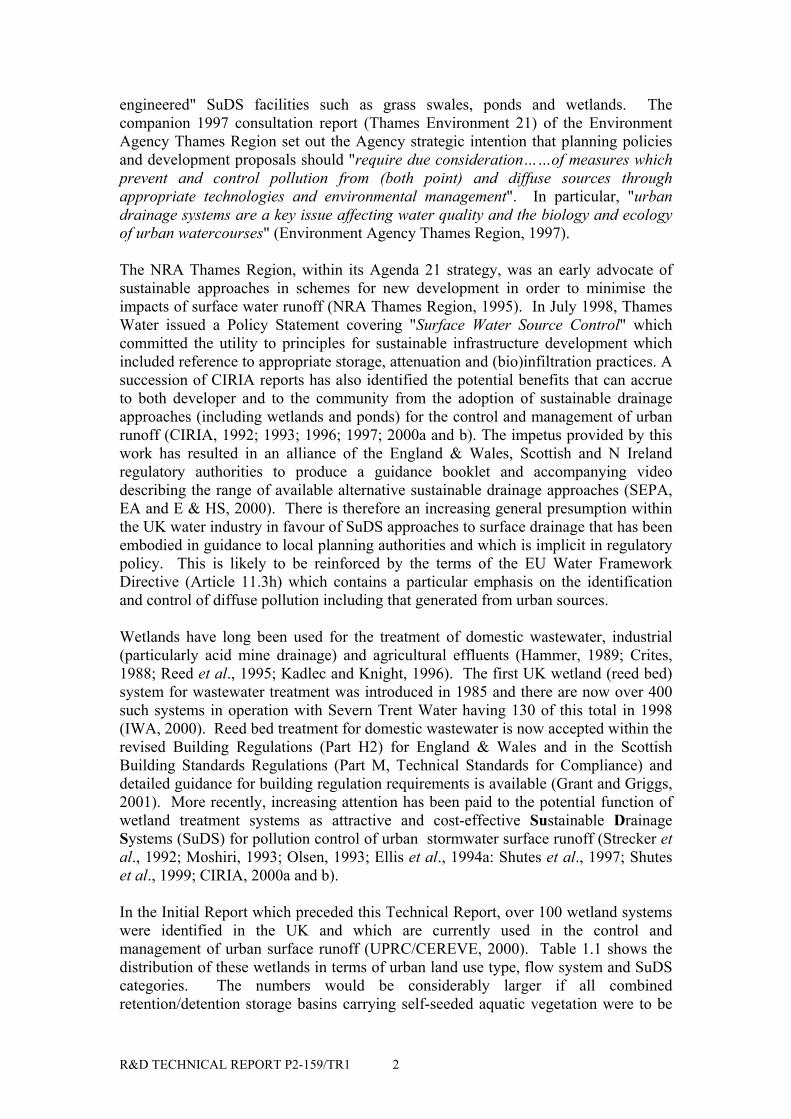
The Welsh Harp, N W LondonThe Welsh Harp basin, whilst originally constructed as an ornamentalreservoir, now serves as a storm runoff attenuation facility for the highlyurbanised 5.2 km2 Silk Stream catchment, with some 60% of the annualflow volume being derived from impermeable surface runoff. The wetretention basin has an extensive Typha and Phragmites wetland marshlocated at the inlet which has become an important wildfowl and birdreserve. Studies have shown that this semi-natural wetland functions asan effective pollution control facility for the treatment of urban runoffremoving some 97% of Suspended Solids (SS) and between 50-80% ofthe hydrocarbons contained in both water and sediment passing throughthe basin (Jones, 1995). The Biological Monitoring Working Party(BMWP which assess the macroinvertebrate community status) scoresimprove from a very depressed value of 5 immediately upstream of theinlet to 50 below the wetland.
Fir Wood Nature Reserve, HertsA small natural wetland located near to Junction 24 on theM25 at Potters Bar receives soil-filtered runoff from themotorway. Although aqueous metal levels recorded in thewetland are well below statutory water quality standards,metal sediment levels show moderate to high levels ofcontamination (Sriyaraj and Shutes, 2001).
1.2 Wetland Types and Definitions
1.2.1 Definitions.
Wetlands are a generic term covering a variety of water bodies supporting aquaticvegetation and providing a biofiltration capability. They include not only naturalmarsh and swamp environments but also artificially constructed storage basins orponds. Wetlands are essentially transitional between terrestrial and aquatic systems,where the water table is normally at or near the soil surface or where there is apermanent shallow water cover (Mitsch and Gosselink, 1993). However, the presenceof water by ponding, flooding or soil saturation is not always a good indicator ofwetlands as they can often appear to be dry. Nevertheless, wetlands possess threebasic characteristics:• an area supporting (at least periodically) hydrophytic vegetation i.e. plants which grow in water• substrates which are predominantly undrained hydric (continually wet) soils• non-soil (rock/gravel) substrates which are either saturated with water or have a
shallow, intermittent or seasonal water cover.
1.2.2 Natural and semi-natural wetlands.
Natural wetlands typically exhibit gradual hydroperiods (i.e. variation in water level),complex topographic structures, moderate to high wildlife habitat value, support fewexotic species and are self-sustaining. They can be classified into three basic types:• swamps which are dominated by water-
tolerant woody plants and trees• marshes dominated by soft-stemmed
emergent plants such as rushes, reedsand sedges (but which can also containsubmergent and floating plants)
• bogs which are characterised by acidic and low-nutrient water and acid-tolerantmosses.
Although natural wetlands and their surrounding riparian area reduce diffusepollution, they do so within a definite range of operational conditions. When eitherhydrologic or pollutant loadings exceed their natural assimilative capacity, theyrapidly become stressed and degraded.
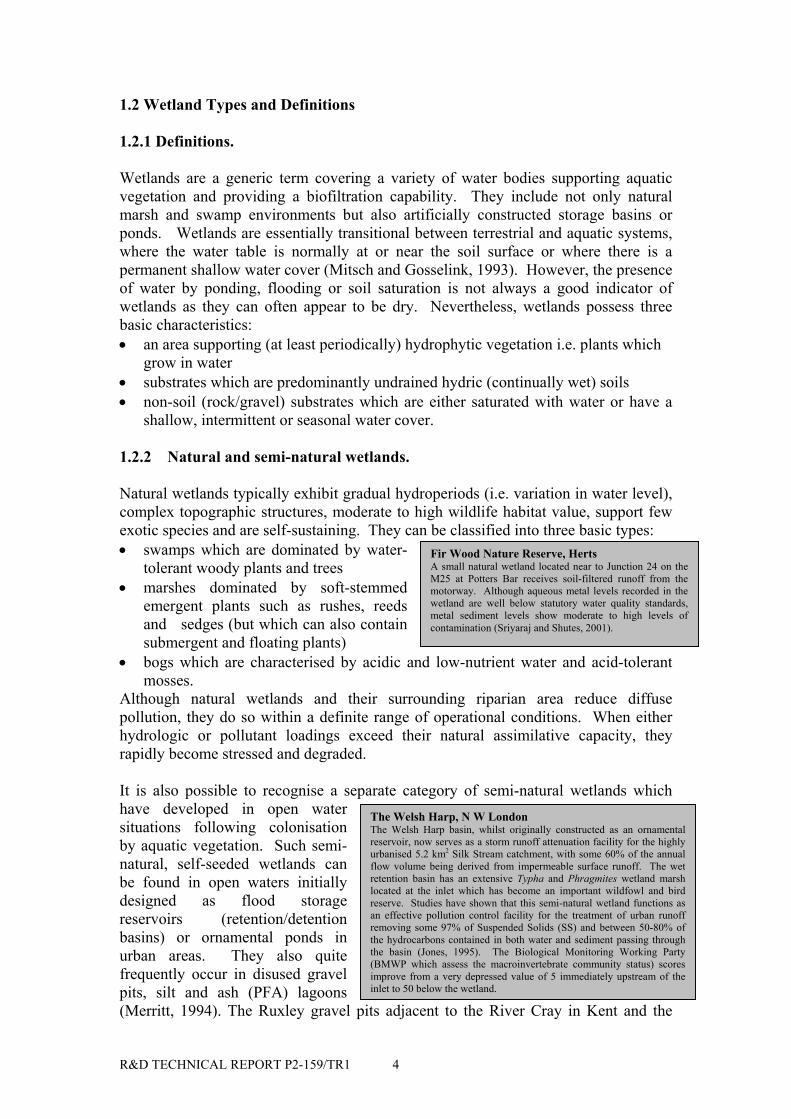
It is also possible to recognise a separate category of semi-natural wetlands whichhave developed in open watersituations following colonisationby aquatic vegetation. Such semi-natural, self-seeded wetlands canbe found in open waters initiallydesigned as flood storagereservoirs (retention/detentionbasins) or ornamental ponds inurban areas. They also quitefrequently occur in disused gravelpits, silt and ash (PFA) lagoons(Merritt, 1994). The Ruxley gravel pits adjacent to the River Cray in Kent and the
R&D TECHNICAL REPORT P2-159/TR1 5
Rye House Nature ReserveThe 5 ha Rye House nature reserve in the lower floodplain of theRiver Lea and operated jointly by the RSPB and Thames Water,is an example of a long established constructed shallow marsh.The wetland marsh was created in 1973 taking 90 Ml/day oftreated sewage effluent from the adjacent tertiary treatmentlagoons of Rye Mead sewage works. The wetland marsh is nowmanaged as a series of compartments demonstrating a range ofhabitats from shallow pools and scrapes, through reed bed tocarr.
The Ouzel Valley LakesThe series of wet retention (balancing) lakes located in the Ouzelvalley at Milton Keynes contain marginal aquatic vegetation which ispartly semi-natural and partly artificially introduced. The largestlakes in this balancing system are Mount Farm Lake (95ha), WillenLake (87ha) and Caldecotte Lake (44ha). All three are fringed byboth emergent and submergent macrophytes which not only provideenhanced ecological and amenity functions, but also help to reducethe elevated nutrient, oil and heavy metal concentrations associatedwith wet weather urban surface discharges.
Extended Detention Basins in Essex and HertsThe 65ha Pinnacles Industrial Estate at Harlow, Essex dischargingsurface water to a 19,400 m3 capacity storage basin and 10.93 haof the M11 at Stansted Brook in Hertfordshire which discharges toa 4,900 m3 capacity dry basin, now have low-level marsh locatedin the base of the storage facilities.
Great Linford pits on the upper Ouzel in Milton Keynes are also examples of self-seeded, wetland marshes. Both are important nature reserves and community assetsand also have significant functions as stormwater balancing facilities.
1.2.3 Artificial or created wetlands.
Artificially constructed wetland storage basins or ponds which create "generic"wetland habitats, have the more limited objectives of flood and pollution control.Created stormwater wetlands which are dependent on surface water runoff are "semi-tidal" in nature, being continuously exposed to episodic inundation and subsequentdrawdown. The extent of the changes in water level impose quite severephysiological constraints on the plant community. The resulting created wetlandsystems typically have a more clearly defined open water component than naturalwetlands. The types of artificial constructed wetlands which can function as urbanstormwater facilities include:
Shallow marsh systems requiring considerable space and which drain contributingareas often in excess of 10 hectares. Theydemand a reliable baseflow orgroundwater supply to support emergentwetland plants. The 140 ha Potteric CarrReserve at West Bessacarr near Doncasterreceives surface runoff from a 1261 hamixed urban catchment, is a very largemarsh system. Whilst being a designatednature reserve dominated by carr marsh, it also retains its function as a major floodstorage facility. The "water meadows" in the Chells district of Stevenage similarlyoperate as shallow marshes fed by overbank flows from the Aston End Brookgenerated by urban surface runoff during storm events.
Retention or wet (balancing) ponds/basins having a permanent water volume areamongst the most frequentlyencountered flood storage facilities inthe UK for managing and controllingurban and highway runoff. Surfacestormwater runoff displaces the waterlying in the basin at thecommencement of the storm event.Sedimentation within the basin willoccur as well as biological uptake and other forms of treatment (volatilisation,complexation, photo-oxidation etc.). Retention ponds can have marginal rooted andsubmergent/floating aquatic vegetation with open water comprising typically some 50- 75% of the total basin surface area.
Small, semi-permanent (low-lying) marshes and pools have been frequentlyincorporated into dry detention basinsto form an extended detention (ED)basin. Such wetlands (of between 10-25% of the total basin area) facilitatepollutant removal and mitigate
R&D TECHNICAL REPORT P2-159/TR1 6
The A34 Newbury BypassA total of nine flood stroage basins have been built alongside theA34 Newbury Bypass to control and treat surface water designdischarges varying between 20-120 l/s, from 13.5 km of dual,two-lane trunk road. Maximum design storage volumes varybetween 121-676 m3 with retention times of between 30-120hours. One storage basin has been retrofitted with a SSFconstructed wetland (Phragmites) and wet weather removalrates recorded for the wetland system has been high with SS andheavy metal removal efficiencies varying between 40-75% and59-98% respectively (Scholes et al., 1999).
District Park (DEX), Dunfermline, Fife, ScotlandCombined dry/wet retention basins and SF wetlands treat surface water froma 600ha light industrial/commercial and highway catchment. Percentagemetal removals from the wetlands are Cu 33%, Pb 25% and Zn 65%. Meanmetal sediment levels are Cu 13, Pb 10.5 and Zn 30.2 mg/kg (Heal, 1999)
M25, Barrow Court, Oxted, Surrey7.29ha of the M25 (with AADT flows of 120,000 vehicles)drains to a dry detention basin of 3147m3 maximum capacity.Pollutant levels retained in the basal marsh sediment variedbetween 162-55,892 mg/kg for total petroleum hydrocarbonsand 15-14,762 µg/g for Cu, Zn and Pb (Ellis et al., 1997)
against short-circuiting, channelisation and sediment re-entrainement. A few EDbasins are now being formally introduced under the SEPA SUDS initiative inScotland on the Dunfermline (Eastern Expansion, DEX) site in Fife (McKissock etal., 2000). There is a modified ED basinwith a semi-permanent pool as well as alow level wetland marsh in the off-line38,000 m3 detention basin located atNorth Weald, Essex and a number ofindustrial/commercial estates haveextended dry detention basins to incorporate a wet marsh facility. A number oforiginally dry detention basins have shallow marsh/wetland vegetation occupyingsome part of the basin floor and now effectively function as extended detentionfacilities with the vegetation filtering out pollutants contained in the influent surfacewater flows.
Combined pond/wetland (retention/detention) basins are storage facilities where partof the containing basin is given over to dead storage (permanent pools) and part tolive (fill and drain) storage. Such combined retention/detention wetland designs havebeen adopted for the control andmanagement of highway runoff as onthe A34 Newbury bypass, the A4/A46Bathford roundabout and at the M49junction to the east of the southernSevern Bridge crossing. The designsfrequently possess a front-end pool orchamber which traps sediment andassociated pollutants providingtreatment for the first flush and (the more frequent) small runoff events. The wetlandcell (which can be separated by a filter strip or gabion wall from the permanent pond),
provides for temporarystorage, secondarybiological treatment andattenuation of runoff fromlarger more infrequent
storms. A final micropool or settlement pond might also be included to give a morelimited tertiary treatment.
R&D TECHNICAL REPORT P2-159/TR1 7
Anton Crescent, Sutton, SurreyThe 1.3 ha Anton Crescent wetland in Sutton, Surrey hasbeen built in a wet detention basin which serves a mixedresidential and light commercial catchment. The basin hasa maximum design storage capacity of 10,000 m3 with amean retention time of 10.8 days. The SF constructedwetland was planted with Typha to provide a wildlifeconservation area and a local amenity/educational facilityand now also provides a valuable water quality functionwith average removal rates for SS, Zn and Faecal Coliformsof 56%, 37% and 78% respectively (Cutbill, 1994). Highmetal levels are associated with the sediments filtered outby the macrophyte roots and stems (Cu 40, Pb 126.6 and Zn120.7 mg/kg.
Keytec 7 Pond, Pershore, Worcs.The 10.9ha Keytec Industrial estate pond in Pershore, Worcs wasdesigned as a flow balancing facility with a SF constructed wetland toprovide 1500m3 of stormwater storage with a retention time of 15-20hours. The imposed pollution discharge consents for SS (100mg/l),BOD (20mg/l) and oils/hydrocarbons (5mg/l) have been successfullymet throughout the operational lifetime of the basin.
1.3 Constructed Wetlands and Flow Systems
1.3.1 Constructed wetlands
Constructed wetland basins normally have non-soil substrates and a permanent (butnormally shallow) water volume which canbe almost entirely covered in aquaticvegetation. Constructed wetlands maycontain marsh, swamp and pond (lagoon)elements; the inlet zone for example, canresemble the latter form and be used as asediment trap. The dominant feature of thesystem is the macrophyte zone containingemergent and/or floating vegetation thatrequires(or can withstand) wetting anddrying cycles. . Constructed wetlandslack the full range of aquatic functions exhibited by natural wetlands and are notintended to provide species diversity. Whilst natural wetlands depend upongroundwater levels, constructed stormwater wetlands are dominated by surface runoffin a random "semi-tidal" hydroperiod characterised by cyclic patterns of inundationand drawdown.
Such constructed wetlands typically experience much greater sediment inputs thannatural wetlands. In addition to a more restricted aquatic flora, they are likely toprovide an environment favourableto invasive terrestrial weed speciesespecially during plantestablishment. Open water wouldnormally occupy up to 25 - 30% ofthe total basin surface area withremaining areas comprising shallowsup to a maximum depth of 0.5m. Flood storage can also be added above the treatmentwetland where the surrounding terrain permits.
1.3.2 Constructed Wetland Flow Systems
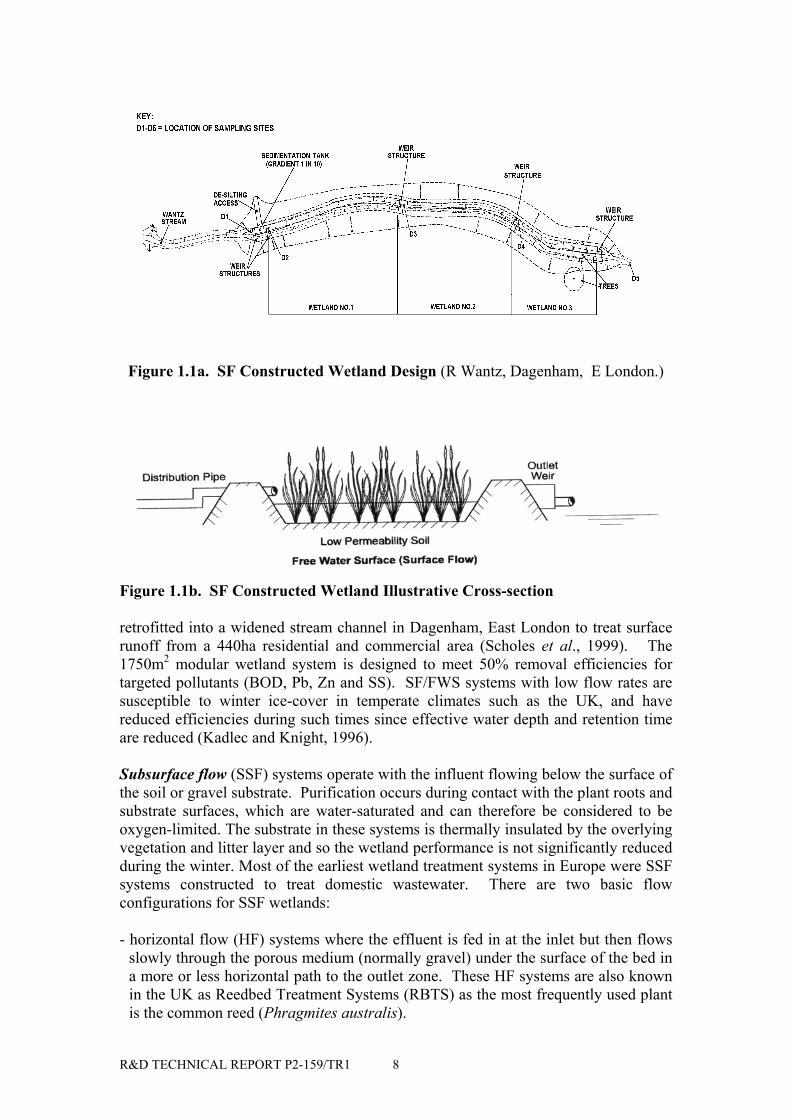
Although the design of artificially constructed wetlands varies making each systemunique, the basic flow configurations can be divided into two categories:Surface flow (SF) or free water surface (FWS) systems which are similar to naturalmarshes in that they are basins planted with emergent, submergent and/or floatingwetland macrophyte plants. Such free surface water treatment wetlands mimic thehydrologic regime of natural wetlands. As indicated in Table 1.1, almost allconstructed wetlands in the UK for the treatment of urban runoff comprise surfaceflow systems and resemble natural marshes, in that they can provide wildlife habitatand aesthetic benefits as well as water treatment. The influent passes as free-surface(overland) flow (and/or at shallow depths) and at low velocities above the supportingsubstrates. Figure 1.1a and b shows a (3 x 80m) linear SF design which has been
R&D TECHNICAL REPORT P2-159/TR1 8
Figure 1.1a. SF Constructed Wetland Design (R Wantz, Dagenham, E London.)
Figure 1.1b. SF Constructed Wetland Illustrative Cross-section
retrofitted into a widened stream channel in Dagenham, East London to treat surfacerunoff from a 440ha residential and commercial area (Scholes et al., 1999). The1750m2 modular wetland system is designed to meet 50% removal efficiencies fortargeted pollutants (BOD, Pb, Zn and SS). SF/FWS systems with low flow rates aresusceptible to winter ice-cover in temperate climates such as the UK, and havereduced efficiencies during such times since effective water depth and retention timeare reduced (Kadlec and Knight, 1996).
Subsurface flow (SSF) systems operate with the influent flowing below the surface ofthe soil or gravel substrate. Purification occurs during contact with the plant roots andsubstrate surfaces, which are water-saturated and can therefore be considered to beoxygen-limited. The substrate in these systems is thermally insulated by the overlyingvegetation and litter layer and so the wetland performance is not significantly reducedduring the winter. Most of the earliest wetland treatment systems in Europe were SSFsystems constructed to treat domestic wastewater. There are two basic flowconfigurations for SSF wetlands:
- horizontal flow (HF) systems where the effluent is fed in at the inlet but then flowsslowly through the porous medium (normally gravel) under the surface of the bed ina more or less horizontal path to the outlet zone. These HF systems are also knownin the UK as Reedbed Treatment Systems (RBTS) as the most frequently used plantis the common reed (Phragmites australis).
R&D TECHNICAL REPORT P2-159/TR1 9
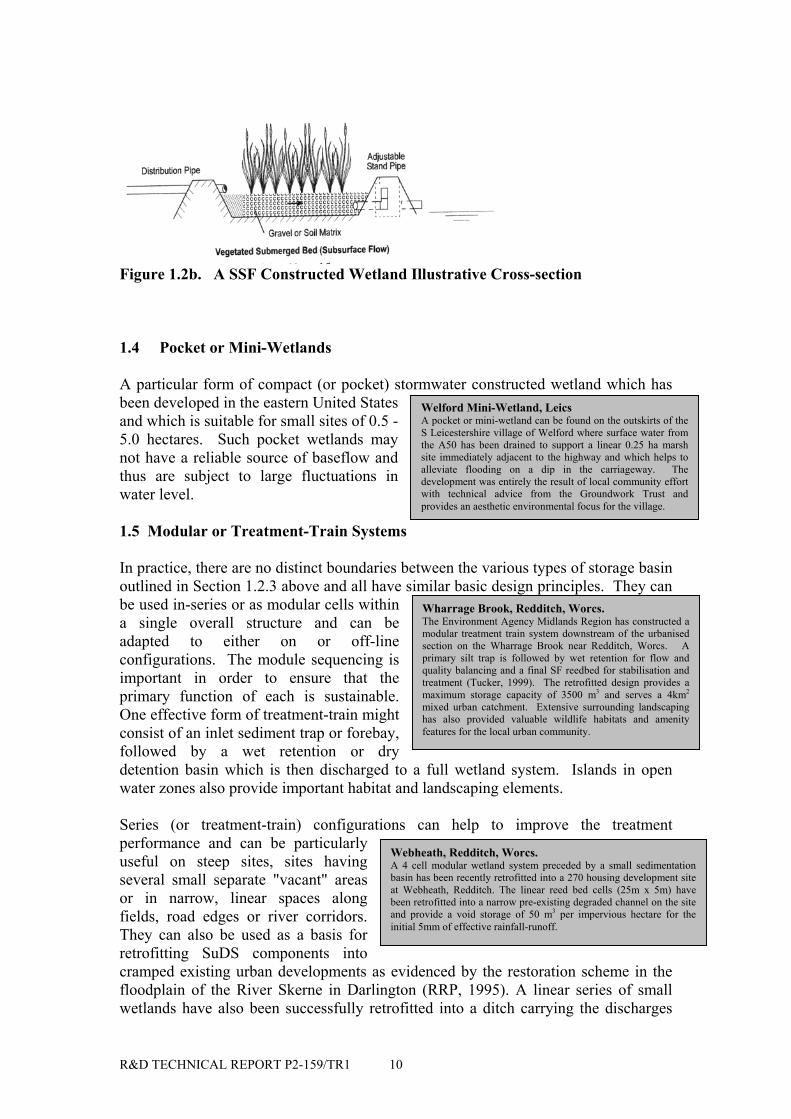
- vertical flow (VF) systems, which usually have a sand cap overlying the gradedgravel/rock substrate, and are intermittently dosed from above to flood the surfaceof the bed. The effluent then drains vertically down through the bed to be collectedat the base. Such VF systems are similar in design and operation to conventionalpercolating filters but are very rarely found on surface water drainage systems(Table 1.1).
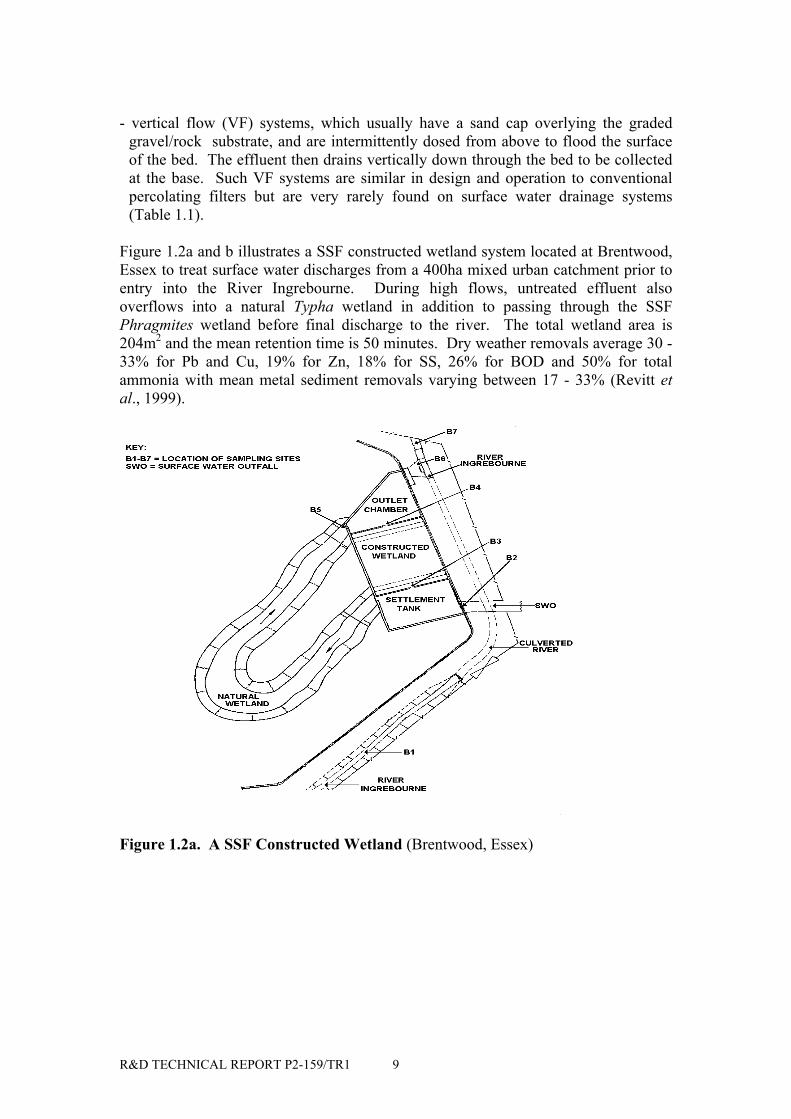
Figure 1.2a and b illustrates a SSF constructed wetland system located at Brentwood,Essex to treat surface water discharges from a 400ha mixed urban catchment prior toentry into the River Ingrebourne. During high flows, untreated effluent alsooverflows into a natural Typha wetland in addition to passing through the SSFPhragmites wetland before final discharge to the river. The total wetland area is204m2 and the mean retention time is 50 minutes. Dry weather removals average 30 -33% for Pb and Cu, 19% for Zn, 18% for SS, 26% for BOD and 50% for totalammonia with mean metal sediment removals varying between 17 - 33% (Revitt etal., 1999).
Figure 1.2a. A SSF Constructed Wetland (Brentwood, Essex)
R&D TECHNICAL REPORT P2-159/TR1 10
Wharrage Brook, Redditch, Worcs.The Environment Agency Midlands Region has constructed amodular treatment train system downstream of the urbanisedsection on the Wharrage Brook near Redditch, Worcs. Aprimary silt trap is followed by wet retention for flow andquality balancing and a final SF reedbed for stabilisation andtreatment (Tucker, 1999). The retrofitted design provides amaximum storage capacity of 3500 m3 and serves a 4km2
mixed urban catchment. Extensive surrounding landscapinghas also provided valuable wildlife habitats and amenityfeatures for the local urban community.
Webheath, Redditch, Worcs.A 4 cell modular wetland system preceded by a small sedimentationbasin has been recently retrofitted into a 270 housing development siteat Webheath, Redditch. The linear reed bed cells (25m x 5m) havebeen retrofitted into a narrow pre-existing degraded channel on the siteand provide a void storage of 50 m3 per impervious hectare for theinitial 5mm of effective rainfall-runoff.
Welford Mini-Wetland, LeicsA pocket or mini-wetland can be found on the outskirts of theS Leicestershire village of Welford where surface water fromthe A50 has been drained to support a linear 0.25 ha marshsite immediately adjacent to the highway and which helps toalleviate flooding on a dip in the carriageway. Thedevelopment was entirely the result of local community effortwith technical advice from the Groundwork Trust andprovides an aesthetic environmental focus for the village.
Figure 1.2b. A SSF Constructed Wetland Illustrative Cross-section
1.4 Pocket or Mini-Wetlands
A particular form of compact (or pocket) stormwater constructed wetland which hasbeen developed in the eastern United Statesand which is suitable for small sites of 0.5 -5.0 hectares. Such pocket wetlands maynot have a reliable source of baseflow andthus are subject to large fluctuations inwater level.
1.5 Modular or Treatment-Train Systems
In practice, there are no distinct boundaries between the various types of storage basinoutlined in Section 1.2.3 above and all have similar basic design principles. They canbe used in-series or as modular cells withina single overall structure and can beadapted to either on or off-lineconfigurations. The module sequencing isimportant in order to ensure that theprimary function of each is sustainable.One effective form of treatment-train mightconsist of an inlet sediment trap or forebay,followed by a wet retention or drydetention basin which is then discharged to a full wetland system. Islands in openwater zones also provide important habitat and landscaping elements.
Series (or treatment-train) configurations can help to improve the treatmentperformance and can be particularlyuseful on steep sites, sites havingseveral small separate "vacant" areasor in narrow, linear spaces alongfields, road edges or river corridors.They can also be used as a basis forretrofitting SuDS components intocramped existing urban developments as evidenced by the restoration scheme in thefloodplain of the River Skerne in Darlington (RRP, 1995). A linear series of smallwetlands have also been successfully retrofitted into a ditch carrying the discharges
R&D TECHNICAL REPORT P2-159/TR1 11
from filter drains on the southern carriageways of the M25 just south of Junction 15near Heathrow Airport.
The Environment Agency Midlands Region has developed an innovative modulartreatment train approach for flood and quality control of urban stormwater runoff(Tucker, 1999). Their working design consists of four principal elements:• a stilling basin and sediment trap (10m3) to capture stormwater debris/litter, grit
and oiled sediment. This front-end basin can also be used to retain oil andchemical spillages which may occur within the catchment
• a retention and attenuation of the first flush through mobilisation of void storageusing simple orifice/notch weir controls
• a multi-cell linear reedbed construction, normally of HF configuration with a totalsurface area of 125m2 and 250m2 respectively for residential andindustrial/commercial land
• a wet retention basin for storm flow balancing and final water quality treatment
The Environment Agency Thames Region has supported the development of a similarmodular sustainable drainage approach for the 6.5ha motorway service area atJunction 8 on the M40 near Oxford. The treatment-train design not only has first-flush(for the initial 10 mm of runoff) and spillage storage, SSF horizontal flow reedbedsand detention ponds (one being a combined detention/wetland system), but also has arange of additional source control structures including porous paving to vehicleparking surfaces, swales and infiltration trenches (Bray, 1999). The final treatedstormwater is recycled for toilet flushing, irrigation and top-up water for ornamentalponds on the site. A similar modular SuDS complex but utilising a series of SFwetland systems has been introduced to control and treat the surface drainage for theM42 Junction 2, Hopwood Park motorway service area (Bray, 2001a). The designfor the HGV parking area captures the 10mm first-flush volume and is treated bystone filtering followed by wetland treatment over a 48 hour period.
1.6 Wetland Processes
1.6.1 Introduction
A wetland system consists of biotic (plant, algae and associated fungi and bacteria)and abiotic (surface and interstitial water, sediment and detrital material)compartments. Each of the compartments can serve to differing degrees, as a storagelocation for pollutants entering the wetland. The vascular plants transfer nutrients,gas and other materials (including pollutants) from one part of the plant to another.The microbial compartment is extremely complex and is probably the leastunderstood although it may be the most important wetland component. The micro-organisms are found in the water column, attached to living and dead organic materialand within the detritus that builds up on the wetland substrate. Some (facultative)bacteria can grow in either aerobic or anaerobic environments whilst others (obligatebacteria) are specific to either aerobic or anaerobic conditions. Bacteria have a directrole in nutrient cycling and through their oxygen consumption can contribute to anincrease in wetland BOD levels. Certain organic and inorganic material canaccumulate in the wetland substrate and lead to predominantly oxygen-deficientsediments which generally tend to inhibit decomposition and oxidation reactions.
R&D TECHNICAL REPORT P2-159/TR1 12
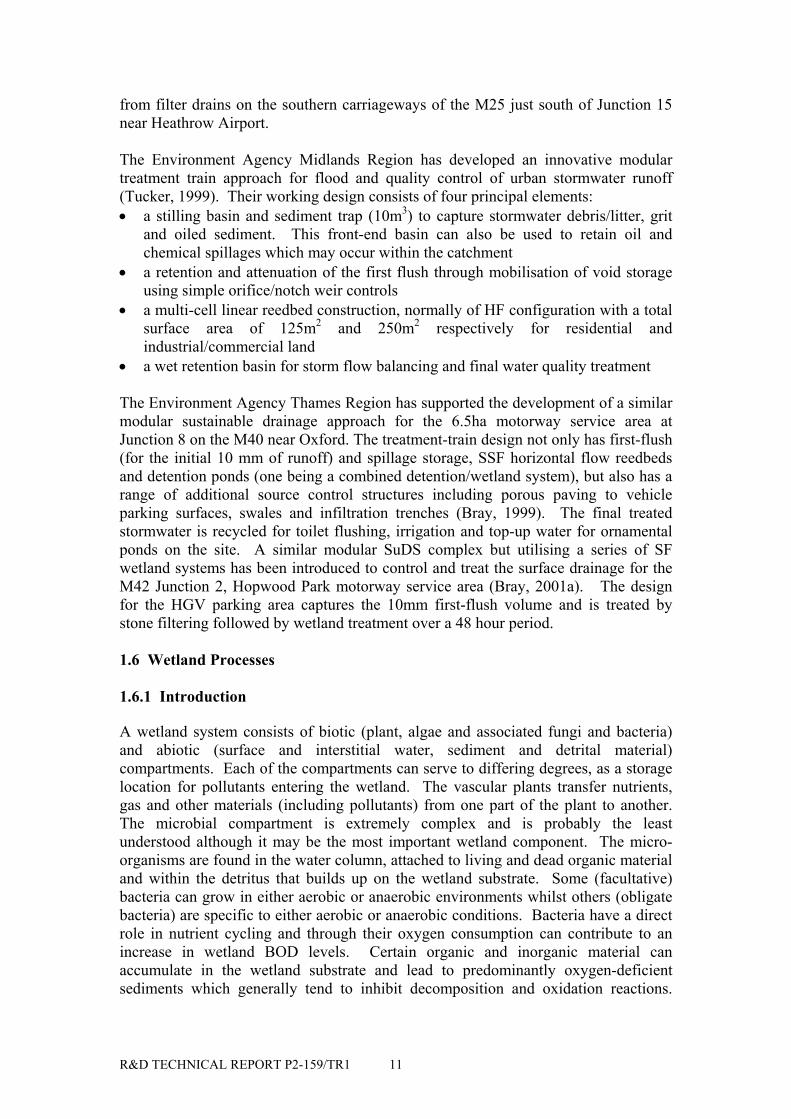
This means that associated metals, oils and nutrients can be tied-up in the sediment forlong periods.
Figure 1.3. Nitrogen Transformation in a Wetland System
When pollutants enter the wetland they are acted upon by biological, chemical andphysical processes which interact in a complex fashion. Figure 1.3 illustrates in asimplified form the interactions which occur in a wetland system between the air-water-sediment phases during sequential nitrogen transformations. Plants will take updissolved inorganic nutrients (ammonia, nitrate, phosphate etc.) and incorporate theminto their tissue whilst bacteria and fungi attack the organic material, utilising bothcarbon compounds and nutrients. The wetland biota die and become detritus in thebasal sediments or may be washed downstream. On an annual basis, pollutants maybecome buried in the sediments, transformed from one form to another, lost to theatmosphere or washed out of the wetland system either in the original or an alteredform.
1.6.2 Pollutant removal processes
In order that the design and operational characteristics of wetland treatment systemsare satisfactorily specified, it is necessary to have an understanding of the basicpollution removal mechanisms. Pollutants in urban surface runoff can be removed bywetlands as a result of sediment attachment, degradation, transformation and transfer.They can also be transferred to the atmosphere or groundwater although the latterpathway should be prevented by the use of an impermeable base or liner. Theprincipal physical, chemical and biological removal mechanisms includesedimentation, adsorption, precipitation and dissolution, filtration, bacterial andbiochemical interactions, volatilisation and infiltration. Due to the complexinteractions between the physical and biochemical processes which occur in wetlandsystems, these removal mechanisms are not independent. The considerable variationin wetland characteristics e.g hydrology, biota, substrates etc., means that the
After: Kadlecand Knight,
R&D TECHNICAL REPORT P2-159/TR1 13
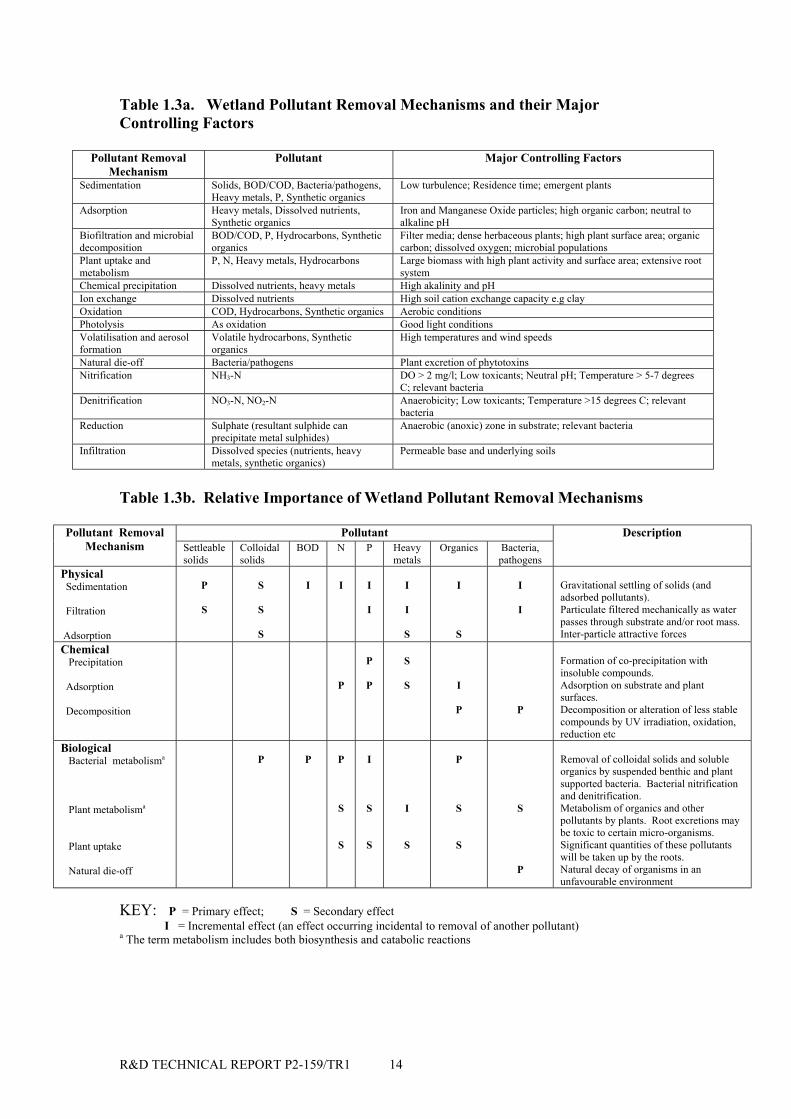
dominant removal mechanisms will vary from one wetland to another as well asbetween differing storm events affecting the same wetland system. These inter- andintra-wetland variations help to explain why wetland pollutant removal efficienciescan vary with respect to both temporal and spatial resolution. Tables 1.3a andb summarise the principal mechanisms that capture, retain and transform variouspollutant species found in urban runoff and the controlling factors that promote thevarious removal mechanisms and which lead to improved water quality.
As noted previously, the large majority of UK urban wetlands are free water surfacesystems containing emergent macrophytes in which the near-surface water layer isaerobic but with the deeper water and substrate being normally anaerobic. Aconstructed wetland has been traditionally thought to provide a combined aerobic-anaerobic environment. The anaerobic zone surrounds the root zone and at the sametime provides a mini-aerobic zone surrounding the root hairs formed by the oxygenpassed down from the stems and/or leaves of the aquatic vegetation and contributingto the degradation of oxygen-consuming substances and to nitrification. Ammonia isalso oxidised into nitrate by nitrifying bacteria in aerobic zones (see Figure 1.3) withdenitrification converting nitrate to free nitrogen (or nitrous oxide) in the anaerobicbottom layers and substrate by denitrifying bacteria. These processes will occur mostrapidly during summer periods when high temperatures stimulate microbial activity.Solids, settleable organics and solid-associated pollutants such as bacteria, metals andoils are very effectively removed by the physical filtration offered by the vegetationwhich imposes a considerable hydraulic resistance to the incoming flow.
Soluble metals are typically transformed by microbial oxidation and precipitated inthe wetland substrate in the form of oxides or sulphates with soluble BOD removedby both attached and suspended microbial growth in the aerobic surface water layers.
R&D TECHNICAL REPORT P2-159/TR1 14
Table 1.3a. Wetland Pollutant Removal Mechanisms and their MajorControlling Factors
Pollutant RemovalMechanism
Pollutant Major Controlling Factors
Sedimentation Solids, BOD/COD, Bacteria/pathogens,Heavy metals, P, Synthetic organics
Low turbulence; Residence time; emergent plants
Adsorption Heavy metals, Dissolved nutrients,Synthetic organics
Iron and Manganese Oxide particles; high organic carbon; neutral toalkaline pH
Biofiltration and microbialdecomposition
BOD/COD, P, Hydrocarbons, Syntheticorganics
Filter media; dense herbaceous plants; high plant surface area; organiccarbon; dissolved oxygen; microbial populations
Plant uptake andmetabolism
P, N, Heavy metals, Hydrocarbons Large biomass with high plant activity and surface area; extensive rootsystem
Chemical precipitation Dissolved nutrients, heavy metals High akalinity and pHIon exchange Dissolved nutrients High soil cation exchange capacity e.g clayOxidation COD, Hydrocarbons, Synthetic organics Aerobic conditionsPhotolysis As oxidation Good light conditionsVolatilisation and aerosolformation
Volatile hydrocarbons, Syntheticorganics
High temperatures and wind speeds
Natural die-off Bacteria/pathogens Plant excretion of phytotoxinsNitrification NH3-N DO > 2 mg/l; Low toxicants; Neutral pH; Temperature > 5-7 degrees
C; relevant bacteriaDenitrification NO3-N, NO2-N Anaerobicity; Low toxicants; Temperature >15 degrees C; relevant
bacteriaReduction Sulphate (resultant sulphide can
precipitate metal sulphides)Anaerobic (anoxic) zone in substrate; relevant bacteria
Infiltration Dissolved species (nutrients, heavymetals, synthetic organics)
Permeable base and underlying soils
Table 1.3b. Relative Importance of Wetland Pollutant Removal Mechanisms
PollutantPollutant RemovalMechanism Settleable
solidsColloidalsolids
BOD N P Heavymetals
Organics Bacteria,pathogens
Description
Physical Sedimentation
Filtration
Adsorption
P
S
S
S
S
I I I
I
I
I
S
I
S
I
I
Gravitational settling of solids (andadsorbed pollutants).Particulate filtered mechanically as waterpasses through substrate and/or root mass.Inter-particle attractive forces
Chemical Precipitation
Adsorption
Decomposition
P
P
P
S
S I
P P
Formation of co-precipitation withinsoluble compounds.Adsorption on substrate and plantsurfaces.Decomposition or alteration of less stablecompounds by UV irradiation, oxidation,reduction etc
Biological Bacterial metabolisma
Plant metabolisma
Plant uptake
Natural die-off
P P P
S
S
I
S
S
I
S
P
S
S
S
P
Removal of colloidal solids and solubleorganics by suspended benthic and plantsupported bacteria. Bacterial nitrificationand denitrification.Metabolism of organics and otherpollutants by plants. Root excretions maybe toxic to certain micro-organisms.Significant quantities of these pollutantswill be taken up by the roots.Natural decay of organisms in anunfavourable environment
KEY: P = Primary effect; S = Secondary effect I = Incremental effect (an effect occurring incidental to removal of another pollutant)a The term metabolism includes both biosynthesis and catabolic reactions
R&D TECHNICAL REPORT P2-159/TR1 15
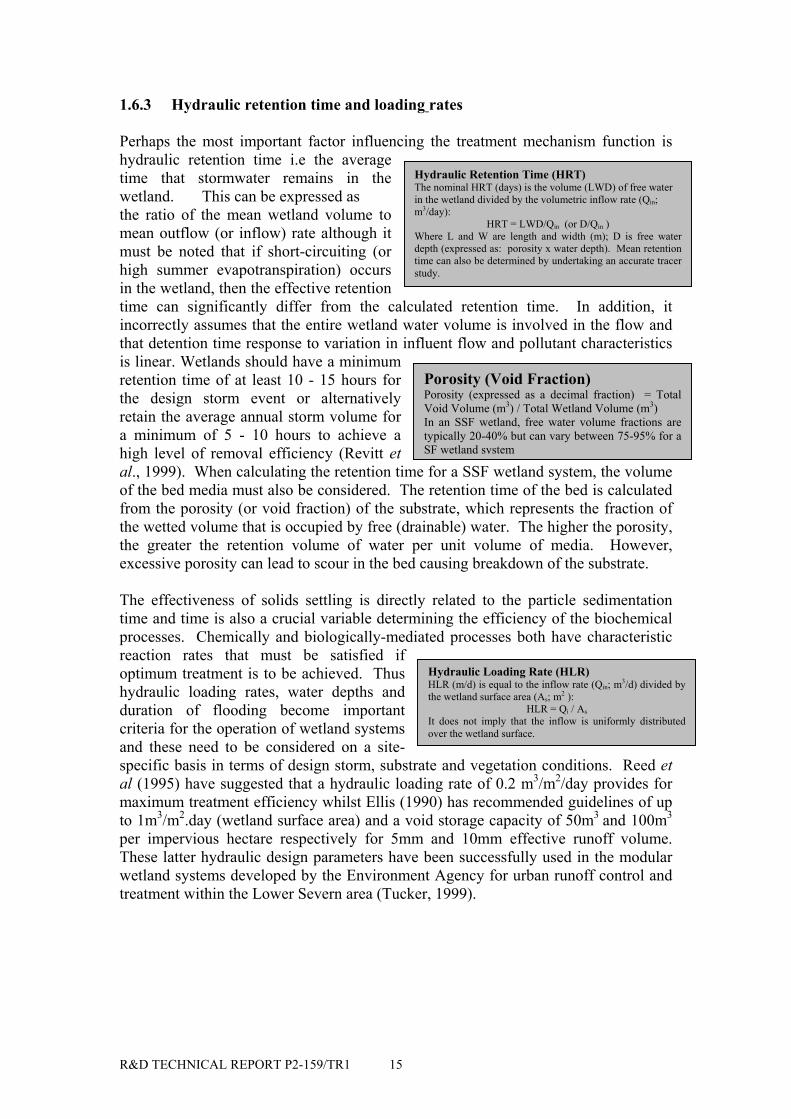
Hydraulic Retention Time (HRT)The nominal HRT (days) is the volume (LWD) of free waterin the wetland divided by the volumetric inflow rate (Qin;m3/day):
HRT = LWD/Qin (or D/Qin )Where L and W are length and width (m); D is free waterdepth (expressed as: porosity x water depth). Mean retentiontime can also be determined by undertaking an accurate tracerstudy.
Hydraulic Loading Rate (HLR)HLR (m/d) is equal to the inflow rate (Qin; m3/d) divided bythe wetland surface area (As; m2 ):
HLR = Qi / AsIt does not imply that the inflow is uniformly distributedover the wetland surface.
Porosity (Void Fraction)Porosity (expressed as a decimal fraction) = TotalVoid Volume (m3) / Total Wetland Volume (m3)In an SSF wetland, free water volume fractions aretypically 20-40% but can vary between 75-95% for aSF wetland system
1.6.3 Hydraulic retention time and loading rates
Perhaps the most important factor influencing the treatment mechanism function ishydraulic retention time i.e the averagetime that stormwater remains in thewetland. This can be expressed asthe ratio of the mean wetland volume tomean outflow (or inflow) rate although itmust be noted that if short-circuiting (orhigh summer evapotranspiration) occursin the wetland, then the effective retentiontime can significantly differ from the calculated retention time. In addition, itincorrectly assumes that the entire wetland water volume is involved in the flow andthat detention time response to variation in influent flow and pollutant characteristicsis linear. Wetlands should have a minimumretention time of at least 10 - 15 hours forthe design storm event or alternativelyretain the average annual storm volume fora minimum of 5 - 10 hours to achieve ahigh level of removal efficiency (Revitt etal., 1999). When calculating the retention time for a SSF wetland system, the volumeof the bed media must also be considered. The retention time of the bed is calculatedfrom the porosity (or void fraction) of the substrate, which represents the fraction ofthe wetted volume that is occupied by free (drainable) water. The higher the porosity,the greater the retention volume of water per unit volume of media. However,excessive porosity can lead to scour in the bed causing breakdown of the substrate.
The effectiveness of solids settling is directly related to the particle sedimentationtime and time is also a crucial variable determining the efficiency of the biochemicalprocesses. Chemically and biologically-mediated processes both have characteristicreaction rates that must be satisfied ifoptimum treatment is to be achieved. Thushydraulic loading rates, water depths andduration of flooding become importantcriteria for the operation of wetland systemsand these need to be considered on a site-specific basis in terms of design storm, substrate and vegetation conditions. Reed etal (1995) have suggested that a hydraulic loading rate of 0.2 m3/m2/day provides formaximum treatment efficiency whilst Ellis (1990) has recommended guidelines of upto 1m3/m2.day (wetland surface area) and a void storage capacity of 50m3 and 100m3
per impervious hectare respectively for 5mm and 10mm effective runoff volume.These latter hydraulic design parameters have been successfully used in the modularwetland systems developed by the Environment Agency for urban runoff control andtreatment within the Lower Severn area (Tucker, 1999).
R&D TECHNICAL REPORT P2-159/TR1 16
Required Wetland VolumeThe computations shown in Appendix A and the retention curvesof Figure 5 can help to reach decisions on required wetlandvolumes (V) for a particular location by multiplying the retentiontime (HRT or tret) by the daily flow (Qd ; m3/d ):
V = tret x Qdto achieve a desired target level of solids reduction (and for anyrequired sediment grading threshold)
1.6.4 Sedimentation
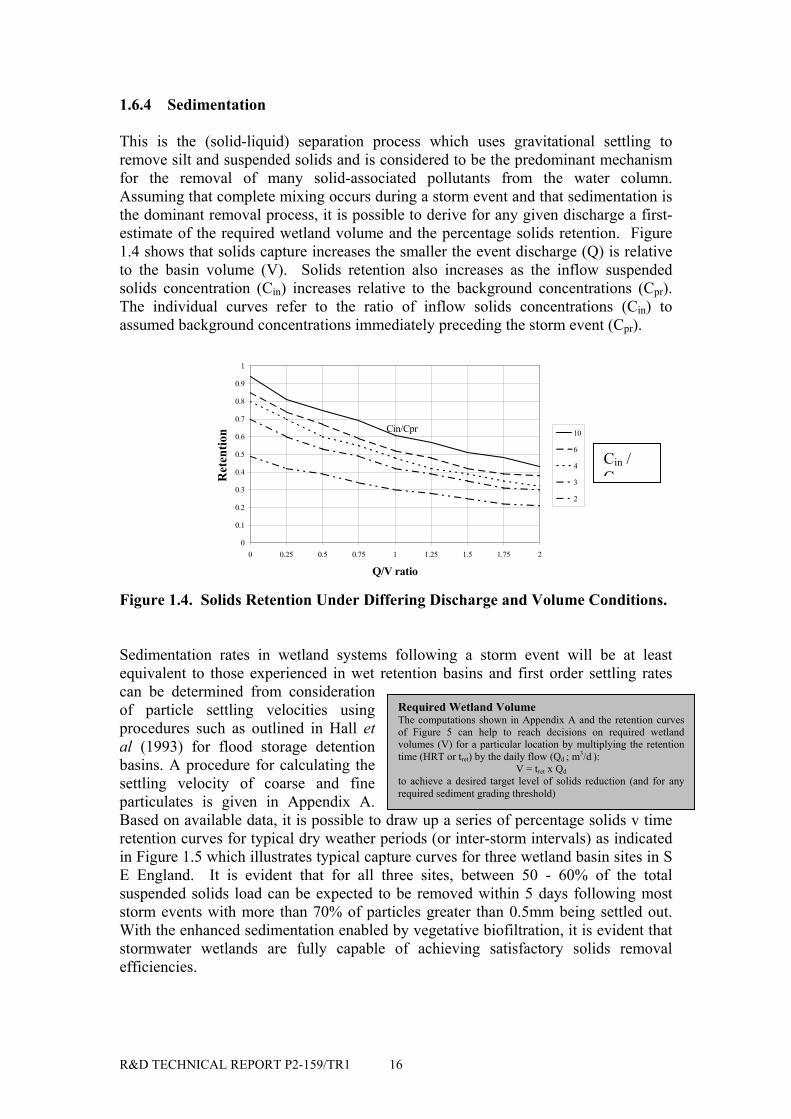
This is the (solid-liquid) separation process which uses gravitational settling toremove silt and suspended solids and is considered to be the predominant mechanismfor the removal of many solid-associated pollutants from the water column.Assuming that complete mixing occurs during a storm event and that sedimentation isthe dominant removal process, it is possible to derive for any given discharge a first-estimate of the required wetland volume and the percentage solids retention. Figure1.4 shows that solids capture increases the smaller the event discharge (Q) is relativeto the basin volume (V). Solids retention also increases as the inflow suspendedsolids concentration (Cin) increases relative to the background concentrations (Cpr).The individual curves refer to the ratio of inflow solids concentrations (Cin) toassumed background concentrations immediately preceding the storm event (Cpr).
0
0.1
0.2
0.3
0.4
0.5
0.6
0.7
0.8
0.9
1
0 0.25 0.5 0.75 1 1.25 1.5 1.75 2
Q/V ratio
Ret
entio
n 10
6
4
3
2
Cin/Cpr
Figure 1.4. Solids Retention Under Differing Discharge and Volume Conditions.
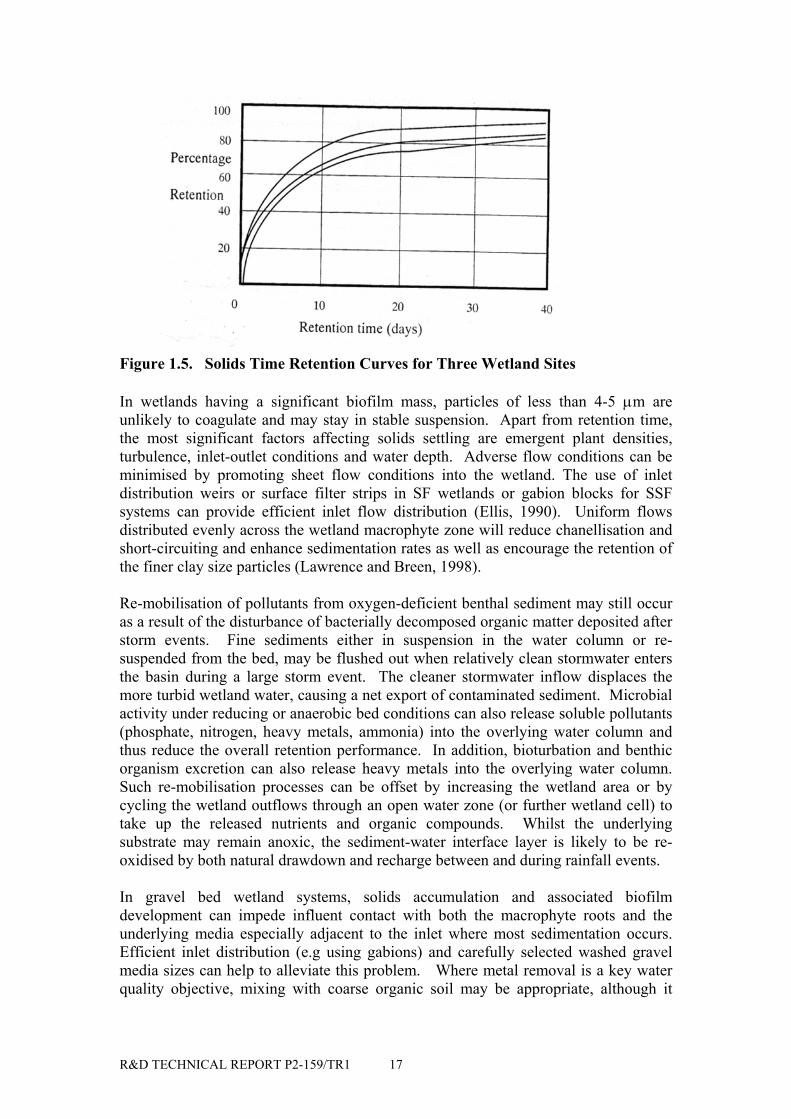
Sedimentation rates in wetland systems following a storm event will be at leastequivalent to those experienced in wet retention basins and first order settling ratescan be determined from considerationof particle settling velocities usingprocedures such as outlined in Hall etal (1993) for flood storage detentionbasins. A procedure for calculating thesettling velocity of coarse and fineparticulates is given in Appendix A.Based on available data, it is possible to draw up a series of percentage solids v timeretention curves for typical dry weather periods (or inter-storm intervals) as indicatedin Figure 1.5 which illustrates typical capture curves for three wetland basin sites in SE England. It is evident that for all three sites, between 50 - 60% of the totalsuspended solids load can be expected to be removed within 5 days following moststorm events with more than 70% of particles greater than 0.5mm being settled out.With the enhanced sedimentation enabled by vegetative biofiltration, it is evident thatstormwater wetlands are fully capable of achieving satisfactory solids removalefficiencies.
Cin /C
R&D TECHNICAL REPORT P2-159/TR1 17
Figure 1.5. Solids Time Retention Curves for Three Wetland Sites
In wetlands having a significant biofilm mass, particles of less than 4-5 µm areunlikely to coagulate and may stay in stable suspension. Apart from retention time,the most significant factors affecting solids settling are emergent plant densities,turbulence, inlet-outlet conditions and water depth. Adverse flow conditions can beminimised by promoting sheet flow conditions into the wetland. The use of inletdistribution weirs or surface filter strips in SF wetlands or gabion blocks for SSFsystems can provide efficient inlet flow distribution (Ellis, 1990). Uniform flowsdistributed evenly across the wetland macrophyte zone will reduce chanellisation andshort-circuiting and enhance sedimentation rates as well as encourage the retention ofthe finer clay size particles (Lawrence and Breen, 1998).
Re-mobilisation of pollutants from oxygen-deficient benthal sediment may still occuras a result of the disturbance of bacterially decomposed organic matter deposited afterstorm events. Fine sediments either in suspension in the water column or re-suspended from the bed, may be flushed out when relatively clean stormwater entersthe basin during a large storm event. The cleaner stormwater inflow displaces themore turbid wetland water, causing a net export of contaminated sediment. Microbialactivity under reducing or anaerobic bed conditions can also release soluble pollutants(phosphate, nitrogen, heavy metals, ammonia) into the overlying water column andthus reduce the overall retention performance. In addition, bioturbation and benthicorganism excretion can also release heavy metals into the overlying water column.Such re-mobilisation processes can be offset by increasing the wetland area or bycycling the wetland outflows through an open water zone (or further wetland cell) totake up the released nutrients and organic compounds. Whilst the underlyingsubstrate may remain anoxic, the sediment-water interface layer is likely to be re-oxidised by both natural drawdown and recharge between and during rainfall events.
In gravel bed wetland systems, solids accumulation and associated biofilmdevelopment can impede influent contact with both the macrophyte roots and theunderlying media especially adjacent to the inlet where most sedimentation occurs.Efficient inlet distribution (e.g using gabions) and carefully selected washed gravelmedia sizes can help to alleviate this problem. Where metal removal is a key waterquality objective, mixing with coarse organic soil may be appropriate, although it
R&D TECHNICAL REPORT P2-159/TR1 18
Maximum Inflow VelocityThe expected maximum velocity (Umax; m/s) in the wetlandcan be calculated as a function of the peak flow rate (Q pkmax ;m3/s) and wetland surface area (As; m2) as: Umax = Qpkmax / As
Adsorption Behaviour of a PollutantThe balance or equilibrium between the solid-associated (Cs, sorbed) anddissolved (Cw) phases of a pollutant is commonly referred to as a sorptionisotherm. The expression used to describe this pollutant partitioning oradsorption relationship is known as the Freundlich isotherm:
Cs = K. Cwn
where K is the Freundlich constant (or pollutant adsorption coefficient) and nis a measure of deviation from linearity. A value of n = 1 reflects thosesituations in which the attractiveness of the solid for the sorbate remains thesame for all levels of Cs. This linear isothermal relationship usually onlyapplies over narrow ranges in Cw particularly at low pollutant concentrations.The distribution ratio (Kd) of total pollutant equilibrium concentrations in thesorbed and dissolved phases is expressed as:
Kd = Cs / Cw
and hence; Kd = K. Cwn - 1
should be noted that introduced weeds are likely to be present and can cause laterproblems.
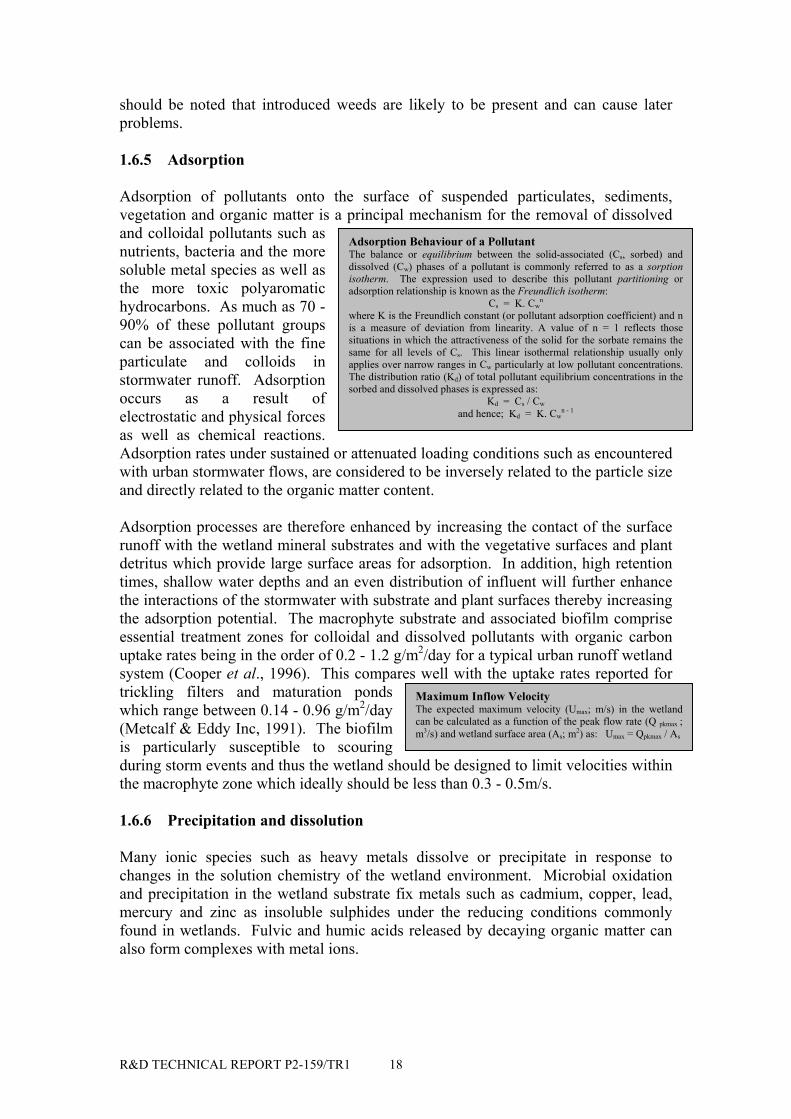
1.6.5 Adsorption
Adsorption of pollutants onto the surface of suspended particulates, sediments,vegetation and organic matter is a principal mechanism for the removal of dissolvedand colloidal pollutants such asnutrients, bacteria and the moresoluble metal species as well asthe more toxic polyaromatichydrocarbons. As much as 70 -90% of these pollutant groupscan be associated with the fineparticulate and colloids instormwater runoff. Adsorptionoccurs as a result ofelectrostatic and physical forcesas well as chemical reactions.Adsorption rates under sustained or attenuated loading conditions such as encounteredwith urban stormwater flows, are considered to be inversely related to the particle sizeand directly related to the organic matter content.
Adsorption processes are therefore enhanced by increasing the contact of the surfacerunoff with the wetland mineral substrates and with the vegetative surfaces and plantdetritus which provide large surface areas for adsorption. In addition, high retentiontimes, shallow water depths and an even distribution of influent will further enhancethe interactions of the stormwater with substrate and plant surfaces thereby increasingthe adsorption potential. The macrophyte substrate and associated biofilm compriseessential treatment zones for colloidal and dissolved pollutants with organic carbonuptake rates being in the order of 0.2 - 1.2 g/m2/day for a typical urban runoff wetlandsystem (Cooper et al., 1996). This compares well with the uptake rates reported fortrickling filters and maturation pondswhich range between 0.14 - 0.96 g/m2/day(Metcalf & Eddy Inc, 1991). The biofilmis particularly susceptible to scouringduring storm events and thus the wetland should be designed to limit velocities withinthe macrophyte zone which ideally should be less than 0.3 - 0.5m/s.
1.6.6 Precipitation and dissolution
Many ionic species such as heavy metals dissolve or precipitate in response tochanges in the solution chemistry of the wetland environment. Microbial oxidationand precipitation in the wetland substrate fix metals such as cadmium, copper, lead,mercury and zinc as insoluble sulphides under the reducing conditions commonlyfound in wetlands. Fulvic and humic acids released by decaying organic matter canalso form complexes with metal ions.
R&D TECHNICAL REPORT P2-159/TR1 19
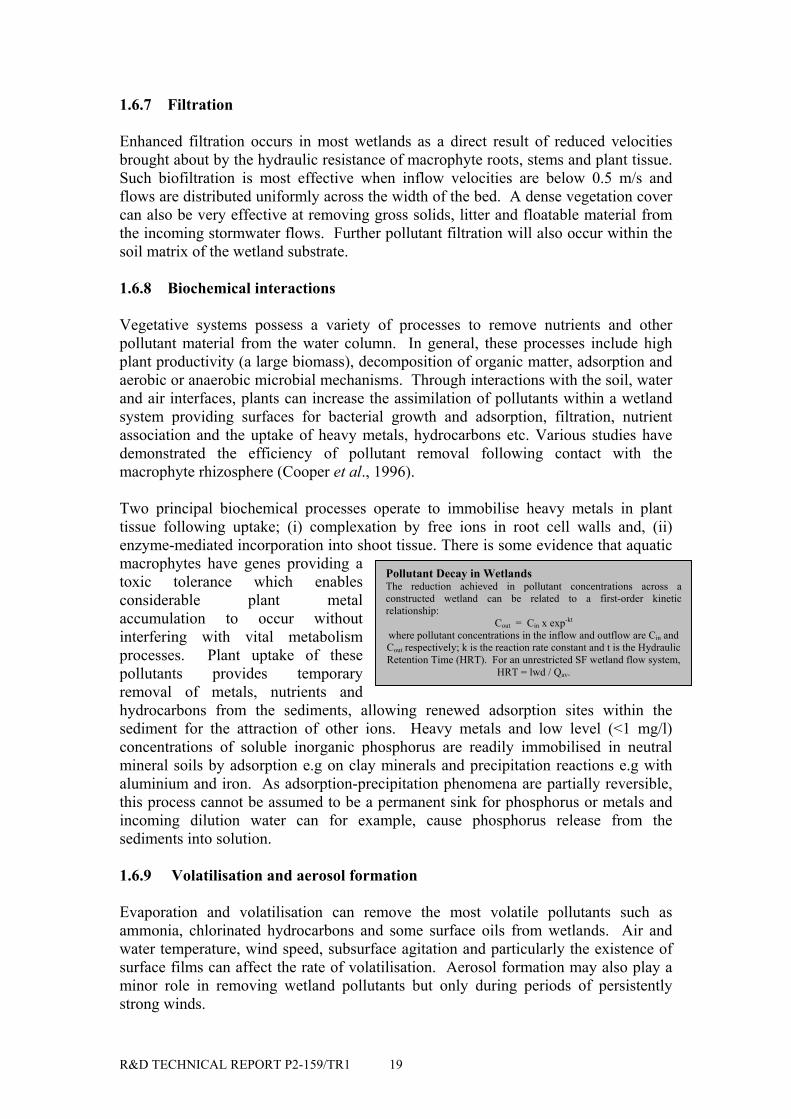
Pollutant Decay in WetlandsThe reduction achieved in pollutant concentrations across aconstructed wetland can be related to a first-order kineticrelationship:
Cout = Cin x exp-kt
where pollutant concentrations in the inflow and outflow are Cin andCout respectively; k is the reaction rate constant and t is the HydraulicRetention Time (HRT). For an unrestricted SF wetland flow system,
HRT = lwd / Qav.
1.6.7 Filtration
Enhanced filtration occurs in most wetlands as a direct result of reduced velocitiesbrought about by the hydraulic resistance of macrophyte roots, stems and plant tissue.Such biofiltration is most effective when inflow velocities are below 0.5 m/s andflows are distributed uniformly across the width of the bed. A dense vegetation covercan also be very effective at removing gross solids, litter and floatable material fromthe incoming stormwater flows. Further pollutant filtration will also occur within thesoil matrix of the wetland substrate.
1.6.8 Biochemical interactions
Vegetative systems possess a variety of processes to remove nutrients and otherpollutant material from the water column. In general, these processes include highplant productivity (a large biomass), decomposition of organic matter, adsorption andaerobic or anaerobic microbial mechanisms. Through interactions with the soil, waterand air interfaces, plants can increase the assimilation of pollutants within a wetlandsystem providing surfaces for bacterial growth and adsorption, filtration, nutrientassociation and the uptake of heavy metals, hydrocarbons etc. Various studies havedemonstrated the efficiency of pollutant removal following contact with themacrophyte rhizosphere (Cooper et al., 1996).
Two principal biochemical processes operate to immobilise heavy metals in planttissue following uptake; (i) complexation by free ions in root cell walls and, (ii)enzyme-mediated incorporation into shoot tissue. There is some evidence that aquaticmacrophytes have genes providing atoxic tolerance which enablesconsiderable plant metalaccumulation to occur withoutinterfering with vital metabolismprocesses. Plant uptake of thesepollutants provides temporaryremoval of metals, nutrients andhydrocarbons from the sediments, allowing renewed adsorption sites within thesediment for the attraction of other ions. Heavy metals and low level (<1 mg/l)concentrations of soluble inorganic phosphorus are readily immobilised in neutralmineral soils by adsorption e.g on clay minerals and precipitation reactions e.g withaluminium and iron. As adsorption-precipitation phenomena are partially reversible,this process cannot be assumed to be a permanent sink for phosphorus or metals andincoming dilution water can for example, cause phosphorus release from thesediments into solution.
1.6.9 Volatilisation and aerosol formation
Evaporation and volatilisation can remove the most volatile pollutants such asammonia, chlorinated hydrocarbons and some surface oils from wetlands. Air andwater temperature, wind speed, subsurface agitation and particularly the existence ofsurface films can affect the rate of volatilisation. Aerosol formation may also play aminor role in removing wetland pollutants but only during periods of persistentlystrong winds.
R&D TECHNICAL REPORT P2-159/TR1 20
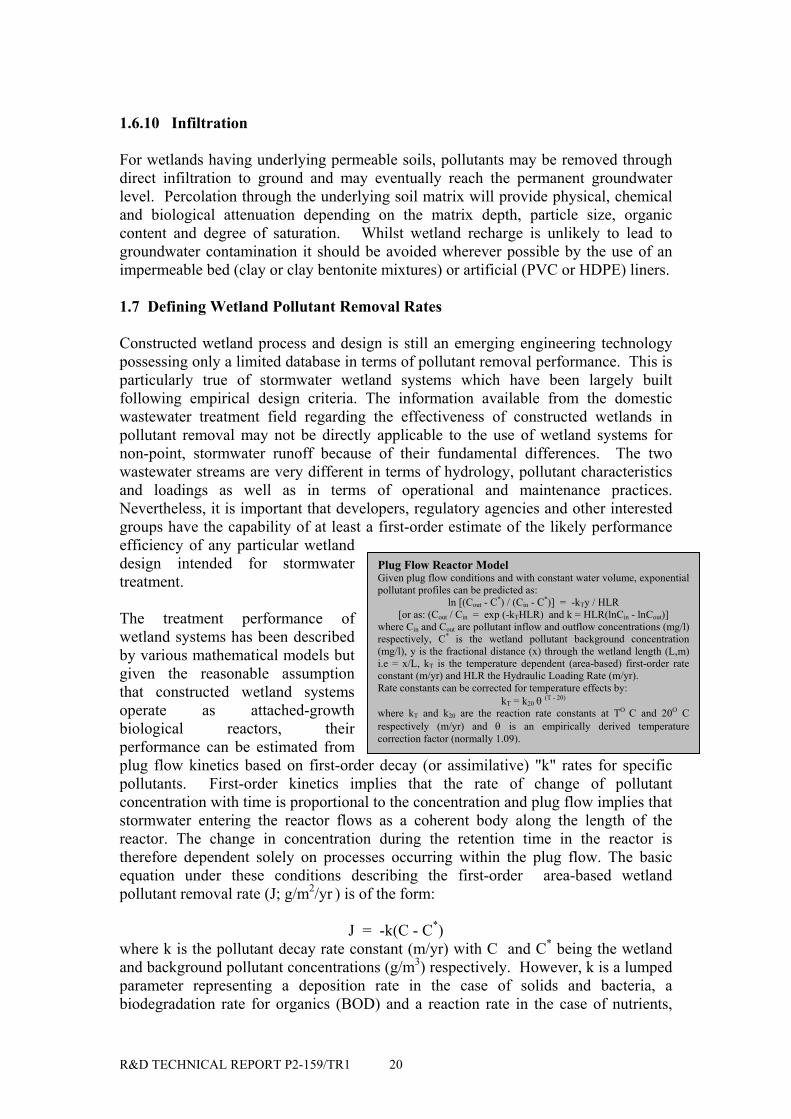
Plug Flow Reactor ModelGiven plug flow conditions and with constant water volume, exponentialpollutant profiles can be predicted as:
ln [(Cout - C*) / (Cin - C*)] = -kTy / HLR[or as: (Cout / Cin = exp (-kTHLR) and k = HLR(lnCin - lnCout)]
where Cin and Cout are pollutant inflow and outflow concentrations (mg/l)respectively, C* is the wetland pollutant background concentration(mg/l), y is the fractional distance (x) through the wetland length (L,m)i.e = x/L, kT is the temperature dependent (area-based) first-order rateconstant (m/yr) and HLR the Hydraulic Loading Rate (m/yr).Rate constants can be corrected for temperature effects by:
kT = k20 θ (T - 20)
where kT and k20 are the reaction rate constants at TO C and 20O Crespectively (m/yr) and θ is an empirically derived temperaturecorrection factor (normally 1.09).
1.6.10 Infiltration
For wetlands having underlying permeable soils, pollutants may be removed throughdirect infiltration to ground and may eventually reach the permanent groundwaterlevel. Percolation through the underlying soil matrix will provide physical, chemicaland biological attenuation depending on the matrix depth, particle size, organiccontent and degree of saturation. Whilst wetland recharge is unlikely to lead togroundwater contamination it should be avoided wherever possible by the use of animpermeable bed (clay or clay bentonite mixtures) or artificial (PVC or HDPE) liners.
1.7 Defining Wetland Pollutant Removal Rates
Constructed wetland process and design is still an emerging engineering technologypossessing only a limited database in terms of pollutant removal performance. This isparticularly true of stormwater wetland systems which have been largely builtfollowing empirical design criteria. The information available from the domesticwastewater treatment field regarding the effectiveness of constructed wetlands inpollutant removal may not be directly applicable to the use of wetland systems fornon-point, stormwater runoff because of their fundamental differences. The twowastewater streams are very different in terms of hydrology, pollutant characteristicsand loadings as well as in terms of operational and maintenance practices.Nevertheless, it is important that developers, regulatory agencies and other interestedgroups have the capability of at least a first-order estimate of the likely performanceefficiency of any particular wetlanddesign intended for stormwatertreatment.
The treatment performance ofwetland systems has been describedby various mathematical models butgiven the reasonable assumptionthat constructed wetland systemsoperate as attached-growthbiological reactors, theirperformance can be estimated fromplug flow kinetics based on first-order decay (or assimilative) "k" rates for specificpollutants. First-order kinetics implies that the rate of change of pollutantconcentration with time is proportional to the concentration and plug flow implies thatstormwater entering the reactor flows as a coherent body along the length of thereactor. The change in concentration during the retention time in the reactor istherefore dependent solely on processes occurring within the plug flow. The basicequation under these conditions describing the first-order area-based wetlandpollutant removal rate (J; g/m2/yr ) is of the form:
J = -k(C - C*)where k is the pollutant decay rate constant (m/yr) with C and C* being the wetlandand background pollutant concentrations (g/m3) respectively. However, k is a lumpedparameter representing a deposition rate in the case of solids and bacteria, abiodegradation rate for organics (BOD) and a reaction rate in the case of nutrients,
R&D TECHNICAL REPORT P2-159/TR1 21
metals and hydrocarbons. Thus the value of k really depends on the relevantoperating "treatment" process and is normally expressed as a synthesised index valuecombining the differing removal processes. Any factor such as hydraulic retentiontime (HRT) which influences these processes can indirectly affect the final k value.
Although simple, this k - C* area-based reduction model, adapted for treatmentwetlands by Kadlec and Knight (1996), represents the highest level of complexity thatcan generally be calibrated with wetland data and provides a reasonableapproximation of performance for a wide range of stormwater pollutants. Appendix Bprovides detail of the working method and illustrates how plug flow kinetic modellingapproaches based on the first-order reaction rates can be applied to determine the sizeand residence time required to achieve target pollutant reduction in wetland systems.The approach has been widely used and was found for example, to best describe theperformance of 21 stormwater constructed wetlands reviewed in a recent USEnvironmental Protection Agency (1998) BMP technology assessment.
However, despite the general utility of the k - C* model it has not been universallyaccepted as it assumes spatially invariant time-averaged flow which is difficult toapply to urban wetlands under stormflow conditions. Rainfall will cause dilution andshorten retention times and such "augmentation" can lead to errors by as much as afactor of four in the determination of rate constants for a first-order reaction. Someguidance on deviation from the simple scheme can be obtained from Kadlec (1989)who argues that SF constructed wetlands have characteristics intermediate betweenplug flow and well mixed. The k - C* two parameter model also does not account foradaptation trends in the wetland ecosystem as it matures or the effects of pH anddissolved oxygen as well as other factors which are known to affect the fate ofpollutants in treatment systems. More complex models incorporating the effects ofplant biomass, pulsed flows and varying residence times are available (Kadlec, 1996;Wong et al., 1998; Lawrence and Breen, 1998) but these require substantialcalibration data and further field testing before they can be universally and simplyapplied to constructed urban stormwater wetlands.

R&D TECHNICAL REPORT P2-159/TR1 22
Key Issues
• defining optimum hydraulic retention times (HRTs) and hydraulic loadingrates (HLRs) for required (or target) pollutant removal efficiencies andvarying wetland surface areas and volumes.
• assumed linear response of hydraulic retention time (HRT) to influent flowand wetland pollutant characteristics.
• the general utility of the k – C* model under non-steady, stormflow conditionsand with wetland maturation.
• relative role of constructed wetlands within a SuDS treatment train.
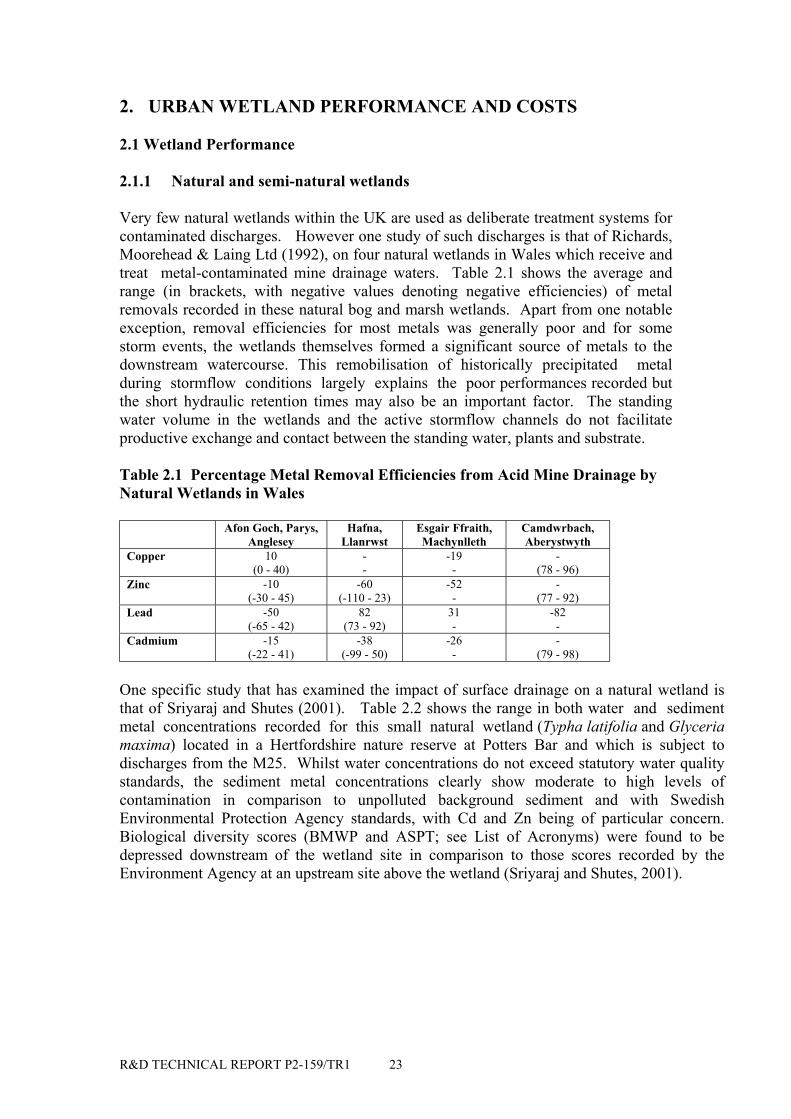
R&D TECHNICAL REPORT P2-159/TR1 23
2. URBAN WETLAND PERFORMANCE AND COSTS
2.1 Wetland Performance
2.1.1 Natural and semi-natural wetlands
Very few natural wetlands within the UK are used as deliberate treatment systems forcontaminated discharges. However one study of such discharges is that of Richards,Moorehead & Laing Ltd (1992), on four natural wetlands in Wales which receive andtreat metal-contaminated mine drainage waters. Table 2.1 shows the average andrange (in brackets, with negative values denoting negative efficiencies) of metalremovals recorded in these natural bog and marsh wetlands. Apart from one notableexception, removal efficiencies for most metals was generally poor and for somestorm events, the wetlands themselves formed a significant source of metals to thedownstream watercourse. This remobilisation of historically precipitated metalduring stormflow conditions largely explains the poor performances recorded butthe short hydraulic retention times may also be an important factor. The standingwater volume in the wetlands and the active stormflow channels do not facilitateproductive exchange and contact between the standing water, plants and substrate.
Table 2.1 Percentage Metal Removal Efficiencies from Acid Mine Drainage byNatural Wetlands in Wales
Afon Goch, Parys,Anglesey
Hafna,Llanrwst
Esgair Ffraith,Machynlleth
Camdwrbach,Aberystwyth
Copper 10(0 - 40)
--
-19-
-(78 - 96)
Zinc -10(-30 - 45)
-60(-110 - 23)
-52-
-(77 - 92)
Lead -50(-65 - 42)
82(73 - 92)
31-
-82-
Cadmium -15(-22 - 41)
-38(-99 - 50)
-26-
-(79 - 98)
One specific study that has examined the impact of surface drainage on a natural wetland isthat of Sriyaraj and Shutes (2001). Table 2.2 shows the range in both water and sedimentmetal concentrations recorded for this small natural wetland (Typha latifolia and Glyceriamaxima) located in a Hertfordshire nature reserve at Potters Bar and which is subject todischarges from the M25. Whilst water concentrations do not exceed statutory water qualitystandards, the sediment metal concentrations clearly show moderate to high levels ofcontamination in comparison to unpolluted background sediment and with SwedishEnvironmental Protection Agency standards, with Cd and Zn being of particular concern.Biological diversity scores (BMWP and ASPT; see List of Acronyms) were found to bedepressed downstream of the wetland site in comparison to those scores recorded by theEnvironment Agency at an upstream site above the wetland (Sriyaraj and Shutes, 2001).
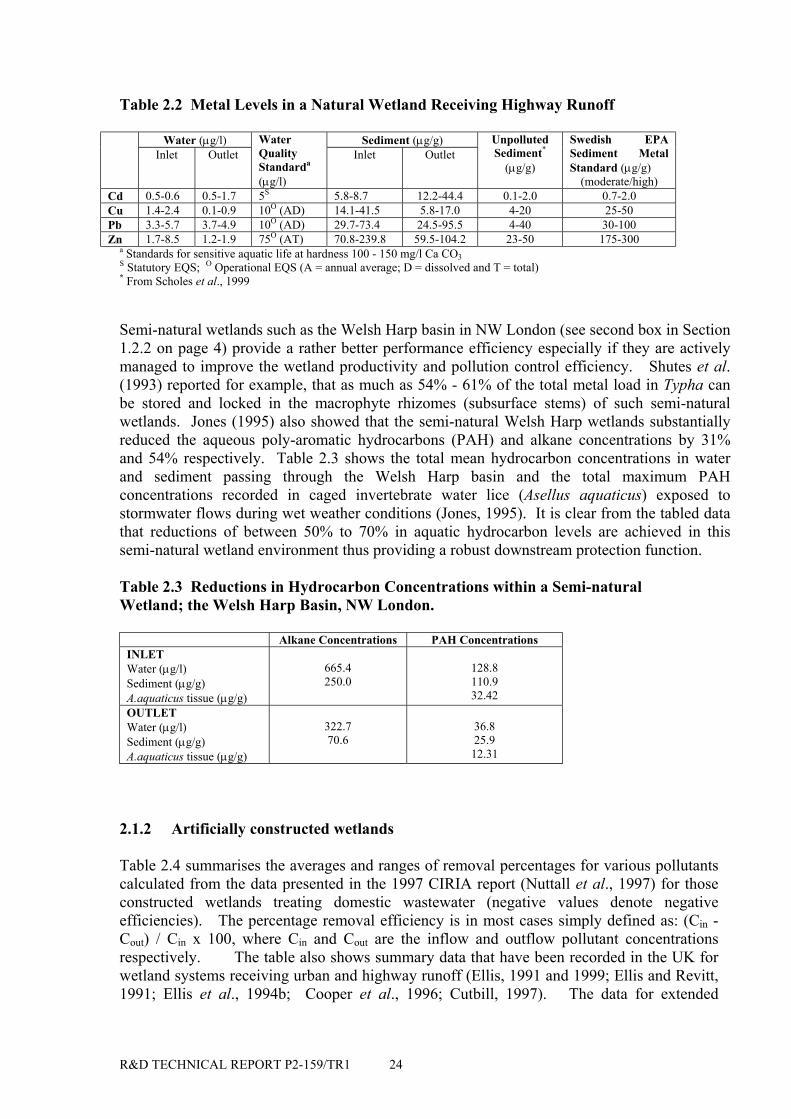
R&D TECHNICAL REPORT P2-159/TR1 24
Table 2.2 Metal Levels in a Natural Wetland Receiving Highway Runoff
Water (µg/l) Sediment (µg/g)Inlet Outlet
WaterQualityStandarda
(µg/l)
Inlet OutletUnpollutedSediment*
(µg/g)
Swedish EPASediment MetalStandard (µg/g)
(moderate/high)Cd 0.5-0.6 0.5-1.7 5S 5.8-8.7 12.2-44.4 0.1-2.0 0.7-2.0Cu 1.4-2.4 0.1-0.9 10O (AD) 14.1-41.5 5.8-17.0 4-20 25-50Pb 3.3-5.7 3.7-4.9 10O (AD) 29.7-73.4 24.5-95.5 4-40 30-100Zn 1.7-8.5 1.2-1.9 75O (AT) 70.8-239.8 59.5-104.2 23-50 175-300
a Standards for sensitive aquatic life at hardness 100 - 150 mg/l Ca CO3S Statutory EQS; O Operational EQS (A = annual average; D = dissolved and T = total)* From Scholes et al., 1999
Semi-natural wetlands such as the Welsh Harp basin in NW London (see second box in Section1.2.2 on page 4) provide a rather better performance efficiency especially if they are activelymanaged to improve the wetland productivity and pollution control efficiency. Shutes et al.(1993) reported for example, that as much as 54% - 61% of the total metal load in Typha canbe stored and locked in the macrophyte rhizomes (subsurface stems) of such semi-naturalwetlands. Jones (1995) also showed that the semi-natural Welsh Harp wetlands substantiallyreduced the aqueous poly-aromatic hydrocarbons (PAH) and alkane concentrations by 31%and 54% respectively. Table 2.3 shows the total mean hydrocarbon concentrations in waterand sediment passing through the Welsh Harp basin and the total maximum PAHconcentrations recorded in caged invertebrate water lice (Asellus aquaticus) exposed tostormwater flows during wet weather conditions (Jones, 1995). It is clear from the tabled datathat reductions of between 50% to 70% in aquatic hydrocarbon levels are achieved in thissemi-natural wetland environment thus providing a robust downstream protection function.
Table 2.3 Reductions in Hydrocarbon Concentrations within a Semi-naturalWetland; the Welsh Harp Basin, NW London.
Alkane Concentrations PAH ConcentrationsINLETWater (µg/l)Sediment (µg/g)A.aquaticus tissue (µg/g)
665.4250.0
128.8110.932.42
OUTLETWater (µg/l)Sediment (µg/g)A.aquaticus tissue (µg/g)
322.770.6
36.825.912.31
2.1.2 Artificially constructed wetlands
Table 2.4 summarises the averages and ranges of removal percentages for various pollutantscalculated from the data presented in the 1997 CIRIA report (Nuttall et al., 1997) for thoseconstructed wetlands treating domestic wastewater (negative values denote negativeefficiencies). The percentage removal efficiency is in most cases simply defined as: (Cin -Cout) / Cin x 100, where Cin and Cout are the inflow and outflow pollutant concentrationsrespectively. The table also shows summary data that have been recorded in the UK forwetland systems receiving urban and highway runoff (Ellis, 1991 and 1999; Ellis and Revitt,1991; Ellis et al., 1994b; Cooper et al., 1996; Cutbill, 1997). The data for extended
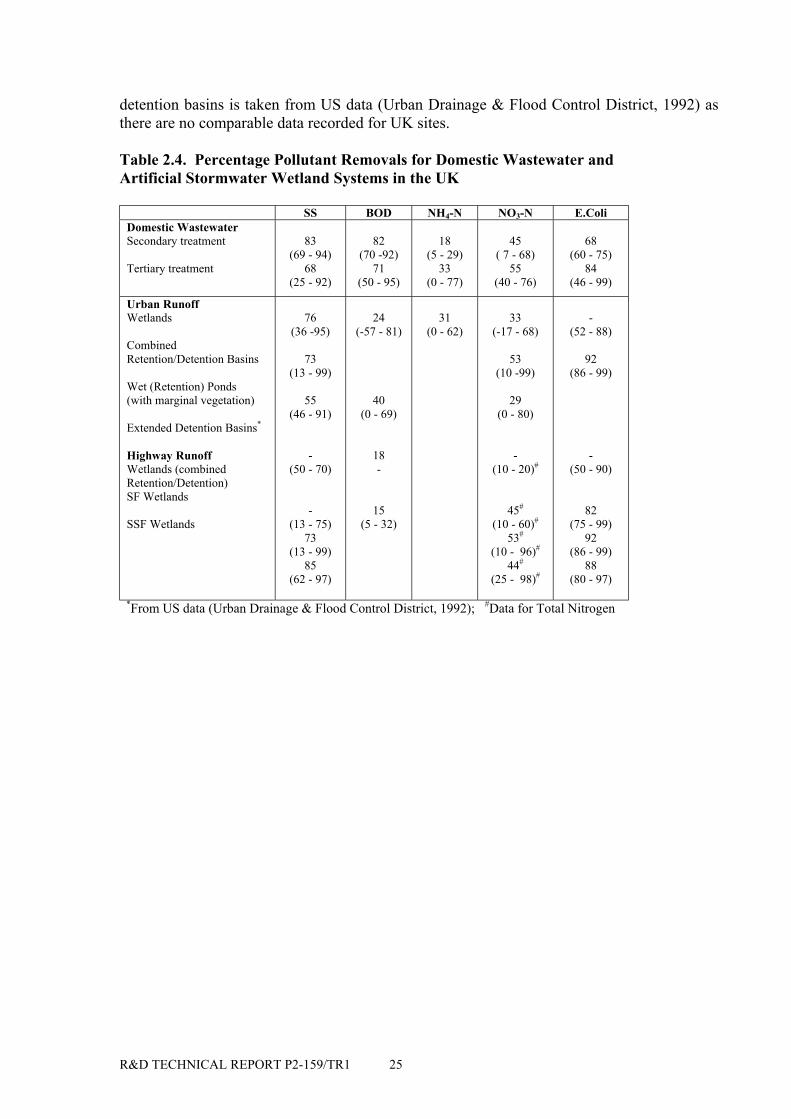
R&D TECHNICAL REPORT P2-159/TR1 25
detention basins is taken from US data (Urban Drainage & Flood Control District, 1992) asthere are no comparable data recorded for UK sites.
Table 2.4. Percentage Pollutant Removals for Domestic Wastewater andArtificial Stormwater Wetland Systems in the UK
SS BOD NH4-N NO3-N E.ColiDomestic WastewaterSecondary treatment
Tertiary treatment
83(69 - 94)
68(25 - 92)
82(70 -92)
71(50 - 95)
18(5 - 29)
33(0 - 77)
45( 7 - 68)
55(40 - 76)
68(60 - 75)
84(46 - 99)
Urban RunoffWetlands
CombinedRetention/Detention Basins
Wet (Retention) Ponds(with marginal vegetation)
Extended Detention Basins*
Highway RunoffWetlands (combinedRetention/Detention)SF Wetlands
SSF Wetlands
76(36 -95)
73(13 - 99)
55(46 - 91)
-(50 - 70)
-(13 - 75)
73(13 - 99)
85(62 - 97)
24(-57 - 81)
40(0 - 69)
18-
15(5 - 32)
31(0 - 62)
33(-17 - 68)
53(10 -99)
29(0 - 80)
-(10 - 20)#
45#
(10 - 60)#
53#
(10 - 96)#
44#
(25 - 98)#
-(52 - 88)
92(86 - 99)
-(50 - 90)
82(75 - 99)
92(86 - 99)
88(80 - 97)
*From US data (Urban Drainage & Flood Control District, 1992); #Data for Total Nitrogen
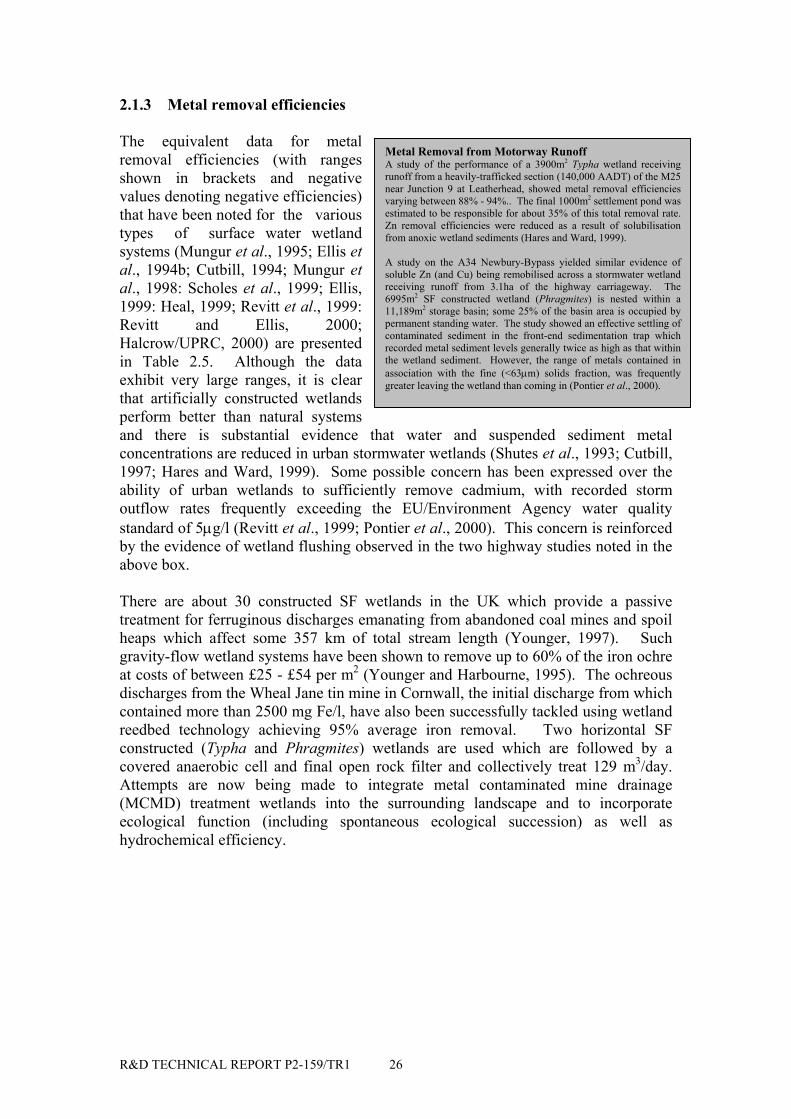
R&D TECHNICAL REPORT P2-159/TR1 26
Metal Removal from Motorway RunoffA study of the performance of a 3900m2 Typha wetland receivingrunoff from a heavily-trafficked section (140,000 AADT) of the M25near Junction 9 at Leatherhead, showed metal removal efficienciesvarying between 88% - 94%.. The final 1000m2 settlement pond wasestimated to be responsible for about 35% of this total removal rate.Zn removal efficiencies were reduced as a result of solubilisationfrom anoxic wetland sediments (Hares and Ward, 1999).
A study on the A34 Newbury-Bypass yielded similar evidence ofsoluble Zn (and Cu) being remobilised across a stormwater wetlandreceiving runoff from 3.1ha of the highway carriageway. The6995m2 SF constructed wetland (Phragmites) is nested within a11,189m2 storage basin; some 25% of the basin area is occupied bypermanent standing water. The study showed an effective settling ofcontaminated sediment in the front-end sedimentation trap whichrecorded metal sediment levels generally twice as high as that withinthe wetland sediment. However, the range of metals contained inassociation with the fine (<63µm) solids fraction, was frequentlygreater leaving the wetland than coming in (Pontier et al., 2000).
2.1.3 Metal removal efficiencies
The equivalent data for metalremoval efficiencies (with rangesshown in brackets and negativevalues denoting negative efficiencies)that have been noted for the varioustypes of surface water wetlandsystems (Mungur et al., 1995; Ellis etal., 1994b; Cutbill, 1994; Mungur etal., 1998: Scholes et al., 1999; Ellis,1999: Heal, 1999; Revitt et al., 1999:Revitt and Ellis, 2000;Halcrow/UPRC, 2000) are presentedin Table 2.5. Although the dataexhibit very large ranges, it is clearthat artificially constructed wetlandsperform better than natural systemsand there is substantial evidence that water and suspended sediment metalconcentrations are reduced in urban stormwater wetlands (Shutes et al., 1993; Cutbill,1997; Hares and Ward, 1999). Some possible concern has been expressed over theability of urban wetlands to sufficiently remove cadmium, with recorded stormoutflow rates frequently exceeding the EU/Environment Agency water qualitystandard of 5µg/l (Revitt et al., 1999; Pontier et al., 2000). This concern is reinforcedby the evidence of wetland flushing observed in the two highway studies noted in theabove box.
There are about 30 constructed SF wetlands in the UK which provide a passivetreatment for ferruginous discharges emanating from abandoned coal mines and spoilheaps which affect some 357 km of total stream length (Younger, 1997). Suchgravity-flow wetland systems have been shown to remove up to 60% of the iron ochreat costs of between £25 - £54 per m2 (Younger and Harbourne, 1995). The ochreousdischarges from the Wheal Jane tin mine in Cornwall, the initial discharge from whichcontained more than 2500 mg Fe/l, have also been successfully tackled using wetlandreedbed technology achieving 95% average iron removal. Two horizontal SFconstructed (Typha and Phragmites) wetlands are used which are followed by acovered anaerobic cell and final open rock filter and collectively treat 129 m3/day.Attempts are now being made to integrate metal contaminated mine drainage(MCMD) treatment wetlands into the surrounding landscape and to incorporateecological function (including spontaneous ecological succession) as well ashydrochemical efficiency.
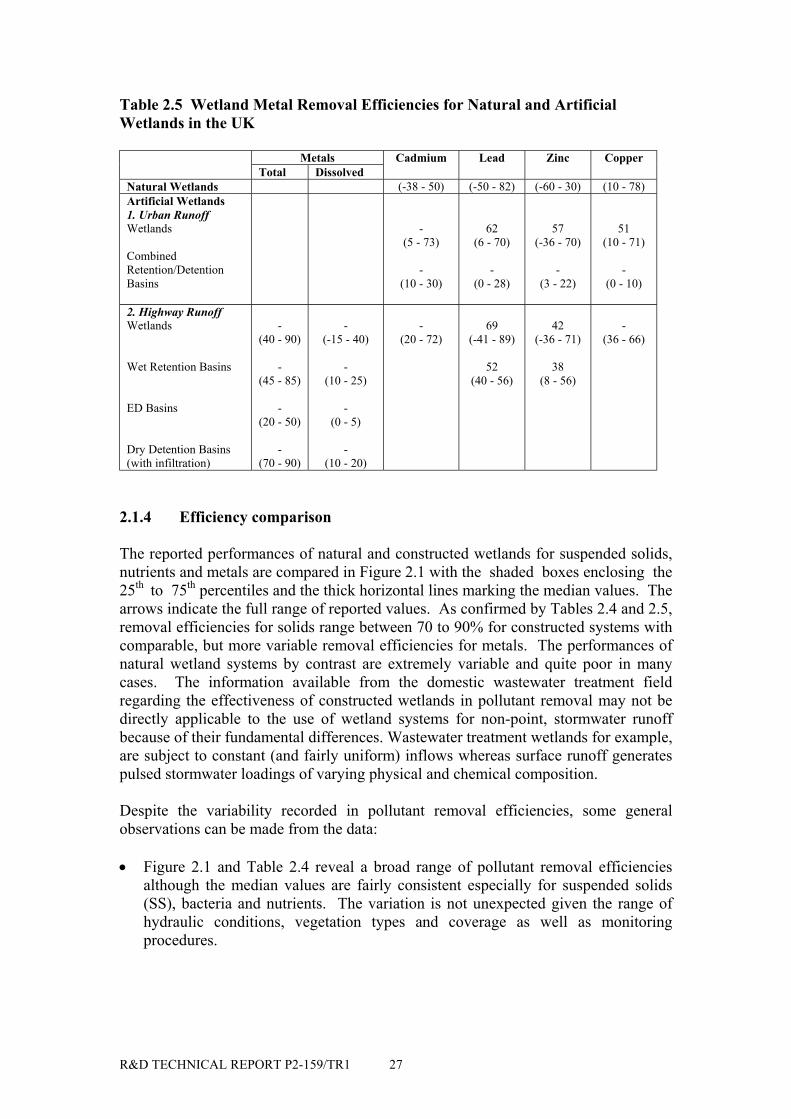
R&D TECHNICAL REPORT P2-159/TR1 27
Table 2.5 Wetland Metal Removal Efficiencies for Natural and ArtificialWetlands in the UK
MetalsTotal Dissolved
Cadmium Lead Zinc Copper
Natural Wetlands (-38 - 50) (-50 - 82) (-60 - 30) (10 - 78)Artificial Wetlands1. Urban RunoffWetlands
CombinedRetention/DetentionBasins
-(5 - 73)
-(10 - 30)
62(6 - 70)
-(0 - 28)
57(-36 - 70)
-(3 - 22)
51(10 - 71)
-(0 - 10)
2. Highway RunoffWetlands
Wet Retention Basins
ED Basins
Dry Detention Basins(with infiltration)
-(40 - 90)
-(45 - 85)
-(20 - 50)
-(70 - 90)
-(-15 - 40)
-(10 - 25)
-(0 - 5)
-(10 - 20)
-(20 - 72)
69(-41 - 89)
52(40 - 56)
42(-36 - 71)
38(8 - 56)
-(36 - 66)
2.1.4 Efficiency comparison
The reported performances of natural and constructed wetlands for suspended solids,nutrients and metals are compared in Figure 2.1 with the shaded boxes enclosing the25th to 75th percentiles and the thick horizontal lines marking the median values. Thearrows indicate the full range of reported values. As confirmed by Tables 2.4 and 2.5,removal efficiencies for solids range between 70 to 90% for constructed systems withcomparable, but more variable removal efficiencies for metals. The performances ofnatural wetland systems by contrast are extremely variable and quite poor in manycases. The information available from the domestic wastewater treatment fieldregarding the effectiveness of constructed wetlands in pollutant removal may not bedirectly applicable to the use of wetland systems for non-point, stormwater runoffbecause of their fundamental differences. Wastewater treatment wetlands for example,are subject to constant (and fairly uniform) inflows whereas surface runoff generatespulsed stormwater loadings of varying physical and chemical composition.
Despite the variability recorded in pollutant removal efficiencies, some generalobservations can be made from the data:
• Figure 2.1 and Table 2.4 reveal a broad range of pollutant removal efficienciesalthough the median values are fairly consistent especially for suspended solids(SS), bacteria and nutrients. The variation is not unexpected given the range ofhydraulic conditions, vegetation types and coverage as well as monitoringprocedures.
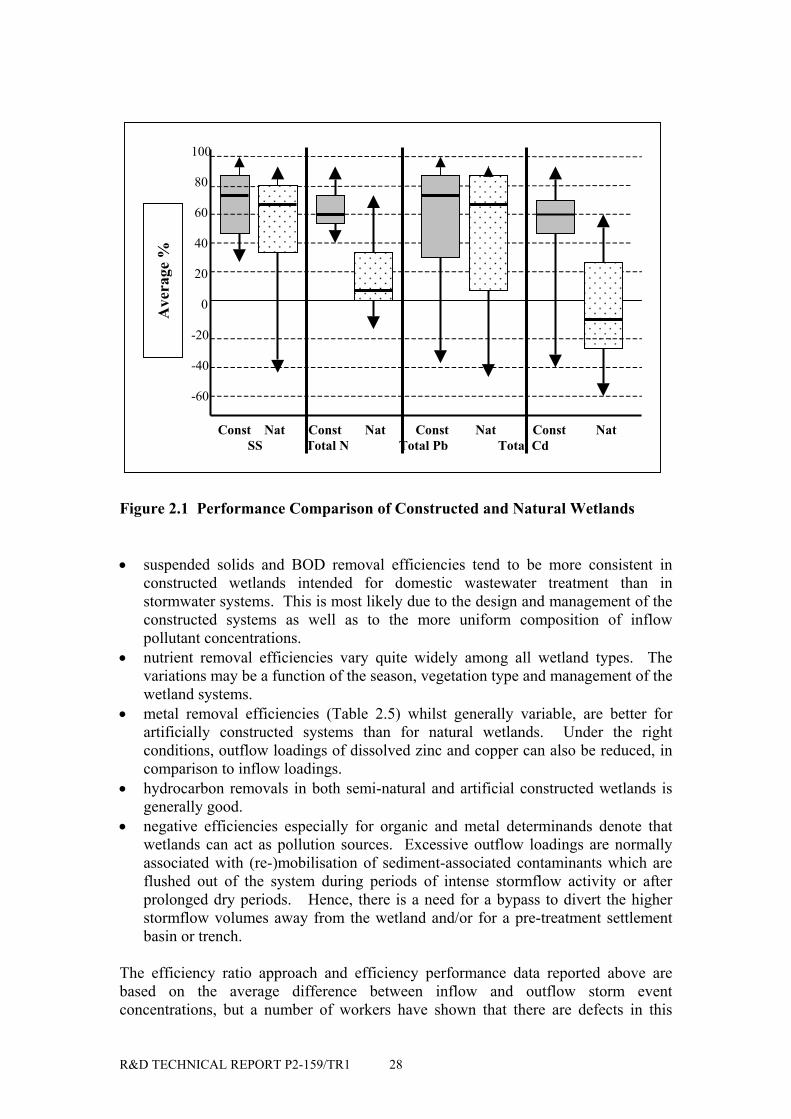
R&D TECHNICAL REPORT P2-159/TR1 28
Figure 2.1 Performance Comparison of Constructed and Natural Wetlands
• suspended solids and BOD removal efficiencies tend to be more consistent inconstructed wetlands intended for domestic wastewater treatment than instormwater systems. This is most likely due to the design and management of theconstructed systems as well as to the more uniform composition of inflowpollutant concentrations.
• nutrient removal efficiencies vary quite widely among all wetland types. Thevariations may be a function of the season, vegetation type and management of thewetland systems.
• metal removal efficiencies (Table 2.5) whilst generally variable, are better forartificially constructed systems than for natural wetlands. Under the rightconditions, outflow loadings of dissolved zinc and copper can also be reduced, incomparison to inflow loadings.
• hydrocarbon removals in both semi-natural and artificial constructed wetlands isgenerally good.
• negative efficiencies especially for organic and metal determinands denote thatwetlands can act as pollution sources. Excessive outflow loadings are normallyassociated with (re-)mobilisation of sediment-associated contaminants which areflushed out of the system during periods of intense stormflow activity or afterprolonged dry periods. Hence, there is a need for a bypass to divert the higherstormflow volumes away from the wetland and/or for a pre-treatment settlementbasin or trench.
The efficiency ratio approach and efficiency performance data reported above arebased on the average difference between inflow and outflow storm eventconcentrations, but a number of workers have shown that there are defects in this
100
80
60
40
20
0
-20
-40
-60
Const Nat Const Nat Const Nat Const Nat SS Total N Total Pb Total Cd
Ave
rage
%
R&D TECHNICAL REPORT P2-159/TR1 29
methodology especially when inflow concentrations are low (Strecker et al., 2001).For example, a wet retention basin experiencing 500 mg/l TSS in the inflow and100mg/l in the outflow would yield a higher pollutant removal efficiency than awetland having 100 mg/l and 20 mg/l in the influent and effluent respectively. Yetthe final water quality for the latter device is clearly superior and would provide moreeffective and efficient protection of the receiving water. This example points out theneed to think carefully about whether pollutant removal efficiency, particularly whenexpressed only as percentage removal, is providing an accurate representation of howeffective a performance is being provided by a SuDS facility. The percentageremoval term is probably only really appropriate for sites and SuDS facilities subjectto high pollutant input concentrations. In addition, given the dynamic nature of flowinto and out of a wetland basin having a permanent mixing pool, the recorded inflowand outflow concentrations are not normally contemporaneous i.e not generated bythe same storm event.
A better and certainly more rigorous approach to measuring efficiency andperformance effectiveness, would be to derive a normal probability plot of the inflowand outflow pollutant event mean concentrations (EMCs) and match the latterdistribution against set (or target) receiving water quality standards (or any dischargeconsent conditions). This would enable the determination of the exceedanceprobabilities of target standards for differing flow conditions and/or return periods.This is the basis on which the efficiency of various BMPs included within the USEnvironmental Protection Agency (EPA) National Stormwater Best ManagementPractices Database will be evaluated (Urban Water Resources Research Council andURS Greiner Woodward Clyde, 1999). This statistical methodology would alsoenable anomalous results to be identified a well as determining whether a smallnumber of large storms are biasing the resulting overall efficiency value. Figure 2.2illustrates the approach with inflow and outflow EMC values recorded either side ofthe central vertical line. The box plots indicate the inflow/outflow range, medians andquartile values. When measured against a receiving water quality target standard (ordischarge consent) of 30 mg/l TSS, it is clear that the wetland system is providing anextremely satisfactory performance efficiency, with an overall outflow median valueof 4.1 mg/l Total Suspended Solids (TSS). The probability of exceeding the targetstandard is less than 2%.
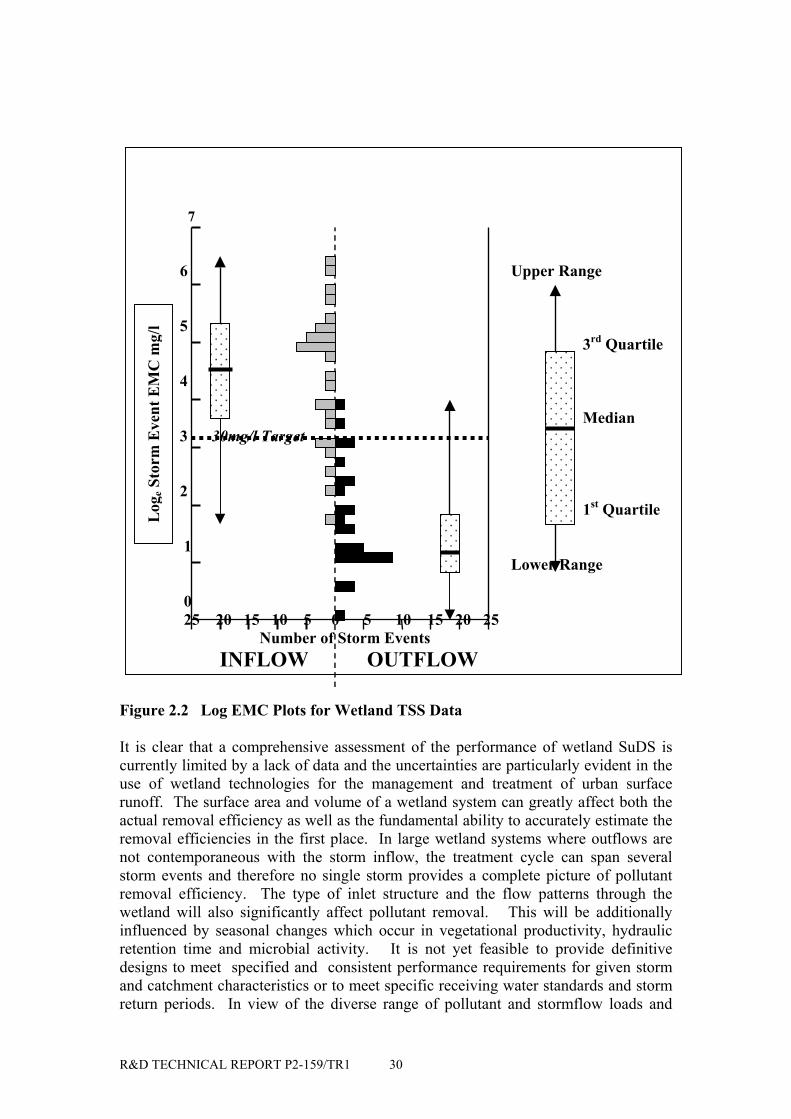
R&D TECHNICAL REPORT P2-159/TR1 30
7
6 Upper Range
5 3rd Quartile
4
Median 3 30mg/l Target
2 1st Quartile
1 Lower Range
0 25 20 15 10 5 0 5 10 15 20 25 Number of Storm Events INFLOW OUTFLOW
Figure 2.2 Log EMC Plots for Wetland TSS Data
It is clear that a comprehensive assessment of the performance of wetland SuDS iscurrently limited by a lack of data and the uncertainties are particularly evident in theuse of wetland technologies for the management and treatment of urban surfacerunoff. The surface area and volume of a wetland system can greatly affect both theactual removal efficiency as well as the fundamental ability to accurately estimate theremoval efficiencies in the first place. In large wetland systems where outflows arenot contemporaneous with the storm inflow, the treatment cycle can span severalstorm events and therefore no single storm provides a complete picture of pollutantremoval efficiency. The type of inlet structure and the flow patterns through thewetland will also significantly affect pollutant removal. This will be additionallyinfluenced by seasonal changes which occur in vegetational productivity, hydraulicretention time and microbial activity. It is not yet feasible to provide definitivedesigns to meet specified and consistent performance requirements for given stormand catchment characteristics or to meet specific receiving water standards and stormreturn periods. In view of the diverse range of pollutant and stormflow loads and
Log
e Sto
rm E
vent
EM
C m
g/l
R&D TECHNICAL REPORT P2-159/TR1 31
reduction requirements, as well as the local physical, social and economic constraints,the design, operation and maintenance requirements will also tend to be site specific.
Nevertheless, whilst accepting this qualification, it is still possible from the data andinformation currently available to broadly identify representative pollutant removaland flow attenuation capacities for various sustainable urban drainage optionsincluding wetland systems. Table 2.6 attempts to summarise these capabilities andprovide an overview of the potential performances that each wetland option might bereasonably expected to achieve. The various SuDS designs undoubtedly vary in theirability to reduce the different types of pollution arising from urban developmentalthough each can also offer additional environmental benefits. It is thereforeimportant that the designer, developer and regulator establish what the general and/orspecific objectives are before selecting a particular SuDS type. After establishingwhat the flood control, water quality and amenity objectives are, an analysis is thenrequired of what is feasible on a particular site given the characteristic physical,meteorological, economic and institutional constraints.
2.1.5 An international perspective
A review of data reported from overseas studies broadly confirms the findings arisingfrom the UK wetland database. Strecker et al., (1992) have analysed the results from26 studies conducted on constructed urban wetland systems in the US. Although goodto high pollutant removal efficiencies were observed, the analysis identified theinherent random nature of the performance data with the absence of any meaningfuldirect relationships between performance and catchment parameters (Table 2.7) orwith basin/runoff volumes. However, the WWAR and DAR values (see notes belowTable 2.7), are very close to those recommended by European workers who haveadvocated for example, WWAR ratios of 2 - 3% and wetland basin volumes (Vb)equal to 4 to 6 times the mean storm runoff volume (Vr) (Hvitved-Jacobsen, 1990;Ellis, 1999).
Table 2.7 Reported Removal Rates for US Stormwater Constructed Wetlands
Pollutant Removal RatesSS NH3 TP Pb Zn
WWAR
DAR
Median 80.5% 44.5% 58.0% 83.0% 42.0% 3.65% 31.0
CV 27.7% 49.4% 48.5% 56.1% 38.8% 94.6% 156.2%
Average 77.1% 39.7% 57.2% 63.8% 48.7% 4.26% 131.0 WWAR = % ratio of wetland surface area to catchment area DAR = Drainage Area Ratio CV = Coefficient of Variation
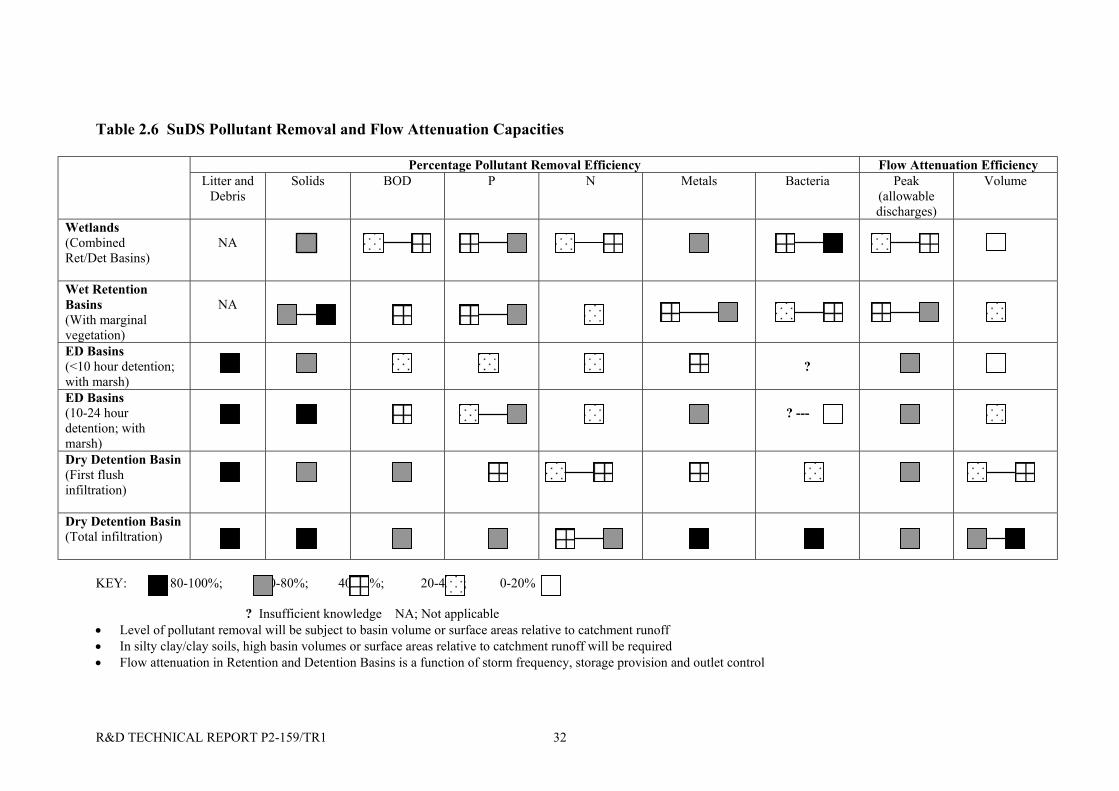
R&D TECHNICAL REPORT P2-159/TR1 32
Table 2.6 SuDS Pollutant Removal and Flow Attenuation Capacities
Percentage Pollutant Removal Efficiency Flow Attenuation EfficiencyLitter and
DebrisSolids BOD P N Metals Bacteria Peak
(allowabledischarges)
Volume
Wetlands(CombinedRet/Det Basins)
NA
Wet RetentionBasins(With marginalvegetation)
NA
ED Basins(<10 hour detention;with marsh)
?
ED Basins(10-24 hourdetention; withmarsh)
? ---
Dry Detention Basin(First flushinfiltration)
Dry Detention Basin(Total infiltration)
KEY: 80-100%; 60-80%; 40-60%; 20-40%; 0-20%
? Insufficient knowledge NA; Not applicable• Level of pollutant removal will be subject to basin volume or surface areas relative to catchment runoff• In silty clay/clay soils, high basin volumes or surface areas relative to catchment runoff will be required• Flow attenuation in Retention and Detention Basins is a function of storm frequency, storage provision and outlet control
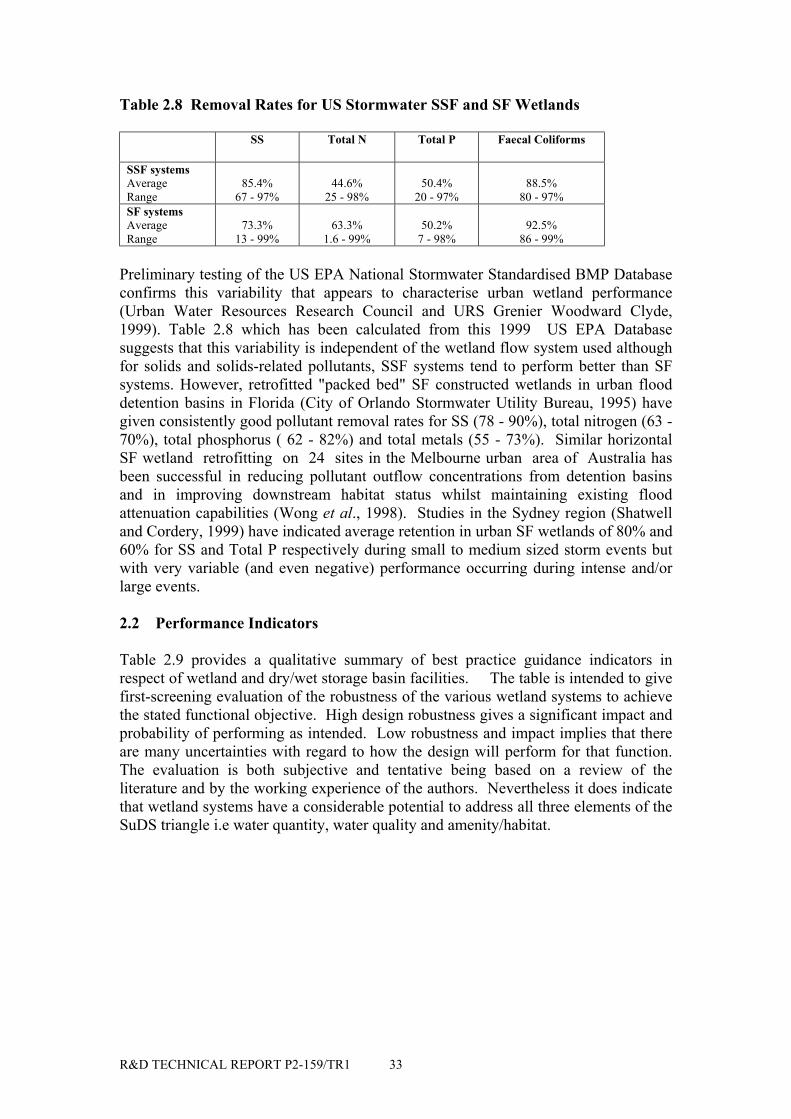
R&D TECHNICAL REPORT P2-159/TR1 33
Table 2.8 Removal Rates for US Stormwater SSF and SF Wetlands
SS Total N Total P Faecal Coliforms
SSF systemsAverageRange
85.4%67 - 97%
44.6%25 - 98%
50.4%20 - 97%
88.5%80 - 97%
SF systemsAverageRange
73.3%13 - 99%
63.3%1.6 - 99%
50.2%7 - 98%
92.5%86 - 99%
Preliminary testing of the US EPA National Stormwater Standardised BMP Databaseconfirms this variability that appears to characterise urban wetland performance(Urban Water Resources Research Council and URS Grenier Woodward Clyde,1999). Table 2.8 which has been calculated from this 1999 US EPA Databasesuggests that this variability is independent of the wetland flow system used althoughfor solids and solids-related pollutants, SSF systems tend to perform better than SFsystems. However, retrofitted "packed bed" SF constructed wetlands in urban flooddetention basins in Florida (City of Orlando Stormwater Utility Bureau, 1995) havegiven consistently good pollutant removal rates for SS (78 - 90%), total nitrogen (63 -70%), total phosphorus ( 62 - 82%) and total metals (55 - 73%). Similar horizontalSF wetland retrofitting on 24 sites in the Melbourne urban area of Australia hasbeen successful in reducing pollutant outflow concentrations from detention basinsand in improving downstream habitat status whilst maintaining existing floodattenuation capabilities (Wong et al., 1998). Studies in the Sydney region (Shatwelland Cordery, 1999) have indicated average retention in urban SF wetlands of 80% and60% for SS and Total P respectively during small to medium sized storm events butwith very variable (and even negative) performance occurring during intense and/orlarge events.
2.2 Performance Indicators
Table 2.9 provides a qualitative summary of best practice guidance indicators inrespect of wetland and dry/wet storage basin facilities. The table is intended to givefirst-screening evaluation of the robustness of the various wetland systems to achievethe stated functional objective. High design robustness gives a significant impact andprobability of performing as intended. Low robustness and impact implies that thereare many uncertainties with regard to how the design will perform for that function.The evaluation is both subjective and tentative being based on a review of theliterature and by the working experience of the authors. Nevertheless it does indicatethat wetland systems have a considerable potential to address all three elements of theSuDS triangle i.e water quantity, water quality and amenity/habitat.
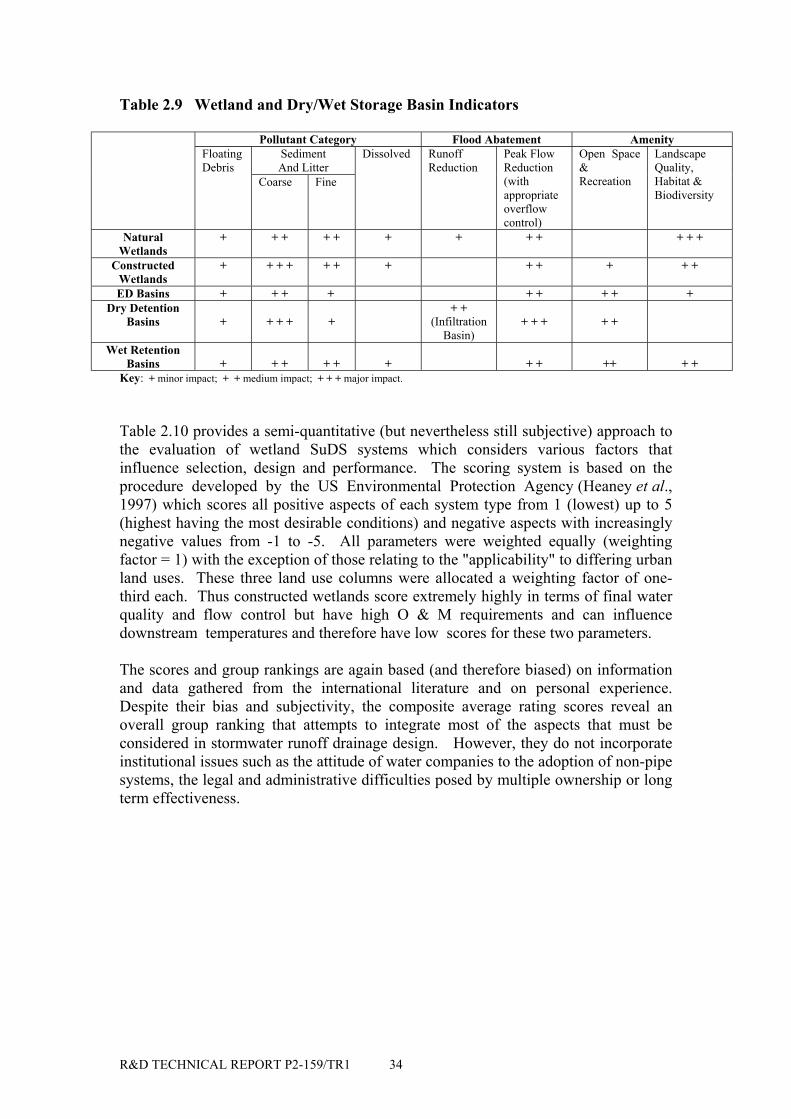
R&D TECHNICAL REPORT P2-159/TR1 34
Table 2.9 Wetland and Dry/Wet Storage Basin Indicators
Pollutant Category Flood Abatement AmenitySedimentAnd Litter
FloatingDebris
Coarse Fine
Dissolved RunoffReduction
Peak FlowReduction(withappropriateoverflowcontrol)
Open Space&Recreation
LandscapeQuality,Habitat &Biodiversity
NaturalWetlands
+ + + + + + + + + + + +
ConstructedWetlands
+ + + + + + + + + + + +
ED Basins + + + + + + + + +Dry Detention
Basins + + + + ++ +
(InfiltrationBasin)
+ + + + +
Wet RetentionBasins + + + + + + + + ++ + +
Key: + minor impact; + + medium impact; + + + major impact.
Table 2.10 provides a semi-quantitative (but nevertheless still subjective) approach tothe evaluation of wetland SuDS systems which considers various factors thatinfluence selection, design and performance. The scoring system is based on theprocedure developed by the US Environmental Protection Agency (Heaney et al.,1997) which scores all positive aspects of each system type from 1 (lowest) up to 5(highest having the most desirable conditions) and negative aspects with increasinglynegative values from -1 to -5. All parameters were weighted equally (weightingfactor = 1) with the exception of those relating to the "applicability" to differing urbanland uses. These three land use columns were allocated a weighting factor of one-third each. Thus constructed wetlands score extremely highly in terms of final waterquality and flow control but have high O & M requirements and can influencedownstream temperatures and therefore have low scores for these two parameters.
The scores and group rankings are again based (and therefore biased) on informationand data gathered from the international literature and on personal experience.Despite their bias and subjectivity, the composite average rating scores reveal anoverall group ranking that attempts to integrate most of the aspects that must beconsidered in stormwater runoff drainage design. However, they do not incorporateinstitutional issues such as the attitude of water companies to the adoption of non-pipesystems, the legal and administrative difficulties posed by multiple ownership or longterm effectiveness.
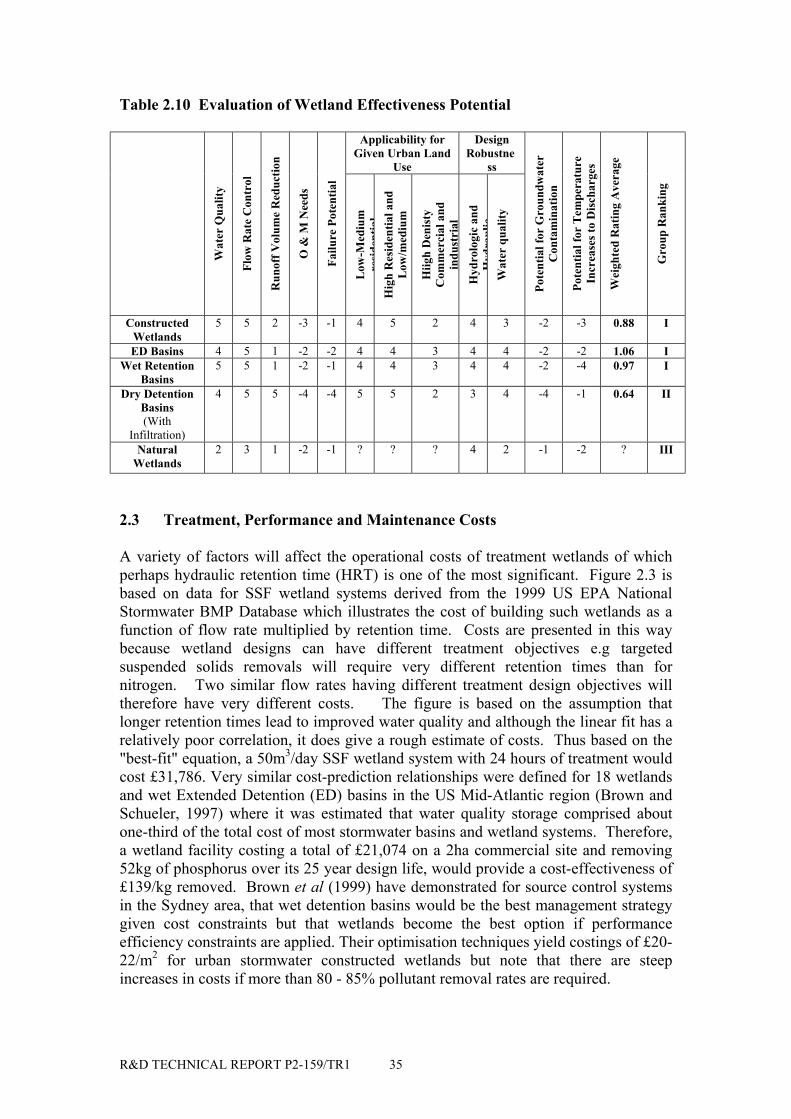
R&D TECHNICAL REPORT P2-159/TR1 35
Table 2.10 Evaluation of Wetland Effectiveness Potential
Applicability forGiven Urban Land
Use
DesignRobustne
ss
Wat
er Q
ualit
y
Flow
Rat
e C
ontr
ol
Run
off V
olum
e R
educ
tion
O &
M N
eeds
Failu
re P
oten
tial
Low
-Med
ium
resi
dent
ial
Hig
h R
esid
entia
l and
Low
/med
ium
Hiig
h D
enis
tyC
omm
erci
al a
ndin
dust
rial
Hyd
rolo
gic
and
Hyd
raul
icW
ater
qua
lity
Pote
ntia
l for
Gro
undw
ater
Con
tam
inat
ion
Pote
ntia
l for
Tem
pera
ture
Incr
ease
s to
Dis
char
ges
Wei
ghte
d R
atin
g A
vera
ge
Gro
up R
anki
ng
ConstructedWetlands
5 5 2 -3 -1 4 5 2 4 3 -2 -3 0.88 I
ED Basins 4 5 1 -2 -2 4 4 3 4 4 -2 -2 1.06 IWet Retention
Basins5 5 1 -2 -1 4 4 3 4 4 -2 -4 0.97 I
Dry DetentionBasins(With
Infiltration)
4 5 5 -4 -4 5 5 2 3 4 -4 -1 0.64 II
NaturalWetlands
2 3 1 -2 -1 ? ? ? 4 2 -1 -2 ? III
2.3 Treatment, Performance and Maintenance Costs
A variety of factors will affect the operational costs of treatment wetlands of whichperhaps hydraulic retention time (HRT) is one of the most significant. Figure 2.3 isbased on data for SSF wetland systems derived from the 1999 US EPA NationalStormwater BMP Database which illustrates the cost of building such wetlands as afunction of flow rate multiplied by retention time. Costs are presented in this waybecause wetland designs can have different treatment objectives e.g targetedsuspended solids removals will require very different retention times than fornitrogen. Two similar flow rates having different treatment design objectives willtherefore have very different costs. The figure is based on the assumption thatlonger retention times lead to improved water quality and although the linear fit has arelatively poor correlation, it does give a rough estimate of costs. Thus based on the"best-fit" equation, a 50m3/day SSF wetland system with 24 hours of treatment wouldcost £31,786. Very similar cost-prediction relationships were defined for 18 wetlandsand wet Extended Detention (ED) basins in the US Mid-Atlantic region (Brown andSchueler, 1997) where it was estimated that water quality storage comprised aboutone-third of the total cost of most stormwater basins and wetland systems. Therefore,a wetland facility costing a total of £21,074 on a 2ha commercial site and removing52kg of phosphorus over its 25 year design life, would provide a cost-effectiveness of£139/kg removed. Brown et al (1999) have demonstrated for source control systemsin the Sydney area, that wet detention basins would be the best management strategygiven cost constraints but that wetlands become the best option if performanceefficiency constraints are applied. Their optimisation techniques yield costings of £20-22/m2 for urban stormwater constructed wetlands but note that there are steepincreases in costs if more than 80 - 85% pollutant removal rates are required.
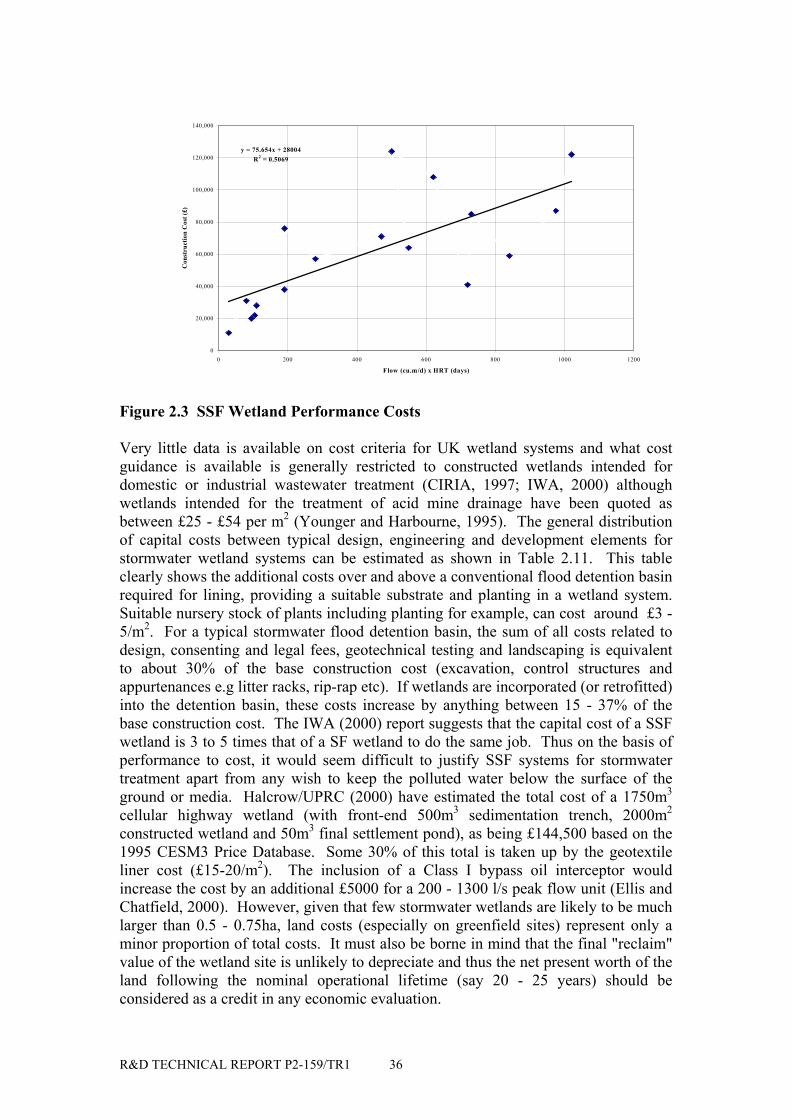
R&D TECHNICAL REPORT P2-159/TR1 36
y = 75.654x + 28004R2 = 0.5069
0
20,000
40,000
60,000
80,000
100,000
120,000
140,000
0 200 400 600 800 1000 1200
Flow (cu.m/d) x HRT (days)
Con
stru
ctio
n C
ost (
£)
Figure 2.3 SSF Wetland Performance Costs
Very little data is available on cost criteria for UK wetland systems and what costguidance is available is generally restricted to constructed wetlands intended fordomestic or industrial wastewater treatment (CIRIA, 1997; IWA, 2000) althoughwetlands intended for the treatment of acid mine drainage have been quoted asbetween £25 - £54 per m2 (Younger and Harbourne, 1995). The general distributionof capital costs between typical design, engineering and development elements forstormwater wetland systems can be estimated as shown in Table 2.11. This tableclearly shows the additional costs over and above a conventional flood detention basinrequired for lining, providing a suitable substrate and planting in a wetland system.Suitable nursery stock of plants including planting for example, can cost around £3 -5/m2. For a typical stormwater flood detention basin, the sum of all costs related todesign, consenting and legal fees, geotechnical testing and landscaping is equivalentto about 30% of the base construction cost (excavation, control structures andappurtenances e.g litter racks, rip-rap etc). If wetlands are incorporated (or retrofitted)into the detention basin, these costs increase by anything between 15 - 37% of thebase construction cost. The IWA (2000) report suggests that the capital cost of a SSFwetland is 3 to 5 times that of a SF wetland to do the same job. Thus on the basis ofperformance to cost, it would seem difficult to justify SSF systems for stormwatertreatment apart from any wish to keep the polluted water below the surface of theground or media. Halcrow/UPRC (2000) have estimated the total cost of a 1750m3
cellular highway wetland (with front-end 500m3 sedimentation trench, 2000m2
constructed wetland and 50m3 final settlement pond), as being £144,500 based on the1995 CESM3 Price Database. Some 30% of this total is taken up by the geotextileliner cost (£15-20/m2). The inclusion of a Class I bypass oil interceptor wouldincrease the cost by an additional £5000 for a 200 - 1300 l/s peak flow unit (Ellis andChatfield, 2000). However, given that few stormwater wetlands are likely to be muchlarger than 0.5 - 0.75ha, land costs (especially on greenfield sites) represent only aminor proportion of total costs. It must also be borne in mind that the final "reclaim"value of the wetland site is unlikely to depreciate and thus the net present worth of theland following the nominal operational lifetime (say 20 - 25 years) should beconsidered as a credit in any economic evaluation.
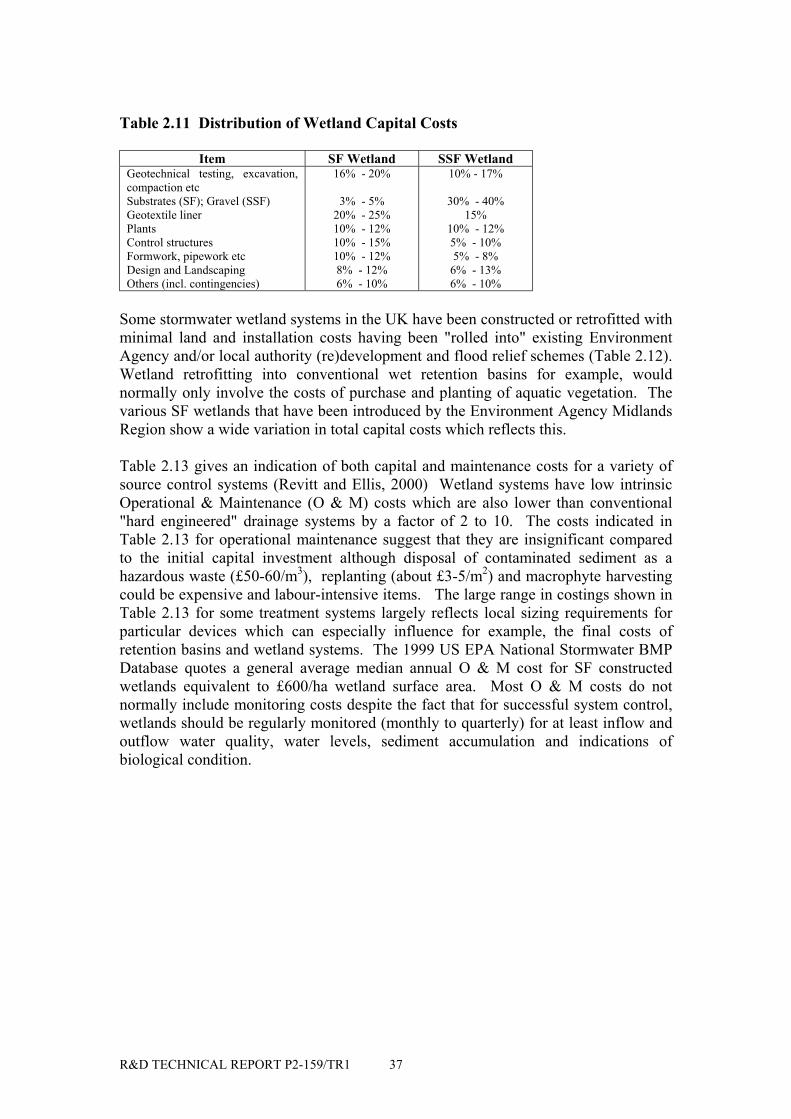
R&D TECHNICAL REPORT P2-159/TR1 37
Table 2.11 Distribution of Wetland Capital Costs
Item SF Wetland SSF WetlandGeotechnical testing, excavation,compaction etcSubstrates (SF); Gravel (SSF)Geotextile linerPlantsControl structuresFormwork, pipework etcDesign and LandscapingOthers (incl. contingencies)
16% - 20%
3% - 5%20% - 25%10% - 12%10% - 15%10% - 12%8% - 12%6% - 10%
10% - 17%
30% - 40%15%
10% - 12%5% - 10%5% - 8%
6% - 13%6% - 10%
Some stormwater wetland systems in the UK have been constructed or retrofitted withminimal land and installation costs having been "rolled into" existing EnvironmentAgency and/or local authority (re)development and flood relief schemes (Table 2.12).Wetland retrofitting into conventional wet retention basins for example, wouldnormally only involve the costs of purchase and planting of aquatic vegetation. Thevarious SF wetlands that have been introduced by the Environment Agency MidlandsRegion show a wide variation in total capital costs which reflects this.
Table 2.13 gives an indication of both capital and maintenance costs for a variety ofsource control systems (Revitt and Ellis, 2000) Wetland systems have low intrinsicOperational & Maintenance (O & M) costs which are also lower than conventional"hard engineered" drainage systems by a factor of 2 to 10. The costs indicated inTable 2.13 for operational maintenance suggest that they are insignificant comparedto the initial capital investment although disposal of contaminated sediment as ahazardous waste (£50-60/m3), replanting (about £3-5/m2) and macrophyte harvestingcould be expensive and labour-intensive items. The large range in costings shown inTable 2.13 for some treatment systems largely reflects local sizing requirements forparticular devices which can especially influence for example, the final costs ofretention basins and wetland systems. The 1999 US EPA National Stormwater BMPDatabase quotes a general average median annual O & M cost for SF constructedwetlands equivalent to £600/ha wetland surface area. Most O & M costs do notnormally include monitoring costs despite the fact that for successful system control,wetlands should be regularly monitored (monthly to quarterly) for at least inflow andoutflow water quality, water levels, sediment accumulation and indications ofbiological condition.
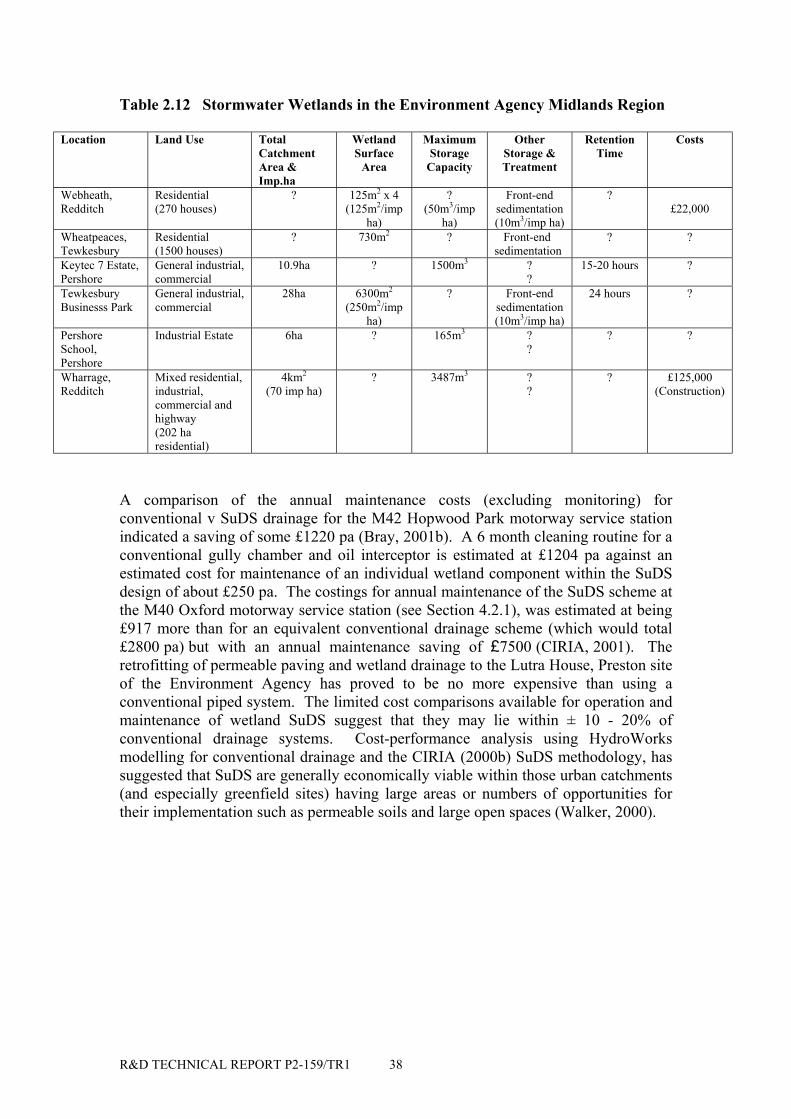
R&D TECHNICAL REPORT P2-159/TR1 38
Table 2.12 Stormwater Wetlands in the Environment Agency Midlands Region
Location Land Use TotalCatchmentArea &Imp.ha
WetlandSurface
Area
MaximumStorage
Capacity
OtherStorage &Treatment
RetentionTime
Costs
Webheath,Redditch
Residential(270 houses)
? 125m2 x 4(125m2/imp
ha)
?(50m3/imp
ha)
Front-endsedimentation(10m3/imp ha)
?£22,000
Wheatpeaces,Tewkesbury
Residential(1500 houses)
? 730m2 ? Front-endsedimentation
? ?
Keytec 7 Estate,Pershore
General industrial,commercial
10.9ha ? 1500m3 ??
15-20 hours ?
TewkesburyBusinesss Park
General industrial,commercial
28ha 6300m2
(250m2/impha)
? Front-endsedimentation(10m3/imp ha)
24 hours ?
PershoreSchool,Pershore
Industrial Estate 6ha ? 165m3 ??
? ?
Wharrage,Redditch
Mixed residential,industrial,commercial andhighway(202 haresidential)
4km2
(70 imp ha)? 3487m3 ?
?? £125,000
(Construction)
A comparison of the annual maintenance costs (excluding monitoring) forconventional v SuDS drainage for the M42 Hopwood Park motorway service stationindicated a saving of some £1220 pa (Bray, 2001b). A 6 month cleaning routine for aconventional gully chamber and oil interceptor is estimated at £1204 pa against anestimated cost for maintenance of an individual wetland component within the SuDSdesign of about £250 pa. The costings for annual maintenance of the SuDS scheme atthe M40 Oxford motorway service station (see Section 4.2.1), was estimated at being£917 more than for an equivalent conventional drainage scheme (which would total£2800 pa) but with an annual maintenance saving of £7500 (CIRIA, 2001). Theretrofitting of permeable paving and wetland drainage to the Lutra House, Preston siteof the Environment Agency has proved to be no more expensive than using aconventional piped system. The limited cost comparisons available for operation andmaintenance of wetland SuDS suggest that they may lie within ± 10 - 20% ofconventional drainage systems. Cost-performance analysis using HydroWorksmodelling for conventional drainage and the CIRIA (2000b) SuDS methodology, hassuggested that SuDS are generally economically viable within those urban catchments(and especially greenfield sites) having large areas or numbers of opportunities fortheir implementation such as permeable soils and large open spaces (Walker, 2000).
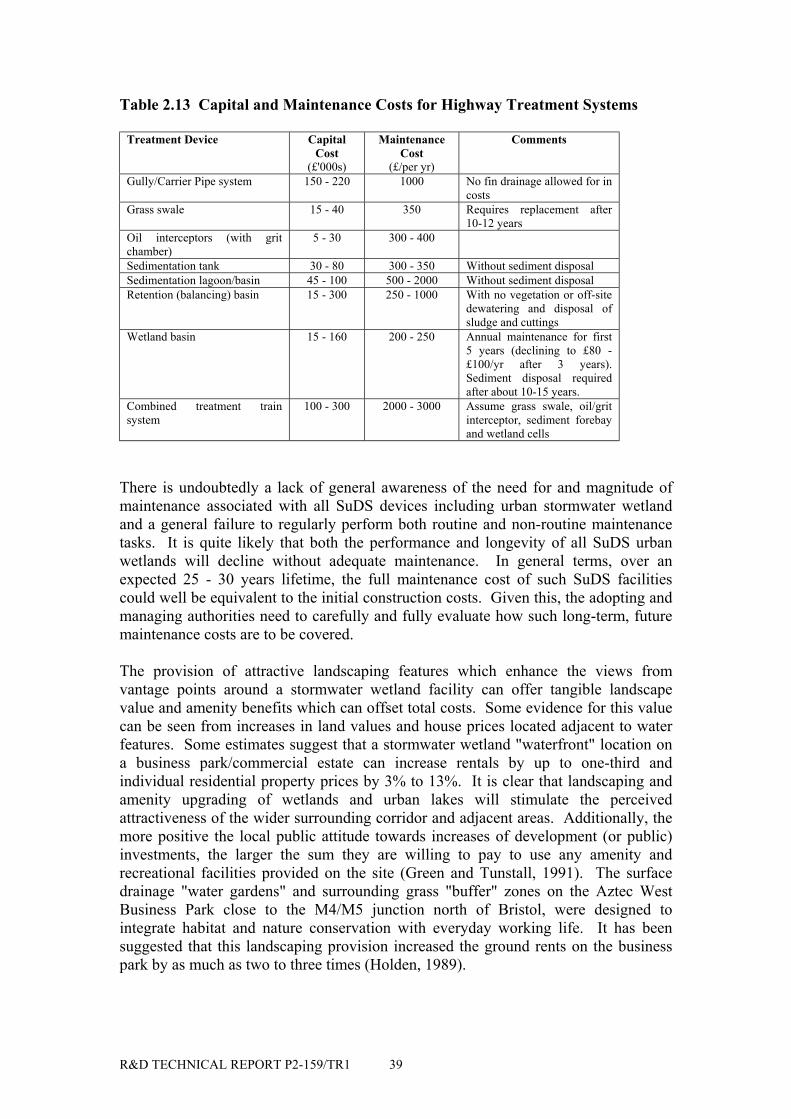
R&D TECHNICAL REPORT P2-159/TR1 39
Table 2.13 Capital and Maintenance Costs for Highway Treatment Systems
Treatment Device CapitalCost
(£'000s)
MaintenanceCost
(£/per yr)
Comments
Gully/Carrier Pipe system 150 - 220 1000 No fin drainage allowed for incosts
Grass swale 15 - 40 350 Requires replacement after10-12 years
Oil interceptors (with gritchamber)
5 - 30 300 - 400
Sedimentation tank 30 - 80 300 - 350 Without sediment disposalSedimentation lagoon/basin 45 - 100 500 - 2000 Without sediment disposalRetention (balancing) basin 15 - 300 250 - 1000 With no vegetation or off-site
dewatering and disposal ofsludge and cuttings
Wetland basin 15 - 160 200 - 250 Annual maintenance for first5 years (declining to £80 -£100/yr after 3 years).Sediment disposal requiredafter about 10-15 years.
Combined treatment trainsystem
100 - 300 2000 - 3000 Assume grass swale, oil/gritinterceptor, sediment forebayand wetland cells
There is undoubtedly a lack of general awareness of the need for and magnitude ofmaintenance associated with all SuDS devices including urban stormwater wetlandand a general failure to regularly perform both routine and non-routine maintenancetasks. It is quite likely that both the performance and longevity of all SuDS urbanwetlands will decline without adequate maintenance. In general terms, over anexpected 25 - 30 years lifetime, the full maintenance cost of such SuDS facilitiescould well be equivalent to the initial construction costs. Given this, the adopting andmanaging authorities need to carefully and fully evaluate how such long-term, futuremaintenance costs are to be covered.
The provision of attractive landscaping features which enhance the views fromvantage points around a stormwater wetland facility can offer tangible landscapevalue and amenity benefits which can offset total costs. Some evidence for this valuecan be seen from increases in land values and house prices located adjacent to waterfeatures. Some estimates suggest that a stormwater wetland "waterfront" location ona business park/commercial estate can increase rentals by up to one-third andindividual residential property prices by 3% to 13%. It is clear that landscaping andamenity upgrading of wetlands and urban lakes will stimulate the perceivedattractiveness of the wider surrounding corridor and adjacent areas. Additionally, themore positive the local public attitude towards increases of development (or public)investments, the larger the sum they are willing to pay to use any amenity andrecreational facilities provided on the site (Green and Tunstall, 1991). The surfacedrainage "water gardens" and surrounding grass "buffer" zones on the Aztec WestBusiness Park close to the M4/M5 junction north of Bristol, were designed tointegrate habitat and nature conservation with everyday working life. It has beensuggested that this landscaping provision increased the ground rents on the businesspark by as much as two to three times (Holden, 1989).

R&D TECHNICAL REPORT P2-159/TR1 40
Key Issues
• development of harmonised sampling and data collection procedures andprotocols for reporting wetland performance and the establishment of anational SuDS database.
• the measurement of wetland performance in terms of percentage pollutantremoval efficiencies rather than measured against water quality standardsespecially given that wetland treatment cycles can span several storm events.
• uncertain costings for varying wetland designs, operation and maintenanceincluding identification of whole life-cycle costs. Identification of economic“added-value” afforded to urban development from wetland landscaping.
R&D TECHNICAL REPORT P2-159/TR1 41
Hydrological effectiveness describes the interaction betweenrunoff capture, hydraulic retention time and wetland volume.Hydraulic efficiency describes the extent to which plug flowconditions are achieved and the proportion of wetland volumeutilised during the passage of stormflow through the wetlandsystem.Treatment efficiency defines the extent to which surface waterrunoff pollutants are removed within the wetland
3. URBAN WETLAND DESIGN
3.1 Introduction
The successful design of constructed wetlands for urban surface runoff managementrequires the adoption of an integrated multi-disciplinary approach as performancecriteria are difficult to set given the inherent random fluctuations in discharge andpollution loadings which characterise stormwater runoff. This temporal and spatialvariability makes it difficult to define retention time and hydraulic loading and thusgeneral design rules for urban stormwater wetlands have been developed fromempirical performance data such as given in Section 2.1 and using "single-number"techniques such as drainage area ratio (see Table 2.7). Thus no UK urban stormwaterconstructed wetlands are alike in every design respect; a feature readily confirmedfrom site inspections.
Figure 3.1 illustrates a general integrated design approach showing the major linkagesand interactions between the various wetland design elements. Consideration of waterquality issues at the preliminary planning stage can help to mitigate or preventstormwater management problems in urban catchments and reduce the magnitude anddifficulty of surface water treatment. Hydrological effectiveness reflects thecompeting (and sometimesconflicting) factors of retentiontime, inflow characteristics andstorage volume and defines thelong term percentage ofcatchment runoff which entersthe wetland basin. Hydraulicefficiency is strongly influencedby basin shape and depth; hydraulic structures such as inlets, outlets and berms; andby the type, extent and distribution of wetland vegetation. Wetland plants are adaptedto specific wetting and drying cycles which also significantly influence the organiccontent and nutrient cycling in the basal sediments. A major factor in determiningwetland hydro-cycling (and the overall treatment efficiency) is the interactionbetween catchment hydrology, basin bathymetry and the hydraulic behaviour (andlocation) of the outlet structure.
3.2 Design Criteria
3.2.1 Return period and retention time
The treatment performance of a constructed wetland results from the combined effectof the hydrological effectiveness and the treatment efficiency. If design criteria wereto be adopted for the treatment of maximum expected peak flows and/or loads, thewetland system would need to be extremely large and over-engineered or the outflowwater quality standards considerably relaxed. The design criteria also need to makereference to existing or future water quality objectives (WQOs) and take into accountthe expected dilution capacities of the receiving water. Normally, performance criteriawill be based
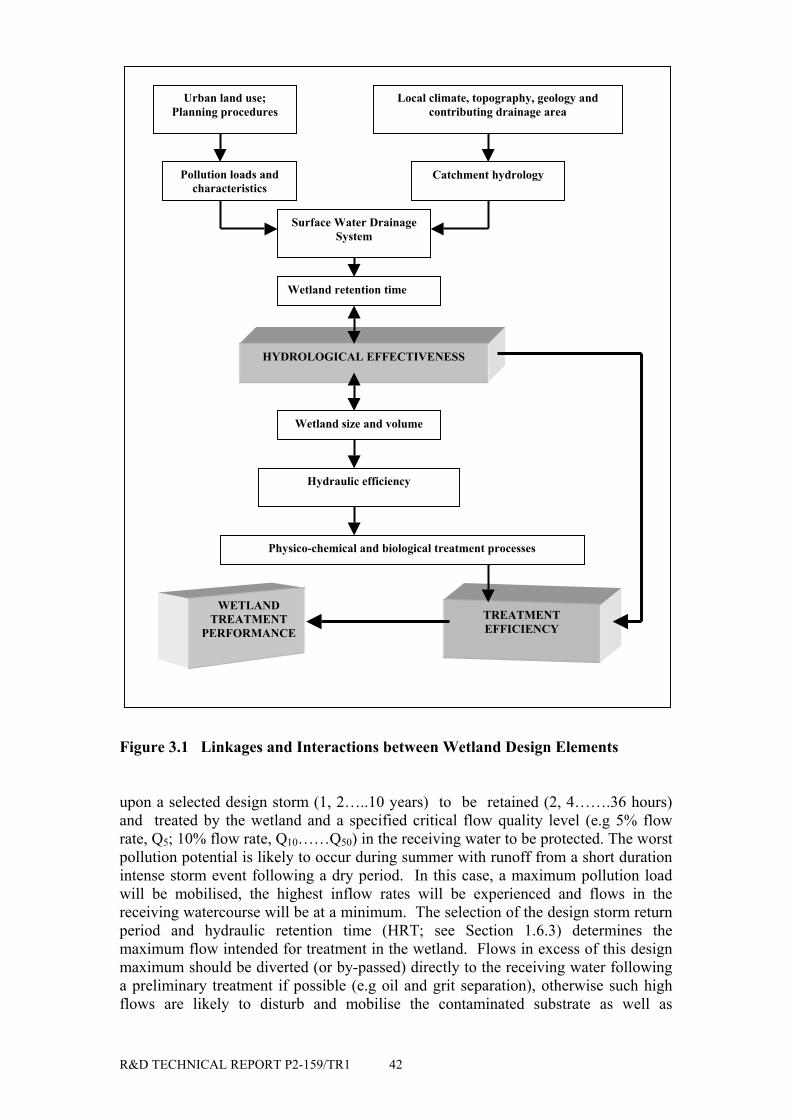
R&D TECHNICAL REPORT P2-159/TR1 42
Figure 3.1 Linkages and Interactions between Wetland Design Elements
upon a selected design storm (1, 2…..10 years) to be retained (2, 4…….36 hours)and treated by the wetland and a specified critical flow quality level (e.g 5% flowrate, Q5; 10% flow rate, Q10……Q50) in the receiving water to be protected. The worstpollution potential is likely to occur during summer with runoff from a short durationintense storm event following a dry period. In this case, a maximum pollution loadwill be mobilised, the highest inflow rates will be experienced and flows in thereceiving watercourse will be at a minimum. The selection of the design storm returnperiod and hydraulic retention time (HRT; see Section 1.6.3) determines themaximum flow intended for treatment in the wetland. Flows in excess of this designmaximum should be diverted (or by-passed) directly to the receiving water followinga preliminary treatment if possible (e.g oil and grit separation), otherwise such highflows are likely to disturb and mobilise the contaminated substrate as well as
Urban land use;Planning procedures
Local climate, topography, geology andcontributing drainage area
Pollution loads andcharacteristics
Catchment hydrology
Surface Water DrainageSystem
Wetland retention time
HYDROLOGICAL EFFECTIVENESS
Wetland size and volume
Hydraulic efficiency
Physico-chemical and biological treatment processes
TREATMENTEFFICIENCY
WETLANDTREATMENT
PERFORMANCE
R&D TECHNICAL REPORT P2-159/TR1 43
damaging the macrophyte vegetation. This is subject to any overall flow restrictionsto the watercourse i.e. taking storage into account.
The most important criterion for the design of a constructed wetland is the selection ofthe design storm which in turn determines the wetland size and volume. Theobjective of the selection process is to determine the critical storm event which willcause the greatest pollution threat, with this storm event being described in terms ofits duration, intensity and frequency of occurrence. In this analysis, it is assumed thatthe selection process will be based upon single rather than multiple event occurrences.Constructed wetlands can be designed to:• retain short duration storms (e.g less than the 1:1 annual storm event) for the
maximum retention time, ensuring that the high flows can be accommodated bythe constructed wetland without overland flow in the case of SSF systems orshort-circuiting in the case of SF systems. For example, a wetland basin sized tocapture 90% of the average annual runoff with a 24 hour drawdown would belikely to overflow between 3 to 8 times per year. This would suggest that afeasible design storm for water quality control purposes might be in the order of atwo to four month storm event.
• retain longer duration storms ensuring that the initial first flush volume (equivalentto 10 - 15 mm effective rainfall runoff) containing the heaviest pollution loadsreceives adequate treatment. It is important that the constructed wetland is largeenough to capture the first flush of the larger storm events to achieve such partialtreatment and to delay outflow discharges to the watercourse until natural dilutionflows have risen.
Where the availability of land and finance is not problematic, the constructed wetlandshould be designed to treat storms with a return period of 10 years, although thedesign of attenuation could be up to the 100 year return period. If a compromise isnecessary requiring a design based on a shorter return period, the system should becapable of treating the polluted first flush of any storm event. Retention time is anextremely important factor in the treatment performance of treatment byconstructed wetlands and even a minimum retention time of only 30 minutes willhelp to remove the coarse sediment fractions. Considerations affecting theretention time include the aspect ratio (width : length), the vegetation, substrateporosity and hence hydraulic conductivity, depth of water, and the slope of thebed. Water level and flow control structures, for example flumes and weirs arealso required to keep the hydraulic regime within desired parameters (Watson andHobson, 1989). An "ideal" retention time is dependent on the pollutant removalprocesses operating in the wetland system. Solids sedimentation can be achievedrelatively quickly and a 3 - 5 hour retention will remove a substantial proportion ofthe coarse solids. However, in order to achieve removal of degradable organics,bacteria and other toxic species associated with the finer solids fractions, much longerretention periods of at least 24 hours will be required (Halcrow/UPRC, 2000). Whencalculating the retention time in a SSF constructed wetland system, the volume of thebed media must also be taken into account (see Section 1.6.3)
The EA Midlands Region SF stormwater wetlands (Table 2.12) have all beendesigned to capture between 5mm - 10mm runoff volume for the 10 year event, withwetland bed void storages of 50 m3 and 100 m3 per impervious hectare of catchmentfor 5mm and 10mm effective runoff volume respectively based on recommendations
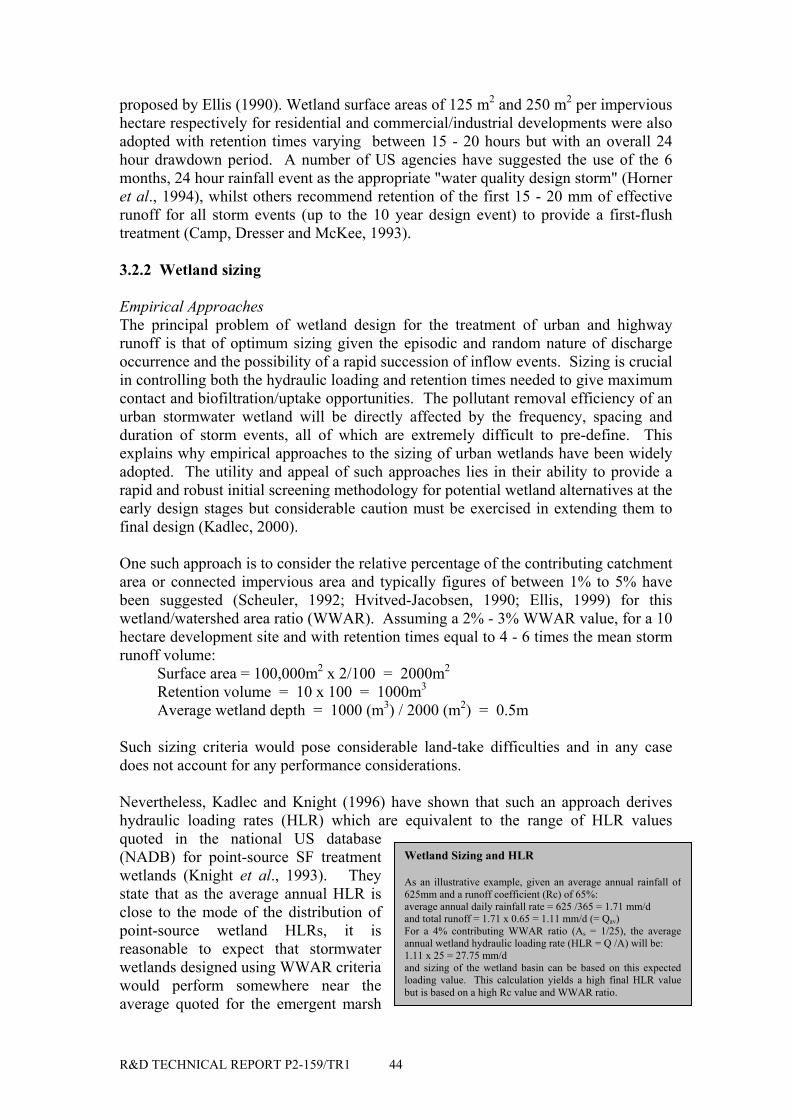
R&D TECHNICAL REPORT P2-159/TR1 44
Wetland Sizing and HLR
As an illustrative example, given an average annual rainfall of625mm and a runoff coefficient (Rc) of 65%:average annual daily rainfall rate = 625 /365 = 1.71 mm/dand total runoff = 1.71 x 0.65 = 1.11 mm/d (= Qav)For a 4% contributing WWAR ratio (As = 1/25), the averageannual wetland hydraulic loading rate (HLR = Q /A) will be:1.11 x 25 = 27.75 mm/dand sizing of the wetland basin can be based on this expectedloading value. This calculation yields a high final HLR valuebut is based on a high Rc value and WWAR ratio.
proposed by Ellis (1990). Wetland surface areas of 125 m2 and 250 m2 per impervioushectare respectively for residential and commercial/industrial developments were alsoadopted with retention times varying between 15 - 20 hours but with an overall 24hour drawdown period. A number of US agencies have suggested the use of the 6months, 24 hour rainfall event as the appropriate "water quality design storm" (Horneret al., 1994), whilst others recommend retention of the first 15 - 20 mm of effectiverunoff for all storm events (up to the 10 year design event) to provide a first-flushtreatment (Camp, Dresser and McKee, 1993).
3.2.2 Wetland sizing
Empirical ApproachesThe principal problem of wetland design for the treatment of urban and highwayrunoff is that of optimum sizing given the episodic and random nature of dischargeoccurrence and the possibility of a rapid succession of inflow events. Sizing is crucialin controlling both the hydraulic loading and retention times needed to give maximumcontact and biofiltration/uptake opportunities. The pollutant removal efficiency of anurban stormwater wetland will be directly affected by the frequency, spacing andduration of storm events, all of which are extremely difficult to pre-define. Thisexplains why empirical approaches to the sizing of urban wetlands have been widelyadopted. The utility and appeal of such approaches lies in their ability to provide arapid and robust initial screening methodology for potential wetland alternatives at theearly design stages but considerable caution must be exercised in extending them tofinal design (Kadlec, 2000).
One such approach is to consider the relative percentage of the contributing catchmentarea or connected impervious area and typically figures of between 1% to 5% havebeen suggested (Scheuler, 1992; Hvitved-Jacobsen, 1990; Ellis, 1999) for thiswetland/watershed area ratio (WWAR). Assuming a 2% - 3% WWAR value, for a 10hectare development site and with retention times equal to 4 - 6 times the mean stormrunoff volume:
Surface area = 100,000m2 x 2/100 = 2000m2
Retention volume = 10 x 100 = 1000m3
Average wetland depth = 1000 (m3) / 2000 (m2) = 0.5m
Such sizing criteria would pose considerable land-take difficulties and in any casedoes not account for any performance considerations.
Nevertheless, Kadlec and Knight (1996) have shown that such an approach deriveshydraulic loading rates (HLR) which are equivalent to the range of HLR valuesquoted in the national US database(NADB) for point-source SF treatmentwetlands (Knight et al., 1993). Theystate that as the average annual HLR isclose to the mode of the distribution ofpoint-source wetland HLRs, it isreasonable to expect that stormwaterwetlands designed using WWAR criteriawould perform somewhere near theaverage quoted for the emergent marsh
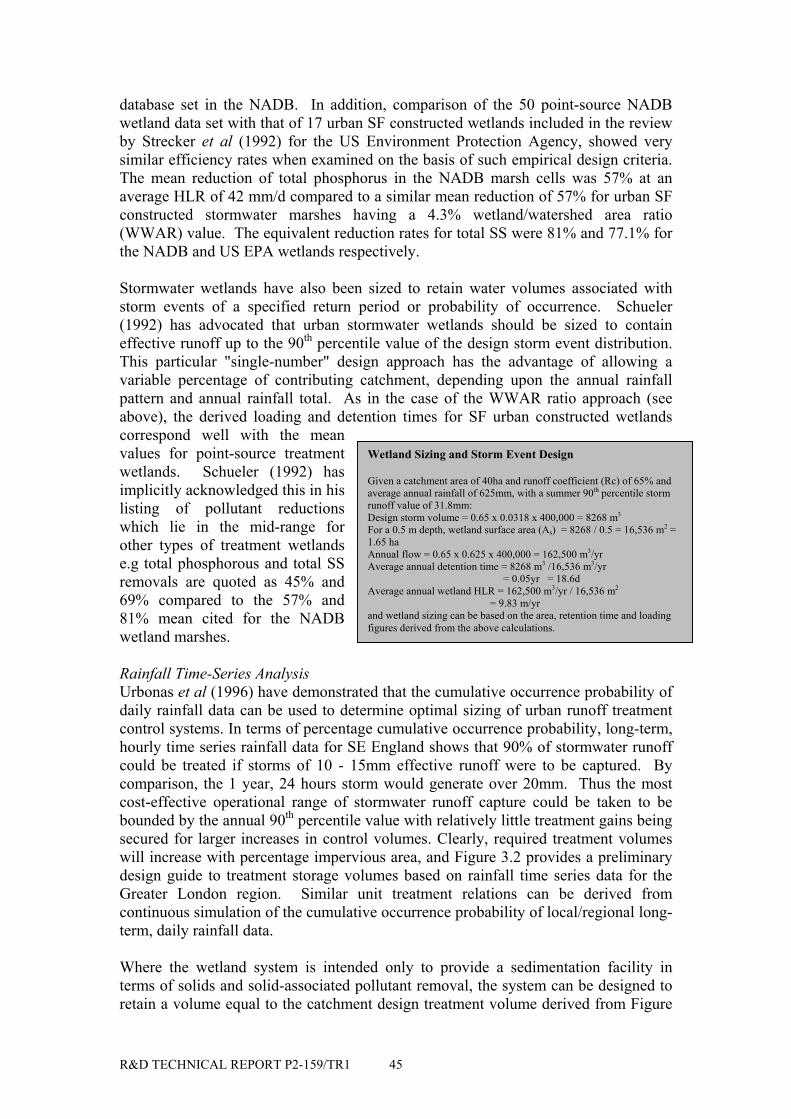
R&D TECHNICAL REPORT P2-159/TR1 45
Wetland Sizing and Storm Event Design
Given a catchment area of 40ha and runoff coefficient (Rc) of 65% andaverage annual rainfall of 625mm, with a summer 90th percentile stormrunoff value of 31.8mm:Design storm volume = 0.65 x 0.0318 x 400,000 = 8268 m3
For a 0.5 m depth, wetland surface area (As) = 8268 / 0.5 = 16,536 m2 =1.65 haAnnual flow = 0.65 x 0.625 x 400,000 = 162,500 m3/yrAverage annual detention time = 8268 m3 /16,536 m3/yr = 0.05yr = 18.6dAverage annual wetland HLR = 162,500 m3/yr / 16,536 m2
= 9.83 m/yrand wetland sizing can be based on the area, retention time and loadingfigures derived from the above calculations.
database set in the NADB. In addition, comparison of the 50 point-source NADBwetland data set with that of 17 urban SF constructed wetlands included in the reviewby Strecker et al (1992) for the US Environment Protection Agency, showed verysimilar efficiency rates when examined on the basis of such empirical design criteria.The mean reduction of total phosphorus in the NADB marsh cells was 57% at anaverage HLR of 42 mm/d compared to a similar mean reduction of 57% for urban SFconstructed stormwater marshes having a 4.3% wetland/watershed area ratio(WWAR) value. The equivalent reduction rates for total SS were 81% and 77.1% forthe NADB and US EPA wetlands respectively.
Stormwater wetlands have also been sized to retain water volumes associated withstorm events of a specified return period or probability of occurrence. Schueler(1992) has advocated that urban stormwater wetlands should be sized to containeffective runoff up to the 90th percentile value of the design storm event distribution.This particular "single-number" design approach has the advantage of allowing avariable percentage of contributing catchment, depending upon the annual rainfallpattern and annual rainfall total. As in the case of the WWAR ratio approach (seeabove), the derived loading and detention times for SF urban constructed wetlandscorrespond well with the meanvalues for point-source treatmentwetlands. Schueler (1992) hasimplicitly acknowledged this in hislisting of pollutant reductionswhich lie in the mid-range forother types of treatment wetlandse.g total phosphorous and total SSremovals are quoted as 45% and69% compared to the 57% and81% mean cited for the NADBwetland marshes.
Rainfall Time-Series AnalysisUrbonas et al (1996) have demonstrated that the cumulative occurrence probability ofdaily rainfall data can be used to determine optimal sizing of urban runoff treatmentcontrol systems. In terms of percentage cumulative occurrence probability, long-term,hourly time series rainfall data for SE England shows that 90% of stormwater runoffcould be treated if storms of 10 - 15mm effective runoff were to be captured. Bycomparison, the 1 year, 24 hours storm would generate over 20mm. Thus the mostcost-effective operational range of stormwater runoff capture could be taken to bebounded by the annual 90th percentile value with relatively little treatment gains beingsecured for larger increases in control volumes. Clearly, required treatment volumeswill increase with percentage impervious area, and Figure 3.2 provides a preliminarydesign guide to treatment storage volumes based on rainfall time series data for theGreater London region. Similar unit treatment relations can be derived fromcontinuous simulation of the cumulative occurrence probability of local/regional long-term, daily rainfall data.
Where the wetland system is intended only to provide a sedimentation facility interms of solids and solid-associated pollutant removal, the system can be designed toretain a volume equal to the catchment design treatment volume derived from Figure
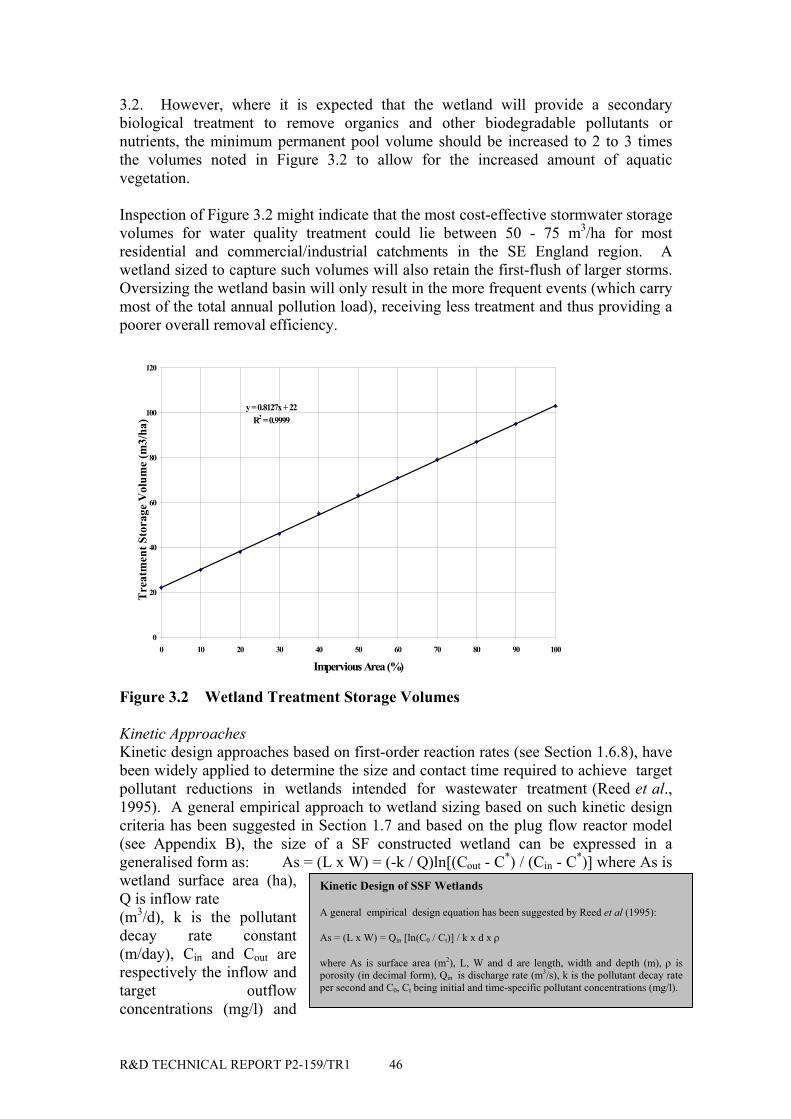
R&D TECHNICAL REPORT P2-159/TR1 46
Kinetic Design of SSF Wetlands
A general empirical design equation has been suggested by Reed et al (1995):
As = (L x W) = Qin [ln(C0 / Ct)] / k x d x ρ
where As is surface area (m2), L, W and d are length, width and depth (m), ρ isporosity (in decimal form), Qin is discharge rate (m3/s), k is the pollutant decay rateper second and C0, Ct being initial and time-specific pollutant concentrations (mg/l).
3.2. However, where it is expected that the wetland will provide a secondarybiological treatment to remove organics and other biodegradable pollutants ornutrients, the minimum permanent pool volume should be increased to 2 to 3 timesthe volumes noted in Figure 3.2 to allow for the increased amount of aquaticvegetation.
Inspection of Figure 3.2 might indicate that the most cost-effective stormwater storagevolumes for water quality treatment could lie between 50 - 75 m3/ha for mostresidential and commercial/industrial catchments in the SE England region. Awetland sized to capture such volumes will also retain the first-flush of larger storms.Oversizing the wetland basin will only result in the more frequent events (which carrymost of the total annual pollution load), receiving less treatment and thus providing apoorer overall removal efficiency.
y = 0.8127x + 22R2 = 0.9999
0
20
40
60
80
100
120
0 10 20 30 40 50 60 70 80 90 100
Impervious Area (%)
Tre
atm
ent S
tora
ge V
olum
e (m
3/ha
)
Figure 3.2 Wetland Treatment Storage Volumes
Kinetic ApproachesKinetic design approaches based on first-order reaction rates (see Section 1.6.8), havebeen widely applied to determine the size and contact time required to achieve targetpollutant reductions in wetlands intended for wastewater treatment (Reed et al.,1995). A general empirical approach to wetland sizing based on such kinetic designcriteria has been suggested in Section 1.7 and based on the plug flow reactor model(see Appendix B), the size of a SF constructed wetland can be expressed in ageneralised form as: As = (L x W) = (-k / Q)ln[(Cout - C*) / (Cin - C*)] where As iswetland surface area (ha),Q is inflow rate(m3/d), k is the pollutantdecay rate constant(m/day), Cin and Cout arerespectively the inflow andtarget outflowconcentrations (mg/l) and
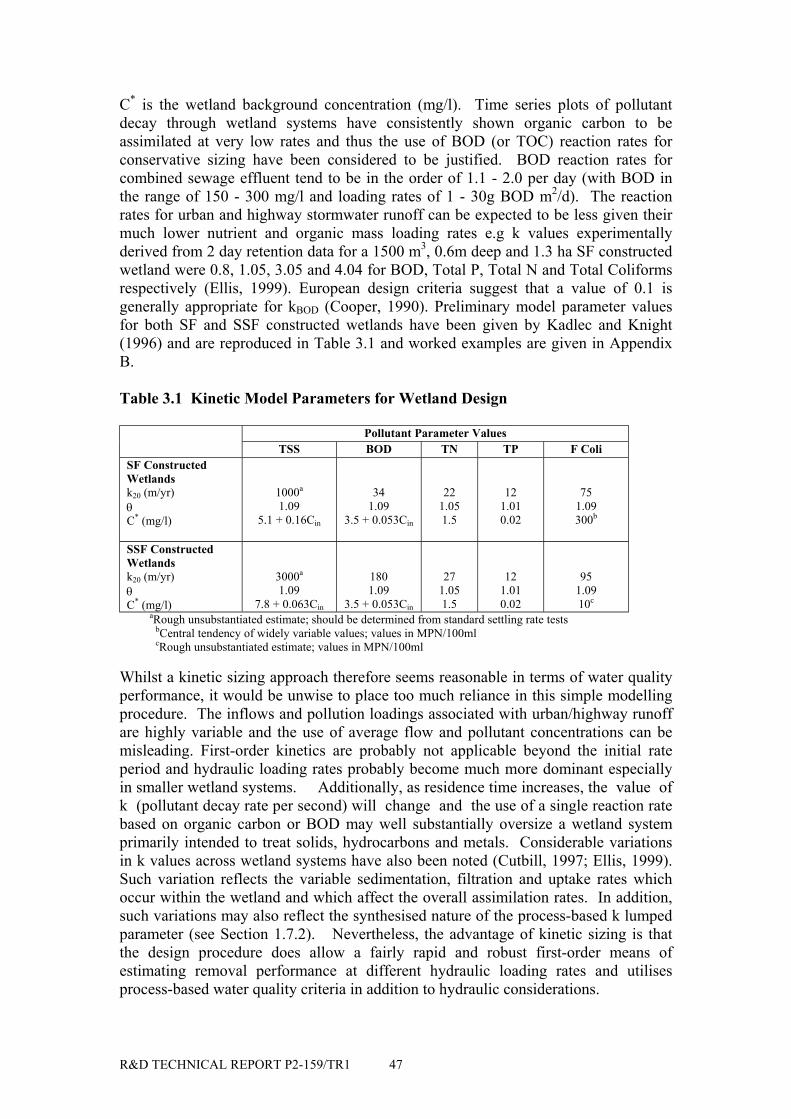
R&D TECHNICAL REPORT P2-159/TR1 47
C* is the wetland background concentration (mg/l). Time series plots of pollutantdecay through wetland systems have consistently shown organic carbon to beassimilated at very low rates and thus the use of BOD (or TOC) reaction rates forconservative sizing have been considered to be justified. BOD reaction rates forcombined sewage effluent tend to be in the order of 1.1 - 2.0 per day (with BOD inthe range of 150 - 300 mg/l and loading rates of 1 - 30g BOD m2/d). The reactionrates for urban and highway stormwater runoff can be expected to be less given theirmuch lower nutrient and organic mass loading rates e.g k values experimentallyderived from 2 day retention data for a 1500 m3, 0.6m deep and 1.3 ha SF constructedwetland were 0.8, 1.05, 3.05 and 4.04 for BOD, Total P, Total N and Total Coliformsrespectively (Ellis, 1999). European design criteria suggest that a value of 0.1 isgenerally appropriate for kBOD (Cooper, 1990). Preliminary model parameter valuesfor both SF and SSF constructed wetlands have been given by Kadlec and Knight(1996) and are reproduced in Table 3.1 and worked examples are given in AppendixB.
Table 3.1 Kinetic Model Parameters for Wetland Design
Pollutant Parameter ValuesTSS BOD TN TP F Coli
SF ConstructedWetlandsk20 (m/yr)θC* (mg/l)
1000a
1.095.1 + 0.16Cin
341.09
3.5 + 0.053Cin
221.051.5
121.010.02
751.09300b
SSF ConstructedWetlandsk20 (m/yr)θC* (mg/l)
3000a
1.097.8 + 0.063Cin
1801.09
3.5 + 0.053Cin
271.051.5
121.010.02
951.0910c
aRough unsubstantiated estimate; should be determined from standard settling rate tests bCentral tendency of widely variable values; values in MPN/100ml cRough unsubstantiated estimate; values in MPN/100ml
Whilst a kinetic sizing approach therefore seems reasonable in terms of water qualityperformance, it would be unwise to place too much reliance in this simple modellingprocedure. The inflows and pollution loadings associated with urban/highway runoffare highly variable and the use of average flow and pollutant concentrations can bemisleading. First-order kinetics are probably not applicable beyond the initial rateperiod and hydraulic loading rates probably become much more dominant especiallyin smaller wetland systems. Additionally, as residence time increases, the value ofk (pollutant decay rate per second) will change and the use of a single reaction ratebased on organic carbon or BOD may well substantially oversize a wetland systemprimarily intended to treat solids, hydrocarbons and metals. Considerable variationsin k values across wetland systems have also been noted (Cutbill, 1997; Ellis, 1999).Such variation reflects the variable sedimentation, filtration and uptake rates whichoccur within the wetland and which affect the overall assimilation rates. In addition,such variations may also reflect the synthesised nature of the process-based k lumpedparameter (see Section 1.7.2). Nevertheless, the advantage of kinetic sizing is thatthe design procedure does allow a fairly rapid and robust first-order means ofestimating removal performance at different hydraulic loading rates and utilisesprocess-based water quality criteria in addition to hydraulic considerations.
R&D TECHNICAL REPORT P2-159/TR1 48
Hydraulic Conductivity (kh)
Is the coefficient of permeability representing the rate atwhich water moves through the porous media and can bedetermined directly from field tests or estimated for clean, un-rooted media as: kh = 12,600 Dp1.9
where Dp is the diameter of the substrate media. 8 - 12mmgravels typically have a kh value of 270 m/d with silts (0.005 -0.05mm) having a value about 0.08 mm/d.Siltation and algal/biomass accumulation will reduce the kh
value especially close to the wetland inlet by some 10% or so.
In addition to the design storm and retention time, the following criteria are alsorecommended:
Aspect ratio (Width:Length) : 1:4 to 1:5
Slope of Wetland Bed : 1%
Minimum substrate bed depth : 0.6m
Hydraulic conductivity ofsubstrate : 10-3 m/s to 10-2 m/s
Once the design storm and retention time choice has been made, the size of theconceptual constructed wetland can be calculated using Darcy’s Law and theabove criteria as: Average daily flow rate (Qd; m3/s) = Ac. kh (∂H/∂x)where Ac is the cross-sectional area of the bed, kh is the hydraulic conductivity ofthe substrate (m/s) and (∂H/∂x) is theslope or hydraulic gradient of the bed(m/m). Darcy’s Law assumes laminaruniform and constant flow in the mediabed and clean water. In a SF wetland,flow will be channelled and short-circuited and the media will be coveredwith biological growths and thereforethe equation only has limited usefulnessin such wetland design. Nevertheless Darcy’s Law does provide a reasonableapproximation of flow conditions in SSF constructed wetland beds if moderatesized gravel (eg 10mm pea gravel) is used for the support medium. Figure 3.3provides a schematic section through a SSF constructed wetland illustrating someof these design criteria.
3.2.3 Optimal hydraulic loading
During storm events, high rates of stormwater runoff may discharge ontoconstructed wetlands, but optimal hydraulic loading rates (HLR; see Section1.6.3) should not exceed 1m3/m2/d in order to achieve a satisfactory treatment(Ellis, 1990). Watson et al (1989) have suggested that an arbitrary HLR breaklineappears to be about 2.7 ha catchment area/1000 m3 storage volume/day, withwetlands having a large area per flow unit (a lower loading rate) being normallySF systems and smaller areas (with higher loadings) associated with SSF systems.
3.2.4 Flow velocity
Flow velocity should not exceed 0.3 to 0.5m/s at the inlet zone if effectivesedimentation is to be achieved. At velocities greater than 0.7m/s, high flow maydamage the plants physically and cause a decline in system efficiency. Section1.6.5.2 shows how expected maximum inflow velocity can be determined fromconsideration of design peak flow rate (Qpkmax) and wetland area (A).
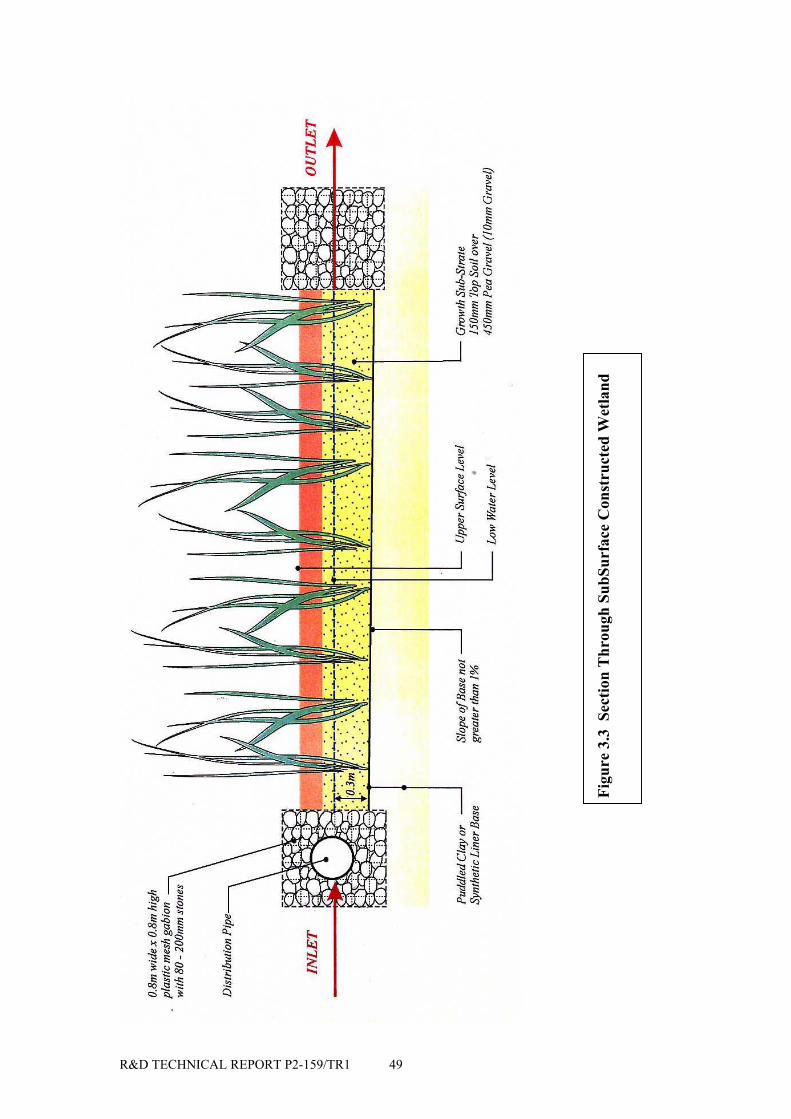
R&D TECHNICAL REPORT P2-159/TR1 49
Figu
re 3
.3 S
ectio
n T
hrou
gh S
ubSu
rfac
e C
onst
ruct
ed W
etla
nd
R&D TECHNICAL REPORT P2-159/TR1 50
3.2.5 Inlet
The inlet pipe should be constructed in such a way that influent flow is evenlydistributed across the width of the bed. This may be achieved using slotted inletpipes or a notched gutter (slots should be large enough to prevent clogging byalgae). The distribution system must be designed to allow maintenance in case ofblockage. Riser pipe distributors have been adopted on many wastewatertreatment systems (Cooper et al., 1996). A level spreader device (serrated weirplate, hard aprons etc.,) can give uniform gravity-fed distribution systemsespecially if they spread the influent flow across a fully-maintained grassed filterstrip prior to entry into the wetland cell.
Some type of stilling structure under the inlet, usually a 1m wide stone trench(rip-rap or gabion zone), is necessary to either dissipate high water flows, orcontain the inlet distributor pipe. Rip-rap and gabions are blankets of stonesplaced to protect erosion zones. The stones for rip-rap are laid directly on the bed,whereas they are packed in cages for gabions.
3.2.6 Substrate slope
The longitudinal slope of the substrate bed parallel to the flow path, should not beless than 1%. The surface of the substrate should be level (see Figure 3.3).
3.2.7 Outlet
The level at which the outlet is set is determined by the lowest water level required inthe constructed wetland. Until further information is available, it is considered that thelowest level in the wetland should be 300mm below the substrate surface dependenton plant type (see Section 3.4). An additional source of water may be needed tosupply the reedbeds during dry periods.
Ideally the outlet structure should incorporate control measures which allows thewater level in the bed to be varied; a flexible plastic pipe linked to a chain is anappropriate low cost option (Cooper et al., 1996). The control should at leastincorporate a measure to allow periodic raising of water level for weed controland bed oxidation. A recent 2001 HR Wallingford R&D project “Guide for theDrainage of Development Sites” Report SR574 on surface water runoffmanagement commissioned by the DETR, has indicated that temporary storagemay not be particularly effective in providing sufficient downstream floodprotection for extreme events. One strong recommendation is for permanentstorage with long release times, and this requirement can be satisfied by wetlandbasins fitted with adjustable outlet controls to maintain outflow rates and volumescompatible with a sustainable receiving water regime.
At the outlet zone it is recommended that an additional rip-rap (or gabion) zonebe inserted to prevent weed growth and resuspension of reedbed substrates(Figure 3.3). Outlet structures are particularly prone to debris accumulation and agabion zone (or debris screen/fence) will help to alleviate this problem. If highflood conditions at the site are anticipated, there should be appropriate provision
R&D TECHNICAL REPORT P2-159/TR1 51
such as emergency overflow spillways or by-passes, to facilitate through-flow andprevent disturbance and flushing of the wetland substrates.
3.2.8 Aspect ratio
An aspect ratio (length:width) of 4:1 to 5:1 for SSF wetlands and 10:1 or higherfor SF wetlands has been recommended for domestic wastewater treatmentwetlands. However, the IWA (2000) technical report considers that any aspectratio with a good inlet distribution can be applied, as previous assumptions thatwetlands with high aspect ratios would function more efficiently and be closer toplug flow have not been confirmed from tracer studies. Problems of short-circuiting can be minimised by careful construction, intermediate open-waterzones for flow distribution and use of baffles and islands.
3.2.9 Aeration
A grid of slotted plastic pipes (say diameter of 100mm) should be installedvertically in the substrate (100mm protruding above the surface, and penetratingthe full depth of the substrate) at 5m centres, to serve as static ventilation tubesand aid aeration of the root zone.
3.2.10 Bird deterrent
Plastic poles should be erected to support lines of bunting to discourage birdsfrom feeding on young plants. The height of the bunting should be about 1.5mabove the substrate surface.
3.2.11 Non-metallic items
Non-metallic items should be incorporated into the construction of the wetland sothat metals in the wetland only come from stormwater runoff. Therefore gabionsshould be encased with geotextiles and the poles supporting bunting should beplastic.
3.3 Substrate Structure
Horizontal surface flow (SF) wetlands utilise a natural soil substrate to provideorganics and nutrients to maintain plant growth, whereas subsurface flow (SSF)wetland substrates should primarily provide a good hydraulic conductivity.Nutrient supply can be supplemented to the subsurface flow if required. Thefollowing sections primarily address the subsurface structure of SSF wetlands.
A combination of organic and clay based soils, sand, gravels and stones are usedin SSF constructed wetlands to provide support for plants, reactive surfaces forcomplexing of ions and other compounds and attachment surfaces for microbeswhich directly or indirectly utilise pollutants. The type of substrate used will havean effect on the hydraulic conductivity and efficiency of the constructed wetlandand must allow for a sufficiently high hydraulic conductivity to enablewastewater to flow at a sufficient rate for treatment without backing up andcausing overland flow.
R&D TECHNICAL REPORT P2-159/TR1 52
Although wetland plants will grow optimally in deep rich soils which allow forextensive root and rhizome penetration, gravels are also needed to increase totalhydraulic conductivity, provide a matrix for supporting plant roots and act as asilt trap during storm events. Nutrient-poor substrates should not be rejected asslow-release fertiliser pellets can be added. Studies conducted by Brodie et al.(1988) and Stillings et al. (1988) have suggested that substrate type is irrelevantto plant growth once the plants have become established.
Nutrient-poor peat based organic soils are best avoided due to their acidic natureand lack of support for emergent macrophytes, and hence the need for additionalanchoring devices. Nutrient-poor clays and gravels on the other hand may be toocompact for root penetration, or be impermeable to water required by roots(Emerson, 1961; Wein et al., 1987). Clay soils may be more effective inadsorbing certain pollutants owing to their high cation exchange capacity, butshould be used with care since changes in pH have been shown to releaseadsorbed pollutants. The texture of sandy soils allows for cost-effective plantingby hand. Sands and gravels with low capillarity may require irrigation if dryingout of roots is to be avoided during times of low influent discharge.
Gravel provides the most suitable substrate for SSF constructed wetland emergentplants, supporting adequate root growth, high conductivity and superiorpermeability. Ideally, prior to use, all components of a substrate mixture shouldbe analysed for hydraulic conductivity, buffering capacity, pH, plant nutrientlevels and microbial activity. Hydraulic conductivity is one of the most importantdeterminants in pollutant removal efficiency, and is especially important in SSFconstructed wetland systems where purification processes are largely confined tothe root zone.
A sufficient rooting depth is also required to prevent physical damage of plants byhigh velocity stormflows and freezing. A 0.6m depth of washed pea gravel(10mm sized gravel) is appropriate and is similar to the 0.6m depth of rootpenetration possessed by the deep rooting Phragmites. Coarse organic top soilmay be mixed with the gravel in a maximum ratio of 1:4 to provide a nutrientsource and to enhance metal removal during the plant establishment phase.However, its addition will reduce the hydraulic conductivity of the substrate.Water depth and substrate depth are the most important determinants of retentiontime in SF systems and SSF systems, respectively. Factors determining the depthof substrate for a SSF system include cost of substrate, depth of root penetration,retention time and climate. Substrate temperatures in excess of 3-5°C must bemaintained in order for sulphate-reduction processes to proceed. In colderclimates substrate depth may be increased to maintain adequate temperatures.
Natural clay, bentonite, geotextile or plastic (high or low duty polyethylene)liners may be used as reedbed bases, in instances where prevention of leakage togroundwaters is imperative. An impermeable liner is also necessary to retainwater in the wetland during dry periods. A required depth of at least 0.6m isrequired to contain the penetration of plant roots and rhizomes (Typha latifolia:0.3m; Phragmites: 0.6m), and prevent leakage of pollutants to groundwater. The

R&D TECHNICAL REPORT P2-159/TR1 53
top surface of the substrate must be level. This allows flooding of the reedbed tooccur for control of weed growth when the reeds are being established.
3.4 Planting Considerations
Constructed wetlands have traditionally utilised plant species commonly occurring inwater bodies and watercourses, which were known to thrive in nutrient-rich situationsand were generally pollutant tolerant. The main plant species utilised in sewagewastewater treatment has been the common reed (Phragmites australis), which led tothe systems being known as reedbed treatment systems. Reedmace (Typha latifoliaand Typha angustifolia) has been increasingly used, both in sewage-derivedwastewater treatment and particularly in the treatment of surface runoff and industrialeffluents. Other plant species have played a lesser role in wastewater treatment, suchas flag iris (Iris pseudacorus), bulrush (Schoenoplectus spp.) and sedges (Carex spp.).
It is recommended that vegetation for stormwater wetland treatment systems shouldbe selected using the following criteria:• a rapid and relatively constant growth rate• high biomass, root density and depth• ease of propagation• capacity to absorb or transform pollutants• tolerance of eutrophic conditions• ease of harvesting and potential of using harvested material• growth form (visual appearance)• ecological value• local retail (or nursery) availability
A list of the most commonly utilised emergent/semi-aquatic and true aquatic plantspecies is given in Table 3.2. It is recommended that a horizontal SF or SSFconstructed wetland is planted with one or both of two main species. Reedmace
Table 3.2 Plant Species Commonly Used in Constructed Wetlands
Scientific Name Vernacular NameEmergent SpeciesAcorus calamusButomus umbellatusCarex spp.Iris pseudacorusJuncus spp.Phalaris arundinaceaPhragmites australisSagittarius spp.Schoenoplectus spp.Typha latifolia
Sweet-flagFlowering rushSedge speciesYellow irisRush speciesReed canary grassCommon reedArrowhead speciesClubrush speciesCommon reedmace
Aquatic SpeciesLemna sppMyriophyllum spp.Ranunculus flammula.
Duckweed speciesWater milfoil speciesLesser spearwort
(Typha latifolia) is shallow rooting and requires the water level to be maintained at orup to 100mm above the surface of the substrate; and also common reed (Phragmitesaustralis) which is more tolerant of variation in the water level; and a fringe of otherplants such as Iris, to soften the wetland appearance. The suitability of Typha fortreating metal-contaminated waters is well known, but a recent study of Phragmites
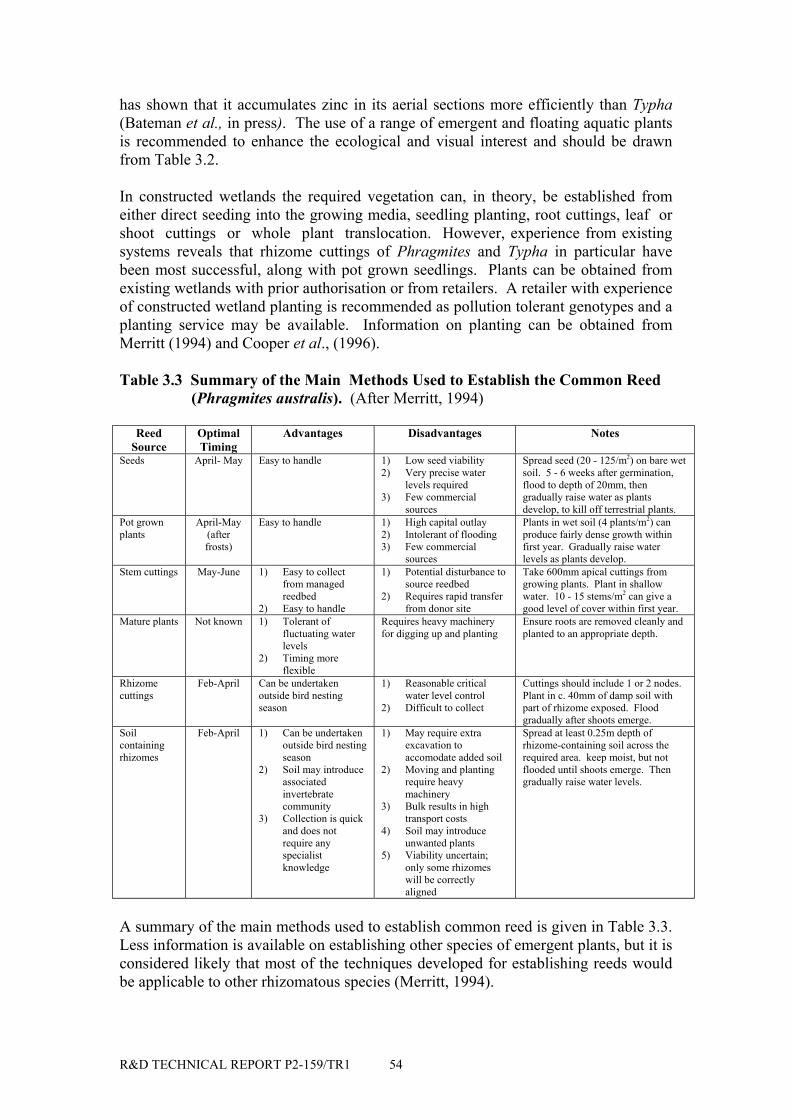
R&D TECHNICAL REPORT P2-159/TR1 54
has shown that it accumulates zinc in its aerial sections more efficiently than Typha(Bateman et al., in press). The use of a range of emergent and floating aquatic plantsis recommended to enhance the ecological and visual interest and should be drawnfrom Table 3.2.
In constructed wetlands the required vegetation can, in theory, be established fromeither direct seeding into the growing media, seedling planting, root cuttings, leaf orshoot cuttings or whole plant translocation. However, experience from existingsystems reveals that rhizome cuttings of Phragmites and Typha in particular havebeen most successful, along with pot grown seedlings. Plants can be obtained fromexisting wetlands with prior authorisation or from retailers. A retailer with experienceof constructed wetland planting is recommended as pollution tolerant genotypes and aplanting service may be available. Information on planting can be obtained fromMerritt (1994) and Cooper et al., (1996).
Table 3.3 Summary of the Main Methods Used to Establish the Common Reed (Phragmites australis). (After Merritt, 1994)
ReedSource
OptimalTiming
Advantages Disadvantages Notes
Seeds April- May Easy to handle 1) Low seed viability2) Very precise water
levels required3) Few commercial
sources
Spread seed (20 - 125/m2) on bare wetsoil. 5 - 6 weeks after germination,flood to depth of 20mm, thengradually raise water as plantsdevelop, to kill off terrestrial plants.
Pot grownplants
April-May(afterfrosts)
Easy to handle 1) High capital outlay2) Intolerant of flooding3) Few commercial
sources
Plants in wet soil (4 plants/m2) canproduce fairly dense growth withinfirst year. Gradually raise waterlevels as plants develop.
Stem cuttings May-June 1) Easy to collectfrom managedreedbed
2) Easy to handle
1) Potential disturbance tosource reedbed
2) Requires rapid transferfrom donor site
Take 600mm apical cuttings fromgrowing plants. Plant in shallowwater. 10 - 15 stems/m2 can give agood level of cover within first year.
Mature plants Not known 1) Tolerant offluctuating waterlevels
2) Timing moreflexible
Requires heavy machineryfor digging up and planting
Ensure roots are removed cleanly andplanted to an appropriate depth.
Rhizomecuttings
Feb-April Can be undertakenoutside bird nestingseason
1) Reasonable criticalwater level control
2) Difficult to collect
Cuttings should include 1 or 2 nodes.Plant in c. 40mm of damp soil withpart of rhizome exposed. Floodgradually after shoots emerge.
Soilcontainingrhizomes
Feb-April 1) Can be undertakenoutside bird nestingseason
2) Soil may introduceassociatedinvertebratecommunity
3) Collection is quickand does notrequire anyspecialistknowledge
1) May require extraexcavation toaccomodate added soil
2) Moving and plantingrequire heavymachinery
3) Bulk results in hightransport costs
4) Soil may introduceunwanted plants
5) Viability uncertain;only some rhizomeswill be correctlyaligned
Spread at least 0.25m depth ofrhizome-containing soil across therequired area. keep moist, but notflooded until shoots emerge. Thengradually raise water levels.
A summary of the main methods used to establish common reed is given in Table 3.3.Less information is available on establishing other species of emergent plants, but it isconsidered likely that most of the techniques developed for establishing reeds wouldbe applicable to other rhizomatous species (Merritt, 1994).
R&D TECHNICAL REPORT P2-159/TR1 55
Attention needs to be paid to water levels throughout the first growing season asyoung plants can be killed off by even shallow flooding. Nutrients may be a limitingfactor of initial plant growth in urban and highway runoff treatment wetlands and asupplementary source of nutrients from slow release pellets may be required. Longterm maintenance of water levels is also important to prevent stress on the plants,especially Typha. At sites which attract large numbers of waterfowl, netting shouldbe used to protect the youngest shoots from grazing. Older reeds require at least thetop one-third to be protruding above the water level (Merritt, 1994). Annualinspections of both the pre-settlement pond and the final settlement tank should bemade to determine if sediment removal is required. If significant growths of algae arepresent, they should be removed and cylindrical bales of barley straw wrapped inhessian should be introduced to prevent further algal growths.
3.5 Pre and Post Treatment Structures
3.5.1 Oil separator, Silt trap/Infiltration trench and spillage containment
Traditional pollution control measures for urban and highway stormwater runoffin the UK have included grit and oil separators for the reduction of sediments andhydrocarbons. They are, however, inefficient in removing the majority of thepollution load and the finer and more mobile sediments and solid-associatedpollutants including oil (which clog some designs of constructed wetland treatingroad runoff). Integrated pollution control systems including a combination of oilseparators, silt traps/infiltration trenches, spillage containment facilities andwetland-forebays or lagoons, located prior to the constructed wetland cell(s), canprovide for pre-treatment of raw stormwater runoff and help to prevent siltation inwetland inlet zones (Figure 3.4).
Oil and phytotoxic chemicals in urban and highway runoff can seriously affect thetreatment efficiencies of constructed wetlands and the viability or performance ofthe plants. As constructed wetlands require 1-3 years to mature and becomecapable of efficient wastewater treatment, bypass oil separators, silt traps and/orinfiltration trenches and spillage containment facilities must be installed prior tothe discharge of runoff into the constructed wetland. All these structures must betamper-proof and easily accessed. The spillage containment facility should have aminimum volume of 25 m3. Whilst the provision of a front-end, pre-treatmentsedimentation trap or lagoon may be an efficient engineering structure to take outlitter, coarse grit and other solid-associated pollutants such as oil, such dropstructures represent a trap for small amphibians, reptiles and other wildlife whichmay be funnelled through the sump during rainfall events (English Nature, 1995).In the M42 Hopwood Park motorway service area development, a 30 x 1.5 x1.25m lined stone infiltration trench is used to intercept the initial 10mmfirstflush from the HGV parking area to filter out the majority of surface-derivedoil. When filled, the trench overflows across a 10m wide grass filter strip(facilitating silt removal) into a parallel swale channel which then delivers theexcess flows into a vegetated balancing pond. Spillage is provided for by aseparate vegetated pond linked to the trench by a perforated pipe at the base ofthe infiltration trench.
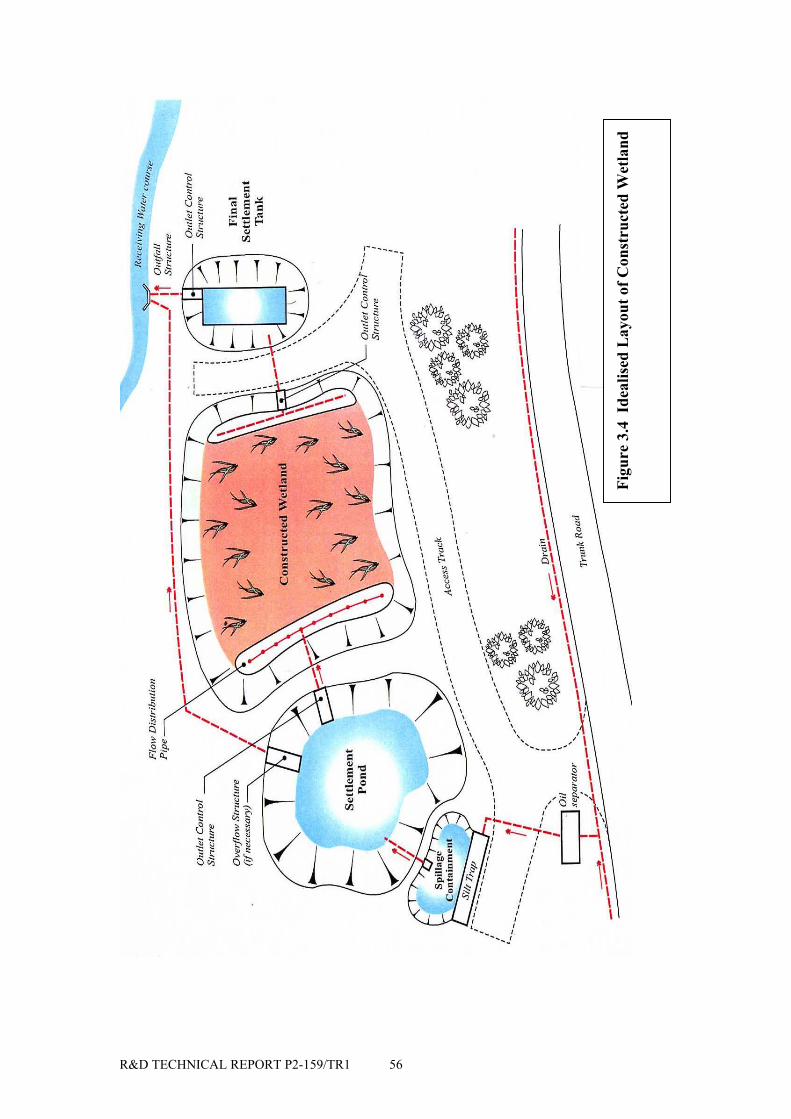
R&D TECHNICAL REPORT P2-159/TR1 56
Figu
re 3
.4 I
deal
ised
Lay
out o
f Con
stru
cted
Wet
land
R&D TECHNICAL REPORT P2-159/TR1 57
The system is thus ecologically sustainable with no drop structures, but this gainmust be offset against a more frequent O & M requirement and potentiallyreduced lifetime for the trench infill, particularly if coarse oiled grits clog thesurface interstices and fissures. An alternative compromise might be to constructa standard front-end sedimentation trap/trench which can be covered by a steelgrill mesh which in turn supports an overlying, shallow stone infill (less than0.3m deep) or geoplastic block storage system such as Stormcell (Andoh et al.,2000). This would have the advantage of providing a full surface filter and basalsedimentation facility which could be easily serviced but at less cost than a fullstone infiltration trench, whilst at the same time being ecologically sustainable.
Where SuDS retrofitting is being considered to a conventional kerb-gutter-gulleysystem, it might be feasible to consider the use of a hydrodynamic separator withthe flow-through supernatant effluent passing on to a lined stone infiltrationtrench or distributed over a grass filter strip and/or swale before discharging to awetland system for final treatment. This form of pre-treatment has been adoptedon part of the A5 Shrewsbury Bypass where road surface runoff passes fromconventional fin drains to a separator, swale and wetland treatment-train system..The basal contaminated sediments in the separator are discharged directly to thefoul system.
Where land availability is not limited (ie. rural and semi-rural areas), forebayswith additional oil booms on the water surface, have been advocated to serve assecondary sedimentation chambers to reduce the initial flush of pollutants into themain wetland (CIRIA, 1993). Such forebays can be readily constructed byinserting a submerged dam of crushed rock supported by rock gabions across theinlet zone or by constructing a diversion weir in the inflow channel (Hall et al.,1993) to direct first-flush volumes to an off-line settlement pond. Theincorporation of pre-settlement ponds if space is not limited is also recommended.
3.5.2 Pre-settlement pond
Ellis (1991) suggested from a review of a number of studies in the US andEurope, that maximum pollutant removal can be achieved in a pre-settlementpond which is equivalent to some 10 - 15% of the total wetland cell volume. TheEA Midlands Region urban constructed wetlands utilise a stilling pond andsedimentation trap of 10 m3 capacity to capture influent stormwater debris/litter,grit and oiled sediment. This front-end basin can also serve as a back-up spillagecontainment facility (Figure 3.4).
3.5.3 Final settlement tank
If sufficient land is available, a final settlement tank (concrete structure) with aminimum capacity of 50 m3 extending across the width of the wetland can beinstalled (Figure 3.4). The tank will help prevent fine sediment from the wetlandbeing transferred into the receiving water body. The final settlement tank is anidealised part of the overall system and only needs to be included in the overalldesign where greatest protection to sensitive receiving waters is required. Regularmaintenance is recommended to prevent collected sediments being resuspendedduring high flows. The rate of sediment deposition will vary with each catchment

R&D TECHNICAL REPORT P2-159/TR1 58
so the frequency of sediment removal cannot be predicted. Annual inspectionsshould be made to determine if sediment removal is required.
Key Issues
• selection of the critical storm event in terms of pollution retention and receivingwater quality targets and standards.
• treatment of the “first-flush” of pollutants within a wetland system and the relationof individual pollutant removal rates to hydraulic retention time (HRT).
• development of UK regional treatment storage volume curves for time-seriesrainfall data.
• protocol for process-based, kinetic sizing of wetlands as a first-order screeningmethodology.
• over-colonisation and naturalisation of wetland vegetation.• alternative “front-end” designs for more sustainable spillage and “first-flush”
protection.
R&D TECHNICAL REPORT P2-159/TR1 59
4. URBAN WETLAND RETROFITTING, OPERATION ANDMAINTENANCE
4.1 Retro-fitting
Retro-fitting means the installation of a treatment system into a structure thatalready exists. The physical attenuation of storm runoff from urban developmentsand highways has been practised for many years and there are many such floodbalancing facilities, for example, adjacent to highways and downstream of urbanareas throughout the UK. Although these traditional facilities generally do notinclude vegetative systems, some have been naturally colonised by aquatic plantsincluding reeds (see Section 1.2.2). To provide a quality treatment, in addition totheir existing flood attenuation capabilities, it may be possible to retro-fit aconstructed wetland into these structures. Such retrofitting can be done intoeither an existing wet detention (with permanent pool) or dry retention storagebasin although in both cases prior consideration must be given to the potentialloss of storage volume due to the introduction of the aquatic vegetation andsubstrate.
Given apparent changes in climate in the UK, with the increased risk of morefrequent summer storms and prolonged periods of winter rainfall, it is nowgenerally accepted that the introduction of SuDS structures into existingdevelopment is likely to have an important future role to play in the prevention offlooding and pollution of low lying urban areas. The revised (February 2001)DETR (now DEFRA) planning guidance for local authorities and developers,Planning & Policy Guideline (PPG) Note 25 "Development and Flood Risk",includes reference to the use of sustainable drainage measures. Nevertheless, thesame weather conditions render the safe design of such SuDS even moreproblematical. Such wetland SuDS retrofitting into existing urban developmentshould not therefore be undertaken lightly and requires careful design incollaboration with local residents, their elected representatives and planningauthorities, the regulatory agencies, local land owners and the various private andpublic agencies having a vested interest. In particular, safety (whether real orperceived), post-project liability and maintenance are likely to be considerableconstraints.
When considering whether to retro-fit subsurface flow (SSF) constructedwetlands into existing urban balancing ponds, the following issues need to beexamined:• does suitable access exist or can it be provided?• can the storage for flood attenuation be safely reduced (at all or enough) so
that the 0.6m deep substrate of a constructed wetland can be incorporated?• is the outlet structure of the balancing pond offset from the inlet structure? If
the outlet is offset (ie not directly opposite the inlet) then the flow could short-circuit. Short-circuiting could be reduced by inserting plastic baffles into thesubstrate to increase flow path length or introducing islands to direct waterflows and reduce "dead" zones as well as helping oxygenation (Hall et al.,1993).
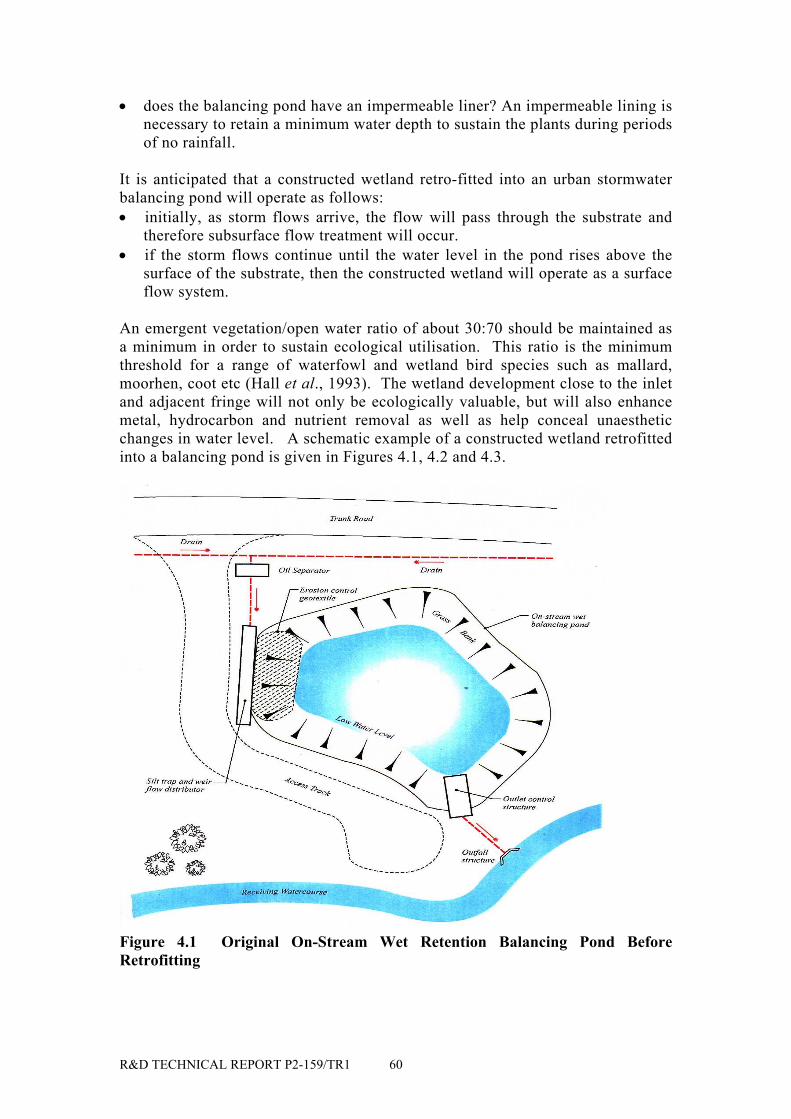
R&D TECHNICAL REPORT P2-159/TR1 60
• does the balancing pond have an impermeable liner? An impermeable lining isnecessary to retain a minimum water depth to sustain the plants during periodsof no rainfall.
It is anticipated that a constructed wetland retro-fitted into an urban stormwaterbalancing pond will operate as follows:• initially, as storm flows arrive, the flow will pass through the substrate and
therefore subsurface flow treatment will occur.• if the storm flows continue until the water level in the pond rises above the
surface of the substrate, then the constructed wetland will operate as a surfaceflow system.
An emergent vegetation/open water ratio of about 30:70 should be maintained asa minimum in order to sustain ecological utilisation. This ratio is the minimumthreshold for a range of waterfowl and wetland bird species such as mallard,moorhen, coot etc (Hall et al., 1993). The wetland development close to the inletand adjacent fringe will not only be ecologically valuable, but will also enhancemetal, hydrocarbon and nutrient removal as well as help conceal unaestheticchanges in water level. A schematic example of a constructed wetland retrofittedinto a balancing pond is given in Figures 4.1, 4.2 and 4.3.
Figure 4.1 Original On-Stream Wet Retention Balancing Pond BeforeRetrofitting
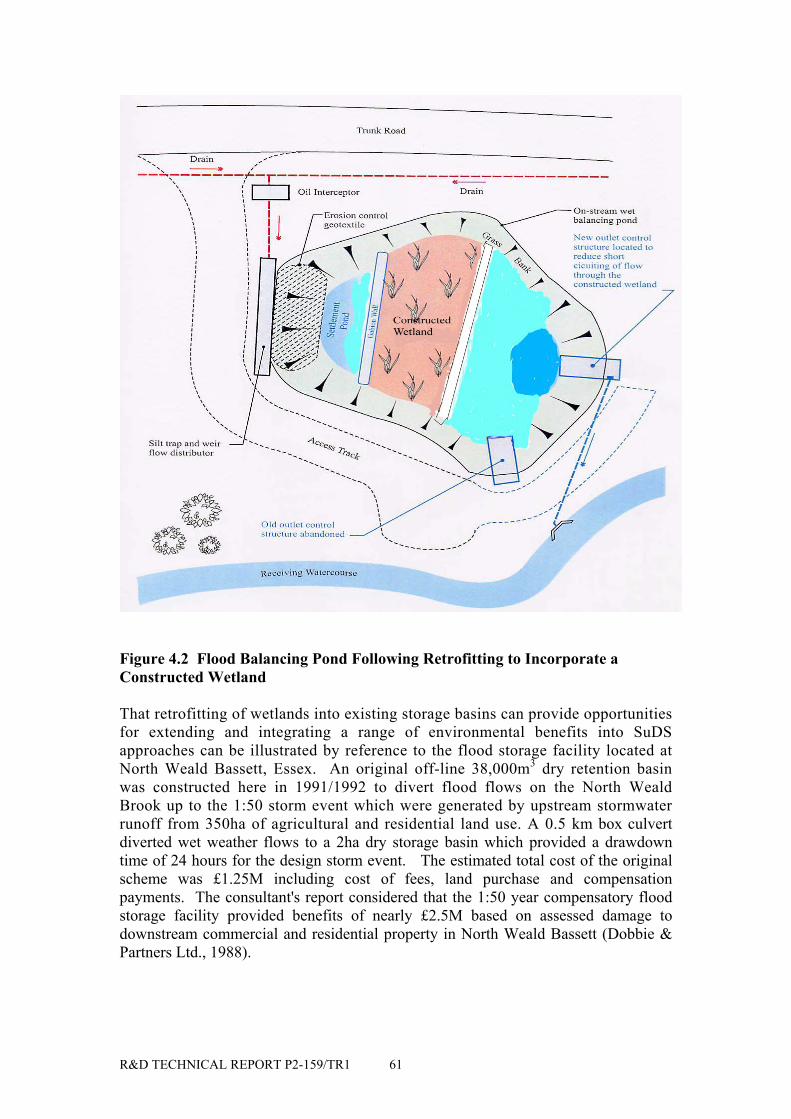
R&D TECHNICAL REPORT P2-159/TR1 61
Figure 4.2 Flood Balancing Pond Following Retrofitting to Incorporate aConstructed Wetland
That retrofitting of wetlands into existing storage basins can provide opportunitiesfor extending and integrating a range of environmental benefits into SuDSapproaches can be illustrated by reference to the flood storage facility located atNorth Weald Bassett, Essex. An original off-line 38,000m3 dry retention basinwas constructed here in 1991/1992 to divert flood flows on the North WealdBrook up to the 1:50 storm event which were generated by upstream stormwaterrunoff from 350ha of agricultural and residential land use. A 0.5 km box culvertdiverted wet weather flows to a 2ha dry storage basin which provided a drawdowntime of 24 hours for the design storm event. The estimated total cost of the originalscheme was £1.25M including cost of fees, land purchase and compensationpayments. The consultant's report considered that the 1:50 year compensatory floodstorage facility provided benefits of nearly £2.5M based on assessed damage todownstream commercial and residential property in North Weald Bassett (Dobbie &Partners Ltd., 1988).
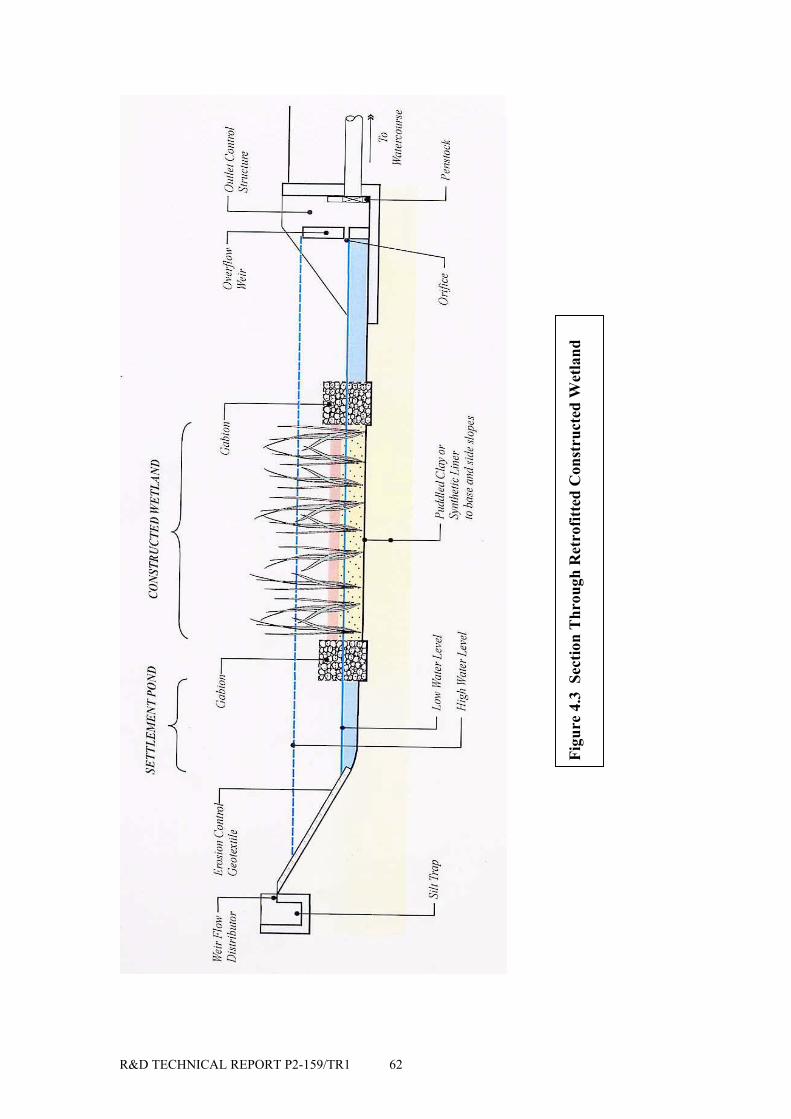
R&D TECHNICAL REPORT P2-159/TR1 62
Figu
re 4
.3 S
ectio
n T
hrou
gh R
etro
fitte
d C
onst
ruct
ed W
etla
nd
R&D TECHNICAL REPORT P2-159/TR1 63
The Wharrage Wetlands, Redditch
A series of retrofitted facilities has been built by the EnvironmentAgency Midlands Region into the existing flood plain of the WixonBrook to store and treat contaminated storm runoff from a 4 km2
urbanised catchment within which 65% is occupied by residential,industrial and highway surfaces. The retrofitted system utilises pools andcut-off meanders to construct storage ponds and reed beds. The wetlandtrain consists of a 0.198ha upper silt and oil trap, a 0.369ha middle flowand quality balancing pond with marginal planting, and a final 0.214hastabilisation and treatment (Phragmites) reed bed; a total 3,500 m3
storage and treatment facility being provided. The excavated silt andspoil has been used to landscape the adjacent river corridor to providevaluable ecological micro-habitats for wildlife and amenity developmentincluding the construction of an artificial badger sett.
The discounted protection benefits excluded consideration of traffic disruption,damage to roads, publicutilities/services or costs ofemergency services. Thus the totalbenefit figures (benefit-cost ratio ofnearly 3:1), were well in excess ofthe capital costs of the flooddiversion and storage scheme.The scheme was completed in1991/1992 with the extendedwetland facility being retrofitted byEpping Forest District Council intothe dry flood storage basin during1995/1996 essentially as a community amenity and educational feature. Spoil fromthe wetland excavation was used to build a small island as a wildlife refuge and toconstruct embayments on the southern margins of the basin with Typha, Phragmitesand Scirpus species being planted to form the wetland vegetation. No considerationwas given in this retrofit design to a water quality treatment function for the wetlandalthough it may provide such a further secondary benefit. The original dry balancingbasin was already fitted with a sediment trap at the inlet to contain coarse solids anddebris prior to discharge into the open basin.
4.2 Wetland Operation and Maintenance Requirements
4.2.1 Introduction
Regular inspections of constructed wetlands must be undertaken to ensure theirproper and continued function. If no maintenance regime is adopted, thenexperience has shown that early failure is likely to occur on many sites (Jefferieset al., 1999). The problems that most frequently occur are blockages ofinlets/outlets, flow regulating devices, siltation of storage areas, algal growth andplant dieback. This means that responsibilities and maintenance routines formaintenance and servicing schedules need to be clearly identified at an earlystage and a distinction made between crisis (remedial) maintenance and regular"good practice" maintenance (Fenner, 2001). Bray (2001b) has developed a fullmaintenance inspection check list intended for the M42 Hopwood Park motorwayservice station area which for the wetland components in the SuDS design suggestmaintenance intervals which vary between monthly (inlet, outlet, drop structures),annually (grass cutting) and bi-annually (valve checks, wetland sediment/plantsetc). In practice, the maintenance frequency will be determined normally by site-specific needs. but maintenance operations should include:• checking inlet and outlet structures• checking weir settings• cleaning-off surfaces where solids and floatable substances have accumulated
to an extent that they may block flows• removal of gross litter/solids• checking sediment accumulation levels (wetlands, sediment traps, infiltration
trenches etc..)• bank erosion
R&D TECHNICAL REPORT P2-159/TR1 64
• general maintenance of the appearance and status of the vegetation and anysurrounding landscaped zones.
The operation and maintenance procedures connected with a constructed wetlandare anticipated to include:
• jetting/cleaning sediment traps, removal of sediment;• maintenance of the substrate and plants;• harvesting;• maintenance of water levels;• maintenance of nutrient levels;• general structure maintenance; and• control of weed growth.
These are described in more detail below. To carry out the operation andmaintenance requirements, "all-weather" vehicular access is required to allconstructed wetlands.
4.2.2 Removal of sediment
Sediments will require removal from settlement trenches, ponds and finalsettlement tank, if present. The purpose of the constructed wetland is to isolateand contain the pollutants originating from urban and highway runoff, either assettled solids or within organic tissue, and prevent them from entering the waterbody. Some of the polluting agents will be degraded through biological processes,but many will persist in the settled sediment and will ultimately need to beremoved and disposed off-site. An effective maintenance programme will need tobe designed. Sediment is likely to be classified as hazardous waste and mayrequire de-watering on site prior to disposal at a licensed waste facility. It issuggested that the routine maintenance programme includes a minimumfrequency of annual inspections to assess whether sediment removal isnecessary and inspection following major storm events to assess whether litterand gross solids have been introduced and need removing. This periodicity can besubsequently reviewed based on experience.
It has been suggested that sediment removal will not be required before 10 - 15years although this operational lifespan will depend on local sedimentation ratesand on whether the wetland basin was subject to solids accumulation during theconstructional phases. The relationship between available storage volume andsolids removal efficiency provides one basis for determining when sedimentremoval may be required. Field determination of accumulated sediment duringregular inspection periods (Figure 4.4) can provide a useful diagnostic method forpredicting when such sediment removal is likely to be necessary.
4.2.3 Maintenance of the substrate and plants
Maintenance requirements of constructed wetlands typically involve ensuringcontinued hydraulic conductivity of the substrate (by washing or replacement),removal of accumulated sludges in the settlement pond and inlet area of thewetland; removal of decaying algae and macrophytes in the settlement trenches,
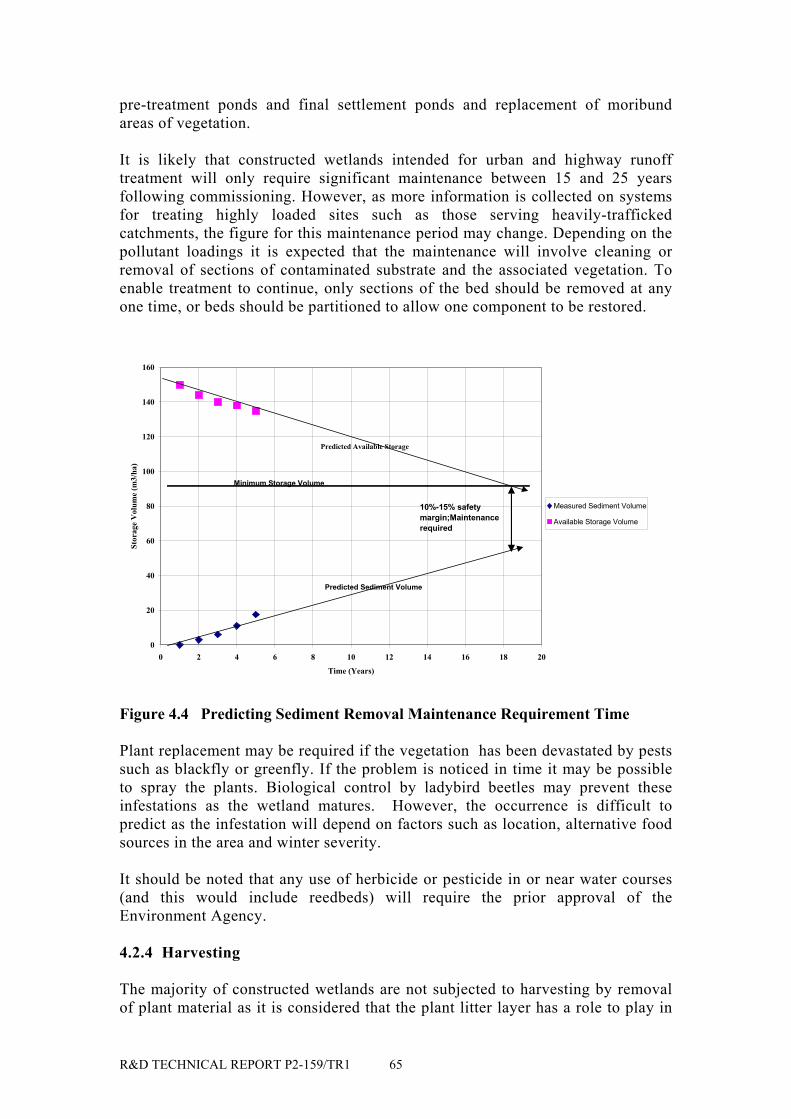
R&D TECHNICAL REPORT P2-159/TR1 65
pre-treatment ponds and final settlement ponds and replacement of moribundareas of vegetation.
It is likely that constructed wetlands intended for urban and highway runofftreatment will only require significant maintenance between 15 and 25 yearsfollowing commissioning. However, as more information is collected on systemsfor treating highly loaded sites such as those serving heavily-traffickedcatchments, the figure for this maintenance period may change. Depending on thepollutant loadings it is expected that the maintenance will involve cleaning orremoval of sections of contaminated substrate and the associated vegetation. Toenable treatment to continue, only sections of the bed should be removed at anyone time, or beds should be partitioned to allow one component to be restored.
0
20
40
60
80
100
120
140
160
0 2 4 6 8 10 12 14 16 18 20
Time (Years)
Stor
age
Vol
ume
(m3/
ha)
Measured Sediment Volume
Available Storage Volume
Minimum Storage Volume
10%-15% safety margin;Maintenance required
Predicted Available Storage
Predicted Sediment Volume
Figure 4.4 Predicting Sediment Removal Maintenance Requirement Time
Plant replacement may be required if the vegetation has been devastated by pestssuch as blackfly or greenfly. If the problem is noticed in time it may be possibleto spray the plants. Biological control by ladybird beetles may prevent theseinfestations as the wetland matures. However, the occurrence is difficult topredict as the infestation will depend on factors such as location, alternative foodsources in the area and winter severity.
It should be noted that any use of herbicide or pesticide in or near water courses(and this would include reedbeds) will require the prior approval of theEnvironment Agency.
4.2.4 Harvesting
The majority of constructed wetlands are not subjected to harvesting by removalof plant material as it is considered that the plant litter layer has a role to play in
R&D TECHNICAL REPORT P2-159/TR1 66
the treatment process by providing thermal insulation for the substrate and a largesurface area of particles from decomposed leaves for the adsorption of metals.However, the harvesting of leaf material from constructed wetlands installed totreat road runoff, will remove metals that have bio-accumulated (Ellis, 1991), andthus help to prolong the wetland life span. However, there is not enoughinformation available at present to decide whether or not harvesting is preferable.
4.2.5 Maintenance of water levels
A suitable outlet control should be installed to regulate the water level; a flexibleplastic pipe linked to a chain is an appropriate low cost option (Cooper et al.,1996). Adjustment of water levels may be required during planting or periods ofdrought. The most expensive maintenance cost would be incurred for replanting iffor example, during a prolonged dry period the wetland was allowed to dry outsufficiently to severely wilt or kill the plants. Again, there is little informationavailable on the hardiness of plants to dry conditions and the critical length ofsuch dry periods. It is known that Typha latifolia requires a water level to bemaintained at or above the surface of the substrate (see Sections 3.3.2 and 3.3.5).Possible prevention measures include:• tankering in water from a nearby water source when necessary;• diverting water into the wetland from adjacent water courses by gravity, if the
topography and water levels allow; or• active pumping of water from a nearby water source such as a river or ground
water aquifer via a borehole. If no electricity supply is available in the areasolar powered pumps could be considered.
The problem of plants dying from lack of water is unlikely to occur every year inthe UK (ie only during summer droughts). Therefore the cost of preventing theproblem should be a key factor in deciding on the appropriate solution. Untilmore information is available on the frequency and severity of the problem, it issuggested that if water cannot be conveniently diverted from a nearby watersource by gravity, then the maintenance programme should include tankering inwater if necessary. At this stage, it does not appear to be economical to install apermanent pumping arrangement.
4.2.6 Maintaining nutrient levels
Constructed wetlands treating road runoff will receive few nutrients. However,nutrient concentrations in urban runoff will vary with the density of gardens andparks within the catchment . Therefore, it may be necessary to spread slowrelease fertiliser pellets periodically. There is not enough information available atpresent to determine the necessity or frequency of such fertiliser application.
4.2.7 Control of weed growth and algae
Periodic flooding of the constructed wetland may be necessary to control weedgrowth when the reeds and aquatic plants are initially growing to maturity.However, the density of reeds at maturity would considerably reduce or eliminatethe possibility of weed growth. A flooding depth of 0.05m is sufficient, which is
R&D TECHNICAL REPORT P2-159/TR1 67
at the lower end of the recommended maximum range of water depths forPhragmites australis (IWA, 2000).
Filamentous algae and blooms of unicellular algae may develop in settlementtrenches and ponds. Cylindrical bales of barley straw wrapped in hessian are beingused successfully on selected treatment wetlands on the A34 Newbury Bypass toeliminate algal infestations.
4.2.8 Monitoring
Monitoring is extremely important to ensure a successful operational performance andearly detection of changes in wetland performance requires adequate data collectionand analysis. All urban stormwater wetlands should be systematically monitored forat least inflow and outflow water quality (concentrations and loadings), water levelsand indicators of biological condition, preferably monthly and minimally on aquarterly seasonal basis. Nuisance species, weed growth and biological condition ofthe plants should also be noted such as reduced lengths of longest leaves, chlorosis orloss of green leaf coloration and curling of the plant leaf tips etc. Water qualityparameters should include temperature, pH, conductivity, DO, BOD, TSS withmetals, hydrocarbons and nutrients as required, together with information on sedimentdepth. One storm event during each season should also be sampled to provideinformation on short-term storm event performance.
Key Issues
• the impact of climatic change on wetland systems and their O&Mrequirements (including influence of prolonged low water levels).
• testing of O&M protocols for varying wetland designs and operation.• long term disposal requirements of contaminated wetland sediments and
predicting sediment maintenance and removal.
R&D TECHNICAL REPORT P2-159/TR1 68
Wetland Amenity Benefits
People find water intrinsically attractive and wetlands create a naturalfocal point in any landscape. Opportunities that add to a wetland amenityinclude:• creation of views over water• designing in "reflection" pools• creation of "visual surprises" through strategic siting of
marginal/surrounding vegetation and gaps through marginal spoilmounds
• provision of wetland access, public open space, walks, jetties andboardwalks, picnic facilities etc
• use of soft engineering techniques e.g. wood, vegetation palettes,anchored willow branches etc
5. URBAN WETLANDS, WILDLIFE AND LANDSCAPEENHANCEMENT
5.1 Multifunctional Use of Urban Wetlands
The 1991 Land Drainage Act, the 1995 Environment Act in addition to the Section 16duties contained in the 1991 Water Resources Act, require that due consideration isgiven to environmental conservation and enhancement in improvement works andnew development. In considering such environmental enhancement, it is essential tobe mindful of local community interests including the need to make water bodies andwetlands both safe and visually acceptable whilst at the same time achieving semi-natural landscapes and habitats. Full amenity development may require the provisionof special facilities which need to be landscaped into the overall wetland design(Adams and Dove, 1984).
The provision of attractive landscape features which enhance the views from vantagepoints around a wetland and from surrounding areas can offer tangible landscapevalue and amenity benefits. Someevidence for this value can be seenfrom increases in land values andhouse prices located adjacent towater features which are notvulnerable to flooding. The"urban wetland lake" concept alsohas a number of intangible benefitswhich include intrinsic, aesthetic,cultural and therapeutic values(Ellis, 1993). The intrinsicbenefits of improved water qualityare the sum of option and existence values (willingness-to-pay), and bequest values(Fisher and Raucher, 1984). For instance, many local people may never directly useany developed recreational or amenity benefits but may still value the maintenance oftheir quality because they know others can enjoy their use or because they value thepreservation and enhancement of the environment they live in. There is considerableevidence that people living close to urban water and wetland bodies have a genuineinterest in wildlife and amenity provision and in opportunities to view wildlife, localwalking and exercising (ap Rheinallt et al., 1992). Public perception of the aestheticand wildlife attributes of urban wetlands places considerable importance on theprovision of a naturalistic and "undisturbed" open space possessing a diversity of floraand fauna and shoreline complexity (House and Sangster, 1991).
Improved water quality and landscaping of urban SUDS structures enhances aestheticvalues for direct recreational and passive amenity use, community stewardship andbequest motives. The social, cultural and therapeutic values placed on clean waterand nature conservation should also not be overlooked in any decision-makingprocess. However, the intangible value of stormwater control and management,although considerable and consisting of several identifiable components, is difficult tomeasure. Nevertheless, it is clear that landscaping and amenity upgrading of wetlandsand urban lakes will stimulate the perceived attractiveness of the wider surroundingcorridor and adjacent areas. Additionally, the more positive the local public attitude
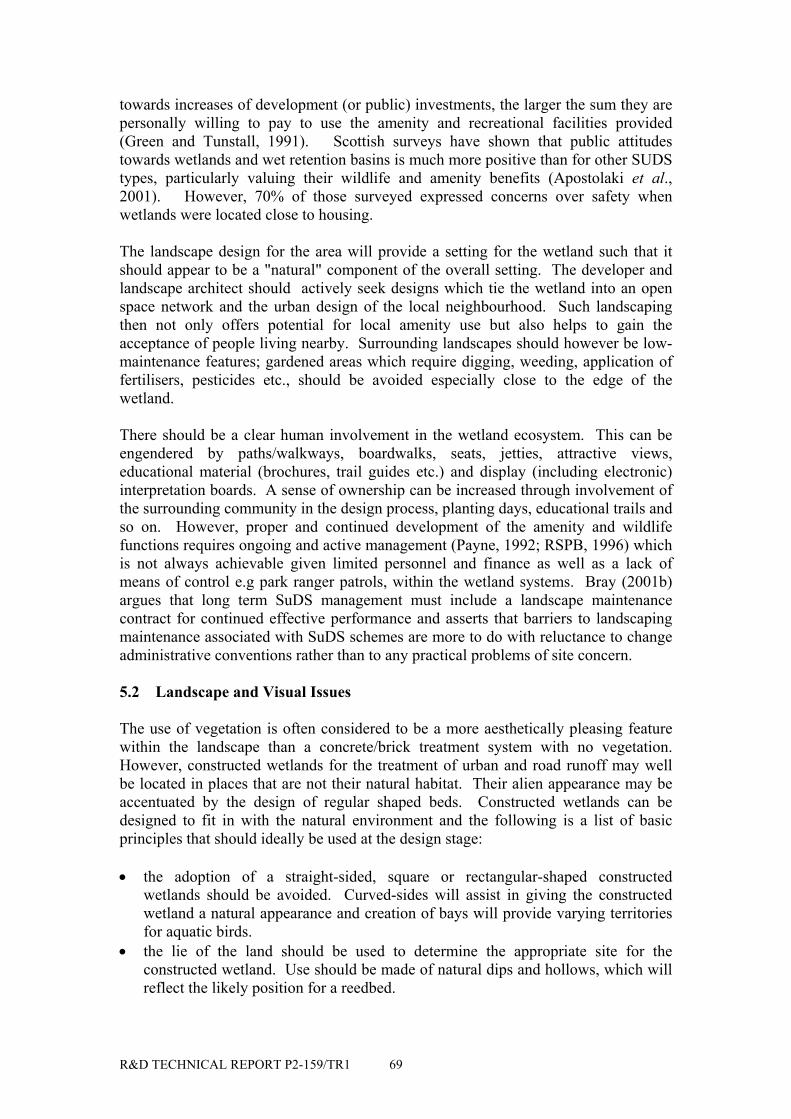
R&D TECHNICAL REPORT P2-159/TR1 69
towards increases of development (or public) investments, the larger the sum they arepersonally willing to pay to use the amenity and recreational facilities provided(Green and Tunstall, 1991). Scottish surveys have shown that public attitudestowards wetlands and wet retention basins is much more positive than for other SUDStypes, particularly valuing their wildlife and amenity benefits (Apostolaki et al.,2001). However, 70% of those surveyed expressed concerns over safety whenwetlands were located close to housing.
The landscape design for the area will provide a setting for the wetland such that itshould appear to be a "natural" component of the overall setting. The developer andlandscape architect should actively seek designs which tie the wetland into an openspace network and the urban design of the local neighbourhood. Such landscapingthen not only offers potential for local amenity use but also helps to gain theacceptance of people living nearby. Surrounding landscapes should however be low-maintenance features; gardened areas which require digging, weeding, application offertilisers, pesticides etc., should be avoided especially close to the edge of thewetland.
There should be a clear human involvement in the wetland ecosystem. This can beengendered by paths/walkways, boardwalks, seats, jetties, attractive views,educational material (brochures, trail guides etc.) and display (including electronic)interpretation boards. A sense of ownership can be increased through involvement ofthe surrounding community in the design process, planting days, educational trails andso on. However, proper and continued development of the amenity and wildlifefunctions requires ongoing and active management (Payne, 1992; RSPB, 1996) whichis not always achievable given limited personnel and finance as well as a lack ofmeans of control e.g park ranger patrols, within the wetland systems. Bray (2001b)argues that long term SuDS management must include a landscape maintenancecontract for continued effective performance and asserts that barriers to landscapingmaintenance associated with SuDS schemes are more to do with reluctance to changeadministrative conventions rather than to any practical problems of site concern.
5.2 Landscape and Visual Issues
The use of vegetation is often considered to be a more aesthetically pleasing featurewithin the landscape than a concrete/brick treatment system with no vegetation.However, constructed wetlands for the treatment of urban and road runoff may wellbe located in places that are not their natural habitat. Their alien appearance may beaccentuated by the design of regular shaped beds. Constructed wetlands can bedesigned to fit in with the natural environment and the following is a list of basicprinciples that should ideally be used at the design stage:
• the adoption of a straight-sided, square or rectangular-shaped constructedwetlands should be avoided. Curved-sides will assist in giving the constructedwetland a natural appearance and creation of bays will provide varying territoriesfor aquatic birds.
• the lie of the land should be used to determine the appropriate site for theconstructed wetland. Use should be made of natural dips and hollows, which willreflect the likely position for a reedbed.
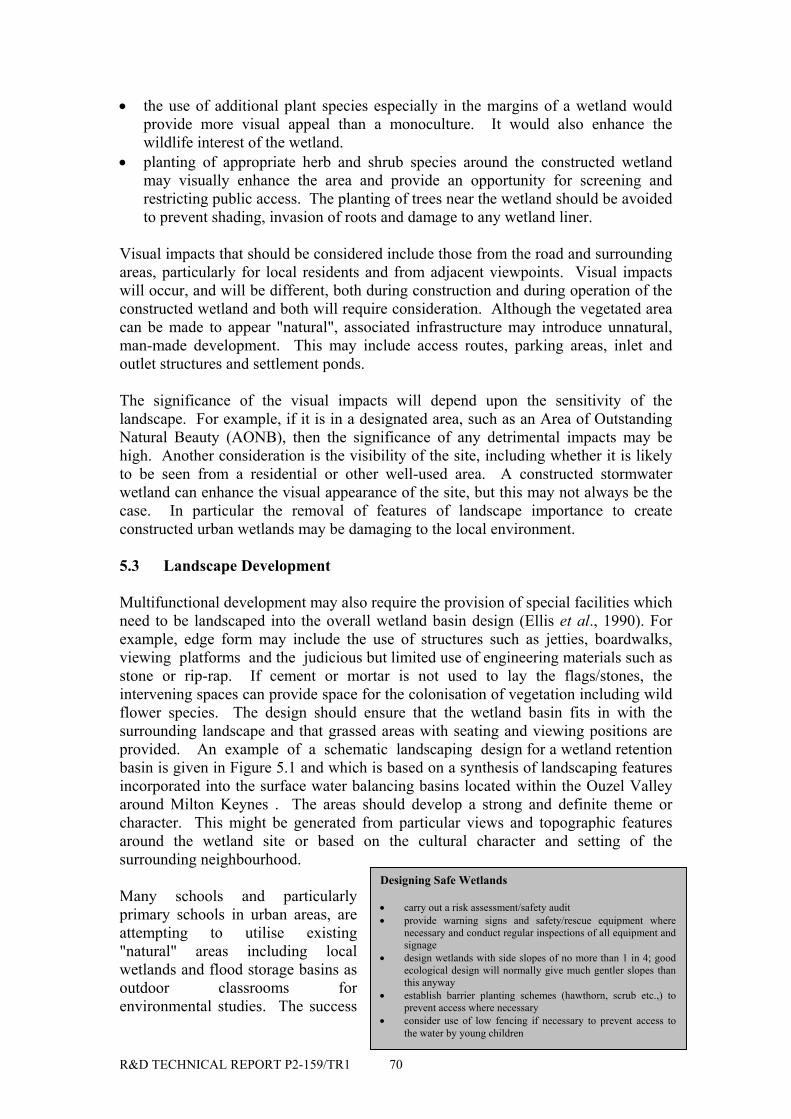
R&D TECHNICAL REPORT P2-159/TR1 70
Designing Safe Wetlands
• carry out a risk assessment/safety audit• provide warning signs and safety/rescue equipment where
necessary and conduct regular inspections of all equipment andsignage
• design wetlands with side slopes of no more than 1 in 4; goodecological design will normally give much gentler slopes thanthis anyway
• establish barrier planting schemes (hawthorn, scrub etc.,) toprevent access where necessary
• consider use of low fencing if necessary to prevent access tothe water by young children
• the use of additional plant species especially in the margins of a wetland wouldprovide more visual appeal than a monoculture. It would also enhance thewildlife interest of the wetland.
• planting of appropriate herb and shrub species around the constructed wetlandmay visually enhance the area and provide an opportunity for screening andrestricting public access. The planting of trees near the wetland should be avoidedto prevent shading, invasion of roots and damage to any wetland liner.
Visual impacts that should be considered include those from the road and surroundingareas, particularly for local residents and from adjacent viewpoints. Visual impactswill occur, and will be different, both during construction and during operation of theconstructed wetland and both will require consideration. Although the vegetated areacan be made to appear "natural", associated infrastructure may introduce unnatural,man-made development. This may include access routes, parking areas, inlet andoutlet structures and settlement ponds.
The significance of the visual impacts will depend upon the sensitivity of thelandscape. For example, if it is in a designated area, such as an Area of OutstandingNatural Beauty (AONB), then the significance of any detrimental impacts may behigh. Another consideration is the visibility of the site, including whether it is likelyto be seen from a residential or other well-used area. A constructed stormwaterwetland can enhance the visual appearance of the site, but this may not always be thecase. In particular the removal of features of landscape importance to createconstructed urban wetlands may be damaging to the local environment.
5.3 Landscape Development
Multifunctional development may also require the provision of special facilities whichneed to be landscaped into the overall wetland basin design (Ellis et al., 1990). Forexample, edge form may include the use of structures such as jetties, boardwalks,viewing platforms and the judicious but limited use of engineering materials such asstone or rip-rap. If cement or mortar is not used to lay the flags/stones, theintervening spaces can provide space for the colonisation of vegetation including wildflower species. The design should ensure that the wetland basin fits in with thesurrounding landscape and that grassed areas with seating and viewing positions areprovided. An example of a schematic landscaping design for a wetland retentionbasin is given in Figure 5.1 and which is based on a synthesis of landscaping featuresincorporated into the surface water balancing basins located within the Ouzel Valleyaround Milton Keynes . The areas should develop a strong and definite theme orcharacter. This might be generated from particular views and topographic featuresaround the wetland site or based on the cultural character and setting of thesurrounding neighbourhood.
Many schools and particularlyprimary schools in urban areas, areattempting to utilise existing"natural" areas including localwetlands and flood storage basins asoutdoor classrooms forenvironmental studies. The success
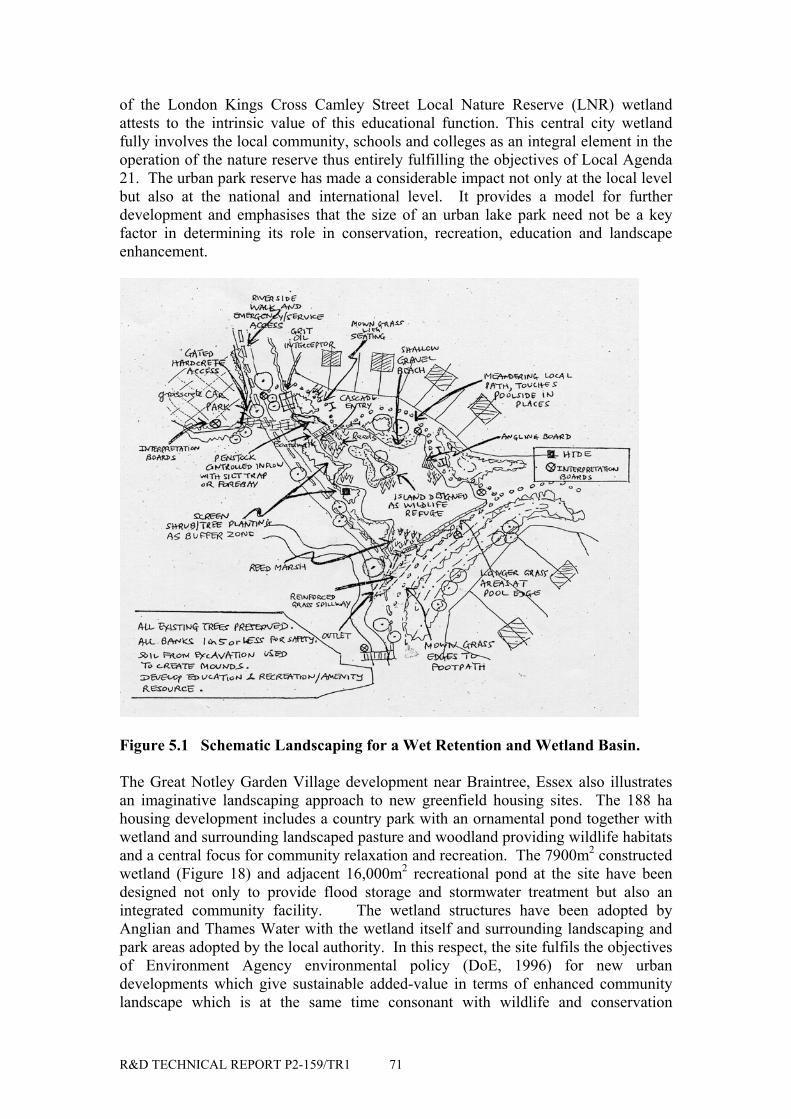
R&D TECHNICAL REPORT P2-159/TR1 71
of the London Kings Cross Camley Street Local Nature Reserve (LNR) wetlandattests to the intrinsic value of this educational function. This central city wetlandfully involves the local community, schools and colleges as an integral element in theoperation of the nature reserve thus entirely fulfilling the objectives of Local Agenda21. The urban park reserve has made a considerable impact not only at the local levelbut also at the national and international level. It provides a model for furtherdevelopment and emphasises that the size of an urban lake park need not be a keyfactor in determining its role in conservation, recreation, education and landscapeenhancement.
Figure 5.1 Schematic Landscaping for a Wet Retention and Wetland Basin.
The Great Notley Garden Village development near Braintree, Essex also illustratesan imaginative landscaping approach to new greenfield housing sites. The 188 hahousing development includes a country park with an ornamental pond together withwetland and surrounding landscaped pasture and woodland providing wildlife habitatsand a central focus for community relaxation and recreation. The 7900m2 constructedwetland (Figure 18) and adjacent 16,000m2 recreational pond at the site have beendesigned not only to provide flood storage and stormwater treatment but also anintegrated community facility. The wetland structures have been adopted byAnglian and Thames Water with the wetland itself and surrounding landscaping andpark areas adopted by the local authority. In this respect, the site fulfils the objectivesof Environment Agency environmental policy (DoE, 1996) for new urbandevelopments which give sustainable added-value in terms of enhanced communitylandscape which is at the same time consonant with wildlife and conservation
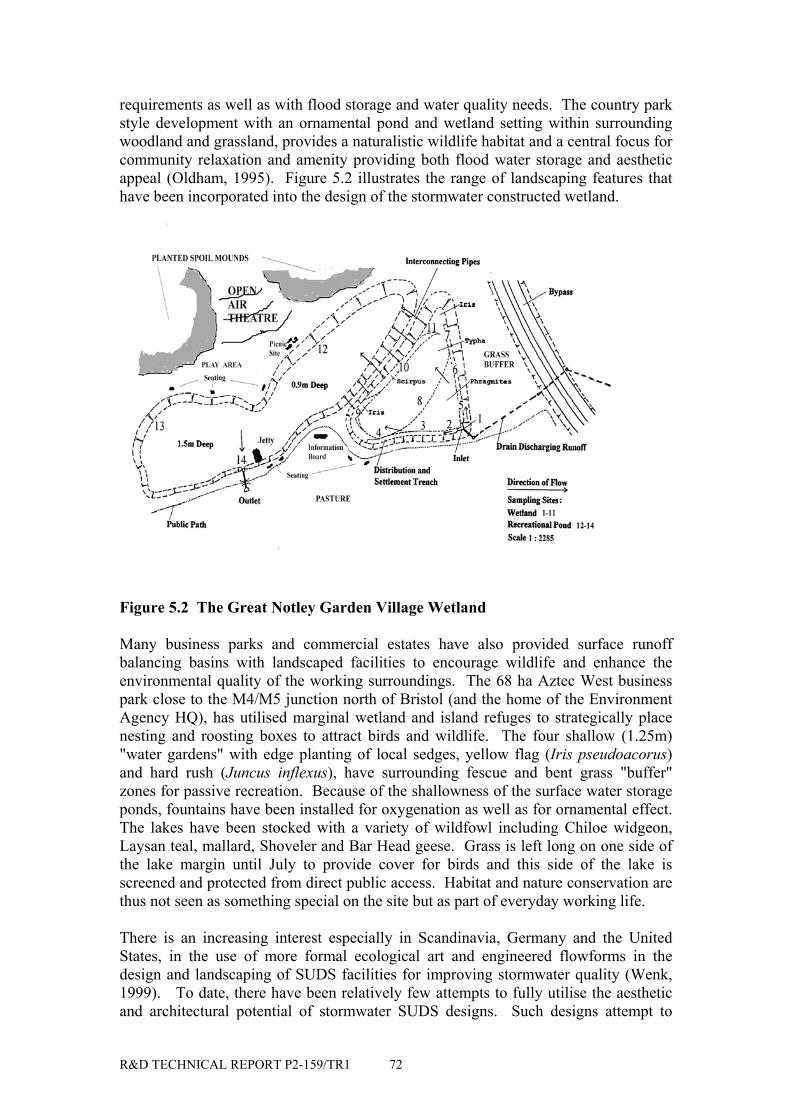
R&D TECHNICAL REPORT P2-159/TR1 72
requirements as well as with flood storage and water quality needs. The country parkstyle development with an ornamental pond and wetland setting within surroundingwoodland and grassland, provides a naturalistic wildlife habitat and a central focus forcommunity relaxation and amenity providing both flood water storage and aestheticappeal (Oldham, 1995). Figure 5.2 illustrates the range of landscaping features thathave been incorporated into the design of the stormwater constructed wetland.
Figure 5.2 The Great Notley Garden Village Wetland
Many business parks and commercial estates have also provided surface runoffbalancing basins with landscaped facilities to encourage wildlife and enhance theenvironmental quality of the working surroundings. The 68 ha Aztec West businesspark close to the M4/M5 junction north of Bristol (and the home of the EnvironmentAgency HQ), has utilised marginal wetland and island refuges to strategically placenesting and roosting boxes to attract birds and wildlife. The four shallow (1.25m)"water gardens" with edge planting of local sedges, yellow flag (Iris pseudoacorus)and hard rush (Juncus inflexus), have surrounding fescue and bent grass "buffer"zones for passive recreation. Because of the shallowness of the surface water storageponds, fountains have been installed for oxygenation as well as for ornamental effect.The lakes have been stocked with a variety of wildfowl including Chiloe widgeon,Laysan teal, mallard, Shoveler and Bar Head geese. Grass is left long on one side ofthe lake margin until July to provide cover for birds and this side of the lake isscreened and protected from direct public access. Habitat and nature conservation arethus not seen as something special on the site but as part of everyday working life.
There is an increasing interest especially in Scandinavia, Germany and the UnitedStates, in the use of more formal ecological art and engineered flowforms in thedesign and landscaping of SUDS facilities for improving stormwater quality (Wenk,1999). To date, there have been relatively few attempts to fully utilise the aestheticand architectural potential of stormwater SUDS designs. Such designs attempt to
R&D TECHNICAL REPORT P2-159/TR1 73
combine art, water treatment and biology in a more formal sculptural manner. Theapproach emphasises the integration of stormwater and pollution control withecological and civic functions. A unique example in the UK can be seen in the site-specific, hydroglyph sculptures integrated into and around tarns and ponds in theGrizedale Forest Sculpture Park in the Lake District (Hull, 1993). These stoneworkforms provide wildlife habitat enhancement and observation stations for the 300,000annual visitors to the park. The award-winning "Strategic Framework" of MBMArquitectes Ltd for the lower Lea Valley in E London includes a proposal for a 80hectare "wetland square" to similarly integrate ecological and civic functions. Sourcecontrol SUDS options will ensure that surface runoff to the sculptured wetland will becarefully managed as part of the overall urban regeneration scheme.
5.4 Wetland Wildlife Considerations
The use of vegetation, with the inevitable micro-organisms (whether introduced ornaturally colonised), in effect constitutes a wetland habitat which is likely to proveattractive to a range of other wildlife species. Wildlife plays a subtle but importantrole in treatment wetlands since they are consumers that keep nutrients in circulationand regulate the populations of lower trophic levels in a manner that maximisessystem function (Worrall et al., 1996) as well as enhancing aesthetic aspects.Perception surveys of urban wetlands strongly support the public appreciation of theirwildlife potential with bird and wildlife watching being particularly highly valued(Mungur, 1997;Apostolaki et al., 2001). A stormwater constructed wetland has thepotential to improve the quality of the water reaching the local streams and rivers.This is likely to lead to ecological improvements in the aquatic habitats and a recentpilot survey of Scottish SuDS ponds and wetlands shows that they can support quiterich wildlife communities largely dominated by common species although mostwetlands were found not to fulfil their ecological potential (SEPA, 2000). This mayessentially be due to the problem of disturbance and the lack of a protective buffer-zone for most bird and other wildlife species in what are essentially public openspaces. In smaller wetlands, some form of screening or exclusion refuges may needto be provided if wildlife is to be encouraged.
Consideration must be given to the scope for implementing ecological principles intothe design and management of urban wetland SUDS but it is essential to recognisethat these schemes are part of the wider environment and as such should be integratedwherever possible with existing semi-natural habitats as well as with the needs ofurban development. It is only through such an integrated approach that localbiodiversity (biological diversity of habitats and species) can be preserved. Asindicated in Table 5.1, urban wetlands can offer considerable potential wildlifebenefits with high conservation value if designed and implemented carefully. Pondsthat have been allowed to colonise naturally tend to have the highest ecological valueand although dominated by common species, these wetlands may also support locallyuncommon submerged plant species as well as mudwart (Limosella aquatica), newtsand water voles. All this is an indication of the potential of urban wetland SuDS forproviding new habitat for key species including UK Biodiversity Action Plan (BAP)species; a useful listing of ways to maximise the nature conservation value of SuDSponds and wetlands is given in Powell et al., 2001 and have been incorporated into thelist of bullet points given below. In the Scottish SuDS surveys (Pond Action, 2000),the richest of the wetlands were those located in an area of extensive unimproved
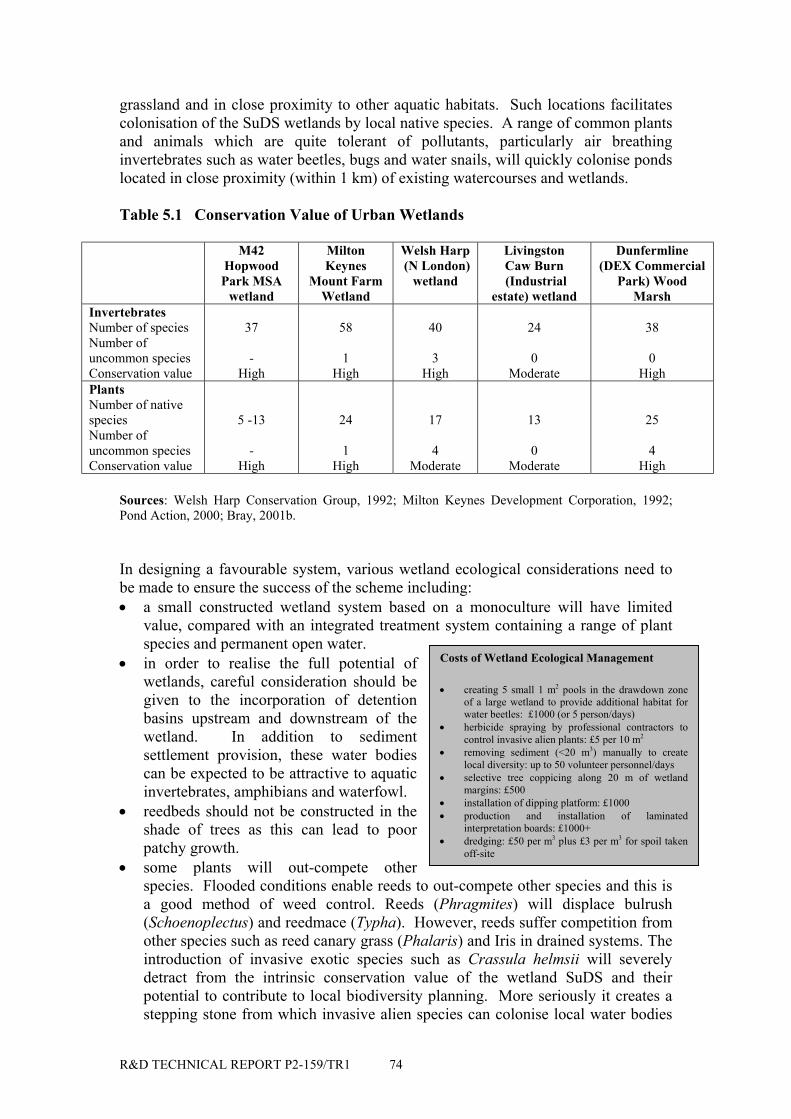
R&D TECHNICAL REPORT P2-159/TR1 74
Costs of Wetland Ecological Management
• creating 5 small 1 m2 pools in the drawdown zoneof a large wetland to provide additional habitat forwater beetles: £1000 (or 5 person/days)
• herbicide spraying by professional contractors tocontrol invasive alien plants: £5 per 10 m2
• removing sediment (<20 m3) manually to createlocal diversity: up to 50 volunteer personnel/days
• selective tree coppicing along 20 m of wetlandmargins: £500
• installation of dipping platform: £1000• production and installation of laminated
interpretation boards: £1000+• dredging: £50 per m3 plus £3 per m3 for spoil taken
off-site
grassland and in close proximity to other aquatic habitats. Such locations facilitatescolonisation of the SuDS wetlands by local native species. A range of common plantsand animals which are quite tolerant of pollutants, particularly air breathinginvertebrates such as water beetles, bugs and water snails, will quickly colonise pondslocated in close proximity (within 1 km) of existing watercourses and wetlands.
Table 5.1 Conservation Value of Urban Wetlands
M42HopwoodPark MSA
wetland
MiltonKeynes
Mount FarmWetland
Welsh Harp (N London)
wetland
LivingstonCaw Burn (Industrial
estate) wetland
Dunfermline(DEX Commercial
Park) WoodMarsh
InvertebratesNumber of speciesNumber ofuncommon speciesConservation value
37
-High
58
1High
40
3High
24
0Moderate
38
0High
PlantsNumber of nativespeciesNumber ofuncommon speciesConservation value
5 -13
-High
24
1High
17
4Moderate
13
0Moderate
25
4High
Sources: Welsh Harp Conservation Group, 1992; Milton Keynes Development Corporation, 1992;Pond Action, 2000; Bray, 2001b.
In designing a favourable system, various wetland ecological considerations need tobe made to ensure the success of the scheme including:• a small constructed wetland system based on a monoculture will have limited
value, compared with an integrated treatment system containing a range of plantspecies and permanent open water.
• in order to realise the full potential ofwetlands, careful consideration should begiven to the incorporation of detentionbasins upstream and downstream of thewetland. In addition to sedimentsettlement provision, these water bodiescan be expected to be attractive to aquaticinvertebrates, amphibians and waterfowl.
• reedbeds should not be constructed in theshade of trees as this can lead to poorpatchy growth.
• some plants will out-compete otherspecies. Flooded conditions enable reeds to out-compete other species and this isa good method of weed control. Reeds (Phragmites) will displace bulrush(Schoenoplectus) and reedmace (Typha). However, reeds suffer competition fromother species such as reed canary grass (Phalaris) and Iris in drained systems. Theintroduction of invasive exotic species such as Crassula helmsii will severelydetract from the intrinsic conservation value of the wetland SuDS and theirpotential to contribute to local biodiversity planning. More seriously it creates astepping stone from which invasive alien species can colonise local water bodies
R&D TECHNICAL REPORT P2-159/TR1 75
that support a high quality native vegetation, which may be threatened by thecompetitive nature of these alien species.
• reedbeds should not be planted near willow trees (Salix) since seeds will bedeposited into the wetland bed and the resulting willow trees, with deep roots,may damage any liner that is present (Cooper et al., 1996).
• the creation of undulating "hummocky margins" in shallow waters of retrofittedwetland designs; these mimic the natural physical diversity of semi-naturalhabitats. Smooth finished surfaces provide less physical habitat diversity foranimals.
• shallow water and nutrient-rich wet mud provides ideal habitat for amphibians andinvertebrates. This is a key habitat for many small annual wetland plant speciesthat is often lost in the later stages of pond succession.
• spits and islands encourage invertebrates and wildfowl; grazing and trampling bywildfowl will also often diversify marginal wetland habitats.
• the encouragement of a mosaic development of marginal plants to maximisehabitat structural diversity eg Glyceria fluitans (floating sweet-grass) whichprovides good habitat for newts and other invertebrates.
• the checking of planting schemes one and two years after establishment to ensurethat specifications have been carried out and undertake immediate remedial actionif invasive species are found.
• the land adjacent to the SUDS wetland can provide important terrestrial (foragingand hibernation) habitat for amphibians and nesting birds where managedsensitively. The vegetation should remain largely uncut to provide cover andshould be planted only with native trees and shrubs such as willow (Salix fragilisor Salix caprea), alder, ash and hawthorn.
• including wherever possible, a short after-care programme about one year aftercreation. Use this to (a) undertake fine-tuning of the wetland design and (b) tocapitalise on new opportunities that may have arisen e.g re-profiling margins,natural seepage to create new pools etc. Fine-tuning of this sort costs very littlebut will often greatly increase the biodiversity value.
The management of fish in wetlands should aim to promote a community whichminimises the effect on algal and submerged water plant growth. Fish may influencelake ecology by selective predation of zooplankton which in turn reduces the grazingpressure on phytoplankton and increases the tendency for algal blooms to occur. Oneof the principal fish species responsible for these problems is the Bream . Fish mayalso be involved in nutrient recycling through feeding on the sediments and throughdigestion of particulate organic matter. Carp has been identified as a principal agent ofsuch pathways. Carp and bream populations should be reduced and the wetlandrestocked with tench and crucian carp which have a less damaging effect. Pike canalso be added as a predator when water clarity has improved ( Mc Caskie and Lee,1996).
Urban wetland habitats can be the basis for successful wildlife reserves and there aremany examples of artificial wetlands which have acquired a wildlife value equivalentto that of natural wetlands and two examples are given here.
• The Sandwell Valley flood storage Forge Mill Pond at Great Barr,Birmingham was constructed in 1982 at a cost of approximately £1 Million.The central 8 ha lake is used for canoeing, windsurfing and dinghy sailing
R&D TECHNICAL REPORT P2-159/TR1 76
with the 2ha restricted-access eastern arm (0.5m deep) incorporating a 0.25 haintroduced wetland marsh with landscaped surroundings totalling some 10 ha.The constructed SF wetland is mostly planted with Phragmites australisinterspersed with some Typha, lesser reed mace and pockets of Phalaris; allplants were introduced from a local reserve at Droitwich in the 1984-1985period. The amenity and recreational facilities are administered by theSandwell Metropolitan Borough Council with the wetland reserve and naturecentre being operated by the RSPB. The wetland is now a designated wildlifereserve and despite the central urban location, over 130 species of birds arerecorded annually with breeding grebes, whinchats, marsh harriers, winteringteal and snipe as well as waders such as migratory dunlin encouraged by theprovision of a "scrape" in the drier area of the marsh. Over 35,000 people ayear visit the wetland site where the RSPB operate an educational centre in theheart of the West Midlands conurbation. In order to maintain ecologicaldiversity and encourage the breeding of new species, an active policy ofhabitat management has been devised with a warden overseeing the reserveand adjacent country park supported by a naturalist and part-time volunteers.
• A similar and highly successful wildlife habitat has been established in thesemi-natural wetlands that have developed in the 96 ha Welsh Harp floodstorage basin in N London which was designated as a Site of Special ScientificInterest (SSSI) in 1950. The wetland basin drains a 5 km2 catchment area ofwhich 65% is highly urbanised with some 60% of the annual flow volumebeing derived from impermeable urban surfaces (Hall, 1977). Oil booms havebeen installed at the stream inlets to the basin with trash screens and anautomated "grab" litter and gross solids collector. The flood storage basinprovides an efficient treatment removing between 50% - 80% of both waterand sediment mean total hydrocarbons (see also Box in Section 1.2.2) andachieving up to 97% reduction in total suspended solids (Jones, 1995). Thewetland is dominated by Typha latifolia and Phragmites australis with lesserareas occupied by Phalaris and Salix woodland. Studies have indicated thatthe plant rhizomes provide a matrix for contaminated sediment trapped by thebiofiltration effect of the plant stems and roots. As much as 54% - 61% of thetotal metal uptake is stored in the rhizome (Shutes et al., 1993).
24 floating vegetated rafts have been provided as nesting/roosting sites as abasis for a flourishing wildlife refuge. Over 100 bird species are regularlyrecorded annually with over 40 breeding species of Great Crested Grebes aswell as kingfishers, cormorants, shags, grey herons and bitterns; the rafts alsoattract several pairs of common tern, Sterna hirundo. Marginal sedgemarshland, 2m dykes and the planting of impenetrable shrubbery preventsgeneral public access to sensitive breeding sites and observation hides. Awide 30 - 60m buffer zone surrounds the 2 km shoreline and provides alandscaped open space with viewing points, pathways, seating and naturewalks as well as accompanying information/interpretation boards provided foraesthetic and general educational needs.
The management of the wildlife habitats is the responsibility of a volunteerConservation Group who sit on a Joint Committee with local authority andEnvironment Agency representatives. There is a fully staffed Field Centre on
R&D TECHNICAL REPORT P2-159/TR1 77
the site which offers day visits, short courses and other environmentaleducational training. Two countryside rangers lead guided walks, liaise withthe local community and protect the conservation interests. However,conservation management of the wetland habitats is limited by local authorityfunds and is largely dependent on the goodwill of volunteers. The reeds createa valuable wildlife habitat for waterfowl and birds but require continualmaintenance and long term control of succession to willow carr development.The wetland has recently been dredged in sections which involved the de-watering of contaminated sediment on-site and costly disposal to landfill(Batten, 1989). Silt removal does provide some opportunities however, and atthe Welsh Harp was used to create irregularly shaped banks and islands tomaximise water-land interface creating more suitable nesting sites.
Consideration must also be given to the potential for stormwater constructed wetlandsto be harmful to the wildlife they attract as a result of direct poisoning or throughpollutant bio-accumulation. The current understanding of the way pollutants affectorganisms is far from comprehensive (Merritt, 1994), which makes it difficult toassess whether or not wildlife will be at risk from a constructed wetland treatingcontaminated urban and road runoff. Polluted wetlands are not universally good forwildlife, but they can provide valuable habitats for some forms of wildlife, providinghigh levels of toxic substances are not readily bio-available. Further monitoring ofpollutant pathways through food chains in urban wetlands and of wildlife colonisationpatterns is required to provide firmer evidence on the appropriateness of such SuDShabitats as wildlife refuges.
A number of further issues in relation to wetland ecology and wildlife may need to beconsidered as SuDS are introduced for urban stormwater treatment over the next 5 to10 years:
• how will the frequency and practice of sediment removal impact upon rates ofrecovery and successional processes within these wetlands?
• how much do different aquatic plants differ in their value within wetland SuDS interms of removing pollutants such as heavy metals, nutrients, hydrocarbons etc.,and does this affect what vegetation should be encouraged at the outset?
• it is known that substantial die-back of common reed can occur under regimes ofhigh toxic and nutrient loading and low oxygen availability. Whilst this is not aconcern at the current stage of wetland SuDS implementation, it could be an issuein 10 years time and might then have a bearing on safety and amenity issues.
• urban wetland SuDS can become dominated by phytoplankton (perhaps also withthe occurrence of blue-green algae). Whilst this may be eliminated by installingbarley straw bales in pre-treatment settlement lagoons in a constructed wetland, itmay prove more difficult to reverse in wetlands having significant areas of openwater. In addition, illegal stocking of fish is common in retention ponds withinsuburban areas and is probably an inevitability in many wetland SuDS.Introduction of carp in particular can be a problem as these bottom-feeding fishcan promote nutrient release from sediments. Whilst fish stocking will not impacton the primary function of the wetland SuDS, it could have major implications foramenity and conservation value. However, given that SuDS wetlands can bedrained and fish removed, these might be fairly minor concerns, but an official
R&D TECHNICAL REPORT P2-159/TR1 78
management response to fish introduction into a wetland SuDS is worthconsidering.
Key Issues
• influence of wetland landscaping on enhancement of development land valuesand construction unit prices.
• public attitudes to, and concerns regarding, wetland provision in urban areas.• use of interpretive materials, educational facilities and formal amenity/wildlife
management in developing local attitudes to urban wetlands.• incompatibilities and inconsistencies between multifunctional uses of urban
wetland systems especially in terms of long term flow and water qualitycontrol.
• conservation value of urban wetlands and “after-care” programmes forwetland landscaping.
• role of fish (especially carp) in urban wetlands and management controlstrategies.
R&D TECHNICAL REPORT P2-159/TR1 79
6. SuDS IMPLEMENTATION AND CATCHMENT PLANNING
6.1 Introduction: The Need for Integrated Approaches
SuDS do not operate as a series of isolated drainage devices but should be designedand operated holistically. Each component adds to the performance of the whole ofthe drainage system. Such a policy perspective needs integrated participation of allstakeholders within a catchment-wide planning framework. The responsibilities andduties associated with urban surface water drainage in England & Wales are complexwith the principal stakeholders including:
• The Environment Agency• Local Councils• Water companies• Highway authorities• Developers• Non-Governmental Organisations (NGOs) and riparian owners
However, the duty for provision of drainage services for water companies as well aspublic and government bodies, is limited to that which is deemed to be affordable;there is no absolute duty to provide for expensive rare and extreme storm events. Thestatutory duty is confined to provide an effective service, and compensation forflooding and associated pollution is only a liability in the event of negligence.Flooding and pollution of any frequency, even when caused by inadequate provision,is still an insurable loss. Due to the strength of the regulation, and the conflict betweenindividual customer service and responsibility for the community at large, WaterCompanies are in the "front-line" for criticism and are frequently called on to takeaction ahead of other responsible bodies. This pressure to act promptly has increasedover the last five years, and it is felt that additional loading may be placed on sewersystems because the performance of other drainage systems has not kept pace withrising customer expectations and this has sharpened anxiety over innovative SuDStechnology. Land drainage provisions and the right of riparian owners can also becomplex, and there is a growing concern for the proliferation of dispersed, minorcontrol systems for the general protection of urban watercourses and designated mainrivers.
Improvements in urban drainage infrastructure need to keep pace with thecommunities which are served, but far too frequently conflicting agenda are evident.There is evidence for different standards of both design and operation in urbandrainage systems even between Water Companies, and there is insufficient correlationand coordination between the standards used for highway and land drainage design.There are known limitations to the modelling of both overland flows andsurface/sewered water quality as well as in the choice of appropriate rainfall intensityand frequency of occurrence for designing integrated systems. However, thesuccessful implementation of SuDS technology relies on an integrated partnershipapproach and as such, the continued development and adoption of SuDS techniquesoffers an important vehicle for introducing improvements and benefits to urbancommunity and catchment planning.
R&D TECHNICAL REPORT P2-159/TR1 80
Urban wetland SuDS systems that function as flow and/or water quality controlfacilities for stormwater runoff normally discharge to controlled receiving waterswithin a defined catchment. It is therefore appropriate to review relevant catchment-based UK legislative and planning policy and practice together with perspectives onthe implications of the EU Water Framework Directive for the management of diffuseurban surface water drainage and stormwater wetlands. Appendix C providesinformation on general discharge standards and consents for surface waters and detailsof the structure of existing receiving water quality classification within England &Wales. A brief outline is also given in Appendix C of sediment quality standardswhich might be appropriately applied as “limit” loadings for the contaminatedsediment which accumulates within urban stormwater wetland systems.
Water pollution control in the UK has traditionally taken account of the dilutionavailable within the receiving water. Environmental Quality Standards (EQS) havebeen defined for particular pollutants and discharges have been consented to ensurethat these EQSs are not exceeded. The (as amended) 1974 Control of Pollution Acthas been used to implement this approach and the interpretation of the Section 34consenting powers have been strictly related to water quality considerations.However, the EQS approach is not applicable for controlling the discharge ofcontaminated urban surface water. The impact cannot be readily modelled; the toxiccomponents are not defined; offenders are not easily traced; and EQSs are notavailable for the possible contaminants in sediment. In addition, a characteristic ofurban diffuse pollution is that environmental impacts are often cumulative; by thetime the case can be firmly proven, the damage may be irrevocable.
The only effective means of ensuring the protection of urban receiving waters isfirstly to require best environmental practice (i.e reduce at source) and subsequentlyminimise the discharge of polluting material (through appropriate and effectivemitigation measures to deal with unavoidable levels of contamination). Such anapproach has been developed and applied in the forestry sector in the UK. Theguidance as set out in "Forest and Water Guidelines" is enforced in effect, by theForestry Authority who administer payments for forestry schemes. The question iscan such similar best practice be encouraged, and where appropriate enforced, in theurban sector which is the source of many diffuse pollution problems? Somepossibilities for the encouragement and dissemination of “best practice” areconsidered in the following sections.
6.2 SuDS and the EU Water Framework Directive
6.2.1 Objectives and key elements
The implementation of the EU Water Framework Directive (WFD) has majorconsequences for the protection of the aquatic environment including urban wetlands,which will require the UK to produce integrated catchment-based plans for dealingwith diffuse pollution sources, including those generated within urban areas. It iswithin the legislative context of the WFD that perhaps the greatest opportunities willarise for the consideration and inclusion of SuDS approaches within future urban landuse planning programmes. The WFD offers opportunities to review the adequacy ofcurrent regulatory measures for controlling and managing urban diffuse pollution and,in the light of such review, to either modify them or seek new powers. The key
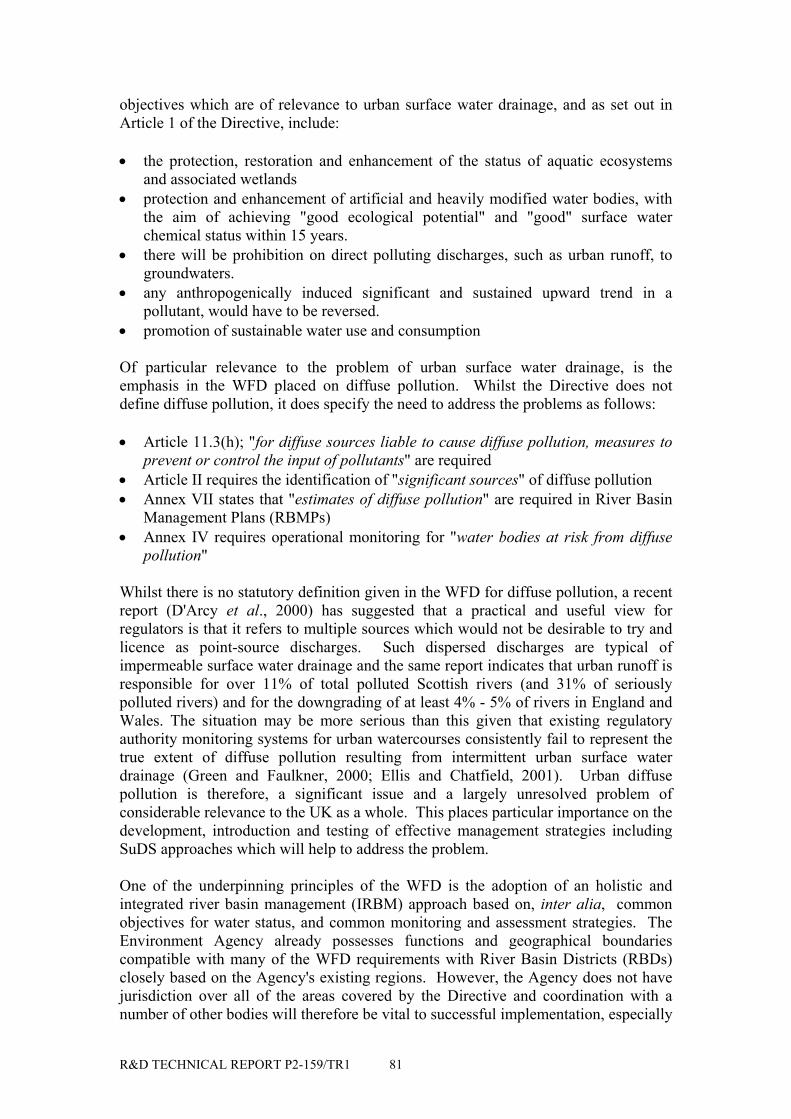
R&D TECHNICAL REPORT P2-159/TR1 81
objectives which are of relevance to urban surface water drainage, and as set out inArticle 1 of the Directive, include:
• the protection, restoration and enhancement of the status of aquatic ecosystemsand associated wetlands
• protection and enhancement of artificial and heavily modified water bodies, withthe aim of achieving "good ecological potential" and "good" surface waterchemical status within 15 years.
• there will be prohibition on direct polluting discharges, such as urban runoff, togroundwaters.
• any anthropogenically induced significant and sustained upward trend in apollutant, would have to be reversed.
• promotion of sustainable water use and consumption
Of particular relevance to the problem of urban surface water drainage, is theemphasis in the WFD placed on diffuse pollution. Whilst the Directive does notdefine diffuse pollution, it does specify the need to address the problems as follows:
• Article 11.3(h); "for diffuse sources liable to cause diffuse pollution, measures toprevent or control the input of pollutants" are required
• Article II requires the identification of "significant sources" of diffuse pollution• Annex VII states that "estimates of diffuse pollution" are required in River Basin
Management Plans (RBMPs)• Annex IV requires operational monitoring for "water bodies at risk from diffuse
pollution"
Whilst there is no statutory definition given in the WFD for diffuse pollution, a recentreport (D'Arcy et al., 2000) has suggested that a practical and useful view forregulators is that it refers to multiple sources which would not be desirable to try andlicence as point-source discharges. Such dispersed discharges are typical ofimpermeable surface water drainage and the same report indicates that urban runoff isresponsible for over 11% of total polluted Scottish rivers (and 31% of seriouslypolluted rivers) and for the downgrading of at least 4% - 5% of rivers in England andWales. The situation may be more serious than this given that existing regulatoryauthority monitoring systems for urban watercourses consistently fail to represent thetrue extent of diffuse pollution resulting from intermittent urban surface waterdrainage (Green and Faulkner, 2000; Ellis and Chatfield, 2001). Urban diffusepollution is therefore, a significant issue and a largely unresolved problem ofconsiderable relevance to the UK as a whole. This places particular importance on thedevelopment, introduction and testing of effective management strategies includingSuDS approaches which will help to address the problem.
One of the underpinning principles of the WFD is the adoption of an holistic andintegrated river basin management (IRBM) approach based on, inter alia, commonobjectives for water status, and common monitoring and assessment strategies. TheEnvironment Agency already possesses functions and geographical boundariescompatible with many of the WFD requirements with River Basin Districts (RBDs)closely based on the Agency's existing regions. However, the Agency does not havejurisdiction over all of the areas covered by the Directive and coordination with anumber of other bodies will therefore be vital to successful implementation, especially
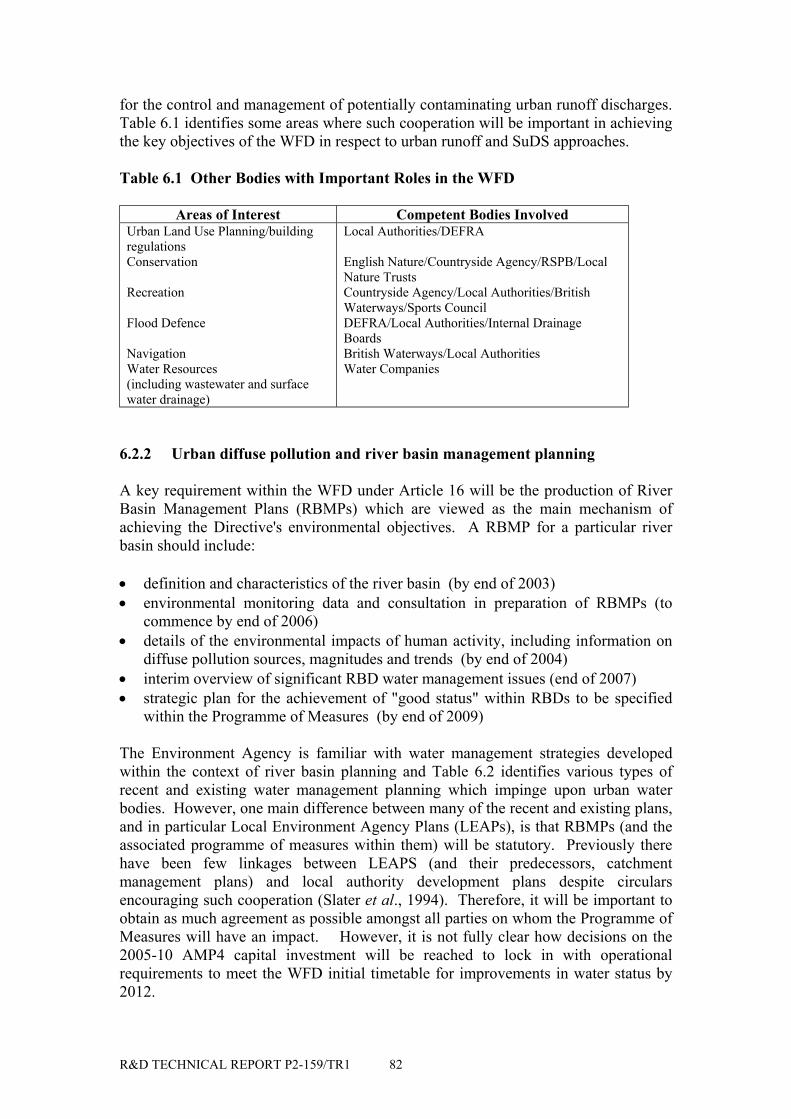
R&D TECHNICAL REPORT P2-159/TR1 82
for the control and management of potentially contaminating urban runoff discharges.Table 6.1 identifies some areas where such cooperation will be important in achievingthe key objectives of the WFD in respect to urban runoff and SuDS approaches.
Table 6.1 Other Bodies with Important Roles in the WFD
Areas of Interest Competent Bodies InvolvedUrban Land Use Planning/buildingregulationsConservation
Recreation
Flood Defence
NavigationWater Resources(including wastewater and surfacewater drainage)
Local Authorities/DEFRA
English Nature/Countryside Agency/RSPB/LocalNature TrustsCountryside Agency/Local Authorities/BritishWaterways/Sports CouncilDEFRA/Local Authorities/Internal DrainageBoardsBritish Waterways/Local AuthoritiesWater Companies
6.2.2 Urban diffuse pollution and river basin management planning
A key requirement within the WFD under Article 16 will be the production of RiverBasin Management Plans (RBMPs) which are viewed as the main mechanism ofachieving the Directive's environmental objectives. A RBMP for a particular riverbasin should include:
• definition and characteristics of the river basin (by end of 2003)• environmental monitoring data and consultation in preparation of RBMPs (to
commence by end of 2006)• details of the environmental impacts of human activity, including information on
diffuse pollution sources, magnitudes and trends (by end of 2004)• interim overview of significant RBD water management issues (end of 2007)• strategic plan for the achievement of "good status" within RBDs to be specified
within the Programme of Measures (by end of 2009)
The Environment Agency is familiar with water management strategies developedwithin the context of river basin planning and Table 6.2 identifies various types ofrecent and existing water management planning which impinge upon urban waterbodies. However, one main difference between many of the recent and existing plans,and in particular Local Environment Agency Plans (LEAPs), is that RBMPs (and theassociated programme of measures within them) will be statutory. Previously therehave been few linkages between LEAPS (and their predecessors, catchmentmanagement plans) and local authority development plans despite circularsencouraging such cooperation (Slater et al., 1994). Therefore, it will be important toobtain as much agreement as possible amongst all parties on whom the Programme ofMeasures will have an impact. However, it is not fully clear how decisions on the2005-10 AMP4 capital investment will be reached to lock in with operationalrequirements to meet the WFD initial timetable for improvements in water status by2012.
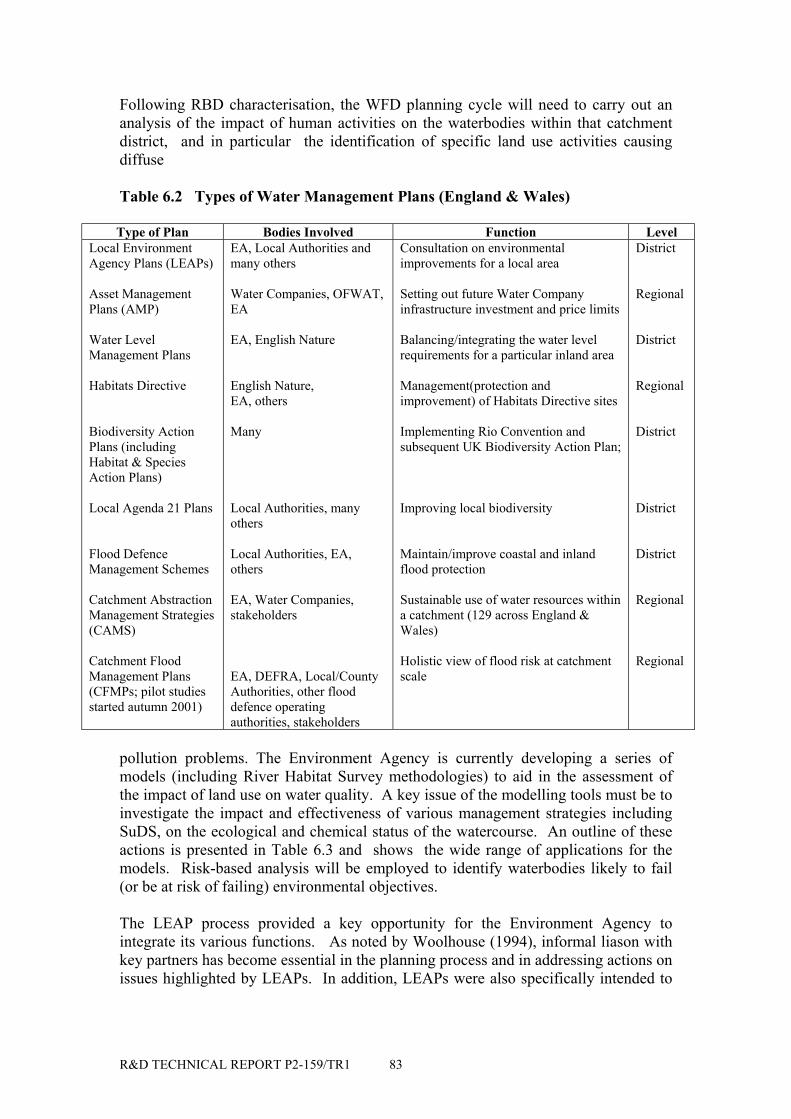
R&D TECHNICAL REPORT P2-159/TR1 83
Following RBD characterisation, the WFD planning cycle will need to carry out ananalysis of the impact of human activities on the waterbodies within that catchmentdistrict, and in particular the identification of specific land use activities causingdiffuse
Table 6.2 Types of Water Management Plans (England & Wales)
Type of Plan Bodies Involved Function LevelLocal EnvironmentAgency Plans (LEAPs)
Asset ManagementPlans (AMP)
Water LevelManagement Plans
Habitats Directive
Biodiversity ActionPlans (includingHabitat & SpeciesAction Plans)
Local Agenda 21 Plans
Flood DefenceManagement Schemes
Catchment AbstractionManagement Strategies(CAMS)
Catchment FloodManagement Plans(CFMPs; pilot studiesstarted autumn 2001)
EA, Local Authorities andmany others
Water Companies, OFWAT,EA
EA, English Nature
English Nature,EA, others
Many
Local Authorities, manyothers
Local Authorities, EA,others
EA, Water Companies,stakeholders
EA, DEFRA, Local/CountyAuthorities, other flooddefence operatingauthorities, stakeholders
Consultation on environmentalimprovements for a local area
Setting out future Water Companyinfrastructure investment and price limits
Balancing/integrating the water levelrequirements for a particular inland area
Management(protection andimprovement) of Habitats Directive sites
Implementing Rio Convention andsubsequent UK Biodiversity Action Plan;
Improving local biodiversity
Maintain/improve coastal and inlandflood protection
Sustainable use of water resources withina catchment (129 across England &Wales)
Holistic view of flood risk at catchmentscale
District
Regional
District
Regional
District
District
District
Regional
Regional
pollution problems. The Environment Agency is currently developing a series ofmodels (including River Habitat Survey methodologies) to aid in the assessment ofthe impact of land use on water quality. A key issue of the modelling tools must be toinvestigate the impact and effectiveness of various management strategies includingSuDS, on the ecological and chemical status of the watercourse. An outline of theseactions is presented in Table 6.3 and shows the wide range of applications for themodels. Risk-based analysis will be employed to identify waterbodies likely to fail(or be at risk of failing) environmental objectives.
The LEAP process provided a key opportunity for the Environment Agency tointegrate its various functions. As noted by Woolhouse (1994), informal liason withkey partners has become essential in the planning process and in addressing actions onissues highlighted by LEAPs. In addition, LEAPs were also specifically intended to
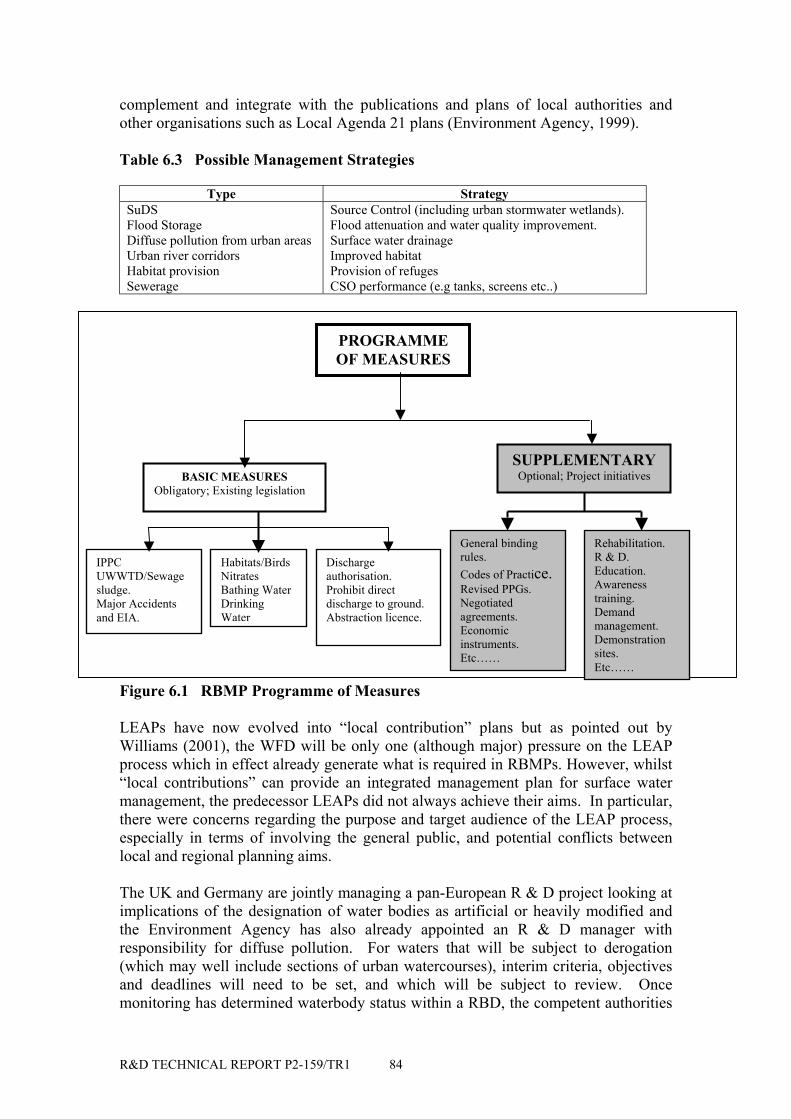
R&D TECHNICAL REPORT P2-159/TR1 84
complement and integrate with the publications and plans of local authorities andother organisations such as Local Agenda 21 plans (Environment Agency, 1999).
Table 6.3 Possible Management Strategies
Type StrategySuDSFlood StorageDiffuse pollution from urban areasUrban river corridorsHabitat provisionSewerage
Source Control (including urban stormwater wetlands).Flood attenuation and water quality improvement.Surface water drainageImproved habitatProvision of refugesCSO performance (e.g tanks, screens etc..)
Figure 6.1 RBMP Programme of Measures
LEAPs have now evolved into “local contribution” plans but as pointed out byWilliams (2001), the WFD will be only one (although major) pressure on the LEAPprocess which in effect already generate what is required in RBMPs. However, whilst“local contributions” can provide an integrated management plan for surface watermanagement, the predecessor LEAPs did not always achieve their aims. In particular,there were concerns regarding the purpose and target audience of the LEAP process,especially in terms of involving the general public, and potential conflicts betweenlocal and regional planning aims.
The UK and Germany are jointly managing a pan-European R & D project looking atimplications of the designation of water bodies as artificial or heavily modified andthe Environment Agency has also already appointed an R & D manager withresponsibility for diffuse pollution. For waters that will be subject to derogation(which may well include sections of urban watercourses), interim criteria, objectivesand deadlines will need to be set, and which will be subject to review. Oncemonitoring has determined waterbody status within a RBD, the competent authorities
PROGRAMMEOF MEASURES
BASIC MEASURESObligatory; Existing legislation
SUPPLEMENTARYOptional; Project initiatives
IPPCUWWTD/Sewagesludge.Major Accidentsand EIA.
Habitats/BirdsNitratesBathing WaterDrinkingWater
Dischargeauthorisation.Prohibit directdischarge to ground.Abstraction licence.
General bindingrules.Codes of Practice.Revised PPGs.Negotiatedagreements.Economicinstruments.Etc……
Rehabilitation.R & D.Education.Awarenesstraining.Demandmanagement.Demonstrationsites.Etc……
R&D TECHNICAL REPORT P2-159/TR1 85
must then use this information to develop an integrated Programme of Measures.Figure 6.1 illustrates the structural requirements for such a programme and it ispossible that urban surface water discharges will be dealt with under SupplementaryMeasures utilising "General Binding Rules" with accompanying Codes of Practice(David Griffiths, Environment Agency, Bristol in Discussion Group Summary toConference Launch, 16 October 2000, of the report on Diffuse Pollution Impacts,D'Arcy et al., 2000). Such Codes of Practice would need to be accompanied byrevisions to existing Pollution Prevention Guidelines (PPGs), which could beextended to include specific reference and guidance to SuDS approaches for themitigation and management of urban surface drainage. The application of suchgeneral SuDS "consenting prevention" conditions for surface water drainage for urbandevelopment might provide a necessary working lever to ensure that developers andlocal authorities adopt wherever possible and appropriate, SuDS techniques includingurban stormwater wetlands.
6.3 Implementing SUDS within River Basin Management Planning
6.3.1 Prohibition notice policy
As stated in Section 6.2.3, it is standard UK regulatory policy (within the Agency,SEPA and the N Ireland E & HS) not to seek formal consents for urban surface waterdischarges. In the large majority of cases, seeking such a consent is a difficult andprotracted process involving considerable administration, especially for a consent thatwill usually be just descriptive in nature i.e not much extra gain is achieved beyond adescription in a planning consent. Risk-based assessments provide the main means ofdetermining the appropriate level of regulatory control required. This allows controlto be focused upon the specifications of the drainage system rather than numericalconsent conditions.
Both the Agency and SEPA are committed to advocate source control and passivetreatment such as urban wetlands as best management practice in their response toStrategic and Local Plans. Normal regulatory practice, therefore, is to rely onplanning conditions and building warrants as the means of delivering best practice.Conditional Prohibition Notices can be served, for example, where source control,passive treatment or engineering measures such as oil interceptors are agreed with thedischarger. Such SuDS structures can then be made a condition of the Notice.Absolute Prohibition Notices can be served for example, to cover required dischargesfrom industrial estates, commercial developments, lorry parks etc., and as such wouldbe subject to full consenting procedure. Either engineering and source controlmeasures can be incorporated in the development design and be covered bydescriptive consent conditions and/or numeric standards. The current ProhibitionNotice policy provides a clear framework for guiding the Agency (and SEPA's)regulatory activity. Therefore, actions in respect of SuDS implementation should beseen as being supportive of this basic policy.
6.3.2 Planning and partnership approaches
SuDS Implementation and the Planning ProcessPlanners have a pivotal role in the regulation of urban development and it essentialthat they fully understand the problems faced by the regulatory agency with respect to
R&D TECHNICAL REPORT P2-159/TR1 86
urban surface drainage. The planning system and local authorities are in a keyposition to bring about change and provide a major role in terms of controlling andinfluencing the decision-making process on urban land use activities. They can workwithin relevant development, structure and local plans as well as the AGENDA 21process to encourage and introduce appropriate design guidance and communityplanning. However, planners can be faced with consultation responses on the onehand from the Agency promoting SuDS and on the other hand, resistance from otherstatutory consultees. This lack of co-ordination can cause serious difficulties for theplanning process. Concerns have also been expressed over the lack of considerationfor other local authority planning responsibilities. In addition, some existing "bestpractice" sites are regarded as examples of poor management practice which do notenhance the appearance of an area. Planning Authorities have specific reservationsover safety and liability implications of SuDS ponds and wetlands where children cangain access. Some 300 SuDS devices are being currently monitored under a SEPAled project which aims to improve design, performance and maintenance criteria.This monitoring project is working closely with the SUDS Scottish Working Party(SUDSWP) which has produced, in conjunction with the Scottish Executive, a SuDSPlanning Advice Note (PAN 61) to provide guidance for planners. Whilst thetechnical aspects relating to the appearance and safety of SuDS systems are a matterof promoting good design, the administrative and consultative difficulties encounteredwithin the planning process are more difficult to address.
One approach for the Agency might be to positively seek to include within Strategicand Local Plans an explanation of the issues raised by impermeable surface waterdrainage together with recommendations for the use of best management practiceincluding SuDS. The difficulties and challenges of achieving such a dialoguebetween the regulatory agency, local planning authorities and other interest groupssuch as water companies, is illustrated by the protracted six year negotiationsregarding the introduction of SuDS into greenfield development within the AylesburyVale District Local Plan (CIRIA, 2001). Teamworking strategies might be reinforcedthrough checking of planning uptake rates and the provision of Agency"presentations" to those Council Planning Departments where there is significantdevelopment pressure and where Local or Strategic Plans are under preparation. Suchpresentations would need to be well prepared to be effective and each Region of theAgency would require an appropriate in-house expertise and associated trainingprogramme. This should include skills and training in the technical aspects of theimpact and control of urban surface water drainage as well as knowledge of theorganisational and legislative framework for diffuse pollution. Access to suitableSuDS demonstration sites in addition to performance, maintenance and costing datawould be extremely supportive to such in-house training. Coordination between theplanning authorities and the regulatory agencies is crucial at the strategic catchmentlevel in order to support decisions on, and to identify thresholds of, "carrying-capacity" and coping with changes in land use (Carroll and Howes, 1998). As part ofsuch strategic scoping work, there needs to be integration between engineering,technical/ building services, planners and environment agencies in order to identifywhich SuDS options might be appropriate at county, district and regional levels.Without clear advice, local authorities will continue to be reluctant to adopt SuDS,even though their own Planning Policies indicate that their use may be preferred.Case studies (CIRIA, 2001) would suggest that SuDS take-up can be very dependenton the enthusiasm and persistence of informed individuals within the negotiating
R&D TECHNICAL REPORT P2-159/TR1 87
organisations, and who drive the planning process through initial apathy/reluctance,lack of information/experience and genuine concern over long term managementissues. Irrespective of such reservations, progress is being made as evidenced by thelocal policy documents of South Gloucestershire District Council, Leicester CityCouncil and Harrow Borough Council, all of which promote the use of SuDS in theirlocal plans and who have produced guidelines for developers in association with theEnvironment Agency.
Partnership Agency/Planning Authority approaches would undoubtedly help in thepromotion of SuDS best practice. This promotional policy approach to planners (anddevelopers) has already being implemented to some extent with the issue of the jointUK regulatory authority booklet on sustainable urban drainage systems (SEPA, EA,and E & HS, 2000). However, this booklet only provides a rudimentary description ofthe various SuDS techniques and contains no design criteria or other technicalspecifications. A current Environment Agency national Working Group is looking atthe issue of adoption, liability and maintenance of SuDS which may recommendrelevant technical and administrative detail for their promotion. HR Wallingford haverecently completed an R&D project commissioned by DETR on surface water runoffmanagement and control which incorporates issues relating to development sitestorage and "allowable runoff" to receiving water bodies (“Storage Requirements forRainfall-Runoff from Greenfield Development Sites”, Report SR580, May 2001). Thedesign philosophy and procedure being advocated is that of permanent retentionstorage (over temporary detention) with slow release rates and/or source infiltration inorder to achieve concepts of sustainability and downstream river protection duringextreme events. This procedural advice is currently being reviewed by the Agency.
Discussion and consultation approaches have been successful in Scotland (see Section6.3.2) with some Planning Authorities taking very positive attitudes towards SuDS e.gWest Lothian highlighting surface water as an issue in their Bathgate Area Local Plan.The latest draft of the Stirling and Fife Council Planning Advice Note, "Planning andEnvironmental Law" states that the prevention of urban pollution by surface runoffrequires the adoption of best practice and SuDS approaches. In Scotland, SUDSWPcomprises a partnership of representatives from SEPA, local and water authorities,government and development interests and a model Framework Agreement foradoption and maintenance has been drawn up. Nevertheless, local authority responsesare constrained to some extent because there is no obvious income stream associatedwith SuDS and their maintenance, and it is not apparent if flood defence spending forexample, might be used (see Section 6.3.2). It may be possible for some localauthorities to utilise approaches that have been used for other rather more familiarissues such as maintenance and management charges for flat blocks, open spaces etc..In Bournemouth for example, Section 106 funding has been used to finance swaleinstallations on retrofitted development.
DTLR PPG 25 (July 2001) "Development and Flood Risk" specifically refers tosurface water drainage and SuDS which should be helpful in this dialogue betweenthe Agency and Planning Authorities:
• "all proposals for development should take account of potentially increasedrunoff"
R&D TECHNICAL REPORT P2-159/TR1 88
• "local planning authorities should consider the need for policies which encouragethe use in appropriate areas of more sustainable drainage systems to controlrunoff as near as possible to source"
• "guidance that all new developments should, as far as possible incorporatesustainable drainage measures"
• "surface water will need to be discussed with the Environment Agency andSewerage Undertakers during the development and preparation of plans"
PPG 25 emphasises the precautionary risk-based approach to ensure a strongeremphasis on planning in relation to river catchments at all stages in the plan-makingprocess. In addition, DEFRA is now considering the possibility of following-upPPG25 with a consultative Flooding Direction which would ensure that the views ofthe Environment Agency on urban development flood risk and associated problemsare properly considered. It is quite likely that such re-considerations of flood defencewill include recommendations for retrofitting upstream source controls rather thanfocusing exclusively on downstream flood walls and embankments etc. The recentHR Wallingford report (SR 580) commissioned by DETR on "allowable runoff" fromnew development recommends the use of permanent or at least long term storage withslow rate of release and/or infiltration for protection from downstream receiving waterflooding. Constructed wetlands linked in a series of cells and with adjustable outletcontrols to provide an appropriate working range of water levels, could provide suchlong term, slow release. Where groundwater conditions are suitable, treated wetlanddischarges might also be directly infiltrated to ground. Such combined long termstorage and treatment, slow release and infiltration could help to achieve moreeffective downstream flood and water quality protection providing a more sustainablereceiving water regime.
SuDS Implementation and DevelopersIt is clear that developers are becoming more familiar with, and more willing toconsider, SuDS construction. Developers will construct what is necessary, so long asthe necessary design requirements can be taken account of when negotiating the landpurchase price. However, they tend not to consult with the Agency until after landpurchase and they are consequently under pressure to avoid any land-take whichwould be detrimental to the number of development units. Delays caused bydisagreements between the Agency, the Water Companies and the Highways Agency(and/or County/District Highway Authorities) are also a frequent cause for complaint.Smaller developers commonly do not have the technical back-up to provide SuDSdesigns and complain that the Agency cannot provide clear design specifications orthat suitably experienced consultants and landscape architects are not readilyavailable. Closer liason and interaction between the regulatory authorities and theUK House Building Federation might help to facilitate a better understanding of themajor issues.
The interpretation of the existing Building Regulations can be a source of problemsfor the construction of SuDS drainage systems which do not have clearly UK-definedconstruction standards. Most available design manuals principally relate to Americanconditions and the most recent UK regulatory authority SuDS publications (CIRIA,2000a and b; SEPA, EA and E & HS, 2000), contain no construction guidancealthough some mainstream software products such as MicroDrainage and R-Win arenow becoming available which address basic SuDS design (Ashley et al., 1998). The
R&D TECHNICAL REPORT P2-159/TR1 89
Surface Water Source Control: Policy Statement July 1998. Thames Water• seek to ensure that new connections to the public sewerage system
do not pose an unacceptable threat of surcharge, flooding orpollution
• with advice from DETR, we will encourage ..........sustainableinfrastructure development which does not involve discharge to thepublic sewerage system.
• we recognise that it is preferable to use locally availablewatercourses, with attenuation or soakaways to drain the surfacewater runoff from sites.
April 2002 revisions to the Building Regulations (Part H2) and the proposed new PartM of the Technical Standards for compliance with the Building Standards (Scotland)Regulations 1990, as amended, both make reference to the need for a hierarchy ofsustainable connections for surface water on new building developments. Thesuggested hierarchy recommends source control (infiltration), then passive treatment(swales, ponds, wetlands) followed by direct discharge to watercourse and failing this,recourse then made to sewered connection. Guidance on SuDS is included in theapproved documents with specific reference to the use of reed beds for treatingwastewater, greywater and surface runoff (Grant and Griggs, 2001).
SuDS Implementation and the Water CompaniesWater Companies and especially those such as Thames, North West and Severn Trentwho face particular problems with urban surface water drainage, represent anotherimportant target group and discussion Workshops/Seminars might provide aneffective forum for airing Agency concerns. It is not clear however, to what extentsuch initiatives would be welcome by the Water Companies and it may be moreeffective to ensure good support and back-up for Agency staff involved with routinediscussions about sites. Water Company PLCs are somewhat constrained becausethey need OFWAT to formally recognise SuDS as drainage assets. Recent OFWATstatements in this regard are very encouraging although it also raises the legaldifficulty about the definition of sewers capable of adoption. Surface water drainageis already charged for by the water companies and there is resistance to providetreatment for discharges which have hitherto been discharged directly. Thus anyadditional charge for implementation of SuDS infrastructures could be viewed as animpediment as such discharges might then essentially be regarded as trade effluent.The water service companies are also becoming increasingly committed to suchsurface water source controlapproaches which seek to divert andcontrol rainfall-runoff at source (seebox). It might also be feasible forthe Agency to discuss with theWater Companies and OFWAT therelative merits of setting baselineservice-level targets for theintroduction of SuDS such that forexample, 5% - 10% of WaterCompany AMP4 capital investment should incorporate sustainable drainageapproaches.
The major concerns of many of the Water Companies are associated with adoptionissues, SuDS design specification and their "unknown" maintenance requirements. Itis not clear for example, whether the forthcoming 5th Edition of "Sewers for Adoption"will make any reference to the issue of SuDS adoption. On the other hand, indicationsare that both capital and maintenance costs for SuDS are less than would be incurredby traditional drainage and mechanical treatment systems. Water Companies inEngland & Wales might consider the East of Scotland Water Authority example ofrequiring developers to finance capital costs and provide a financial bond to coverfuture maintenance requirements. However, some Water Companies consider that theanswer lies in more separation of contaminated sources of runoff rather than in novelpollution attenuation and treatment systems.
R&D TECHNICAL REPORT P2-159/TR1 90
County Council Highway Powers. 1980 Highways Act.
• s.38: power to adopt a highway drain constructed by others• s.100: power to prevent water flowing into a highway and
power to drain water from a highway• s.101: power to pipe or fill in roadside ditches, subject to
drainage authority consent• s.110: power to divert a watercourse after consulting the
district council• s.339: power to require developers to obtain consent for any
works or the use of a watercourse for highway drainage.
Section 89(5), 1991 Water Resource s Act"A highway authority or other person entitled to keep open a drainby virtue of Section 100 of the Highways Act 1980 shall not beguilty of a offence under Section 95 by reason of his causing orpermitting any discharge to be made from a drain kept open byvirtue of that section unless the discharge is made in contraventionof a prohibition imposed under Section 86"
SuDS Implementation and Highway DrainageThe responsible highway authority for motorways and trunk roads in the UK was theformer Department of Transport (DoT) but this has passed to the Secretary of State forthe Environment, Transport & Regionswho delegates responsibility to theHighways Agency. The operationalmanagement of trunk roads is distributedon a regional basis to appointed managingagents. For most other roads, the countycouncil (or London Borough) is thedesignated authority although delegationoften occurs to a district council toadminister local residential roads. The specific powers vested in a county council inrespect of highways are indicated in the box and the council will also be consulted forviews on planning applications for development when flows to a watercourse fromhighway drains is substantial. There is provision under Section 21 of the 1936 PublicHealth Act and the 1991 Water Industry Act for the dual use of highway drains orpublic sewers for the combined drainage of surface waters from roads and domestic(non-commercial) properties. The joint-use procedure and cost-apportionment iscovered by the 1981 National Water Council (NWC) “Guideline Memorandum onRelationships between Water Authorities and Highway Authorities”. The ownershiparrangements and continued use of such highway drains is covered by Section 264 ofthe 1980 Highways Act. However, Water Companies generally resist the connectionof road drainage to public sewers particularly if any treatment is specified by theEnvironment Agency. Where road drains are used jointly for highway and propertydrainage, those lengths in joint use are normally adopted under Section 38 of the 1980Highways Act by the sewerage undertaker. However, many developers favour theconstruction of highway drains in parallel with public sewers for domestic surfacewater drainage with each discharging separately to the same watercourse and eventhree pipe systems have been talked about for future development on difficult urbansites. In these circumstances, a highway drain is a private drain owned by the highwayauthority and may not be requisitioned. Undoubtedly, modification in the statutoryregime controlling surface water drainage to clarify issues of ownership, adoption,joint use as well as other mainstream issues would appear to be overdue.
The right to discharge surface waterrunoff from roads to receiving watersthrough highway drains (which includeditches, gutters, culverts, pipes andsoakaways), is established in the 1980Highways Act (Section 100). UnderSection 89(5) of the 1991 WaterResources Act, the highways authority does not require the statutory defence of adischarge consent. However, under a liaison agreement, the measures (which couldinclude SuDS) required to prevent or alleviate pollution will be agreed throughconsultation between the Agency and the highways authority or its agent prior toconstruction under the various provisions contained in the 1990 Town & CountryPlanning Act and the 1991 Town & Country Planning (Development Plan)Regulations.
R&D TECHNICAL REPORT P2-159/TR1 91
The planning legislation allows the Environment Agency to make representationopposing development projects (including new or improved highways), which arelikely to have an unacceptable impact upon the aquatic environment, and PlanningPolicy Guidance (PPG) 12 provides background information on pollution preventionand surface runoff control. In addition, there is a policy implementation guidance note(SC/CC/014; September 1992) for highway discharge. For certain classes ofdevelopment, the Agency will be a statutory consultee under the 1988 GeneralDevelopment Order and a local planning authority is bound (Article 18, GDO 1988) totake recommendations from such a consultee into consideration when making adetermination on a specific development application. Additionally, local authorityUnitary Development Plans (UDPs) are required to take into account theenvironmental implications of direct discharges to ground and specific requirementsmay be imposed by the Agency in relation to groundwater protection (under the 1998Environment Agency "Policy and Practice for the Protection of Groundwater").However, the Agency could choose to apply the provisions of Section 86 to serve aConditional or an Absolute Prohibition Notice (see Section 6.3.1) to an existing orproposed highway drain if it saw fit to do so because of some particular pollutionhazard. This could either require that a consent be obtained (under Schedule 10, para.5(1), WRA 1991) or alternatively it may specify the conditions to be observed prior tothe making of the discharge.
Whilst there may still be some misunderstandings between, and lack of knowledgeabout, the specific powers and roles of the various highway authorities due to thecomplex enveloping legal and administrative frameworks, it is quite evident that allthe agencies are becoming increasingly aware of their responsibilities in respect ofpollution control from highway discharges. The concern of the national regulatorybodies is reflected for example in the 1993 NRA guidance notes (SC/CC/014) on“Drainage from Motorways, Highways and Other Roads” intended to facilitateintegration of specialist engineering, geomorphological and ecological knowledge intothe design and implementation of highway drainage structures. The EnvironmentAgency Thames Region has also recently published (1999) an interim guidancemanual on the “Treatment of Highway Runoff Using Constructed Wetlands” intendedto encourage alternative control and treatment approaches for highway drainage.Whilst the Highways Agency have been rather cautious in their approach to the use ofvegetated treatment systems for the control and management of highway runoff, a newAdvice Note covering this theme is now included within a new update to Section 2(Drainage, HA 103/01), Volume 4 of the DMRB.
The Highways Agency have developed more specific guidance on pollution control forhighway drainage through incorporation of a new section (Section 3, Part 10) on WaterQuality and Drainage within Volume 11, "Environmental Assessment" in an update tothe previous 1993 DoT/DoE “The Good Roads Guide” section of the “Design Manualfor Roads and Bridges” (DMRB). SuDS structures are referred to in this DMRBupdate although no detailed design or construction guidance is provided and there isno agreement as to when they should be applied. A recent publication by theInstitution of Highways & Transportation (2001) also recommends SuDS best practicestructures for the control and management of road and highway runoff and providesmore detail on their relative benefits over conventional gutter-kerb-sewer drainagesystems. Whilst the adoption of such SuDS technology may well have resource
R&D TECHNICAL REPORT P2-159/TR1 92
implications for the highway authorities, coordinated approaches need to be adoptedand maintained with the Environment Agency and other nature conservation bodies, topursue the implementation and evaluation of such best practice. In addition, somemodification in the statutory regime controlling surface water drainage, to clarifyissues of ownership, adoption and joint use, would be beneficial.
SuDS Implementation and Stakeholder PartnershipsThe evolution of water resource management under the Water Framework Directivetowards an eco-centric, holistic approach to catchment management requires thesharing, coordination and integration of values and inputs from a broad range ofagencies, public and other organisations when conceiving, designing andimplementing policies, programmes or projects. Local community interest andgeneral public support will be crucial in effectively achieving the goals of integratedurban catchment management under the Directive. Partnership approaches involvingrepresentatives of all stakeholder organisations (regulatory authority, water utilities,local authorities, housebuilders, developers and government) have been successfulwithin a Scottish SuDS Working Party in implementing best practice technology forurban stormwater management. Such partnership approaches were consideredessential because SuDS technology is not just about water quality, but also seeks toaddress quantity, amenity and habitat issues. The partnership approach has resulted inthe production of a policy document (Policy No.15, 1997) covering the "Regulation ofUrban Drainage" and SEPA is currently producing a discussion document to providea view of the future development of surface water drainage policy. This will identifyoptions for future policy covering urban development and its effects on the urbanenvironment. Similar stakeholder partnerships might be encouraged within theAgency Regions in order to help overcome institutional inertia and hostility to "new"approaches and to help integrate SuDS into overall river basin management planning.
Such partnership efforts are likely to primarily focus on new greenfield developmentin order to prevent existing urban diffuse pollution problems from becoming bigger.To resolve the worst problems within existing urban developments, such as drainagefrom industrial/commercial estates, the Agency will need to work with the waterutilities to identify the worst case impacts and to seek treatment measures where noalternatives are possible, in addition to conventional best "housekeeping" practice(such as bunding oil tanks). Potential approaches to the control and management ofdiffuse urban oil pollution from industrial and commercial premises, utilising acombination of SuDS and internal "housekeeping" containment measures, havealready been identified (Ellis and Chatfield, 2001). Such control and treatmentrequirements should be sought by the Agency under existing statutes, in order to meetthe requirements of the Water Framework Directive to have "measures to prevent ormitigate the impact of diffuse pollutants".
Whilst a pro-active approach to the implementation of SuDS technology is desirable,any imposition of Agency views or policy is likely to cause resentment amongststakeholder groups. Concerns have been expressed in Scotland by most of the partiesinvolved in urban development over a lack of consultation prior to SEPA's promotionof SuDS best practice. To some extent, this resentment will be inevitable, as manylocal and highway authorities in particular are not initially prepared to consider theissue. Thus it is necessary to raise the profile of urban surface water drainage and runeducation and training programmes on the potential of SuDS best practice. Where the

R&D TECHNICAL REPORT P2-159/TR1 93
issues of surface water become understood and appreciated, there is considerablepotential for a more collaborative and partnership approach to future policydevelopment. Inevitably there is a difficult balance to be sought between theregulatory lead role that the Environment Agency must take to promote a newphilosophy, and the collaborative process which must subsequently develop if theprocess is to be successfully applied.
Key Issues
• application of sediment quality standards to urban wetlands.• role of the Water Framework Directive (WFD) for future management of
urban diffuse pollution and implications for SuDS (and wetland) provision.• use of “General Binding Rules” for managing urban diffuse pollution and
potential amendments/updating of PPGs to incorporate SuDS.• formal development of integrated coordination of SuDS into the local
authority development plan process and stakeholder partnership agreements.• clarification of surface water sewer ownership, adoption and joint use issues.
R&D TECHNICAL REPORT P2-159/TR1 94
7. DECISION SUPPORT APPROACHES FOR URBAN WETLANDS
7.1 Introduction: Towards a Multi-Criteria Approach
Whilst urban wetlands have been included as generic source control structuresconforming to the principles of SuDS (SEPA, EA and E & HS, 2000; CIRIA, 2000aand b), there is no clear evidence of their self-sustainability in terms of long termpressure-response feedback loops. In the US, Scandinavia and Australia/NewZealand, the sustainability of such wetland systems is not invoked as a basic driverreason for their adoption. The national US manual for urban runoff quality control(WEF/ASCE, 1998) only refers to best management practice, whilst Australian/NewZealand urban drainage practice refers to environmentally-sensitive drainage systems.The evaluation of SuDS sustainability and self-purification to date has been mainlyempirical and subjective in nature and lacking in the development and application ofrobust quantifiable sustainability criteria and indicators, particularly in respect oflong-term performance, effects and costs.
At the same time, the UK government water regulator (OFWAT) currently has nostatutory duty to incorporate sustainability or to anticipate future undefinedregulations in respect of diffuse urban pollution. Hence, sustainability issues are notproperly reflected in the way in which performance targets are set and the financialdeterminations only allow for the achievement of current performance standardswithin short 5 year time scales. OFWAT presumes that longer term considerationsare dealt with by other partners in the regulatory process such as the EnvironmentAgency and DEFRA. Yet it is becoming clear that traditional cost-benefit approachesto evaluating appropriate levels of service delivered at acceptable performancestandards are being replaced by consideration of whole-life cycle costing. Given theincreasing emphasis on service provision over and above asset ownership andoperation, it is also becoming increasingly important to ensure that levels of service,serviceability targets and related performance measures provide adequate safeguardsfor whole life service provision. It is within this context that decisions need to bemade regarding asset investment for wetland SuDS and which fully recognisecontemporary decision-making processes as well as environmental, institutional,planning and regulatory constraints. Methodologies are needed to support decisionson preferred approaches which may reduce the cost of urban stormwaterinfrastructures whilst maintaining socially acceptable levels of service and minimisingadverse environmental impacts. The biggest challenge to water service providers(WSPs) will be to convince stakeholders, particularly customers and financialregulators, that full cost water services include whole-life asset investments.
A number of workers have recently presented approaches for stormwater managementwhich utilise universal or over-arching sustainability criteria or what might be termedsustainable system conditions. Such principles and conditions are taken to define thelimiting constraints or aspirations by which sustainable urban drainage may beachieved (Crabtree, 2000; Everard and Street, 2001). Such approaches referencesustainable criteria against the release, pathways and transfer of pollutants; use ofmaterials and energy; health, safety and maintenance issues; as well as institutional,regulatory and social factors. The approaches therefore acknowledge the complexityand uncertainty surrounding the decision-making processes associated with urban
R&D TECHNICAL REPORT P2-159/TR1 95
stormwater management and the proposed methodologies utilise formal multicriteriaanalysis techniques which can trade-off mandatory against more sustainable criteria.
Sustainability criteria for urban wetlands must be similarly referenced against thoseparameters related to all three elements of the SuDS triangle; water quantity, waterquality and amenity. Thus, design and construction, environmental/ecologicalimpact, operation and maintenance, health and safety, social/urban(community/amenity) and economic issues become prime potential sustainabilitycriteria to facilitate comparisons and accreditation of drainage options with regard tocapital cost, resource use, acceptability, performance, maintenance etc. However, thecriteria which relate to the technical, environmental, biotic, social and economicdimensions of the SuDS triangle, have disparate and non-commensurate units ofmeasurement (Ashley et al, 2001a) and are not readily amenable to deterministicapproaches. It is therefore appropriate, if not necessary, to evaluate the sustainabilityof urban wetland systems against multi-criteria and multi-objectives placed within anoverall subjective decision-support framework. The subjectivity of such a decision-making process is intrinsic in terms of the uncertainties associated with the variousorganisations and stakeholders involved in the decision-making process as well as theinherent variability observed in the controlling environmental processes.
7.2 Defining Primary Criteria, Indicators and Benchmarks
The primary components in the structure of any decision-support process mustreference and define generic performance criteria together with appropriate supportingmulti-criteria decision-making parameters. Any listing of primary (or secondary)criteria will inevitably be arbitrary to some degree, but such categorisations need to begeneric, inclusive, flexible and dynamic if they are to support decision makers andstakeholders in selecting and comparing drainage system options intended to meetspecified objectives.
Such multi-criteria approaches must be flexible and dynamic in order that they can beadapted and reviewed to meet changing circumstances and constraints withinorganisations, regulations and customers, and the same is true of technical andscientific knowledge of the operating systems. The application of multi-criteriaanalysis should also incorporate a risk and sensitivity assessment stage in terms ofdetermining which options are more likely to be the more sustainable under uncertainand variable conditions.
It must also be recognised that such multi-criteria methodologies should, whereappropriate, be capable of evaluating the "do-nothing" option as well as that offeredby conventional drainage systems. In addition, it must be acknowledged that the finaldecision may well be driven or at least constrained by specific local considerationsand hence result in a preferred option which may not be the most sustainable. Table7.1 outlines a possible listing of primary generic criteria which might be universallyacceptable as being basic sustainability indicators in the asset investment decision forurban wetland SuDS. The listing is compatible with existing methodologies whichare being currently tested elsewhere within the UK water industry in conjunction withthe EPSRC/UKWIR funded Sustainable Water Asset Resource Decisions (SWARD)
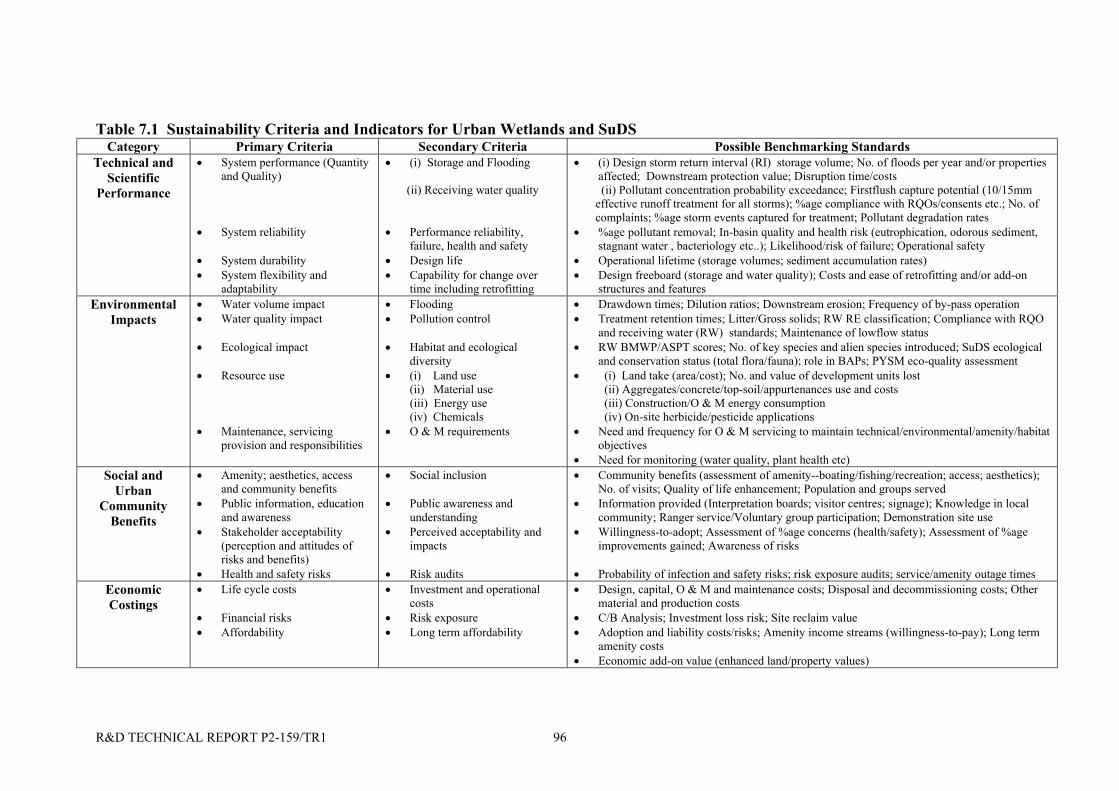
R&D TECHNICAL REPORT P2-159/TR1 96
Table 7.1 Sustainability Criteria and Indicators for Urban Wetlands and SuDSCategory Primary Criteria Secondary Criteria Possible Benchmarking Standards
Technical andScientific
Performance
• System performance (Quantityand Quality)
• System reliability
• System durability• System flexibility and
adaptability
• (i) Storage and Flooding
(ii) Receiving water quality
• Performance reliability,failure, health and safety
• Design life• Capability for change over
time including retrofitting
• (i) Design storm return interval (RI) storage volume; No. of floods per year and/or propertiesaffected; Downstream protection value; Disruption time/costs
(ii) Pollutant concentration probability exceedance; Firstflush capture potential (10/15mmeffective runoff treatment for all storms); %age compliance with RQOs/consents etc.; No. ofcomplaints; %age storm events captured for treatment; Pollutant degradation rates
• %age pollutant removal; In-basin quality and health risk (eutrophication, odorous sediment,stagnant water , bacteriology etc..); Likelihood/risk of failure; Operational safety
• Operational lifetime (storage volumes; sediment accumulation rates)• Design freeboard (storage and water quality); Costs and ease of retrofitting and/or add-on
structures and featuresEnvironmental
Impacts• Water volume impact• Water quality impact
• Ecological impact
• Resource use
• Maintenance, servicingprovision and responsibilities
• Flooding• Pollution control
• Habitat and ecologicaldiversity
• (i) Land use (ii) Material use (iii) Energy use (iv) Chemicals• O & M requirements
• Drawdown times; Dilution ratios; Downstream erosion; Frequency of by-pass operation• Treatment retention times; Litter/Gross solids; RW RE classification; Compliance with RQO
and receiving water (RW) standards; Maintenance of lowflow status• RW BMWP/ASPT scores; No. of key species and alien species introduced; SuDS ecological
and conservation status (total flora/fauna); role in BAPs; PYSM eco-quality assessment• (i) Land take (area/cost); No. and value of development units lost (ii) Aggregates/concrete/top-soil/appurtenances use and costs (iii) Construction/O & M energy consumption (iv) On-site herbicide/pesticide applications• Need and frequency for O & M servicing to maintain technical/environmental/amenity/habitat
objectives• Need for monitoring (water quality, plant health etc)
Social andUrban
CommunityBenefits
• Amenity; aesthetics, accessand community benefits
• Public information, educationand awareness
• Stakeholder acceptability(perception and attitudes ofrisks and benefits)
• Health and safety risks
• Social inclusion
• Public awareness andunderstanding
• Perceived acceptability andimpacts
• Risk audits
• Community benefits (assessment of amenity--boating/fishing/recreation; access; aesthetics);No. of visits; Quality of life enhancement; Population and groups served
• Information provided (Interpretation boards; visitor centres; signage); Knowledge in localcommunity; Ranger service/Voluntary group participation; Demonstration site use
• Willingness-to-adopt; Assessment of %age concerns (health/safety); Assessment of %ageimprovements gained; Awareness of risks
• Probability of infection and safety risks; risk exposure audits; service/amenity outage timesEconomicCostings
• Life cycle costs
• Financial risks• Affordability
• Investment and operationalcosts
• Risk exposure• Long term affordability
• Design, capital, O & M and maintenance costs; Disposal and decommissioning costs; Othermaterial and production costs
• C/B Analysis; Investment loss risk; Site reclaim value• Adoption and liability costs/risks; Amenity income streams (willingness-to-pay); Long term
amenity costs• Economic add-on value (enhanced land/property values)
R&D TECHNICAL REPORT P2-159/TR1 97
project (Ashley et al., 2001a) as well as with benchmarking criteria included in thegovernment sustainability agenda (DETR, 2001). Table 7.1 also identifies a range ofsecondary indicators and benchmark "standards" against which a specific wetland orother SuDS structure or set of drainage options might be assessed. The methodologycan also be applied to conventional kerb-gutter-gulley and pipe systems either as astand-alone drainage option or in combination with a variety of SuDS structures in atreatment-train approach.
This multi-criteria approach has the advantage of being readily amenable toconventional spread sheet application which in turn facilitates the assessment ofdrainage options where one primary criterion e.g investment and/or O&M costingmay be the predominant consideration or constraint. The multi-criteria matrixrequires a mix of quantitative and qualitative measures some of which will have welldefined numerical values (both dimensional and non-dimensional), whilst others willremain essentially descriptive (and frequently subjective) in nature, perhaps definedonly by presence/absence notation. The listing could also provide a suitable basis fordeveloping holistic accreditation criteria for assessing the relative sustainability of anyexisting urban wetland or other SuDS structures as well as providing a basis for post-project evaluation of sustainability gains achieved following the introduction of aSuDS initiative within an urban development.
7.3 Applying a Multi-Criteria Approach
Once the objectives of a specific scheme have been identified as a basis for a decisionon the adoption of varying drainage options for an urban development (or re-development in the case of a retrofitting design), the multi-criteria approach can beimplemented as illustrated in Figure 7.1. As indicated in the figure, the methodologycan be single or multi-objective although the emphasis in the following detail anddiscussion is placed on stormwater treatment. The figure does not show the detail ofthe various phases involved during application, but these should include: risk andsensitivity assessment and detailed data collection and analysis covering bothqualitative and quantitative elements in the key technical-environmental-social-economic components as needed.
If the multi-criteria methodology was being applied for the purpose of assessing therelative sustainability of an existing urban wetland or SuDS structure(s), then onlyStages 3 to 5 need be worked through. Accreditation schemes for existing urbanwetlands or SuDS structures would similarly only need to consider Stages 3 to 5. Onedeficiency in this sort of post-project approach for a stand-alone drainage option,would be that it is not clear how the outcome of the analysis might be interpretedgiven our present state of knowledge on the relative sustainability of differing urbandrainage options. What is the absolute or target level of sustainability for a given setof criteria and benchmark standards against which the relative performance ofdiffering drainage options might be matched and judged? The existing project has notbeen able (within the constraints of time and funding) to undertake any detailed casestudies of the multi-criteria methodology in order to obtain a feel for the potentialrange of outcome values for differing combinations of urban wetland types or other
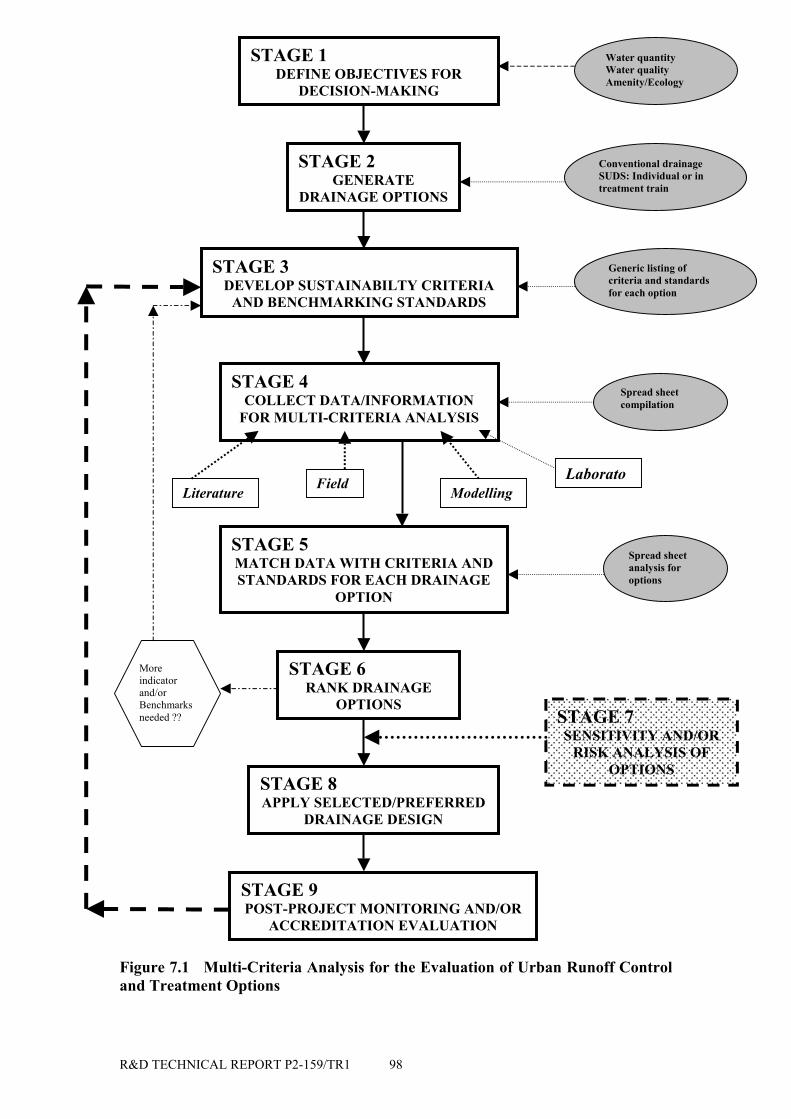
R&D TECHNICAL REPORT P2-159/TR1 98
Figure 7.1 Multi-Criteria Analysis for the Evaluation of Urban Runoff Controland Treatment Options
STAGE 2GENERATE
DRAINAGE OPTIONS
STAGE 3DEVELOP SUSTAINABILTY CRITERIA
AND BENCHMARKING STANDARDS
STAGE 4COLLECT DATA/INFORMATION
FOR MULTI-CRITERIA ANALYSIS
Literature Field Modelling
STAGE 5MATCH DATA WITH CRITERIA ANDSTANDARDS FOR EACH DRAINAGE
OPTION
STAGE 6RANK DRAINAGE
OPTIONS
STAGE 8APPLY SELECTED/PREFERRED
DRAINAGE DESIGN
STAGE 7SENSITIVITY AND/OR
RISK ANALYSIS OFOPTIONS
Conventional drainageSUDS: Individual or intreatment train
Generic listing ofcriteria and standardsfor each option
Spread sheetcompilation
Spread sheetanalysis foroptions
STAGE 9POST-PROJECT MONITORING AND/OR
ACCREDITATION EVALUATION
STAGE 1DEFINE OBJECTIVES FOR
DECISION-MAKING
Water quantityWater qualityAmenity/Ecology
Laborato
Moreindicatorand/orBenchmarksneeded ??
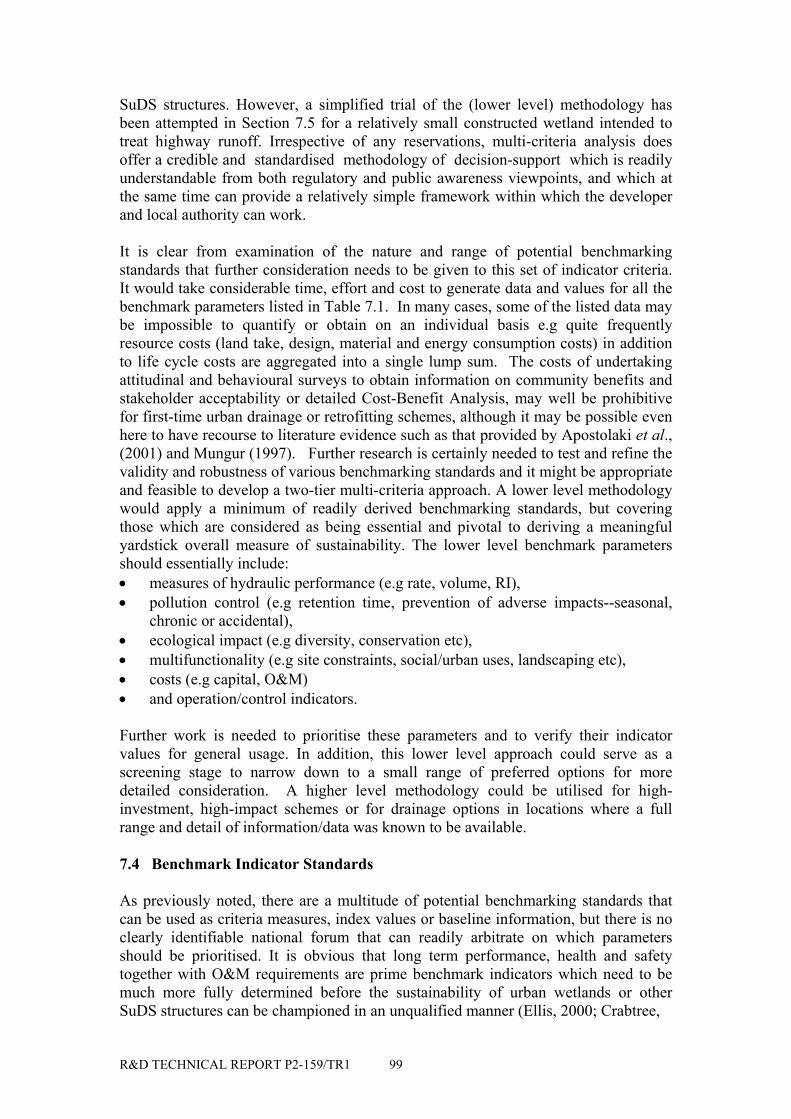
R&D TECHNICAL REPORT P2-159/TR1 99
SuDS structures. However, a simplified trial of the (lower level) methodology hasbeen attempted in Section 7.5 for a relatively small constructed wetland intended totreat highway runoff. Irrespective of any reservations, multi-criteria analysis doesoffer a credible and standardised methodology of decision-support which is readilyunderstandable from both regulatory and public awareness viewpoints, and which atthe same time can provide a relatively simple framework within which the developerand local authority can work.
It is clear from examination of the nature and range of potential benchmarkingstandards that further consideration needs to be given to this set of indicator criteria.It would take considerable time, effort and cost to generate data and values for all thebenchmark parameters listed in Table 7.1. In many cases, some of the listed data maybe impossible to quantify or obtain on an individual basis e.g quite frequentlyresource costs (land take, design, material and energy consumption costs) in additionto life cycle costs are aggregated into a single lump sum. The costs of undertakingattitudinal and behavioural surveys to obtain information on community benefits andstakeholder acceptability or detailed Cost-Benefit Analysis, may well be prohibitivefor first-time urban drainage or retrofitting schemes, although it may be possible evenhere to have recourse to literature evidence such as that provided by Apostolaki et al.,(2001) and Mungur (1997). Further research is certainly needed to test and refine thevalidity and robustness of various benchmarking standards and it might be appropriateand feasible to develop a two-tier multi-criteria approach. A lower level methodologywould apply a minimum of readily derived benchmarking standards, but coveringthose which are considered as being essential and pivotal to deriving a meaningfulyardstick overall measure of sustainability. The lower level benchmark parametersshould essentially include:• measures of hydraulic performance (e.g rate, volume, RI),• pollution control (e.g retention time, prevention of adverse impacts--seasonal,
chronic or accidental),• ecological impact (e.g diversity, conservation etc),• multifunctionality (e.g site constraints, social/urban uses, landscaping etc),• costs (e.g capital, O&M)• and operation/control indicators.
Further work is needed to prioritise these parameters and to verify their indicatorvalues for general usage. In addition, this lower level approach could serve as ascreening stage to narrow down to a small range of preferred options for moredetailed consideration. A higher level methodology could be utilised for high-investment, high-impact schemes or for drainage options in locations where a fullrange and detail of information/data was known to be available.
7.4 Benchmark Indicator Standards
As previously noted, there are a multitude of potential benchmarking standards thatcan be used as criteria measures, index values or baseline information, but there is noclearly identifiable national forum that can readily arbitrate on which parametersshould be prioritised. It is obvious that long term performance, health and safetytogether with O&M requirements are prime benchmark indicators which need to bemuch more fully determined before the sustainability of urban wetlands or otherSuDS structures can be championed in an unqualified manner (Ellis, 2000; Crabtree,
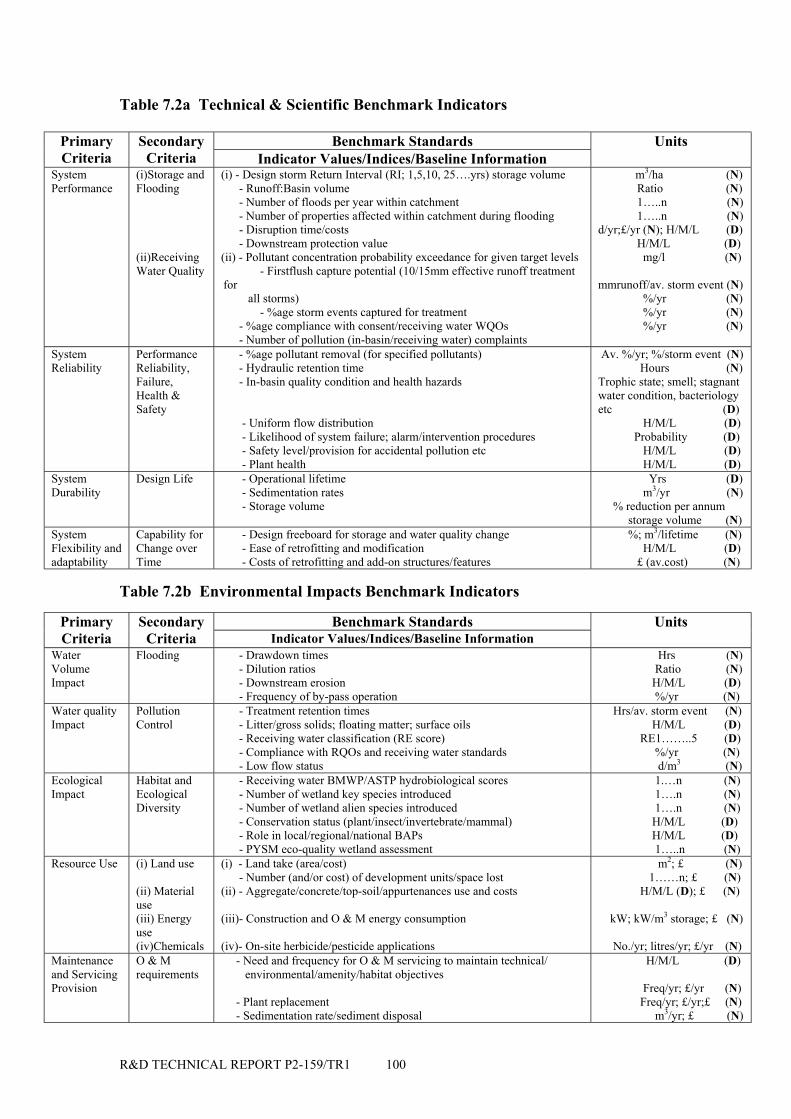
R&D TECHNICAL REPORT P2-159/TR1 100
Table 7.2a Technical & Scientific Benchmark Indicators
Benchmark StandardsPrimaryCriteria
SecondaryCriteria Indicator Values/Indices/Baseline Information
Units
SystemPerformance
(i)Storage andFlooding
(ii)ReceivingWater Quality
(i) - Design storm Return Interval (RI; 1,5,10, 25….yrs) storage volume - Runoff:Basin volume - Number of floods per year within catchment - Number of properties affected within catchment during flooding - Disruption time/costs - Downstream protection value(ii) - Pollutant concentration probability exceedance for given target levels - Firstflush capture potential (10/15mm effective runoff treatmentfor all storms) - %age storm events captured for treatment - %age compliance with consent/receiving water WQOs - Number of pollution (in-basin/receiving water) complaints
m3/ha (N) Ratio (N) 1…..n (N) 1…..n (N)d/yr;£/yr (N); H/M/L (D) H/M/L (D) mg/l (N)
mmrunoff/av. storm event (N) %/yr (N) %/yr (N) %/yr (N)
SystemReliability
PerformanceReliability,Failure,Health &Safety
- %age pollutant removal (for specified pollutants)- Hydraulic retention time
- In-basin quality condition and health hazards
- Uniform flow distribution- Likelihood of system failure; alarm/intervention procedures
- Safety level/provision for accidental pollution etc - Plant health
Av. %/yr; %/storm event (N) Hours (N)Trophic state; smell; stagnantwater condition, bacteriologyetc (D) H/M/L (D) Probability (D) H/M/L (D) H/M/L (D)
SystemDurability
Design Life - Operational lifetime- Sedimentation rates- Storage volume
Yrs (D) m3/yr (N) % reduction per annum storage volume (N)
SystemFlexibility andadaptability
Capability forChange overTime
- Design freeboard for storage and water quality change - Ease of retrofitting and modification - Costs of retrofitting and add-on structures/features
%; m3/lifetime (N) H/M/L (D) £ (av.cost) (N)
Table 7.2b Environmental Impacts Benchmark Indicators
Benchmark StandardsPrimaryCriteria
SecondaryCriteria Indicator Values/Indices/Baseline Information
Units
WaterVolumeImpact
Flooding - Drawdown times- Dilution ratios- Downstream erosion
- Frequency of by-pass operation
Hrs (N) Ratio (N) H/M/L (D) %/yr (N)
Water qualityImpact
PollutionControl
- Treatment retention times- Litter/gross solids; floating matter; surface oils- Receiving water classification (RE score)
- Compliance with RQOs and receiving water standards - Low flow status
Hrs/av. storm event (N) H/M/L (D) RE1……..5 (D) %/yr (N) d/m3 (N)
EcologicalImpact
Habitat andEcologicalDiversity
- Receiving water BMWP/ASTP hydrobiological scores - Number of wetland key species introduced - Number of wetland alien species introduced - Conservation status (plant/insect/invertebrate/mammal) - Role in local/regional/national BAPs - PYSM eco-quality wetland assessment
1.…n (N) 1….n (N) 1….n (N) H/M/L (D) H/M/L (D) 1…..n (N)
Resource Use (i) Land use
(ii) Materialuse(iii) Energyuse(iv)Chemicals
(i) - Land take (area/cost) - Number (and/or cost) of development units/space lost(ii) - Aggregate/concrete/top-soil/appurtenances use and costs
(iii)- Construction and O & M energy consumption
(iv)- On-site herbicide/pesticide applications
m2; £ (N) 1……n; £ (N) H/M/L (D); £ (N)
kW; kW/m3 storage; £ (N)
No./yr; litres/yr; £/yr (N)Maintenanceand ServicingProvision
O & Mrequirements
- Need and frequency for O & M servicing to maintain technical/ environmental/amenity/habitat objectives
- Plant replacement- Sedimentation rate/sediment disposal
H/M/L (D)
Freq/yr; £/yr (N) Freq/yr; £/yr;£ (N) m3/yr; £ (N)
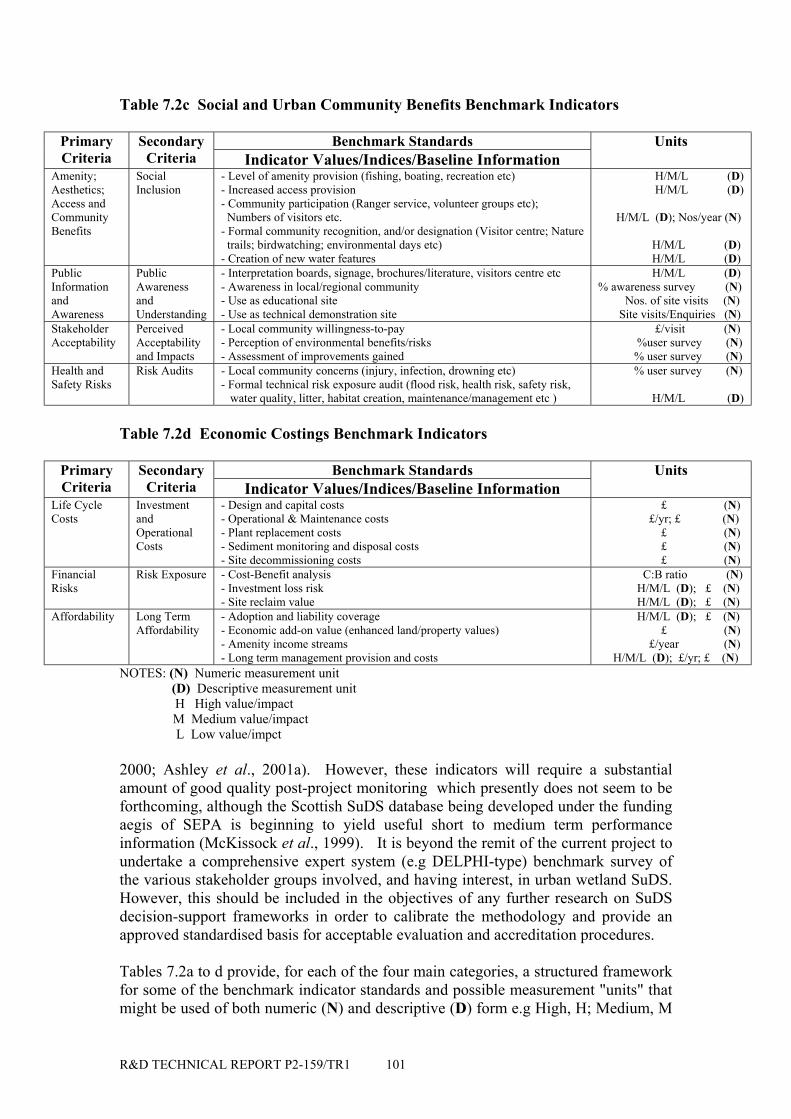
R&D TECHNICAL REPORT P2-159/TR1 101
Table 7.2c Social and Urban Community Benefits Benchmark Indicators
Benchmark StandardsPrimaryCriteria
SecondaryCriteria Indicator Values/Indices/Baseline Information
Units
Amenity;Aesthetics;Access andCommunityBenefits
SocialInclusion
- Level of amenity provision (fishing, boating, recreation etc)- Increased access provision- Community participation (Ranger service, volunteer groups etc); Numbers of visitors etc.- Formal community recognition, and/or designation (Visitor centre; Nature trails; birdwatching; environmental days etc)- Creation of new water features
H/M/L (D) H/M/L (D)
H/M/L (D); Nos/year (N)
H/M/L (D) H/M/L (D)
PublicInformationandAwareness
PublicAwarenessandUnderstanding
- Interpretation boards, signage, brochures/literature, visitors centre etc- Awareness in local/regional community- Use as educational site- Use as technical demonstration site
H/M/L (D)% awareness survey (N) Nos. of site visits (N) Site visits/Enquiries (N)
StakeholderAcceptability
PerceivedAcceptabilityand Impacts
- Local community willingness-to-pay- Perception of environmental benefits/risks- Assessment of improvements gained
£/visit (N) %user survey (N) % user survey (N)
Health andSafety Risks
Risk Audits - Local community concerns (injury, infection, drowning etc)- Formal technical risk exposure audit (flood risk, health risk, safety risk, water quality, litter, habitat creation, maintenance/management etc )
% user survey (N)
H/M/L (D)
Table 7.2d Economic Costings Benchmark Indicators
Benchmark StandardsPrimaryCriteria
SecondaryCriteria Indicator Values/Indices/Baseline Information
Units
Life CycleCosts
InvestmentandOperationalCosts
- Design and capital costs- Operational & Maintenance costs- Plant replacement costs- Sediment monitoring and disposal costs- Site decommissioning costs
£ (N) £/yr; £ (N) £ (N) £ (N) £ (N)
FinancialRisks
Risk Exposure - Cost-Benefit analysis- Investment loss risk- Site reclaim value
C:B ratio (N) H/M/L (D); £ (N) H/M/L (D); £ (N)
Affordability Long TermAffordability
- Adoption and liability coverage- Economic add-on value (enhanced land/property values)- Amenity income streams- Long term management provision and costs
H/M/L (D); £ (N) £ (N) £/year (N) H/M/L (D); £/yr; £ (N)
NOTES: (N) Numeric measurement unit (D) Descriptive measurement unit H High value/impact
M Medium value/impact L Low value/impct
2000; Ashley et al., 2001a). However, these indicators will require a substantialamount of good quality post-project monitoring which presently does not seem to beforthcoming, although the Scottish SuDS database being developed under the fundingaegis of SEPA is beginning to yield useful short to medium term performanceinformation (McKissock et al., 1999). It is beyond the remit of the current project toundertake a comprehensive expert system (e.g DELPHI-type) benchmark survey ofthe various stakeholder groups involved, and having interest, in urban wetland SuDS.However, this should be included in the objectives of any further research on SuDSdecision-support frameworks in order to calibrate the methodology and provide anapproved standardised basis for acceptable evaluation and accreditation procedures.
Tables 7.2a to d provide, for each of the four main categories, a structured frameworkfor some of the benchmark indicator standards and possible measurement "units" thatmight be used of both numeric (N) and descriptive (D) form e.g High, H; Medium, M
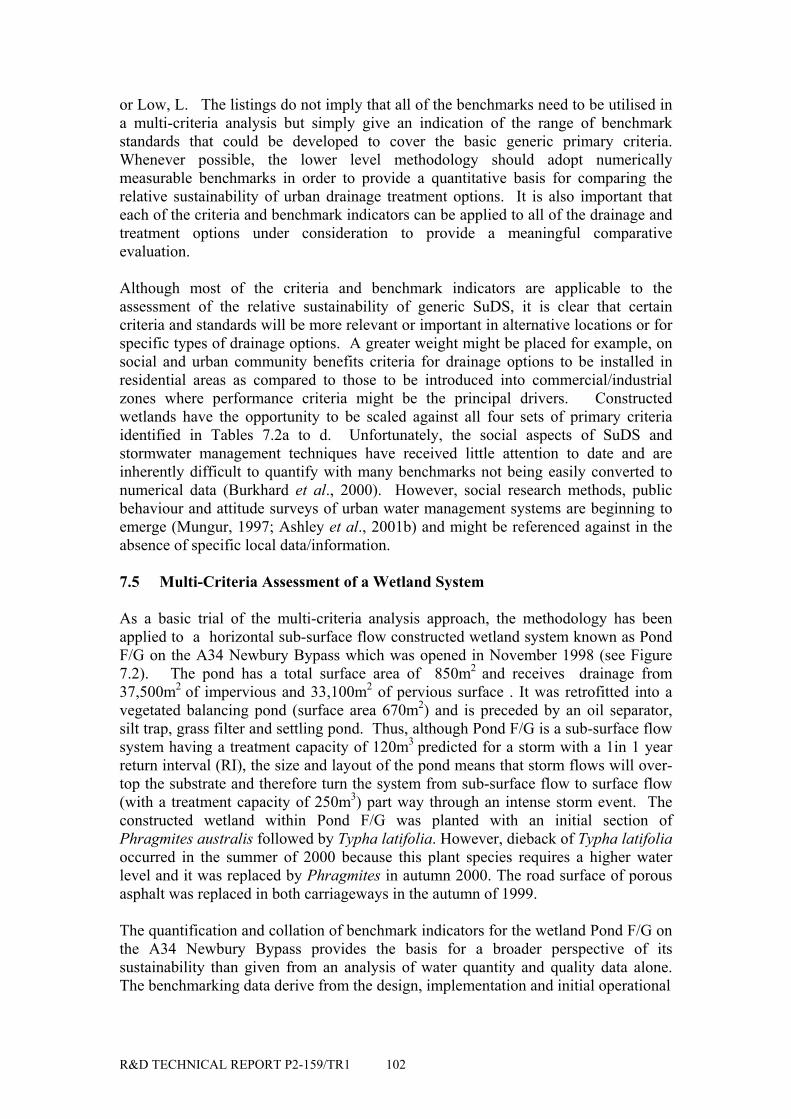
R&D TECHNICAL REPORT P2-159/TR1 102
or Low, L. The listings do not imply that all of the benchmarks need to be utilised ina multi-criteria analysis but simply give an indication of the range of benchmarkstandards that could be developed to cover the basic generic primary criteria.Whenever possible, the lower level methodology should adopt numericallymeasurable benchmarks in order to provide a quantitative basis for comparing therelative sustainability of urban drainage treatment options. It is also important thateach of the criteria and benchmark indicators can be applied to all of the drainage andtreatment options under consideration to provide a meaningful comparativeevaluation.
Although most of the criteria and benchmark indicators are applicable to theassessment of the relative sustainability of generic SuDS, it is clear that certaincriteria and standards will be more relevant or important in alternative locations or forspecific types of drainage options. A greater weight might be placed for example, onsocial and urban community benefits criteria for drainage options to be installed inresidential areas as compared to those to be introduced into commercial/industrialzones where performance criteria might be the principal drivers. Constructedwetlands have the opportunity to be scaled against all four sets of primary criteriaidentified in Tables 7.2a to d. Unfortunately, the social aspects of SuDS andstormwater management techniques have received little attention to date and areinherently difficult to quantify with many benchmarks not being easily converted tonumerical data (Burkhard et al., 2000). However, social research methods, publicbehaviour and attitude surveys of urban water management systems are beginning toemerge (Mungur, 1997; Ashley et al., 2001b) and might be referenced against in theabsence of specific local data/information.
7.5 Multi-Criteria Assessment of a Wetland System
As a basic trial of the multi-criteria analysis approach, the methodology has beenapplied to a horizontal sub-surface flow constructed wetland system known as PondF/G on the A34 Newbury Bypass which was opened in November 1998 (see Figure7.2). The pond has a total surface area of 850m2 and receives drainage from37,500m2 of impervious and 33,100m2 of pervious surface . It was retrofitted into avegetated balancing pond (surface area 670m2) and is preceded by an oil separator,silt trap, grass filter and settling pond. Thus, although Pond F/G is a sub-surface flowsystem having a treatment capacity of 120m3 predicted for a storm with a 1in 1 yearreturn interval (RI), the size and layout of the pond means that storm flows will over-top the substrate and therefore turn the system from sub-surface flow to surface flow(with a treatment capacity of 250m3) part way through an intense storm event. Theconstructed wetland within Pond F/G was planted with an initial section ofPhragmites australis followed by Typha latifolia. However, dieback of Typha latifoliaoccurred in the summer of 2000 because this plant species requires a higher waterlevel and it was replaced by Phragmites in autumn 2000. The road surface of porousasphalt was replaced in both carriageways in the autumn of 1999.
The quantification and collation of benchmark indicators for the wetland Pond F/G onthe A34 Newbury Bypass provides the basis for a broader perspective of itssustainability than given from an analysis of water quantity and quality data alone.The benchmarking data derive from the design, implementation and initial operational
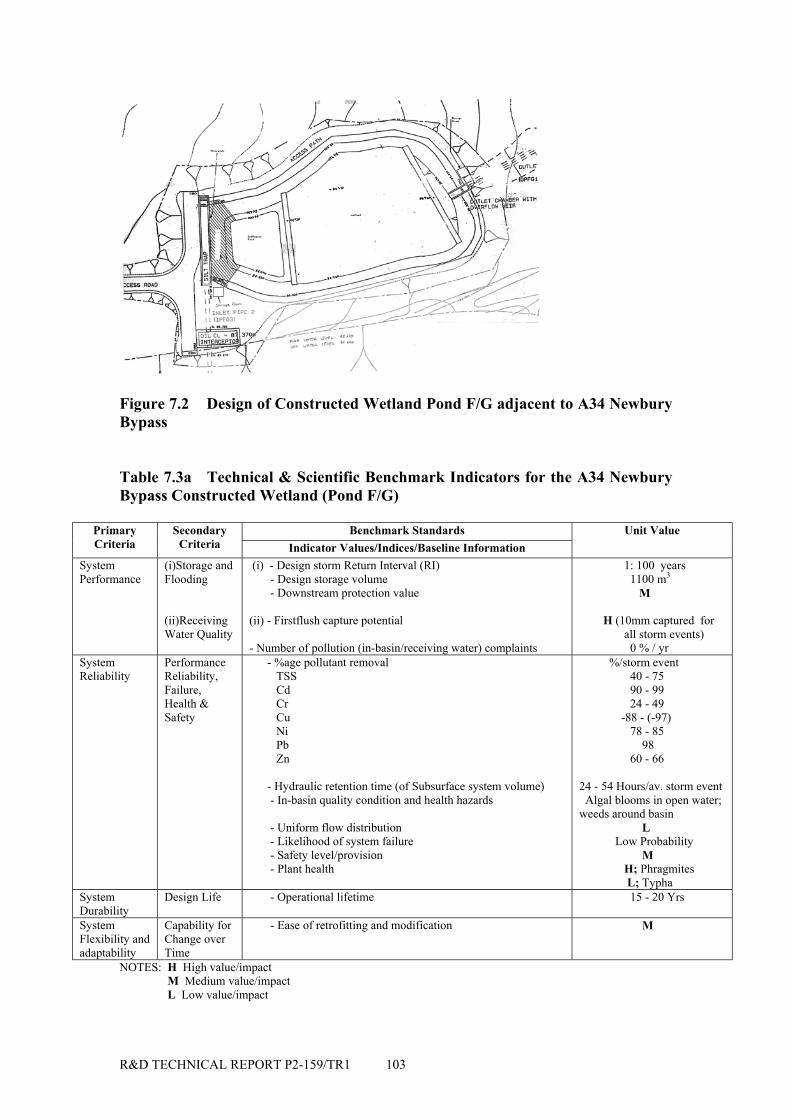
R&D TECHNICAL REPORT P2-159/TR1 103
Figure 7.2 Design of Constructed Wetland Pond F/G adjacent to A34 NewburyBypass
Table 7.3a Technical & Scientific Benchmark Indicators for the A34 NewburyBypass Constructed Wetland (Pond F/G)
Benchmark StandardsPrimaryCriteria
SecondaryCriteria Indicator Values/Indices/Baseline Information
Unit Value
SystemPerformance
(i)Storage andFlooding
(ii)ReceivingWater Quality
(i) - Design storm Return Interval (RI) - Design storage volume
- Downstream protection value
(ii) - Firstflush capture potential
- Number of pollution (in-basin/receiving water) complaints
1: 100 years 1100 m3
M
H (10mm captured for all storm events) 0 % / yr
SystemReliability
PerformanceReliability,Failure,Health &Safety
- %age pollutant removal TSS Cd Cr Cu Ni Pb Zn
- Hydraulic retention time (of Subsurface system volume)- In-basin quality condition and health hazards
- Uniform flow distribution- Likelihood of system failure
- Safety level/provision - Plant health
%/storm event 40 - 75 90 - 99 24 - 49 -88 - (-97) 78 - 85 98 60 - 66
24 - 54 Hours/av. storm event Algal blooms in open water;weeds around basin L Low Probability M H; Phragmites L; Typha
SystemDurability
Design Life - Operational lifetime 15 - 20 Yrs
SystemFlexibility andadaptability
Capability forChange overTime
- Ease of retrofitting and modification M
NOTES: H High value/impact M Medium value/impact L Low value/impact
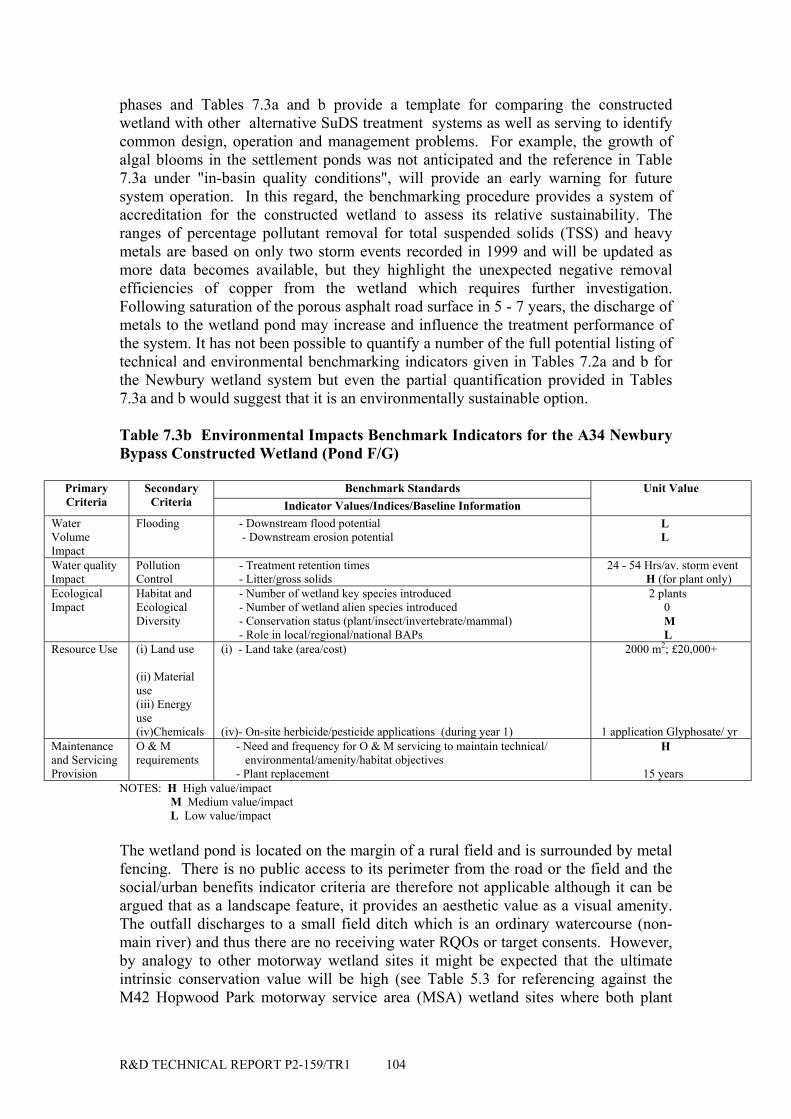
R&D TECHNICAL REPORT P2-159/TR1 104
phases and Tables 7.3a and b provide a template for comparing the constructedwetland with other alternative SuDS treatment systems as well as serving to identifycommon design, operation and management problems. For example, the growth ofalgal blooms in the settlement ponds was not anticipated and the reference in Table7.3a under "in-basin quality conditions", will provide an early warning for futuresystem operation. In this regard, the benchmarking procedure provides a system ofaccreditation for the constructed wetland to assess its relative sustainability. Theranges of percentage pollutant removal for total suspended solids (TSS) and heavymetals are based on only two storm events recorded in 1999 and will be updated asmore data becomes available, but they highlight the unexpected negative removalefficiencies of copper from the wetland which requires further investigation.Following saturation of the porous asphalt road surface in 5 - 7 years, the discharge ofmetals to the wetland pond may increase and influence the treatment performance ofthe system. It has not been possible to quantify a number of the full potential listing oftechnical and environmental benchmarking indicators given in Tables 7.2a and b forthe Newbury wetland system but even the partial quantification provided in Tables7.3a and b would suggest that it is an environmentally sustainable option.
Table 7.3b Environmental Impacts Benchmark Indicators for the A34 NewburyBypass Constructed Wetland (Pond F/G)
Benchmark StandardsPrimaryCriteria
SecondaryCriteria Indicator Values/Indices/Baseline Information
Unit Value
WaterVolumeImpact
Flooding - Downstream flood potential - Downstream erosion potential
L L
Water qualityImpact
PollutionControl
- Treatment retention times- Litter/gross solids
24 - 54 Hrs/av. storm event H (for plant only)
EcologicalImpact
Habitat andEcologicalDiversity
- Number of wetland key species introduced - Number of wetland alien species introduced - Conservation status (plant/insect/invertebrate/mammal) - Role in local/regional/national BAPs
2 plants 0 M L
Resource Use (i) Land use
(ii) Materialuse(iii) Energyuse(iv)Chemicals
(i) - Land take (area/cost)
(iv)- On-site herbicide/pesticide applications (during year 1)
2000 m2; £20,000+
1 application Glyphosate/ yrMaintenanceand ServicingProvision
O & Mrequirements
- Need and frequency for O & M servicing to maintain technical/ environmental/amenity/habitat objectives- Plant replacement
H
15 yearsNOTES: H High value/impact M Medium value/impact L Low value/impact
The wetland pond is located on the margin of a rural field and is surrounded by metalfencing. There is no public access to its perimeter from the road or the field and thesocial/urban benefits indicator criteria are therefore not applicable although it can beargued that as a landscape feature, it provides an aesthetic value as a visual amenity.The outfall discharges to a small field ditch which is an ordinary watercourse (non-main river) and thus there are no receiving water RQOs or target consents. However,by analogy to other motorway wetland sites it might be expected that the ultimateintrinsic conservation value will be high (see Table 5.3 for referencing against theM42 Hopwood Park motorway service area (MSA) wetland sites where both plant
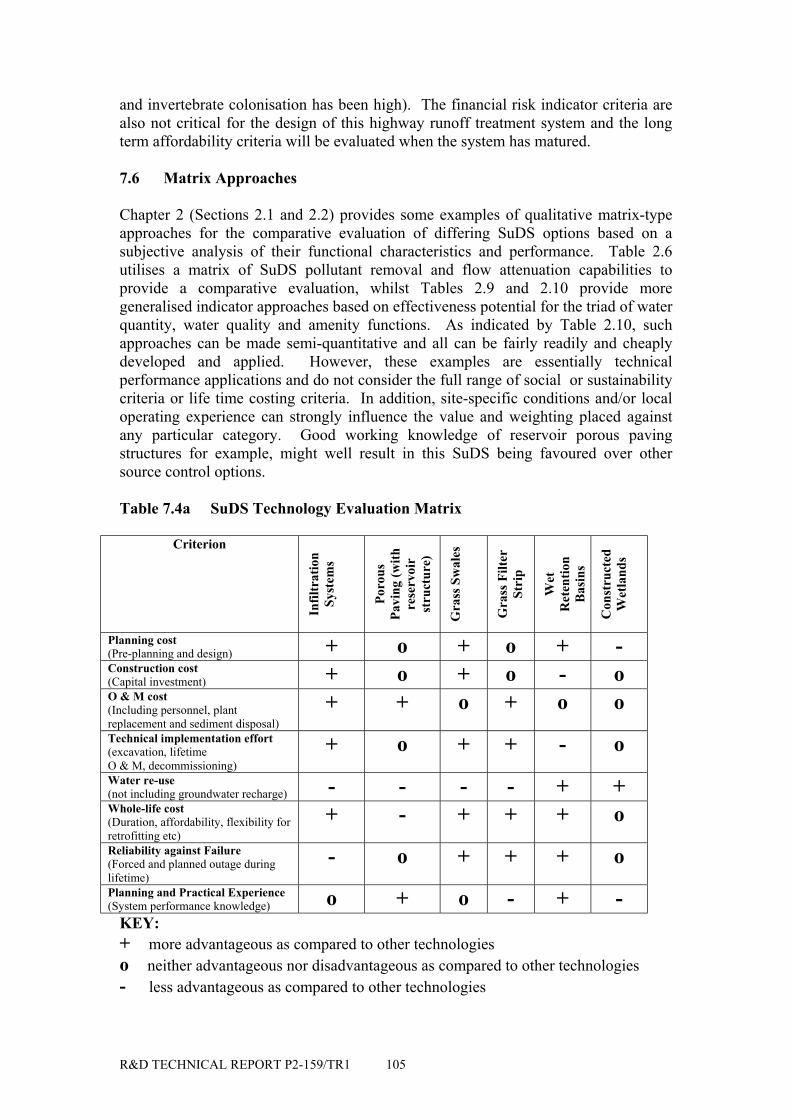
R&D TECHNICAL REPORT P2-159/TR1 105
and invertebrate colonisation has been high). The financial risk indicator criteria arealso not critical for the design of this highway runoff treatment system and the longterm affordability criteria will be evaluated when the system has matured.
7.6 Matrix Approaches
Chapter 2 (Sections 2.1 and 2.2) provides some examples of qualitative matrix-typeapproaches for the comparative evaluation of differing SuDS options based on asubjective analysis of their functional characteristics and performance. Table 2.6utilises a matrix of SuDS pollutant removal and flow attenuation capabilities toprovide a comparative evaluation, whilst Tables 2.9 and 2.10 provide moregeneralised indicator approaches based on effectiveness potential for the triad of waterquantity, water quality and amenity functions. As indicated by Table 2.10, suchapproaches can be made semi-quantitative and all can be fairly readily and cheaplydeveloped and applied. However, these examples are essentially technicalperformance applications and do not consider the full range of social or sustainabilitycriteria or life time costing criteria. In addition, site-specific conditions and/or localoperating experience can strongly influence the value and weighting placed againstany particular category. Good working knowledge of reservoir porous pavingstructures for example, might well result in this SuDS being favoured over othersource control options.
Table 7.4a SuDS Technology Evaluation Matrix
Criterion
Infil
trat
ion
Syst
ems
Poro
usPa
ving
(with
rese
rvoi
rst
ruct
ure)
Gra
ss S
wal
es
Gra
ss F
ilter
Stri
p
Wet
Ret
entio
nB
asin
s
Con
stru
cted
Wet
land
sPlanning cost(Pre-planning and design) + o + o + -Construction cost(Capital investment) + o + o - oO & M cost(Including personnel, plantreplacement and sediment disposal)
+ + o + o oTechnical implementation effort(excavation, lifetimeO & M, decommissioning)
+ o + + - oWater re-use(not including groundwater recharge) - - - - + +Whole-life cost(Duration, affordability, flexibility forretrofitting etc)
+ - + + + oReliability against Failure(Forced and planned outage duringlifetime)
- o + + + oPlanning and Practical Experience(System performance knowledge) o + o - + -
KEY:+ more advantageous as compared to other technologieso neither advantageous nor disadvantageous as compared to other technologies- less advantageous as compared to other technologies
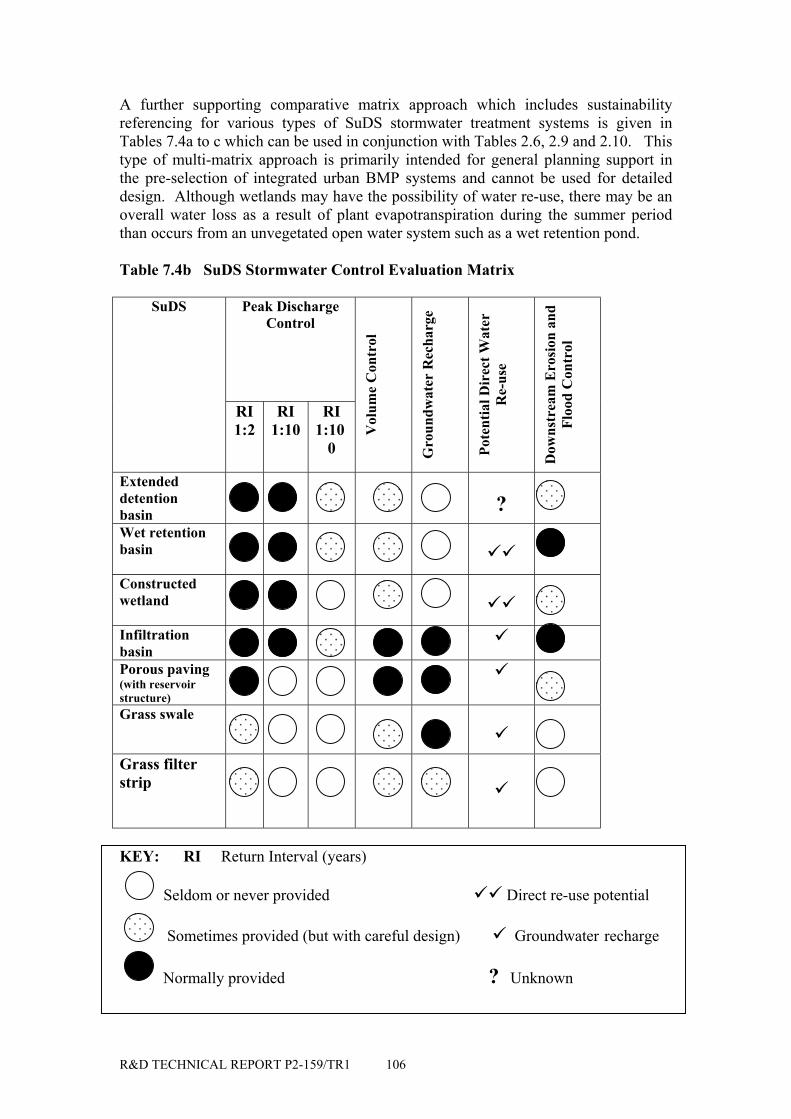
R&D TECHNICAL REPORT P2-159/TR1 106
Sometimes provided (but with careful design) Groundwater recharge
Normally provided ? Unknown
A further supporting comparative matrix approach which includes sustainabilityreferencing for various types of SuDS stormwater treatment systems is given inTables 7.4a to c which can be used in conjunction with Tables 2.6, 2.9 and 2.10. Thistype of multi-matrix approach is primarily intended for general planning support inthe pre-selection of integrated urban BMP systems and cannot be used for detaileddesign. Although wetlands may have the possibility of water re-use, there may be anoverall water loss as a result of plant evapotranspiration during the summer periodthan occurs from an unvegetated open water system such as a wet retention pond.
Table 7.4b SuDS Stormwater Control Evaluation Matrix
Peak DischargeControl
SuDS
RI1:2
RI1:10
RI1:10
0
Vol
ume
Con
trol
Gro
undw
ater
Rec
harg
e
Pote
ntia
l Dir
ect W
ater
Re-
use
Dow
nstr
eam
Ero
sion
and
Floo
d C
ontr
ol
Extendeddetentionbasin ?Wet retentionbasin
Constructedwetland
InfiltrationbasinPorous paving(with reservoirstructure)Grass swale
Grass filterstrip
KEY: RI Return Interval (years)
Seldom or never provided Direct re-use potential
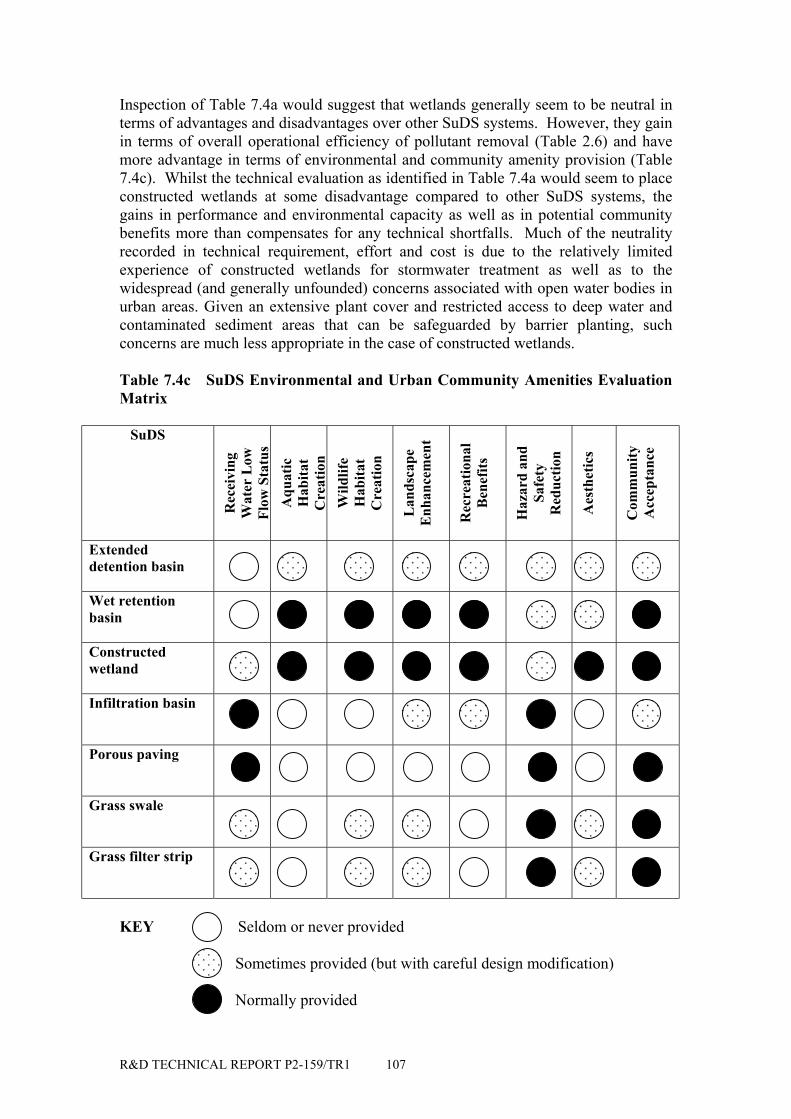
R&D TECHNICAL REPORT P2-159/TR1 107
Inspection of Table 7.4a would suggest that wetlands generally seem to be neutral interms of advantages and disadvantages over other SuDS systems. However, they gainin terms of overall operational efficiency of pollutant removal (Table 2.6) and havemore advantage in terms of environmental and community amenity provision (Table7.4c). Whilst the technical evaluation as identified in Table 7.4a would seem to placeconstructed wetlands at some disadvantage compared to other SuDS systems, thegains in performance and environmental capacity as well as in potential communitybenefits more than compensates for any technical shortfalls. Much of the neutralityrecorded in technical requirement, effort and cost is due to the relatively limitedexperience of constructed wetlands for stormwater treatment as well as to thewidespread (and generally unfounded) concerns associated with open water bodies inurban areas. Given an extensive plant cover and restricted access to deep water andcontaminated sediment areas that can be safeguarded by barrier planting, suchconcerns are much less appropriate in the case of constructed wetlands.
Table 7.4c SuDS Environmental and Urban Community Amenities EvaluationMatrix
SuDS
Rec
eivi
ngW
ater
Low
Flow
Sta
tus
Aqu
atic
Hab
itat
Cre
atio
nW
ildlif
eH
abita
tC
reat
ion
Lan
dsca
peE
nhan
cem
ent
Rec
reat
iona
lB
enef
its
Haz
ard
and
Safe
tyR
educ
tion
Aes
thet
ics
Com
mun
ityA
ccep
tanc
e
Extendeddetention basin
Wet retentionbasin
Constructedwetland
Infiltration basin
Porous paving
Grass swale
Grass filter strip
KEY Seldom or never provided
Sometimes provided (but with careful design modification)
Normally provided
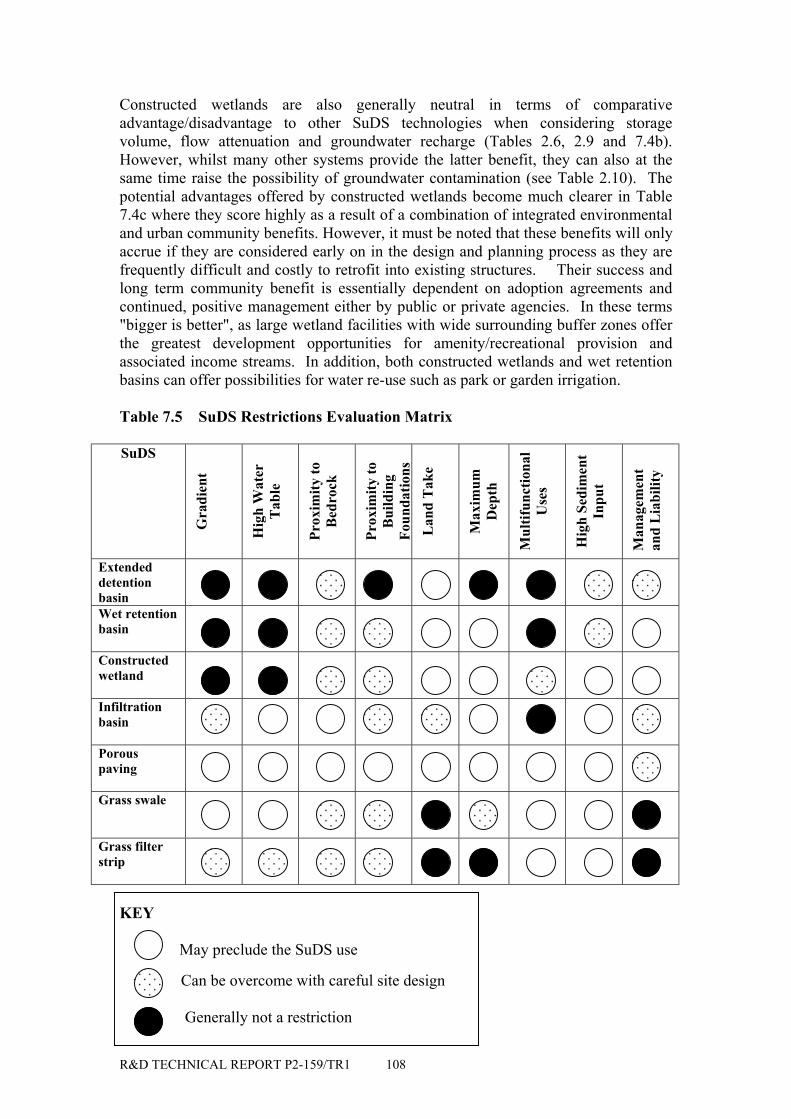
R&D TECHNICAL REPORT P2-159/TR1 108
Can be overcome with careful site design
Generally not a restriction
Constructed wetlands are also generally neutral in terms of comparativeadvantage/disadvantage to other SuDS technologies when considering storagevolume, flow attenuation and groundwater recharge (Tables 2.6, 2.9 and 7.4b).However, whilst many other systems provide the latter benefit, they can also at thesame time raise the possibility of groundwater contamination (see Table 2.10). Thepotential advantages offered by constructed wetlands become much clearer in Table7.4c where they score highly as a result of a combination of integrated environmentaland urban community benefits. However, it must be noted that these benefits will onlyaccrue if they are considered early on in the design and planning process as they arefrequently difficult and costly to retrofit into existing structures. Their success andlong term community benefit is essentially dependent on adoption agreements andcontinued, positive management either by public or private agencies. In these terms"bigger is better", as large wetland facilities with wide surrounding buffer zones offerthe greatest development opportunities for amenity/recreational provision andassociated income streams. In addition, both constructed wetlands and wet retentionbasins can offer possibilities for water re-use such as park or garden irrigation.
Table 7.5 SuDS Restrictions Evaluation Matrix
SuDS
Gra
dien
t
Hig
h W
ater
Tab
le
Prox
imity
toB
edro
ck
Prox
imity
toB
uild
ing
Foun
datio
nsL
and
Tak
e
Max
imum
Dep
th
Mul
tifun
ctio
nal
Use
s
Hig
h Se
dim
ent
Inpu
t
Man
agem
ent
and
Lia
bilit
y
ExtendeddetentionbasinWet retentionbasin
Constructedwetland
Infiltrationbasin
Porouspaving
Grass swale
Grass filterstrip
KEY
May preclude the SuDS use
R&D TECHNICAL REPORT P2-159/TR1 109
The matrix criteria identified in Table 7.4c essentially relate to stormwater wetlandsystems that are intended for introduction within residential and /orcommercial/industrial areas. The full range of criteria would not necessarily beapplicable to wetlands intended for the control and treatment of highway runoff whererecreational, amenity, aesthetics and community acceptance are generally notapplicable considerations. The major difficulties indicated in the Table 7.4c matrix,are associated with health and safety and with downstream receiving water protectionof low flow and thermal regimes where rapid changes in temperature due to incomingstormwater may present difficulties to fish and other aquatic species (see also Table2.10). Nevertheless, with careful design, constructed wetlands can avoid (or at thevery least minimise) all potential hazards.
Table 7.5 provides a general guidance matrix on a range of factors which can precludeor restrict the use of particular SuDS options. Wetlands together with other wetstorage facilities such as retention and extended detention basins, have fewer overallrestrictions although they can score badly against important factors such as spaceconsumption and adoption/management liability.
7.7 Flow Chart SuDS Design Procedure
Figure 7.3 illustrates a further alternative approach to providing general guidance tothe basic decisions and options available in the SuDS selection process for thetreatment and management of urban stormwater runoff. This "decision-tree" approachhas been developed for application to relatively small greenfield development sitesand is included in the guidance notes provided to SEPA Pollution Prevention &Control (PPC) Divisional teams to accompany the Scottish CIRIA SuDS manual(CIRIA, 2000a).
Like evaluation matrices, such flow charts are intended to assist the designer,developer and planner with the initial screening for urban drainage SuDS that arelikely to be most applicable for a given site; they are not in themselves a detaileddesign guide. However, before final selection is made, the initial screening outcomesmust be examined against the specific site characteristics and planning specificationsas well as evaluated in terms of cost effectiveness and institutional factors such as theliabilities for adoption. Such considerations might demote the initially screened SuDScandidate(s) and may in some cases rule them out altogether.
Note that the catchment areas indicated refer to the total drainage area served by theparticular device. For smaller sub-catchments, the SuDS type denoted on the tablelayer may be used, in which case the size of the device serving the larger catchmentcan be reduced. A question mark (?) indicates that the particular SuDS applicationmay be questionable because the catchment area is not large enough.
7.8 Wetland Design Procedure
The aim of this review has been to provide guidance on the design, operation andmaintenance of urban stormwater constructed wetlands, including detail on theirconfiguration, planting medium, water levels and type and extent of associated
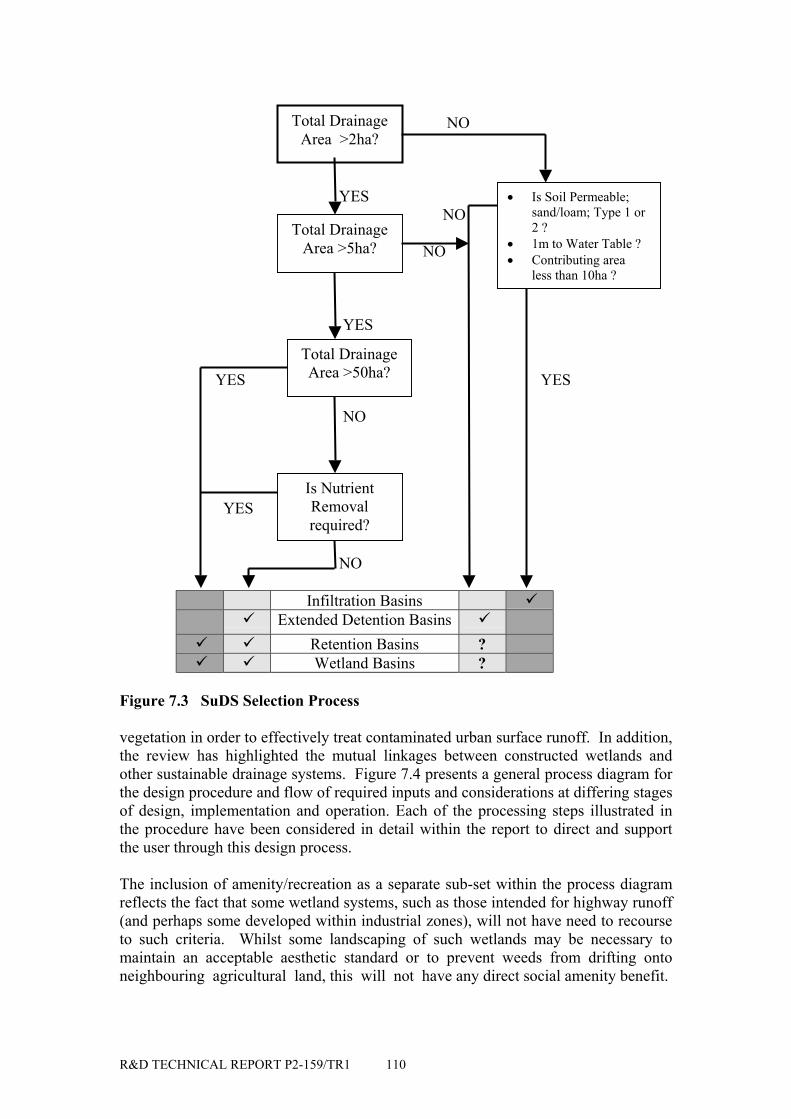
R&D TECHNICAL REPORT P2-159/TR1 110
NO
YES NO
NO
YES
YES YES
NO
YES
NO
Infiltration Basins Extended Detention Basins
Retention Basins ? Wetland Basins ?
Figure 7.3 SuDS Selection Process
vegetation in order to effectively treat contaminated urban surface runoff. In addition,the review has highlighted the mutual linkages between constructed wetlands andother sustainable drainage systems. Figure 7.4 presents a general process diagram forthe design procedure and flow of required inputs and considerations at differing stagesof design, implementation and operation. Each of the processing steps illustrated inthe procedure have been considered in detail within the report to direct and supportthe user through this design process.
The inclusion of amenity/recreation as a separate sub-set within the process diagramreflects the fact that some wetland systems, such as those intended for highway runoff(and perhaps some developed within industrial zones), will not have need to recourseto such criteria. Whilst some landscaping of such wetlands may be necessary tomaintain an acceptable aesthetic standard or to prevent weeds from drifting ontoneighbouring agricultural land, this will not have any direct social amenity benefit.
Total DrainageArea >2ha?
• Is Soil Permeable;sand/loam; Type 1 or2 ?
• 1m to Water Table ?• Contributing area
less than 10ha ?
Total DrainageArea >5ha?
Total DrainageArea >50ha?
Is NutrientRemovalrequired?
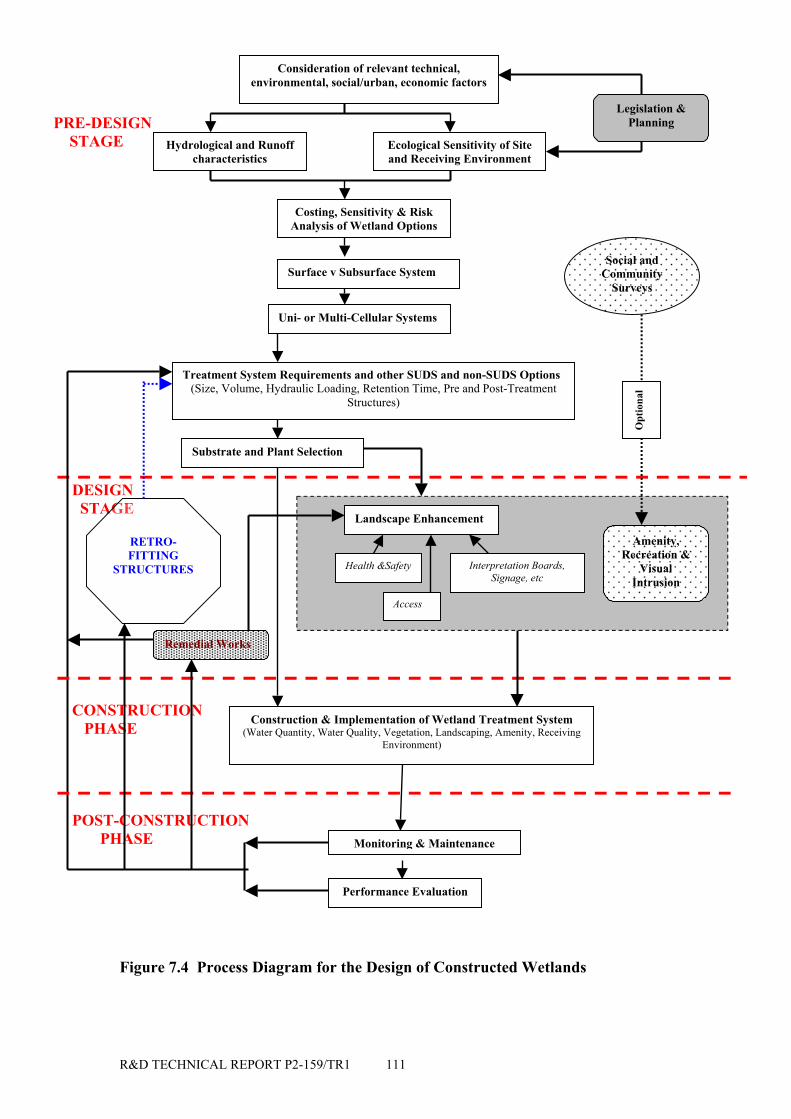
R&D TECHNICAL REPORT P2-159/TR1 111
PRE-DESIGN STAGE
DESIGN STAGE
CONSTRUCTION PHASE
POST-CONSTRUCTION PHASE
Figure 7.4 Process Diagram for the Design of Constructed Wetlands
Consideration of relevant technical,environmental, social/urban, economic factors
Hydrological and Runoffcharacteristics
Ecological Sensitivity of Siteand Receiving Environment
Legislation &Planning
Costing, Sensitivity & RiskAnalysis of Wetland Options
Uni- or Multi-Cellular Systems
Treatment System Requirements and other SUDS and non-SUDS Options(Size, Volume, Hydraulic Loading, Retention Time, Pre and Post-Treatment
Structures)
Social andCommunity
Surveys
Substrate and Plant Selection
Landscape Enhancement
Health &Safety
Access
Interpretation Boards,Signage, etc
Amenity,Recreation &
VisualIntrusion
Opt
iona
l
RETRO-FITTING
STRUCTURES
Remedial Works
Construction & Implementation of Wetland Treatment System(Water Quantity, Water Quality, Vegetation, Landscaping, Amenity, Receiving
Environment)
Monitoring & Maintenance
Performance Evaluation
Surface v Subsurface System

R&D TECHNICAL REPORT P2-159/TR1 112
Undoubtedly such wetland systems can offer conservation, habitat and aesthetic(quality-of-life) benefits irrespective of the exclusion of direct social/urban benefits,and these ecological criteria can be achieved through careful vegetation selection,planting considerations and control of water levels. The process design diagram thushas two routes from the design to construction phase, one of which by-passesamenity/recreational considerations when these are not required or are considered tobe redundant to the particular location and/or design objectives. The sustainability ofrestricted-objective wetland systems must therefore be judged on their own merits,rather than with systems which can be referenced against the full range of technical,environmental and social/urban community benchmark indicators.
Key Issues
• evaluation of the degree and nature of wetland sustainability in terms ofquantifiable generic criteria and indicators.
• role of SuDS devices as formal sewerage asset investments.• development of accreditation protocols for evaluating the comparative
sustainability of various SuDS devices.• use of multi-criteria analysis (MCA) for the selection of SuDS
drainage/treatment options

R&D TECHNICAL REPORT P2-159/TR1 113
8. DECISION SUPPORT APPROACHES FOR URBAN STORMDRAINAGE SYSTEMS IN FRANCE
8.1 Introduction
Constructed urban wetlands have not been widely adopted in France because wetlandsare traditionally associated with mosquitoes, and partly because of the rigidboundaries existing between disciplines. Ecologists have always been enthusiasticabout wetlands but urban drainage engineers have been reluctant to adopt thesenatural water retention systems, mainly because they have not always been properlydesigned. For these and other reasons, many natural wetlands within France havedisappeared during the past forty years. Within urban areas, creeks and small rivershave been gradually integrated into the underground sewer system.
Nevertheless, France has been one of the European states which became interestedrelatively early on in source control of urban stormwater run-off and BMP’s withmany wet retention basins being designed and introduced into french urban areasduring the early sixties. The New Towns Construction policy, which was launched atthe end of the fifties, allowed drastic changes in the design of sewer systems. Aclassical sewer system (i.e. with pipes) for stormwater runoff could not be designedfor these towns, mainly for economic reasons. This led to the promotion of retentionbasins and to a new 1997 regulation on sewer systems, within which one chapter wasdevoted to the design of retention structures. It was followed by an important nationalresearch programme, led by the Ministry of Public Works, from 1978. Othertechniques were soon investigated such as the use of porous pavements.
During the past twenty years, the concept of source control of urban storm runoff hasbecome widely disseminated among drainage engineers in France. However, as thenumber of field experiments increased, it soon emerged that the difficulties ofimplementation were far from being solely technical in nature. Design engineers alsohad to face questions such as :
• how to convince people to infiltrate stormwater runoff directly to ground or tostore rainfall-runoff on house roofs?
• how to convince elected officials to retain a section of developement land fromurbanisation in order to build a retention basin or other source control devicesome years later?
• how to estimate the global life-time cost (initial investment and post-projectmaintenance) of innovative source control devices?
At the same time, the development of modelling and national measurementcampaigns questioned the technical basis of traditional sewer system design usingfor example, the concept of a fixed design storm return period of 10 years, or the useof very simple models for the calculation of peak flows on very large urbancatchments. New problems also appeared, such as the importance of the pollutionimpact associated with urban stormwater outfalls and combined sewer overflows, andthe need to determine the impacts of such pollution sources on the environmentwhich depends to some extent on quality objectives for groundwater, river or lakewater. Appendix D provides an outline of the legislation relating to the planning,

R&D TECHNICAL REPORT P2-159/TR1 114
design and operation of surface water discharges and storage facilities in France,together with a brief description of prevailing water quality and sediment standards.
These legislative and technical developments have led to two outcomes. The first isthe development of numerous research programmes to determine and specify theparameters which can give a good description of the state of the aquatic environmentboth now, and in the future, and particularly during wet weather conditions. Thesecond is the idea that decisions in the field of urban sewerage are no longer takenexclusively by engineers or even following a dialogue between engineers and electedofficials. Other stakeholders have to be involved in the decision process in order thatthe solution is acceptable to all interest and user groups. The variety of potentialstakeholders include: drainage engineers in the state services, public health engineersat the county level, local government planners and technicians at different levels,urban designers, water agencies, private firms, local elected officials, local residentassociations etc.
Thus urban decision-making is becoming increasingly complex. Faced with thissituation, some important local communities have tried to make the process moreobjective, following two pathways :• Organising the decision-making process by: identifying which stakeholder(s)
should be involved, and at what stage, in order to facilitate communicationbetween technicians and non-technicians, and providing methods to take intoaccount the impact of new devices and associated equipment when they are infinal operation.
• Involving all the potential stakeholders and taking into consideration the multipleobjectives that might be contained in the decision-making process.
From the variety of decision-making methods available, multicriteria analysis (MCA)has become a commonly chosen tool. This method is now frequently used in the maincities within France as a decision support tool for urban sewer systems, and provides amethod that could be equally applied to constructed wetlands. To illustrate how themethod may be applied, the following section describes :
• the development and the implementation of a sewerage programme at the localcommunity level
• the criteria for the choice of source control of urban runoff through a generalmethodology and a benchmarking inquiry conducted to resolve alternativesolutions for source control.
• two case studies.
8.2 Sewerage Systems Procedures in Local Communities
Sewerage system development procedures have been defined by the 1992 FrenchWater Law, and more explicitly by a decree dated June 3rd 1994 which givesdirectives to technicians, and makes sewerage programmes mandatory (see AppendixD). These programmes are the result of national studies that have analysed how theexisting system functions, how final proposals are reached, and how long-terminvestment programmes are established. These sewer drainage programmes must beapproved by the appropriate city council. The June 3rd decree sets out specialdirectives concerning the way such urban sewerage programmes should be
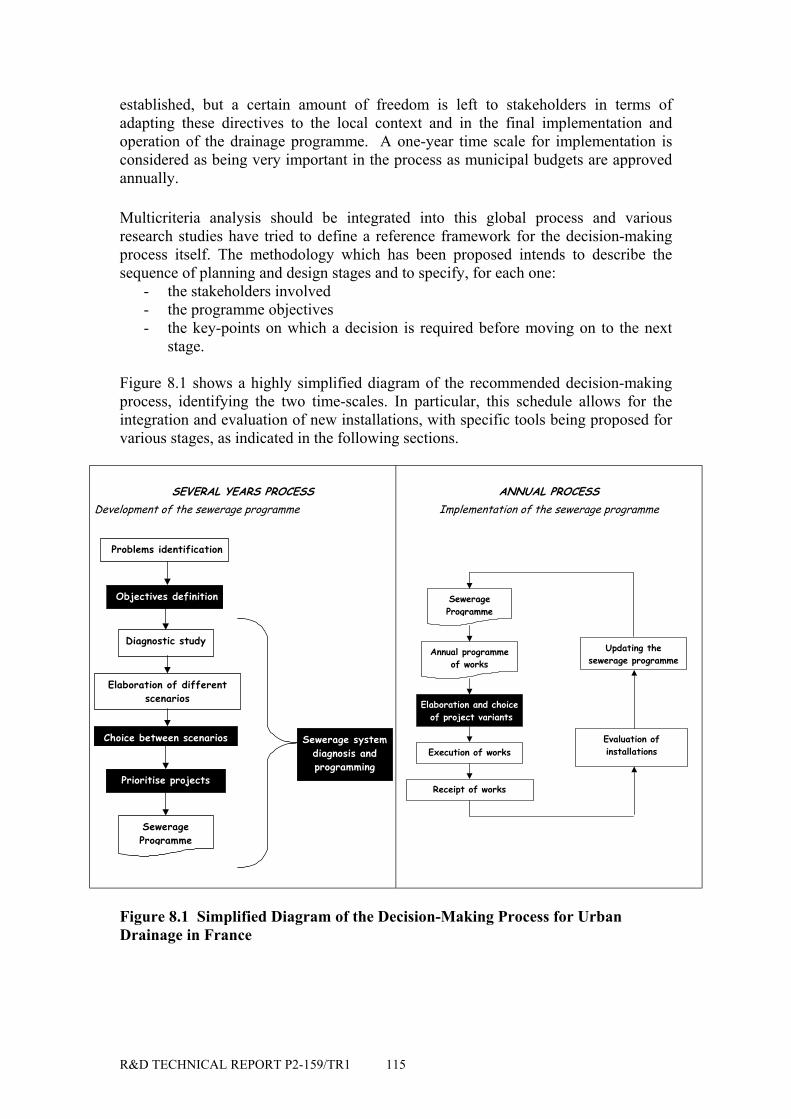
R&D TECHNICAL REPORT P2-159/TR1 115
established, but a certain amount of freedom is left to stakeholders in terms ofadapting these directives to the local context and in the final implementation andoperation of the drainage programme. A one-year time scale for implementation isconsidered as being very important in the process as municipal budgets are approvedannually.
Multicriteria analysis should be integrated into this global process and variousresearch studies have tried to define a reference framework for the decision-makingprocess itself. The methodology which has been proposed intends to describe thesequence of planning and design stages and to specify, for each one:
- the stakeholders involved- the programme objectives- the key-points on which a decision is required before moving on to the next
stage.
Figure 8.1 shows a highly simplified diagram of the recommended decision-makingprocess, identifying the two time-scales. In particular, this schedule allows for theintegration and evaluation of new installations, with specific tools being proposed forvarious stages, as indicated in the following sections.
SEVERAL YEARS PROCESSDevelopment of the sewerage programme
Problems identification
SewerageProgramme
Objectives definition
Diagnostic study
Elaboration of differentscenarios
Choice between scenarios
Prioritise projects
Sewerage systemdiagnosis andprogramming
ANNUAL PROCESSImplementation of the sewerage programme
SewerageProgramme
Elaboration and choice of project variants
Execution of works
Receipt of works
Annual programmeof works
Evaluation ofinstallations
Updating thesewerage programme
Figure 8.1 Simplified Diagram of the Decision-Making Process for UrbanDrainage in France
R&D TECHNICAL REPORT P2-159/TR1 116
8.2.1 Defining city sanitation objectives
This initial stage includes a checklist of potential objectives such as sanitaryprotection, flood control and participation in sustainable water management, the latterof which could be considered as being an external objective, since it refers to thedirect and indirect operational effects of sewer systems on people’s lives. Internalobjectives also exist, e.g in considering the operational work undertaken by theemployees within the sanitation services or the environmental image that electedrepresentatives wish to give of their cities. Nevertheless, the main objectives of anyurban sanitation programme are: economic efficiency, operational efficiency andpositive socio-political impact, especially in terms of integration of facilities intocity infrastructure and making them environmentally acceptable. These objectivesalso include the incorporation of indicators covering specific issues (e.g. legal ortechnical requirements) or indicators for converting political objectives into sanitationterms.
8.2.2 Sewerage project diagnosis and programming
The Book of Technical Specifications1 for French public works projects is importantfor the municipal government level, not only in terms of selecting the privatecontractor who will eventually complete the work, but also for monitoring thediagnostic and design phases. Thus, a standard Book of Technical Specifications isprovided which contains the elements necessary to adapt the specifications to eachcontext.
8.2.3 Choosing between scenarios
Different strategies can be adopted for the sanitation of urban areas and there isfrequently no obvious choice. The methodology advised here is that of multicriteriaanalysis (MCA). A standard list of criteria suited to a particular stage in the planningand design process is provided, together with recommendations on how the variouscriteria should be evaluated.
8.2.4 Prioritising projects
A checklist of typical constraints involved in the implementation of sewerageprogrammes is combined with a list of ratios that can be used within the remaining“room for manoeuvre”.
8.2.5 Develop and choose project variants
At the end of a project design process, engineers often propose several variants to thedecision-makers. This is often the case for stormwater retention devices, as theycomprise surface drainage devices and, therefore, are of interest to inhabitants andtheir representatives. The recommended methodology for this stage in the planningprocess is again multicriteria analysis. A standard list of criteria for this type of sourcecontrol device is provided, together with advice on how such retention facilitiesshould be evaluated.
1 In French : Cahier des Clauses Techniques Particulières (CCTP).
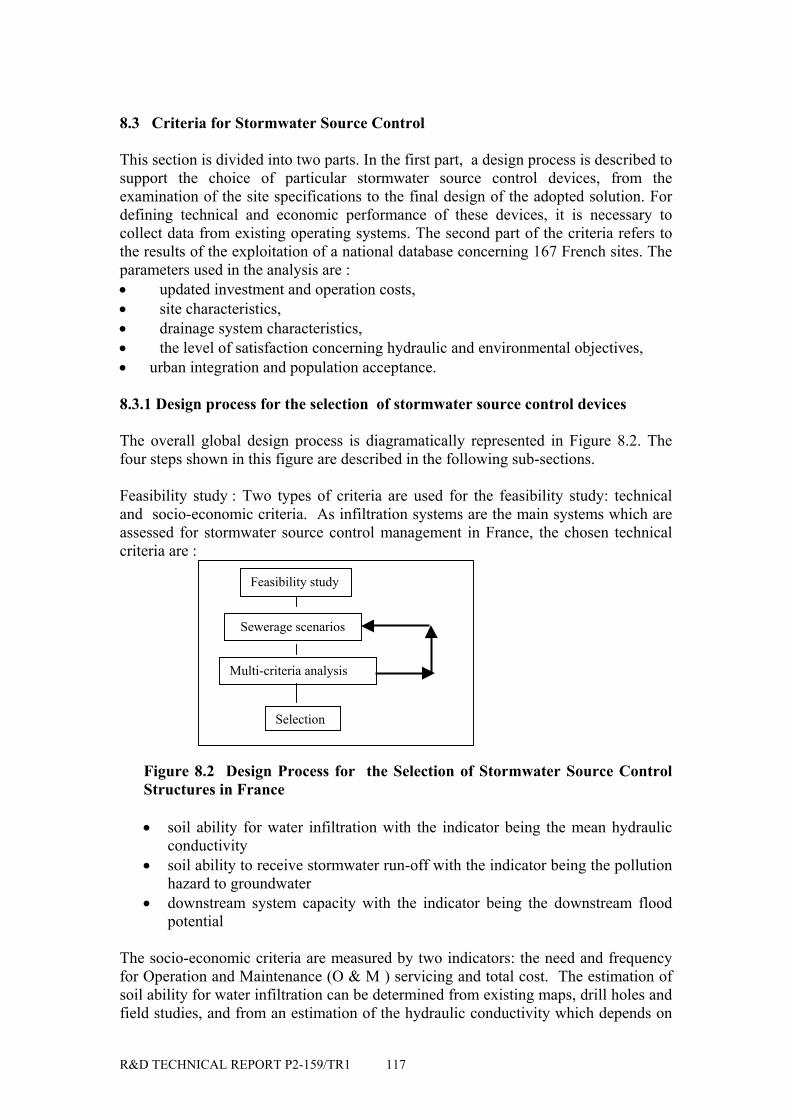
R&D TECHNICAL REPORT P2-159/TR1 117
8.3 Criteria for Stormwater Source Control
This section is divided into two parts. In the first part, a design process is described tosupport the choice of particular stormwater source control devices, from theexamination of the site specifications to the final design of the adopted solution. Fordefining technical and economic performance of these devices, it is necessary tocollect data from existing operating systems. The second part of the criteria refers tothe results of the exploitation of a national database concerning 167 French sites. Theparameters used in the analysis are :• updated investment and operation costs,• site characteristics,• drainage system characteristics,• the level of satisfaction concerning hydraulic and environmental objectives,• urban integration and population acceptance.
8.3.1 Design process for the selection of stormwater source control devices
The overall global design process is diagramatically represented in Figure 8.2. Thefour steps shown in this figure are described in the following sub-sections.
Feasibility study : Two types of criteria are used for the feasibility study: technicaland socio-economic criteria. As infiltration systems are the main systems which areassessed for stormwater source control management in France, the chosen technicalcriteria are :
Figure 8.2 Design Process for the Selection of Stormwater Source ControlStructures in France
• soil ability for water infiltration with the indicator being the mean hydraulicconductivity
• soil ability to receive stormwater run-off with the indicator being the pollutionhazard to groundwater
• downstream system capacity with the indicator being the downstream floodpotential
The socio-economic criteria are measured by two indicators: the need and frequencyfor Operation and Maintenance (O & M ) servicing and total cost. The estimation ofsoil ability for water infiltration can be determined from existing maps, drill holes andfield studies, and from an estimation of the hydraulic conductivity which depends on
Feasibility study
Sewerage scenarios
Multi-criteria analysis
Selection
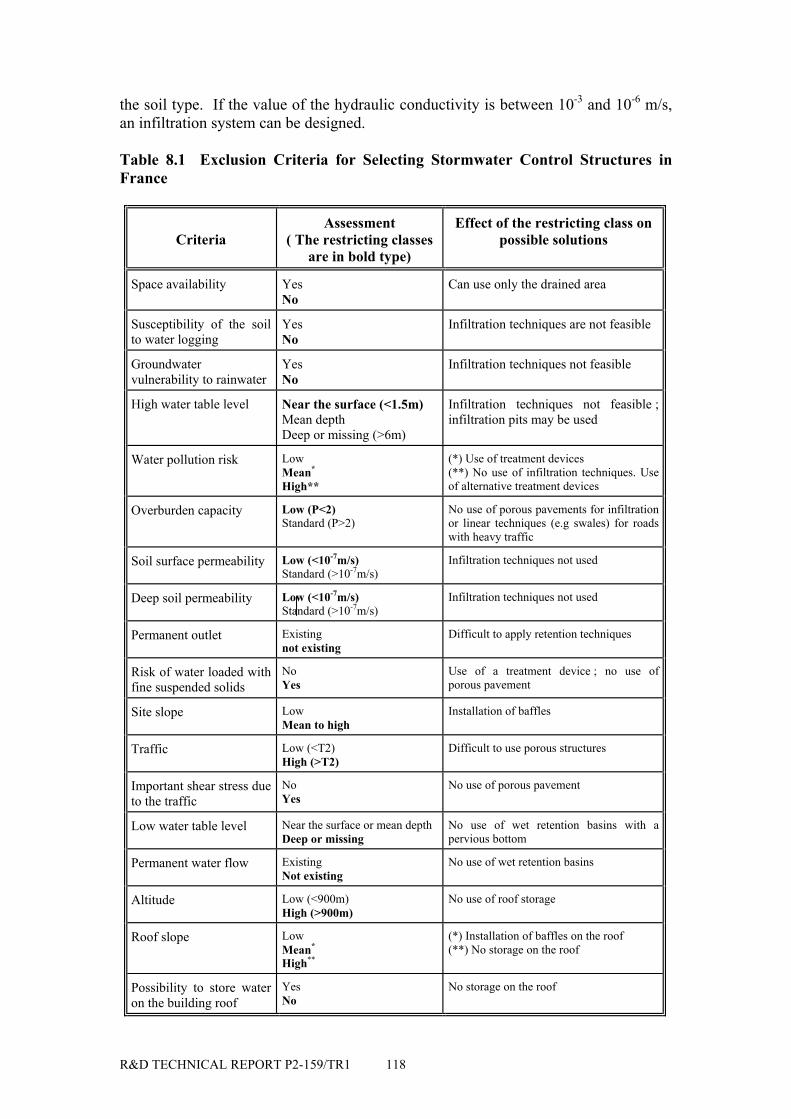
R&D TECHNICAL REPORT P2-159/TR1 118
the soil type. If the value of the hydraulic conductivity is between 10-3 and 10-6 m/s,an infiltration system can be designed.
Table 8.1 Exclusion Criteria for Selecting Stormwater Control Structures inFrance
CriteriaAssessment
( The restricting classesare in bold type)
Effect of the restricting class onpossible solutions
Space availability YesNo
Can use only the drained area
Susceptibility of the soilto water logging
YesNo
Infiltration techniques are not feasible
Groundwatervulnerability to rainwater
YesNo
Infiltration techniques not feasible
High water table level Near the surface (<1.5m)Mean depthDeep or missing (>6m)
Infiltration techniques not feasible ;infiltration pits may be used
Water pollution risk LowMean*
High**
(*) Use of treatment devices(**) No use of infiltration techniques. Useof alternative treatment devices
Overburden capacity Low (P<2)Standard (P>2)
No use of porous pavements for infiltrationor linear techniques (e.g swales) for roadswith heavy traffic
Soil surface permeability Low (<10-7m/s)Standard (>10-7m/s)
Infiltration techniques not used
Deep soil permeability Low (<10-7m/s)Standard (>10-7m/s)
Infiltration techniques not used
Permanent outlet Existingnot existing
Difficult to apply retention techniques
Risk of water loaded withfine suspended solids
NoYes
Use of a treatment device ; no use ofporous pavement
Site slope LowMean to high
Installation of baffles
Traffic Low (<T2)High (>T2)
Difficult to use porous structures
Important shear stress dueto the traffic
NoYes
No use of porous pavement
Low water table level Near the surface or mean depthDeep or missing
No use of wet retention basins with apervious bottom
Permanent water flow ExistingNot existing
No use of wet retention basins
Altitude Low (<900m)High (>900m)
No use of roof storage
Roof slope LowMean*
High**
(*) Installation of baffles on the roof(**) No storage on the roof
Possibility to store wateron the building roof
YesNo
No storage on the roof
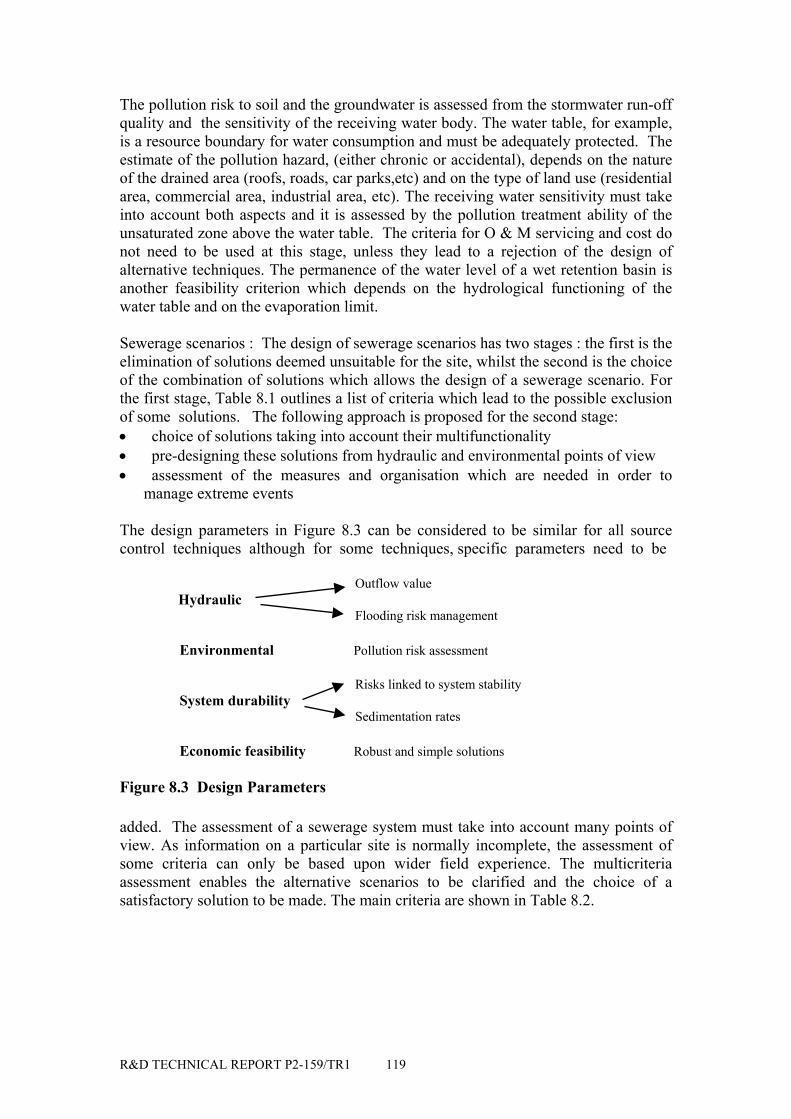
R&D TECHNICAL REPORT P2-159/TR1 119
The pollution risk to soil and the groundwater is assessed from the stormwater run-offquality and the sensitivity of the receiving water body. The water table, for example,is a resource boundary for water consumption and must be adequately protected. Theestimate of the pollution hazard, (either chronic or accidental), depends on the natureof the drained area (roofs, roads, car parks,etc) and on the type of land use (residentialarea, commercial area, industrial area, etc). The receiving water sensitivity must takeinto account both aspects and it is assessed by the pollution treatment ability of theunsaturated zone above the water table. The criteria for O & M servicing and cost donot need to be used at this stage, unless they lead to a rejection of the design ofalternative techniques. The permanence of the water level of a wet retention basin isanother feasibility criterion which depends on the hydrological functioning of thewater table and on the evaporation limit.
Sewerage scenarios : The design of sewerage scenarios has two stages : the first is theelimination of solutions deemed unsuitable for the site, whilst the second is the choiceof the combination of solutions which allows the design of a sewerage scenario. Forthe first stage, Table 8.1 outlines a list of criteria which lead to the possible exclusionof some solutions. The following approach is proposed for the second stage:• choice of solutions taking into account their multifunctionality• pre-designing these solutions from hydraulic and environmental points of view• assessment of the measures and organisation which are needed in order to
manage extreme events
The design parameters in Figure 8.3 can be considered to be similar for all sourcecontrol techniques although for some techniques, specific parameters need to be
Outflow value Hydraulic
Flooding risk management
Environmental Pollution risk assessment
Risks linked to system stabilitySystem durability Sedimentation rates
Economic feasibility Robust and simple solutions
Figure 8.3 Design Parameters
added. The assessment of a sewerage system must take into account many points ofview. As information on a particular site is normally incomplete, the assessment ofsome criteria can only be based upon wider field experience. The multicriteriaassessment enables the alternative scenarios to be clarified and the choice of asatisfactory solution to be made. The main criteria are shown in Table 8.2.
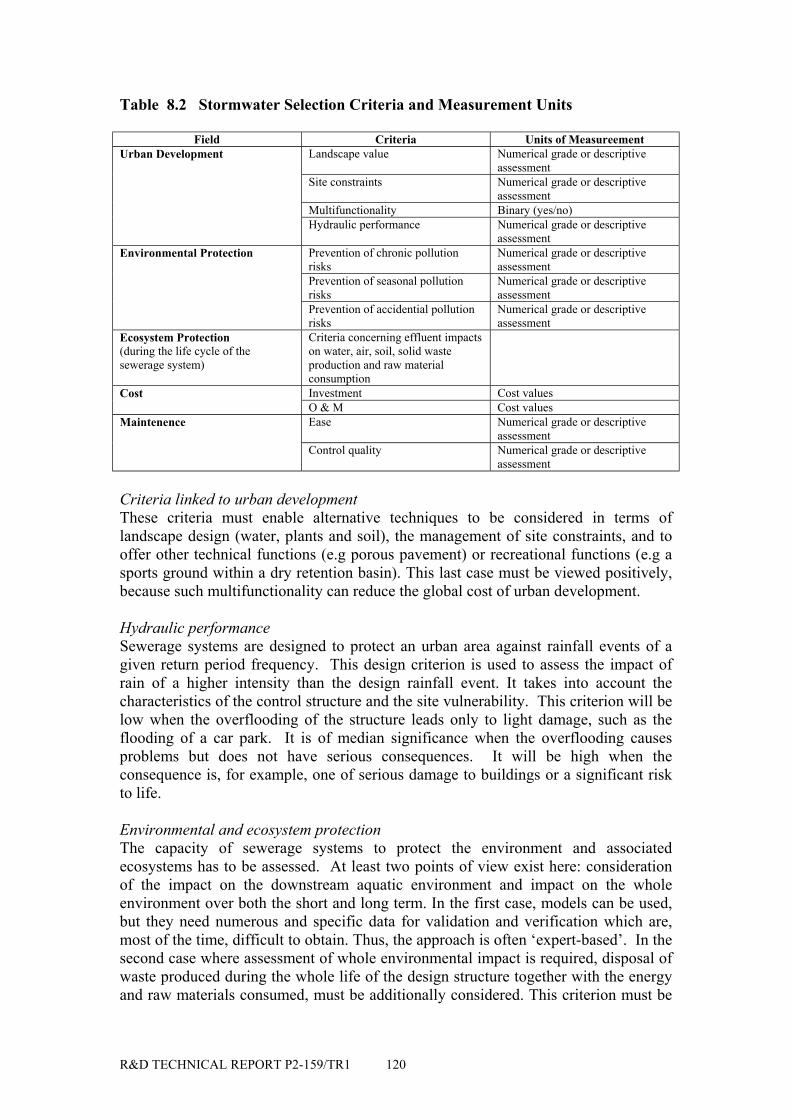
R&D TECHNICAL REPORT P2-159/TR1 120
Table 8.2 Stormwater Selection Criteria and Measurement Units
Field Criteria Units of MeasureementLandscape value Numerical grade or descriptive
assessmentSite constraints Numerical grade or descriptive
assessmentMultifunctionality Binary (yes/no)
Urban Development
Hydraulic performance Numerical grade or descriptiveassessment
Prevention of chronic pollutionrisks
Numerical grade or descriptiveassessment
Prevention of seasonal pollutionrisks
Numerical grade or descriptiveassessment
Environmental Protection
Prevention of accidential pollutionrisks
Numerical grade or descriptiveassessment
Ecosystem Protection(during the life cycle of thesewerage system)
Criteria concerning effluent impactson water, air, soil, solid wasteproduction and raw materialconsumptionInvestment Cost valuesCostO & M Cost valuesEase Numerical grade or descriptive
assessmentMaintenence
Control quality Numerical grade or descriptiveassessment
Criteria linked to urban developmentThese criteria must enable alternative techniques to be considered in terms oflandscape design (water, plants and soil), the management of site constraints, and tooffer other technical functions (e.g porous pavement) or recreational functions (e.g asports ground within a dry retention basin). This last case must be viewed positively,because such multifunctionality can reduce the global cost of urban development.
Hydraulic performanceSewerage systems are designed to protect an urban area against rainfall events of agiven return period frequency. This design criterion is used to assess the impact ofrain of a higher intensity than the design rainfall event. It takes into account thecharacteristics of the control structure and the site vulnerability. This criterion will below when the overflooding of the structure leads only to light damage, such as theflooding of a car park. It is of median significance when the overflooding causesproblems but does not have serious consequences. It will be high when theconsequence is, for example, one of serious damage to buildings or a significant riskto life.
Environmental and ecosystem protectionThe capacity of sewerage systems to protect the environment and associatedecosystems has to be assessed. At least two points of view exist here: considerationof the impact on the downstream aquatic environment and impact on the wholeenvironment over both the short and long term. In the first case, models can be used,but they need numerous and specific data for validation and verification which are,most of the time, difficult to obtain. Thus, the approach is often ‘expert-based’. In thesecond case where assessment of whole environmental impact is required, disposal ofwaste produced during the whole life of the design structure together with the energyand raw materials consumed, must be additionally considered. This criterion must be
R&D TECHNICAL REPORT P2-159/TR1 121
derived from life-cycle analysis. The aim here is to minimize the effluent discharges,the consumption of energy and raw materials and to reduce the quantity of waste.
CostDespite the numeric form of this criterion, there is considerable inherent uncertaintyin its assessment, due to the following factors :• the capital investment and O&M cost data are very heterogeneous in nature.
They depend on the design of the structure (dimensioning, landscape provisionand integration etc.), the location and cost of the site and the treatmentprocess implemented by the local stakeholders.
• the type of answer given to the following question : who pays ? The answerto this question is variable and could be the local community or a privatedeveloper, but in most cases will depend upon the selected technique(s).
• the difficulty of comparing structures having two or more functions. Theanalysis of the costs corresponding to the different functions is very complex.How should one compare the costs of a dry landscaped basin with a wetretention basin or a grass swale ? How is it possible to separate the addedcosts of the hydraulic function and of the public green space function ?
• the difficulty of estimating the direct beneficial (or penal) cost of anylimitation in flow for the downstream network or the non-increase ofstormwater effluent at the overflow facilities, or resulting land values.
Operation and controlFor the operation and control of alternative techniques, it is necessary to define whichkind of operation is needed, and which stakeholders will be responsible for themanagement of each operation. This is of particular importance for a multifunctionalstructure as there may be several services having responsibility for the different levelsand modes of operation. In this respect, the multifunctional mode can lead to thedilution (or abrogation) of individual responsibilities and inadequate long termmaintenance of the structure and thus degrade the ability of the structure to performits various design functions.
8.3.2 Economic database of French alternative techniques
This database covers different types of source control structure and different contextsof design. It contains 167 cases situated within three French areas : Lyon, Bordeauxand Seine Saint-Denis, Paris. For each case on a given site, the following informationis given:• Type of structure and materials used• Storage volume• Drained catchment area• Year of implementation of the structure and the reference year for the costs• Total investment costs, updated (and discounted) for the base year of 1999• Mean annual O&M costs• Quality mark for the information relating to investment and operating costs• Qualitative assessment of the global perception of the structure by the
stakeholders: technical operation, environmental impact and integration level(social, landscape etc).
R&D TECHNICAL REPORT P2-159/TR1 122
Most of the cases in this national database are retention basins (143). The numbers ofdry retention basins, of underground storage tanks and of storage systems in pre-fabricated elements (pipes with large dimensions) are sufficient to present somegeneral statistics.
Dry retention basins: The range of storage volume is very large from 68 m3 to202,000 m3 with a mean of 22 088 m3 and a standard deviation of 610 m3. Theinvestment costs vary from 54 F/m3 to 4479 F/m3 with a mean of 895F/m3 and astandard deviation of 1 143 F/m3. The correlation between the storage volumeparameter and the cost parameter is good (with a coefficient of determination, R2 =0.73 i.e 73% of the variance is explained by the two parameters). The basins whichare integrated into the local urban framework have a mean cost of about 740 F/m3
(standard deviation of 570 F/m3) and non- integrated basins have a mean cost of 960F/m3 (standard deviation of 1333F/m3). This means statistically, that for the sample inthe data base, the additional costs due to multifunctionality are not very significant.The O&M costs vary from 0 to 83F/m3 with an average of 10.6 F/m3 and a standarddeviation of 19.7 F/m3. There is no correlation between these costs and the storagevolume, between the investment costs and the O&M costs, or between the globalcosts and the operational quality.
Underground storage tanks: The range of storage volume is also very large varyingbetween 10 to 39 000 m3, with an average of 2 784 m3 and a standard deviation of 7370 m3. The investment costs vary from 159F/m3 to 9 946 F/m3 with a mean of 2 369F/m3 and a standard deviation of 1 928 F/m3. There is a good correlation with thestorage volume (with R2 = 0.79) but there is no statistical relation between theinvestment costs and the O&M costs, or between the global costs and the operationalquality.
Prefabricated storage systems: These basins have a rather low storage volume with amean of 150 m3 and a standard deviation of 138 m3. The investment costs vary from1 062 F/m3 to 7 276 F/m3 with a mean of 2 854 F/m3 and a standard deviation of 1315 F/m3. There is a good correlation with the storage volume (with R2 = 0.86). Twoclasses can be distinguished in terms of O&M costs :• 0 F/year for 32% of the cases, showing that there is no maintenance• 3 F/year/m3 for 2/3 of the cases, corresponding to annual cleansing.
8.4 Case Studies
Two case studies are presented here, one concerning choice between scenarios and thesecond concerning choice between projects; both studies are situated in the Paris area.
8.4.1 Choice between scenarios
The sewerage strategy for the Paris area presents a complex problem and a studybegan in 1997 to determine what might be the best strategy, according to thefollowing points :• the number and location of wastewater treatment plants, providing either
centralised or decentralised treatment• the management of surface stormwater: either through construction of storage
tanks in order to direct stormflow to wastewater treatment plants, or
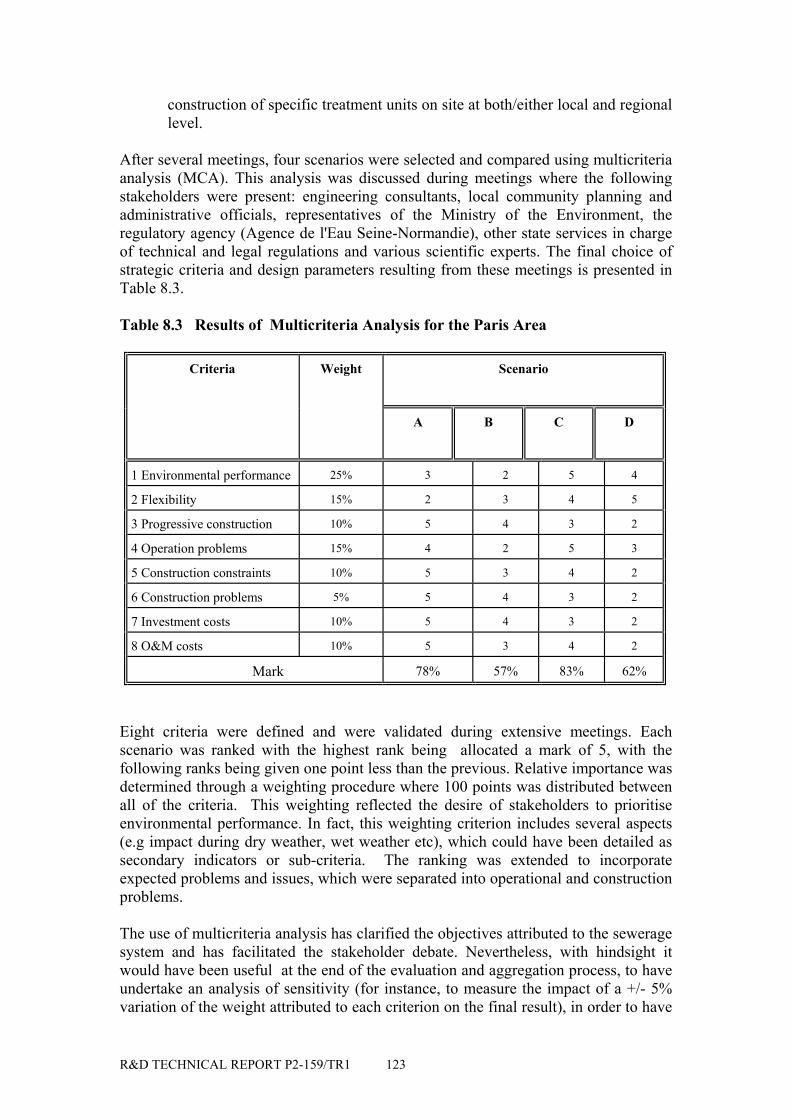
R&D TECHNICAL REPORT P2-159/TR1 123
construction of specific treatment units on site at both/either local and regionallevel.
After several meetings, four scenarios were selected and compared using multicriteriaanalysis (MCA). This analysis was discussed during meetings where the followingstakeholders were present: engineering consultants, local community planning andadministrative officials, representatives of the Ministry of the Environment, theregulatory agency (Agence de l'Eau Seine-Normandie), other state services in chargeof technical and legal regulations and various scientific experts. The final choice ofstrategic criteria and design parameters resulting from these meetings is presented inTable 8.3.
Table 8.3 Results of Multicriteria Analysis for the Paris Area
ScenarioCriteria Weight
A B C D
1 Environmental performance 25% 3 2 5 4
2 Flexibility 15% 2 3 4 5
3 Progressive construction 10% 5 4 3 2
4 Operation problems 15% 4 2 5 3
5 Construction constraints 10% 5 3 4 2
6 Construction problems 5% 5 4 3 2
7 Investment costs 10% 5 4 3 2
8 O&M costs 10% 5 3 4 2
Mark 78% 57% 83% 62%
Eight criteria were defined and were validated during extensive meetings. Eachscenario was ranked with the highest rank being allocated a mark of 5, with thefollowing ranks being given one point less than the previous. Relative importance wasdetermined through a weighting procedure where 100 points was distributed betweenall of the criteria. This weighting reflected the desire of stakeholders to prioritiseenvironmental performance. In fact, this weighting criterion includes several aspects(e.g impact during dry weather, wet weather etc), which could have been detailed assecondary indicators or sub-criteria. The ranking was extended to incorporateexpected problems and issues, which were separated into operational and constructionproblems.
The use of multicriteria analysis has clarified the objectives attributed to the seweragesystem and has facilitated the stakeholder debate. Nevertheless, with hindsight itwould have been useful at the end of the evaluation and aggregation process, to haveundertake an analysis of sensitivity (for instance, to measure the impact of a +/- 5%variation of the weight attributed to each criterion on the final result), in order to have
R&D TECHNICAL REPORT P2-159/TR1 124
an idea of the robustness of the selection procedure. It is significant that themethodology used for the weighting has been retrospectively questioned.
8.4.2 Choice between projects
The brief case study presented here involves the choice of a construction site for acounty retention basin in Blanc-Mesnil (Seine Saint-Denis, Paris). Four sites wereunder consideration and were studied with a multicriteria analysis undertaken in orderto compare them. The stakeholders and their interests in the choice of drainagefacility were the following :• the technical services from the county, in charge of real time control, new
works and water quality. Some of these service groups, who will beresponsible for the management of the future basin, look primarily fortechnical coherence in the project.
• the elected officials of the Seine Saint-Denis County and the Blanc-mesnilmunicipality who hold specific planning authority but who also have a generalinterest eg in amenity and/or recreational provision.
• the local inhabitants of Blanc-Mesnil who are preoccupied by specificproblems such as ensuring an end to local flooding and the provision ofneighbourhood environmental protection.
County services studied each aspect of the selection problem and established a list ofcriteria that were classed into four categories:• hydraulic performance,• environment of the project,• feasibility• and costs.
The relative importance of each category was defined through a weighting procedurewith 100 points being distributed firstly between these categories, and then betweenall of the specified criteria. The adopted weighting procedure demonstrates an aim tomaintain an equilibrium between the four major categories, even if a lower prioritywas to be given to the hydraulic performance and the environmental impact of theproject. The next step in the approach was to rank the drainage variants in terms ofthe identified criteria with the highest ranking being allocated a score of 5 with thefollowing being given one point less than the previous. The results of themulticriteria analysis are presented in Table 8.4 and it is clear that the highest overallscore is achieved by project A.
Two main objectives were reached through the application of this multicriteriaanalysis procedure. Firstly, the technical services group used it as a synthetic meansof presenting the identified assets and weaknesses of each variant. Secondly, thesocial, technical, and economic aspects of each variant were made available forelected officials of the county who could then use the multicriteria analysis as asupport tool to present and explain the four variants to the inhabitants of the city andother local interest groups.
The individual marks given to each variant for each criterion were at least asimportant as the final scores. Indeed, during the ensuing public debate, the drainageproblem could be examined on the basis of each criterion with each stakeholder
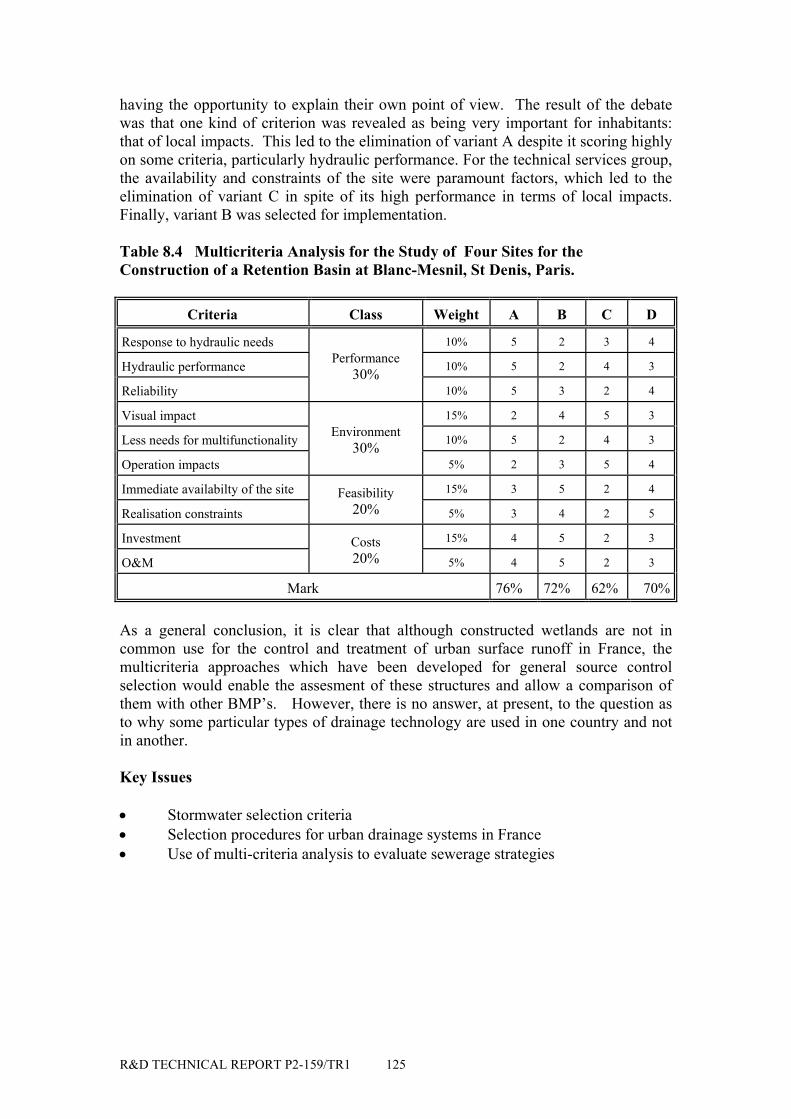
R&D TECHNICAL REPORT P2-159/TR1 125
having the opportunity to explain their own point of view. The result of the debatewas that one kind of criterion was revealed as being very important for inhabitants:that of local impacts. This led to the elimination of variant A despite it scoring highlyon some criteria, particularly hydraulic performance. For the technical services group,the availability and constraints of the site were paramount factors, which led to theelimination of variant C in spite of its high performance in terms of local impacts.Finally, variant B was selected for implementation.
Table 8.4 Multicriteria Analysis for the Study of Four Sites for theConstruction of a Retention Basin at Blanc-Mesnil, St Denis, Paris.
Criteria Class Weight A B C D
Response to hydraulic needs 10% 5 2 3 4
Hydraulic performance 10% 5 2 4 3
Reliability
Performance30%
10% 5 3 2 4
Visual impact 15% 2 4 5 3
Less needs for multifunctionality 10% 5 2 4 3
Operation impacts
Environment30%
5% 2 3 5 4
Immediate availabilty of the site 15% 3 5 2 4
Realisation constraintsFeasibility
20% 5% 3 4 2 5
Investment 15% 4 5 2 3
O&MCosts20% 5% 4 5 2 3
Mark 76% 72% 62% 70%
As a general conclusion, it is clear that although constructed wetlands are not incommon use for the control and treatment of urban surface runoff in France, themulticriteria approaches which have been developed for general source controlselection would enable the assesment of these structures and allow a comparison ofthem with other BMP’s. However, there is no answer, at present, to the question asto why some particular types of drainage technology are used in one country and notin another.
Key Issues
• Stormwater selection criteria• Selection procedures for urban drainage systems in France• Use of multi-criteria analysis to evaluate sewerage strategies
R&D TECHNICAL REPORT P2-159/TR1 126
9. RECOMMENDATIONS FOR FURTHER WORK
9.1 Introduction
It is clear that constructed wetlands, together with the full suite of SuDS devices, faceconsiderable challenges before they are regarded by many drainage engineers asstandard components in future urban drainage systems. These challenges includeissues relating to technical and operational management, organisational and legalframeworks. The potential problems occur at various points in the four developmentphases (pre-design, design, construction and post-project phases) identified in Figure7.4, but as pointed out in the CIRIA (2001) Best Practice Manual, many are issueswhich are essentially related to perception and lack of information/experience.
The suggestions for further work which are given below are not prioritised but aregrouped into thematic issues related to wetland monitoring, technical and operationalevaluation, design and management, life-cycle assessment and social/urban issuesassociated with wildlife/amenity provision. Many of the identified themes have beenpreviously highlighted as key issues at the end of each chapter. The listed topics alsovary from minor issues to major R&D projects many of which will require multi-disciplinary teams in order to be tackled successfully.
9.2 Database and Monitoring
• Development of national and standardised database for urban wetlands (as part ofnational SuDS monitoring) and consideration of the strategic role of SuDS for thecontrol and management of surface runoff within urban catchments within futureimplementation of the Water Framework Directive. The US EPA sponsored"National Stormwater Best Management Practices Database" (NSBMPD) guidedeveloped by Urban Water Resources Research Council/URS Greiner WoodwardClyde (1999), provides a base template from which a UK equivalent might beworked up. Figure 9.1 provides an outline of a possible database structure withinwhich data might be categorised as:
(a) "required"; mandatory data which would need to be completed in order forthe SuDS device and associated data to be included as an accepted entry inthe main database.
(b) "essential"; primary data covering parameters which are considered essentialin order that the SuDS device can be used as a demonstration site and whichenables the performance of the device to be compared on a standardisedbasis with other SuDS and conventional drainage systems.
(c) "useful to have"; a listing of data and descriptive information coveringorganisational, O&M, amenity and other issues of relevance.
• Development of national water quantity and water quality monitoring programmefor differing types and locations (i.e residential, commercial, industrial, highwayetc.) of urban wetlands (as part of national SuDS monitoring). This will need toidentify a standard parameter base which is also compatible with requirements formonitoring of other SuDS structures.
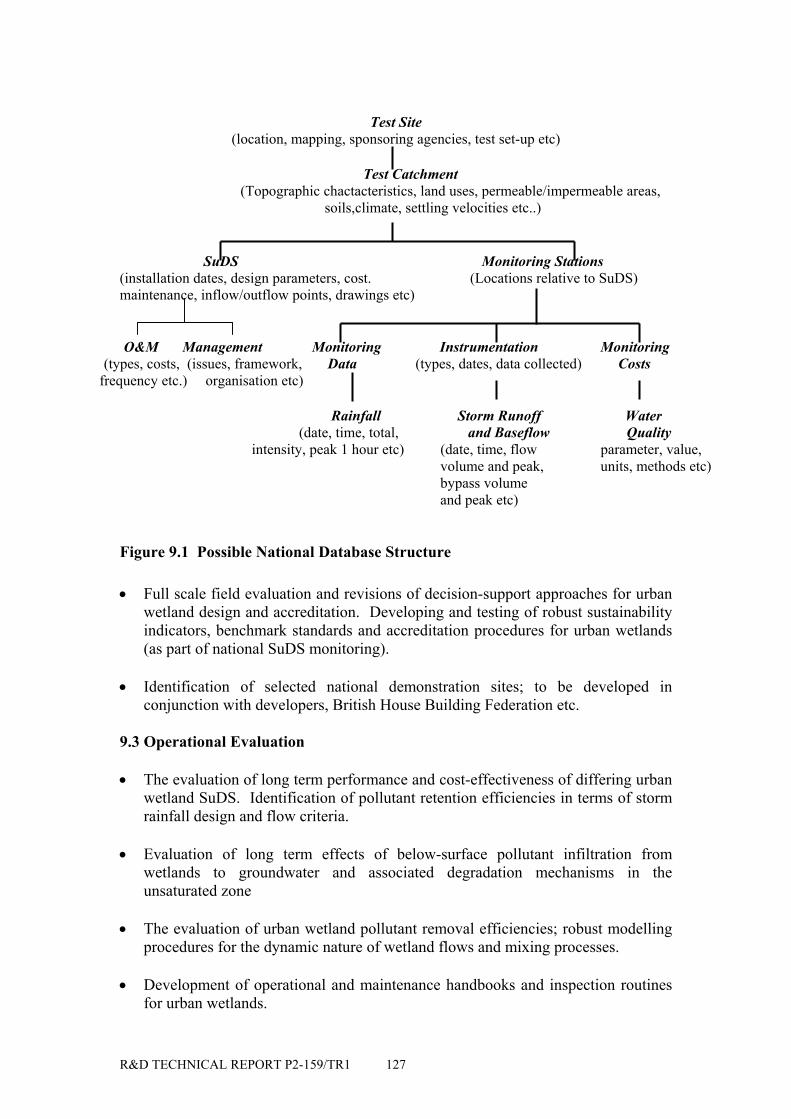
R&D TECHNICAL REPORT P2-159/TR1 127
Test Site(location, mapping, sponsoring agencies, test set-up etc)
Test Catchment (Topographic chactacteristics, land uses, permeable/impermeable areas, soils,climate, settling velocities etc..)
SuDS Monitoring Stations(installation dates, design parameters, cost. (Locations relative to SuDS)maintenance, inflow/outflow points, drawings etc)
O&M Management Monitoring Instrumentation Monitoring (types, costs, (issues, framework, Data (types, dates, data collected) Costs
frequency etc.) organisation etc)
Rainfall Storm Runoff Water (date, time, total, and Baseflow Quality
intensity, peak 1 hour etc) (date, time, flow parameter, value,volume and peak, units, methods etc)bypass volumeand peak etc)
Figure 9.1 Possible National Database Structure
• Full scale field evaluation and revisions of decision-support approaches for urbanwetland design and accreditation. Developing and testing of robust sustainabilityindicators, benchmark standards and accreditation procedures for urban wetlands(as part of national SuDS monitoring).
• Identification of selected national demonstration sites; to be developed inconjunction with developers, British House Building Federation etc.
9.3 Operational Evaluation
• The evaluation of long term performance and cost-effectiveness of differing urbanwetland SuDS. Identification of pollutant retention efficiencies in terms of stormrainfall design and flow criteria.
• Evaluation of long term effects of below-surface pollutant infiltration fromwetlands to groundwater and associated degradation mechanisms in theunsaturated zone
• The evaluation of urban wetland pollutant removal efficiencies; robust modellingprocedures for the dynamic nature of wetland flows and mixing processes.
• Development of operational and maintenance handbooks and inspection routinesfor urban wetlands.

R&D TECHNICAL REPORT P2-159/TR1 128
9.4 Pollutant Pathways
• Hydrocarbon chemical and microbial degradation; sediment and plant uptake.
• Metal uptake and food chain transfer.
• Pesticide degradation and plant uptake.
• Bacterial and pathogen pathways, exposure, degradation and resuscitation anduptake rates in sediment, plants, insects, invertebrates, birds and other wildlife.
9.5 Wetland Design and Management
• Significance of, and needs for, first-flush treatment; alternative techniques forfirst-flush treatment; role of wetlands in inner urban areas and in conjunction withconventional drainage systems.
• Issues of wetland adoption, liability including issues of long term wetlandmanagement and multi-party agreements particularly for secondary conjunctiveuses where amenity provision, for example, is a prime subsidiary objective orproblem of the SuDS development.
• Public attitudes and behavioural surveys of local/community uses of, and needsfor, urban wetland systems. Such surveys are essential if robust social and urbancommunity benchmarking and indicator standards are to be developed to fullyquantify the sustainability of SuDS devices as indicated in Chapter 7.
• Wetland design for the removal of priority pollutants including methyl tertiarybutyl ether (MTBE; which is now used as a petrol additive and which is soluble inwater and not readily biodegraded), hydrocarbons, pesticides, bacteria/pathogens,oestrogens etc.
9.6 Life-cycle Assessment
• Whole life-cycle costing for urban wetlands, including MIPS (Materials IntensityPer Service Unit) analysis; (as part of national SuDS monitoring). MIPS enablesthe environmental impact costs of infrastructures and services to be determinedand compared for varying service units (including sewers, SuDS etc), based onwhole life-cycle consumption costs.
• Identification of separate land take, resource/energy use and O & M costs fordiffering urban wetland types.
• Identification and quantification of sedimentation rates for urban wetlandenvironments; techniques for predicting sedimentation accumulation rates andassociated pollutant contamination (uptake) rates; ultimate sediment disposaltechniques, frequency and costs.
• Identification of plant replacement requirements, frequency and costs.

R&D TECHNICAL REPORT P2-159/TR1 129
9.7 Wildlife/Amenity & Social/Urban Issues
• Issues related to over-successful wetland naturalisation and colonisation
• Issues of species colonisation including feeding, breeding etc.
• Food chain transfer and resultant effects of differing pollutants.
• Issues of fish management in urban wetlands.
• The identification and impact of pollutant pathways in urban wetlands.
• Health hazards posed to wildlife and the public from exposure to urban wetlandpollutants such as bacteria/pathogens, hydrocarbons etc.
• Public attitudes to wildlife and ecological issues associated with urban wetlandsand means of combating vandalism.
R&D TECHNICAL REPORT P2-159/TR1 130
REFERENCES
Adams, L W and Dove, L E. 1984. Urban wetlands for stormwater control andwildlife enhancement. National Institute for Urban Wildlife, Columbia, Maryland,United States.
Apostolaki, S., Jefferies, C and Souter, N. 2001. Assessing the public perception ofSUDS at two locations in Eastern Scotland. 28 - 37 in Pratt, C.J., Davies, H.W andPerry, J.L. (Edits): Proc. 1st nat. Conf on Sustainable Dranage. CoventryUniversity, Coventry.
Ashley, R M., Morrison, R W., Fleming, R and Jefferies, C. 1998. Application of acomputer model for BMP performance assessment and comparison between UK andGerman design practice. 513 - 520 in Butler, D and Maksimovic, C (Edits):Proceedings IAWQ/IAHR 4th International Conference, Developments in UrbanDrainage Modelling. Imperial College of Science, Technology & Medicine, London.
Ashley, R.M., Smith, H., Jowitt, P.W., Butler, D., Blackwood, D.J., Davies, J.W.,Gilmour, D and Foxon, T. 2001a. A multi-criteria analysis/risk management tool toassess the relative sustainability of water/wastewater systems; SWARD (SustainableWater Industry Asset Resource Decisions). 221 - 231 in Pratt, C.J., Davies, J.W andPerry, J.L (Edits): Proc. 1st Nat. Conf on Sustainable Drainage, Coventry University,Coventry.
Ashley, R.M., Souter, N and Hendry, S. 2001b. The importance of public attitudesand behaviour for the management of urban water systems. In Proc. UNESCO Conf.on Frontiers in Urban Water, Marseilles, June 2001.
ap Rheinallt, T., House, M A., Hyde, V M and Sangster, E K. 1992. Natureconservation in urban watercourses. Report PRS 2482-M/1, Water Research Centre,Medmenham, Marlow, Bucks.
Bateman, M.J., Newman, A.P and Smith, S.J. 2001. A comparative study of theuptake and accumulation of zinc by Typha latifolia (L) and Phragmites australis(Cav.) Trin. Ex Steudel under hydroponic greenhouse conditions and the implicationsfor wetland management. (Accepted for publication).
Batten, L A. 1989. Habitat management for bird species in urban wetlands. In:Proceedings of Seminar on Urban Wetland Management, Urban Pollution ResearchCentre, Middlesex University, 3 February 1989.
Bray, R.J. 1999. Design experience of source control on commercial development.In: Vol XVII, Proceedings of 17th Meeting, Standing Conference on StormwaterSource Control, Coventry University, Coventry.
Bray, R.J. 2001a. Environmental monitoring of sustainable drainage at HopwoodPark motorway service area M42 Junction 2. 58 – 70 in Pratt, C J., Davies, J W andPerry, J L (Edits); Proceedings 1st National Conference on Sustainable Drainage,June 2001, University of Coventry, Coventry.
R&D TECHNICAL REPORT P2-159/TR1 131
Bray, R.J. 2001b. Maintenance of sustainable drainage: Experience on two EAdemonstration sites in England. 93 – 104 in Pratt, C J., Davies, J W and Perry, J L(Edits); Proceedings 1st National Conference on Sustainable Drainage, June 2001,University of Coventry, Coventry.
Brodie, G A., Hammer, D A and Tomijanovich, D A. 1988. Constructed wetlands forwastewater treatment. 201 - 209 in Proceedings 1st International Conference, 13-17June 1988, Tennessee Valley Authority, Chattanooga, Tennessee.
Brown. S., Shrestha, S and Riley, S J. 1999. The allocation of resources tostormwater pollution control. 381 - 389 in Ellis, J B (Edit); Impacts of urban growthon surface water and groundwater quality. Publ. No. 259., IAHS Press, Wallingford,Oxon.
Brown, W and Schueler, T. 1997. The economics of stormwater BMPs in the Mid-Atlantic region. Final Report, Centre for Watershed Protection, Silver spring,Maryland, USA.
Burkhard, R., Delectic, A and Craig, A. 2000. Techniques for water and wastewatermanagement; A review of techniques and their integration in planning. Urban Water,2, 197 - 221.
Camp, Dresser and McKee Inc. 1993. California stormwater best managementpractice handbook. State of California, Sacramento, California.
Carroll, B.A and Howes, H.R. 1998. Integrated environmental planning forsustainable development: The Environment Agency’s role. Journ. Chart. Inst. Water& Envir. Managt., 13 (1), 48 – 54.
CIRIA. (Maskell, A D; Ed) 1992. Scope for control of urban runoff. Report 123,Vols I-IV, Construction Industry Research & Information Association, London.
CIRIA. (Hall, M J., Hockin, D L and Ellis, J B) 1993. Design of flood storagereservoirs. Butterworth-Heinemann (also CIRIA), London.
CIRIA. 1996. Sustainable urban runoff management. Report 20. ConstructionIndustry Research & Information Association, London.
CIRIA. (Nuttall, P M., Boon, A G and Rowell, M R) 1997. Review of the design andmanagement of constructed wetlands. Report 180. Construction Industry Research &Information Association, London.
CIRIA. 2000a. Sustainable urban drainage systems: A design manual for Scotlandand N Ireland. Report C521, Construction Industry Research & InformationAssociation, London.
CIRIA. 2000b. Sustainable urban drainage systems: A design manual for England &Wales. Report C522, Construction Industry Research & Information Association,London.
R&D TECHNICAL REPORT P2-159/TR1 132
CIRIA. 2001 Sustainable urban drainage systems: Best Practice Manual. ReportC523, Construction Industry Research & Information Association, London.
City of Orlando Stormwater Utility Bureau. 1995. Packed bed wetland stormwatertreatment system. Final Report, Florida Dept of Environmental Regulation,Tallahassee, Florida, USA
Cooper, P F. 1990. European design and operation guidelines for reed bed treatmentsystems. Report UI 17, WRc, Swindon.
Cooper, P F., Job, G D., Green, M B and Shutes, R B E. 1996. Reed beds andconstructed wetlands for wastewater treatment. WRc, Swindon.
Crabtree, R.W. 2000. A UK perspective on institutional constraints limitingadvances in stormwater management. Paper given at NATO Workshop, November2000, St.Mariethal, Germany
Crites, R W. 1988. Design manual: Constructed wetlands and aquatic plant systemsfor municipal wastewater treatment. USEPA 625/1-88/022, US Govt. PrintingOffice, Washington DC, USA
Cutbill, L B. 1994. The potential for urban stormwater treatment by constructedwetlands. 677 - 686 in: Proceedings IAWQ 4th International Conference on WetlandSystems for Water Pollution Control, Guangzhou, China, 6-10 November 1994,IAWQ, London
Cutbill, L B. 1997. Urban stormwater treatment by artificial wetlands. UnpublishedPhD thesis, University College, London.
D'Arcy, B J., Ellis, J B., Ferrier, R C., Jenkins, A and Dils, R. 2000. Diffusepollution impacts: The environmental and economic impacts of diffuse pollution in theUK. Terence Dalton Publishers (CIWEM), Lavenham, Suffolk.
DETR. 2001. Achieving a better quality of life: Review of progress towardssustainable development. Department of the Environment, Transport and theRegions, HMSO, London.
Dobbie & Partners Ltd. 1988. North Weald Brook Investigation. Report to EppingForest District Council, C H Dobbie & Partners Ltd, Croydon, Surrey
DoE. 1996. The Environment Agency and sustainable development. HMSO,London.
DTLR. 2001. Vegetative treatment systems for highway runoff. Design manual forRoads and Bridges. Advice Note, Volume 4, Section 2. Part 1, HA 103/01. HMSO,London.
Ellis, J B. 1990. Bioengineering design for water quality improvement of urbanrunoff. 34 - 47 in Balmforth, D J. (Edit): Developments in storm drainage.Proceedings of CIRIA/CIWEM Conference, Sheffield City University, Sheffield.
R&D TECHNICAL REPORT P2-159/TR1 133
Ellis, J B. 1991. The design and operation of vegetative systems for urban runoffquality control. In: Proc 3rd Standing Conf. Stormwater Source Control, 1 - 12,Coventry University, Coventry.
Ellis, J B. 1993. Urban Lakes: Planning for amenity and leisure. In: Proceedings ofSeminar on Planning for Sustainable Development. Churchill College, Cambridge,Smisson Foundation, Clevedon, Bristol.
Ellis, J B. 1999. Design considerations for the use of vegetative controls for thetreatment of highway discharges. 357 - 364 in Ellis, J.B. (Edit); Impacts of urbangrowth on surface water and groundwater quality. Publ.No. 259, IAHS Press,Wallingford, Oxon
Ellis, J.B. 2000. Infiltration systems: A sustainable source control option for urbanstormwater quality management?. Journ. Chart. Inst. Water & Envir. Managt., 14, 27- 34.
Ellis, J B and Chatfield, P. 2000. Oils and Hydrocarbons. 9 - 20 in D'Arcy, B J.,Ellis, J B., Ferrier, R C., Jenkins, A and Dils, R (Edits); Diffuse Pollution Impacts.Terence Dalton Publ., Lavenham, Suffolk.
Ellis, J B and Chatfield, P. 2001. Diffuse urban oil pollution in the UK. Proceedings5th IWA Conference on Diffuse Pollution, June 2001, Milwaukee, Wisconsin, USA.
Ellis, J B and Revitt, D M. 1991. Drainage for roads: Control and treatment ofhighway runoff. Report NRA 43804/MID.012, National Rivers Authority, Reading.
Ellis, J B., Hall, M J and Hockin, D L. 1990. The design and operation of floodstorage dams for recreational use. 133 - 136 in Tyler, N (Edit): Proceedings 6th
Conference on The Embankment Dam, British Dam Society, Thomas Telford Ltd.,London.
Ellis, J B., Revitt, D M and Llewellyn, N. 1997. Transport and the environment:Effects of organic pollution on water quality. Journ.Chart.Inst.Water & Env.Managt., 11 (3), 170 - 177.
Ellis, J B., Shutes, R B E., Revitt, D M and Zhang, T T. 1994a. Use of macrophytesfor pollution treatment in urban wetlands. Resources, Conservation & Recycling, 11,1-12.
Ellis, J B., Revitt, D M., Shutes, R B E and Langley, J M. 1994b. The performanceof vegetated biofilters for highway runoff control. Sci Total Env., 146/147, 543 - 550.
Emerson, F B. 1961. Experimental establishment of food and cover plants inmarshes created for wildlife in New York state. New York Fish Game Journ., 8(2),130 - 144.
Environment Agency. 1997. Liason with Local Planning Authorities. EnvironmentAgency, Bristol.
R&D TECHNICAL REPORT P2-159/TR1 134
Environment Agency Thames Region. 1997. Thames Environment 21: TheEnvironment Agency strategy for land use planning in Thames region. EnvironmentAgency Thames Region, Reading.
Everard, M and Street, P. 2001. Sustainable urban drainage systems; An evaluationusing the Natural Step framework. Draft Report, The Natural Step, London.
Fisher, A and Raucher, R. 1984. Intrinsic benefits of input water quality: Conceptualand empirical perspectives. Advances in Applied Microeconomics, 3, 37-66.
FWR. 1994. Urban pollution management manual. FR/CL0002. Foundation forWater Research, Medmenham, Bucks.
FWR. 1996. Assessing the benefits of surface water quality impacts manual.FR/CL0005. Foundation for Water Research, Medmenham, Bucks.
Grant, N and Griggs, J. 2001. Reed beds: Applications, specification, design andmaintenance. Building Research Establishment, Garston, Watford, Herts.
Green, A and Faulkner, H. 2000. An assessment of the suitability of theEnvironment Agency's water quality classification system for use in urbancatchments. Journ.Chart.Inst.Water & Env.Managt., 14 (2), 131 - 139.
Green, C H and Tunstall, S M. 1991. The evaluation of river water qualityimprovement by the contingent valuation method. Applied Economics, 23(7), 1135 -1146.
Halcrow/UPRC. 1998. Treatment of highway runoff using constructed wetlands: Aninterim manual. Halcrow & Urban Pollution Research Centre, Middlesex University.Environment Agency Thames Region, Reading.
Halcrow/UPRC. 2000. Protection of the water environment using balancingfacilities. Final Field Studies Report, Halcrow & Urban Pollution Research Centre,Middlesex University, Environment Agency Thames Region, Reading.
Hall, M J. 1977. The effects of urbanisation on storm runoff from two catchmentareas in NW London. 144-152 in: Effects of urbanisation on the hydrological regime,Publ. 123, IAHS-UNESCO, Amsterdam.
Hall, M J., Hockin, D L and Ellis, J B. 1993. Design of flood storage reservoirs.Butterworth-Heinemann, London. (See also CIRIA, 1993)
Hammer, D A. (Edit). 1989. Constructed wetlands for wastewater treatment:Municipal, industrial and Agricultural. Lewis Publishers, Chelsea, Michigan, USA
Hares, R J and Ward, N I. 1999. Comparison of the heavy metal content ofmotorway stormwater following discharge into wet biofiltration and dry detentionponds along the London Orbital (M25) Motorway. Science Total Env., 235 (1/3), 169- 178.
R&D TECHNICAL REPORT P2-159/TR1 135
Heal, K. 1999. Metals in sediments of sustainable urban drainage structures inScotland. 331 - 338 in Ellis, J.B. (Edit): Impacts of Urban Growth on Surface Waterand Groundwater Quality. Publ. No. 259, IAHS Press, Wallingford, Oxon.
Heaney, J P., Wright, L., Sample, D., Urbonas, B., Mack, B W., Schmidt, M F.,Solberg, M., Jones, J., Clary, J. and Brown, T. 1997. Development of methodologiesfor the design of integrated wet weather flow collection/control/treatment systems fornewly urbanised areas. Vol.1, draft technical report, US Environmental ProtectionAgency, Edison, New Jersey, United States.
Holden, R. 1989. Wetland habitats in commercial estate development. In:Proceedings of seminar on urban wetland management. 3 February 1989. UrbanPollution Research Centre, Middlesex University, London.
Horner, R R., Skupien, J J., Livingston, E H and Shaver, H E. 1994. Fundamentalsof urban runoff management. Terrene Institute, Washington DC.
House, M A and Sangster, E K. 1991. Public percepion of river corridormanagement. Journ.Chart. Inst. Water & Env. Managt., 15 (3), 312-317.
Hull, L. 1993. Grizedale Forest Sculpture Park. Sculpture Magazine Maquette, May1993.
Hvitved-Jacobsen, T. 1990. Design criteria for detention pond quality. 111 - 130 inTorno, H C (Edit): Urban Storm Quality Enhancement. American Society of CivilEngineers, New York.
Institution of Highways & Transportation. 2001. Guidelines for the environmentalmanagement of highways. Institution of Highways & Transportation, London.
IWA. 2000 Constructed wetlands for pollution control: Processes, performance,design and operation. (Eds; Kadlec, R H., Knight, R L., Vymazal, J., Brix, H.,Cooper, P and Haberl, R). Scientific & Technical Report No.8., IWA Publishing,London.
Jones, R H. 1995. Ecotoxicology of oil derived pollutants in urban receiving waters.Unpublished PhD, Urban Pollution Research Centre, Middlesex University, London.
Kadlec, R H. 1996. An autobiotic wetland phosphorus model. EcologicalEngineering, 8(2), 145 - 172.
Kadlec, R H. 2000. The inadequacy of first-order treatment wetland models.Ecological Engineering, 15, 105 - 119.
Kadlec, R H and Knight, R L. 1996. Treatment wetlands. CRC Press, LewisPublishers, Boca Raton, Florida, USA.
Knight, R L., Ruble, R W., Kadlec, R H and Reed, S C. 1993. Wetlands forwastewater treatment performance database. 35 - 58 in Moshiri, G A (Edit):
R&D TECHNICAL REPORT P2-159/TR1 136
Constructed wetlands for water quality improvement. Lewis Publishers Inc., BocaRaton, Florida.
Lawrence, I and Breen, P. 1998. Design guidelines: Stormwater pollution controlponds and wetlands. Cooperative Research Centre for Freshwater Ecology,University of Canberra, Canberra, Australia.
McCaskie, J and Lee, R. 1996. Restoring London's lakes. Enact., 4 (3), 4 - 7.
McKissock, G., Jeffries, C J and D'Arcy, B J. 1999 An assessment of drainage bestpractices in Scotland. Journ Chart Inst Water & Env Managt., 13(1), 47-54.
Merritt, A. 1994. Wetlands, Industry and Wildlife: A manual of principles andpractices. The Wildfowl & Wetlands Trust, Slimbridge, Gloucs.
Metcalf and Eddy Inc. Wastewater engineering: Treatment, disposal and reuse.Third Edition, McGraw Hill, London.
Milton Keynes Development Corporation. 1992. Monitoring studies of MiltonKeynes balancing lakes. Vols. 1-6. Urban Pollution Research Centre, MiddlesexUniversity. Milton Keynes Development Corporation, Milton Keynes.
Mitsch, W J and Gosselink, J G. 1993. Wetlands. Van Nostrand Reinhold, NewYork.
Moshiri, G A. (Ed). 1993. Constructed wetlands for water quality improvement.Lewis Publishers, Chelsea, Michigan, USA.
Mungur, A S. 1997. The performance and perception of wetlands for the treatmentof highway runoff. Unpublished PhD thesis, Urban Pollution Research Centre,Middlesex University, London.
Mungur, A S., Shutes, R B E., Revitt, D M and House, M A. 1995. An assessment ofmetal removal from highway runoff by a natural wetland. Water Sci Tech., 32 (3),169 - 175.
Mungur, A S., Shutes, R B E., Revitt, D M., House, M A and Fallon, C. 1998. Aconstructed wetland for the treatment of urban runoff. 329 - 341 in Wong, M.H.,Wong, J.W.C and Baker, A.J.M. (Edits): Remediation and Management of DegradedLands. Lewis Publishers Ltd., London.
NRA. 1993. Guidelines for AMP2 periodic review (Version 2). National RiversAuthority, Bristol.
NRA. 1994a. Guidance notes for local planning authorities on the methods ofprotecting the water environment through development plans. NRA, Bristol.
NRA Thames Region. 1995. Thames 21: A planning perspective and a sustainablestrategy for the Thames region. NRA, Reading.
R&D TECHNICAL REPORT P2-159/TR1 137
Nuttall, P M., Boon, A G and Rowell, M R. 1997. Review of the design andmanagement of constructed wetlands. Report 180, Construction Industry Researchand Information Association, London. (See also CIRIA, 1997)
Oldham, J. 1995. Sustainable development for large, mixed-use developments. InVolume IX, Proceedings of Standing Conference on Stormwater Source Control,Coventry University, Coventry.
Olsen, R K. 1993. Created and natural wetlands for controlling non-point sourcepollution. US Environmental Protection Agency., Cincinnati, Ohio, USA.
Payne, N. 1992. Techniques for wildlife habitat management of wetlands. McGrawHill, London.
Pond Action. 2000. An assessment of the ecological value of sustainable urbandrainage systems in Scotland. Report by Pond Action, Oxford Brookes University,Scottish Environment Protection Agency, Stirling.
Reed, S C., Crites, R W and Middlebrookes, E T. (Eds) 1995. Natural systems forwaste management and treatment. McGraw Hill, New York, USA
Revitt, D M and Ellis, J B. 2000. Drainage, runoff and groundwater management.Chapter 4 in Mudge, G (Edit): The environmental management of highways.Institution of Highways and Transportation, London.
Revitt, D M., Shutes, R B E and Scholes, L. 1999. The use of constructed wetlandsfor reducing the impacts of urban surface runoff on receiving water quality. 349 -356in Ellis, J.B. (Edit); Impacts of urban growth on surface water and groundwaterquality. Publ. No. 259, IAHS Press, Wallingford, Oxon.
Richards, Moorehead & Laing Ltd. 1992. Natural wetlands to ameliorate metal richmine waters. R & D Note 103, National Rivers Authority, Bristol.
RRP. 1995. River restoration: Benefits for integrated catchment management.Interim Report 1994, River Restoration Project Group, Huntingdon, Cambs.
RSPB. 1996. Water management; Benefits for integrated catchment management.Interim report 1994, River Restoration Project group, Huntingdon, Cambs.
Scheuler, T R. 1992. Controlling urban runoff: A practical manual for planning anddesigning urban BMPs. Washington Council of Governments, Washington DC.
Scholes, L N L., Shutes, R B E., Revitt, D M., Purchase, D and Forshaw, M. 1999.The removal of urban pollutants by constructed wetlands during wet weather. WaterSci Tech., 40(3), 333 - 340.
SEPA. 1997. Urban best management practice database. Tech. Report EQI, 17December (G McKissock), Scottish Environment Protection Agency, East region,Edinburgh.
R&D TECHNICAL REPORT P2-159/TR1 138
SEPA. 2000. Ponds, pools and lochans. Habitat Enhancement Initiative, ScottishEnvironment Protection Agency, Stirling.
SEPA, EA and E & HS. 2000. An Introduction: Sustainable urban drainage systems.Scottish Environment Protection Agency, Stirling, Environment Agency, Bristol andN Ireland Environment & Heritage Service, Belfast.
Shatwell, T and Cordery, I. 1999. Nutrient storage in urban wetlands. 339 - 348 in:Ellis, J B (Edit); Impacts of urban growth on surface water and groundwater quality.Publ. No.259, IAHS Press, Wallingford, Oxon.
Shutes, R B E., Ellis, J B., Revitt, D M and Zhang, T T. 1993. The use of Typhalatifolia for heavy metal pollution control in urban wetlands. 407 - 414 in Moshiri,G.A. (Edit); Constructed wetlands for water quality improvement. Lewis Publishers,London.
Shutes, R B E., Revitt, D M., Mungur, A S and Scholes, L N L. 1997. The design ofwetland systems for the treatment of urban runoff. Water Sci Tech., 35(5), 19 - 25.
Shutes, R B E., Revitt, D M., Lagerberg, I M and Barraud, V C E. 1999. The designof vegetative constructed wetlands for the treatment of highway runoff. Sci TotalEnv., 235, 189 - 197.
Sriyaraj, K and Shutes, R B E. 2001. An assessment of the impact of motorwayrunoff on a pond, wetland and stream. Journ.Env.Geochem & Health. (In press).
Stillings, L l., Gryta, J J and Ronnings, E A. 1988. Iron and manganese removal in aTypha dominated wetland during ten months following wetland construction in minedrainage and surface mine reclamation. 317 - 324 in Information Circular 9183, USBureau of Mines, Pittsburgh, Pennsylvania.
Strecker, E W., Kersnor, J M, Driscoll, E D and Horner, R R. 1992. The use ofwetlands for controlling stormwater pollution. Report EPA/600, The TerraneInstitute, Washington DC, USA
Tucker, C. 1999. A modular approach to "end-of-pipe" stormwater treatment:Developments in the Lower Severn are of the Environment Agency. In: Vol. XVII,Proceedings of 17th Meeting, Standing Conference on Stormwater Source Control,Coventry University, Coventry.
Urban Drainage & Flood Control District. 1992. Urban Storm Drainage CriteriaManual, Volume 3; Best Management Practices. Urban Drainage & Flood ControlDistrict, Denver, Colorado, USA.
UPRC/CEREVE. 2000. Review of best practices in the sue of constructed wetlandsfor pollution control. Initial Report and Final Brief, UPRC, MiddlesexUniversity/CEREVE, Ecole des Ponts et Chaussees, Paris., Environment AgencyThames Region, R&D Project P-2-159, Reading, Berks.
R&D TECHNICAL REPORT P2-159/TR1 139
Urban Water Resources Research Council and URS Greiner Woodward Clyde. 1999.National Stormwater Best Management Practices (BMP) Database. EnvironmentalProtection Agency, Office of Water, Washington DC.
Urbonas, B R., Roesner, L A and Guo, C Y. 1996. Hydrology for optimal sizing ofurban runoff treatment control systems. Water Quality International, February 1996,30 - 33.
US Environmental Protection Agency. 1998. Free water surface flow constructedwetlands for wastewater treatment and wildlife habitat: A technology assessment.EPA/832-R-99-006. Office of Water, USEPA, Washington, DC.
Watson, J T and Hobson, T A. 1989. Hydraulic design considerations for controlstructures for constructed wetlands for wastewater treatment. 379 - 391 in Hammer,D A (Edit): Constructed wetlands for wastewater treatment. Lewis Publishers Inc.,Chelsea, Michigan.
Watson, J T., Reed, S C., Kadlec, R H., Knight, R L and Whitehouse, A E. 1989.Performance expectations and loading rates for constructed wetlands. 319 - 352 inHammer, D A (Edit): Constructed wetlands for wastewater treatment. LewisPublishers Inc., Chelsea, Michigan.
WEF/ASCE. 1998. Urban runoff quality management. WEF Manual of Practice,No 23, Manual and Report on Engineering Practice, No 87., American Society ofCivil Engineers, New York.
Wein, G R., Kroeger, S and Pierce, G J. 1987. Lacustrine vegetation establishmentwithin a cooling reservoir. In Proceedings 14th Annual Conference on WetlandRestoration and Creation, Tampa, Florida.
Welsh Harp Conservation Group. 1992. Annual Report. London Borough of Barnet,Herts.
Wenk, W E. 1999. Stormwater as civic and ecological urban framework. 434 - 453in Rowney, A C., Stahre, P and Roesner, L A (Edits): Sustainable urban waterresources in the 21st century. American Society of Civil Engineers, Reston, Virginia,United States.
Wong, T H F., Breen, P F., Somes, N L G and Lloyd, S D. 1998. Managing urbanstormwater using constructed wetlands. Cooperative Research Centre for catchmenthydrology, Report 98/7, Monash University, Victoria, Australia.
Woolhouse, C. 1994. Catchment management plans: Current successes and futureopportunities. 463 – 474 in Kirby, C and White, W.R (Edits); Integrated River BasinDevelopment., J Wiley & Sons ltd., Chichester.
Worrall, P., Peberdy, K J and Millet, M C. 1996. Constructed wetlands and natureconservation. 1-1 to 1-9 in: Proceedings 5th IAWQ International Conference onWetland Systems for Water Pollution Control, Vienna, Austria.

R&D TECHNICAL REPORT P2-159/TR1 140
Younger, P L. (Edit). 1997. Minewater treatment using wetlands. Proceedings ofCIWEM National Conference, 5 September 1997, University of Newcastle.
Younger, P L and Harbourne, K J. 1995. To pump or not to pump; Cost benefitanalysis of future environmental management options for the abandoned Durhamcoalfield. Journ Chart Inst Water & Env Managt., 9 (4), 405 - 415.
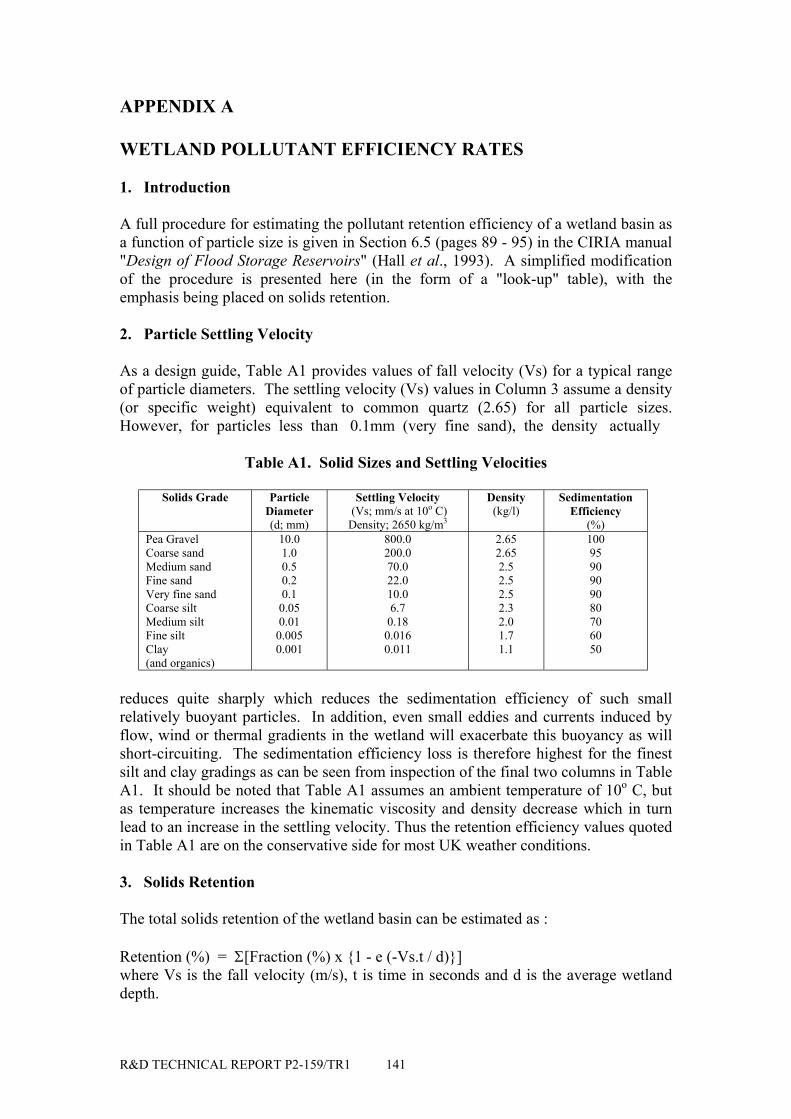
R&D TECHNICAL REPORT P2-159/TR1 141
APPENDIX A
WETLAND POLLUTANT EFFICIENCY RATES
1. Introduction
A full procedure for estimating the pollutant retention efficiency of a wetland basin asa function of particle size is given in Section 6.5 (pages 89 - 95) in the CIRIA manual"Design of Flood Storage Reservoirs" (Hall et al., 1993). A simplified modificationof the procedure is presented here (in the form of a "look-up" table), with theemphasis being placed on solids retention.
2. Particle Settling Velocity
As a design guide, Table A1 provides values of fall velocity (Vs) for a typical rangeof particle diameters. The settling velocity (Vs) values in Column 3 assume a density(or specific weight) equivalent to common quartz (2.65) for all particle sizes.However, for particles less than 0.1mm (very fine sand), the density actually
Table A1. Solid Sizes and Settling Velocities
Solids Grade ParticleDiameter(d; mm)
Settling Velocity (Vs; mm/s at 10o C)Density; 2650 kg/m3
Density(kg/l)
SedimentationEfficiency
(%)Pea GravelCoarse sandMedium sandFine sandVery fine sandCoarse siltMedium siltFine siltClay(and organics)
10.01.00.50.20.10.050.01
0.0050.001
800.0200.070.022.010.06.7
0.180.0160.011
2.652.652.52.52.52.32.01.71.1
1009590909080706050
reduces quite sharply which reduces the sedimentation efficiency of such smallrelatively buoyant particles. In addition, even small eddies and currents induced byflow, wind or thermal gradients in the wetland will exacerbate this buoyancy as willshort-circuiting. The sedimentation efficiency loss is therefore highest for the finestsilt and clay gradings as can be seen from inspection of the final two columns in TableA1. It should be noted that Table A1 assumes an ambient temperature of 10o C, butas temperature increases the kinematic viscosity and density decrease which in turnlead to an increase in the settling velocity. Thus the retention efficiency values quotedin Table A1 are on the conservative side for most UK weather conditions.
3. Solids Retention
The total solids retention of the wetland basin can be estimated as :
Retention (%) = Σ[Fraction (%) x {1 - e (-Vs.t / d)}]where Vs is the fall velocity (m/s), t is time in seconds and d is the average wetlanddepth.
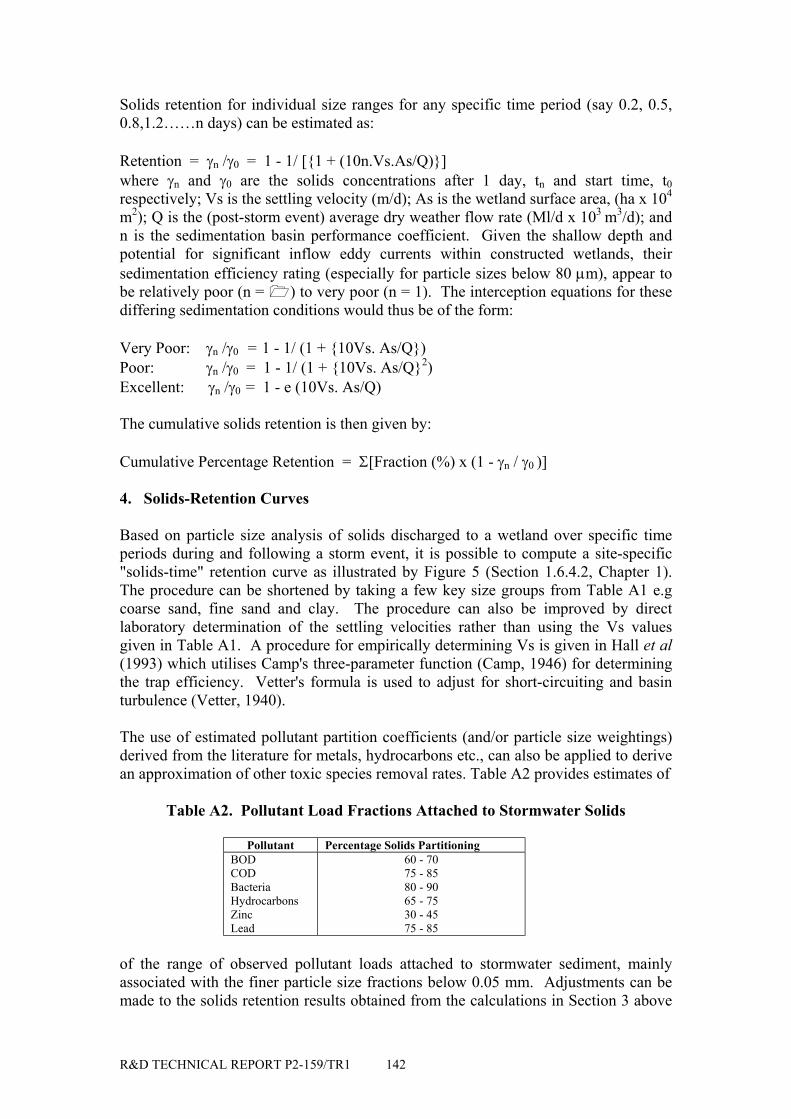
R&D TECHNICAL REPORT P2-159/TR1 142
Solids retention for individual size ranges for any specific time period (say 0.2, 0.5,0.8,1.2……n days) can be estimated as:
Retention = γn /γ0 = 1 - 1/ [{1 + (10n.Vs.As/Q)}]where γn and γ0 are the solids concentrations after 1 day, tn and start time, t0respectively; Vs is the settling velocity (m/d); As is the wetland surface area, (ha x 104
m2); Q is the (post-storm event) average dry weather flow rate (Ml/d x 103 m3/d); andn is the sedimentation basin performance coefficient. Given the shallow depth andpotential for significant inflow eddy currents within constructed wetlands, theirsedimentation efficiency rating (especially for particle sizes below 80 µm), appear tobe relatively poor (n = ) to very poor (n = 1). The interception equations for thesediffering sedimentation conditions would thus be of the form:
Very Poor: γn /γ0 = 1 - 1/ (1 + {10Vs. As/Q})Poor: γn /γ0 = 1 - 1/ (1 + {10Vs. As/Q}2)Excellent: γn /γ0 = 1 - e (10Vs. As/Q)
The cumulative solids retention is then given by:
Cumulative Percentage Retention = Σ[Fraction (%) x (1 - γn / γ0 )]
4. Solids-Retention Curves
Based on particle size analysis of solids discharged to a wetland over specific timeperiods during and following a storm event, it is possible to compute a site-specific"solids-time" retention curve as illustrated by Figure 5 (Section 1.6.4.2, Chapter 1).The procedure can be shortened by taking a few key size groups from Table A1 e.gcoarse sand, fine sand and clay. The procedure can also be improved by directlaboratory determination of the settling velocities rather than using the Vs valuesgiven in Table A1. A procedure for empirically determining Vs is given in Hall et al(1993) which utilises Camp's three-parameter function (Camp, 1946) for determiningthe trap efficiency. Vetter's formula is used to adjust for short-circuiting and basinturbulence (Vetter, 1940).
The use of estimated pollutant partition coefficients (and/or particle size weightings)derived from the literature for metals, hydrocarbons etc., can also be applied to derivean approximation of other toxic species removal rates. Table A2 provides estimates of
Table A2. Pollutant Load Fractions Attached to Stormwater Solids
Pollutant Percentage Solids PartitioningBODCODBacteriaHydrocarbonsZincLead
60 - 7075 - 8580 - 9065 - 7530 - 4575 - 85
of the range of observed pollutant loads attached to stormwater sediment, mainlyassociated with the finer particle size fractions below 0.05 mm. Adjustments can bemade to the solids retention results obtained from the calculations in Section 3 above
R&D TECHNICAL REPORT P2-159/TR1 143
to derive an estimate of the retention efficiencies for the various toxic pollutantspecies noted in Table A2.
5. Empirical Approaches to Solids Removal
5.1 Solids removal is essentially a function of sedimentation i.e. (bio)infiltration andretention time, which is primarily affected by the relationships between size andsettling velocity (Section 2 above). A number of empirically derived regressionequations have been derived to predict solids removal efficiency for SSF wetlands inthe absence of detailed data on influent particle size distribution and settling velocities(Vs). The two most widely used are those associated with the US NADB (Knight etal., 1993) and UK/Denmark wetland databases (Brix, 1994):
CSout = 4.7 + 0.09 CSin (Brix, 1994) CSout = 7.8 + 0.063 CSin (Knight et al., 1993)Reed (1994) has also suggested: CSout = CSin [(0.1058 + 0.0011) HLR (cm/day)]
5.2 Taking the wetland design data from Section 2.2, Appendix B and the derivedHLR value (0.043 m/d) of Section 2.3 in Appendix B, and assuming a TSS influentconcentration (CSin) of 100 mg/l, the Reed equation derives an outflow (CSout)concentration of:
CSout = 100 [{(0.1058 + 0.0011) 4.3}] = 46 mg/l = 54% removal efficiency
The UK/European and US NADB equations derive CSout values of 5.6 mg/l and 14.1mg/l respectively i.e a 94% and 86% removal efficiency.
References
CAMP, T R. 1946. Sedimentation and the design of settling tanks. Trans, Amer.Soc. Civil Eng., 111, 895 - 952.
HALL, M J., HOCKIN, D L and ELLIS, J B. 1993. Design of flood storagereservoirs. Butterworth-Heinemann/CIRIA, London. ISBN 0 7506 1057 3
VETTER, C P. 1940. Technical aspects of the silt problem on the Colorado river.Civ, Eng., 10 (11), 698 - 701.
R&D TECHNICAL REPORT P2-159/TR1 144
APPENDIX B
KINETIC DESIGN MODELLING OF WETLANDS(See Section 1.7 and 3.2.2 in main text)
1. Introduction
1.1 Plug flow is generally considered to be the optimal flow condition for a wetlandand is from a hydraulic viewpoint the preferred flow regime since all fluid elementsreside around the normal residence time. Further, the removal rates of pollutants suchas BOD, SS and nitrogen increase with the loading rate, which makes plug flow moredesirable. Mathematically, plug flow can be defined as a residence time distribution(RTD) with a variance (σ2) equal to zero i.e no dispersion other than the advection,and a quotient between mean time (tmn) and nominal residence time (tnom) whichequals unity i.e no dead zones.
1.2 The generalised plug flow input/output reactor k - C* model is given in the box inSection 1.7 as: (-k/HLR) = ln[(Cout - C*) / (Cin - C*)] and where the HydraulicLoading Rate (HLR) = (Qin / As); see third box in Section 1.6.3. Re-arrangement(with appropriate unit conversion) of this general model therefore provides a basis fordetermining the required surface area (As) of a SF wetland basin intended for theremoval of a particular pollutant:
As = (Q/k) ln[(Cin - C*) / (Cout - C*)]
1.3 Reed et al (1995) have also proposed a simplified kinetic design equation whichplaces k into the numerator of the equation, and that can be used for preliminaryestimation of SSF wetland sizing:
As = Q (ln Cout - ln Cin) / kDwhere D is the free water depth (ρ x d); see boxes in Section 1.6.3.
2. Wetland Sizing
2.1 As an example, it is intended that a stormwater SF wetland should reduce thelong-term inlet annual average Total Nitrogen (Ntot) concentration from 4.5 mg/l to atarget outlet concentration of 1.6 mg/l for an average influent discharge (Qin) of 25.8m3/d. What surface area (As) of wetland will be required? No values are given forthe nitrogen decay rate constant (kNtot) or for the wetland background concentration(C*) but reference to Table 3.1 gives values of 22 m/yr and 1.5 mg/l respectively forthese two parameters.Applying and re-arranging the general equation:
As = [(25.8 x 365) ln{(4.5 - 1.5) / (1.6 - 1.5)}] / 22 = 1,455.86 m2 = 0.15 ha
It should be noted that the effect of ignoring the background C* value would give amuch smaller surface area (As) value of 0.046 ha. Reduced winter temperatures willalso reduce the k value, thus leading to a requirement for larger surface areas. For
R&D TECHNICAL REPORT P2-159/TR1 145
example, with a mean winter temperature of 5o C (see box in Section 1.7) and stillignoring the background C* value:
kNtot = 20 (1.09)(5 - 20) = 10.6 m/yrwhich would yield a wetland surface (As) value of 0.095 ha (i.e twice as large).
2.2 A 0.6m deep SSF wetland with substrate porosity of 0.4 (40%) receives anaverage daily flow of 60.5 m3/d with an influent BOD concentration of 140 mg/l andhas an outflow target concentration of 10 mg/l. The prevailing winter temperature is10o C and the reaction rate constant (k) is 1.104 days at 20o C. What surface area (As)is needed to meet the target concentration? kBODt = 1.104 (1.09)(10 - 20) = 0.47/day and As = 60.5 (ln 140 - ln 10) / (0.47 x 0.6 x 0.4) = (160 / 0.113) = 1416 m2
2.3 An alternative non-kinetic approach to the sizing of SSF wetlands has beensuggested by Reed (1993) which is based on the premise that in a "temperate" climate,the annual BOD removal rate approximates 2.5 kg/m2/yr. Using the designinformation provided in Section 2.2 above, the annual BOD removal for the wetlandwould be: [(Cin - Cout) (Q/1000)] 365
= [(140 - 10) (60.5 / 1000)] 365 = 2,871 kg/yr
and As = (2871 / 2.5) = 1148 m2
which is within 20% of the 1416 m2 figure derived from the kinetic procedure,and HLR = (Q / As) = (60.5 / 1416) = 0.043 m/d ( = 4.3 cm/day)
3. Pollutant Decay Rates and Removal Efficiency
3.1 For the general pollution reduction rate (J) equation given in section 1.7: J = -k (Cin - C*)and the pollutant mass balance equation, assuming plug flow conditions, for thewetland also can be expressed as: HLR (∂Cin / ∂x) = -k (Cin - C*)with the pollutant fraction remaining (FR) in the wetland of the total possible changein pollutant (see box in Section 1.7) then being: FR = [(Cout - C*) / (Cin - C*) = e [(-k / HLR)]
3.2 The decay rate (k) for Total Nitrogen (Ntot) removal in a wetland is 31.7 m/yr at adetermined HLR value of 28.65 m/yr. What is the pollutant fraction remaining (FR) inthe wetland?
FR = [(Cout - C*) / (Cin - C*)] = e (-k / HLR)
= e (-31.7 / 28.65)
= 0.031Therefore the percentage of total nitrogen retained within the wetland as a result ofthese conditions would be 33.1%.
Note that the combined dimensionless value (-k / HLR) is also known in manytextbooks (e.g. Kadlec and Knight, 1995) as the Damkohler number (Da)
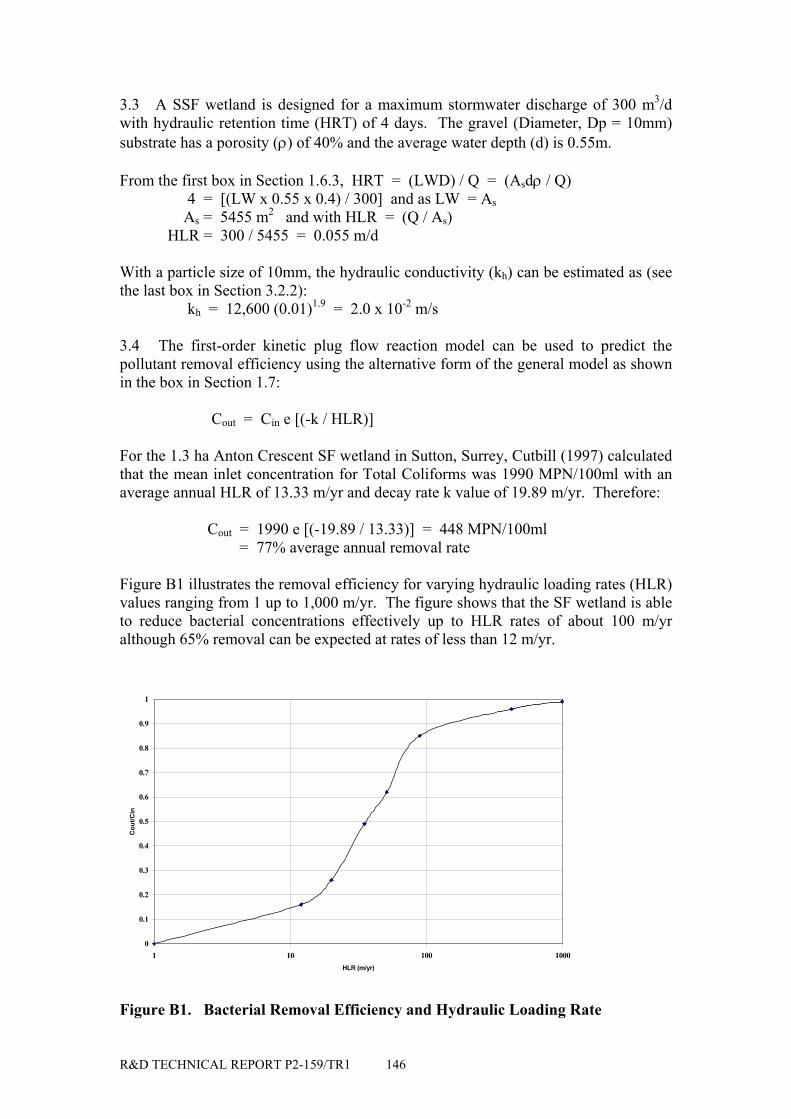
R&D TECHNICAL REPORT P2-159/TR1 146
3.3 A SSF wetland is designed for a maximum stormwater discharge of 300 m3/dwith hydraulic retention time (HRT) of 4 days. The gravel (Diameter, Dp = 10mm)substrate has a porosity (ρ) of 40% and the average water depth (d) is 0.55m.
From the first box in Section 1.6.3, HRT = (LWD) / Q = (Asdρ / Q) 4 = [(LW x 0.55 x 0.4) / 300] and as LW = As As = 5455 m2 and with HLR = (Q / As) HLR = 300 / 5455 = 0.055 m/d
With a particle size of 10mm, the hydraulic conductivity (kh) can be estimated as (seethe last box in Section 3.2.2): kh = 12,600 (0.01)1.9 = 2.0 x 10⁻² m/s
3.4 The first-order kinetic plug flow reaction model can be used to predict thepollutant removal efficiency using the alternative form of the general model as shownin the box in Section 1.7:
Cout = Cin e [(-k / HLR)]
For the 1.3 ha Anton Crescent SF wetland in Sutton, Surrey, Cutbill (1997) calculatedthat the mean inlet concentration for Total Coliforms was 1990 MPN/100ml with anaverage annual HLR of 13.33 m/yr and decay rate k value of 19.89 m/yr. Therefore:
Cout = 1990 e [(-19.89 / 13.33)] = 448 MPN/100ml = 77% average annual removal rate
Figure B1 illustrates the removal efficiency for varying hydraulic loading rates (HLR)values ranging from 1 up to 1,000 m/yr. The figure shows that the SF wetland is ableto reduce bacterial concentrations effectively up to HLR rates of about 100 m/yralthough 65% removal can be expected at rates of less than 12 m/yr.
0
0.1
0.2
0.3
0.4
0.5
0.6
0.7
0.8
0.9
1
1 10 100 1000HLR (m/yr)
Cou
t/Cin
Figure B1. Bacterial Removal Efficiency and Hydraulic Loading Rate
R&D TECHNICAL REPORT P2-159/TR1 147
References
BRIX, H. 1994. Constructed wetlands for municipal wastewater treatment inEurope. 325 - 333 in MITSCH, W J (Edit): Global wetlands; Old world and new.Elsevier Ltd., Amsterdam.
CUTBILL, L B. 1997. Urban stormwater treatment by artificial wetlands.Unpublished PhD thesis. University College, London.
KADLEC, R H and KNIGHT, R L. 1995. Treatment wetlands. CRC Press, LewisPublishers, Boca Raton, Florida, USA
KNIGHT, R L., RUBLE, KADLEC, R H and REED, SC. 1993. Wetlands forwastewater treatment performance database. 35 - 58 in MOSHIRI, G A (Edit):Constructed wetlands for waste quality improvement. Lewis Publishers, Boca Raton,Florida, USA
REED, S C. 1993. Subsurface flow constructed wetlands for wastewater treatment.Report EPA832-R-93-008, Environment Protection Agency, Washington DC, USA.
REED, S C., CRITES, R W and MIDDLEBROOKES, E T (Edits). 1995. Naturalsystems for waste management and treatment. McGraw Hill, New York, USA
R&D TECHNICAL REPORT P2-159/TR1 148
APPENDIX C
SURFACE WATER DISCHARGE, SEDIMENT QUALITYSTANDARDS AND RECEVING WATER CLASSIFICATION INENGLAND & WALES
1. Discharge Standards and Consents for Surface Waters in England & Wales
1.1 Section 95 of the 1991 UK Water Industry Act states the general duty ofsewerage undertakers is to "provide, improve and extend…….a system of publicsewers"…. to achieve effectual drainage within urban areas. This duty includes therequirement to collect and dispose of surface water. Outfalls from separate (surfacewater) sewers are not subject to routine consent in the UK although under Section 85of the 1991 Water Resources Act it is an offence to "cause or knowingly permit anypoisonous, noxious or polluting matter or any solid waste matter to enter anycontrolled waters". Section 100 of the 1980 Highways Act gives the right todischarge road runoff to surface waters through highway drains (which includeditches, gutters, culverts and pipes).
1.2. However, under Section 89 (5) of the 1991 Water Resources Act (WRA), thehighways authority does not require the statutory defence of a discharge consentalthough the 1998 Groundwater Regulations (which implement the EU Directive80/68/EEC), does impose specific requirements. It should be noted that the exemptionstatus for stormwater drainage does not apply in Scotland where they were taken outof direct control as a deregulation initiative at the time that the Scottish EnvironmentProtection Agency (SEPA) was established. Measures required to prevent or alleviatepollution are usually agreed through consultation between the highways authority andthe Environment Agency and a policy implementation guidance note (SC/CC/014) forhighway discharges was issued in September 1992. The Environment Agency andHighways Agency have a Liaison Agreement in place which sets out their jointunderstanding of the relevant legislation and arrangements for early consultation onthe effects of new and improvement schemes and maintenance works on the waterenvironment. This is currently being updated and is intended to become a formalMemorandum of Understanding or Advice Note (see Section 6.3.2.4.4). The criminaldefence against highway discharges embodied in Section 89 (5) WRA 1991 does nothold against liabilities arising under civil law where pollution can be shown andproven to be "caused or knowingly permitted".
1.3 The Environment Agency can choose to apply the provisions of Section 86 of theWRA 1991 to serve a Conditional or Absolute Prohibition Notice to an existingsurface water outfall (SWO), if it saw fit to do so because of some particular pollutionhazard. This could either require that a consent be obtained (under Schedule 10, para5 (1), WRA 1991) or alternatively the Agency may specify the conditions to beobserved prior to the approval of a discharge. SEPA has a similar fall-back power ofserving a prohibitive Notice requiring pollution prevention measures; the only defenceagainst an Absolute Prohibition Notice being a discharge consent. On the basis of thelimited information available at the time of writing this report, there are about 50,000SWOs in the UK of which some 7% (about 3540) are consented. Where surfacewater discharges are highlighted as a cause of receiving water quality problems, a
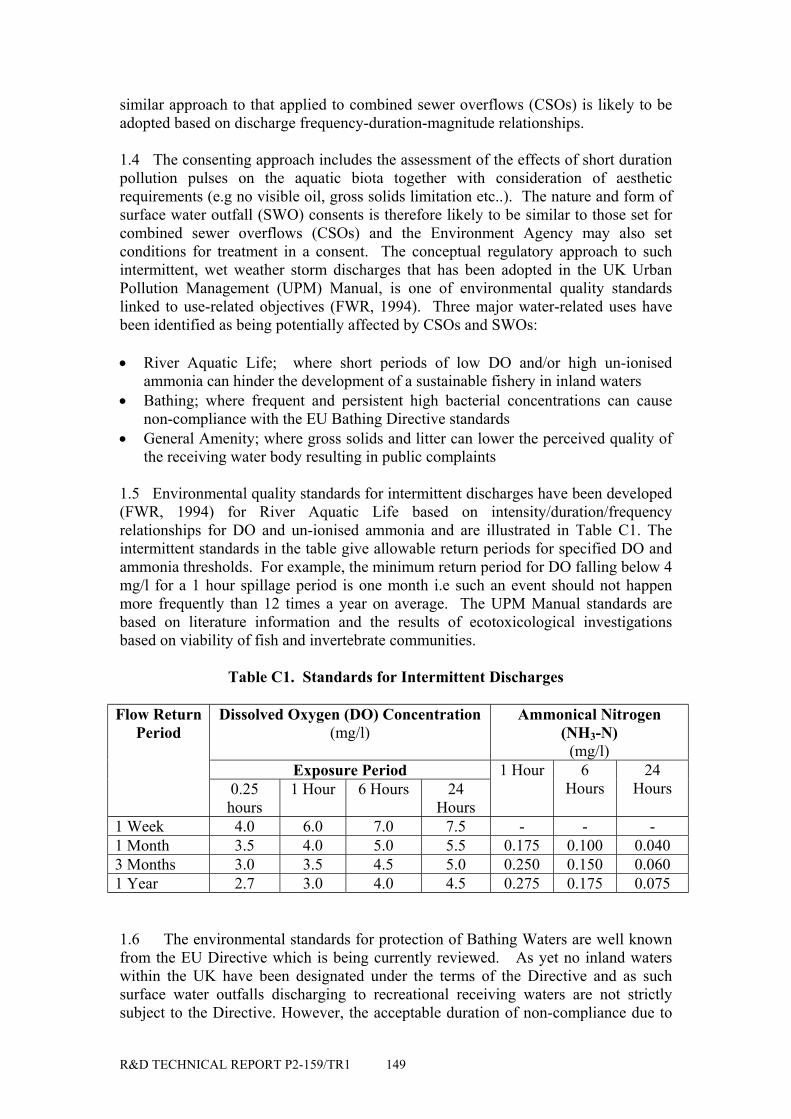
R&D TECHNICAL REPORT P2-159/TR1 149
similar approach to that applied to combined sewer overflows (CSOs) is likely to beadopted based on discharge frequency-duration-magnitude relationships.
1.4 The consenting approach includes the assessment of the effects of short durationpollution pulses on the aquatic biota together with consideration of aestheticrequirements (e.g no visible oil, gross solids limitation etc..). The nature and form ofsurface water outfall (SWO) consents is therefore likely to be similar to those set forcombined sewer overflows (CSOs) and the Environment Agency may also setconditions for treatment in a consent. The conceptual regulatory approach to suchintermittent, wet weather storm discharges that has been adopted in the UK UrbanPollution Management (UPM) Manual, is one of environmental quality standardslinked to use-related objectives (FWR, 1994). Three major water-related uses havebeen identified as being potentially affected by CSOs and SWOs:
• River Aquatic Life; where short periods of low DO and/or high un-ionisedammonia can hinder the development of a sustainable fishery in inland waters
• Bathing; where frequent and persistent high bacterial concentrations can causenon-compliance with the EU Bathing Directive standards
• General Amenity; where gross solids and litter can lower the perceived quality ofthe receiving water body resulting in public complaints
1.5 Environmental quality standards for intermittent discharges have been developed(FWR, 1994) for River Aquatic Life based on intensity/duration/frequencyrelationships for DO and un-ionised ammonia and are illustrated in Table C1. Theintermittent standards in the table give allowable return periods for specified DO andammonia thresholds. For example, the minimum return period for DO falling below 4mg/l for a 1 hour spillage period is one month i.e such an event should not happenmore frequently than 12 times a year on average. The UPM Manual standards arebased on literature information and the results of ecotoxicological investigationsbased on viability of fish and invertebrate communities.
Table C1. Standards for Intermittent Discharges
Dissolved Oxygen (DO) Concentration(mg/l)
Ammonical Nitrogen(NH3-N)
(mg/l)Exposure Period
Flow ReturnPeriod
0.25hours
1 Hour 6 Hours 24Hours
1 Hour 6Hours
24Hours
1 Week 4.0 6.0 7.0 7.5 - - -1 Month 3.5 4.0 5.0 5.5 0.175 0.100 0.0403 Months 3.0 3.5 4.5 5.0 0.250 0.150 0.0601 Year 2.7 3.0 4.0 4.5 0.275 0.175 0.075
1.6 The environmental standards for protection of Bathing Waters are well knownfrom the EU Directive which is being currently reviewed. As yet no inland waterswithin the UK have been designated under the terms of the Directive and as suchsurface water outfalls discharging to recreational receiving waters are not strictlysubject to the Directive. However, the acceptable duration of non-compliance due to
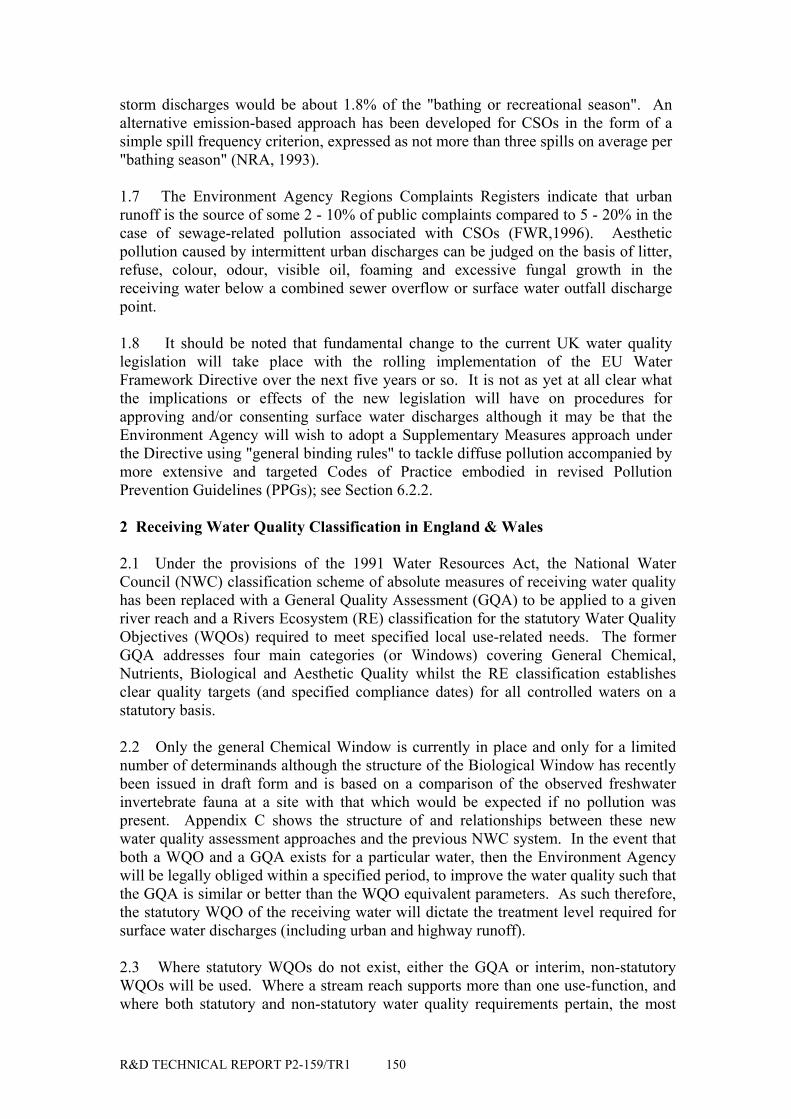
R&D TECHNICAL REPORT P2-159/TR1 150
storm discharges would be about 1.8% of the "bathing or recreational season". Analternative emission-based approach has been developed for CSOs in the form of asimple spill frequency criterion, expressed as not more than three spills on average per"bathing season" (NRA, 1993).
1.7 The Environment Agency Regions Complaints Registers indicate that urbanrunoff is the source of some 2 - 10% of public complaints compared to 5 - 20% in thecase of sewage-related pollution associated with CSOs (FWR,1996). Aestheticpollution caused by intermittent urban discharges can be judged on the basis of litter,refuse, colour, odour, visible oil, foaming and excessive fungal growth in thereceiving water below a combined sewer overflow or surface water outfall dischargepoint.
1.8 It should be noted that fundamental change to the current UK water qualitylegislation will take place with the rolling implementation of the EU WaterFramework Directive over the next five years or so. It is not as yet at all clear whatthe implications or effects of the new legislation will have on procedures forapproving and/or consenting surface water discharges although it may be that theEnvironment Agency will wish to adopt a Supplementary Measures approach underthe Directive using "general binding rules" to tackle diffuse pollution accompanied bymore extensive and targeted Codes of Practice embodied in revised PollutionPrevention Guidelines (PPGs); see Section 6.2.2.
2 Receiving Water Quality Classification in England & Wales
2.1 Under the provisions of the 1991 Water Resources Act, the National WaterCouncil (NWC) classification scheme of absolute measures of receiving water qualityhas been replaced with a General Quality Assessment (GQA) to be applied to a givenriver reach and a Rivers Ecosystem (RE) classification for the statutory Water QualityObjectives (WQOs) required to meet specified local use-related needs. The formerGQA addresses four main categories (or Windows) covering General Chemical,Nutrients, Biological and Aesthetic Quality whilst the RE classification establishesclear quality targets (and specified compliance dates) for all controlled waters on astatutory basis.
2.2 Only the general Chemical Window is currently in place and only for a limitednumber of determinands although the structure of the Biological Window has recentlybeen issued in draft form and is based on a comparison of the observed freshwaterinvertebrate fauna at a site with that which would be expected if no pollution waspresent. Appendix C shows the structure of and relationships between these newwater quality assessment approaches and the previous NWC system. In the event thatboth a WQO and a GQA exists for a particular water, then the Environment Agencywill be legally obliged within a specified period, to improve the water quality such thatthe GQA is similar or better than the WQO equivalent parameters. As such therefore,the statutory WQO of the receiving water will dictate the treatment level required forsurface water discharges (including urban and highway runoff).
2.3 Where statutory WQOs do not exist, either the GQA or interim, non-statutoryWQOs will be used. Where a stream reach supports more than one use-function, andwhere both statutory and non-statutory water quality requirements pertain, the most
R&D TECHNICAL REPORT P2-159/TR1 151
stringent of the combined specifications will apply. Therefore the assessment of newroads or road improvements must include consideration of all the uses (both upstreamand downstream) to which the watercourse is put.
3 Sediment Quality Standards
3.1 Wetland SuDS structures will accumulate contaminated sediment including toxicmetals which will ultimately require disposal and thus become subject to prevailingregulatory limits for contaminated soil and biosolids. Table C2 gives "trigger" orthreshold loading limits as defined under EU legislation for biosolids and soilexpressed in either annual or total cumulative loadings. As a basis for comparisonwith the standard EU limits, the table also shows regulatory limits that have beenestablished elsewhere and which are often referred to in the literature.
3.2 The UK Inter-Departmental Committee on the Redevelopment of ContaminatedLand (ICRCL) values are those quoted for parks and open spaces whilst the Dutchvalues are those defining clearly contaminated land. Even adopting the maximumloading rates shown in the table would suggest that the operational lives of mostwetlands would be at least 20 - 50 years especially if given regular and propermaintenance. However, the relatively low loading limits specified for cadmium mightprovide a more critical restriction.
Table C2. Sediment Quality Standards
EU 1986 DirectivePollutant UKICRCL(mg/kg) Biosolids
(mg/kg)UK 90%(1996/97)Biosolids
Limit
Soil(mg/kg)
ApplicationLoading
10 yr average(kg/ha/yr)
DutchMinistryof PublicHousing(mg/kg)
SwedishEPA
"Moderatepollution"(mg/kg)
US EPA503
Regulations(kg/ha/yr)
CanadaOntarioMinistryof Env.(LowestEffectLevel)
(mg/kg)Zinc 300 2500 -
40001076 150 -
30030 720 175 - 300 140 110.0
Lead 2000 750 -1200
288 50 - 300 15 530 30 - 100 15 31.0
Cadmium 15 20 - 40 3.4 1.3 0.15 12 1.7 - 2.0 1.9 1.0Copper 1000 -
1750758 50 - 140 12 25 - 50 25
References
FWR. 1994. Urban pollution management manual. FR/CL0002, Foundation forWater Research, Medmenham, Bucks.
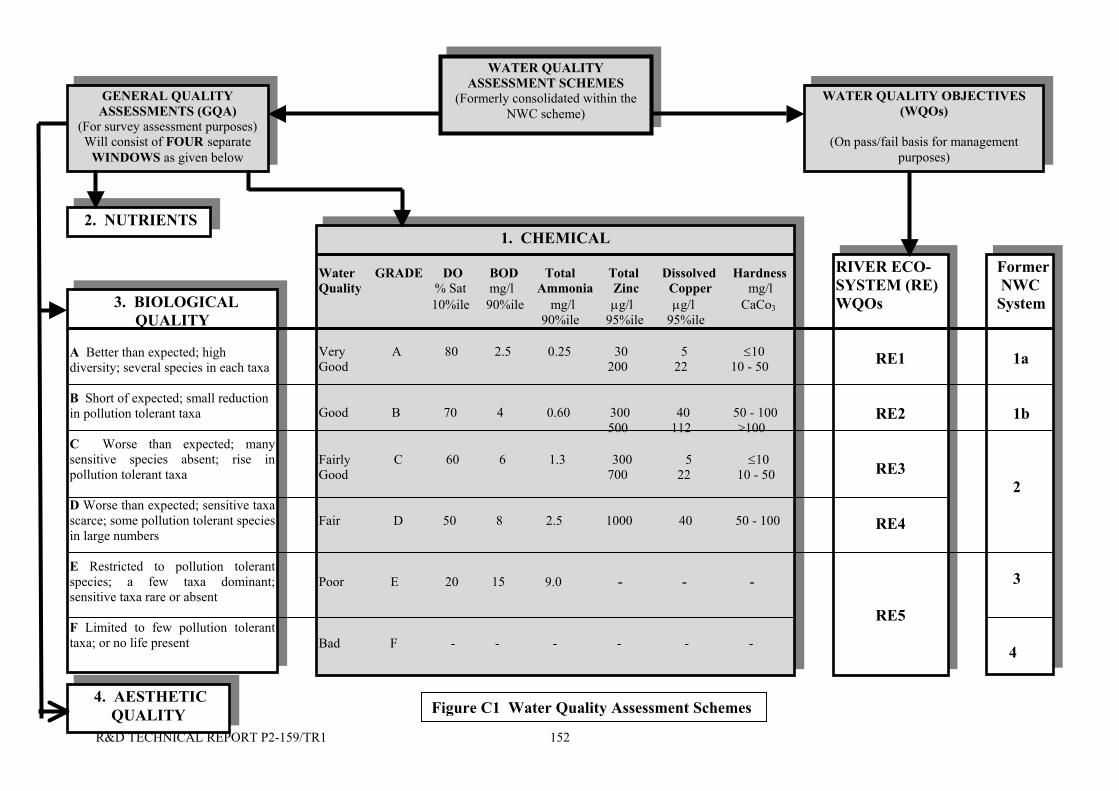
R&D TECHNICAL REPORT P2-159/TR1 152
WATER QUALITYASSESSMENT SCHEMES
(Formerly consolidated within theNWC scheme)
GENERAL QUALITYASSESSMENTS (GQA)
(For survey assessment purposes)Will consist of FOUR separate
WINDOWS as given below
2. NUTRIENTS
3. BIOLOGICALQUALITY
A Better than expected; highdiversity; several species in each taxa
B Short of expected; small reductionin pollution tolerant taxa
C Worse than expected; manysensitive species absent; rise inpollution tolerant taxa
D Worse than expected; sensitive taxascarce; some pollution tolerant speciesin large numbers
E Restricted to pollution tolerantspecies; a few taxa dominant;sensitive taxa rare or absent
F Limited to few pollution toleranttaxa; or no life present
4. AESTHETICQUALITY
WATER QUALITY OBJECTIVES(WQOs)
(On pass/fail basis for managementpurposes)
1. CHEMICAL
Water GRADE DO BOD Total Total Dissolved HardnessQuality % Sat mg/l Ammonia Zinc Copper mg/l 10%ile 90%ile mg/l µg/l µg/l CaCo3 90%ile 95%ile 95%ile
Very A 80 2.5 0.25 30 5 ≤10Good 200 22 10 - 50
Good B 70 4 0.60 300 40 50 - 100 500 112 >100
Fairly C 60 6 1.3 300 5 ≤10Good 700 22 10 - 50
Fair D 50 8 2.5 1000 40 50 - 100
Poor E 20 15 9.0 - - -
Bad F - - - - - -
RIVER ECO-SYSTEM (RE)WQOs
RE1
RE2
RE3
RE4
RE5
Former NWC System
1a
1b
2
3
4
Figure C1 Water Quality Assessment Schemes

R&D TECHNICAL REPORT P2-159/TR1 153
APPENDIX D
LEGAL REGULATIONS, WATER QUALITY AND SEDIMENTSTANDARDS IN FRANCE FOR SURFACE WATERDISCHARGES AND THE ENVIRONMENT
D1. Stormwater Control
1.1 Law 92-3 of 3 January 1992, article 35.III requires urban communities todelimit after a public investigation:• zones within which measures should be taken to limit the impermeabilisation of
land and to ensure stormwater control• zones within which it is necessary to provide devices for collection, storage and
when needed, treatment of stormwater if the pollutant load discharged to thereceiving waters is likely to seriously damage the efficiency of the seweragesystem
1.2 The above two paragraphs of article 35.III invoke directly or indirectly theneed for retention (permanent wet) basins which may form part of the array of devicesrecommended for good management of the urban water cycle
D2. Discharge Permit
2.1 The byelaw of 20 November 1979, framed for application of decree number73-218, lays down provisos applicable to the stormwater discharged from channels,pipes etc. (decree no. 73-218 was later abrogated)
2.2 Law 92-3 of 3 January 1992 prescribes in article 10 the procedures for declarationor permit for works involving pairing out, flow, discharge or storage which may bedirectly or indirectly, chronic or occasionally, polluting or non-polluting.
2.3 Decree no.93-743 of 29 March 1993 gives the list of these works in its annexure,notably:• Clause 2.7.0; Creation of ponds or water bodies with a surface area
- larger than 3ha would need a Permit - larger than 2000 m2 but smaller than 3ha would need a Declaration• Clause 5.3.0; Regarding discharge of stormwater into surface waters or into an
infiltration pond, if the total water catchment area is-- larger than or equal to 20ha, a Permit is required- large than 1ha but smaller than 20ha, a Declaration is required
D3. Environmental Impact Study/Statement
Under article 2 of law 76-629 of 10 July 1976, open basins, irrespective of their size,are subject to an impact study under current french law where "the preliminary studybefore planning or installation of works which, by virtue of their size or theirinfluence on the natural environment, could undermine the latter, should include animpact study….to assess the consequences".
R&D TECHNICAL REPORT P2-159/TR1 154
D4. Public Safety and Health
4.1 Retention (wetland) basins are governed by the municipal police as specified inthe Code of Communes and Departmental Sanitary Regulations.• Article L.131-2 stipulates:
- the mayor is responsible….for taking suitable precautions to put a stop topollution of all types
• Article L.131-11 stipulates:- the mayor can require the owners, beneficiaries and users to enclose by properfencing, all holes, wells, shafts and excavations likely to endanger public safety
4.2 Article 36 of the Standard Departmental Sanitary Regulations concerning storageof non-potable water stipulates:• "water storages have to be emptied as often as necessary, in particular to prevent
proliferation of insects. They have to be cleaned and disinfected as often asnecessary, but at least once a year".
However, these provisos may not be strictly applicable to stormwater retention(wetland) basins.
D5. Urban Planning
5.1 Retention (wetland) basins are not explicitly mentioned in the Code for TownPlanning. They may however, be considered a part of lowering or raising the level ofland operations, which are frequently mentioned in the Code.
5.2 Article L121-10 states: - the town planning documents specify conditions that assist in prevention of
natural as well as technological risks. The provisos of this article have to beconsidered as law for Town and Country Planning in the sense of article L111-11 of the French Code of Urbanisation. This article confers a specialarticulation between elaboration of town planning documents and studies ofstormwater networks and retention (wetland) basins. It refers to theobligations of the communities regarding division of their territory into zones(cf with D1 above) and the measures limiting the impermeabilisation of landconforming to law 92-3 of 3 January 1992- Article L123-1 reads: "the Plan d'Occupation des Sols (POS; land use plan)should fix the sites reserved for public roads and works" and clearly, retentionbasins should figure among the sites reserved by POS. In this context,attention is drawn to the consequences of article L.123-9 which specifies therights of owners and the obligations of the community with respect to reservedsites.
5.2 Under POS, retention basins are governed by articles R.123-18 (GraphicDocuments) and R.123-21 (Regulation) which relate to identified zones which areeither subject to special conditions (e.g prescribed land uses and operations) orprohibiting buildings and facilities, lowering or raising land etc.
5.3 According to the Code of Urbanisation (article L.421-1), a request for abuilding permit must be made in most cases of retention (wetland) basins although

R&D TECHNICAL REPORT P2-159/TR1 155
article R.422-2 allows exemption for technical structures whose floor area is smallerthan 20 m2 and height less than 3m. It should be noted that French Circular DAU of25 July 1986 (Direction de l'Architecture et de l'Urbanisme, Ministry of Public Worksand Transport), contains information that does not coincide with the contents of theabove articles of the Code of Urbanisation. The revised article R.421-1 gives aspecial list of works or structures exempted from the application of building permitswhich includes "basins, irrespective of their usage; pleasure, agricultural, pisiculture,aquaculture and uncovered swimming pools"
5.4 Article L.422-2 stipulates that works exempted from the building permit shouldnevertheless be subject to a preliminary Declaration in which full detail (articleR.422-3) of the proposed works be given.
5.5 According to the French Code of Urbanisation under article R.422-2, retention(wetland) basins belong to a group of installations and works for which a request forAuthorisation must also be made.
5.6 The Code of Urbanisation provides (under L.332-9; Plan d'Amenagementd’Ensemble, PAE) that private operators/developers may be required to meet all or atleast part of the cost of public facilities needed or associated with retention basins inaccordance with the town and country plans
5.7 Article R.123-18, Sections c and d of the Code of Urbanisation define NC andND zones which are protected zones by virtue of their agricultural, groundwater (NC)or aesthetic, historical, ecological (ND) value. Within such zones, the construction ofretention (wetland) basins would be subject to particular attention and questioning.
D6. Accidental Pollution
6.1 Law no.84-512 of 29 June 1984 (Fishing) and Law no.92-3 of 3 January 1992(Water) include essential legal means of initiating judicial action in the case ofaccidental pollution and where harm or damage is caused in receiving waters to eitherfish (article L.231-3 of the Rural Code) or to flora/fauna as well modifications to thenormal food chain regime (article 22 of the Water Law).
6.2 The civil legal process is independent of any penal action taken by the waterpolice and may be pursued even in the absence of police action; its objective is toobtain appropriate compensation as based on articles 1382, 1383, 1384 et seq of theCivil Code.
D7. French Water Quality Standards
7.1 The water quality standards currently in use in France are rather embryonic innature and mix various physical, chemical and biological data to produce a uniquefive category classification namely, 1A, 1B, 2, 3 and HC. This system is in theprocess of being changed and a new approach, termed SEQ (Water Quality EvaluationSystem) has been constructed and recently proposed for use (Etudes Agence de l'Eau,n°72, 1999; n° 64, 2000). The SEQ is based on three main components : water (SEQ-Eau), hydrology and morphology (SEQ-Physique) and aquatic life (SEQ-Bio). Foreach of these components, a number of parameters have been chosen defining quality

R&D TECHNICAL REPORT P2-159/TR1 156
alterations, and a set of thresholds is given for each of them, and for selected wateruses. For example regarding the SEQ-Eau, thresholds are different for biologicalpotential, drinking water production, bathing, irrigation, livestock and fish farming.Alterations include organic matter, eutrophication (N, P, phytoplankton), suspendedsolids, micro-pollutants (in water, sediments, bryophytes…), and pathogenicorganisms. A significant effort has been made to relate the thresholds to realconstraints on uses. Data bases have been compiled including for example : acute orchronic No Observable Effect Concentration (NOEC) levels as well as LC50 formicro-pollutants (alteration) and life support (water use), treatment cost and toxicityon man for micro-pollutants (alteration) and drinking water production (water use). Arigorous strategy has been established to derive thresholds from such data, includingexpert comments, thus enabling the SEQ system to evolve with increasing knowledge.
7.2 The following table D1 gathers the currently proposed thresholds for lead inwater (µg/l) which would be introduced under the above legislation.
Table D1. Proposed SEQ Standards
1 (green) 2 (blue) 3 (yellow) 4 (orange) 5 (red)Life support* 2.1/5.2/10 21/52/100 100/250/500 370/930/1900Drinking waterproduction
5 10 50 50
Irrigation 200 200 2000 2000Livestock 50 100Fish farming 30 30* three thresholds depending on water hardness.
The SEQ-eau, whilst not yet official, does seem much more advanced than the otherproposed SEQ's (hydrology and morphology, aquatic life). There is no proposed SEQfor wetlands, although a recent review has been written trying to sketch out a first setof parameters to define wetland quality (Fustec and Frochot, 1998).
7.3 Highway runoff discharges have to be authorised by government representatives,because of the expected negative consequences of de-icing salts released into theenvironment. However, information brought forward by highway companies to obtainthis official agreement is expected to include information about the impact of metals,hydrocarbons and suspended solids. However this is not legally required (although afreshwater fishery owner recently won his case in the courts and obtained suchinformation from a highway society). The discharges also have to be legallyauthorised as soon as the impervious catchment is greater than 20 ha, as soon as theexpected flow is higher than 10000 m3 per day, or higher than 25% of the referenceflow of the receiving river. There also exist legal constraints regarding flooding, butmainly to prevent embanking of natural flows by civil engineering works. Theconstraints do not seem to be active for runoff problems.
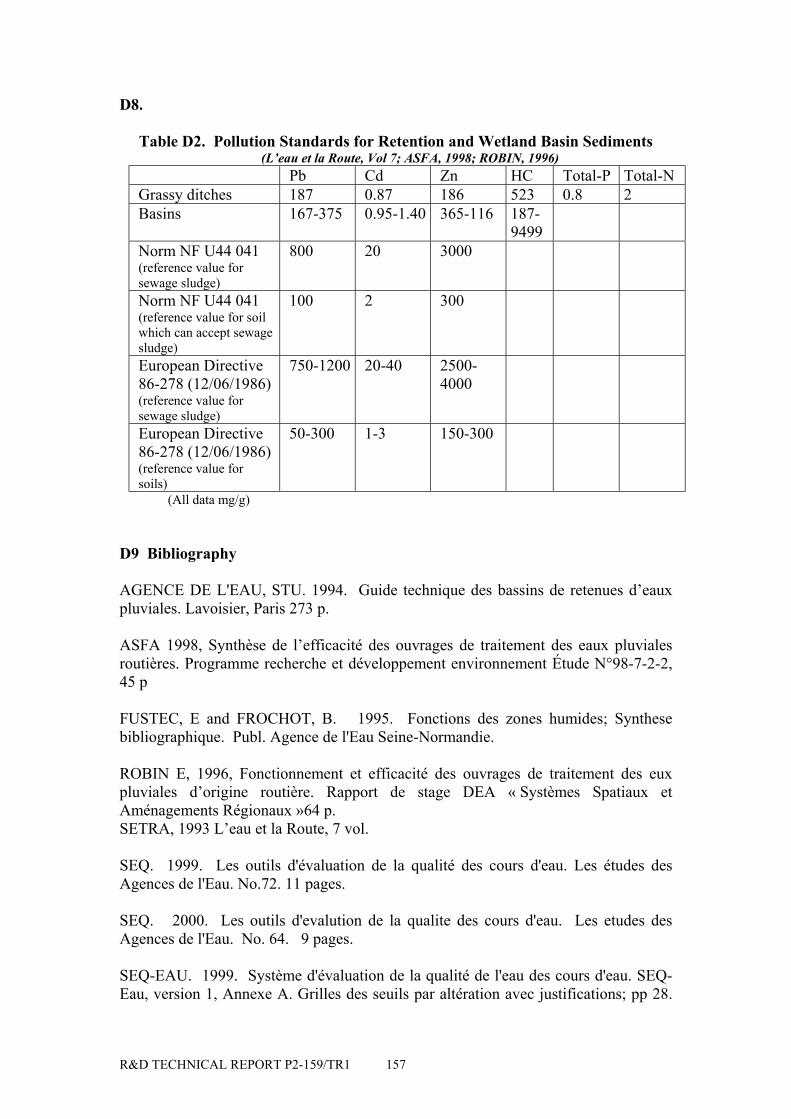
R&D TECHNICAL REPORT P2-159/TR1 157
D8.
Table D2. Pollution Standards for Retention and Wetland Basin Sediments(L’eau et la Route, Vol 7; ASFA, 1998; ROBIN, 1996)
Pb Cd Zn HC Total-P Total-NGrassy ditches 187 0.87 186 523 0.8 2Basins 167-375 0.95-1.40 365-116 187-
9499Norm NF U44 041(reference value forsewage sludge)
800 20 3000
Norm NF U44 041(reference value for soilwhich can accept sewagesludge)
100 2 300
European Directive86-278 (12/06/1986)(reference value forsewage sludge)
750-1200 20-40 2500-4000
European Directive86-278 (12/06/1986)(reference value forsoils)
50-300 1-3 150-300
(All data mg/g)
D9 Bibliography
AGENCE DE L'EAU, STU. 1994. Guide technique des bassins de retenues d’eauxpluviales. Lavoisier, Paris 273 p.
ASFA 1998, Synthèse de l’efficacité des ouvrages de traitement des eaux pluvialesroutières. Programme recherche et développement environnement Étude N°98-7-2-2,45 p
FUSTEC, E and FROCHOT, B. 1995. Fonctions des zones humides; Synthesebibliographique. Publ. Agence de l'Eau Seine-Normandie.
ROBIN E, 1996, Fonctionnement et efficacité des ouvrages de traitement des euxpluviales d’origine routière. Rapport de stage DEA « Systèmes Spatiaux etAménagements Régionaux »64 p.SETRA, 1993 L’eau et la Route, 7 vol.
SEQ. 1999. Les outils d'évaluation de la qualité des cours d'eau. Les études desAgences de l'Eau. No.72. 11 pages.
SEQ. 2000. Les outils d'evalution de la qualite des cours d'eau. Les etudes desAgences de l'Eau. No. 64. 9 pages.
SEQ-EAU. 1999. Système d'évaluation de la qualité de l'eau des cours d'eau. SEQ-Eau, version 1, Annexe A. Grilles des seuils par altération avec justifications; pp 28.

R&D TECHNICAL REPORT P2-159/TR1 158
APPENDIX E
WETLAND LOCATIONS AND DETAIL
E1. Residential (and mixed) Catchment Runoff
Anton Crescent, Sutton, SurreyResidentialand lightcommercial
Surfacestormwaterrunoff ;1:50 design;165.5 m3/d.
Flood storage, 1.3 ha;wet retention basin;SF wetland withexcavated pond atoutlet;Typha
Maximum designstorage capacity;10,000 m3
Wetland area; 13, 125m2
Mean retention time;10.8 days
Wildlife conservation area; localamenity; educational facilityAverage removal %: N -19%; SS 56%;Pb 7%; Zn 37%; Faecal Coli 78%High levels of metals reported insediment (Cd, 1.5; Cu 40.0;Pb 126.6; Zn 120.7 mg/kg)Plant tissue (leaf) metal levels alsorecorded
Great Notley Garden Village, Braintree, EssexResidential(2000houses);lowdensityretail andbusiness;Highway.
188.18 ha
Surfacestormwaterruunoff;1:100 designMaximumdischarge;272.4 l/s
Flood storage;wet retention basin;SF wetland withsediment trenchfollowed by 16,000 m2
pond.Typha, Phragmites(also Iris , Scirpus)
Maximum designstorage capacity;30,000 m3
Wetland area;7, 900 m2
Final open water recreational pond.% removal range: Cd 10-99; Cu 94-97;Pb 89-97; Zn 10-99.Sediment metal levels: Cd 2±1.9; Cu24±19.4; Pb 31±10.3; Zn 65±49.7Plant tissue and rhizome metal levelsalso recorded
Thorley Pond, Bishops Stortford, HertsResidential(2500houses)172 ha
Surfacestormwaterrunoff;1:30 design;Consentdischarge;1.89 m3/s
Flood storage;Dry detention basinLow wet marsh in baseof pond
Maximum designstorage capacity;8,000 m3
Newton Park East, Harrow, MiddlesexResidential2.5 km2
Surfacestormwaterrunoff;1:2 design
Flood strorage;Extended detention(ED) basin;Low marsh to base
Maximum designstorage capacity:1,075 m3
To provide local flood relief on theYeading brook
Redhill Brook, Holmethorpe, Redhill, SurreyResidential Surface
stormwaterrunoff;
Flood storage;Wet retention pondwith large self-seededreed bed (Typha)
Maximum designstorage capacity;2,400 m3

R&D TECHNICAL REPORT P2-159/TR1 159
Broadfield, Crawley, HantsResidential236 ha
Surfacestormwaterrunoff;1:10 design1.25 m3/s
Flood strorage;Extended detention(ED) basin;Low wet marsh to basewith macrophytevegetation
Maximum designstorage capacity;30, 800 m3
Considered to be the most "sensitive"of all the flood storage basins inCrawley
Langshott, Horley, SurreyResidential12 ha
Surfacestormwaterrunoff;1:50 designMaximumflow; 70 l/s
Flood storage;Dry detention basin;Low marsh and reedsto base of pond and atoutlet
Maximum designstorage capacity;2,303 m3
Brentwood, EssexResidentialand mixedland use
400 ha
Surfacestormwaterrunoff
Flood storage;SSF constructedwetland (Phragmites)followed by a SFnatural wetland(Typha)
Wetland area; 204 m2
Mean retention time;50 mins
Front-end settlement basin.Elevated inflows of Pb (195 µg/l), Zn(132 µg/l) and high BOD (75 mg/l).Mean % removals (Water):Dry weather; Zn 19; Cd 33; Pb 30; Cu-15; BOD 17; SS 18; Total Amm 50.Wet weather; Zn 22; Cd -4; Pb 16; Cu8; BOD 15; SS 4; Total Amm 59.Mean % removals (Sediment): Zn -35;Cd 17; Pb 32; Cu 33.Plant tissue metal levels also recorded.
St Johns Wood, Tamar, CornwallMixedurban landuse
Surfacestormwaterrunoff
Diversion pond;SF RBTS constructedwetland
To mitigate the effects of urban runoffinto a saltmarsh reserve
North Weald, EssexResidentialandagriculturalrunoff.
Surfacestormwaterrunoff
Diversion pond;ED Basin with wetretention pond to baseand SF constructedwetland;Typha/Phragmites
Wildlife enhancement and localeducational facility
Claver House East, Dundee, Fife, ScotlandResidential Surface
stormwaterrunoff
Flood storage.Wet retention basinwith SF constructedwetland
Wetlands within woodland area; toovercome cost of 2m outfall pipe.

R&D TECHNICAL REPORT P2-159/TR1 160
Webheath, Redditch, Worcs.Residential270 houses
Surfacestormwaterrunoff
Flood storage andpollution control;Stilling andsedimentation basin towet retention balancingpond followed by 425m x 5m linearconstructed reedbeds
Wetland 125 m2 perimpervious hectare ofcatchment;Void storage inreedbed--50 m3 perimpervious hectare ofcatchment--5 mmrunoff volume
Retrofitted into previous degradedchannel;Front-end stilling basin and pollutiontrap--10 m3 per impervious hectare ofcatchment
Tewkesbury, Gloucs.Residential1500houses(drained by6 outfalls)
Surfacestormwaterrunoff
Flood storage andpollution control;Stilling andsedimentation basininto 146m x 5m linearSF constructed reedbedwetland
Retrofitted into existing ditchedfloodplain of watercourse
Arbroath Road, Dundee, Fife, ScotlandResidential
400 homes
Surfacestormwaterrunoff
Flood storage andpollution control.Wet retention basinswith SF constructedwetland(s)
Menstrie Mains, Clackmannan, ScotlandResidential Surface
stormwaterrunoff
Flood storage.SF constructedwetlands
Filter drains to housing areas followedby wetlands
Newcastle Great Park, Newcastle-upon-TyneResidentialGreenfield site.172ha residential,2.9ha park & ride,139ha commercial.Plus 144ha servicecentre and roads etc
SurfaceStormwaterrunoff
Flood storage and pollutionControl.Constructed wetland reedbeds
7 wetland cells.300 - 5400 m3 permanentwater volumes;1130 - 20000 m3 designstorage volumes
Wetland surrounds to be fullylandscaped
Welfield Park, StevenageResidentialandaccess/serviceroads
Surfacestormwaterrunoff
Flood storage;Wet retention pondwith marginalvegetation

R&D TECHNICAL REPORT P2-159/TR1 161
E2. Commercial/Industrial and Business Estate Runoff
Pinnacles Estate, Harlow, EssexLightIndustrialandcommercial;65 ha
Surfacestormwaterrunoff;1:10 design;Consentdischarge;0.163 m3/s
Flood storage;Dry detention basin;Low wet pond marsh inbase of pond
Maximum designstorage capacity;19,400 m3
Rowley Wood, Northgate, Crawley, HantsIndustrial;201 ha
Surfacestormwaterrunoff;1:1 design;
Flood strorage;Dry detention basin;Low marsh at outlet
Maximum designstorage capacity;5,432 m3
Stockley Park, Southall, Hillingdon.Business andcommercialestate;26.92 ha
Surfacestormwaterrunoff;1:30 design;Consentdischarge;0.065 m3/s
Flood storage;6 Wet retentionbasins;Self-seeded marginalmarsh andmacrophytes to 4 ofthe ponds
Maximum designstorage capacity;11,950 m3
Ponds used by London Borough ofHillingdon for passive amenity andrecreation
Hookwood, Reigate, SurreyRetail andcommercial;car parking
Surfacestormwaterrunoff;1:10 design
Flood storage;Dry/wet detentionand retention basin;Self-seeded reeds andmarsh in wet pondarea.
Aztec West, Junction 16 M5, N BristolBusiness andcommercial;
68 ha
Surfacestormwaterrunoff;(roofs, carparks, roads)
Flood storage;2 Dry detentionbasins;2 Wet retentionbasins withJuncus/Irisvegetation
Front-end oil interceptors.Ornamental ponds; landscapedsurroundings;Wildlife and birds;Landscaped surroundings
Furzen Farm Industrial Estate, Pershore, Worcs.Generalindustrial;4 ha
Surfacestormwaterrunoff.
Flood balancing andpollution control;Dry detention basin;SF constructedwetland to base
Landscaped to provide amenityfeature.
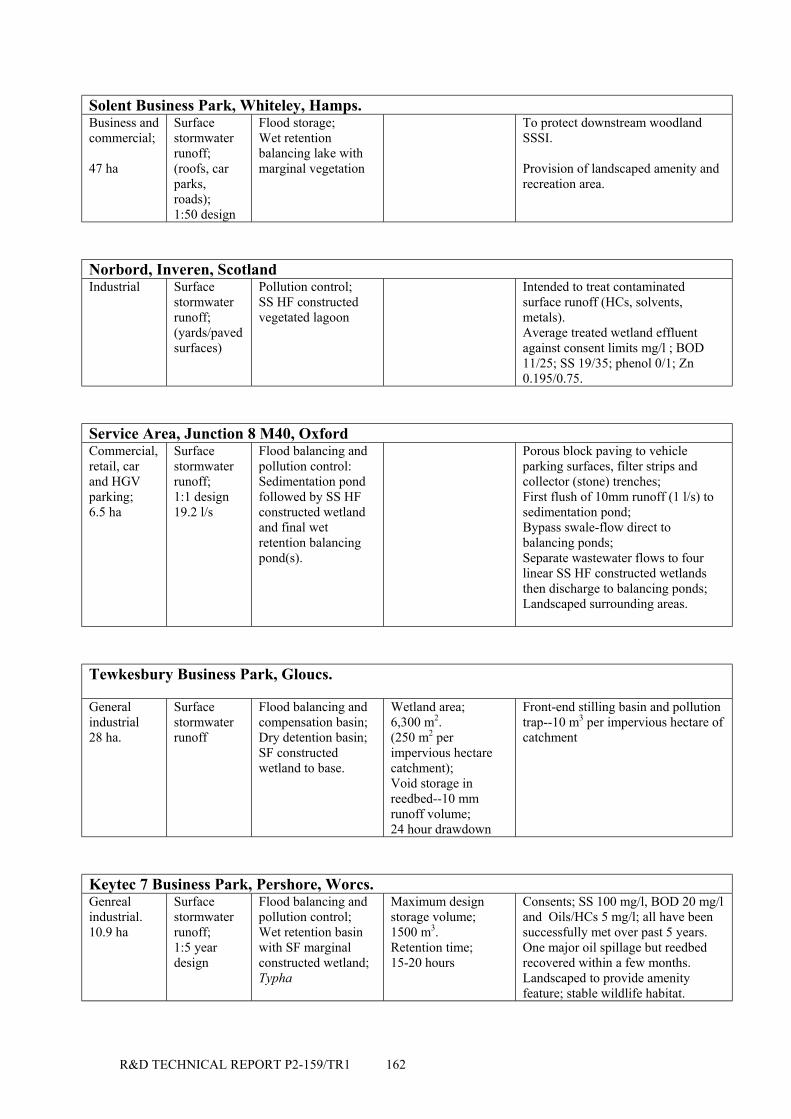
R&D TECHNICAL REPORT P2-159/TR1 162
Solent Business Park, Whiteley, Hamps.Business andcommercial;
47 ha
Surfacestormwaterrunoff;(roofs, carparks,roads);1:50 design
Flood storage;Wet retentionbalancing lake withmarginal vegetation
To protect downstream woodlandSSSI.
Provision of landscaped amenity andrecreation area.
Norbord, Inveren, ScotlandIndustrial Surface
stormwaterrunoff;(yards/pavedsurfaces)
Pollution control;SS HF constructedvegetated lagoon
Intended to treat contaminatedsurface runoff (HCs, solvents,metals).Average treated wetland effluentagainst consent limits mg/l ; BOD11/25; SS 19/35; phenol 0/1; Zn0.195/0.75.
Service Area, Junction 8 M40, OxfordCommercial,retail, carand HGVparking;6.5 ha
Surfacestormwaterrunoff;1:1 design19.2 l/s
Flood balancing andpollution control:Sedimentation pondfollowed by SS HFconstructed wetlandand final wetretention balancingpond(s).
Porous block paving to vehicleparking surfaces, filter strips andcollector (stone) trenches;First flush of 10mm runoff (1 l/s) tosedimentation pond;Bypass swale-flow direct tobalancing ponds;Separate wastewater flows to fourlinear SS HF constructed wetlandsthen discharge to balancing ponds;Landscaped surrounding areas.
Tewkesbury Business Park, Gloucs.
Generalindustrial28 ha.
Surfacestormwaterrunoff
Flood balancing andcompensation basin;Dry detention basin;SF constructedwetland to base.
Wetland area;6,300 m2.(250 m2 perimpervious hectarecatchment);Void storage inreedbed--10 mmrunoff volume;24 hour drawdown
Front-end stilling basin and pollutiontrap--10 m3 per impervious hectare ofcatchment
Keytec 7 Business Park, Pershore, Worcs.Genrealindustrial.10.9 ha
Surfacestormwaterrunoff;1:5 yeardesign
Flood balancing andpollution control;Wet retention basinwith SF marginalconstructed wetland;Typha
Maximum designstorage volume;1500 m3.Retention time;15-20 hours
Consents; SS 100 mg/l, BOD 20 mg/land Oils/HCs 5 mg/l; all have beensuccessfully met over past 5 years.One major oil spillage but reedbedrecovered within a few months.Landscaped to provide amenityfeature; stable wildlife habitat.
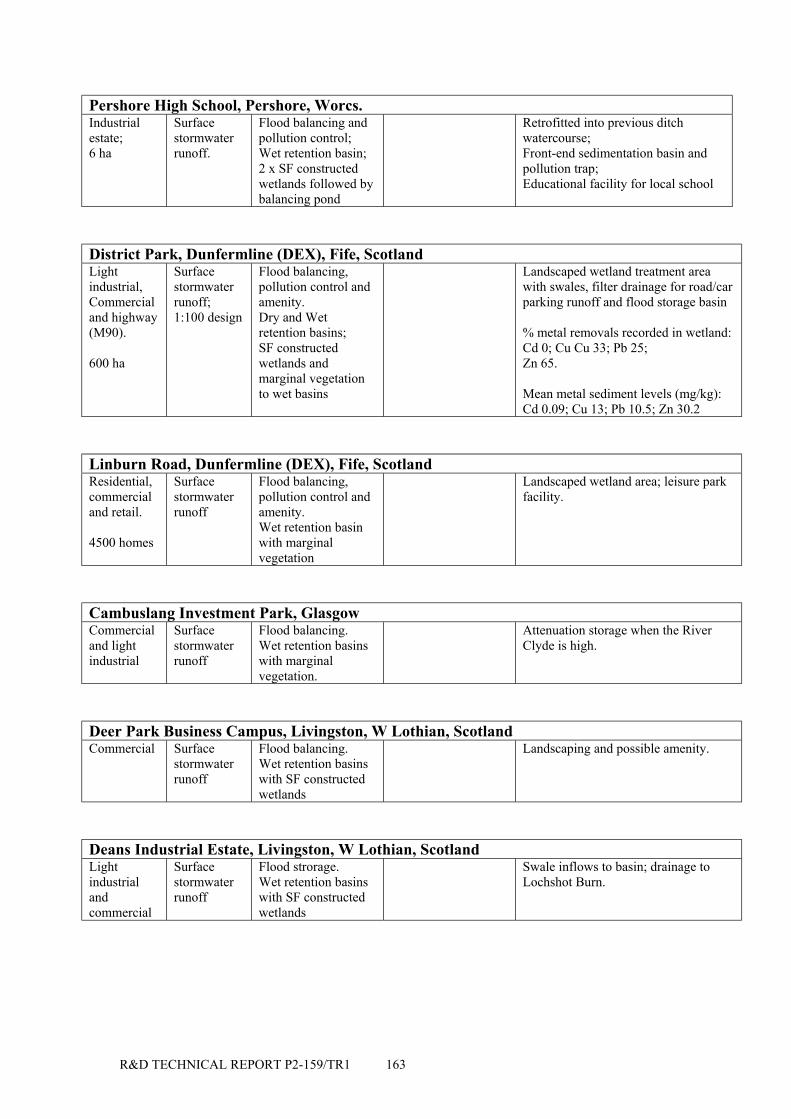
R&D TECHNICAL REPORT P2-159/TR1 163
Pershore High School, Pershore, Worcs.Industrialestate;6 ha
Surfacestormwaterrunoff.
Flood balancing andpollution control;Wet retention basin;2 x SF constructedwetlands followed bybalancing pond
Retrofitted into previous ditchwatercourse;Front-end sedimentation basin andpollution trap;Educational facility for local school
District Park, Dunfermline (DEX), Fife, ScotlandLightindustrial,Commercialand highway(M90).
600 ha
Surfacestormwaterrunoff;1:100 design
Flood balancing,pollution control andamenity.Dry and Wetretention basins;SF constructedwetlands andmarginal vegetationto wet basins
Landscaped wetland treatment areawith swales, filter drainage for road/carparking runoff and flood storage basin
% metal removals recorded in wetland:Cd 0; Cu Cu 33; Pb 25;Zn 65.
Mean metal sediment levels (mg/kg):Cd 0.09; Cu 13; Pb 10.5; Zn 30.2
Linburn Road, Dunfermline (DEX), Fife, ScotlandResidential,commercialand retail.
4500 homes
Surfacestormwaterrunoff
Flood balancing,pollution control andamenity.Wet retention basinwith marginalvegetation
Landscaped wetland area; leisure parkfacility.
Cambuslang Investment Park, GlasgowCommercialand lightindustrial
Surfacestormwaterrunoff
Flood balancing.Wet retention basinswith marginalvegetation.
Attenuation storage when the RiverClyde is high.
Deer Park Business Campus, Livingston, W Lothian, ScotlandCommercial Surface
stormwaterrunoff
Flood balancing.Wet retention basinswith SF constructedwetlands
Landscaping and possible amenity.
Deans Industrial Estate, Livingston, W Lothian, ScotlandLightindustrialandcommercial
Surfacestormwaterrunoff
Flood strorage.Wet retention basinswith SF constructedwetlands
Swale inflows to basin; drainage toLochshot Burn.
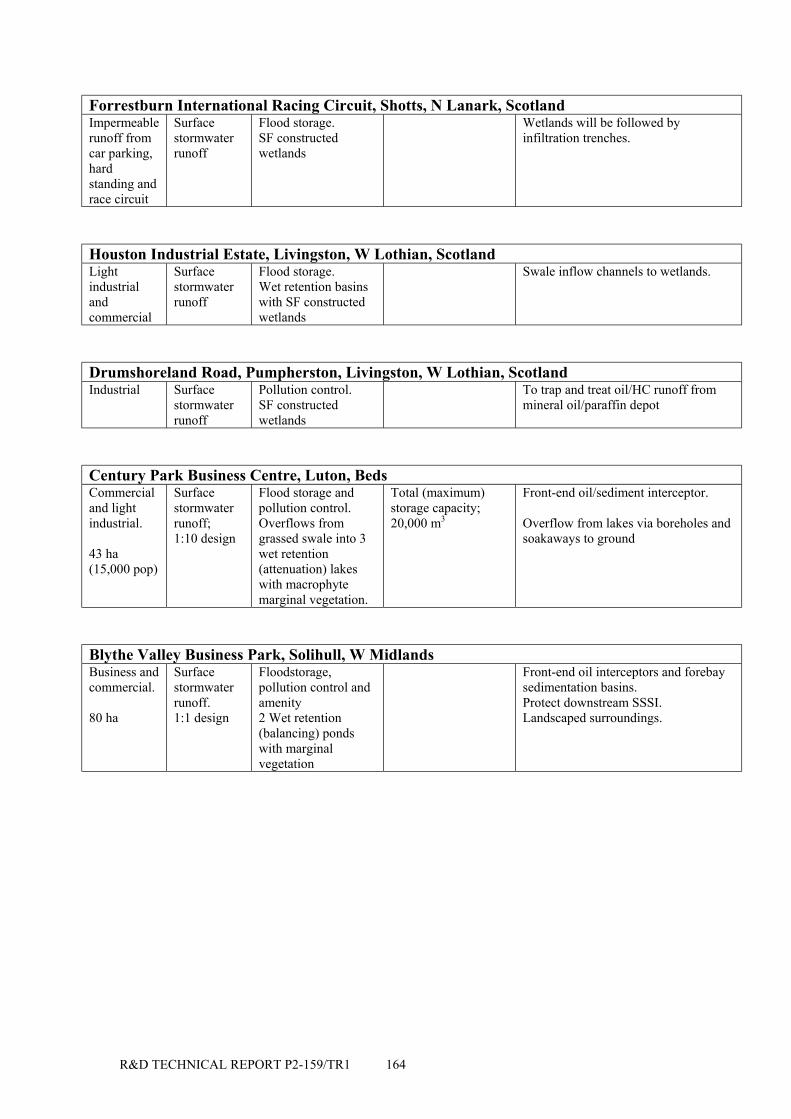
R&D TECHNICAL REPORT P2-159/TR1 164
Forrestburn International Racing Circuit, Shotts, N Lanark, ScotlandImpermeablerunoff fromcar parking,hardstanding andrace circuit
Surfacestormwaterrunoff
Flood storage.SF constructedwetlands
Wetlands will be followed byinfiltration trenches.
Houston Industrial Estate, Livingston, W Lothian, ScotlandLightindustrialandcommercial
Surfacestormwaterrunoff
Flood storage.Wet retention basinswith SF constructedwetlands
Swale inflow channels to wetlands.
Drumshoreland Road, Pumpherston, Livingston, W Lothian, ScotlandIndustrial Surface
stormwaterrunoff
Pollution control.SF constructedwetlands
To trap and treat oil/HC runoff frommineral oil/paraffin depot
Century Park Business Centre, Luton, BedsCommercialand lightindustrial.
43 ha(15,000 pop)
Surfacestormwaterrunoff;1:10 design
Flood storage andpollution control.Overflows fromgrassed swale into 3wet retention(attenuation) lakeswith macrophytemarginal vegetation.
Total (maximum)storage capacity;20,000 m3
Front-end oil/sediment interceptor.
Overflow from lakes via boreholes andsoakaways to ground
Blythe Valley Business Park, Solihull, W MidlandsBusiness andcommercial.
80 ha
Surfacestormwaterrunoff.1:1 design
Floodstorage,pollution control andamenity2 Wet retention(balancing) pondswith marginalvegetation
Front-end oil interceptors and forebaysedimentation basins.Protect downstream SSSI.Landscaped surroundings.

R&D TECHNICAL REPORT P2-159/TR1 165
E3. Highway Catchment Runoff
M11, Stansted Brook, HertsM1110.93 ha
Motorwayrunoff;1:10 design;Consentdischarge;5 m3/s
Flood balancing;Dry detention basinLow marsh at inlet andoutlet
Maximum designstorage capacity;4,900 m3 (Plusadditional 20,000 m3
storage planned
At junction of M11 with Stansted raillink
M25, Junction 9, Leatherhead Interchange, SurreyM254 ha
AADT;140,000
Motorwayrunoff;1:25 design;Maximumdischarge;170 l/s
Flood balancing;2 basins; wetbiofiltration pond withTypha and a smallerwet sedimentationpond
Maximum designstorage capacity:2730 m3 + 500 m3
= 3230 m3
Front-end silt trap.Connection between two basinsthrough outfall headwall which acts asflow control device.
M25, Reigate Hill (Pond No.3, Surrey
M25 Motorwayrunoff;
Flood balancing;Dry detention basinwith wet base fullyoccupied by Typhareed
M25, Barrow Court, Oxted, SurreyM257.29 ha
AADT;120,000
Motorwayrunoff;1:30 designMaximumdischarge;687 l/s
Flow balancing;Dry detention basinwith wet base andmargins occupied bymarsh vegetation andscrub
Maximum designstorage capacity;3,147 m3
Clear build-up of metals in basal pondsediments (Cu 15-310; Zn 85-1110; Cd0.5-74; Pb 60-14762 µg/g)Total Petroleum Hydrocarbons in basalsediment: 12,162-55,892 mg/kg
M23, Burstow, SurreyM23 Motorway
runoffFlood balancing;Combineddetention/retentionbasin.Retention basinoccupied with marshvegetation
Maximum designstorage capacity;2,125 m3
M23, Smallfield (North), SurreyM231.8 ha
Motorwayrunoff;1:60 design
Flood balancing;Dry detention basinwith stream channel inbase occupied bywetland vegetation
Maximum designstorage capacity;3,711 m3
Drawdown time:125 hours
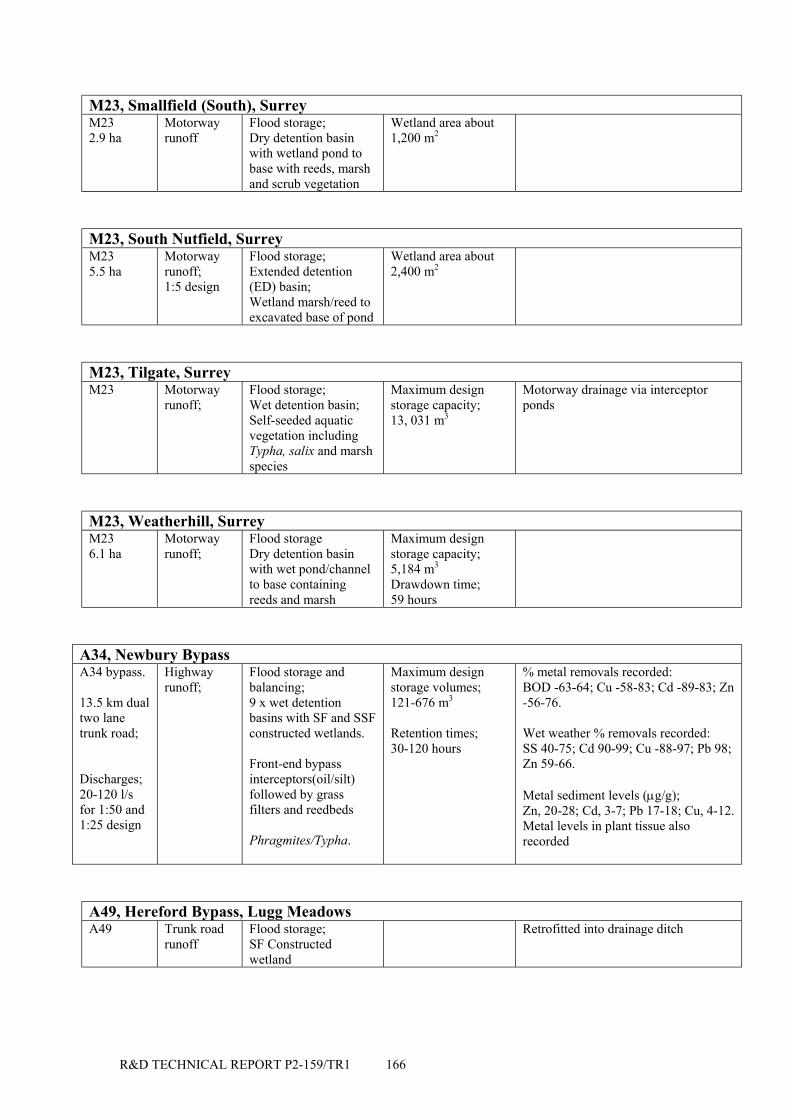
R&D TECHNICAL REPORT P2-159/TR1 166
M23, Smallfield (South), SurreyM232.9 ha
Motorwayrunoff
Flood storage;Dry detention basinwith wetland pond tobase with reeds, marshand scrub vegetation
Wetland area about1,200 m2
M23, South Nutfield, SurreyM235.5 ha
Motorwayrunoff;1:5 design
Flood storage;Extended detention(ED) basin;Wetland marsh/reed toexcavated base of pond
Wetland area about2,400 m2
M23, Tilgate, SurreyM23 Motorway
runoff;Flood storage;Wet detention basin;Self-seeded aquaticvegetation includingTypha, salix and marshspecies
Maximum designstorage capacity;13, 031 m3
Motorway drainage via interceptorponds
M23, Weatherhill, SurreyM236.1 ha
Motorwayrunoff;
Flood storageDry detention basinwith wet pond/channelto base containingreeds and marsh
Maximum designstorage capacity;5,184 m3
Drawdown time;59 hours
A34, Newbury BypassA34 bypass.
13.5 km dualtwo lanetrunk road;
Discharges;20-120 l/sfor 1:50 and1:25 design
Highwayrunoff;
Flood storage andbalancing;9 x wet detentionbasins with SF and SSFconstructed wetlands.
Front-end bypassinterceptors(oil/silt)followed by grassfilters and reedbeds
Phragmites/Typha.
Maximum designstorage volumes;121-676 m3
Retention times;30-120 hours
% metal removals recorded:BOD -63-64; Cu -58-83; Cd -89-83; Zn-56-76.
Wet weather % removals recorded:SS 40-75; Cd 90-99; Cu -88-97; Pb 98;Zn 59-66.
Metal sediment levels (µg/g);Zn, 20-28; Cd, 3-7; Pb 17-18; Cu, 4-12.Metal levels in plant tissue alsorecorded
A49, Hereford Bypass, Lugg MeadowsA49 Trunk road
runoffFlood storage;SF Constructedwetland
Retrofitted into drainage ditch

R&D TECHNICAL REPORT P2-159/TR1 167
A4/A46 Batheaston Bypass,A4/A46junction;3.8 ha
Trunk roadrunoff;1:1 design;76 l/s (up to106 l/s for1:100 storm)
Flood storage;Wet retention withconstructed SF wetlandPhragmites/Typha withScirpus.
Maximum designstorage capacity;320 m3
9 ha wetland area8 hour retention time
Front-end oil bypass interceptor.Special designed oxbow lake.Wetland nature conservation area
Austin Drive, Coventry, Warcs.New roadarea.
Residentialinner cityroad runoff
Pollution control;Swale with wetland tobase near outlet ofchannel.Phragmites, Burr Reed,Rumex etc.
Wetland area:300 m2
To prevent pollution to the CoventryCanal and to avoid £2M capitalexpenditure on conventional drainage.Front-end oil/silt interceptor then intograssed swale before entering wetlandand final discharge into the CoventryCanal.
A1(M)/A59 Junction, Dishforth, Yorks.Walshford-DishforthmotorwaySection.
Motorwayrunoff;
Balancing pond andpollution control;
Constructed wetlandwith Typha
Surrounding landscaping
M5, Junctions 22 and 24, Bridgewater, Somerset.Motorwayrunoff
M6, Tebay, Cumbria.Motorwayrunoff
Balancing pondConstructed wetland
M1, Junction 9, Harpenden, Herts.Motorwayrunoff
Balancing pond
M40, Junction 9, Wendlebury, Oxford.Motorwayrunoff
Balancing pond
A36, Warminster Bypass, Somerset.Highwayrunoff
2 x balancing ponds

R&D TECHNICAL REPORT P2-159/TR1 168
A303/A36, Wylye Junction, Wilts.Highwayrunoff
A5, Fazeley (Two Gates Wilnecote Bypass), Staffs.Highwayrunoff
A1079, Market Weighton, Yorks.Highwayrunoff
M42, Junction 2, Hopwood Park Service StationSurface drainageforcar/HGV parkingand fuellingareas.
9 ha drainagearea.
5l/s/ha designrunoff rate
Hardstandingsurfacerunoff
Series of small in-serieswetland cells followingeither filtration trench orhydrodynamicseparators.
Typha/Phragmiteswith other plants
10mm first-flushcapture.
48 hour "filtering"period
95 - 99% retention for heavymetals, TSS and BOD for HGVparking area.
79 - 83% retention for heavy metalsfor fuelling/car park areas with 89%BOD and 97% TSS.
High nature conservation value.
M40, Junction 8, Oxford Service StationSurface drainagefor car/HGVparking andfuelling areas
Hardstandingsurfacerunoff
Surface runoff from carpark to 4 in-serieswetland cells dischargingto final balancing pond.
Surface runoff fromHGV park to asettlement pond andwetland

R&D TECHNICAL REPORT P2-159/TR1 169
E4. Airport Runoff
Stansted Airport (BAA), HertsPond(B),StartHill122 ha
Airport runoff;1:100 design;1.02 m3/sdesign flow
Flow balancing;Wet retention basin;Marginal macrophytevegetation
Maximum designstorage capacity;44,580 m3
Front-end oil separator
Pond(C),TakeleyStreet488 ha
Airport runoff;1:100 design;1.36 m3/sdesign flow
Flow balancing andde-cing separation;Wet retention basins;Marginal vegetation
Maximum designstorage capacity;123, 500 m3
Retention basin in 3 compartments forde-icant separation; 10 year designflow for diversion is 1.723 m3/s
Heathrow Airport (BAA), Eastern Balancing Reservoir, Hatton369 ha Airport runoff; Flow balancing and
fire-fighting aeration;Wet retention basin;Self-seeded marginalmacrophytes
Surface area;227,100 m2
Old gravel pits
Heathrow Airport (BAA), Southern Balancing Reservoir, Hatton354 ha Airport runoff Flow balancing and
fire-fighting aeration;Wet retention basin;Self-seeded marginalmacrophytes
Maximum designstorage capacity;962,000 m3
Surface area;370,000 m2
Old gravel pits
Heathrow Airport (BAA), Experimental Reedbeds245 ha
8.6 m3/day
Airport runoff Pollution control (de-icing removal);SF constructedwetlandSSF constructedwetland(Typha/Phragmites)Rafted lagoon
Retention time:16 hours
Experimental reedbed systems.
Elevated BOD inflows: 270 mg/.Glycol inflows: 1180-6326 mg/l.
% Removals recorded: Glycol (SFsystem), 40-60%; (SSF system), 26-99%;BOD (SF system), 18%; (SSF system)22%;Faecal Coli (SF system), 97%; (SSFsystem), 98%.
Teeside Airport, Stockton, ClevelandAirport runoff Flow balancing, de-
icing removal andfoam/detergentremoval.VF constructedwetland
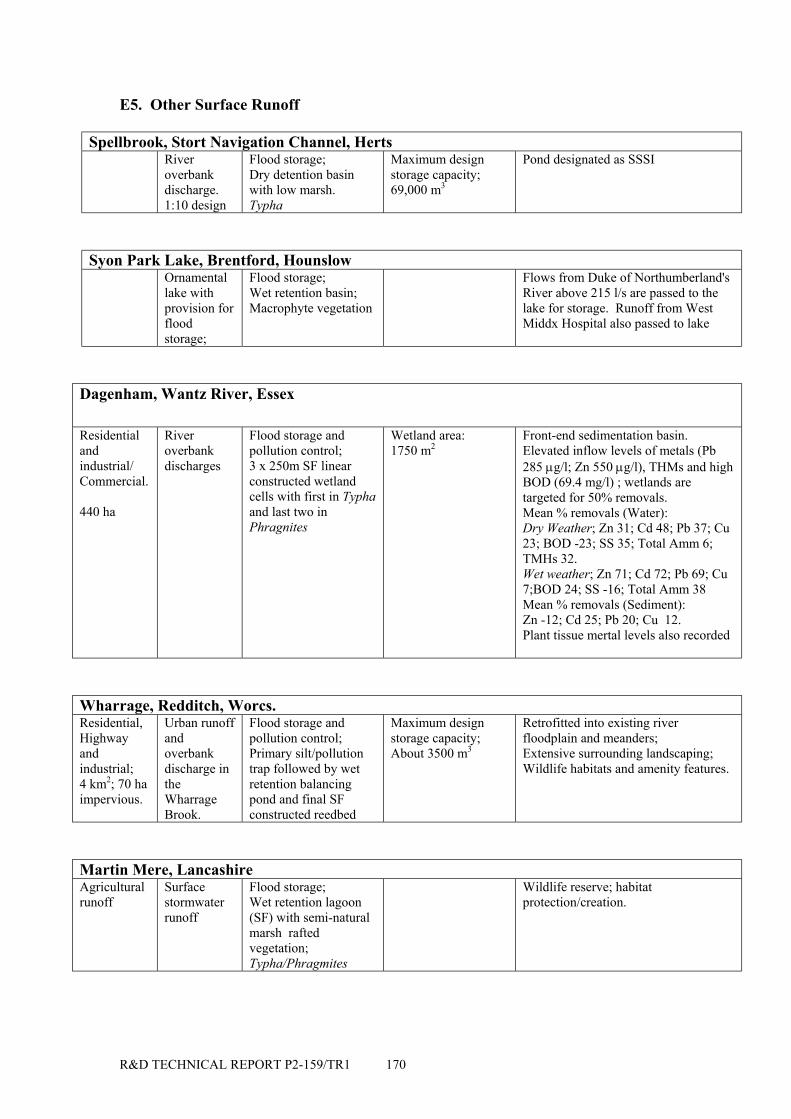
R&D TECHNICAL REPORT P2-159/TR1 170
E5. Other Surface Runoff
Spellbrook, Stort Navigation Channel, HertsRiveroverbankdischarge.1:10 design
Flood storage;Dry detention basinwith low marsh.Typha
Maximum designstorage capacity;69,000 m3
Pond designated as SSSI
Syon Park Lake, Brentford, HounslowOrnamentallake withprovision forfloodstorage;
Flood storage;Wet retention basin;Macrophyte vegetation
Flows from Duke of Northumberland'sRiver above 215 l/s are passed to thelake for storage. Runoff from WestMiddx Hospital also passed to lake
Dagenham, Wantz River, Essex
Residentialandindustrial/Commercial.
440 ha
Riveroverbankdischarges
Flood storage andpollution control;3 x 250m SF linearconstructed wetlandcells with first in Typhaand last two inPhragnites
Wetland area:1750 m2
Front-end sedimentation basin.Elevated inflow levels of metals (Pb285 µg/l; Zn 550 µg/l), THMs and highBOD (69.4 mg/l) ; wetlands aretargeted for 50% removals.Mean % removals (Water):Dry Weather; Zn 31; Cd 48; Pb 37; Cu23; BOD -23; SS 35; Total Amm 6;TMHs 32.Wet weather; Zn 71; Cd 72; Pb 69; Cu7;BOD 24; SS -16; Total Amm 38Mean % removals (Sediment):Zn -12; Cd 25; Pb 20; Cu 12.Plant tissue mertal levels also recorded
Wharrage, Redditch, Worcs.Residential,Highwayandindustrial;4 km2; 70 haimpervious.
Urban runoffandoverbankdischarge intheWharrageBrook.
Flood storage andpollution control;Primary silt/pollutiontrap followed by wetretention balancingpond and final SFconstructed reedbed
Maximum designstorage capacity;About 3500 m3
Retrofitted into existing riverfloodplain and meanders;Extensive surrounding landscaping;Wildlife habitats and amenity features.
Martin Mere, LancashireAgriculturalrunoff
Surfacestormwaterrunoff
Flood storage;Wet retention lagoon(SF) with semi-naturalmarsh raftedvegetation;Typha/Phragmites
Wildlife reserve; habitatprotection/creation.

R&D TECHNICAL REPORT P2-159/TR1 171
South Finger Lake, Slimbridge, Gloucs.Agriculturalandresidentialrunoff;2000 m3/day
Surfacestormwaterrunoff
Flood storage;Wet retention lagoonwith SF constructedwetlands
Wetland area;11,900 m2
Wildlife reserve; habitat protection
Great Linford Pit, Milton KeynesResidential,commercialandindustrial.
Urban runoff Flood storage;Wet retention pond;Marginal macrophytevegetation.
Disused quarry on flood plain of upperOuzel.
Welsh Harp Basin, Brent, N LondonResidential,commercial,industrialandhighways.
5.2 km2
Urban runoffand stormoverflows;60% ofannual riverflow volumefromimpervioussurfaces.
Flood storage;Wet retention basin;Semi-naturalmacrophyte vegetationat inlet;Typha/Phragmites andPhalaris
Designated SSSI and RSPB naturereserve;Recreation and amenity includingsailing, canoeing, fishing;Mean % Removals in totalconcentrations: SS 97%; SOD 61%;Alkanes 46% (water) 68% (sediment);PAH 69% (water) 73% (sediment);Faecal coliforms 85%59% reduction in PAH in A.aquaticustissue;Improvement in BMWP score from 5to 50;Mean metal levels (mg/kg) at inlet inwater and sediment: Cu 59.6, 219.8; Pb36.2, 841; Zn 136.6, 778.9; Cd 8.9,12.5.Metal levels also recorded in planttissue.
Stoneyfield Park, W Hendon, N LondonResidential,motorwayand generalurban
Urbanstormwaterrunoff
Ornamental floodstorage;Marginal macrophytevegetation;Typha
Mean metal levels (mg/kg) recorded inwater and sediment: Cu 39.4, 119.9;Pb27.4, 696.2; Zn 77.5, 506.0; Cd 6.0,9.7.Metal levels also recorded in planttissues.
Willen Lake, Milton KeynesResidentialandHighway;1:200 design
Urbansurfacerunoff
Flood balancing;Marginal macrophytevegetation.
Phragmites/Typha
Surface area; 87 ha3 ha marginalmacrophytes
Measured inflowconcentrations(mg/l) :Cl 80-159; Po4 0.004-0.257; Zn 0.01-0.02; Pb 0.12-0.26; Cu 0.01.Faecal Colifoms; >200 MPN/100ml
Extensive surrounding landscaping

R&D TECHNICAL REPORT P2-159/TR1 172
River Skerne, Haughton, Darlington, Co DurhamUrban andagriculturalrunoff;Riverrestorationin urbanflood plain;Suburbanhousing andoldindustrialestate;
250 km2
4700 pop inlocal floodplain
Surfacerunoff;urban andagricultural.
Annualmean flow;1.61 m3/s
Inclusion of 3 wetlandsin "cut-off" meanderswithin upgraded floodplain;Use as overbanktreatment for floodrunoff and fortreatment of inflowurban runoff intorestored 2 km section.
2 km river reach indegraded urban fringeopen space
Pollutant inflow values (range) toreach: SS 1-92; BOD 1-10; Total N 4-20; Phenol 0.02-0.26 mg/l.BMWP score; 41-68
Tooting Common Lake, Wandsworth, S London.Urbanresidential;
89 ha;200 m3/day
Surfacerunoff fromsurroundingurbancommonland
2 SSF constructedwetland reedbeds;
Phragmites andCarex/Iris/Juncus andTypha wetlands.
Introduced as "bufferzone" between shoreand open water.
Surface area;7608 m2
Ornamental lake in disused gravel pit;Eutrophication; Total P 330 µg/l; withtoxic blooms;
Target P levels; 35-100 µg/l andOxygen > 4 mg/l
Mean % Removals: Chlorophyll a 16;Ammonia -9; Nitrate 27;Orthophosphate 18; Bacteria 70-90.
Maghull Brook, Lydiate, S Lancs.Residentialand urbanrunoff;3 km2
65%urbanised;1:50 design
Surfacestormwaterrunoff
Overbank and marginaldischarges;Marginal aquaticvegetation to restoredbermed edges ofchannel;Treat overbank andinflowing urbandischarges
Retrofitting of widenedchannel and marginalreedbeds
Illegal connections from localhousing causing water qualityproblems.
Marginal landscaping to edge ofwetlands to provide a wildlifecorridor
Mount Farm Lake, Milton KeynesResidential,highway andindustrial;
Urbansurfacerunoff
Flood balancing;Marginal andsubmerged macrophytevegetation.
Phragmites, Typha,Juncus with Nymphea
Surface area; 95 ha Front-end oil interceptor.Measured inflow concentrations(mg/l):Cl 300-3000; Po4 0.07-0.12; Zn 0.01-0.06; Pb 0.03-0.02.Faecal Coliforms;>10,000MPN/100mlFish kills recorded

R&D TECHNICAL REPORT P2-159/TR1 173
Caldecotte Lake, Milton KeynesResidentialandhighway;
1:50 design
Urbansurfacerunoff
Flood balancing;Marginal macrophytevegetation.
Typha, Juncus withElodea
Surface area; 44 ha Front-end oil interceptor.Measured inflow concentration(mg/l):Cl 56 mg/l; Po4 0.001-0.42; Pb 0.01-0.2.
Island refuges.
Rye House Marsh, Rye Meads, Roydon, Herts.Overbankriverdischargesand treatedsewage.
5 ha
Surfacerunoff;urban andagricultural;
Treatedsewageeffluent;90Ml/day
Wildlife habitat
Compartmentalisedwetland cells.
Typha/Phrgamites andGlyceria marsh
RSPB nature reserve;About 15,000 visitors per annum.
Measured inflow concentrations:BOD 2-6; Po4 3.5-11.0 mg/l;Zn 14-21; Cu 5-11 µg/l.
Potteric Carr Reserve, West Bessacarr, DoncasterSurfacerunoff.
1261 ha;1:50 design
Surfacerunoff;urban,agriculturaland treatedeffluent;derelictindustrialsite.
Flood storage.
Typha/Phragmiteswetland with carrmarsh
Wetland/carr area;140 ha
Maximum design storagecapacity;230,000 m3
Wildlife habitat; designated naturereserve.
Camley Street Nature Park, Kings Cross, N LondonUrban, oldindustrialsite
Canal(RegentsCanal) feedwater.
Marginalmacrophytereedbedgrading intomarsh
Canal overspill water Local Nature Reserve;Wildlife habitat; conservation andamenity;Educational facility.
Newhall Valley, Walmley, W MidlandsResidentialand roadrunoff.
600 houses
Surfacerunoff toPlants Brook
Stormwater attenuationschemes.
Rough wet meadowsand wetlands withinfloodplain.
Alder/willow carr
SLINC designation.
SUDS options selected for front-end structures include infiltrationtrenches and swales to rechargewetland during high flows.

R&D TECHNICAL REPORT P2-159/TR1 174
List of Acronyms
AMP Asset Management Plan
ASPT Average Score Per Taxon
AONB Area of Outstanding Natural Beauty
BAP Biodiversity Action Plan
BMWP Biological Monitoring Working Party
BOD Biochemical Oxygen Demand
BMP Best Management Practice
BPEO Best Practicable Environmental Option
CESM3 Civil Engineering Standard Method of Measurement
CIRIA Construction Industry Research & Information Association
COD Chemical Oxygen Demand
CSO Combined Sewer Overflow
CW Constructed Wetland
DEFRA Department of Environment, Food and Rural Affairs
DETR Department of Environment, Transport and the Regions
DO Dissolved Oxygen
DTLR Department of Transport, Local Government and Regions
ED Extended Detention Basin
EMC Event Mean Concentration
EIA Environmental Impact Analysis
EPSRC Engineering and Physical Sciences Research Council
EQI Environmental Quality Index
EQS Environmental Quality Standard
FWR Foundation for Water Research

R&D TECHNICAL REPORT P2-159/TR1 175
GQA General Quality Assessment
HLR Hydraulic Loading Rate
HRT Hydraulic Retention Time
IPPC Integrated Pollution Prevention and Control
IRBM Integrated River Basin Management
LCP Local Contribution Plans
LEAP Local Environment Agency Plan
LNR Local Nature Reserve
MIPS Material Intensity per Service Unit
MTBE Methyl Tertiary Butyl Ether
NGO Non-Government Organisation
NNR National Nature Reserve
NOEC No Observable Effect Concentration
NWC National Water Council
O&M Operation & Maintenance
OFWAT Office of Water Services
PAH Poly-Aromatic Hydrocarbons
PAN Planning Advice Note
PPGs Pollution Prevention Guidelines
PPG 25 Planning Policy Guidance Note 25 (DTLR)
RBD River Basin District
RBMP River Basin Management Plan
RE River Ecosystem
RHS River Habitat Survey
RIVPACS River Invertebrate Prediction and Classification System

R&D TECHNICAL REPORT P2-159/TR1 176
RSPB Royal Society for the Protection of Birds
RQO River Quality Objective
SEPA Scottish Environment Protection Agency
SS Suspended Solids
SF Surface Flow Constructed Wetland System
SSF Sub-surface Flow Constructed Wetland System
SLINC Site of Local Importance for Nature Conservation
SPA Special Protected Area
SSSI Site of Special Scientific Interest
SuDS Sustainable Drainage Systems
SUDS Sustainable Urban Drainage Systems (as used in Scotland)
SWO Surface Water Outfall
TOC Total Organic Carbon
TPH Total Petroleum Hydrocarbons
TSS Total Suspended Solids
UDP Unitary Development Plan
USEPA United States Environmental Protection Agency
UKWIR United Kingdom Water Industry Research
VF Vertical Flow Constructed Wetland System
WFD Water Framework Directive
WQO Water Quality Objectives
WWAR Wetland Area to Watershed Area Ratio
R&D TECHNICAL REPORT P2-159/TR1 177
Glossary
Aspect Ratio Length to width ratio of a Constructed Wetland
Biochemical oxygenDemand (BOD)
The amount of oxygen consumed by thedegradation of organic materials
Bioaccumulation The uptake or accumulation of a compound by aliving organisms as a result of exposure to thecompound
Bioavailability The extent by which an ion or compound is freelyavailable for uptake by living organisms
Biomass The mass of animals and plants within a habitatmeasured at a given time
Chemical oxygen demand(COD)
The amount of oxygen consumed by chemicaloxidation of organic material
Chlorosis Pale coloration in plants leaves caused by a failureof chlorophyll synthesis
Consent standard Licence to discharge wastewater at or better than astandard set by a regulatory authority. UK WaterCompanies usually have to comply withBOD/TSS/amm-N standards, and possibly withadditional nitrate and bacteria standards
Constructed wetland Artificial wetland engineered to achieve biologicaland physiochemical improvement in theenvironment
Derogation
Emergent macrophytes
Temporarily deferred designation
Aquatic plants rooted in the support medium withmuch of their green parts above the surface of thewater
Heavy metal Metalliferous elements and their derivativesincluding zinc, lead, copper, iron, mercury,cadmium, cobalt, lead nickel and aluminium
Hydraulic conductivity The ability of support medium to conduct fluidthrough the interstices between particles whichmake up the medium
Hydrophyte Plant which grows in areas with periodic orcontinuous flooding
R&D TECHNICAL REPORT P2-159/TR1 178
Micro-organism An organism that is not visible with the naked eye
Nitrification A two-stage process. Ammonia is first convertedto nitrite and then from nitrite to nitrate
Denitrification A microbial process that reduces nitrate to nitriteand nitrite to nitrogen gas
pH Scale based on hydrogen ion concentration andranging from highly acid (1) to highly alkaline(14)
Productivity The rate of production of biomass
Rhizosphere Zone of soil immediately around roots andrhizomes and modified by them
Rhizomes
Rip-rap zone
Below ground stem of macrophytes
Area of stones placed directly on the ground toprotect locations prone to soil erosion, the stonescan vary in size but are usually larger than 100mm
Root zone The area around the growing tips of the roots of aplant
Support medium Gravel, soil or other material used as the matrixwithin the constructed wetland
Suspended solids (SS) Dry weight per volume of matter retained by afilter
Total suspended solids(TSS)
Material remaining in a sample when all the waterhas been evaporated