Embed Size (px)
Citation preview

CONSTRUCTED WETLANDS FOR MUNICIPAL WASTEWATER TREATMENT
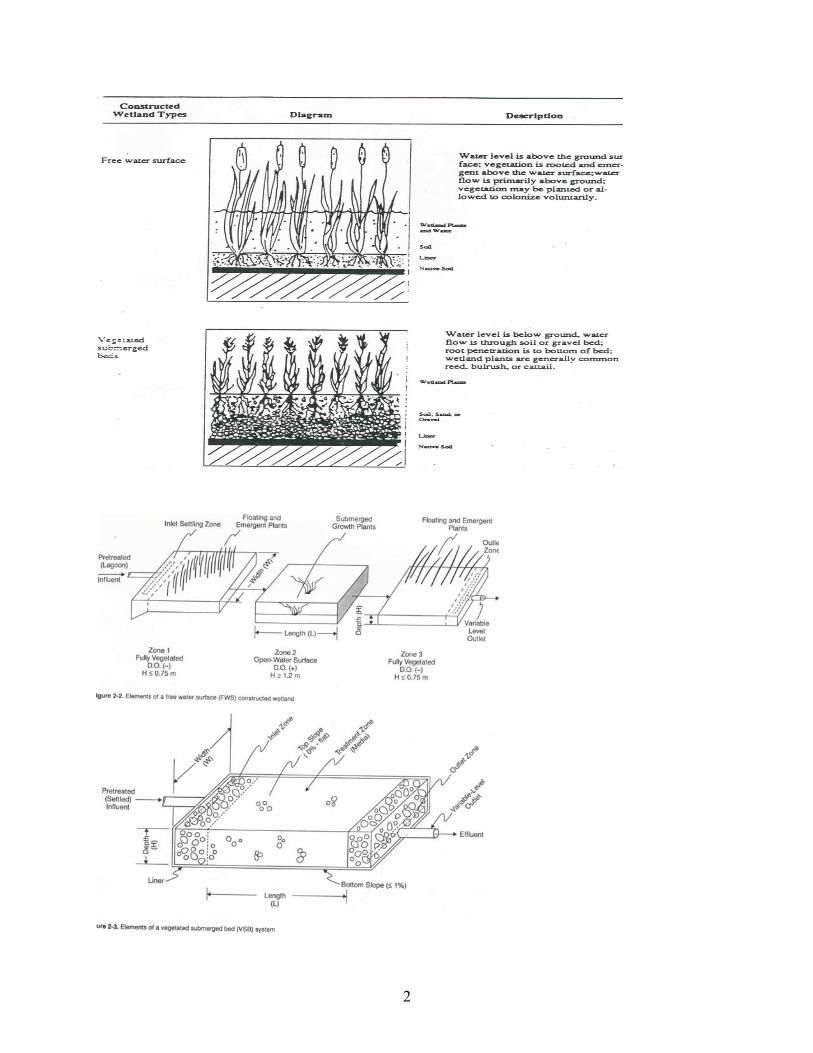
CONCEPTS AND PROCESSES TERMINOLOGY What is a Wetland? Areas inundated or saturated by surface or ground water at a frequency and duration to support hydrophytic vegetation Natural vs. “Constructed”, “Created,” and “Restored” Wetlands Natural wetlands—Perform a variety of ecological and social functions, including water quality improvement; flood water storage and regulation; provision of biological production, biodiversity, and wildlife habitat; and community open space Constructed wetlands—Built in an upland area (without natural wetland hydrology, hydric soils, and hydrophytic vegetation) principally or entirely for effluent or runoff treatment Created wetland—Built in an upland area for mitigation to replace a lost natural wetland and its multiple functions Restored wetland—Natural wetland subject to actions to recover some or all of its original size, functions, or both Free Water Surface Vs. Vegetated Submerged Bed Constructed Wetlands Description (see diagrams): Free water surface (FWS) type (also known as surface flow, SF)—Configuration similar to natural wetland, with soil bed, emergent vegetation, and water exposed to atmosphere Vegetated submerged bed (VSB) type (also known as subsurface flow, SSF)—Bed of media (e.g., stones, gravel, sand, soil), often linear, planted with wetland plants but with water level below media surface
1
2
Relative advantages and disadvantages: FWS—
Can be integrated better in landscapes, More secondary benefits (e.g., wildlife habitat, but this can be a disadvantage if excessive
contamination exposure results), Cheaper to build and operate, and Shorter development period to reach full performance
VSB—
Not attractive to wildlife, Reduced odor and insect problems, More isolated from humans, Greater flexibility in using land and therefore overall land requirement can be less, and Greater cold tolerance
Related Technologies Floating macrophyte (e.g., water hyacinth, duckweed) systems—Treatment partially by wetland processes and partly by mechanized components to remove macrophytes before discharge and dispose of them Overland flow systems—Treatment by terrestrial vegetation and non-hydric soil as wastewater sheet flows over a broad surface SUMMARY OF CONSTRUCTED WETLAND EXPERIENCE Use recorded as far back as 1912 in Europe Research began in Europe in 1950s, US in late 1960s North American Wetlands for Water Quality Treatment Database (USEPA 2000)—
245 locations, 800 individual wetland cells 205 constructed, 38 natural (all before 1991) wetlands (2 unclassified) 138 of constructed are FWS type, 49 VSB type (others combination or not classified)
3
Median sizes: FWS 1.0 ha, VSB 0.5 ha (most smaller) Majority <0.25 mgd, 82% < 1 mgd 159 treat municipal wastewater (almost half polish lagoon effluent, 36% secondary or
advanced secondary, only 4 tertiary) Other effluents treated include agricultural (58), industrial (13), and stormwater (6);
however, the database is surely missing many stormwater and mining effluent treatments and probably others
Largest number in SD, FL, and several other southern states; not unusual in cold climates
and function for BOD and TSS reduction even under ice; 1 listed in WA VSB favored in Europe POLLUTANT REMOVAL MECHANISMS See tables: Summary of Mechanisms and Summary of Controllable Features That Promote Pollution Control Some qualifications: Unless effluent is low organic strength, vegetated zones tend to be anaerobic, because oxygen released by hydrophytic plant roots is insignificant compared to oxygen demand.
Therefore, nitrification is unlikely in VSB wetlands and highly vegetated zones of FWS wetlands, but can be accomplished in open-water or sheet-flow zones that are well aerated from the atmosphere.
Phosphorus removal from municipal wastewater and other high phosphorus effluents is limited, because seasonal plant uptake is relatively small compared to loading and release occurs with senescence. Also, soil-binding sites become saturated relatively rapidly. Therefore, mechanisms do not effectively deal with dissolved P, and much reduction is possible only if most is in the solid state.
4

SUMMARY OF MECHANISMS
5
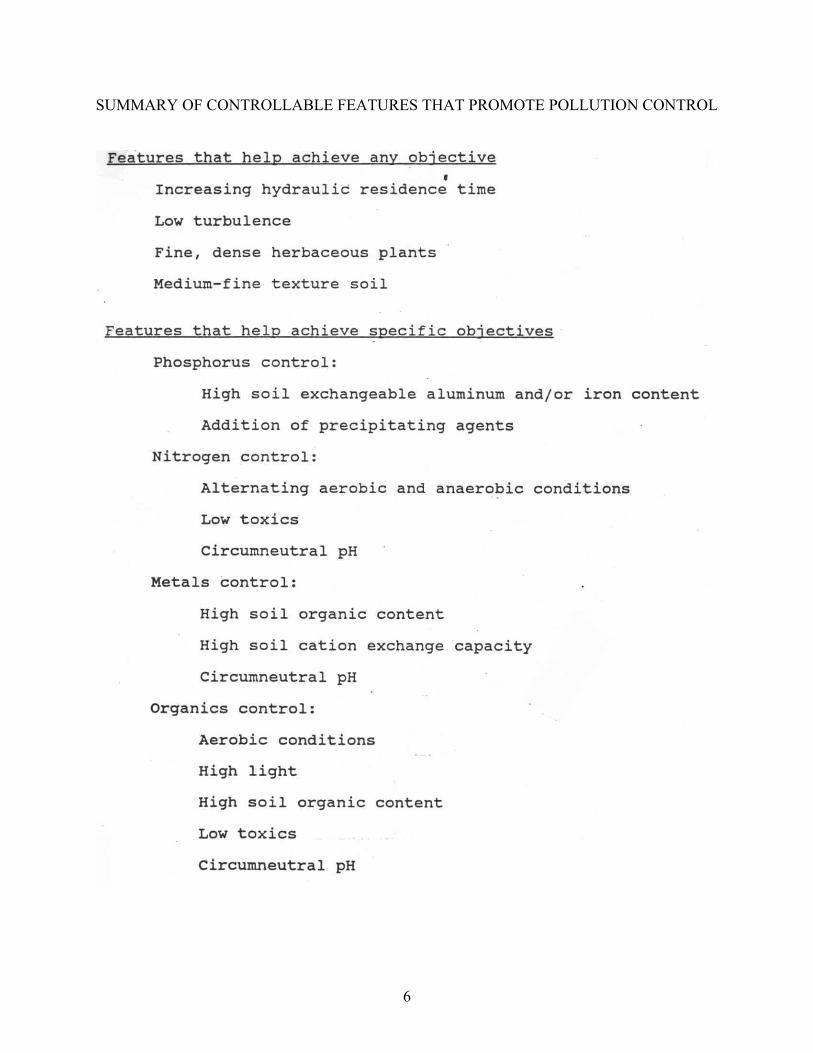
SUMMARY OF CONTROLLABLE FEATURES THAT PROMOTE POLLUTION CONTROL
6
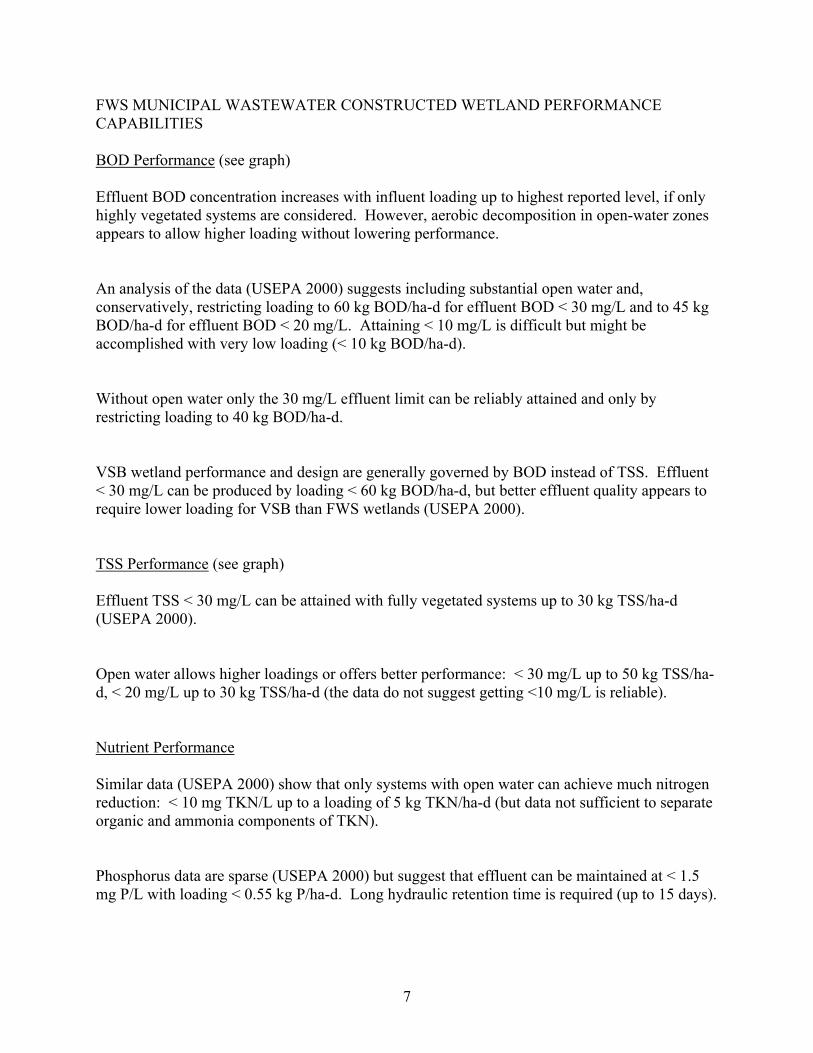
FWS MUNICIPAL WASTEWATER CONSTRUCTED WETLAND PERFORMANCE CAPABILITIES BOD Performance (see graph) Effluent BOD concentration increases with influent loading up to highest reported level, if only highly vegetated systems are considered. However, aerobic decomposition in open-water zones appears to allow higher loading without lowering performance. An analysis of the data (USEPA 2000) suggests including substantial open water and, conservatively, restricting loading to 60 kg BOD/ha-d for effluent BOD < 30 mg/L and to 45 kg BOD/ha-d for effluent BOD < 20 mg/L. Attaining < 10 mg/L is difficult but might be accomplished with very low loading (< 10 kg BOD/ha-d). Without open water only the 30 mg/L effluent limit can be reliably attained and only by restricting loading to 40 kg BOD/ha-d. VSB wetland performance and design are generally governed by BOD instead of TSS. Effluent < 30 mg/L can be produced by loading < 60 kg BOD/ha-d, but better effluent quality appears to require lower loading for VSB than FWS wetlands (USEPA 2000). TSS Performance (see graph) Effluent TSS < 30 mg/L can be attained with fully vegetated systems up to 30 kg TSS/ha-d (USEPA 2000). Open water allows higher loadings or offers better performance: < 30 mg/L up to 50 kg TSS/ha-d, < 20 mg/L up to 30 kg TSS/ha-d (the data do not suggest getting <10 mg/L is reliable). Nutrient Performance Similar data (USEPA 2000) show that only systems with open water can achieve much nitrogen reduction: < 10 mg TKN/L up to a loading of 5 kg TKN/ha-d (but data not sufficient to separate organic and ammonia components of TKN). Phosphorus data are sparse (USEPA 2000) but suggest that effluent can be maintained at < 1.5 mg P/L with loading < 0.55 kg P/ha-d. Long hydraulic retention time is required (up to 15 days).
7
8 8

Other Performance Data Fecal coliform reports are even scarcer but suggest reduction of two orders of magnitude is possible. Effluents still usually need disinfection. Most metals associate to one degree or another with the solids and are removed with them. Removals of 40-80% of the influent metals are reported. POLICY AND PERMITTING ISSUES Under the Clean Water Act natural wetlands cannot be used for the conveyance or treatment of wastewater. Federal interagency guidelines govern the separation of natural and constructed treatment wetlands; treatment wetlands will:
Not be allowed to be constructed in natural wetlands or other waters of the US; Not be allowed to mitigate for natural wetland losses; Have same liner and monitoring requirements as treatment lagoons; Not be considered waters of the US if continuously operated as treatment systems (abandonment can result in classification as waters of the US under certain conditions); Be permitted to be built for benefits other than treatment.
Treated wastewater can be used to restore degraded natural wetlands if the water meets water quality standards and the discharge would help restore a historic condition and yield a net environmental benefit. Public acceptance requires designing, building, and maintaining to be a community asset. Research is lacking on existence or lack of harm to attracted wildlife, but longer experience with treatment lagoons suggests a lack of risk. If the effluent has relatively high concentrations of toxicants, a VSB wetland or a FWS design not attractive to wildlife should be used.
9
COSTS
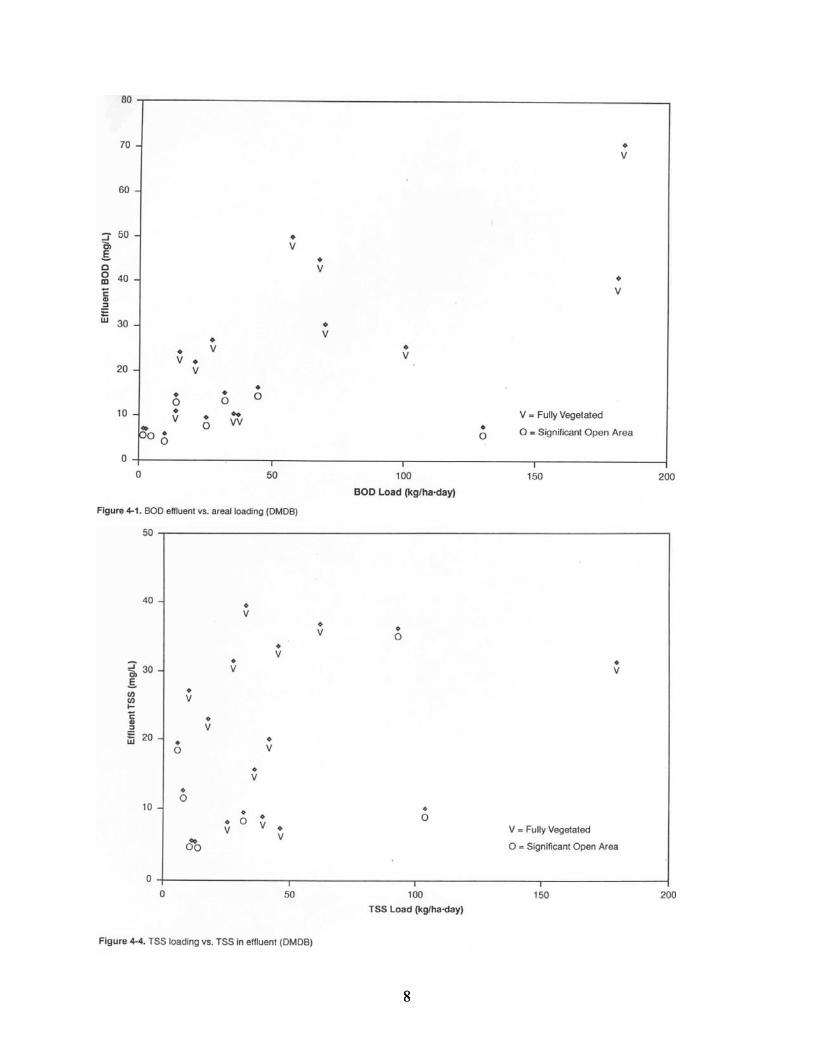
he capital cost table shows that VSB wetlands are about 60% more expensive to build than M
r VSB systems.
TFWS wetlands, but a smaller land requirement could mitigate some of the extra expense. O&costs are variable but appear to be higher overall fo
10
FWS WETLAND DESIGN DESIGN BASIS Configurations Most emphasis now is on treating primary effluent to secondary or better standards in small communities. They can be part of a secondary treatment train to save investment in more mechanized components. Constructed wetlands can and have served to polish secondary effluents. As discussed earlier, polishing to meet nutrient control objectives is difficult; trace metal reduction is more easily achieved. Treating raw municipal wastewater in constructed wetlands is not recommended. Pretreatment A combination of primary settling and aeration seems to be best. Versions used include:
Partial-mix lagoon—Mechanical surface aerators mix contents only enough to prevent odors and anaerobic conditions; settling occurs in quiescent areas and a separate settling basin is not needed (Stanwood design) Complete-mix aeration basin (typically, 12-24 hours residence time) followed by settling (greater cost and energy requirements); and Primary settling followed by short aeration period.
A facultative (non-aerated) lagoon is not recommended because of odors, algal production, and cost. If metal concentrations are excessive, source reduction and/or industrial waste pretreatment should be instituted.
11
Treatment Objectives
objective will likely be to treat primary effluent to given secondary standards g/L of BOD and TSS in effluent). The objectives should be numerically stated. Wastewater
nd other circumstances will determine which of the two objectives controls zing (see below).
ould be (again, they should be numerically stated):
Nitrogen and/or phosphorus reduction either in combination with BOD and TSS removal e
Tertiary metals reduction.
WS WETLAND LAYOUT AND SIZING
ents
The most common(mcharacteristics asi Other possible objectives w
in secondary treatment or in a tertiary polishing step (as pointed out earlier, this objectivis difficult to meet); and
F Cell Arrangem
more than one parallel track. Different cell types increase the opportunity for different mechanisms to operateallowin For secfrom in vegetated cell (for flocculation, filtering and surface processes), (2) an open-water zone deep enough to hold vegetation cover to <50% (for aeratio d cell (for denitrification and capture
f algae). Each cell should be sized for 2 days of retention time at maximum monthly flow.
possible series arrangements include an emergent wetland marsh—open-water pond—eadow (for aeration, nitrification, and soil sorption) or marsh—meadow (the Stanwood design).
e solids should be kept down by pretreatment; but if they are relatively high, an inlet settling zone should be provided upstream of the first principal treatment cell. It should have a 1-day hydraulic residence time at average monthly flow and a 1-meter depth.
The strong consensus is to have multiple cells in series, with the arrangement replicated in
and reduce flow short circuiting. Parallel tracks give operating flexibility, for example g cell rotation in low hydraulic loading periods and a chance to do maintenance.
ondary treatment objectives USEPA (2000) recommends two tracks each having, in series fluent to effluent end: (1) a heavily (~100%)
n and nitrification), and (3) another heavily vegetateo Otherm The influent settleabl
12
Piping Arrangements While piping networks can increase operating flexibility, they are generally kept simple in constructed wetlands to save costs and need for operator attention. Possibilities include piping to allow step feeds at the head end or multiple points in more than
ne cell and to accomplish effluent recirculation to the inlet or other internal location. Recycling gen near the inlet,
lthough these factors have not been found to be important in achieving performance goals. Alternaperiodslow flow in summer creates faster travel through the wetland than conducive to nitrification of ammonia. Recycling can restore sufficient hydraulic residence time.
nother possibility is to store wastewater during the winter and feed it through the wetland in armer weather, an option that has been used in some cold-weather locations and even Arcata,
ocan decrease influent concentrations by dilution and can increase dissolved oxya
tively, recirculation can compensate for flows that are too low for good operations in dry . As one example, sometimes the combination of reduced depth for better aeration and
AwCA. Possible Sizing Procedures Constructed wetlands have been designed according to a number of different types of criteria, sometimes used in combination as checks. Possibilities include:
A first-order BOD removal equation (size is a function of a BOD decay reaction rate
A specified loading rate (kg/ha-d), in terms of BOD, TSS, TKN, etc.; and
constant, which itself is a function of temperature, and logarithmic concentration change); A specified hydraulic loading rate (cm/d over the wetland surface area; 2-5 cm/d has beenrecommended);
A specified hydraulic residence time.
Recommended Sizing Procedure for TSS and BOD Treatment Objectives USEPA (2000) recommended a combination of the third and fourth methods presented above; its steps are:
13

1. Calculate total wetland surface area for treatment objectives and associated area loading rates (ALR, kg/ha-d); perform calculation for both TSS and BOD, in each
Aw = (Qo * Co)/ALR Co = Inflow concentration (mg/L) of TSS or BOD
2. Set cell depths (h, meters): Operating depth of 0.6-0.9 m recommended for fully vegetated cells, 1.2-1.5 m for open water cell.
especially high peak inflows or if extra space for solids build up desired to reduce maintenance frequency)
cal hydraulic residence time (HRT) overall for Qo = Qave and Qmax; allocate by cells:
ell ommended)
e Aw.
days maximum at Qave to prevent algal blooms.
Allocate remaining area (Aw – A2) equally to the vegetated cells (A1 and A3).
Note: The total area needed for the wetland, including berms, buffers, and wetlands and vice
versa). Divide cell areas evenly between two parallel tracks.
te: Checking if hydrology affects design would add another level of design care. Precipitation directly on the wetland surface increases flow rate but also dilutes loading. With this compensation and the relatively conservative design basis employed,
case for both average annual design inflow rate (Qo = Qave, m3/d) and maximum monthly inflow rate (Qo = Qmax, m3/d):
ALR = 60 kg BOD/ha-d for effluent BOD < 30 mg/L; 45 kg BOD/ha-d for effluent BOD < 20 mg/L; 10 kg BOD/ha-d for effluent BOD < 10 mg/L ALR = 50 kg TSS/ha-d for effluent TSS < 30 mg/L; 30 kg TSS/ha-d for effluent TSS < 20 mg/L
Add at least 0.6 m freeboard above peak flow operating depth (additional if
3. Compute theoreti
HRT = (Aw * h * ε)/Qo
ε = Fraction of volume through which water can flow (0.65 in fully, densely vegetated cells, 0.75 with moderate vegetation density, 1.0 in open water crec
HRT in each cell should be 2 days minimum at Qmax (6 days total); if not, recalculat
Calculate area of open water cell (A2) to limit HRT in that cell to 3
setbacks would be 25-40% larger (lower in range for larger
No
14

precipitation should not affect size. Groundwater recharge or discharge is not a factoe constructed wetlands are lined if soils are not expected to isolate them from
undwater. Maximum open water HRT could be checked at maximum potranspiration to ensure that algae do n
r, sincgroeva ot become a summer problem. It is
commended that 75% of the pan evaporation rate be used for wetlands. Maximum monthl Was the 75% adjustment) to 0.0035 m/d. To check, subtract ET loss = (0.0035 m/d * Aw) from Q
Design Examp
rey evaporation in Western hington is 5.65 inches in July, which converts (with
ave (with consistent units) and recalculate open water HRT.
le Influent conditions:
Qave 10 mgd (37840 m /d) Partial-BOD/L
Treatm d area loading rates): 20 mg/L for BOD and TSS (45 kg BOD/ha-d and 30 kg T / Step 1: Aw = (
BOD— =
At Qmax, Aw = (37840 m3/d * 40 mg/L * 1000 L/m3)/(45 kg/ha-d * 106 mg/kg) =
TSS—At Qave, Aw = (18920 m3/d * 70 mg/L * 1000 L/m3)/(30 kg/ha-d * 106 mg/kg) =
t Qmax, Aw = (37840 m /d * 30 mg/L * 1000 L/m3)/(30 kg/ha-d * 106 mg/kg) =
Limitin
tep 2: Set each vegetated cell depth at 0.6 m and the open water cell depth at 1.2 m.
Step 3:
= 5 mgd (18920 m /d) Q3max = 3
mix lagoon effluent has 50 mg BOD/L and 70 mg TSS/L at Qave and 40 mg and 30 mg TSS/L at Qmax.
ent objectives (anSS ha-d)
Qo * Co)/ALR
At Qave, Aw = (18920 m3/d * 50 mg/L * 1000 L/m3)/(45 kg/ha-d * 106 mg/kg)21 ha
34 ha
44 ha
3A38 ha
g condition is TSS at Qave, Aw = 44 ha
S
HRT = (Aw * h * ε)/Qo Assume moderately densely vegetated
15

(> 6 d,
HRT in the two parallel open water cells must be held to 3 d at Qavg; therefore,
A2 = (3 d * 18920 m3/d)/(1.0 * 1.2 m * 104 m2/ha) = 4.7 ha (2.4 ha each cell)
A1 = A3 = (44 ha – 4.7 ha)/2 = 39.3 ha (9.8 ha each of four cells)
Tentative Sizing Bases for Other Treatment Objectives
have = (0.6 m * 2 + 1.2 m)/3 = 0.8 m εave = (0.75 * 2 + 1.0)/3 = 0.83 Overall—At Qave, HRT = (44 ha * 104 m2/ha * 0.8 m *0.83)/18920 m3/d = 15.4 dOK) At Qmax, HRT = (44 ha * 104 m2/ha * 0.8 m *0.83)/37840 m3/d = 7.7 d
Design ment objectives. A procedure similar to the one outlined for BOD and TSS can be used with appropriate area loading rates and HRTs. The riteria that can be derived from the database presented by USEPA (2000) are:
/ha-d for < 10 mg TKN/L
0.55 kg P/ha-d for <1.5 mg P/L and HRT = 15 days at Qmax
These criteria, especially the one for P, must be regarded as experimental.
FWS WETLA Shape
bases are less certain for other treat
c
5 kg TKN
ND DESIGN FEATURES
Plug flow and avoidance of sh uiting (actual HRT does not reach theoretical value) are enhanced by separating the inlet and outlet through a relatively high aspect (length:width, L:W) ratio. While g more berm construction, ever else being equal, and increase head loss through very long flow paths through dense vegetation. In extreme cases excessive head loss can create a backwa ead loss is not a problem with L:W = 5 or even somewhat higher. Therefore, that aspect ratio is recommended, if available space and budget permit. L:W should not be <3:1.
ort circ
reater is better from that standpoint, very high aspect ratios raise cost by requiringything
ter condition and overflow. Evidence shows h
16

Slopes It is necessary to grade constructed wetlands very carefully during construction to keep velocities very lo Lateral slope ( Longitudinal slope (parallel to flow)—Some drainage needed but must be uniform and very gradual (1% m Berm side slopes—3:1 horizontal:vertical
let and Outlet Structures
w and prevent the formation of preferential low-flow paths.
perpendicular to flow)—Must be essentially zero
aximum in marsh and open water cells, 2-3% in meadow cells)
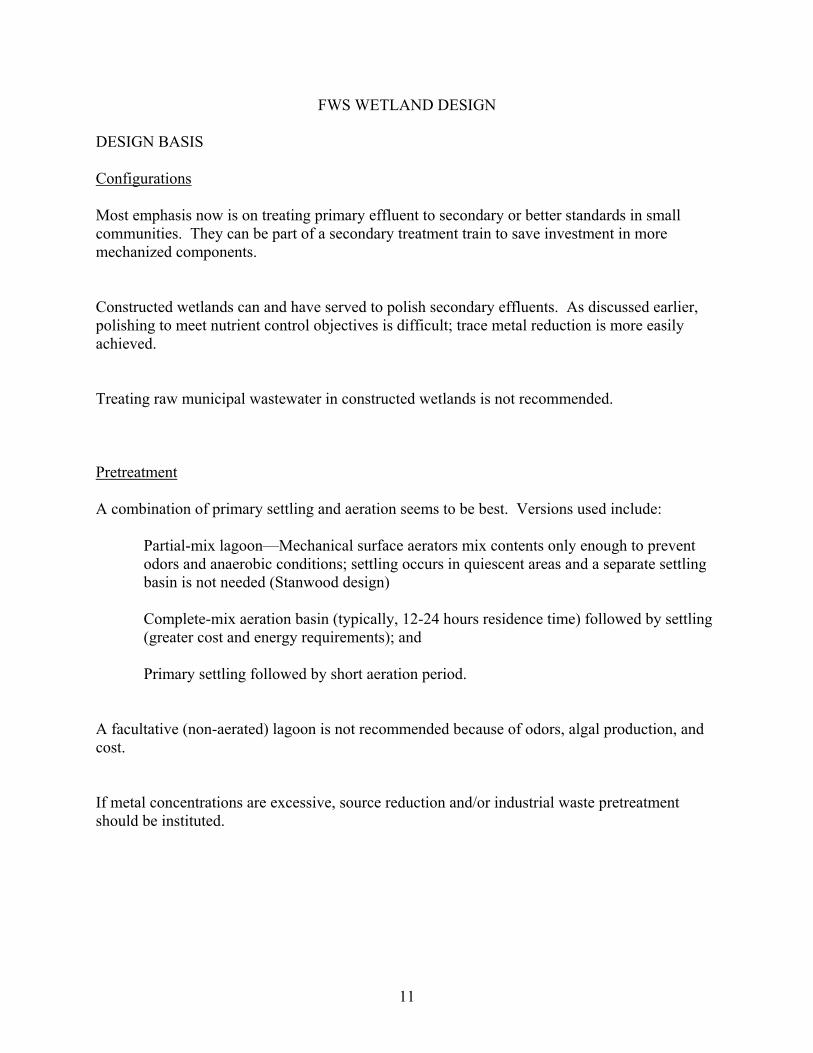
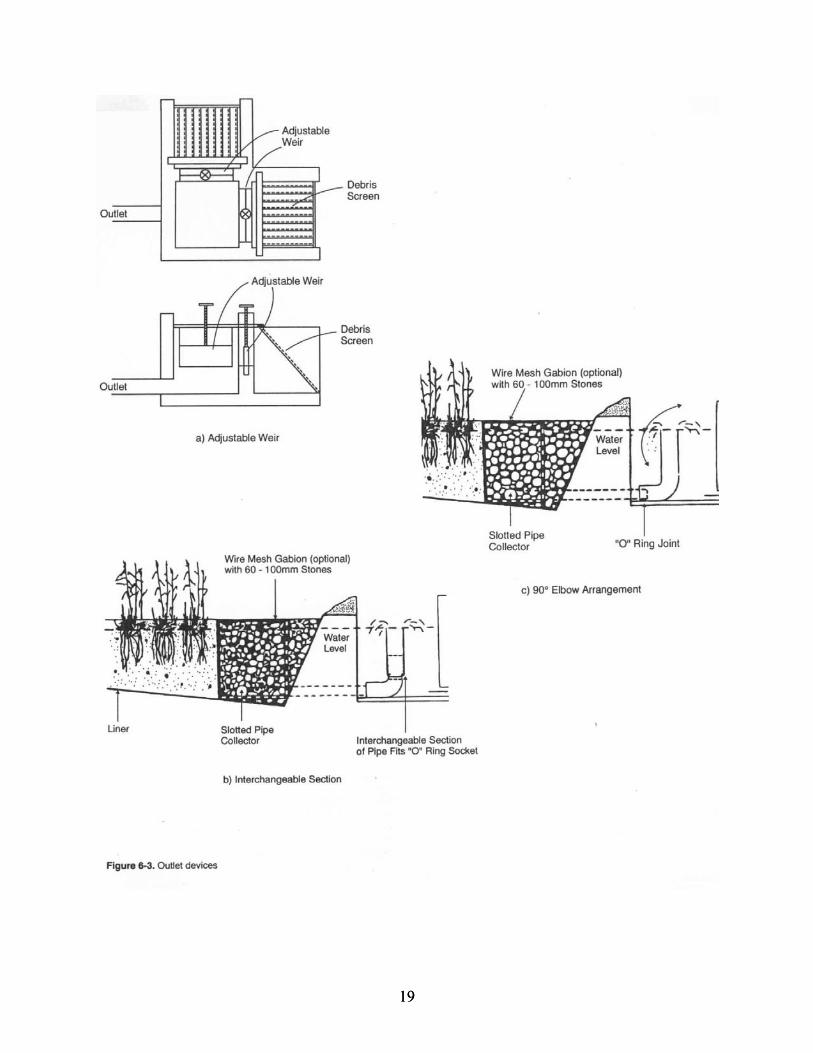
In (See diagrams, USEPA 2000)
elocities.
mall, relatively narrow wetlands—Level perforated or slotted pipes can be used for both inlet
and out
across width. rifices must be large enough to prevent clogging by the largest solids expected to enter.
enerally place above the water surface, unless extended freezing or public exposure e outlet is submerged, a level control device is needed
to adjust depth (adjustable weir or gate, series of stop logs, or swiveling elbow). Orifices can be covered with gravel to promote uniform distribution and avoid plant
ng
Space individual boxes 5-10 meters apart across width.
Principles—(1) design inlet to distribute inflow uniformly across entire cell width, (2) designoutlet to collect effluent uniformly across entire cell width, (3) minimize local v
Slet.
Determine size and number of orifices based on flow rate. Space uniformlyO Gwarrants subsurface location. If th
encroachment. An alternative is to construct a 1.0-1.3 meter deeper water zone extendi1 meter out from the inflow or outflow point. Access at the pipe end is required for clean out.
Larger wetlands—Concrete or PVC weirs or drop boxes are usually used for both inlets and outlets.
17
18
19 19
Recommended weir overflow rate is 120-190 m3/m weir length-day (low in range best to reduce velocity). Analyze hydraulically to attain uniform distribution. Place a deep-water zone adjacent to weir or box to prevent plant encroachment.
A forebay (1 meter deep, 1 day HRT) can be installed at the inlet end of the first vegetated cell if influent settleable solids are expected to be relatively high. Baffles are generally not needed but can be employed to correct problems like short circuiting and dead zones. Install a debris screen around the outlet to restrict plant fragments. Fit the outlet structure with a drain to allow emptying the wetland if necessary for maintenance. Soils Soils considerations include percolation rate, depth, and texture. Percolation should be no more than ~10-6 cm/s to sustain the wetland and avoid any chance of groundwater contamination. If soils percolate faster and there is no impermeable natural layer to stop it, a liner may be necessary (see below). Depth above the impermeable layer must be adequate to contain the root penetration of the expected plants, especially to avoid damaging a liner if present. Approximate penetration distances for some common wetland plants are:
Larger bulrushes—76 cm Reeds—60 cm Cattails—30 cm Medium soil textures (e.g., loams) relatively high in organics are best for plant growth. If large water level fluctuations will occur, a denser loam (e.g., sandy loam or loam-gravel mix) is advantageous to reduce floating mats. Heavy clay limits root extension, while sand lacks nutrients and structural support for plants. Topsoil or organic sources like sawdust can be mixed into clay to improve texture. Much peat should usually be avoided because of its poor nutrition and acidity, which tends to keep metals in the dissolved state.
20

Liners If perm ability is marginally above 10 cm/s, soil compaction and solids deposition and soil reactio nstalled. Possible liners are imported clay fill, bentonite clay, or a synthetic membrane (e.g., PVC, high-
ensity polypropylene). Clay is preferred because of its easier placement.
egetation Selection
-6ens after operation begins may be sufficient to contain it. If not, a liner should be i
d V
most used in the marsh cells of constructed wetlands are Typha (cattails), cirpus (bulrushes), Phagmites (reeds), Juncus (rushes), and Carex (sedges). All of these genera ave Washington natives among their species, except Phragmites. There are important
orm monocultures in the etland or downstream. Nurseries now offer ample selection in native species, and there is no ood reason to use non-natives. While native, Juncus effusus (soft rush) and Typha latifolia common cattail) are somewhat aggressive, tend to restrict diversity, and are best avoided.
rs and surfaces for microbial rowth and are less important for uptake of pollutants. Thus, good cover and the prospects for
eyond picking natives that cover well, plant selection depends principally on water depth ersus plant preferences and tolerances. For example, Carex, Juncus, and Scirpus microcarpus
e nd
es yet, up to about 1 meter. It is recommended at final selection be made with the assistance of a botanist well informed about the
charact
The plant genera Shadvantages to selecting natives, such as adaptation to nutritional and climatic conditions, resistance to pests and disease, and low tendency to dominate and fwg( Most evidence indicates that the plants function primarily as filtegsuccessful establishment are more important than specific selections relative to uptake abilities. Bv(small-fruited bulrush) prefer water from 15 cm below to 15 cm above the soil surface, whilSagittaria (arrowheads, also having native species) does better in somewhat deeper water aScirpus acutus (hardstem bulrush) in deeper zonth
eristics of local wetland plants. Vegetation Establishment Specifications Wetland plants can be grown from potted nursery stock, seed, or roots and rhizomes preserved in wetland soil. The latter source has been found to provide good, relatively rapid cover but is not widely available. Difficult germination conditions compromise success with seed development. Therefore, a wetland plant nursery with a good selection and track record is the best source.
21
However plants are initially established, the eventual assemblage almost certainly will include olunteer species and may not even resemble the original planting plan very closely. Most
iderations include lanting season, handling plants before installation, spacing, planting depth, and treatment after lanting.
seasons are early spring and early fall, with some plants seeming to do better in one and others in the opposite season. Again, take the advice of a good local
ve the tall
lows. On the one hand, it is advantageous to mix species in a localized area to gain diverse capabilities throughout, but this plan makes planting less convenient. The best
Rely on the botanist and nursery for planting depth advice. Depths for some common plants are: bareroot Carex obnupta (slough sedge) and Scirpus acutus (hardstem bulrush)
m.
l below ason and until plants begin rapid growth and spread.
Allow at least one full growing season before the plants are subjected to sustained loading of wastewater. Thus, spring planting can allow operation sooner than if vegetation is planted in the fall. Achieving complete coverage and reaching full
nal one or two growing seasons.
reventing an Effluent Ammonia Problem
vimportant is to establish conditions and initial vegetation to resist undesirable species. Vegetation establishment must be carefully specified and monitored. Conspp
Prime planting
botanist and the nursery. Most crucial in handling plants is to get them in the ground quickly after they leanursery and keep them shaded and moist in the meantime. It is recommended thatplant stalks be topped to 20-25 cm to prevent wind throw.
The most common spacing appears to be 50 cm. Of course, closer spacing raises prospects for success and could allow earlier operation, and can be used if budget al
compromise seems to be to plant monocultures in relatively small plots localized withindepth zones and mix these plots through the depth zone.
rhizomes—5-10 cm, bareroot Scirpus microcarpus (small-fruited bulrush)—2.5-10 c
Be careful to prevent plant loss to animals. If herbivores can get access, net the vegetation until it is self-sustaining.
Specify that the new plantings be flooded to a depth of 1-5 cm. Keep the levenew growth the first growing se
performance could take an additio PROBLEM PREVENTION P
There has been a fair amount of attention given avoiding high ammonia in the effluent, which can be toxic to aquatic life and creates a downstream oxygen demand. The recommended
22
configuration, with an aerobic open water cell for nitrification can go a long way toward solvingthis problem, even if there is no specific nitrogen control objective. Other recommendationshave been made to deal with this potential problem include:
that
Recirculating some effluent if necessary to get adequate HRT for nitrification;
Making the last cell a highly aerated, shallow overland flow or wet meadow cell;
Full effwell de
Wildlif
Sizing so that ammonia-N loading is < 10 kg/ha-d;
Adding limestone if alkalinity is insufficient for nitrification, and keep pH in the 7-8 range.
ectiveness in ammonia control is likely to require two to four growing seasons to get a veloped vegetation and plant litter system.
e Access Control
n wildlife control are restricting wildlife harmful to operations and any that may be by exposure to contaminants, and attracting those that wo
Issues iharmed uld not be harmed and could gain habitat. Generally, providing habitat is not a high priority objective for constructed wetlandusuallyhigh co
atement is not true, and to control harmful pests in general, some controls may be needed.
uisance species include burrowing rodents that damage berms and eat vegetation, waterfowl that add(see be ral control
essary;
Waterfowl—Place high growth around open water areas, net these areas; Carp—Draw down and remove;
s for municipal wastewater treatment. At the same time, incidental attraction is not looked on with concern, since most wetlands serve relatively small communities without ncentrations of metals and other toxicants in their wastewater. To the extent that
st
N nutrient loading, bottom-feeding fish like carp that resuspend solids, and mosquitoes
low). Controls need to be designed with the help of local wildlife experts. Some gene methods are:
Rodents—Screen from culverts, harden berms with riprap, trap and remove if nec
23
Mosquito Control Constructed wetlands have the potential to become a mosquito problem because of the presence
f shallow open water and vegetation. Mosquito fish (Gambusia) have been used successfully to control hen high vegetation falls over in the fall, especially, the quiescent zone underneath is a good breeding zone. R l measure. If treatment capacity is adequate with respect to warm weather flows, when mosquito breeding is most lilarvae.
sing these methods requires attention to spect and apply and could affect non-target, beneficial insects. Better biological methods may
e to introduce dragonfly larvae and encourage bats and bird predators, like purple martins and allows, by installing houses for them; but the effectiveness of these methods has not been well
o mosquito breeding in open water but cannot move through dense vegetation. W
emoving this dead standing stock is a good remedia
kely, vegetated cells can be rotated out of service and drained to get rid of eggs and
Otherwise, two species of Bacillus bacteria are effective biological pesticides without the harmful side effects of chemical pesticides. Still, uinbswdocumented. Human Health Concerns Polishing wetlands for tertiary treatment have been used for interpretive centers and other open space uses benefiting humans. However, constructed wetlands receiving primary effluentappropriate for these uses. Therefore, fencing and signage could be essential features, unless
are not the
etland is well removed from population and its travel. w Avoiding Odors Odors in conventional treatment plants often result from anoxia at points of confinement. This problemthe atm sphere, and odor problems are not the rule in treatment wetlands. Inlet areas are the most li circulation can increase inlet dissolved oxygen in the summer, when its solubility is reduced by high temper
is mitigated by the relatively wide distribution of wastewater in an area well exposed to okely spots for odors to form through anaerobic decomposition. Effluent re
atures.
24

OPERATION AND MAINTENANCE CONSIDERATIONS
elop. The major
equirements are:
to
Seasonally adjust water level if needed to improve operation, do maintenance, aid
imate, an
Regularly (at least weekly) inspect inlets and outlets for clogging and maintenance of uniform flow distribution. Adjust and clean as necessary.
, especially in the first few years of operation, and schedule maintenance plantings if necessary to replace losses. Thoroughly remove unwanted
s
Stop vegetation spreading too much into open water areas by harvesting.
berms through, as necessary, mowing, erosion control, removal of burrows and their makers, repairing damage, and removing trees that would compromise structural
USEPA (2000) estimated that these tasks would take no more than one day per week of labor for a 1 mgd plant, with monitoring probably being the most demanding of time.
GENERAL REQUIREMENTS Constructed wetlands are primarily passive systems that do not require much operator attention compared to conventional plants. Mostly, the operator needs to be observant, conduct a smallamount of monitoring, and take appropriate actions when problems devr
Monitor water levels and investigate any unplanned change, which could be due to leakage, clogging, berm damage, a large new water source, direct stormwater runoffthe wetland, or another cause.
vegetation growth, or solve one of the problems discussed above. In a very cold clwinter operation can be enhanced by raising the level 50 cm in the late fall, allowingice sheet to form and then dropping the level back to create an insulating air pocket. Initiate and control seasonal effluent recycling if needed for a reason discussed earlier.
Inspect vegetation
species before they become established, and foster more desirable replacements. Later avegetation becomes self-sustaining, replanting is not likely to be needed; but vegetation should still be inspected annually to be sure species that would compromise performance are not getting a foothold.
Maintain
integrity and/or excessively shade the wetland. Take action on any of the problems identified above. Perform required monitoring.
25

REMOVING AC
lowances, partial dredging should be required only rarely. Data nd calculations indicate that the normal 0.6-meter freeboard should be only partly consumed by
APPLICATIONS APPRO Approp
ffordable—Total annual costs, including capital, operation, maintenance, and
eliable—Meets effluent requirements consistently. Generaconstru
ne to activated sludge, which has often failed the appropriate chnology criteria, becoming unaffordable to operate properly and hence unreliable;
andards SEPA 2000).
Constru ology in areas where inexpensive land is available and skilled labor is relatively scarce. Approp constructed wetlands include: (1) stabilization ponds or
goons, (2) slow sand filters, and (3) land treatment systems. All meet the operability criterion nd to varying degrees the affordability and reliability criteria. They can be used alone or in
Stabilization pond followed by a tertiary FWS constructed wetland to enhance settling of the profuse algae often produced in ponds and other solids, especially for fecal coliform reduction;
CUMULATED SOLIDS AND ORGANIC LITTER With the recommended design alaboth solids and vegetation litter in 10-15 years. Most deposition is likely to be near the inlet, requiring removal from only 10-25% of the area. Plant debris in vegetative zones has accumulated only 8-12 cm in 15 years of operation (USEPA 2000).
PRIATE TECHNOLOGY FOR SMALL COMMUNITIES
riate technology is defined as a treatment system that is:
Adepreciation, are within the user’s ability to pay;
Operable—Possible with locally available labor and support; and R
lly applied to “small treatment systems,” usually considered to be < 1 mgd, although cted wetlands do not have to be limited to this flow if land is available
Many such systems have gotesmall plants comprise more than 90% of the violations of US discharge st(U
cted wetlands are generally an appropriate techn
riate technology alternatives tolaaseries with other techniques, depending on treatment objectives. Examples are:
26
Anaerobic lagoon followed by a tertiary VSB constructed wetland (low anaerobic lagoon
N-SITE APPLICATIONS
onstructed wetlands can be used for wastewater treatment at individual properties, where they
nk effluent (or sometimes primary packaged plant effluent) and have a subsurface discharge to soils.
dequate properties. This option must be evaluated carefully to be certain that expected en problematic for
filtration, because of a shallow glacial till layer, seasonal high water table, or both.
Variations on this treatment train include following the lined VSB wetland with a gravel- or sand-filled trench to facilitate infiltration and direct surface discharge after
The TeSteiner
rcata, CA
algal production does not cause problems in VSB media); and Secondary constructed wetland followed by a tertiary intermittent or recirculating sandfilter for ammonia oxidation.
O
Care relatively cost-effective and easy to maintain.
They are generally lined VSB systems receiving septic ta
A second, unlined VSB wetland can be added to infiltrate final effluent, if soils have ainfiltration will occur. Glaciated areas around Puget Sound are oftin
disinfection.
nnessee Valley Authority has developed the concept for its region (see, for example, , Watson, and Choate 1989).
CASE STUDIES A
1986, and the ystem has been in continuous operation since then. Dr. Robert Gearheart and his colleagues at
Humboperform
Arcata (Humboldt County) began pilot-scale research on wetland units in 1979 to assess them asalternatives to a regional conventional secondary plant. The City was ordered to upgrade its system consisting of primary settling, oxidation ponds, and disinfection. The research was promising, and the state authorized proceeding in 1983. Construction finished ins
ldt State University performed the original research, did basic design, and have ed a great deal of research over the years.
27
Treatmconsist icated to treatment, followed by over 12 ha made up of three “enhancement” marsh cells with a large proportion of open w in parallel series, but the flow pattern is more complex than that rrangement, with more than one direction within a set often possible. Discharge from the first t is disinfected because of the public presence in the enhancement area. Final effluent is
umped back to the same point for disinfection again.
he first set of cells, built in old lagoons, was originally planted in hardstem bulrush plant shoots
l not being a treatment objective, they have a latively brief 1.9 day HRT at design flow and 60-cm depth.
The enhancement cells have average depth of 60 cm and about 9 days average HRT. They were built onemerge Long-term averages show treatment objectives to be met easily, with 28 mg BOD/L and 21 mg TSS/L the enh o 30 mg/L after the first set of wetland cells, to 3 mg/L after the long residence time in the well aerated enhancement cells.
r salt and fresh water wetlands adjacent to e enhancement cells. The overall complex comprises the Arcata Marsh and Wildlife Sanctuary
nd has substantial wildlife, especially birds; trails; an interpretive center; and other recreational atures.
tanwood, WA Pilot Wetland
ent objectives for a design flow of 2.9 mgd were 30/30 mg/L for TSS/BOD. The system s of three densely vegetated cells totaling about 3 ha in area ded
ater for final polishing, habitat, and public recreation. The first set of cells are arranged and the enhancement cells in
asep Tand rhizomes on 1-meter centers. They were designed for 60 cm water depth but are being operated at twice that depth. With nutrient removare
a former log storage area, pasture, and borrow pit. Vegetation includes a variety of nts in shallow zones and submerged plants in deeper ones.
exiting the first set of wetland cells and 3.3 and 3.0 mg/L, respectively, discharged after ancement stage. Total nitrogen falls from 40 mg/L in oxidation pond effluent t
Open space benefits are compounded by 28 ha of othethafe S
mg/L ish River. After the City expressed
terest to the Washington Department of Ecology (WDOE) in using a constructed wetland to
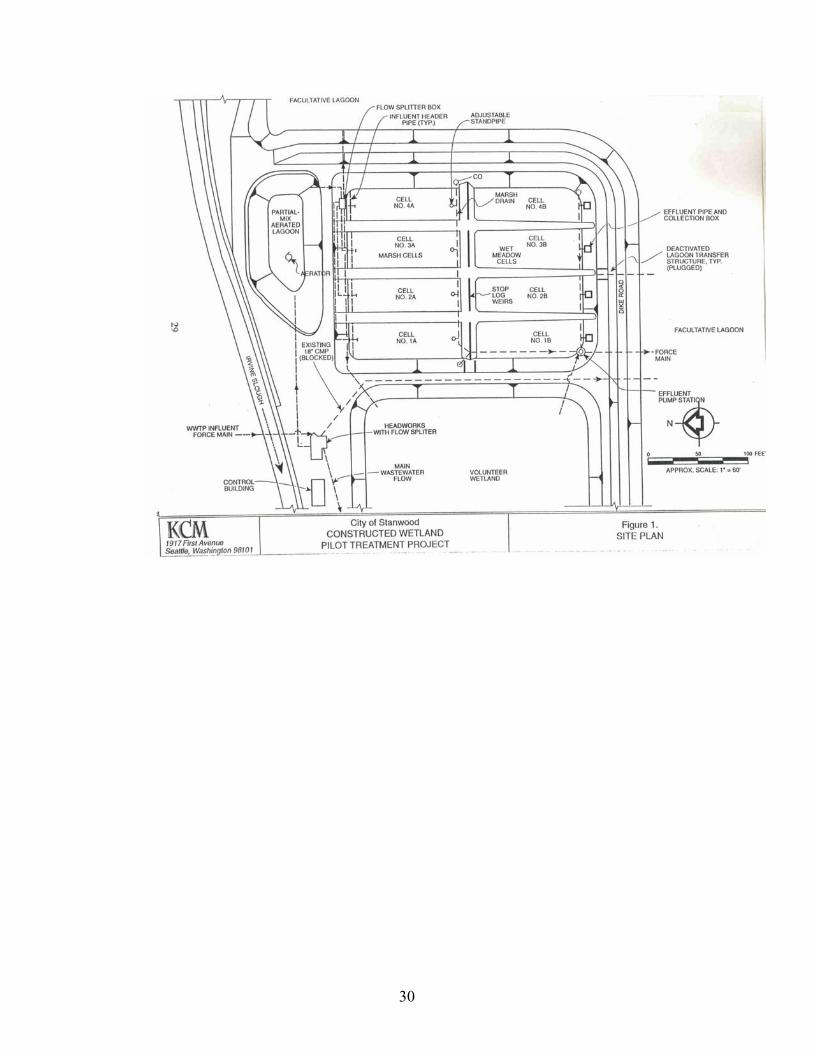
Description: In 1992 the City of Stanwood in Snohomish County set a goal of upgrading its facultative lagoonsystem to ensure continued compliance with discharge limits for TSS and BOD, as well as to reduce nutrients. Specific effluent objectives were < 30 mg/L for TSS and BOD and < 2for ammonia (as nitrogen) before discharge to the Stillaguamin
28
achieve the goal, WDOE required a demonstration of the technology, because constructed
n in
The existing Stanwood treatment plant in 1993 consisted of a 0.5-ha complete-mix aerated lagoon followed by a 14-ha facultative lagoon. At that time the plant treated
Four replicate constructed wetland units, allowing for loading rate experimentation, were built in this lagoon in 1994 and 1995. Each unit consists of a marsh cell in which deeply
hich r a 1% slope through low-
growing vegetation. Stop logs at the transition between cells control the marsh depth. It has generally been set at 30 cm, although the original plan was to operate at that depth in
The planting plan called for these species, all natives:
Wet meadow-- Carex obnupta, Glyceria occidentalis (manna grass), and Oenanthe sarmentosa water parsley).
The constructed wetland units were planted with nursery plants beginning in the spring of
ting process was not performed under tight control. The hardstem bulrush did well in the marsh cells, but most other specimens never took hold well and
vercome by volunteers. By summer 1998 (McCauley 1999) the marsh cells were 42% covered with open water overall (although one had much less) and the balance with
wetlands had not been used before by publicly owned treatment works in the state. In 1993 WDOE awarded the City a Centennial Clean Water Fund Grant to perform the demonstratiopilot scale. The project design is detailed in a predesign report (KCM 1993) and subsequent construction drawings. A brief description follows (see diagram).
approximately 0.25 mgd in the summer and 0.50 mgd in the winter. Three 0.5-ha inactive lagoons lie upstream of the facultative lagoon. One was used for the pilot project.
ponded effluent passes with varying HRT, depending on loading rate, through emergent herbaceous wetland vegetation. Following the marsh zone is a wet meadow cell in weffluent proceeds in sheet flow (soil level to 3 cm deep) ove
the summer and 45 cm in the winter. The marsh and meadow cells are equal in size, each approximately 10 meters wide by 36.5 meters long at the bed elevation. Berms with 2.5:1 side slopes separate cells.
Marsh—Carex obnupta (slough sedge), Eleocharis palustris (spike rush), Scirpus acutus (hardstem bulrush, since renamed Schoenoplectus acutus), and Scirpus microcarpus (small-fruited bulrush);
1994, although the plan
were o
plants, of which almost all were hardstem bulrush. The wet meadow cells were 99% covered with live plants, with the invasive exotic Phalaris arundinacea (reed canarygrass) dominant at 37.1% and the aggressive natives Juncus effusus (soft rush) andTypha latifolia (common cattail) making up most of the remainder at 19.2% and 17.0%,
29
30
respectively. Only slough sedge from the original planting plan appeared, constituting 9.1% of the wet meadow cover.
A partial-mix aerated lagoon was constructed for pretreatment of the marsh cell influent. Approximately 8% of the total plant influent is diverted to this lagoon. Its HRT is approximately 6 days in winter and 12 days in summer. The lagoon discharges fixed proportions of its flow to each marsh cell under V-notch weir control. During a performance evaluation by Marx (1999) average annual hydraulic loading rates to the four cells were 103, 211, 260, and 358 m3/ha-d (corresponding to 1.1-4.1 cm/d). Experience: In Marx’s (1999) study overall (marsh plus meadow) HRTs ranged from 1.0 to 6.9 days. All were lower than theoretical values, and only one was in the recommended range of 5-10 days, apparently because of short circuiting. Marx recommended holding to this criterion. The 30 mg/L BOD objective was always reached with the longest HRT, and the equivalent TSS effluent target was usually achieved. BOD and TSS concentrations were below 20 mg/L most of the time and often < 10 mg/L. All other tracks had a number of exceedences. The partial-mix pond cut BOD 84% overall, and the majority of the remaining reduction occurred in the marsh cells. The maximum loading rate to any cell was 25 kg BOD/ha-d, far below the 40 kg BOD/ha-d design criterion (for a fully vegetated wetland) for < 30 mg/L in the effluent derived from the national data base and discussed earlier. It appears that the relative lack of success of three tracks was a function of short HRT instead of excessive loading rate. Only the track with the longest HRT reduced ammonia below the target concentration, representing more than 90% reduction. In that track about 20% of the nitrification occurred in the pretreatment lagoon, an equivalent amount in the marsh, and the majority in the wet meadow. Denitrification of nitrate occurred during the summer but minimally in winter due to temperature limitation. Still, effluent nitrate concentrations generally exceeded influent values. However, total inorganic nitrogen was reduced overall. Despite variable performance in concentration reduction, all cells reduced ammonia and total inorganic N mass most of the time. The longest HRT cell performed notably better and the shortest substantially worse than the other two. Marx recommended that ammonia loading be restricted to < 2 kg NH4-N/ha-d, an alternative criterion to the 5 kg TKN/ha-d derived from the national data base and presented earlier. He also recommended considering recycling effluent to the wet meadow and rotating cells out of service. All tracks usually reduced phosphorus concentrations, the longest HRT one by >50% most of the time, usually keeping effluent concentration in the 1-3 mg/L range. Annual average P mass removals ranged 14-66%, the best again with the longest HRT.
31

McCauspecies in special plots. She concluded that there were not strong differences, and that ontrolling plant composition by weeding or other maintenance is not warranted for treatment
intain
ley (1999) studied the relative treatment effectiveness attributable to different plant
creasons (it still may be for other objectives). She did note that reed canarygrass did not magrowth and vigor when continuously flooded. Also, hardstem bulrush promoted nitrification and phosphorus reduction better than reed canarygrass and cattail. Ouray, CO Ouray, at over 2300 meters altitude, represents a location with a relatively harsh winter. Its FWS
ves aerated lagoon effluent and provides secondary treatment. The system has two acks each with three cells in series. All are heavily vegetated in cattail and bulrush, and no
o
iagrams on the next two pages illustrate some of the attributes typical of stormwater wetlands.
r
ds and
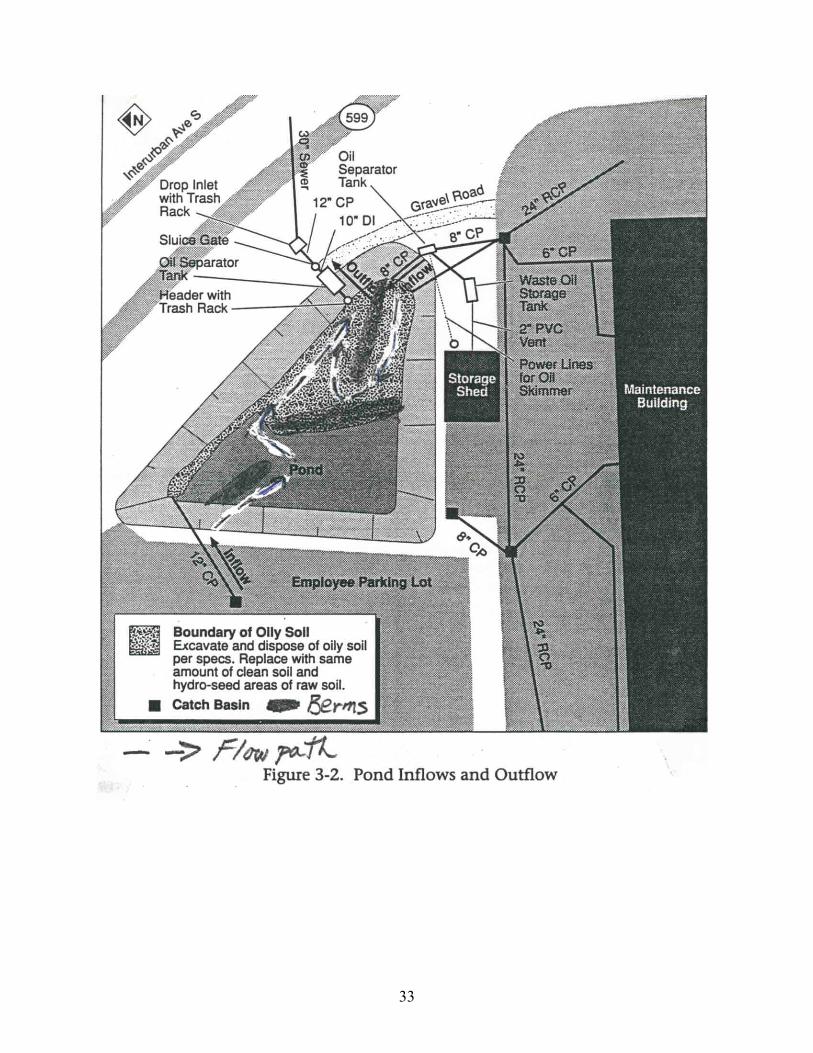
well. The facility is a public park and has a public art grotto based on the overall theme.
designed to fit with the surrounding landscape. They are often more integrated with the community and, with lower contamination levels than municipal wetlands, frequently welcome the public.
wetland receitropen water was planned or exists. Overall HRT ranges from 2.2 to 3.8 days. BOD and TSS have been well below the 30/30 mg/L targets both summer and winter, with monthly averages nmore than 18 mg/L for BOD and 11 mg/L for TSS. APPLICATIONS FOR OTHER EFFLUENTS Many constructed wetlands have been built to treat industrial effluents and stormwater runoff. Examples of the former include discharges from pulp and paper mills, sugar beet processing, an oil refinery, pig farms, a coal ash pond, landfills, and many mine drainage sites. Over 200 were built in Florida alone in the early 1990s for stormwater treatment (Hammer 1989, 1993). D
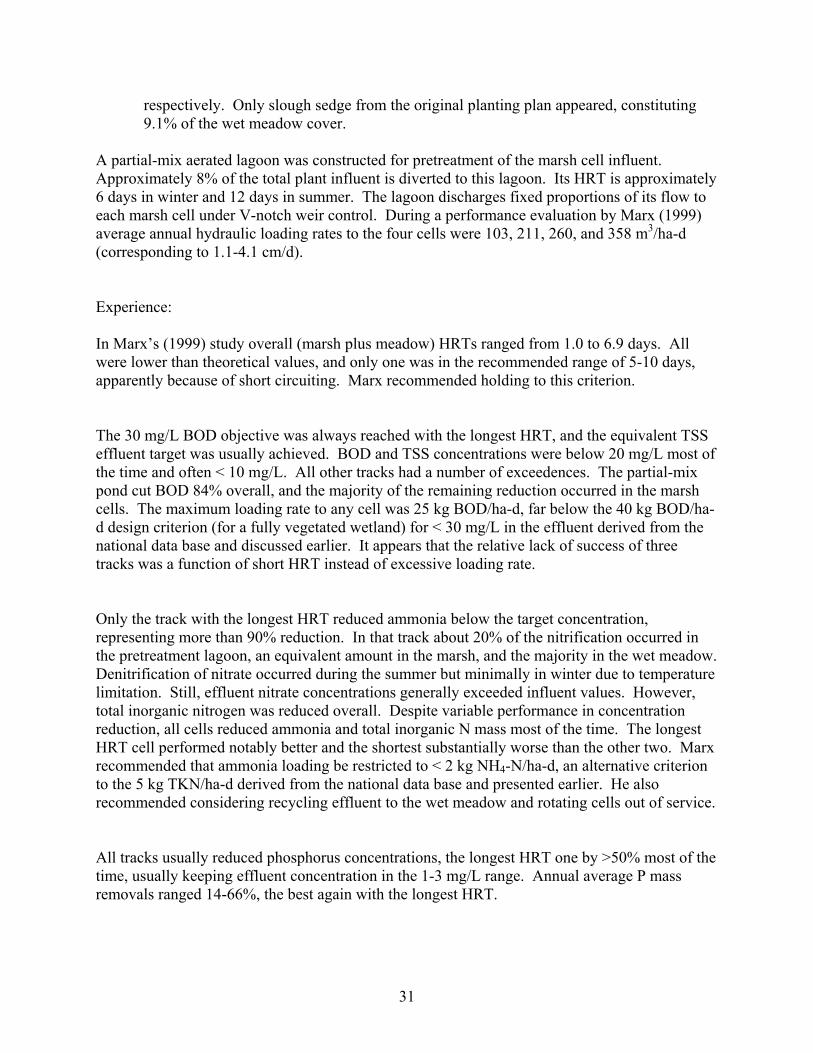
The first system was built at the Metro Transit South Base in Tukwila, WA to treat bus and employee parking lot runoff. It consists of marsh and open water zones and higher berms placed to lengthen flow paths and reduce the tendency to short circuit. The berm baffle is especially important for the inflow at the top of the diagram, which is very neathe discharge. The second diagram shows a complex built at the Renton, WA wastewater treatment plant to treat the stormwater coming from the impervious surfaces (no municipal wastewater enters). It represents an almost extreme application of the use of islanpeninsulas to direct flow. In this case the features have a landscape design purpose as
These examples indicate some of the distinctions between municipal wastewater and stormwater wetlands. Stormwater wetlands tend to be more naturalistic and less geometric in configuration and appearance, and are best
32
33
34
DESIGN PROBLEM ASSIGNMENT Influent conditions:
Qave = 0.3 mgd (1135 m3/d) Qmax = 0.5 mgd (1892 m3/d) Partial-mix lagoon effluent has 70 mg BOD/L and 70 mg TSS/L at Qave and 50 mg BOD/L and 50 mg TSS/L at Qmax.
Treatment objectives: 30 mg/L for BOD and TSS Size two different systems to meet the objectives: (1) a fully vegetated wetland consisting of two tracks of two cells each, and (2) a system of two tracks each with a vegetated cell, an open water cell, and then a vegetated cell. If the lagoon effluent has 40 mg TKN/L at Qave and 30 mg TKN/L at Qmax and the objective is to have < 10 mg TKN/L in final effluent, do you expect either wetland design to meet the objective? Why or why not? If not, what are all the options to try to meet it? Which do you recommend?
SELECTED REFERENCES Hammer, D.A. (ed.). 1989. Constructed Wetlands for Wastewater Treatment: Municipal,
Industrial and Agricultural. Lewis Publishers, Chelsea, MI. Hammer, D.A. 1993. Constructed Wetlands for Wastewater Treatment: An Overview of a Low
Cost Technology. Pres. at Constructed Wetlands for Wastewater Treatment Conf., Midleton, Ireland, Feb. 11-12, 1993.
KCM, Inc. and R. Horner. 1993. City of Stanwood Constructed Wetlands Pilot Treatment
Project Predesign Report. City of Stanwood, WA. Kadlec, R.H. and R.L. Knight. 1996. Treatment Wetlands. Lewis Publishers, Boca Raton, FL. Marx, K.W. 1999. Effects of Loading and Temperature on the Performance of a Pacific
Northwest Treatment Wetland. M.S.E. thesis, Department of Civil and Environmental Engineering, University of Washington, Seattle, WA.
35
McCauley, M. 1999. The Influence of Plant Species on Treatment Effectiveness in a Constructed Wetland for Wastewater Treatment. M.S. thesis, College of Forest Resources,
Steiner n, and Operation Guidelines: Constructed Wetlands Wastewater Treatment Systems for Small Users InclCha
ask Force on Natural Systems. 1990. Natural Systems for Wastewater Treatment, Manual of
tion, Alexandria, VA.
SEPA. 2000. Manual, Constructed Wetlands Treatment of Municipal Wastewaters,
University of Washington, Seattle, WA.
, G.R., J.T. Watson, and K.D. Choate. 1991. General Design, Constructio
uding Individual Residences, TVA/WR/WQ-91/2. Tennessee Valley Authority, ttanooga, TN.
TPractice FD-16. Water Pollution Control Federa
U
EPA/625/R-99/010. National Risk Management Research Laboratory (USEPA), Cincinnati, OH.
36