Embed Size (px)
Citation preview
Constructing a Nutritionally Balanced Food Basket for Zanzibar a Case Study
by Nancy Cochrane
[email protected] Market and Trade Economic Division, Economic Research Service, USDA
355 East Street, SW, Washington DC
Selected Poster/Paper prepared for presentation at the Agricultural & Applied Economics Association’s 2016 AAEA Annual Meeting, Boston, Massachusetts, July 31-August 2, 2016
Disclaimer: The views expressed are the author’s and do not represent those of Economic Research Service or those of United States Department of Agriculture or the United States Government
Research Objective
This research builds on previous work in which the author used household survey data to construct a set of representative food baskets for different geographical regions of Tanzania (Cochrane and D’Souza 2015). By calculating the monthly cost of the food baskets and comparing that cost to per capita income, the author derived a measure of access (ability to purchase ) to food. The new research takes that work one step further to address the utilization pillar (individual’s ability to process nutrients and energy from food). The representative food baskets are based on actual consumption; they do not provide a nutritionally balanced diet; nearly all are deficient in a number of essential nutrients. The objective of the current research is to construct a set of “healthy food baskets” that meet key nutritional requirements while deviating minimally from traditional diets.
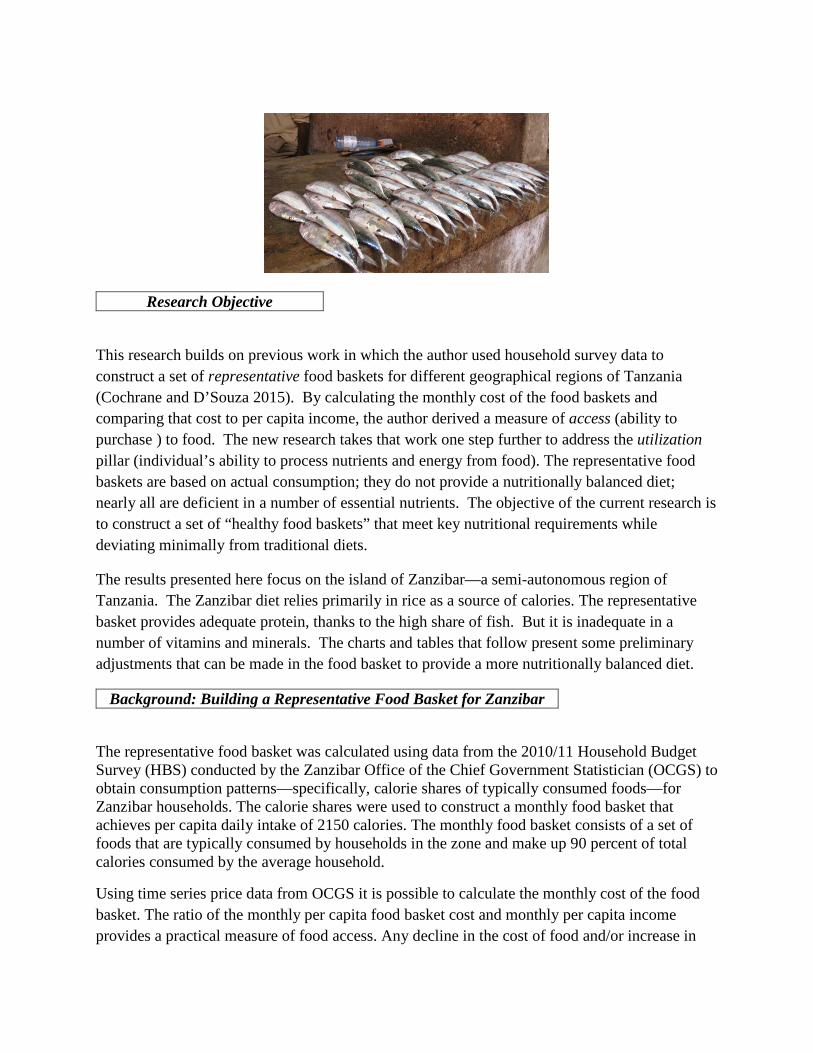
The results presented here focus on the island of Zanzibar—a semi-autonomous region of Tanzania. The Zanzibar diet relies primarily in rice as a source of calories. The representative basket provides adequate protein, thanks to the high share of fish. But it is inadequate in a number of vitamins and minerals. The charts and tables that follow present some preliminary adjustments that can be made in the food basket to provide a more nutritionally balanced diet.
Background: Building a Representative Food Basket for Zanzibar
The representative food basket was calculated using data from the 2010/11 Household Budget Survey (HBS) conducted by the Zanzibar Office of the Chief Government Statistician (OCGS) to obtain consumption patterns—specifically, calorie shares of typically consumed foods—for Zanzibar households. The calorie shares were used to construct a monthly food basket that achieves per capita daily intake of 2150 calories. The monthly food basket consists of a set of foods that are typically consumed by households in the zone and make up 90 percent of total calories consumed by the average household.
Using time series price data from OCGS it is possible to calculate the monthly cost of the food basket. The ratio of the monthly per capita food basket cost and monthly per capita income provides a practical measure of food access. Any decline in the cost of food and/or increase in
income are expected to improve the food security of a household. Monitoring food costs relative to consumer purchasing power can provide timely feedback on the effectiveness of food security policies and the investment required to address problems of food security.
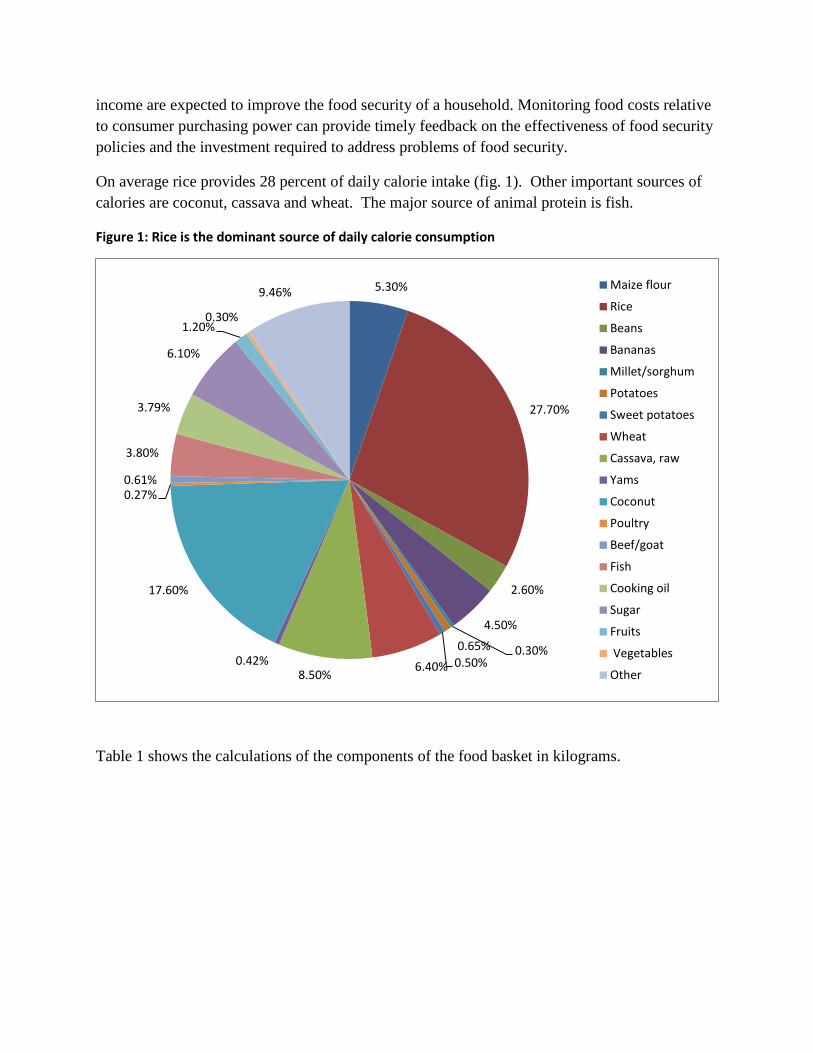
On average rice provides 28 percent of daily calorie intake (fig. 1). Other important sources of calories are coconut, cassava and wheat. The major source of animal protein is fish.
Figure 1: Rice is the dominant source of daily calorie consumption
Table 1 shows the calculations of the components of the food basket in kilograms.
5.30%
27.70%
2.60%
4.50%
0.30%0.65%0.50%6.40%8.50%
0.42%
17.60%
0.27%0.61%
3.80%
3.79%
6.10%
1.20%0.30%
9.46% Maize flour
Rice
Beans
Bananas
Millet/sorghum
Potatoes
Sweet potatoes
Wheat
Cassava, raw
Yams
Coconut
Poultry
Beef/goat
Fish
Cooking oil
Sugar
Fruits
Vegetables
Other
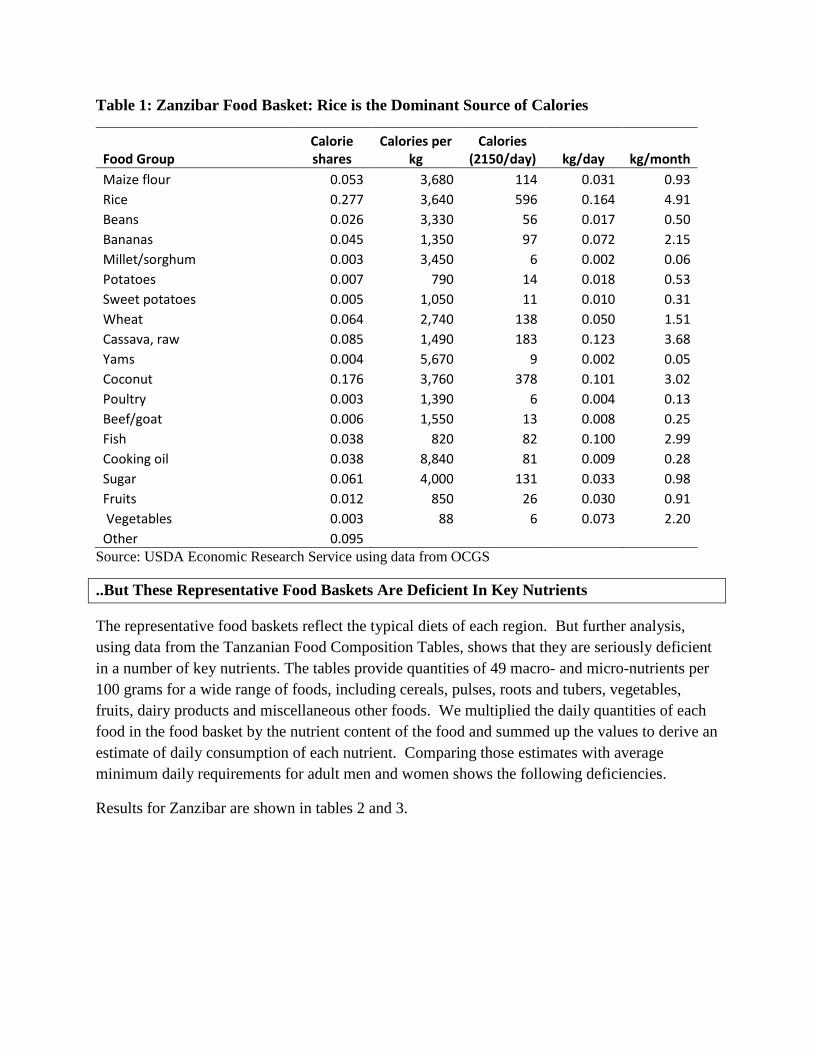
Table 1: Zanzibar Food Basket: Rice is the Dominant Source of Calories
Food Group Calorie shares
Calories per kg
Calories (2150/day) kg/day kg/month
Maize flour 0.053 3,680 114 0.031 0.93 Rice 0.277 3,640 596 0.164 4.91 Beans 0.026 3,330 56 0.017 0.50 Bananas 0.045 1,350 97 0.072 2.15 Millet/sorghum 0.003 3,450 6 0.002 0.06 Potatoes 0.007 790 14 0.018 0.53 Sweet potatoes 0.005 1,050 11 0.010 0.31 Wheat 0.064 2,740 138 0.050 1.51 Cassava, raw 0.085 1,490 183 0.123 3.68 Yams 0.004 5,670 9 0.002 0.05 Coconut 0.176 3,760 378 0.101 3.02 Poultry 0.003 1,390 6 0.004 0.13 Beef/goat 0.006 1,550 13 0.008 0.25 Fish 0.038 820 82 0.100 2.99 Cooking oil 0.038 8,840 81 0.009 0.28 Sugar 0.061 4,000 131 0.033 0.98 Fruits 0.012 850 26 0.030 0.91 Vegetables 0.003 88 6 0.073 2.20 Other 0.095
Source: USDA Economic Research Service using data from OCGS
..But These Representative Food Baskets Are Deficient In Key Nutrients
The representative food baskets reflect the typical diets of each region. But further analysis, using data from the Tanzanian Food Composition Tables, shows that they are seriously deficient in a number of key nutrients. The tables provide quantities of 49 macro- and micro-nutrients per 100 grams for a wide range of foods, including cereals, pulses, roots and tubers, vegetables, fruits, dairy products and miscellaneous other foods. We multiplied the daily quantities of each food in the food basket by the nutrient content of the food and summed up the values to derive an estimate of daily consumption of each nutrient. Comparing those estimates with average minimum daily requirements for adult men and women shows the following deficiencies.
Results for Zanzibar are shown in tables 2 and 3.
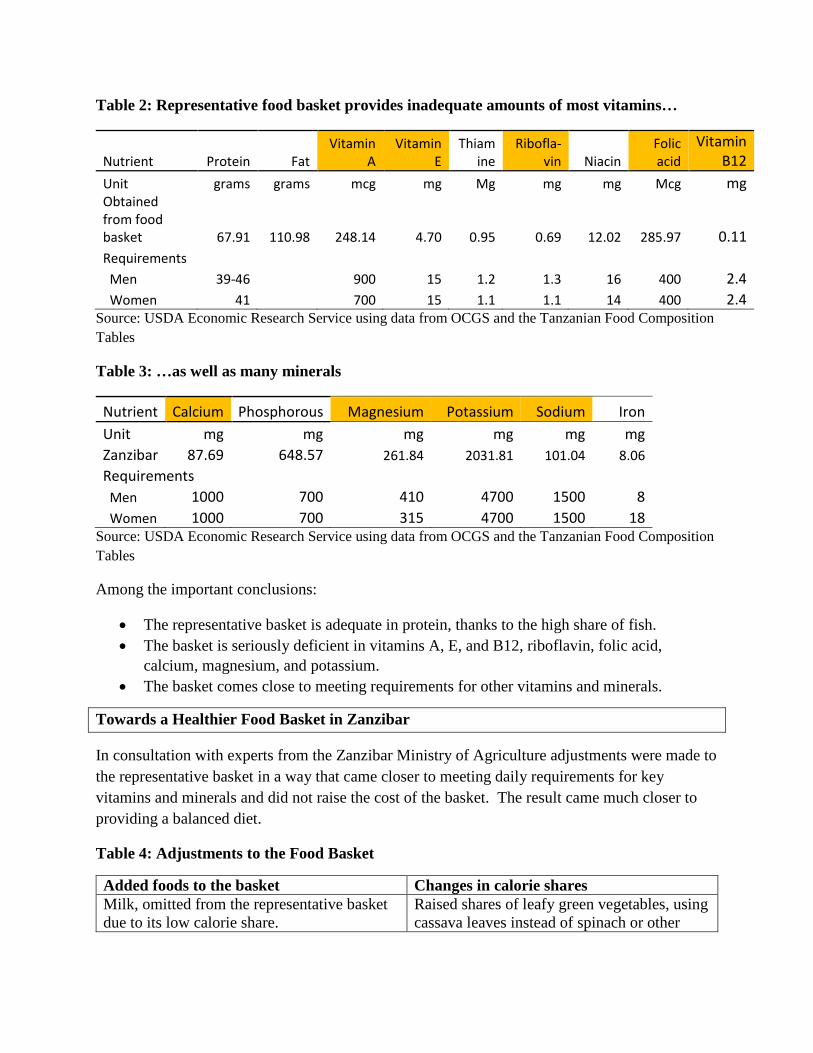
Table 2: Representative food basket provides inadequate amounts of most vitamins…
Nutrient Protein Fat Vitamin
A Vitamin
E Thiam
ine Ribofla-
vin Niacin Folic acid
Vitamin B12
Unit grams grams mcg mg Mg mg mg Mcg mg Obtained from food basket 67.91 110.98 248.14 4.70 0.95 0.69 12.02 285.97 0.11 Requirements Men 39-46 900 15 1.2 1.3 16 400 2.4 Women 41 700 15 1.1 1.1 14 400 2.4
Source: USDA Economic Research Service using data from OCGS and the Tanzanian Food Composition Tables
Table 3: …as well as many minerals
Nutrient Calcium Phosphorous Magnesium Potassium Sodium Iron Unit mg mg mg mg mg mg Zanzibar 87.69 648.57 261.84 2031.81 101.04 8.06 Requirements Men 1000 700 410 4700 1500 8 Women 1000 700 315 4700 1500 18
Source: USDA Economic Research Service using data from OCGS and the Tanzanian Food Composition Tables
Among the important conclusions:
• The representative basket is adequate in protein, thanks to the high share of fish. • The basket is seriously deficient in vitamins A, E, and B12, riboflavin, folic acid,
calcium, magnesium, and potassium. • The basket comes close to meeting requirements for other vitamins and minerals.
Towards a Healthier Food Basket in Zanzibar
In consultation with experts from the Zanzibar Ministry of Agriculture adjustments were made to the representative basket in a way that came closer to meeting daily requirements for key vitamins and minerals and did not raise the cost of the basket. The result came much closer to providing a balanced diet.
Table 4: Adjustments to the Food Basket
Added foods to the basket Changes in calorie shares Milk, omitted from the representative basket due to its low calorie share.
Raised shares of leafy green vegetables, using cassava leaves instead of spinach or other
greens. Cassava leaves are more widely available and cheaper.
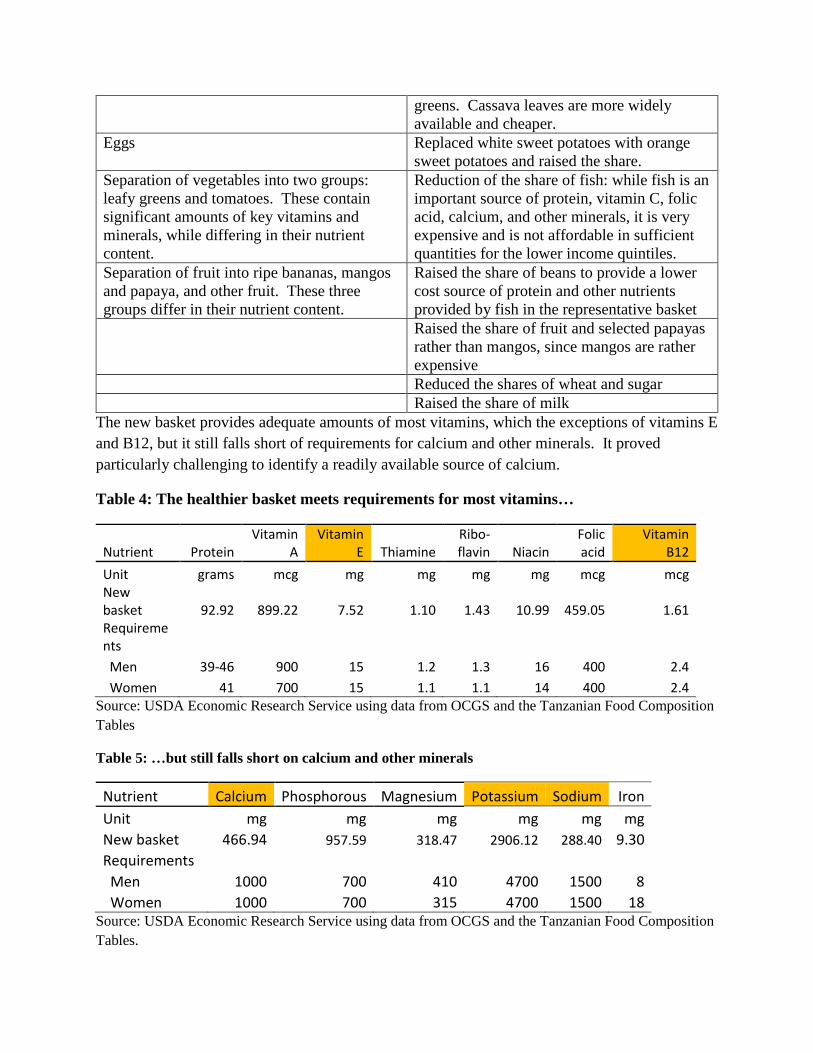
Eggs Replaced white sweet potatoes with orange sweet potatoes and raised the share.
Separation of vegetables into two groups: leafy greens and tomatoes. These contain significant amounts of key vitamins and minerals, while differing in their nutrient content.
Reduction of the share of fish: while fish is an important source of protein, vitamin C, folic acid, calcium, and other minerals, it is very expensive and is not affordable in sufficient quantities for the lower income quintiles.
Separation of fruit into ripe bananas, mangos and papaya, and other fruit. These three groups differ in their nutrient content.
Raised the share of beans to provide a lower cost source of protein and other nutrients provided by fish in the representative basket
Raised the share of fruit and selected papayas rather than mangos, since mangos are rather expensive
Reduced the shares of wheat and sugar Raised the share of milk
The new basket provides adequate amounts of most vitamins, which the exceptions of vitamins E and B12, but it still falls short of requirements for calcium and other minerals. It proved particularly challenging to identify a readily available source of calcium.
Table 4: The healthier basket meets requirements for most vitamins…
Nutrient Protein Vitamin
A Vitamin
E Thiamine Ribo-flavin Niacin
Folic acid
Vitamin B12
Unit grams mcg mg mg mg mg mcg mcg New basket 92.92 899.22 7.52 1.10 1.43 10.99 459.05 1.61 Requirements Men 39-46 900 15 1.2 1.3 16 400 2.4 Women 41 700 15 1.1 1.1 14 400 2.4
Source: USDA Economic Research Service using data from OCGS and the Tanzanian Food Composition Tables
Table 5: …but still falls short on calcium and other minerals
Nutrient Calcium Phosphorous Magnesium Potassium Sodium Iron Unit mg mg mg mg mg mg New basket 466.94 957.59 318.47 2906.12 288.40 9.30 Requirements Men 1000 700 410 4700 1500 8 Women 1000 700 315 4700 1500 18
Source: USDA Economic Research Service using data from OCGS and the Tanzanian Food Composition Tables.
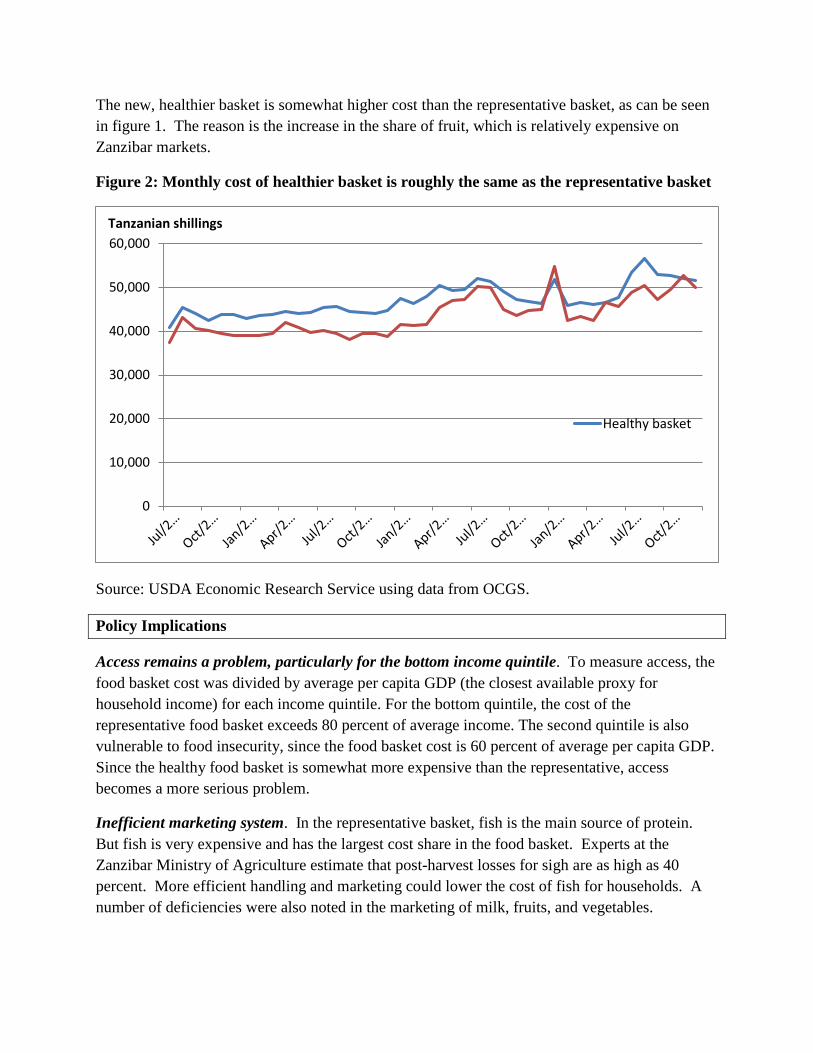
The new, healthier basket is somewhat higher cost than the representative basket, as can be seen in figure 1. The reason is the increase in the share of fruit, which is relatively expensive on Zanzibar markets.
Figure 2: Monthly cost of healthier basket is roughly the same as the representative basket
Source: USDA Economic Research Service using data from OCGS.
Policy Implications
Access remains a problem, particularly for the bottom income quintile. To measure access, the food basket cost was divided by average per capita GDP (the closest available proxy for household income) for each income quintile. For the bottom quintile, the cost of the representative food basket exceeds 80 percent of average income. The second quintile is also vulnerable to food insecurity, since the food basket cost is 60 percent of average per capita GDP. Since the healthy food basket is somewhat more expensive than the representative, access becomes a more serious problem.
Inefficient marketing system. In the representative basket, fish is the main source of protein. But fish is very expensive and has the largest cost share in the food basket. Experts at the Zanzibar Ministry of Agriculture estimate that post-harvest losses for sigh are as high as 40 percent. More efficient handling and marketing could lower the cost of fish for households. A number of deficiencies were also noted in the marketing of milk, fruits, and vegetables.
0
10,000
20,000
30,000
40,000
50,000
60,000Tanzanian shillings
Healthy basket
Need for nutritional education. Leafy green vegetables are widely grown in Zanzibar, but they are not consumed by households—examples are cassava and pumpkin leaves. Some nutrition projects are aimed at educating households on the importance of vegetables to a healthy diet, but they are only reaching a small portion of the population. Additionally, the Zanzibar food basket would benefit from some substitution away from rice, but nutrition experts there believe that that rice consumption is such a strong cultural tradition that it would be difficult to persuade households to consume less of it.
Fortification of foods may be necessary. It proved particularly difficult to identify sources of calcium, and fortification may be the only way to provide adequate amounts of calcium.
Selected References
Cochrane, Nancy and Anna D’Souza. 2015. Measuring Access to Food in Tanzania: a Food Basket Approach. EIB 135. U.S. Department of Agriculture, Economic Research Service. Office of the Chief Government Statistician (OCGS). 2012. Household Budget Survey, 2009/10. Tanzania Food Composition Tables. November 2008. Compiled by Muhimbili University of Health and Allied Sciences (MUHAS), Dar es Salaam; Tanzania Food and Nutrition Centre (TFNC), Dar es Salaam; and the Harvard School of Public Health (HSPH), Boston, MA.