Embed Size (px)
Citation preview
Constructing the Brazilian Greenhouse Gas
Measurement network
Luciana V. Gatti1, Alexandre Martinewski1, John B. Miller2, Emanuel Gloor3, Luana S. Basso1, Lucas G. Domingues1, Caio S. C. Correia1, V. F. Borges1, M. H. Santos1, H.R. Rocha4, Marcos H. Costa5, Ed Dlugokencky2, A. Crotwell2, Kirk W Thoning2, Pieter
Tans2
1 IPEN/CQMA/LQA (Nuclear and Energy Research Institute), Sao Paulo, SP, Brazil2 NOAA/ESRL/GMD (Global Monitoring Division), Boulder, Colorado, US3University of Leeds, School of Geography, UK4IAG/USP Instituto Astronomico e Geofisico, Sao Paulo, Brazil5MCT - Ministry of Science and Technology – Climate Global Change

50% Global Tropical Forest
~ 120Pg above ground biomass
Amazon river discharge ~20% of
Global fresh water input to ocean
~20% Global biodiversity
Vertical Profiles started Dec 2000 – NOAA/CMDL/CCGG
2003 GHG IPEN Lab was constructed in NOAA and
2004 – 2009 GHG analysis at IPEN
(Funded by NASA – Ecology)
2009-2013 – Funded by FAPESP
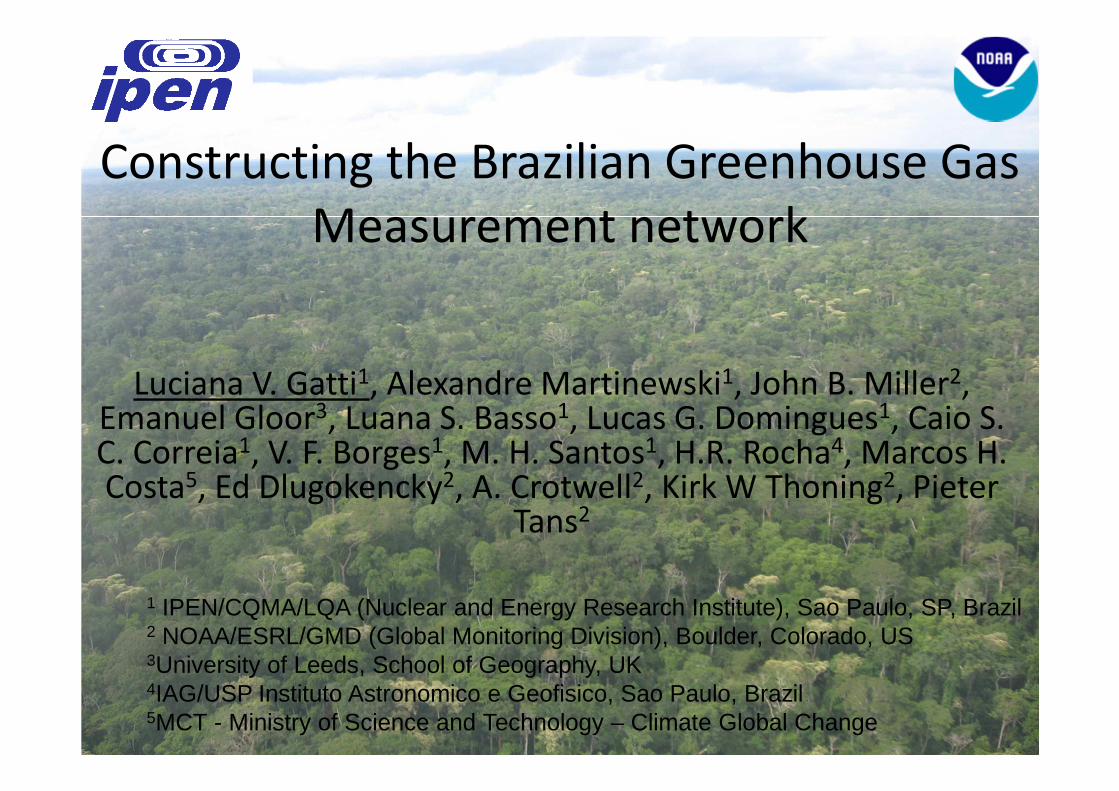
2006 IPEN/NOAA/INMET started GHG
flasks measures weekly at Arembepe
GAW Global station –
Closed Jan 2010 by INMET
2010 – Started biweekly Vertical Profiles at:
RBA, TAB and ALF
- Coast flasks samples Salinopolis and Natal
379
381
383
385
387
389
391
393
395
9/20/06 4/8/07 10/25/07 5/12/08 11/28/08 6/16/09 1/2/10
CO
2 (p
pm)
CO2 Arembepe - IPEN,NOAA, Ascension
IPEN NOAA
CO2, CH4, N20, SF6 and CO
365
370
375
380
385
390
395
400
00 01 02 03 04 05 06 07 08 09 10 11 12
CO
2m
ixin
g ra
tio (
ppm
)
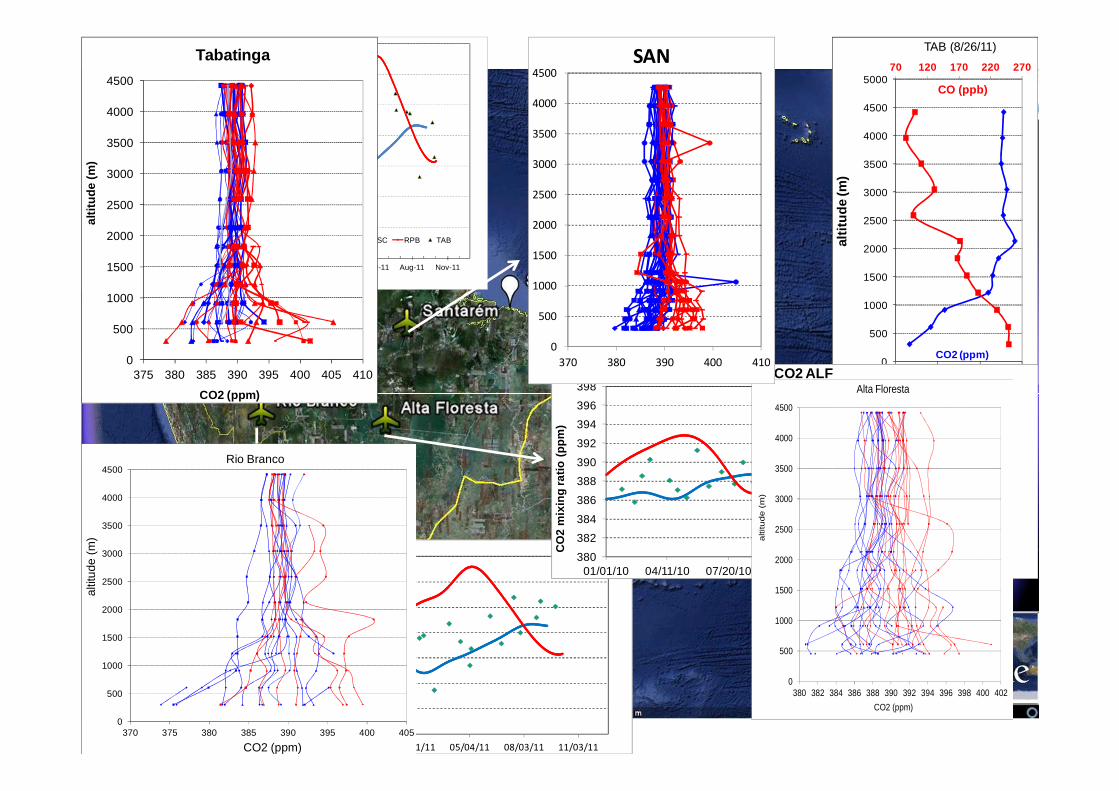
CO2 - mean vertical profile - SAN
ASC RPB SAN
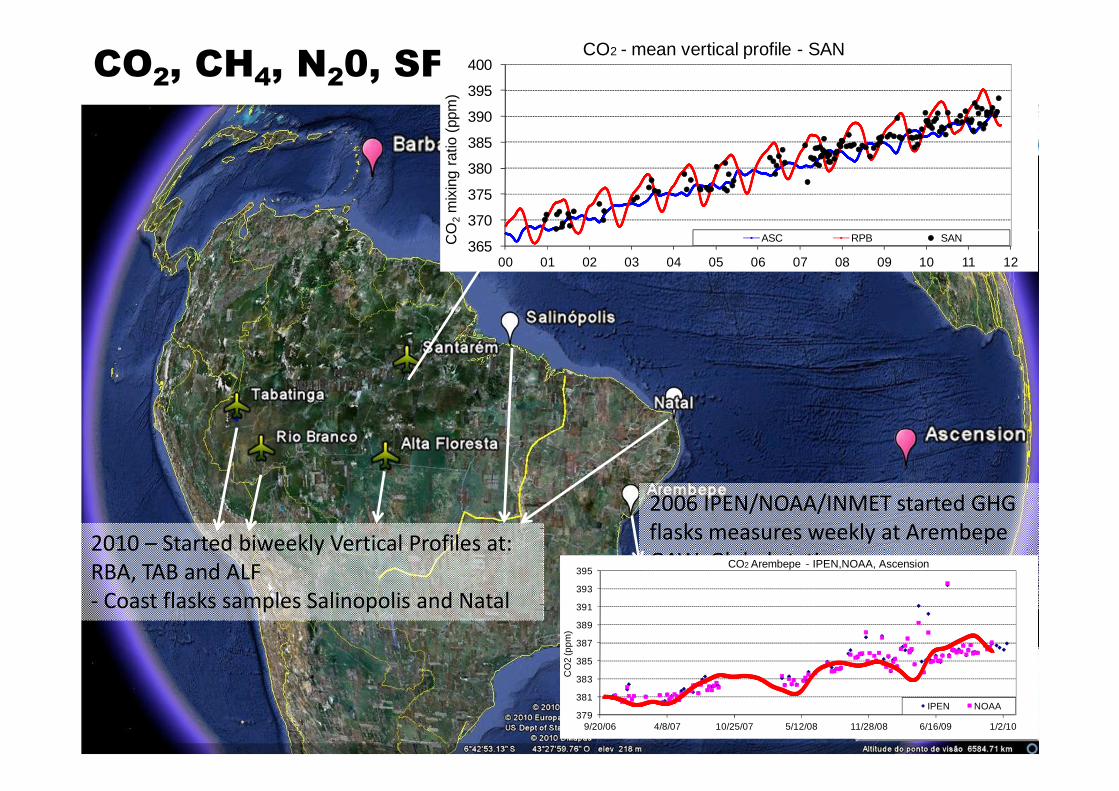
Sampling with Aircraft Vertical Profiles in Amazon Basin
MAGICC System
PFP and PCP
382.00
384.00
386.00
388.00
390.00
392.00
394.00
396.00
11/01/09 01/31/10 05/03/10 08/02/10 11/02/10 02/01/11 05/04/11 08/03/11 11/03/11
CO
2 m
ixin
g r
ati
o (
pp
m)
CO2 RBA
0
500
1000
1500
2000
2500
3000
3500
4000
4500
370 375 380 385 390 395 400 405
altit
ude
(m)
CO2 (ppm)
Rio Branco
382.00
384.00
386.00
388.00
390.00
392.00
394.00
396.00
Aug-09 Nov-09 Feb-10 May-10 Aug-10 Nov-10 Feb-11 May-11 Aug-11 Nov-11
CO
2m
ixin
g ra
tio (p
pm
)
ASC RPB TAB
TAB
0
500
1000
1500
2000
2500
3000
3500
4000
4500
375 380 385 390 395 400 405 410
alti
tud
e (m
)
CO2 (ppm)
Tabatinga70 120 170 220 270
0
500
1000
1500
2000
2500
3000
3500
4000
4500
5000
377 382 387 392
CO (ppb)
alti
tud
e (m
)
CO2 (ppm)
TAB (8/26/11)
380
382
384
386
388
390
392
394
396
398
01/01/10 04/11/10 07/20/10 10/28/10 02/05/11 05/16/11 08/24/11C
O2
mix
ing
rat
io (
pp
m)
CO2 ALF
0
500
1000
1500
2000
2500
3000
3500
4000
4500
380 382 384 386 388 390 392 394 396 398 400 402
alti
tud
e (
m)
CO2 (ppm)
Alta Floresta
0
500
1000
1500
2000
2500
3000
3500
4000
4500
370 380 390 400 410
SAN

Flask sampling in surface in Brazilian coast sites
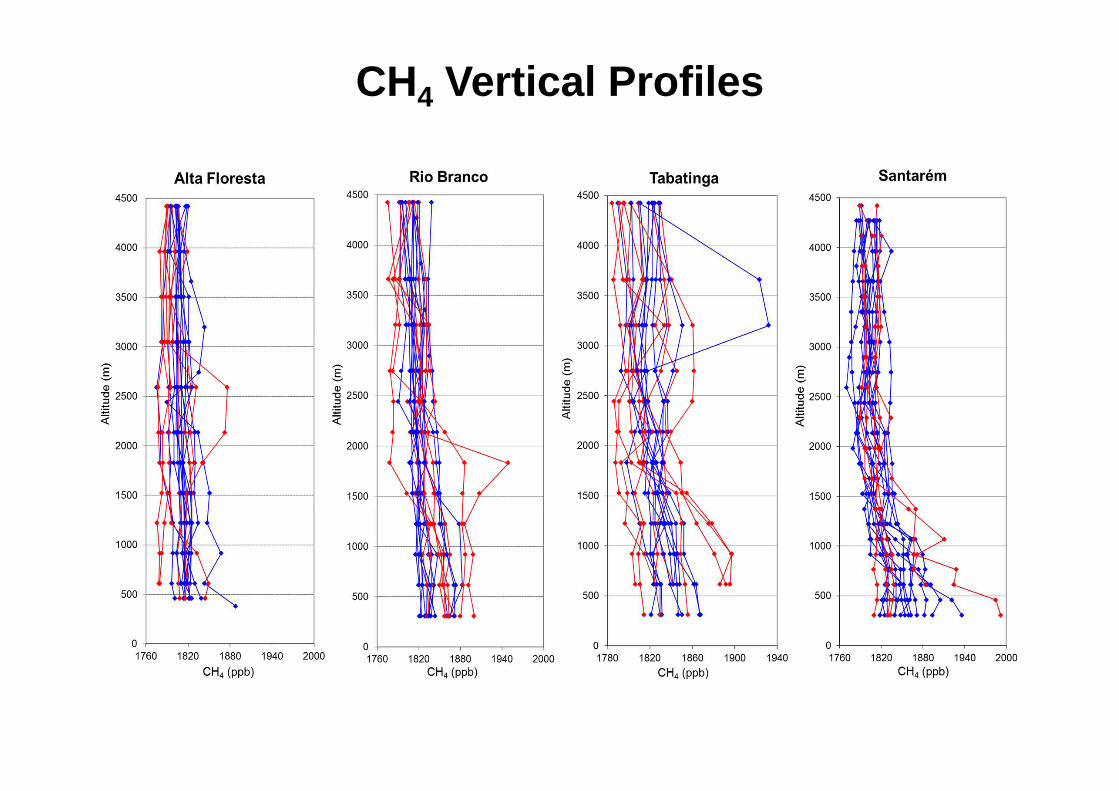
CH4 Vertical Profiles

CH4 concentration
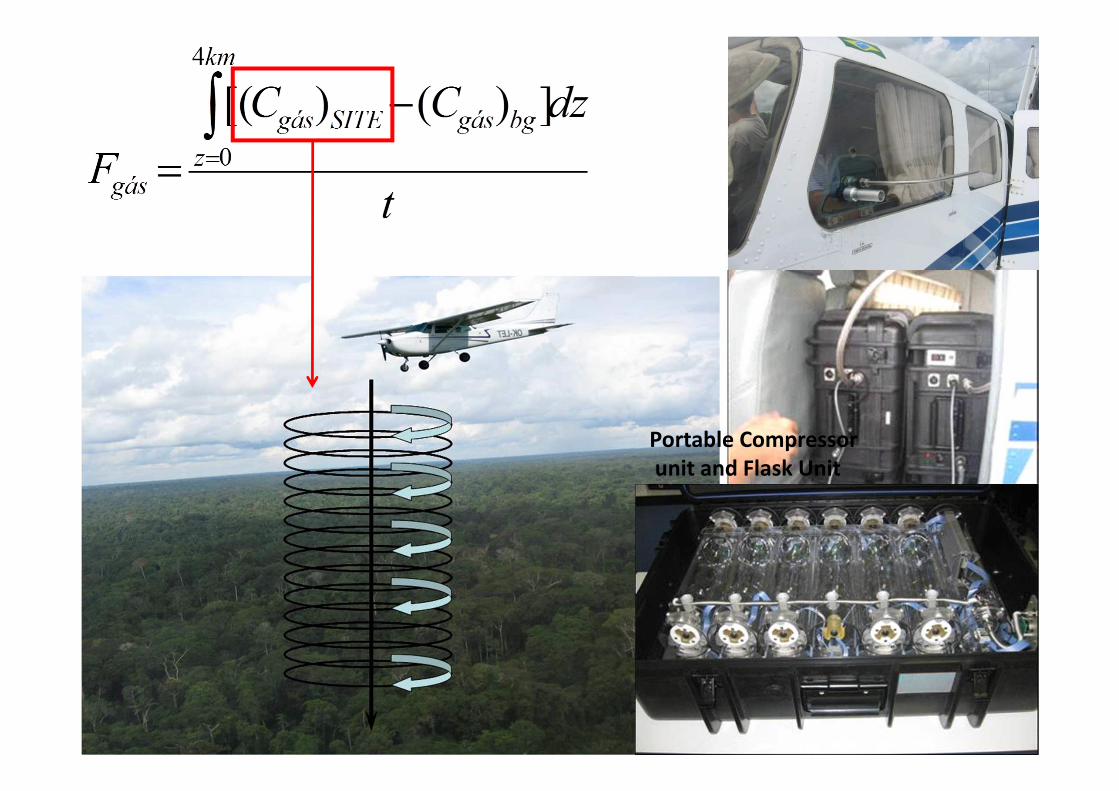
Portable Compressor
unit and Flask Unit
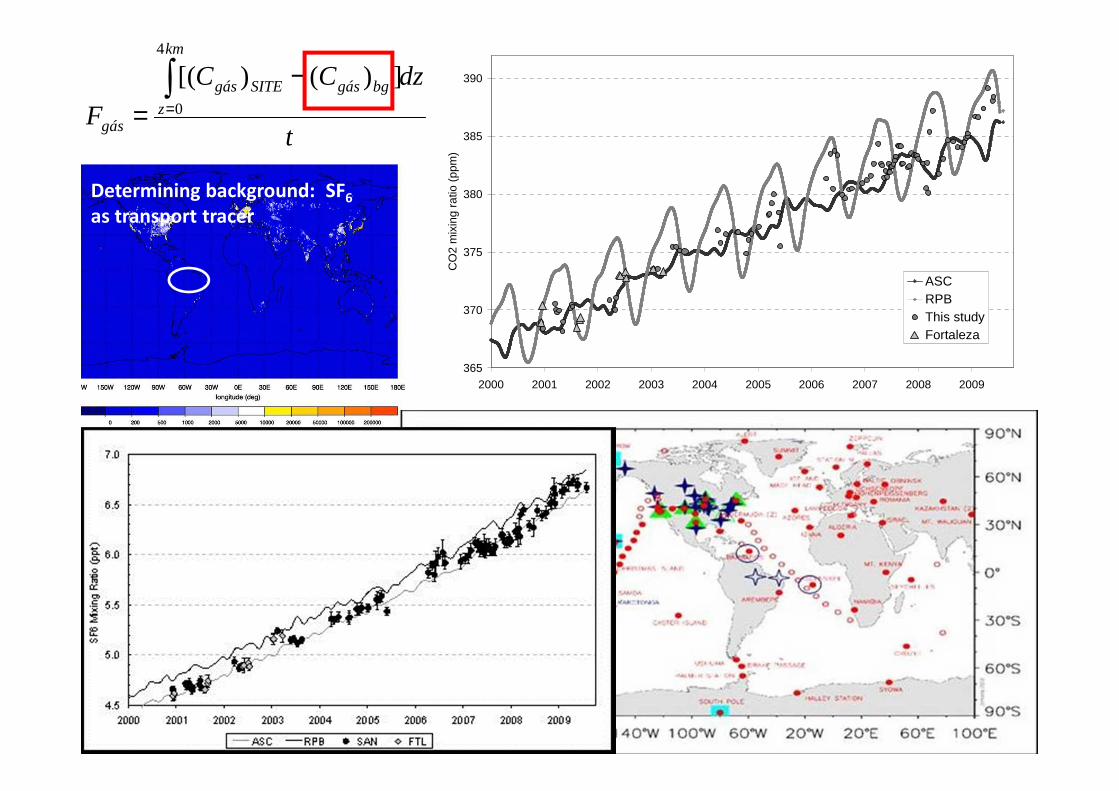
Determining background:
fractions of NH and SH Air
t
dzCC
F
km
z
bggásSITEgás
gás
∫=
−=
4
0
])()[(Background
ASCASCRPBRPBbggás CfCfC +=)(
Determining background: SF6
as transport tracer
ASCRPB
RPBASC
RPBSANASC
ff
CC
CCf
−=−−=
1365
370
375
380
385
390
2000 2001 2002 2003 2004 2005 2006 2007 2008 2009
CO
2 m
ixin
g ra
tio (
ppm
)
ASCRPBThis studyFortaleza
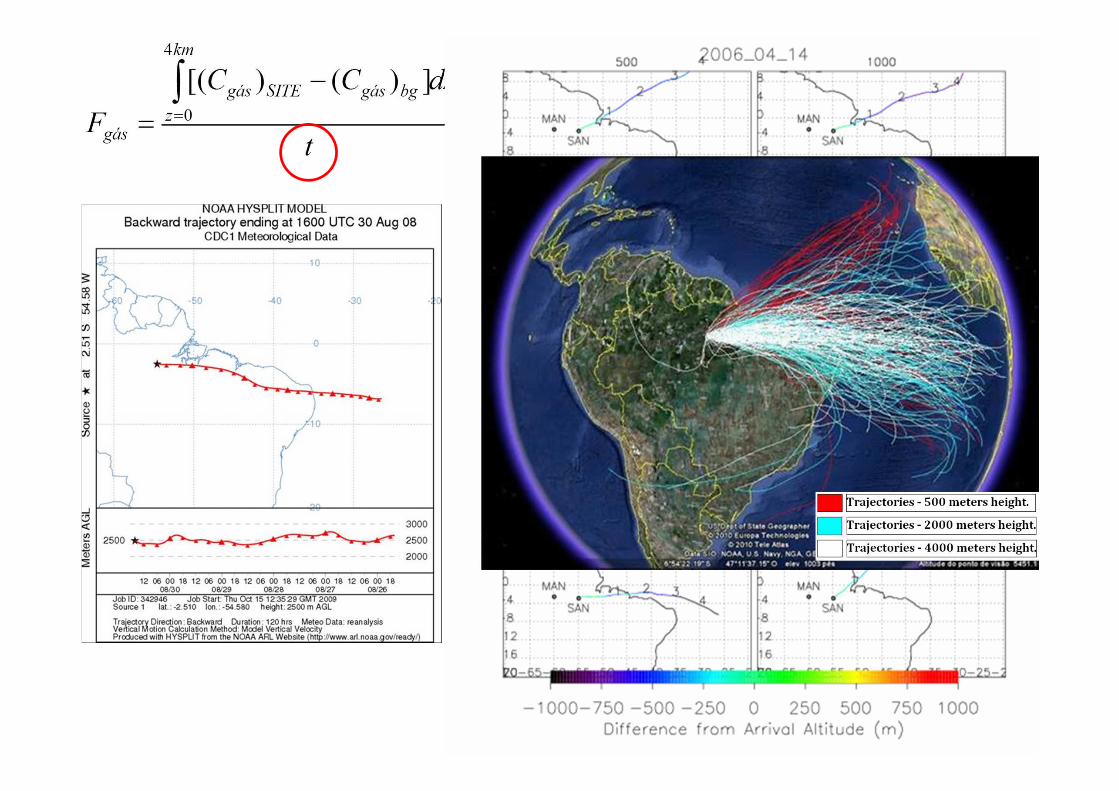
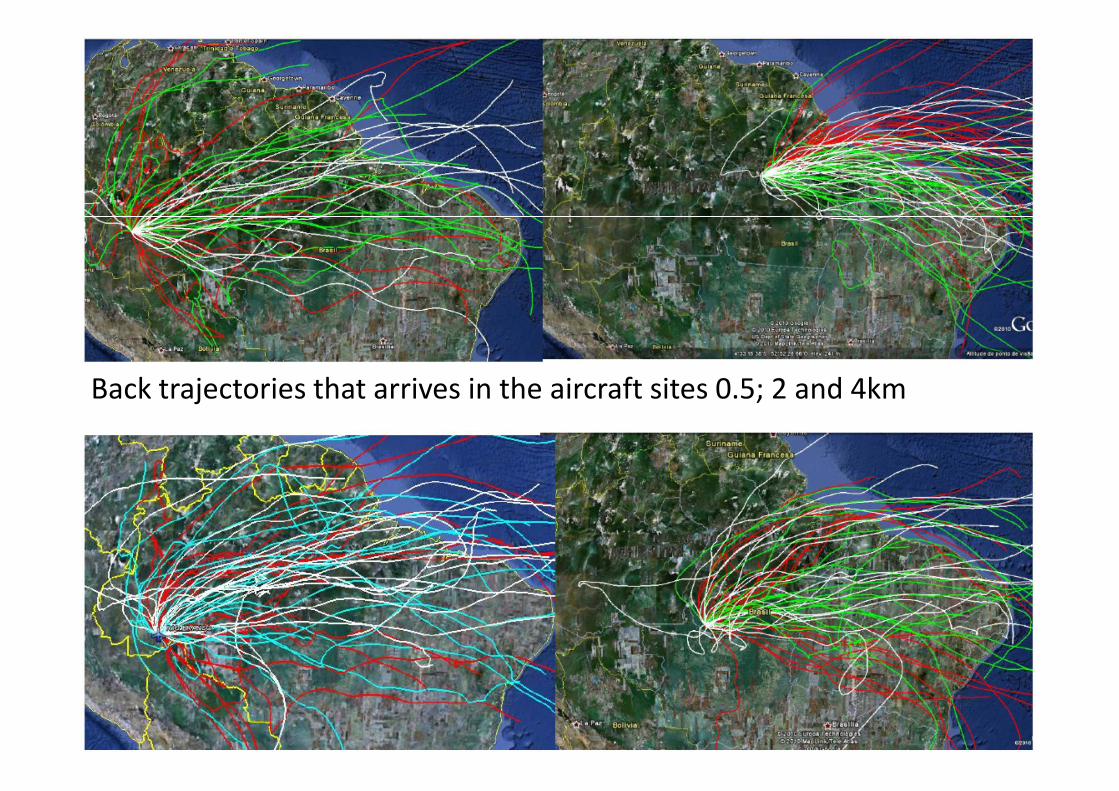
Back trajectories that arrives in the aircraft sites 0.5; 2 and 4km
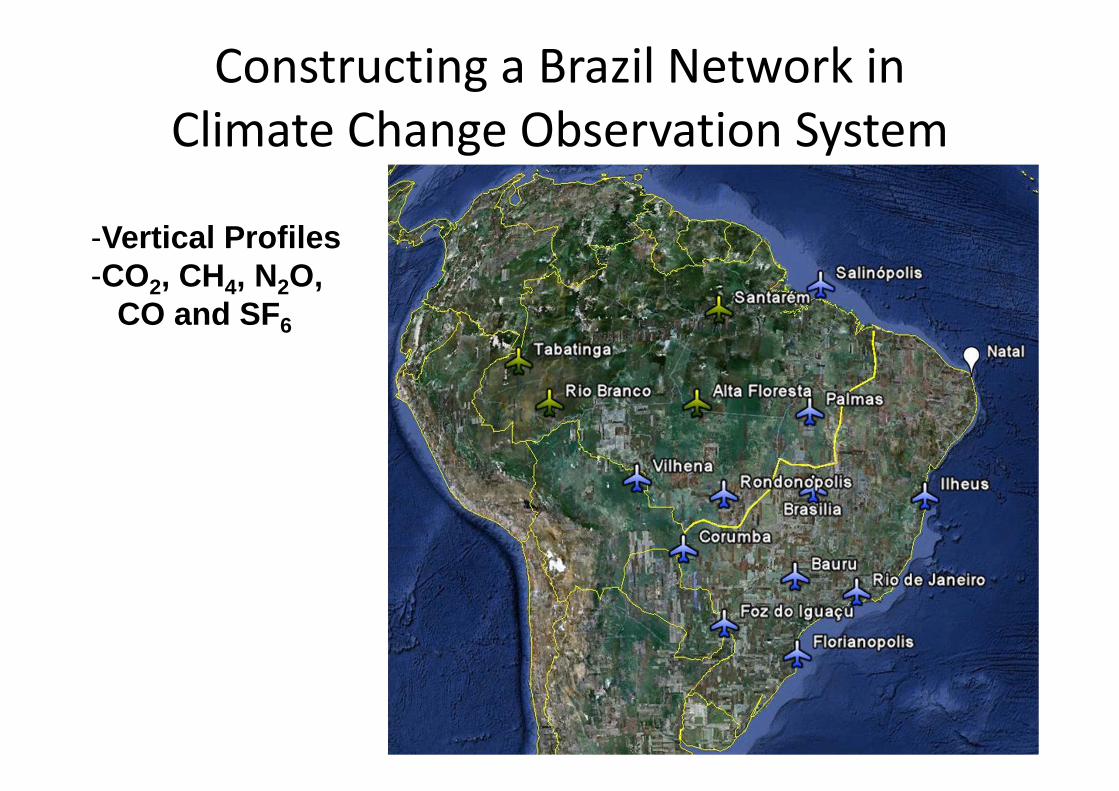
Constructing a Brazil Network in
Climate Change Observation System
-Vertical Profiles-CO2, CH4, N2O,
CO and SF6

Constructing a Brazil Network in
Climate Change Observation System
-Towers
CO2 flux towerEddy covariance
- Create a protocol for tower measures
with automatic calibrations
- Central Laboratory Facilities (LQA/IPEN)
for calibrate all standards used in GHG
measures
- Comparison program with towers using
flasks

Thank you
NOAA/ESRL/GMDNASAWMONERCFAPESPMCT/BRAZIL GOV.