Embed Size (px)
Citation preview
Construction and Hawaii’s Economy http://dbedt.hawaii.gov/
qu
Construction and Hawaii’s Economy an analysis of the past and forecast of the future
February 20, 2014
2 Construction and Hawaii’s Economy http://dbedt.hawaii.gov/
TABLE OF CONTENTS
1. INTRODUCTION 5
2. HAWAII’S CONSTRUCTION INDUSTRY: Performance Over the Past Decade 6
2.1 Overview of the Construction Industry 7
2.2 Residential Construction Units 10
2.3 Value of State Private Building Permits 11
2.4 Value of County Private Building Permits 12
Honolulu County Private Building Permits 12
Hawaii County Private Building Permits 15
Maui County Private Building Permits 17
Kauai County Private Building Permits 19
2.5 State Capital Improvement Project Expenditures 20
2.6 State Contracting Tax Base 21
2.7 Honolulu Construction Cost Indices 23
2.8 Major Construction Projects of 2013 25
3. CONSTRUCTION AND HAWAII’S ECONOMY 30
3.1 Hawaii Construction Industry’s Direct Contribution to Nominal GDP 31
3.2 Construction Labor Productivity 35
3.3 Construction Industry’s Economic Impact 36
4. HOUSING SUPPLY AND DEMAND IN HAWAII 37
4.1 Population and Housing Growth 37
4.2 Home Ownership 38
4.3 Vacancy Rates 40
4.4 Household Size 41
4.5 Number of Housing Units Required 42
5. CONSTRUCTION FORECAST: 2014 and 2015 43
6. CONCLUSIONS 47
3 Construction and Hawaii’s Economy http://dbedt.hawaii.gov/
LIST OF TABLES
Table 1. Major Construction Projects 2001-2012 9 Table 2. State Private Building Permit Values in 2013: Percentage Share and Growth 11 Table 3. Honolulu County Private Building Permit Values in 2013: Percentage Share and Growth 12 Table 4. Hawaii County Private Building Permit Values in 2013: Percentage Share and Growth 15 Table 5. Maui County Private Building Permit Values in 2013: Percentage Share and Growth 17 Table 6. Hawaii State Capital Improvement Project Expenditure 20 Table 7. State of Hawaii Contracting Tax Base 22 Table 8. Major Projects Permitted in 2013 26 Table 9. Major Rail Contracts Awarded as of November 2013 29 Table 10. Construction Industry GDP for Hawaii and the U.S. 32 Table 11. Construction Industry Jobs in Hawaii and the U.S. 34 Table 12. Construction Industry Multipliers 36 Table 13. Percentage Share of Inter-Industry Output 36 Table 14. Vacancy as a Percentage of Total Housing Units 41 Table 15. Definition of Variables used in Forecasting Models 43 Table 16. Specification of Regression Models 44 Table 17. Construction Industry Forecast by Category 44
4 Construction and Hawaii’s Economy http://dbedt.hawaii.gov/
LIST OF FIGURES
Figure 1. U.S. Real GDP Growth 6
Figure 2. U.S. Construction Spending Annual Growth: Public and Private 7
Figure 3. Comparison of Hawaii’s Construction Industry With Total GDP Growth 8
Figure 4. U.S. and Hawaii New Housing Units 10
Figure 5. State of Hawaii Monthly Value of Private Building Permits 11
Figure 6. Honolulu County Monthly Value of Private Building Permits 13
Figure 7. Honolulu Additions and Alterations Permit Values with Photovoltaic 14
Figure 8. Hawaii County Monthly Value of Private Building Permits 16
Figure 9. Maui County Monthly Value of Private Building Permits 18
Figure 10. Kauai County Monthly Value of Residential Building Permits 19
Figure 11. State Contracting Tax Base Annual Growth 21
Figure 12. Annual Percentage Change of Honolulu Construction Cost Indices 24
Figure 13. Map of Honolulu Rail Route and Transit Stations 28
Figure 14. Hawaii and U.S. Construction Industry Real Growth 30
Figure 15. Construction Industry’s Direct Contribution to Nominal GDP 31
Figure 16. Construction Industry’s Direct Contribution to Total Jobs 33
Figure 17. Productivity of the Construction Industry and the Economy 35
Figure 18. Historical Trend of Housing and Population Growth in Hawaii 38
Figure 19. Homeownership Trends, Hawaii vs. U.S. 39
Figure 20. Hawaii Vacancies as Percentage of Total Housing Units 40
Figure 21. Hawaii Average Household Size 41
5 Construction and Hawaii’s Economy http://dbedt.hawaii.gov/
The construction industry is the fourth largest private industry in Hawaii as measured by the share of the
State’s gross domestic product (GDP), following tourism, real estate, and health care. In 2013, the
construction industry completed an estimated $7.7 billion of projects, generated $4 billion in GDP, and
contributed 32,000 payroll jobs to the economy.
Construction demand is influenced by the growth of population and the growth of other industries
including hotel, retail, education, healthcare, and Federal military. Construction is also influenced by the
monetary policy of the Federal Reserve Bank, which adjusts interest rates thus affecting the cost of
construction loans.
The construction industry differs from other industries in that, not only does it add economic value to the
current year, but it also contributes to the capital stock to be used in future years. This is significant
because capital stock is one of the main factors determining long term economic growth.
Governments often use construction as the main fiscal policy tool to adjust economic growth, especially
at the state and county levels. When the economy is in recession, governments tend to spend more on
public construction by raising funds from selling government bonds. When the economy is in the
expansion phase, governments tend to restrict public spending on capital projects and divert the money to
other uses such as reserves and a rainy day fund. This practice helps to stabilize the construction industry
and thus help the overall economic growth.
This report examines the trends of Hawaii’s construction industry during the previous and the current
business cycles, identifies the demand drivers for Hawaii’s construction industry especially for housing,
analyzes the economic contribution of the construction industry, and forecasts the growth of the industry
for 2014 and 2015.
1. INTRODUCTION
6 Construction and Hawaii’s Economy http://dbedt.hawaii.gov/
The Great Recession has been the largest economic calamity of our generation. This recession started in
December 2007 and lasted until June of 2009. During this time the country experienced a plunge in real
estate values, deep declines in the stock market, a credit crisis, and an unemployment rate that was
unprecedented in recent history.
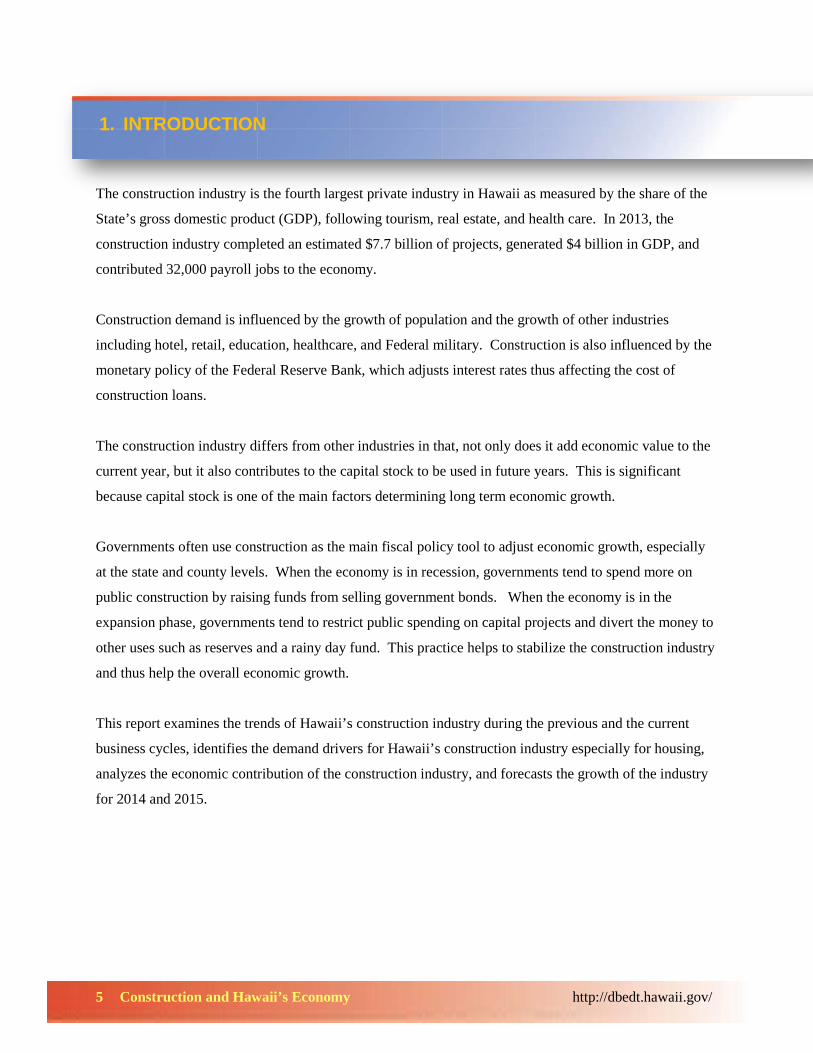
From June 2009, the U.S. economy entered the expansion phase of the business cycle. Real GDP growth
was 2.5 percent in 2010, 1.8 percent in 2011, and 2.8 percent in 2012 (Figure 1). The estimate for 2013
real GDP annual growth was 1.9 percent (BEA 2014). The major drag on 2013 growth was a decrease in
federal spending. While 2013 growth was below 2012, the end of 2013 saw an acceleration of growth in
the second half of the year, with 3rd and 4th quarter growth rates increasing at 4.1 percent and 3.2 percent
respectively over the previous quarters (BEA 2014)
Figure 1. U.S. Real GDP Growth
Source: U.S. Bureau of Economic Analysis 2013 figure is the Bureau of Economic Analysis advance estimate 1/30/2014 /shaded area is Great Recession from 12/2007 to 6/2009 as defined by NBER
-4%
-3%
-2%
-1%
0%
1%
2%
3%
4%
5%
2003 2004 2005 2006 2007 2008 2009 2010 2011 2012 2013
2. HAWAII’S CONSTRUCTION INDUSTRY: performance over the past decade
7 Construction and Hawaii’s Economy http://dbedt.hawaii.gov/
2.1 Overview of the Construction Industry
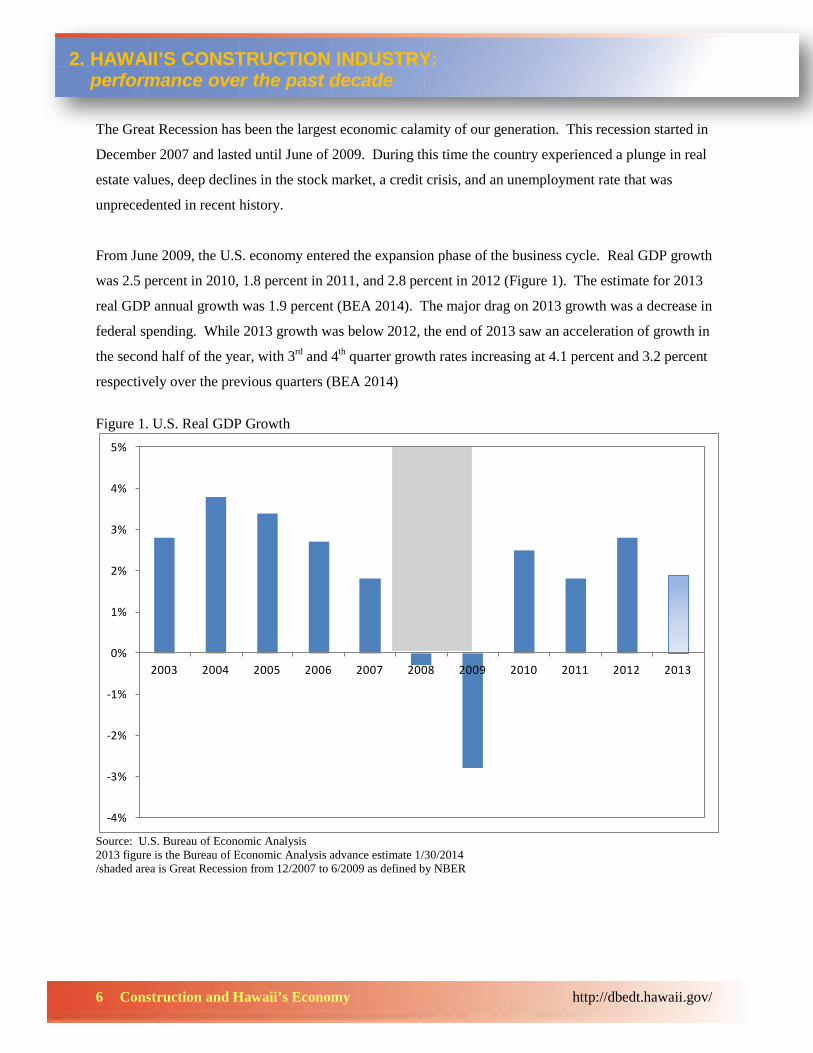
The recession hit the construction industry especially hard. Overall, construction spending in the U.S.
declined drastically from a peak of $1.2 trillion in 2008 to a trough of $750 billion in 2011. While
construction spending was one of the hardest hit sectors, it was also a tool used by the federal government
to stimulate the economy during the recession. The percentage of construction spending by the public
sector as a percentage of total construction spending rose from a pre-recession average of 23 percent
(2003 to 2007) to an average of 34 percent after the start of the recession (2008-2012). However, as the
economy recovered, the federal government throttled back on construction stimulus measures. From
2011 through 2013, the private sector has been increasing construction spending while the public sector
has been reducing spending (Figure 2). One of the reasons for the rapid growth in the private sector is
pent up demand. As individuals and companies conserved cash during the recession, many construction
projects were put on hold. The recent increase in private sector spending is an indicator that the private
sector is starting to utilize their resources for new construction and capital improvement projects.
Figure 2. U.S. Construction Spending Annual Growth: Public and Private
Source: U.S. Census Bureau 2013 2013 is annualized estimate based on year to date growth
-25.0%
-20.0%
-15.0%
-10.0%
-5.0%
0.0%
5.0%
10.0%
15.0%
20.0%
25.0%
2003 2004 2005 2006 2007 2008 2009 2010 2011 2012 2013
Public Private
8 Construction and Hawaii’s Economy http://dbedt.hawaii.gov/
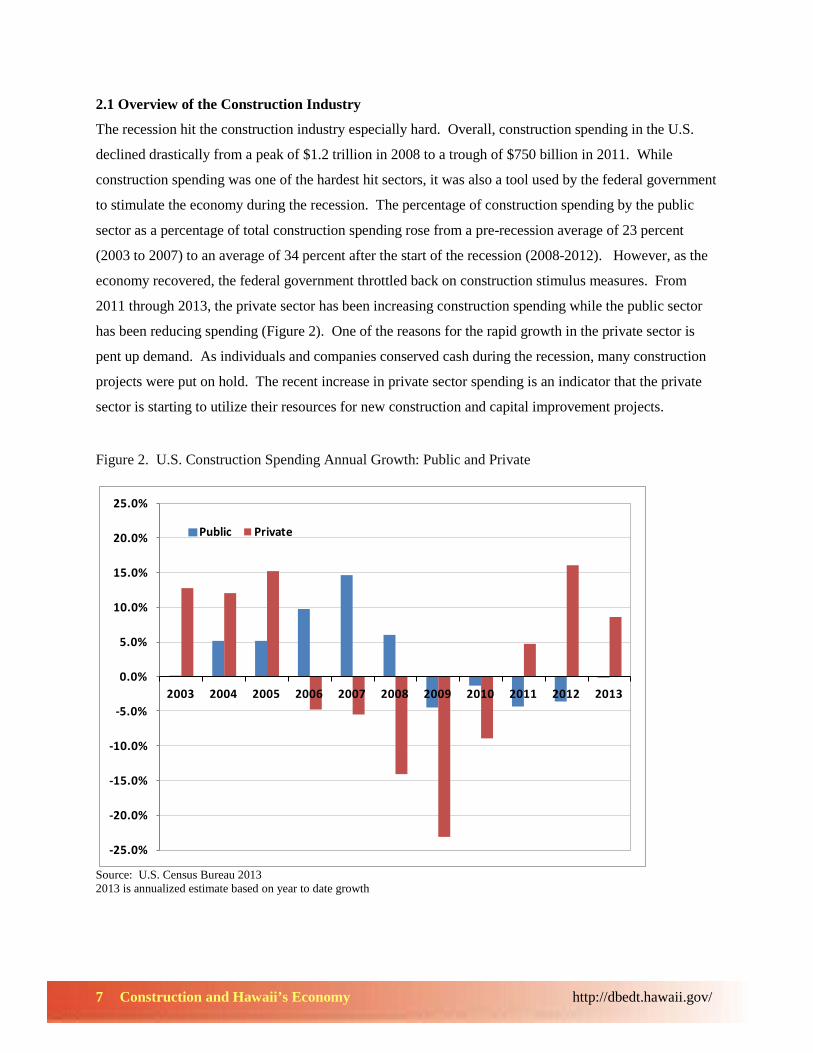
During the last decade, the state’s construction industry experienced a period of expansion, severe
contraction, and renewed expansion. The construction industry started the new millennium strong with
seven consecutive years of annual real GDP growth from 2002 through 2007 and an annual compound
growth rate at 5.6 percent during these seven years. The growth rate peaked in 2005 at 12.7 percent and
then began a dramatic slide with 2006 at 1.5 percent and 2007 at 2.5 percent. In 2008, growth came to a
virtual halt as the impacts of the recession began to take hold of the construction industry. In 2008,
Hawaii’s construction industry growth rate dropped to near zero and then declined to a negative 12.3
percent in 2009. As the state’s economy emerged from the recession, Hawaii’s construction industry
recovery lagged that of the state’s overall economy. In 2010, the state’s overall economy grew at a rate of
3.1 percent, while the construction industry declined 1.5 percent. In 2011, the state’s economy grew at
2.1 percent, while the construction industry declined 0.5 percent. However, this trend reversed in 2012 as
Hawaii’s construction industry surpassed the total state GDP growth rate, with state total real GDP
growth at 1.6 percent and the construction sector at 1.9 percent (Figure 3). This trend appears to be
continuing in 2014, as Hawaii’s construction industry continues to grow.
Figure 3. Comparison of Hawaii’s Construction Industry With Total GDP Growth
Source: U.S. Bureau of Economic Analysis
-15.0%
-10.0%
-5.0%
0.0%
5.0%
10.0%
15.0%
2001 2002 2003 2004 2005 2006 2007 2008 2009 2010 2011 2012
HI Total Real GDP Growth HI Construction Real GDP Growth
9 Construction and Hawaii’s Economy http://dbedt.hawaii.gov/
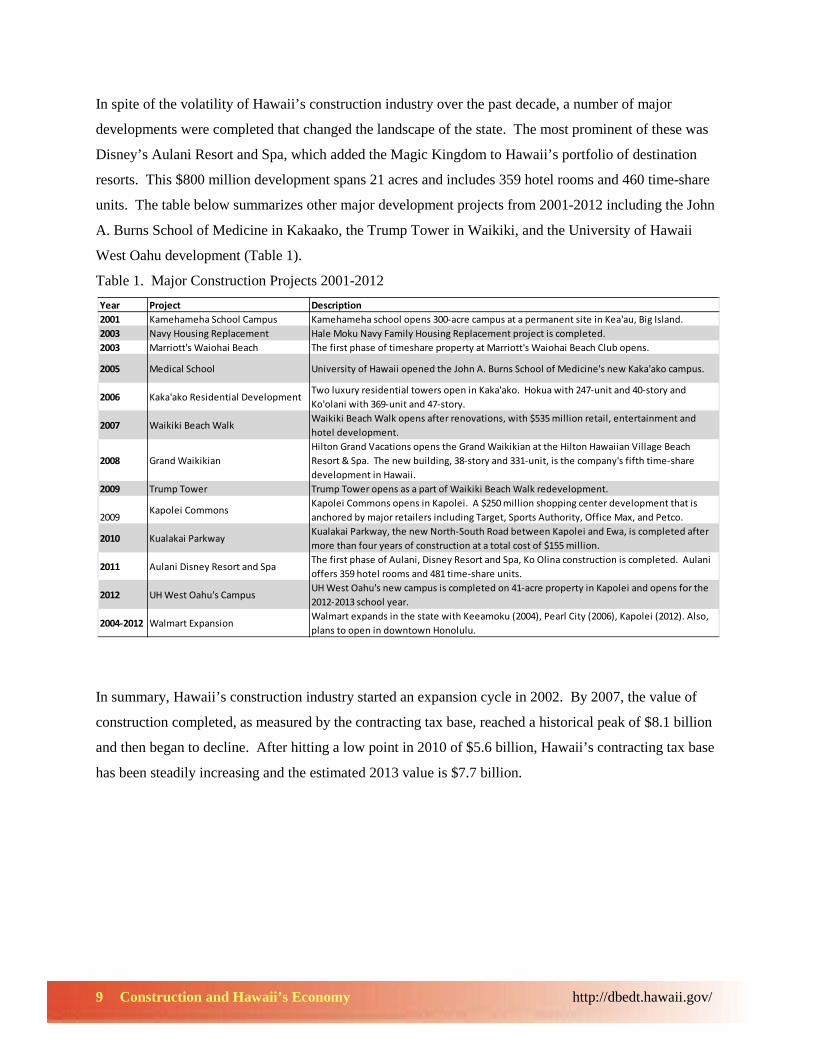
In spite of the volatility of Hawaii’s construction industry over the past decade, a number of major
developments were completed that changed the landscape of the state. The most prominent of these was
Disney’s Aulani Resort and Spa, which added the Magic Kingdom to Hawaii’s portfolio of destination
resorts. This $800 million development spans 21 acres and includes 359 hotel rooms and 460 time-share
units. The table below summarizes other major development projects from 2001-2012 including the John
A. Burns School of Medicine in Kakaako, the Trump Tower in Waikiki, and the University of Hawaii
West Oahu development (Table 1).
Table 1. Major Construction Projects 2001-2012
In summary, Hawaii’s construction industry started an expansion cycle in 2002. By 2007, the value of
construction completed, as measured by the contracting tax base, reached a historical peak of $8.1 billion
and then began to decline. After hitting a low point in 2010 of $5.6 billion, Hawaii’s contracting tax base
has been steadily increasing and the estimated 2013 value is $7.7 billion.
Year Project Description2001 Kamehameha School Campus Kamehameha school opens 300-acre campus at a permanent site in Kea'au, Big Island.2003 Navy Housing Replacement Hale Moku Navy Family Housing Replacement project is completed.2003 Marriott's Waiohai Beach The first phase of timeshare property at Marriott's Waiohai Beach Club opens.
2005 Medical School University of Hawaii opened the John A. Burns School of Medicine's new Kaka'ako campus.
2006 Kaka'ako Residential DevelopmentTwo luxury residential towers open in Kaka'ako. Hokua with 247-unit and 40-story and Ko'olani with 369-unit and 47-story.
2007 Waikiki Beach WalkWaikiki Beach Walk opens after renovations, with $535 million retail, entertainment and hotel development.
2008 Grand WaikikianHilton Grand Vacations opens the Grand Waikikian at the Hilton Hawaiian Village Beach Resort & Spa. The new building, 38-story and 331-unit, is the company's fifth time-share development in Hawaii.
2009 Trump Tower Trump Tower opens as a part of Waikiki Beach Walk redevelopment.
2009Kapolei Commons
Kapolei Commons opens in Kapolei. A $250 million shopping center development that is anchored by major retailers including Target, Sports Authority, Office Max, and Petco.
2010 Kualakai ParkwayKualakai Parkway, the new North-South Road between Kapolei and Ewa, is completed after more than four years of construction at a total cost of $155 million.
2011 Aulani Disney Resort and SpaThe first phase of Aulani, Disney Resort and Spa, Ko Olina construction is completed. Aulani offers 359 hotel rooms and 481 time-share units.
2012 UH West Oahu's CampusUH West Oahu's new campus is completed on 41-acre property in Kapolei and opens for the 2012-2013 school year.
2004-2012 Walmart ExpansionWalmart expands in the state with Keeamoku (2004), Pearl City (2006), Kapolei (2012). Also, plans to open in downtown Honolulu.
10 Construction and Hawaii’s Economy http://dbedt.hawaii.gov/
2.2 Residential Construction Units
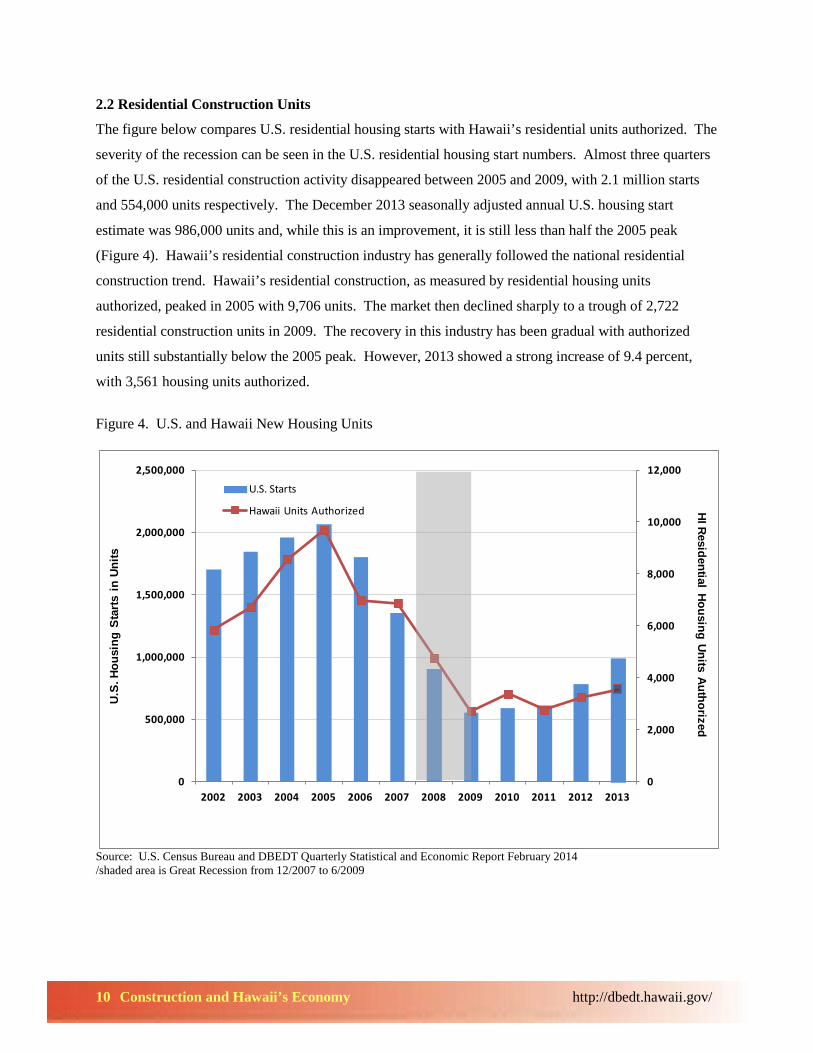
The figure below compares U.S. residential housing starts with Hawaii’s residential units authorized. The
severity of the recession can be seen in the U.S. residential housing start numbers. Almost three quarters
of the U.S. residential construction activity disappeared between 2005 and 2009, with 2.1 million starts
and 554,000 units respectively. The December 2013 seasonally adjusted annual U.S. housing start
estimate was 986,000 units and, while this is an improvement, it is still less than half the 2005 peak
(Figure 4). Hawaii’s residential construction industry has generally followed the national residential
construction trend. Hawaii’s residential construction, as measured by residential housing units
authorized, peaked in 2005 with 9,706 units. The market then declined sharply to a trough of 2,722 residential construction units in 2009. The recovery in this industry has been gradual with authorized
units still substantially below the 2005 peak. However, 2013 showed a strong increase of 9.4 percent,
with 3,561 housing units authorized. Figure 4. U.S. and Hawaii New Housing Units
Source: U.S. Census Bureau and DBEDT Quarterly Statistical and Economic Report February 2014 /shaded area is Great Recession from 12/2007 to 6/2009
0
2,000
4,000
6,000
8,000
10,000
12,000
0
500,000
1,000,000
1,500,000
2,000,000
2,500,000
2002 2003 2004 2005 2006 2007 2008 2009 2010 2011 2012 2013
U.S. Starts
Hawaii Units Authorized
U.S.
Hou
sing
Sta
rtsin
Uni
tsHIResidential Housing Units Authorized
11 Construction and Hawaii’s Economy http://dbedt.hawaii.gov/
2.3 Value of State Private Building Permits
The total value of private building permits in the state was up 3.0 percent in 2013 over 2012. The
Residential category led the growth with an increase of 22.4 percent and the Commercial and Industrial
category followed with an increase of 9.4 percent. However, the Additions and Alterations category was
a drag on growth and declined by 8.9 percent over 2012. As will be discussed below, photovoltaic panel
installations are included in the Additions and Alterations category and the decline can partially be
attributed to Hawaii’s solar tax credit revisions and electrical grid constraints. The largest share of private
construction in the state in 2013 was the Additions and Alterations category, which comprised 51.3
percent. This was followed by Residential at 37.8 percent and Commercial and Industrial at 10.9 percent
(Table 2).
Table 2. State Private Building Permit Values in 2013: Percentage Share and Growth
Category % of Total % Growth from 2012 Residential 37.8% 22.8% Commercial & Industrial 10.9% 9.4% Additions & Alterations 51.3% -8.9% Total 100% 3.0%
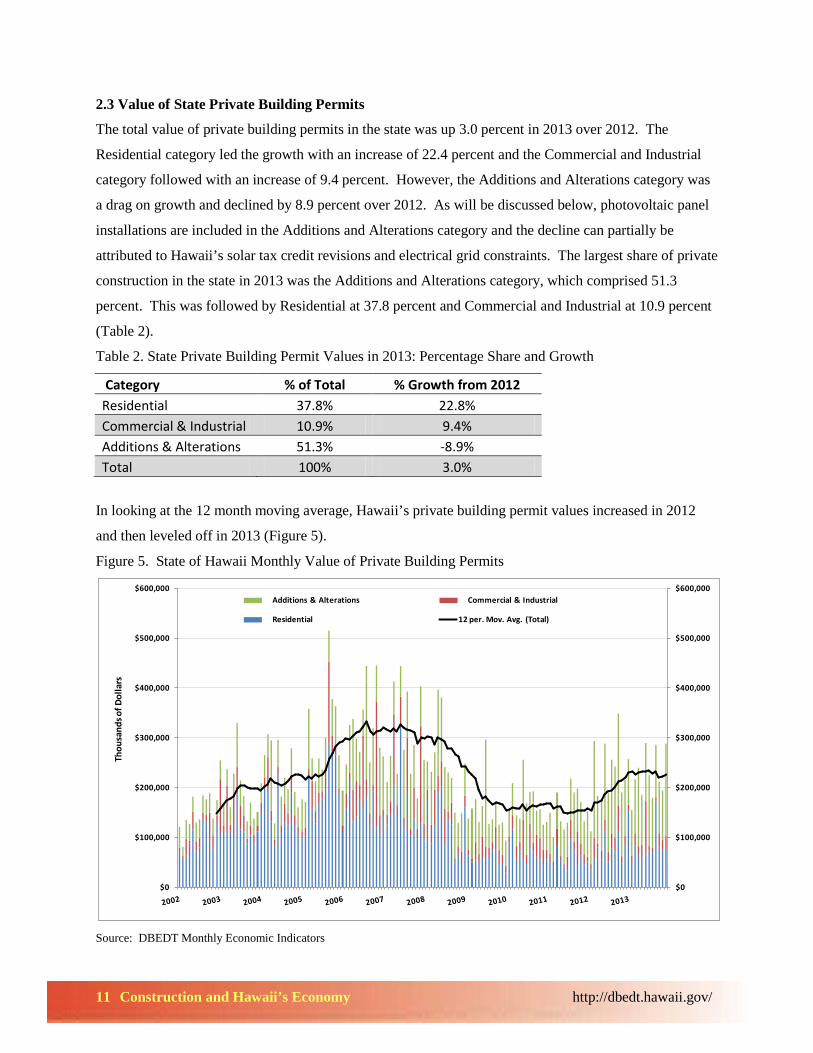
In looking at the 12 month moving average, Hawaii’s private building permit values increased in 2012
and then leveled off in 2013 (Figure 5).
Figure 5. State of Hawaii Monthly Value of Private Building Permits
Source: DBEDT Monthly Economic Indicators
$0
$100,000
$200,000
$300,000
$400,000
$500,000
$600,000
$0
$100,000
$200,000
$300,000
$400,000
$500,000
$600,000Additions & Alterations Commercial & Industrial
Residential 12 per. Mov. Avg. (Total)
Thou
sand
s of D
olla
rs
12 Construction and Hawaii’s Economy http://dbedt.hawaii.gov/
2.4 Value of County Private Building Permits
In 2013, the total value of private building permits for the state was $2.7 billion. Honolulu County made
up the majority of these permits with $1.9 billion or 69 percent of the state total. Honolulu was followed
by Hawaii County with $443.7 million or 16 percent, Maui County with $325.0 million or 12.0 percent,
and Kauai County with $85.4 million or 3 percent (Kauai County private permits only include residential
construction). The following section will examine the construction industry for each county.
Honolulu County Private Building Permits
Honolulu County distinguishes itself as the only county where the industry has recovered to pre-recession
levels. The monthly average permit value from 2003 through 2007 was $118.3 million and from 2008
through 2013 the average has reached $124.9 million.
The 2013 value of Honolulu private building permits increased 5.5 percent over 2012. The Residential
category was up sharply, with a 40.5 percent growth over the same period of 2012. However, the
Commercial and Industrial and Additions and Alterations categories slowed down with declines of 15.8
percent and 5.7 percent respectively over 2012. The Additions and Alterations category was the main
driver for Honolulu construction in 2013, with a share of 61.7 percent of the total. This was followed by
the Residential at 33.9 percent and Commercial and Industrial at 4.4 percent (Table 3).
Table 3. Honolulu County Private Building Permit Values in 2013: Percentage Share and Growth
Category % of Total % Growth from 2012 Residential 33.9% 40.5% Commercial & Industrial 4.4% -15.8% Additions & Alterations 61.7% -5.7% Total 100% 5.5%
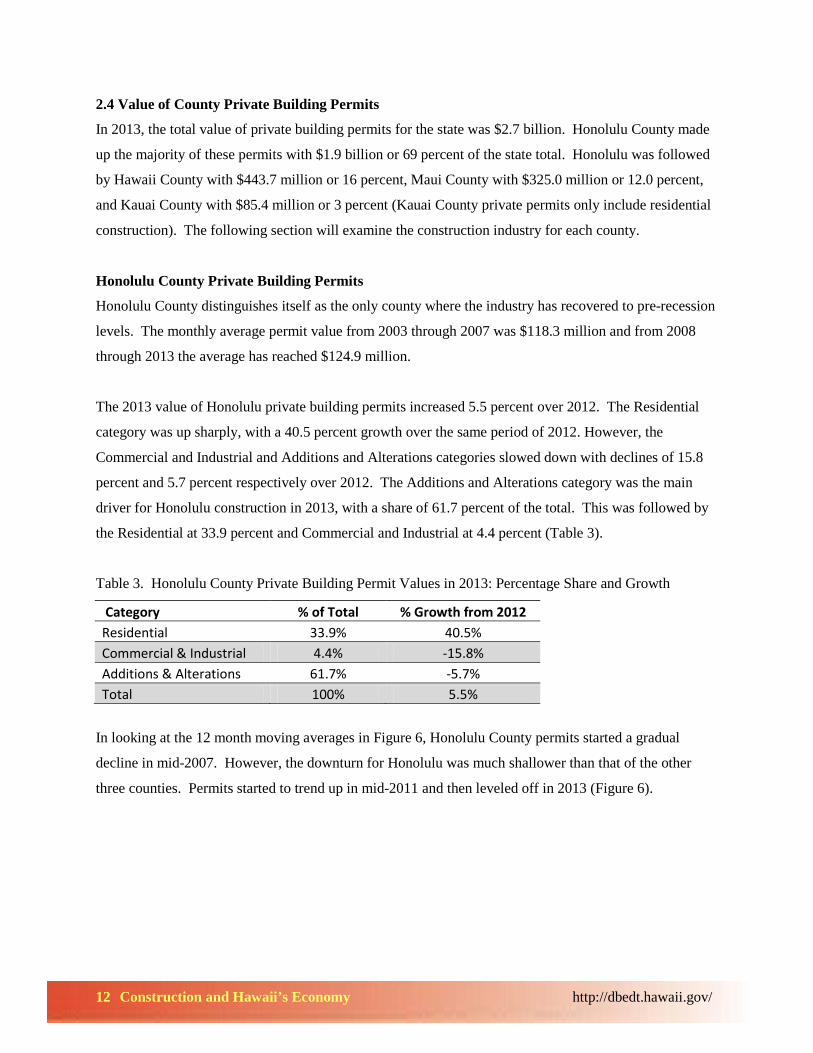
In looking at the 12 month moving averages in Figure 6, Honolulu County permits started a gradual
decline in mid-2007. However, the downturn for Honolulu was much shallower than that of the other
three counties. Permits started to trend up in mid-2011 and then leveled off in 2013 (Figure 6).

13 Construction and Hawaii’s Economy http://dbedt.hawaii.gov/
Figure 6. Honolulu County Monthly Value of Private Building Permits
Source: DBEDT Monthly Economic Indicators 2013
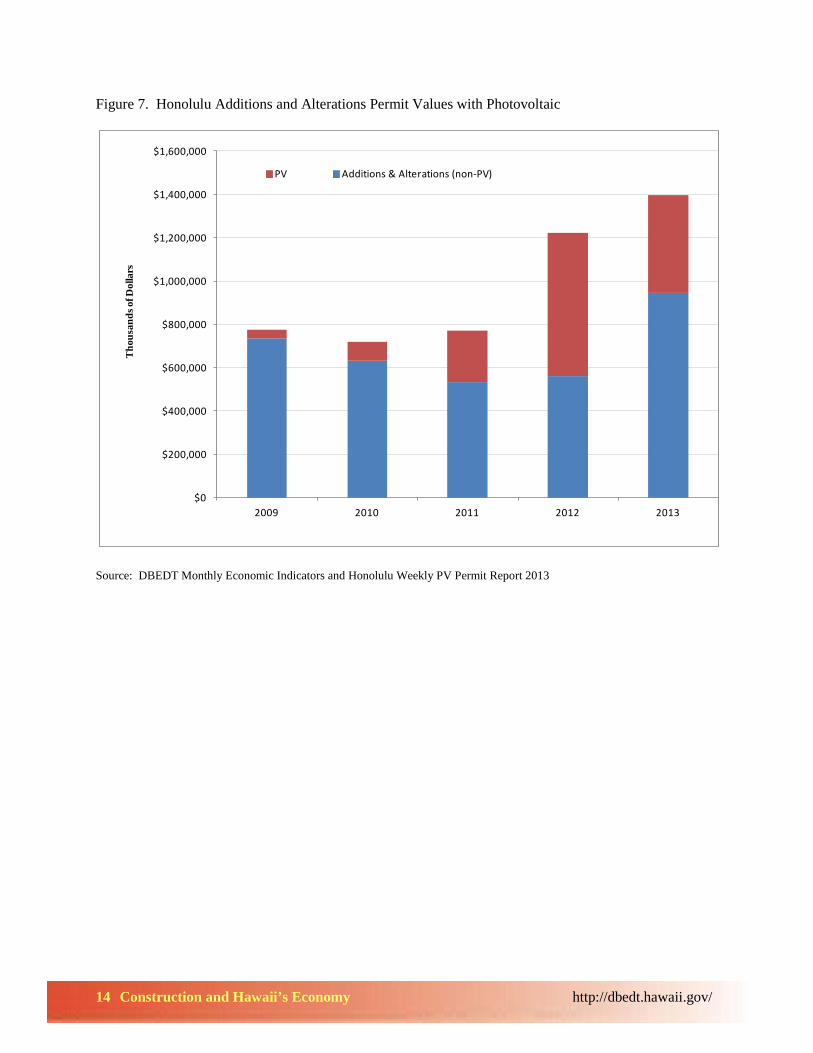
Photovoltaic installations drove much of the recent growth in Honolulu’s Additions and Alterations
category through 2012. The value of photovoltaic permits increased from $40 million in 2009 to $659
million in 2012. Photovoltaic as a percentage of the Additions and Alterations category also rose from 5
percent in 2009 to 54 percent in 2012. However in 2013, the value of Honolulu photovoltaic permits has
declined substantially. The 2013 value of Honolulu photovoltaic permits was down 29.7 percent from the
previous year. The Additions and Alterations permit value was $1.4 billion, with photovoltaic permits
comprising 32 percent or $454.5 million of the Additions and Alterations category (Figure 7).
$-
$50,000
$100,000
$150,000
$200,000
$250,000
$300,000
$-
$50,000
$100,000
$150,000
$200,000
$250,000
$300,000 Additions & alterations Commercial & industrialResidential 12 per. Mov. Avg. (Total)
Thou
sand
s of D
olla
rs
14 Construction and Hawaii’s Economy http://dbedt.hawaii.gov/
Figure 7. Honolulu Additions and Alterations Permit Values with Photovoltaic
Source: DBEDT Monthly Economic Indicators and Honolulu Weekly PV Permit Report 2013
$0
$200,000
$400,000
$600,000
$800,000
$1,000,000
$1,200,000
$1,400,000
$1,600,000
2009 2010 2011 2012 2013
PV Additions & Alterations (non-PV)
Tho
usan
dsof
Dol
lars
15 Construction and Hawaii’s Economy http://dbedt.hawaii.gov/
Hawaii County Private Building Permits
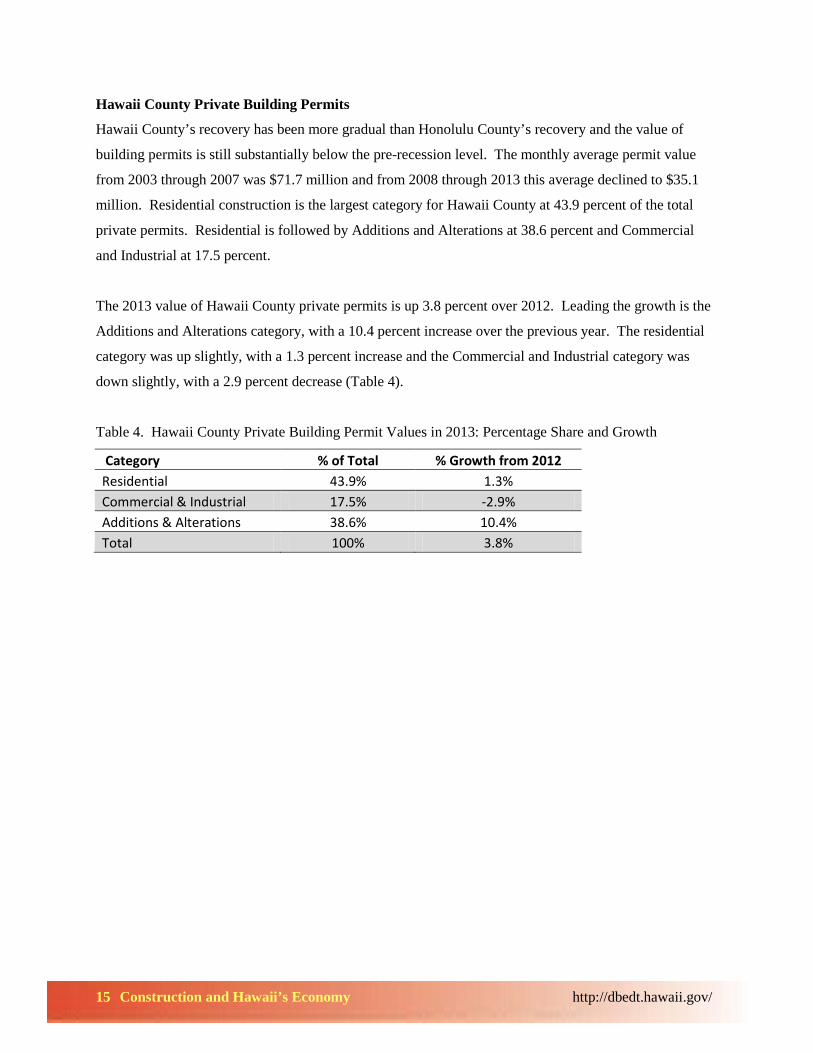
Hawaii County’s recovery has been more gradual than Honolulu County’s recovery and the value of
building permits is still substantially below the pre-recession level. The monthly average permit value
from 2003 through 2007 was $71.7 million and from 2008 through 2013 this average declined to $35.1
million. Residential construction is the largest category for Hawaii County at 43.9 percent of the total
private permits. Residential is followed by Additions and Alterations at 38.6 percent and Commercial
and Industrial at 17.5 percent.
The 2013 value of Hawaii County private permits is up 3.8 percent over 2012. Leading the growth is the
Additions and Alterations category, with a 10.4 percent increase over the previous year. The residential
category was up slightly, with a 1.3 percent increase and the Commercial and Industrial category was
down slightly, with a 2.9 percent decrease (Table 4).
Table 4. Hawaii County Private Building Permit Values in 2013: Percentage Share and Growth
Category % of Total % Growth from 2012 Residential 43.9% 1.3% Commercial & Industrial 17.5% -2.9% Additions & Alterations 38.6% 10.4% Total 100% 3.8%
16 Construction and Hawaii’s Economy http://dbedt.hawaii.gov/
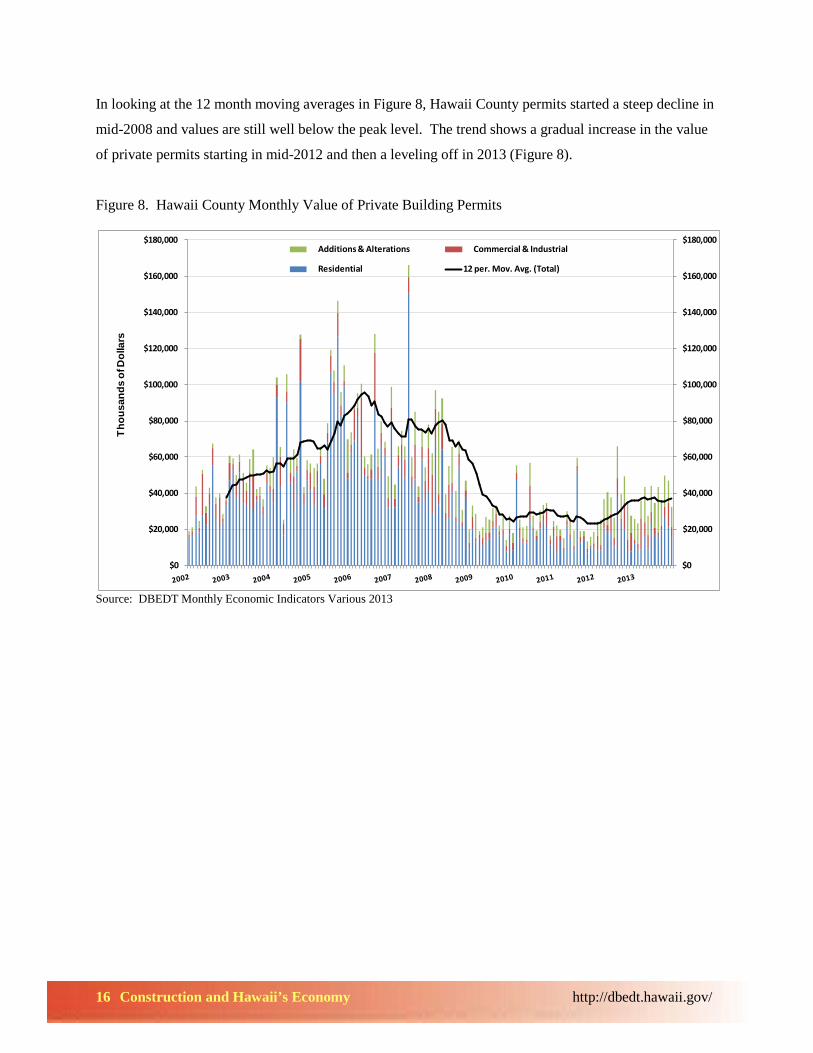
In looking at the 12 month moving averages in Figure 8, Hawaii County permits started a steep decline in
mid-2008 and values are still well below the peak level. The trend shows a gradual increase in the value
of private permits starting in mid-2012 and then a leveling off in 2013 (Figure 8).
Figure 8. Hawaii County Monthly Value of Private Building Permits
Source: DBEDT Monthly Economic Indicators Various 2013
$0
$20,000
$40,000
$60,000
$80,000
$100,000
$120,000
$140,000
$160,000
$180,000
$0
$20,000
$40,000
$60,000
$80,000
$100,000
$120,000
$140,000
$160,000
$180,000Additions & Alterations Commercial & Industrial
Residential 12 per. Mov. Avg. (Total)
Thou
sand
sof
Dol
lars
17 Construction and Hawaii’s Economy http://dbedt.hawaii.gov/
Maui County Private Building Permits
The recovery of Maui’s construction industry has been gradual and monthly permit values are still
substantially below pre-recession levels. The monthly average permit value from 2003 through 2007 was
$57.6 million and from 2008 through 2013 this average declined to $25.0 million.
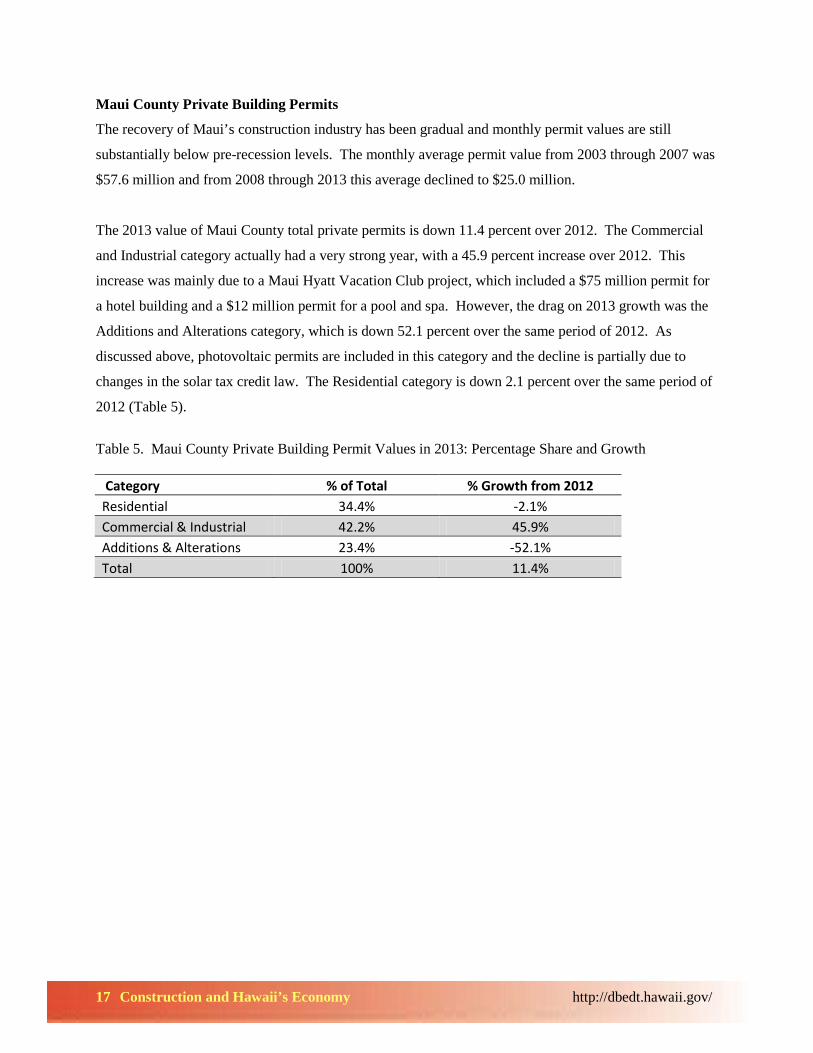
The 2013 value of Maui County total private permits is down 11.4 percent over 2012. The Commercial
and Industrial category actually had a very strong year, with a 45.9 percent increase over 2012. This
increase was mainly due to a Maui Hyatt Vacation Club project, which included a $75 million permit for
a hotel building and a $12 million permit for a pool and spa. However, the drag on 2013 growth was the
Additions and Alterations category, which is down 52.1 percent over the same period of 2012. As
discussed above, photovoltaic permits are included in this category and the decline is partially due to
changes in the solar tax credit law. The Residential category is down 2.1 percent over the same period of
2012 (Table 5).
Table 5. Maui County Private Building Permit Values in 2013: Percentage Share and Growth Category % of Total % Growth from 2012 Residential 34.4% -2.1% Commercial & Industrial 42.2% 45.9% Additions & Alterations 23.4% -52.1% Total 100% 11.4%
18 Construction and Hawaii’s Economy http://dbedt.hawaii.gov/
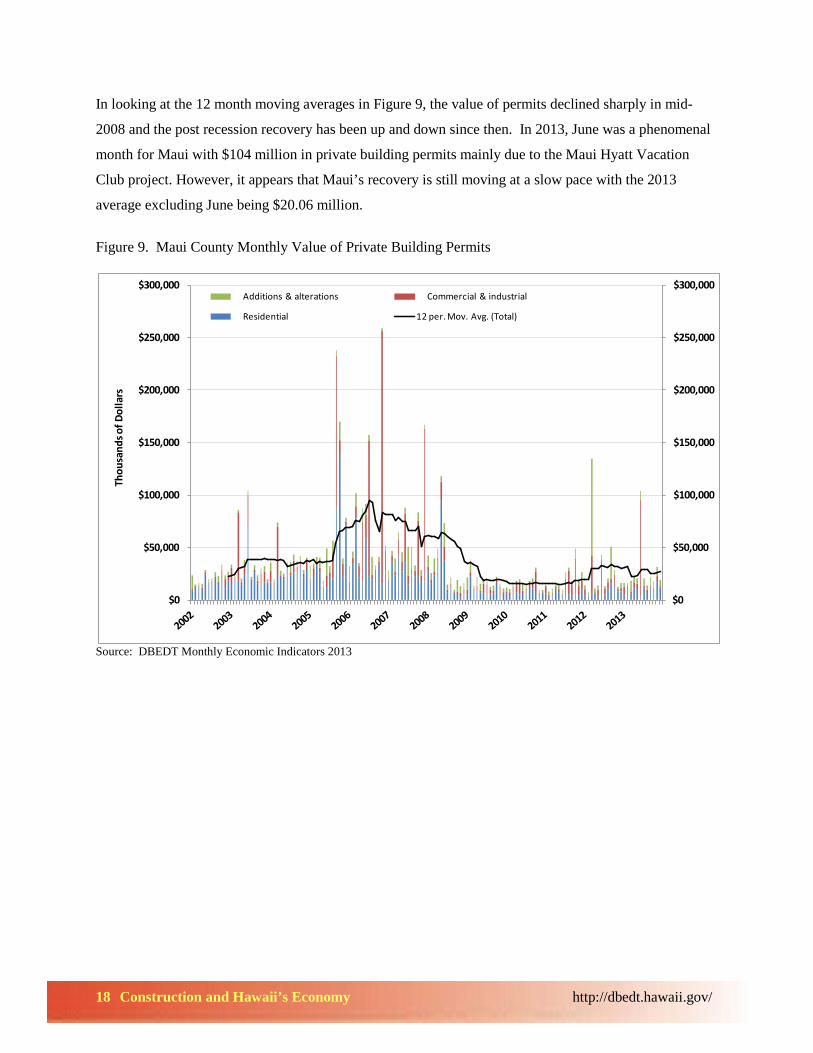
In looking at the 12 month moving averages in Figure 9, the value of permits declined sharply in mid-
2008 and the post recession recovery has been up and down since then. In 2013, June was a phenomenal
month for Maui with $104 million in private building permits mainly due to the Maui Hyatt Vacation
Club project. However, it appears that Maui’s recovery is still moving at a slow pace with the 2013
average excluding June being $20.06 million.
Figure 9. Maui County Monthly Value of Private Building Permits
Source: DBEDT Monthly Economic Indicators 2013
$0
$50,000
$100,000
$150,000
$200,000
$250,000
$300,000
$0
$50,000
$100,000
$150,000
$200,000
$250,000
$300,000Additions & alterations Commercial & industrial
Residential 12 per. Mov. Avg. (Total)
Thou
sand
s of D
olla
rs
19 Construction and Hawaii’s Economy http://dbedt.hawaii.gov/
Kauai County Private Building Permits
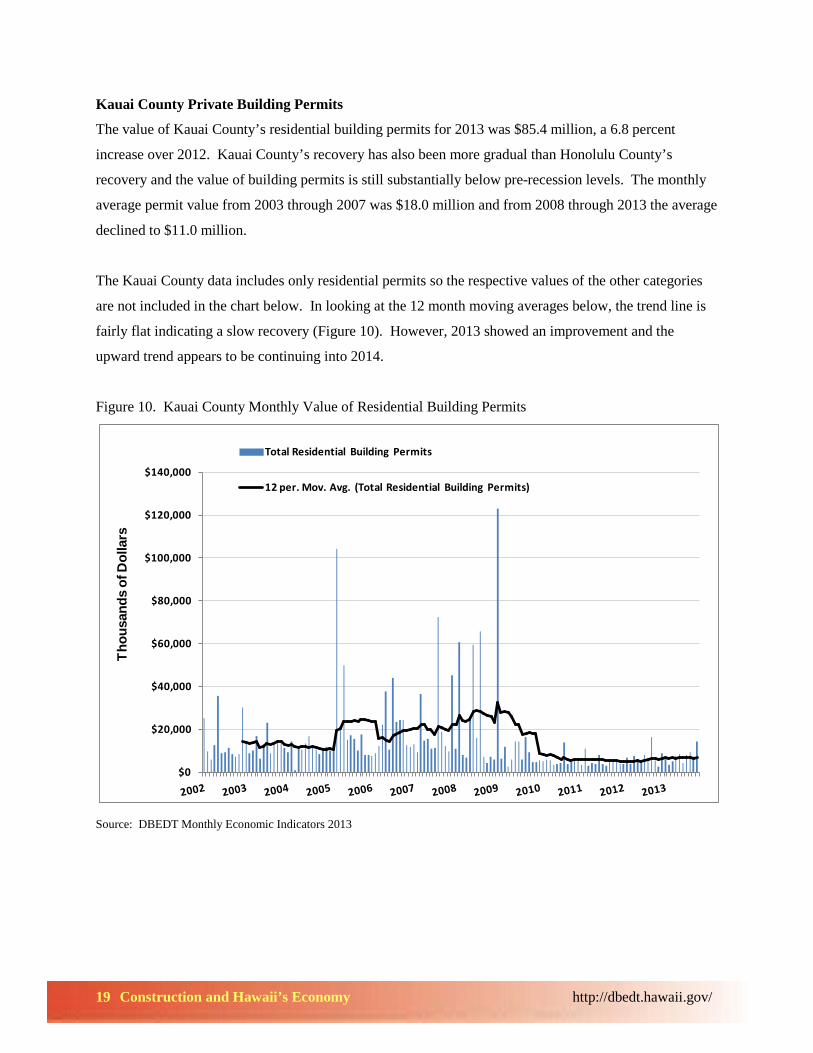
The value of Kauai County’s residential building permits for 2013 was $85.4 million, a 6.8 percent
increase over 2012. Kauai County’s recovery has also been more gradual than Honolulu County’s
recovery and the value of building permits is still substantially below pre-recession levels. The monthly
average permit value from 2003 through 2007 was $18.0 million and from 2008 through 2013 the average
declined to $11.0 million.
The Kauai County data includes only residential permits so the respective values of the other categories
are not included in the chart below. In looking at the 12 month moving averages below, the trend line is
fairly flat indicating a slow recovery (Figure 10). However, 2013 showed an improvement and the
upward trend appears to be continuing into 2014.
Figure 10. Kauai County Monthly Value of Residential Building Permits
Source: DBEDT Monthly Economic Indicators 2013
$0
$20,000
$40,000
$60,000
$80,000
$100,000
$120,000
$140,000
Total Residential Building Permits
12 per. Mov. Avg. (Total Residential Building Permits)
Thou
sand
s of
Dol
lars
20 Construction and Hawaii’s Economy http://dbedt.hawaii.gov/
Expenditures Year ($ thousands) % Change2002 $654,804 7.1%2003 $847,667 29.5%2004 $400,707 -52.7%2005 $765,953 91.2%2006 $652,664 -14.8%2007 $1,131,450 73.4%2008 $980,061 -13.4%2009 $1,102,080 12.5%2010 $1,052,636 -4.5%2011 $1,004,491 -4.6%2012 $1,300,621 29.5%2013 $1,150,213 -11.6%
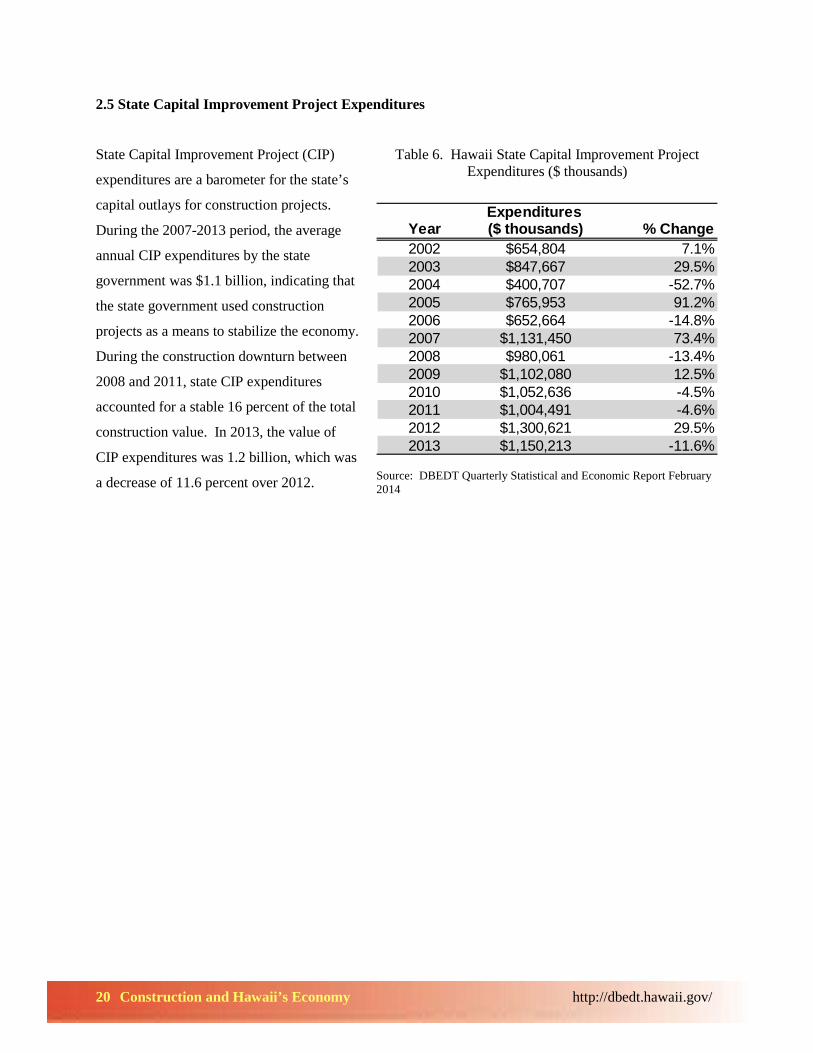
2.5 State Capital Improvement Project Expenditures
State Capital Improvement Project (CIP)
expenditures are a barometer for the state’s
capital outlays for construction projects.
During the 2007-2013 period, the average
annual CIP expenditures by the state
government was $1.1 billion, indicating that
the state government used construction
projects as a means to stabilize the economy.
During the construction downturn between
2008 and 2011, state CIP expenditures
accounted for a stable 16 percent of the total
construction value. In 2013, the value of
CIP expenditures was 1.2 billion, which was
a decrease of 11.6 percent over 2012.
Table 6. Hawaii State Capital Improvement Project Expenditures ($ thousands)
Source: DBEDT Quarterly Statistical and Economic Report February 2014
21 Construction and Hawaii’s Economy http://dbedt.hawaii.gov/
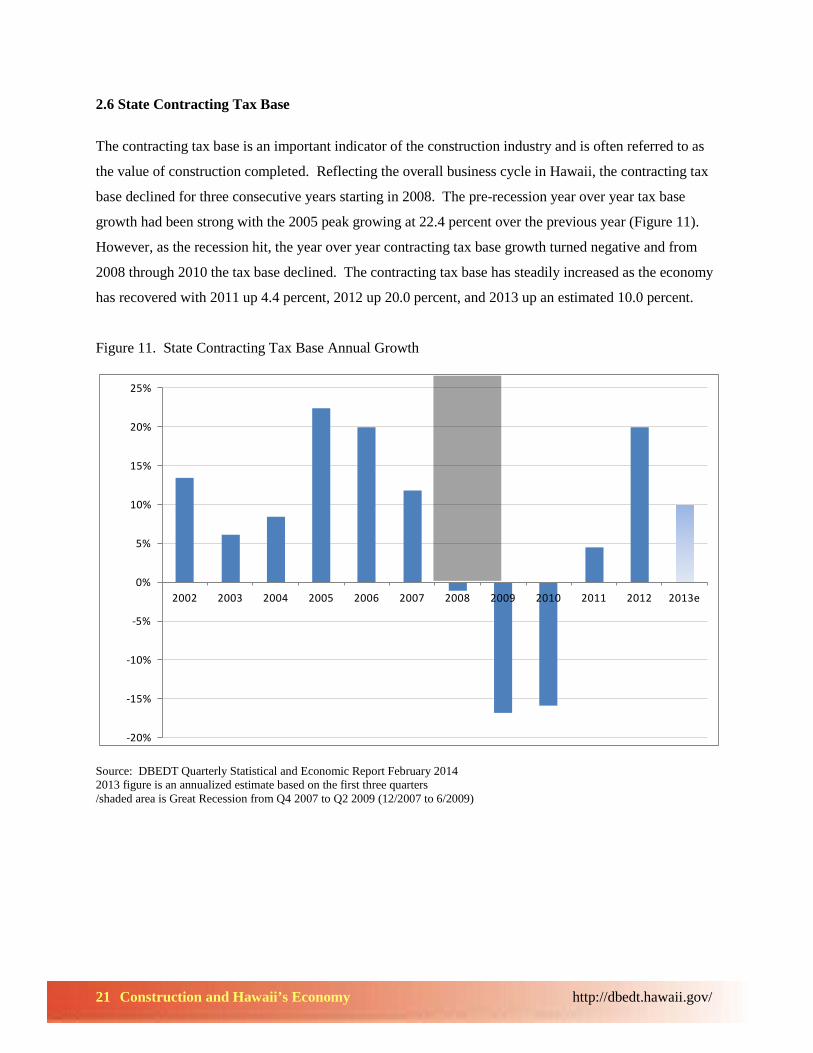
2.6 State Contracting Tax Base
The contracting tax base is an important indicator of the construction industry and is often referred to as
the value of construction completed. Reflecting the overall business cycle in Hawaii, the contracting tax
base declined for three consecutive years starting in 2008. The pre-recession year over year tax base
growth had been strong with the 2005 peak growing at 22.4 percent over the previous year (Figure 11).
However, as the recession hit, the year over year contracting tax base growth turned negative and from
2008 through 2010 the tax base declined. The contracting tax base has steadily increased as the economy
has recovered with 2011 up 4.4 percent, 2012 up 20.0 percent, and 2013 up an estimated 10.0 percent.
Figure 11. State Contracting Tax Base Annual Growth
Source: DBEDT Quarterly Statistical and Economic Report February 2014 2013 figure is an annualized estimate based on the first three quarters /shaded area is Great Recession from Q4 2007 to Q2 2009 (12/2007 to 6/2009)
-20%
-15%
-10%
-5%
0%
5%
10%
15%
20%
25%
2002 2003 2004 2005 2006 2007 2008 2009 2010 2011 2012 2013e
22 Construction and Hawaii’s Economy http://dbedt.hawaii.gov/
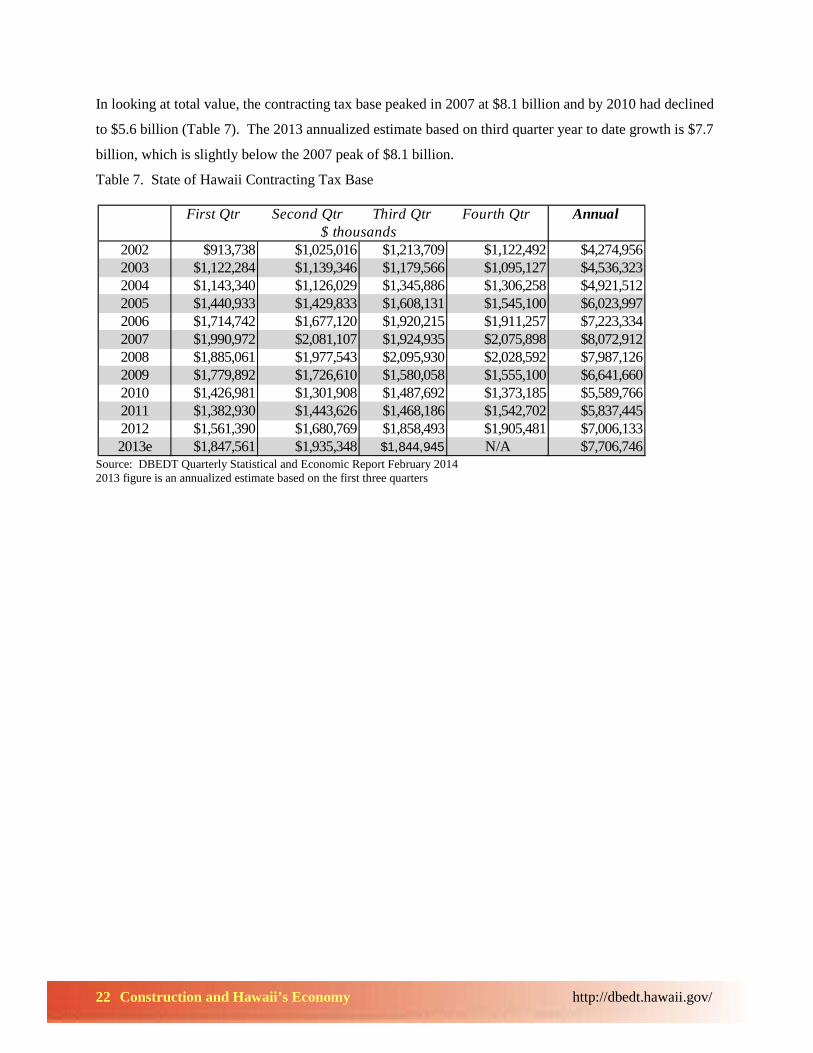
In looking at total value, the contracting tax base peaked in 2007 at $8.1 billion and by 2010 had declined
to $5.6 billion (Table 7). The 2013 annualized estimate based on third quarter year to date growth is $7.7
billion, which is slightly below the 2007 peak of $8.1 billion.
Table 7. State of Hawaii Contracting Tax Base
Source: DBEDT Quarterly Statistical and Economic Report February 2014 2013 figure is an annualized estimate based on the first three quarters
First Qtr Second Qtr Third Qtr Fourth Qtr Annual
2002 $913,738 $1,025,016 $1,213,709 $1,122,492 $4,274,9562003 $1,122,284 $1,139,346 $1,179,566 $1,095,127 $4,536,3232004 $1,143,340 $1,126,029 $1,345,886 $1,306,258 $4,921,5122005 $1,440,933 $1,429,833 $1,608,131 $1,545,100 $6,023,9972006 $1,714,742 $1,677,120 $1,920,215 $1,911,257 $7,223,3342007 $1,990,972 $2,081,107 $1,924,935 $2,075,898 $8,072,9122008 $1,885,061 $1,977,543 $2,095,930 $2,028,592 $7,987,1262009 $1,779,892 $1,726,610 $1,580,058 $1,555,100 $6,641,6602010 $1,426,981 $1,301,908 $1,487,692 $1,373,185 $5,589,7662011 $1,382,930 $1,443,626 $1,468,186 $1,542,702 $5,837,4452012 $1,561,390 $1,680,769 $1,858,493 $1,905,481 $7,006,1332013e $1,847,561 $1,935,348 $1,844,945 N/A $7,706,746
$ thousands
23 Construction and Hawaii’s Economy http://dbedt.hawaii.gov/
2.7 The Honolulu Construction Cost Indices
The Honolulu Construction Cost Indices serve as a price barometer for construction industry inputs. The
original Honolulu Construction Cost Indices were developed in 1947 by the Builders Report Pacific
publication and this organization continued publishing the index until 1969. The indices were then
compiled and published by First Hawaiian Bank until 1997, when they discontinued compiling the
construction index figures. It was then that DBEDT took over the Honolulu Construction Cost Indices
and DBEDT continues to compile and publish these figures.
The indices were designed as a proxy to measure the costs to builders of typical building materials and
public-contract labor. However, the indices do not include the costs of contract overhead and profit, site
preparation, utilities-installation, and overtime labor. The indices estimate the current cost of materials
and labor for the following two types of construction:
Single Family Residence: This index is calculated for a typical 1,300 square foot single family house
with a concrete slab floor. This includes eight types of building materials: lumber, roofing shingles,
cement, copper pipe, electrical wire, drywall, glass, and paint.
The wage component is made up of ten major labor construction including carpenters, electricians,
laborers I & III, lathers, masons, painters, plasterers, plumbers, and roofers.
High Rise Condominiums or Office Buildings: The high rise condominium or office building index is
similar to the single family residence index with some additions and different proportions. This index
includes reinforcing steel and five additional labor groups: boilermaker, tile-setters, structural and
reinforcing ironworkers, and heavy equipment operators.
The labor and materials component are weighted for each type of construction based on estimates of
amount of the item used in each type of construction. The base for the indices is January 1992 = 100.
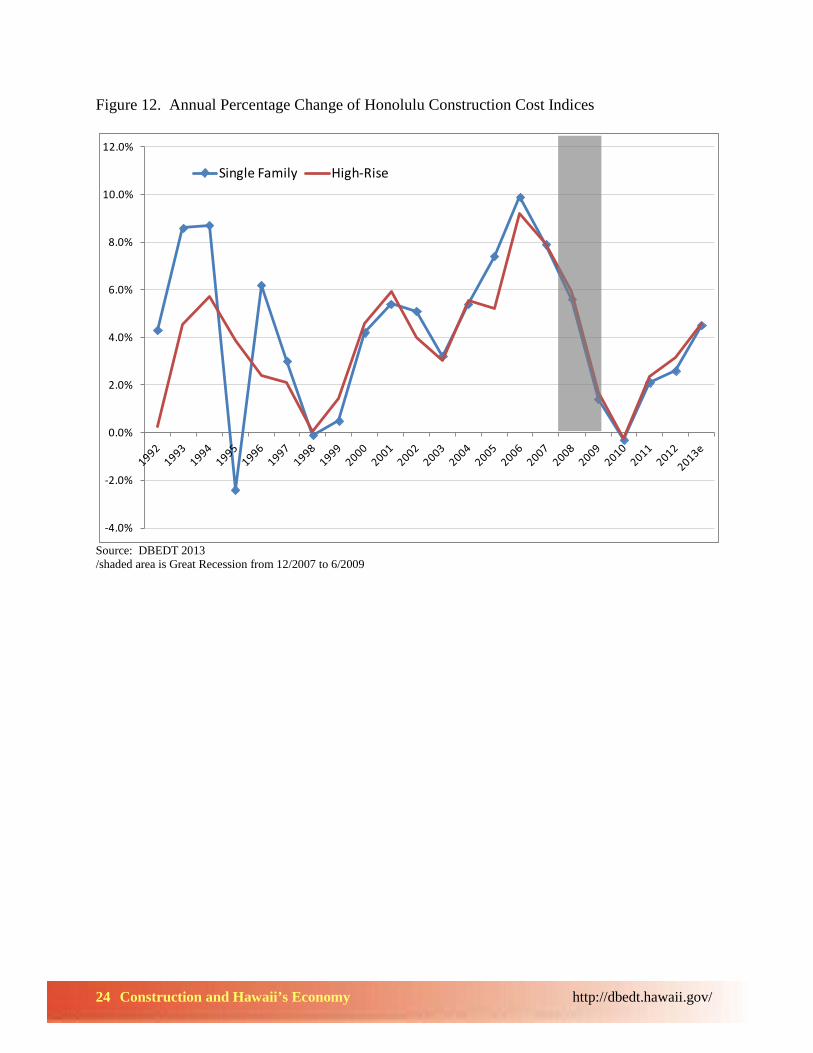
Figure 12 shows the annual percent change over the previous year for both indices. Since the late 1990’s
the indices have generally moved together, with both indices reaching a pre-recession peak in 2006 of 10
percent growth over the previous year. The percent change then declined through the recession until it
reached a trough in 2010, when both indices decreased 0.3 percent over the previous year. Since 2010,
both price indices have been increasing steadily and this trend appears to be continuing. As of the third
quarter 2013, the average index increase for Single Family Residence and High Rise Condominiums or
Office Buildings were 4.5 percent and 4.6 percent respectively.
24 Construction and Hawaii’s Economy http://dbedt.hawaii.gov/
Figure 12. Annual Percentage Change of Honolulu Construction Cost Indices
Source: DBEDT 2013 /shaded area is Great Recession from 12/2007 to 6/2009
-4.0%
-2.0%
0.0%
2.0%
4.0%
6.0%
8.0%
10.0%
12.0%
Single Family High-Rise
25 Construction and Hawaii’s Economy http://dbedt.hawaii.gov/
2.8 Major Construction Projects of 2013
In looking at 2013, Hawaii had many construction projects that were permitted. The table below lists
construction projects of $5 million or more that had been permitted in 2013. Residential construction was
strong in 2013 and several large scale projects that exceeded $5 million were permitted. The largest of
these was a residential complex located at 1189 Waimanu St in Kakaako, Honolulu. This is a $109.9
million residential high rise that was permitted in January. The next largest was also a Kakaako
residential project located at 801 South Street, with a permit value of $105 million. Other projects
included town homes in Ewa Beach for $37 million, town homes in Kapolei for $34.6 million, and the
Hale Mohalu senior living facility for $12.2 million.
The commercial sector also contributed to construction with strong demand from the tourism, retail, and
health care sectors. Leading tourism construction was the Maui Hyatt Vacation Club which received a
combined total of $87 million for a hotel building and pool and spa construction. Another notable project
was Hawaiian Airlines, which received a $10 million permit for their facility near the airport at 3375
Koapaka Street. Retail development was also a strong contributor to the commercial construction sector.
The project that is leading this category is the Ala Moana Center expansion and renovation. The two
largest Ala Moana projects were the Ala Moana Center for $43.8 million and the Ala Moana Building for
$63.5 million. The health care industry was led by Kaiser, which received a permit to update their
medical facilities for $22.8 million. The Comprehensive Health Care Center in Waianae received a
permit to update their facilities for $5 million.
In the government category, the Sand Island Wastewater Treatment plant received a $19.9 million permit
for the expansion of their facilities. There was also significant demand from the education sector as
Hawaii’s educational institutions applied for permits to renovate and add capacity. This category was led
by the University of Hawaii Manoa Campus receiving a $23.7 million permit for the Clarence T.C. Ching
Athletics Complex. This will be a three story complex with seating for approximately 2,500. The
campus is also renovating existing facilities with a $6.2 million permit for work on Sakamaki Hall and a
$5.1 permit for work on Snyder and Edmonson Halls. There was also construction at the K12 level.
Kailua High School received a $6.2 million permit for a natural science lab and Waipahu Elementary
received an $8.6 million permit for classroom and parking construction.
26 Construction and Hawaii’s Economy http://dbedt.hawaii.gov/
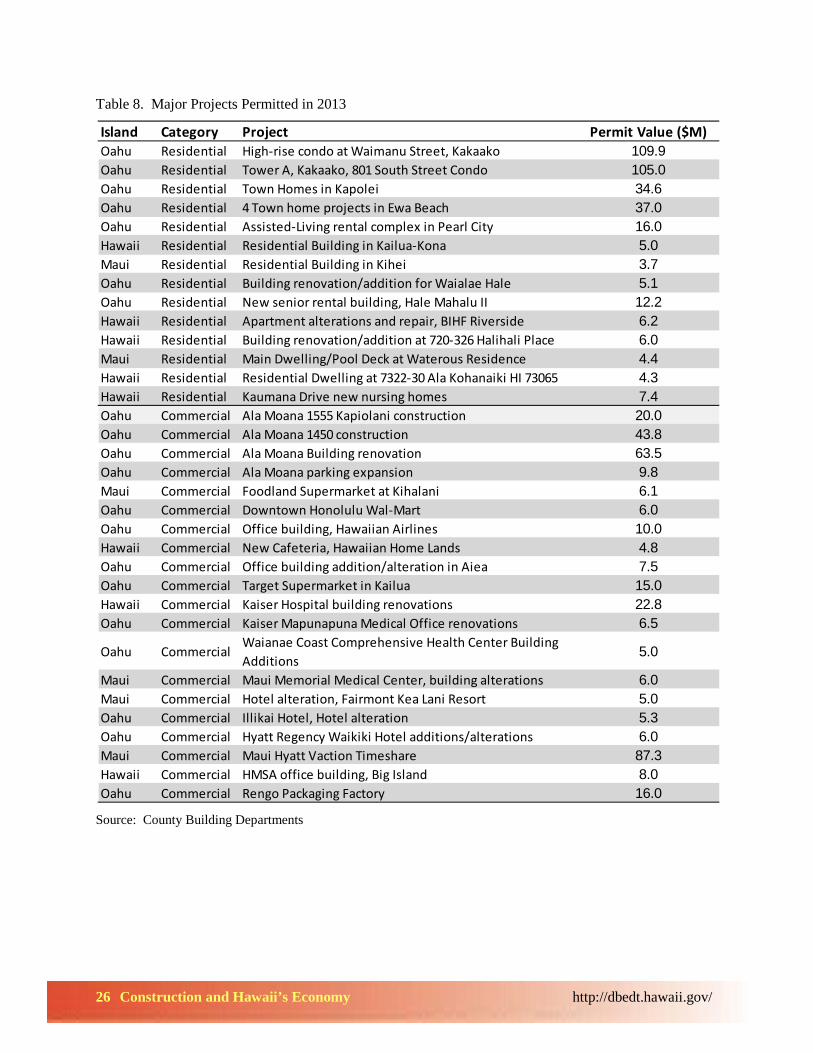
Table 8. Major Projects Permitted in 2013
Source: County Building Departments
Island Category Project Permit Value ($M)Oahu Residential High-rise condo at Waimanu Street, Kakaako 109.9Oahu Residential Tower A, Kakaako, 801 South Street Condo 105.0Oahu Residential Town Homes in Kapolei 34.6Oahu Residential 4 Town home projects in Ewa Beach 37.0Oahu Residential Assisted-Living rental complex in Pearl City 16.0Hawaii Residential Residential Building in Kailua-Kona 5.0Maui Residential Residential Building in Kihei 3.7Oahu Residential Building renovation/addition for Waialae Hale 5.1Oahu Residential New senior rental building, Hale Mahalu II 12.2Hawaii Residential Apartment alterations and repair, BIHF Riverside 6.2Hawaii Residential Building renovation/addition at 720-326 Halihali Place 6.0Maui Residential Main Dwelling/Pool Deck at Waterous Residence 4.4Hawaii Residential Residential Dwelling at 7322-30 Ala Kohanaiki HI 73065 4.3Hawaii Residential Kaumana Drive new nursing homes 7.4Oahu Commercial Ala Moana 1555 Kapiolani construction 20.0Oahu Commercial Ala Moana 1450 construction 43.8Oahu Commercial Ala Moana Building renovation 63.5Oahu Commercial Ala Moana parking expansion 9.8Maui Commercial Foodland Supermarket at Kihalani 6.1Oahu Commercial Downtown Honolulu Wal-Mart 6.0Oahu Commercial Office building, Hawaiian Airlines 10.0Hawaii Commercial New Cafeteria, Hawaiian Home Lands 4.8Oahu Commercial Office building addition/alteration in Aiea 7.5Oahu Commercial Target Supermarket in Kailua 15.0Hawaii Commercial Kaiser Hospital building renovations 22.8Oahu Commercial Kaiser Mapunapuna Medical Office renovations 6.5
Oahu CommercialWaianae Coast Comprehensive Health Center Building Additions
5.0
Maui Commercial Maui Memorial Medical Center, building alterations 6.0Maui Commercial Hotel alteration, Fairmont Kea Lani Resort 5.0Oahu Commercial Illikai Hotel, Hotel alteration 5.3Oahu Commercial Hyatt Regency Waikiki Hotel additions/alterations 6.0Maui Commercial Maui Hyatt Vaction Timeshare 87.3Hawaii Commercial HMSA office building, Big Island 8.0Oahu Commercial Rengo Packaging Factory 16.0
27 Construction and Hawaii’s Economy http://dbedt.hawaii.gov/
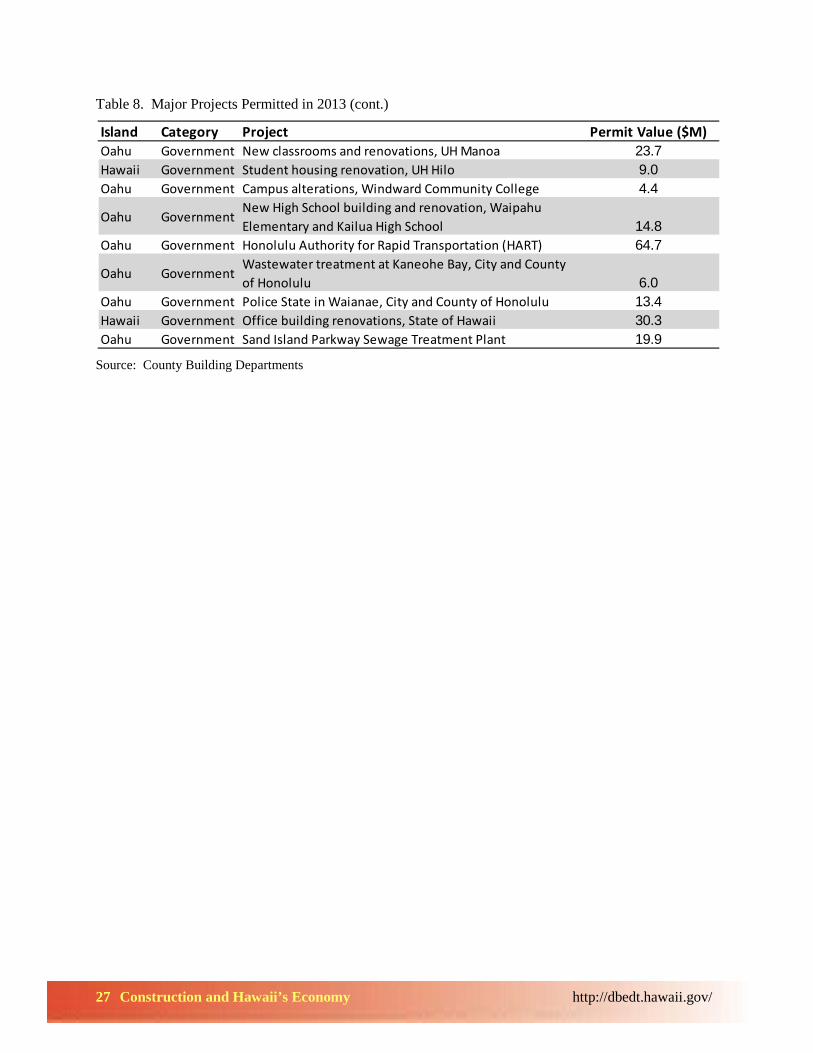
Table 8. Major Projects Permitted in 2013 (cont.)
Source: County Building Departments
Island Category Project Permit Value ($M)Oahu Government New classrooms and renovations, UH Manoa 23.7Hawaii Government Student housing renovation, UH Hilo 9.0Oahu Government Campus alterations, Windward Community College 4.4
Oahu GovernmentNew High School building and renovation, Waipahu Elementary and Kailua High School 14.8
Oahu Government Honolulu Authority for Rapid Transportation (HART) 64.7
Oahu GovernmentWastewater treatment at Kaneohe Bay, City and County of Honolulu 6.0
Oahu Government Police State in Waianae, City and County of Honolulu 13.4Hawaii Government Office building renovations, State of Hawaii 30.3Oahu Government Sand Island Parkway Sewage Treatment Plant 19.9
28 Construction and Hawaii’s Economy http://dbedt.hawaii.gov/
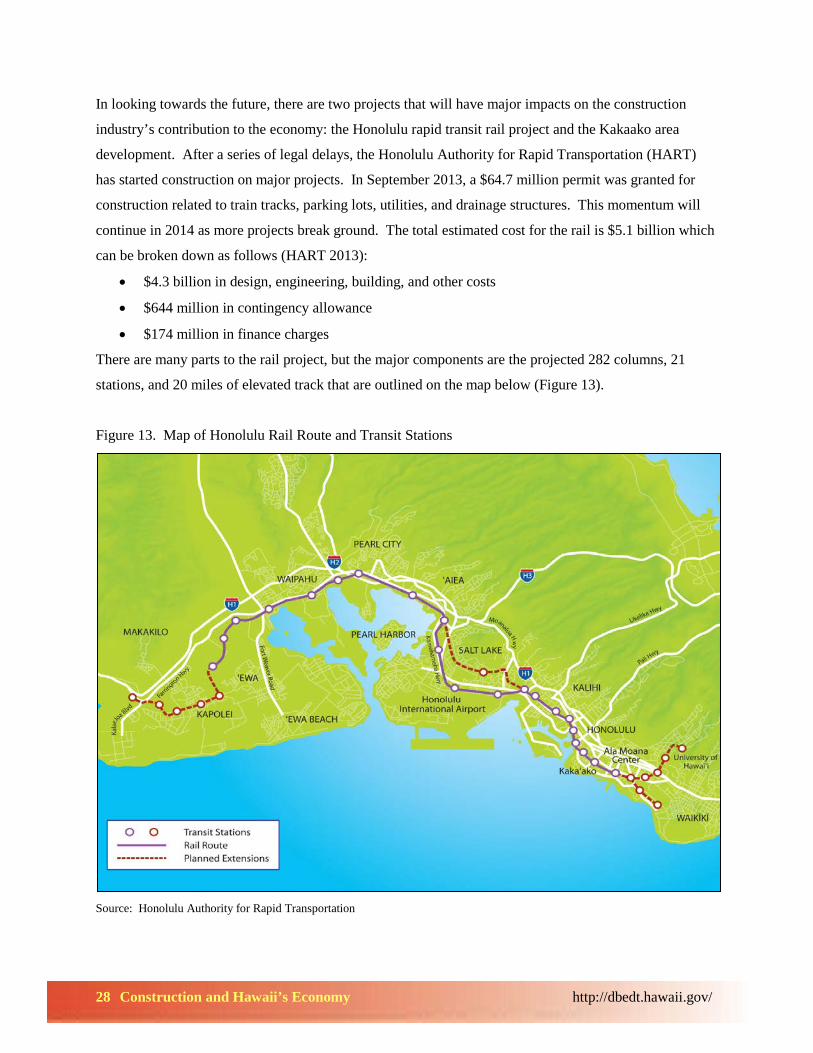
In looking towards the future, there are two projects that will have major impacts on the construction
industry’s contribution to the economy: the Honolulu rapid transit rail project and the Kakaako area
development. After a series of legal delays, the Honolulu Authority for Rapid Transportation (HART)
has started construction on major projects. In September 2013, a $64.7 million permit was granted for
construction related to train tracks, parking lots, utilities, and drainage structures. This momentum will
continue in 2014 as more projects break ground. The total estimated cost for the rail is $5.1 billion which
can be broken down as follows (HART 2013):
• $4.3 billion in design, engineering, building, and other costs
• $644 million in contingency allowance
• $174 million in finance charges
There are many parts to the rail project, but the major components are the projected 282 columns, 21
stations, and 20 miles of elevated track that are outlined on the map below (Figure 13).
Figure 13. Map of Honolulu Rail Route and Transit Stations
Source: Honolulu Authority for Rapid Transportation
29 Construction and Hawaii’s Economy http://dbedt.hawaii.gov/
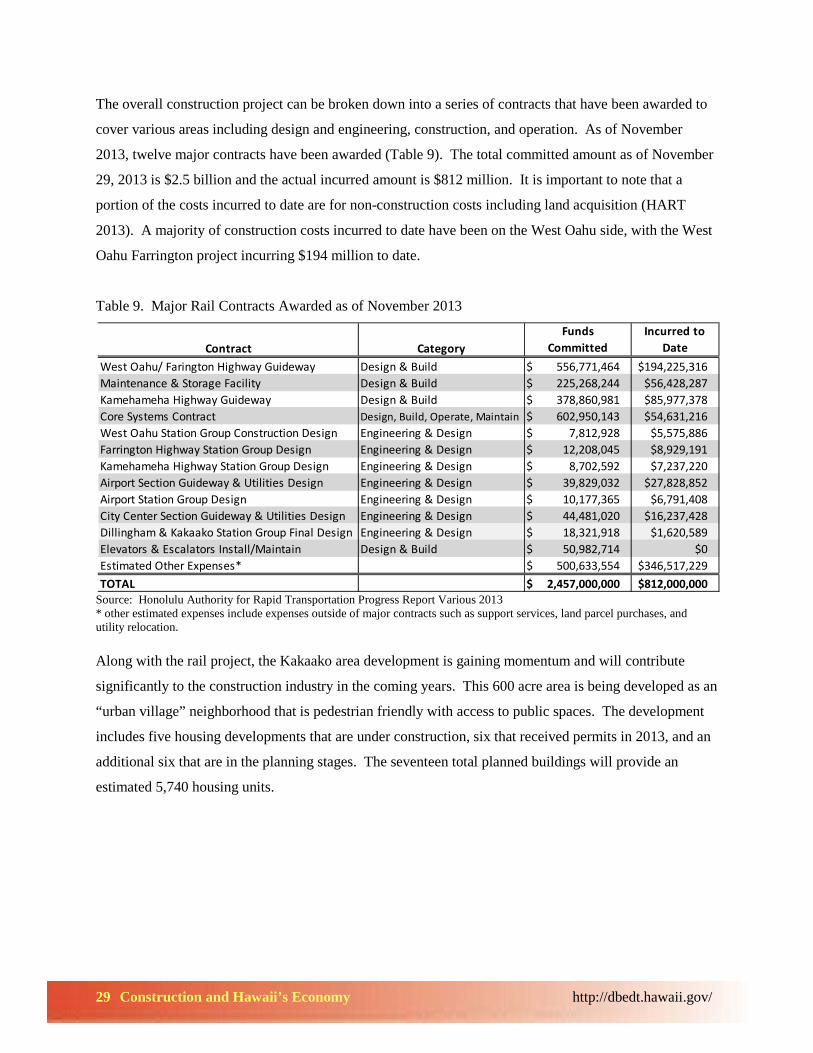
The overall construction project can be broken down into a series of contracts that have been awarded to
cover various areas including design and engineering, construction, and operation. As of November
2013, twelve major contracts have been awarded (Table 9). The total committed amount as of November
29, 2013 is $2.5 billion and the actual incurred amount is $812 million. It is important to note that a
portion of the costs incurred to date are for non-construction costs including land acquisition (HART
2013). A majority of construction costs incurred to date have been on the West Oahu side, with the West
Oahu Farrington project incurring $194 million to date.
Table 9. Major Rail Contracts Awarded as of November 2013
Source: Honolulu Authority for Rapid Transportation Progress Report Various 2013 * other estimated expenses include expenses outside of major contracts such as support services, land parcel purchases, and utility relocation. Along with the rail project, the Kakaako area development is gaining momentum and will contribute
significantly to the construction industry in the coming years. This 600 acre area is being developed as an
“urban village” neighborhood that is pedestrian friendly with access to public spaces. The development
includes five housing developments that are under construction, six that received permits in 2013, and an
additional six that are in the planning stages. The seventeen total planned buildings will provide an
estimated 5,740 housing units.
Contract CategoryFunds
CommittedIncurred to
DateWest Oahu/ Farington Highway Guideway Design & Build 556,771,464 $ $194,225,316 Maintenance & Storage Facility Design & Build 225,268,244 $ $56,428,287 Kamehameha Highway Guideway Design & Build 378,860,981 $ $85,977,378 Core Systems Contract Design, Build, Operate, Maintain 602,950,143 $ $54,631,216 West Oahu Station Group Construction Design Engineering & Design 7,812,928 $ $5,575,886 Farrington Highway Station Group Design Engineering & Design 12,208,045 $ $8,929,191 Kamehameha Highway Station Group Design Engineering & Design 8,702,592 $ $7,237,220 Airport Section Guideway & Utilities Design Engineering & Design 39,829,032 $ $27,828,852 Airport Station Group Design Engineering & Design 10,177,365 $ $6,791,408 City Center Section Guideway & Utilities Design Engineering & Design 44,481,020 $ $16,237,428 Dillingham & Kakaako Station Group Final Design Engineering & Design 18,321,918 $ $1,620,589 Elevators & Escalators Install/Maintain Design & Build 50,982,714 $ $0 Estimated Other Expenses* 500,633,554 $ $346,517,229 TOTAL 2,457,000,000 $ $812,000,000
30 Construction and Hawaii’s Economy http://dbedt.hawaii.gov/
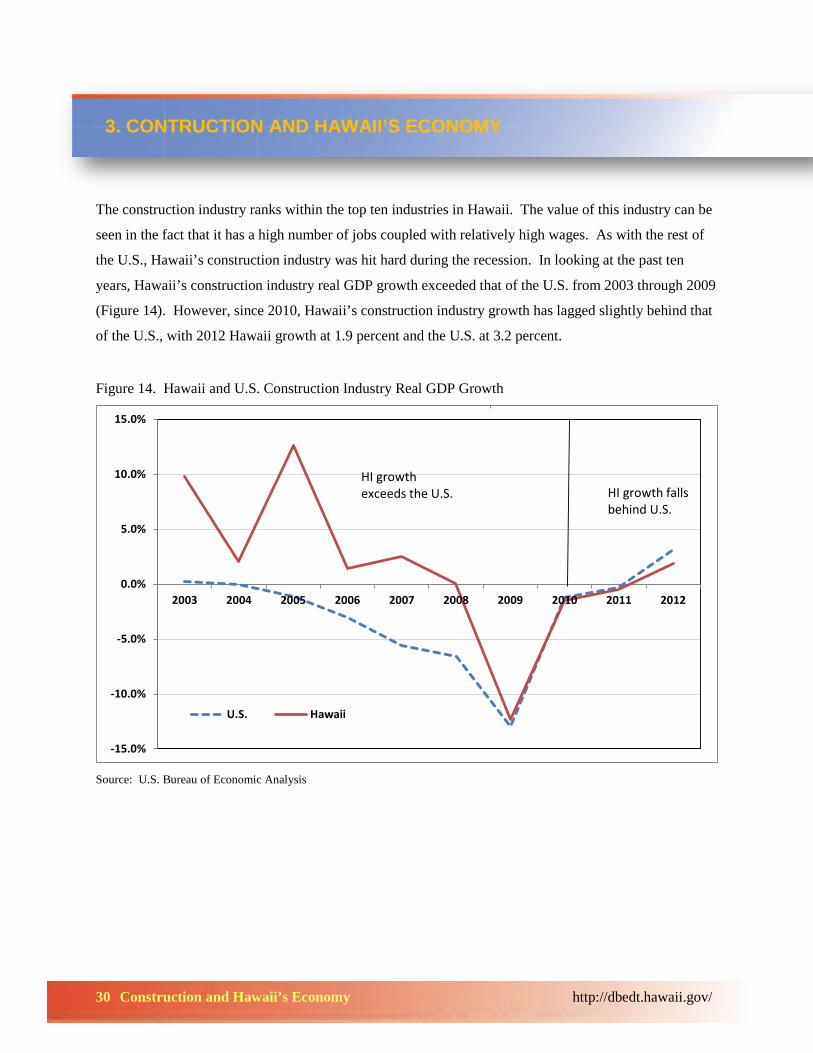
The construction industry ranks within the top ten industries in Hawaii. The value of this industry can be
seen in the fact that it has a high number of jobs coupled with relatively high wages. As with the rest of
the U.S., Hawaii’s construction industry was hit hard during the recession. In looking at the past ten
years, Hawaii’s construction industry real GDP growth exceeded that of the U.S. from 2003 through 2009
(Figure 14). However, since 2010, Hawaii’s construction industry growth has lagged slightly behind that
of the U.S., with 2012 Hawaii growth at 1.9 percent and the U.S. at 3.2 percent.
Figure 14. Hawaii and U.S. Construction Industry Real GDP Growth
Source: U.S. Bureau of Economic Analysis
-15.0%
-10.0%
-5.0%
0.0%
5.0%
10.0%
15.0%
2003 2004 2005 2006 2007 2008 2009 2010 2011 2012
U.S. Hawaii
HI growth falls behind U.S.
HI growthexceeds the U.S.
3. CONTRUCTION AND HAWAII’S ECONOMY
31 Construction and Hawaii’s Economy http://dbedt.hawaii.gov/
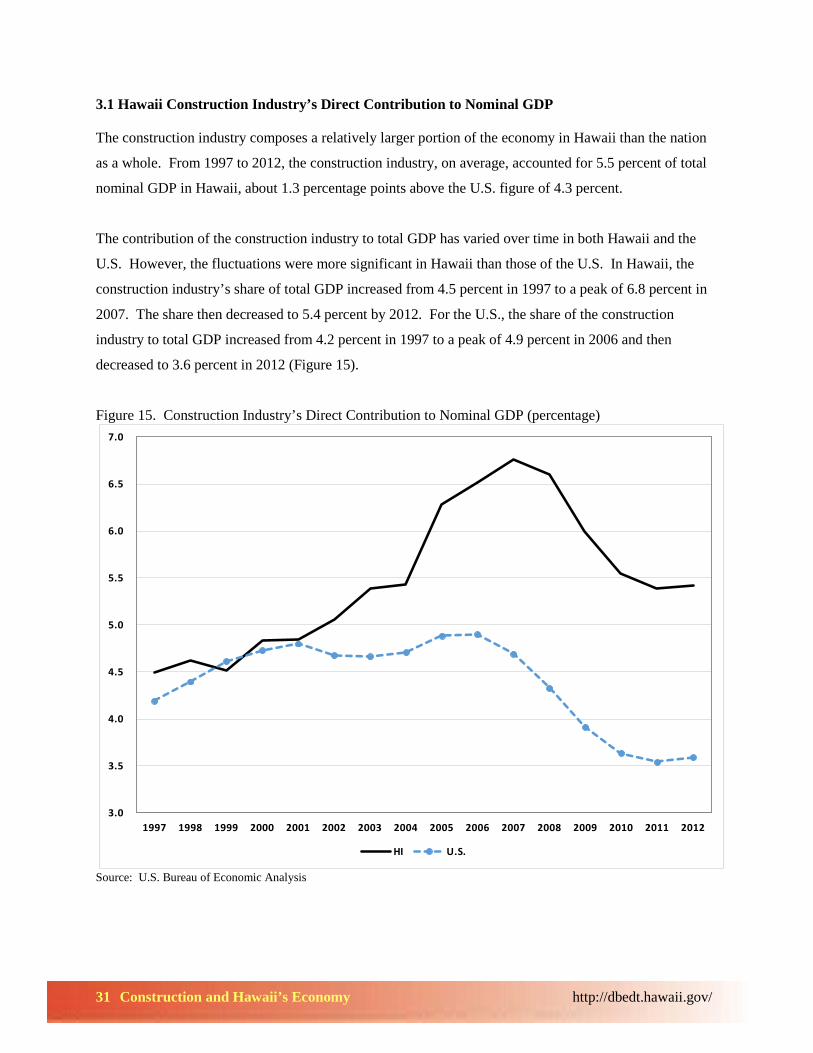
3.1 Hawaii Construction Industry’s Direct Contribution to Nominal GDP
The construction industry composes a relatively larger portion of the economy in Hawaii than the nation
as a whole. From 1997 to 2012, the construction industry, on average, accounted for 5.5 percent of total
nominal GDP in Hawaii, about 1.3 percentage points above the U.S. figure of 4.3 percent.
The contribution of the construction industry to total GDP has varied over time in both Hawaii and the
U.S. However, the fluctuations were more significant in Hawaii than those of the U.S. In Hawaii, the
construction industry’s share of total GDP increased from 4.5 percent in 1997 to a peak of 6.8 percent in
2007. The share then decreased to 5.4 percent by 2012. For the U.S., the share of the construction
industry to total GDP increased from 4.2 percent in 1997 to a peak of 4.9 percent in 2006 and then
decreased to 3.6 percent in 2012 (Figure 15).
Figure 15. Construction Industry’s Direct Contribution to Nominal GDP (percentage)
Source: U.S. Bureau of Economic Analysis
3.0
3.5
4.0
4.5
5.0
5.5
6.0
6.5
7.0
1997 1998 1999 2000 2001 2002 2003 2004 2005 2006 2007 2008 2009 2010 2011 2012
HI U.S.
32 Construction and Hawaii’s Economy http://dbedt.hawaii.gov/
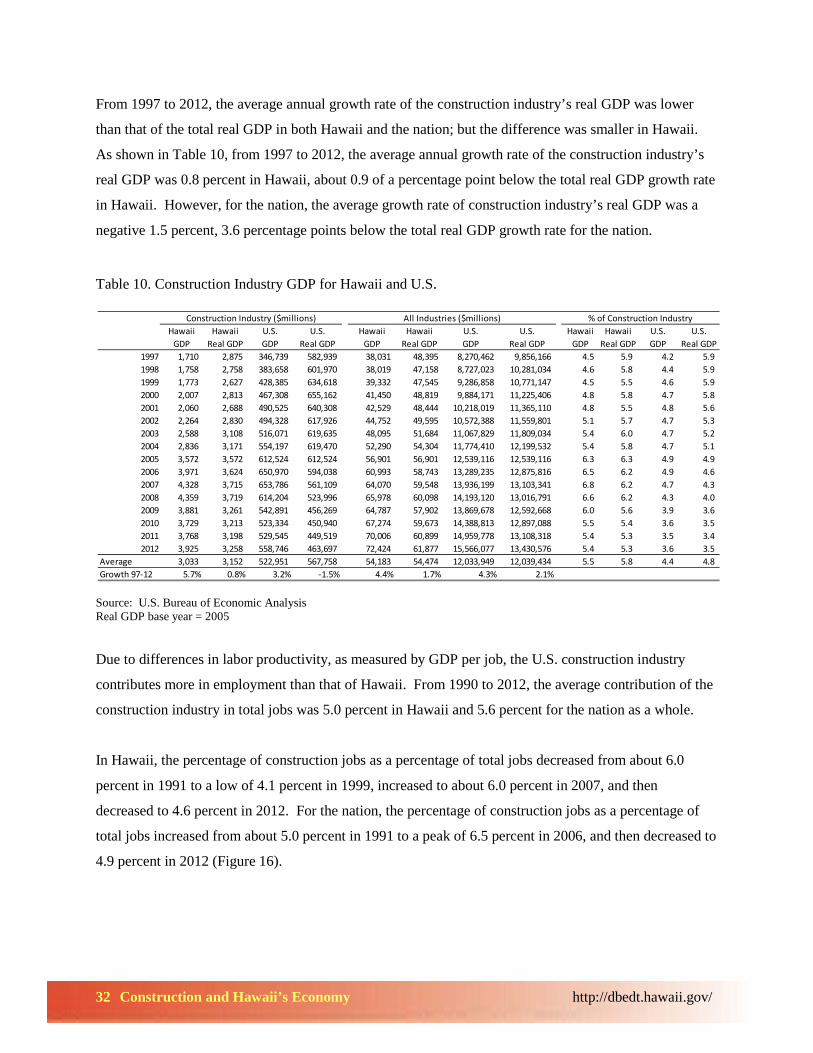
From 1997 to 2012, the average annual growth rate of the construction industry’s real GDP was lower
than that of the total real GDP in both Hawaii and the nation; but the difference was smaller in Hawaii.
As shown in Table 10, from 1997 to 2012, the average annual growth rate of the construction industry’s
real GDP was 0.8 percent in Hawaii, about 0.9 of a percentage point below the total real GDP growth rate
in Hawaii. However, for the nation, the average growth rate of construction industry’s real GDP was a
negative 1.5 percent, 3.6 percentage points below the total real GDP growth rate for the nation.
Table 10. Construction Industry GDP for Hawaii and U.S.
Source: U.S. Bureau of Economic Analysis Real GDP base year = 2005 Due to differences in labor productivity, as measured by GDP per job, the U.S. construction industry
contributes more in employment than that of Hawaii. From 1990 to 2012, the average contribution of the
construction industry in total jobs was 5.0 percent in Hawaii and 5.6 percent for the nation as a whole.
In Hawaii, the percentage of construction jobs as a percentage of total jobs decreased from about 6.0
percent in 1991 to a low of 4.1 percent in 1999, increased to about 6.0 percent in 2007, and then
decreased to 4.6 percent in 2012. For the nation, the percentage of construction jobs as a percentage of
total jobs increased from about 5.0 percent in 1991 to a peak of 6.5 percent in 2006, and then decreased to
4.9 percent in 2012 (Figure 16).
Hawaii Hawaii U.S. U.S. Hawaii Hawaii U.S. U.S. Hawaii Hawaii U.S. U.S.GDP Real GDP GDP Real GDP GDP Real GDP GDP Real GDP GDP Real GDP GDP Real GDP
1997 1,710 2,875 346,739 582,939 38,031 48,395 8,270,462 9,856,166 4.5 5.9 4.2 5.9 1998 1,758 2,758 383,658 601,970 38,019 47,158 8,727,023 10,281,034 4.6 5.8 4.4 5.9 1999 1,773 2,627 428,385 634,618 39,332 47,545 9,286,858 10,771,147 4.5 5.5 4.6 5.9 2000 2,007 2,813 467,308 655,162 41,450 48,819 9,884,171 11,225,406 4.8 5.8 4.7 5.8 2001 2,060 2,688 490,525 640,308 42,529 48,444 10,218,019 11,365,110 4.8 5.5 4.8 5.6 2002 2,264 2,830 494,328 617,926 44,752 49,595 10,572,388 11,559,801 5.1 5.7 4.7 5.3 2003 2,588 3,108 516,071 619,635 48,095 51,684 11,067,829 11,809,034 5.4 6.0 4.7 5.2 2004 2,836 3,171 554,197 619,470 52,290 54,304 11,774,410 12,199,532 5.4 5.8 4.7 5.1 2005 3,572 3,572 612,524 612,524 56,901 56,901 12,539,116 12,539,116 6.3 6.3 4.9 4.9 2006 3,971 3,624 650,970 594,038 60,993 58,743 13,289,235 12,875,816 6.5 6.2 4.9 4.6 2007 4,328 3,715 653,786 561,109 64,070 59,548 13,936,199 13,103,341 6.8 6.2 4.7 4.3 2008 4,359 3,719 614,204 523,996 65,978 60,098 14,193,120 13,016,791 6.6 6.2 4.3 4.0 2009 3,881 3,261 542,891 456,269 64,787 57,902 13,869,678 12,592,668 6.0 5.6 3.9 3.6 2010 3,729 3,213 523,334 450,940 67,274 59,673 14,388,813 12,897,088 5.5 5.4 3.6 3.5 2011 3,768 3,198 529,545 449,519 70,006 60,899 14,959,778 13,108,318 5.4 5.3 3.5 3.4 2012 3,925 3,258 558,746 463,697 72,424 61,877 15,566,077 13,430,576 5.4 5.3 3.6 3.5
Average 3,033 3,152 522,951 567,758 54,183 54,474 12,033,949 12,039,434 5.5 5.8 4.4 4.8 Growth 97-12 5.7% 0.8% 3.2% -1.5% 4.4% 1.7% 4.3% 2.1%
Construction Industry ($millions) All Industries ($millions) % of Construction Industry
33 Construction and Hawaii’s Economy http://dbedt.hawaii.gov/
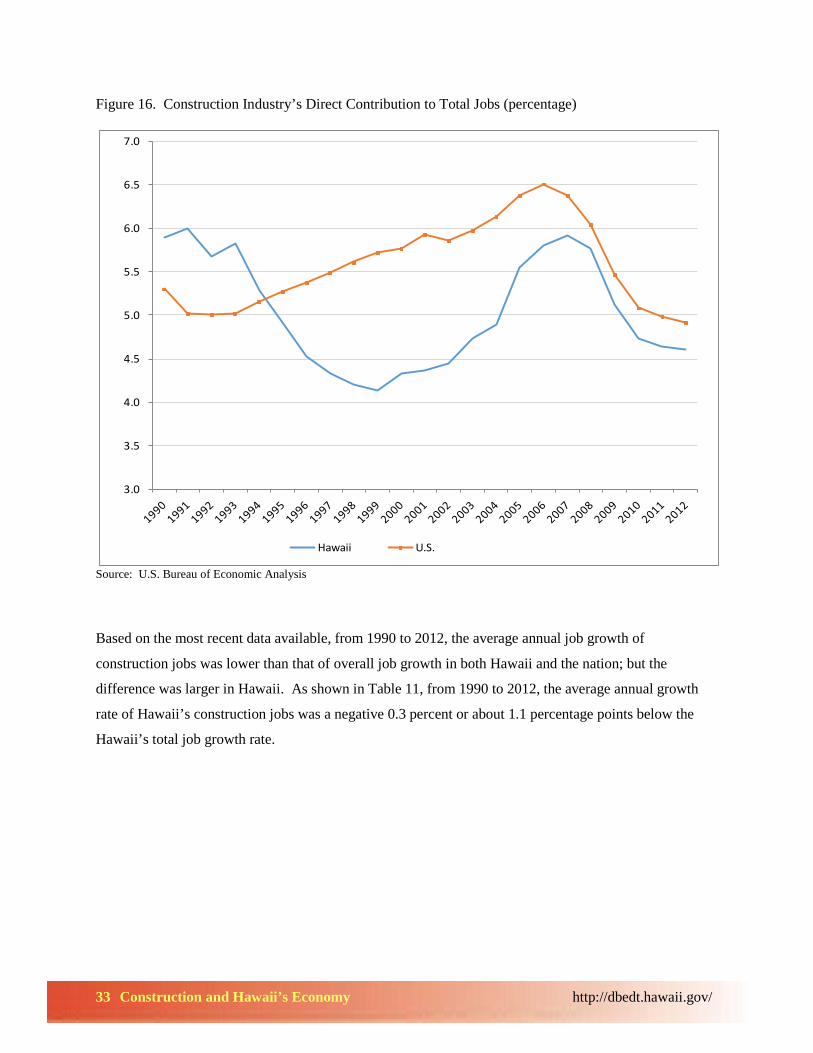
Figure 16. Construction Industry’s Direct Contribution to Total Jobs (percentage)
Source: U.S. Bureau of Economic Analysis
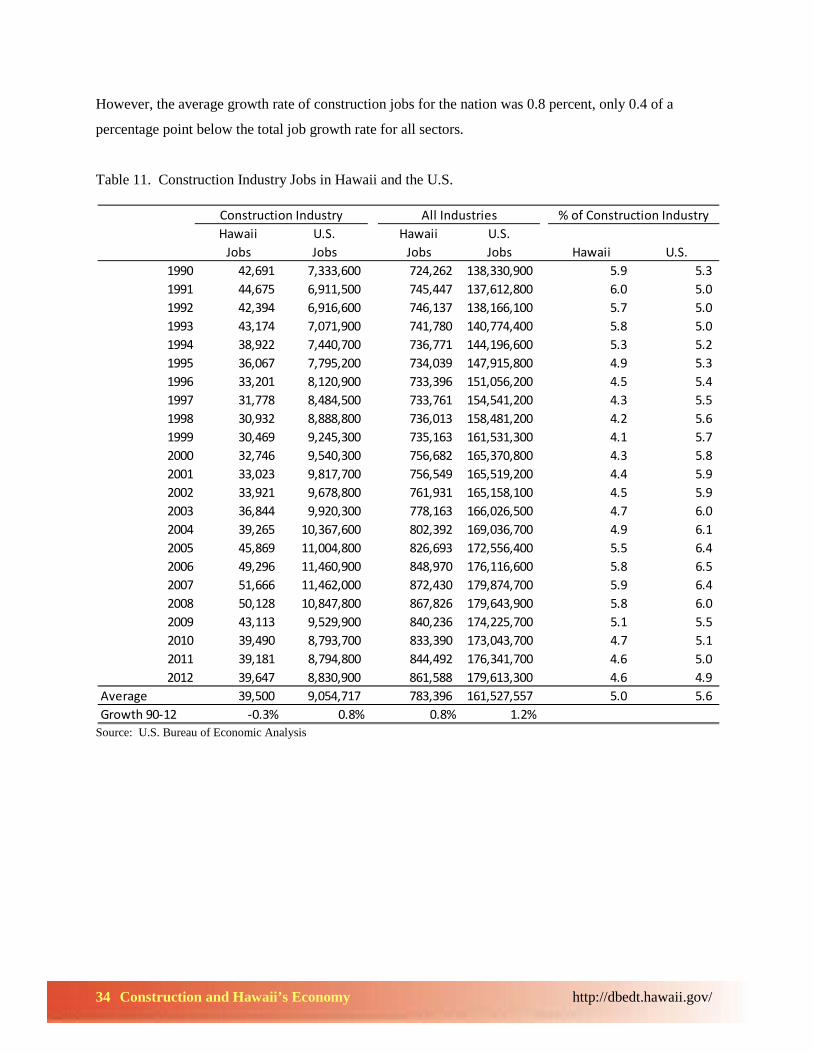
Based on the most recent data available, from 1990 to 2012, the average annual job growth of
construction jobs was lower than that of overall job growth in both Hawaii and the nation; but the
difference was larger in Hawaii. As shown in Table 11, from 1990 to 2012, the average annual growth
rate of Hawaii’s construction jobs was a negative 0.3 percent or about 1.1 percentage points below the
Hawaii’s total job growth rate.
3.0
3.5
4.0
4.5
5.0
5.5
6.0
6.5
7.0
Hawaii U.S.
34 Construction and Hawaii’s Economy http://dbedt.hawaii.gov/
However, the average growth rate of construction jobs for the nation was 0.8 percent, only 0.4 of a
percentage point below the total job growth rate for all sectors.
Table 11. Construction Industry Jobs in Hawaii and the U.S.
Source: U.S. Bureau of Economic Analysis
Hawaii U.S. Hawaii U.S.Jobs Jobs Jobs Jobs Hawaii U.S.
1990 42,691 7,333,600 724,262 138,330,900 5.9 5.3 1991 44,675 6,911,500 745,447 137,612,800 6.0 5.0 1992 42,394 6,916,600 746,137 138,166,100 5.7 5.0 1993 43,174 7,071,900 741,780 140,774,400 5.8 5.0 1994 38,922 7,440,700 736,771 144,196,600 5.3 5.2 1995 36,067 7,795,200 734,039 147,915,800 4.9 5.3 1996 33,201 8,120,900 733,396 151,056,200 4.5 5.4 1997 31,778 8,484,500 733,761 154,541,200 4.3 5.5 1998 30,932 8,888,800 736,013 158,481,200 4.2 5.6 1999 30,469 9,245,300 735,163 161,531,300 4.1 5.7 2000 32,746 9,540,300 756,682 165,370,800 4.3 5.8 2001 33,023 9,817,700 756,549 165,519,200 4.4 5.9 2002 33,921 9,678,800 761,931 165,158,100 4.5 5.9 2003 36,844 9,920,300 778,163 166,026,500 4.7 6.0 2004 39,265 10,367,600 802,392 169,036,700 4.9 6.1 2005 45,869 11,004,800 826,693 172,556,400 5.5 6.4 2006 49,296 11,460,900 848,970 176,116,600 5.8 6.5 2007 51,666 11,462,000 872,430 179,874,700 5.9 6.4 2008 50,128 10,847,800 867,826 179,643,900 5.8 6.0 2009 43,113 9,529,900 840,236 174,225,700 5.1 5.5 2010 39,490 8,793,700 833,390 173,043,700 4.7 5.1 2011 39,181 8,794,800 844,492 176,341,700 4.6 5.0 2012 39,647 8,830,900 861,588 179,613,300 4.6 4.9
Average 39,500 9,054,717 783,396 161,527,557 5.0 5.6 Growth 90-12 -0.3% 0.8% 0.8% 1.2%
Construction Industry All Industries % of Construction Industry
35 Construction and Hawaii’s Economy http://dbedt.hawaii.gov/
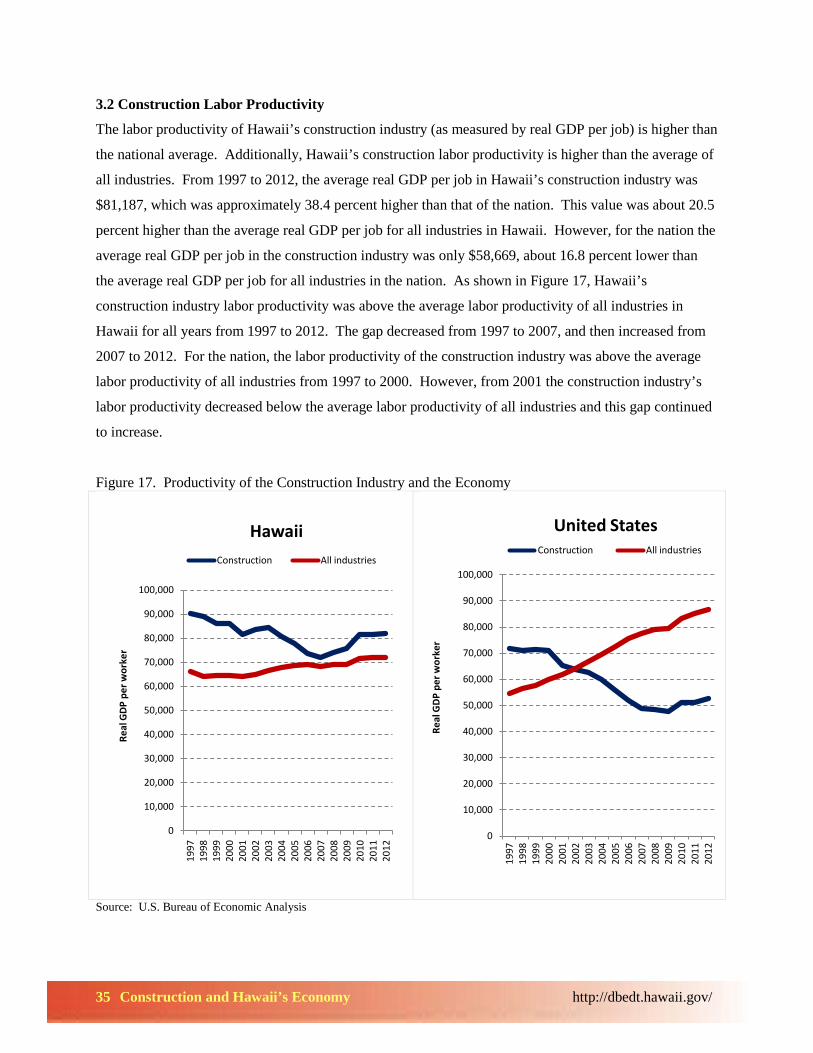
3.2 Construction Labor Productivity
The labor productivity of Hawaii’s construction industry (as measured by real GDP per job) is higher than
the national average. Additionally, Hawaii’s construction labor productivity is higher than the average of
all industries. From 1997 to 2012, the average real GDP per job in Hawaii’s construction industry was
$81,187, which was approximately 38.4 percent higher than that of the nation. This value was about 20.5
percent higher than the average real GDP per job for all industries in Hawaii. However, for the nation the
average real GDP per job in the construction industry was only $58,669, about 16.8 percent lower than
the average real GDP per job for all industries in the nation. As shown in Figure 17, Hawaii’s
construction industry labor productivity was above the average labor productivity of all industries in
Hawaii for all years from 1997 to 2012. The gap decreased from 1997 to 2007, and then increased from
2007 to 2012. For the nation, the labor productivity of the construction industry was above the average
labor productivity of all industries from 1997 to 2000. However, from 2001 the construction industry’s
labor productivity decreased below the average labor productivity of all industries and this gap continued
to increase.
Figure 17. Productivity of the Construction Industry and the Economy
Source: U.S. Bureau of Economic Analysis
0
10,000
20,000
30,000
40,000
50,000
60,000
70,000
80,000
90,000
100,000
1997
19
98
1999
20
00
2001
20
02
2003
20
04
2005
20
06
2007
20
08
2009
20
10
2011
20
12
Real
GDP
per
wor
ker
Hawaii Construction All industries
0
10,000
20,000
30,000
40,000
50,000
60,000
70,000
80,000
90,000
100,000
1997
19
98
1999
20
00
2001
20
02
2003
20
04
2005
20
06
2007
20
08
2009
20
10
2011
20
12
Real
GDP
per
wor
ker
United States Construction All industries
36 Construction and Hawaii’s Economy http://dbedt.hawaii.gov/
Category MultiplierImpact of $1 million
Construction Spending Output 2.08 $2,080,000Household Income 0.6 $600,000State Taxes 0.11 $110,000
Industry Output Share
Real estate and rentals 40.7%Accommodations 13.1%Government 11.4%Eating and drinking 6.7%Transportation 5.3%Utilities 2.7%Health services 2.7%Other services 2.5%Retail trade 2.4%Educational services 2.2%Finance and insurance 2.1%Mining and construction 2.1%Other 6.1%
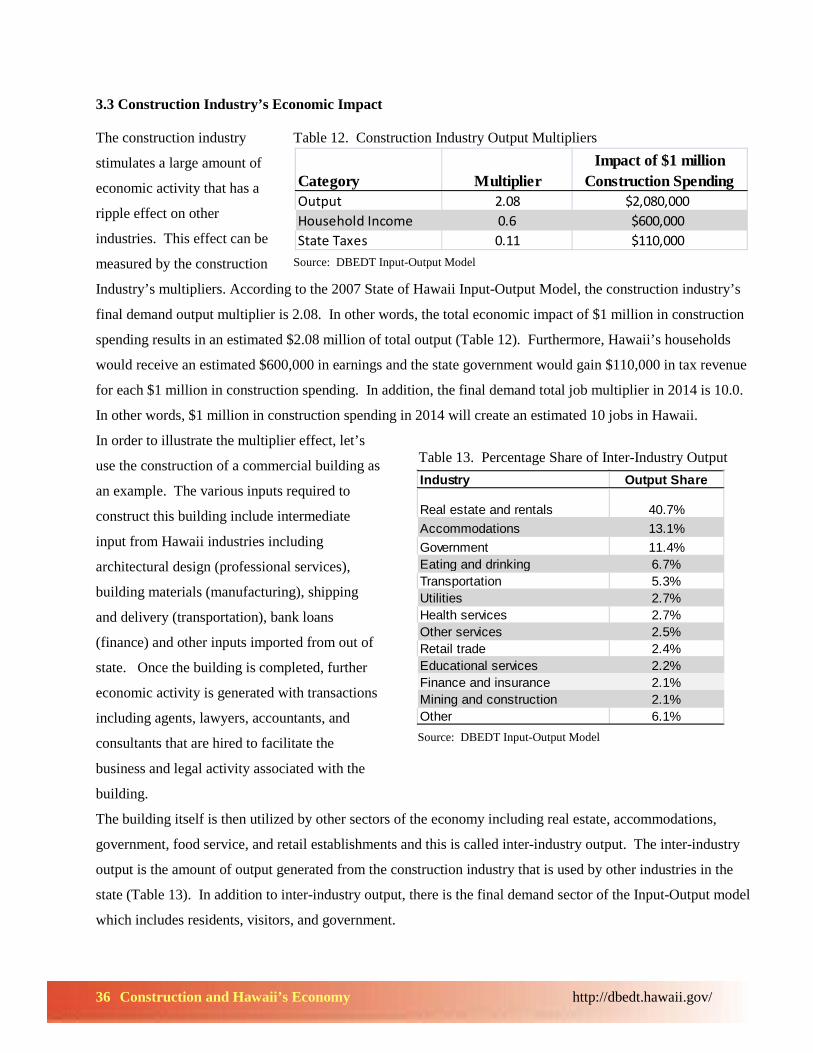
3.3 Construction Industry’s Economic Impact The construction industry
stimulates a large amount of
economic activity that has a
ripple effect on other
industries. This effect can be
measured by the construction
Table 12. Construction Industry Output Multipliers
Source: DBEDT Input-Output Model
Industry’s multipliers. According to the 2007 State of Hawaii Input-Output Model, the construction industry’s
final demand output multiplier is 2.08. In other words, the total economic impact of $1 million in construction
spending results in an estimated $2.08 million of total output (Table 12). Furthermore, Hawaii’s households
would receive an estimated $600,000 in earnings and the state government would gain $110,000 in tax revenue
for each $1 million in construction spending. In addition, the final demand total job multiplier in 2014 is 10.0.
In other words, $1 million in construction spending in 2014 will create an estimated 10 jobs in Hawaii.
In order to illustrate the multiplier effect, let’s
use the construction of a commercial building as
an example. The various inputs required to
construct this building include intermediate
input from Hawaii industries including
architectural design (professional services),
building materials (manufacturing), shipping
and delivery (transportation), bank loans
(finance) and other inputs imported from out of
state. Once the building is completed, further
economic activity is generated with transactions
including agents, lawyers, accountants, and
consultants that are hired to facilitate the
business and legal activity associated with the
building.
Table 13. Percentage Share of Inter-Industry Output
Source: DBEDT Input-Output Model
The building itself is then utilized by other sectors of the economy including real estate, accommodations,
government, food service, and retail establishments and this is called inter-industry output. The inter-industry
output is the amount of output generated from the construction industry that is used by other industries in the
state (Table 13). In addition to inter-industry output, there is the final demand sector of the Input-Output model
which includes residents, visitors, and government.
37 Construction and Hawaii’s Economy http://dbedt.hawaii.gov/
There have been a number of studies conducted on the housing market focusing on what determines
demand in housing market and how the market price has been responsive to the demand change. Income
and job growth, mortgage rate, tax structure, credit market constraints, consumer confidence, and
expectation of future housing price movements have been discussed as major factors that impact the
demand. This is homeownership demand, which is somewhat different from housing stock demand.
Demand for housing stock is related to how many housing units are needed to accommodate every
household adequately in a given region regardless if a household owns or rents. Demand for housing
stock is determined by long-term factors such as population growth, household formation patterns, and
other ownership behaviors. This section examines historical trends of these factors and attempts to
estimate how many additional housing units are required annually to meet Hawaii’s projected population
growth, considering expected changes in household structure and demographic characteristics.
4.1 Population and Housing Growth
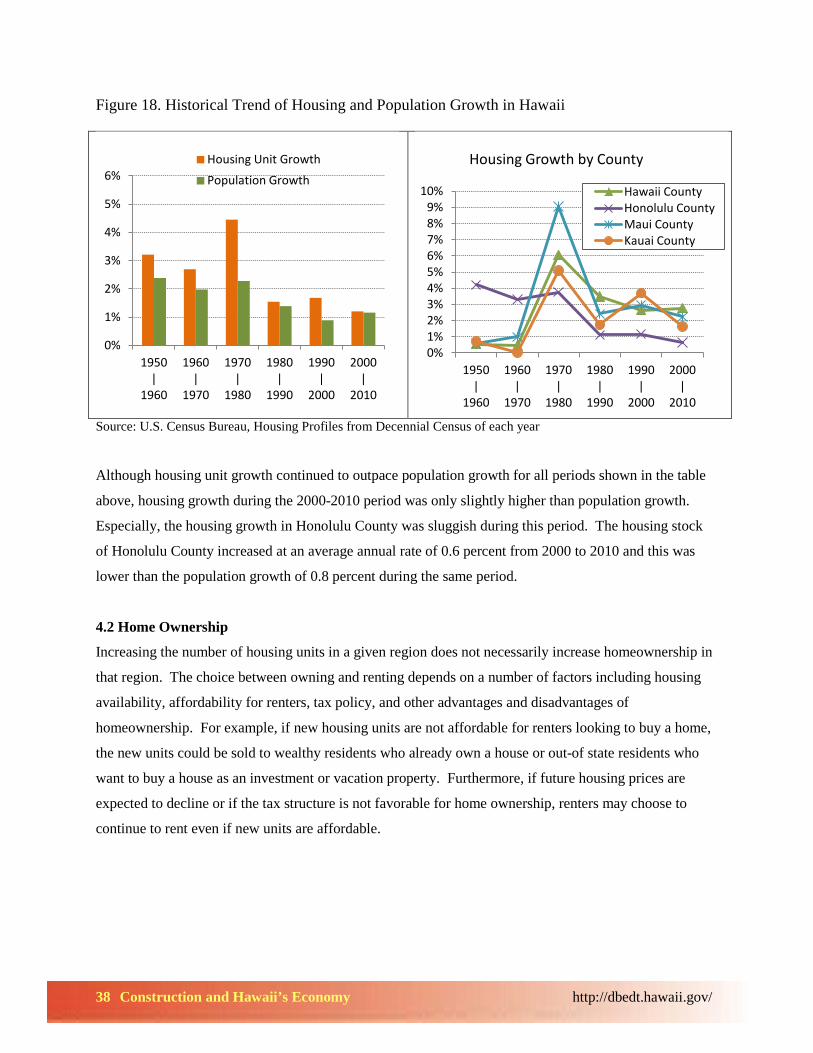
Historically, housing growth in Hawaii has outpaced population growth (Figure 18). Housing growth was
especially strong from 1970 to 1980 as the neighbor islands experienced a development boom. Total
housing in Hawaii and Maui County increased by 80 percent and 138 percent respectively from 1970 to
1980. For state as a whole, total housing units increased by 55 percent during this period.
4. Housing Supply and Demand in Hawaii
38 Construction and Hawaii’s Economy http://dbedt.hawaii.gov/
Figure 18. Historical Trend of Housing and Population Growth in Hawaii
Source: U.S. Census Bureau, Housing Profiles from Decennial Census of each year
Although housing unit growth continued to outpace population growth for all periods shown in the table
above, housing growth during the 2000-2010 period was only slightly higher than population growth.
Especially, the housing growth in Honolulu County was sluggish during this period. The housing stock
of Honolulu County increased at an average annual rate of 0.6 percent from 2000 to 2010 and this was
lower than the population growth of 0.8 percent during the same period.
4.2 Home Ownership
Increasing the number of housing units in a given region does not necessarily increase homeownership in
that region. The choice between owning and renting depends on a number of factors including housing
availability, affordability for renters, tax policy, and other advantages and disadvantages of
homeownership. For example, if new housing units are not affordable for renters looking to buy a home,
the new units could be sold to wealthy residents who already own a house or out-of state residents who
want to buy a house as an investment or vacation property. Furthermore, if future housing prices are
expected to decline or if the tax structure is not favorable for home ownership, renters may choose to
continue to rent even if new units are affordable.
0%
1%
2%
3%
4%
5%
6%
1950 |
1960
1960 |
1970
1970 |
1980
1980 |
1990
1990 |
2000
2000 |
2010
Housing Unit Growth
Population Growth
0% 1% 2% 3% 4% 5% 6% 7% 8% 9%
10%
1950 |
1960
1960 |
1970
1970 |
1980
1980 |
1990
1990 |
2000
2000 |
2010
Housing Growth by County
Hawaii County Honolulu County Maui County Kauai County
39 Construction and Hawaii’s Economy http://dbedt.hawaii.gov/
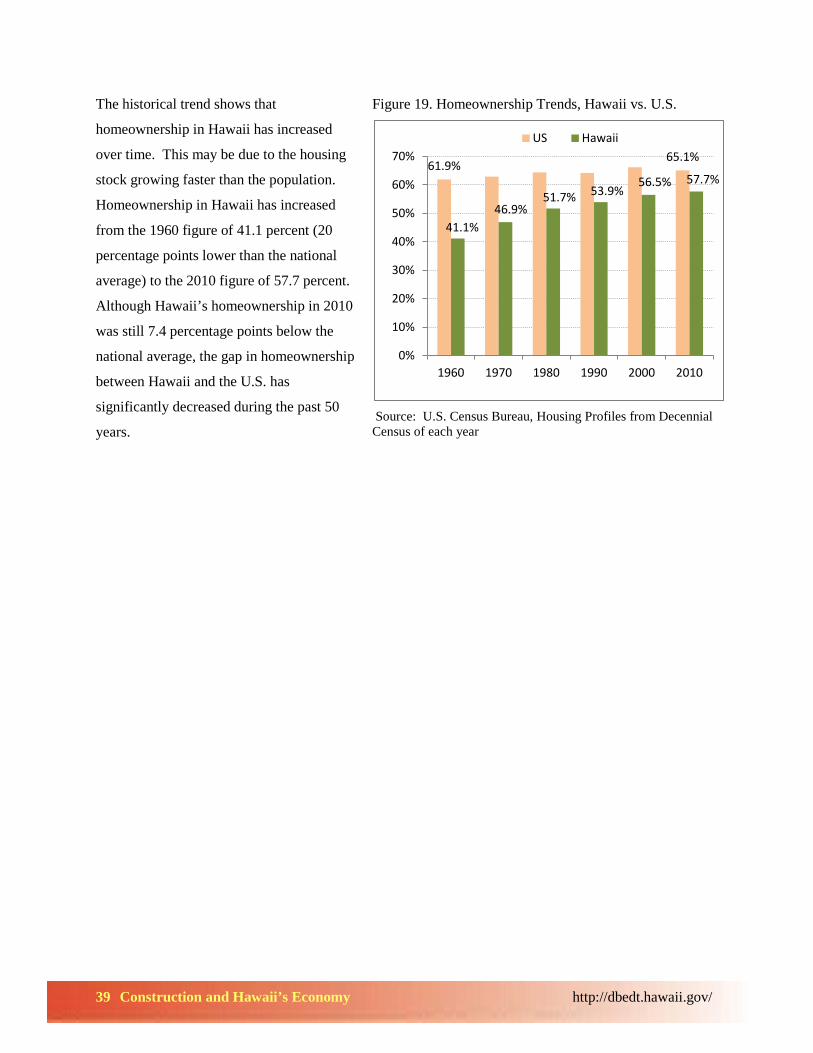
The historical trend shows that
homeownership in Hawaii has increased
over time. This may be due to the housing
stock growing faster than the population.
Homeownership in Hawaii has increased
from the 1960 figure of 41.1 percent (20
percentage points lower than the national
average) to the 2010 figure of 57.7 percent.
Although Hawaii’s homeownership in 2010
was still 7.4 percentage points below the
national average, the gap in homeownership
between Hawaii and the U.S. has
significantly decreased during the past 50
years.
Figure 19. Homeownership Trends, Hawaii vs. U.S.
Source: U.S. Census Bureau, Housing Profiles from Decennial Census of each year
61.9% 65.1%
41.1% 46.9%
51.7% 53.9% 56.5% 57.7%
0%
10%
20%
30%
40%
50%
60%
70%
1960 1970 1980 1990 2000 2010
US Hawaii
40 Construction and Hawaii’s Economy http://dbedt.hawaii.gov/
4.3 Vacancy Rates
Vacancy rates are a good indicator of a given region’s shortage or surplus of housing supply. Among
519,508 housing units available in Hawaii at the time of the 2010 decennial census, 455,338 units
(87.6%) were occupied either by owners or renters and 64,170 units (12.4%) were vacant. Hawaii’s
vacancy rate of 12.4 percent was slightly higher than the overall U.S. rate of 11.4 percent for the same
year.
A housing unit can be vacant for various reasons including selling the unit, listing the unit for rent, or the
unit is sold or rented and waiting for occupancy. Another big component is vacancy for occasional use
(seasonal, recreational, etc.). Vacancy for occasional use accounted for 5.8 percent of total available
housing units in Hawaii in 2010, which is much higher than the U.S. average of 3.5 percent.
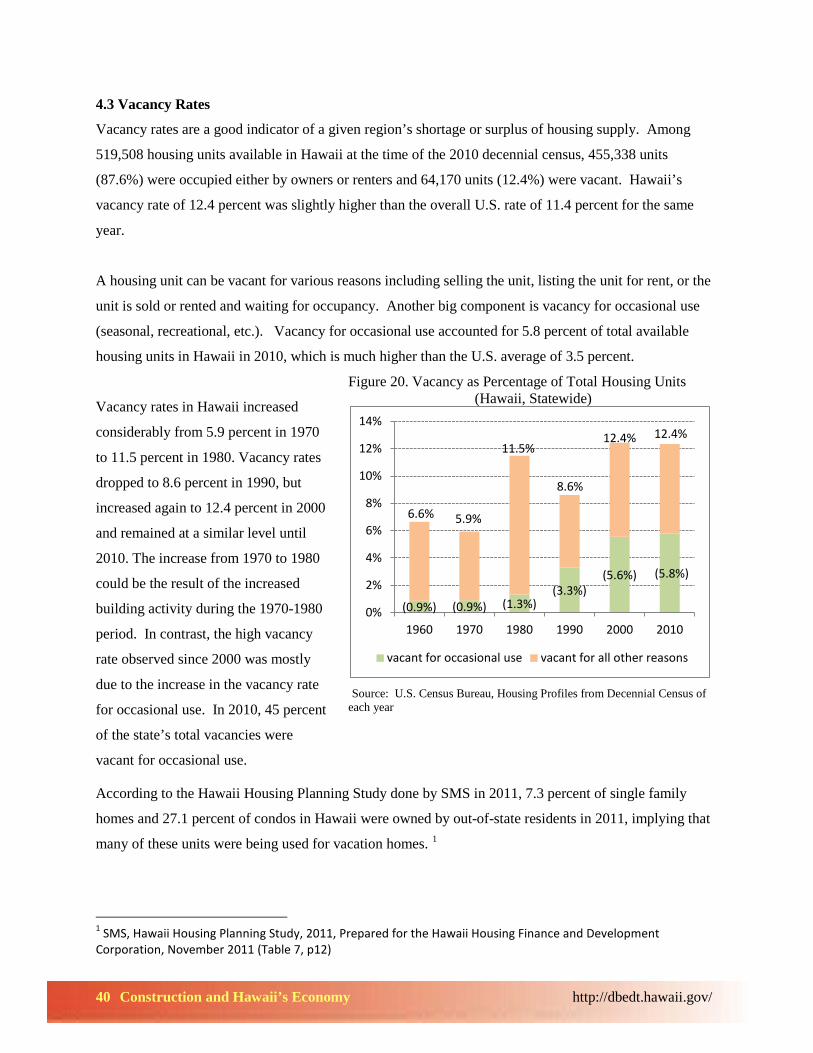
Vacancy rates in Hawaii increased
considerably from 5.9 percent in 1970
to 11.5 percent in 1980. Vacancy rates
dropped to 8.6 percent in 1990, but
increased again to 12.4 percent in 2000
and remained at a similar level until
2010. The increase from 1970 to 1980
could be the result of the increased
building activity during the 1970-1980
period. In contrast, the high vacancy
rate observed since 2000 was mostly
due to the increase in the vacancy rate
for occasional use. In 2010, 45 percent
of the state’s total vacancies were
vacant for occasional use.
Figure 20. Vacancy as Percentage of Total Housing Units (Hawaii, Statewide)
Source: U.S. Census Bureau, Housing Profiles from Decennial Census of each year
According to the Hawaii Housing Planning Study done by SMS in 2011, 7.3 percent of single family
homes and 27.1 percent of condos in Hawaii were owned by out-of-state residents in 2011, implying that
many of these units were being used for vacation homes. 1
1 SMS, Hawaii Housing Planning Study, 2011, Prepared for the Hawaii Housing Finance and Development Corporation, November 2011 (Table 7, p12)
(0.9%) (0.9%) (1.3%) (3.3%)
(5.6%) (5.8%)
6.6% 5.9%
11.5%
8.6%
12.4% 12.4%
0%
2%
4%
6%
8%
10%
12%
14%
1960 1970 1980 1990 2000 2010
vacant for occasional use vacant for all other reasons
41 Construction and Hawaii’s Economy http://dbedt.hawaii.gov/
The vacancy patterns show quite a big
difference between Honolulu County and the
neighbor islands. For all neighbor islands, about
18-24 percent of total housing units were held
vacant in 2010 and a large portion of these
vacancies were for occasional use. In contrast,
the overall vacancy rate for Honolulu County
was relatively low at 7.7 percent in 2010. The
vacancy rate for occasional use in Honolulu, as
a percentage of total housing units, was also low
at 2.6 percent for 2010.
Table 14. Vacancy as Percentage of Total Housing
(by county, 2010)
Total Occasional use
All other reasons
Statewide 12.4% 5.8% 6.6%
Honolulu County 7.7% 2.6% 5.1%
Hawaii County 18.5% 8.7% 9.8%
Maui County 23.4% 14.1% 9.3%
Kauai County 22.0% 14.0% 8.0% Source: U.S. Census Bureau, Housing Profiles from Decennial Census 2010
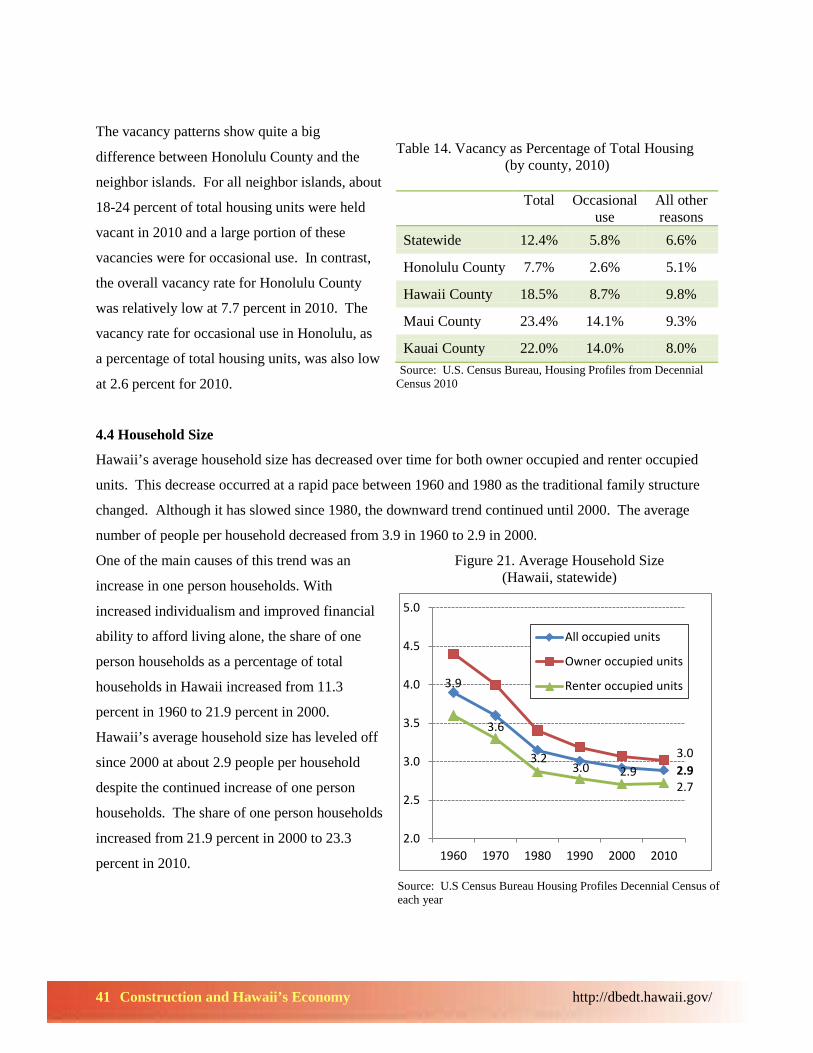
4.4 Household Size
Hawaii’s average household size has decreased over time for both owner occupied and renter occupied
units. This decrease occurred at a rapid pace between 1960 and 1980 as the traditional family structure
changed. Although it has slowed since 1980, the downward trend continued until 2000. The average
number of people per household decreased from 3.9 in 1960 to 2.9 in 2000.
One of the main causes of this trend was an
increase in one person households. With
increased individualism and improved financial
ability to afford living alone, the share of one
person households as a percentage of total
households in Hawaii increased from 11.3
percent in 1960 to 21.9 percent in 2000.
Hawaii’s average household size has leveled off
since 2000 at about 2.9 people per household
despite the continued increase of one person
households. The share of one person households
increased from 21.9 percent in 2000 to 23.3
percent in 2010.
Figure 21. Average Household Size (Hawaii, statewide)
Source: U.S Census Bureau Housing Profiles Decennial Census of each year
3.9
3.2 3.0 2.9 2.9
3.0
3.6
2.7
2.0
2.5
3.0
3.5
4.0
4.5
5.0
1960 1970 1980 1990 2000 2010
All occupied units
Owner occupied units
Renter occupied units
42 Construction and Hawaii’s Economy http://dbedt.hawaii.gov/
One explanation for the leveling-off of the average household size, in spite of the increase in one person
households, is the increase in multi-generational households. The increase in multi-generational
households has been widely observed across the nation during the past decade. As with many other
regions with high housing costs, many low income individuals in Hawaii are unable to afford to live
separately from their families. The recent recession also contributed to the increase of multi-generational
households as many individuals moved back home.
4.5 Number of Housing Units Required
Population growth is the most important component of long-term housing demand. Hawaii’s population
is projected to grow at about 0.85 percent annually until 2020, adding about 85,000 more people from
2013 to 2020. If the average household size remains unchanged at the current level of 2.9 people per
household, Hawaii will need to add about 4,100 new housing units every year to adequately house the
projected population growth until 2020. However, since not all newly built units will be occupied,
Hawaii needs to build more than is required to accommodate the projected vacancy rates. Another factor
to be considered in the estimation is the demolition of housing units. The number of units demolished has
fluctuated over the years, but on average 520 housing units were demolished annually since 2000.2 Thus,
in order to add 4,200 new housing units annually after replacing demolition and subtracting units to be
held vacant, approximately 5,200 units need to be built each year until 2020 to adequately accommodate
the projected population growth. This estimation is based on the assumption that the average household
size and vacancy rates will remain similar to the 2010 decennial census figures. However, if less people
live in each household and if more housing units are held vacant for occasional use, Hawaii would need to
build more housing units.
Another key issue to be taken into consideration is the impact of the aging population on the future
housing demand. In Hawaii, the share of the population age 65 and older increased from 8.0 percent in
1980 to 14.5 percent in 2010. This trend will continue and the share of the population 65 and older will
increase to 23.6 percent by 2040. 3 The majority of the people in this age bracket want to stay in their
own homes as long as possible as they age. Since the share of one person households is much higher in
the elderly population, the increase in this demographic is likely to decrease the average household size.
However, this trend may be offset by trends in the other direction such as the increase in multi-
generational households. The next section forecasts construction values and residential housing
is expected to lead the construction industry over the next two years. 2 DBEDT, 2012 State of Hawaii Data Book, Table 21.07 3 DBEDT, Population and Economic Projections for the State of Hawaii to 2040, March 2012
43 Construction and Hawaii’s Economy http://dbedt.hawaii.gov/
The 2014 and 2015 forecast for the construction industry is for firm growth in both the public and private
sectors. The industry is gaining momentum from the Kakaako development, the rail project, and
government construction projects all coming together around the same time.
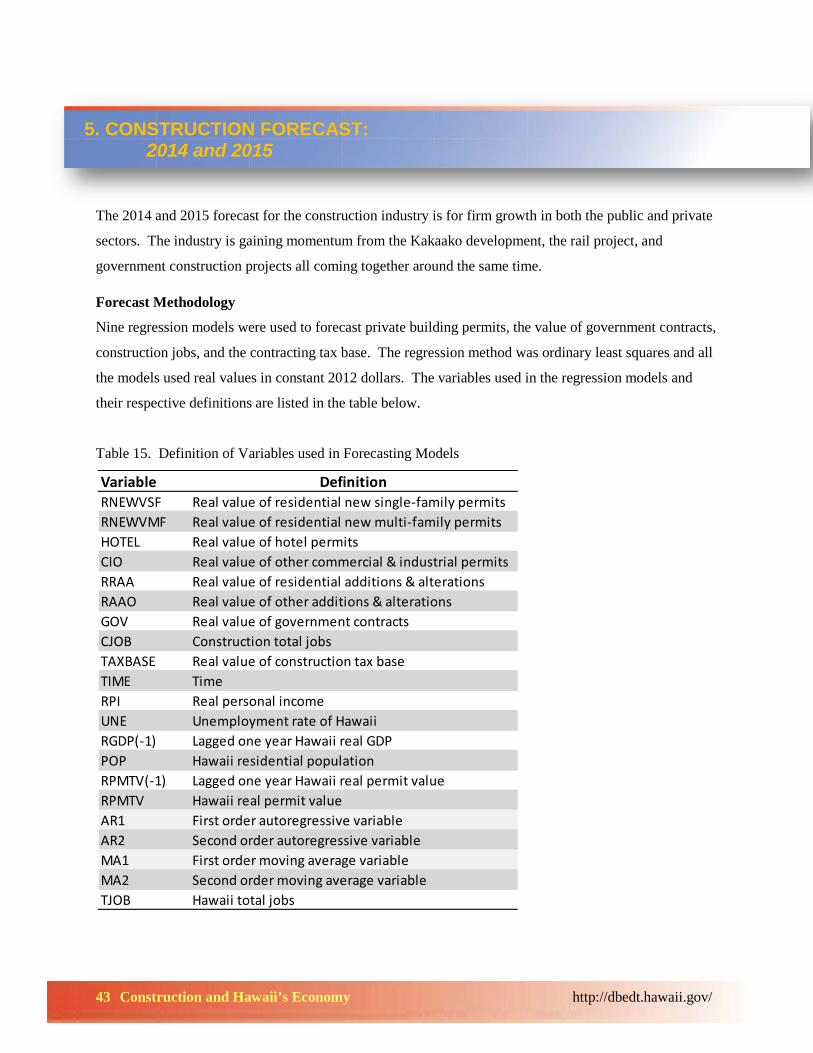
Forecast Methodology
Nine regression models were used to forecast private building permits, the value of government contracts,
construction jobs, and the contracting tax base. The regression method was ordinary least squares and all
the models used real values in constant 2012 dollars. The variables used in the regression models and
their respective definitions are listed in the table below.
Table 15. Definition of Variables used in Forecasting Models
Variable DefinitionRNEWVSF Real value of residential new single-family permitsRNEWVMF Real value of residential new multi-family permitsHOTEL Real value of hotel permitsCIO Real value of other commercial & industrial permitsRRAA Real value of residential additions & alterationsRAAO Real value of other additions & alterationsGOV Real value of government contractsCJOB Construction total jobsTAXBASE Real value of construction tax baseTIME TimeRPI Real personal incomeUNE Unemployment rate of HawaiiRGDP(-1) Lagged one year Hawaii real GDPPOP Hawaii residential populationRPMTV(-1) Lagged one year Hawaii real permit valueRPMTV Hawaii real permit valueAR1 First order autoregressive variableAR2 Second order autoregressive variableMA1 First order moving average variableMA2 Second order moving average variableTJOB Hawaii total jobs
5. CONSTRUCTION FORECAST: 2014 and 2015
44 Construction and Hawaii’s Economy http://dbedt.hawaii.gov/
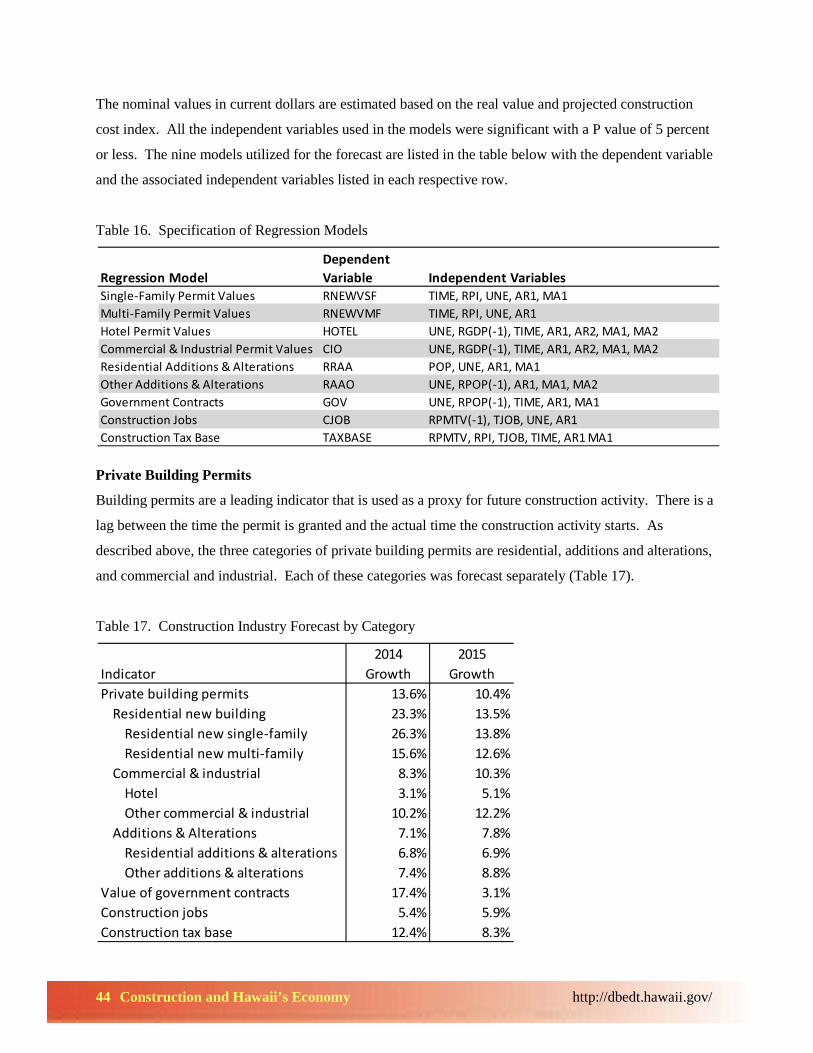
The nominal values in current dollars are estimated based on the real value and projected construction
cost index. All the independent variables used in the models were significant with a P value of 5 percent
or less. The nine models utilized for the forecast are listed in the table below with the dependent variable
and the associated independent variables listed in each respective row.
Table 16. Specification of Regression Models
Private Building Permits
Building permits are a leading indicator that is used as a proxy for future construction activity. There is a
lag between the time the permit is granted and the actual time the construction activity starts. As
described above, the three categories of private building permits are residential, additions and alterations,
and commercial and industrial. Each of these categories was forecast separately (Table 17).
Table 17. Construction Industry Forecast by Category
Regression ModelDependent Variable Independent Variables
Single-Family Permit Values RNEWVSF TIME, RPI, UNE, AR1, MA1Multi-Family Permit Values RNEWVMF TIME, RPI, UNE, AR1Hotel Permit Values HOTEL UNE, RGDP(-1), TIME, AR1, AR2, MA1, MA2Commercial & Industrial Permit Values CIO UNE, RGDP(-1), TIME, AR1, AR2, MA1, MA2Residential Additions & Alterations RRAA POP, UNE, AR1, MA1Other Additions & Alterations RAAO UNE, RPOP(-1), AR1, MA1, MA2Government Contracts GOV UNE, RPOP(-1), TIME, AR1, MA1Construction Jobs CJOB RPMTV(-1), TJOB, UNE, AR1Construction Tax Base TAXBASE RPMTV, RPI, TJOB, TIME, AR1 MA1
2014 2015Indicator Growth GrowthPrivate building permits 13.6% 10.4% Residential new building 23.3% 13.5% Residential new single-family 26.3% 13.8% Residential new multi-family 15.6% 12.6% Commercial & industrial 8.3% 10.3% Hotel 3.1% 5.1% Other commercial & industrial 10.2% 12.2% Additions & Alterations 7.1% 7.8% Residential additions & alterations 6.8% 6.9% Other additions & alterations 7.4% 8.8%Value of government contracts 17.4% 3.1%Construction jobs 5.4% 5.9%Construction tax base 12.4% 8.3%
45 Construction and Hawaii’s Economy http://dbedt.hawaii.gov/
Residential construction is projected to have strong growth as supply chases demand. The forecast for
residential permit values is for an increase of 23.3 percent in 2014 and an increase of 13.5 percent in
2015, with projected values at $1.29 billion and $1.46 billion respectively. New single family
construction will lead the growth, with projected increases of 26.3 percent in 2014 and 13.8 percent in
2015. While not as strong as single-family, multi-family permit growth is projected to be 15.6 percent in
2014 and 12.6 percent in 2015. However, the total forecast values of 1.29 billion for 2014 and $1.46
billion for 2015 are still well below the 2005 peak of $2.26 billion.
The Commercial and Industrial category is expected to increase in the next two years as companies
cautiously move forward with projects that were put on hold during the downturn. The growth in the
commercial and industrial category is projected to be 8.3 percent in 2014 and 10.3 percent in 2015, with
projected permit values of $316 million and $349 million respectively. While the forecast predicts two
consecutive years of growth, the forecast values are still below the 2006 peak level of $732 million.
The category that is likely to have some volatility is additions and alterations. The solar tax credit
revisions and grid constraints appear to have had an impact on the value of photovoltaic permits.
Therefore, the forecasted growth in the additions and alterations category is below most of the other
categories. The forecasted growth for 2014 is 7.1 percent and 7.8 percent in 2015. The forecast for
permit values of the additions and alterations category is $1.42 billion in 2014 and rising slightly to $1.53
billion in 2015. The residential additions and alterations category includes photovoltaic permits and
therefore is projected to grow slower than the non-residential other category, with forecasted growth of
6.8 percent in 2014 and 6.9 percent in 2015. The other additions and alterations category will grow at a
faster pace with 2014 growth projected at 7.4 percent and 2015 growth at 8.8 percent.
The total private construction forecast was derived by summing the forecasts for the three private building
permit categories: residential, commercial and industrial, and additions and alterations. The 2014 forecast
for the private construction sector is $3.02 billion dollars, a 13.6 percent increase over 2013. The 2015
forecast is for $3.33 billion, a 10.4 percent increase over 2014. While the forecast predicts continued
growth in the industry, the 2014 and 2015 forecast values are expected to remain below the 2006 peak of
$3.8 billion.
46 Construction and Hawaii’s Economy http://dbedt.hawaii.gov/
Government Contracts Awards
The forecast was calculated using Hawaii’s Building Industry Magazine’s government contracts awarded
data. It is important to note that these data are the value of contracts awarded rather than permit values as
with the private construction sector. The value of the contracts awarded includes federal, state, and
county projects. The forecast for government contracts awards is for 17.4 percent growth in 2014 and 3.1
percent growth in 2015. The respective forecast values are $1.41 billion and $1.45 billion.
Construction Jobs and Contracting Tax Base
Once permits are authorized, companies start to hire workers and begin the actual construction activity.
The period in which the construction activity occurs can be seen in the construction jobs data. The 2014
forecast for construction jobs is 46,592 jobs, a 5.4 percent increase over 2013. The 2015 forecast is for
49,334 jobs, a 5.9 percent increase over 2014.
While jobs data are a good measure for current building activity, the contracting tax base is a proxy for
completed construction. Since the low point of 2010, the contracting tax base has made strong gains.
The 2014 forecast for the contracting tax base is $8.3 billion dollars, a 12.2 percent increase over 2013.
The 2015 forecast is for $9.0 billion, an 8.3 percent increase over 2014.
47 Construction and Hawaii’s Economy http://dbedt.hawaii.gov/
Over the past decade, Hawaii’s construction industry has gone through a full cycle of expansion and
contraction. The previous construction cycles were led by residential construction. However, the current
construction expansion phase that started in 2012 is led by activities in the addition and alterations
category, one third of which were photovoltaic system installations. The value of new residential
building permits fell to 31.7 percent of the total from 64.7 percent in 2005, while the permit values of
additions and alterations increased its share from 22.9 percent in 2005 to 58.1 percent in 2012. The
number of new residential units authorized during the 2001-2013 period averaged about 2,800 units each
year and this is less than half of those authorized during the 2000s of about 6,000 units per year.
There are three factors that are driving up housing demand in Hawaii. First, is the population growth,
which has been growing at a rate of 1.0 percent annually since 2010 and 1.2 percent annually between
2000 and 2010. This converts to an additional 14,000 people per year that need places to stay. Second, is
the high rate of homes that have been converted to visitor use due to a limited amount of hotel rooms,
especially on Oahu. As of 2012, there were more than 10,000 housing units were converted to visitor
accommodations. Third, is the increase in military forces that have been shifted to Hawaii as a result of
the national defense strategy to shift forces from the Atlantic to the Pacific. These active military
personnel and their families are increasing demand for off-base housing.
Due to the previous contraction in the construction industry, especially in the residential area, there is
currently a short supply of residential housing units. This shortage may drive up home price more in the
next few years.
In 2013, private building permits increased 2.9 percent over 2012. Residential construction led the
growth with an increase of 22.4 percent as supply continued to chase demand. The growth in residential
construction is expected to continue as the population grows at a projected annual rate of 0.85 percent
from 2013 to 2020. In order to accommodate this population growth, it is estimated that an additional
5,200 housing units will be required annually.
6. Conclusions
48 Construction and Hawaii’s Economy http://dbedt.hawaii.gov/
The commercial and industrial category also had strong growth in 2013 with an increase of 9.4 percent.
The category that was a lag on growth was the additions and alterations category, which was down 8.9
percent over 2012. One reason for this decline was a 29.7 decrease in the value of photovoltaic permits.
In looking at the counties, three of the four counties had an increase in 2013 permit values with Honolulu
County up 5.5 percent, Hawaii County up 3.8 percent, and Kauai County is up 6.8 percent. The one
county that showed a decrease was Maui County, which decreased 11.4 percent in 2013.
Currently, the construction industry contributes about 5.5 percent to Hawaii’s gross domestic product,
which is down from the peak of 6.8 percent in 2007.
The forecast for Hawaii’s construction industry is for growth of 12.4 in 2014 and 8.3 percent in 2015.
Construction job growth led Hawaii’s economy adding 2,500 jobs in 2013 and the job growth will
continue in 2014. There are a number of positive factors that will drive this growth including
infrastructure projects, large scale commercial projects, and residential construction. The two most
prominent of these are the Honolulu Rapid Transportation Rail and the Kakaako area development
projects. Hawaii also appears to be well positioned to benefit from the military’s “Pivot Towards Asia”
policy of redeploying resources in the Pacific Region. One example is the National Defense
Authorization Act, which includes approximately $400 million in military construction projects for the
state.
While we expect the fundamentals of construction to continue to be positive, there are some areas of the
economy that deserve caution including the Fed’s monetary tapering policy, mortgage rates, and
continued volatility with Hawaii’s photovoltaic permits. However, the positive momentum of Hawaii’s
construction industry is robust and construction will be one of the main engines for growth in 2014 and
2015.
49 Construction and Hawaii’s Economy http://dbedt.hawaii.gov/
REFERENCES: Bureau of Economic Analysis. 2013. Regional Economic Statistics. http://www.bea.gov/itable/index.cfm Bureau of Economic Analysis. 2013. Advance Estimate Annual Economic Growth, Press Release. January 30. http://www.bea.gov/newsreleases/national/gdp/2014/pdf/gdp4q13_adv.pdf Census Bureau. 2013. Housing Start Summary Statistics. http://www.census.gov/starts Census Bureau. 2013. Construction Spending Statistics. http://www.census.gov/construction DBEDT. 2013. Hawaii Annual Data Book. http://dbedt.hawaii.gov/economic/databook/ DBEDT. 2013. Monthly Economic Indicators. http://dbedt.hawaii.gov/economic/mei/ DBEDT. 2014. Quarterly Statistical and Economic Report (QSER). http://dbedt.hawaii.gov/economic/qser/outlook-economy/ Federal Reserve Bank. 2013. Economic Projections of Federal Reserve Board Members and Federal Reserve Bank Presidents. December 18. http://www.federalreserve.gov/monetarypolicy/files/fomcprojtabl20131218.pdf Federal Reserve Economic Data. 2013. 30 Year Mortgage Rate Data. http://research.stlouisfed.org/fred2/ Gomes, A. 2013. 900 condo units planned at Ward Centers in Kakaako. Honolulu Star Advertiser. May 21. Honolulu Authority for Rapid Transportation. 2013. December Monthly Progress Report. http://www.honolulutransit.org/hart/monthly-reports.aspx Hawaii Community Development Authority. 2014. HCDA Developments. http://dbedt.hawaii.gov/hcda/projects/