Embed Size (px)
Citation preview
i
CIVIL ENGINEERING STUDIES
Illinois Center for Transportation Series No. 17-005 UILU-ENG-2017-2005
ISSN: 0197-9191
CONSTRUCTION AND PERFORMANCE MONITORING
OF VARIOUS ASPHALT MIXES IN ILLINOIS:
2016 INTERIM REPORT
Prepared By David L. Lippert, Shenghua Wu, Hasan Ozer, Imad L. Al-Qadi,
James F. Meister, Greg Renshaw, Maxwell K. Barry, Izak M. Said, Arturo F. Espinoza Luque, and Fazal R. Safi
Illinois Center for Transportation University of Illinois at Urbana-Champaign
Timothy R. Murphy Murphy Pavement Technology, Inc.
James S. Trepanier and Joseph W. Vespa Bureau of Materials and Physical Research
Illinois Department of Transportation
Research Report No. FHWA-ICT-17-003
A report of the findings of ICT PROJECT R27-161
Construction and Performance Monitoring of Various Asphalt Mixes
Illinois Center for Transportation
February 2017
Technical Report Documentation Page 1. Report No.
FHWA-ICT-17-003 2. Government Accession No.
3. Recipient's Catalog No.
4. Title and Subtitle
Construction and Performance Monitoring of Various Asphalt Mixes in Illinois: 2016 Interim Report
5. Report Date
February 2017
6. Performing Organization Code
7. Author(s)
David L. Lippert, Shenghua Wu, Hasan Ozer, Imad L. Al-Qadi, James F. Meister, Greg Renshaw, Maxwell K. Barry, Izak M. Said, Arturo F. Espinoza Luque, Fazal R. Safi, Timothy R. Murphy, James S. Trepanier, Joseph W. Vespa
8. Performing Organization Report No.
ICT-17-005 UIUL-ENG-2017-2005
9. Performing Organization Name and Address
Illinois Center for Transportation Department of Civil and Environmental Engineering University of Illinois at Urbana-Champaign 205 North Mathews Avenue, MC 250 Urbana, IL 61801
10. Work Unit No. (TRAIS)
11. Contract or Grant No.
R27-161
12. Sponsoring Agency Name and Address
Illinois Department of Transportation (SPR) Bureau of Research 126 East Ash Street Springfield, IL 26704-4766
13. Type of Report and Period Covered
2nd Interim Report October 1, 2014–July 31, 2016 14. Sponsoring Agency Code
FHWA 15. Supplementary Notes
Conducted in cooperation with the U.S. Department of Transportation, Federal Highway Administration
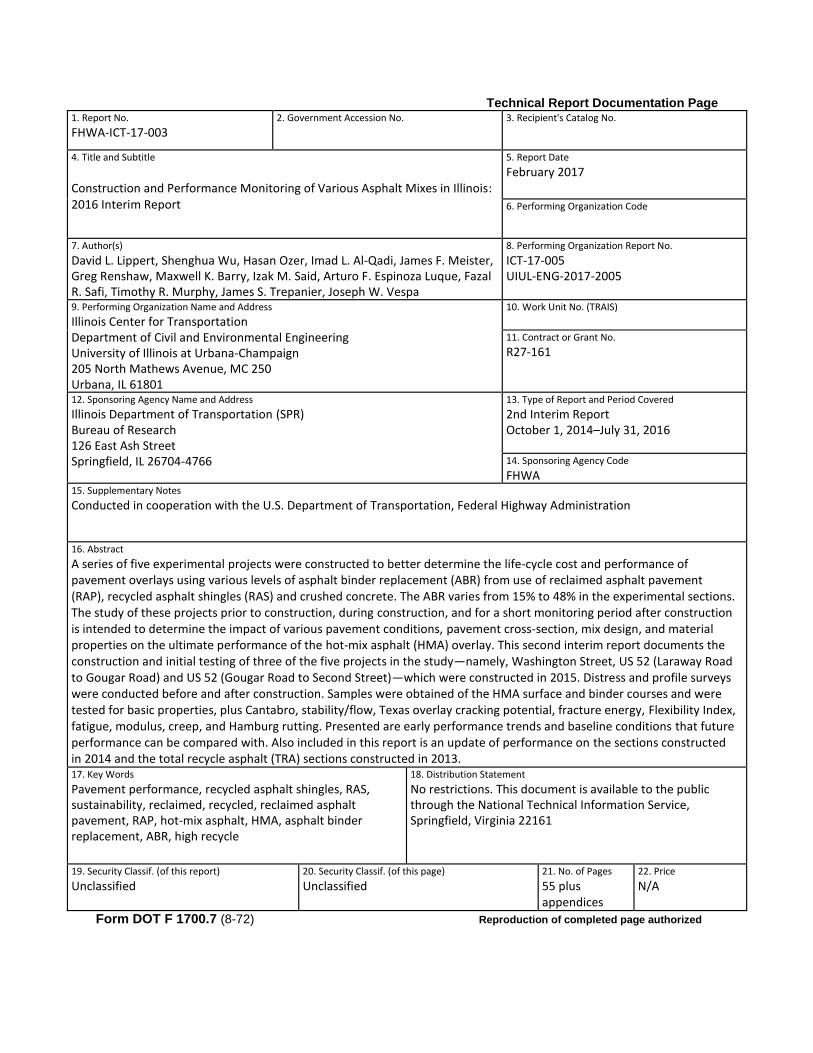
16. Abstract
A series of five experimental projects were constructed to better determine the life-cycle cost and performance of pavement overlays using various levels of asphalt binder replacement (ABR) from use of reclaimed asphalt pavement (RAP), recycled asphalt shingles (RAS) and crushed concrete. The ABR varies from 15% to 48% in the experimental sections. The study of these projects prior to construction, during construction, and for a short monitoring period after construction is intended to determine the impact of various pavement conditions, pavement cross-section, mix design, and material properties on the ultimate performance of the hot-mix asphalt (HMA) overlay. This second interim report documents the construction and initial testing of three of the five projects in the study—namely, Washington Street, US 52 (Laraway Road to Gougar Road) and US 52 (Gougar Road to Second Street)—which were constructed in 2015. Distress and profile surveys were conducted before and after construction. Samples were obtained of the HMA surface and binder courses and were tested for basic properties, plus Cantabro, stability/flow, Texas overlay cracking potential, fracture energy, Flexibility Index, fatigue, modulus, creep, and Hamburg rutting. Presented are early performance trends and baseline conditions that future performance can be compared with. Also included in this report is an update of performance on the sections constructed in 2014 and the total recycle asphalt (TRA) sections constructed in 2013. 17. Key Words
Pavement performance, recycled asphalt shingles, RAS, sustainability, reclaimed, recycled, reclaimed asphalt pavement, RAP, hot-mix asphalt, HMA, asphalt binder replacement, ABR, high recycle
18. Distribution Statement
No restrictions. This document is available to the public through the National Technical Information Service, Springfield, Virginia 22161
19. Security Classif. (of this report)
Unclassified 20. Security Classif. (of this page)
Unclassified 21. No. of Pages
55 plus appendices
22. Price
N/A
Form DOT F 1700.7 (8-72) Reproduction of completed page authorized

i
ACKNOWLEDGMENTS AND DISCLAIMER
The authors of this report wish to thank the many people involved in providing assistance in coordinating this ambitious project, answering our many questions, and sampling and testing of materials.
We wish to thank the Illinois Department of Transportation’s Region 1/District 1 staff: Abdul Dahhan, George Houston, Velicia Goode, Michael Wiater, Jeff Ogrodnik, Sami Daniel, Jeff Ogrodnik, Brian Cameron, James Stewart, and the coring crew. We also thank the IDOT Bureau of Materials and Physical Research staff: Tom Zehr, Frank Stemmons, Anthony Karas, Joe Rechner, Joe Vespa, Michael Brownlee, Xinyu “Bernie” Sun, and Janay Hammons.
We wish to thank D Construction’s Jason Steffes for keeping the team informed of paving schedules.
We also wish to thank Google for their mapping images.
The contents of this report reflect the views of the authors, who are responsible for the facts and accuracy of the data presented herein. The content does not necessarily reflect the official views or policies of the Illinois Department of Transportation. This report does not constitute a standard, specification, or regulation.

ii
EXECUTIVE SUMMARY
Recent efforts to increase recycling raised questions about the durability and cracking potential of hot-mix asphalt (HMA) being constructed in Illinois. Mixes using reclaimed asphalt pavement (RAP) and recycled asphalt shingles (RAS) can replace a substantial part of liquid asphalt binder in new HMA, the main cost component of the mix. To be truly sustainable, mixes with high asphalt binder replacement (ABR) must perform equivalent to virgin or low-recycle HMA.
To better determine the life-cycle cost and performance of pavement overlays using higher amounts of RAP and RAS, a series of five experimental projects were constructed. The ABR level in the experiment varies from a low of 15% to a high of 48%. The study of these projects prior to construction, during construction, and for a short monitoring period after construction is intended to determine the impact of pavement condition, design, and material properties on the performance of the HMA overlay.
This interim report documents the construction and testing to date on three of the five projects in the study—namely, Washington Street, US 52 (Laraway Road to Gougar Road) and US 52 (Gougar Road to Second Street)—which were constructed in 2015. Distress and profile surveys were conducted before and after construction. Samples were obtained of the HMA surface and binder courses and were tested for a basic properties, plus Cantabro, stability/flow, Texas overlay cracking potential, fracture energy, Flexibility Index (FI), fatigue, modulus, creep, and Hamburg Wheel rutting. Also included in this report is an update of performance of the three total recycle asphalt (TRA) sections and a comparison section constructed in 2013. The ABR on these sections varied from 20% to 60%.
Performance data have now been collected after one to three winters for the sections under study. A few of the sections constructed in 2013 are showing increasing amounts of fatigue/alligator cracking distress. The bulk of this distress is believed to be related to underlying structural conditions and is not an indication surface mix differences. Transverse reflective cracking through the HMA surface is showing differences from section to section in early performance. The majority of Washington Street and all sections of US 52 had approximately 6 in of HMA left in place after milling. These sections have substantially less cracking to date than sections that were either overlays of bare concrete pavement or for which the HMA was milled to concrete prior to the HMA overlay.
The comparison section on Wolf Road that used standard specifications with a 20% ABR mix using RAP only and a PG 64-22 asphalt binder continues to show less distress at lower levels than any of the other TRA sections constructed in 2013. Some of the distress is due to the underlying pavement, but focusing just on transverse cracking, centerline distress and raveling/segregation performance, this group of TRA sections was found to be more distressed than the comparison section on Wolf Road and the 2015 TRA sections. It should be noted here that the cross-section differences may be driving performance more than the surface mix.
Illinois Flexibility Index Test (I-FIT) results on plant mixes for Washington Street provided an FI value of 10.6 for the 30% ABR RAP and RAS mix and 10.2 for the 30% ABR RAP-only mix. Both of these

iii
mixes used PG 58-34 for an asphalt binder. For US 52, the FI results were 5.4 for the 48% ABR TRA mix using a PG 52-34 and 6.3 for the same TRA mix but using a PG 58-28.
The information in this report documents the baseline conditions and short-term performance of various HMA with a wide variety of recycle contents and asphalt grades. Common HMA testing schemes were used to characterize the mixes at production and with time by roadway coring/testing. The information obtained will help set the direction for I-FIT usage and specification parameters.

iv
CONTENTS
CHAPTER 1: INTRODUCTION ................................................................................................1
CHAPTER 2: RESEARCH PROJECT DESCRIPTION ............................................................2
CHAPTER 3: PRE-EXISTING CONDITIONS AND PROPOSED IMPROVEMENTS ..............4
CHAPTER 4: PROJECT CONSTRUCTION ......................................................................... 13
CHAPTER 5: POST-CONSTRUCTION SURFACE CONDITIONS ........................................ 25
CHAPTER 6: MATERIALS TESTING .................................................................................... 27
CHAPTER 7: PERFORMANCE OF MIXES BY DISTRESS MONITORING .......................... 41
CHAPTER 8: SUMMARY, OBSERVATIONS, AND RECOMMENDATIONS ........................ 52
REFERENCES ....................................................................................................................... 54
APPENDIX A: EXISTING AND PROPOSED CROSS-SECTIONS ........................................ 56
APPENDIX B: DISTRESS SURVEY SUMMARIES ............................................................... 66
APPENDIX C: AUTOMATED DISTRESS DATA ................................................................... 77
APPENDIX D: PATCHING SCHEDULES .............................................................................. 93
APPENDIX G: LABORATORY TESTING SUMMARIES ..................................................... 109
APPENDIX H: PAVEMENT DISTRESS SUMMARIES ........................................................ 115
APPENDIX I: TOTAL RECYCLE ASPHALT SPECIAL PROVISION .................................. 120
APPENDIX J: TOTAL RECYCLE ASPHALT (2013 PROJECTS) PHOTOS 2014 TO 2016 ...................................................................................................... 133

1
CHAPTER 1: INTRODUCTION
This study was designed to follow the laydown and early-life performance of five construction projects using eight different surface mix designs, including total recycle asphalt (TRA). Two of the study projects were completed in 2014 and previously reported on (Lippert et al. 2015). The three remaining projects in the study were completed in the 2015 construction season. As with the previous projects, component materials were sampled along with each hot-mix asphalt (HMA) being placed on the various sections. Testing was performed to establish baseline material properties of the various mixes. As part of the study, annual coring and distress surveys will be used to document the changes the pavement experiences with time. The mixes were also examined under the Illinois semi-circular bending (IL-SCB) test method and Flexibility Index (FI) developed in ICT project R27-128, “Testing Protocols to Ensure Performance of High Asphalt Binder Replacement Mixes Using RAP and RAS” (Al-Qadi et al. 2015; Ozer et al. 2016a, 2016b).The Illinois Department of Transportation (IDOT) has coined the process the Illinois Flexibility Index test (I-FIT). The FI is expected to provide the much-needed prediction link between mix properties at production and long-term performance. Results of this study are expected to assist in establishing performance expectations of high recycle mixes and the ability of the FI to predict cracking.
This second interim report documents the construction and early baseline performance of the three projects constructed in 2015—namely, Washington Street, US 52 (Laraway Road to Gougar Road) and US 52 (Gougar Road to north of Second Street). Also included in this report is an update on performance of the sections constructed in 2014 and the original TRA constructed projects constructed in 2013.
2
CHAPTER 2: RESEARCH PROJECT DESCRIPTION
2.1 STUDY GOAL
The goal of this study is to document the testing, construction, and performance of surface mixes with a variety with ABR levels, ABR types, and different asphalt binder grades to allow the evaluation and comparison of the impact of recycled materials on pavement performance. Five projects will be closely documented in this study. The work includes two projects with TRA mixes and three projects having mixes with various ABR levels. Also included in this study is monitoring the performance of the 3 TRA pavements along with a comparison pavement constructed in 2013.
2.2 SECTION PARAMETERS
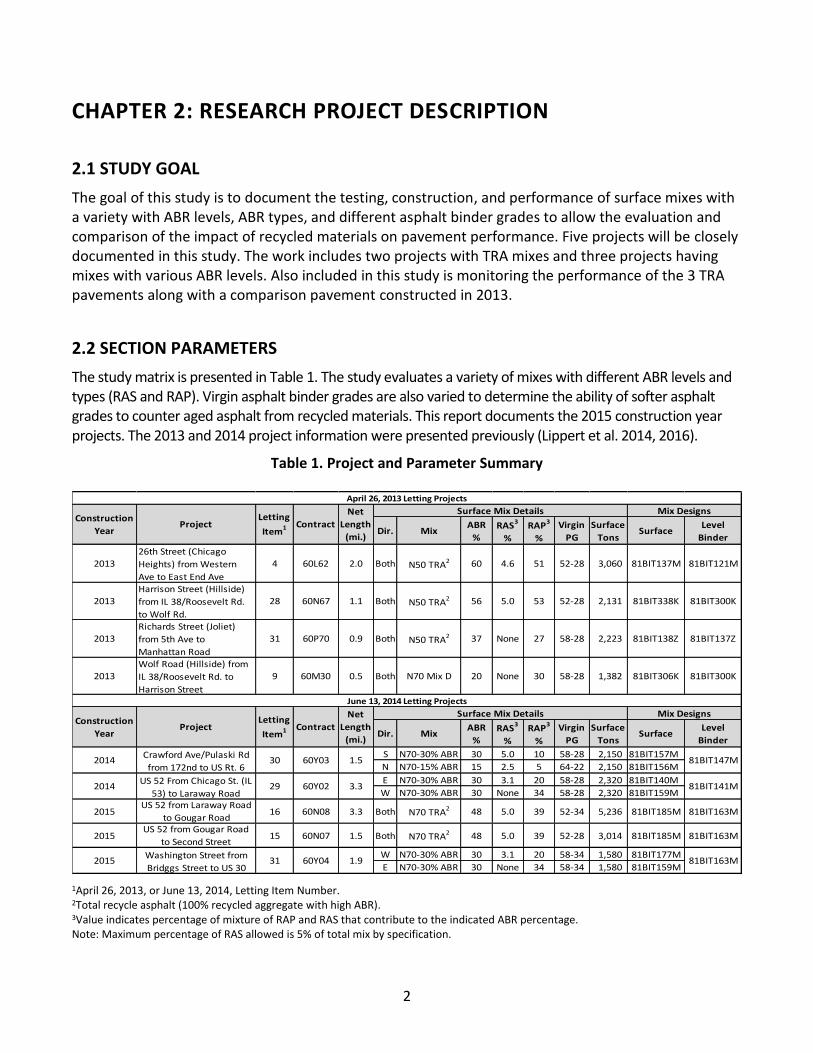
The study matrix is presented in Table 1. The study evaluates a variety of mixes with different ABR levels and types (RAS and RAP). Virgin asphalt binder grades are also varied to determine the ability of softer asphalt grades to counter aged asphalt from recycled materials. This report documents the 2015 construction year projects. The 2013 and 2014 project information were presented previously (Lippert et al. 2014, 2016).
Table 1. Project and Parameter Summary
1April 26, 2013, or June 13, 2014, Letting Item Number. 2Total recycle asphalt (100% recycled aggregate with high ABR). 3Value indicates percentage of mixture of RAP and RAS that contribute to the indicated ABR percentage. Note: Maximum percentage of RAS allowed is 5% of total mix by specification.
Dir. MixABR
%RAS3
%
RAP3
%
Virgin
PG
Surface
TonsSurface
Level
Binder
201326th Street (Chicago
Heights) from Western
Ave to East End Ave
4 60L62 2.0 Both N50 TRA2 60 4.6 51 52-28 3,060 81BIT137M 81BIT121M
2013Harrison Street (Hillside)
from IL 38/Roosevelt Rd.
to Wolf Rd.
28 60N67 1.1 Both N50 TRA2 56 5.0 53 52-28 2,131 81BIT338K 81BIT300K
2013Richards Street (Joliet)
from 5th Ave to
Manhattan Road
31 60P70 0.9 Both N50 TRA2 37 None 27 58-28 2,223 81BIT138Z 81BIT137Z
2013Wolf Road (Hillside) from
IL 38/Roosevelt Rd. to
Harrison Street
9 60M30 0.5 Both N70 Mix D 20 None 30 58-28 1,382 81BIT306K 81BIT300K
Dir. MixABR
%RAS
3
%
RAP3
%
Virgin
PG
Surface
TonsSurface
Level
Binder
S N70-30% ABR 30 5.0 10 58-28 2,150 81BIT157M
N N70-15% ABR 15 2.5 5 64-22 2,150 81BIT156M
E N70-30% ABR 30 3.1 20 58-28 2,320 81BIT140M
W N70-30% ABR 30 None 34 58-28 2,320 81BIT159M
W N70-30% ABR 30 3.1 20 58-34 1,580 81BIT177M
E N70-30% ABR 30 None 34 58-34 1,580 81BIT159M81BIT163M
81BIT163M
81BIT163M
81BIT185M
2015Washington Street from
Bridggs Street to US 30 31 60Y04 1.9
N70 TRA2 48 5.0 39 52-28
39 52-34
2015US 52 from Gougar Road
to Second Street15 60N07 1.5 81BIT185M3,014
5,236
April 26, 2013 Letting Projects
Construction
YearProject
Letting
Item1 Contract
Net
Length
(mi.)
Mix DesignsSurface Mix Details
60Y03
Construction
YearProject
Letting
Item1 Contract
Net
Length
(mi.)
2014Crawford Ave/Pulaski Rd
from 172nd to US Rt. 630 1.5
Mix DesignsSurface Mix Details
June 13, 2014 Letting Projects
81BIT147M
81BIT141M
3.3 N70 TRA2 48 5.02015US 52 from Laraway Road
to Gougar Road16 60N08
2014US 52 From Chicago St. (IL
53) to Laraway Road29 60Y02 3.3
Both
Both

3
The main tasks in this study are as follows:
Document in detail the pavement condition prior to construction.
Monitor construction work for cross-sectional or installation issues that may present performance problems later.
Collect quality assurance information for the record.
Sample mixes and pavement for laboratory material characterization with time.
Monitor pavement performance with time and present performance trends.
Provide reporting of data available during the study period.
In the chapters that follow, documentation to date is presented for the projects constructed in 2015 and short-term performance of all sections under study. Because of the length of some test procedures, the final report will present test results that could not be completed at this time.

4
CHAPTER 3: PRE-EXISTING CONDITIONS AND PROPOSED IMPROVEMENTS
This chapter provides project location, pre-existing conditions, and proposed improvements for three project constructed in 2015. Information for projects let and constructed in 2013 and 2014 is provided in previous reports (Lippert et al. 2014, 2016).
3.1 WASHINGTON STREET (BRIGGS STREET TO US 30)
This project begins at the edge of Briggs Street and extends to US 30 (Lincoln Highway) through the City of Joliet in Will County as shown in Figure 1.
Figure 1. Improvement on Washington Street (Map data: Google).
3.1.1 Traffic Characteristics
The posted speed limits on the project are 30 and 35 mph. The 2012 two-way average daily traffic (ADT) was 5,050 vehicles. Truck counts are not available for the section.
3.1.2 Existing Pavement Cross-Section
Existing cross-section details can be found in Appendix A. Because of changing pavement cross-sections along the improvement, there were two distinct sections at the time of construction, as follows.
Segment 1. Five-lane and taper: Briggs Street to Peale Street. The westernmost end of the project consists of the original bare 9 in. PCC five-lane pavement with curb and gutter that taper to a two-lane pavement for the remainder of the project. Figure 2 shows the condition of the western segment in 2014.

5
Figure 2. Washington Street (Segment 1) looking west from near Davison Street.
Segment 2. Between Peale Street and US 30. After a short five-lane segment to allow for turning movement at Briggs Street, the section quickly narrows to a two-lane section that is the bulk of the pavement on the project. This segment consists of a 6 in. HMA pavement over an 8 in. stabilized base course and 4 in. granular subbase. The east end of the project has additional turn lanes, with the same pavement section. Figure 3 provides an indication of the section condition.
Figure 3. Washington Street (Segment 2) looking east near Circle Drive.

6
3.1.3 Pre-Construction Distress Survey
On September 8, 2014, prior to the improvement, the project was surveyed and distresses mapped by IDOT’s Bureau of Materials and Physical Research (BMPR). The survey consisted of walking the sections with field sheets representing the pavement and related stationing. Data were recorded by mapping and coding the distress as outlined in the BMPR Pavement Distress Manual (IDOT 2012a). The survey will provide a record of cracks and joints that can be compared with reflective distress over the evaluation period.
A survey summary by station is provided in Appendix B. For the purpose of clearly monitoring distress over time, the taper area between Davison Street and Peale Street was omitted from the summaries. Turn lanes were not surveyed on the east and west ends of the project.
3.1.4 Pre-Construction Rutting and Ride Quality
For pre-construction rutting and ride quality, BMPR arranged for data collection by IDOT’s video survey vendor. The data were collected in each lane and direction of the project on August 15, 2014. Values of the International Roughness Index (IRI) and rutting were determined every 0.1 mi. The taper area noted above was removed from the data so that only a uniform cross-section of pavement was represented. For the project, the data were summarized for the two uniform segments as noted above for each direction, lane, and wheel path. The data are presented in Appendix C.
3.1.5 Proposed Improvement Work
The improvement was let as Item 31, Contract 60Y04, on IDOT’s June 13, 2014, letting bulletin. Electronic plans and specifications are available on IDOT’s website (IDOT 2014a).
Each segment improvement was different, as follows:
Segment 1. Five-lane and taper–Briggs Street to Peale Street. In the outside lane, the pavement edge was milled to remove 1.5 in. of pavement adjacent to the gutter, which was tapered to zero at the center of the outside lane. An IL 4.75 mm level binder was placed at 0.75 in. thickness up to 6 ft from the pavement edge, thus not covering the milled taper from the center of the lane to the gutter. Once the nominal 1.5 in. of surface mix was placed over the level binder, a “step” results in the cross-section behind the paver; however, the contractor requested and was given approval to “taper” the edge of the level binder by hand-luting the edge and tapering the 4.75 mm mix over approximately 1 ft. As a result, the surface course is approximately 2.25 in. thick at the edge of the level binder, tapering to 1.5 in. at the gutter, but without the abrupt thickness transition at the edge of the level binder.
Segment 2. Between Peale Street and US 30. The existing HMA surface on this segment was milled 2.25 in. full width of the pavement, typically 12 ft; included in the milling width was the HMA shoulder, when present. The level binder was placed at 0.75 in. thick and 1 ft narrower than the pavement or pavement and shoulder width, thus leaving the outside 1 ft of pavement as 2.25 in. of surface course.

7
Details of the various proposed cross-sections are shown on the plans (IDOT 2014a). Key cross-sections are presented in Appendix A.
3.2 US 52 –LARAWAY ROAD TO GOUGAR ROAD
This improvement on US 52 (Manhattan Road) begins approximately 109 ft south of Laraway Road and extends south (east on US 52) for a distance of 17,893.9 ft (3.39 mi) through the City of Joliet and the Village of Manhattan in Will County, ending approximately 75 ft north of Gougar Road as shown in Figure 4.
Two resurfacing omissions for bridges/box culverts are within the project located as follows:
Sta. 80+20 to Sta. 80+98.3
Sta. 149+83 to Sta. 154+93.2
Figure 4. Improvement on US 52–Laraway Road to Gougar Road (Map data: Google).

8
3.2.1 Traffic Characteristics
The posted speed limit on the project is 55 mph. Traffic along the section varies. From the 2013 traffic information, the peak two-way ADT along the project is 8,950 vehicles. The two-way truck ADT is 775 vehicles for this project.
3.2.2 Existing Pavement Cross-Section
The pavement structure is an 8.25 in. HMA surface that serves as an overlay of a 9 in. PCC pavement, which is consistent throughout the project. Although there are changes in cross-section details such as turn lanes, safety shoulder, and curb and gutter along the project, these items are not expected to impact the performance of the HMA surface. For the purpose of this study, the entire project is considered a single segment. Details of the various existing cross-sections are shown on the plans. Key cross-sections are presented in Appendix A. Figure 5 shows the condition of the pavement on this project in 2014.
Figure 5. US 52 (Laraway Road to Gougar Road) looking south near Station 70+00.
3.2.3. Pre-Construction Distress Survey
Prior to construction on September 26 and 30, 2014, the project was surveyed and distresses mapped by BMPR. The survey consisted of walking the sections with field sheets representing the pavement and related pavement stationing. Data were recorded by mapping and coding the distress as outlined in the BMPR Pavement Distress Manual (IDOT 2012a). The pre-construction survey provides a record of cracks and joints that can be compared with reflective distress over the evaluation period. A distress survey summary is provided in Appendix B. Turn lanes were not surveyed.

9
3.2.4 Pre-Construction Rutting and Ride Quality
For pre-construction rutting and ride quality, BMPR arranged for a data collection run by IDOT’s video survey vendor. The data were collected in each lane and direction of the project on August 15, 2014. The data were analyzed by 0.1 mi segments, with paving omissions and bridges removed from the data so that only the pavement was represented. For the project, the data were summarized for the three segments as noted above for each direction, lane, and wheel path. The data are presented in Appendix C.
3.2.5 Proposed Improvement Work
The project was let as Item 16, Contract 60N08, on IDOT’s June 13, 2014, letting. Electronic plans and specifications are available on IDOT’s website (IDOT 2014b). The work consisted primarily of HMA surface removal, pavement patching, combination concrete curb and gutter removal and replacement, frame and lid adjustments, resurfacing with level binder and HMA surface course, placement of thermoplastic pavement markings, detector loop replacement, and all incidental and collateral work necessary to complete the project.
The pavement improvement consisted of milling the existing HMA to a depth of 2.25 in. shoulder edge to shoulder edge or curb to curb. After priming, a 0.75 in. thick IL 4.75 mm level binder was placed except for the outer 12 in. of the pavement, leaving the outside foot of the milled PCC pavement exposed. For curb sections, the level binder was placed curb to curb. The 1.5 in. of surface was then placed the full width of the pavement. This resulted in the outside foot of the pavement being a nominal 2.25 in. of surface mix except for curb areas. Additional aggregate was added to the shoulder to complete the cross-section.
Details of the various proposed cross-sections are shown on the plans. Key cross-sections are presented in Appendix A.
3.3 US 52–GOUGAR ROAD TO NORTH OF SECOND STREET
This improvement on US 52 (Manhattan Road) begins approximately 75 ft north of Gougar Road and extends in the southerly direction along US 52 (Manhattan Road) for a distance of 8,095.6 ft (1.53 mi) through the Village of Manhattan in Will County as shown in Figure 6.
The plan for the project shows an omission for a railroad crossing; however, after closer examination of a structure during construction, an additional omission was determined. The two resurfacing omissions are located as follows:
Sta. 69+99 to Sta. 70+60 (Bridge/Culvert and Approaches)
Sta. 86+65 to 86+95 (Railroad Crossing)

10
Figure 6. Improvement on US 52–Gougar Road to north of Second Street (Map data: Google).
3.3.1 Traffic Characteristics
The posted speed limit on the project varies from 30 to 55 mph. Traffic along the section varies. From the 2013 traffic information, the peak two-way ADT along the project is 7,050 vehicles north of Manhattan Road. Also at this location is the peak two-way truck ADT of 875 vehicles.
3.3.2 Existing Pavement Cross-Section
The pavement structure is an 8.25 in. HMA surface that serves as an overlay of a 9 in. PCC pavement, which is consistent throughout the project. Although there are changes in cross-section details such as turn lanes, safety shoulder, and curb and gutter along the project, these items are not expected to impact the performance of the HMA surface. For the purpose of this study, the entire project is considered a single segment. Details of the various existing cross-sections are shown on the plans. Key cross-sections are presented in Appendix A.
Figure 7 shows the condition of the pavement on this project in 2014.

11
Figure 7. US 52–Gougar Road to north of Second Street near Station 55+00 looking south.
3.3.3 Pre-Construction Distress Survey
Prior to construction on September 26 and 30, 2014, the project was surveyed and distresses mapped by BMPR. The survey consisted of walking the sections with field sheets representing the pavement and related pavement stationing. Data were recorded by mapping and coding the distress as outlined in the BMPR Pavement Distress Manual (IDOT 2012a). The pre-construction survey provides a record of cracks and joints that can be compared with reflective distress over the evaluation period. A distress survey summary is provided in Appendix B. Turn lanes were not surveyed.
3.3.4 Pre-Construction Rutting and Ride Quality
For pre-construction rutting and ride quality, BMPR arranged for a data collection run by IDOT’s video survey vendor. The data were collected in each lane and direction of the project on August 15, 2014. The data were analyzed by 0.1 mi segments, with paving omissions and bridges removed from the data so that only the pavement was represented. For the project, the data were summarized for each direction, lane, and wheel path. The data are presented in Appendix C.
3.3.5 Proposed Improvement Work
The project was let as Item 15, Contract 60N07, on IDOT’s June 13, 2014, letting. Electronic plans and specifications are available on IDOT’s website (IDOT 2014c). The work consisted primarily of HMA surface removal, pavement patching, combination concrete curb and gutter removal and replacement, frame and lid adjustments, resurfacing with level binder and HMA surface course, placement of thermoplastic pavement markings, detector loop replacement, and all incidental and collateral work necessary to complete the project.

12
The pavement improvement consisted of milling the existing HMA to a depth of 2.25 in. shoulder edge to shoulder edge or curb to curb. After priming, a 0.75 in. thick IL 4.75 mm level binder was placed except for the outer 12 in. of the pavement, leaving the outside foot of the milled PCC pavement exposed. For curb sections, the level binder was placed curb to curb. The 1.5 in. of surface was then placed the full width of the pavement. This resulted in the outside foot of the pavement being a nominal 2.25 in. of surface mix except for curb areas. Additional aggregate was added to the shoulder to complete the cross-section.
Details of the various proposed cross-sections are shown on the plans. Key cross-sections are presented in Appendix A.

13
CHAPTER 4: PROJECT CONSTRUCTION
This chapter presents information pertaining to the HMA overlay construction in 2015. The general sequence of construction operations for the projects was to mill the concrete or HMA overlay as shown on the plans; adjust frames and grates; perform patching and filling of cracks, joints, and flangeways with HMA; prime (tack coat); place 4.75 mm level binder; place 9.5 mm surface course; construct shoulders; establish pavement markings; install raised pavement reflectors; and install detector loops for traffic signals. For all projects in this study effort, D Construction, Inc. of Coal City, Illinois, was the successful bidder and prime contractor that performed the HMA overlay work.
4.1 WASHINGTON STREET (BRIGGS STREET TO US 30)
For this project two different cross-section were present. These cross-sections were monitored separately as two unique segments. Starting at Briggs the pavement is bare concrete and continues east a short distance. This segment was likely an intersection improvement to add lanes for turning and better traffic flow. The section segment consists of stabilized base pavement that was overlaid with HMA. Details of the existing pavement and proposed improvement are shown in Appendix A.
4.1.1 Pavement Cold-Milling
In general, milling per Articles 440 and 1101.16 of the Standard Specifications for Road and Bridge Construction (IDOT 2012b) was followed. In the bare concrete segment, the milling was tapered from 1.5 in. at the curb face to no milling 6 ft away. This was done to retain the curb and gutter function once the surface was placed. The remainder of the project consists of an existing HMA overlay that was milled 2.25 in. in depth from edge to edge of pavement or shoulder as shown on the plans. Figures 8 and 9 show the result of milling the existing HMA surfacing in the two segments on this project.
Unlike the projects constructed in 2014, the 2015 milled surface texture of both the PCC and HMA segments was even and fairly uniform across the pavement lane. The first interim report (Lippert et al. 2016) which reported on the 2014 construction noted that there were issues with the resulting texture of the milled surface. For those projects constructed in 2014, a mix of old and new teeth on the milling drum resulted in several deep grooves across the pavement. Winter maintenance of the milling head resulted in new teeth being installed. Because this project had been constructed in spring of 2015, the teeth had yet to experience significant wear or need for replacement. The result was a more desirable and even milled surface.
The milling operation removed a majority of the surface distress in the HMA section that initially seemed to warrant patching. The depth of milling in some areas was very near a lift interface. The result was that, in areas where approximately 1 in. or more of the HMA lift thickness remained in place, it was firmly bonded to the HMA below. In other areas, the remaining HMA lift thickness was 0.5 to 0.75 in., which often debonded from the lower HMA lift and was lost under traffic. Figures 10 and 11 show the resulting milling in various areas.

14
4.1.2 Patching, Filling of Cracks, Joints, and Flangeways
Plans and provisions called for patching to be done prior to overlay using Class D patches (full-depth HMA). The plan quantity for patching was 130 yd2; however, the condition of the surface after milling was deemed sufficient, so the patching was eliminated. A couple of areas may have benefited from patching as shown in Figure 12. Monitoring over the study period will determine if there was a need for patching or not in these areas.
Areas of wide cracks and joints were cleaned and filled with an IL 4.75 mm HMA level binder sand mix. This activity required 9.81 t of material, which equates to an average of 0.07 t for every 100 lane-ft of the project. Plan quantity for this work was 48 t.
4.1.3 Prime (Tack Coat)
After repairs were complete, the pavement was cleaned then primed. By paving time, traffic had spread the material to fairly uniform coverage. No defining “zebra striping” was evident. Figures 8 through 12 provide an indication of the prime on the milled surface.
4.1.4 Level Binder
The IL 4.75 mm level binder sand mix used a PG 70-28 asphalt binder with an asphalt binder replacement (ABR) of 29% from both RAP and RAS. The mix design can be found in Appendix E.
It should be noted that the level binder was placed partial width of the cross-sections. On Segment 1, the outside 6 ft was without level binder, and on Segment 2 the outside 1 ft of the pavement was without level binder. See Appendix A for cross-sectional details of level binder placement. Figures 8 through 15 also illustrate this detail. As shown on the plan, the level binder was placed at 0.75 in. thick, with the machine edge forming the longitudinal edge of the level binder. In Segment 1, the contractor tapered the edge by hand luting. The result was that a tapered edge spread over approximately 1 ft.
Appendix F contains the paving sequence map for the level binder. Paving sequence can be important in determining long-term performance related to compaction conditions of the mat near joints (i.e., confined or unconfined edge).
Two static three-wheel rollers were used as breakdown and intermediate rollers. A dual-drum roller in static mode was used as a finish roller. This is the same equipment and process used on previous projects.
4.1.5 Surface Course
Prior to placement of the surface, the level binder was primed. Figures 15 through 18 show the level binder primed and ready for paving. On examining the level binder, it was found that several areas had hairline cracks reflecting through the level binder lift. In Segment 1, nearly all the underlying transverse joints and cracks had reflected through the level binder to some degree. Figure 18 shows such an area after the level binder was in place 11 days. In Segment 2, intermittent areas had cracking that was primarily longitudinal near the wheel paths but with some short transverse cracks radiating off of these cracks as shown in Figure 17.

15
The surface course mixes are the main experimental feature on this project. Surface mixes on this project as well as all the 2014 let projects used a N70 gyratory mix design. Mix criteria of aggregate and volumetrics were according to standard specifications and job special provisions; however, the PG binder grade selected for this experimental section was different than typical policy. The binder grade used for both surface mixes on this project was PG 58-34. This results in a head to head comparison of ABR from RAP alone and ABR from a blend of RAP and RAS. Other details of the surface mixes are as follows:
The eastbound lanes used a mix with 30% ABR from only RAP. The plans called for a PG 64-22; with a mix ABR over 20%, standard specifications would call for a “bump” down to a PG 58-28. However, an even softer low-temperature grade of PG 58-34 was used.
The westbound lanes used a mix with 30% ABR with equal contributions from RAP and RAS. The plans called for a PG 64-22. Standard specifications would require that a mix over 20% ABR “bump” down to a PG 58-28. However, an even softer low-temperature grade of PG 58-34 was used.
Appendix F contains the paving sequence map for the surface course. Paving sequence can be important in determining long-term performance related to confined or unconfined compaction edge conditions of the joint. Figure 19 shows paving of the eastbound lanes.
Paving was typical: the paver used a 30 ft non-contact reference for leveling. The grade reference was on the left side of the paver during paving of all lanes and mixtures. The right side of the paver was adjusted from time to time to control material yield. The surface was paved a thickness of 1.5 in. and compacted with two dual-drum vibratory rollers followed by a dual-drum finish roller operated in static mode. As noted, the partial-width level binder in the cross-section resulted in a stepped cross-section in the outer lane. The surface lift thickness varies from 1.5 in. over the level binder then increasing to 2.25 in. over the milled pavement tapering to 1.5 in. at the curb and gutter.
Figure 8. Segment 1 (Briggs to Peale) cold-milled pavement looking east.
Figure 9. Segment 2 (Peale to US 30) cold-milled pavement looking west.

16
Figure 10. Segment 2 (Peale to US 30)
cold-milled pavement looking east. Figure 11. Segment 2 (Peale to US 30) cold-milled pavement looking west.
Figure 12. Segment 2 (Peale to US 30) possible area needing patching.
Figure 13. Segment 1 (Briggs to Peale) level binder placed with luted tapered edge (right
side) to edge to milled concrete.
Figure 14. Segment 2 (Peale to US 30).
Placing 4.75 mm level course. Figure 15. Segment 2 (Peale to US 30)
showing 1 ft milled pavement to be covered with surface course.

17
Figure 16. Segment 2 (Peale to US 30).
Typical tack coat on level binder. Figure 17. Segment 2 (Peale to US 30). Longitudinal and transverse cracks in
newly placed level binder east of NE Circle Drive in westbound lane outer wheel path.
Figure 18. Segment 1 (Briggs to Peale).
Reflection through level binder at Sta. 23+52. Figure 19. Segment 1 to 2 transition
at Peale. Paving surface course.
4.2 US 52–LARAWAY ROAD TO GOUGAR ROAD
4.2.1 Pavement Cold-Milling
This project consists of an existing HMA overlay that was milled 2.25 in. in depth from edge to edge of pavement, shoulder, or curb and gutter as shown on the plans. Milling was of good quality and generally even in nature. Figures 20 and 21 present the milled surface at various locations.
4.2.2 Patching, Filling of Cracks, Joints, and Flangeways
Prior to overlay, the section was patched using Class D patches (full-depth HMA), and any wide cracks and joints were cleaned and filled. Appendix D provides the patching schedule for Class D patches. The total plan quantity for patching was 370 yd2. The actual patching totaled 202.2 yd2 for the project, which represents 55% of plan quantity. One area in the eastbound lane at Station 42+00 was
18
troublesome and was repeatedly repaired during the project. Other edge areas that appeared to be sound at first later resulted in the need for repairs. The delay was caused by quality failures of mix production test strips
The plan quantity for filling of cracks, joints, and flangeways with an IL 4.75 mm HMA level binder was 91 t. After milling, the areas in need of filling were minimal. Weather delays resulted in a need to quickly move the project along. The contractor proposed and IDOT accepted the use of surface mix paid at the per ton rate for surface mix in place of the normal crack-filling mix. Unfortunately, this approach resulted in the loss of tons-used information for this item; however, it is estimated that 20 t of mix was used. Using this estimated value, an average of 0.06 t for every 100 lane-ft of the project was determined.
4.2.3 Prime (Tack Coat)
The pavement was cleaned then primed. Plans called for paving to start several hours later, at daybreak. After priming, the traffic spread the prime somewhat and by morning appeared to be fairly even across the roadway as shown in Figures 20 and 21. Unfortunately, the morning also brought a light rain that caused some of the unbroken emulsified prime to migrate off the road surface as shown in Figures 22 and 23.
4.2.4 Level Binder
The mix used for level binder was an IL 4.75 mm sand mix. The level binder uses an asphalt binder of PG 70-28 with an asphalt binder replacement of 29% from both RAP and RAS. Details of the mix design can be found in Appendix E.
A common cross-section detail of Region 1/District 1, the level binder was placed narrower than the pavement area to be resurfaced. The outside 12 in. of the pavement or safety shoulder were not covered with the level binder. See Appendix A for cross-sectional details of how the level binder was placed. Figures 24 and 25 show this detail in relation to surface paving. As shown on the plan, the level binder was placed at 0.75 in. thick, with the machine edge forming the shoulder-side longitudinal joint edge of the level binder. As with the other projects let in 2014, the contractor used two static three-wheel rollers for breakdown and intermediate rolling followed by a finish dual-drum roller.
Appendix F contains the paving sequence map for the level binder. Paving sequence can be important in determining long-term performance related to compaction conditions of the mat near joints (i.e., confined or unconfined edge).

19
Figure 20. Primed cold-milled surface of US 52 near Sta. 47+00 looking south.
Figure 21. Prime cold-milled surface of US 52 near Sta. 114+00 looking north.
Figure 22. Brown “unbroken” emulsified asphalt prime coat
Figure 23. Asphalt prime migration to shoulder.
Figure 24. Level binder with 12 in. exposed milled pavement.
Figure 25. Surface course installation showing level course, lip between level and cold-
milled surface, and surface course installation.
20
4.2.5 Surface Course
Prior to paving the surface, the level binder was primed. Figure 26 shows the resulting coverage. There were some slight zebra stripes; however, traffic seemed to have spread the prime to the point that coverage was relatively uniform.
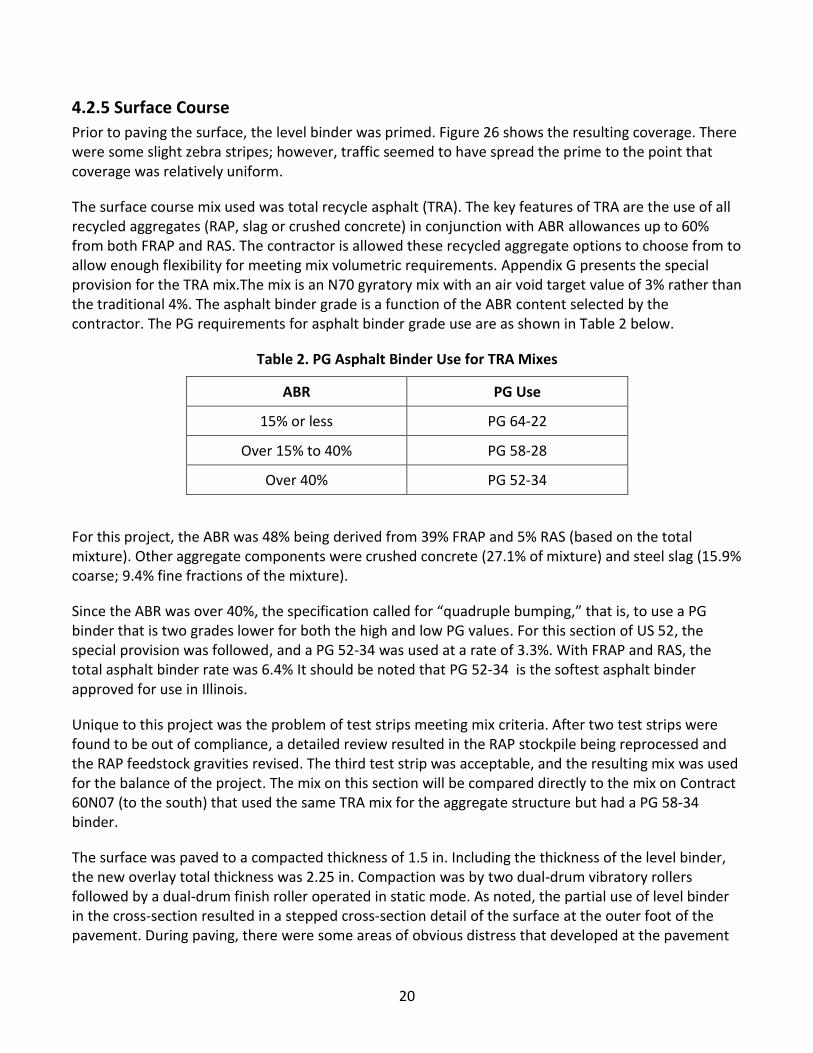
The surface course mix used was total recycle asphalt (TRA). The key features of TRA are the use of all recycled aggregates (RAP, slag or crushed concrete) in conjunction with ABR allowances up to 60% from both FRAP and RAS. The contractor is allowed these recycled aggregate options to choose from to allow enough flexibility for meeting mix volumetric requirements. Appendix G presents the special provision for the TRA mix.The mix is an N70 gyratory mix with an air void target value of 3% rather than the traditional 4%. The asphalt binder grade is a function of the ABR content selected by the contractor. The PG requirements for asphalt binder grade use are as shown in Table 2 below.
Table 2. PG Asphalt Binder Use for TRA Mixes
ABR PG Use
15% or less PG 64-22
Over 15% to 40% PG 58-28
Over 40% PG 52-34
For this project, the ABR was 48% being derived from 39% FRAP and 5% RAS (based on the total mixture). Other aggregate components were crushed concrete (27.1% of mixture) and steel slag (15.9% coarse; 9.4% fine fractions of the mixture).
Since the ABR was over 40%, the specification called for “quadruple bumping,” that is, to use a PG binder that is two grades lower for both the high and low PG values. For this section of US 52, the special provision was followed, and a PG 52-34 was used at a rate of 3.3%. With FRAP and RAS, the total asphalt binder rate was 6.4% It should be noted that PG 52-34 is the softest asphalt binder approved for use in Illinois.
Unique to this project was the problem of test strips meeting mix criteria. After two test strips were found to be out of compliance, a detailed review resulted in the RAP stockpile being reprocessed and the RAP feedstock gravities revised. The third test strip was acceptable, and the resulting mix was used for the balance of the project. The mix on this section will be compared directly to the mix on Contract 60N07 (to the south) that used the same TRA mix for the aggregate structure but had a PG 58-34 binder.
The surface was paved to a compacted thickness of 1.5 in. Including the thickness of the level binder, the new overlay total thickness was 2.25 in. Compaction was by two dual-drum vibratory rollers followed by a dual-drum finish roller operated in static mode. As noted, the partial use of level binder in the cross-section resulted in a stepped cross-section detail of the surface at the outer foot of the pavement. During paving, there were some areas of obvious distress that developed at the pavement

21
edge on the binder lift as seen in Figures 27 and 28. Such areas were repaired prior to surface placement.
Appendix F shows the locations of the various test strips and the paving sequence map for the surface course. Paving sequence can be important in determining long-term performance related to compaction conditions of the mat near joints (i.e., confined or unconfined edge).
Figure 26. Prime coat on level binder looking north near Sta. 45+00.
Figure 27. Edge of pavement distress on westbound US 52 near Sta. 77+00.
Figure 28. Edge distress of US 52 looking
south near Sta. 42+00 looking north. Figure 29. Paving train of surface
looking south near Sta. 90+00.
4.3 US 52–GOUGAR ROAD TO NORTH OF SECOND STREET
4.3.1 Pavement Cold-Milling
The project consists of an existing HMA overlay that was milled 2.25 in. in depth from edge to edge of pavement, shoulder, or curb and gutter as shown on the plans. Milling was of good quality and generally even in nature with the exception of a few locations at the centerline joint where some loose material that tended to ravel under traffic was encountered. Figures 30 and 31 present the milled surface.

22
4.3.2 Patching, Filling of Cracks, Joints, and Flangeways
Prior to overlay, the section was patched using Class D patches (full-depth HMA), and any wide cracks and joints were cleaned and filled with an IL 4.75 mm HMA level binder sand mix. Appendix D provides the patching schedule for Class D patches. The total plan quantity for patching was 340 yd2. The actual patching totaled 328.7 yd2 for the project, which represents 97% of plan quantity.
The plan quantity for filling of cracks, joints, and flangeways with an IL 4.75 mm HMA level binder was 54 t. After milling, the areas in need of filling were minimal, with 21.85 t of mix being used for this operation. This equates to an average of 0.14 t of mix for every 100 lane-ft of the project.
4.3.3 Prime (Tack Coat)
The pavement was cleaned then primed for paving to start several hours later at daybreak. After priming, the traffic spread the prime somewhat and by morning appeared to be fairly even across the roadway and parking lanes as shown in Figures 34 and 35.
4.3.4 Level Binder
The mix used for level binder was an IL 4.75 mm sand mix. The level binder uses an asphalt binder of PG 70-28 with an asphalt binder replacement of 29% from both RAP and RAS. Details of the mix design can be found in Appendix E.
This project was partly a rural cross-section with shoulders for half the project and the remaining project having an urban curb and gutter cross-section. As with all the rural segments under study in this project, the level binder was placed narrower than the pavement area to be resurfaced on the outside 12 in. of the pavement or safety shoulder. In the curb and gutter area, the level binder was from gutter to gutter. See Appendix A for cross-sectional details of how the level binder was placed and Figures 36 through 38 for this detail. As shown on the plan, the level binder was placed at 0.75 in. thick, with the machine edge forming the longitudinal joint edge of the lift. As with the other projects, the contractor used two three-wheel rollers for breakdown and intermediate rolling followed by a finish dual-drum roller.
Figure 30. Cold-milled surface of US 52 near Gougar Road (to right) looking south.
Figure 31. Cold-milled surface of US 52 at Manhattan Road looking north.

23
Figure 32. US 52 patching near Sta. 36+00 in eastbound (southbound) lane.
Figure 33. US 52 patch near Sta. 36+00 eastbound lane looking north.
Figure 34. Level binder roller train; primed and milled parking area with filled joint/crack near
Sta. 84+00 westbound lane looking south.
Figure 35. Rolling level binder directly behind paver in westbound lane near Sta. 84+00.
4.3.5 Surface Course
Prior to paving the surface, the level binder was primed. Figures 36 through 38 show the resulting coverage in different areas, which was fairly even.
The surface course mix used was total recycle asphalt (TRA) using the same aggregate structure as on contract 60Y08 previously described. The only difference is that the PG asphalt binder grade was set at PG 58-34. Appendix G presents the special provision for TRA.
The surface was paved to a compacted thickness of 1.5 in. With the 0.75 in. level binder, the new overlay total thickness was 2.25 in. Compaction was by two dual-drum vibratory rollers followed by a dual-drum finish roller operated in static mode. As noted, the partial use of level binder in the cross-section areas where an aggregate shoulder was present resulted in stepped cross-section at the outer foot of the pavement. Figure 39 presents the paving train in the curb and gutter segment.

24
Appendix F presents the locations of the various test strips and the paving sequence map for the surface course.
Figure 36. Prime coat on level binder looking west near Sta. 63+00.
Figure 37. Prime coat on level binder looking west near Sta. 81+00.
Figure 38. Near Sta. 36+00 looking north with surface placed eastbound. Note level
binder placed 1 ft less than lane width.
Figure 39. Paving train of surface in eastbound lanes just south of Manhattan Road.
25
CHAPTER 5: POST-CONSTRUCTION SURFACE CONDITIONS
5.1 PAVEMENT PROFILE
As part of the evaluation of the projects, International Roughness Index (IRI) and rutting data were collected using non-contact profile equipment. Prior to construction, IDOT’s profile vendor collected the profile data. After construction, ERI Inc. of Savoy, Illinois, collected profile and rutting data for the study. The same equipment and data collection techniques will be used throughout the post-construction evaluation to reduce device-to-device variations in measurement technology. For IRI, all data presented are quarter-car simulations.
For the three projects constructed in 2015 [Washington Street (60Y04), US 52–Laraway Road to Gougar Road (60N08) and US 52–Gougar Road to north of Second Street (60N07)], profile data were collected after construction and in late winter under frozen conditions. This was done to match data collection condition of the projects constructed in 2014. All projects under study were profiled in spring 2016.
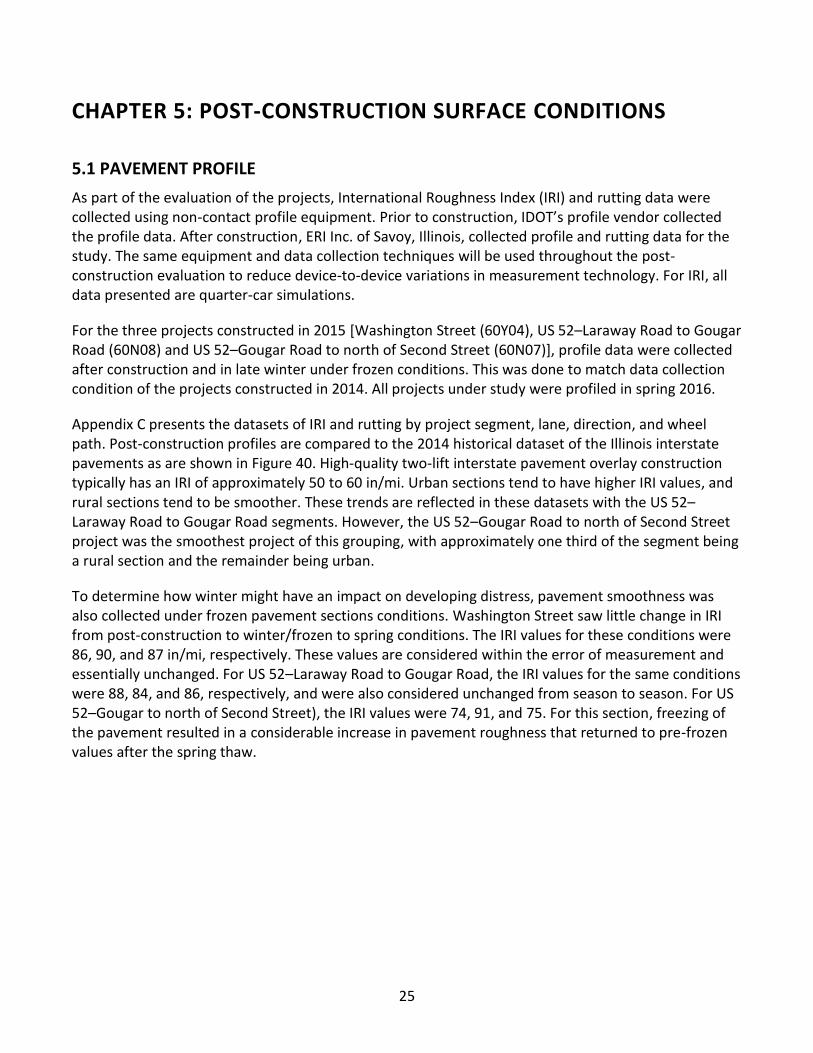
Appendix C presents the datasets of IRI and rutting by project segment, lane, direction, and wheel path. Post-construction profiles are compared to the 2014 historical dataset of the Illinois interstate pavements as are shown in Figure 40. High-quality two-lift interstate pavement overlay construction typically has an IRI of approximately 50 to 60 in/mi. Urban sections tend to have higher IRI values, and rural sections tend to be smoother. These trends are reflected in these datasets with the US 52–Laraway Road to Gougar Road segments. However, the US 52–Gougar Road to north of Second Street project was the smoothest project of this grouping, with approximately one third of the segment being a rural section and the remainder being urban.
To determine how winter might have an impact on developing distress, pavement smoothness was also collected under frozen pavement sections conditions. Washington Street saw little change in IRI from post-construction to winter/frozen to spring conditions. The IRI values for these conditions were 86, 90, and 87 in/mi, respectively. These values are considered within the error of measurement and essentially unchanged. For US 52–Laraway Road to Gougar Road, the IRI values for the same conditions were 88, 84, and 86, respectively, and were also considered unchanged from season to season. For US 52–Gougar to north of Second Street), the IRI values were 74, 91, and 75. For this section, freezing of the pavement resulted in a considerable increase in pavement roughness that returned to pre-frozen values after the spring thaw.
26
Figure 40. 2014 cumulative frequency curve of Illinois interstate IRI.
As seen in the 2014 constructed projects of this study, the right wheel path near the pavement edge or curb is the roughest. This data trend was discussed in the previous report (Lippert et al. 2016).
Washington Street
US 52 (Laraway to Gougar)
US 52 (Gougar to Second)

27
CHAPTER 6: MATERIALS TESTING
6.1 INTRODUCTION
This chapter documents the testing data collected by Illinois Center for Transportation (ICT) and IDOT’s Bureau of Materials and Physical Research (BMPR) teams to date. The testing results include (1) basic mix design verification: virgin asphalt binder, asphalt binder content, and aggregate gradation; (2) mechanical properties: Marshall stability, Cantabro loss, tensile strength ratio (TSR), Texas overlay, Hamburg wheel tracking (HWT), Illinois Flexibility Index Test (I-FIT), fatigue beam, dynamic modulus, and flow number.
Table 3. Summary of Testing
Test Specification Laboratory
Performance-graded asphalt binder AASHTO M 320 (Illinois Modified/AASHTO M 332) BMPR
Asphalt binder content AASHTO T 164-13 (Illinois Modified 01/01/15) BMPR
Aggregate gradation AASHTO T-27 (Illinois Modified 3/1/2013) BMPR
Gmm AASHTO T 209-12 (Illinois Modified 01/01/15) BMPR
Marshall stability and flow ASTM D 1559 (Illinois Modified w/150 mm fixture) BMPR
Cantabro loss TxDOT Test: Tex-245-F BMPR
TSR AASHTO T 283-07 (2011) (Illinois Modified 01/01/15) BMPR
Texas overlay TxDOT Test: Tex-248-F BMPR
Hamburg wheel tracking AASHTO T 324-11 (Illinois Modified 01/01/15) ICT
Creep compliance/IDT strength AASHTO T-322-07 (2011)B ICT
Beam fatigue AASHTO T-321-14 ICT
I-FIT Draft AASHTO TP 105-13 Modified for Intermediate Temperatures ICT
Flow number AASHTO TP 79-13 ICT
Complex modulus AASHTO T 342-11 ICT
BMPR = Bureau of Materials and Physical Research Laboratory
ICT= Illinois Center for Transportation
6.2 MIX DESIGN VERIFICATION
Based on the mix design verification test results, the key observations are as follows:
All neat asphalt binders satisfy the requirement of AASHTO M 332. The detailed binder test results can be found in Appendix G-1.
The extracted aggregate gradation for all mixes sampled from the plant is consistent with the job mix formula (JMF).
Several of the asphalt binder extractions determined for plant mixes differed from the JMF significantly as follows: 177M (0.8% higher than JMF), 140M (0.3% lower than JMF), N08-185M (0.4% lower than JMF), N08-163M (0.3% lower than JMF), and 147M (0.3% higher than JMF). It should be noted that asphalt binder content affected the performance of asphalt mixtures, which will be discussed later for each test. The detailed test results can be found in Appendix G-2.
28
6.3 MECHANICAL TESTING
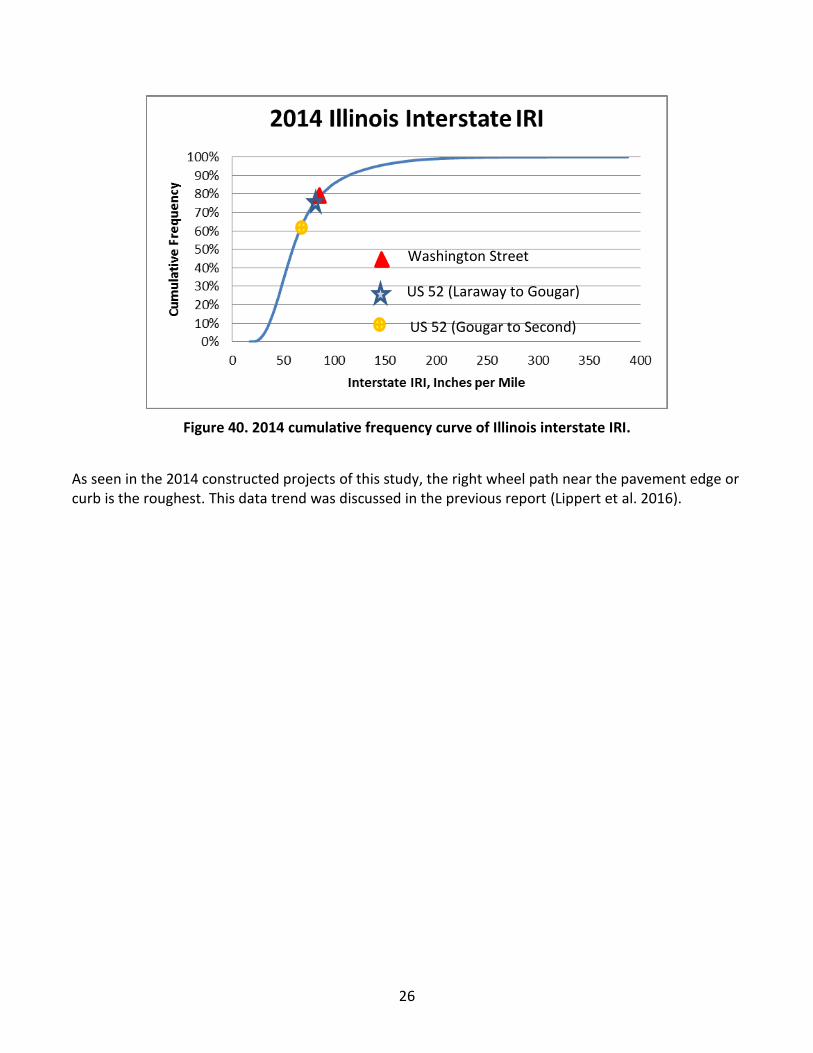
To better illustrate the effect of mix design parameters on mechanical properties, mixes are divided into surface mix and level binder mix. The surface mixes with similar mix design are grouped as shown in Figure 41.
Figure 41. Grouping of surface mixes.
6.3.1 Marshall Stability Results
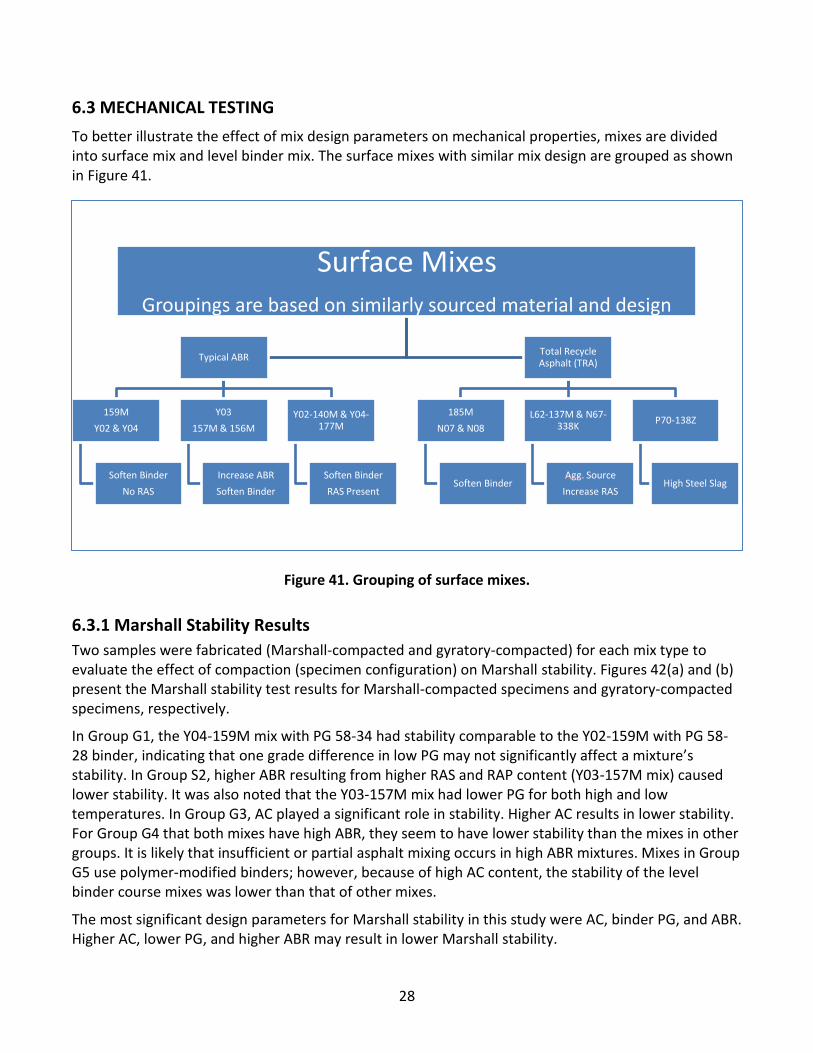
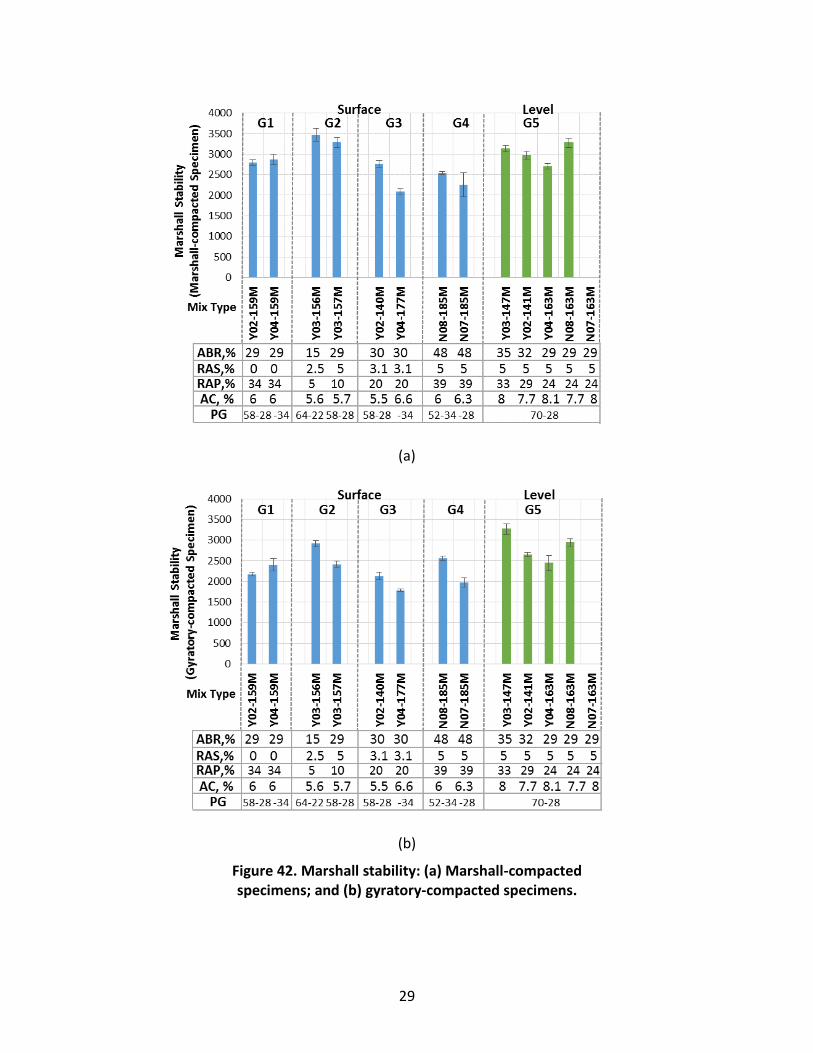
Two samples were fabricated (Marshall-compacted and gyratory-compacted) for each mix type to evaluate the effect of compaction (specimen configuration) on Marshall stability. Figures 42(a) and (b) present the Marshall stability test results for Marshall-compacted specimens and gyratory-compacted specimens, respectively.
In Group G1, the Y04-159M mix with PG 58-34 had stability comparable to the Y02-159M with PG 58-28 binder, indicating that one grade difference in low PG may not significantly affect a mixture’s stability. In Group S2, higher ABR resulting from higher RAS and RAP content (Y03-157M mix) caused lower stability. It was also noted that the Y03-157M mix had lower PG for both high and low temperatures. In Group G3, AC played a significant role in stability. Higher AC results in lower stability. For Group G4 that both mixes have high ABR, they seem to have lower stability than the mixes in other groups. It is likely that insufficient or partial asphalt mixing occurs in high ABR mixtures. Mixes in Group G5 use polymer-modified binders; however, because of high AC content, the stability of the level binder course mixes was lower than that of other mixes.
The most significant design parameters for Marshall stability in this study were AC, binder PG, and ABR. Higher AC, lower PG, and higher ABR may result in lower Marshall stability.
Surface MixesGroupings are based on similarly sourced material and design
Typical ABR
159M
Y02 & Y04
Soften Binder
No RAS
Y03
157M & 156M
Increase ABR
Soften Binder
Y02-140M & Y04-177M
Soften Binder
RAS Present
Total Recycle Asphalt (TRA)
185M
N07 & N08
Soften Binder
L62-137M & N67-338K
Agg. Source
Increase RAS
P70-138Z
High Steel Slag
29
(a)
(b)
Figure 42. Marshall stability: (a) Marshall-compacted specimens; and (b) gyratory-compacted specimens.

30
Since the availability of Marshall equipment is limited due to the adoption of SuperPave mix design procedures in the 1990’s, an effort was undertaken to compare the Marshall stability of traditional hammer compacted 4 in Marshall specimens to more available gyratory-compacted specimens that was cored resulting in a 4 in specimen suitable for conducting Marshall stability test. For this effort, the N50 (2013 let projects) and N70 (2014 let projects) mixes were compacted to 4 +/- 0.5% air voids using both gyratory and Marshall hammer compactors. This required the number of blows of the Marshall hammer to be varied from 25 to 105 depending upon the mix to obtain the proper air void. Figure 43 plots the Marshall stability of a Marshall-compacted specimen with that of a gyratory-compacted specimen that was cored (to produce the standard 4 in Marshall size specimen). As shown, the Marshall stability of the gyratory-compacted specimen was biased lower than that of the Marshall-compacted one. This is explained by the facts that the compaction effort (energy) by the Marshall apparatus is higher than that of gyratory compactor and that the gyratory compactor was developed to better simulate field compaction.
Figure 43. Marshall stability between Marshall-compacted and cored gyratory-compacted specimens at 4+/- 0.5% air voids.
6.3.2 Cantabro Loss Test Results
The Cantabro loss test was used to characterize durability of the asphalt mixes. Figure 44 shows the Cantabro loss for each mix type for three air void contents. Overall, the Cantabro loss was less than 10% regardless of mix type. Previous studies on open-graded friction course (OGFC) mix showed that the Cantabro loss ranged from 12% to 31% (Punith et al. 2012). A study by Doyle and Howard (2010) on a 9.5 mm dense-graded Mississippi mixture showed that the Cantabro loss ranged from 2.8% to 11.7%. The mixes in the current study are also 9.5 mm dense-graded; thus, low Cantabro loss value was expected for dense-graded mixes.
y = 0.81x + 176.54R² = 0.61
1000
2000
3000
4000
1000 2000 3000 4000
Gyra
tory
-co
mp
acte
d S
pe
cim
en
(N
70
)
Marshall-compacted Specimen(25 to 125 blows)
Line of Equality

31
Group S5 had the lowest Cantabro loss, which is due to polymer-modified binders and 4.75 mm aggregate gradation. Mixes within Group S5 were comparable in Cantabro loss. The Y03-156M mix had the highest Cantabro loss, which may imply that asphalt binder grade and binder content plays an important role in keeping the cohesiveness of HMA.
Figure 44. Cantabro loss test results.
6.3.4 Moisture Damage Test Results (TSR)
The moisture damage resistance of asphalt mixtures was characterized by the IL-Modified AASHTO T 283 TSR test. Figure 45 presents the TSR for each mix. As shown, all mixes had acceptable ratios, except that the TSR value for the Y03-147M mix was slightly below the threshold value of 0.85. It was verified in the JMF that the Y03-147M mix passed the TSR requirement.

32
Figure 44. TSR test results
6.3.5 Texas Overlay Test Results
The Texas overlay tester (OT) was used to evaluate cracking resistance of asphalt mixtures. The number of cycles to failure was obtained in this test when the initial load was reduced by 93%. Figure 45 presents the number of cycles to failure from the OT for each mix. The variation in OT results for most surface mixes was high, and the coefficient of variation (COV) among five replicates could be as high as 56% for Y03-157M mix. However, the OT seems to qualitatively distinguish the mixes in Groups S1, S3, and S4. The soft, low PG (Group 1) and high AC (Groups 3 and 4) as mixes achieving a higher number of cycles to failure (i.e., better cracking resistance). Clearly shown is that as the AC content increases the number of cycles to failure increases.
For level binder mixes (Group S5), the number of cycles were all high because of the polymer-modified binder used and higher AC.
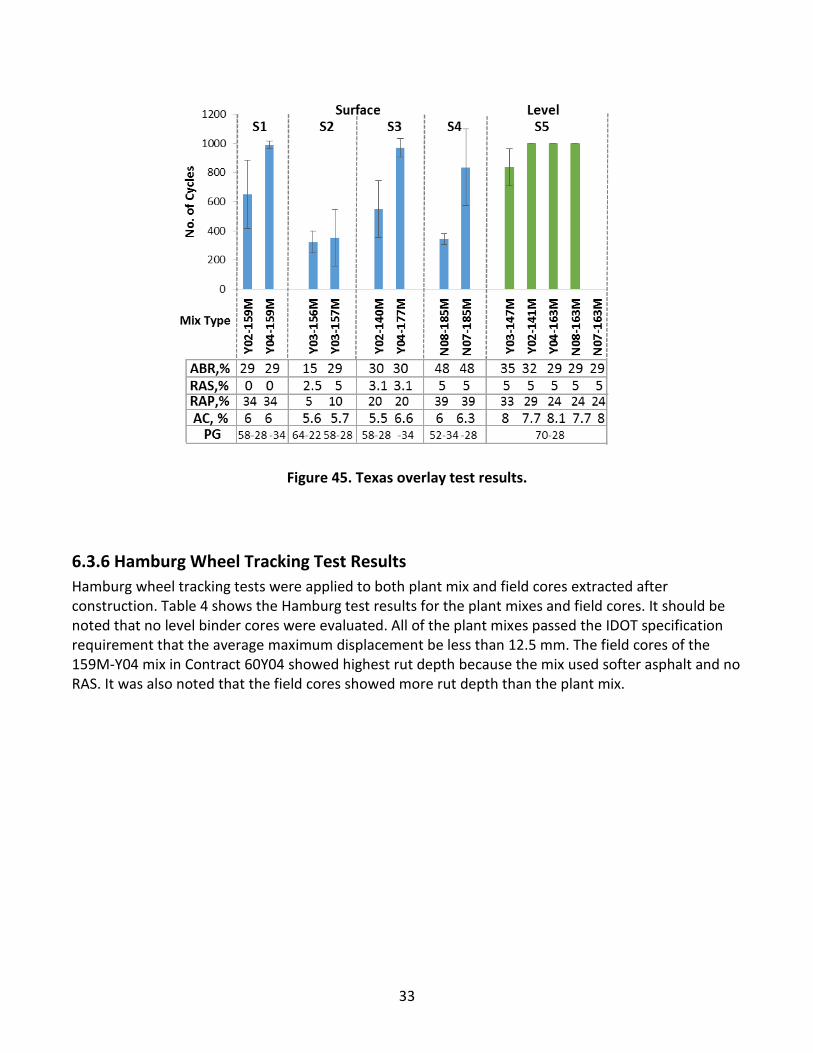
33
Figure 45. Texas overlay test results.
6.3.6 Hamburg Wheel Tracking Test Results
Hamburg wheel tracking tests were applied to both plant mix and field cores extracted after construction. Table 4 shows the Hamburg test results for the plant mixes and field cores. It should be noted that no level binder cores were evaluated. All of the plant mixes passed the IDOT specification requirement that the average maximum displacement be less than 12.5 mm. The field cores of the 159M-Y04 mix in Contract 60Y04 showed highest rut depth because the mix used softer asphalt and no RAS. It was also noted that the field cores showed more rut depth than the plant mix.

34
Table 4. Hamburg Wheel Tracking Test Result Summary
Contract Mix Neat
Binder PG Designed PG IDOT Pass
Criteria
Average Max Displacement, mm
Plant Mix Field Core
60Y03
147M (L) 70-28 70-28 15,000 2.8 NA
156M 64-22 64-22 7,500 2.0 2.5
157M 58-28 64-22 7,500 2.5 2.5
60Y02
141M (L) 70-28 70-28 15,000 3.0 NA
140M 58-28 64-22 7,500 2.8 5.0
159M 58-28 64-22 7,500 3.4 3.4
60N08 185M 52-34 64-22 7,500 3.7 4.0
163M (L) 70-28 70-28 15,000 4.4 NA
60N07 185M 58-28 64-22 7,500 4.7 6.0
163M (L) 70-28 70-28 15,000 3.8 NA
60Y04
177M 58-34 64-22 7,500 4.6 6.7
159M 58-34 64-22 7,500 4.6 9.9
163M (L) 70-28 70-28 15,000 6.5 NA
60P70 138Z 52-28 64-22 75,00 3.4 2.3
60L62 137M 52-28 64-22 75,00 3.7 4.3
60N67 338M 52-28 64-22 75,00 1.6 1.6
Note: L denotes level binder course.
6.3.7 I-FIT Results
The Flexibility Index (FI) obtained from I-FIT using PMLC specimens is shown in Figure 45(a). A higher FI value indicates better cracking resistance. No significant difference was found between two mixes in Group G1. In Group G2, the Y03-157M mix with 29% ABR showed a lower FI value than the Y03-156M with 15% ABR, indicating higher ABR results with a lower FI value, despite using softer binder. However, in general, Group G2 resulted in relatively low FI. The mixes with higher AC in both Groups G3 and G4 exhibited higher FI values, indicating that higher AC may contribute to better cracking resistance.
For the level binder mixes (Group G5), Y03-147M and Y02-141M mixes exhibited similar FI values because of similar mix composition. Mix type 163M in three contracts showed different FI values, possibly related to the different aging effects that occurred during asphalt plant production. This difference was also observed in flow number test and dynamic modulus test results. Further investigation is needed to check this difference for these three mixes.
Illinois is considering a minimum FI of 8 for HMA surface mixes; however, only three surface mixes (Y02-159M, Y04-159M, and Y04-177M) met that requirement. For the level binder mixes (Group G5), it is recommended that an FI value significantly greater than 8 be used for a level binder course to retard reflective cracking; an FI less than 8 would be counterproductive. Hence, an optimized level binder design with RAP and/or RAS should be developed. It is the authors’ opinion that the FI should be above 15 for a level binder mix if the layer is to provide a crack retarding function. The addition of RAP and

35
RAS in a level binder course must be reexamined without jeopardizing the main purpose of using level binder and without impacting negatively on its performance.
Figure 45. I-FIT results for plant mix.
Figure 46 compares the FI values between the plant mixes and field cores. Only surface mixes had field cores. The numbers in orange denote the air void of field cores. The field cores showed higher FI values than the plant mixes, which is due primarily to the difference in compaction efforts, specimen thickness, and air void contents.

36
Figure 46. FI comparison between field cores and plant mix.
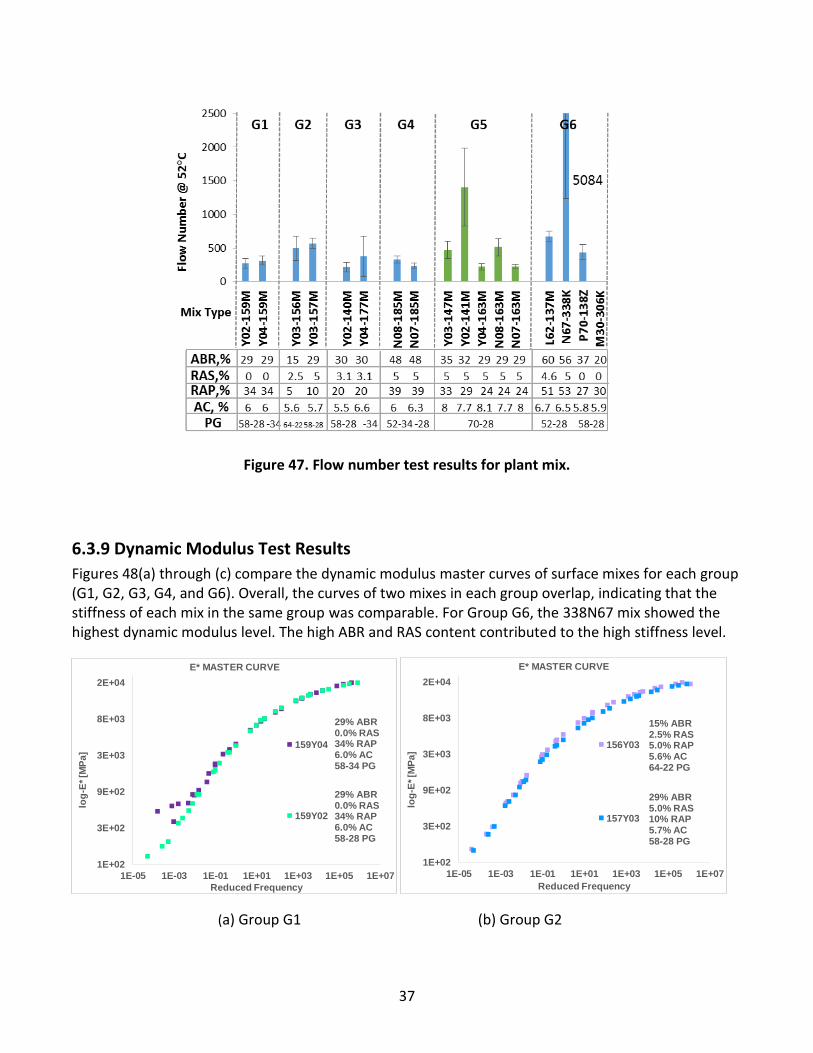
6.3.8 Flow Number Test Results
The flow number tests at 52°C for plant mixes are shown in Figure 47. In Group G4, the mix with lower AC showed higher flow number. However, the variability of the flow number test was high, as indicated by the error bar in the figure, which overshadows the effect of mix design parameters on the mixes’ resistance to permanent deformation. All mixes had a flow number much higher than 50, which is the minimum number for a traffic level of 3 to 10 million equivalent single-axle loads (ESALS) and indicates that all the tested mixes have an excellent rutting resistance.
The N67-338K mix in Group G6 had an extremely high flow number, which is consistent with the Hamburg wheel tracking test results that its rut depth was lowest among all mixes because of its highest ABR and RAS content.
37
Figure 47. Flow number test results for plant mix.
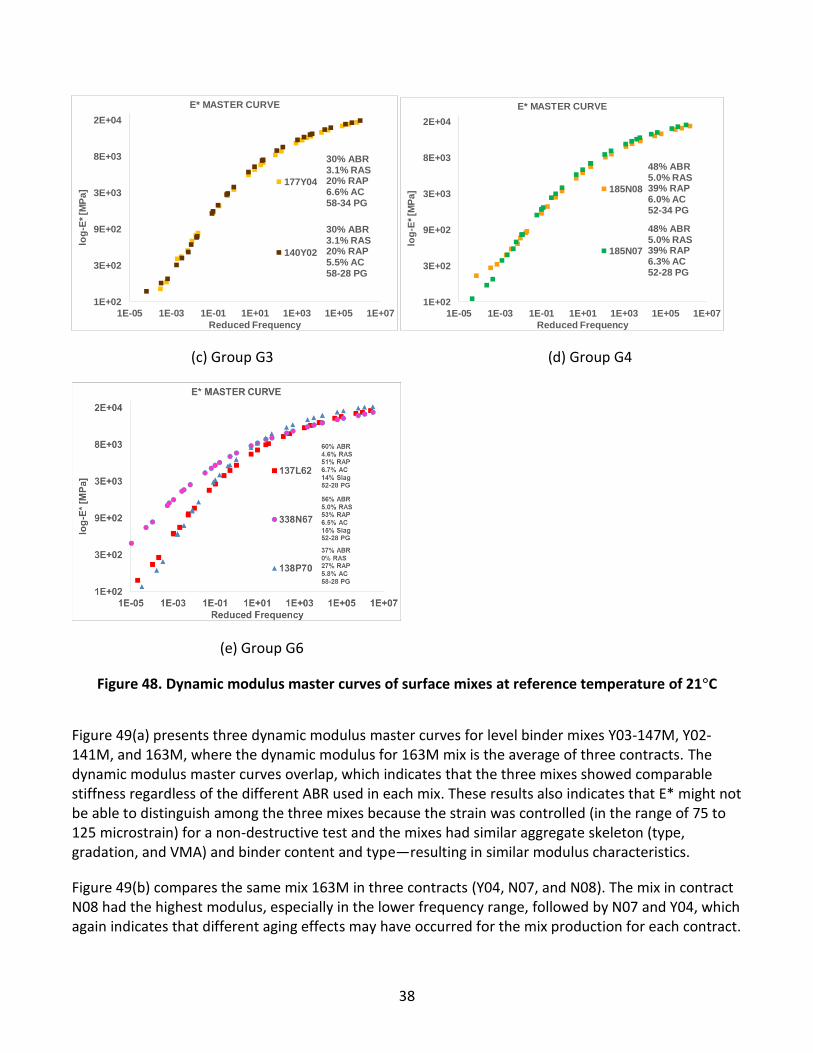
6.3.9 Dynamic Modulus Test Results
Figures 48(a) through (c) compare the dynamic modulus master curves of surface mixes for each group (G1, G2, G3, G4, and G6). Overall, the curves of two mixes in each group overlap, indicating that the stiffness of each mix in the same group was comparable. For Group G6, the 338N67 mix showed the highest dynamic modulus level. The high ABR and RAS content contributed to the high stiffness level.
(a) Group G1 (b) Group G2
1E+02
3E+02
9E+02
3E+03
8E+03
2E+04
1E-05 1E-03 1E-01 1E+01 1E+03 1E+05 1E+07
log
-E*
[MP
a]
Reduced Frequency
E* MASTER CURVE
159Y04
159Y02
29% ABR0.0% RAS34% RAP6.0% AC58-34 PG
29% ABR0.0% RAS34% RAP6.0% AC58-28 PG
1E+02
3E+02
9E+02
3E+03
8E+03
2E+04
1E-05 1E-03 1E-01 1E+01 1E+03 1E+05 1E+07
log
-E*
[MP
a]
Reduced Frequency
E* MASTER CURVE
156Y03
157Y03
15% ABR2.5% RAS5.0% RAP5.6% AC64-22 PG
29% ABR5.0% RAS10% RAP5.7% AC58-28 PG
38
(c) Group G3 (d) Group G4
(e) Group G6
Figure 48. Dynamic modulus master curves of surface mixes at reference temperature of 21°C
Figure 49(a) presents three dynamic modulus master curves for level binder mixes Y03-147M, Y02-141M, and 163M, where the dynamic modulus for 163M mix is the average of three contracts. The dynamic modulus master curves overlap, which indicates that the three mixes showed comparable stiffness regardless of the different ABR used in each mix. These results also indicates that E* might not be able to distinguish among the three mixes because the strain was controlled (in the range of 75 to 125 microstrain) for a non-destructive test and the mixes had similar aggregate skeleton (type, gradation, and VMA) and binder content and type—resulting in similar modulus characteristics.
Figure 49(b) compares the same mix 163M in three contracts (Y04, N07, and N08). The mix in contract N08 had the highest modulus, especially in the lower frequency range, followed by N07 and Y04, which again indicates that different aging effects may have occurred for the mix production for each contract.
1E+02
3E+02
9E+02
3E+03
8E+03
2E+04
1E-05 1E-03 1E-01 1E+01 1E+03 1E+05 1E+07
log
-E*
[MP
a]
Reduced Frequency
E* MASTER CURVE
177Y04
140Y02
30% ABR3.1% RAS20% RAP6.6% AC58-34 PG
30% ABR3.1% RAS20% RAP5.5% AC58-28 PG
1E+02
3E+02
9E+02
3E+03
8E+03
2E+04
1E-05 1E-03 1E-01 1E+01 1E+03 1E+05 1E+07
log
-E*
[MP
a]
Reduced Frequency
E* MASTER CURVE
185N08
185N07
48% ABR5.0% RAS39% RAP6.0% AC52-34 PG
48% ABR5.0% RAS39% RAP6.3% AC52-28 PG

39
(a) (b)
Figure 49. Dynamic modulus master curves of level binder mixes at reference temperature of 21°C
6.3.10 Four-Point Bending Beam Fatigue Test Results
Figure 50 plots the failure cycles versus applied strain levels from four-point bending beam fatigue test results for three level binder mixes. The figure indicates that the 163M mix is best in fatigue cracking resistance, followed by the 141M and 147M mixes. The conventional analysis of the beam fatigue test results in Figure 50 shows the correlation between cycles to failure and applied strain level using the following equation:
𝑁𝑓 = 𝑘1 (1
𝜀𝑡)
𝑘2
[1]
where Nf is the cycles to failure when the initial stiffness is reduced by 50%, ɛt is applied strain level, and k1 and k2 are regression coefficients.
The 163M mix has the highest k2 parameter, and its regression line is clearly higher than those of the other two mixes, indicating that the 163M mix had the best fatigue resistance. The typical range of k2 is from 2.93 to 6.17 (Shukla et al. 2008), and all mixes followed in this range.
The tests for other surface mixes are still ongoing, and more data analysis will be conducted once they are completed.
1E+02
3E+02
9E+02
3E+03
8E+03
2E+04
1E-05 1E-03 1E-01 1E+01 1E+03 1E+05 1E+07
log
-E*
[MP
a]
Reduced Frequency
E* MASTER CURVE
163Y04
163N07
163N08
29% ABR5.0% RAS24% RAP8.1% AC70-28 PG
29% ABR5.0% RAS24% RAP8.0% AC70-28 PG
29% ABR5.0% RAS24% RAP7.7% AC70-28 PG

40
Figure 50. Four-point beam fatigue test results: Cycles to failure versus strain level.

41
CHAPTER 7: PERFORMANCE OF MIXES BY DISTRESS MONITORING
This project focuses on pavements constructed as the result of two IDOT lettings—namely, April 26, 2013, and June 13, 2014. The April letting allowed time for all the projects to be constructed that year. The June letting did not provide enough time for construction of all the projects in 2014. Three of the projects on the 2014 letting were carried over to 2015 for construction. Table 1 (see Chapter 2) provides details of letting and construction times, along with the surface mix details under study.
To be consistent with previous reporting on total recycle asphalt (TRA) performance from the 2013 let, these projects are reported as a group (Lippert et al. 2014, 2015) followed by the projects let in 2014.
7.1 TRA PAVEMENT PERFORMANCE, 2013 LET PROJECTS
7.1.1 Distress Surveys
Distress survey data were collected on the sections using established distress criteria (IDOT 2012a). The datasets consist of pre-construction (2013), post-construction (2013), spring 2014, spring 2015, and spring 2016. Summaries of the distress surveys by section and date are presented in Appendix H. To present data trends, the data summaries are plotted on stacked bar charts by distress type, as shown in Figures 51 through 60.
Part of the annual distress survey is to take photos at similar locations, with each survey providing a visual progression of distress with time. Typical photos representing each section are presented in Appendix I.
Figure 51. Transverse joints and cracks by distress level for TRA projects.

42
Figure 52. Percentage of crack and joint length reflected through overlay for TRA projects.
Figure 53. Centerline cracking by distress level for TRA projects.

43
Figure 54. Permanent patching deterioration for TRA projects.
Figure 55. Centerline cracking by distress level for TRA projects.
44
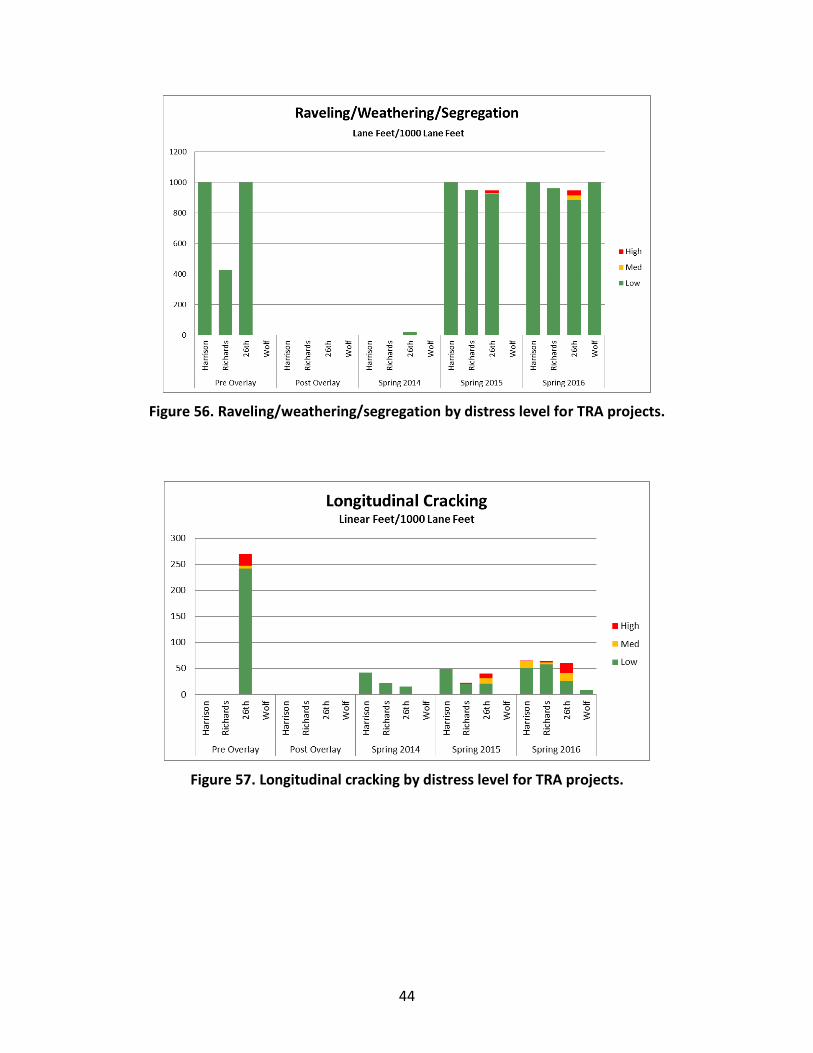
Figure 56. Raveling/weathering/segregation by distress level for TRA projects.
Figure 57. Longitudinal cracking by distress level for TRA projects.
45
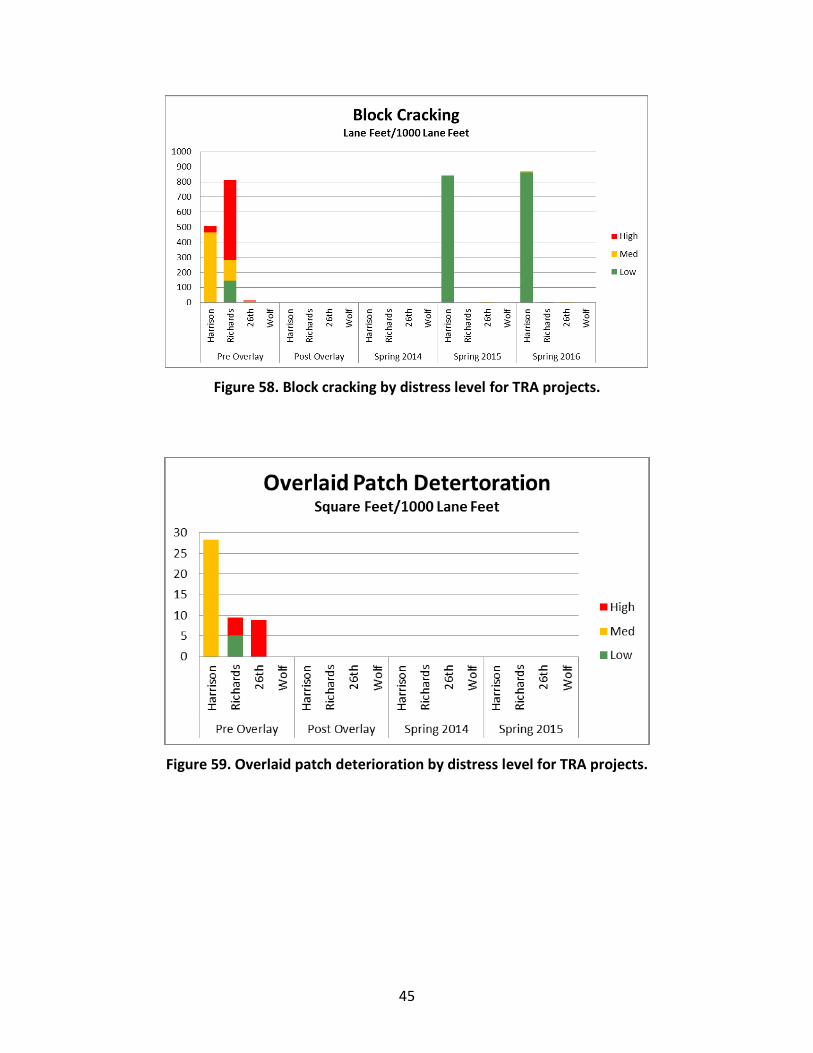
Figure 58. Block cracking by distress level for TRA projects.
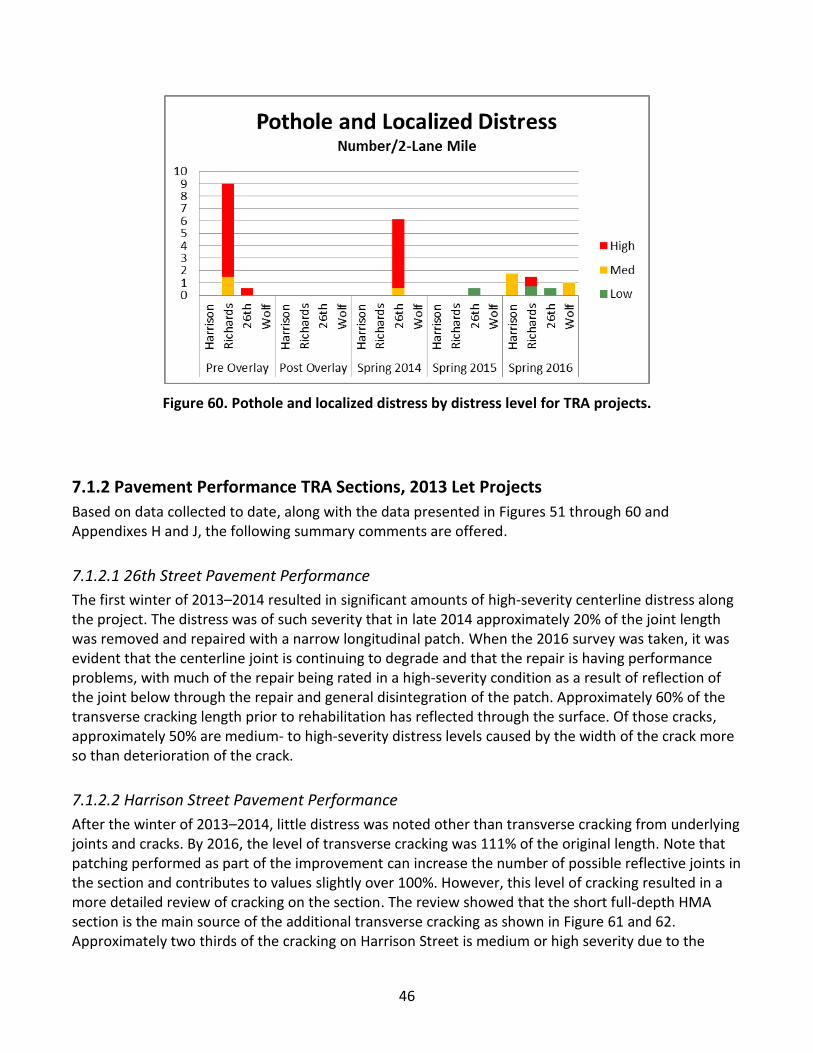
Figure 59. Overlaid patch deterioration by distress level for TRA projects.
46
Figure 60. Pothole and localized distress by distress level for TRA projects.
7.1.2 Pavement Performance TRA Sections, 2013 Let Projects
Based on data collected to date, along with the data presented in Figures 51 through 60 and Appendixes H and J, the following summary comments are offered.
7.1.2.1 26th Street Pavement Performance
The first winter of 2013–2014 resulted in significant amounts of high-severity centerline distress along the project. The distress was of such severity that in late 2014 approximately 20% of the joint length was removed and repaired with a narrow longitudinal patch. When the 2016 survey was taken, it was evident that the centerline joint is continuing to degrade and that the repair is having performance problems, with much of the repair being rated in a high-severity condition as a result of reflection of the joint below through the repair and general disintegration of the patch. Approximately 60% of the transverse cracking length prior to rehabilitation has reflected through the surface. Of those cracks, approximately 50% are medium- to high-severity distress levels caused by the width of the crack more so than deterioration of the crack.
7.1.2.2 Harrison Street Pavement Performance
After the winter of 2013–2014, little distress was noted other than transverse cracking from underlying joints and cracks. By 2016, the level of transverse cracking was 111% of the original length. Note that patching performed as part of the improvement can increase the number of possible reflective joints in the section and contributes to values slightly over 100%. However, this level of cracking resulted in a more detailed review of cracking on the section. The review showed that the short full-depth HMA section is the main source of the additional transverse cracking as shown in Figure 61 and 62. Approximately two thirds of the cracking on Harrison Street is medium or high severity due to the

47
width of the cracks and not the deterioration of the crack. Also of note on this section is the amount of alligator or fatigue cracking that has exceeded the pre-overlay amount by some twofold. Alligator or fatigue cracking is a reflection of the structural support of the road or underlying materials’ performance rather than a reflection of the surface material performance. While at a lower severity the total block cracking is double that of the pre-overlay.
7.1.2.3 Richards Street Pavement Performance
After the winter of 2016, fatigue cracking was measured at just over 6% of the roadway. Fatigue cracking is typically an indication of a structural and underlying material problems usually unrelated to the surface material. Other distresses such as raveling/weathering/segregation and longitudinal cracking began to appear in 2015, which are more closely related to the properties of the surface material and were relatively unchanged in 2016. As in the past, comparing the three TRA sections to each other, Richards Street is the best performing, with the lowest amount of pavement distress.
7.1.2.4 Wolf Road Pavement Performance
After a third winter, the rate of transverse cracking compared to the amount before rehabilitation is 46%. Other distresses such as centerline distress along with raveling and weathering were noted for the first time in 2016, which were both at low-severity levels. The severity and extent of these distresses are less than any of the 2013 let TRA projects. Wolf Road continues to perform markedly better than the TRA sections. It should be noted that Wolf Road was extensively patched prior to the overlay in this study, with the resulting joint spacing at approximately 11.2 ft. It is not uncommon for pavement joints to basically lock up and act as a hinge. In such cases, movement occurs at every other joint or perhaps every third joint. This may explain the low amount of reflective joints more so than the mix itself. On a relative level, Wolf Road after three winters has similar performance as the TRA sections after the first or second winter, depending on the distress compared.
7.2 PAVEMENT PERFORMANCE OF VARIOUS HMA MIXES, 2014 LET PROJECTS
7.2.1 Distress Surveys
Distress survey data were collected on the sections using established distress criteria (IDOT 2012a). The datasets consist of pre-construction (2014), post-construction (2015 spring or fall, depending on section), and spring 2016. Summaries of the distress surveys for all the 2014 let projects by section and date are presented in Appendix B.
7.2.2 Pavement Performance of TRA Sections, 2014 Let Projects
Of note in reviewing the data is that, overall, there is much less distress on the 2014 let projects than was seen on the 2013 let projects at the same age, especially with respect to centerline joint performance and raveling/segregation. The main distress for the 2014 let projects was transverse cracking, yet on some projects very little transverse cracking developed (US 52 and Washington Street). On US 52 and Segment 2 of Washington Street, approximately 6 in and 3.75 in. of HMA respectively was left in place over the old PCC pavement or stabilized base (Washington Street). The 2013 let projects, Crawford/Pulaski and Segment 1 of Washington Street, were overlays on either bare PCC

48
pavement or the milling operation removed the HMA down to the existing PCC pavement. While the performance may be related to in-place surface mix properties, another possibility worth exploring is the pre-existing pavement cross-section and rehabilitation design. An additional winter should help clarify this trend.
7.3 TRANSVERSE CRACKING PERFORMANCE OF ALL SECTIONS UNDER STUDY
In reviewing the broader data set, there were major performance differences after the first winter based on the type of pavement section. Sections that were overlays directly on bare concrete pavement or where the existing overlay was milled off and the overlay placed on bare concrete showed more transverse cracking than segments that left 3 or more inches of HMA in place prior to overlay. In addition, observations of distress in the new leveling binder prior to final surface placement was an indication of how challenging preventing reflective cracking on overlays of jointed concrete pavement can be. Figure 61 presents an observation photo of reflective cracking of the leveling binder placed upon bare concrete pavement in Segment 1 of Washington Street after 11 days off service. The leveling binder mix provided an FI of approximately 7.0 which is not sufficient for the leveling binder to serve as a crack control layer. A formal survey was not conducted, but it was observed that very few transverse cracks reflected through the leveling binder on Segment 2 of Washington street. Subsequent crack surveys reinforced this observation. Projects on US 52 which also left a substantial layer of HMA in place (approximately 6 in) also exhibited limited transverse cracking after the first winter.
Figure 61. Reflective crack in leveling binder of Washington Street Segment 1
From the limited observations and the data collected to date, it is evident that cross-sections where relatively thin HMA overlays are placed directly upon concrete pavement, there is a high demand for flexibility (high FI values) of the mix to retard reflective cracks as long as possible. Likewise, cross-sections that left 3 or more inches of the existing HMA in place between the concrete pavement and
I-FIT FI = 7
Laydown 5/29/15
Photo 6/9/15
4.75 Leveling
Binder
0.75-Inch
PG 70-28
AC: 8.0%
ABR: 29%
RAP: 24%
RAS: 4.9%
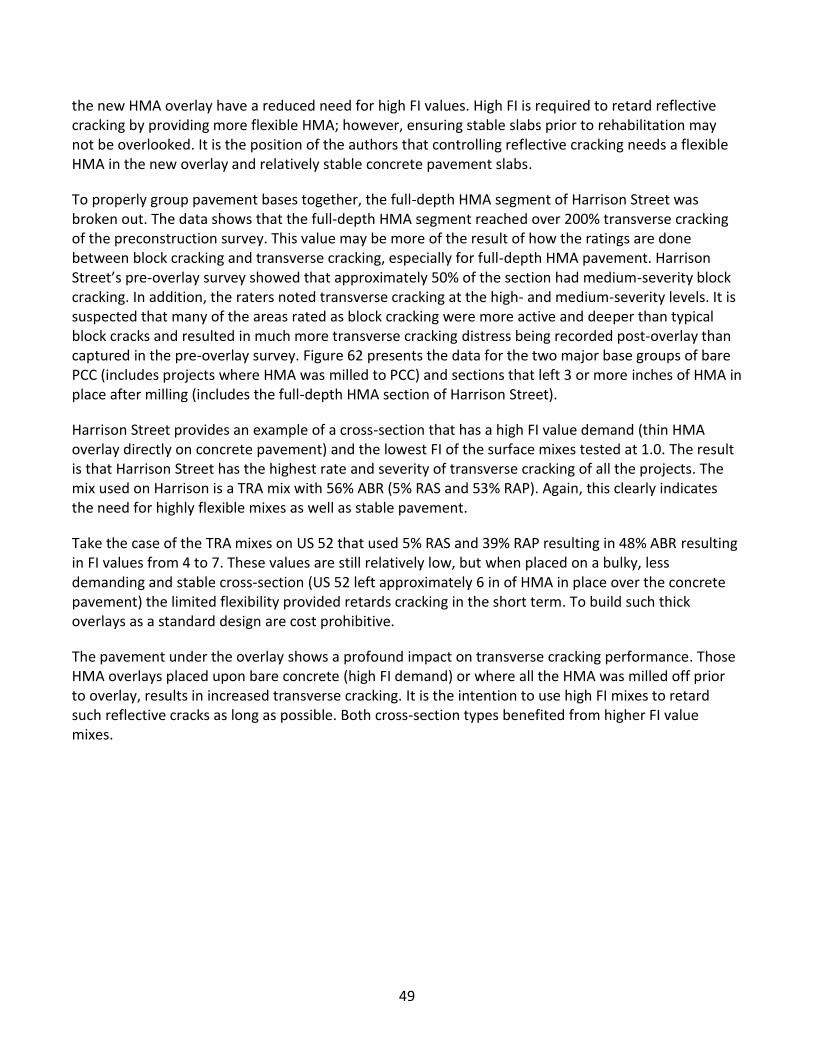
49
the new HMA overlay have a reduced need for high FI values. High FI is required to retard reflective cracking by providing more flexible HMA; however, ensuring stable slabs prior to rehabilitation may not be overlooked. It is the position of the authors that controlling reflective cracking needs a flexible HMA in the new overlay and relatively stable concrete pavement slabs.
To properly group pavement bases together, the full-depth HMA segment of Harrison Street was broken out. The data shows that the full-depth HMA segment reached over 200% transverse cracking of the preconstruction survey. This value may be more of the result of how the ratings are done between block cracking and transverse cracking, especially for full-depth HMA pavement. Harrison Street’s pre-overlay survey showed that approximately 50% of the section had medium-severity block cracking. In addition, the raters noted transverse cracking at the high- and medium-severity levels. It is suspected that many of the areas rated as block cracking were more active and deeper than typical block cracks and resulted in much more transverse cracking distress being recorded post-overlay than captured in the pre-overlay survey. Figure 62 presents the data for the two major base groups of bare PCC (includes projects where HMA was milled to PCC) and sections that left 3 or more inches of HMA in place after milling (includes the full-depth HMA section of Harrison Street).
Harrison Street provides an example of a cross-section that has a high FI value demand (thin HMA overlay directly on concrete pavement) and the lowest FI of the surface mixes tested at 1.0. The result is that Harrison Street has the highest rate and severity of transverse cracking of all the projects. The mix used on Harrison is a TRA mix with 56% ABR (5% RAS and 53% RAP). Again, this clearly indicates the need for highly flexible mixes as well as stable pavement.
Take the case of the TRA mixes on US 52 that used 5% RAS and 39% RAP resulting in 48% ABR resulting in FI values from 4 to 7. These values are still relatively low, but when placed on a bulky, less demanding and stable cross-section (US 52 left approximately 6 in of HMA in place over the concrete pavement) the limited flexibility provided retards cracking in the short term. To build such thick overlays as a standard design are cost prohibitive.
The pavement under the overlay shows a profound impact on transverse cracking performance. Those HMA overlays placed upon bare concrete (high FI demand) or where all the HMA was milled off prior to overlay, results in increased transverse cracking. It is the intention to use high FI mixes to retard such reflective cracks as long as possible. Both cross-section types benefited from higher FI value mixes.

50
Figure 62. Linear feet of transverse joint and cracks by number of winters, base type, and project segment.
Using the same data, Figure 63 presents the post-overlay transverse cracking as a percentage of the pre-overlay survey values.

51
Figure 63. Percentage of cracking based on pre- and post- overlay surveys by winter, base type, and project segment.
0%
20%
40%
60%
80%
100%
120%
140%
160%
180%
200%
Cra
wfo
rd/P
ula
ski
US
52
(60
Y03
) Se
g 3
Was
hin
gto
n -
Seg
1
Har
riso
n
Ric
har
ds
Wo
lf
US
52
(60
Y03
) Se
g 1
& 2
US
52
(60
N0
8)
US
52
(60
N0
7)
Was
hin
gto
n -
Seg
2
26th
Str
eet
Har
riso
n -
FD
-HM
A
Cra
wfo
rd/P
ula
ski
US
52
(60
Y03
) Se
g 3
Har
riso
n
Ric
har
ds
Wo
lf
US
52
(60
Y03
) Se
g 1
& 2
26th
Str
eet
Har
riso
n -
FD
-HM
A
Har
riso
n
Ric
har
ds
Wo
lf
26th
Str
eet
Har
riso
n -
FD
-HM
A
Bare PCC* 3"+ HMA Bare PCC* 3"+ HMA Bare PCC* 3"+HMA
One Winter Two Winters Three Winters
Per
cen
t
Winters/Base Type/Project-Segment
Transverse Cracks and Joints: Percentage of Pre-Overlay Length

52
CHAPTER 8: SUMMARY, OBSERVATIONS, AND RECOMMENDATIONS
8.1 SUMMARY
The main purpose of this study is to document pre-existing conditions and construction procedures, characterize the materials used in the construction, and monitor the resulting performance of five experimental sections. The experiments used hot-mix asphalt (HMA) surface mixes that contain reclaimed asphalt pavement (RAP) with and without recycled asphalt shingles (RAS) at a variety of asphalt binder replacement (ABR) levels. To counter brittle asphalt from recycled sources, various grades of PG asphalt binders that are much softer than typically specified were evaluated. This report serves to document the construction of three of the five projects—namely Washington Street, US 52 (Laraway Road to Gougar Road), and US 52 (Gougar Road to north of Second Street). Also provided is an update of the original total recycle asphalt (TRA) projects constructed in 2013 that contained 100% recycled aggregate.
8.2 KEY OBSERVATIONS
The teeth in the cold-milling head used for 2015 construction provided a more uniform texture than that provided in 2014.
The placement of prime (tack coat) was adequate with little to no “zebra striping” of the prime across the mat. This may be more a function of how traffic can assist in spreading the material.
A relative light rain after prime (tack coat) application did result in some slight migration of the prime material to the shoulder edge in some locations on the US 52 (Laraway Road to Gougar Road) project.
Patching plan quantity and needed patching at time of construction seemed to be well balanced. However, because of the time it took to obtain an acceptable surface mix for US 52 (Laraway Road to Gougar Road), the exposed milled edge and level binder lift experienced more traffic than typical, resulting in edge distress and the need for additional repair of these areas.
For the US 52 projects, crack filling seemed to be well balanced compared with patching. For the Washington Street project, a few areas seemed to be in need of patching and had been crack filled; however, these areas have yet to develop distress.
The partial-width level binder (1 ft less than surface width on most of Washington Street and US 52) was used on the bulk of these projects. For the 2015-constructed projects, no longitudinal distress was observed that could be tied to this detail.
For the 2013 let TRA projects, distress types, extent, and severity are developing sooner than Wolf Road such that after three winters, the distress on Wolf Road is at the same type, extent, and severity approximately 1 to 2 years later than the 2013 let TRA projects. The extent of transverse cracking on

53
projects/segments that did not remove all the existing HMA is typically much less than on sections that were overlays of bare concrete or where the existing HMA was milled to concrete prior to the new HMA overlay.
Washington Street surface mixes, which used a soft PG 58-34 along with a moderate asphalt binder replacement (ABR) of 30%, resulted in the best Flexibility Index (FI) of the study, of just over 10.
Leaving an existing HMA layer of 3 or more inches after milling seems to be more effective than the current level binder in preventing cracking in the new overlay. An additional winter will help make the trend clear.
Low Flexibility Index (FI) values and underlying bare concrete pavement combinations as seen on Harrison Street resulted in high amounts of reflective cracking early in the overlay life.
The use of polymer in the 4.75 level binder in combination with RAP and RAS that results in approximately 30% ABR produces FI values similar to the surface mixes under study, which may negate the anti-reflective cracking role of this layer.
8.3 RECOMMENDATIONS
The need for partial-width use of level binder should be re-evaluated. The higher prime rate associated with the IDOT’s new Tack specification may have negated the need for this detail.
If partial-width use of level binder is to continue, a tapered edge detail by hand luting should be considered.
Building up HMA over underlying concrete pavement over time should be evaluated. Allowing sound material to remain on lower volume roadways may be one option. However, strong assurances would be needed through testing/evaluation so that any material left in place would not result in future rutting/stripping issues. As an alternative, in-place recycling may assist in providing additional thickness over concrete pavement to assist in reducing reflective cracking.
Thicker level binder lifts along with improved FI values for HMA over bare concrete pavements should be evaluated for cost and long-term performance.
Evaluation of a more appropriate FI value for level binder should be considered. The use of a higher FI mix below the surface would make the overlay more crack resistant. A review of the benefit/costs of FI values up to double what may be selected for the surface should be examined. A more economical level binder with improved FI properties should be the goal.
While the use of thin overlays using high recycle content materials may seem desirable to reduce cost, more sustainable pavements may be obtained through higher-FI HMA that are designed with a slightly thicker overlay. The economic trade-offs among thickness, FI, polymer use, and overall performance need closer examination to optimize life-cycle cost and performance.

54
REFERENCES
Al-Qadi, I.L., O. Hason, J. Lambros, A. Khatib, P. Singhvi, T. Khan, J. Rivera-Perez, B. Doll, 2015 (Dec). Testing Protocols to Ensure Performance of High Asphalt Binder Replacement Mixes Using RAP and RAS. Research Report No. FHWA-ICT-25-017. Illinois Center for Transportation: Rantoul, IL.
Doyle, J.D., and I.L. Howard, 2010. Laboratory Investigation of High RAP Content Pavement Surface Layers. Final Report FHWA/MS-DOT-RD-10-212, Mississippi State University, Jackson, MS.
Illinois Department of Transportation (IDOT). 2012a. Pavement Distress Manual. Illinois Department of Transportation, Bureau of Materials and Physical Research: Springfield, IL.
Illinois Department of Transportation (IDOT). 2012b. Standard Specifications for Road and Bridge Construction. Adopted January 1, 2012. Illinois Department of Transportation: Springfield, IL.
Illinois Department of Transportation (IDOT). 2014a. Letting (June 13, 2014). “Item 31—Contract 60Y04.” http://eplan.dot.il.gov/desenv/061314/60Y04-031/. Illinois Department of Transportation: Springfield, IL.
Illinois Department of Transportation (IDOT). 2014b. Letting (June 13, 2014). “Item 16—Contract 60N08.” http://eplan.dot.il.gov/desenv/061314/60N08-016/. Illinois Department of Transportation: Springfield, IL.
Illinois Department of Transportation (IDOT). 2014c. Letting (June 13, 2014). “Item 15—Contract 60N07.” http://eplan.dot.il.gov/desenv/061314/60N07-015/. Illinois Department of Transportation: Springfield, IL.
Illinois Department of Transportation (IDOT). 2015. Manual of Test Procedures for Materials. Revised January 23, 2015. Illinois Department of Transportation, Bureau of Materials and Physical Research: Springfield, IL.
Lippert, D.L., H. Ozer, I.L. Al-Qadi, A.K. El-Khatib, R. Yang, T.U. Kang, A.Z. Dahhan, J.W. Vespa, and J.S. Trepanier. 2014 (Aug.). Illinois Highway Materials Sustainability Efforts of 2013. Research Report No. FHWA-ICT-14-015. Illinois Center for Transportation: Rantoul, IL.
Lippert, D.L., H. Ozer, I.L. Al-Qadi, J.F. Meister, G. Renshaw, T. Khan, T.R. Murphy, J.S. Trepanier, and J.W. Vespa. 2016 (Feb.). Construction and Performance Monitoring of Various Asphalt Mixes in Illinois: 2015 Interim Report. Research Report No. FHWA-ICT-16-009. Illinois Center for Transportation: Rantoul, IL.
Ozer, H., Al-Qadi, I. L., Lambros, J., El-Khatib, A., Singhvi, P., & Doll, B. (2016a). Development of the fracture-based flexibility index for asphalt concrete cracking potential using modified semi-circle bending test parameters. Construction and Building Materials, 115, 390-401.
Ozer, H., and P. Singhvi, T. Khan, J. Rivera, I. L. Al-Qadi. (2016b). Fracture Characterization of Asphalt Mixtures with RAP and RAS using the Illinois Semi-Circular Bending Test Method and Flexibility Index. Transportation Research Record: Journal of the Transportation Research Board, 2575, 130-137.

55
Punith, V.S., S.N., Suresha, S. Raju, S. Bose, and A. Veeraragavan, 2012. Laboratory Investigation of Open-Graded Friction-Course Mixtures Containing Polymers and Cellulose Fibers. Journal of Transportation Engineering, Vol. 138, pp. 67-74.
Shukla, P.K. and A. Das, 2008. A Re-visit to the Development of Fatigue and Rutting Equations Used for Asphalt Pavement Design. International Journal of Pavement Engineering, Vol. 9, pp. 355-364.

56
APPENDIX A: EXISTING AND PROPOSED CROSS-SECTIONS

57
APPENDIX A-1: WASHINGTON STREET
SEGMENT 1: WESTERN FIVE-LANE SECTION
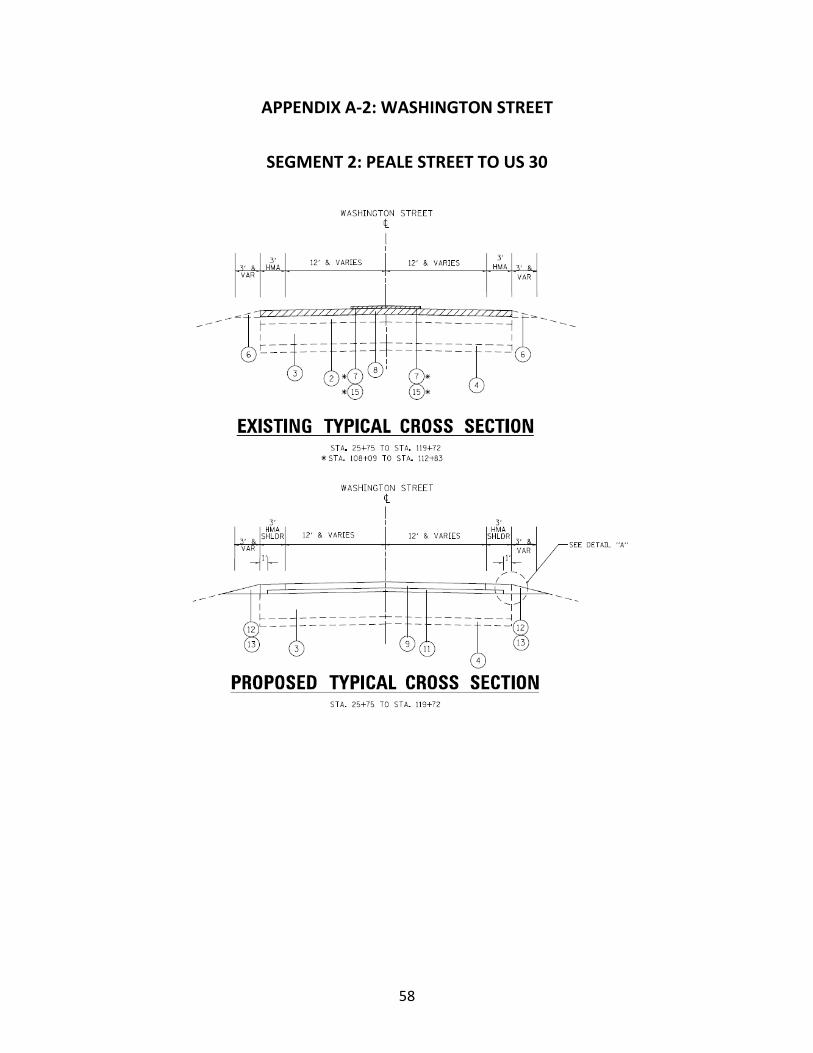
58
APPENDIX A-2: WASHINGTON STREET
SEGMENT 2: PEALE STREET TO US 30
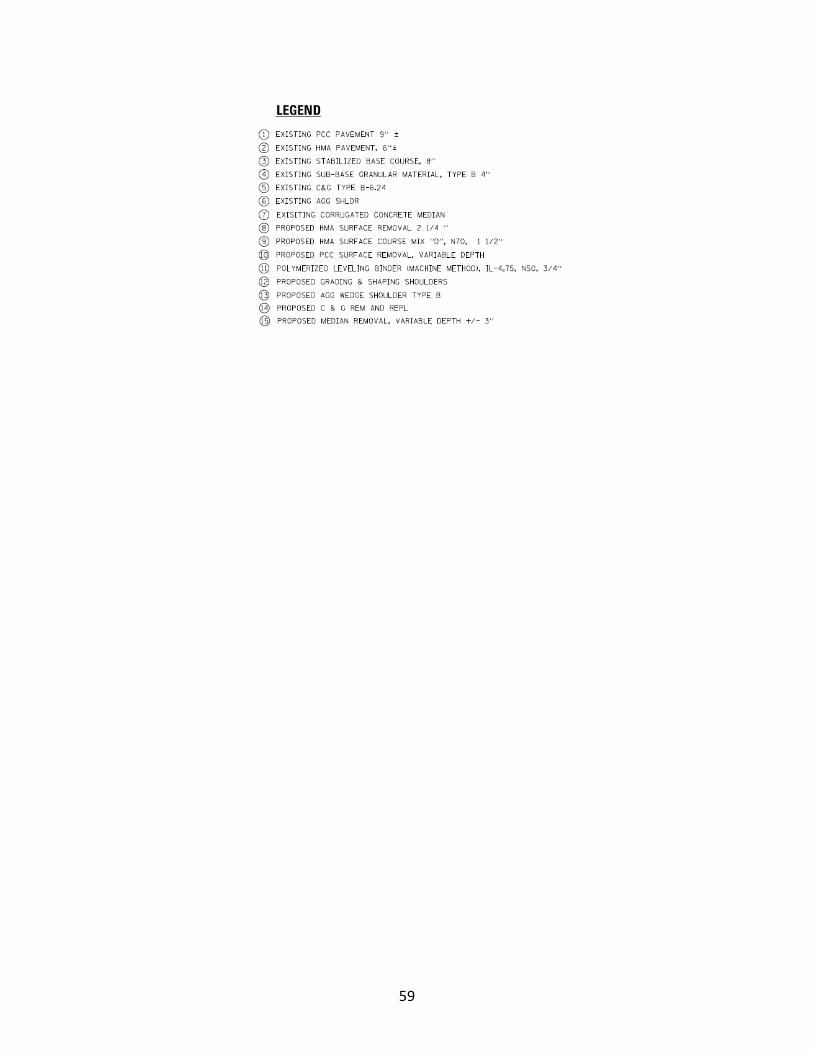
59

60
APPENDIX A-3: US 52 (LARAWAY ROAD TO GOUGER ROAD)
RURAL CROSS-SECTION

61

62
APPENDIX A-4: US 52 (LARAWAY ROAD TO GOUGER ROAD)
CURB AND GUTTER CROSS-SECTION
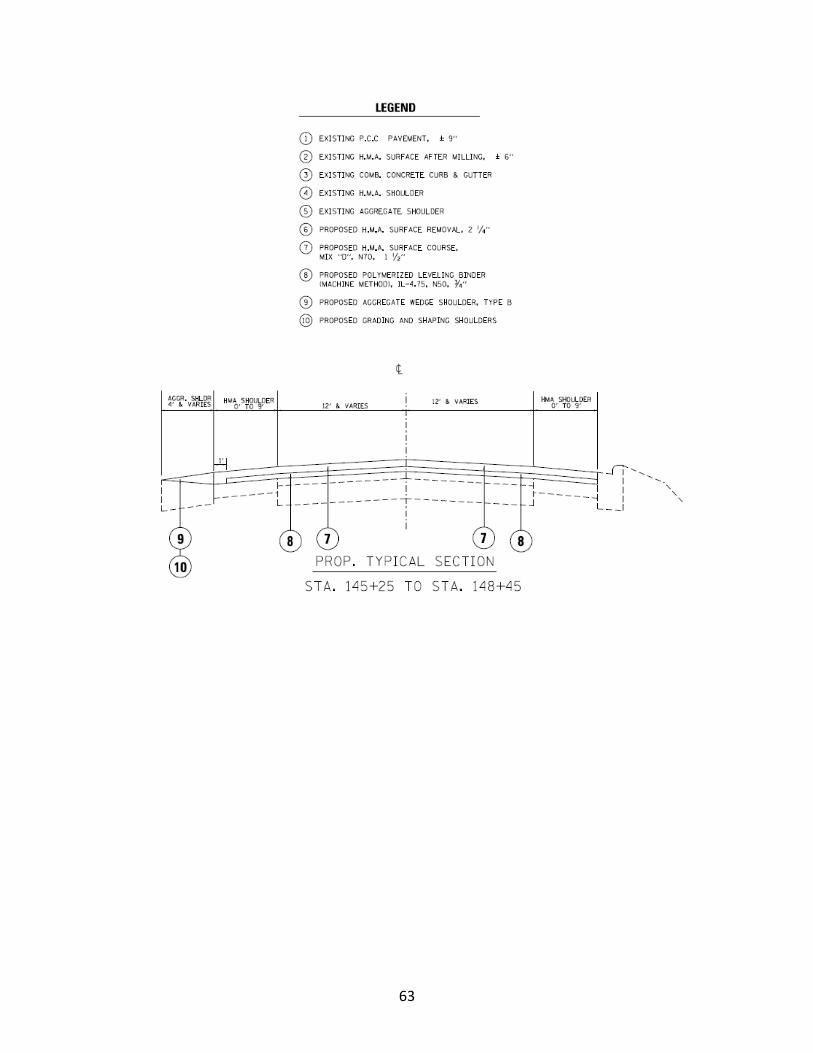
63
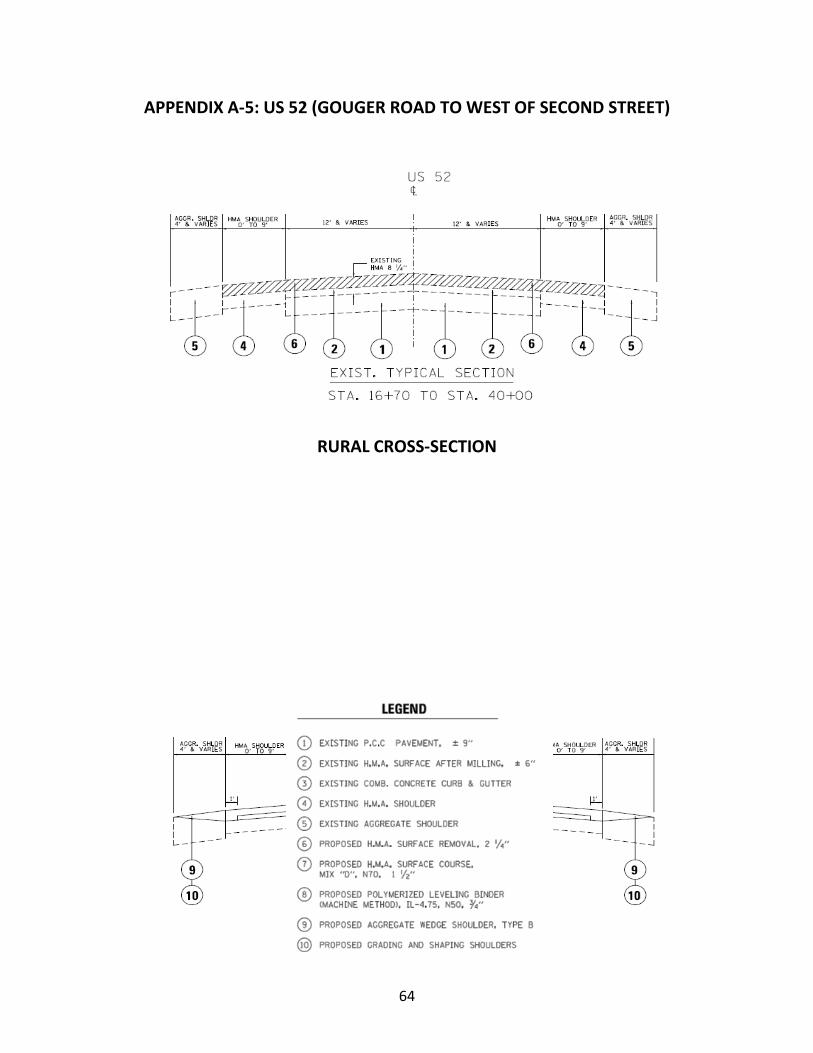
64
APPENDIX A-5: US 52 (GOUGER ROAD TO WEST OF SECOND STREET)
RURAL CROSS-SECTION

65
APPENDIX A-6: US 52 (GOUGER ROAD TO WEST OF SECOND STREET)
CURB AND GUTTER CROSS-SECTION

66
APPENDIX B: DISTRESS SURVEY SUMMARIES

67
APPENDIX B-1: WASHINGTON STREET, SEGMENT 1
DISTRESS SUMMARY
Low Med High Total Low Med High Total Low Med High Total Low Med High Total
Alligator or Fatigue Cracking Lane-Feet - - - - - - - - - - - - -
Block Cracking Lane-Feet - - - - - - - - - - - - -
Centerline Cracking Linear Feet - - - - - - - - - - - - -
Longitudinal Cracking Linear Feet - - - - - - - - - - - - -
Overlaid Patch Detertoration Square Feet - - - - - - - - - - - - -
Permanent Patch Deterioration Square Feet - - - - - - - - - - - - -
Pothole and Localized Distress Each - - - - - - - - - - - - -
Raveling/Weathering/Segregation Lane-Feet - - - - - - - - - - - - -
Transverse Cracking Linear Feet* 372 120 130 622 - - - - 165 - - 165 -
* Linear feet of cracking measured in lieu of occurrences Note: Data is from Lane 1 from Sta 25+66 to 20+00 and Lane 2 from Sta 22+00 to 20+00 - Excludes Tapers
Lane-Feet in Segment = 766 Lane Feet Centerline Joint Feet in Segment = 766 Feet
Low Med High Total Low Med High Total Low Med High Total Low Med High Total
Alligator or Fatigue Cracking Lane-Feet - - - - - - - - - - - - - - - -
Block Cracking Lane-Feet - - - - - - - - - - - - - - - -
Centerline Cracking Linear Feet - - - - - - - - - - - - - - - -
Longitudinal Cracking Linear Feet - - - - - - - - - - - - - - - -
Overlaid Patch Detertoration Square Feet - - - - - - - - - - - - - - - -
Permanent Patch Deterioration Square Feet - - - - - - - - - - - - - - - -
Pothole and Localized Distress Each - - - - - - - - - - - - - - - -
Raveling/Weathering/Segregation Lane-Feet - - - - - - - - - - - - - - - -
Transverse Cracking Linear Feet* 373 127 239 739 12 - - 12 161 - - 161 - - - -
* Linear feet of cracking measured in lieu of occurrences Note: Data is from Lane 1 from Sta 25+66 to 20+00 and Lane 2 from Sta 22+00 to 20+00 - Excludes Tapers
Lane-Feet in Segment = 766 Lane Feet Centerline Joint Feet in Segment = 766 Feet
Washington Street Segment 1 East Bound (30% ABR - RAP Only)- Distress Level Summary
Distress Type Unit
Pre Overlay (2014) Post Overlay (2015) Spring 2016 (After 1 Winter) Spring 2017 (After 2 Winters)
Washington Street Segment 1 West Bound (30% ABR - RAP + RAS)- Distress Level Summary
Distress Type Unit
Pre Overlay (2014) Post Overlay (2015) Spring 2016 (After 1 Winter) Spring 2017 (After 2 Winters)
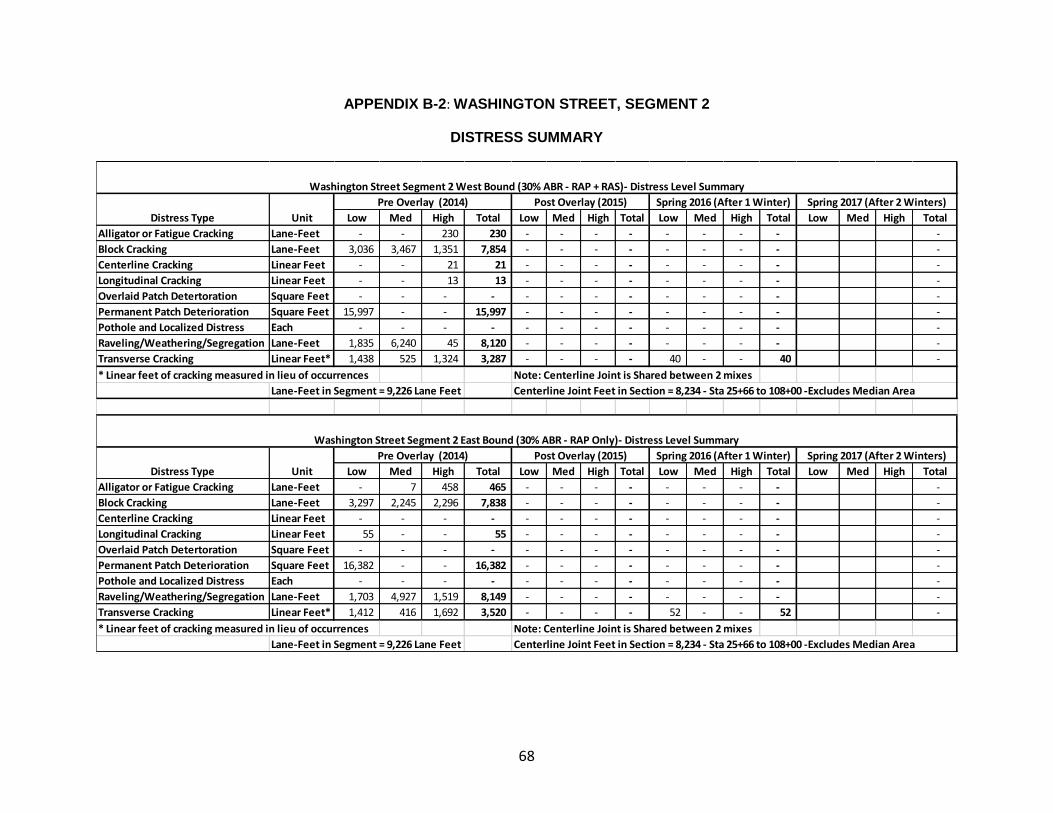
68
APPENDIX B-2: WASHINGTON STREET, SEGMENT 2
DISTRESS SUMMARY
Low Med High Total Low Med High Total Low Med High Total Low Med High Total
Alligator or Fatigue Cracking Lane-Feet - - 230 230 - - - - - - - - -
Block Cracking Lane-Feet 3,036 3,467 1,351 7,854 - - - - - - - - -
Centerline Cracking Linear Feet - - 21 21 - - - - - - - - -
Longitudinal Cracking Linear Feet - - 13 13 - - - - - - - - -
Overlaid Patch Detertoration Square Feet - - - - - - - - - - - - -
Permanent Patch Deterioration Square Feet 15,997 - - 15,997 - - - - - - - - -
Pothole and Localized Distress Each - - - - - - - - - - - - -
Raveling/Weathering/Segregation Lane-Feet 1,835 6,240 45 8,120 - - - - - - - - -
Transverse Cracking Linear Feet* 1,438 525 1,324 3,287 - - - - 40 - - 40 -
* Linear feet of cracking measured in lieu of occurrences Note: Centerline Joint is Shared between 2 mixes
Lane-Feet in Segment = 9,226 Lane Feet Centerline Joint Feet in Section = 8,234 - Sta 25+66 to 108+00 -Excludes Median Area
Low Med High Total Low Med High Total Low Med High Total Low Med High Total
Alligator or Fatigue Cracking Lane-Feet - 7 458 465 - - - - - - - - -
Block Cracking Lane-Feet 3,297 2,245 2,296 7,838 - - - - - - - - -
Centerline Cracking Linear Feet - - - - - - - - - - - - -
Longitudinal Cracking Linear Feet 55 - - 55 - - - - - - - - -
Overlaid Patch Detertoration Square Feet - - - - - - - - - - - - -
Permanent Patch Deterioration Square Feet 16,382 - - 16,382 - - - - - - - - -
Pothole and Localized Distress Each - - - - - - - - - - - - -
Raveling/Weathering/Segregation Lane-Feet 1,703 4,927 1,519 8,149 - - - - - - - - -
Transverse Cracking Linear Feet* 1,412 416 1,692 3,520 - - - - 52 - - 52 -
* Linear feet of cracking measured in lieu of occurrences Note: Centerline Joint is Shared between 2 mixes
Lane-Feet in Segment = 9,226 Lane Feet Centerline Joint Feet in Section = 8,234 - Sta 25+66 to 108+00 -Excludes Median Area
Washington Street Segment 2 East Bound (30% ABR - RAP Only)- Distress Level Summary
Distress Type Unit
Pre Overlay (2014) Post Overlay (2015) Spring 2016 (After 1 Winter) Spring 2017 (After 2 Winters)
Washington Street Segment 2 West Bound (30% ABR - RAP + RAS)- Distress Level Summary
Distress Type Unit
Pre Overlay (2014) Post Overlay (2015) Spring 2016 (After 1 Winter) Spring 2017 (After 2 Winters)

69
APPENDIX B-3: US 52 (LARAWAY ROAD TO GOUGER)
DISTRESS SUMMARY
Low Med High Total Low Med High Total Low Med High Total Low Med High Total
Alligator or Fatigue Cracking Lane-Feet 81 1,319 788 2,188 - - - - - - - - - - - -
Block Cracking Lane-Feet 20,145 13,495 - 33,640 - - - - - - - - - - - -
Centerline Cracking Linear Feet - 17,220 - 17,220 - - - - - - - - - - - -
Center of Lane Cracking Linear Feet 47 - - - - - - - - - - - - -
Longitudinal Cracking Linear Feet 3,033 60 94 3,187 - - - - 6 - - 6 - - - -
Overlaid Patch Detertoration Square Feet 498 - - 498 - - - - - - - - - - - -
Permanent Patch Deterioration Square Feet 16,518 256 4,441 21,215 - - - - - - - - - - - -
Pothole and Localized Distress Each 5 - 1 6 - - - - - - - - - - - -
Raveling/Weathering/Segregation Lane-Feet 1,500 32,140 - 33,640 - - - - 69 - - 69 - - - -
Transverse Cracking Linear Feet* 5,108 9,513 762 15,383 12 - - 12 144 - - 144 - - - -
* Linear feet of cracking measured in lieu of occurrences
Lane Feet in Section = 35,788 Centerline Joint Feet in Section = 17,894
Spring 2016 Distress Level Spring 2017 Distress Level
US 52 (Laraway Road to Gouger) - Both Directions Combined
48% ABR, PG 52-34 w/ RAP and RAS Total Recycle Asphalt - Surface Mix: 81BIT185M
Distress Type Unit
Pre Overlay Distress Level (2014) Post Overlay Distress Level (2015)
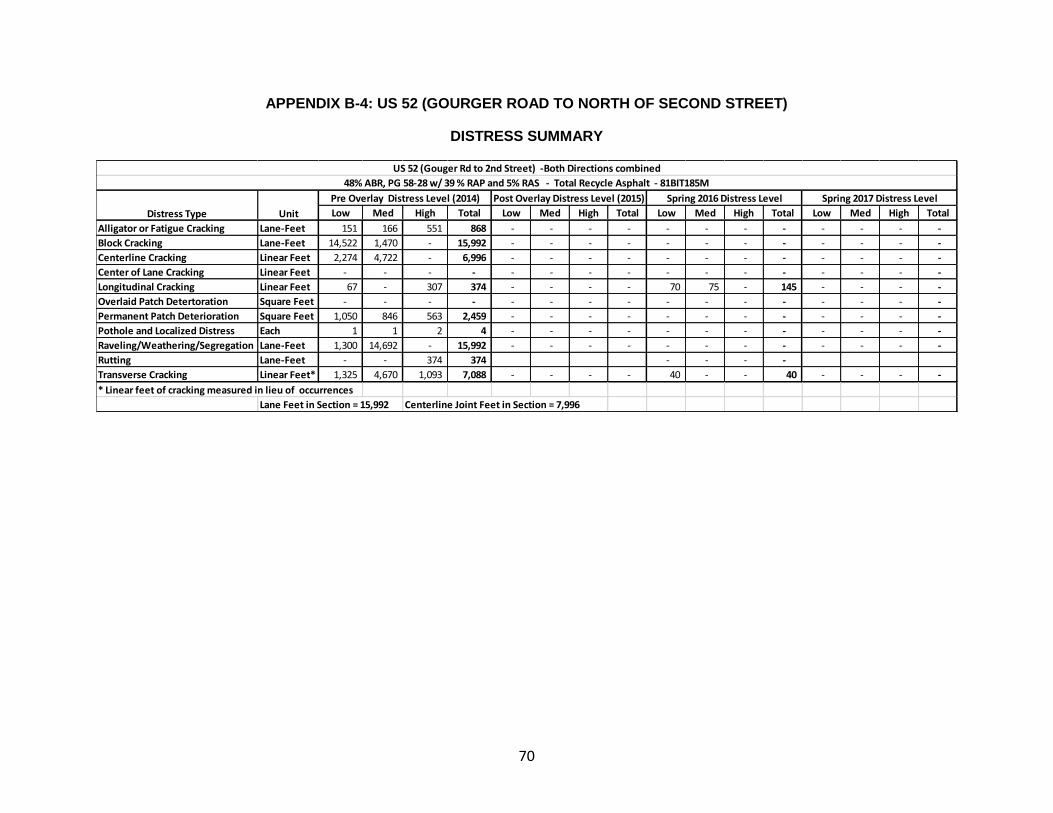
70
APPENDIX B-4: US 52 (GOURGER ROAD TO NORTH OF SECOND STREET)
DISTRESS SUMMARY
Low Med High Total Low Med High Total Low Med High Total Low Med High Total
Alligator or Fatigue Cracking Lane-Feet 151 166 551 868 - - - - - - - - - - - -
Block Cracking Lane-Feet 14,522 1,470 - 15,992 - - - - - - - - - - - -
Centerline Cracking Linear Feet 2,274 4,722 - 6,996 - - - - - - - - - - - -
Center of Lane Cracking Linear Feet - - - - - - - - - - - - - - - -
Longitudinal Cracking Linear Feet 67 - 307 374 - - - - 70 75 - 145 - - - -
Overlaid Patch Detertoration Square Feet - - - - - - - - - - - - - - - -
Permanent Patch Deterioration Square Feet 1,050 846 563 2,459 - - - - - - - - - - - -
Pothole and Localized Distress Each 1 1 2 4 - - - - - - - - - - - -
Raveling/Weathering/Segregation Lane-Feet 1,300 14,692 - 15,992 - - - - - - - - - - - -
Rutting Lane-Feet - - 374 374 - - - -
Transverse Cracking Linear Feet* 1,325 4,670 1,093 7,088 - - - - 40 - - 40 - - - -
* Linear feet of cracking measured in lieu of occurrences
Lane Feet in Section = 15,992 Centerline Joint Feet in Section = 7,996
Distress Type Unit
Pre Overlay Distress Level (2014) Post Overlay Distress Level (2015) Spring 2016 Distress Level Spring 2017 Distress Level
48% ABR, PG 58-28 w/ 39 % RAP and 5% RAS - Total Recycle Asphalt - 81BIT185M
US 52 (Gouger Rd to 2nd Street) -Both Directions combined

71
APPENDIX B-5: CRAWFORD AVENUE/PULASKI ROAD (SEGMENT 1)
DISTRESS SUMMARY
Low Med High Total Low Med High Total Low Med High Total Low Med High Total
Alligator or Fatigue Cracking Lane-Feet - - - - - - -
Block Cracking Lane-Feet - - - - - - -
Centerline Cracking Linear Feet 19 121 140 - - - - - -
Longitudinal Cracking Linear Feet - - - - - - -
Overlaid Patch Detertoration Square Feet - - - - - - -
Permanent Patch Deterioration Square Feet - - - - - - -
Pothole and Localized Distress Each - - - - - - -
Raveling/Weathering/Segregation Lane-Feet 19 19 - - - - - -
Transverse Cracking Linear Feet* 96 48 324 468 14 - - 14 107 10 12 129 -
* Linear feet of cracking measured in lieu of occurrences
Lane Feet in Section = 607 Centerline Joint Feet in Section = 607 Note Centerline Joint is shared between 2 mixes
Low Med High Total Low Med High Total Low Med High Total Low Med High Total
Alligator or Fatigue Cracking Lane-Feet - - - - - - -
Block Cracking Lane-Feet - - - - - - -
Centerline Cracking Linear Feet - - - - - - -
Longitudinal Cracking Linear Feet - - - - - - -
Overlaid Patch Detertoration Square Feet - - - - - - -
Permanent Patch Deterioration Square Feet - - - - - - -
Pothole and Localized Distress Each - - - - - - -
Raveling/Weathering/Segregation Lane-Feet 19 19 - - - - - -
Transverse Cracking Linear Feet* 180 48 276 504 - - - - 64 - 3 67 -
* Linear feet of cracking measured in lieu of occurrences
Lane Feet in Section = 607 Centerline Joint Feet in Section = 607 Note Centerline Joint is shared between 2 mixes
Crawford Avenue/Pulaski Road - Segment 1 North Bound (15% ABR, PG 64-22 w/ RAP and RAS) Surface Mix: 81BIT156M
Distress Type Unit
Pre Overlay Distress Level (2014) Post Overlay Distress Level (2015) Spring 2016 Distress Level Spring 2017 Distress Level
Crawford Avenue/Pulaski Road - Segment 1 South Bound (30% ABR, PG 58-28 w/ RAP and RAS) Surface Mix: 81BIT157M
Distress Type Unit
Pre Overlay Distress Level (2014) Post Overlay Distress Level (2015) Spring 2016 Distress Level Spring 2017 Distress Level
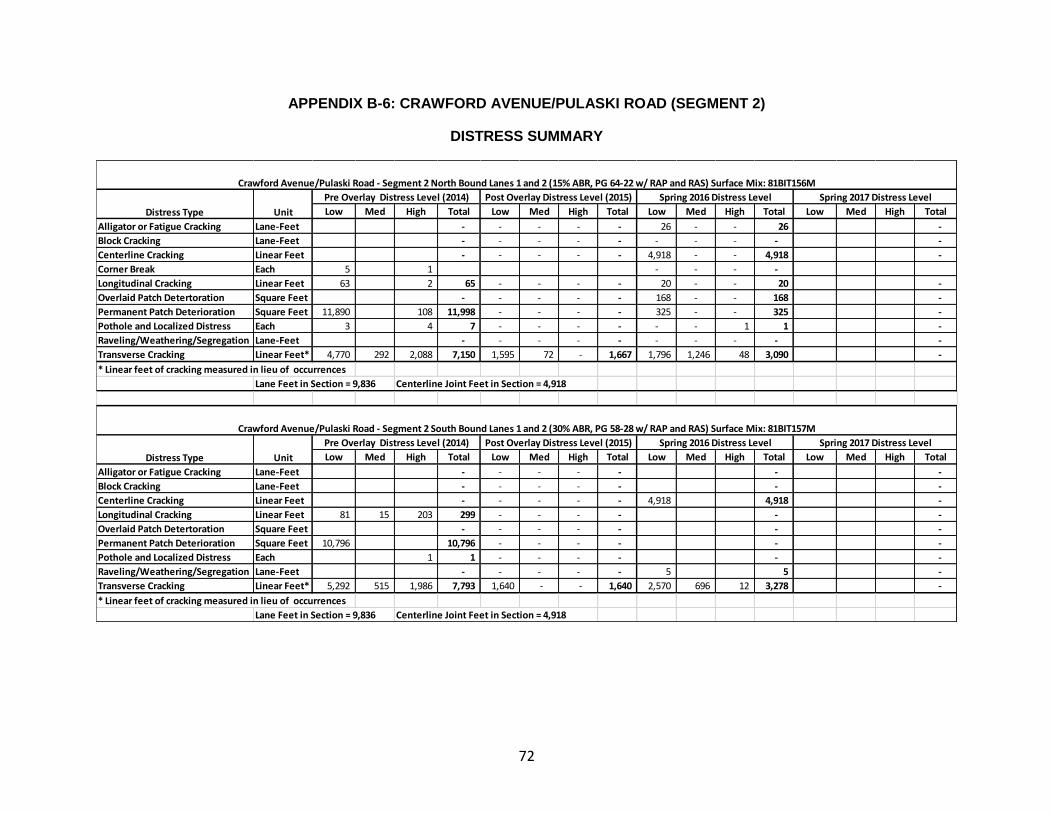
72
APPENDIX B-6: CRAWFORD AVENUE/PULASKI ROAD (SEGMENT 2)
DISTRESS SUMMARY
Low Med High Total Low Med High Total Low Med High Total Low Med High Total
Alligator or Fatigue Cracking Lane-Feet - - - - - 26 - - 26 -
Block Cracking Lane-Feet - - - - - - - - - -
Centerline Cracking Linear Feet - - - - - 4,918 - - 4,918 -
Corner Break Each 5 1 - - - -
Longitudinal Cracking Linear Feet 63 2 65 - - - - 20 - - 20 -
Overlaid Patch Detertoration Square Feet - - - - - 168 - - 168 -
Permanent Patch Deterioration Square Feet 11,890 108 11,998 - - - - 325 - - 325 -
Pothole and Localized Distress Each 3 4 7 - - - - - - 1 1 -
Raveling/Weathering/Segregation Lane-Feet - - - - - - - - - -
Transverse Cracking Linear Feet* 4,770 292 2,088 7,150 1,595 72 - 1,667 1,796 1,246 48 3,090 -
* Linear feet of cracking measured in lieu of occurrences
Lane Feet in Section = 9,836 Centerline Joint Feet in Section = 4,918
Low Med High Total Low Med High Total Low Med High Total Low Med High Total
Alligator or Fatigue Cracking Lane-Feet - - - - - - -
Block Cracking Lane-Feet - - - - - - -
Centerline Cracking Linear Feet - - - - - 4,918 4,918 -
Longitudinal Cracking Linear Feet 81 15 203 299 - - - - - -
Overlaid Patch Detertoration Square Feet - - - - - - -
Permanent Patch Deterioration Square Feet 10,796 10,796 - - - - - -
Pothole and Localized Distress Each 1 1 - - - - - -
Raveling/Weathering/Segregation Lane-Feet - - - - - 5 5 -
Transverse Cracking Linear Feet* 5,292 515 1,986 7,793 1,640 - - 1,640 2,570 696 12 3,278 -
* Linear feet of cracking measured in lieu of occurrences
Lane Feet in Section = 9,836 Centerline Joint Feet in Section = 4,918
Crawford Avenue/Pulaski Road - Segment 2 North Bound Lanes 1 and 2 (15% ABR, PG 64-22 w/ RAP and RAS) Surface Mix: 81BIT156M
Distress Type Unit
Pre Overlay Distress Level (2014) Post Overlay Distress Level (2015) Spring 2016 Distress Level Spring 2017 Distress Level
Crawford Avenue/Pulaski Road - Segment 2 South Bound Lanes 1 and 2 (30% ABR, PG 58-28 w/ RAP and RAS) Surface Mix: 81BIT157M
Distress Type Unit
Pre Overlay Distress Level (2014) Post Overlay Distress Level (2015) Spring 2016 Distress Level Spring 2017 Distress Level

73
APPENDIX B-7: CRAWFORD AVENUE/PULASKI ROAD (SEGMENT 3)
DISTRESS SUMMARY
Low Med High Total Low Med High Total Low Med High Total Low Med High Total
Alligator or Fatigue Cracking Lane-Feet 45 45 - - - - - -
Block Cracking Lane-Feet - - - - - - -
Centerline Cracking Linear Feet 1,585 1,585 200 - - 200 1,305 280 1,585 -
Longitudinal Cracking Linear Feet - - - - - - -
Overlaid Patch Detertoration Square Feet - - - - - - -
Permanent Patch Deterioration Square Feet 1,156 544 1,700 - - - - - -
Pothole and Localized Distress Each - - - - - - -
Raveling/Weathering/Segregation Lane-Feet 3,170 3,170 - - - - - -
Transverse Cracking Linear Feet* 492 592 768 1,852 36 - - 36 562 32 594 -
* Linear feet of cracking measured in lieu of occurrences
Lane Feet in Section = 3,170 Centerline Joint Feet in Section = 1,585
Low Med High Total Low Med High Total Low Med High Total Low Med High Total
Alligator or Fatigue Cracking Lane-Feet 79 79 - - - - 71 71 -
Block Cracking Lane-Feet - - - - - - -
Centerline Cracking Linear Feet 1,585 1,585 895 - - 895 635 550 1,185 -
Longitudinal Cracking Linear Feet - - - - - 4 4 -
Overlaid Patch Detertoration Square Feet - - - - - - -
Permanent Patch Deterioration Square Feet - - - - - - -
Pothole and Localized Distress Each - - - - - - -
Raveling/Weathering/Segregation Lane-Feet 3,170 3,170 - - - - - -
Transverse Cracking Linear Feet* 72 1,488 312 1,872 7 - - 7 628 108 736 -
* Linear feet of cracking measured in lieu of occurrences
Lane Feet in Section = 3,170 Centerline Joint Feet in Section = 1,585
Crawford Avenue/Pulaski Road - Segment 3 North Bound Lanes 1 and 2 (15% ABR, PG 64-22 w/ RAP and RAS) Surface Mix: 81BIT156M
Distress Type Unit
Pre Overlay Distress Level (2014) Post Overlay Distress Level (2015) Spring 2016 Distress Level Spring 2017 Distress Level
Crawford Avenue/Pulaski Road - Segment 3 South Bound Lanes 1 and 2 (30% ABR, PG 58-28 w/ RAP and RAS) Surface Mix: 81BIT157M
Distress Type Unit
Pre Overlay Distress Level (2014) Post Overlay Distress Level (2015) Spring 2016 Distress Level Spring 2017 Distress Level

74
APPENDIX B-8: US 52 FROM CHICAGO STREET (IL 53) TO LARAWAY ROAD (SEGMENT 1)
DISTRESS SUMMARY
Low Med High Total Low Med High Total Low Med High Total Low Med High Total
Alligator or Fatigue Cracking Lane-Feet 156 156 - - - - - -
Block Cracking Lane-Feet 300 894 1,194 - - - - - -
Centerline Cracking Linear Feet 150 447 597 - - - - 30 30 -
Center of Lane Cracking Linear Feet
Longitudinal Cracking Linear Feet 26 26 26 - - 26 - -
Overlaid Patch Detertoration Square Feet - - - - - - -
Permanent Patch Deterioration Square Feet - - - - - - -
Pothole and Localized Distress Each - - - - - - -
Raveling/Weathering/Segregation Lane-Feet 1,194 1,194 - - - - 894 894 -
Transverse Cracking Linear Feet* 204 248 204 656 - - - - - -
* Linear feet of cracking measured in lieu of occurrences
Lane Feet in Section = 1,194 Centerline Joint Feet in Section = 597
Low Med High Total Low Med High Total Low Med High Total Low Med High Total
Alligator or Fatigue Cracking Lane-Feet - - - - - - -
Block Cracking Lane-Feet 1,194 1,194 - - - - - -
Centerline Cracking Linear Feet 597 597 - - - - - -
Center of Lane Cracking Linear Feet
Longitudinal Cracking Linear Feet - - - - - - -
Overlaid Patch Detertoration Square Feet - - - - - - -
Permanent Patch Deterioration Square Feet - - - - - - -
Pothole and Localized Distress Each - - - - - - -
Raveling/Weathering/Segregation Lane-Feet 1,194 1,194 - - - - 1,226 1,226 -
Transverse Cracking Linear Feet* 204 408 120 732 - - - - - -
* Linear feet of cracking measured in lieu of occurrences
Lane Feet in Section = 1,194 Centerline Joint Feet in Section = 597
US 52 (IL 53 to Laraway Road) - Segment 1 West Bound (30% ABR, PG 58-28 w/ RAP only) Surface Mix: 81BIT159M
Distress Type Unit
Pre Overlay Distress Level (2014) Post Overlay Distress Level (2015) Spring 2016 Distress Level Spring 2017 Distress Level
US 52 (IL 53 to Laraway Road) - Segment 1 East Bound (30% ABR, PG 58-28 w/ RAP and RAS) Surface Mix: 81BIT140M
Distress Type Unit
Pre Overlay Distress Level (2014) Post Overlay Distress Level (2015) Spring 2016 Distress Level Spring 2017 Distress Level

75
APPENDIX B-9: US 52 FROM CHICAGO STREET (IL 53) TO LARAWAY ROAD (SEGMENT 2)
DISTRESS SUMMARY
Low Med High Total Low Med High Total Low Med High Total Low Med High Total
Alligator or Fatigue Cracking Lane-Feet 40 371 411 - - - - - -
Block Cracking Lane-Feet 14,674 715 15,389 - - - - - -
Centerline Cracking Linear Feet - - - - - 12,780 12,780 -
Center of Lane Cracking Linear Feet 89
Longitudinal Cracking Linear Feet 7 36 43 - - - - 105 105 -
Overlaid Patch Detertoration Square Feet - - - - - - -
Permanent Patch Deterioration Square Feet 1,934 96 2,030 - - - - - -
Pothole and Localized Distress Each 7 3 10 - - - - - -
Raveling/Weathering/Segregation Lane-Feet 1,000 14,218 171 15,389 22 - - 22 15,418 15,418 -
Transverse Cracking Linear Feet* 2,255 4,336 924 7,515 196 - - 196 772 22 794 -
* Linear feet of cracking measured in lieu of occurrences
Lane Feet in Section = 15,388 Centerline Joint Feet in Section = 15,388 Note Centerline Joint is shared between 2 mixes
Low Med High Total Low Med High Total Low Med High Total Low Med High Total
Alligator or Fatigue Cracking Lane-Feet - - - - - - -
Block Cracking Lane-Feet 14,754 643 15,397 - - - - - -
Centerline Cracking Linear Feet 500 8,925 4,983 14,408 1,078 - - 1,078 - -
Center of Lane Cracking Linear Feet 18
Longitudinal Cracking Linear Feet 225 225 - - - - 55 26 81 -
Overlaid Patch Detertoration Square Feet - - - - - - -
Permanent Patch Deterioration Square Feet 1,500 216 1,716 - - - - - -
Pothole and Localized Distress Each 12 9 4 25 - - - - - -
Raveling/Weathering/Segregation Lane-Feet 1,000 14,397 15,397 53 - - 53 15,418 15,418 -
Transverse Cracking Linear Feet* 2,423 4,680 1,279 8,382 113 - - 113 532 12 544 -
* Linear feet of cracking measured in lieu of occurrences
Lane Feet in Section = 15,388 Centerline Joint Feet in Section = 15,388 Note Centerline Joint is shared between 2 mixes
US 52 (IL 53 to Laraway Road) - Segment 2 West Bound (30% ABR, PG 58-28 w/ RAP only) Surface Mix: 81BIT159M
Distress Type Unit
Pre Overlay Distress Level (2014) Post Overlay Distress Level (2015) Spring 2016 Distress Level Spring 2017 Distress Level
US 52 (IL 53 to Laraway Road) - Segment 2 East Bound (30% ABR, PG 58-28 w/ RAP and RAS) Surface Mix: 81BIT140M
Distress Type Unit
Pre Overlay Distress Level (2014) Post Overlay Distress Level (2015) Spring 2016 Distress Level Spring 2017 Distress Level

76
APPENDIX B-10: US 52 FROM CHICAGO STREET (IL 53) TO LARAWAY ROAD (SEGMENT 3)
DISTRESS SUMMARY
Low Med High Total Low Med High Total Low Med High Total Low Med High Total
Alligator or Fatigue Cracking Lane-Feet - - - - - - -
Block Cracking Lane-Feet 1,361 1,361 - - - - - -
Centerline Cracking Linear Feet - - - - - 165 165 -
Center of Lane Cracking Linear Feet
Longitudinal Cracking Linear Feet - - - - - - -
Overlaid Patch Detertoration Square Feet - - - - - - -
Permanent Patch Deterioration Square Feet 84 168 252 - - - - - -
Pothole and Localized Distress Each 3 1 6 10 - - - - - -
Raveling/Weathering/Segregation Lane-Feet 1,361 1,361 - - - - 1,385 1,385 -
Transverse Cracking Linear Feet* 270 168 168 606 20 - - 20 150 48 12 210 -
* Linear feet of cracking measured in lieu of occurrences
Lane Feet in Section = 1,415 Centerline Joint Feet in Section = 1,415 Note Centerline Joint is shared between 2 mixes
Low Med High Total Low Med High Total Low Med High Total Low Med High Total
Alligator or Fatigue Cracking Lane-Feet - - - - - - -
Block Cracking Lane-Feet 1,361 1,361 - - - - - -
Centerline Cracking Linear Feet 693 693 - - - - - -
Center of Lane Cracking Linear Feet
Longitudinal Cracking Linear Feet - - - - - - -
Overlaid Patch Detertoration Square Feet - - - - - - -
Permanent Patch Deterioration Square Feet 528 228 180 936 - - - - - -
Pothole and Localized Distress Each - 1 2 3 - - - - - -
Raveling/Weathering/Segregation Lane-Feet - 1,361 1,361 - - - - 1,385 1,385 -
Transverse Cracking Linear Feet* 432 294 36 762 24 - - 24 161 12 173 -
* Linear feet of cracking measured in lieu of occurrences
Lane Feet in Section = 1,415 Centerline Joint Feet in Section = 1,415 Note Centerline Joint is shared between 2 mixes
US 52 (IL 53 to Laraway Road) - Segment 3 West Bound (30% ABR, PG 58-28 w/ RAP only) Surface Mix: 81BIT159M
Distress Type Unit
Pre Overlay Distress Level (2014) Post Overlay Distress Level (2015) Spring 2016 Distress Level Spring 2017 Distress Level
US 52 (IL 53 to Laraway Road) - Segment 3 East Bound (30% ABR, PG 58-28 w/ RAP and RAS) Surface Mix: 81BIT140M
Distress Type Unit
Pre Overlay Distress Level (2014) Post Overlay Distress Level (2015) Spring 2016 Distress Level Spring 2017 Distress Level

77
APPENDIX C: AUTOMATED DISTRESS DATA
RUTTING AND INTERNATIONAL ROUGHNESS INDEX (IRI)

78
APPENDIX C-1: 26TH STREET, AUTOMATED DISTRESS DATA, MAY 12, 2016
SPRING 2016 RUTTING AND INTERNATIONAL ROUGHNESS INDEX (IRI), AFTER THREE WINTERS
Mix ABR% RAS RAPVirgin
PG
Left
WP
Right
WPAve.
Left
WP
Right
WPAve.
EB 1(DL) 5/12/20162-Lane HMA Overlay
of PCCN50-TRA 56 Y Y 52-28 152 148 150 0.03 0.06 0.04
WB 1(DL) 5/12/20162-Lane HMA Overlay
of PCCN50-TRA 56 Y Y 52-28 125 134 129 0.04 0.07 0.05
5/12/20162-Lane HMA Overlay
of PCCN50-TRA 56 Y Y 52-28 138 141 140 0.03 0.06 0.05
26th Street
Dir. Lane Test DateOriginal Pavement
Type
Overlay Surface Mix IRI (Inches/Mile) Rut (Inches)
Overall Project

79
APPENDIX C-2: HARRISON STREET, AUTOMATED DISTRESS DATA, MAY 12, 2016
SPRING 2016 RUTTING AND INTERNATIONAL ROUGHNESS INDEX (IRI), AFTER THREE WINTERS
Mix ABR% RAS RAPVirgin
PG
Left
WP
Right
WPAve.
Left
WP
Right
WPAve.
NB/EB 1(DL) 5/12/20162-Lane Overlay of
Full Depth HMAN50-TRA 56 Y Y 52-28 156 270 213 0.04 0.06 0.05
NB/EB 1(DL) 5/12/20162-Lane HMA Overlay
of PCCN50-TRA 56 Y Y 52-28 126 143 135 0.03 0.05 0.04
SB/WB 1(DL) 5/12/20162-Lane Overlay of
Full Depth HMAN50-TRA 56 Y Y 52-28 186 278 232 0.05 0.10 0.07
SB/WB 1(DL) 5/12/20162-Lane HMA Overlay
of PCCN50-TRA 56 Y Y 52-28 120 145 132 0.04 0.06 0.05
5/12/20162-Lane HMA and
HMA overlay of PCCN50-TRA 56 Y Y 52-28 130 162 146 0.04 0.06 0.05
Harrison Street
Dir. Lane Test DateOriginal Pavement
Type
Overlay Surface Mix IRI (Inches/Mile) Rut (Inches)
Overall Project

80
APPENDIX C-3: RICHARDS STREET, AUTOMATED DISTRESS DATA, MAY 12, 2016
SPRING 2016 RUTTING AND INTERNATIONAL ROUGHNESS INDEX (IRI), AFTER THREE WINTERS
Mix ABR% RAS RAPVirgin
PG
Left
WP
Right
WPAve.
Left
WP
Right
WPAve.
NB 1(DL) 5/12/20162-Lane HMA Overlay
of PCCN50-TRA 37 N Y 52-28 118 224 171 0.05 0.07 0.06
NB 2(DL) 5/12/2016 4-Lane Bare PCC N50-TRA 37 N Y 52-28 139 182 161 0.03 0.08 0.06
SB 2(DL) 5/12/2016 4-Lane Bare PCC N50-TRA 37 N Y 52-28 161 128 145 0.07 0.07 0.05
SB 1(DL) 5/12/20162-Lane HMA Overlay
of PCCN50-TRA 37 N Y 52-28 98 167 133 0.07 0.10 0.09
5/12/2016HMA Overlay and
Bare PCCN50-TRA 37 N Y 52-28 123 183 153 0.05 0.08 0.06
Richards Street
Dir. Lane Test DateOriginal Pavement
Type
Overlay Surface Mix IRI (Inches/Mile) Rut (Inches)
Overall Project

81
APPENDIX C-4: WOLF ROAD, AUTOMATED DISTRESS DATA, MAY 12, 2016
SPRING 2016 RUTTING AND INTERNATIONAL ROUGHNESS INDEX (IRI), AFTER THREE WINTERS
Mix ABR% RAS RAPVirgin
PG
Left
WP
Right
WPAve.
Left
WP
Right
WPAve.
NB 1(PL) 5/12/2016 4-Lane Bare PCC N70-20% ABR 20 N Y 64-22 88 111 100 0.02 0.04 0.02
NB 2(DL) 5/12/2016 4-Lane Bare PCC N70-20% ABR 20 N Y 64-22 115 184 149 0.02 0.06 0.04
SB 1(PL) 5/12/2016 4-Lane Bare PCC N70-20% ABR 20 N Y 64-22 69 59 64 0.02 0.03 0.03
SB 2(DL) 5/12/2016 4-Lane Bare PCC N70-20% ABR 20 N Y 64-22 86 123 104 0.01 0.06 0.04
5/12/2016 4-Lane Bare PCC N70-20% ABR 21 N Y 64-22 88 111 100 0.02 0.04 0.03
Wolf Road
Dir. Lane Test DateOriginal Pavement
Type
Overlay Surface Mix IRI (Inches/Mile) Rut (Inches)
Overall Project

82
APPENDIX C-5: CRAWFORD AVENUE/PULASKI ROAD, AUTOMATED DISTRESS DATA, MAY 13, 2016
SPRING 2016 RUTTING AND INTERNATIONAL ROUGHNESS INDEX (IRI), AFTER TWO WINTERS
Mix ABR% RAS RAPVirgin
PG
Left
WP
Right
WPAve.
Left
WP
Right
WPAve.
1 NB 1 5/13/2016 2-Lane Bare PCC N70-15% ABR 15 Y Y 64-22 140 204 172 0.02 0.06 0.04
1 SB 1 5/13/2016 2-Lane Bare PCC N70-30% ABR 30 Y Y 58-28 140 198 169 0.03 0.07 0.05
2 NB 1(PL) 5/13/2016 5-Lane Bare PCC N70-15% ABR 15 Y Y 64-22 106 167 137 0.01 0.05 0.03
2 NB 2(DL) 5/13/2016 5-Lane Bare PCC N70-15% ABR 15 Y Y 64-22 117 194 155 0.02 0.04 0.03
2 SB 1(PL) 5/13/2016 5-Lane Bare PCC N70-30% ABR 30 Y Y 58-28 113 163 138 0.02 0.05 0.03
2 SB 2(DL) 5/13/2016 5-Lane Bare PCC N70-30% ABR 30 Y Y 58-28 100 155 127 0.01 0.04 0.03
3 NB 1(PL) 5/13/20165-Lane HMA Overlay
of PCCN70-15% ABR 15 Y Y 64-22 103 178 141 0.01 0.06 0.04
3 NB 2(DL) 5/13/20165-Lane HMA Overlay
of PCCN70-15% ABR 15 Y Y 64-22 104 154 129 0.02 0.07 0.04
3 SB 1(PL) 5/13/20165-Lane HMA Overlay
of PCCN70-30% ABR 30 Y Y 58-28 117 167 142 0.02 0.06 0.04
3 SB 2(DL) 5/13/20165-Lane HMA Overlay
of PCCN70-30% ABR 30 Y Y 58-28 106 171 136 0.01 0.05 0.03
Direction NB All 5/13/2016 All N70-15% ABR 15 Y Y 64-22 111 178 144 0.01 0.05 0.03
Direction SB All 5/13/2016 All N70-30% ABR 30 Y Y 58-28 109 163 136 0.02 0.05 0.03
Crawford Avenue/Pulaski Road
Segment Dir. Lane Test DateOriginal Pavement
Type
Overlay Surface Mix IRI (Inches/Mile) Rut (Inches)
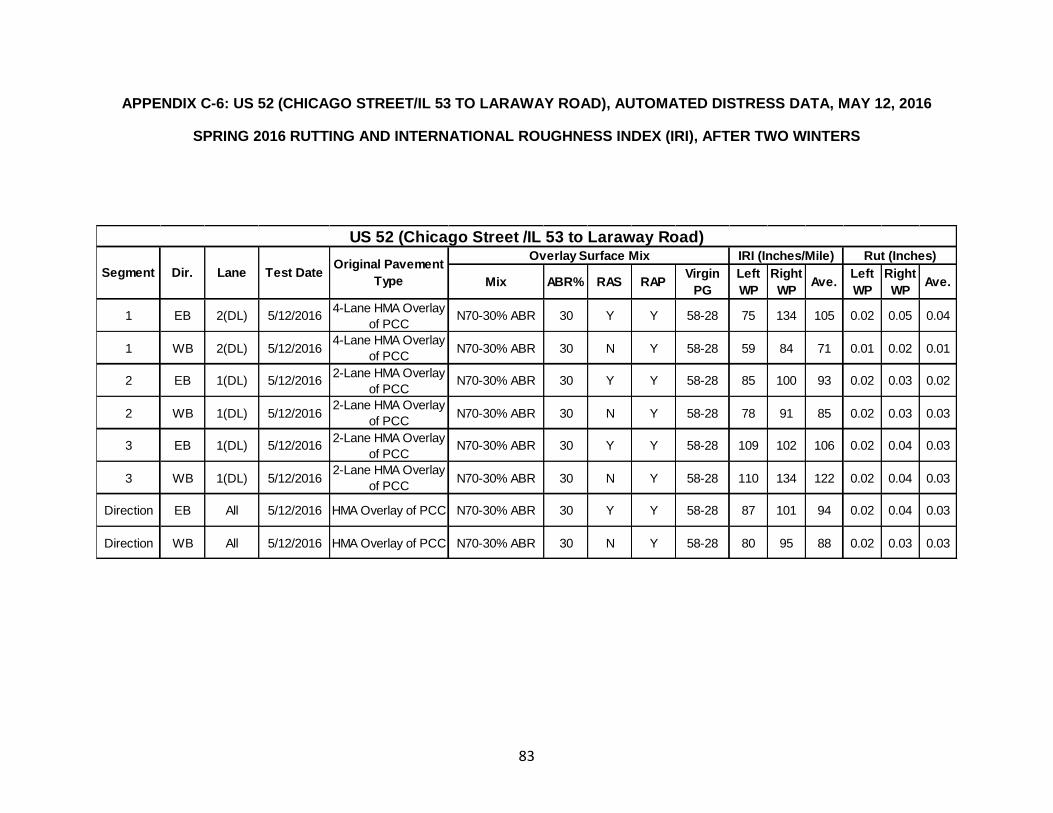
83
APPENDIX C-6: US 52 (CHICAGO STREET/IL 53 TO LARAWAY ROAD), AUTOMATED DISTRESS DATA, MAY 12, 2016
SPRING 2016 RUTTING AND INTERNATIONAL ROUGHNESS INDEX (IRI), AFTER TWO WINTERS
Mix ABR% RAS RAPVirgin
PG
Left
WP
Right
WPAve.
Left
WP
Right
WPAve.
1 EB 2(DL) 5/12/20164-Lane HMA Overlay
of PCCN70-30% ABR 30 Y Y 58-28 75 134 105 0.02 0.05 0.04
1 WB 2(DL) 5/12/20164-Lane HMA Overlay
of PCCN70-30% ABR 30 N Y 58-28 59 84 71 0.01 0.02 0.01
2 EB 1(DL) 5/12/20162-Lane HMA Overlay
of PCCN70-30% ABR 30 Y Y 58-28 85 100 93 0.02 0.03 0.02
2 WB 1(DL) 5/12/20162-Lane HMA Overlay
of PCCN70-30% ABR 30 N Y 58-28 78 91 85 0.02 0.03 0.03
3 EB 1(DL) 5/12/20162-Lane HMA Overlay
of PCCN70-30% ABR 30 Y Y 58-28 109 102 106 0.02 0.04 0.03
3 WB 1(DL) 5/12/20162-Lane HMA Overlay
of PCCN70-30% ABR 30 N Y 58-28 110 134 122 0.02 0.04 0.03
Direction EB All 5/12/2016 HMA Overlay of PCC N70-30% ABR 30 Y Y 58-28 87 101 94 0.02 0.04 0.03
Direction WB All 5/12/2016 HMA Overlay of PCC N70-30% ABR 30 N Y 58-28 80 95 88 0.02 0.03 0.03
US 52 (Chicago Street /IL 53 to Laraway Road)
Segment Dir. Lane Test DateOriginal Pavement
Type
Overlay Surface Mix IRI (Inches/Mile) Rut (Inches)

84
APPENDIX C-7: WASHINGTON STREET, AUTOMATED DISTRESS DATA, NOVEMBER 3, 2015
POST-CONSTRUCTION 2015, RUTTING AND INTERNATIONAL ROUGHNESS INDEX (IRI)
Mix ABR% RAS RAPVirgin
PG
Left
WP
Right
WPAve.
Left
WP
Right
WPAve.
EB 1(DL) 11/03/2015 2-Lane HMA Overlay
of PCCN70-30% ABR 30 Y Y 52-34 75 89 82 0.01 0.01 0.01
WB 1(DL) 11/03/2015 2-Lane HMA Overlay
of PCCN70-30% ABR 30 N Y 52-34 86 94 90 0.01 0.02 0.02
Washington StreetOverlay Surface Mix IRI (Inches/Mile) Rut (Inches)
Original Pavement
TypeDir. Lane Test Date

85
APPENDIX C-8: WASHINGTON STREET, AUTOMATED DISTRESS DATA, FEBRUARY 16, 2016
LATE WINTER 2016 RUTTING AND INTERNATIONAL ROUGHNESS INDEX (IRI), FROZEN CONDITIONS
Mix ABR% RAS RAPVirgin
PG
Left
WP
Right
WPAve.
Left
WP
Right
WPAve.
EB 1(DL) 2/16/20162-Lane HMA Overlay
of PCCN70-30% ABR 30 Y Y 52-34 78 94 86 0.02 0.02 0.02
WB 1(DL) 2/16/20162-Lane HMA Overlay
of PCCN70-30% ABR 30 N Y 52-34 88 98 93 0.03 0.02 0.03
Washington Street
Dir. Lane Test DateOriginal Pavement
Type
Overlay Surface Mix IRI (Inches/Mile) Rut (Inches)

86
APPENDIX C-9: WASHINGTON STREET, AUTOMATED DISTRESS DATA, MAY 11, 2016
SPRING 2016 RUTTING AND INTERNATIONAL ROUGHNESS INDEX (IRI), AFTER FIRST WINTER
Mix ABR% RAS RAPVirgin
PG
Left
WP
Right
WPAve.
Left
WP
Right
WPAve.
EB 1(DL) 5/11/20162-Lane HMA Overlay
of PCCN70-30% ABR 30 Y Y 52-34 76 91 83 0.01 0.03 0.02
WB 1(DL) 5/11/20162-Lane HMA Overlay
of PCCN70-30% ABR 30 N Y 52-34 86 95 91 0.01 0.03 0.02
Washington Street
Dir. Lane Test DateOriginal Pavement
Type
Overlay Surface Mix IRI (Inches/Mile) Rut (Inches)
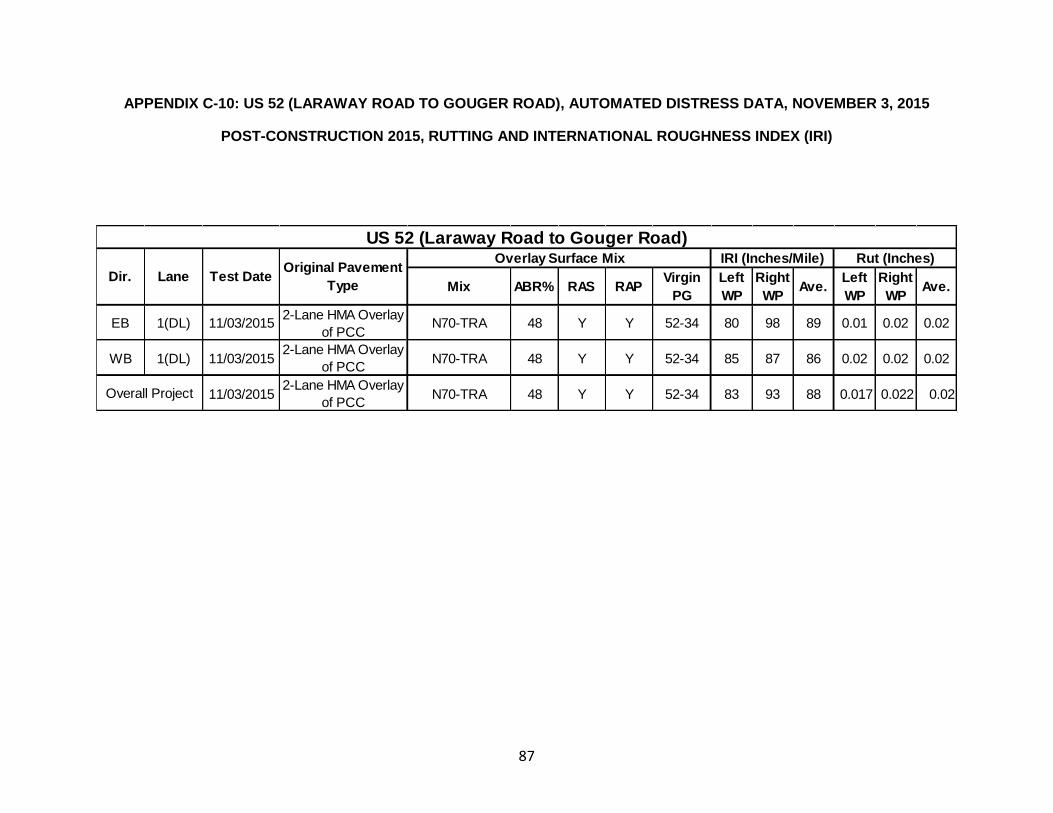
87
APPENDIX C-10: US 52 (LARAWAY ROAD TO GOUGER ROAD), AUTOMATED DISTRESS DATA, NOVEMBER 3, 2015
POST-CONSTRUCTION 2015, RUTTING AND INTERNATIONAL ROUGHNESS INDEX (IRI)
Mix ABR% RAS RAPVirgin
PG
Left
WP
Right
WPAve.
Left
WP
Right
WPAve.
EB 1(DL) 11/03/2015 2-Lane HMA Overlay
of PCCN70-TRA 48 Y Y 52-34 80 98 89 0.01 0.02 0.02
WB 1(DL) 11/03/2015 2-Lane HMA Overlay
of PCCN70-TRA 48 Y Y 52-34 85 87 86 0.02 0.02 0.02
11/03/2015 2-Lane HMA Overlay
of PCCN70-TRA 48 Y Y 52-34 83 93 88 0.017 0.022 0.02Overall Project
US 52 (Laraway Road to Gouger Road)Overlay Surface Mix IRI (Inches/Mile) Rut (Inches)
Original Pavement
TypeTest DateLaneDir.

88
APPENDIX C-11: US 52 (LARAWAY ROAD TO GOUGER ROAD), AUTOMATED DISTRESS DATA, FEBRUARY 17, 2016
LATE WINTER 2016 RUTTING AND INTERNATIONAL ROUGHNESS INDEX (IRI), FROZEN CONDITIONS
Mix ABR% RAS RAPVirgin
PG
Left
WP
Right
WPAve.
Left
WP
Right
WPAve.
EB 1(DL) 2/17/20162-Lane HMA Overlay
of PCCN70-TRA 48 Y Y 52-34 75 94 84 0.01 0.01 0.01
WB 1(DL) 2/17/20162-Lane HMA Overlay
of PCCN70-TRA 48 Y Y 52-34 70 98 84 0.02 0.02 0.02
2/17/20162-Lane HMA Overlay
of PCCN70-TRA 48 Y Y 52-34 73 96 84 0.01 0.02 0.01
US 52 (Laraway Road to Gouger Road)
Dir. Lane Test DateOriginal Pavement
Type
Overlay Surface Mix IRI (Inches/Mile) Rut (Inches)
Overall Project

89
APPENDIX C-12: US 52 (LARAWAY ROAD TO GOUGER ROAD), AUTOMATED DISTRESS DATA, MAY 11, 2016
SPRING 2016, RUTTING AND INTERNATIONAL ROUGHNESS INDEX (IRI), AFTER FIRST WINTER
Mix ABR% RAS RAPVirgin
PG
Left
WP
Right
WPAve.
Left
WP
Right
WPAve.
EB 1(DL) 5/11/20162-Lane HMA Overlay
of PCCN70-TRA 48 Y Y 52-34 84 94 89 0.02 0.04 0.03
WB 1(DL) 5/11/20162-Lane HMA Overlay
of PCCN70-TRA 48 Y Y 52-34 83 85 84 0.02 0.04 0.03
5/11/20162-Lane HMA Overlay
of PCCN70-TRA 48 Y Y 52-34 84 89 86 0.02 0.04 0.03
US 52 (Laraway Road to Gouger Road)
Dir. Lane Test DateOriginal Pavement
Type
Overlay Surface Mix IRI (Inches/Mile) Rut (Inches)
Overall Project

90
APPENDIX C-13: US 52 (GOUGER ROAD TO SECOND STREET), AUTOMATED DISTRESS DATA, NOVEMBER 3, 2015
POST-CONSTRUCTION 2015, RUTTING AND INTERNATIONAL ROUGHNESS INDEX (IRI)
Mix ABR% RAS RAPVirgin
PG
Left
WP
Right
WPAve.
Left
WP
Right
WPAve.
EB 1(DL) 11/03/2015 2-Lane HMA Overlay
of PCCN70-TRA 48 Y Y 58-28 65 82 73 0.01 0.02 0.01
WB 1(DL) 11/03/2015 2-Lane HMA Overlay
of PCCN70-TRA 48 Y Y 58-28 63 85 74 0.01 0.02 0.01
11/03/2015 2-Lane HMA Overlay
of PCCN70-TRA 48 Y Y 58-28 64 83 74 0.014 0.015 0.014
US 52 (Gouger Road to Second Street)Overlay Surface Mix IRI (Inches/Mile) Rut (Inches)
Original Pavement
Type
Overall Project
Test DateLaneDir.

91
APPENDIX C-14: US 52 (GOUGER ROAD TO SECOND STREET), AUTOMATED DISTRESS DATA, FEBRUARY 17, 2016
LATE WINTER 2016, RUTTING AND INTERNATIONAL ROUGHNESS INDEX (IRI), FROZEN CONDITIONS
Mix ABR% RAS RAPVirgin
PG
Left
WP
Right
WPAve.
Left
WP
Right
WPAve.
EB 1(DL) 2/17/20162-Lane HMA Overlay
of PCCN70-TRA 48 Y Y 58-28 87 100 94 0.02 0.02 0.02
WB 1(DL) 2/17/20162-Lane HMA Overlay
of PCCN70-TRA 48 Y Y 58-28 86 93 89 0.03 0.02 0.03
2/17/20162-Lane HMA Overlay
of PCCN70-TRA 48 Y Y 58-28 86 96 91 0.02 0.02 0.02
US 52 (Gouger Road to Second Street)
Dir. Lane Test DateOriginal Pavement
Type
Overlay Surface Mix IRI (Inches/Mile) Rut (Inches)
Overall Project

92
APPENDIX C-15: US 52 (GOUGER ROAD TO SECOND STREET), AUTOMATED DISTRESS DATA, MAY 11, 2016
SPRING 2016, RUTTING AND INTERNATIONAL ROUGHNESS INDEX (IRI), AFTER FIRST WINTER
Mix ABR% RAS RAPVirgin
PG
Left
WP
Right
WPAve.
Left
WP
Right
WPAve.
EB 1(DL) 5/11/20162-Lane HMA Overlay
of PCCN70-TRA 48 Y Y 58-28 67 86 76 0.01 0.02 0.02
WB 1(DL) 5/11/20162-Lane HMA Overlay
of PCCN70-TRA 48 Y Y 58-28 60 87 74 0.01 0.03 0.02
5/11/20162-Lane HMA Overlay
of PCCN70-TRA 48 Y Y 58-28 64 86 75 0.01 0.03 0.02
US 52 (Gouger Road to Second Street)
Dir. Lane Test DateOriginal Pavement
Type
Overlay Surface Mix IRI (Inches/Mile) Rut (Inches)
Overall Project

93
APPENDIX D: PATCHING SCHEDULES

94
APPENDIX D-1: PATCHING SCHEDULE US 52 (LARAWAY ROAD TO GOUGAR ROAD)
CONTRACT 60N08 US
Patch Number
Patch Station Direction Lane
Width (Feet)
Length (Feet)
Area (Sq. Yds.)
1 27+00 EB 1 9.0 14.0 14.0
2 27+00 WB 1 8.3 14.0 12.9
3 28+50 EB 1 5.0 17.5 9.7
4 40+00 EB 1 12.0 5.0 6.7
5 40+15 EB 1 9.9 7.0 7.7
6 42+50 EB 1 4.0 27.0 12.0
7 53+00 EB 1 8.5 12.5 11.8
8 58+00 EB 1 4.0 21.0 9.3
9 70+00 EB 1 11.0 13.0 15.9
10 70+00 WB 1 10.0 8.5 9.4
11 87+00 EB 1 12.0 10.0 13.3
12 95+00 EB 1 5.0 22.0 12.2
13 101+00 EB 1 12.0 5.0 6.7
14 101+00 WB 1 12.0 11.0 14.7
15 101+00 WB 1 12.0 9.7 12.9
16 110+00 WB 1 12.0 8.0 10.7
17 147+00 EB 1 5.0 40.0 22.2
Total 202.2

95
APPENDIX D-2: PATCHING SCHEDULE US 52 (GOUGER ROAD TO NORTH OF SECOND STREET)
CONTRACT 60N07
Patch Station Direction Lane
Width (Feet)
Length (Feet)
Area (Sq. Yds.)
25+35 EB 1 4 26.40 11.73
27+70 EB 1 4 11.30 5.02
30+50 EB 1 4 52.00 23.11
34+42 EB 1 4 56.80 25.24
36+76 EB 1 4 55.60 24.71
37+68 EB 1 4 38.30 17.02
38+56 EB 1 4 30.90 13.73
87+88 EB 1 7.3 15.00 12.17
84+87 WB 1 8.9 87.10 86.13
35+96 WB 1 4 29.80 13.24
32+17 WB 1 4 78.60 34.93
31+20 WB 1 4 51.00 22.67
28+05 WB 1 4 25.70 11.42
23+50 WB 1 4 24.00 10.67
22+58 WB 1 4 38.00 16.89
Total 328.70

96
APPENDIX E: LEVEL BINDER AND SURFACE COURSE MIX DESIGNS

97
APPENDIX E-1: LEVEL BINDER, WASHINGTON STREET (CONTRACT 60Y04), US 52 (CONTRACTS 60NO7 AND 60NO8) MIX: 81BIT163M: 4.75 LEVEL BINDER – PG 70-28 – 29% ABR W/RAP & RAS

98
APPENDIX E-2: SURFACE MIX 81BIT159M- WASHINGTON STREET (CONTRACT 60Y04), PG 58-34 – 30% ABR W/RAP ONLY

99
APPENDIX E-3: SURFACE MIX 81BIT177M, WASHINGTON STREET (CONTRACT 60Y04), PG 58-34 – 30% ABR W/RAP & RAS

100
APPENDIX E-4: SURFACE MIX 81BIT185M, US 52 (LARAWAY TO NORTH OF SECOND STREET) – 48% ABR W/RAP & RAS US 52 (CONTRACT 60N07) – PG58-28; US 52 (CONTRACT 60N08) – PG52-34

101
APPENDIX F-1: WASHINGTON STREET (60&04), LEVEL BINDER PAVING SEQUENCE N
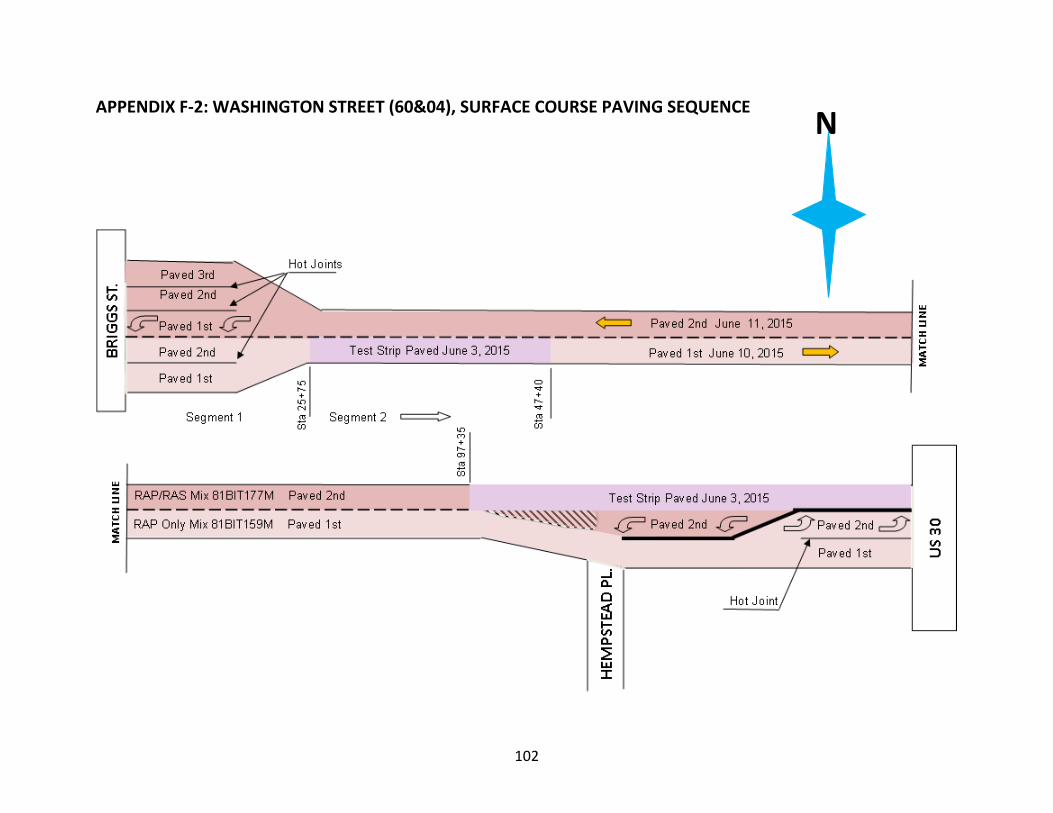
102
APPENDIX F-2: WASHINGTON STREET (60&04), SURFACE COURSE PAVING SEQUENCE N

103
APPENDIX F-3: US 52 (LARAWAY ROAD to GOUGER ROAD), LEVEL BINDER PAVING SEQUENCE
N

104
APPENDIX F-4: US 52 (LARAWAY ROAD to GOUGER ROAD) , SURFACE COURSE PAVING SEQUENCE
N

105
APPENDIX F-5: US 52 (GOUGER ROAD TO SECOND STREET), BINDER COURSE PAVING SEQUENCE (1/2)
N

106
APPENDIX F-6: US 52 (GOUGER ROAD TO SECOND STREET), BINDER COURSE PAVING SEQUENCE (2/2)
N

107
APPENDIX F-7: US 52 (GOUGER ROAD TO SECOND STREET), SURFACE COURSE PAVING SEQUENCE (1/2)
N
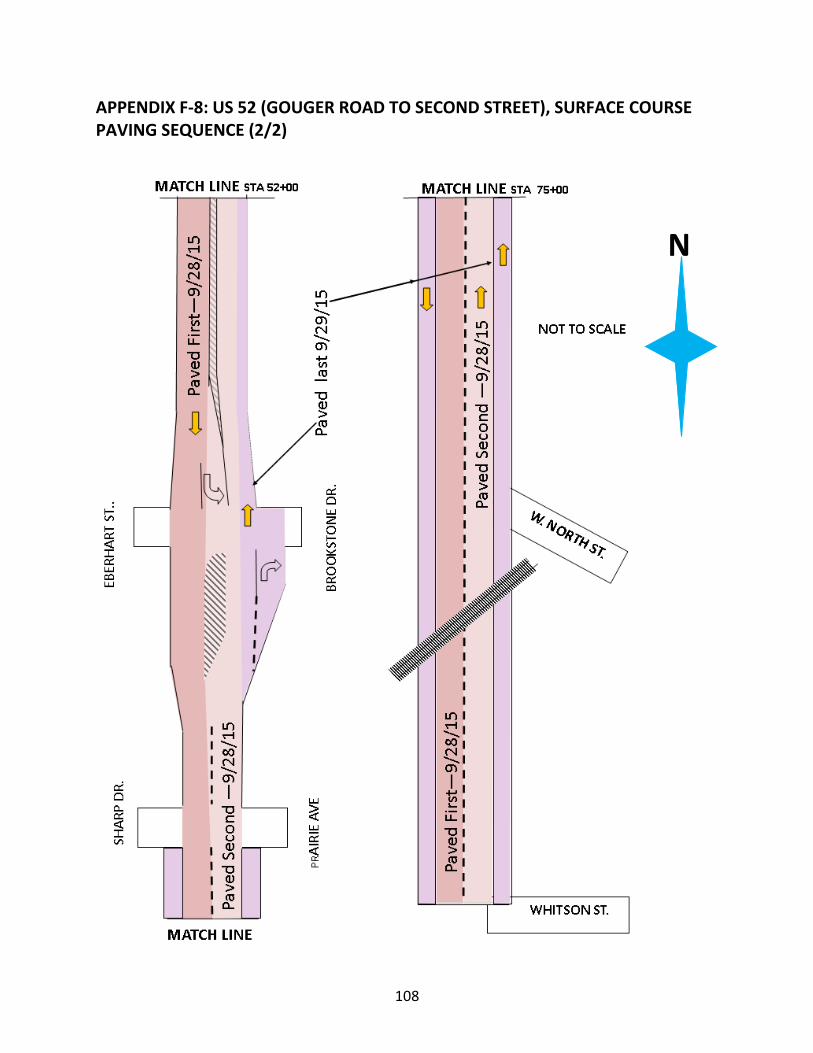
108
APPENDIX F-8: US 52 (GOUGER ROAD TO SECOND STREET), SURFACE COURSE PAVING SEQUENCE (2/2)
N

109
APPENDIX G: LABORATORY TESTING SUMMARIES
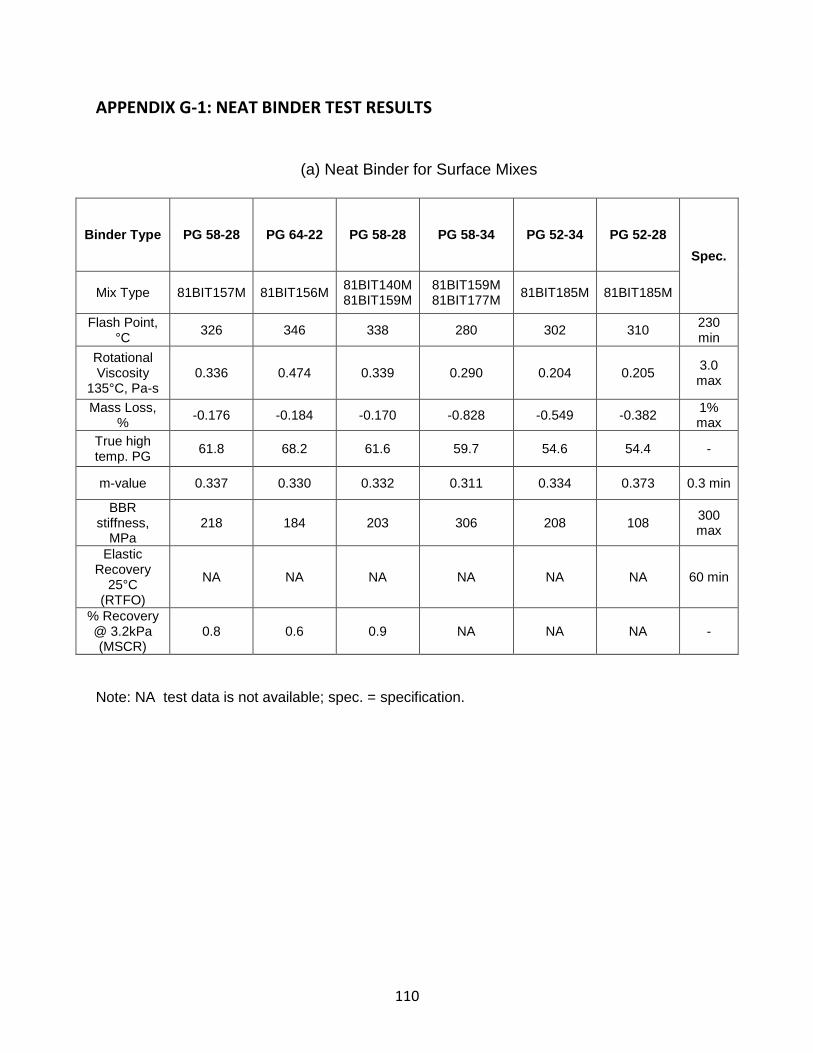
110
APPENDIX G-1: NEAT BINDER TEST RESULTS
(a) Neat Binder for Surface Mixes
Binder Type PG 58-28 PG 64-22 PG 58-28 PG 58-34 PG 52-34 PG 52-28
Spec.
Mix Type 81BIT157M 81BIT156M 81BIT140M 81BIT159M
81BIT159M 81BIT177M
81BIT185M 81BIT185M
Flash Point, °C
326 346 338 280 302 310 230 min
Rotational Viscosity
135°C, Pa-s 0.336 0.474 0.339 0.290 0.204 0.205
3.0 max
Mass Loss, %
-0.176 -0.184 -0.170 -0.828 -0.549 -0.382 1% max
True high temp. PG
61.8 68.2 61.6 59.7 54.6 54.4 -
m-value 0.337 0.330 0.332 0.311 0.334 0.373 0.3 min
BBR stiffness,
MPa 218 184 203 306 208 108
300 max
Elastic Recovery
25°C (RTFO)
NA NA NA NA NA NA 60 min
% Recovery @ 3.2kPa (MSCR)
0.8 0.6 0.9 NA NA NA -
Note: NA test data is not available; spec. = specification.
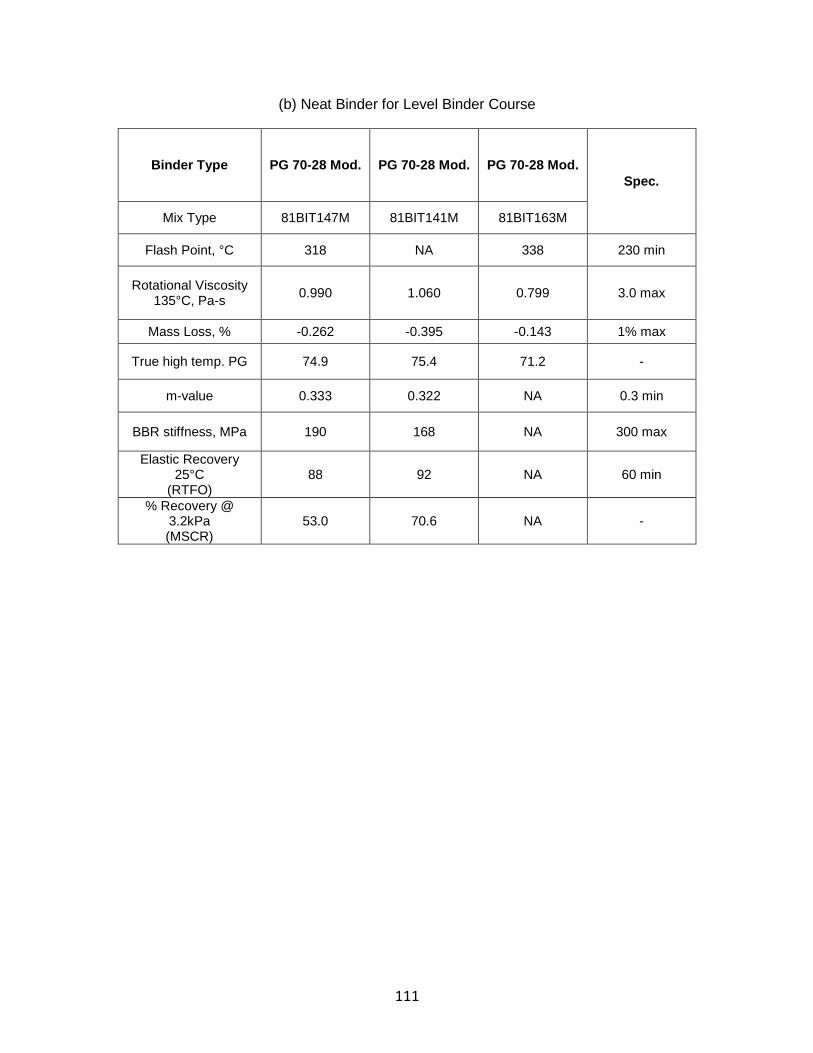
111
(b) Neat Binder for Level Binder Course
Binder Type PG 70-28 Mod. PG 70-28 Mod. PG 70-28 Mod.
Spec.
Mix Type 81BIT147M 81BIT141M 81BIT163M
Flash Point, °C 318 NA 338 230 min
Rotational Viscosity 135°C, Pa-s
0.990 1.060 0.799 3.0 max
Mass Loss, % -0.262 -0.395 -0.143 1% max
True high temp. PG 74.9 75.4 71.2 -
m-value 0.333 0.322 NA 0.3 min
BBR stiffness, MPa 190 168 NA 300 max
Elastic Recovery 25°C
(RTFO) 88 92 NA 60 min
% Recovery @ 3.2kPa (MSCR)
53.0 70.6 NA -
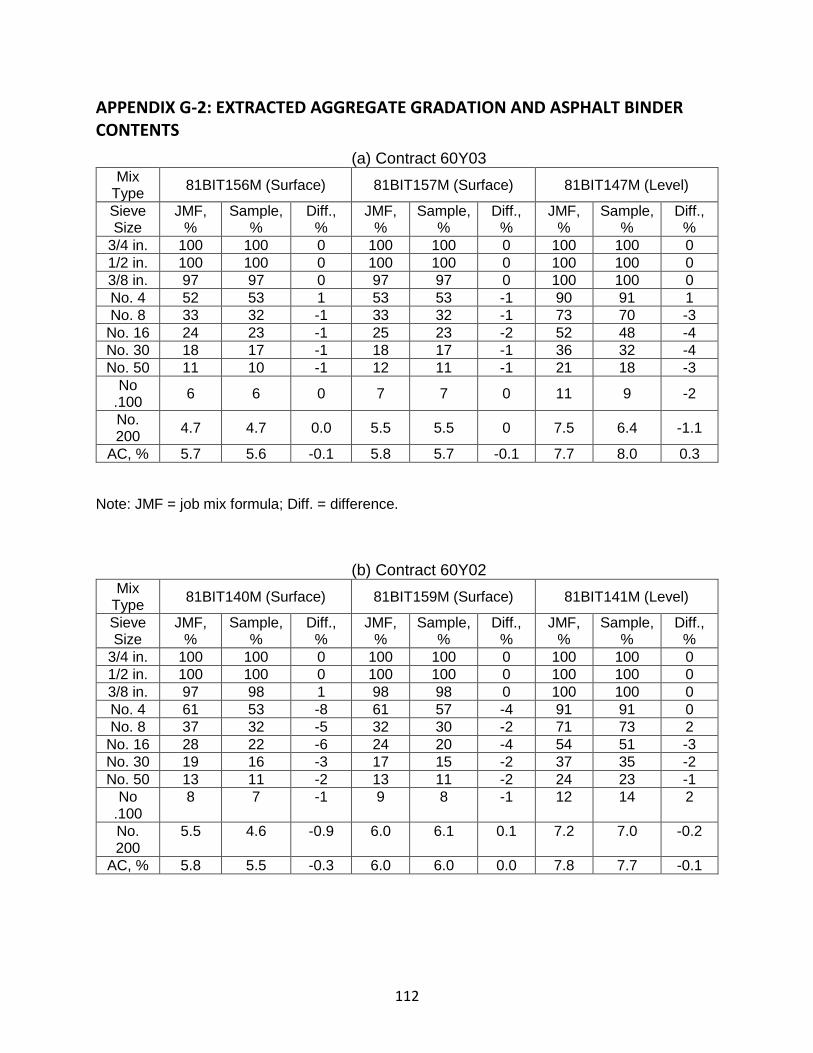
112
APPENDIX G-2: EXTRACTED AGGREGATE GRADATION AND ASPHALT BINDER CONTENTS
(a) Contract 60Y03 Mix
Type 81BIT156M (Surface) 81BIT157M (Surface) 81BIT147M (Level)
Sieve Size
JMF, %
Sample, %
Diff., %
JMF, %
Sample, %
Diff., %
JMF, %
Sample, %
Diff., %
3/4 in. 100 100 0 100 100 0 100 100 0
1/2 in. 100 100 0 100 100 0 100 100 0
3/8 in. 97 97 0 97 97 0 100 100 0
No. 4 52 53 1 53 53 -1 90 91 1
No. 8 33 32 -1 33 32 -1 73 70 -3
No. 16 24 23 -1 25 23 -2 52 48 -4
No. 30 18 17 -1 18 17 -1 36 32 -4
No. 50 11 10 -1 12 11 -1 21 18 -3
No .100
6 6 0 7 7 0 11 9 -2
No. 200
4.7 4.7 0.0 5.5 5.5 0 7.5 6.4 -1.1
AC, % 5.7 5.6 -0.1 5.8 5.7 -0.1 7.7 8.0 0.3
Note: JMF = job mix formula; Diff. = difference.
(b) Contract 60Y02 Mix
Type 81BIT140M (Surface) 81BIT159M (Surface) 81BIT141M (Level)
Sieve Size
JMF, %
Sample, %
Diff., %
JMF, %
Sample, %
Diff., %
JMF, %
Sample, %
Diff., %
3/4 in. 100 100 0 100 100 0 100 100 0
1/2 in. 100 100 0 100 100 0 100 100 0
3/8 in. 97 98 1 98 98 0 100 100 0
No. 4 61 53 -8 61 57 -4 91 91 0
No. 8 37 32 -5 32 30 -2 71 73 2
No. 16 28 22 -6 24 20 -4 54 51 -3
No. 30 19 16 -3 17 15 -2 37 35 -2
No. 50 13 11 -2 13 11 -2 24 23 -1
No .100
8 7 -1 9 8 -1 12 14 2
No. 200
5.5 4.6 -0.9 6.0 6.1 0.1 7.2 7.0 -0.2
AC, % 5.8 5.5 -0.3 6.0 6.0 0.0 7.8 7.7 -0.1

113
(c) Contract 60Y04 Mix
Type 81BIT177M (Surface) 81BIT159M (Surface) 81BIT163M (Level)
Sieve Size
JMF, %
Sample, %
Diff., %
JMF, %
Sample, %
Diff., %
JMF, %
Sample, %
Diff., %
3/4 in. 100 100 0 100 100 0 100 100 0
1/2 in. 100 100 0 100 100 0 100 100 0
3/8 in. 99 97 -2 98 98 0 100 99 -1
No. 4 61 58 -3 61 59 -2 90 84 -6
No. 8 36 36 0 32 29 -3 70 70 0
No. 16 27 26 -1 24 19 -5 55 52 -3
No. 30 19 20 1 17 15 -2 37 37 0
No. 50 13 14 1 13 11 -2 23 22 -1
No .100
9 9 0 9 8 -1 12 12 0
No. 200
6.0 5.7 -0.3 6.0 5.8 -0.2 7.6 6.3 -1.3
AC, % 5.8 6.6 0.8 6.0 6.0 0.0 8.0 8.1 0.1
(d) Contract 60N08 & 60N07 Mix
Type 81BIT185M (Surface) 81BIT163M (Surface) 81BIT185M (Surface)
Sieve Size
JMF, %
Sample, %
Diff., %
JMF, %
Sample, %
Diff., %
JMF, %
Sample, %
Diff., %
3/4 in. 3/4 100 100 3/4 100 100 100 100 0
1/2 in. 1/2 100 100 1/2 100 100 100 99 -1
3/8 in. 3/8 95 95 3/8 100 100 95 95 0
No. 4 #4 54 50 #4 90 88 54 54 0
No. 8 #8 34 31 #8 70 72 34 32 -2
No. 16 #16 25 21 #16 55 52 25 21 -4
No. 30 #30 18 16 #30 37 36 18 15 -3
No. 50 #50 13 12 #50 23 21 13 12 -1
No .100
#100 9 8 #100 12 12 9 9 0
No. 200
#200 6.6 5.8 #200 7.6 6.1 6.6 6.4 -0.2
AC, % AC % 6.4 6.0 AC % 8.0 7.7 6.4 6.3 -0.1

114
APPENDIX G-7: LABORATORY TEST RESULTS ON NEAT ASPHALT BINDERS
PG 70-28 Mod. Not sure of producer
(Level Binder) Mix: 81BIT163M
PG 58-34 Interstate Asphalt
Manistee, MI (Surface Course) Mix: 81BIT159M and 81BIT177M
PG 52-34 Interstate Asphalt
Chicago, Ameropan (Surface Course) Mix 81BIT185M
PG 52-28 Interstate Asphalt
Chicago, Ameropan (Surface Course) Mix: 81BIT185M
Spec: AASHTO M320
Table 1/ IL PG+
Date Sampled 9/10/15 6/10/15 8/6/15 9/28/15
HMA Lab Sample Number
P15-70 P15-14 P15-19 P15-80
Specific Gravity 15.6C 1.028 1.030 1.015 1.025 ----
Flash (C.O.C.), °C 338 280 302 310 230 min.
Rotational Viscosity @ 135°C, Pa-s
0.799
0.290
0.204
0.205
3.0 max.
Mass Loss RTFO, % -0.143 -0.828 -0.549 -0.382 1.00 max.
Original DSR, kPa 1.12 1.24 1.19 1.33 1.00 min.
Phase Angle (delta °) 73.7 85.5 86.5 86.5 ----
RTFO DSR, kPa 3.31 3.57 3.28 2.20 min.
PAV DSR, kPa 3380 2807 2151 5000 max.
BBR, m-value 0.311 0.334 0.373 0.300 min. BBR, Stiffness, MPa 306 208 108 300 max.
Force Ratio @ 4°C (unaged)
NA NA NA 0.30 min.
Elastic Recovery @ 25°C (RTFO), % (ASTM D6084 Proc. A)
NA NA NA 60 min.
Separation of Polymer NA NA NA 2.0 °C max.
True high temp. grade PG 71.2 PG 59.7 PG 54.6 PG 54.4

115
APPENDIX H: PAVEMENT DISTRESS SUMMARIES

116
APPENDIX H-1: 26TH STREET TOTAL RECYCLE ASPHALT SECTION
Low Med High Total Low Med High Total Low Med High Total
Alligator or Fatigue Cracking Lane-Feet 2 - 2 4 - - - - - - - -
Block Cracking Lane-Feet - 125 138 263 - - - - - - - -
Centerline Cracking Linear Feet - - 9,000 9,000 - - - - 1,641 10 7,389 9,040
Longitudinal Cracking Linear Feet 4,600 94 430 5,124 - - - - 288 - - 288
Overlaid Patch Detertoration Square Feet - - 168 168 - - - - - - - -
Permanent Patch Deterioration Square Feet 19,958 720 - 20,678 - - - - - - - -
Pothole and Localized Distress Each - - 1 1 - - - - - 1 10 11
Raveling/Weathering/Segregation Lane-Feet - - - - 4 - - 4 369 10 - 379
Transverse Cracking Linear Feet* 2,362 2,557 4,990 9,909 36 - - 36 3,251 36 - 3,287
Low Med High Total Low Med High Total Low Med High Total
Alligator or Fatigue Cracking Lane-Feet - - -
Block Cracking Lane-Feet 25 25 25 25 -
Centerline Cracking Linear Feet 2073 310 6164 8,547 2,000 7,000 9,000 -
Longitudinal Cracking Linear Feet 397 190 175 762 505 273 368 1,146 -
Overlaid Patch Detertoration Square Feet - - -
Permanent Patch Deterioration Square Feet 944 330 652 1,926 266 1,060 837 2,163 -
Pothole and Localized Distress Each 1 1 1 1 -
Raveling/Weathering/Segregation Lane-Feet 17571 57 372 18,000 16,822 526 652 18,000 -
Transverse Cracking Linear Feet* 3955 1166 58 5,179 3,025 2,741 495 6,261 -
* Linear feet of cracking measured in lieu of occurrences
Lane Feet in Section = 19,000 Centerline Joint Feet in Section = 9,500
Distress Type UnitPre Overlay Distress Level Post Overlay Distress Level Spring 2014 Distress Level
Spring 2015 Distress Level Spring 2016 Distress Level Spring 2017 Distress Level
26th Street
Distress Type Unit

117
APPENDIX H-2: HARRISON STREET TOTAL RECYCLE ASPHALT SECTION
Low Med High Total Low Med High Total Low Med High Total
Alligator or Fatigue Cracking Lane-Feet 202 - 130 332 - - - - - - - -
Block Cracking Lane-Feet - 5,500 500 6,000 - - - - - - - -
Centerline Cracking Linear Feet - 6,000 - 6,000 - - - - 47 - - 47
Longitudinal Cracking Linear Feet - - - - - - - - 497 - - 497
Overlaid Patch Detertoration Square Feet - 336 - 336 - - - - - - - -
Permanent Patch Deterioration Square Feet 314 108 - 422 - - - - - - - -
Pothole and Localized Distress Each - - - - - - - - - - - -
Raveling/Weathering/Segregation Lane-Feet - - - - 4 - - 4 4 - - 4
Transverse Cracking Linear Feet* 969 1,695 3,894 6,558 - - - - 5,472 331 - 5,803
Low Med High Total Low Med High Total Low Med High Total
Alligator or Fatigue Cracking Lane-Feet 567 - - 567 664 664 -
Block Cracking Lane-Feet 9953 36 0 9,989 10,205 113 10,318 -
Centerline Cracking Linear Feet - 3,943 1,980 5,923 3,587 2,336 5,923 -
Longitudinal Cracking Linear Feet 570 - - 570 591 167 11 769 -
Overlaid Patch Detertoration Square Feet - - - - - -
Permanent Patch Deterioration Square Feet - - - - - -
Pothole and Localized Distress Each - - - - 2 2 -
Raveling/Weathering/Segregation Lane-Feet 11846 0 0 11,846 11,846 11,846 -
Transverse Cracking Linear Feet* 3,888 2,347 660 6,895 2,612 3,440 1,247 7,299 -
* Linear feet of cracking measured in lieu of occurrences
Lane Feet in Section = 11,846 Centerline Joint Feet in Section = 5,923
Spring 2016 Distress Level Spring 2017 Distress LevelDistress Type Unit
Distress Type UnitPre Overlay Distress Level Post Overlay Distress Level Spring 2014 Distress Level
Spring 2015 Distress Level
Harrison Street

118
APPENDIX H-3: RICHARDS STREET TOTAL RECYCLE ASPHALT SECTION
Low Med High Total Low Med High Total Low Med High Total
Alligator or Fatigue Cracking Lane-Feet - - 36 36 - - - - 172 - - 172
Asphalt Bleeding Lane-Feet
Block Cracking Lane-Feet 2,016 1,960 7,440 11,416 - - - - - - - -
Centerline Cracking Linear Feet - - 2,942 2,942 - - - - 81 - - 81
Longitudinal Cracking Linear Feet 6 - - 6 - - - - 300 - - 300
Overlaid Patch Detertoration Square Feet 72 - 60 132 - - - - - - - -
Permanent Patch Deterioration Square Feet 19,897 204 420 20,521 - - - - - - - -
Pothole and Localized Distress Each - 2 10 12 - - - - - - - -
Raveling/Weathering/Segregation Lane-Feet - - - - - - - - - - - -
Shoving/Corr Lane-Feet
Transverse Cracking Linear Feet* 6,215 1,464 3,203 10,882 - - - - 720 - - 720
Low Med High Total Low Med High Total Low Med High Total
Alligator or Fatigue Cracking Lane-Feet 154 215 369 412 170 292 874 -
Asphalt Bleeding Lane-Feet 26
Block Cracking Lane-Feet - 20 20 -
Centerline Cracking Linear Feet 6,592 6,592 5,186 1,415 6,601 -
Longitudinal Cracking Linear Feet 285 30 315 815 50 33 898 -
Overlaid Patch Detertoration Square Feet - - -
Permanent Patch Deterioration Square Feet - - -
Pothole and Localized Distress Each - 1 1 2 -
Raveling/Weathering/Segregation Lane-Feet 13,334 13,334 13,485 13,485 -
Shoving/Corr Lane-Feet 7
Transverse Cracking Linear Feet* 2,000 202 36 2,238 2,525 854 24 3,403 -
* Linear feet of cracking measured in lieu of occurrences
Lane Feet in Section = 14,052 Centerline Joint Feet in Section = 7,026
Distress Type UnitSpring 2015 Distress Level Spring 2016 Distress Level Spring 2017 Distress Level
Distress Type UnitPre Overlay Distress Level Post Overlay Distress Level Spring 2014 Distress Level
Richards Road

119
APPENDIX H-4: WOLF ROAD COMPARISON SECTION
Low Med High Total Low Med High Total Low Med High Total
Alligator or Fatigue Cracking Lane-Feet - - - - - - - - - - - -
Block Cracking Lane-Feet - - - - - - - - - - - -
Centerline Cracking Linear Feet - - - - - - - - 52 - - 52
Longitudinal Cracking Linear Feet - - - - - - - - - - - -
Overlaid Patch Detertoration Square Feet - - - - - - - - - - - -
Permanent Patch Deterioration Square Feet 39,144 - - 39,144 - - - - - - - -
Pothole and Localized Distress Each - - - - - - - - - - - -
Raveling/Weathering/Segregation Lane-Feet - - - - - - - - - - - -
Transverse Cracking Linear Feet* 11,058 - - 11,058 - - - - 3,080 108 - 3,188
Low Med High Total Low Med High Total Low Med High Total
Alligator or Fatigue Cracking Lane-Feet - - -
Block Cracking Lane-Feet - - -
Centerline Cracking Linear Feet 52 52 5,055 5,055 -
Longitudinal Cracking Linear Feet - 93 93 -
Overlaid Patch Detertoration Square Feet - - -
Permanent Patch Deterioration Square Feet - - -
Pothole and Localized Distress Each - 1 1 -
Raveling/Weathering/Segregation Lane-Feet - 10,312 10,312 -
Transverse Cracking Linear Feet* 3512 108 3,620 4,898 228 12 5,138 -
* Linear feet of cracking and joints **Estimated from Google street view (2011) survey section length 2470
Lane Feet in Section = 10,112 Centerline Joint Feet in Section = 4,940
Distress Type Unit
Distress Type UnitPre Overlay Distress Level** Post Overlay Distress Level Spring 2014 Distress Level
Spring 2015 Distress Level Spring 2016 Distress Level Spring 2017 Distress Level
Wolf Road

120
APPENDIX I: TOTAL RECYCLE ASPHALT SPECIAL PROVISION

121
TOTAL RECYCLE HOT-MIX ASPHALT (D-1)
Effective: January 28, 2013. Revised: March 1, 2014
Description. This work shall consist of constructing a Hot-Mix Asphalt (HMA) with materials recovered from the waste stream in accordance with IEPA Standards. Work shall be according to Sections 406, 1030, 1031 and 1032 of the Standard Specifications except as modified herein.
This special provision shall supersede other applicable HMA special provisions contained in this contract for the HMA mixes specified on the plans.
Materials. Revise Section 1030.02(a) and (b) of the Standard Specifications to read: “(a) Coarse Aggregate* ..................................................................................... 1004.03 (b) Fine Aggregate** ........................................................................................ 1003.03 (c) RAP Material ............................................................................................... 1031
* Coarse aggregate shall be crushed concrete, crushed slag or crushed steel slag. ** Fine aggregate shall be crushed concrete sand, slag sand or steel slag sand.” Note 1. The use of steel slag will not be allowed in binder course mixes.
Revise Section 1031 of the Standard Specifications to read:
“SECTION 1031. RECLAIMED ASPHALT PAVEMENT AND RECLAIMED ASPHALT
SHINGLES
1031.01 Description. Reclaimed asphalt pavement and reclaimed asphalt shingles shall be according to the following.
(a) Reclaimed Asphalt Pavement (RAP). RAP is the material resulting by cold milling or
crushing an existing hot-mix asphalt (HMA) pavement. RAP will be considered processed FRAP after completion of both crushing and screening to size. The Contractor shall supply written documentation that the RAP originated from routes or airfields under federal, state, or local agency jurisdiction.
(b) Reclaimed Asphalt Shingles (RAS). Reclaimed asphalt shingles (RAS). RAS is from the processing and grinding of preconsumer or post-consumer shingles. RAS shall be a clean and uniform material with a maximum of 0.5 percent unacceptable material, as defined in Bureau of Materials and Physical Research Policy Memorandum “Reclaimed Asphalt Shingle (RAS) Sources,” by weight of RAS. All RAS used shall come from a Bureau of Materials and Physical Research approved processing facility where it shall be ground and processed to 100 percent passing the 3/8 in. (9.5 mm) sieve and 90 percent passing the #4 (4.75 mm) sieve . RAS shall meet the testing requirements specified herein. In addition, RAS shall meet the following Type 1 or Type 2 requirements.
(1) Type 1. Type 1 RAS shall be processed, preconsumer asphalt shingles salvaged from the manufacture of residential asphalt roofing shingles.

122
(2) Type 2. Type 2 RAS shall be processed post-consumer shingles only, salvaged from residential, or four unit or less dwellings not subject to the National Emission Standards for Hazardous Air Pollutants (NESHAP).
1031.02 Stockpiles. RAP and RAS stockpiles shall be according to the following.
(a) RAP Stockpiles. The Contractor shall construct individual, sealed RAP stockpiles
meeting one of the following definitions. Additional processed RAP (FRAP) shall be stockpiled in a separate working pile, as designated in the QC Plan, and only added to the sealed stockpile when test results for the working pile are complete and are found to meet tolerances specified herein for the original sealed FRAP stockpile. Stockpiles shall be sufficiently separated to prevent intermingling at the base. All stockpiles (including unprocessed RAP and FRAP) shall be identified by signs indicating the type as listed below (i.e. “Non- Quality, FRAP -#4 or Type 2 RAS”, etc…).
(1) Fractionated RAP (FRAP). FRAP shall consist of RAP from Class I, Superpave HMA (High and Low ESAL) or equivalent mixtures. The coarse aggregate in FRAP shall be crushed aggregate and may represent more than one aggregate type and/or quality but shall be at least C quality. All FRAP shall be processed prior to testing sized into fractions with the separation occurring on or between the #4 (4.75 mm) and 1/2 in. (12.5 mm) sieves. Agglomerations shall be minimized such that 100 percent of the RAP in the coarse fraction shall pass the maximum sieve size specified for the mix the RAP will be used in.
(2) Restricted FRAP (B quality) stockpiles shall consist of RAP from Class I, Superpave (High ESAL), or HMA (High ESAL). If approved by the Engineer, the aggregate from a maximum 3.0 inch single combined pass of surface/binder milling will be classified as B quality. All millings from this application will be processed into FRAP as described previously.
(3) Conglomerate. Conglomerate RAP stockpiles shall consist of RAP from Class I, Superpave HMA (High and Low ESAL) or equivalent mixtures. The coarse aggregate in this RAP shall be crushed aggregate and may represent more than one aggregate type and/or quality but shall be at least C quality. This RAP may have an inconsistent gradation and/or asphalt binder content prior to processing. All conglomerate RAP shall be processed (FRAP) prior to testing. Conglomerate RAP stockpiles shall not contain steel slag or other expansive material as determined by the Department.
(4) Conglomerate “D” Quality (DQ). Conglomerate DQ RAP stockpiles shall consist of RAP from from HMA shoulders, bituminous stabilized subbases or Superpave (Low ESAL)/HMA (Low ESAL) IL-19.0L binder mixture. The coarse aggregate in this RAP may be crushed or round but shall be at least D quality. This RAP may have an inconsistent gradation and/or asphalt binder content. Conglomerate DQ RAP stockpiles shall not contain steel slag or other expansive material as determined by the Department.
(5) Non-Quality. RAP stockpiles that do not meet the requirements of the stockpile categories listed above shall be classified as “Non-Quality.”
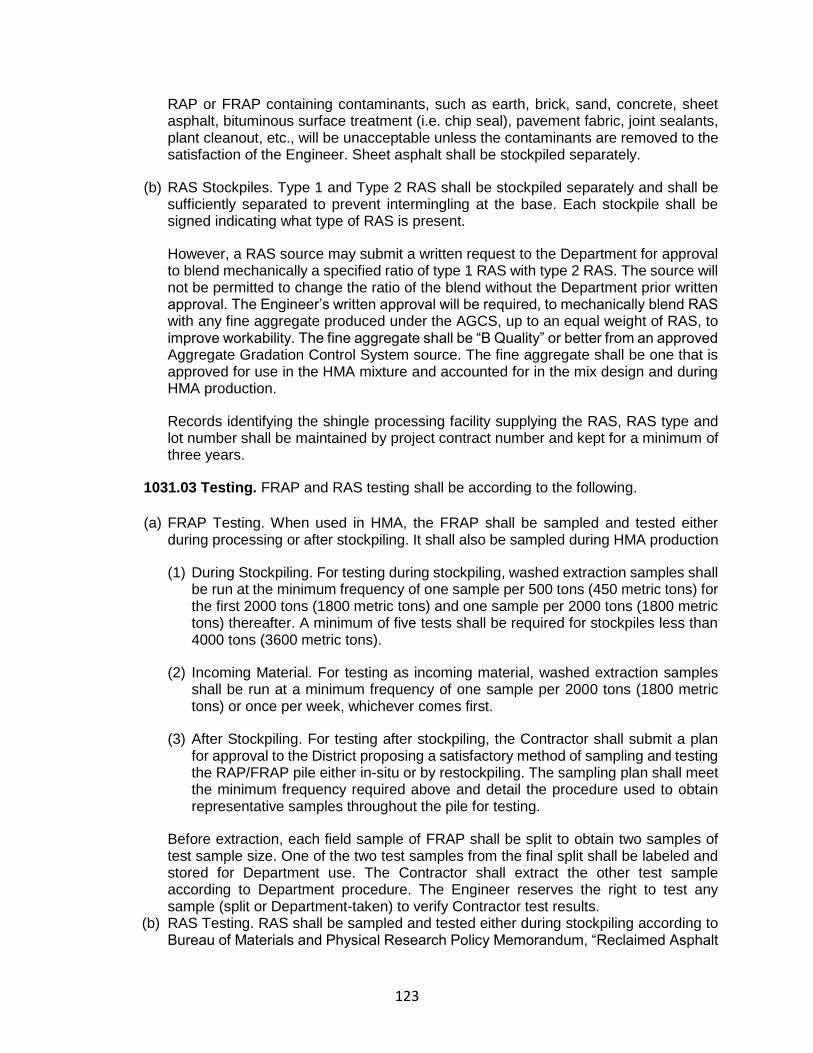
123
RAP or FRAP containing contaminants, such as earth, brick, sand, concrete, sheet asphalt, bituminous surface treatment (i.e. chip seal), pavement fabric, joint sealants, plant cleanout, etc., will be unacceptable unless the contaminants are removed to the satisfaction of the Engineer. Sheet asphalt shall be stockpiled separately.
(b) RAS Stockpiles. Type 1 and Type 2 RAS shall be stockpiled separately and shall be sufficiently separated to prevent intermingling at the base. Each stockpile shall be signed indicating what type of RAS is present.
However, a RAS source may submit a written request to the Department for approval to blend mechanically a specified ratio of type 1 RAS with type 2 RAS. The source will not be permitted to change the ratio of the blend without the Department prior written approval. The Engineer’s written approval will be required, to mechanically blend RAS with any fine aggregate produced under the AGCS, up to an equal weight of RAS, to improve workability. The fine aggregate shall be “B Quality” or better from an approved Aggregate Gradation Control System source. The fine aggregate shall be one that is approved for use in the HMA mixture and accounted for in the mix design and during HMA production.
Records identifying the shingle processing facility supplying the RAS, RAS type and lot number shall be maintained by project contract number and kept for a minimum of three years.
1031.03 Testing. FRAP and RAS testing shall be according to the following.
(a) FRAP Testing. When used in HMA, the FRAP shall be sampled and tested either
during processing or after stockpiling. It shall also be sampled during HMA production
(1) During Stockpiling. For testing during stockpiling, washed extraction samples shall be run at the minimum frequency of one sample per 500 tons (450 metric tons) for the first 2000 tons (1800 metric tons) and one sample per 2000 tons (1800 metric tons) thereafter. A minimum of five tests shall be required for stockpiles less than 4000 tons (3600 metric tons).
(2) Incoming Material. For testing as incoming material, washed extraction samples shall be run at a minimum frequency of one sample per 2000 tons (1800 metric tons) or once per week, whichever comes first.
(3) After Stockpiling. For testing after stockpiling, the Contractor shall submit a plan for approval to the District proposing a satisfactory method of sampling and testing the RAP/FRAP pile either in-situ or by restockpiling. The sampling plan shall meet the minimum frequency required above and detail the procedure used to obtain representative samples throughout the pile for testing.
Before extraction, each field sample of FRAP shall be split to obtain two samples of test sample size. One of the two test samples from the final split shall be labeled and stored for Department use. The Contractor shall extract the other test sample according to Department procedure. The Engineer reserves the right to test any sample (split or Department-taken) to verify Contractor test results.
(b) RAS Testing. RAS shall be sampled and tested either during stockpiling according to Bureau of Materials and Physical Research Policy Memorandum, “Reclaimed Asphalt
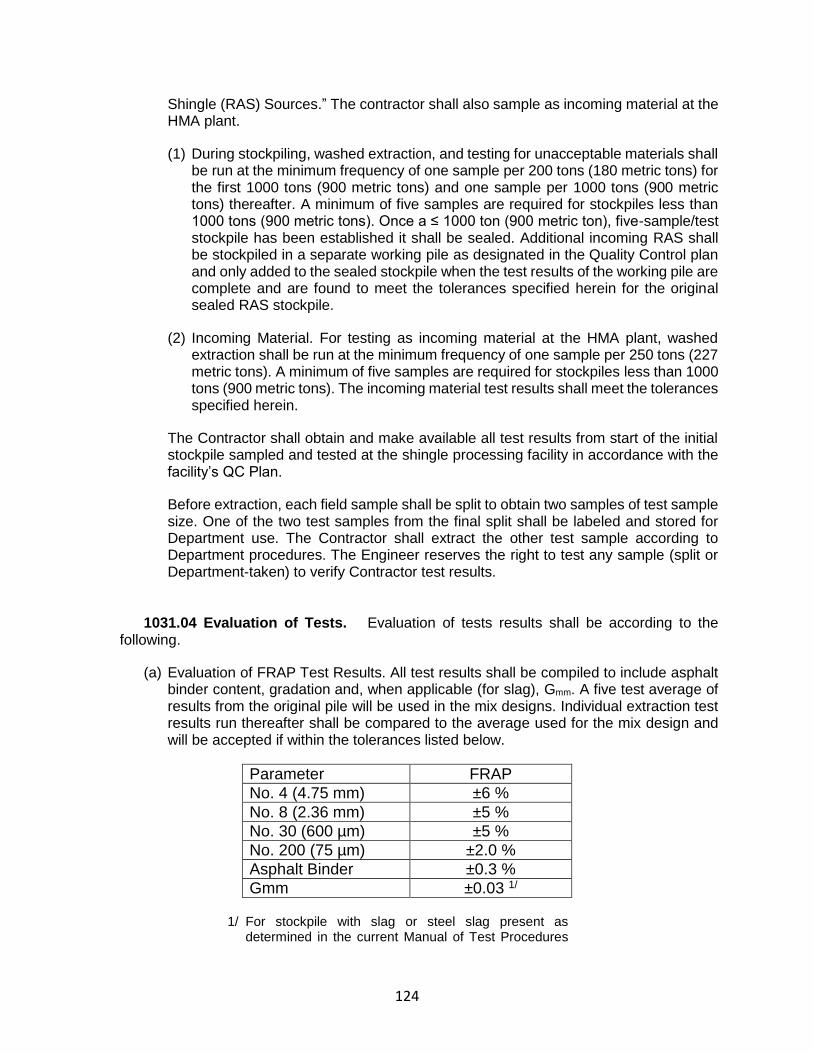
124
Shingle (RAS) Sources.” The contractor shall also sample as incoming material at the HMA plant.
(1) During stockpiling, washed extraction, and testing for unacceptable materials shall be run at the minimum frequency of one sample per 200 tons (180 metric tons) for the first 1000 tons (900 metric tons) and one sample per 1000 tons (900 metric tons) thereafter. A minimum of five samples are required for stockpiles less than 1000 tons (900 metric tons). Once a ≤ 1000 ton (900 metric ton), five-sample/test stockpile has been established it shall be sealed. Additional incoming RAS shall be stockpiled in a separate working pile as designated in the Quality Control plan and only added to the sealed stockpile when the test results of the working pile are complete and are found to meet the tolerances specified herein for the original sealed RAS stockpile.
(2) Incoming Material. For testing as incoming material at the HMA plant, washed extraction shall be run at the minimum frequency of one sample per 250 tons (227 metric tons). A minimum of five samples are required for stockpiles less than 1000 tons (900 metric tons). The incoming material test results shall meet the tolerances specified herein.
The Contractor shall obtain and make available all test results from start of the initial stockpile sampled and tested at the shingle processing facility in accordance with the facility’s QC Plan.
Before extraction, each field sample shall be split to obtain two samples of test sample size. One of the two test samples from the final split shall be labeled and stored for Department use. The Contractor shall extract the other test sample according to Department procedures. The Engineer reserves the right to test any sample (split or Department-taken) to verify Contractor test results.
1031.04 Evaluation of Tests. Evaluation of tests results shall be according to the following.
(a) Evaluation of FRAP Test Results. All test results shall be compiled to include asphalt binder content, gradation and, when applicable (for slag), Gmm. A five test average of results from the original pile will be used in the mix designs. Individual extraction test results run thereafter shall be compared to the average used for the mix design and will be accepted if within the tolerances listed below.
Parameter FRAP
No. 4 (4.75 mm) ±6 %
No. 8 (2.36 mm) ±5 %
No. 30 (600 µm) ±5 %
No. 200 (75 µm) ±2.0 %
Asphalt Binder ±0.3 %
Gmm ±0.03 1/
1/ For stockpile with slag or steel slag present as determined in the current Manual of Test Procedures

125
Appendix B 21, “Determination of Reclaimed Asphalt Pavement Aggregate Bulk Specific Gravity.”
If any individual sieve and/or asphalt binder content tests are out of the above tolerances when compared to the average used for the mix design, the FRAP stockpile shall not be used in Hot-Mix Asphalt unless the FRAP representing those test is removed from the stockpile. All test data and acceptance ranges shall be sent to the District for evaluation.
The Contractor shall maintain a representative moving average of five tests to be used for Hot-Mix Asphalt production.
With the approval of the Engineer, the ignition oven may be substituted for extractions according to the Illinois Test Procedure, “Calibration of the Ignition Oven for the Purpose of Characterizing Reclaimed Asphalt Pavement (RAP)” or Illinois Modified AASHTO T-164-11, Test Method A.
(b) Evaluation of RAS Test Results. All of the test results, with the exception of percent unacceptable materials, shall be compiled and averaged for asphalt binder content and gradation. Individual test results run thereafter, when compared to the average, used for the mix design, will be accepted if within the tolerances listed below.
Parameter RAS
No. 8 (2.36 mm) ± 5 %
No. 16 (1.18 mm) ± 5 %
No. 30 (600 µm) ± 4 %
No. 200 (75 µm) ± 2.5 %
Asphalt Binder Content ± 2.0 %
If any individual sieve and/or asphalt binder content tests are out of the above tolerances when compared to the average used for the mix design, the RAS shall not be used in Hot-Mix Asphalt unless the RAS representing those tests is removed from the stockpile. All test data and acceptance ranges shall be sent to the District for evaluation.
(c) Quality Assurance by the Engineer. The Engineer may witness the sampling and splitting conduct assurance tests on split samples taken by the Contractor for quality control testing a minimum of once a month.
The overall testing frequency will be performed over the entire range of Contractor samples for asphalt binder content and gradation. The Engineer may select any or all split samples for assurance testing. The test results will be made available to the Contractor as soon as they become available.
The Engineer will notify the Contractor of observed deficiencies.
Differences between the Contractor’s and the Engineer’s split sample test results will be considered acceptable if within the following limits.

126
Test Parameter Acceptable Limits of Precision
% Passing:1/ FRAP RAS
1 / 2 in. 5.0%
No. 4 5.0%
No. 8 3.0% 4.0%
No. 30 2.0% 3.0%
No. 200 2.2% 2.5%
Asphalt Binder Content 0.3% 1.0%
Gmm 0.030
1/ Based on washed extraction
In the event comparisons are outside the above acceptable limits of precision, the Engineer will immediately investigate.
(d) Acceptance by the Engineer. Acceptable of the material will be based on the validation of the Contractor’s quality control by the assurance process.
1031.05 Quality Designation of Aggregate in RAP/FRAP.
(a) RAP. The aggregate quality of the RAP for homogenous, conglomerate, and
conglomerate “D” quality stockpiles shall be set by the lowest quality of coarse aggregate in the RAP stockpile and are designated as follows.
(1) RAP from Class I, Superpave (High ESAL), or (Low ESAL) Il-9.5L surface mixtures are designated as containing Class B quality course aggregate.
(2) RAP from Superpave (Low ESAL) IL-19.0L binder mixture is designated as Class D quality coarse aggregate.
(3) RAP from Class I, Superpave/HMA (High ESAL) binder mixtures, bituminous base course mixtures, and bituminous base course widening mixtures are designated as containing Class C quality coarse aggregate.
(4) RAP from bituminous stabilized subbase and BAM shoulders are designated as containing Class D quality coarse aggregate.
(b) FRAP. If the Engineer has documentation of the quality of the FRAP aggregate, the Contractor shall use the assigned quality provided by the Engineer.
If the quality is not known, the quality shall be determined as follows. Fractionated RAP stockpiles containing plus #4 (4.75 mm) sieve coarse aggregate shall have a maximum tonnage of 5,000 tons (4,500 metric tons). The Contractor shall obtain a representative sample witnessed by the Engineer. The sample shall be a minimum of 50 lb (25 kg). The sample shall be extracted according to Illinois Modified AASHTO T 164 by a consultant prequalified by the Department for the specified testing. The consultant shall submit the test results along with the recovered aggregate to the District Office. The cost for this testing shall be paid by the Contractor. The District will forward the sample to the BMPR Aggregate Lab for MicroDeval Testing, according to Illinois Modified AASHTO T 327. A maximum loss of 15.0 percent will be applied for
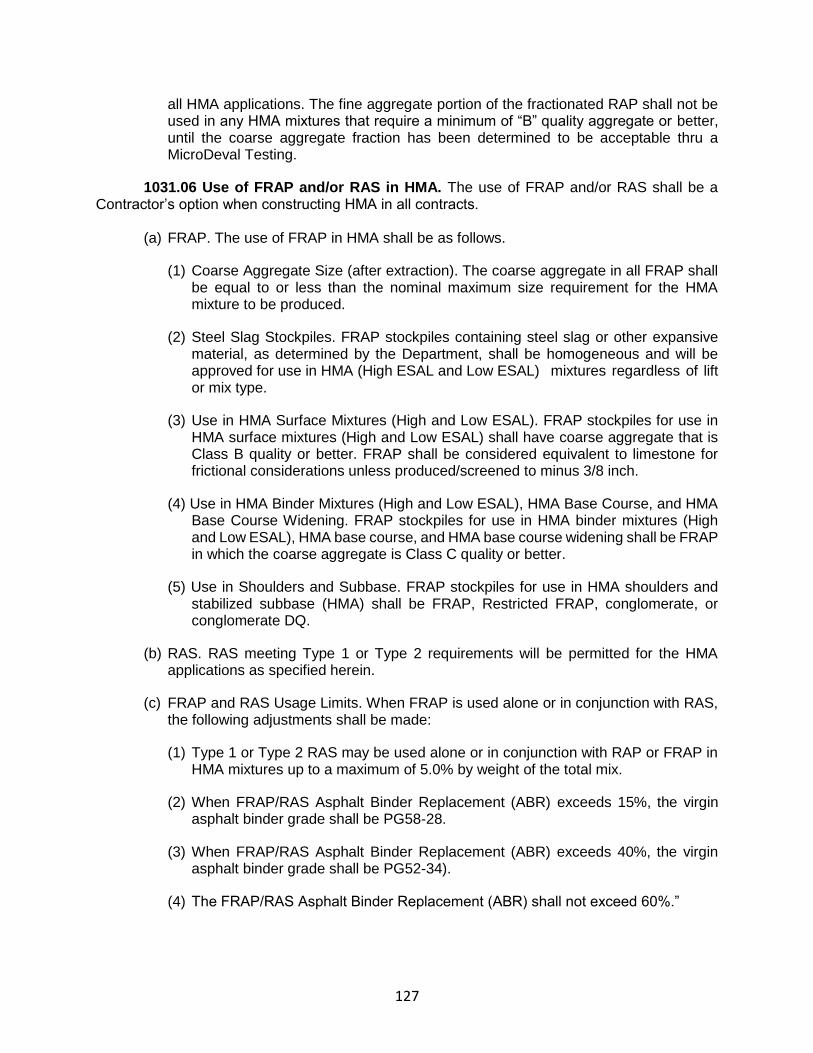
127
all HMA applications. The fine aggregate portion of the fractionated RAP shall not be used in any HMA mixtures that require a minimum of “B” quality aggregate or better, until the coarse aggregate fraction has been determined to be acceptable thru a MicroDeval Testing.
1031.06 Use of FRAP and/or RAS in HMA. The use of FRAP and/or RAS shall be a Contractor’s option when constructing HMA in all contracts.
(a) FRAP. The use of FRAP in HMA shall be as follows.
(1) Coarse Aggregate Size (after extraction). The coarse aggregate in all FRAP shall be equal to or less than the nominal maximum size requirement for the HMA mixture to be produced.
(2) Steel Slag Stockpiles. FRAP stockpiles containing steel slag or other expansive material, as determined by the Department, shall be homogeneous and will be approved for use in HMA (High ESAL and Low ESAL) mixtures regardless of lift or mix type.
(3) Use in HMA Surface Mixtures (High and Low ESAL). FRAP stockpiles for use in HMA surface mixtures (High and Low ESAL) shall have coarse aggregate that is Class B quality or better. FRAP shall be considered equivalent to limestone for frictional considerations unless produced/screened to minus 3/8 inch.
(4) Use in HMA Binder Mixtures (High and Low ESAL), HMA Base Course, and HMA Base Course Widening. FRAP stockpiles for use in HMA binder mixtures (High and Low ESAL), HMA base course, and HMA base course widening shall be FRAP in which the coarse aggregate is Class C quality or better.
(5) Use in Shoulders and Subbase. FRAP stockpiles for use in HMA shoulders and stabilized subbase (HMA) shall be FRAP, Restricted FRAP, conglomerate, or conglomerate DQ.
(b) RAS. RAS meeting Type 1 or Type 2 requirements will be permitted for the HMA applications as specified herein.
(c) FRAP and RAS Usage Limits. When FRAP is used alone or in conjunction with RAS, the following adjustments shall be made:
(1) Type 1 or Type 2 RAS may be used alone or in conjunction with RAP or FRAP in HMA mixtures up to a maximum of 5.0% by weight of the total mix.
(2) When FRAP/RAS Asphalt Binder Replacement (ABR) exceeds 15%, the virgin asphalt binder grade shall be PG58-28.
(3) When FRAP/RAS Asphalt Binder Replacement (ABR) exceeds 40%, the virgin asphalt binder grade shall be PG52-34).
(4) The FRAP/RAS Asphalt Binder Replacement (ABR) shall not exceed 60%.”
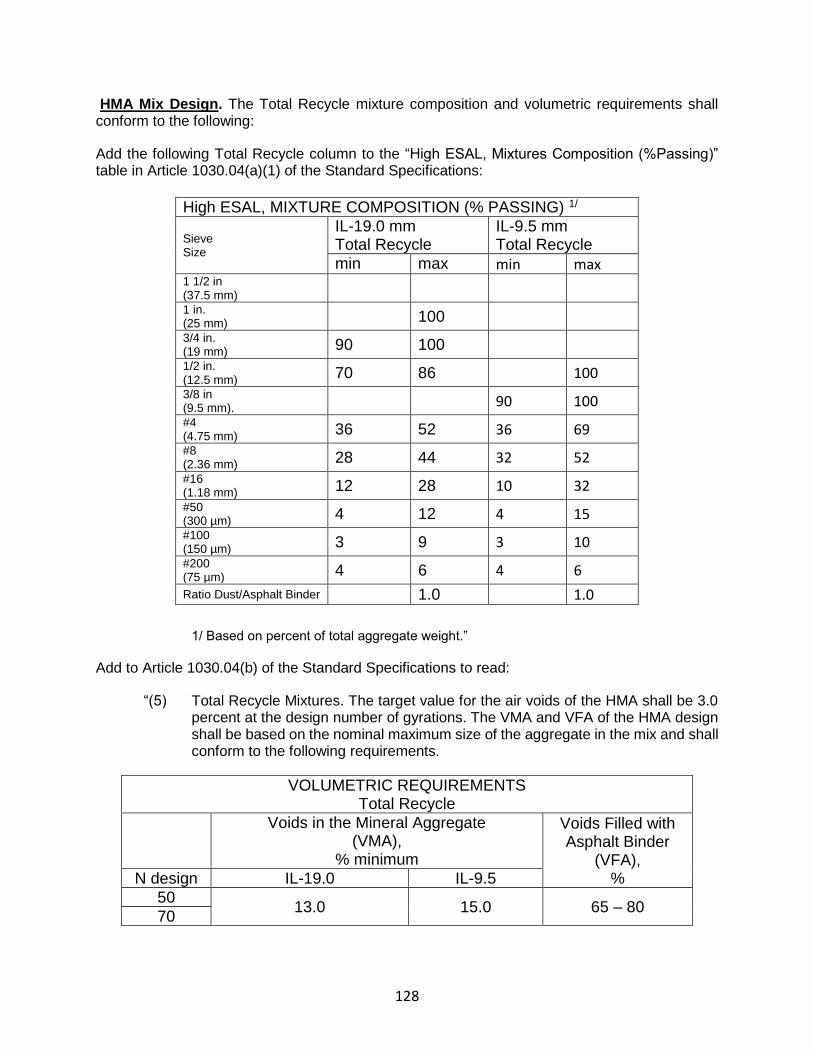
128
HMA Mix Design. The Total Recycle mixture composition and volumetric requirements shall conform to the following:
Add the following Total Recycle column to the “High ESAL, Mixtures Composition (%Passing)” table in Article 1030.04(a)(1) of the Standard Specifications:
High ESAL, MIXTURE COMPOSITION (% PASSING) 1/
Sieve Size
IL-19.0 mm Total Recycle
IL-9.5 mm Total Recycle
min max min max 1 1/2 in (37.5 mm)
1 in. (25 mm) 100
3/4 in. (19 mm)
90 100
1/2 in. (12.5 mm)
70 86 100
3/8 in (9.5 mm). 90 100
#4 (4.75 mm)
36 52 36 69
#8 (2.36 mm) 28 44 32 52
#16 (1.18 mm) 12 28 10 32
#50 (300 µm)
4 12 4 15
#100 (150 µm) 3 9 3 10
#200 (75 µm) 4 6 4 6
Ratio Dust/Asphalt Binder 1.0 1.0
1/ Based on percent of total aggregate weight.”
Add to Article 1030.04(b) of the Standard Specifications to read:
“(5) Total Recycle Mixtures. The target value for the air voids of the HMA shall be 3.0 percent at the design number of gyrations. The VMA and VFA of the HMA design shall be based on the nominal maximum size of the aggregate in the mix and shall conform to the following requirements.
VOLUMETRIC REQUIREMENTS Total Recycle
Voids in the Mineral Aggregate (VMA),
% minimum
Voids Filled with Asphalt Binder
(VFA), % N design IL-19.0 IL-9.5
50 13.0 15.0 65 – 80
70

129
Add the following Total Recycle columns to the “Control Limits” Table in Article 1030.05(d)(4)
“CONTROL LIMITS
Parameter Total Recycle
Individual Test
Total Recycle
Moving Avg. of 4
% Passing: 1/
1/2 in. (12.5 mm) ± 6 % ± 4 %
No. 4 (4.75 mm) ± 5 % ± 4 %
No. 8 (2.36 mm) ± 5 % ± 3 %
No. 30 (600 µm) ± 4 % ± 2.5 %
Total Dust Content No. 200 (75 µm)
± 1.5 % ± 1.0 %
Asphalt Binder Content ± 0.3 % ± 0.2 %
Voids ± 1.0 % ± 0.8 %
VMA -0.7 % 2/ -0.5 % 2/
1/ Based on washed ignition oven 2/ Allowable limit below minimum design VMA requirement”
Add the following to Article 1030.04 of the Standard Specifications:
“(d) Verification Testing. High ESAL mix designs submitted for verification will be tested to
ensure that the resulting mix designs will pass the required criteria for the Hamburg Wheel Test (IL mod AASHTO T-324) and the Tensile Strength Test (IL mod AASHTO T-283). The Department will perform a verification test on gyratory specimens compacted by the Contractor. If the mix fails the Department’s verification test, the Contractor shall make the necessary changes to the mix and resubmit compacted specimens to the Department for verification. If the mix fails again, the mix design will be rejected.
(1) Hamburg Wheel Test criteria.
Asphalt Binder Grade # Repetitions Max Rut Depth (mm)
PG 64 -XX (or lower) 10,000 12.5
(2) Tensile Strength Criteria. The minimum allowable conditioned tensile strength
shall be 415 kPa (60 psi) for non-polymer modified performance graded (PG) asphalt binder and 550 kPa (80 psi) for polymer modified PG asphalt binder. The maximum allowable unconditioned tensile strength shall be 1380 kPa (200 psi).
(3) Cure of Hot-Mix Asphalt. In addition to the basic curing (2 hrs), the designer shall conduct a 4 hour cure at the optimum asphalt binder (AB) content (as outlined in District One HMA Design Guideline). After the 4 hour cure, the voids must be within ±0.5% of the Design Air Voids Target.
130
(4) Chemical Extraction. Each submitted design shall include a washed chemical extraction according to IL Modified AASHTO T 164 on a compacted briquette.”
(5) FRAP and RAS. If additional FRAP or RAS stockpiles are tested and found to be within tolerance, as defined under “Evaluation of Tests” and meet all requirements herein, the additional FRAP or RAS stockpiles may be used in the original design at the percent previously verified.
(6) RAS. Type 1 and Type 2 RAS are not interchangeable in a mix design. A RAS stone bulk specific gravity (Gsb) of 2.500 shall be used for mix design purposes.
(7) Maximum Specific Gravity. The mix design maximum specific gravity (Gmm), at optimum AC content, shall not exceed 2.533.
Revise the seventh paragraph of Article 406.14 of the Standard Specifications to read:
“For all mixes designed and verified under the Hamburg Wheel criteria, the cost of furnishing and introducing anti-stripping additives in the HMA will not be paid for separately but shall be considered as included in the contract unit price of the HMA item involved.
No additional compensation will be awarded to the Contractor because of reduced production rates associated with the addition of the anti-stripping additive.”
Plant Requirements. HMA plants shall be capable of automatically recording and printing the following information.
(1) Dryer Drum Plants.
a. Date, month, year, and time to the nearest minute for each print.
b. HMA mix number assigned by the Department.
c. Accumulated weight of dry aggregate (combined or individual) in tons (metric tons) to the nearest 0.1 ton (0.1 metric ton).
d. Accumulated dry weight of RAS and FRAP in tons (metric tons) to the nearest 0.1 ton (0.1 metric ton).
e. Accumulated mineral filler in revolutions, tons (metric tons), etc. to the nearest 0.1 unit.
f. Accumulated asphalt binder in gallons (liters), tons (metric tons), etc. to the nearest 0.1 unit.
g. Residual asphalt binder in the RAS and FRAP material as a percent of the total mix to the nearest 0.1 percent.
h. Aggregate RAS and FRAP moisture compensators in percent as set on the control panel. (Required when accumulated or individual aggregate and RAS, RAP, and FRAP are printed in wet condition.)

131
i. When producing mixtures with FRAP and/or RAS, a positive dust control system shall be utilized.
j. Accumulated mixture tonnage.
k. Dust Removed (accumulated to the nearest 0.1 ton)
(2) Batch Plants. a. Date, month, year, and time to the nearest minute for each print.
b. HMA mix number assigned by the Department.
c. Individual virgin aggregate hot bin batch weights to the nearest pound (kilogram).
d. Mineral filler weight to the nearest pound (kilogram).
f. RAS and FRAP weight to the nearest pound (kilogram).
g. Virgin asphalt binder weight to the nearest pound (kilogram).
h. Residual asphalt binder in the RAS and FRAP material as a percent of the total mix to the nearest 0.1 percent.
The printouts shall be maintained in a file at the plant for a minimum of one year or as directed by the Engineer and shall be made available upon request. The printing system will be inspected by the Engineer prior to production and verified at the beginning of each construction season thereafter.
To remove or reduce agglomerated material, a scalping screen, gator, crushing unit, or comparable sizing device approved by the Engineer shall be used in the RAS, RAP and FRAP feed system to remove or reduce oversized material. If material passing the sizing device adversely affects the mix production or quality of the mix, the sizing device shall be set at a size specified by the Engineer.
RAS shall be incorporated into the HMA mixture either by a separate weight depletion system or by using the RAP weigh belt. Either feed system shall be interlocked with the aggregate feed or weigh system to maintain correct proportions for all rates of production and batch sizes. The portion of RAS shall be controlled accurately to within ± 0.5 percent of the amount of RAS utilized. When using the weight depletion system, flow indicators or sensing devices shall be provided and interlocked with the plant controls such that the mixture production is halted when RAS flow is interrupted.
HMA Production.
Add the following to Article 1030.06 of the Standard Specifications:
“(c) Hamburg Wheel Test. The Contractor shall sample the HMA mixture within the first 500
tons (450 metric tons) on the first day of production or during start up with a split reserved for the Department. The mix sample shall be tested according to the Illinois Modified AASHTO T 324 and shall meet the requirements specified herein. Mix production shall not exceed 1500 tons (1350 metric tons) or one day’s production, whichever comes first, until
132
the testing is completed and the mixture is found to be in conformance. The requirement to cease mix production may be waived if the plant produced mixture demonstrates conformance prior to start of mix production for a contract. The Department may conduct additional Hamburg Wheel Tests on production material as determined by the Engineer. If the mixture fails to meet the Hamburg Wheel criteria, no further mixture will be accepted until the Contractor takes such action as is necessary to furnish a mixture meeting the criteria”
The Contractor shall immediately cease production upon notification by the Engineer of failing Hamburg Wheel test. All prior produced material may be paved out provided all other mixture criteria are being met. No additional mixture shall be produced until the Engineer receives passing Hamburg Wheel tests.
If during mix production, corrective actions fail to maintain RAS, FRAP or QC/QA test results within control tolerances or the requirements listed herein, the Contractor shall cease production of the mixture and conduct an investigation that may require a new mix design.
Hot-mix Storage. The HMA mixture shall have combined silo storage and haul time of not less
than 2 hours.

133
APPENDIX J: TOTAL RECYCLE ASPHALT (2013 PROJECTS) PHOTOS 2014 TO 2016

134
APPENDIX J-1: 26TH STREET TOTAL RECYCLE ASPHALT SECTION
2014 2015 2016

135
26TH STREET TOTAL RECYCLE ASPHALT SECTION (CONTINUED)

136
APPENDIX J-2: HARRISON STREET TOTAL RECYCLE ASPHALT SECTION
2014 2015 2016

137
HARRISON STREET TOTAL RECYCLE ASPHALT SECTION (CONTINUED)

138
APPENDIX J-3: RICHARDS STREET TOTAL RECYCLE ASPHALT SECTION
2014 2015 2016
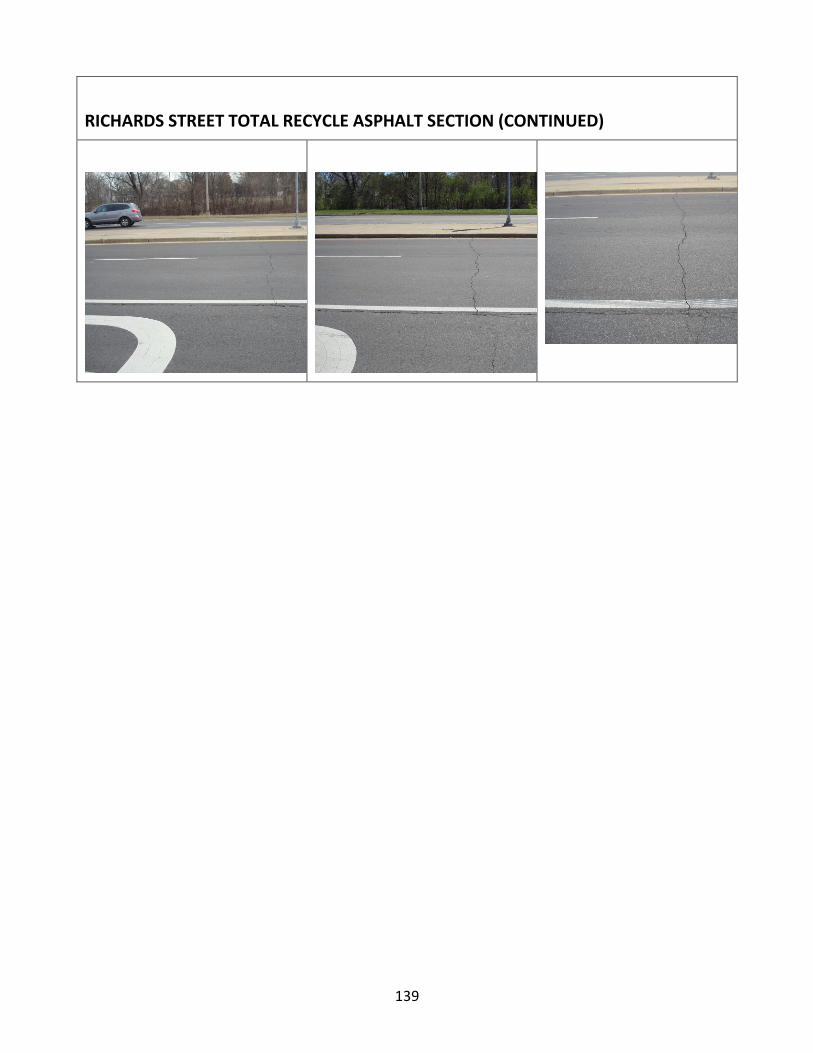
139
RICHARDS STREET TOTAL RECYCLE ASPHALT SECTION (CONTINUED)
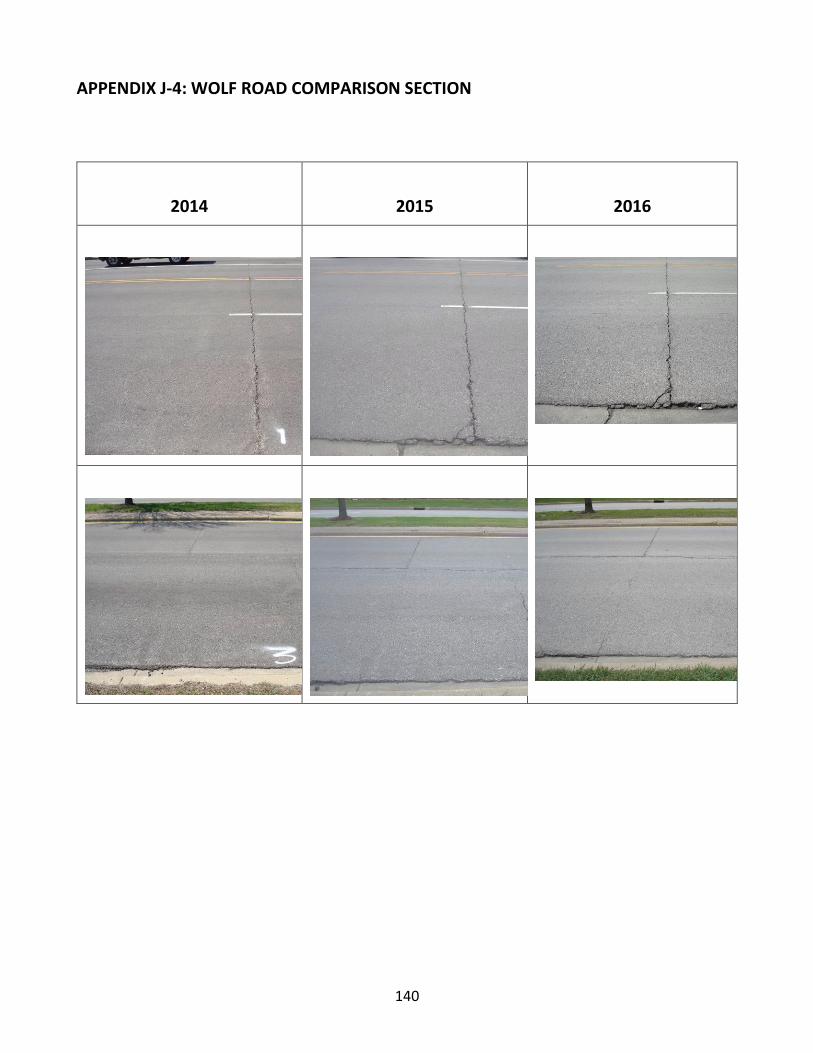
140
APPENDIX J-4: WOLF ROAD COMPARISON SECTION
2014 2015 2016

141
APPENDIX J-4: WOLF ROAD COMPARISON SECTION (CONTINUED)
2014 2015 2016