Embed Size (px)
Citation preview
Construction Industry Forecasts 2017-2019
Spring 2017 Edition - £175
2 3
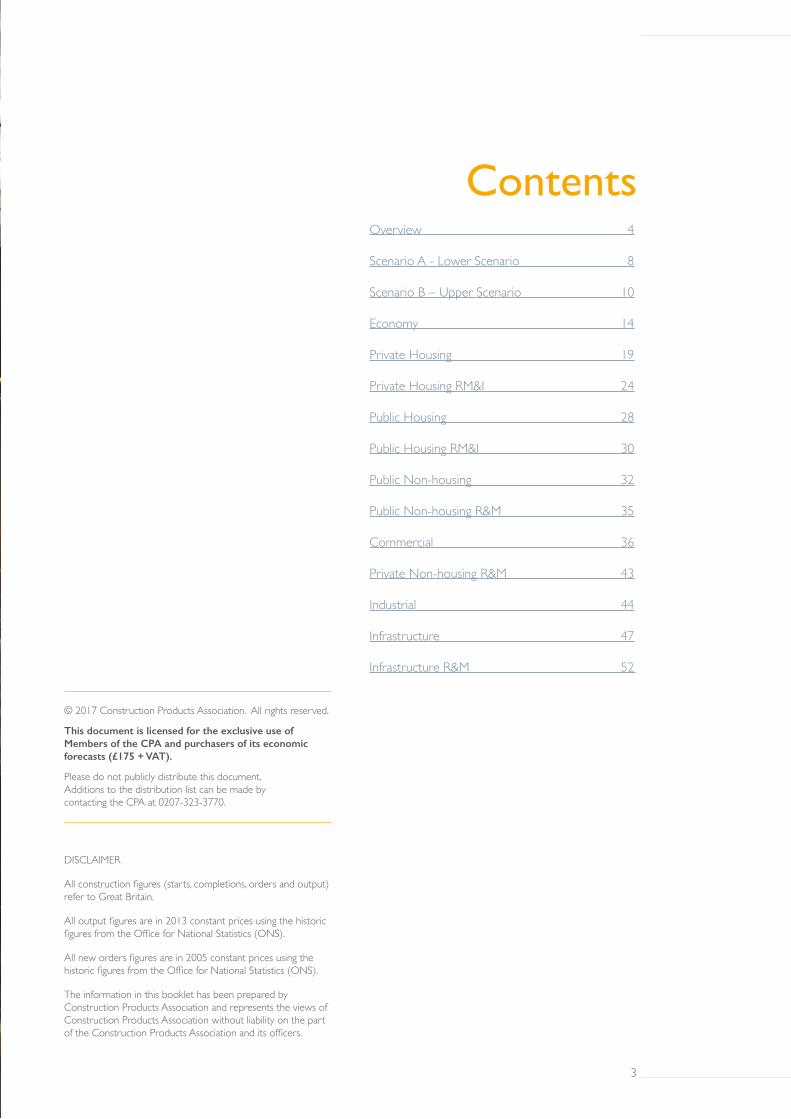
Contents
DISCLAIMER
All construction figures (starts, completions, orders and output) refer to Great Britain.
All output figures are in 2013 constant prices using the historic figures from the Office for National Statistics (ONS).
All new orders figures are in 2005 constant prices using the historic figures from the Office for National Statistics (ONS).
The information in this booklet has been prepared by Construction Products Association and represents the views of Construction Products Association without liability on the part of the Construction Products Association and its officers.
© 2017 Construction Products Association. All rights reserved.
This document is licensed for the exclusive use of Members of the CPA and purchasers of its economic forecasts (£175 + VAT).
Please do not publicly distribute this document. Additions to the distribution list can be made by contacting the CPA at 0207-323-3770.
Overview 4
Scenario A - Lower Scenario 8
Scenario B – Upper Scenario 10
Economy 14
Private Housing 19
Private Housing RM&I 24
Public Housing 28
Public Housing RM&I 30
Public Non-housing 32
Public Non-housing R&M 35
Commercial 36
Private Non-housing R&M 43
Industrial 44
Infrastructure 47
Infrastructure R&M 52
2 3
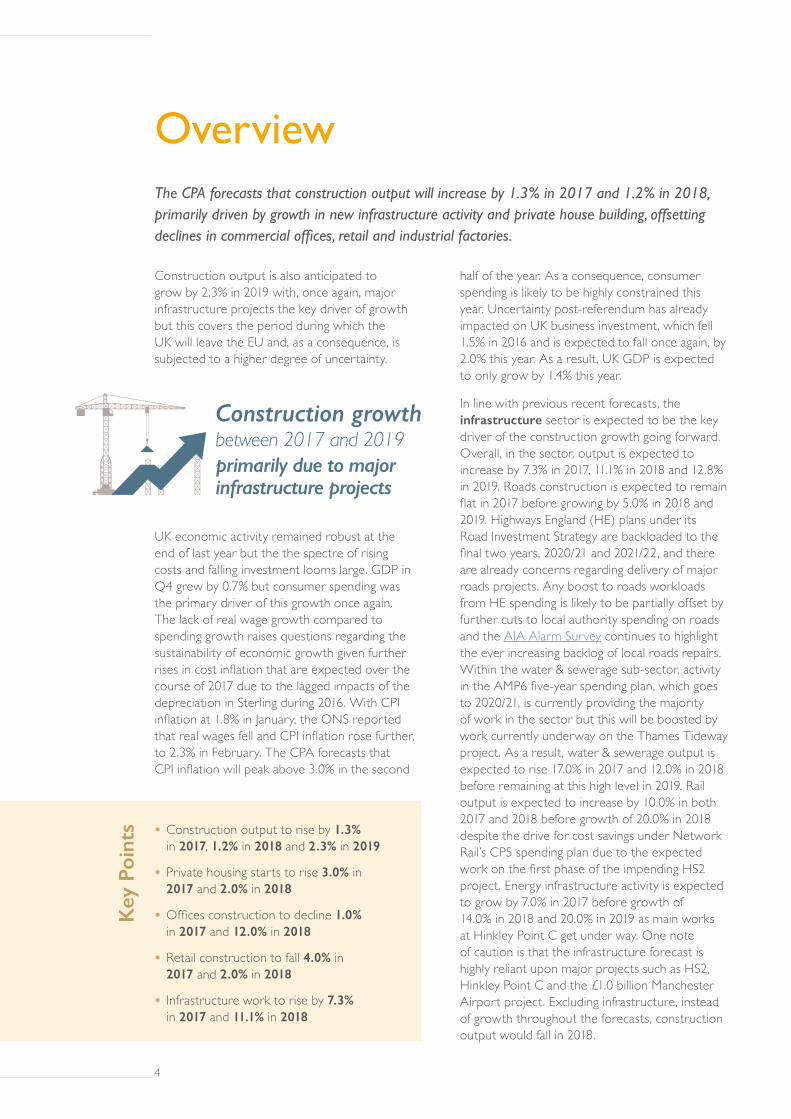
Overview
Construction output is also anticipated to grow by 2.3% in 2019 with, once again, major infrastructure projects the key driver of growth but this covers the period during which the UK will leave the EU and, as a consequence, is subjected to a higher degree of uncertainty.
UK economic activity remained robust at the end of last year but the the spectre of rising costs and falling investment looms large. GDP in Q4 grew by 0.7% but consumer spending was the primary driver of this growth once again. The lack of real wage growth compared to spending growth raises questions regarding the sustainability of economic growth given further rises in cost inflation that are expected over the course of 2017 due to the lagged impacts of the depreciation in Sterling during 2016. With CPI inflation at 1.8% in January, the ONS reported that real wages fell and CPI inflation rose further, to 2.3% in February. The CPA forecasts that CPI inflation will peak above 3.0% in the second
half of the year. As a consequence, consumer spending is likely to be highly constrained this year. Uncertainty post-referendum has already impacted on UK business investment, which fell 1.5% in 2016 and is expected to fall once again, by 2.0% this year. As a result, UK GDP is expected to only grow by 1.4% this year.
In line with previous recent forecasts, the infrastructure sector is expected to be the key driver of the construction growth going forward. Overall, in the sector, output is expected to increase by 7.3% in 2017, 11.1% in 2018 and 12.8% in 2019. Roads construction is expected to remain flat in 2017 before growing by 5.0% in 2018 and 2019. Highways England (HE) plans under its Road Investment Strategy are backloaded to the final two years, 2020/21 and 2021/22, and there are already concerns regarding delivery of major roads projects. Any boost to roads workloads from HE spending is likely to be partially offset by further cuts to local authority spending on roads and the AIA Alarm Survey continues to highlight the ever increasing backlog of local roads repairs. Within the water & sewerage sub-sector, activity in the AMP6 five-year spending plan, which goes to 2020/21, is currently providing the majority of work in the sector but this will be boosted by work currently underway on the Thames Tideway project. As a result, water & sewerage output is expected to rise 17.0% in 2017 and 12.0% in 2018 before remaining at this high level in 2019. Rail output is expected to increase by 10.0% in both 2017 and 2018 before growth of 20.0% in 2018 despite the drive for cost savings under Network Rail’s CP5 spending plan due to the expected work on the first phase of the impending HS2 project. Energy infrastructure activity is expected to grow by 7.0% in 2017 before growth of 14.0% in 2018 and 20.0% in 2019 as main works at Hinkley Point C get under way. One note of caution is that the infrastructure forecast is highly reliant upon major projects such as HS2, Hinkley Point C and the £1.0 billion Manchester Airport project. Excluding infrastructure, instead of growth throughout the forecasts, construction output would fall in 2018.
The CPA forecasts that construction output will increase by 1.3% in 2017 and 1.2% in 2018, primarily driven by growth in new infrastructure activity and private house building, offsetting declines in commercial offices, retail and industrial factories.
• Construction output to rise by 1.3% in 2017, 1.2% in 2018 and 2.3% in 2019
• Private housing starts to rise 3.0% in 2017 and 2.0% in 2018
• Offices construction to decline 1.0% in 2017 and 12.0% in 2018
• Retail construction to fall 4.0% in 2017 and 2.0% in 2018
• Infrastructure work to rise by 7.3% in 2017 and 11.1% in 2018
Key
Poi
nts
Construction growthbetween 2017 and 2019primarily due to major infrastructure projects
4 5
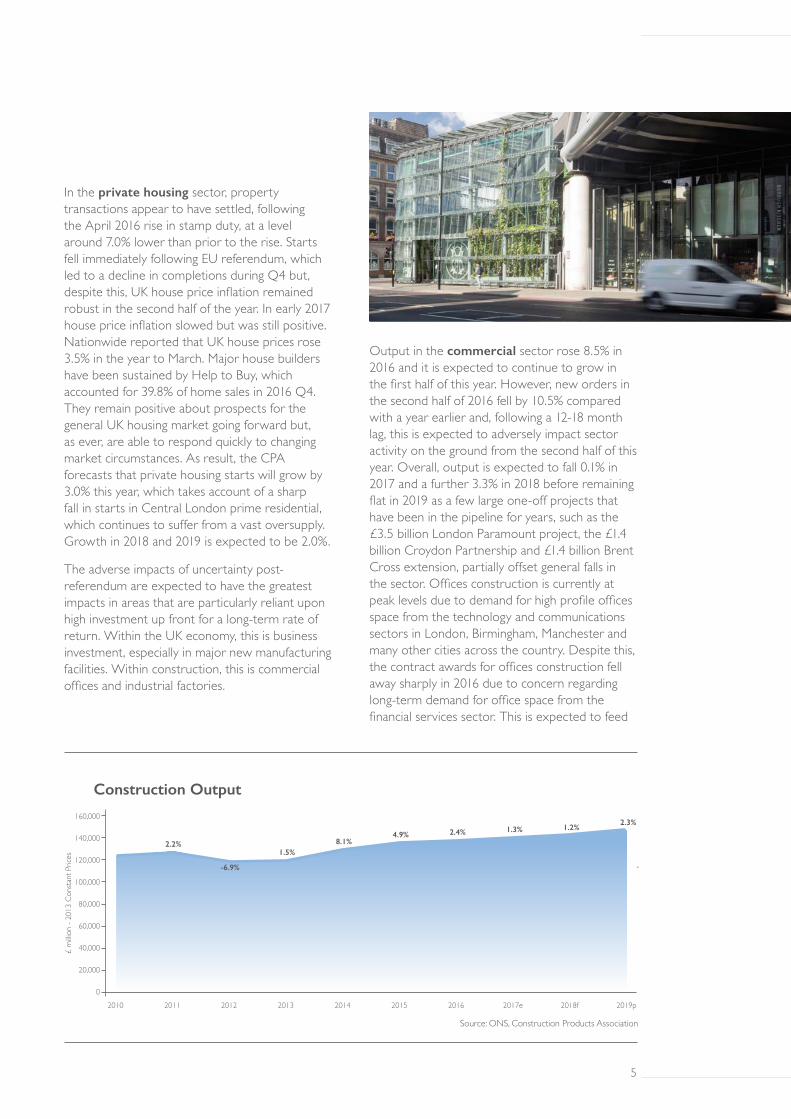
In the private housing sector, property transactions appear to have settled, following the April 2016 rise in stamp duty, at a level around 7.0% lower than prior to the rise. Starts fell immediately following EU referendum, which led to a decline in completions during Q4 but, despite this, UK house price inflation remained robust in the second half of the year. In early 2017 house price inflation slowed but was still positive. Nationwide reported that UK house prices rose 3.5% in the year to March. Major house builders have been sustained by Help to Buy, which accounted for 39.8% of home sales in 2016 Q4. They remain positive about prospects for the general UK housing market going forward but, as ever, are able to respond quickly to changing market circumstances. As result, the CPA forecasts that private housing starts will grow by 3.0% this year, which takes account of a sharp fall in starts in Central London prime residential, which continues to suffer from a vast oversupply. Growth in 2018 and 2019 is expected to be 2.0%.
The adverse impacts of uncertainty post-referendum are expected to have the greatest impacts in areas that are particularly reliant upon high investment up front for a long-term rate of return. Within the UK economy, this is business investment, especially in major new manufacturing facilities. Within construction, this is commercial offices and industrial factories.
Output in the commercial sector rose 8.5% in 2016 and it is expected to continue to grow in the first half of this year. However, new orders in the second half of 2016 fell by 10.5% compared with a year earlier and, following a 12-18 month lag, this is expected to adversely impact sector activity on the ground from the second half of this year. Overall, output is expected to fall 0.1% in 2017 and a further 3.3% in 2018 before remaining flat in 2019 as a few large one-off projects that have been in the pipeline for years, such as the £3.5 billion London Paramount project, the £1.4 billion Croydon Partnership and £1.4 billion Brent Cross extension, partially offset general falls in the sector. Offices construction is currently at peak levels due to demand for high profile offices space from the technology and communications sectors in London, Birmingham, Manchester and many other cities across the country. Despite this, the contract awards for offices construction fell away sharply in 2016 due to concern regarding long-term demand for office space from the financial services sector. This is expected to feed
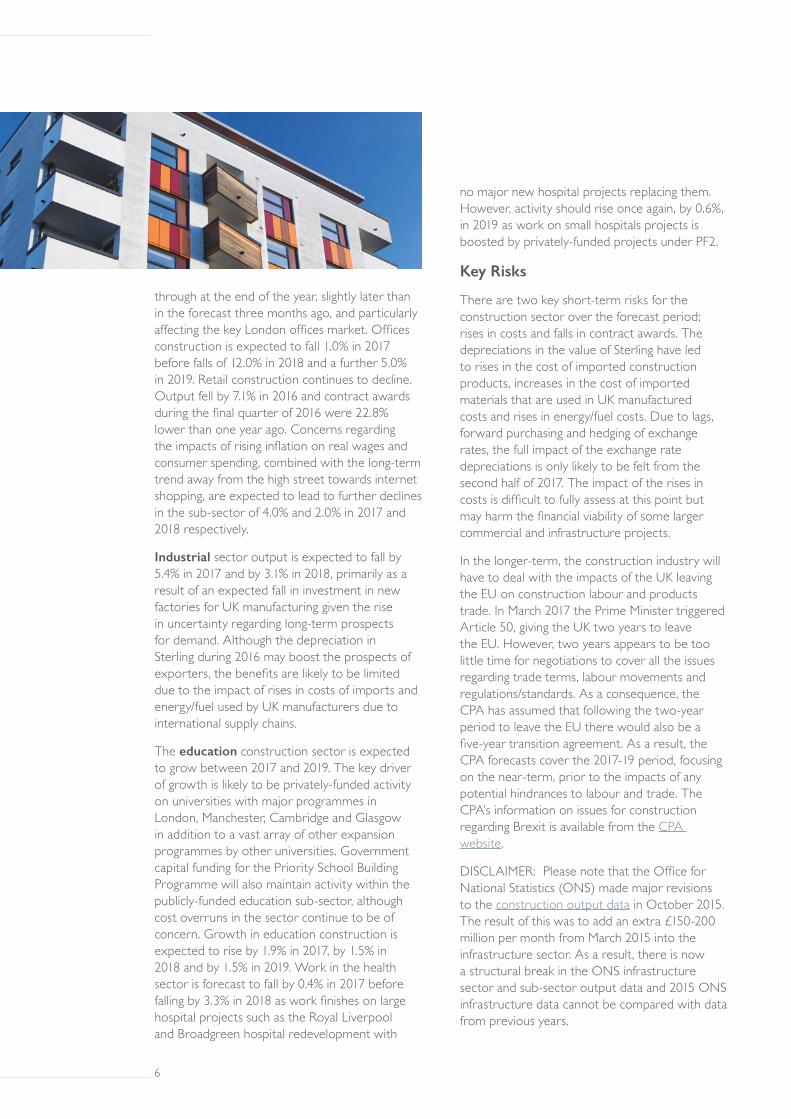
8.1%
-6.9%
2.4%
2.2%4.9%
1.5%
1.3% 1.2%2.3%
2010 2011 2012 2013 2014 2015 2016 2017e 2018f 2019p
160,000
140,000
120,000
100,000
80,000
60,000
40,000
20,000
0
Construction Output
£ m
illion
- 20
13 C
onsta
nt P
rices
Source: ONS, Construction Products Association
4 5
through at the end of the year, slightly later than in the forecast three months ago, and particularly affecting the key London offices market. Offices construction is expected to fall 1.0% in 2017 before falls of 12.0% in 2018 and a further 5.0% in 2019. Retail construction continues to decline. Output fell by 7.1% in 2016 and contract awards during the final quarter of 2016 were 22.8% lower than one year ago. Concerns regarding the impacts of rising inflation on real wages and consumer spending, combined with the long-term trend away from the high street towards internet shopping, are expected to lead to further declines in the sub-sector of 4.0% and 2.0% in 2017 and 2018 respectively.
Industrial sector output is expected to fall by 5.4% in 2017 and by 3.1% in 2018, primarily as a result of an expected fall in investment in new factories for UK manufacturing given the rise in uncertainty regarding long-term prospects for demand. Although the depreciation in Sterling during 2016 may boost the prospects of exporters, the benefits are likely to be limited due to the impact of rises in costs of imports and energy/fuel used by UK manufacturers due to international supply chains.
The education construction sector is expected to grow between 2017 and 2019. The key driver of growth is likely to be privately-funded activity on universities with major programmes in London, Manchester, Cambridge and Glasgow in addition to a vast array of other expansion programmes by other universities. Government capital funding for the Priority School Building Programme will also maintain activity within the publicly-funded education sub-sector, although cost overruns in the sector continue to be of concern. Growth in education construction is expected to rise by 1.9% in 2017, by 1.5% in 2018 and by 1.5% in 2019. Work in the health sector is forecast to fall by 0.4% in 2017 before falling by 3.3% in 2018 as work finishes on large hospital projects such as the Royal Liverpool and Broadgreen hospital redevelopment with
no major new hospital projects replacing them. However, activity should rise once again, by 0.6%, in 2019 as work on small hospitals projects is boosted by privately-funded projects under PF2.
Key Risks
There are two key short-term risks for the construction sector over the forecast period; rises in costs and falls in contract awards. The depreciations in the value of Sterling have led to rises in the cost of imported construction products, increases in the cost of imported materials that are used in UK manufactured costs and rises in energy/fuel costs. Due to lags, forward purchasing and hedging of exchange rates, the full impact of the exchange rate depreciations is only likely to be felt from the second half of 2017. The impact of the rises in costs is difficult to fully assess at this point but may harm the financial viability of some larger commercial and infrastructure projects.
In the longer-term, the construction industry will have to deal with the impacts of the UK leaving the EU on construction labour and products trade. In March 2017 the Prime Minister triggered Article 50, giving the UK two years to leave the EU. However, two years appears to be too little time for negotiations to cover all the issues regarding trade terms, labour movements and regulations/standards. As a consequence, the CPA has assumed that following the two-year period to leave the EU there would also be a five-year transition agreement. As a result, the CPA forecasts cover the 2017-19 period, focusing on the near-term, prior to the impacts of any potential hindrances to labour and trade. The CPA’s information on issues for construction regarding Brexit is available from the CPA website.
DISCLAIMER: Please note that the Office for National Statistics (ONS) made major revisions to the construction output data in October 2015. The result of this was to add an extra £150-200 million per month from March 2015 into the infrastructure sector. As a result, there is now a structural break in the ONS infrastructure sector and sub-sector output data and 2015 ONS infrastructure data cannot be compared with data from previous years.
6 7
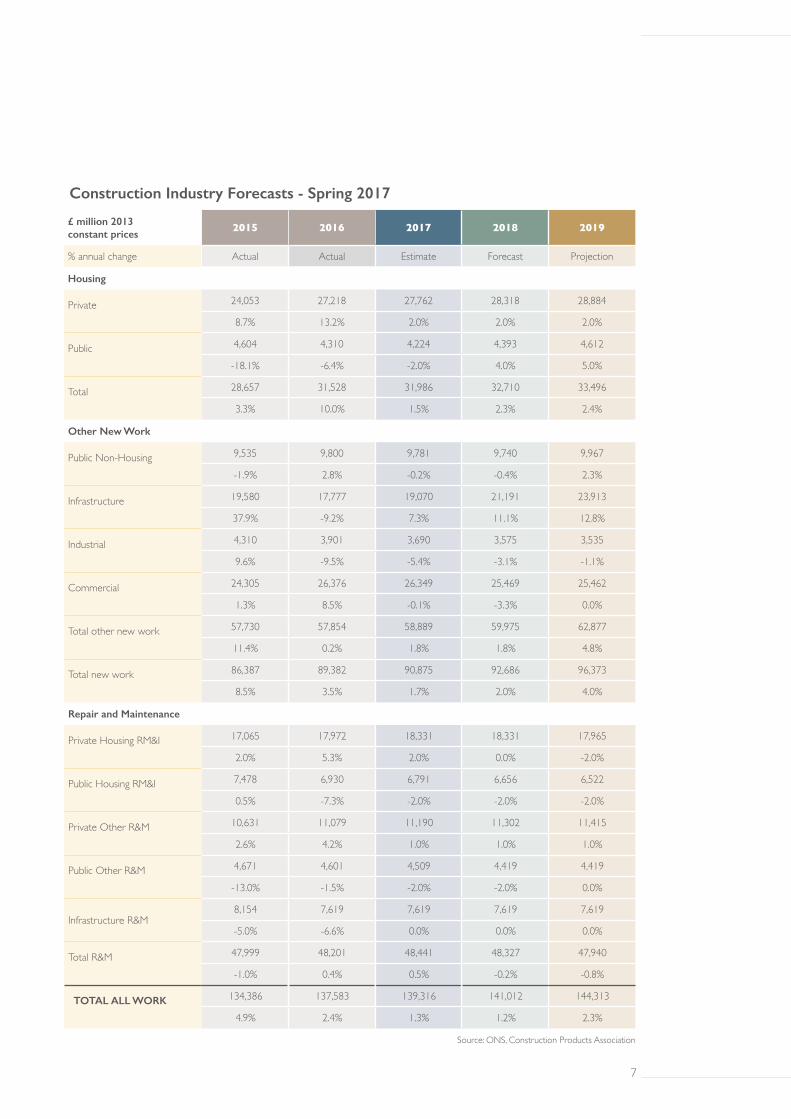
Construction Industry Forecasts - Spring 2017
£ million 2013 constant prices
2015 2016 2017 2018 2019
% annual change Actual Actual Estimate Forecast Projection
Housing
Private
24,053 27,218 27,762 28,318 28,884
8.7% 13.2% 2.0% 2.0% 2.0%
Public
4,604 4,310 4,224 4,393 4,612
-18.1% -6.4% -2.0% 4.0% 5.0%
Total
28,657 31,528 31,986 32,710 33,496
3.3% 10.0% 1.5% 2.3% 2.4%
Other New Work
Public Non-Housing
9,535 9,800 9,781 9,740 9,967
-1.9% 2.8% -0.2% -0.4% 2.3%
Infrastructure
19,580 17,777 19,070 21,191 23,913
37.9% -9.2% 7.3% 11.1% 12.8%
Industrial
4,310 3,901 3,690 3,575 3,535
9.6% -9.5% -5.4% -3.1% -1.1%
Commercial
24,305 26,376 26,349 25,469 25,462
1.3% 8.5% -0.1% -3.3% 0.0%
Total other new work
57,730 57,854 58,889 59,975 62,877
11.4% 0.2% 1.8% 1.8% 4.8%
Total new work
86,387 89,382 90,875 92,686 96,373
8.5% 3.5% 1.7% 2.0% 4.0%
Repair and Maintenance
Private Housing RM&I
17,065 17,972 18,331 18,331 17,965
2.0% 5.3% 2.0% 0.0% -2.0%
Public Housing RM&I
7,478 6,930 6,791 6,656 6,522
0.5% -7.3% -2.0% -2.0% -2.0%
Private Other R&M
10,631 11,079 11,190 11,302 11,415
2.6% 4.2% 1.0% 1.0% 1.0%
Public Other R&M
4,671 4,601 4,509 4,419 4,419
-13.0% -1.5% -2.0% -2.0% 0.0%
Infrastructure R&M8,154 7,619 7,619 7,619 7,619
-5.0% -6.6% 0.0% 0.0% 0.0%
Total R&M
47,999 48,201 48,441 48,327 47,940
-1.0% 0.4% 0.5% -0.2% -0.8%
TOTAL ALL WORK
134,386 137,583 139,316 141,012 144,313
4.9% 2.4% 1.3% 1.2% 2.3%
Source: ONS, Construction Products Association
6 7
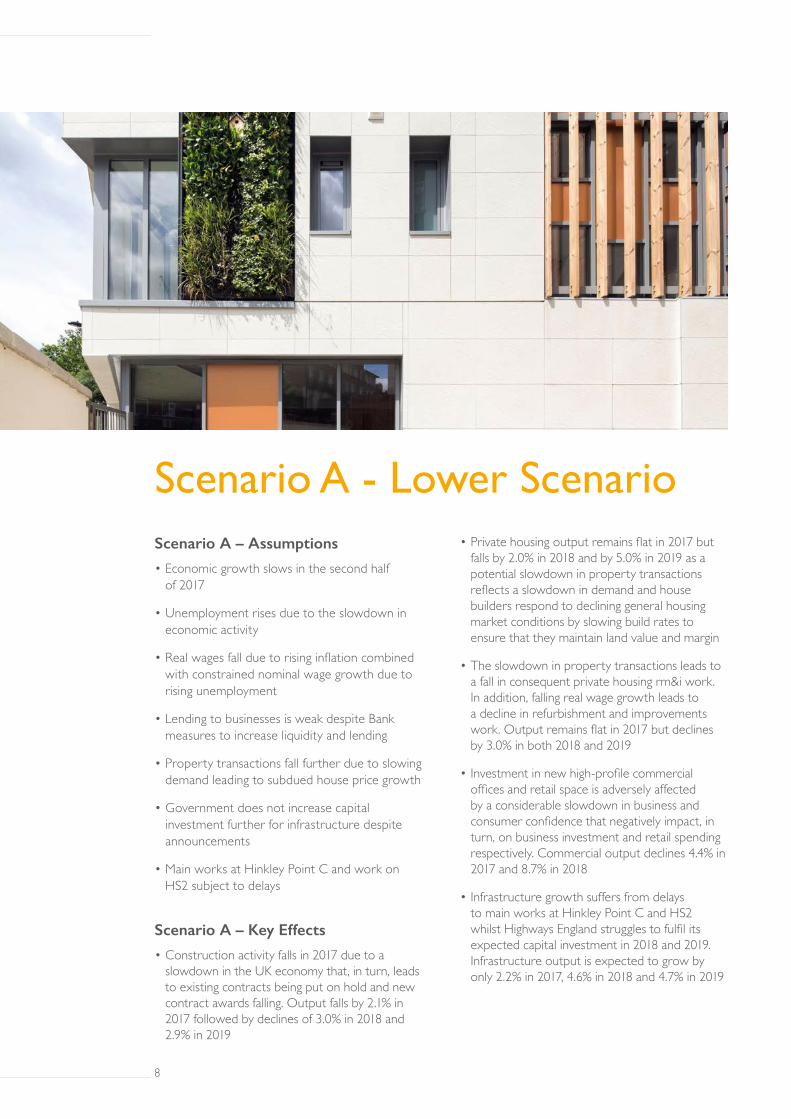
Scenario A - Lower ScenarioScenario A – Assumptions
• Economic growth slows in the second half of 2017
• Unemployment rises due to the slowdown in economic activity
• Real wages fall due to rising inflation combined with constrained nominal wage growth due to rising unemployment
• Lending to businesses is weak despite Bank measures to increase liquidity and lending
• Property transactions fall further due to slowing demand leading to subdued house price growth
• Government does not increase capital investment further for infrastructure despite announcements
• Main works at Hinkley Point C and work on HS2 subject to delays
Scenario A – Key Effects
• Construction activity falls in 2017 due to a slowdown in the UK economy that, in turn, leads to existing contracts being put on hold and new contract awards falling. Output falls by 2.1% in 2017 followed by declines of 3.0% in 2018 and 2.9% in 2019
• Private housing output remains flat in 2017 but falls by 2.0% in 2018 and by 5.0% in 2019 as a potential slowdown in property transactions reflects a slowdown in demand and house builders respond to declining general housing market conditions by slowing build rates to ensure that they maintain land value and margin
• The slowdown in property transactions leads to a fall in consequent private housing rm&i work. In addition, falling real wage growth leads to a decline in refurbishment and improvements work. Output remains flat in 2017 but declines by 3.0% in both 2018 and 2019
• Investment in new high-profile commercial offices and retail space is adversely affected by a considerable slowdown in business and consumer confidence that negatively impact, in turn, on business investment and retail spending respectively. Commercial output declines 4.4% in 2017 and 8.7% in 2018
• Infrastructure growth suffers from delays to main works at Hinkley Point C and HS2 whilst Highways England struggles to fulfil its expected capital investment in 2018 and 2019. Infrastructure output is expected to grow by only 2.2% in 2017, 4.6% in 2018 and 4.7% in 2019
8 9
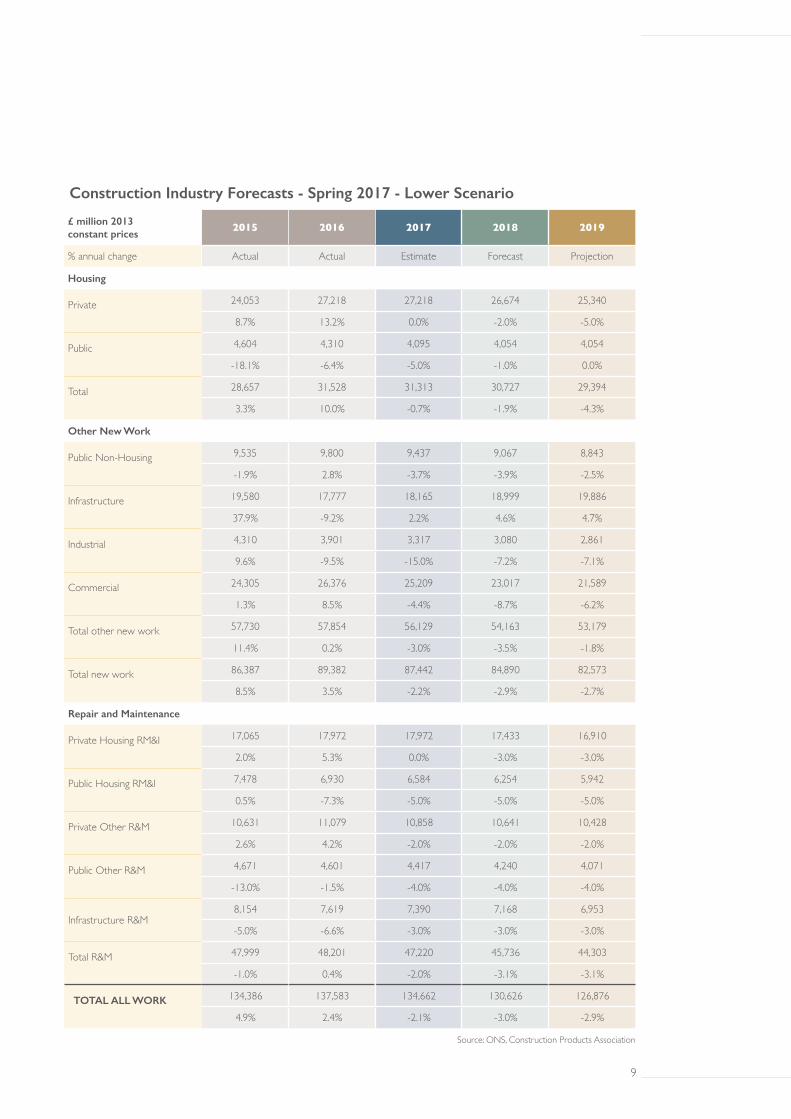
Construction Industry Forecasts - Spring 2017 - Lower Scenario
£ million 2013 constant prices
2015 2016 2017 2018 2019
% annual change Actual Actual Estimate Forecast Projection
Housing
Private
24,053 27,218 27,218 26,674 25,340
8.7% 13.2% 0.0% -2.0% -5.0%
Public
4,604 4,310 4,095 4,054 4,054
-18.1% -6.4% -5.0% -1.0% 0.0%
Total
28,657 31,528 31,313 30,727 29,394
3.3% 10.0% -0.7% -1.9% -4.3%
Other New Work
Public Non-Housing
9,535 9,800 9,437 9,067 8,843
-1.9% 2.8% -3.7% -3.9% -2.5%
Infrastructure
19,580 17,777 18,165 18,999 19,886
37.9% -9.2% 2.2% 4.6% 4.7%
Industrial
4,310 3,901 3,317 3,080 2,861
9.6% -9.5% -15.0% -7.2% -7.1%
Commercial
24,305 26,376 25,209 23,017 21,589
1.3% 8.5% -4.4% -8.7% -6.2%
Total other new work
57,730 57,854 56,129 54,163 53,179
11.4% 0.2% -3.0% -3.5% -1.8%
Total new work
86,387 89,382 87,442 84,890 82,573
8.5% 3.5% -2.2% -2.9% -2.7%
Repair and Maintenance
Private Housing RM&I
17,065 17,972 17,972 17,433 16,910
2.0% 5.3% 0.0% -3.0% -3.0%
Public Housing RM&I
7,478 6,930 6,584 6,254 5,942
0.5% -7.3% -5.0% -5.0% -5.0%
Private Other R&M
10,631 11,079 10,858 10,641 10,428
2.6% 4.2% -2.0% -2.0% -2.0%
Public Other R&M
4,671 4,601 4,417 4,240 4,071
-13.0% -1.5% -4.0% -4.0% -4.0%
Infrastructure R&M8,154 7,619 7,390 7,168 6,953
-5.0% -6.6% -3.0% -3.0% -3.0%
Total R&M
47,999 48,201 47,220 45,736 44,303
-1.0% 0.4% -2.0% -3.1% -3.1%
TOTAL ALL WORK
134,386 137,583 134,662 130,626 126,876
4.9% 2.4% -2.1% -3.0% -2.9%
Source: ONS, Construction Products Association
8 9
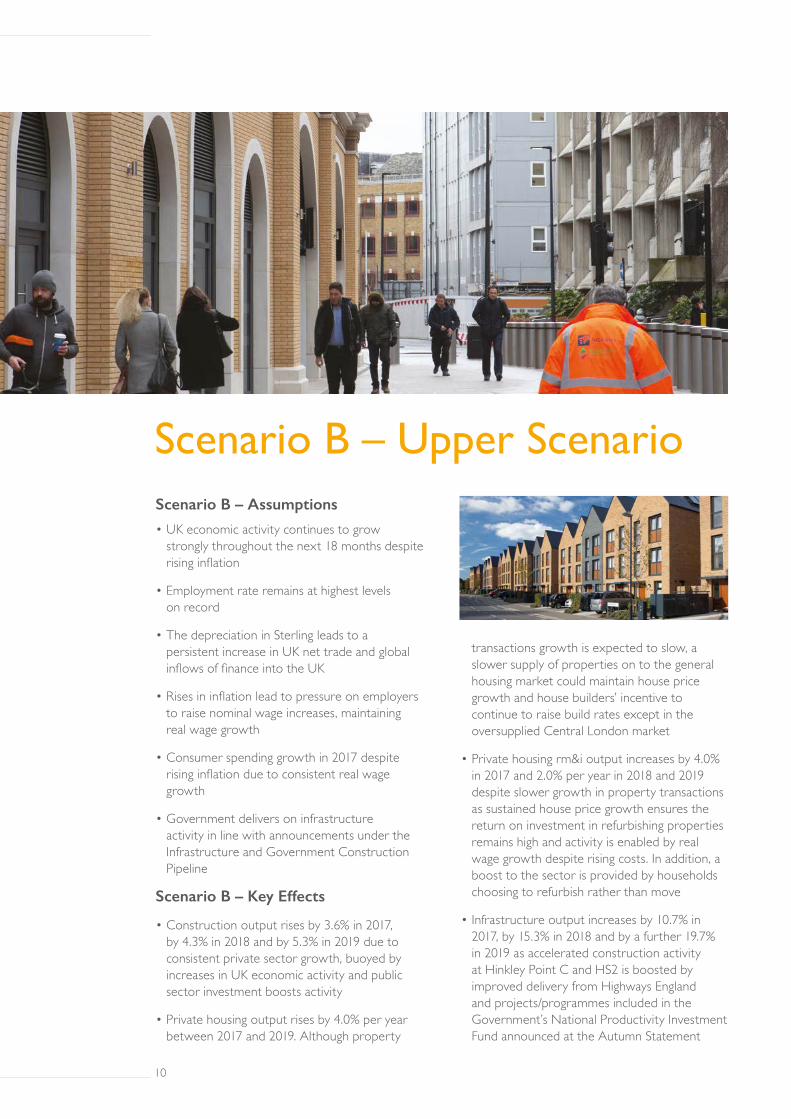
Scenario B – Upper ScenarioScenario B – Assumptions
• UK economic activity continues to grow strongly throughout the next 18 months despite rising inflation
• Employment rate remains at highest levels on record
• The depreciation in Sterling leads to a persistent increase in UK net trade and global inflows of finance into the UK
• Rises in inflation lead to pressure on employers to raise nominal wage increases, maintaining real wage growth
• Consumer spending growth in 2017 despite rising inflation due to consistent real wage growth
• Government delivers on infrastructure activity in line with announcements under the Infrastructure and Government Construction Pipeline
Scenario B – Key Effects
• Construction output rises by 3.6% in 2017, by 4.3% in 2018 and by 5.3% in 2019 due to consistent private sector growth, buoyed by increases in UK economic activity and public sector investment boosts activity
• Private housing output rises by 4.0% per year between 2017 and 2019. Although property
transactions growth is expected to slow, a slower supply of properties on to the general housing market could maintain house price growth and house builders’ incentive to continue to raise build rates except in the oversupplied Central London market
• Private housing rm&i output increases by 4.0% in 2017 and 2.0% per year in 2018 and 2019 despite slower growth in property transactions as sustained house price growth ensures the return on investment in refurbishing properties remains high and activity is enabled by real wage growth despite rising costs. In addition, a boost to the sector is provided by households choosing to refurbish rather than move
• Infrastructure output increases by 10.7% in 2017, by 15.3% in 2018 and by a further 19.7% in 2019 as accelerated construction activity at Hinkley Point C and HS2 is boosted by improved delivery from Highways England and projects/programmes included in the Government’s National Productivity Investment Fund announced at the Autumn Statement
10 11
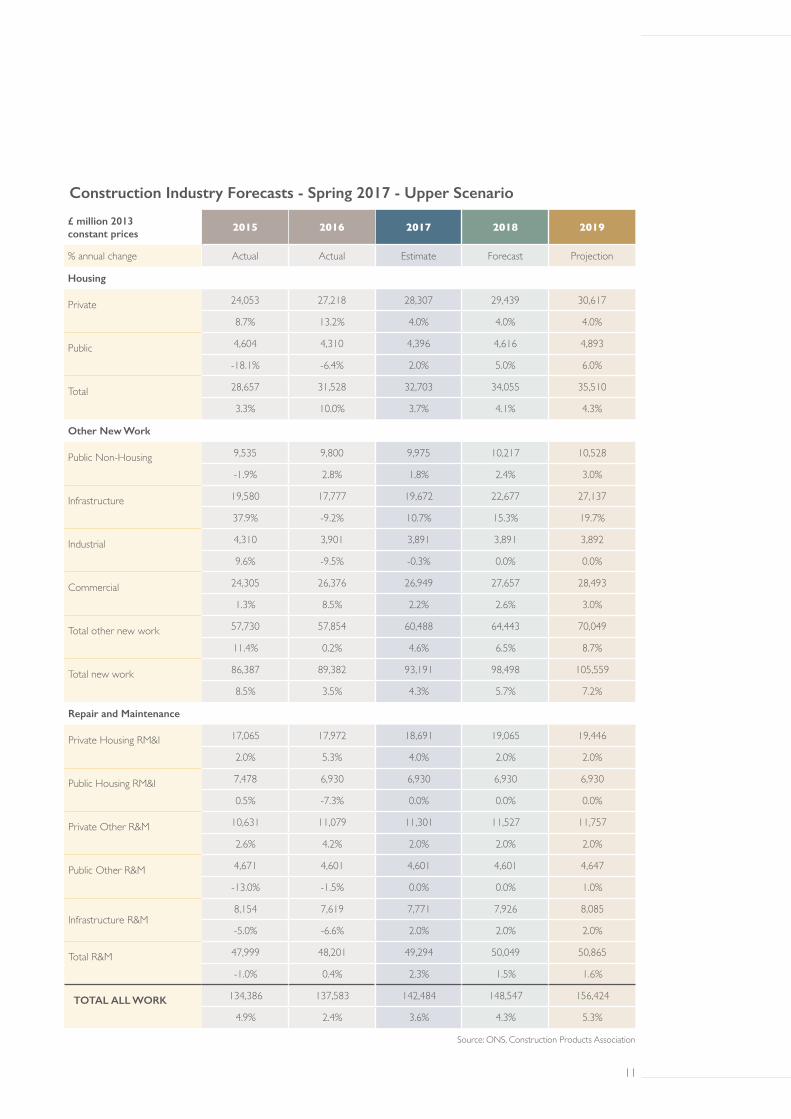
Construction Industry Forecasts - Spring 2017 - Upper Scenario
£ million 2013 constant prices
2015 2016 2017 2018 2019
% annual change Actual Actual Estimate Forecast Projection
Housing
Private
24,053 27,218 28,307 29,439 30,617
8.7% 13.2% 4.0% 4.0% 4.0%
Public
4,604 4,310 4,396 4,616 4,893
-18.1% -6.4% 2.0% 5.0% 6.0%
Total
28,657 31,528 32,703 34,055 35,510
3.3% 10.0% 3.7% 4.1% 4.3%
Other New Work
Public Non-Housing
9,535 9,800 9,975 10,217 10,528
-1.9% 2.8% 1.8% 2.4% 3.0%
Infrastructure
19,580 17,777 19,672 22,677 27,137
37.9% -9.2% 10.7% 15.3% 19.7%
Industrial
4,310 3,901 3,891 3,891 3,892
9.6% -9.5% -0.3% 0.0% 0.0%
Commercial
24,305 26,376 26,949 27,657 28,493
1.3% 8.5% 2.2% 2.6% 3.0%
Total other new work
57,730 57,854 60,488 64,443 70,049
11.4% 0.2% 4.6% 6.5% 8.7%
Total new work
86,387 89,382 93,191 98,498 105,559
8.5% 3.5% 4.3% 5.7% 7.2%
Repair and Maintenance
Private Housing RM&I
17,065 17,972 18,691 19,065 19,446
2.0% 5.3% 4.0% 2.0% 2.0%
Public Housing RM&I
7,478 6,930 6,930 6,930 6,930
0.5% -7.3% 0.0% 0.0% 0.0%
Private Other R&M
10,631 11,079 11,301 11,527 11,757
2.6% 4.2% 2.0% 2.0% 2.0%
Public Other R&M
4,671 4,601 4,601 4,601 4,647
-13.0% -1.5% 0.0% 0.0% 1.0%
Infrastructure R&M8,154 7,619 7,771 7,926 8,085
-5.0% -6.6% 2.0% 2.0% 2.0%
Total R&M
47,999 48,201 49,294 50,049 50,865
-1.0% 0.4% 2.3% 1.5% 1.6%
TOTAL ALL WORK
134,386 137,583 142,484 148,547 156,424
4.9% 2.4% 3.6% 4.3% 5.3%
Source: ONS, Construction Products Association
10 11
12 13
12 13
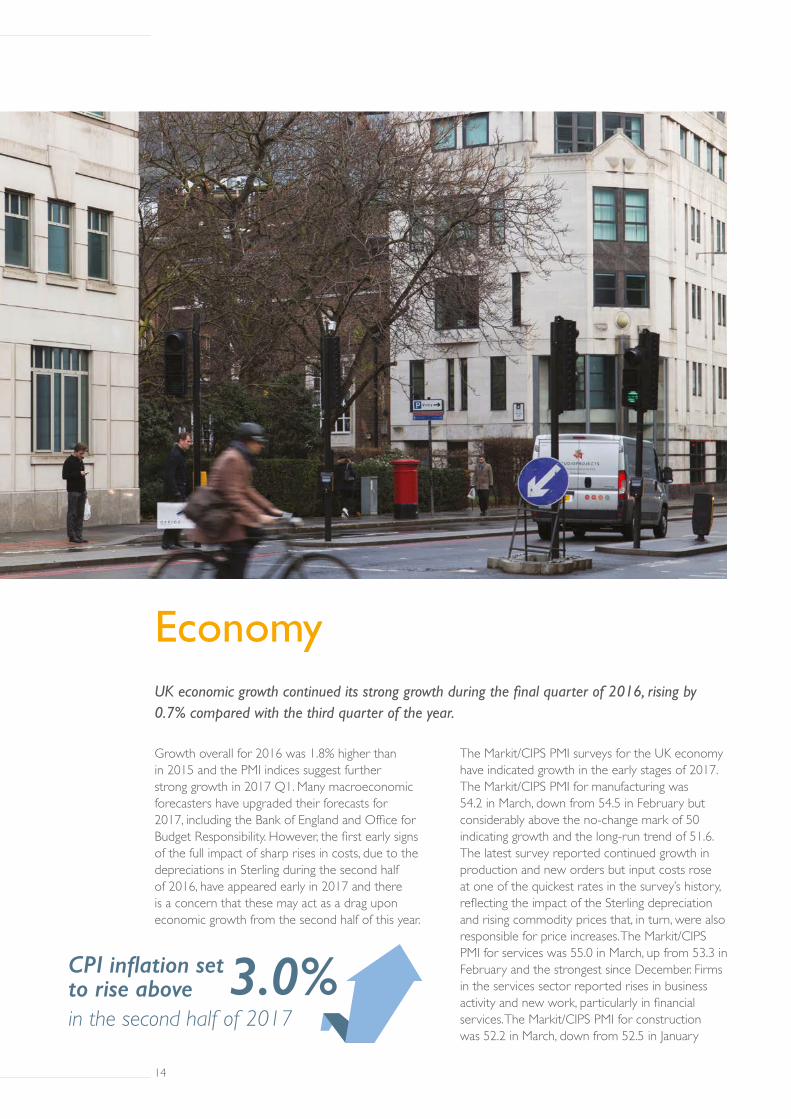
Growth overall for 2016 was 1.8% higher than in 2015 and the PMI indices suggest further strong growth in 2017 Q1. Many macroeconomic forecasters have upgraded their forecasts for 2017, including the Bank of England and Office for Budget Responsibility. However, the first early signs of the full impact of sharp rises in costs, due to the depreciations in Sterling during the second half of 2016, have appeared early in 2017 and there is a concern that these may act as a drag upon economic growth from the second half of this year.
EconomyUK economic growth continued its strong growth during the final quarter of 2016, rising by 0.7% compared with the third quarter of the year.
The Markit/CIPS PMI surveys for the UK economy have indicated growth in the early stages of 2017. The Markit/CIPS PMI for manufacturing was 54.2 in March, down from 54.5 in February but considerably above the no-change mark of 50 indicating growth and the long-run trend of 51.6. The latest survey reported continued growth in production and new orders but input costs rose at one of the quickest rates in the survey’s history, reflecting the impact of the Sterling depreciation and rising commodity prices that, in turn, were also responsible for price increases. The Markit/CIPS PMI for services was 55.0 in March, up from 53.3 in February and the strongest since December. Firms in the services sector reported rises in business activity and new work, particularly in financial services. The Markit/CIPS PMI for construction was 52.2 in March, down from 52.5 in January
CPI inflation set to rise abovein the second half of 2017
3.0%
14 15
but still indicating that activity increased. Activity accelerated in commercial and civil engineering but slowed in residential. The latest overall reading signalled the slowest expansion in business activity since September 2016, with firms attributing this to tighter client budgets and concerns regarding cost inflation.
In February 2017, the Bank of England upwardly revised its UK growth forecast for 2017 to 2.0%, a significant revision upward from the 1.4% forecast just three months earlier. The Bank stated that consumer spending growth is projected to be sustained by a fall in the saving ratio to its lowest level on record. In addition, in March, the Office for Budget Responsibility also raised its UK growth forecast to 2.0% in 2017.
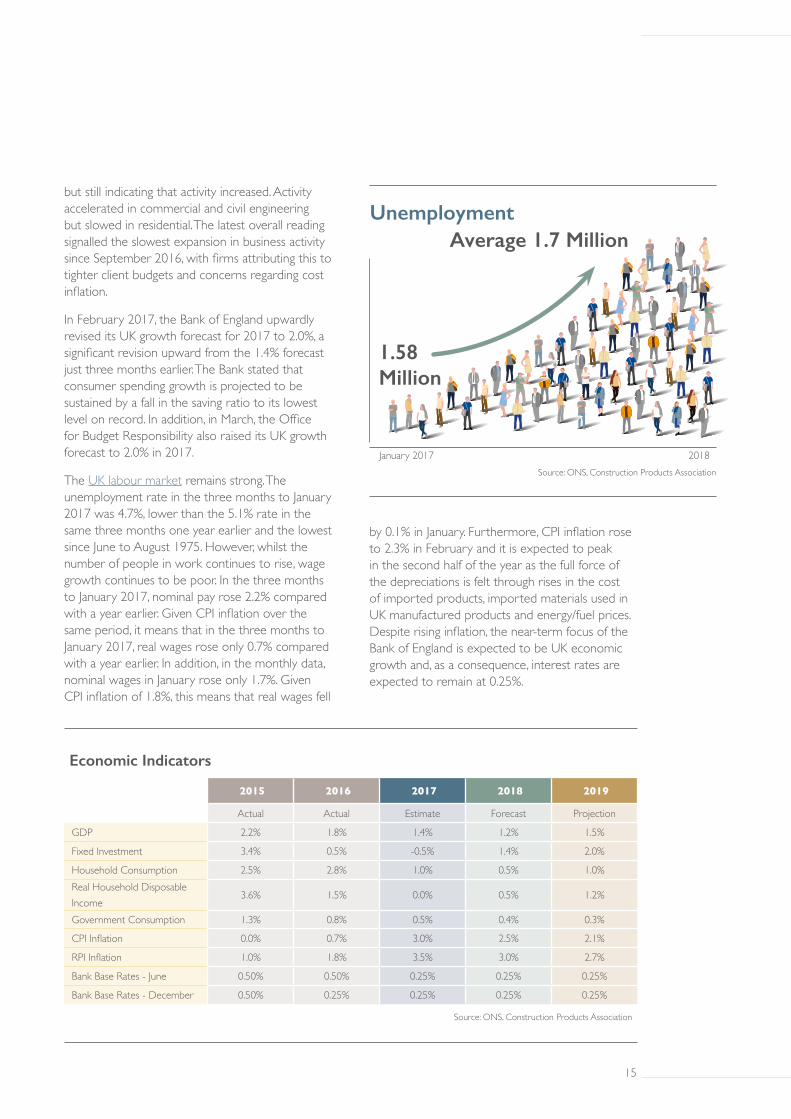
The UK labour market remains strong. The unemployment rate in the three months to January 2017 was 4.7%, lower than the 5.1% rate in the same three months one year earlier and the lowest since June to August 1975. However, whilst the number of people in work continues to rise, wage growth continues to be poor. In the three months to January 2017, nominal pay rose 2.2% compared with a year earlier. Given CPI inflation over the same period, it means that in the three months to January 2017, real wages rose only 0.7% compared with a year earlier. In addition, in the monthly data, nominal wages in January rose only 1.7%. Given CPI inflation of 1.8%, this means that real wages fell
by 0.1% in January. Furthermore, CPI inflation rose to 2.3% in February and it is expected to peak in the second half of the year as the full force of the depreciations is felt through rises in the cost of imported products, imported materials used in UK manufactured products and energy/fuel prices. Despite rising inflation, the near-term focus of the Bank of England is expected to be UK economic growth and, as a consequence, interest rates are expected to remain at 0.25%.
Economic Indicators
2015 2016 2017 2018 2019
Actual Actual Estimate Forecast Projection
GDP 2.2% 1.8% 1.4% 1.2% 1.5%
Fixed Investment 3.4% 0.5% -0.5% 1.4% 2.0%
Household Consumption 2.5% 2.8% 1.0% 0.5% 1.0%Real Household Disposable Income
3.6% 1.5% 0.0% 0.5% 1.2%
Government Consumption 1.3% 0.8% 0.5% 0.4% 0.3%
CPI Inflation 0.0% 0.7% 3.0% 2.5% 2.1%
RPI Inflation 1.0% 1.8% 3.5% 3.0% 2.7%
Bank Base Rates - June 0.50% 0.50% 0.25% 0.25% 0.25%
Bank Base Rates - December 0.50% 0.25% 0.25% 0.25% 0.25%
Source: ONS, Construction Products Association
UnemploymentAverage 1.7 Million
1.58 Million
January 2017 2018Source: ONS, Construction Products Association
14 15
The uncertainty following the vote to leave the EU would primarily be expected to impact adversely on UK business investment. In the third quarter of 2016, business investment was estimated to have risen by 0.4% but business investment in Q4 fell 0.9% and, overall in 2016 was 1.5% lower than in 2015. Without a reduction in the uncertainty, the impacts on business investment are likely to be felt in 2017 as well, with a 2.0% fall in business investment expected this year. The fall in business investment is expected to particularly impact in UK manufacturing for the domestic market and in sectors that have an international market that focuses on the EU such as financial services.
Downside Risks:
• Economic activity slows considerably in the second half of 2017
• Unemployment rises due to the fall in economic activity
• Real wages fall due to rising inflation combined with constrained nominal wage growth due to rising unemployment
• Lending to businesses is weak despite Bank measures to increase liquidity and lending
If UK economic activity slows more than expected during the second half of 2017, this will impact upon consumer and business confidence. This may lead to falls in consumer spending and business investment and, in turn, would slow economic activity further leading to a rise in unemployment. The Bank of England’s cut in the interest rate and boosts to liquidity and lending may have little impact as the impacts of a slowdown offset any potential for improvements in lending. A persistent fall in Sterling would be likely to impact upon import prices, and therefore UK inflation at a time when wage growth is likely to be constrained by the rise in unemployment.
Upside Risks:
• UK economic activity rises significantly in the second half of 2017
• Unemployment continues to be subdued
• The depreciation in Sterling leads to a persistent increase in UK net trade and global inflows of finance into the UK
• Real wages continue to grow despite the anticipated rise in inflation
• Measures by the Bank of England to boost lending and liquidity help to ensure that businesses and consumers have finance available
• Consumer spending growth in 2017 despite rising inflation
If UK economic activity continues to grow at rates of 0.5% per quarter or above, the unemployment rate would be anticipated to remain at historic lows. The UK economy would be likely to benefit
16 17
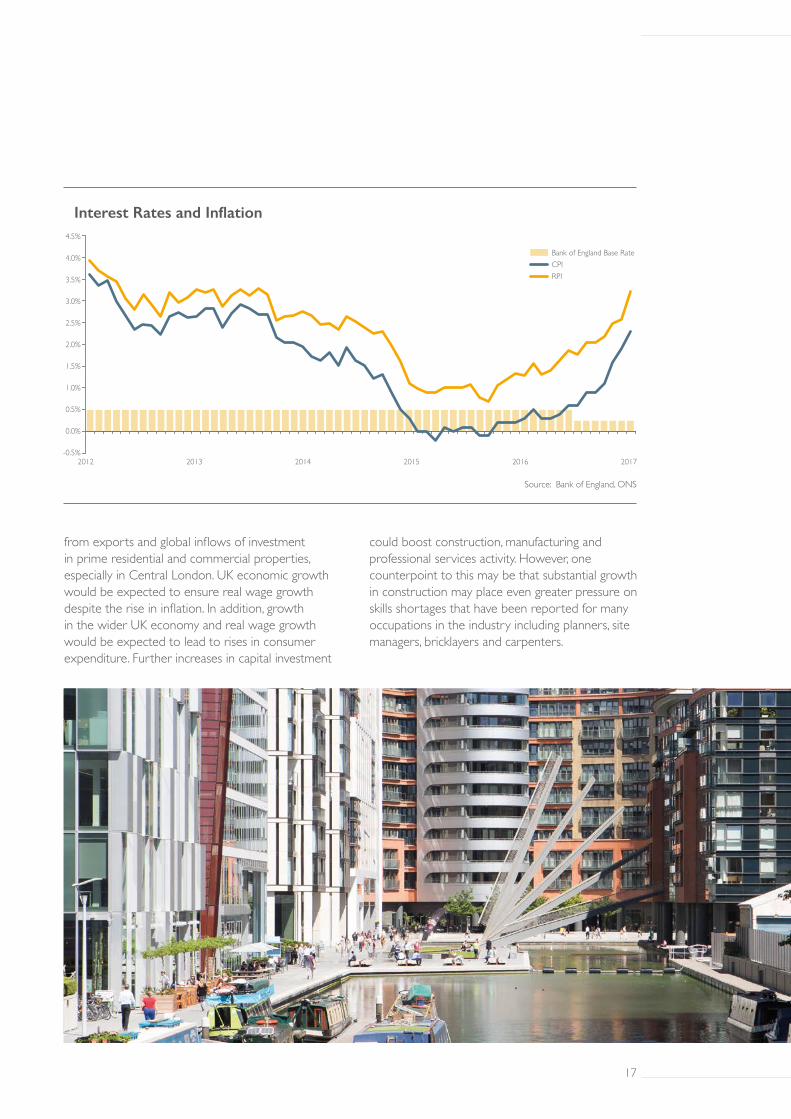
from exports and global inflows of investment in prime residential and commercial properties, especially in Central London. UK economic growth would be expected to ensure real wage growth despite the rise in inflation. In addition, growth in the wider UK economy and real wage growth would be expected to lead to rises in consumer expenditure. Further increases in capital investment
could boost construction, manufacturing and professional services activity. However, one counterpoint to this may be that substantial growth in construction may place even greater pressure on skills shortages that have been reported for many occupations in the industry including planners, site managers, bricklayers and carpenters.
2012 2013 2014 2015 2016 2017
4.5%
4.0%
3.5%
3.0%
2.5%
2.0%
1.5%
1.0%
0.5%
0.0%
-0.5%
Bank of England Base RateCPIRPI
Interest Rates and Inflation
Source: Bank of England, ONS
16 17

18 19
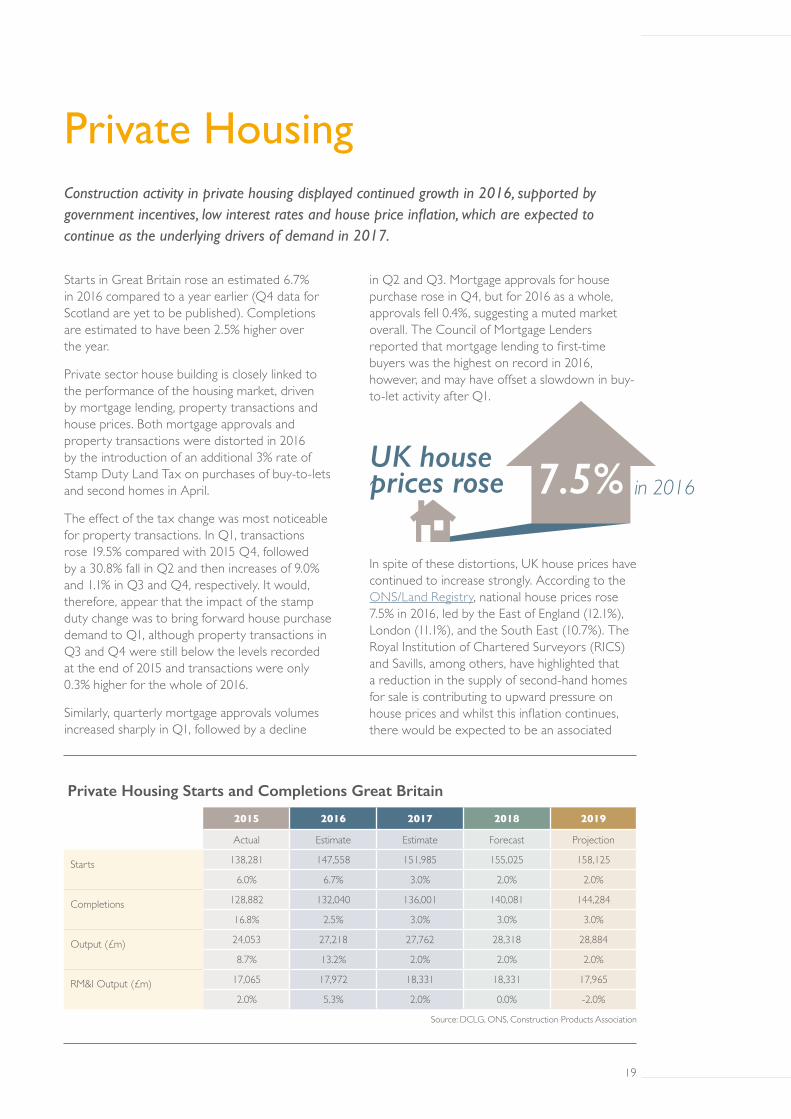
Construction activity in private housing displayed continued growth in 2016, supported by government incentives, low interest rates and house price inflation, which are expected to continue as the underlying drivers of demand in 2017.
Private Housing
Starts in Great Britain rose an estimated 6.7% in 2016 compared to a year earlier (Q4 data for Scotland are yet to be published). Completions are estimated to have been 2.5% higher over the year.
Private sector house building is closely linked to the performance of the housing market, driven by mortgage lending, property transactions and house prices. Both mortgage approvals and property transactions were distorted in 2016 by the introduction of an additional 3% rate of Stamp Duty Land Tax on purchases of buy-to-lets and second homes in April.
The effect of the tax change was most noticeable for property transactions. In Q1, transactions rose 19.5% compared with 2015 Q4, followed by a 30.8% fall in Q2 and then increases of 9.0% and 1.1% in Q3 and Q4, respectively. It would, therefore, appear that the impact of the stamp duty change was to bring forward house purchase demand to Q1, although property transactions in Q3 and Q4 were still below the levels recorded at the end of 2015 and transactions were only 0.3% higher for the whole of 2016.
Similarly, quarterly mortgage approvals volumes increased sharply in Q1, followed by a decline
in Q2 and Q3. Mortgage approvals for house purchase rose in Q4, but for 2016 as a whole, approvals fell 0.4%, suggesting a muted market overall. The Council of Mortgage Lenders reported that mortgage lending to first-time buyers was the highest on record in 2016, however, and may have offset a slowdown in buy-to-let activity after Q1.
In spite of these distortions, UK house prices have continued to increase strongly. According to the ONS/Land Registry, national house prices rose 7.5% in 2016, led by the East of England (12.1%), London (11.1%), and the South East (10.7%). The Royal Institution of Chartered Surveyors (RICS) and Savills, among others, have highlighted that a reduction in the supply of second-hand homes for sale is contributing to upward pressure on house prices and whilst this inflation continues, there would be expected to be an associated
Private Housing Starts and Completions Great Britain
2015 2016 2017 2018 2019
Actual Estimate Estimate Forecast Projection
Starts
138,281 147,558 151,985 155,025 158,125
6.0% 6.7% 3.0% 2.0% 2.0%
Completions
128,882 132,040 136,001 140,081 144,284
16.8% 2.5% 3.0% 3.0% 3.0%
Output (£m)
24,053 27,218 27,762 28,318 28,884
8.7% 13.2% 2.0% 2.0% 2.0%
RM&I Output (£m) 17,065 17,972 18,331 18,331 17,965
2.0% 5.3% 2.0% 0.0% -2.0%
Source: DCLG, ONS, Construction Products Association
UK house prices rose in 20167.5%
18 19
increase in house building. In March, the Office for Budget Responsibility (OBR) forecast house prices to rise 6.5% in 2017 and 4.0% in 2018. However, reflecting uncertainty over the outlook for the housing market in 2017, HM Treasury’s comparison of independent economic forecasts for house price inflation in the year to 2017 Q4 ranged from 0.0% to +8.1%. For 2018 Q4, forecasts ranged between -2.0% and +6.0%.
The Help to Buy equity loan, which was introduced in April 2013, has been a significant government policy for supporting building activity. Between its introduction in April 2013 and December 2016, the equity loan was used on 112,338 transactions in England, and whilst this accounts for only 2.9% of property transactions over the period, it represents 29.0% of new build completions. Furthermore, in 2016 Q4, this proportion rose to 39.8%, echoing estimates from major house builders that equity loan purchases account for up to 40% of their sales. The counterpart schemes in Scotland and Wales have accounted for a similar proportion of transactions and building activity. In England and Wales, the equity loan scheme will be in operation until 2020, but in Scotland, the maximum eligible purchase value under the scheme will be tapered, from £230,000 to £200,000 from April 2017 and
to £175,000 from April 2018. Despite the strong uptake nationwide, it is difficult to ascertain the substitution impact of how many of these purchases would still have occurred had the policy not been in place.
In early 2017, the government awarded bids for two funding programmes that aim to encourage local authorities to bring forward or remediate land suitable for housing. £6 million has been set aside to prepare land for 14 new garden villages, which the government hopes will lead to 25,000 starts by 2020. In addition, 30 local authority partnerships were established by government in January under the £1.2 billion Starter Homes Land Fund, to support the acquisition, remediation and de-risking of land for starter home developments (homes sold to buyers aged between 23 and 40, at a 20% discount from the market price). This latter policy signals a potential to unlock brownfield development on sites that would not otherwise be used for housing, but questions remain over the suitability of Starter Homes for mortgage lenders (particularly concerning valuations), as well as government commitments to the previously stated target of 200,000 homes under this scheme. It is, therefore, unlikely that construction will start until the later years of the forecast period.
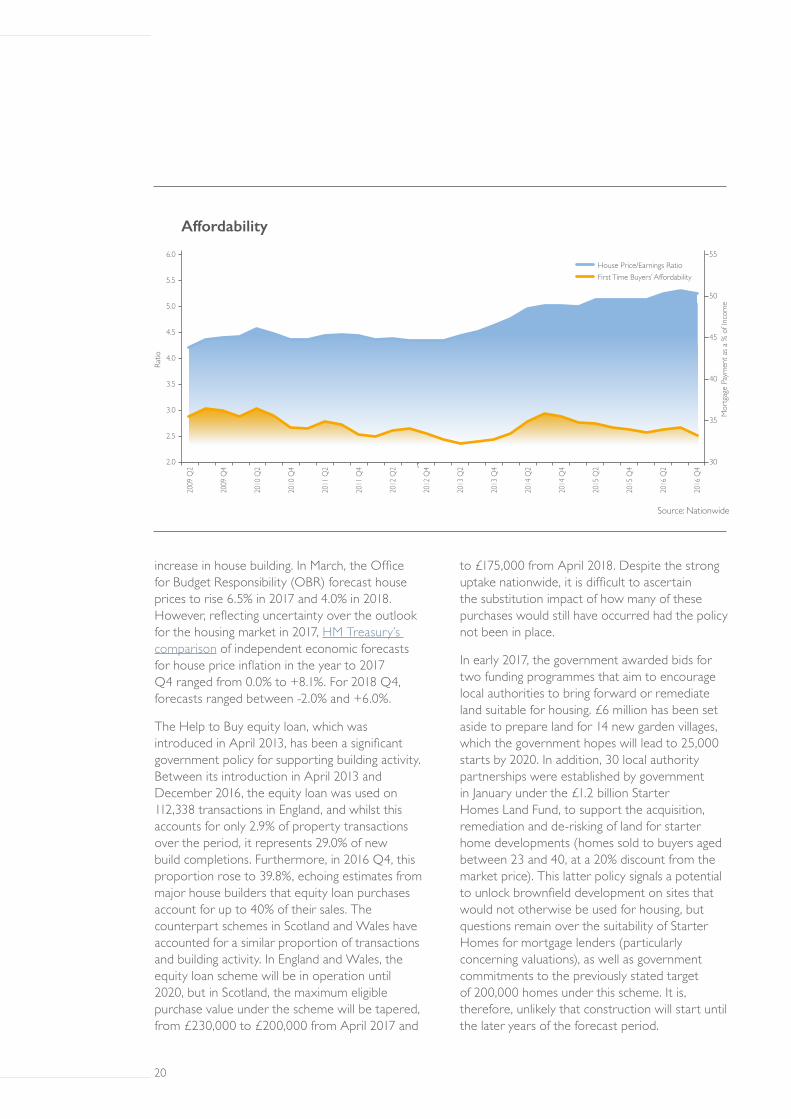
House Price/Earnings RatioFirst Time Buyers’ Affordability
2009
Q2
2009
Q4
2010
Q2
2010
Q4
2011
Q2
2011
Q4
2012
Q2
2012
Q4
2013
Q2
2013
Q4
2014
Q2
2014
Q4
2015
Q2
2015
Q4
2016
Q2
2016
Q4
6.0
5.5
5.0
4.5
4.0
3.5
3.0
2.5
2.0
55
50
45
40
35
30
Ratio
Mor
tgag
e Pa
ymen
t as a
% o
f Inc
ome
Affordability
Source: Nationwide
20 21
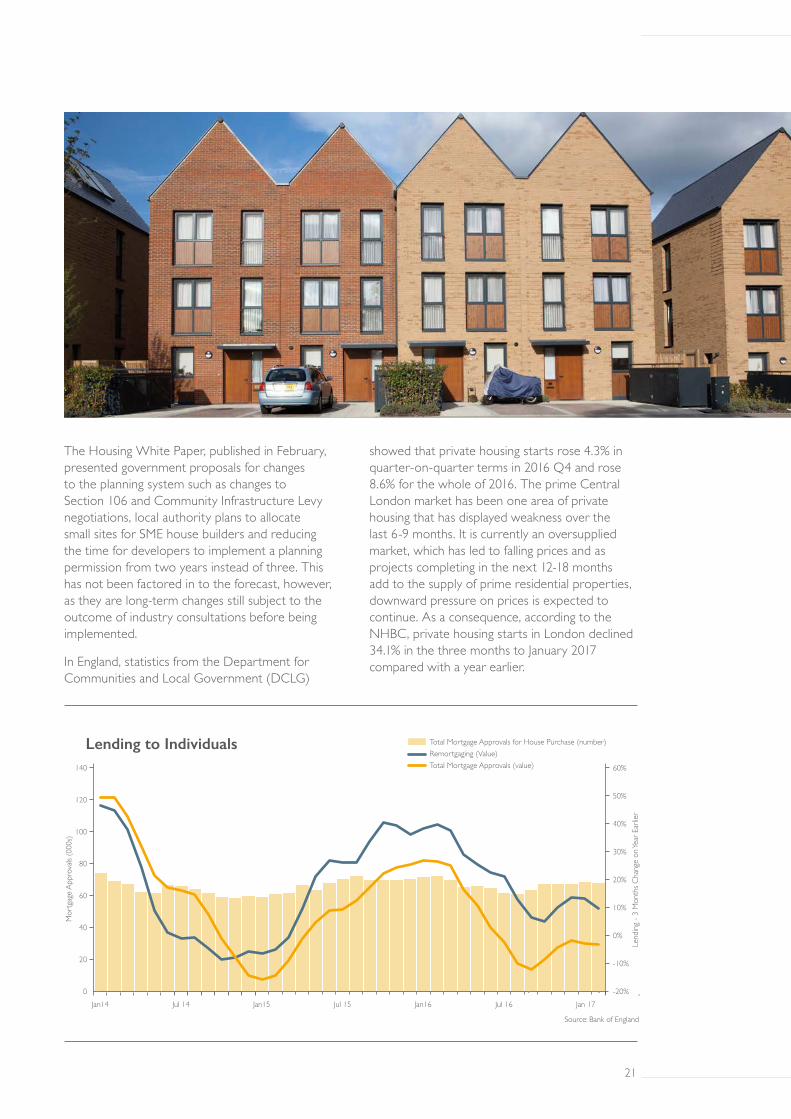
The Housing White Paper, published in February, presented government proposals for changes to the planning system such as changes to Section 106 and Community Infrastructure Levy negotiations, local authority plans to allocate small sites for SME house builders and reducing the time for developers to implement a planning permission from two years instead of three. This has not been factored in to the forecast, however, as they are long-term changes still subject to the outcome of industry consultations before being implemented.
In England, statistics from the Department for Communities and Local Government (DCLG)
showed that private housing starts rose 4.3% in quarter-on-quarter terms in 2016 Q4 and rose 8.6% for the whole of 2016. The prime Central London market has been one area of private housing that has displayed weakness over the last 6-9 months. It is currently an oversupplied market, which has led to falling prices and as projects completing in the next 12-18 months add to the supply of prime residential properties, downward pressure on prices is expected to continue. As a consequence, according to the NHBC, private housing starts in London declined 34.1% in the three months to January 2017 compared with a year earlier.
Jan14 Jul 14 Jan15 Jul 15 Jan16 Jul 16 Jan 17
140
120
100
80
60
40
20
0
Mor
tgag
e Ap
prov
als (0
00s)
Lending to Individuals
Source: Bank of England
Total Mortgage Approvals for House Purchase (number)Remortgaging (Value)Total Mortgage Approvals (value) 60%
50%
40%
30%
20%
10%
0%
-10%
-20%
Lend
ing -
3 M
onth
s Cha
nge
on Ye
ar E
arlie
r
20 21
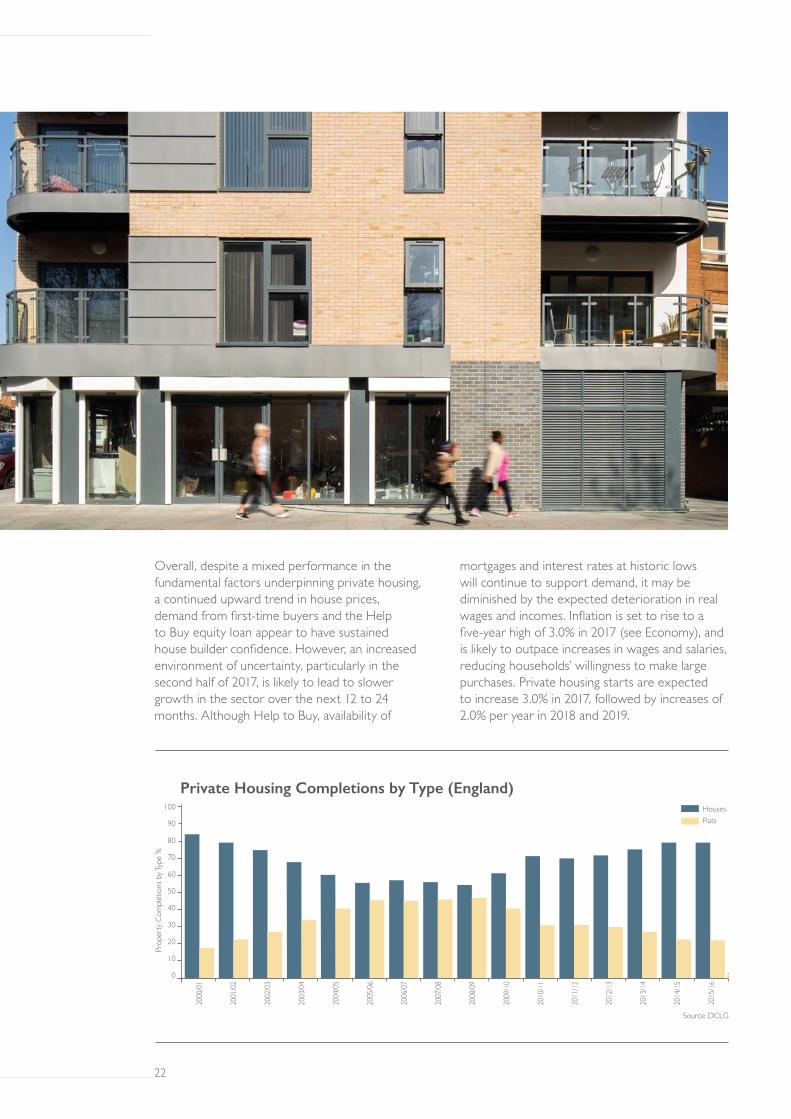
Overall, despite a mixed performance in the fundamental factors underpinning private housing, a continued upward trend in house prices, demand from first-time buyers and the Help to Buy equity loan appear to have sustained house builder confidence. However, an increased environment of uncertainty, particularly in the second half of 2017, is likely to lead to slower growth in the sector over the next 12 to 24 months. Although Help to Buy, availability of
mortgages and interest rates at historic lows will continue to support demand, it may be diminished by the expected deterioration in real wages and incomes. Inflation is set to rise to a five-year high of 3.0% in 2017 (see Economy), and is likely to outpace increases in wages and salaries, reducing households’ willingness to make large purchases. Private housing starts are expected to increase 3.0% in 2017, followed by increases of 2.0% per year in 2018 and 2019.
Prop
erty
Com
plet
ions
by T
ype
%
HousesFlats
2000
/01
2001
/02
2002
/03
2003
/04
2004
/05
2005
/06
2006
/07
2007
/08
2008
/09
2009
/10
2010
/11
2011
/12
2012
/13
2013
/14
2014
/15
2015
/16
100
90
80
70
60
50
40
30
20
10
0
Private Housing Completions by Type (England)
Source: DCLG
22 23
Downside Risks:
• Consumers react quickly to rising inflation
• Mortgage lending falls in 2017 despite record-low interest rates
• A decline in property transactions in 2017
• House price growth slows significantly or falls in 2017
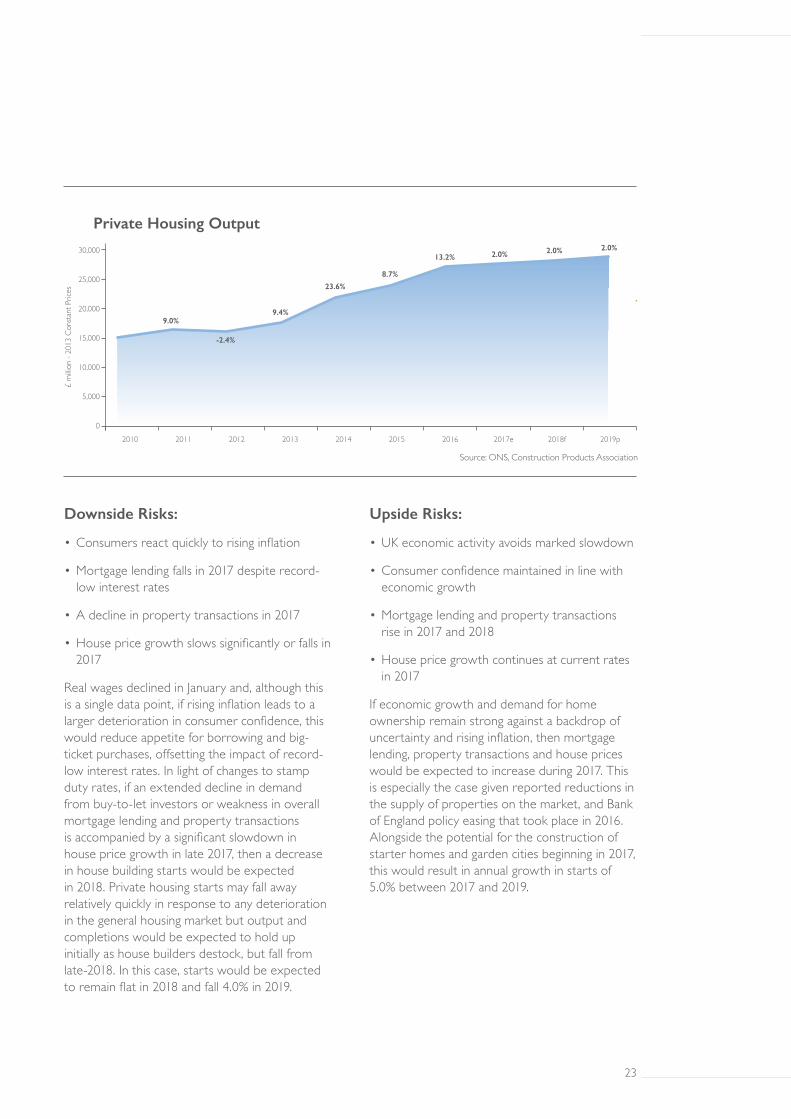
Real wages declined in January and, although this is a single data point, if rising inflation leads to a larger deterioration in consumer confidence, this would reduce appetite for borrowing and big-ticket purchases, offsetting the impact of record-low interest rates. In light of changes to stamp duty rates, if an extended decline in demand from buy-to-let investors or weakness in overall mortgage lending and property transactions is accompanied by a significant slowdown in house price growth in late 2017, then a decrease in house building starts would be expected in 2018. Private housing starts may fall away relatively quickly in response to any deterioration in the general housing market but output and completions would be expected to hold up initially as house builders destock, but fall from late-2018. In this case, starts would be expected to remain flat in 2018 and fall 4.0% in 2019.
Upside Risks:
• UK economic activity avoids marked slowdown
• Consumer confidence maintained in line with economic growth
• Mortgage lending and property transactions rise in 2017 and 2018
• House price growth continues at current rates in 2017
If economic growth and demand for home ownership remain strong against a backdrop of uncertainty and rising inflation, then mortgage lending, property transactions and house prices would be expected to increase during 2017. This is especially the case given reported reductions in the supply of properties on the market, and Bank of England policy easing that took place in 2016. Alongside the potential for the construction of starter homes and garden cities beginning in 2017, this would result in annual growth in starts of 5.0% between 2017 and 2019.
2010 2011 2012 2013 2014 2015 2016 2017e 2018f 2019p
30,000
25,000
20,000
15,000
10,000
5,000
0
Private Housing Output
£ m
illion
- 20
13 C
onsta
nt P
rices
Source: ONS, Construction Products Association
23.6%
-2.4%
13.2%
9.0%
8.7%
9.4%
2.0% 2.0% 2.0%
22 23
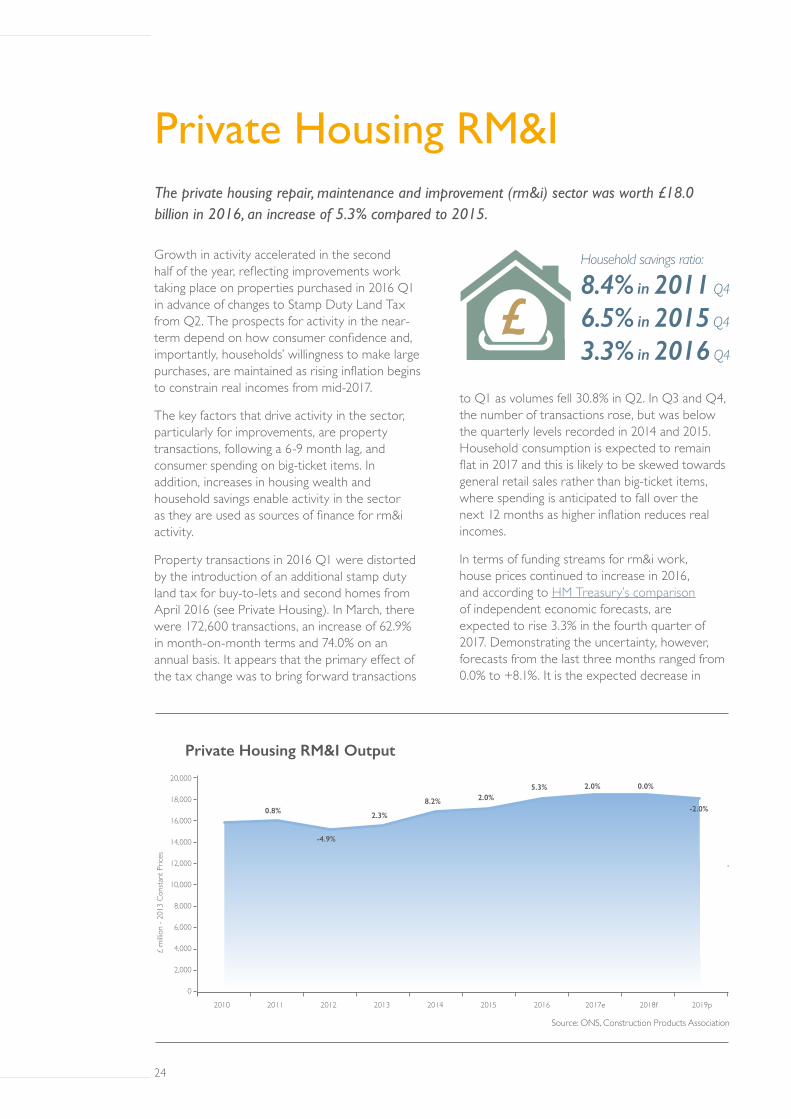
Growth in activity accelerated in the second half of the year, reflecting improvements work taking place on properties purchased in 2016 Q1 in advance of changes to Stamp Duty Land Tax from Q2. The prospects for activity in the near-term depend on how consumer confidence and, importantly, households’ willingness to make large purchases, are maintained as rising inflation begins to constrain real incomes from mid-2017.
The key factors that drive activity in the sector, particularly for improvements, are property transactions, following a 6-9 month lag, and consumer spending on big-ticket items. In addition, increases in housing wealth and household savings enable activity in the sector as they are used as sources of finance for rm&i activity.
Property transactions in 2016 Q1 were distorted by the introduction of an additional stamp duty land tax for buy-to-lets and second homes from April 2016 (see Private Housing). In March, there were 172,600 transactions, an increase of 62.9% in month-on-month terms and 74.0% on an annual basis. It appears that the primary effect of the tax change was to bring forward transactions
to Q1 as volumes fell 30.8% in Q2. In Q3 and Q4, the number of transactions rose, but was below the quarterly levels recorded in 2014 and 2015. Household consumption is expected to remain flat in 2017 and this is likely to be skewed towards general retail sales rather than big-ticket items, where spending is anticipated to fall over the next 12 months as higher inflation reduces real incomes.
In terms of funding streams for rm&i work, house prices continued to increase in 2016, and according to HM Treasury’s comparison of independent economic forecasts, are expected to rise 3.3% in the fourth quarter of 2017. Demonstrating the uncertainty, however, forecasts from the last three months ranged from 0.0% to +8.1%. It is the expected decrease in
Private Housing RM&IThe private housing repair, maintenance and improvement (rm&i) sector was worth £18.0 billion in 2016, an increase of 5.3% compared to 2015.
Household savings ratio:
8.4% in 2011 Q4
6.5% in 2015 Q4
3.3% in 2016 Q4
24 25
20,000
18,000
16,000
14,000
12,000
10,000
8,000
6,000
4,000
2,000
0
Private Housing RM&I Output
£ m
illion
- 20
13 C
onsta
nt P
rices
Source: ONS, Construction Products Association
8.2%
-4.9%
5.3%
0.8%
2.0%
2.3%
2.0% 0.0%
-2.0%
2010 2011 2012 2013 2014 2015 2016 2017e 2018f 2019p
real wages during 2017 and 2018 that may have a larger impact on consumer confidence, especially for purchases of big-ticket items. Consumer price inflation is expected to outpace growth in wages and worsen real incomes. Savings have previously been used to fund housing improvements, but the household savings ratio was at a record low of 3.3 in 2016 Q4, down from 5.3 in Q3 and 5.9 in Q2. This sharp fall in Q4 largely reflects a reduction in pensions equity, but the savings ratio has fallen from a post-recession peak of 11.5 in 2010 Q1. Therefore, it is unlikely to continue to be a driver of rm&i activity, especially as heightened uncertainty makes householders more risk averse. In addition, households are taking advantage of record-low mortgage interest rates to repay housing equity. In 2016 Q4, £10.2 billion was repaid by households, in contrast to the pre-recession period when similar levels were being withdrawn from housing equity and used as funding for rm&i work.
Activity under the current Energy Company Obligation (ECO) slowed considerably before its end in March 2017. New policies to boost energy-efficiency will provide certainty of government policy going forward but are likely to only have a slight positive impact on activity in the sector in the near-term. In 2017/18, there is a one-year transition towards a five-year programme of ECO: Help to Heat, valued at around £640 million and focusing on fuel poverty. However, this is lower than the £770 million spent under ECO currently and considerably lower than the £1.3 billion per year initially spent on ECO before expenditure was cut by one-third in December 2013.
These factors combined are expected to hinder output from the private housing rm&i sector beyond 2017. Output is forecast to rise 2.0% in 2017, reflecting current favourable consumer sentiment. Activity is forecast to remain flat in 2018 and fall 2.0% in 2019, however, reflecting weaker consumer confidence and lower discretionary spending and property transactions as inflation rises.
Downside Risks:
• Consumers retrench quickly in response to higher inflation
• A fall in property transactions and house prices in 2017
• ECO: Help to Heat implementation delayed as has happened with previous supplier obligations
An immediate deterioration in consumer confidence due to falling real incomes or a rise in economic uncertainty could have a larger impact upon big-ticket spending as households adopt a precautionary savings stance. Whilst this is unlikely to impact on basic repairs and maintenance, it could have a large impact on refurbishment work especially in the near-term. In terms of energy-efficient retrofit work, any potential hiatus between the end of ECO and ECO: Help to Heat schemes could lead to a further drop off in activity in 2017/18 or 2018/19. In this case, output would be expected to remain flat in 2017 and decline 3.0% each year in 2018 and 2019.
Upside Risks:
• Rising inflation has limited impact on consumer confidence
• Mortgage lending conditions and low interest rates enable housing demand
• Property transactions increase in 2017 and 2018
• House price inflation is matched in 2017
If UK consumer spending is unaffected by rising inflation, and property transactions and house price growth remain strong, the prospects for rm&i remain positive. Whilst UK economic growth is still expected to be below the long-term trend in 2017 and 2018, rm&i activity could accelerate as rises in transactions drive an increase in property refurbishment and improvements spending. This would drive growth rates of 4.0% in 2017 and 2.0% in both 2018 and 2019.
24 25

26 27

26 27
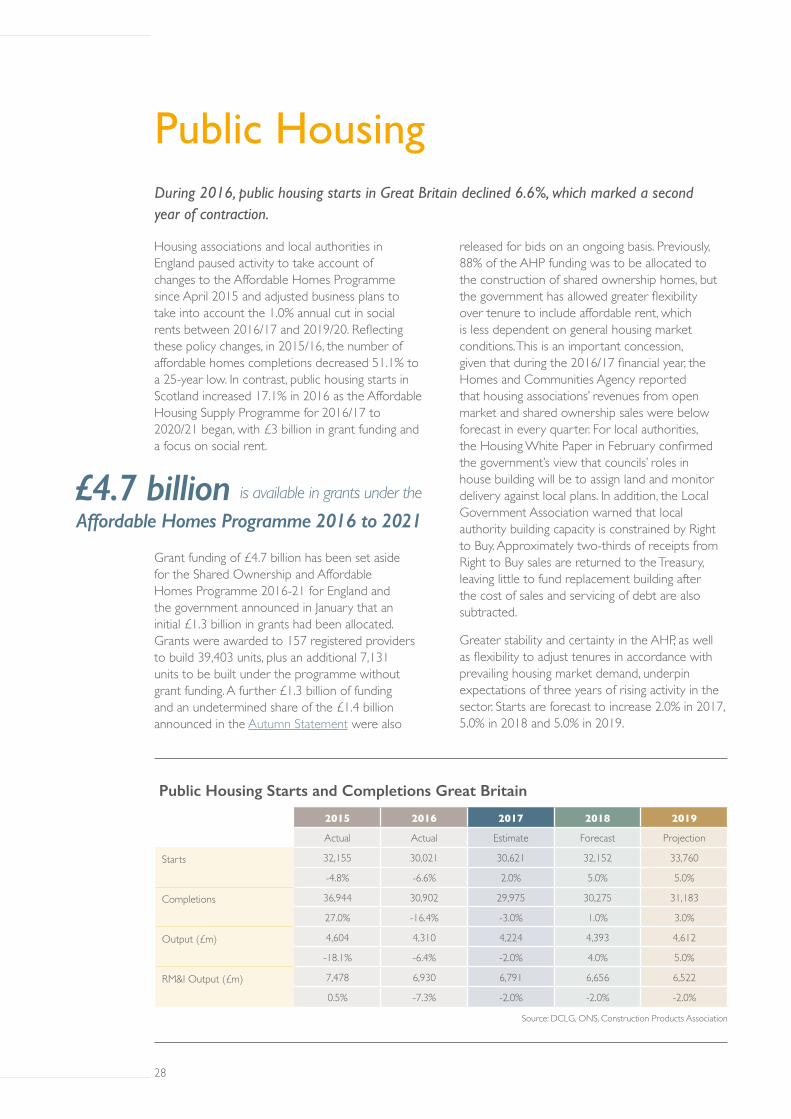
Housing associations and local authorities in England paused activity to take account of changes to the Affordable Homes Programme since April 2015 and adjusted business plans to take into account the 1.0% annual cut in social rents between 2016/17 and 2019/20. Reflecting these policy changes, in 2015/16, the number of affordable homes completions decreased 51.1% to a 25-year low. In contrast, public housing starts in Scotland increased 17.1% in 2016 as the Affordable Housing Supply Programme for 2016/17 to 2020/21 began, with £3 billion in grant funding and a focus on social rent.
Grant funding of £4.7 billion has been set aside for the Shared Ownership and Affordable Homes Programme 2016-21 for England and the government announced in January that an initial £1.3 billion in grants had been allocated. Grants were awarded to 157 registered providers to build 39,403 units, plus an additional 7,131 units to be built under the programme without grant funding. A further £1.3 billion of funding and an undetermined share of the £1.4 billion announced in the Autumn Statement were also
released for bids on an ongoing basis. Previously, 88% of the AHP funding was to be allocated to the construction of shared ownership homes, but the government has allowed greater flexibility over tenure to include affordable rent, which is less dependent on general housing market conditions. This is an important concession, given that during the 2016/17 financial year, the Homes and Communities Agency reported that housing associations’ revenues from open market and shared ownership sales were below forecast in every quarter. For local authorities, the Housing White Paper in February confirmed the government’s view that councils’ roles in house building will be to assign land and monitor delivery against local plans. In addition, the Local Government Association warned that local authority building capacity is constrained by Right to Buy. Approximately two-thirds of receipts from Right to Buy sales are returned to the Treasury, leaving little to fund replacement building after the cost of sales and servicing of debt are also subtracted.
Greater stability and certainty in the AHP, as well as flexibility to adjust tenures in accordance with prevailing housing market demand, underpin expectations of three years of rising activity in the sector. Starts are forecast to increase 2.0% in 2017, 5.0% in 2018 and 5.0% in 2019.
Public HousingDuring 2016, public housing starts in Great Britain declined 6.6%, which marked a second year of contraction.
Public Housing Starts and Completions Great Britain
2015 2016 2017 2018 2019
Actual Actual Estimate Forecast Projection
Starts
32,155 30,021 30,621 32,152 33,760
-4.8% -6.6% 2.0% 5.0% 5.0%
Completions
36,944 30,902 29,975 30,275 31,183
27.0% -16.4% -3.0% 1.0% 3.0%
Output (£m)
4,604 4,310 4,224 4,393 4,612
-18.1% -6.4% -2.0% 4.0% 5.0%
RM&I Output (£m) 7,478 6,930 6,791 6,656 6,522
0.5% -7.3% -2.0% -2.0% -2.0%
Source: DCLG, ONS, Construction Products Association
£4.7 billion is available in grants under the
Affordable Homes Programme 2016 to 2021
28 29
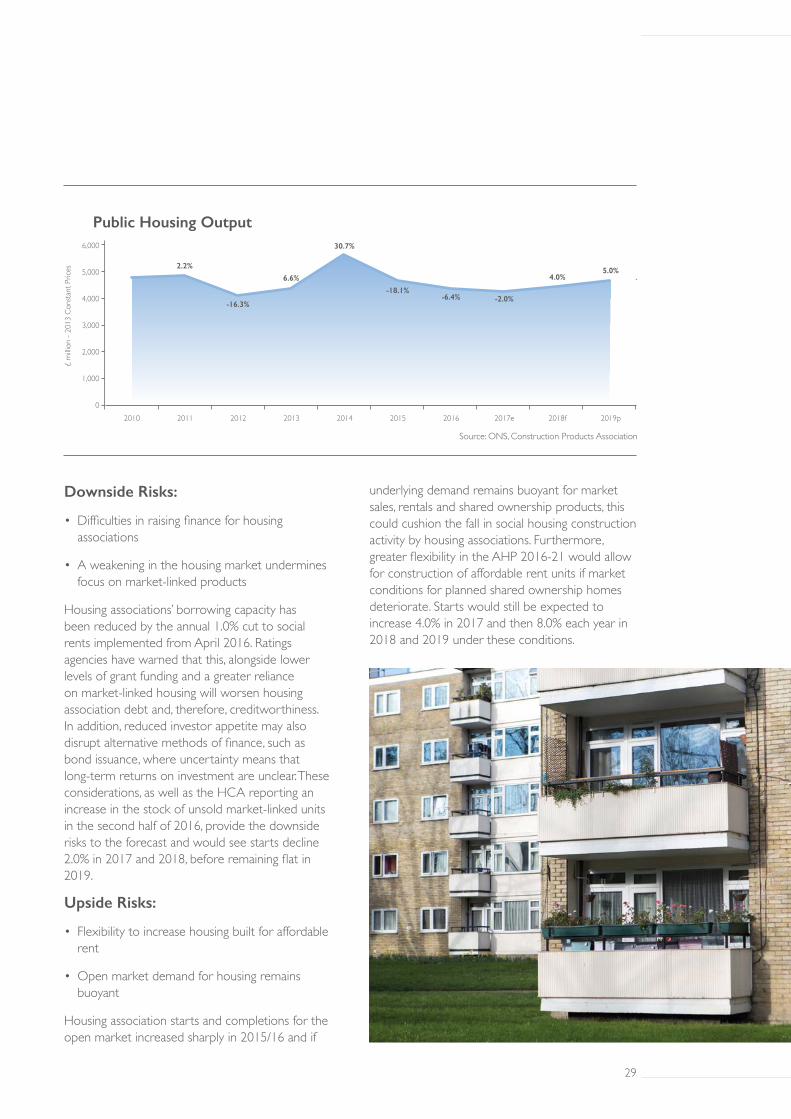
Downside Risks:
• Difficulties in raising finance for housing associations
• A weakening in the housing market undermines focus on market-linked products
Housing associations’ borrowing capacity has been reduced by the annual 1.0% cut to social rents implemented from April 2016. Ratings agencies have warned that this, alongside lower levels of grant funding and a greater reliance on market-linked housing will worsen housing association debt and, therefore, creditworthiness. In addition, reduced investor appetite may also disrupt alternative methods of finance, such as bond issuance, where uncertainty means that long-term returns on investment are unclear. These considerations, as well as the HCA reporting an increase in the stock of unsold market-linked units in the second half of 2016, provide the downside risks to the forecast and would see starts decline 2.0% in 2017 and 2018, before remaining flat in 2019.
Upside Risks:
• Flexibility to increase housing built for affordable rent
• Open market demand for housing remains buoyant
Housing association starts and completions for the open market increased sharply in 2015/16 and if
underlying demand remains buoyant for market sales, rentals and shared ownership products, this could cushion the fall in social housing construction activity by housing associations. Furthermore, greater flexibility in the AHP 2016-21 would allow for construction of affordable rent units if market conditions for planned shared ownership homes deteriorate. Starts would still be expected to increase 4.0% in 2017 and then 8.0% each year in 2018 and 2019 under these conditions.
6,000
5,000
4,000
3,000
2,000
1,000
0
Public Housing Output
£ m
illion
- 20
13 C
onsta
nt P
rices
Source: ONS, Construction Products Association
30.7%
-16.3%-6.4%
2.2%
-18.1%
6.6%
-2.0%
4.0%
2010 2011 2012 2013 2014 2015 2016 2017e 2018f 2019p
5.0%
28 29
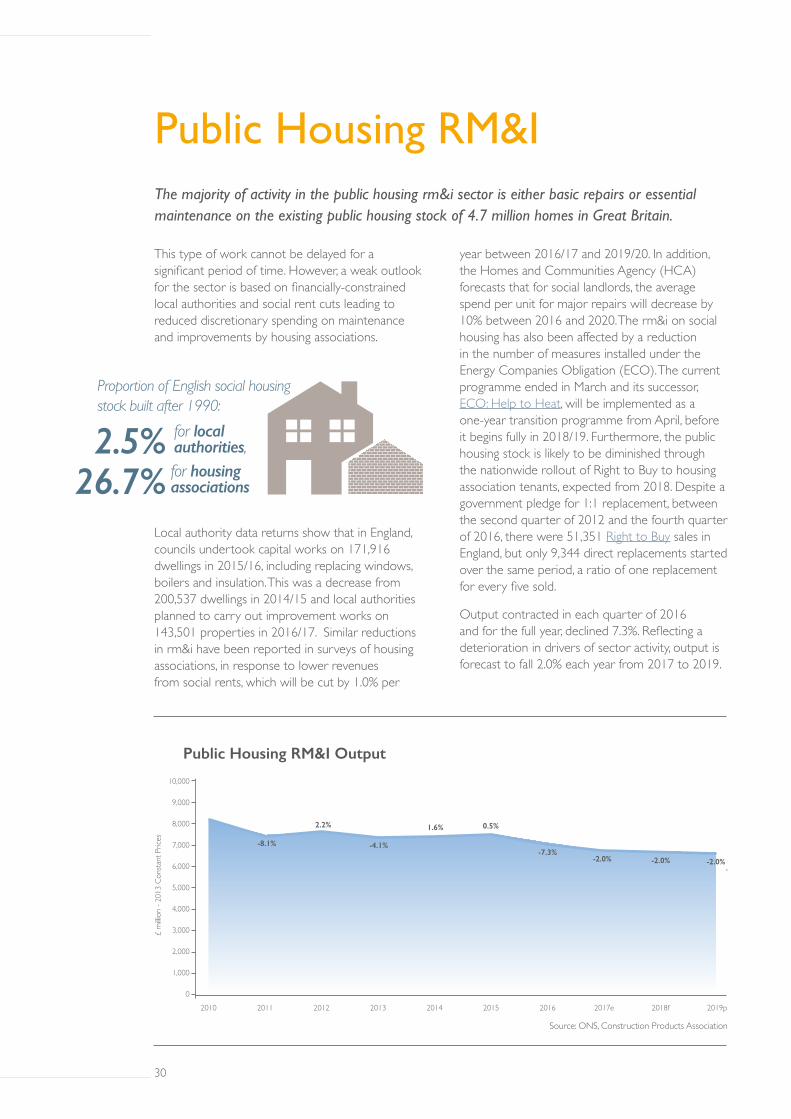
This type of work cannot be delayed for a significant period of time. However, a weak outlook for the sector is based on financially-constrained local authorities and social rent cuts leading to reduced discretionary spending on maintenance and improvements by housing associations.
Local authority data returns show that in England, councils undertook capital works on 171,916 dwellings in 2015/16, including replacing windows, boilers and insulation. This was a decrease from 200,537 dwellings in 2014/15 and local authorities planned to carry out improvement works on 143,501 properties in 2016/17. Similar reductions in rm&i have been reported in surveys of housing associations, in response to lower revenues from social rents, which will be cut by 1.0% per
year between 2016/17 and 2019/20. In addition, the Homes and Communities Agency (HCA) forecasts that for social landlords, the average spend per unit for major repairs will decrease by 10% between 2016 and 2020. The rm&i on social housing has also been affected by a reduction in the number of measures installed under the Energy Companies Obligation (ECO). The current programme ended in March and its successor, ECO: Help to Heat, will be implemented as a one-year transition programme from April, before it begins fully in 2018/19. Furthermore, the public housing stock is likely to be diminished through the nationwide rollout of Right to Buy to housing association tenants, expected from 2018. Despite a government pledge for 1:1 replacement, between the second quarter of 2012 and the fourth quarter of 2016, there were 51,351 Right to Buy sales in England, but only 9,344 direct replacements started over the same period, a ratio of one replacement for every five sold.
Output contracted in each quarter of 2016 and for the full year, declined 7.3%. Reflecting a deterioration in drivers of sector activity, output is forecast to fall 2.0% each year from 2017 to 2019.
Public Housing RM&IThe majority of activity in the public housing rm&i sector is either basic repairs or essential maintenance on the existing public housing stock of 4.7 million homes in Great Britain.
Proportion of English social housing stock built after 1990:
26.7%
for local authorities, 2.5%for housing associations
30 31
2010 2011 2012 2013 2014 2015 2016 2017e 2018f 2019p
10,000
9,000
8,000
7,000
6,000
5,000
4,000
3,000
2,000
1,000
0
Public Housing RM&I Output
£ m
illion
- 20
13 C
onsta
nt P
rices
Source: ONS, Construction Products Association
1.6%2.2%
-7.3%-8.1%
0.5%
-4.1%
-2.0% -2.0% -2.0%
Downside Risks:
• New ECO programme delayed
• Local authorities direct funding away from housing rm&i
• Housing association revenues reduced by a weaker than expected housing market
The proposed follow-up to the ECO will cover fewer measures and will focus on easing fuel poverty, rather than improving energy efficiency. The government plans a transitionary period in 2017/18, before the full launch of a four-year programme in 2018/19. Delays to implementation, due to discussions over the scope and cost, cannot be ruled out and would reduce activity. The risk of further reductions in funding, through local authorities adjusting local spending priorities or a weaker housing market performance affecting housing associations’ open market sales revenues, also pose a downside risk to rm&i spending. Under these conditions, output is forecast to decline 5.0% each year.
Upside Risks:
• Housing associations focus on maintenance
• Housing market performs stronger than expected
If building homes for market sale or shared ownership becomes less financially viable due to a weaker housing market in 2017, housing associations may instead focus on maintaining their existing, revenue-earning housing stock. In contrast, if the housing market remains more buoyant than expected, this would raise the revenues housing associations receive from sales of shared ownership and units sold on the open market, offering additional funding for rm&i work. This would not offset constrained local authority rm&i spending, however, and flat growth throughout the forecast period would be expected in this case.
30 31
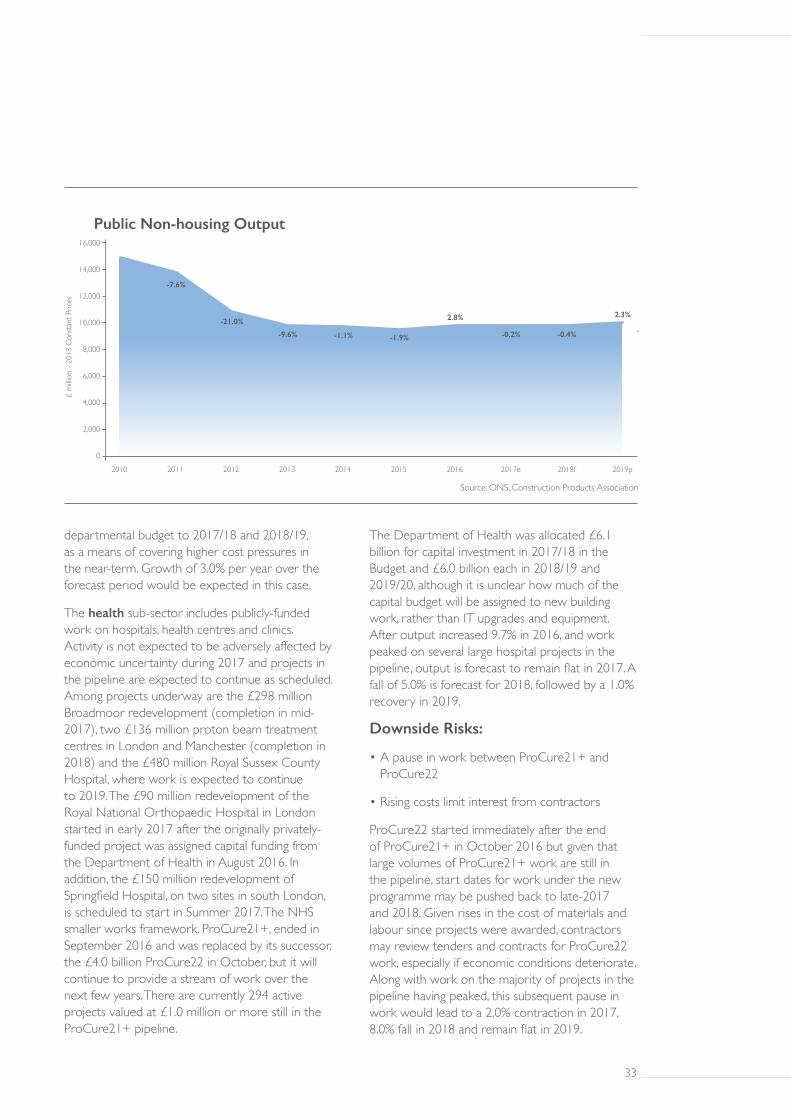
As a positive for the sector, capital investment for both education and health was increased in the March Budget, alongside an additional funding allocation for new free schools, whilst total new orders in the sector rose 5.9% in 2016. However, downside risk to activity stems from concern over potential delays and budget overruns, as highlighted by the Infrastructure and Projects Authority annual report in July 2016 and recent rises in raw materials and input costs. Total sector output is expected to remain largely flat in 2017 and 2018, before rising 2.3% in 2019.
Output in the publicly-funded education sub-sector will be driven by the Priority School Building Programme (PSBP). The first phase, currently underway, will rebuild 260 schools, 214 of which are publicly funded and the majority is scheduled to be completed by the end of 2017. A further £2.0 billion of funding has been allocated for an entirely capital-funded second phase (PSBP2), which will focus on rebuilding individual blocks at 277 schools by 2021. However, the National Audit Office noted that costs under the first phase of the programme have risen by £286 million to £2.3 billion and a lack of interest from contractors for projects yet to sign construction contracts has pushed back the expected end date for these projects to 2020. Rising cost pressures for contractors were also highlighted as a threat to achieving time and budget targets for the PSBP2 and inflation is likely to intensify in 2017 due to the rising costs of labour and materials. Activity fell in the second half of 2016, resulting in a 0.5% decline in output for the whole year, whilst new orders also fell in 2016, despite the pipeline of activity provided by the PSBP. In the Budget in March, the government increased the Department for Education’s capital investment funding by a cumulative £2.8 billion between 2017/18 and
2019/20 compared to Budget 2016, and allocated £320 million in additional funding for 140 new free schools, although the majority is not expected to be used until 2020. For 2017 and 2018, output is forecast to rise 1.0% each year, followed by growth of 2.0% in 2019.
Downside Risks:
• Cost increases and a lack of contractor interest delays start dates further
If contractors are reluctant to sign contracts for work due to cost inflation, the start and end dates for PSBP work could be pushed further beyond the forecast horizon. In addition, it is unlikely that the government will assign additional funding to cover these higher costs across each year of the programme, leading to a delay in contract awards and the start of construction. In this case, output is expected to decline 3.0% each year over the forecast period.
Upside Risks:
• Capital funding is brought forward
With capital funding for education already raised in the latest Budget, additional financial support for school building is only likely to arise if government brings forward funding from later years of the
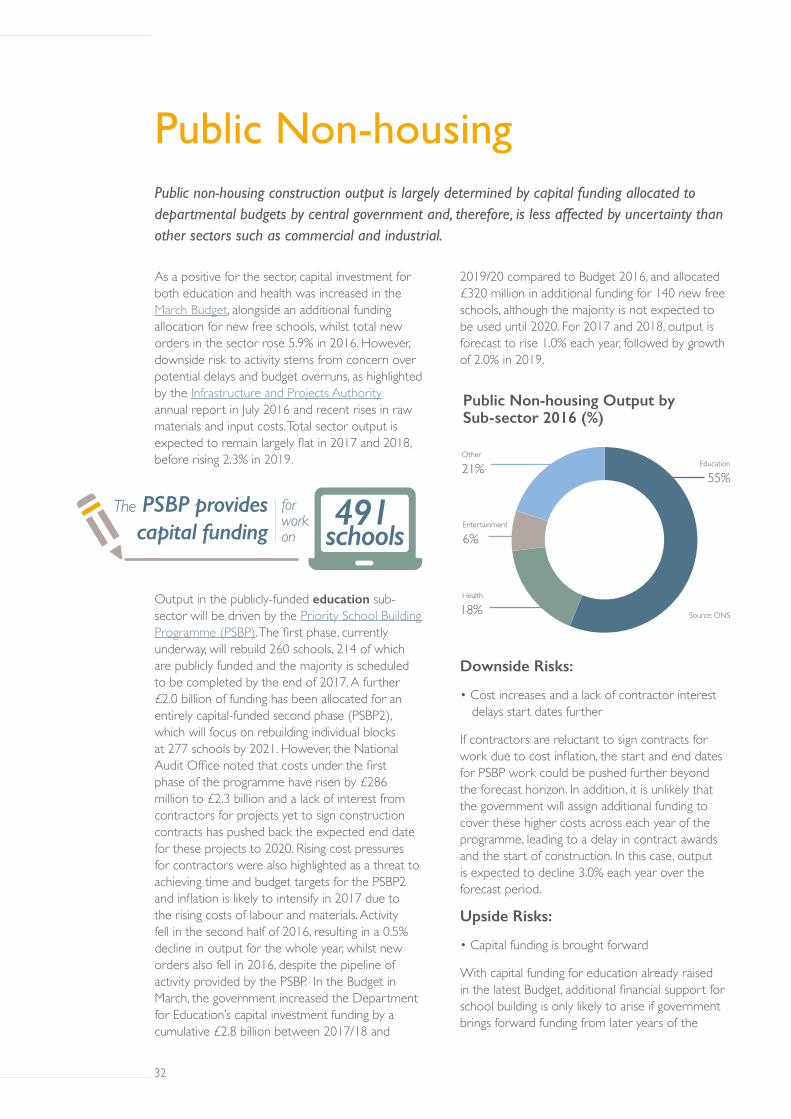
Public Non-housingPublic non-housing construction output is largely determined by capital funding allocated to departmental budgets by central government and, therefore, is less affected by uncertainty than other sectors such as commercial and industrial.
Health
18%
Entertainment
6%
Public Non-housing Output by Sub-sector 2016 (%)
Source: ONS
Other
21% Education
55%
The PSBP provides capital funding
for work on schools
491
32 33
departmental budget to 2017/18 and 2018/19, as a means of covering higher cost pressures in the near-term. Growth of 3.0% per year over the forecast period would be expected in this case.
The health sub-sector includes publicly-funded work on hospitals, health centres and clinics. Activity is not expected to be adversely affected by economic uncertainty during 2017 and projects in the pipeline are expected to continue as scheduled. Among projects underway are the £298 million Broadmoor redevelopment (completion in mid-2017), two £136 million proton beam treatment centres in London and Manchester (completion in 2018) and the £480 million Royal Sussex County Hospital, where work is expected to continue to 2019. The £90 million redevelopment of the Royal National Orthopaedic Hospital in London started in early 2017 after the originally privately-funded project was assigned capital funding from the Department of Health in August 2016. In addition, the £150 million redevelopment of Springfield Hospital, on two sites in south London, is scheduled to start in Summer 2017. The NHS smaller works framework, ProCure21+, ended in September 2016 and was replaced by its successor, the £4.0 billion ProCure22 in October, but it will continue to provide a stream of work over the next few years. There are currently 294 active projects valued at £1.0 million or more still in the ProCure21+ pipeline.
The Department of Health was allocated £6.1 billion for capital investment in 2017/18 in the Budget and £6.0 billion each in 2018/19 and 2019/20, although it is unclear how much of the capital budget will be assigned to new building work, rather than IT upgrades and equipment. After output increased 9.7% in 2016, and work peaked on several large hospital projects in the pipeline, output is forecast to remain flat in 2017. A fall of 5.0% is forecast for 2018, followed by a 1.0% recovery in 2019.
Downside Risks:
• A pause in work between ProCure21+ and ProCure22
• Rising costs limit interest from contractors
ProCure22 started immediately after the end of ProCure21+ in October 2016 but given that large volumes of ProCure21+ work are still in the pipeline, start dates for work under the new programme may be pushed back to late-2017 and 2018. Given rises in the cost of materials and labour since projects were awarded, contractors may review tenders and contracts for ProCure22 work, especially if economic conditions deteriorate. Along with work on the majority of projects in the pipeline having peaked, this subsequent pause in work would lead to a 2.0% contraction in 2017, 8.0% fall in 2018 and remain flat in 2019.
-1.1%
-21.0% 2.8%
-7.6%
-1.9%-9.6% -0.2% -0.4%
2.3%
2010 2011 2012 2013 2014 2015 2016 2017e 2018f 2019p
16,000
14,000
12,000
10,000
8,000
6,000
4,000
2,000
0
Public Non-housing Output
£ m
illion
- 20
13 C
onsta
nt P
rices
Source: ONS, Construction Products Association
32 33
Upside Risks:
• Capital funding is brought forward
• ProCure22 work starts immediately
As of January, all framework contracts under ProCure22 had been awarded to six firms and growth rates could quicken if work on the ground begins immediately. Like the education sub-sector, a sharp rise in costs that leads to contractors pausing activity could also prompt the government to change the existing capital funding profile to bring forward spending from later years. Growth is forecast at 2.0% each year between 2017 and 2019 in this case.
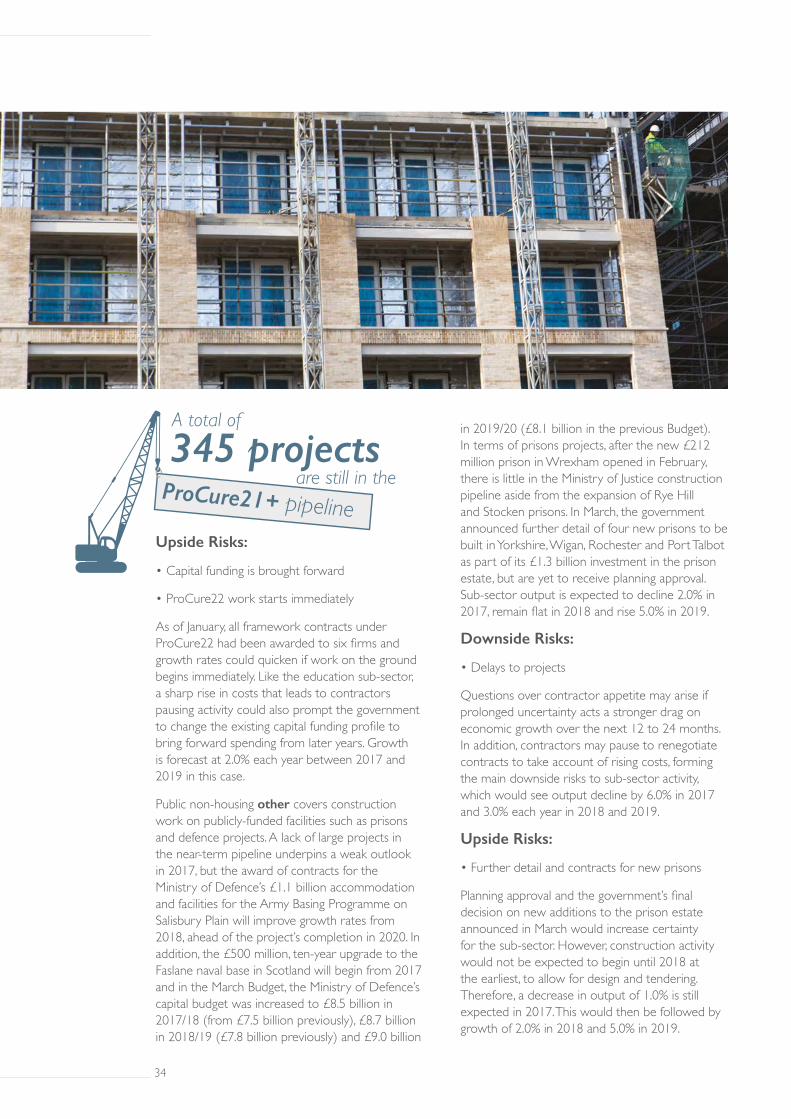
Public non-housing other covers construction work on publicly-funded facilities such as prisons and defence projects. A lack of large projects in the near-term pipeline underpins a weak outlook in 2017, but the award of contracts for the Ministry of Defence’s £1.1 billion accommodation and facilities for the Army Basing Programme on Salisbury Plain will improve growth rates from 2018, ahead of the project’s completion in 2020. In addition, the £500 million, ten-year upgrade to the Faslane naval base in Scotland will begin from 2017 and in the March Budget, the Ministry of Defence’s capital budget was increased to £8.5 billion in 2017/18 (from £7.5 billion previously), £8.7 billion in 2018/19 (£7.8 billion previously) and £9.0 billion
in 2019/20 (£8.1 billion in the previous Budget). In terms of prisons projects, after the new £212 million prison in Wrexham opened in February, there is little in the Ministry of Justice construction pipeline aside from the expansion of Rye Hill and Stocken prisons. In March, the government announced further detail of four new prisons to be built in Yorkshire, Wigan, Rochester and Port Talbot as part of its £1.3 billion investment in the prison estate, but are yet to receive planning approval. Sub-sector output is expected to decline 2.0% in 2017, remain flat in 2018 and rise 5.0% in 2019.
Downside Risks:
• Delays to projects
Questions over contractor appetite may arise if prolonged uncertainty acts a stronger drag on economic growth over the next 12 to 24 months. In addition, contractors may pause to renegotiate contracts to take account of rising costs, forming the main downside risks to sub-sector activity, which would see output decline by 6.0% in 2017 and 3.0% each year in 2018 and 2019.
Upside Risks:
• Further detail and contracts for new prisons
Planning approval and the government’s final decision on new additions to the prison estate announced in March would increase certainty for the sub-sector. However, construction activity would not be expected to begin until 2018 at the earliest, to allow for design and tendering. Therefore, a decrease in output of 1.0% is still expected in 2017. This would then be followed by growth of 2.0% in 2018 and 5.0% in 2019.
345 projectsA total of
are still in theProCure21+ pipeline
34 35
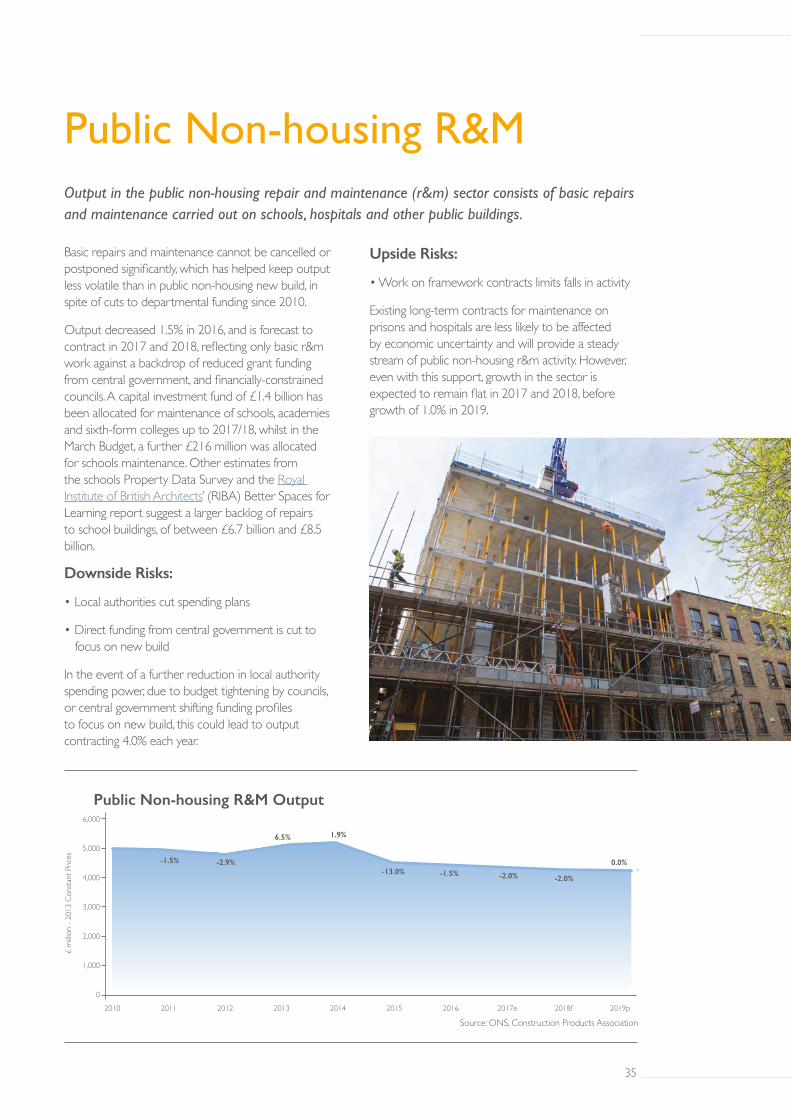
Basic repairs and maintenance cannot be cancelled or postponed significantly, which has helped keep output less volatile than in public non-housing new build, in spite of cuts to departmental funding since 2010.
Output decreased 1.5% in 2016, and is forecast to contract in 2017 and 2018, reflecting only basic r&m work against a backdrop of reduced grant funding from central government, and financially-constrained councils. A capital investment fund of £1.4 billion has been allocated for maintenance of schools, academies and sixth-form colleges up to 2017/18, whilst in the March Budget, a further £216 million was allocated for schools maintenance. Other estimates from the schools Property Data Survey and the Royal Institute of British Architects’ (RIBA) Better Spaces for Learning report suggest a larger backlog of repairs to school buildings, of between £6.7 billion and £8.5 billion.
Downside Risks:
• Local authorities cut spending plans
• Direct funding from central government is cut to focus on new build
In the event of a further reduction in local authority spending power, due to budget tightening by councils, or central government shifting funding profiles to focus on new build, this could lead to output contracting 4.0% each year.
Upside Risks:
• Work on framework contracts limits falls in activity
Existing long-term contracts for maintenance on prisons and hospitals are less likely to be affected by economic uncertainty and will provide a steady stream of public non-housing r&m activity. However, even with this support, growth in the sector is expected to remain flat in 2017 and 2018, before growth of 1.0% in 2019.
Public Non-housing R&MOutput in the public non-housing repair and maintenance (r&m) sector consists of basic repairs and maintenance carried out on schools, hospitals and other public buildings.
1.9%
-2.9%-1.5%
-1.5%-13.0%
6.5%
-2.0% -2.0%
2010 2011 2012 2013 2014 2015 2016 2017e 2018f 2019p
6,000
5,000
4,000
3,000
2,000
1,000
0
Public Non-housing R&M Output
£ m
illion
- 20
13 C
onsta
nt P
rices
Source: ONS, Construction Products Association
0.0%
34 35
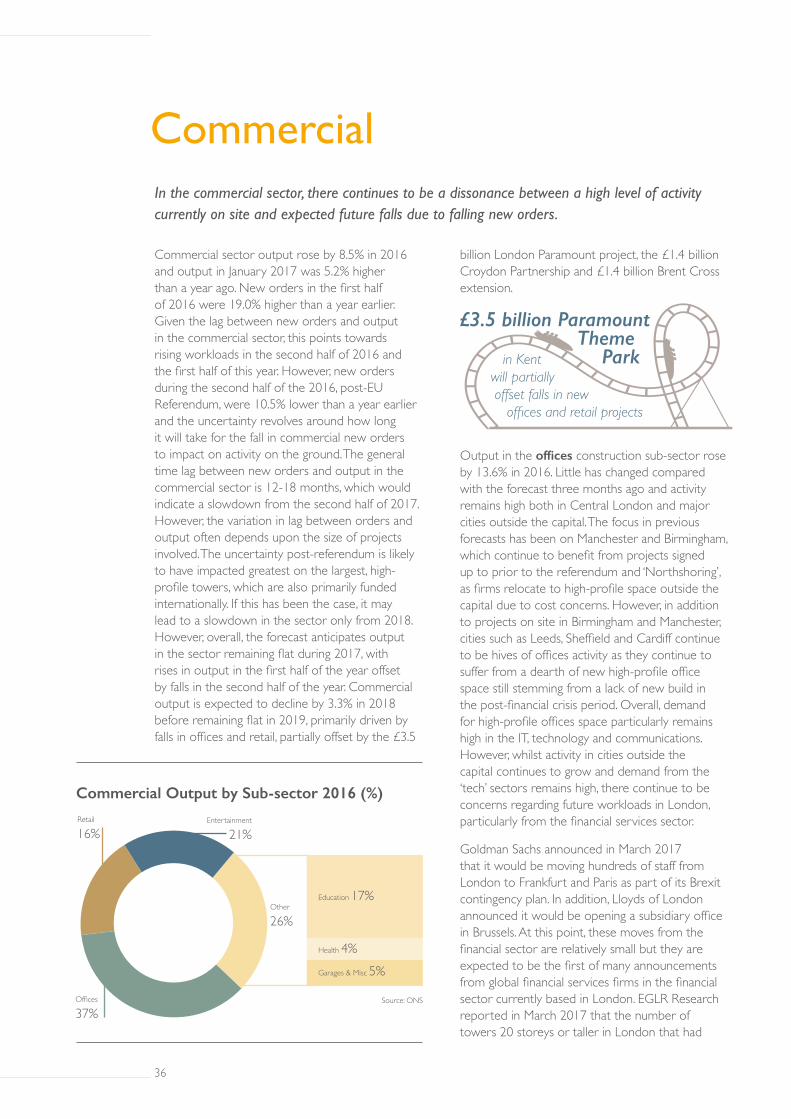
CommercialIn the commercial sector, there continues to be a dissonance between a high level of activity currently on site and expected future falls due to falling new orders.
Commercial Output by Sub-sector 2016 (%)
Source: ONS
Retail
16%
Other
26%
Entertainment
21%
Offices
37%
Health 4%Garages & Misc 5%
Education 17%
in Kent will partially offset falls in new offices and retail projects
£3.5 billion Paramount Theme Park
36 37
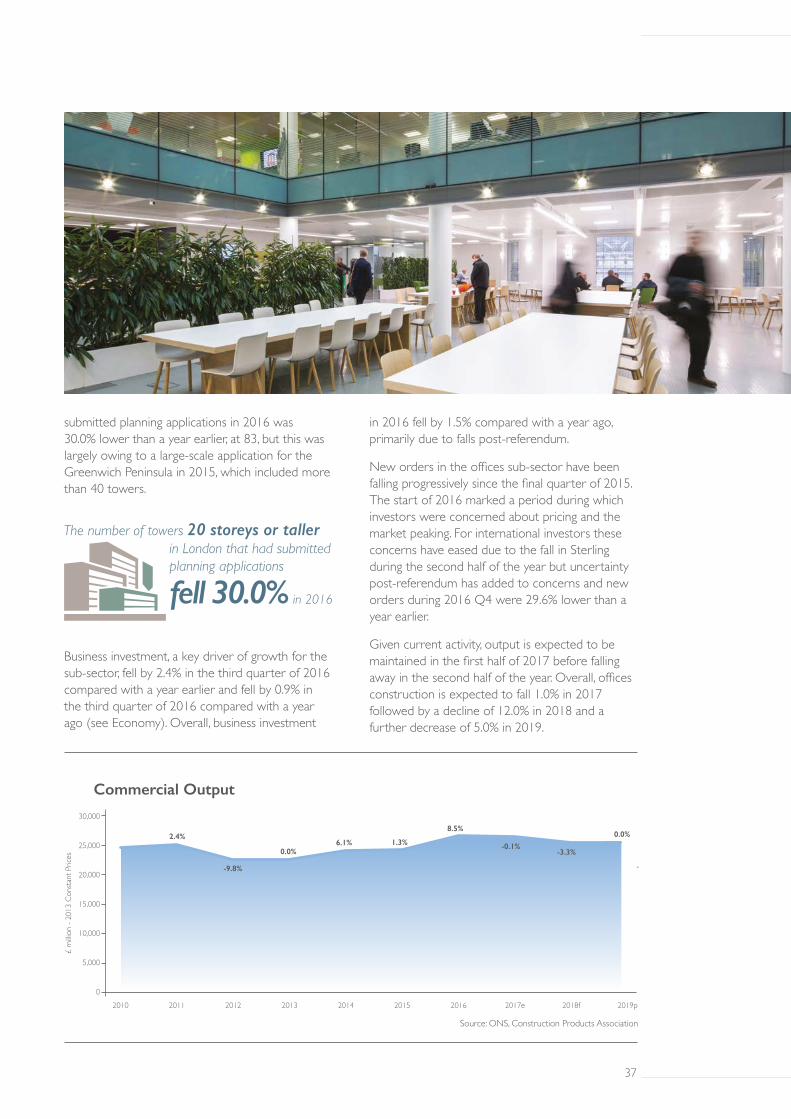
Commercial sector output rose by 8.5% in 2016 and output in January 2017 was 5.2% higher than a year ago. New orders in the first half of 2016 were 19.0% higher than a year earlier. Given the lag between new orders and output in the commercial sector, this points towards rising workloads in the second half of 2016 and the first half of this year. However, new orders during the second half of the 2016, post-EU Referendum, were 10.5% lower than a year earlier and the uncertainty revolves around how long it will take for the fall in commercial new orders to impact on activity on the ground. The general time lag between new orders and output in the commercial sector is 12-18 months, which would indicate a slowdown from the second half of 2017. However, the variation in lag between orders and output often depends upon the size of projects involved. The uncertainty post-referendum is likely to have impacted greatest on the largest, high-profile towers, which are also primarily funded internationally. If this has been the case, it may lead to a slowdown in the sector only from 2018. However, overall, the forecast anticipates output in the sector remaining flat during 2017, with rises in output in the first half of the year offset by falls in the second half of the year. Commercial output is expected to decline by 3.3% in 2018 before remaining flat in 2019, primarily driven by falls in offices and retail, partially offset by the £3.5
billion London Paramount project, the £1.4 billion Croydon Partnership and £1.4 billion Brent Cross extension.
Output in the offices construction sub-sector rose by 13.6% in 2016. Little has changed compared with the forecast three months ago and activity remains high both in Central London and major cities outside the capital. The focus in previous forecasts has been on Manchester and Birmingham, which continue to benefit from projects signed up to prior to the referendum and ‘Northshoring’, as firms relocate to high-profile space outside the capital due to cost concerns. However, in addition to projects on site in Birmingham and Manchester, cities such as Leeds, Sheffield and Cardiff continue to be hives of offices activity as they continue to suffer from a dearth of new high-profile office space still stemming from a lack of new build in the post-financial crisis period. Overall, demand for high-profile offices space particularly remains high in the IT, technology and communications. However, whilst activity in cities outside the capital continues to grow and demand from the ‘tech’ sectors remains high, there continue to be concerns regarding future workloads in London, particularly from the financial services sector.
Goldman Sachs announced in March 2017 that it would be moving hundreds of staff from London to Frankfurt and Paris as part of its Brexit contingency plan. In addition, Lloyds of London announced it would be opening a subsidiary office in Brussels. At this point, these moves from the financial sector are relatively small but they are expected to be the first of many announcements from global financial services firms in the financial sector currently based in London. EGLR Research reported in March 2017 that the number of towers 20 storeys or taller in London that had
fell 30.0% in 2016
in London that had submitted planning applications
The number of towers 20 storeys or taller
36 37
6.1%
-9.8%
8.5%2.4%
1.3% 0.0%
-0.1%-3.3%
0.0%
2010 2011 2012 2013 2014 2015 2016 2017e 2018f 2019p
30,000
25,000
20,000
15,000
10,000
5,000
0
Commercial Output
£ m
illion
- 20
13 C
onsta
nt P
rices
Source: ONS, Construction Products Association
submitted planning applications in 2016 was 30.0% lower than a year earlier, at 83, but this was largely owing to a large-scale application for the Greenwich Peninsula in 2015, which included more than 40 towers.
Business investment, a key driver of growth for the sub-sector, fell by 2.4% in the third quarter of 2016 compared with a year earlier and fell by 0.9% in the third quarter of 2016 compared with a year ago (see Economy). Overall, business investment
in 2016 fell by 1.5% compared with a year ago, primarily due to falls post-referendum.
New orders in the offices sub-sector have been falling progressively since the final quarter of 2015. The start of 2016 marked a period during which investors were concerned about pricing and the market peaking. For international investors these concerns have eased due to the fall in Sterling during the second half of the year but uncertainty post-referendum has added to concerns and new orders during 2016 Q4 were 29.6% lower than a year earlier.
Given current activity, output is expected to be maintained in the first half of 2017 before falling away in the second half of the year. Overall, offices construction is expected to fall 1.0% in 2017 followed by a decline of 12.0% in 2018 and a further decrease of 5.0% in 2019.
38 39
Downside Risks:
• Prolonged Brexit negotiation uncertainty
• Business investment is constrained by a longer economic downturn, which reduces pre-letting activity and investor confidence
• Further depreciations in Sterling lead to further rises in construction costs
Uncertainty throughout the Brexit negotiations would be expected to lead to sharper falls in the investment and take-up of new high-profile office space in London. Uncertainty regarding financial passporting would particularly impact upon the financial sector and lead to further falls in new investment in London. In addition, any further depreciations in Sterling due to speculation would lead to a rise in construction costs, due to the impact on imported materials, hindering the financial viability of projects given uncertain returns. In this case, commercial offices would be expected to fall 5.0% in 2017 and 20.0% in 2018 with a further decline of 15.0% in 2019.
Upside Risks:
• Stronger economic growth despite rising inflation
• Exchange rate weakness supports foreign investment
If the economy continues to grow strongly and real wage growth is maintained, despite rising inflation, then upward revisions to business confidence and business investment may incentivise new investment in commercial offices. This, combined with a weaker value of Sterling, may lead to further international investment as concerns regarding long-term returns on investment abate. These potential new projects could help to offset the impacts of falls in new contract awards last year. A rise in activity of 2.0% is expected in 2017 but activity would remain flat in 2018 and 2019.
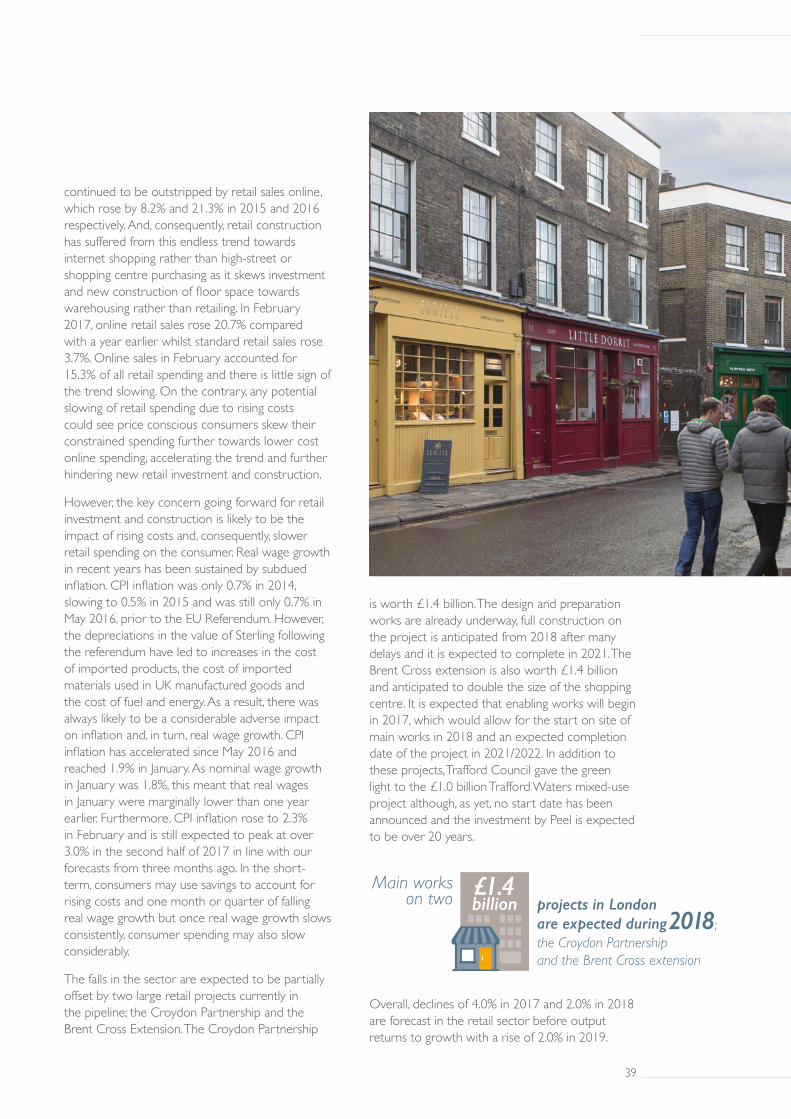
The fortunes for retail construction expected over the next three years remain unchanged from the forecasts three months ago. Retail construction activity fell by 10.9% in 2015 and by 7.1% in 2016 in spite of robust retail spending figures. UK retail spending volumes rose by 4.4% in 2015 and 4.9% in 2016. However, this growth
Main works on two £1.4
billion projects in London are expected during the Croydon Partnership and the Brent Cross extension
2018 ;
38 39
continued to be outstripped by retail sales online, which rose by 8.2% and 21.3% in 2015 and 2016 respectively. And, consequently, retail construction has suffered from this endless trend towards internet shopping rather than high-street or shopping centre purchasing as it skews investment and new construction of floor space towards warehousing rather than retailing. In February 2017, online retail sales rose 20.7% compared with a year earlier whilst standard retail sales rose 3.7%. Online sales in February accounted for 15.3% of all retail spending and there is little sign of the trend slowing. On the contrary, any potential slowing of retail spending due to rising costs could see price conscious consumers skew their constrained spending further towards lower cost online spending, accelerating the trend and further hindering new retail investment and construction.
However, the key concern going forward for retail investment and construction is likely to be the impact of rising costs and, consequently, slower retail spending on the consumer. Real wage growth in recent years has been sustained by subdued inflation. CPI inflation was only 0.7% in 2014, slowing to 0.5% in 2015 and was still only 0.7% in May 2016, prior to the EU Referendum. However, the depreciations in the value of Sterling following the referendum have led to increases in the cost of imported products, the cost of imported materials used in UK manufactured goods and the cost of fuel and energy. As a result, there was always likely to be a considerable adverse impact on inflation and, in turn, real wage growth. CPI inflation has accelerated since May 2016 and reached 1.9% in January. As nominal wage growth in January was 1.8%, this meant that real wages in January were marginally lower than one year earlier. Furthermore, CPI inflation rose to 2.3% in February and is still expected to peak at over 3.0% in the second half of 2017 in line with our forecasts from three months ago. In the short-term, consumers may use savings to account for rising costs and one month or quarter of falling real wage growth but once real wage growth slows consistently, consumer spending may also slow considerably.
The falls in the sector are expected to be partially offset by two large retail projects currently in the pipeline; the Croydon Partnership and the Brent Cross Extension. The Croydon Partnership
is worth £1.4 billion. The design and preparation works are already underway, full construction on the project is anticipated from 2018 after many delays and it is expected to complete in 2021. The Brent Cross extension is also worth £1.4 billion and anticipated to double the size of the shopping centre. It is expected that enabling works will begin in 2017, which would allow for the start on site of main works in 2018 and an expected completion date of the project in 2021/2022. In addition to these projects, Trafford Council gave the green light to the £1.0 billion Trafford Waters mixed-use project although, as yet, no start date has been announced and the investment by Peel is expected to be over 20 years.
Overall, declines of 4.0% in 2017 and 2.0% in 2018 are forecast in the retail sector before output returns to growth with a rise of 2.0% in 2019.
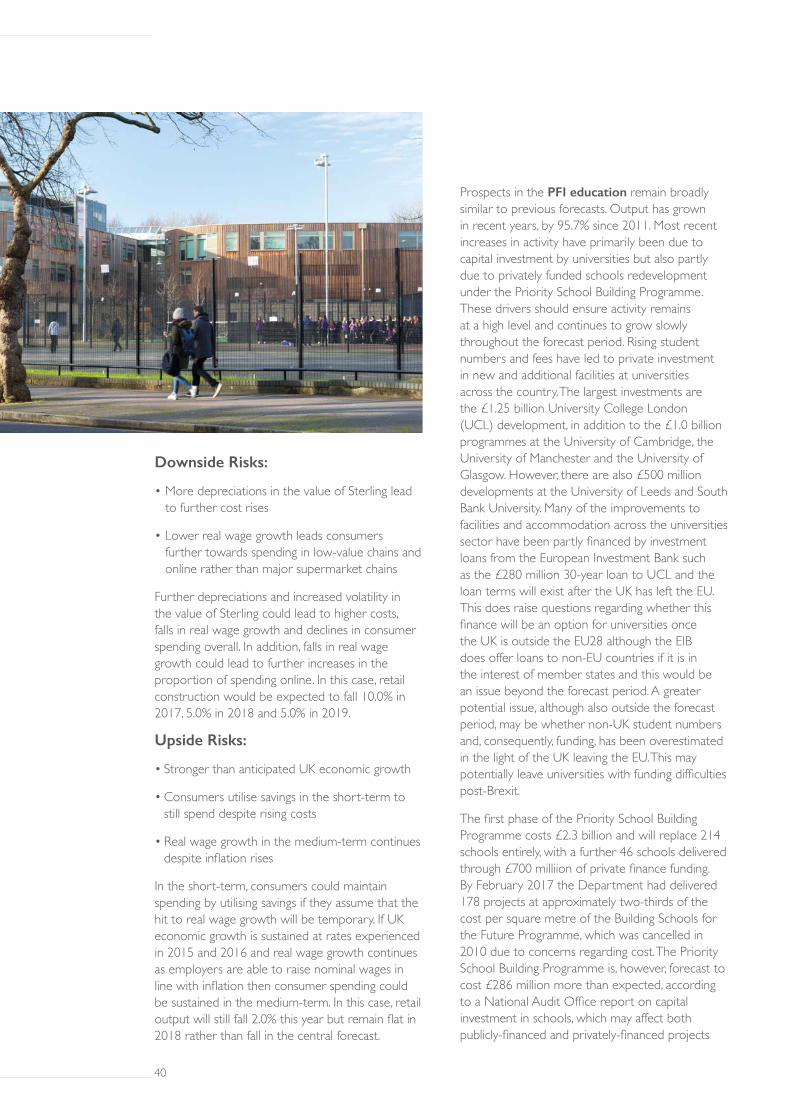
40 41
Downside Risks:
• More depreciations in the value of Sterling lead to further cost rises
• Lower real wage growth leads consumers further towards spending in low-value chains and online rather than major supermarket chains
Further depreciations and increased volatility in the value of Sterling could lead to higher costs, falls in real wage growth and declines in consumer spending overall. In addition, falls in real wage growth could lead to further increases in the proportion of spending online. In this case, retail construction would be expected to fall 10.0% in 2017, 5.0% in 2018 and 5.0% in 2019.
Upside Risks:
• Stronger than anticipated UK economic growth
• Consumers utilise savings in the short-term to still spend despite rising costs
• Real wage growth in the medium-term continues despite inflation rises
In the short-term, consumers could maintain spending by utilising savings if they assume that the hit to real wage growth will be temporary. If UK economic growth is sustained at rates experienced in 2015 and 2016 and real wage growth continues as employers are able to raise nominal wages in line with inflation then consumer spending could be sustained in the medium-term. In this case, retail output will still fall 2.0% this year but remain flat in 2018 rather than fall in the central forecast.
Prospects in the PFI education remain broadly similar to previous forecasts. Output has grown in recent years, by 95.7% since 2011. Most recent increases in activity have primarily been due to capital investment by universities but also partly due to privately funded schools redevelopment under the Priority School Building Programme. These drivers should ensure activity remains at a high level and continues to grow slowly throughout the forecast period. Rising student numbers and fees have led to private investment in new and additional facilities at universities across the country. The largest investments are the £1.25 billion University College London (UCL) development, in addition to the £1.0 billion programmes at the University of Cambridge, the University of Manchester and the University of Glasgow. However, there are also £500 million developments at the University of Leeds and South Bank University. Many of the improvements to facilities and accommodation across the universities sector have been partly financed by investment loans from the European Investment Bank such as the £280 million 30-year loan to UCL and the loan terms will exist after the UK has left the EU. This does raise questions regarding whether this finance will be an option for universities once the UK is outside the EU28 although the EIB does offer loans to non-EU countries if it is in the interest of member states and this would be an issue beyond the forecast period. A greater potential issue, although also outside the forecast period, may be whether non-UK student numbers and, consequently, funding, has been overestimated in the light of the UK leaving the EU. This may potentially leave universities with funding difficulties post-Brexit.
The first phase of the Priority School Building Programme costs £2.3 billion and will replace 214 schools entirely, with a further 46 schools delivered through £700 milliion of private finance funding. By February 2017 the Department had delivered 178 projects at approximately two-thirds of the cost per square metre of the Building Schools for the Future Programme, which was cancelled in 2010 due to concerns regarding cost. The Priority School Building Programme is, however, forecast to cost £286 million more than expected, according to a National Audit Office report on capital investment in schools, which may affect both publicly-financed and privately-financed projects
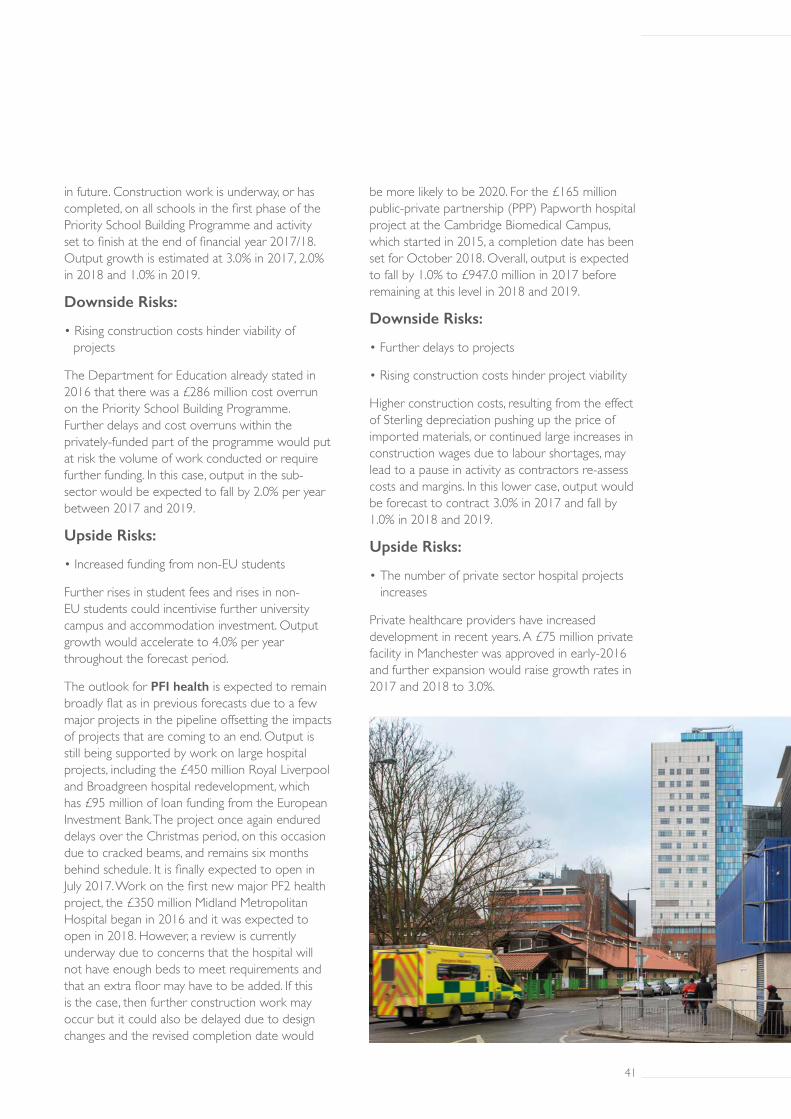
40 41
in future. Construction work is underway, or has completed, on all schools in the first phase of the Priority School Building Programme and activity set to finish at the end of financial year 2017/18. Output growth is estimated at 3.0% in 2017, 2.0% in 2018 and 1.0% in 2019.
Downside Risks:
• Rising construction costs hinder viability of projects
The Department for Education already stated in 2016 that there was a £286 million cost overrun on the Priority School Building Programme. Further delays and cost overruns within the privately-funded part of the programme would put at risk the volume of work conducted or require further funding. In this case, output in the sub-sector would be expected to fall by 2.0% per year between 2017 and 2019.
Upside Risks:
• Increased funding from non-EU students
Further rises in student fees and rises in non-EU students could incentivise further university campus and accommodation investment. Output growth would accelerate to 4.0% per year throughout the forecast period.
The outlook for PFI health is expected to remain broadly flat as in previous forecasts due to a few major projects in the pipeline offsetting the impacts of projects that are coming to an end. Output is still being supported by work on large hospital projects, including the £450 million Royal Liverpool and Broadgreen hospital redevelopment, which has £95 million of loan funding from the European Investment Bank. The project once again endured delays over the Christmas period, on this occasion due to cracked beams, and remains six months behind schedule. It is finally expected to open in July 2017. Work on the first new major PF2 health project, the £350 million Midland Metropolitan Hospital began in 2016 and it was expected to open in 2018. However, a review is currently underway due to concerns that the hospital will not have enough beds to meet requirements and that an extra floor may have to be added. If this is the case, then further construction work may occur but it could also be delayed due to design changes and the revised completion date would
be more likely to be 2020. For the £165 million public-private partnership (PPP) Papworth hospital project at the Cambridge Biomedical Campus, which started in 2015, a completion date has been set for October 2018. Overall, output is expected to fall by 1.0% to £947.0 million in 2017 before remaining at this level in 2018 and 2019.
Downside Risks:
• Further delays to projects
• Rising construction costs hinder project viability
Higher construction costs, resulting from the effect of Sterling depreciation pushing up the price of imported materials, or continued large increases in construction wages due to labour shortages, may lead to a pause in activity as contractors re-assess costs and margins. In this lower case, output would be forecast to contract 3.0% in 2017 and fall by 1.0% in 2018 and 2019.
Upside Risks:
• The number of private sector hospital projects increases
Private healthcare providers have increased development in recent years. A £75 million private facility in Manchester was approved in early-2016 and further expansion would raise growth rates in 2017 and 2018 to 3.0%.

42 43
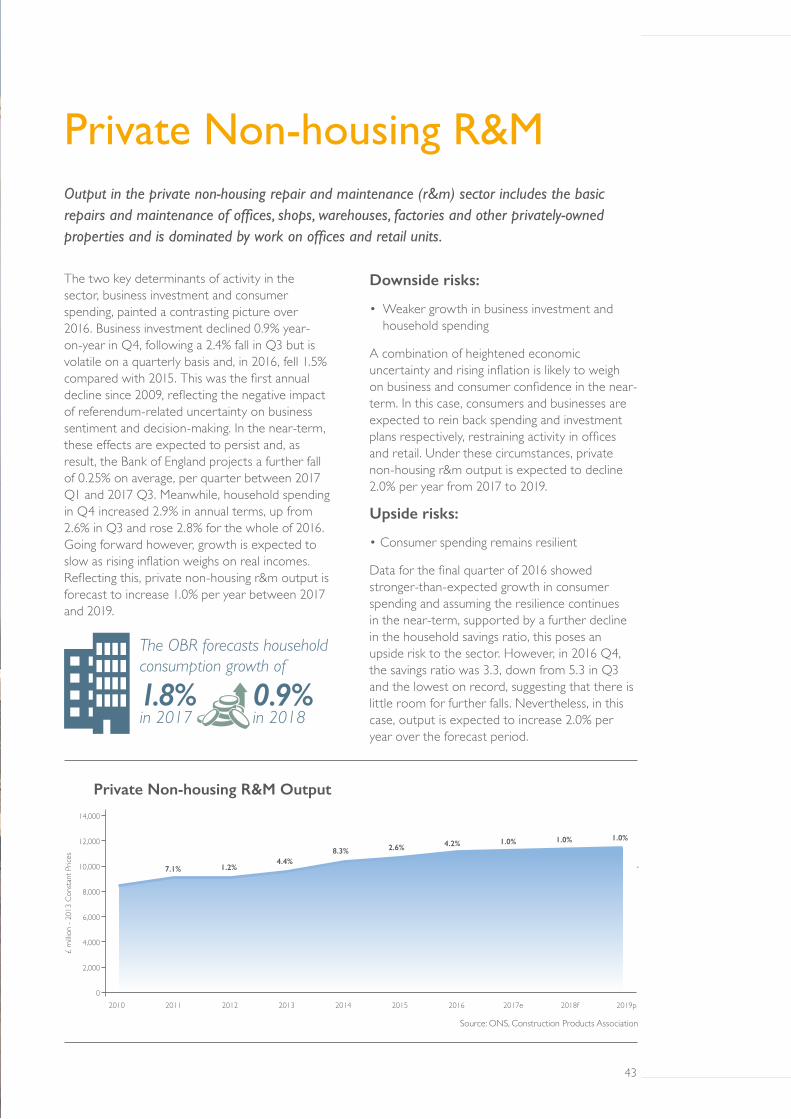
The two key determinants of activity in the sector, business investment and consumer spending, painted a contrasting picture over 2016. Business investment declined 0.9% year-on-year in Q4, following a 2.4% fall in Q3 but is volatile on a quarterly basis and, in 2016, fell 1.5% compared with 2015. This was the first annual decline since 2009, reflecting the negative impact of referendum-related uncertainty on business sentiment and decision-making. In the near-term, these effects are expected to persist and, as result, the Bank of England projects a further fall of 0.25% on average, per quarter between 2017 Q1 and 2017 Q3. Meanwhile, household spending in Q4 increased 2.9% in annual terms, up from 2.6% in Q3 and rose 2.8% for the whole of 2016. Going forward however, growth is expected to slow as rising inflation weighs on real incomes. Reflecting this, private non-housing r&m output is forecast to increase 1.0% per year between 2017 and 2019.
Downside risks:
• Weaker growth in business investment and household spending
A combination of heightened economic uncertainty and rising inflation is likely to weigh on business and consumer confidence in the near-term. In this case, consumers and businesses are expected to rein back spending and investment plans respectively, restraining activity in offices and retail. Under these circumstances, private non-housing r&m output is expected to decline 2.0% per year from 2017 to 2019.
Upside risks:
• Consumer spending remains resilient
Data for the final quarter of 2016 showed stronger-than-expected growth in consumer spending and assuming the resilience continues in the near-term, supported by a further decline in the household savings ratio, this poses an upside risk to the sector. However, in 2016 Q4, the savings ratio was 3.3, down from 5.3 in Q3 and the lowest on record, suggesting that there is little room for further falls. Nevertheless, in this case, output is expected to increase 2.0% per year over the forecast period.
Private Non-housing R&MOutput in the private non-housing repair and maintenance (r&m) sector includes the basic repairs and maintenance of offices, shops, warehouses, factories and other privately-owned properties and is dominated by work on offices and retail units.
The OBR forecasts household consumption growth of
1.8% in 2017
0.9% in 2018
42 43
8.3%
1.2%
4.2%
7.1%
2.6%
4.4%
1.0% 1.0% 1.0%
2010 2011 2012 2013 2014 2015 2016 2017e 2018f 2019p
14,000
12,000
10,000
8,000
6,000
4,000
2,000
0
Private Non-housing R&M Output
£ m
illion
- 20
13 C
onsta
nt P
rices
Source: ONS, Construction Products Association
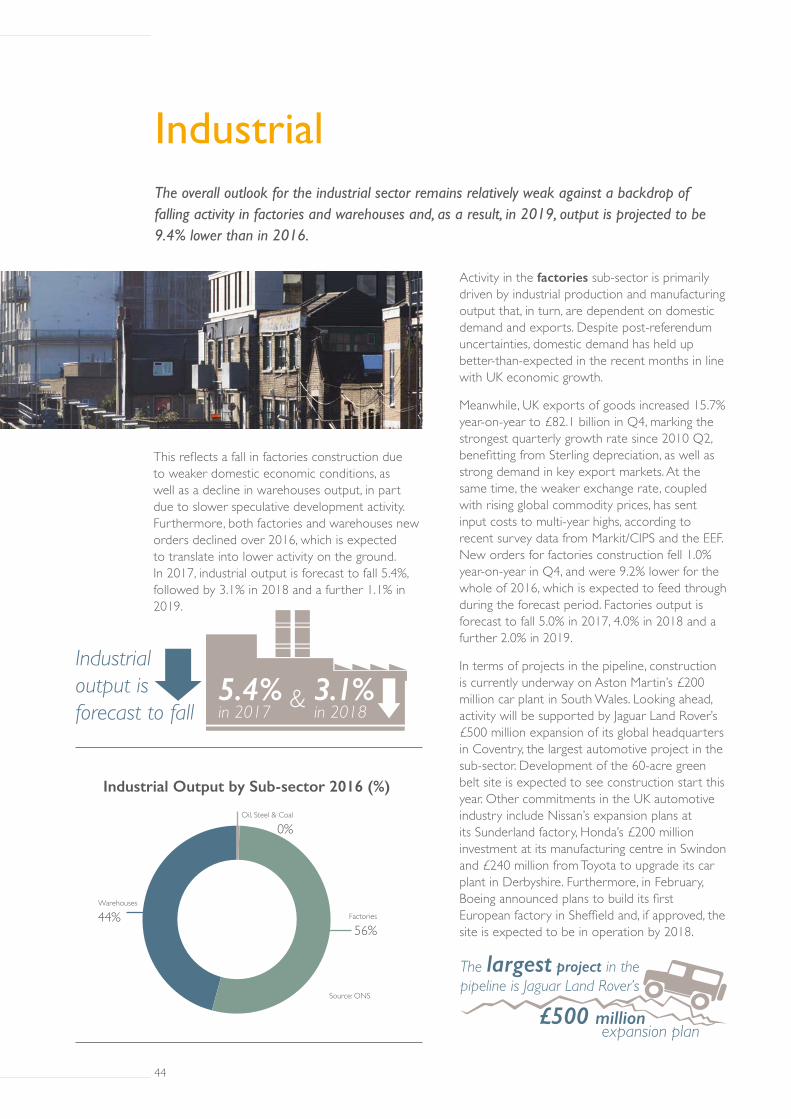
This reflects a fall in factories construction due to weaker domestic economic conditions, as well as a decline in warehouses output, in part due to slower speculative development activity. Furthermore, both factories and warehouses new orders declined over 2016, which is expected to translate into lower activity on the ground. In 2017, industrial output is forecast to fall 5.4%, followed by 3.1% in 2018 and a further 1.1% in 2019.
Activity in the factories sub-sector is primarily driven by industrial production and manufacturing output that, in turn, are dependent on domestic demand and exports. Despite post-referendum uncertainties, domestic demand has held up better-than-expected in the recent months in line with UK economic growth.
Meanwhile, UK exports of goods increased 15.7% year-on-year to £82.1 billion in Q4, marking the strongest quarterly growth rate since 2010 Q2, benefitting from Sterling depreciation, as well as strong demand in key export markets. At the same time, the weaker exchange rate, coupled with rising global commodity prices, has sent input costs to multi-year highs, according to recent survey data from Markit/CIPS and the EEF. New orders for factories construction fell 1.0% year-on-year in Q4, and were 9.2% lower for the whole of 2016, which is expected to feed through during the forecast period. Factories output is forecast to fall 5.0% in 2017, 4.0% in 2018 and a further 2.0% in 2019.
In terms of projects in the pipeline, construction is currently underway on Aston Martin’s £200 million car plant in South Wales. Looking ahead, activity will be supported by Jaguar Land Rover’s £500 million expansion of its global headquarters in Coventry, the largest automotive project in the sub-sector. Development of the 60-acre green belt site is expected to see construction start this year. Other commitments in the UK automotive industry include Nissan’s expansion plans at its Sunderland factory, Honda’s £200 million investment at its manufacturing centre in Swindon and £240 million from Toyota to upgrade its car plant in Derbyshire. Furthermore, in February, Boeing announced plans to build its first European factory in Sheffield and, if approved, the site is expected to be in operation by 2018.
IndustrialThe overall outlook for the industrial sector remains relatively weak against a backdrop of falling activity in factories and warehouses and, as a result, in 2019, output is projected to be 9.4% lower than in 2016.
Industrial Output by Sub-sector 2016 (%)
Source: ONS
Oil, Steel & Coal
0%
Factories
56%
Warehouses
44%
Industrial output is forecast to fall
5.4% in 2017
3.1% in 2018
&
expansion plan£500 million
The largest project in the pipeline is Jaguar Land Rover’s
44 45
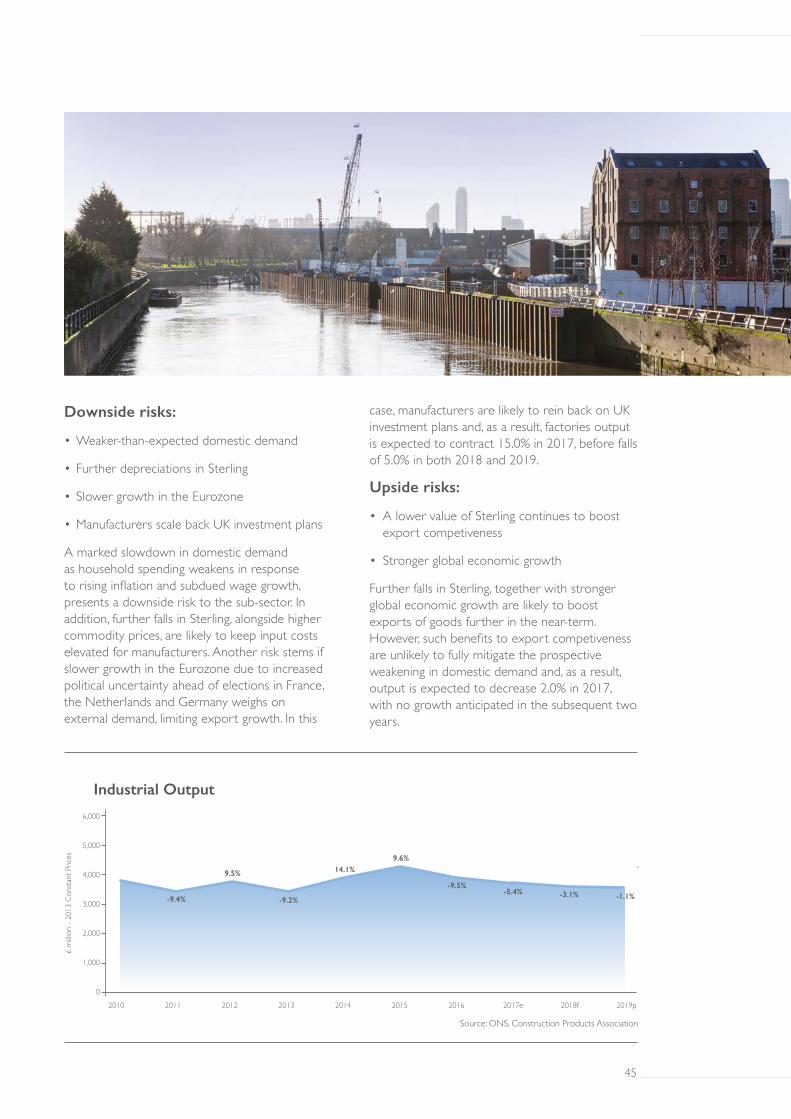
Downside risks:
• Weaker-than-expected domestic demand
• Further depreciations in Sterling
• Slower growth in the Eurozone
• Manufacturers scale back UK investment plans
A marked slowdown in domestic demand as household spending weakens in response to rising inflation and subdued wage growth, presents a downside risk to the sub-sector. In addition, further falls in Sterling, alongside higher commodity prices, are likely to keep input costs elevated for manufacturers. Another risk stems if slower growth in the Eurozone due to increased political uncertainty ahead of elections in France, the Netherlands and Germany weighs on external demand, limiting export growth. In this
case, manufacturers are likely to rein back on UK investment plans and, as a result, factories output is expected to contract 15.0% in 2017, before falls of 5.0% in both 2018 and 2019.
Upside risks:
• A lower value of Sterling continues to boost export competiveness
• Stronger global economic growth
Further falls in Sterling, together with stronger global economic growth are likely to boost exports of goods further in the near-term. However, such benefits to export competiveness are unlikely to fully mitigate the prospective weakening in domestic demand and, as a result, output is expected to decrease 2.0% in 2017, with no growth anticipated in the subsequent two years.
14.1%9.5%
-9.5%
-9.4%
9.6%
-9.2%-5.4% -3.1% -1.1%
2010 2011 2012 2013 2014 2015 2016 2017e 2018f 2019p
6,000
5,000
4,000
3,000
2,000
1,000
0
Industrial Output
£ m
illion
- 20
13 C
onsta
nt P
rices
Source: ONS, Construction Products Association
44 45
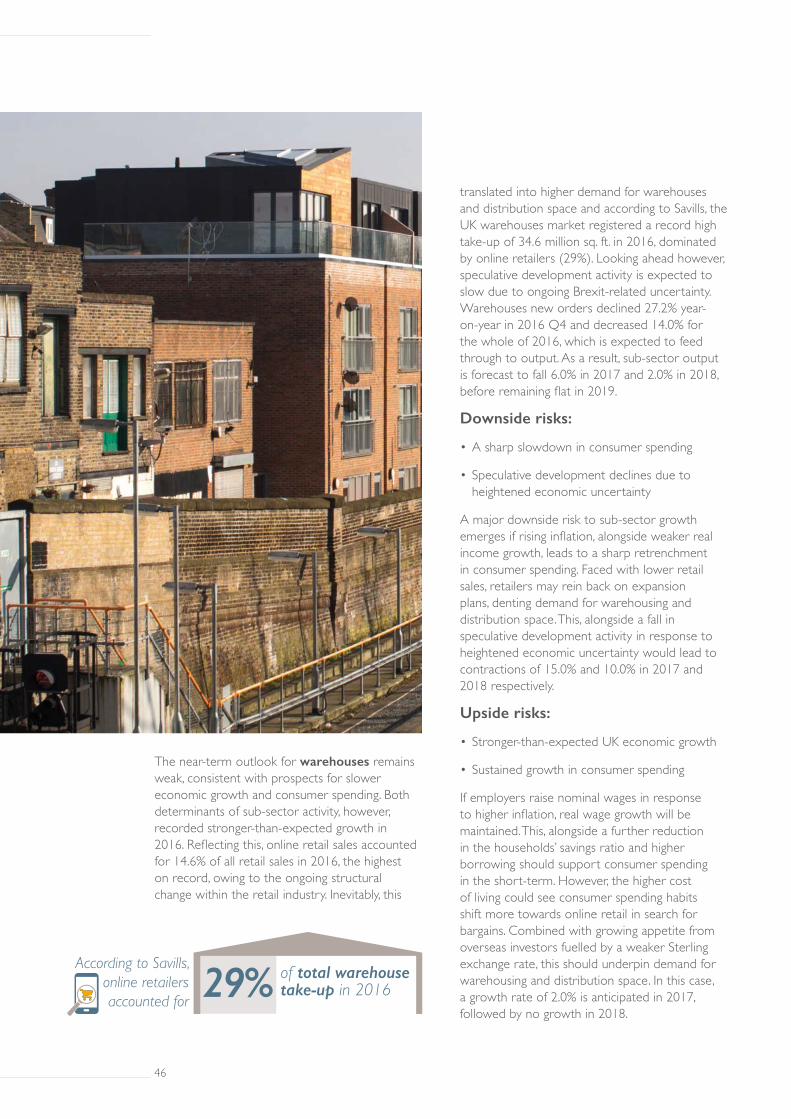
The near-term outlook for warehouses remains weak, consistent with prospects for slower economic growth and consumer spending. Both determinants of sub-sector activity, however, recorded stronger-than-expected growth in 2016. Reflecting this, online retail sales accounted for 14.6% of all retail sales in 2016, the highest on record, owing to the ongoing structural change within the retail industry. Inevitably, this
translated into higher demand for warehouses and distribution space and according to Savills, the UK warehouses market registered a record high take-up of 34.6 million sq. ft. in 2016, dominated by online retailers (29%). Looking ahead however, speculative development activity is expected to slow due to ongoing Brexit-related uncertainty. Warehouses new orders declined 27.2% year-on-year in 2016 Q4 and decreased 14.0% for the whole of 2016, which is expected to feed through to output. As a result, sub-sector output is forecast to fall 6.0% in 2017 and 2.0% in 2018, before remaining flat in 2019.
Downside risks:
• A sharp slowdown in consumer spending
• Speculative development declines due to heightened economic uncertainty
A major downside risk to sub-sector growth emerges if rising inflation, alongside weaker real income growth, leads to a sharp retrenchment in consumer spending. Faced with lower retail sales, retailers may rein back on expansion plans, denting demand for warehousing and distribution space. This, alongside a fall in speculative development activity in response to heightened economic uncertainty would lead to contractions of 15.0% and 10.0% in 2017 and 2018 respectively.
Upside risks:
• Stronger-than-expected UK economic growth
• Sustained growth in consumer spending
If employers raise nominal wages in response to higher inflation, real wage growth will be maintained. This, alongside a further reduction in the households’ savings ratio and higher borrowing should support consumer spending in the short-term. However, the higher cost of living could see consumer spending habits shift more towards online retail in search for bargains. Combined with growing appetite from overseas investors fuelled by a weaker Sterling exchange rate, this should underpin demand for warehousing and distribution space. In this case, a growth rate of 2.0% is anticipated in 2017, followed by no growth in 2018.
According to Savills, online retailers accounted for
of total warehouse take-up in 201629%
46 47
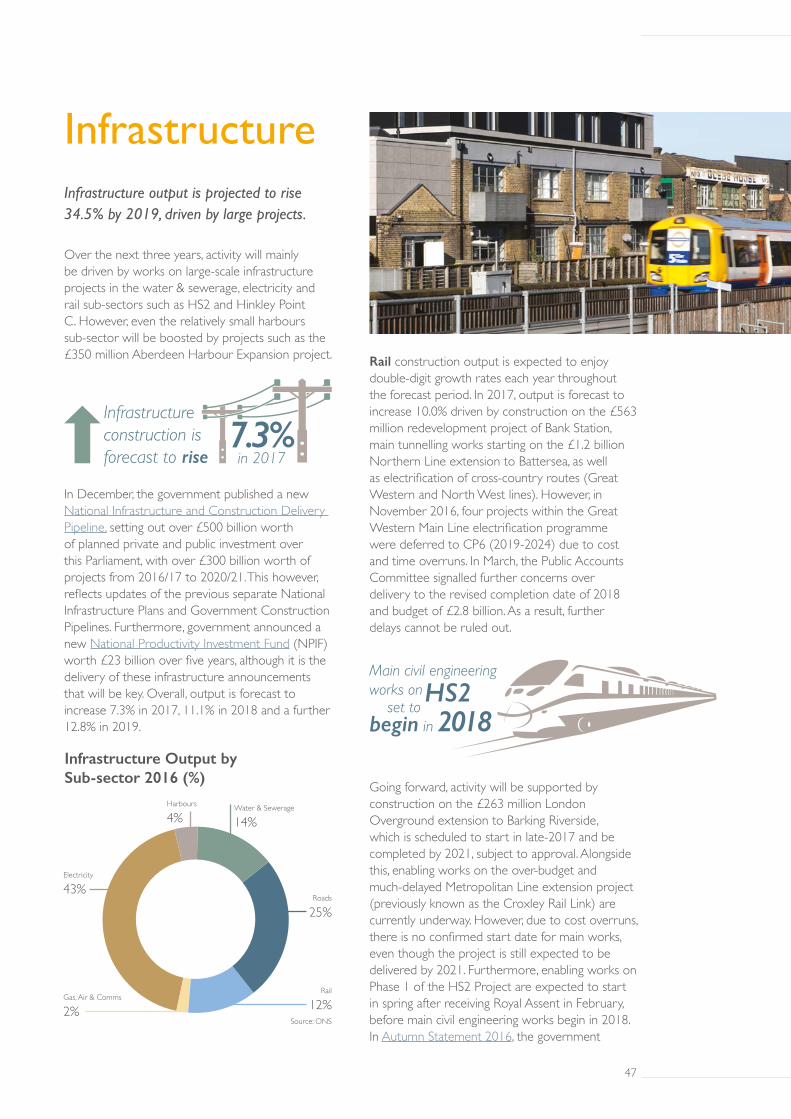
Over the next three years, activity will mainly be driven by works on large-scale infrastructure projects in the water & sewerage, electricity and rail sub-sectors such as HS2 and Hinkley Point C. However, even the relatively small harbours sub-sector will be boosted by projects such as the £350 million Aberdeen Harbour Expansion project.
In December, the government published a new National Infrastructure and Construction Delivery Pipeline, setting out over £500 billion worth of planned private and public investment over this Parliament, with over £300 billion worth of projects from 2016/17 to 2020/21. This however, reflects updates of the previous separate National Infrastructure Plans and Government Construction Pipelines. Furthermore, government announced a new National Productivity Investment Fund (NPIF) worth £23 billion over five years, although it is the delivery of these infrastructure announcements that will be key. Overall, output is forecast to increase 7.3% in 2017, 11.1% in 2018 and a further 12.8% in 2019.
Rail construction output is expected to enjoy double-digit growth rates each year throughout the forecast period. In 2017, output is forecast to increase 10.0% driven by construction on the £563 million redevelopment project of Bank Station, main tunnelling works starting on the £1.2 billion Northern Line extension to Battersea, as well as electrification of cross-country routes (Great Western and North West lines). However, in November 2016, four projects within the Great Western Main Line electrification programme were deferred to CP6 (2019-2024) due to cost and time overruns. In March, the Public Accounts Committee signalled further concerns over delivery to the revised completion date of 2018 and budget of £2.8 billion. As a result, further delays cannot be ruled out.
Going forward, activity will be supported by construction on the £263 million London Overground extension to Barking Riverside, which is scheduled to start in late-2017 and be completed by 2021, subject to approval. Alongside this, enabling works on the over-budget and much-delayed Metropolitan Line extension project (previously known as the Croxley Rail Link) are currently underway. However, due to cost overruns, there is no confirmed start date for main works, even though the project is still expected to be delivered by 2021. Furthermore, enabling works on Phase 1 of the HS2 Project are expected to start in spring after receiving Royal Assent in February, before main civil engineering works begin in 2018. In Autumn Statement 2016, the government
InfrastructureInfrastructure output is projected to rise 34.5% by 2019, driven by large projects.
Infrastructure Output by Sub-sector 2016 (%)
Gas, Air & Comms
2%
Electricity
43%
Source: ONS
Harbours
4%
Roads
25%
Rail
12%
Water & Sewerage
14%
Main civil engineering works on
begin in 2018HS2
set to
Infrastructure construction is forecast to rise
7.3% in 2017
46 47
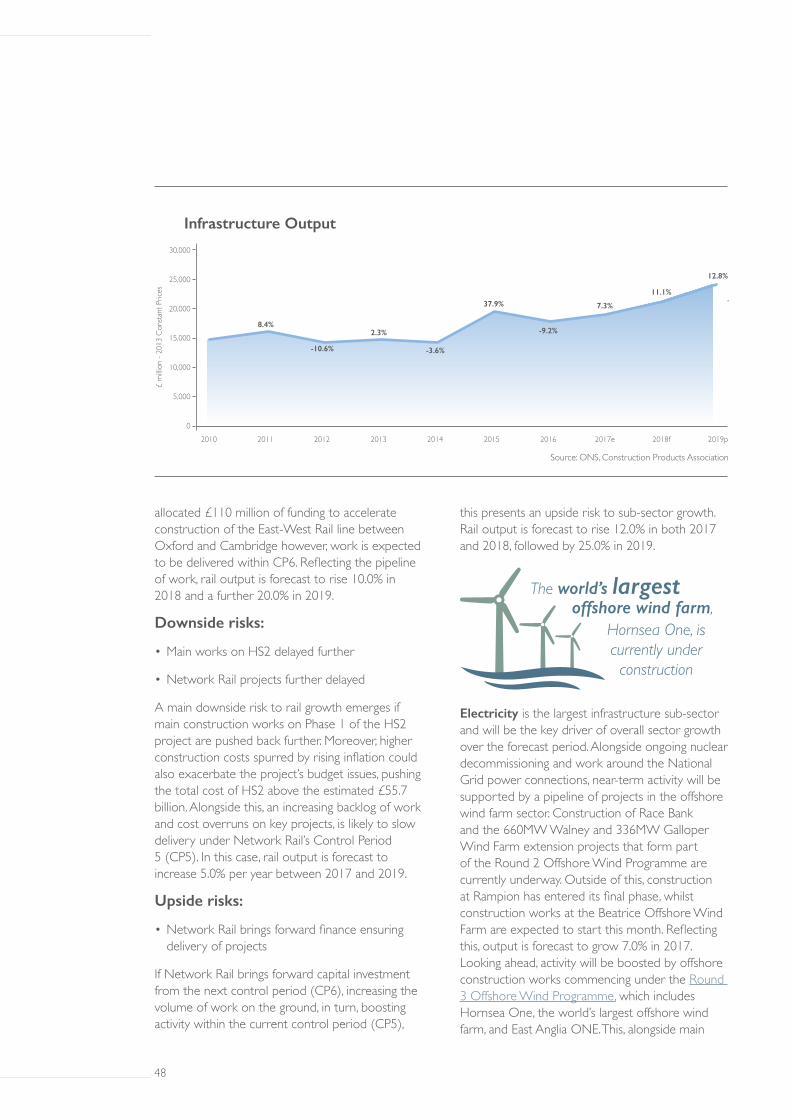
allocated £110 million of funding to accelerate construction of the East-West Rail line between Oxford and Cambridge however, work is expected to be delivered within CP6. Reflecting the pipeline of work, rail output is forecast to rise 10.0% in 2018 and a further 20.0% in 2019.
Downside risks:
• Main works on HS2 delayed further
• Network Rail projects further delayed
A main downside risk to rail growth emerges if main construction works on Phase 1 of the HS2 project are pushed back further. Moreover, higher construction costs spurred by rising inflation could also exacerbate the project’s budget issues, pushing the total cost of HS2 above the estimated £55.7 billion. Alongside this, an increasing backlog of work and cost overruns on key projects, is likely to slow delivery under Network Rail’s Control Period 5 (CP5). In this case, rail output is forecast to increase 5.0% per year between 2017 and 2019.
Upside risks:
• Network Rail brings forward finance ensuring delivery of projects
If Network Rail brings forward capital investment from the next control period (CP6), increasing the volume of work on the ground, in turn, boosting activity within the current control period (CP5),
this presents an upside risk to sub-sector growth. Rail output is forecast to rise 12.0% in both 2017 and 2018, followed by 25.0% in 2019.
Electricity is the largest infrastructure sub-sector and will be the key driver of overall sector growth over the forecast period. Alongside ongoing nuclear decommissioning and work around the National Grid power connections, near-term activity will be supported by a pipeline of projects in the offshore wind farm sector. Construction of Race Bank and the 660MW Walney and 336MW Galloper Wind Farm extension projects that form part of the Round 2 Offshore Wind Programme are currently underway. Outside of this, construction at Rampion has entered its final phase, whilst construction works at the Beatrice Offshore Wind Farm are expected to start this month. Reflecting this, output is forecast to grow 7.0% in 2017. Looking ahead, activity will be boosted by offshore construction works commencing under the Round 3 Offshore Wind Programme, which includes Hornsea One, the world’s largest offshore wind farm, and East Anglia ONE. This, alongside main
2010 2011 2012 2013 2014 2015 2016 2017e 2018f 2019p
30,000
25,000
20,000
15,000
10,000
5,000
0
Infrastructure Output
£ m
illion
- 20
13 C
onsta
nt P
rices
Source: ONS, Construction Products Association
-3.6%-10.6%
-9.2% 8.4%
37.9%
2.3%
7.3%
11.1%
12.8%
The world’s largest offshore wind farm,
Hornsea One, is currently under construction
48 49
works starting at Hinkley Point C after it finally received go-ahead from government in September 2016, should underpin stronger growth rates of 14.0% and 20.0% in 2018 and 2019 respectively, despite prospective reductions in subsidies for offshore wind energy announced by government in the Industrial Strategy Green Paper in January.
Downside risks:
• Hiatus in new offshore wind development
• Hinkley Point C suffers from further delays due to budget concerns
A downside risk emerges if heightened economic and political uncertainty during the two-year negotiation period further undermines investor confidence, deterring new foreign investments into the UK. Furthermore, increased uncertainty over access to European Investment Bank (EIB) funding over the medium-term could stall decision-making on large-scale projects, especially in offshore wind. At the same time, further delays at Hinkley Point C due to rising construction costs could see main works occur beyond the forecast period. These concerns are likely to be exacerbated as the UK leaves the European Atomic Energy Community (Euratom) over the long-term, which makes nuclear investment riskier and, consequently, more expensive. In this case, lower growth rates of 3.0% and 7.0% are anticipated in 2017 and 2018 respectively, followed by 7.0% in 2019.
Upside risks:
• Investor confidence improves leaving large-scale projects unaffected
• Swansea Bay Tidal Lagoon receives government go-ahead
A potential upside risk relates to a period compounded by better-than-expected economic conditions and greater clarity regarding the future UK/EU relationship. In this case, investor confidence is likely to be renewed, enabling large-scale projects to get off the ground, including work previously paused under the Round 3 Offshore Wind Programme. In January, plans to build a £1.3 billion Swansea Bay Tidal Lagoon in South Wales that would deliver 320MW of capacity were backed by the government-commissioned Hendry Review. However, a strike price is yet to be agreed
and if given go-ahead by the UK government, on-site construction works are expected to begin in 2018. Reflecting this, electricity output is forecast to rise 10.0% in 2017, 18.0% in 2018 and a further 25.0% in 2019.
Prospects for the water & sewerage sub-sector remain unchanged since the Winter forecast, with strong growth rates anticipated in the near-term driven by work on the largest project in the pipeline, the £4.2 billion Thames Tideway Tunnel. Preliminary construction is currently underway, with main tunnelling works set to start in 2018. The project has a £700 million backing from the EIB and following the EU referendum result, the Bank has stated that its funding commitments to the sub-sector will remain unchanged in the near-term, until a decision is reached on the UK’s membership of the EIB. Framework spending under the current five-year Asset Management Plan (AMP6) running from 2015/16 to 2021/21 is set to increase but water companies will mainly focus on efficiency, through maintenance of existing assets, rather than new build. Overall, sub-sector output is forecast to grow 17.0% in 2017, 12.0% in 2018, before remaining flat in 2019.
Downside risks:
• Thames Tideway Tunnel delayed
A downside risk to sub-sector growth arises if work on the Thames Tideway Tunnel suffers from delays due to cost overruns, slowing activity on the ground. However, a recent report by the National Audit Office revealed that the government has provided a contingent support package, which aims to mitigate any downside risks, including providing financial support if cost overruns exceed 30% or if economic and political events make it difficult to access capital from debt capital markets. Nevertheless, water & sewerage output is expected to increase 10.0% in 2017, followed by 5.0% in both 2018 and 2019 in this case.
£4.2 billionThames Tideway Tunnel to start in 2018
Tunnelling works on the
48 49
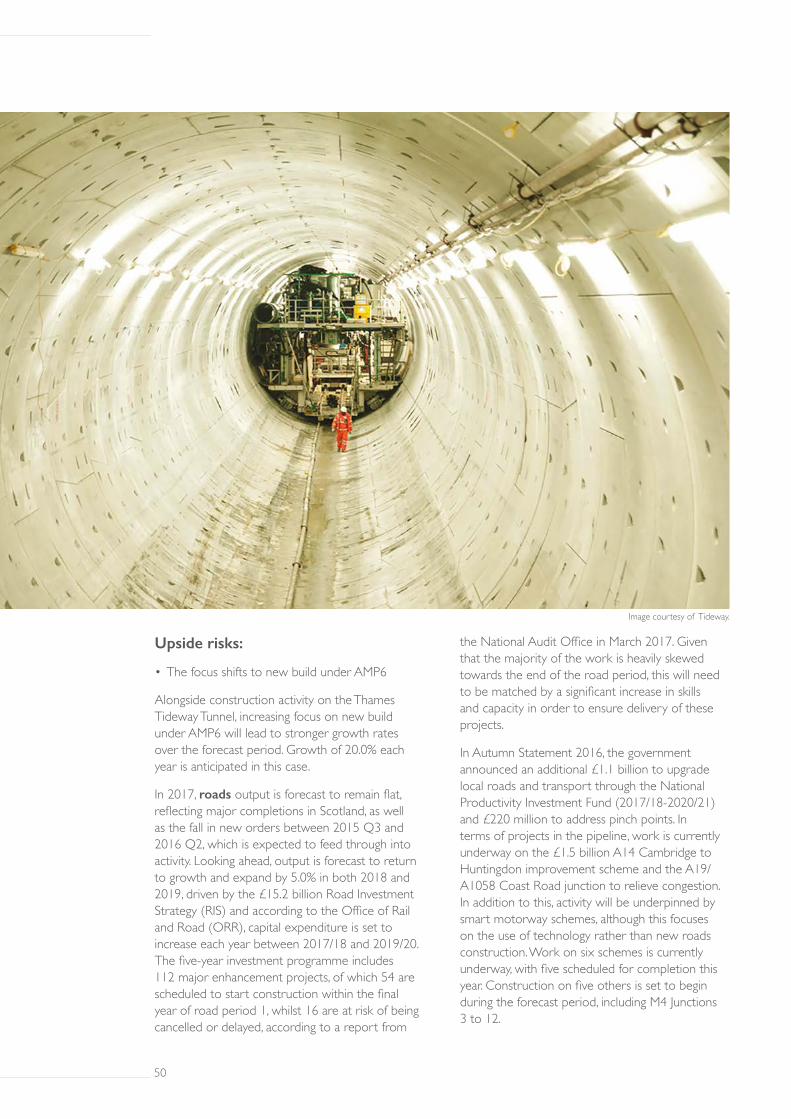
Upside risks:
• The focus shifts to new build under AMP6
Alongside construction activity on the Thames Tideway Tunnel, increasing focus on new build under AMP6 will lead to stronger growth rates over the forecast period. Growth of 20.0% each year is anticipated in this case.
In 2017, roads output is forecast to remain flat, reflecting major completions in Scotland, as well as the fall in new orders between 2015 Q3 and 2016 Q2, which is expected to feed through into activity. Looking ahead, output is forecast to return to growth and expand by 5.0% in both 2018 and 2019, driven by the £15.2 billion Road Investment Strategy (RIS) and according to the Office of Rail and Road (ORR), capital expenditure is set to increase each year between 2017/18 and 2019/20. The five-year investment programme includes 112 major enhancement projects, of which 54 are scheduled to start construction within the final year of road period 1, whilst 16 are at risk of being cancelled or delayed, according to a report from
the National Audit Office in March 2017. Given that the majority of the work is heavily skewed towards the end of the road period, this will need to be matched by a significant increase in skills and capacity in order to ensure delivery of these projects.
In Autumn Statement 2016, the government announced an additional £1.1 billion to upgrade local roads and transport through the National Productivity Investment Fund (2017/18-2020/21) and £220 million to address pinch points. In terms of projects in the pipeline, work is currently underway on the £1.5 billion A14 Cambridge to Huntingdon improvement scheme and the A19/A1058 Coast Road junction to relieve congestion. In addition to this, activity will be underpinned by smart motorway schemes, although this focuses on the use of technology rather than new roads construction. Work on six schemes is currently underway, with five scheduled for completion this year. Construction on five others is set to begin during the forecast period, including M4 Junctions 3 to 12.
Image courtesy of Tideway.
50 51
Downside risks:
• Further cuts to local authorities’ funding
• Focus shifts further to smart motorways
Government focus on austerity in the near-term could see funding to local authorities fall further, constraining their ability to deliver on roads projects. This, coupled with diminishing EU funding over the long-term, could see local government budgets stretched, leaving projects unfunded. Furthermore, increasing focus on smart motorways, mainly technology-based, rather new roads construction could dampen activity in the sub-sector. In this case, output is anticipated to fall 5.0% in 2017, before remaining flat in both 2018 and 2019.
Upside risks:
• Highways England brings forward finance
If Highways England brings forward finance from later years during the RIS period that will ensure a smoother profile of works. This would provide higher workloads in the near-term and ensure a gradual increase in funding and investment over the RIS, rather than the bulk of activity occurring in the later years of the programme. Moreover, financial incentives to local authorities mainly in the form of ring-fenced funding could provide more clarity on roads projects and, in turn, ensure delivery of them over the medium-term. In this case, growth of 5.0% is expected in 2017, followed by 8.0% in both 2018 and 2019.
Following five years of declines since 2012, gas, air and communications output is forecast to increase 20.0% in 2017, reflecting construction works commencing under Manchester Airport’s £1.0 billion ten-year investment programme, London City Airport’s £344 million expansion programme and Luton Airport’s £1.5 billion 20-year investment programme that will support
activity through to the long-term. This, alongside ongoing works under Gatwick Airport’s £1.2 billion five-year Capital Investment Programme (2016 to 2021) and Virgin Media’s £3.0 billion expansion of its broadband network across the UK should support double-digit growth rates throughout the forecast period. However, workloads in broadband expansion have been limited under previous expansion programmes. Given that a final decision to build a third runaway at Heathrow Airport has not yet been reached, this has not been included in the forecast. Sub-sector output is forecast to rise 20.0% in 2018 and a further 10.0% in 2019.
Downside risks:
• Further delays in expansion to superfast broadband
In the Autumn Statement, the government announced that it will invest £740 million through the new NPIF to support the market to roll out full-fibre connections and future 5G communications. This includes £400 million for a new Digital Infrastructure Investment Fund (DIIF) to fund the extension of fibre networks over the next four years. However, further delays to this, as well as to Virgin Media’s £3.0 billion ultra-fast broadband roll out, would result in lower growth figures over the next three years. In this case, output is anticipated to rise 5.0% in 2017, followed by 7.0% in both 2018 and 2019.
Upside risks:
• Substantial progress is made in expanding broadband across the UK
• New gas storage investment occurs
If progress is made on expanding broadband across the UK, including work under Virgin Media’s £3.0 billion project, this presents an upside risk to sub-sector growth. This, as well as new investment in gas storage in response to utilising shale gas reserves, will underpin double-digit growth rates of 25.0% in 2017 and 2018 and 15.0% in 2019.
The NPIF aims to invest
in digital infrastructure by 2020/21
50 51

Highways England has a maintenance budget of £1.3 billion over its first fixed five-year investment period, which began in 2015/16. In 2017/18, expenditure on maintenance is set to rise to £258 million, from the £254 million allocated for 2016/17. Thereafter, it is expected to increase in 2018/19, before slowing in 2019/20. However, local authorities manage 97% of the roads network, and remain financially constrained. According to the Local Government Association, the shortfall between total local authority expenditure and funding will peak at £10.3 billion in 2018/19. The government has allocated £70 million of funding from the £250 million Pothole Action Fund for use by local highway authorities across England in 2017/18 that will help repair 1.3 million potholes. However, the Asphalt Industry Alliance’s 2017 ALARM survey reported that there was a 13-year backlog of local roads maintenance in England, at a value of £10.8 billion. For London, the average maintenance backlog was 10 years (£686.1 million).
In the rail-sub-sector, according to the ORR’s annual efficiency and finance assessment report, Network Rail maintenance expenditure for 2015/16 was £1.2 billion, £112 million over budget than the estimated £1.1 billion in the Periodic Review 2013 (PR13) determination. Furthermore, maintenance expenditure for the control period to-date was £156 million higher than initially estimated. Furthermore rising cost pressures and a backlog of work under the current control period is likely to increase financial pressure on CP6 (2019-2024). Overall, infrastructure r&m is forecast to remain flat in the next three years from 2017.
Infrastructure R&M Infrastructure repair and maintenance (r&m) includes work on assets owned by utility companies, publicly-funded assets such as roads and rail, airports and energy-generating facilities.
Image courtesy of Highways England.
The ALARM survey 2017 reported a
of local roads maintenance
in England
52 53
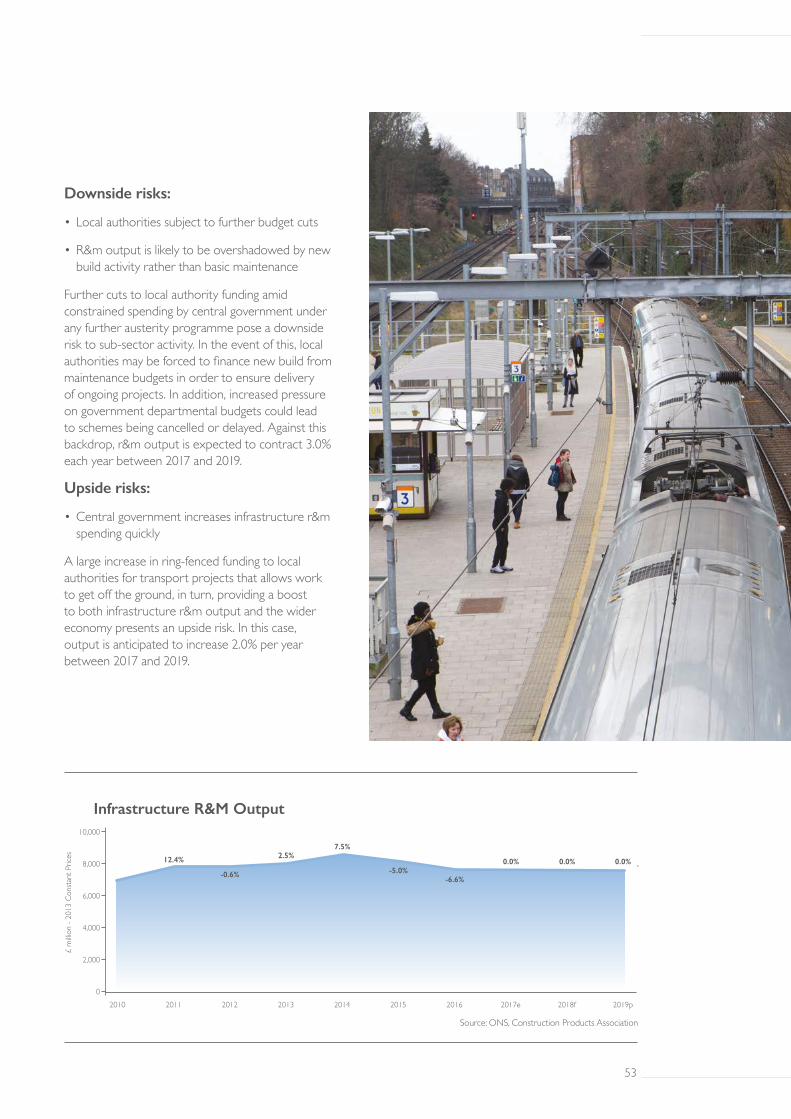
Downside risks:
• Local authorities subject to further budget cuts
• R&m output is likely to be overshadowed by new build activity rather than basic maintenance
Further cuts to local authority funding amid constrained spending by central government under any further austerity programme pose a downside risk to sub-sector activity. In the event of this, local authorities may be forced to finance new build from maintenance budgets in order to ensure delivery of ongoing projects. In addition, increased pressure on government departmental budgets could lead to schemes being cancelled or delayed. Against this backdrop, r&m output is expected to contract 3.0% each year between 2017 and 2019.
Upside risks:
• Central government increases infrastructure r&m spending quickly
A large increase in ring-fenced funding to local authorities for transport projects that allows work to get off the ground, in turn, providing a boost to both infrastructure r&m output and the wider economy presents an upside risk. In this case, output is anticipated to increase 2.0% per year between 2017 and 2019.
2010 2011 2012 2013 2014 2015 2016 2017e 2018f 2019p
10,000
8,000
6,000
4,000
2,000
0
Infrastructure R&M Output
£ m
illion
- 20
13 C
onsta
nt P
rices
Source: ONS, Construction Products Association
7.5%
-0.6%-6.6%
12.4%-5.0%
2.5%0.0% 0.0% 0.0%
52 53

The Construction Products Association represents the UK’s manufacturers and distributors of construction products and materials. The sector directly provides jobs for 300,000 people across 22,000 companies and has an annual turnover of more than £55 billion. The Association is the leading voice to promote and campaign for this vital UK industry.
The CPA produces a range of economic reports including quarterly Construction Industry Forecasts, Construction Trade Surveys, State of Trade Surveys and various bespoke research. These publications are available free to members and via subscription to non-members. To learn more, please contact our Economics Team at (44) 020 7323 3770 or visit www.constructionproducts.org.uk.
54 55
54 55
ISBN: 978-1-909415-25-6
April 2017
Construction Products Association26 Store StreetLondon WC1E 7BT Tel: 0207 323 3770www.constructionproducts.org.uk