Embed Size (px)
Citation preview

CONSTRUCTION OF COMPOSITE INDEX
III Seminar
Gopichand, BIII Ph. D.PALB - 8025Dept of Agril. Extension

Acknowledgement
Joint Research Centre-European Commission, 2008, Handbook on
constructing composite indicators: methodology and user guide.
OECD publishing.
BANDURA, R., 2008, A survey of composite indices measuring
country performance: 2008 update. New York: United Nations
Development Programme, Office of Development Studies (UNDP/ODS
Working Paper).
MAZZIOTTA, M., & PARETO, A., 2013, Methods for constructing
composite indices: One for all or all for one. Rivista Italiana di
Economia Demografia e Statistica, 67(2), 67-80.
INTRODUCTION
Social science thrives to measure the appropriate human relations, behavior, growth, impact, comparison…
Different methodologies used
Scale and index are most valid Agricultural Extension methodologies
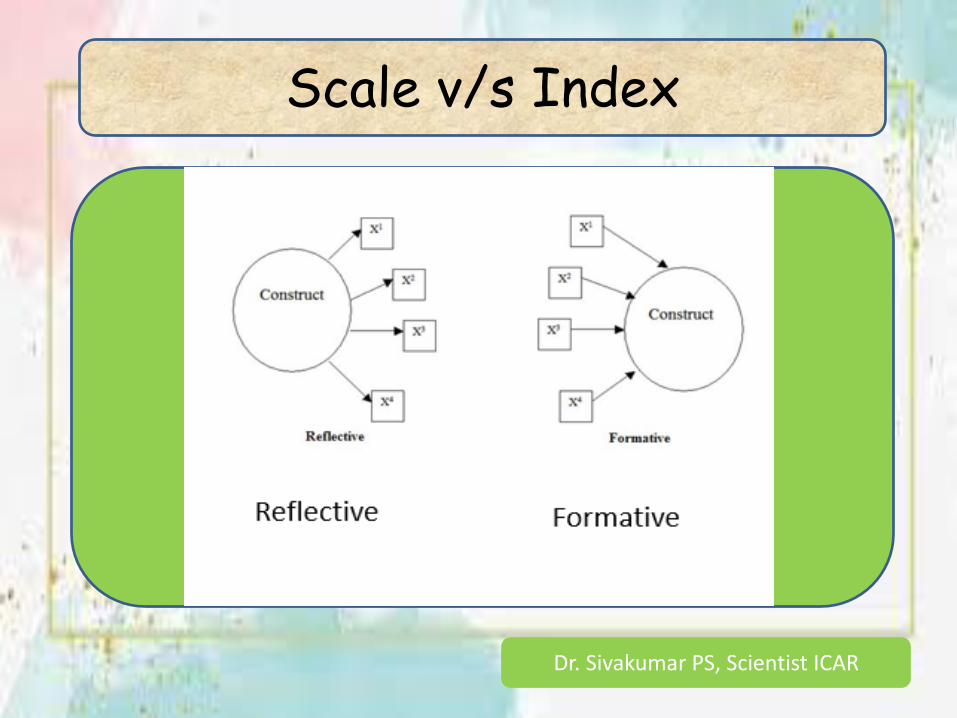
Scale v/s Index
Dr. Sivakumar PS, Scientist ICAR
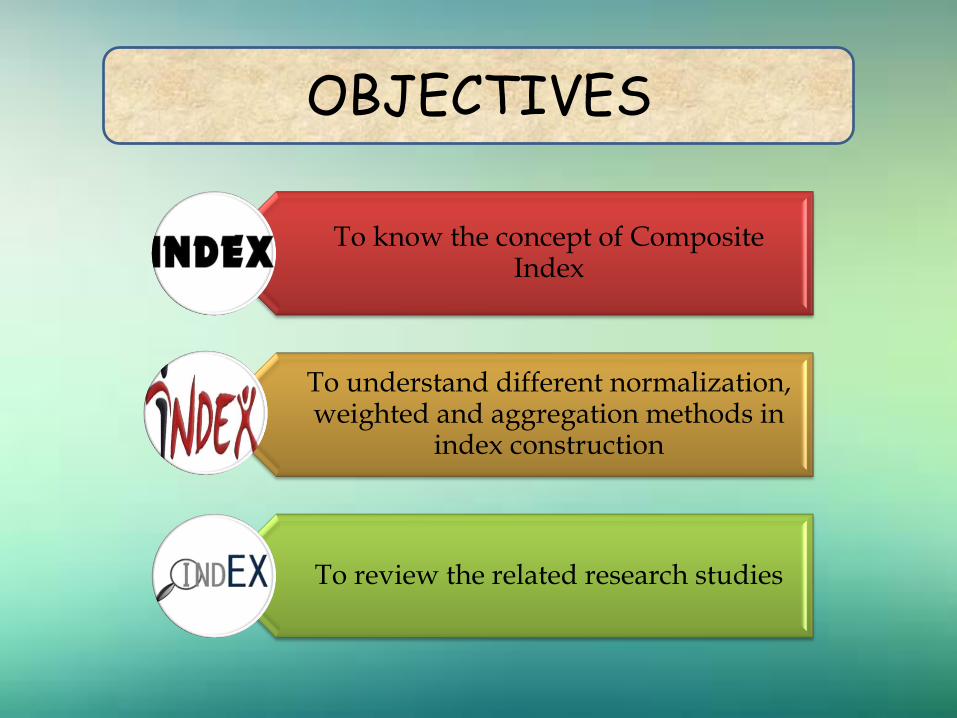
OBJECTIVES
To know the concept of Composite Index
To understand different normalization, weighted and aggregation methods in
index construction
To review the related research studies
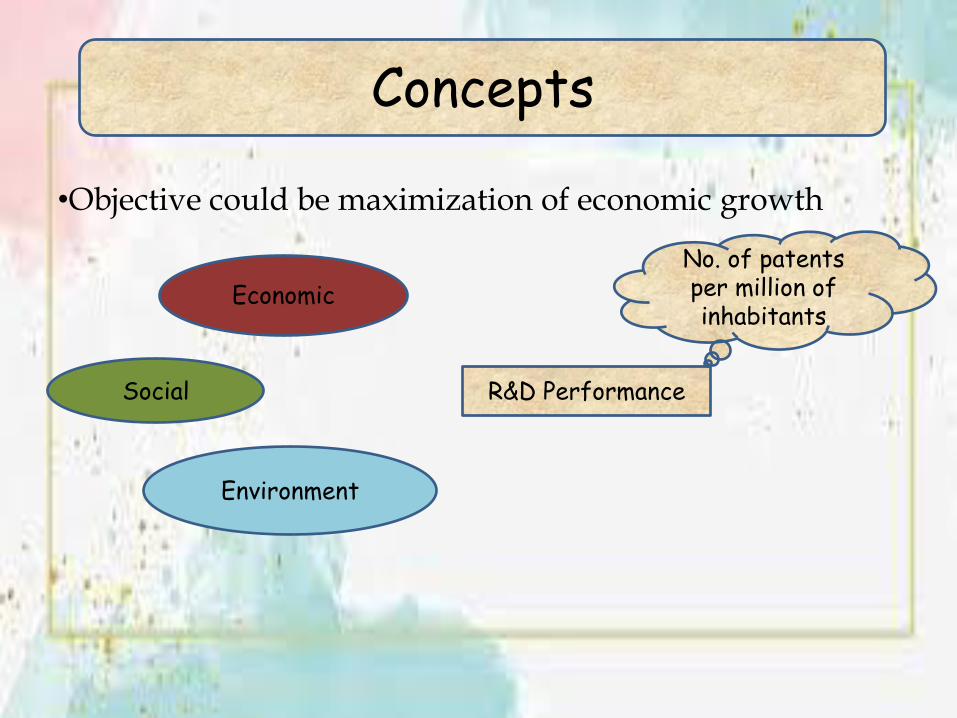
Concepts
•Objective could be maximization of economic growth
Economic
Social
Environment
R&D Performance
No. of patents per million of inhabitants
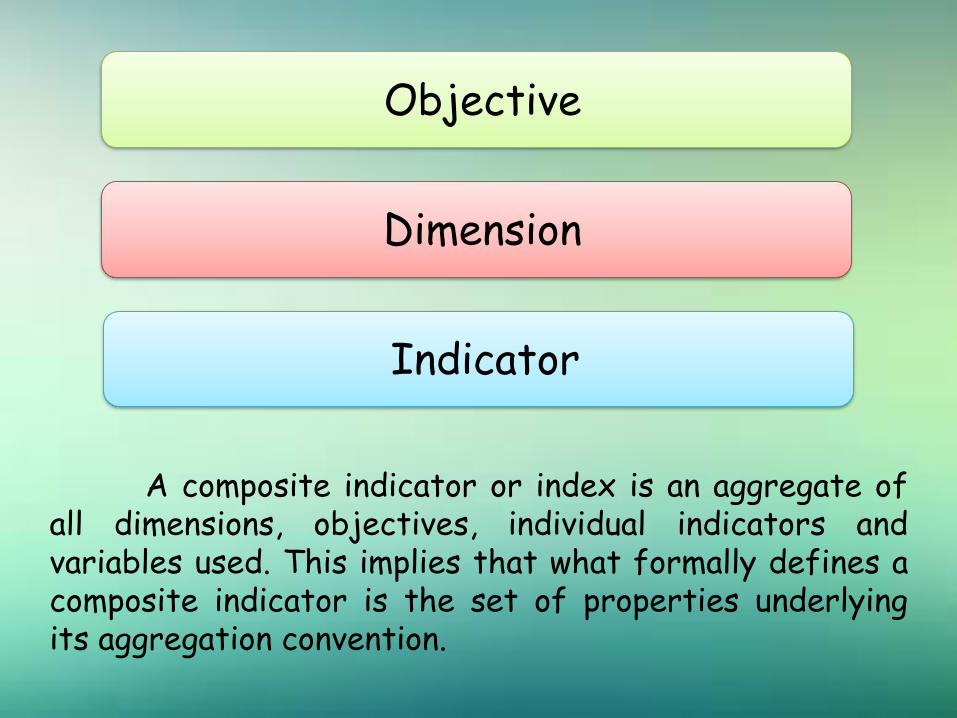
Dimension
A composite indicator or index is an aggregate ofall dimensions, objectives, individual indicators andvariables used. This implies that what formally defines acomposite indicator is the set of properties underlyingits aggregation convention.
Objective
Indicator
INDEX- Meaning
• A composite indicator is formed when individualindicators are compiled into a single index on thebasis of an underlying model.
• The composite indicator should ideally measuremultidimensional concepts which cannot be capturedby a single indicator.
• Construction owes more craftsmanship of modelerthan to universally accepted scientific rules forencoding
- OECD
Importance
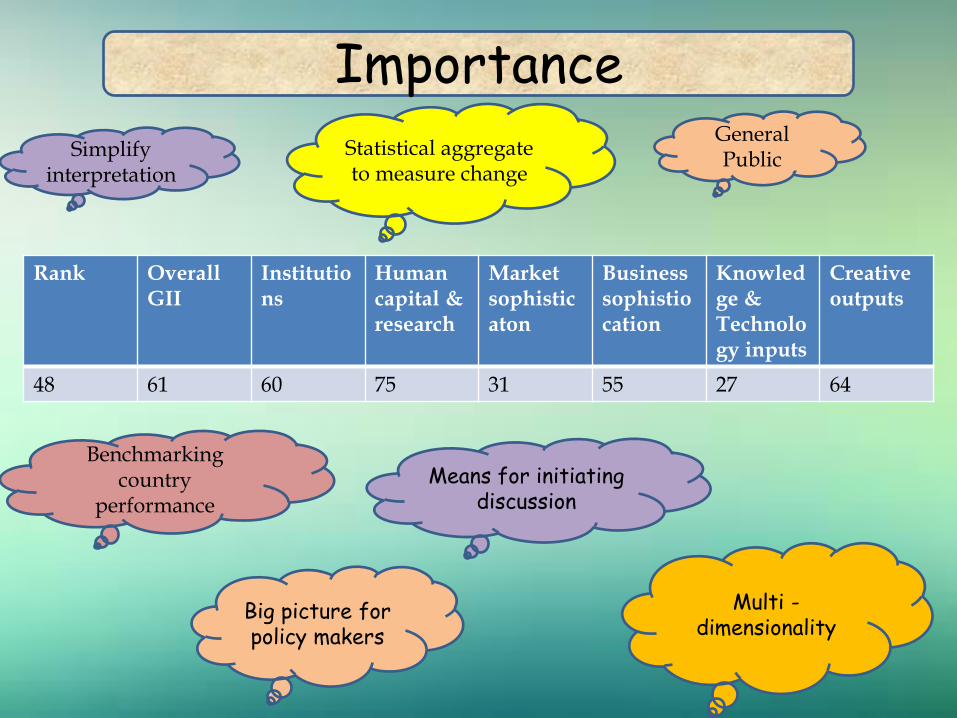
Simplify interpretation
Statistical aggregate to measure change
Rank Overall GII
Institutions
Human capital & research
Market sophisticaton
Business sophistiocation
Knowledge & Technology inputs
Creative outputs
48 61 60 75 31 55 27 64
General Public
Benchmarking country
performance
Big picture for policy makers
Means for initiating discussion
Multi -dimensionality
Importance
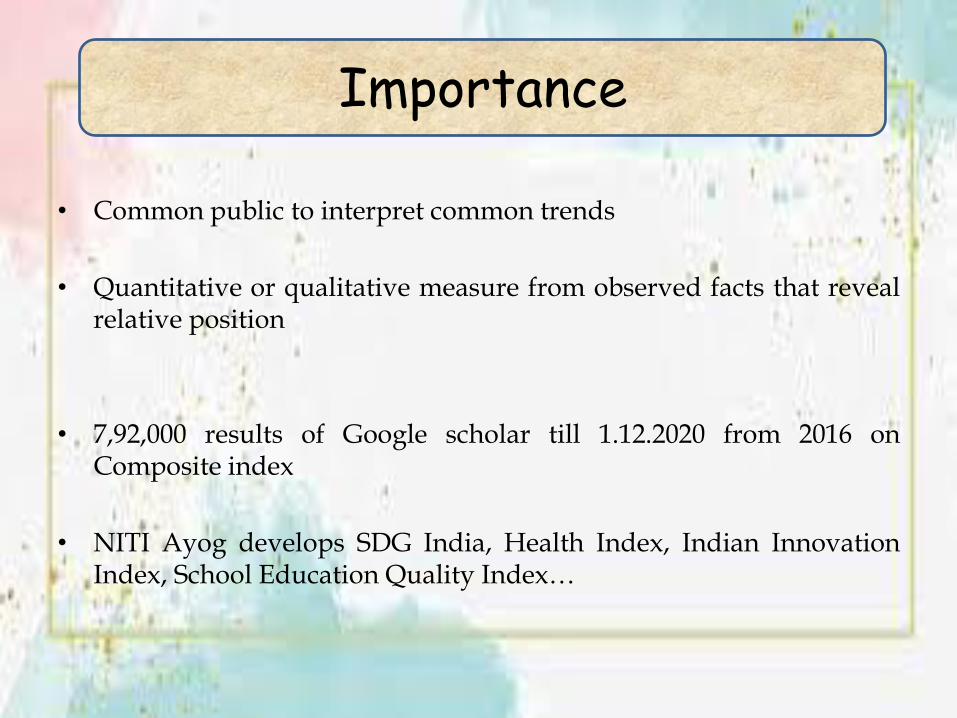
• Common public to interpret common trends
• Quantitative or qualitative measure from observed facts that revealrelative position
• 7,92,000 results of Google scholar till 1.12.2020 from 2016 onComposite index
• NITI Ayog develops SDG India, Health Index, Indian InnovationIndex, School Education Quality Index…

Characteristics of an Index
❖ Robust – Not thrown off by random or partialvariations
❖ Discriminating – Able to distinguishes betweendifferent case
❖ Efficient – Reasonably easy to build and measure
❖ Effective : Captures what we want to measure
Guidelines for selection of indicators
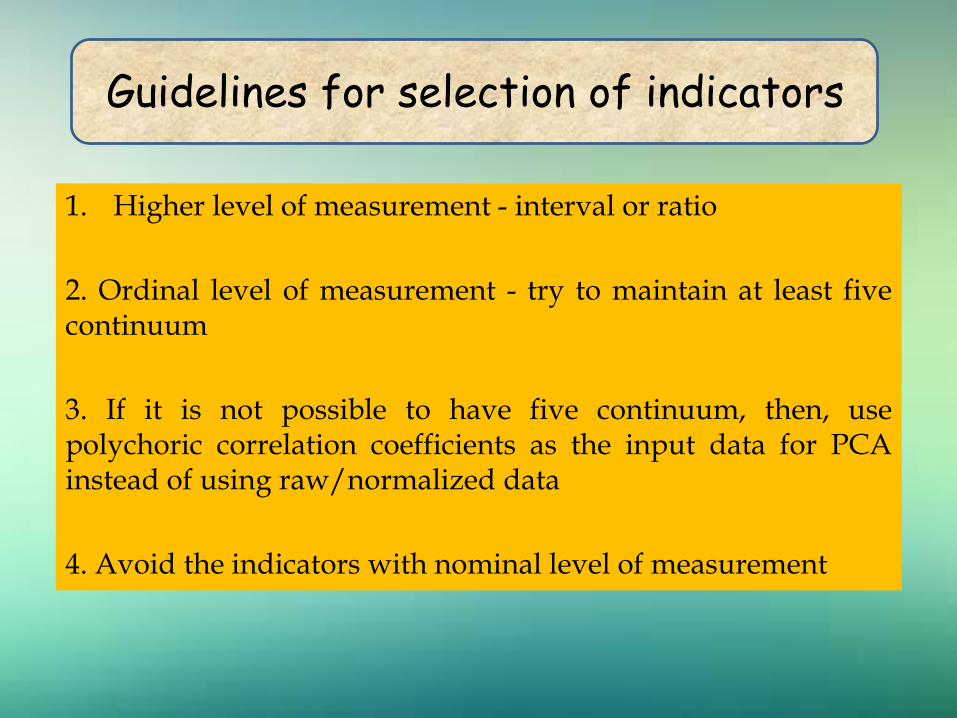
1. Higher level of measurement - interval or ratio
2. Ordinal level of measurement - try to maintain at least fivecontinuum
3. If it is not possible to have five continuum, then, usepolychoric correlation coefficients as the input data for PCAinstead of using raw/normalized data
4. Avoid the indicators with nominal level of measurement

Choices made in one step can have importantimplications for others: therefore, the developer ofcomposite indicator has not only to make the mostappropriate methodological choices in each step, but also toidentify whether they fit together well.
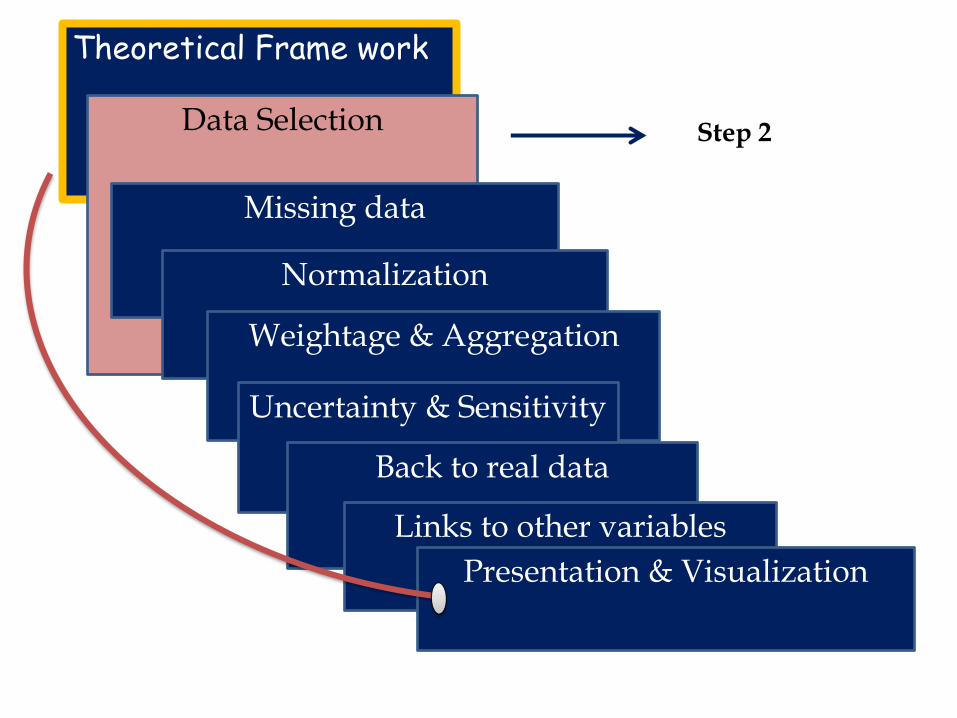
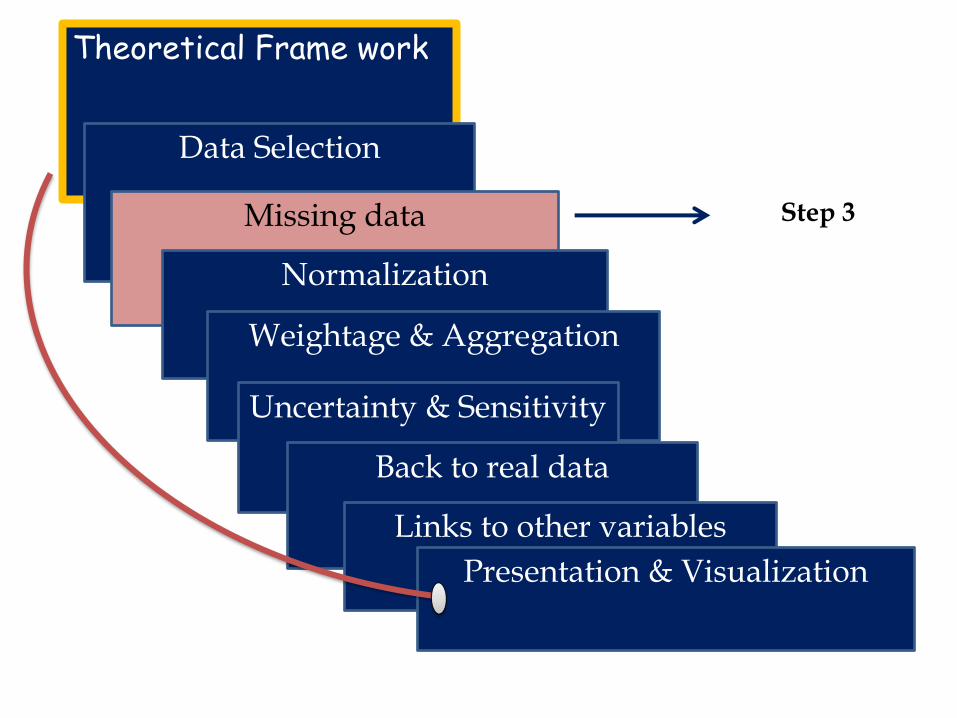
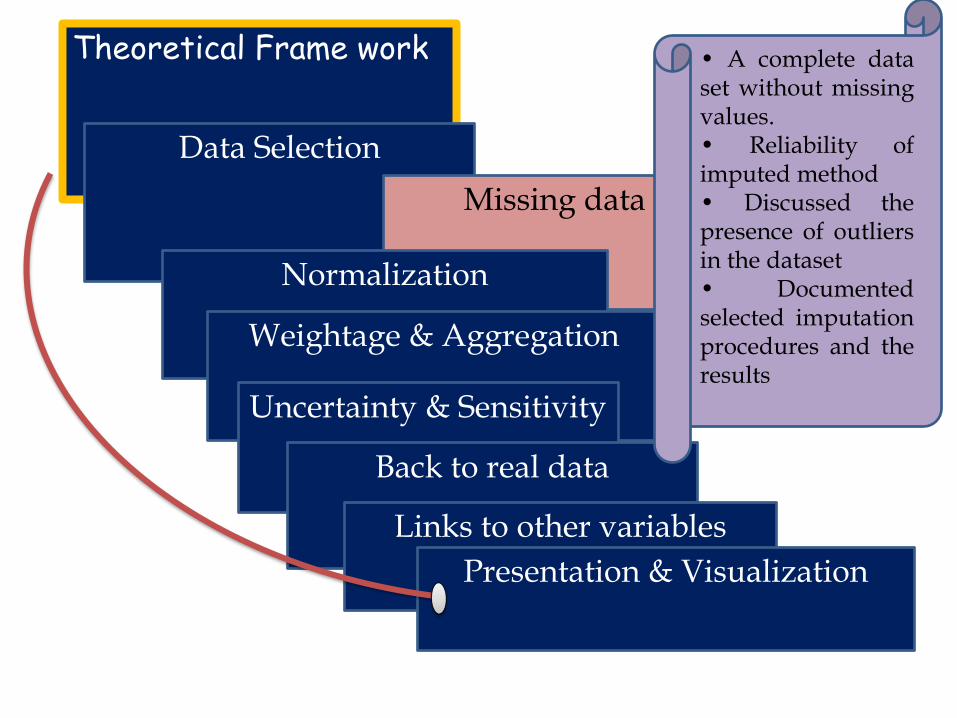
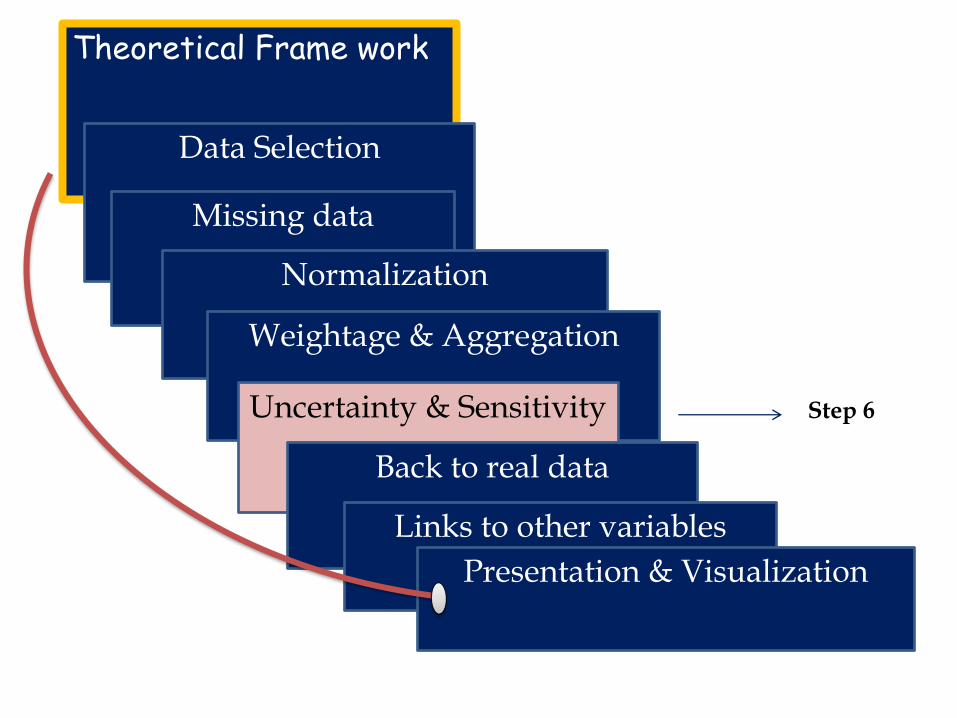
Steps in Construction of Composite Index
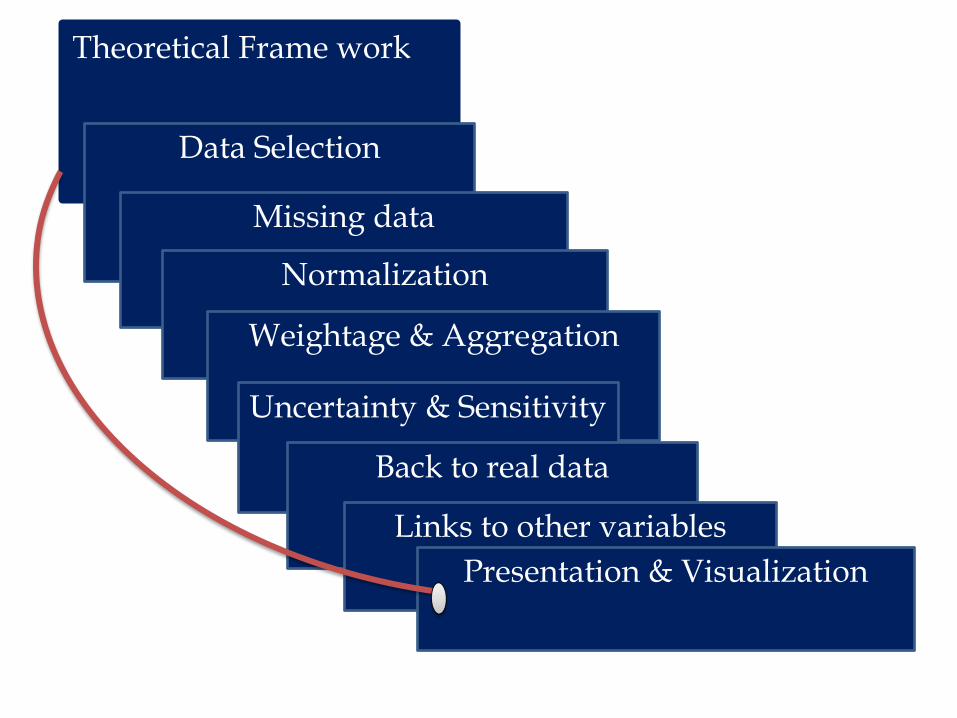
Theoretical Frame work
Data Selection
Missing data
Normalization
Weightage & Aggregation
Uncertainty & Sensitivity
Back to real data
Links to other variables
Presentation & Visualization
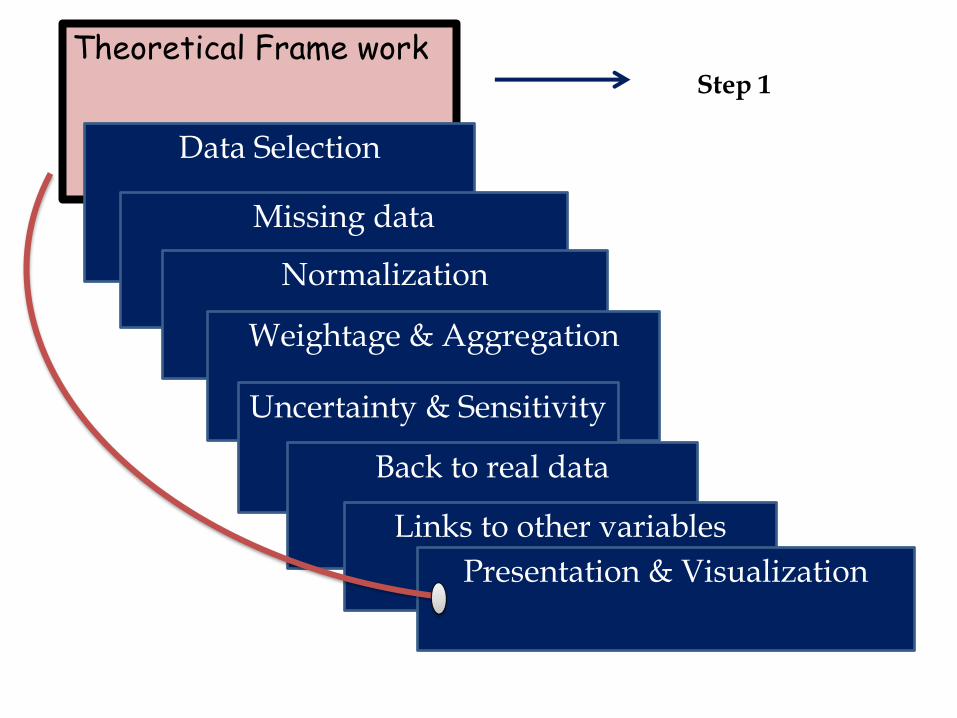
Theoretical Frame work
Data Selection
Missing data
Normalization
Weightage & Aggregation
Uncertainty & Sensitivity
Back to real data
Links to other variables
Presentation & Visualization
Step 1
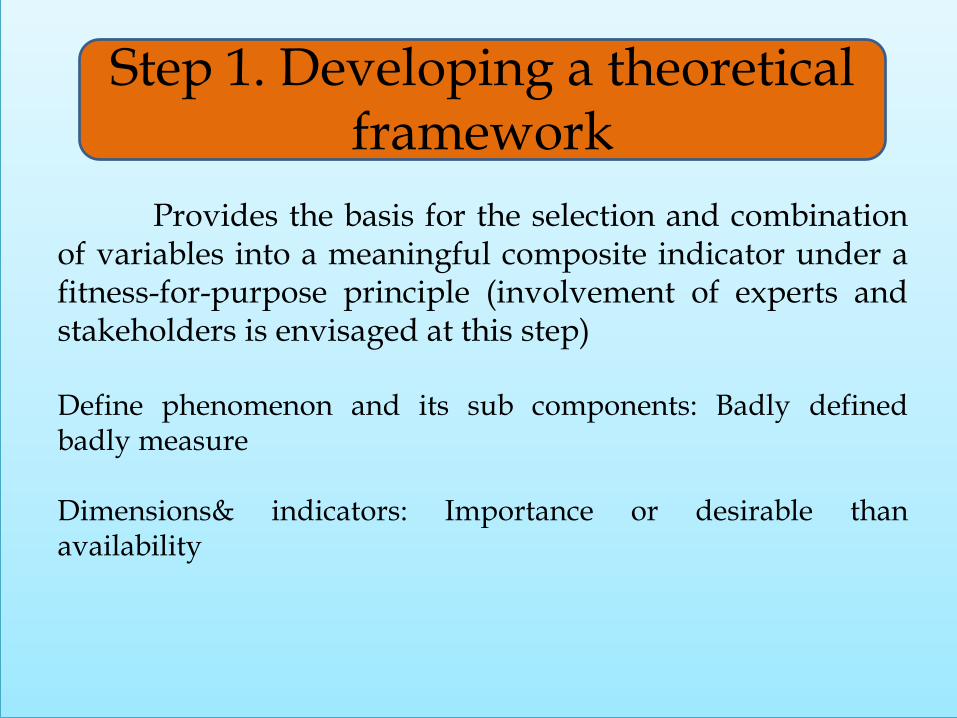
Step 1. Developing a theoretical framework
Provides the basis for the selection and combinationof variables into a meaningful composite indicator under afitness-for-purpose principle (involvement of experts andstakeholders is envisaged at this step)
Define phenomenon and its sub components: Badly definedbadly measure
Dimensions& indicators: Importance or desirable thanavailability
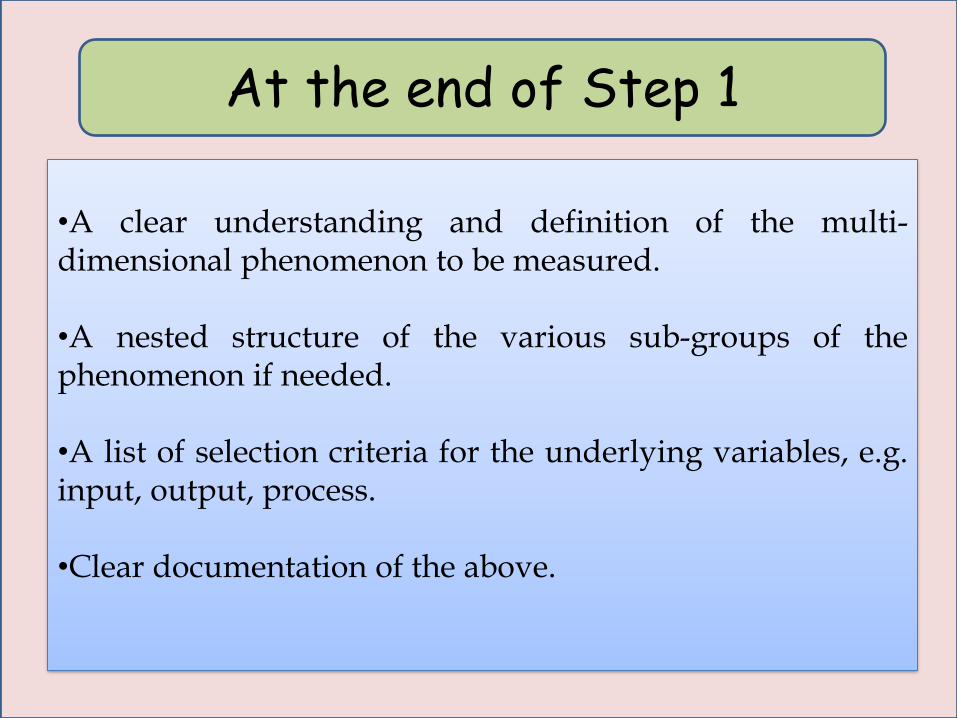
At the end of Step 1
•A clear understanding and definition of the multi-dimensional phenomenon to be measured.
•A nested structure of the various sub-groups of thephenomenon if needed.
•A list of selection criteria for the underlying variables, e.g.input, output, process.
•Clear documentation of the above.
Theoretical Frame work
Data Selection
Missing data
Normalization
Weightage & Aggregation
Uncertainty & Sensitivity
Back to real data
Links to other variables
Presentation & Visualization
Step 2
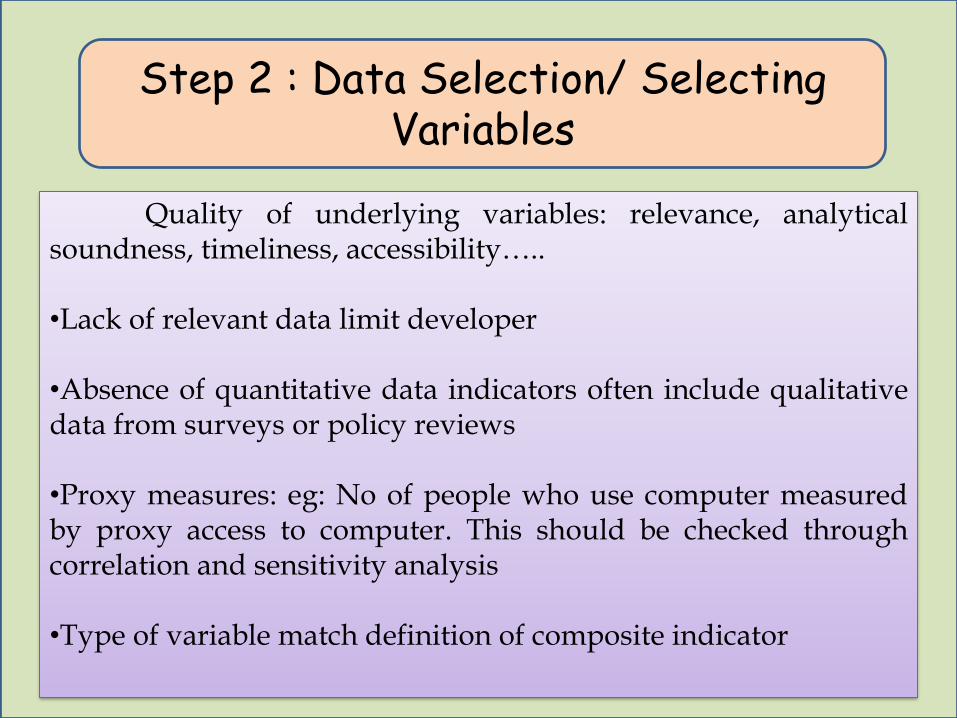
Step 2 : Data Selection/ Selecting Variables
Quality of underlying variables: relevance, analyticalsoundness, timeliness, accessibility…..
•Lack of relevant data limit developer
•Absence of quantitative data indicators often include qualitativedata from surveys or policy reviews
•Proxy measures: eg: No of people who use computer measuredby proxy access to computer. This should be checked throughcorrelation and sensitivity analysis
•Type of variable match definition of composite indicator
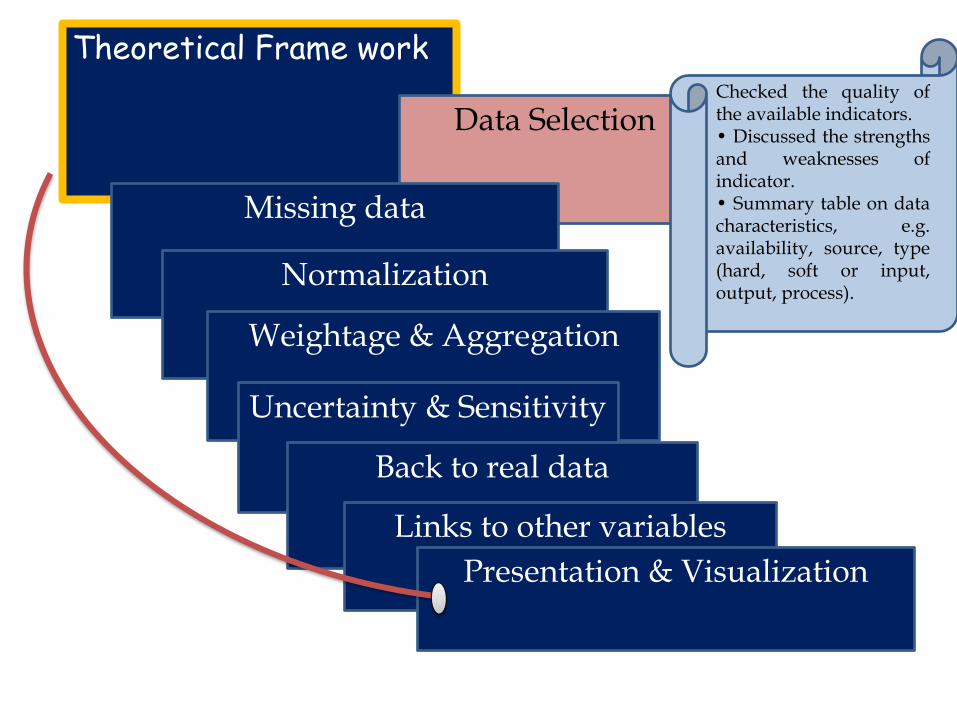
Theoretical Frame work
Data Selection
Missing data
Normalization
Weightage & Aggregation
Uncertainty & Sensitivity
Back to real data
Links to other variables
Presentation & Visualization
Checked the quality ofthe available indicators.• Discussed the strengthsand weaknesses ofindicator.• Summary table on datacharacteristics, e.g.availability, source, type(hard, soft or input,output, process).
Theoretical Frame work
Data Selection
Missing data
Normalization
Weightage & Aggregation
Uncertainty & Sensitivity
Back to real data
Links to other variables
Presentation & Visualization
Step 3
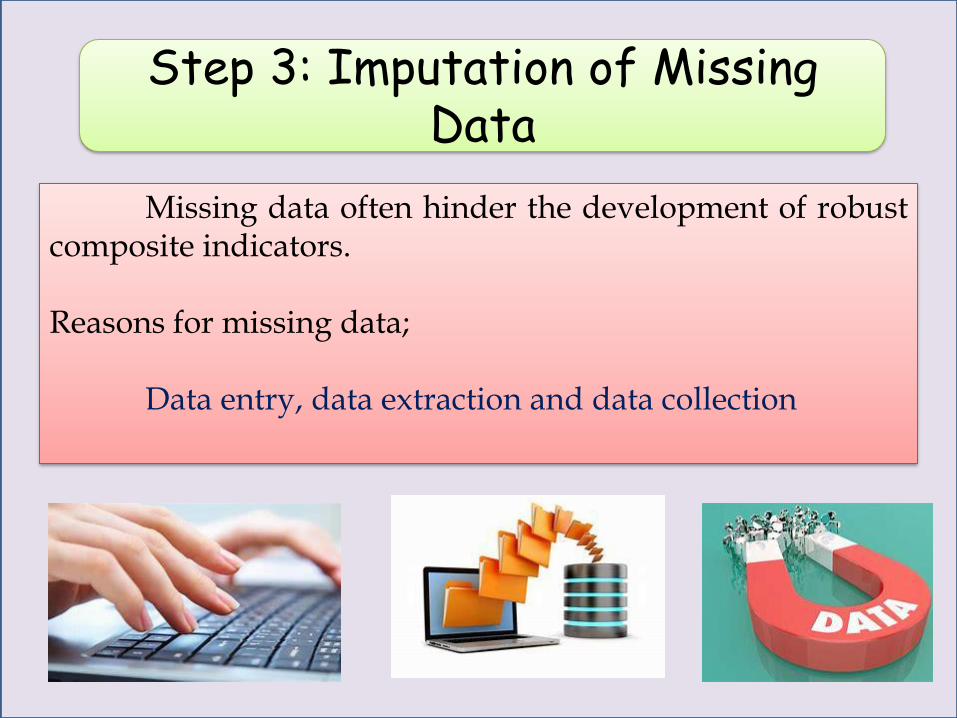
Step 3: Imputation of Missing Data
Missing data often hinder the development of robustcomposite indicators.
Reasons for missing data;
Data entry, data extraction and data collection
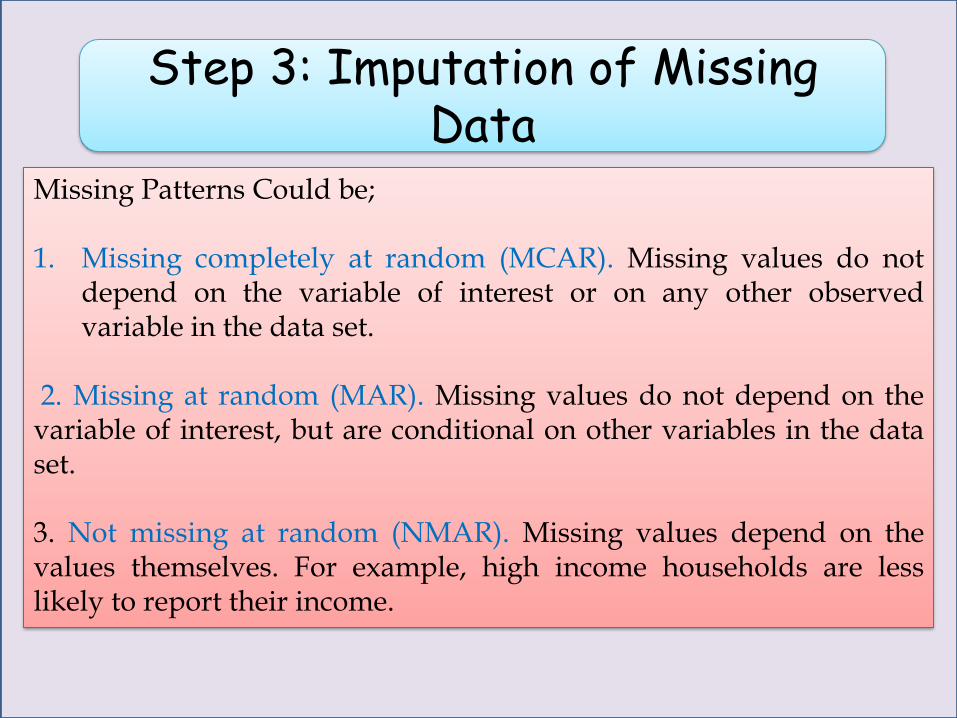
Step 3: Imputation of Missing Data
Missing Patterns Could be;
1. Missing completely at random (MCAR). Missing values do notdepend on the variable of interest or on any other observedvariable in the data set.
2. Missing at random (MAR). Missing values do not depend on thevariable of interest, but are conditional on other variables in the dataset.
3. Not missing at random (NMAR). Missing values depend on thevalues themselves. For example, high income households are lesslikely to report their income.
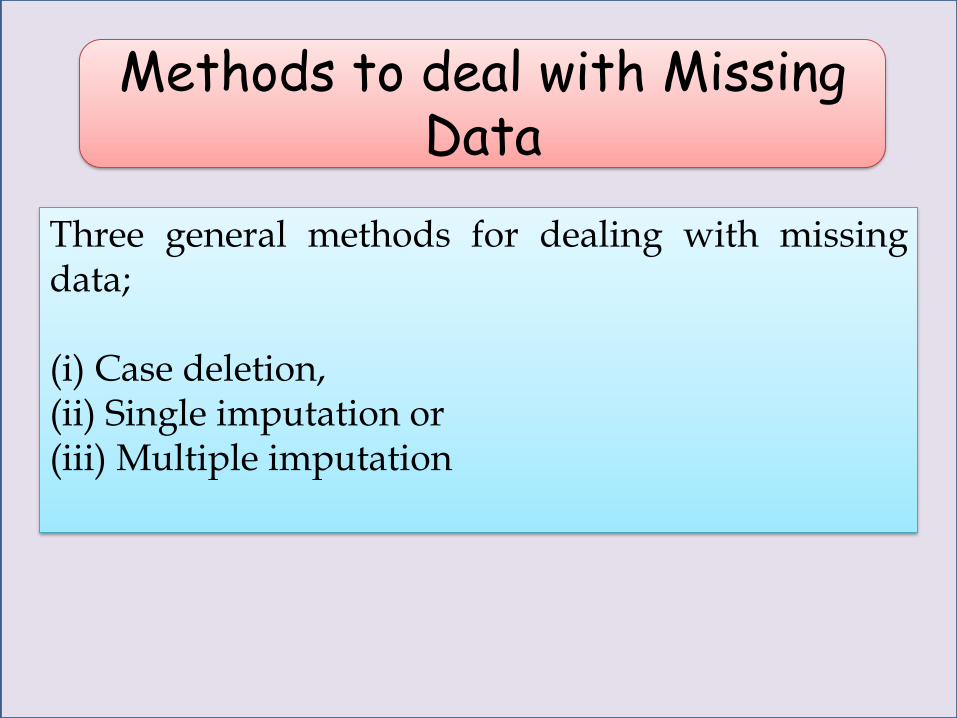
Methods to deal with Missing Data
Three general methods for dealing with missingdata;
(i) Case deletion,(ii) Single imputation or(iii) Multiple imputation
Theoretical Frame work
Data Selection
Missing data
Normalization
Weightage & Aggregation
Uncertainty & Sensitivity
Back to real data
Links to other variables
Presentation & Visualization
• A complete dataset without missingvalues.• Reliability ofimputed method• Discussed thepresence of outliersin the dataset• Documentedselected imputationprocedures and theresults
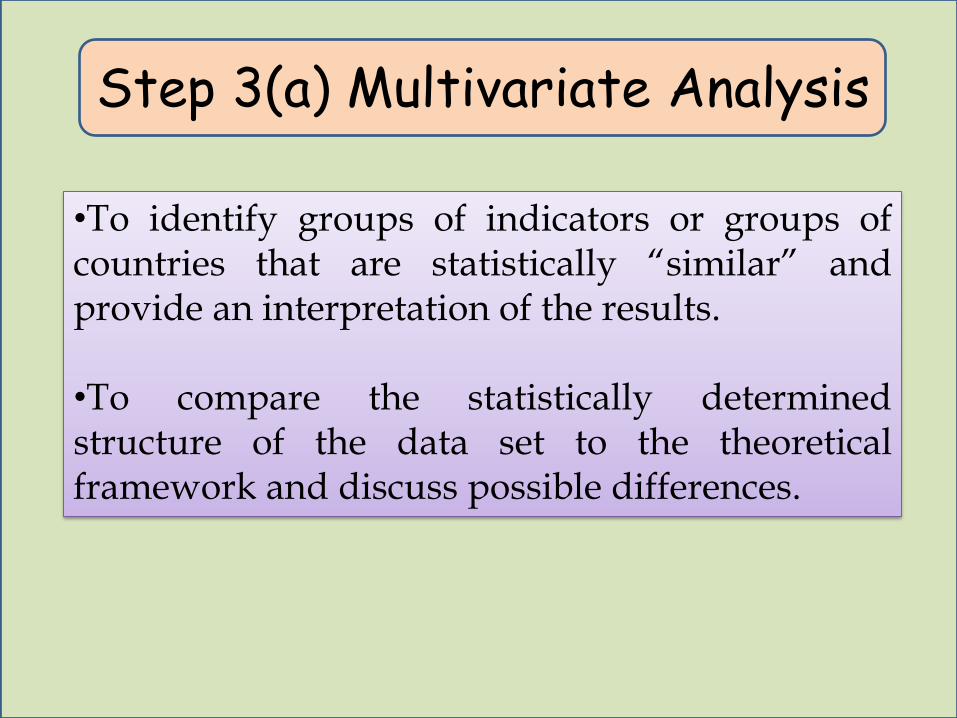
Step 3(a) Multivariate Analysis
•To identify groups of indicators or groups ofcountries that are statistically “similar” andprovide an interpretation of the results.
•To compare the statistically determinedstructure of the data set to the theoreticalframework and discuss possible differences.
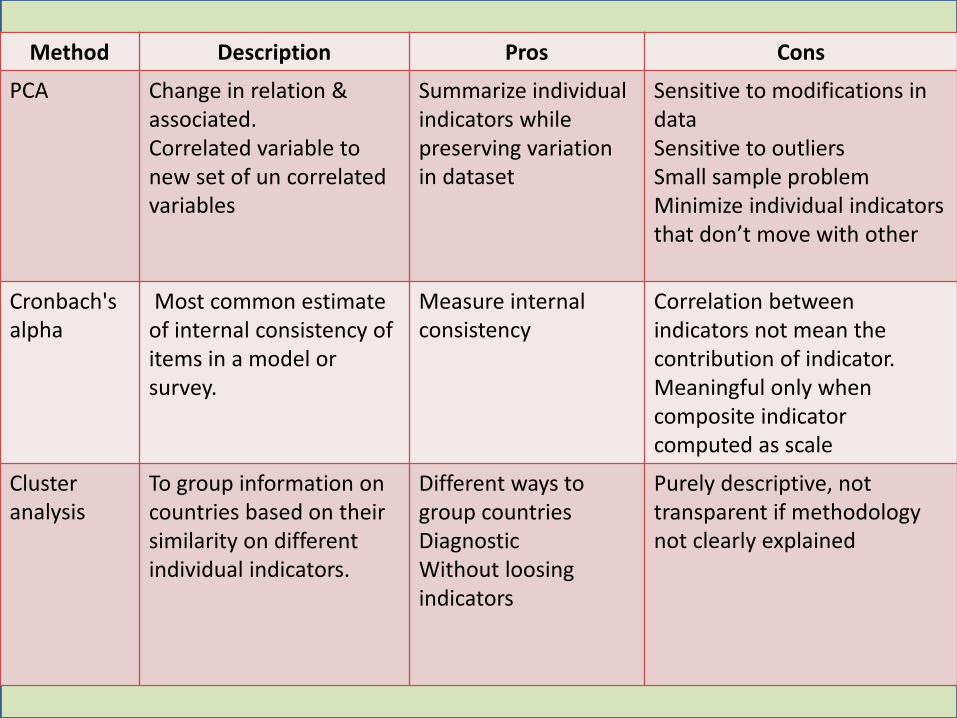
Method Description Pros Cons
PCA Change in relation & associated. Correlated variable to new set of un correlated variables
Summarize individual indicators while preserving variation in dataset
Sensitive to modifications in dataSensitive to outliersSmall sample problemMinimize individual indicators that don’t move with other
Cronbach's alpha
Most common estimate of internal consistency of items in a model or survey.
Measure internal consistency
Correlation between indicators not mean the contribution of indicator.Meaningful only when composite indicator computed as scale
Cluster analysis
To group information on countries based on their similarity on different individual indicators.
Different ways to group countriesDiagnosticWithout loosing indicators
Purely descriptive, not transparent if methodology not clearly explained
Theoretical Frame work
Data Selection
Missing data
Normalization
Weightage & Aggregation
Uncertainty & Sensitivity
Back to real data
Links to other variables
Presentation & Visualization
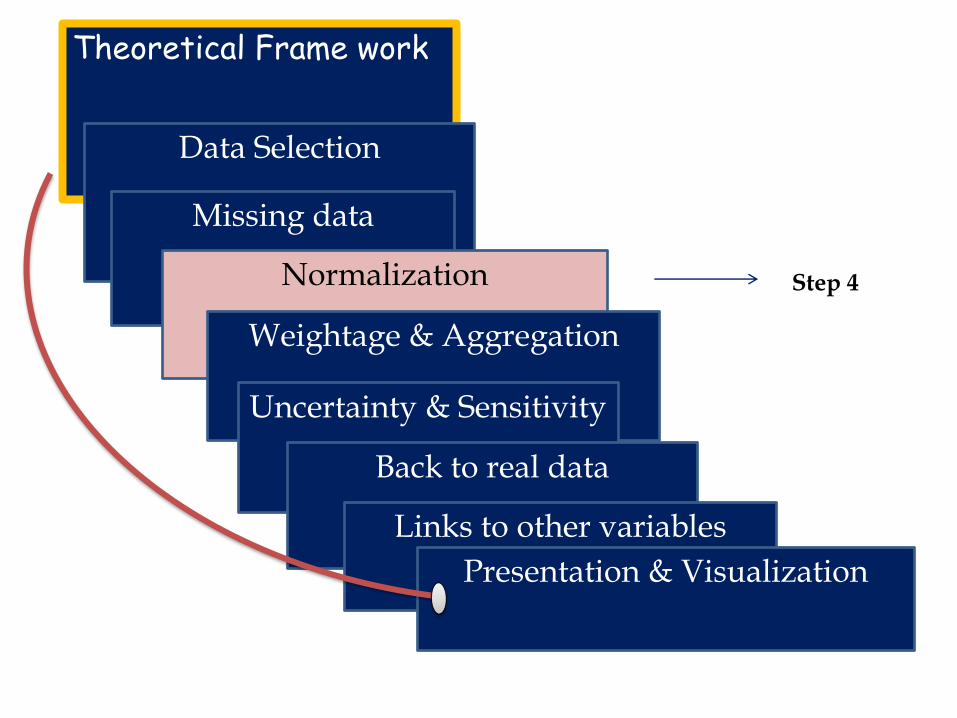
Step 4
Step 4:Normalization
Transforming indicators in order to bring commonscaling.
A number of normalisation methods exist but selection oftechnique depends on purpose, data properties, importanceof extreme values, variance in data etc..
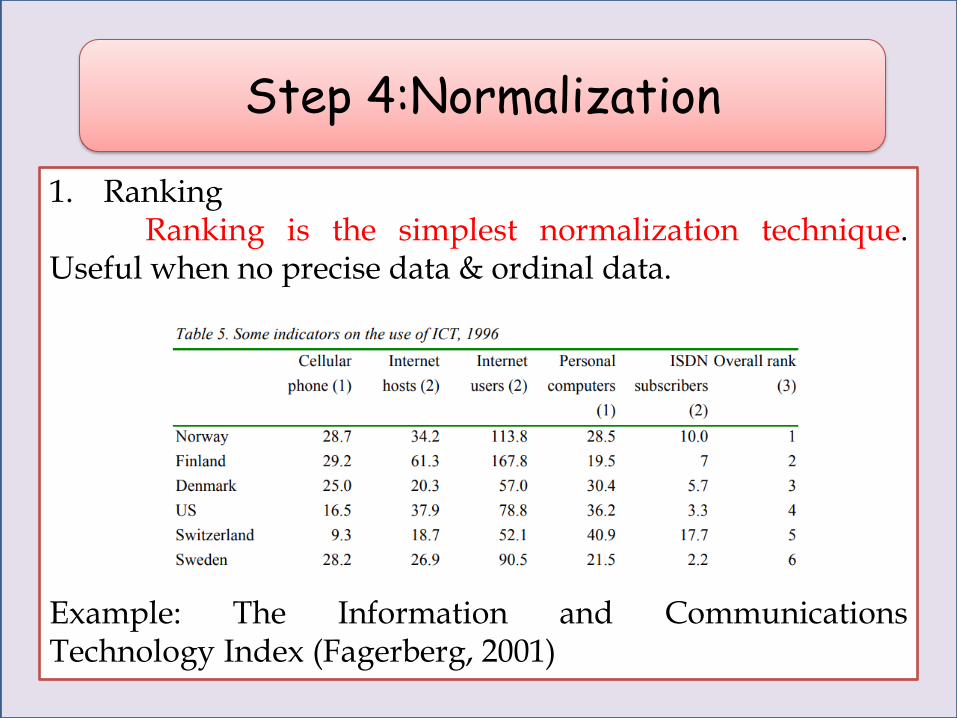
Step 4:Normalization
1. RankingRanking is the simplest normalization technique.
Useful when no precise data & ordinal data.
Example: The Information and CommunicationsTechnology Index (Fagerberg, 2001)
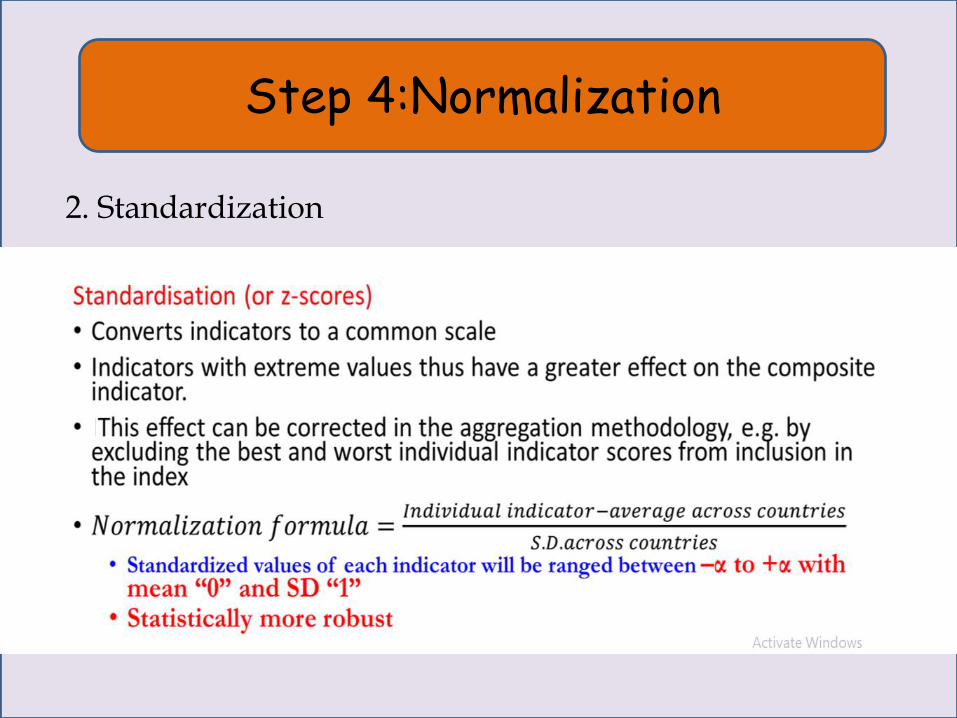
Step 4:Normalization
2. Standardization
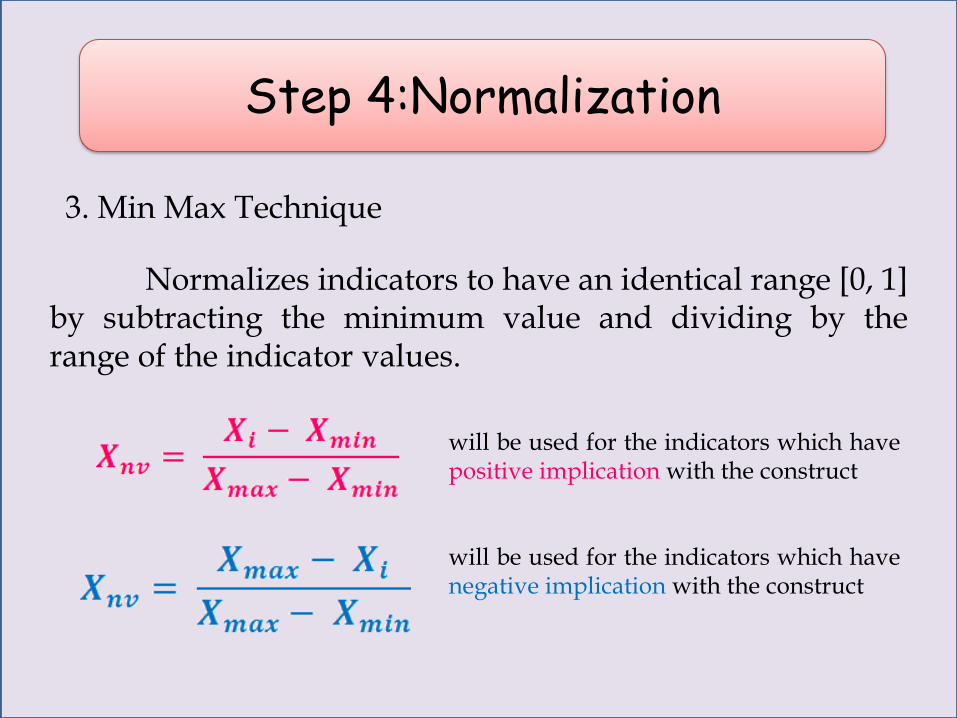
Step 4:Normalization
3. Min Max Technique
Normalizes indicators to have an identical range [0, 1]by subtracting the minimum value and dividing by therange of the indicator values.
will be used for the indicators which havepositive implication with the construct
will be used for the indicators which havenegative implication with the construct

Step 4:Normalization
4. Distance to a reference
Measures the relative position of a given indicatorwith a reference point.This could be a target to be reached in a given time frame.1. External benchmark2. Average of a group and assigned 1 hence above avg.performance above 13. Reference might be group leader and receives one,reference country might be unreliable outlier4. Instead of being centered on 1, it is centered on 0. In thesame way, the reference country can be the average country,the group leader, or an external benchmark.
Step 4:Normalization
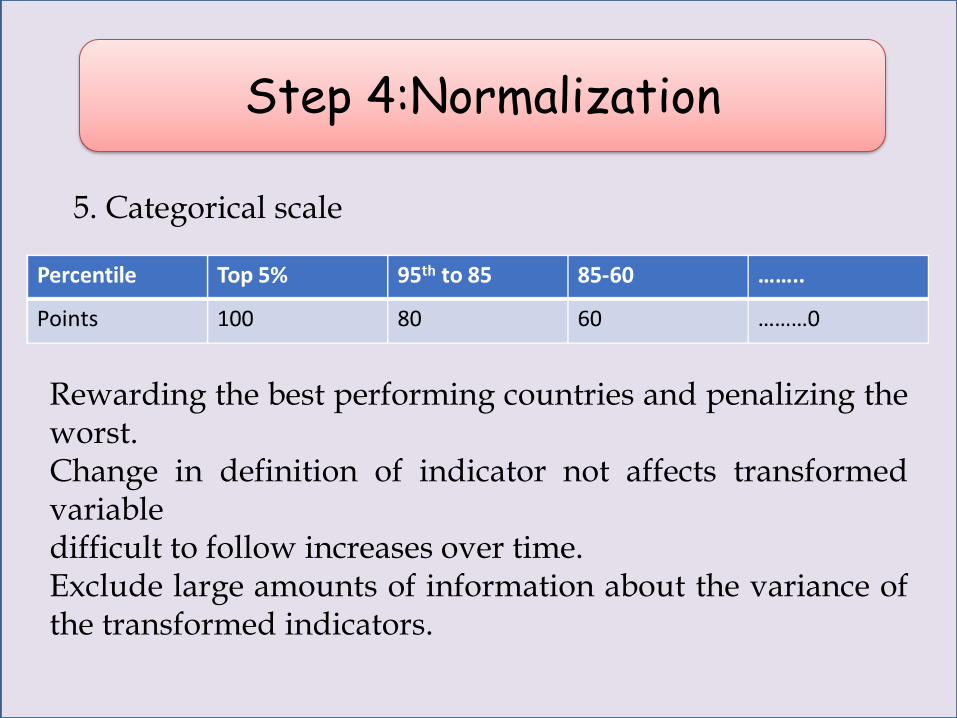
5. Categorical scale
Rewarding the best performing countries and penalizing theworst.Change in definition of indicator not affects transformedvariabledifficult to follow increases over time.Exclude large amounts of information about the variance ofthe transformed indicators.
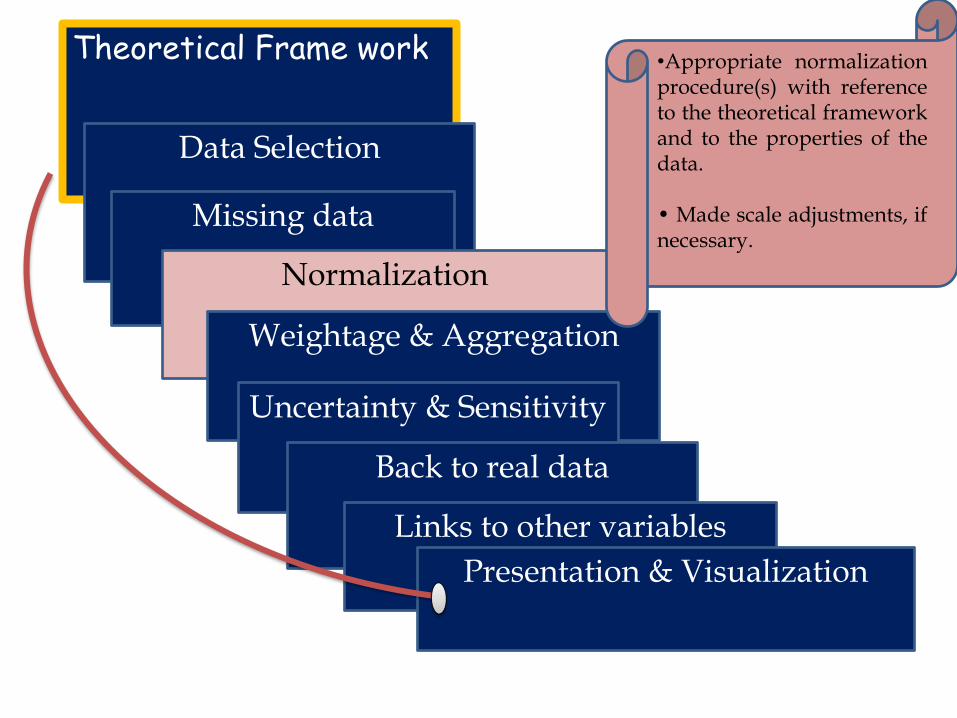
Theoretical Frame work
Data Selection
Missing data
Normalization
Weightage & Aggregation
Uncertainty & Sensitivity
Back to real data
Links to other variables
Presentation & Visualization
•Appropriate normalizationprocedure(s) with referenceto the theoretical frameworkand to the properties of thedata.
• Made scale adjustments, ifnecessary.
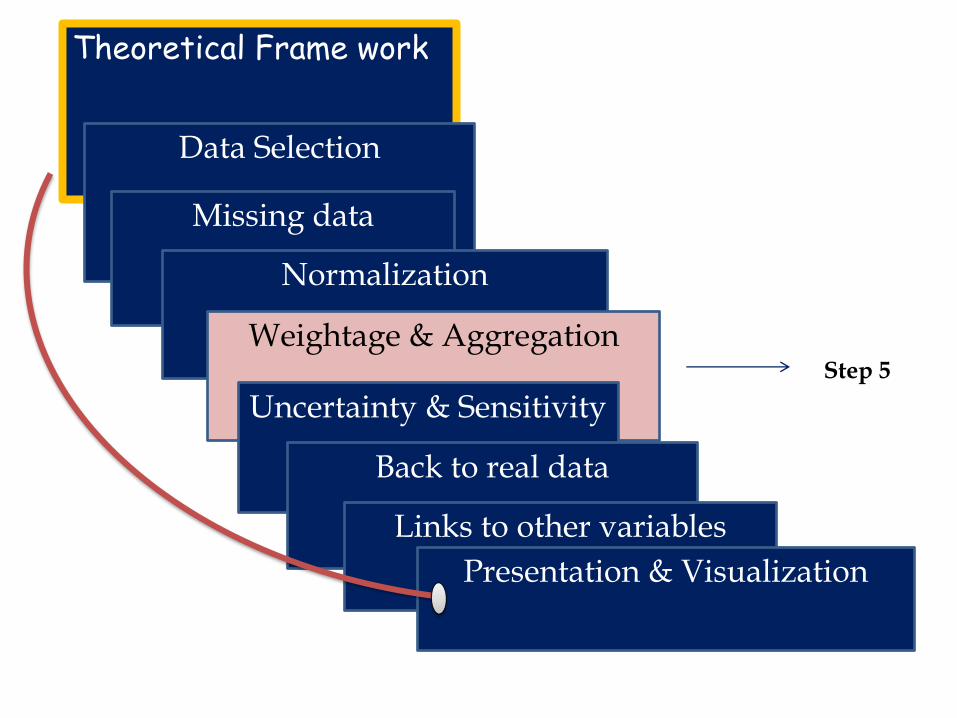
Theoretical Frame work
Data Selection
Missing data
Normalization
Weightage & Aggregation
Uncertainty & Sensitivity
Back to real data
Links to other variables
Presentation & Visualization
Step 5
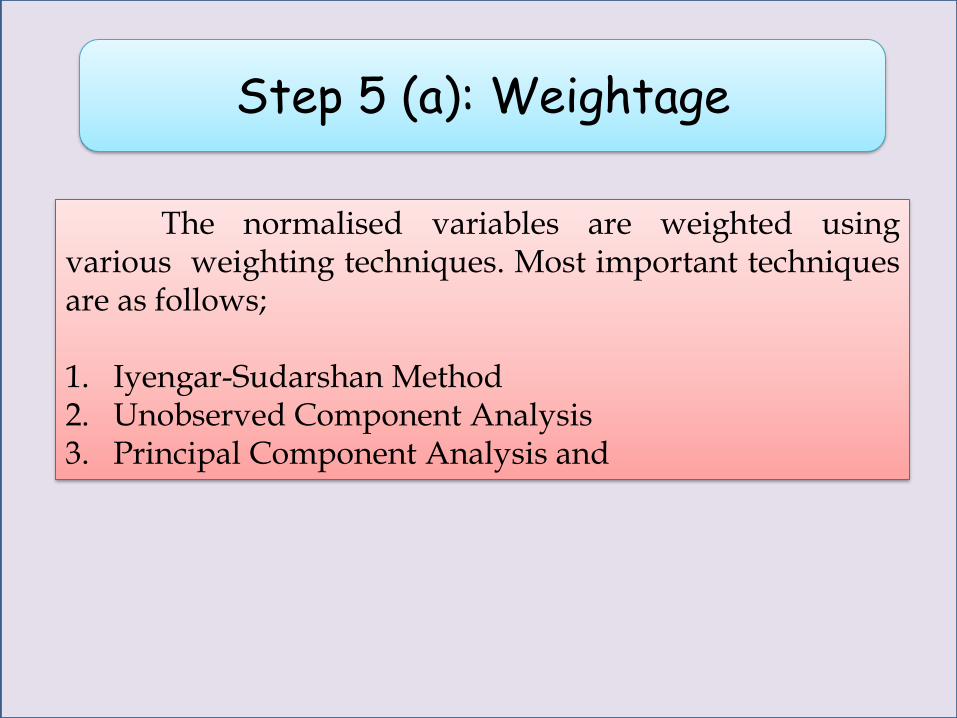
Step 5 (a): Weightage
The normalised variables are weighted usingvarious weighting techniques. Most important techniquesare as follows;
1. Iyengar-Sudarshan Method2. Unobserved Component Analysis3. Principal Component Analysis and
Step 5 (a): Weightage
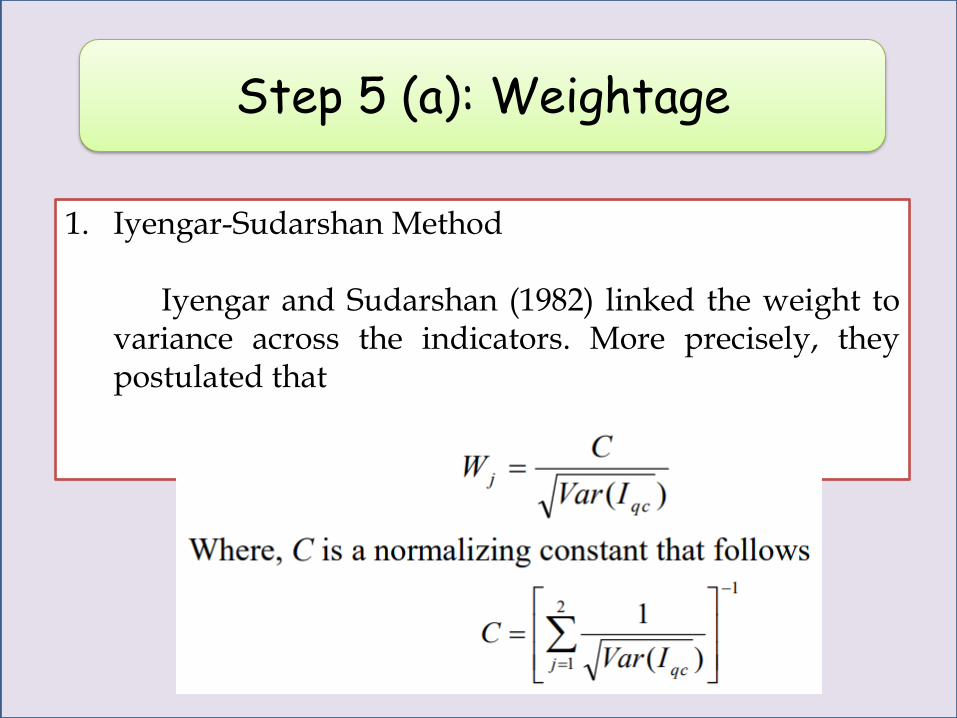
1. Iyengar-Sudarshan Method
Iyengar and Sudarshan (1982) linked the weight tovariance across the indicators. More precisely, theypostulated that
Step 5 (a): Weightage
1. Iyengar-Sudarshan Method
The choice of the weights in this manner wouldensure that large variation in any one of the indicatorswould not unduly dominate the contribution of the rest ofthe indicators and distort the overall ranking of thecountries (Iyengar and Sudarshan, 1982).
Step 5 (a): Weightage
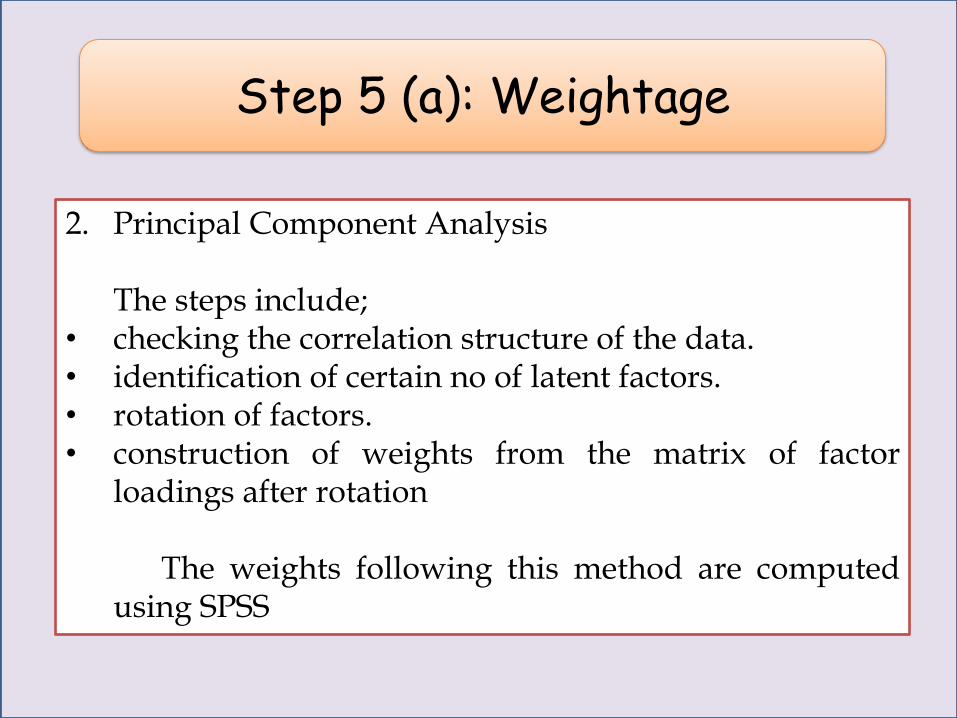
2. Principal Component Analysis
The steps include;• checking the correlation structure of the data.• identification of certain no of latent factors.• rotation of factors.• construction of weights from the matrix of factor
loadings after rotation
The weights following this method are computedusing SPSS
Step 5 (a): Weightage
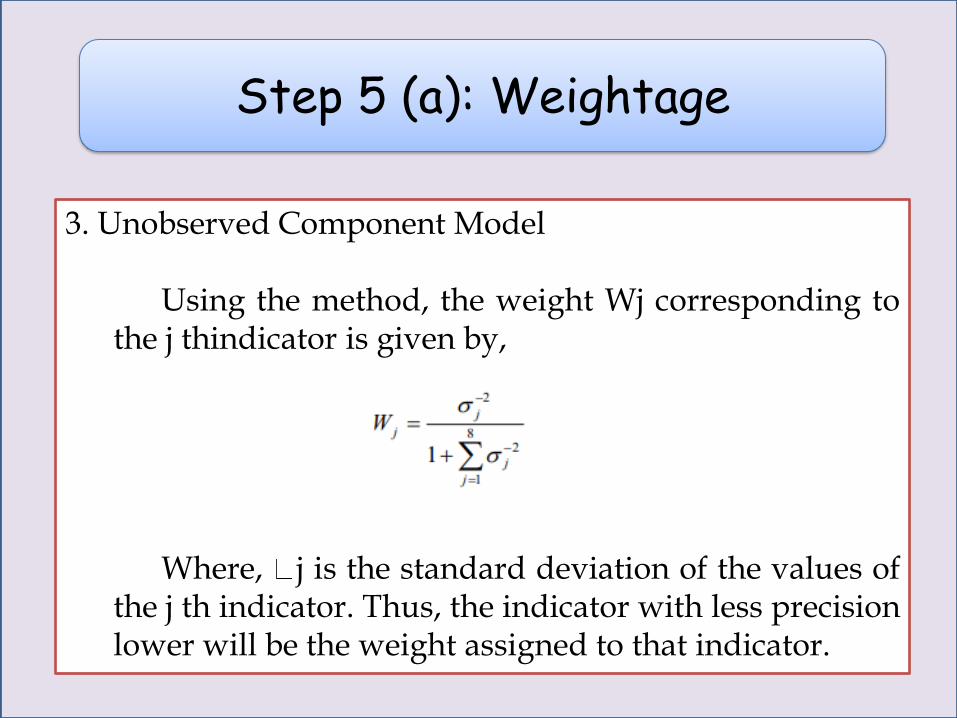
3. Unobserved Component Model
This method is applied if a set of sub-indicators areout to measure an unknown component. The weightobtained will be set to minimize the error in thecomposite index
This method resembles with regression analysis butthe main difference lies in the dependent variable,which is unknown and hence named as theUnobserved Component Model
Step 5 (a): Weightage
3. Unobserved Component Model
Using the method, the weight Wj corresponding tothe j thindicator is given by,
Where, j is the standard deviation of the values ofthe j th indicator. Thus, the indicator with less precisionlower will be the weight assigned to that indicator.
Step 5 (a): Weightage
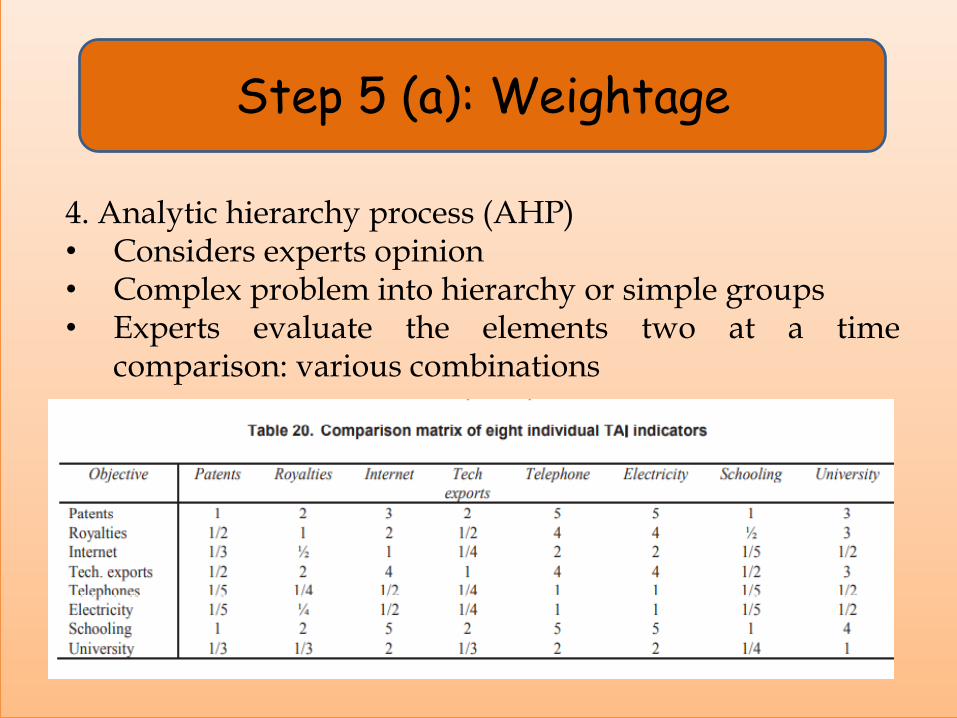
4. Analytic hierarchy process (AHP)• Considers experts opinion• Complex problem into hierarchy or simple groups• Experts evaluate the elements two at a time
comparison: various combinations
Step 5 (b): Aggregation
The Weighted indicators were aggregated to form acomposite index, The different methods of aggregationare ;
1. Linear aggregation2. Geometric aggregation and3. Weighted Displaced Ideal Method
Step 5 (b): Aggregation
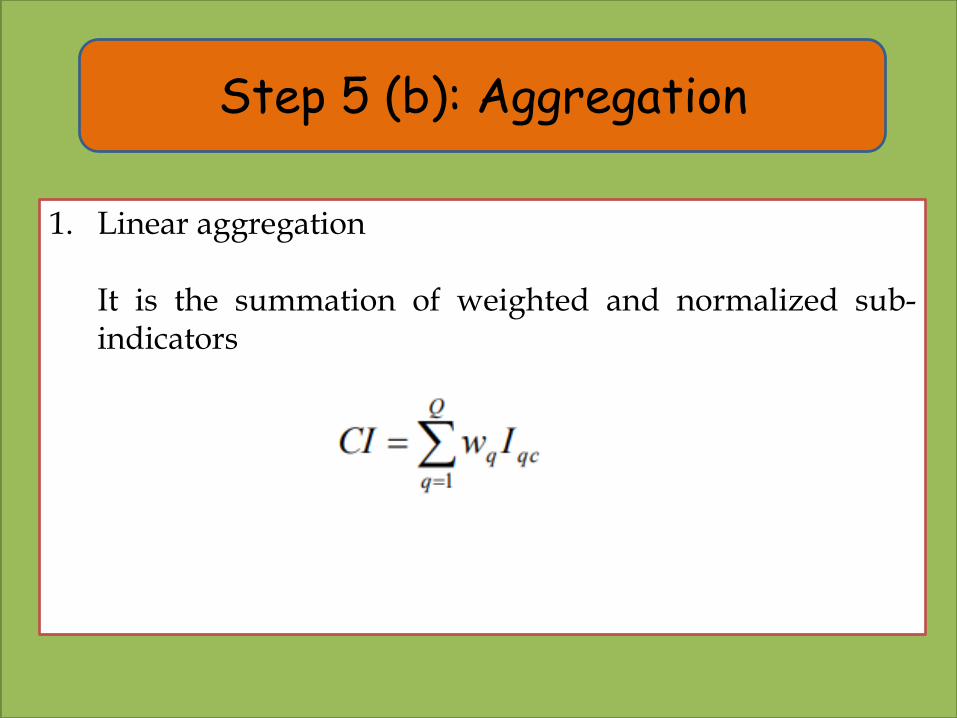
1. Linear aggregation
It is the summation of weighted and normalized sub-indicators
Step 5 (b): Aggregation
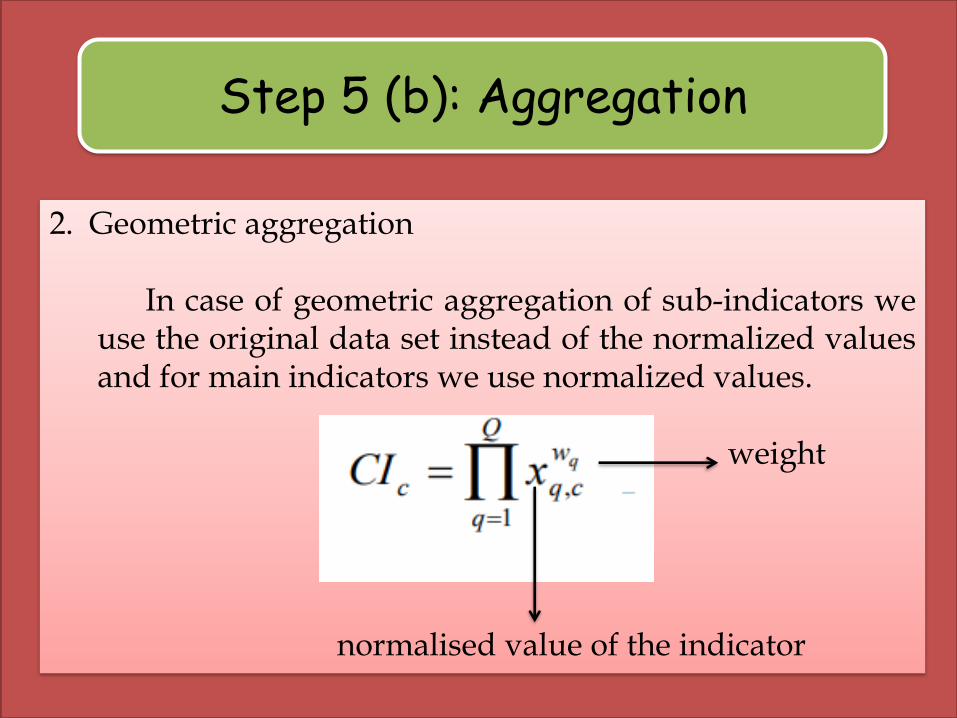
2. Geometric aggregation
In case of geometric aggregation of sub-indicators weuse the original data set instead of the normalized valuesand for main indicators we use normalized values.
weight
normalised value of the indicator
Step 5 (b): Aggregation
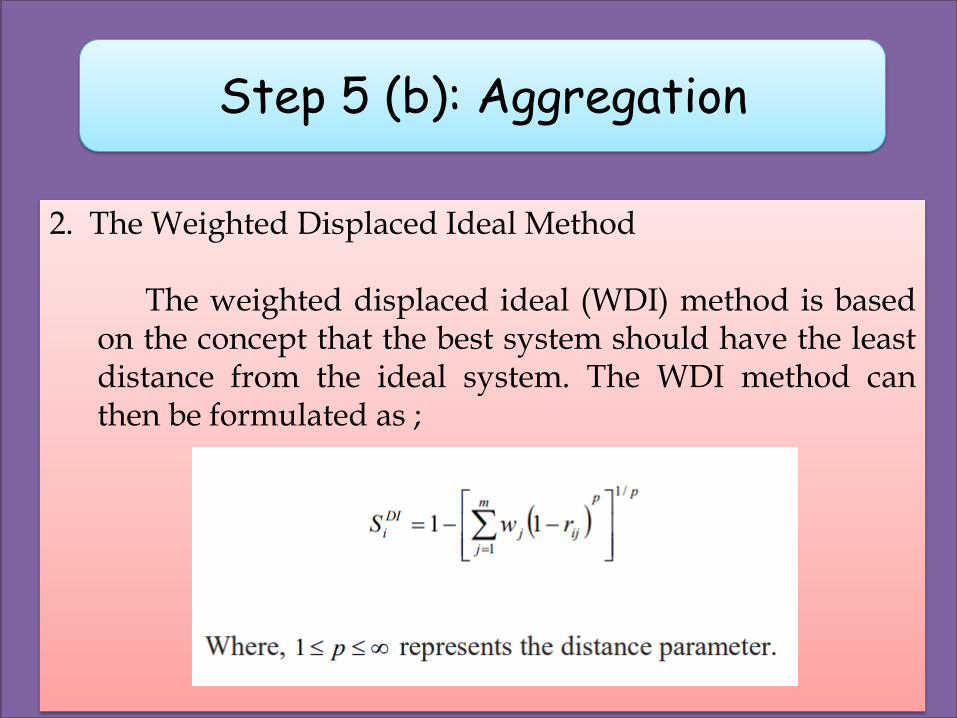
2. The Weighted Displaced Ideal Method
The weighted displaced ideal (WDI) method is basedon the concept that the best system should have the leastdistance from the ideal system. The WDI method canthen be formulated as ;
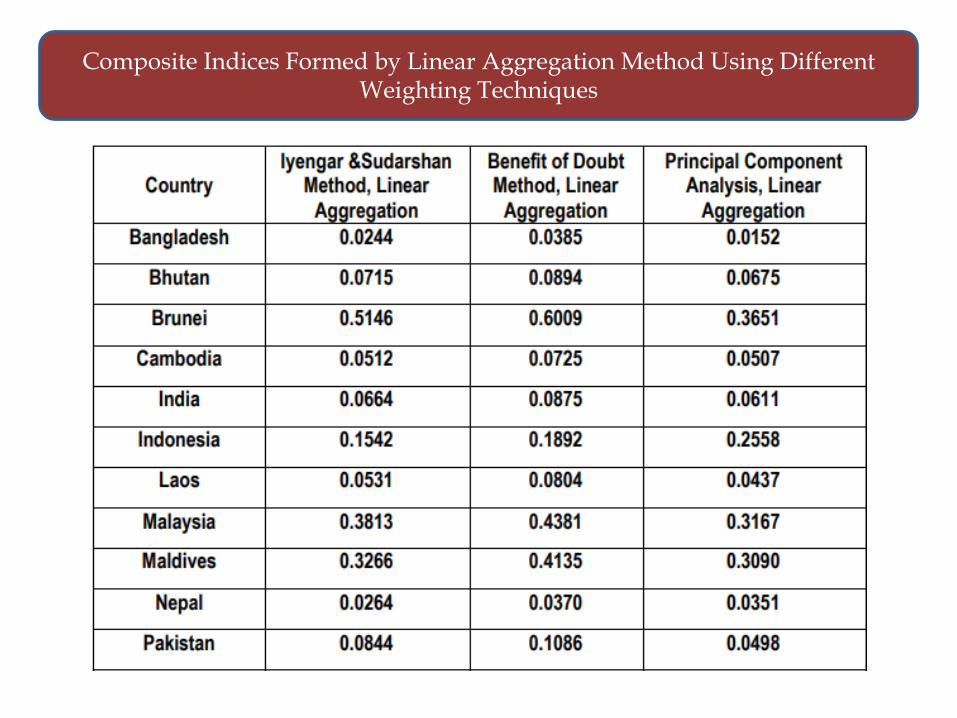
Composite Indices Formed by Linear Aggregation Method Using Different Weighting Techniques
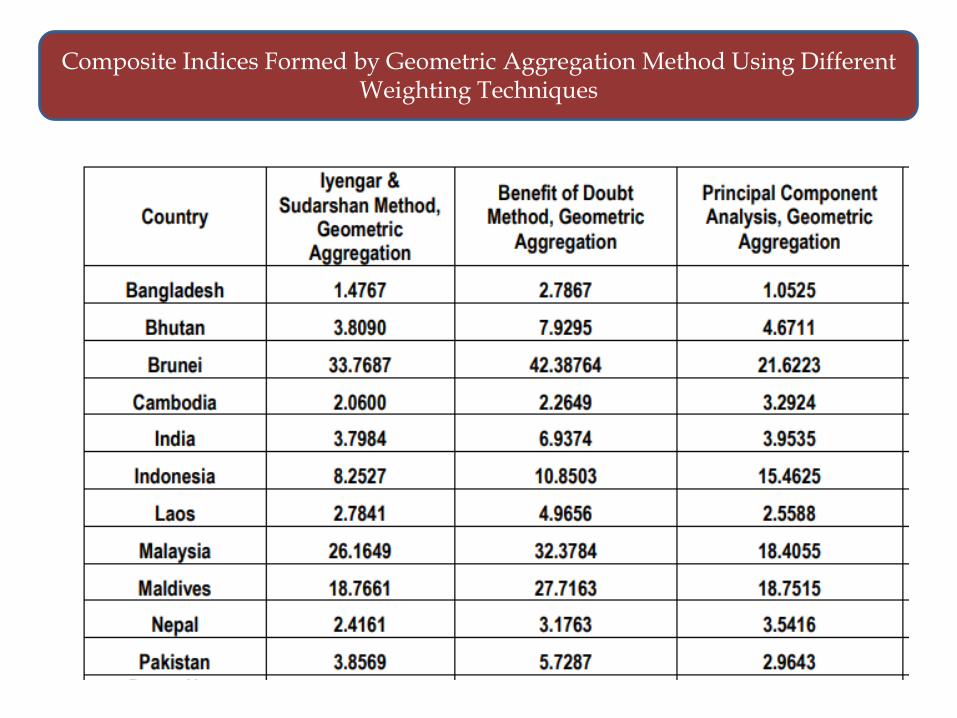
Composite Indices Formed by Geometric Aggregation Method Using Different Weighting Techniques
Theoretical Frame work
Data Selection
Missing data
Normalization
Weightage & Aggregation
Uncertainty & Sensitivity
Back to real data
Links to other variables
Presentation & Visualization
Step 6
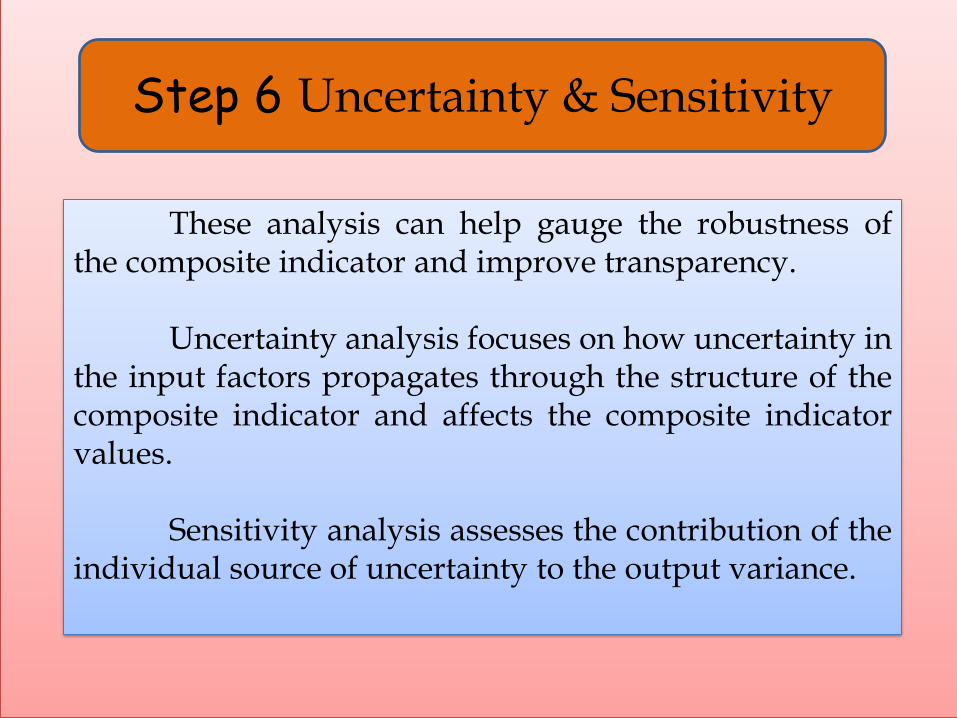
Step 6 Uncertainty & Sensitivity
These analysis can help gauge the robustness ofthe composite indicator and improve transparency.
Uncertainty analysis focuses on how uncertainty inthe input factors propagates through the structure of thecomposite indicator and affects the composite indicatorvalues.
Sensitivity analysis assesses the contribution of theindividual source of uncertainty to the output variance.
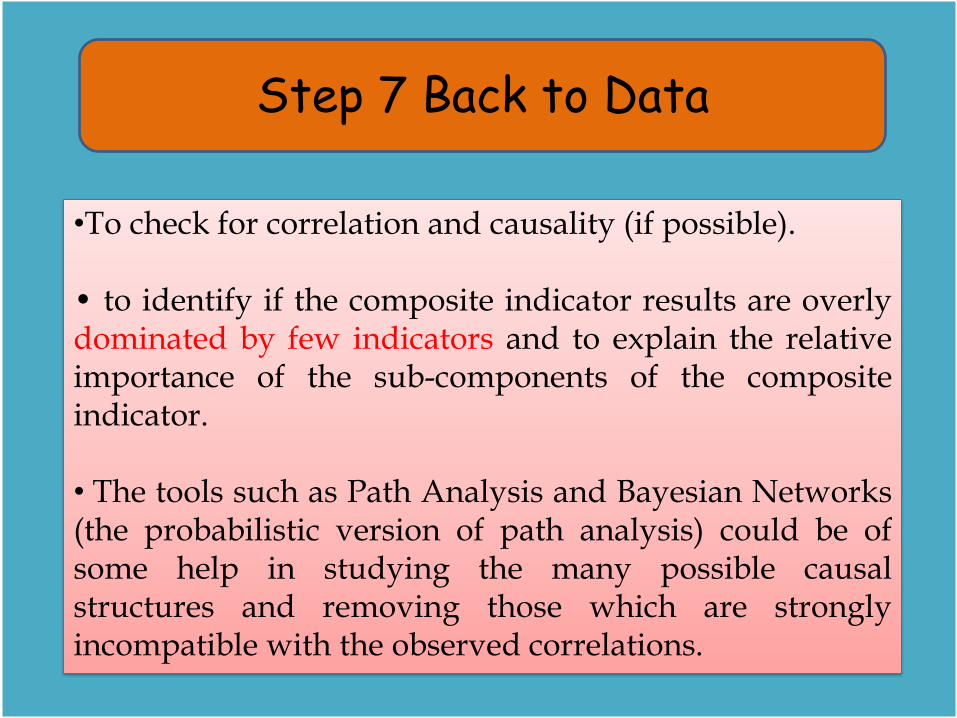
Step 7 Back to Data
•To check for correlation and causality (if possible).
• to identify if the composite indicator results are overlydominated by few indicators and to explain the relativeimportance of the sub-components of the compositeindicator.
• The tools such as Path Analysis and Bayesian Networks(the probabilistic version of path analysis) could be ofsome help in studying the many possible causalstructures and removing those which are stronglyincompatible with the observed correlations.

Quality Dimensions Of Composite Index
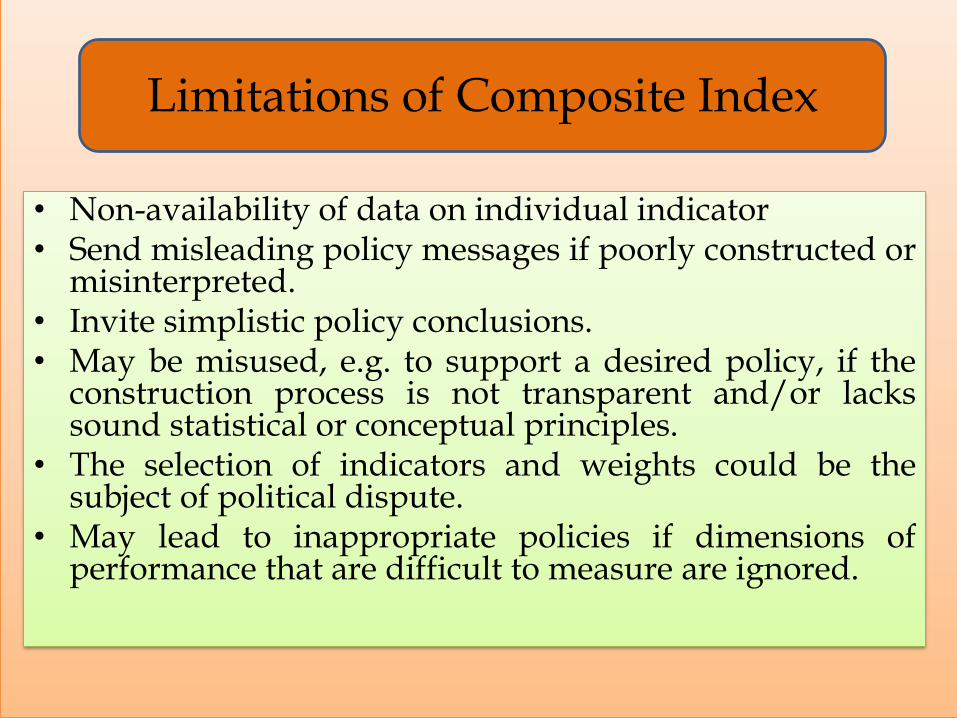
Limitations of Composite Index
• Non-availability of data on individual indicator• Send misleading policy messages if poorly constructed or
misinterpreted.• Invite simplistic policy conclusions.• May be misused, e.g. to support a desired policy, if the
construction process is not transparent and/or lackssound statistical or conceptual principles.
• The selection of indicators and weights could be thesubject of political dispute.
• May lead to inappropriate policies if dimensions ofperformance that are difficult to measure are ignored.
Research Studies
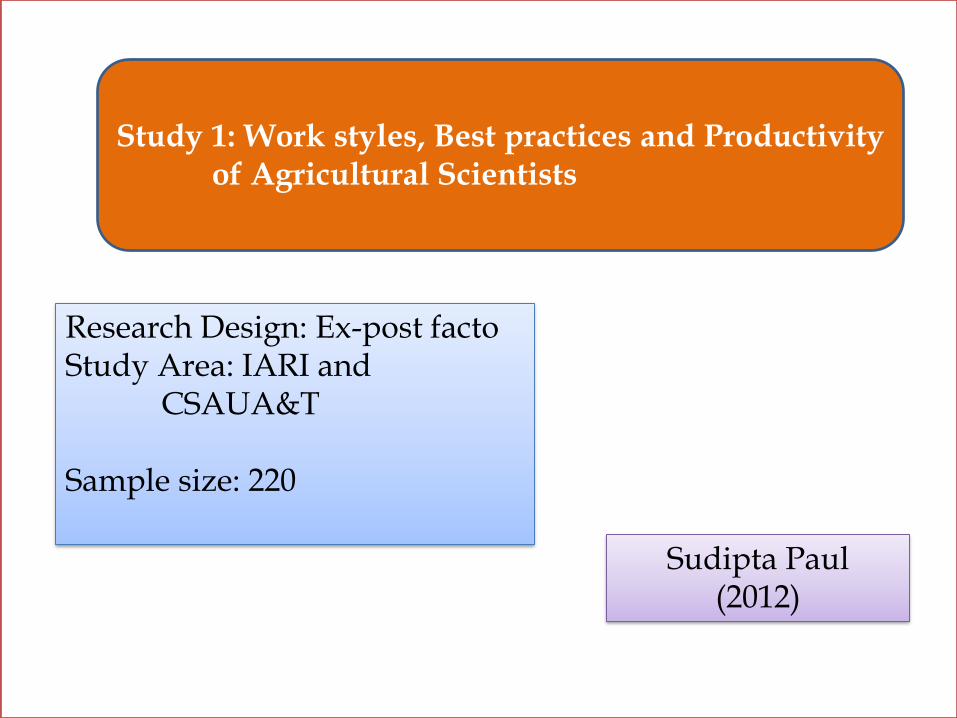
Study 1: Work styles, Best practices and Productivityof Agricultural Scientists
Sudipta Paul (2012)
Research Design: Ex-post factoStudy Area: IARI and
CSAUA&T
Sample size: 220
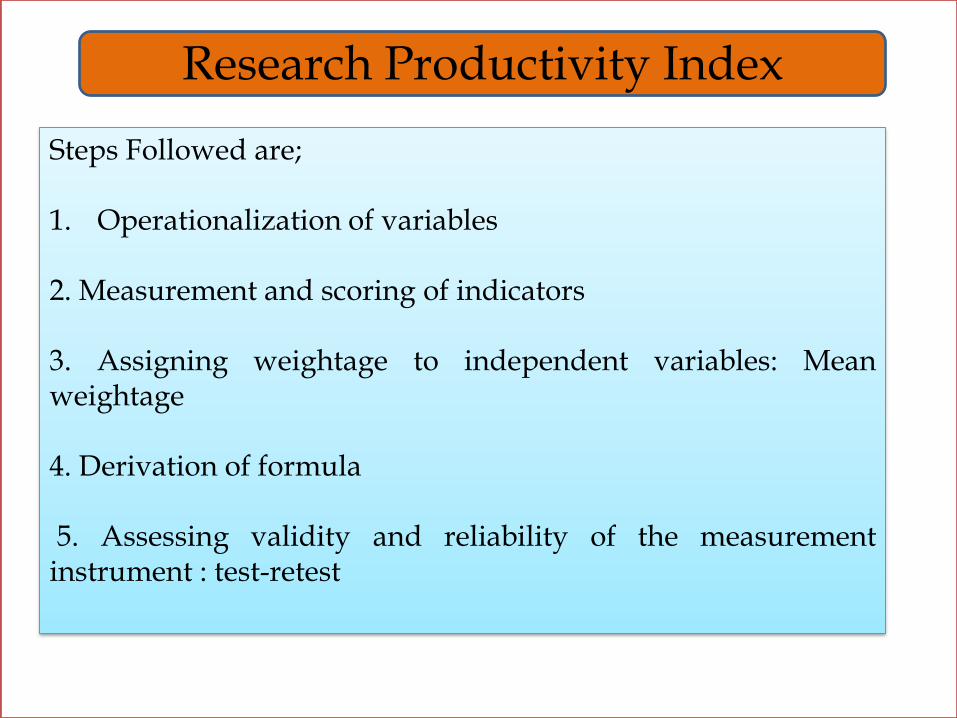
Research Productivity Index
Steps Followed are;
1. Operationalization of variables
2. Measurement and scoring of indicators
3. Assigning weightage to independent variables: Meanweightage
4. Derivation of formula
5. Assessing validity and reliability of the measurementinstrument : test-retest
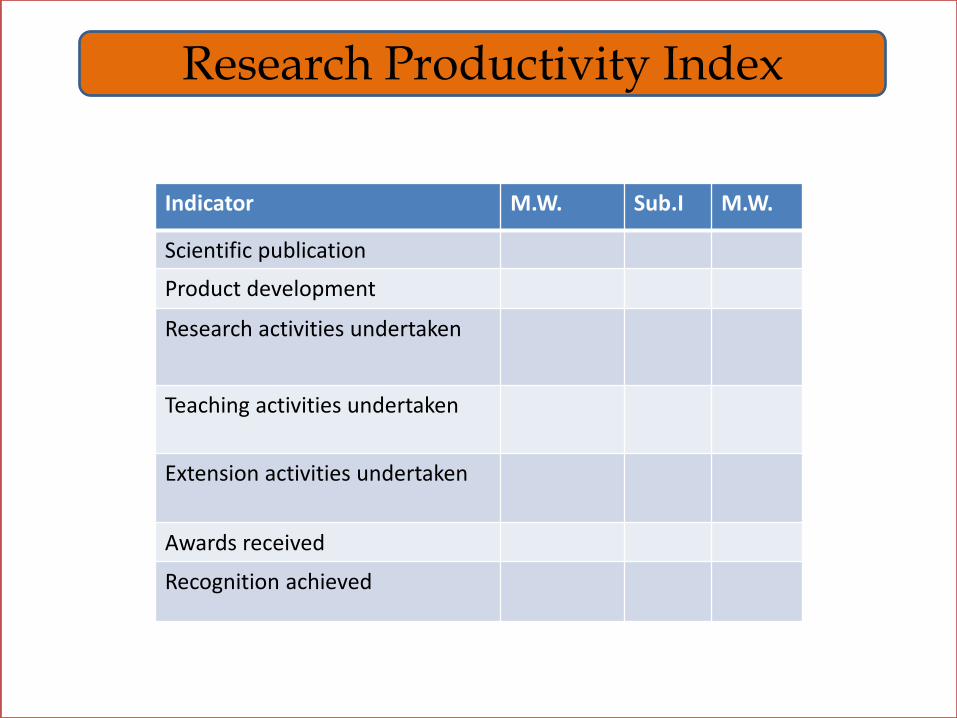
Research Productivity Index
Indicator M.W. Sub.I M.W.
Scientific publication
Product development
Research activities undertaken
Teaching activities undertaken
Extension activities undertaken
Awards received
Recognition achieved
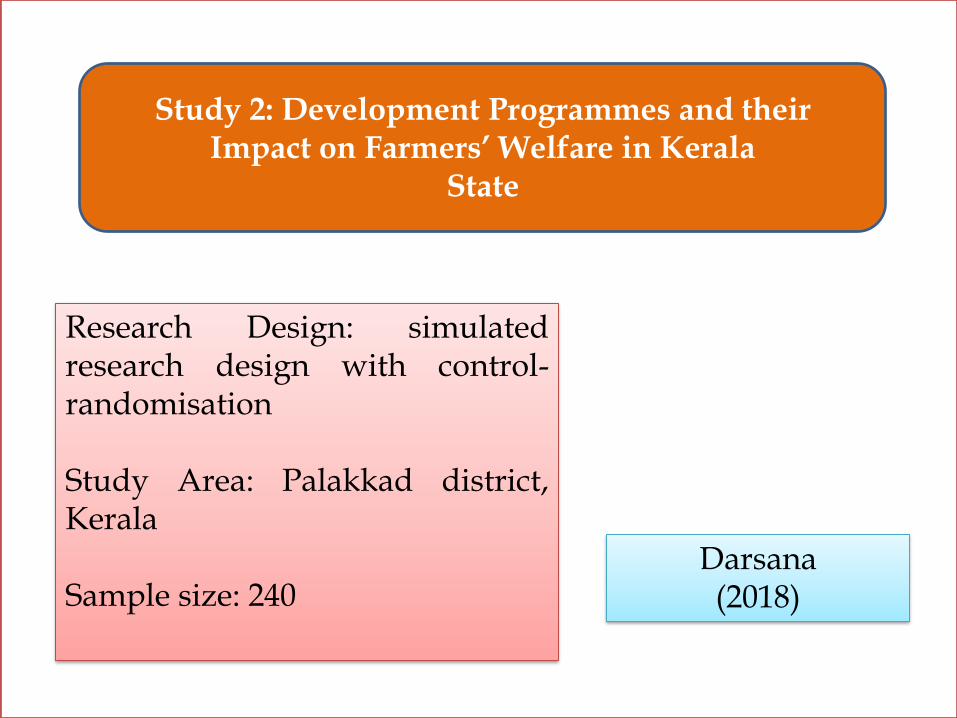
Study 2: Development Programmes and theirImpact on Farmers’ Welfare in Kerala
State
Darsana(2018)
Research Design: simulatedresearch design with control-randomisation
Study Area: Palakkad district,Kerala
Sample size: 240
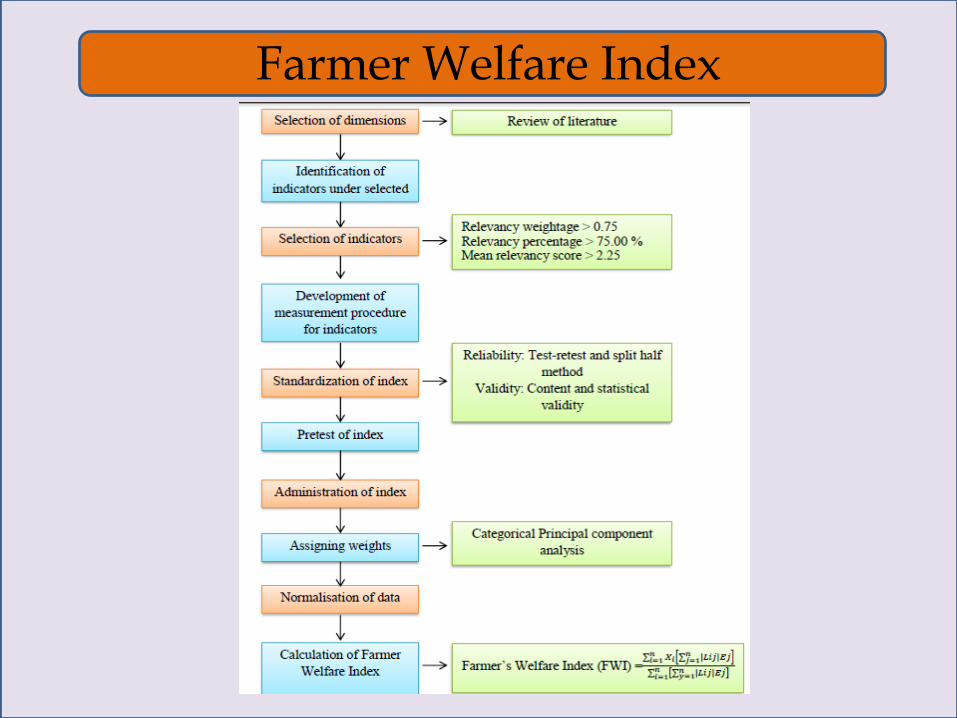
Farmer Welfare Index
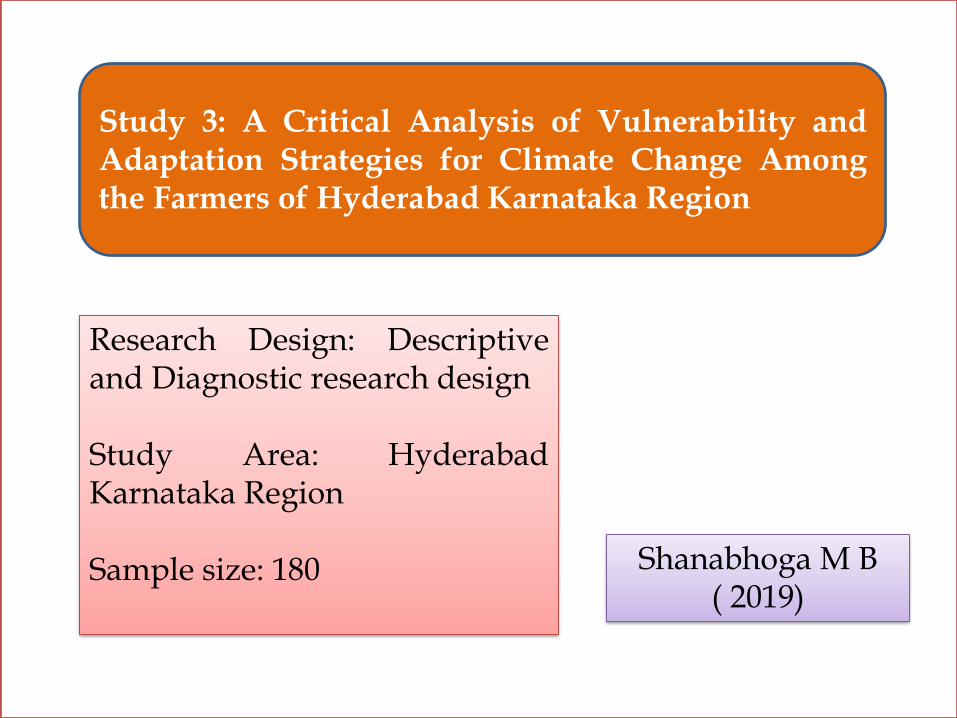
Study 3: A Critical Analysis of Vulnerability andAdaptation Strategies for Climate Change Amongthe Farmers of Hyderabad Karnataka Region
Shanabhoga M B ( 2019)
Research Design: Descriptiveand Diagnostic research design
Study Area: HyderabadKarnataka Region
Sample size: 180

Vulnerability to Climate Change Index
Steps Followed are;
1. Identification of dimensions2. Collection of indicators3. Relevancy weightage4. Computation of scale values: Centile5. Measurement procedures of indicators6. Reliability & validity7. Calculation
VI= (Exposure Index + Sensitivity Index)- Adaptive capacity
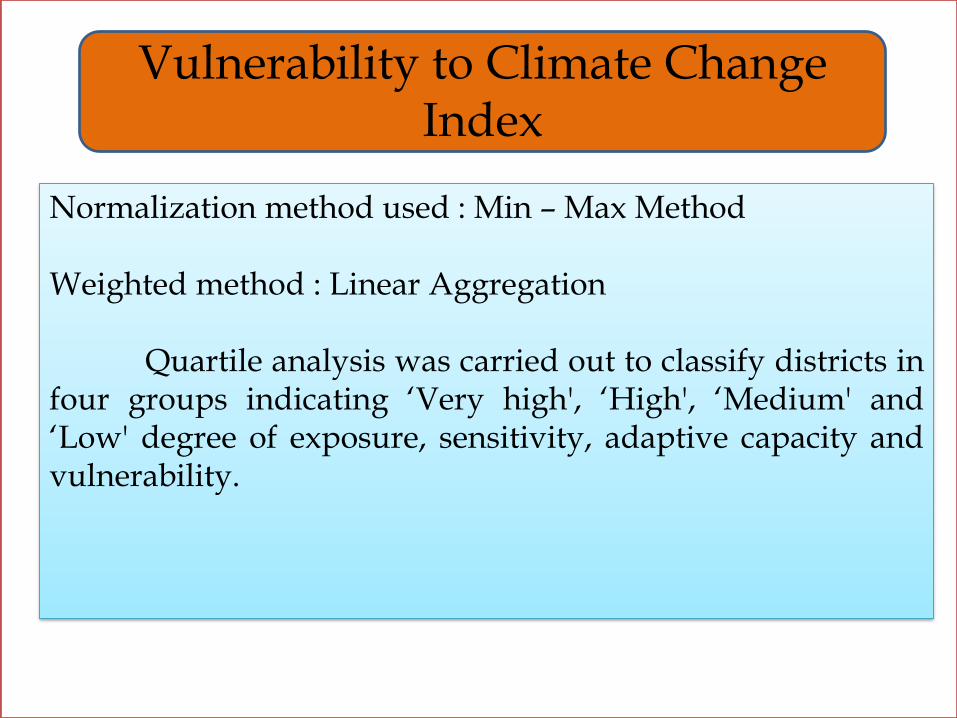
Vulnerability to Climate Change Index
Normalization method used : Min – Max Method
Weighted method : Linear Aggregation
Quartile analysis was carried out to classify districts infour groups indicating ‘Very high', ‘High', ‘Medium' and‘Low' degree of exposure, sensitivity, adaptive capacity andvulnerability.
Conclusion
Composite index serves as an handy tool in assessingthe overall performance of any selected dependent variableon which the particular index was constructed. Theirreplaceable contribution of composite index in policydecisions and simplicity in representation makes it front-runner in measurement of socio-economic development.However, the universal validity of index depends onobjective of the measurement, dimensions selected andtransparency of process

Discussion