Embed Size (px)
Citation preview

Construction Outlook: 2011-2015
Ed Sullivan, Chief Economist PCA
Independent Equipment Dealers Association February 2011
Named Most Accurate Forecaster By Chicago Federal Reserve, 2009

Real Construction Spending Billion Real $1996
1998
1999
2000
2001
2002
2003
2004
2005
2006
2007
2008
2009
2010
2011
2012
2013
2014
2015
450
500
550
600
650
700
750
800 Chart Title
-44%

Cement Capacity Utilization Percent Capacity Utilized
2002 2003 2004 2005 2006 2007 2008 2009 2010 2011 2012 2013 2014 20150%
20%
40%
60%
80%
100%
Excess Capacity, Depressed Earnings

Economic Outlook

Sub-Prime/Exotics
Lending Standards
Energy
Labor Markets
2006 20082007 2009 2010
State Deficits
Economic Adversity Abates 2011/12
The abatement of the conditions that put us in
recession…are receding…but remain in
place.
2011

Synchronized Recovery Theory
Incremental Demand Gains
Job Gains
Sentiment Gains
Lending Standards Ease &
Hiring Accelerates
Heals Structural Restraints
In the context of moderating productivity
Gains Leads to:
Sentiment includes
Consumer, Business &
Banks:
Defaults & perceived
lending risks decline
Job creation determines how
quickly the recovery cycle spins.

Commercial Risk PremiumsSpread between Treasury and BAA
Jan 2006
Feb 2006
Mar 2006
Apr 2006
May 2006
Jun 2006
Jul 2006
Aug 2006
Sep 2006
Oct 2006
Nov 2006
Dec 2006
Jan 2007
Feb 2007
Mar 2007
Apr 2007
May 2007
Jun 2007
Jul 2007
Aug 2007
Sep 2007
Oct 2007
Nov 2007
Dec 2007
Jan 2008
Feb 2008
Mar 2008
Apr 2008
May 2008
Jun 2008
Jul 2008
Aug 2008
Sep 2008
Oct 2008
Nov 2008
Dec 2008
Jan 2009
Feb 2009
Mar 2009
Apr 2009
May 2009
Jun 2009
Jul 2009
Aug 2009
Sep 2009
Oct 2009
Nov 2009
Dec 2009
Jan 2010
Feb 2010
Mar 2010
Apr 2010
May 2010
Jun 2010
Jul 2010
Aug 2010
Sep 2010
0
1
2
3
4
5
6
7
8
9
Source: Federal Reserve, PCA Projections 4.91 4.51 3.25
20112010 2012
Projected
Corporate Risk Premiums Serve as
a Proxy for Bank Lending Attitudes
Toward Risk

Consumer Sentiment Risks
Jan 2004
Feb 2004
Mar 2004
Apr 2004
May 2004
Jun 2004
Jul 2004
Aug 2004
Sep 2004
Oct 2004
Nov 2004
Dec 2004
Jan 2005
Feb 2005
Mar 2005
Apr 2005
May 2005
Jun 2005
Jul 2005
Aug 2005
Sep 2005
Oct 2005
Nov 2005
Dec 2005
Jan 2006
Feb 2006
Mar 2006
Apr 2006
May 2006
Jun 2006
Jul 2006
Aug 2006
Sep 2006
Oct 2006
Nov 2006
Dec 2006
Jan 2007
Feb 2007
Mar 2007
Apr 2007
May 2007
Jun 2007
Jul 2007
Aug 2007
Sep 2007
Oct 2007
Nov 2007
Dec 2007
Jan 2008
Feb 2008
Mar 2008
Apr 2008
May 2008
Jun 2008
Jul 2008
Aug 2008
Sep 2008
Oct 2008
Nov 2008
Dec 2008
Jan 2009
Feb 2009
Mar 2009
Apr 2009
May 2009
Jun 2009
Jul 2009
Aug 2009
Sep 2009
Oct 2009
Nov 2009
Dec 2009
Jan 2010
Feb 2010
Mar 2010
Apr 2010
May 2010
Jun 2010
Jul 2010
Aug 2010
Sep 2010
0
20
40
60
80
100
120
Source: Conference Board, PCA Projections
20112010 2012
Projected

Synchronized Theory: Problem = Policy Support
Traditional Monetary Policy’s effectiveness is limited. Interest rates already low
“Liquidity Trap”
Federal Reserve Concerned. Didn’t Act Traditionally.
Quantitative Easing, or, QE2 is Born. Similar to open market operations….but…
Potentially broader asset classes (harder to control money
supply growth).
Blurred “easy landing” guideposts. Under shoot = Risk Double Dip
Over shoot = Risk powerful inflationary pressures

Housing Recovery

Housing Starts: Recovery Muted Thousand Starts
1999
2000
2001
2002
2003
2004
2005
2006
2007
2008
2009
2010
2011
2012
2013
2014
2015
0
500
1,000
1,500
2,000
2,500

Ingredients for a Starts Recovery
Inventory no higher than 5
months supplyPrice stability
Carry costs erode expected ROI.
Weaker the price environment…lowers the months’ supply
trigger point.
Homebuilders Expected ROI

Foreclosures Accelerate
Foreclosure Impacts
Add to Inventory
Depress Prices
3.4 Foreclosures in 2010.
1.2 Mil Bank possessions.
Equates to one out of every 4 homes on the
market.
Depressed Homebuilder
ROI
Adds supply.
Bank owned properties discounted.
Pressures new home prices.
Longer carry costs.
Lower revenues.
Erodes expected ROI.
Delays recovery in starts.

Residential: Re-Set Scenario$ Billion
2007 2008 2009 2010 2011 2012 2013 20140
5
10
15
20
25
30
35
40
Subprime Resets
Alt-A
Option Adjusta
ble

Residential: Bank Possession ProjectionsMillion Homes
2007 2008 2009 2010 2011 2012 2013 20140.0
0.2
0.4
0.6
0.8
1.0
1.2
1.4

Months’ Supply: Single FamilyNumber of months required to burn off existing inventory at current selling rates
Jan 2006
Feb 2006
Mar 2006
Apr 2006
May 2006
Jun 2006
Jul 2006
Aug 2006
Sep 2006
Oct 2006
Nov 2006
Dec 2006
Jan 2007
Feb 2007
Mar 2007
Apr 2007
May 2007
Jun 2007
Jul 2007
Aug 2007
Sep 2007
Oct 2007
Nov 2007
Dec 2007
Jan 2008
Feb 2008
Mar 2008
Apr 2008
May 2008
Jun 2008
Jul 2008
Aug 2008
Sep 2008
Oct 2008
Nov 2008
Dec 2008
Jan 2009
Feb 2009
Mar 2009
Apr 2009
May 2009
Jun 2009
Jul 2009
Aug 2009
Sep 2009
Oct 2009
Nov 2009
Dec 2009
Jan 2010
Feb 2010
Mar 2010
Apr 2010
May 2010
Jun 2010
Jul 2010
Aug 2010
Sep 2010
Oct 2010
Nov 2010
Dec 2010
Jan 2011
Feb 2011
March 2011
April 2011
May 2011
June 2011
July 2011
Aug 2011
Sept 2011
Oct 2011
Nov 2011
Dec 2011
0
2
4
6
8
10
12
Desired Months Supply
Source: PCA Projections
Projected

Single Family Starts ProjectionsThousand Homes
2007 2008 2009 2010 2011 2012 2013 20140.0
200.0
400.0
600.0
800.0
1,000.0
1,200.0
1,400.0 Slow job growth, tight lending stan-dards & high level
of foreclosures prevent a signifi-cant increase in
starts.

Single Family Starts ProjectionsThousand Homes
2007 2008 2009 2010 2011 2012 2013 20140.0
200.0
400.0
600.0
800.0
1,000.0
1,200.0
1,400.0 Stronger job growth, easier tight lending
standards & foreclo-sures abate but lag to burn off inventories – delaying a signal to
build

Single Family Starts ProjectionsThousand Homes
2007 2008 2009 2010 2011 2012 2013 20140.0
200.0
400.0
600.0
800.0
1,000.0
1,200.0
1,400.0 Strong job growth, eas-ier tight lending stan-
dards foreclosure issue gone. Pent-up demand release is moderated by mortgage rates in-
creases.

Residential: Upside Risks Thousand Starts
Total Starts2010 2011 2012
PCA 602 647 880
MBA 597 659 964
NAHB 605 804 1,180
NAR 617 769 1,014
Other Average 606 744 1,053
Tons Per Start ---- ---- ----
Upside Risk (Tons) ---- 1,912 3,190
Pes
sim
ists
Op
tim
ists

Nonresidential Drag

Nonresidential Conclusions No longer a significant drag on construction activity.
Large imbalances exist in before a positive NOI
materializes Slow job growth implies slow healing process
Credit environment hostile.
Conditions for positive ROI years off.
Not a significant contributor to cement consumption
growth until 2013
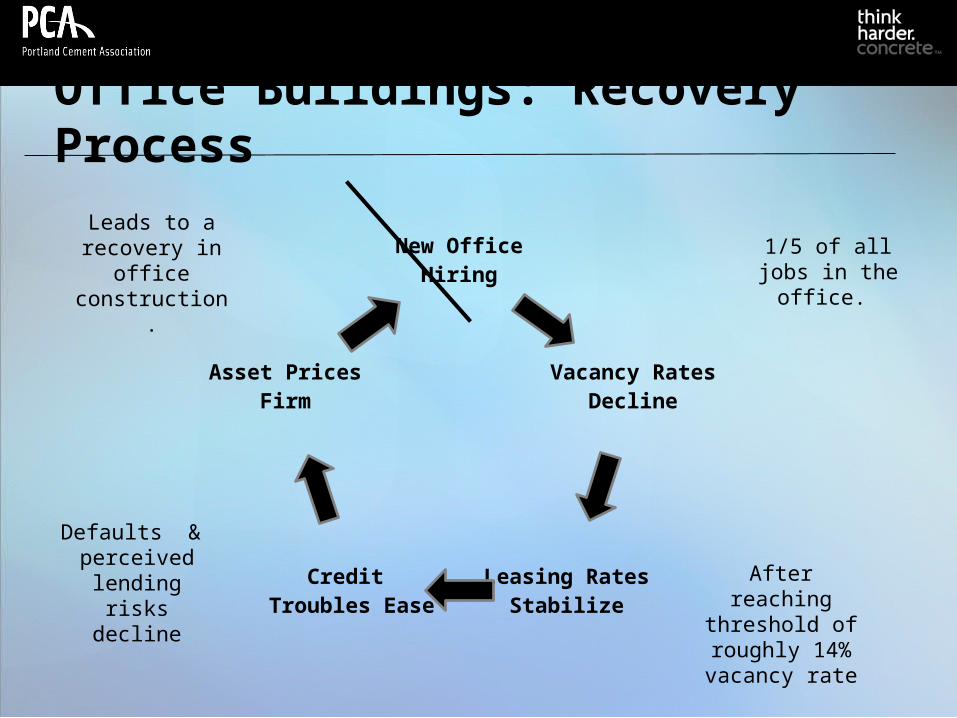
Office Buildings: Recovery Process
New Office Hiring
Vacancy Rates Decline
Leasing Rates Stabilize
Credit Troubles Ease
Asset Prices Firm
1/5 of all jobs in the office.
After reaching threshold of roughly 14% vacancy rate
Defaults & perceived
lending risks decline
Leads to a recovery in
office construction.

Office Recovery Timing Thousand Office Jobs
2005
February
March
April
May
June
July
August
September
October
November
38717
2006
February
March
April
May
June
July
August
September
October
November
39082
2007
February
March
April
May
June
July
August
September
October
November
39447
2008
February
March
April
May
June
July
August
September
October
November
39813
2009
February
March
April
May
June
July
August
September
October
November
40178
2010
February
March
April
May
June
July
August
September
25,000
26,000
27,000
28,000
29,000
30,000
2.4 million office jobs lost

32.0 Million Office Jobs Equates to Full Occupancy
27.5 Million Office Jobs Equates to Stable Leasing Rates
27.0 Million Office Jobs Today
500,000 Office Jobs must be
created before leasing rates stabilize
Implying…..
Since 1 in 5 Jobs Are In The Office
This equates to a total job creation number of roughly 2.5 million
Jobs
This condition may not materialize until 2012
Office Buildings Recovery Timing

Nonresidential Construction ProjectionsBillion Real $1996
2007 2008 2009 2010 2011 2012 2013 20140.0
20.0
40.0
60.0
80.0
100.0
120.0
140.0
160.0
180.0 High vacancy rates, weak leasing rates
translate into low NOI.
Asset prices remain soft.

Nonresidential Construction ProjectionsBillion Real $1996
2007 2008 2009 2010 2011 2012 2013 20140.0
20.0
40.0
60.0
80.0
100.0
120.0
140.0
160.0
180.0 Job growth heals, va-cancy rates decline,
leasing rates firm. Re-gional gains.

Public Recovery

ARRA Spending Composition AssumptionsBillion $
2009 2010 2011 2012
0.0
2.0
4.0
6.0
8.0
10.0
12.0
Resurfacing Widening & New Route Bridge
Chart Excludes “Other” Spending

FY 2011 Budget Gaps
State Fiscal Conditions
ME
RI
MA
VTNH
AL GA
SC
TN
FL
MS
LATX
OKNM
KS
MN
IA
MO
AR
WY
CO
ND
SD
NE
WA
ID
MT
OR
NVUT
AZ
CA
WI
ILIN
MI
OH
KY
WVVA
NC
MD
DE
PA
NY
CT
NJ
HI
Source: PCA/CBPP Oct. 2010 No Shortfall Under 11% 11%-20% Over 20%

State Deficits $ Real
1999
2000
2001
2002
2003
2004
2005
2006
2007
2008
2009
2010
2011
2012
2013
2014
2015
-400,000,000
-300,000,000
-200,000,000
-100,000,000
0
100,000,000
200,000,000
300,000,000
Source: NIPI Data
National Estimates: States Do Not Heal in a Synchronized Fashion
Slow Job Creation Leads to Slow
Deficit Heal

Discretionary State Highway Cement Consumption Thousand Metric Tons
1998
1999
2000
2001
2002
2003
2004
2005
2006
2007
2008
2009
2010
2011
2012
2013
2014
0
2,000
4,000
6,000
8,000
10,000
12,000
14,000
16,000
18,000
20,000

SAFETEA-LU Math
2010 2011
SAFETEA-LU
- Delay in Extension -1 to -2 MMT 0 MMT
- Recapture 2010 ----- +1 to +2 MMT
Volume Impact - 1 to -2 MMT +1 to +2 MMT
Net Change 2011 (No Delay) +2 to +4 MMT

Portland Cement Consumption: Highway Thousand Metric Tons
2004 2005 2006 2007 2008 2009 2010 2011 2012 2013 20140
5,000
10,000
15,000
20,000
25,000
30,000
35,000
40,000
45,000
StateDiscretionary
Highway Bill Stimulus

Beyond the Crisis
“New Normal” or “New Headaches”

Real Construction Spending Billion Real $1996
1998
1999
2000
2001
2002
2003
2004
2005
2006
2007
2008
2009
2010
2011
2012
2013
2014
2015
450
500
550
600
650
700
750
800 Chart Title

American consumer, the engine of US economic growth
May distance from debt spending patterns (lowering GDP).
Baby boomers may not re-capture wealth
Higher inflation erodes spending.
Impacts Slower growth – Is 50 basis point enough?
After the Crisis: “New Normal”: Economics

Fiscal Policy Stimulus spending must be paid for…resulting in
higher interest rates, higher taxes, and potentially higher inflation.
Monetary policy easing (U.S. & global) & QE2 Could add to inflationary pressures. QE2 compounds the inflationary risks. Raises prospects of Federal Reserve tightening.
Weakens dollar in context of large public debt. Heightens debt costs. Opens door for fiscal austerity.
Key economic consequences
American consumer, the engine of US economic growth, may distance from debt spending patterns (lowering GDP).
Dollar may show a structural weakening.
…combining for the potential of slower longer term economic growth (50 basis points).
After the Crisis: “New Normal”: Policy

Not a typical recession recovery. Amplified by structural corrections. Amplified by possible policy errors.
Long impacts
Pent-Up Demand Being generated across all sectors.
Longer period of distress, more pent-up demand
Timing and magnitude of release impacted by economy.
Regional impacts from resulting growth.
Residential, nonresidential & public synchronized – 2013 & Beyond.
Typically suggests strong cement consumption growth rates.
After the Crisis: “New Normal”: Construction

Emerging economies, led by China/India, account for key growth drivers. Accounts for larger share of world GDP than OECD by
2014 (IMF). Exerts “new” potent demand on world markets “Synchronized” world growth returns 2013-2020.
Commodity prices (oil), freight rates, trading patterns subject to change. Impacts concrete competitiveness (oil prices = paving
position, residential ICF) Impacts sourcing decisions – high freight rates raising
import costs.
New challenges could lead to potentially new economic/political tensions.
After the Crisis: “New Normal”: Global

Researchers at the MIT Concrete Sustainability Hub are working to quantify the full cradle-to-grave life-cycle environmental and economic costs of paving and building materials.
Residential Buildings – More than 90% of the life-cycle carbon
emissions are due to the use phase, with construction and end-of-
life disposal accounting for less than 10% of the total emissions.
Residential Buildings – Concrete structures built with insulated
concrete forms (ICF) enjoy long-term operational energy savings of
20% or more over wood-framed buildings.
In the context of synchronized world growth, higher oil prices,
homebuyers may increasingly emphasize energy saving aspects of
concrete homes.
After the Crisis: “New Normal”: MIT

Activist EPA Plant shut downs High compliance costs. New Source regulations!
Resumption of demand growth
Import Dependence Grows In context of weak dollar In context of emerging economy demand growth Higher freight rates.
Sourcing strategies Near term, import dependence – longer term?
After the Crisis: “New Normal”: Regulation
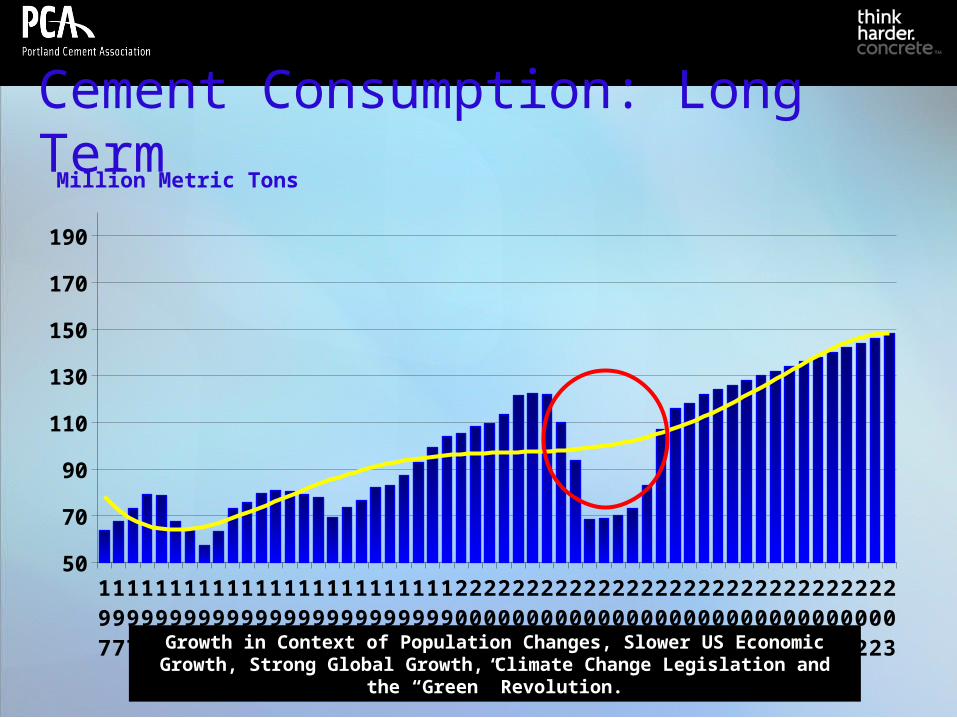
Cement Consumption: Long Term
1975
1976
1977
1978
1979
1980
1981
1982
1983
1984
1985
1986
1987
1988
1989
1990
1991
1992
1993
1994
1995
1996
1997
1998
1999
2000
2001
2002
2003
2004
2005
2006
2007
2008
2009
2010
2011
2012
2013
2014
2015
2016
2017
2018
2019
2020
2021
2022
2023
2024
2025
2026
2027
2028
2029
2030
50
70
90
110
130
150
170
190
Million Metric Tons
Growth in Context of Population Changes, Slower US Economic Growth, Strong Global Growth, Climate Change Legislation and the “Green” Revolution.

Construction Outlook: 2011-2015
Ed Sullivan, Chief Economist PCA
Independent Equipment Dealers Association February 2011
Named Most Accurate Forecaster By Chicago Federal Reserve, 2009