Embed Size (px)
Citation preview
Construction Productivity The devil’s in the detail .........
Productivity Hub Conference 2 July 2013
Helen Anderson, Suzanne Wilkinson, John Tookey, Jeff Seadon, Brett Lineham, Ian Page, Wayne Sharman, Richard Capie, Ruth Berry, Andrew Reding, Adrian Bennett, Peter Cunningham, Chris Kane, Amanda Warren, Pam Bell, Kevin Golding, Derek Baxter, Brendan Mai
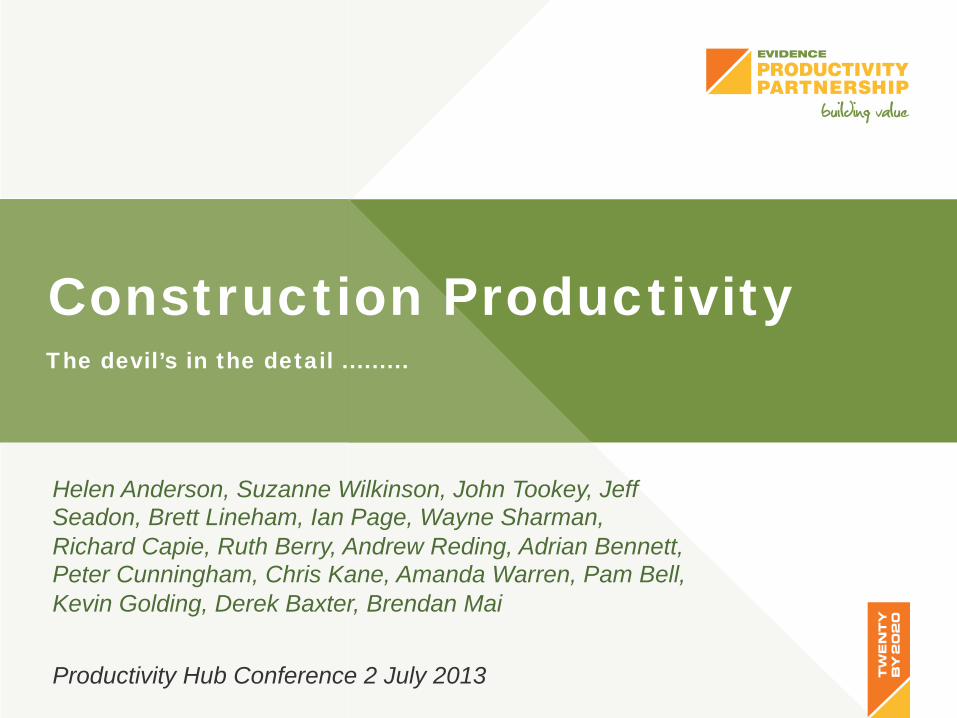
Mud on the boots research
Productivity will improve when
we get the right people with the right tools doing the right stuff we use a lot of low skill labour, don’t use our capital wisely and quality isn’t a key driver
Industry leader’s definition, 2011
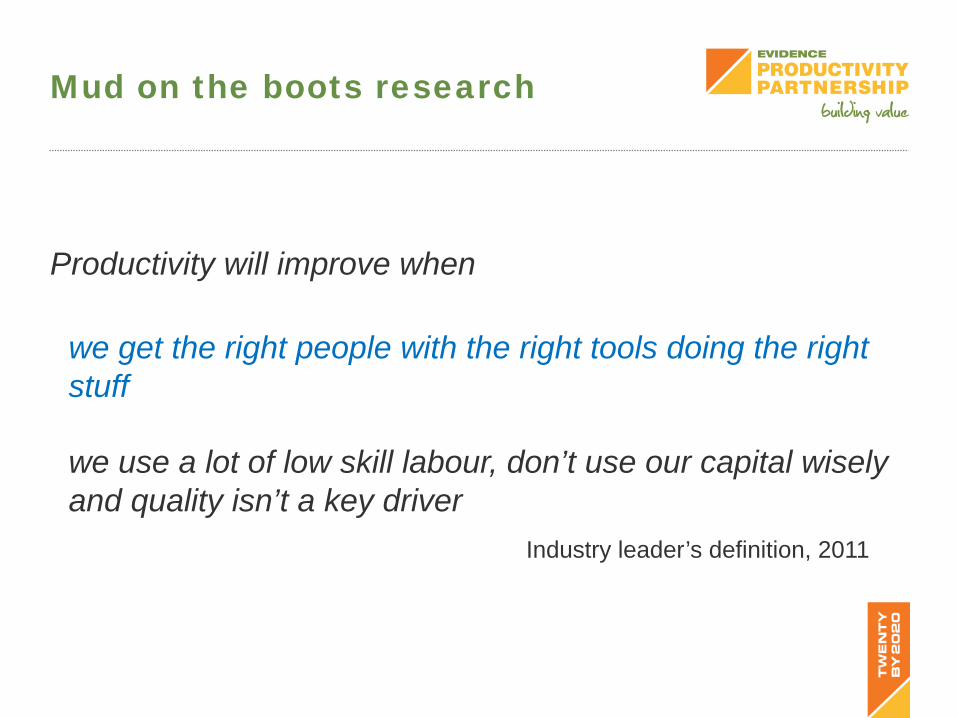
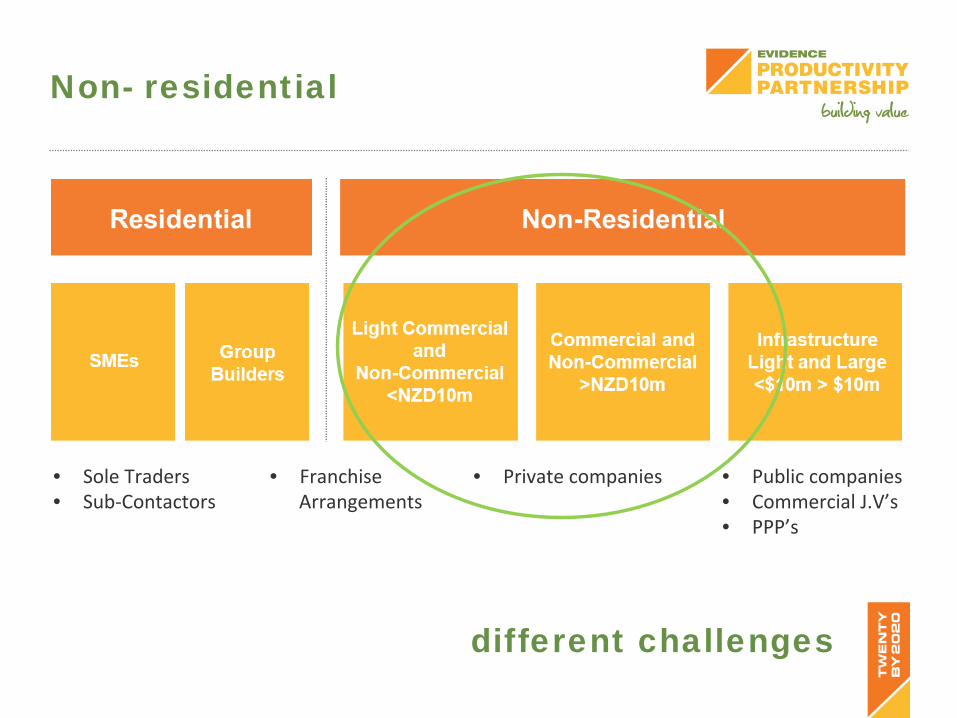
• Sole Traders • Sub-‐Contactors
• Franchise Arrangements
• Private companies • Public companies • Commercial J.V’s • PPP’s
One size does not fit all
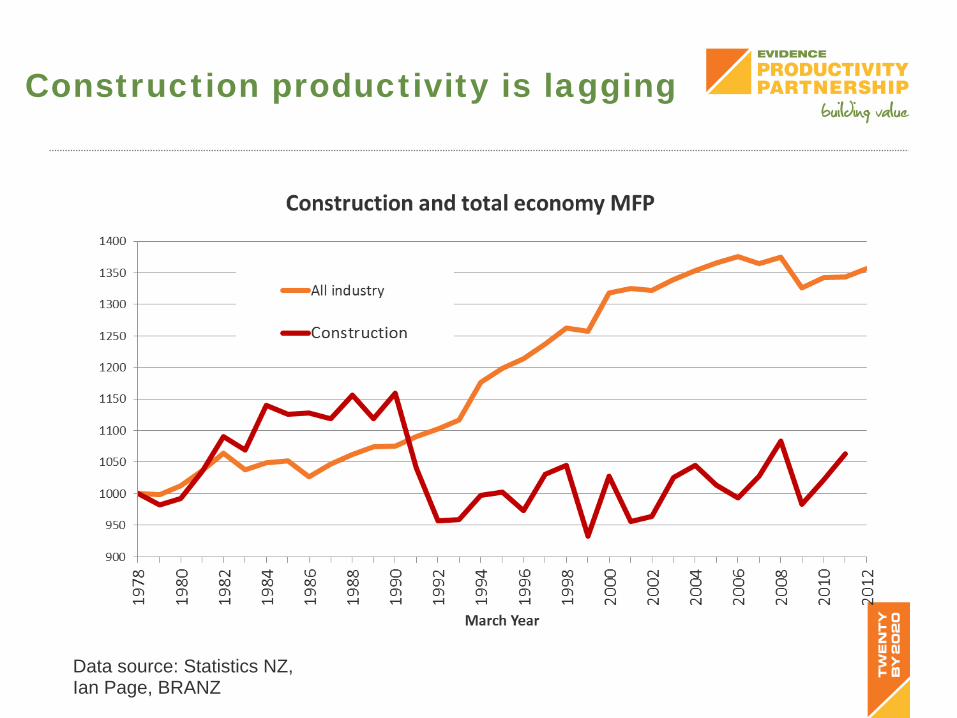
Construction productivity is lagging
Data source: Statistics NZ, Ian Page, BRANZ

We’ve got a bit more volatility than other economies
Data: OECD, StatsNZ, Source: Ian Page, BRANZ
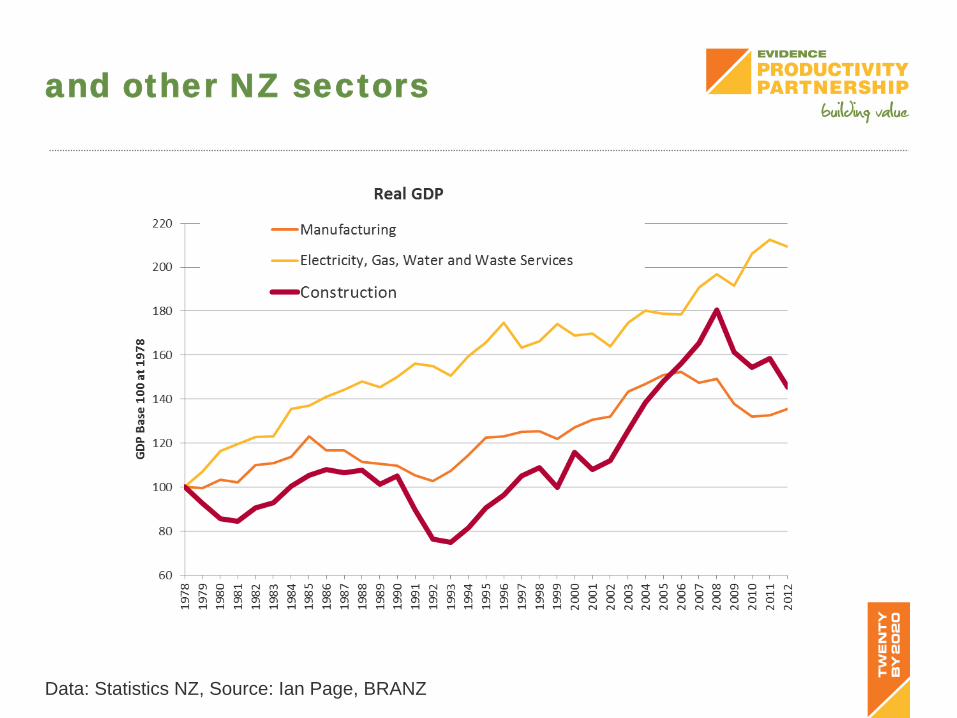
and other NZ sectors
Data: Statistics NZ, Source: Ian Page, BRANZ
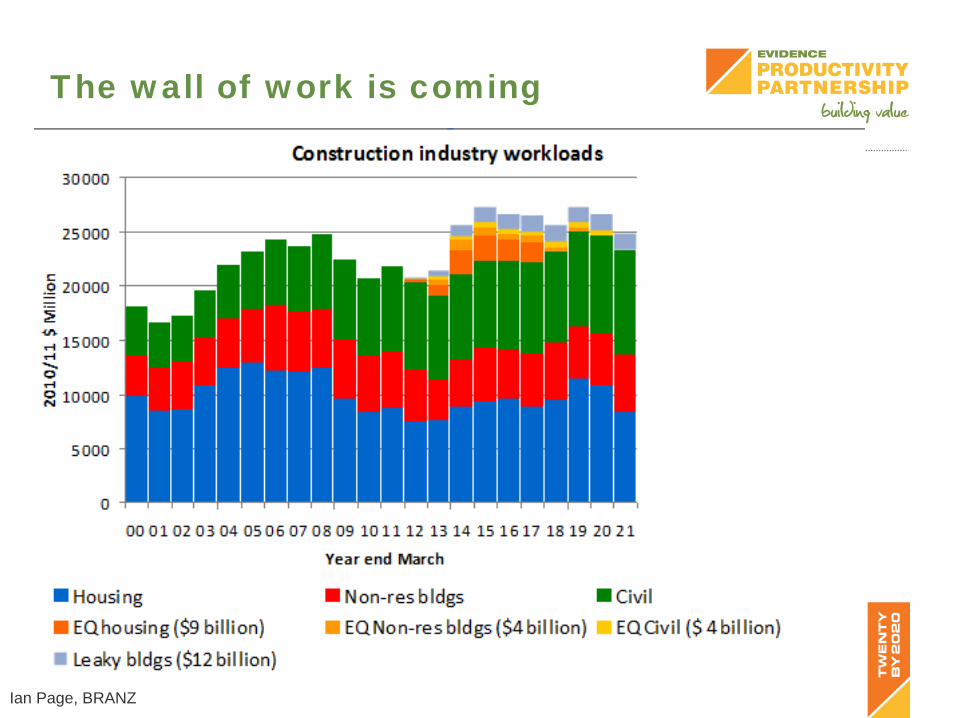
The wall of work is coming
Ian Page, BRANZ
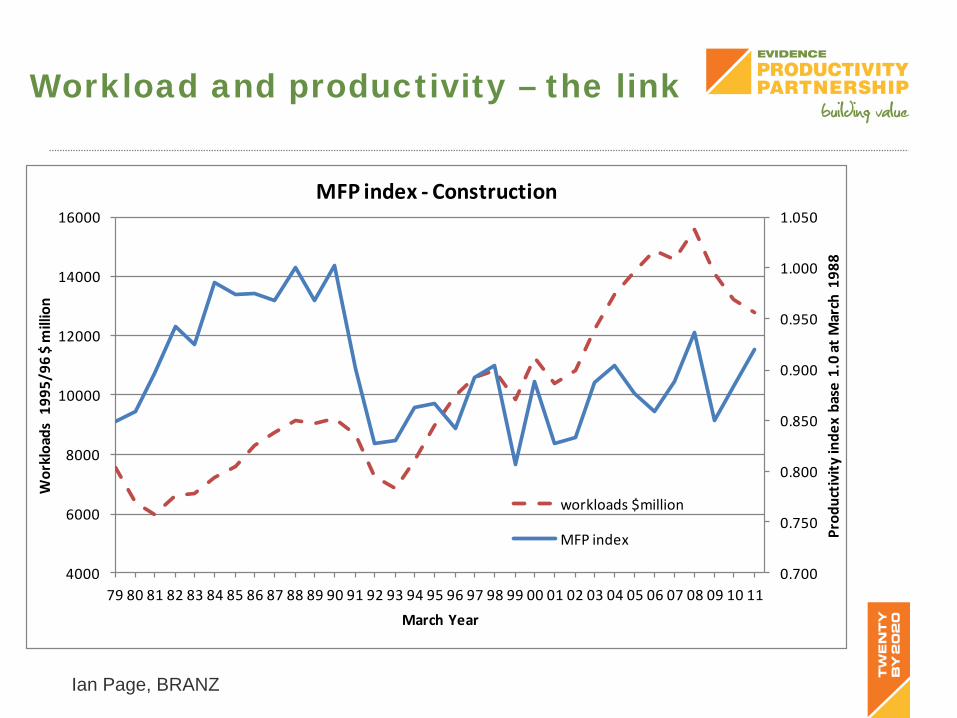
Workload and productivity – the link
0.700
0.750
0.800
0.850
0.900
0.950
1.000
1.050
4000
6000
8000
10000
12000
14000
16000
79 80 81 82 83 84 85 86 87 88 89 90 91 92 93 94 95 96 97 98 99 00 01 02 03 04 05 06 07 08 09 10 11
Prod
uctiv
ity inde
x base 1.0 at M
arch 198
8
Workloads 1
995/96
$ million
March Year
MFP index -‐ Construction
workloads $million
MFP index
Ian Page, BRANZ
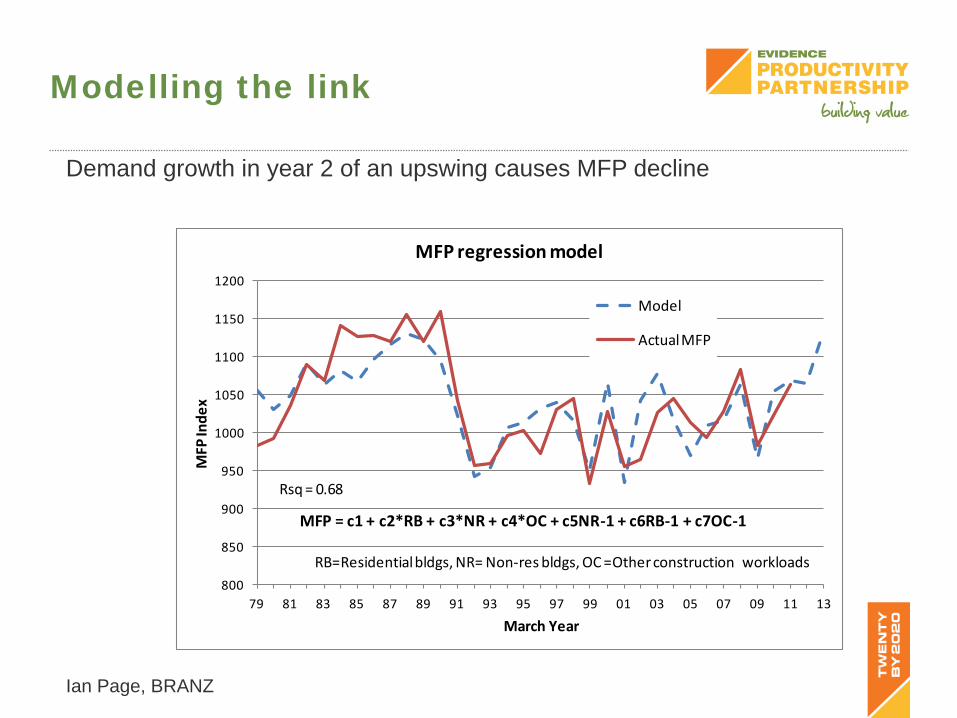
Modelling the link
800
850
900
950
1000
1050
1100
1150
1200
79 81 83 85 87 89 91 93 95 97 99 01 03 05 07 09 11 13
MFP Inde
x
March Year
MFP regression model
Model
Actual MFP
MFP = c1 + c2*RB + c3*NR + c4*OC + c5NR-‐1 + c6RB-‐1 + c7OC-‐1
RB=Residential bldgs, NR= Non-‐res bldgs, OC =Other construction workloads
Rsq = 0.68
Demand growth in year 2 of an upswing causes MFP decline
Ian Page, BRANZ
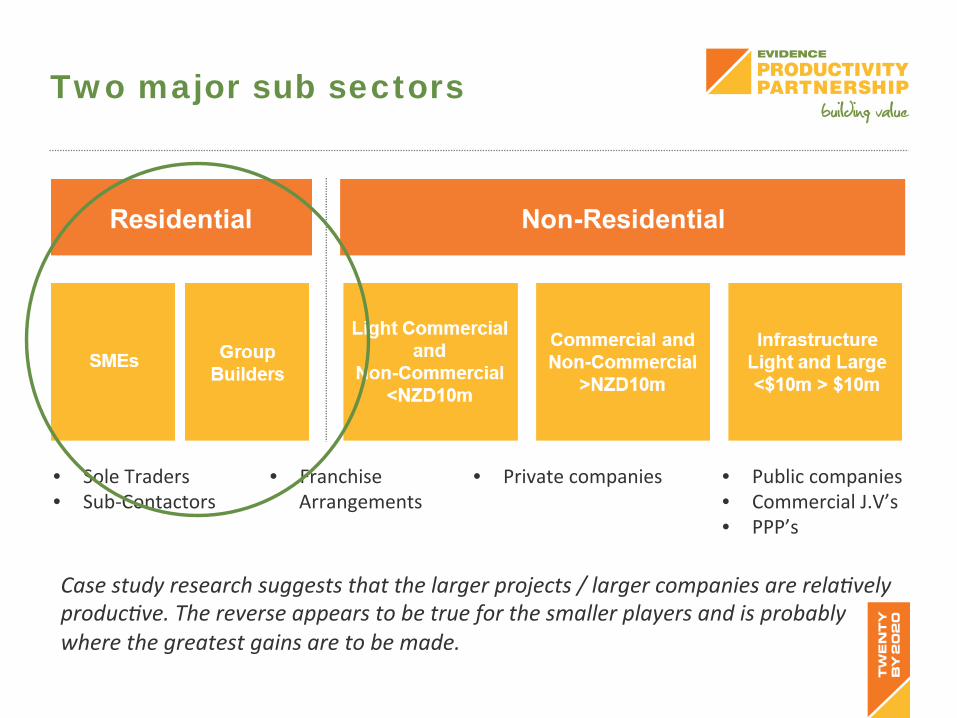
Case study research suggests that the larger projects / larger companies are rela6vely produc6ve. The reverse appears to be true for the smaller players and is probably where the greatest gains are to be made.
• Sole Traders • Sub-‐Contactors
• Franchise Arrangements
• Private companies • Public companies • Commercial J.V’s • PPP’s
Two major sub sectors
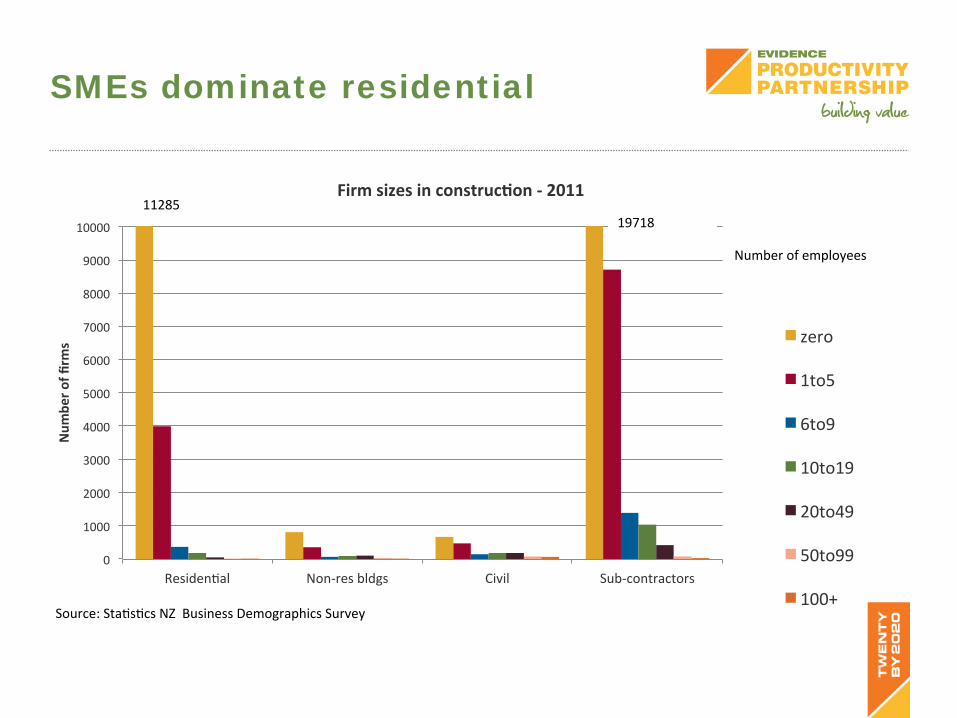
SMEs dominate residential
0
1000
2000
3000
4000
5000
6000
7000
8000
9000
10000
ResidenJal Non-‐res bldgs Civil Sub-‐contractors
Num
ber o
f firm
s
Firm sizes in construc2on -‐ 2011
zero
1to5
6to9
10to19
20to49
50to99
100+
Number of employees
11285 19718
Source: StaJsJcs NZ Business Demographics Survey
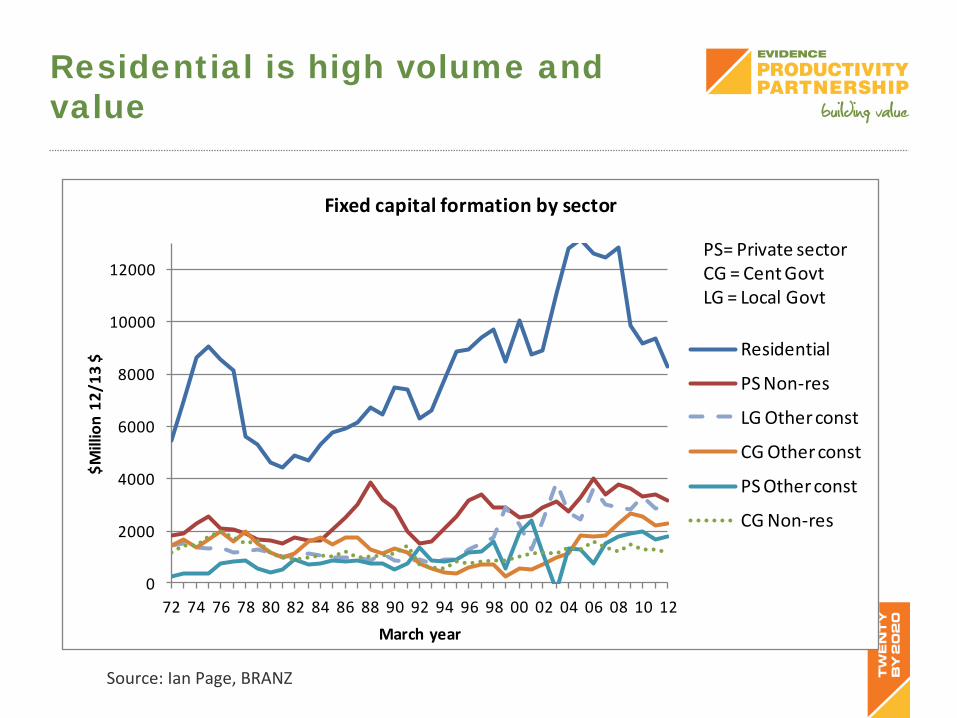
Residential is high volume and value
Source: Ian Page, BRANZ
0
2000
4000
6000
8000
10000
12000
72 74 76 78 80 82 84 86 88 90 92 94 96 98 00 02 04 06 08 10 12
$Million 12
/13 $
March year
Fixed capital formation by sector
Residential
PS Non-‐res
LG Other const
CG Other const
PS Other const
CG Non-‐res
PS= Private sectorCG = Cent GovtLG = Local Govt

Productivity Partnership
Mud on the boots research
• Systems mapping • Case studies • Focus groups • Detailed statistics
Allco
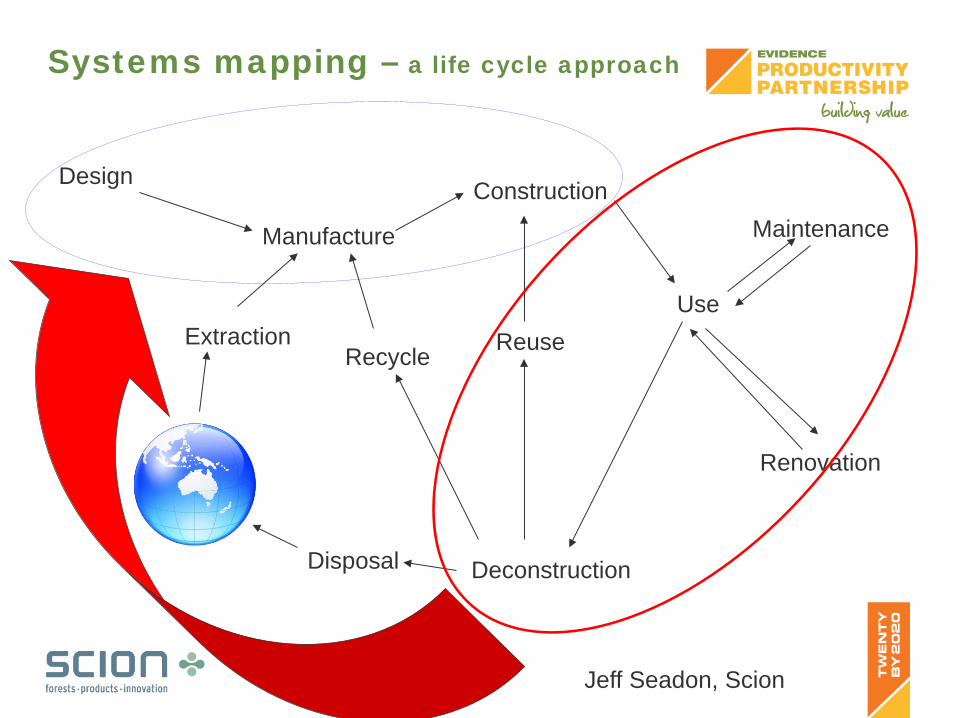
Systems mapping – a life cycle approach
Design
Manufacture
Construction
Use
Maintenance
Renovation
Deconstruction
Recycle Reuse
Disposal
Extraction
Jeff Seadon, Scion
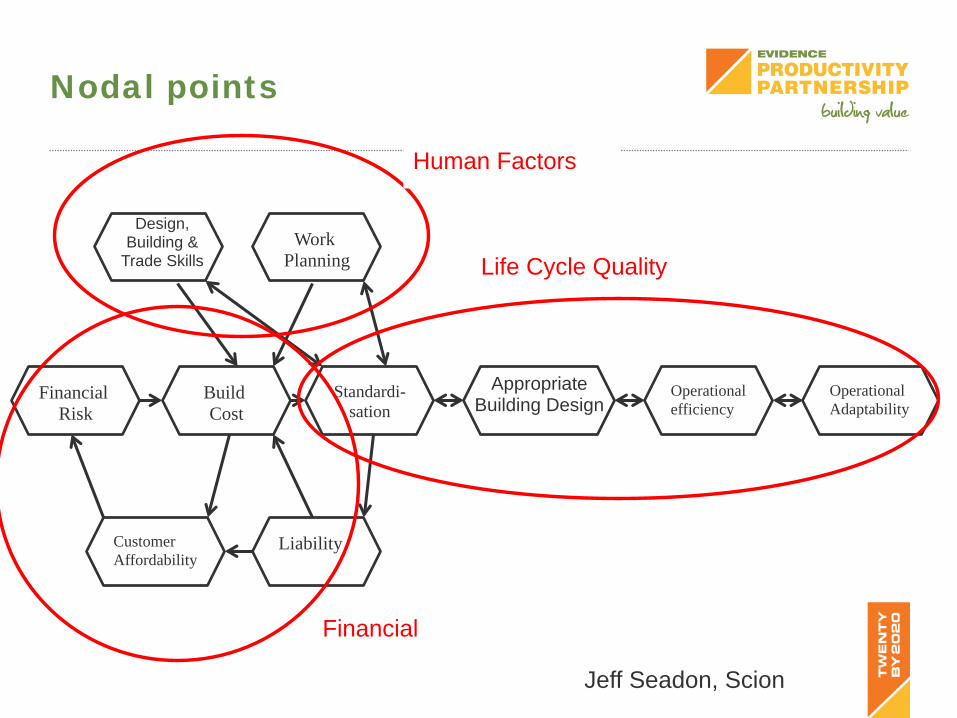
Nodal points
Financial Risk
Build Cost
Standardi-sation
Operational efficiency
Operational Adaptability
Customer Affordability
Liability
Work Planning
Design, Building &
Trade Skills
Appropriate Building Design
Human Factors
Financial
Life Cycle Quality
Jeff Seadon, Scion
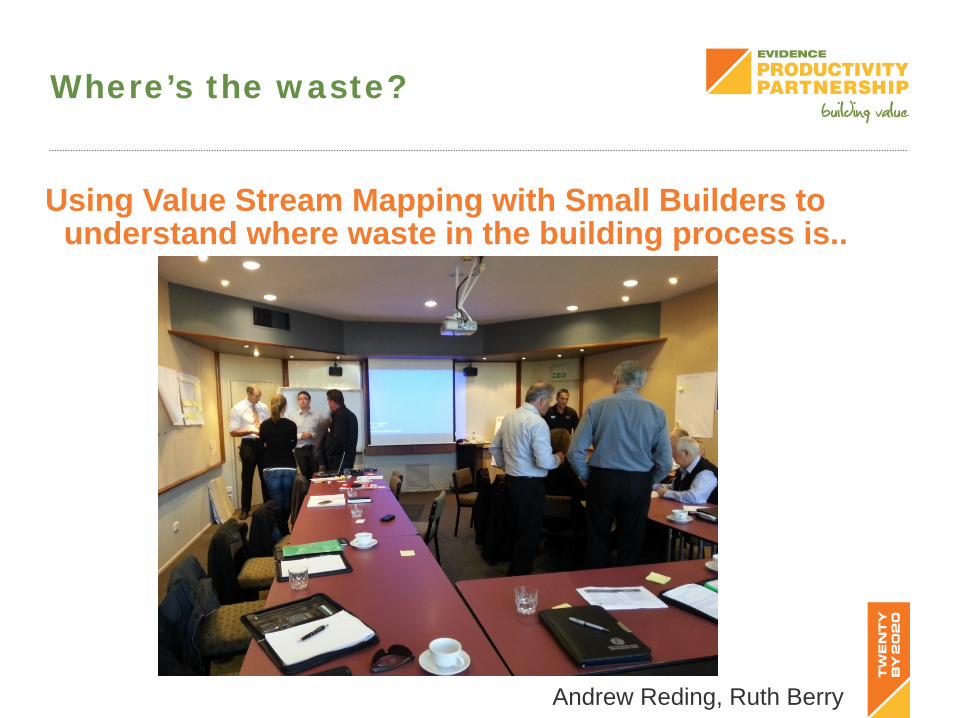
Where’s the waste?
Using Value Stream Mapping with Small Builders to understand where waste in the building process is..
Andrew Reding, Ruth Berry
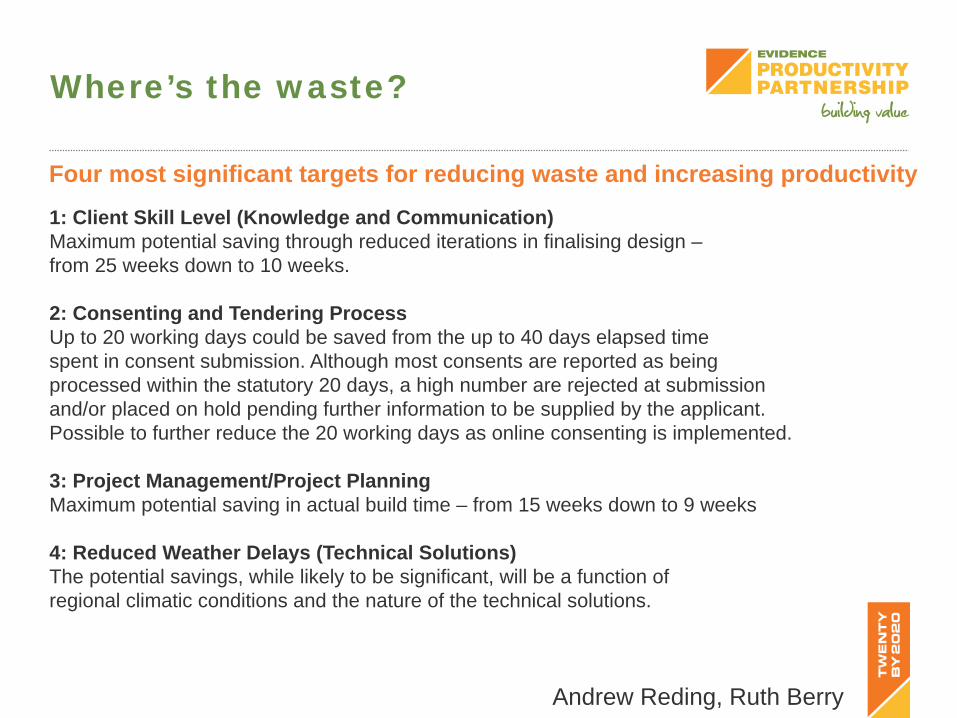
Where’s the waste?
1: Client Skill Level (Knowledge and Communication) Maximum potential saving through reduced iterations in finalising design – from 25 weeks down to 10 weeks. 2: Consenting and Tendering Process Up to 20 working days could be saved from the up to 40 days elapsed time spent in consent submission. Although most consents are reported as being processed within the statutory 20 days, a high number are rejected at submission and/or placed on hold pending further information to be supplied by the applicant. Possible to further reduce the 20 working days as online consenting is implemented. 3: Project Management/Project Planning Maximum potential saving in actual build time – from 15 weeks down to 9 weeks 4: Reduced Weather Delays (Technical Solutions) The potential savings, while likely to be significant, will be a function of regional climatic conditions and the nature of the technical solutions.
Four most significant targets for reducing waste and increasing productivity
Andrew Reding, Ruth Berry
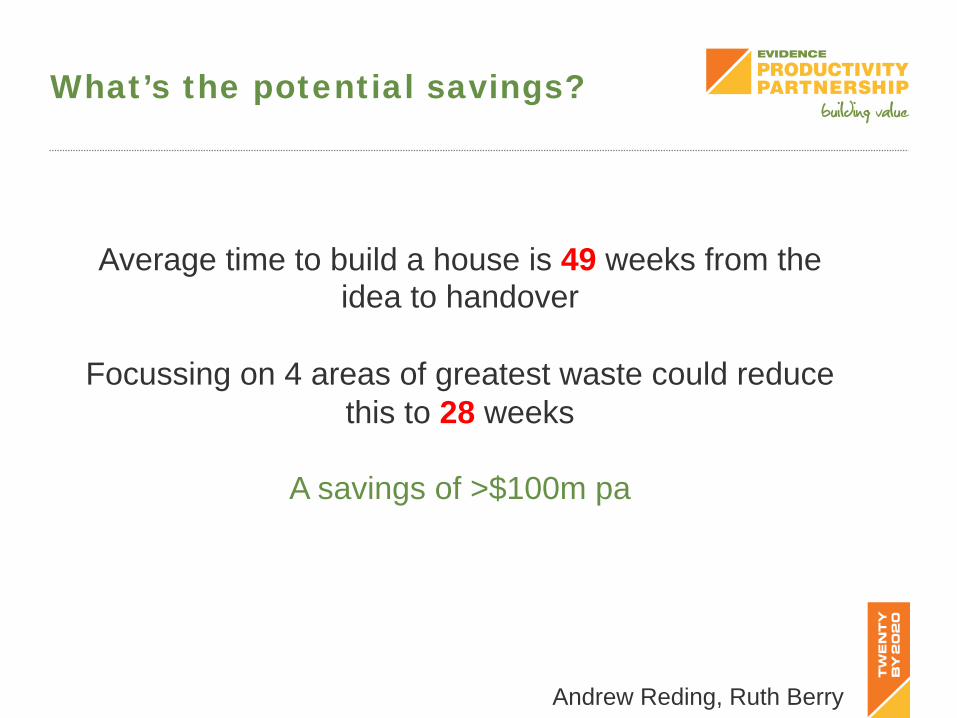
What’s the potential savings?
Average time to build a house is 49 weeks from the idea to handover
Focussing on 4 areas of greatest waste could reduce
this to 28 weeks
A savings of >$100m pa
Andrew Reding, Ruth Berry
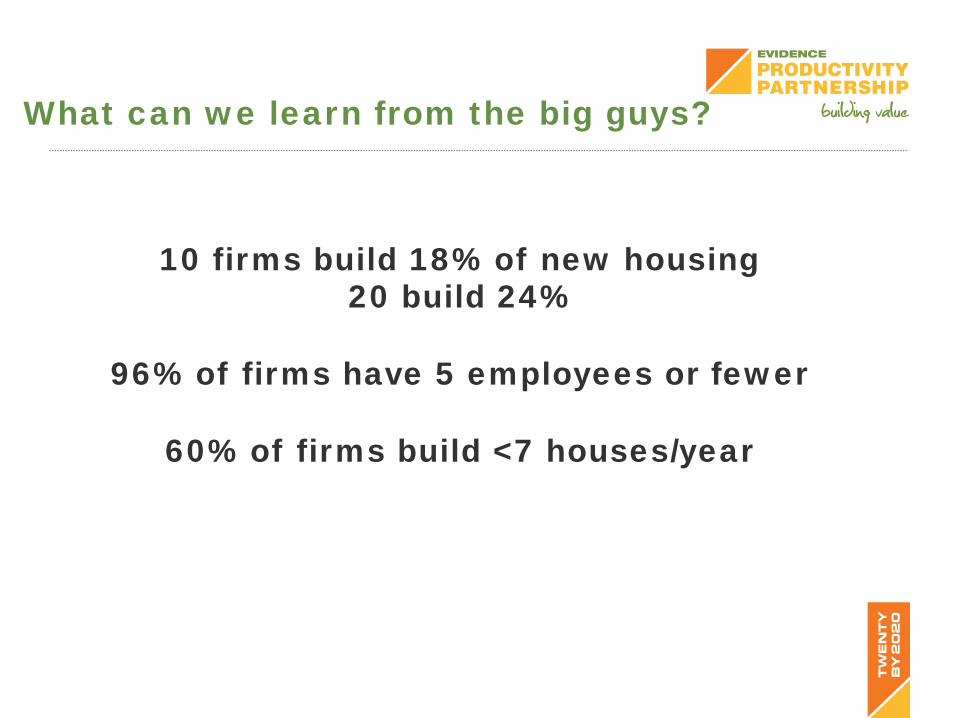
What can we learn from the big guys?
10 firms build 18% of new housing 20 build 24%
96% of firms have 5 employees or fewer
60% of firms build <7 houses/year
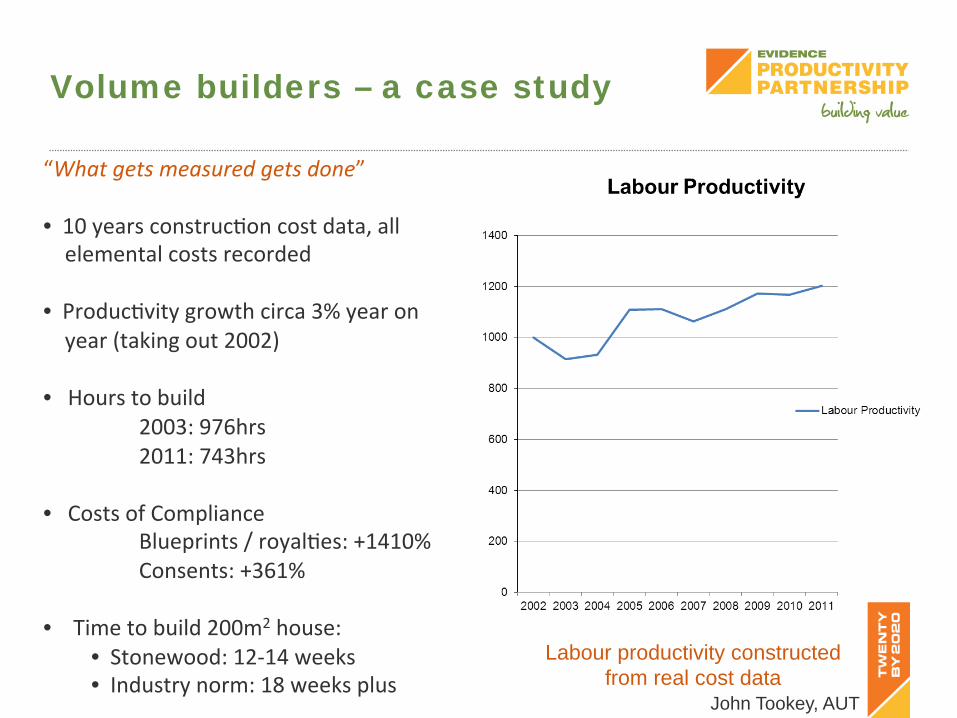
Volume builders – a case study
“What gets measured gets done” • 10 years construcJon cost data, all elemental costs recorded • ProducJvity growth circa 3% year on year (taking out 2002) • Hours to build
2003: 976hrs 2011: 743hrs
• Costs of Compliance Blueprints / royalJes: +1410% Consents: +361%
• Time to build 200m2 house: • Stonewood: 12-‐14 weeks • Industry norm: 18 weeks plus
Labour productivity constructed from real cost data
John Tookey, AUT
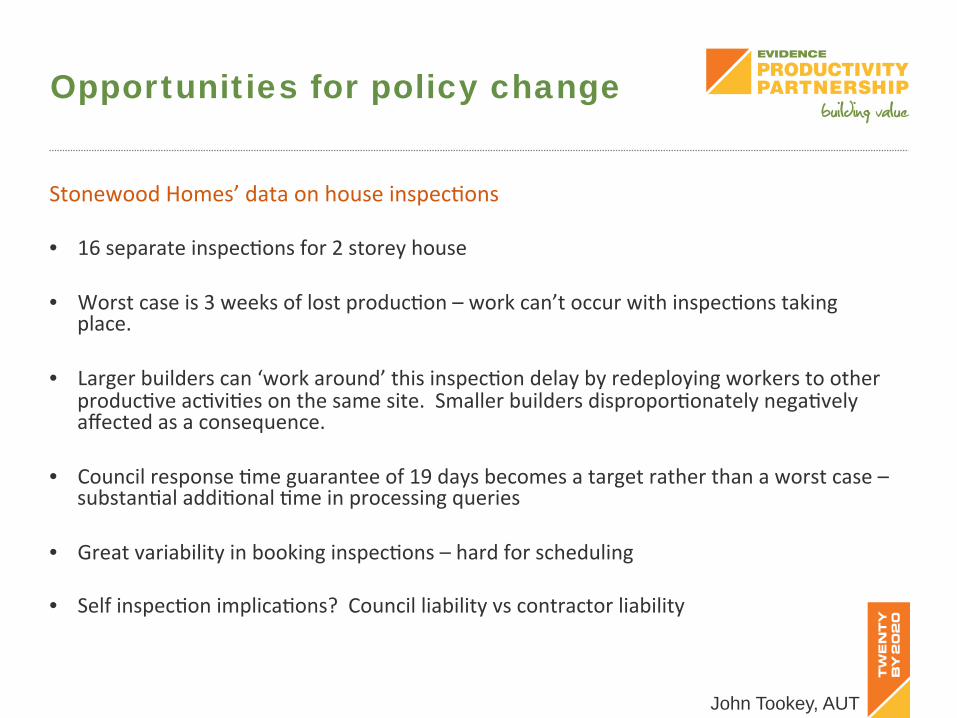
Opportunities for policy change
Stonewood Homes’ data on house inspecJons • 16 separate inspecJons for 2 storey house
• Worst case is 3 weeks of lost producJon – work can’t occur with inspecJons taking place.
• Larger builders can ‘work around’ this inspecJon delay by redeploying workers to other producJve acJviJes on the same site. Smaller builders disproporJonately negaJvely affected as a consequence.
• Council response Jme guarantee of 19 days becomes a target rather than a worst case –
substanJal addiJonal Jme in processing queries
• Great variability in booking inspecJons – hard for scheduling
• Self inspecJon implicaJons? Council liability vs contractor liability
John Tookey, AUT
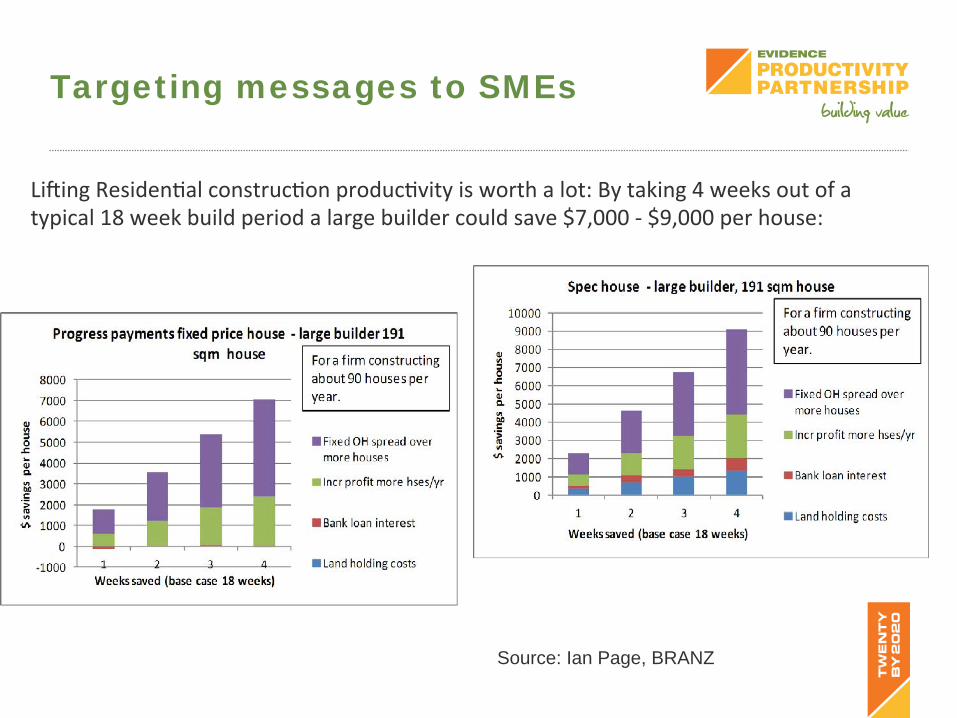
Liging ResidenJal construcJon producJvity is worth a lot: By taking 4 weeks out of a typical 18 week build period a large builder could save $7,000 -‐ $9,000 per house:
Targeting messages to SMEs
Source: Ian Page, BRANZ
• Sole Traders • Sub-‐Contactors
• Franchise Arrangements
• Private companies • Public companies • Commercial J.V’s • PPP’s
Non- residential
different challenges
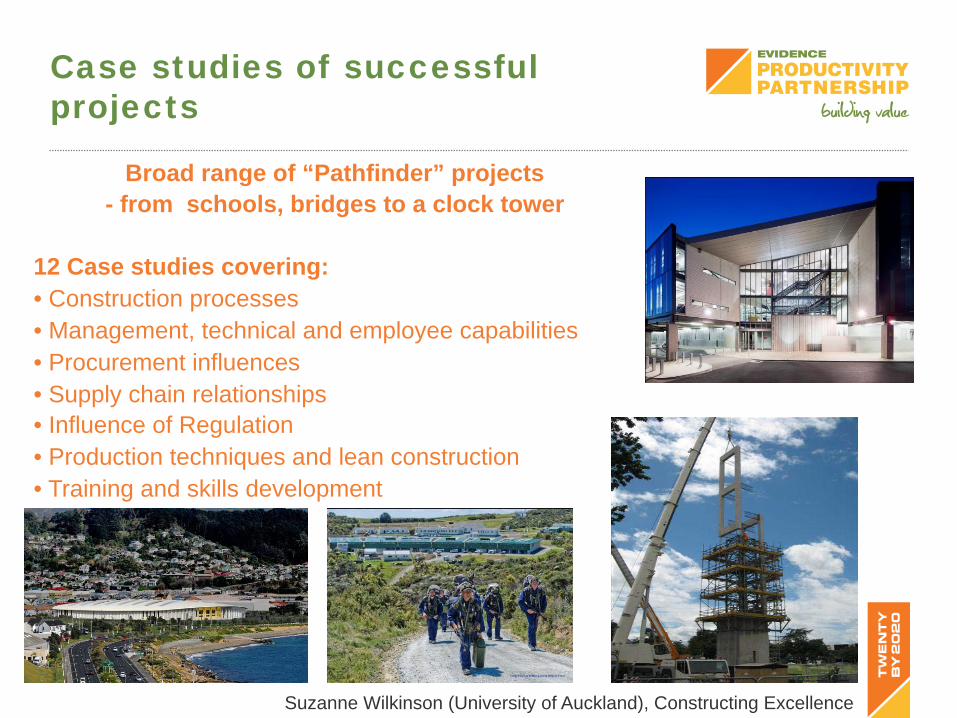
Case studies of successful projects
Broad range of “Pathfinder” projects - from schools, bridges to a clock tower
12 Case studies covering: • Construction processes • Management, technical and employee capabilities • Procurement influences • Supply chain relationships • Influence of Regulation • Production techniques and lean construction • Training and skills development
Suzanne Wilkinson (University of Auckland), Constructing Excellence
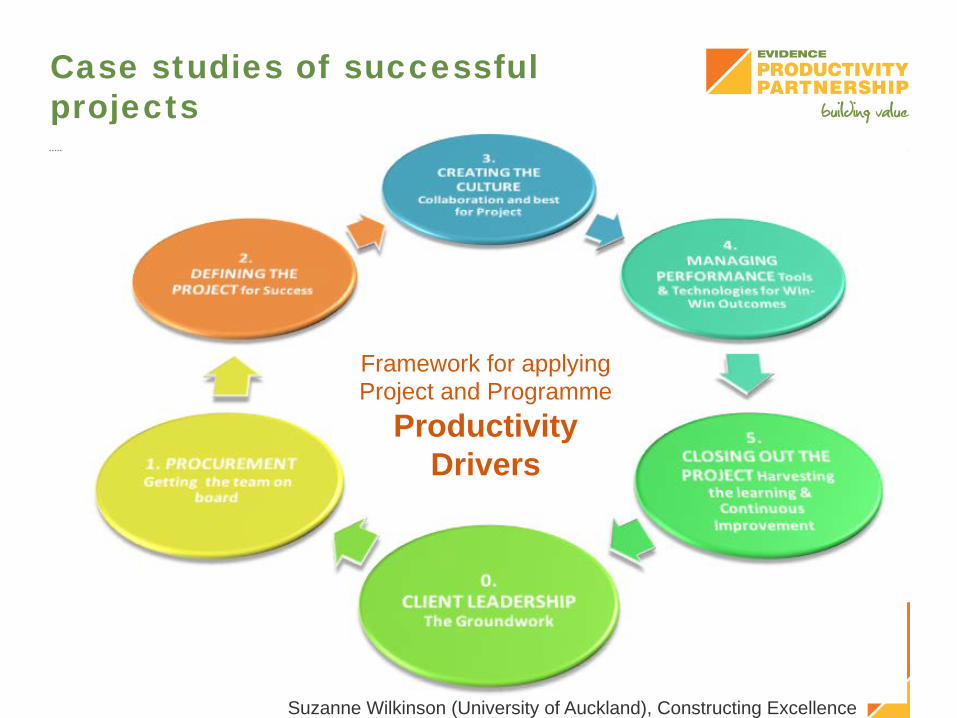
Case studies of successful projects
Framework for applying Project and Programme
Productivity Drivers
Suzanne Wilkinson (University of Auckland), Constructing Excellence
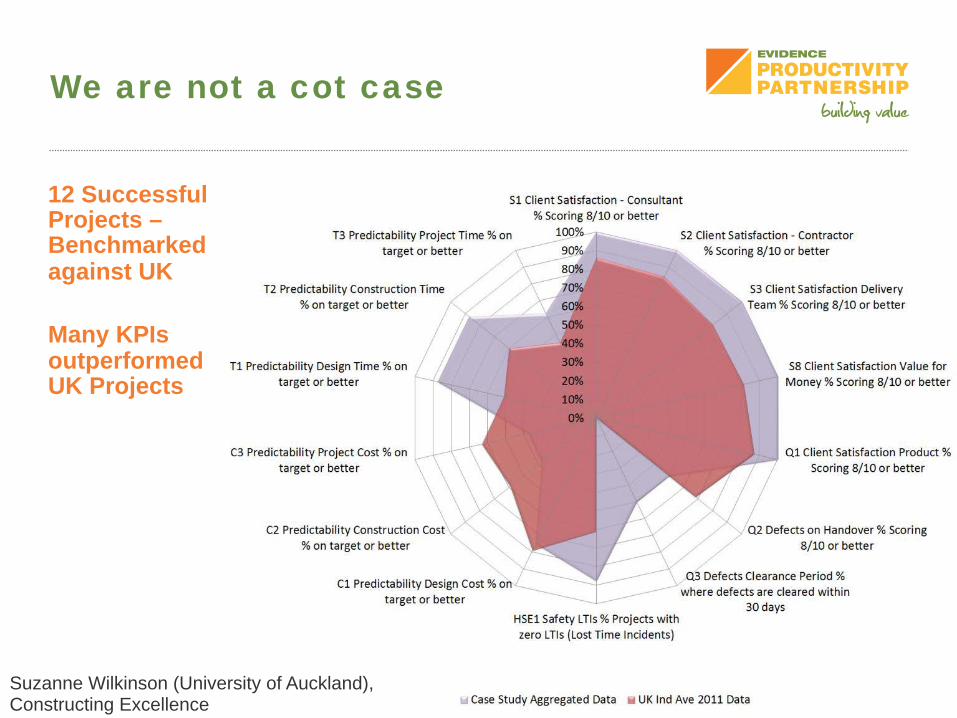
We are not a cot case
12 Successful Projects – Benchmarked against UK Many KPIs outperformed UK Projects
Suzanne Wilkinson (University of Auckland), Constructing Excellence
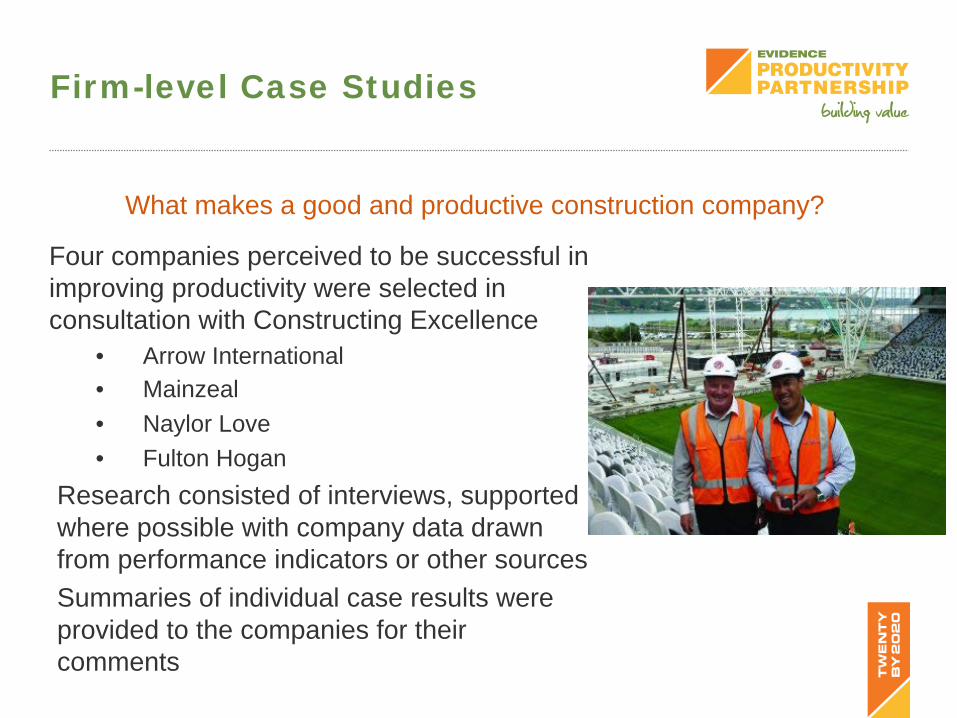
Firm-level Case Studies
Four companies perceived to be successful in improving productivity were selected in consultation with Constructing Excellence
• Arrow International • Mainzeal • Naylor Love • Fulton Hogan
Research consisted of interviews, supported where possible with company data drawn from performance indicators or other sources Summaries of individual case results were provided to the companies for their comments
What makes a good and productive construction company?
Firm-level Case Studies
Firms did not use standard statistical measures of productivity and had limited trend data for their operations as a whole, but had measures of increasing productivity in some areas • Time, quality, cost, and safety measures were identified • Emphasis on cutting waste in time & materials, reducing rework
• Greatest emphasis placed on better management including: • Effective and early planning • Project management • Relationships with supply chain partners, clients • Use of information technologies to coordinate the supply chain
• Less emphasis on staff skills, regulatory issues
David Turner, MBIE
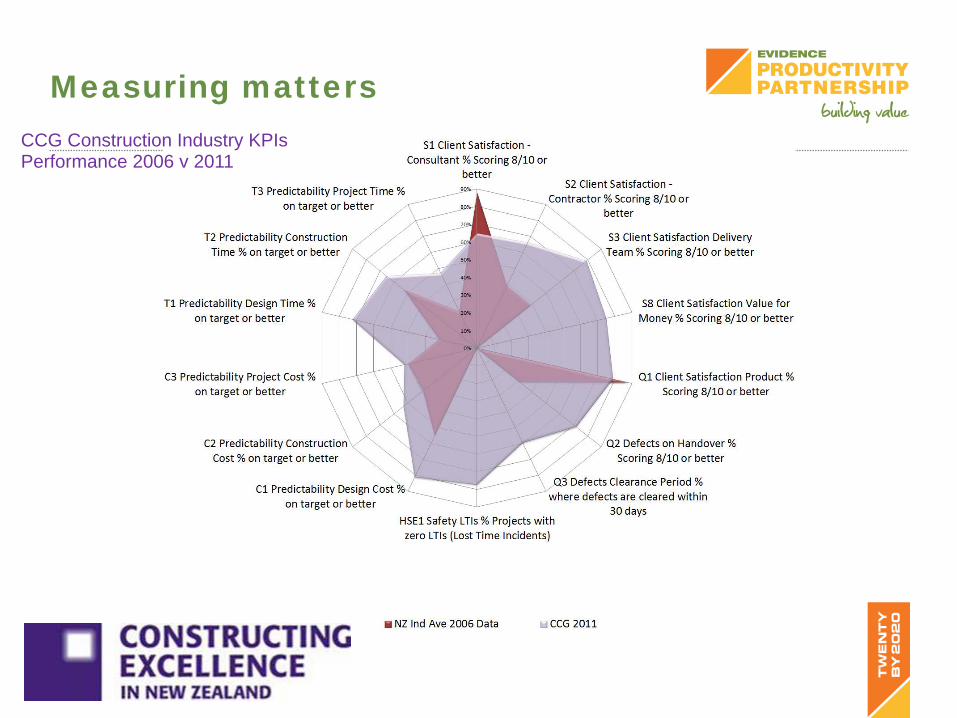
Measuring matters CCG Construction Industry KPIs Performance 2006 v 2011
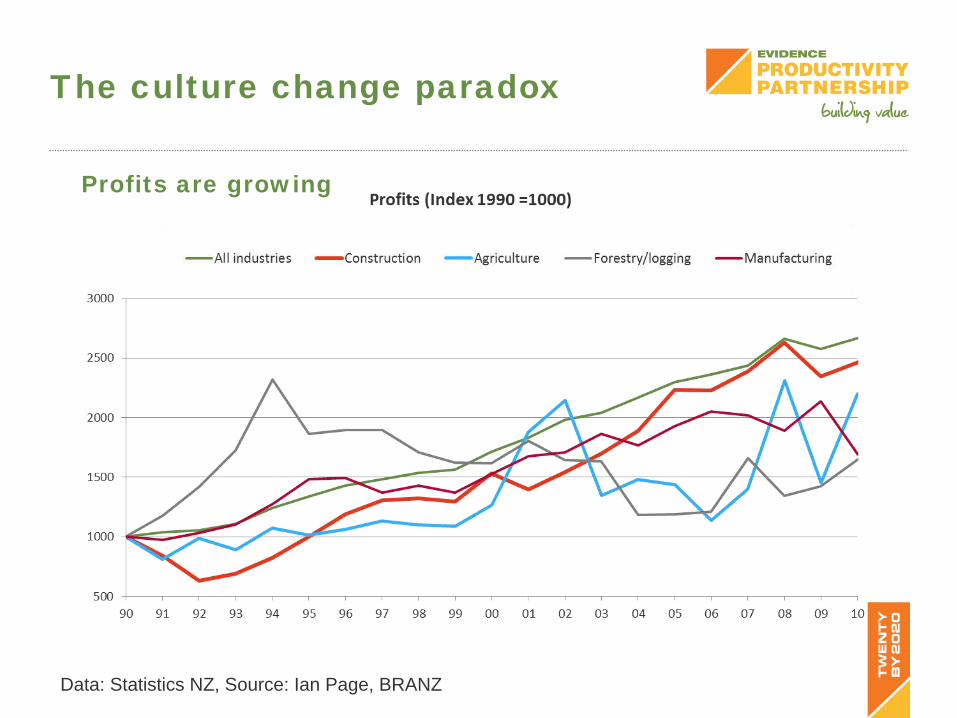
The culture change paradox
Data: Statistics NZ, Source: Ian Page, BRANZ
Profits are growing
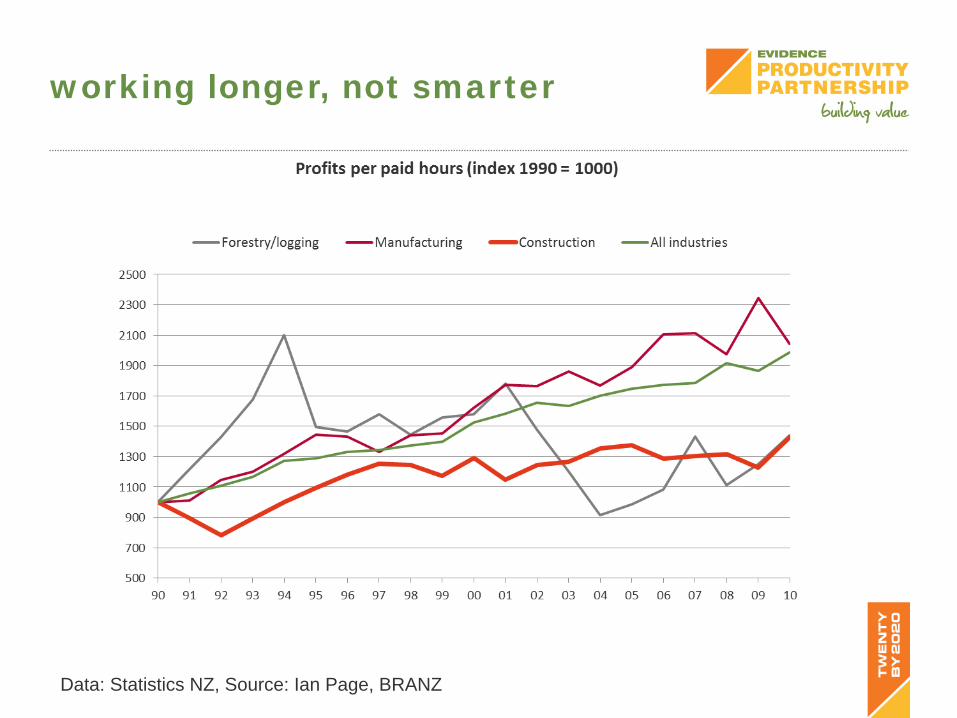
working longer, not smarter
Data: Statistics NZ, Source: Ian Page, BRANZ
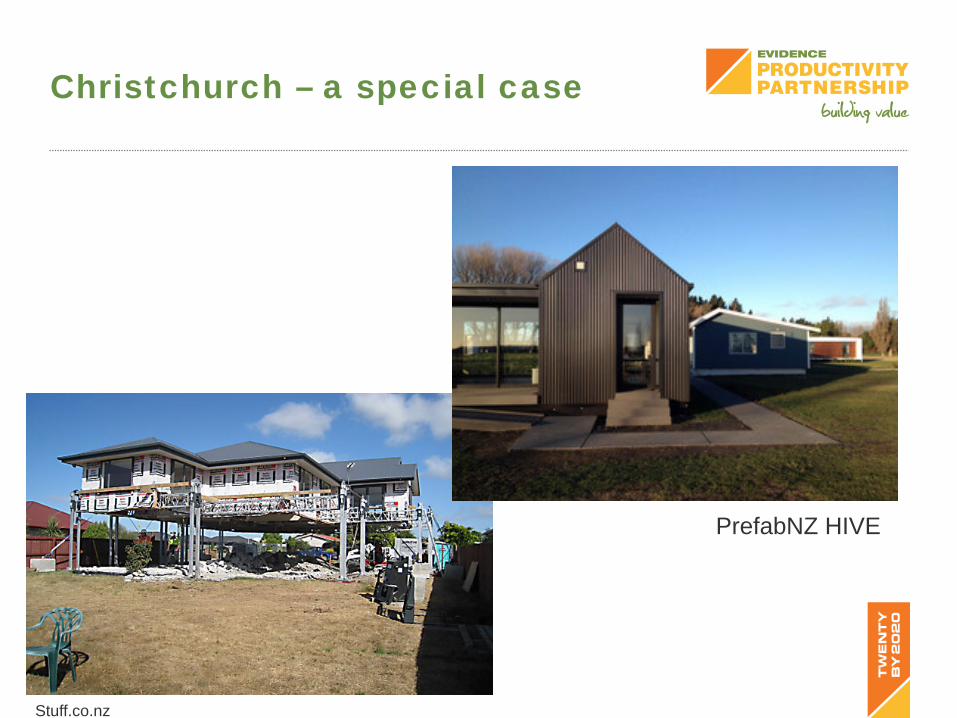
Christchurch – a special case
PrefabNZ HIVE
Stuff.co.nz
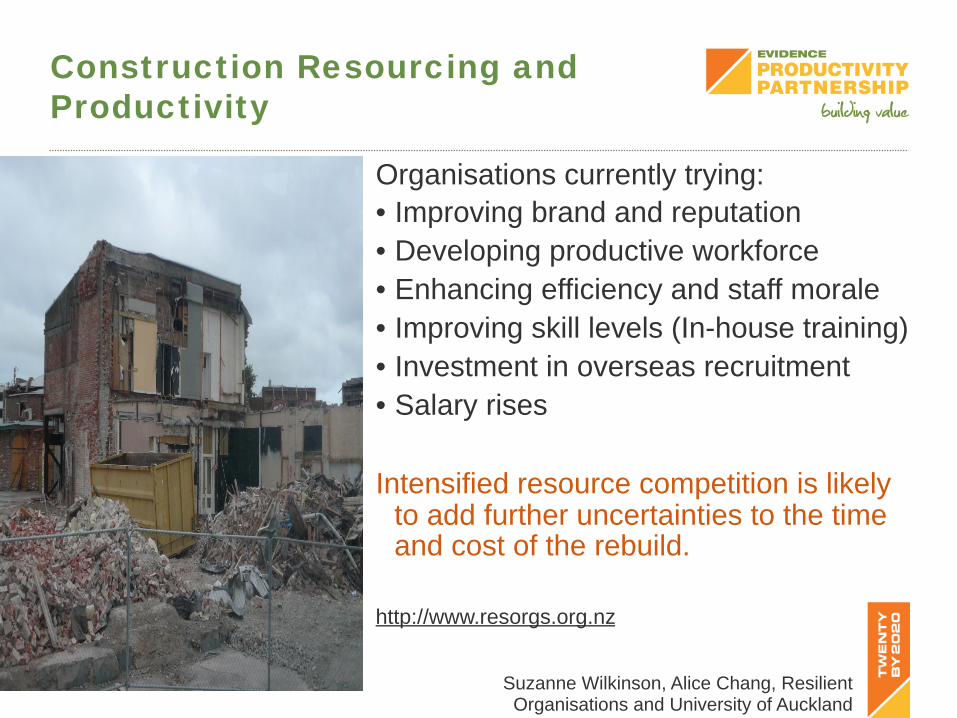
Construction Resourcing and Productivity
Organisations currently trying: • Improving brand and reputation • Developing productive workforce • Enhancing efficiency and staff morale • Improving skill levels (In-house training) • Investment in overseas recruitment • Salary rises
Intensified resource competition is likely to add further uncertainties to the time and cost of the rebuild.
http://www.resorgs.org.nz
Suzanne Wilkinson, Alice Chang, Resilient Organisations and University of Auckland
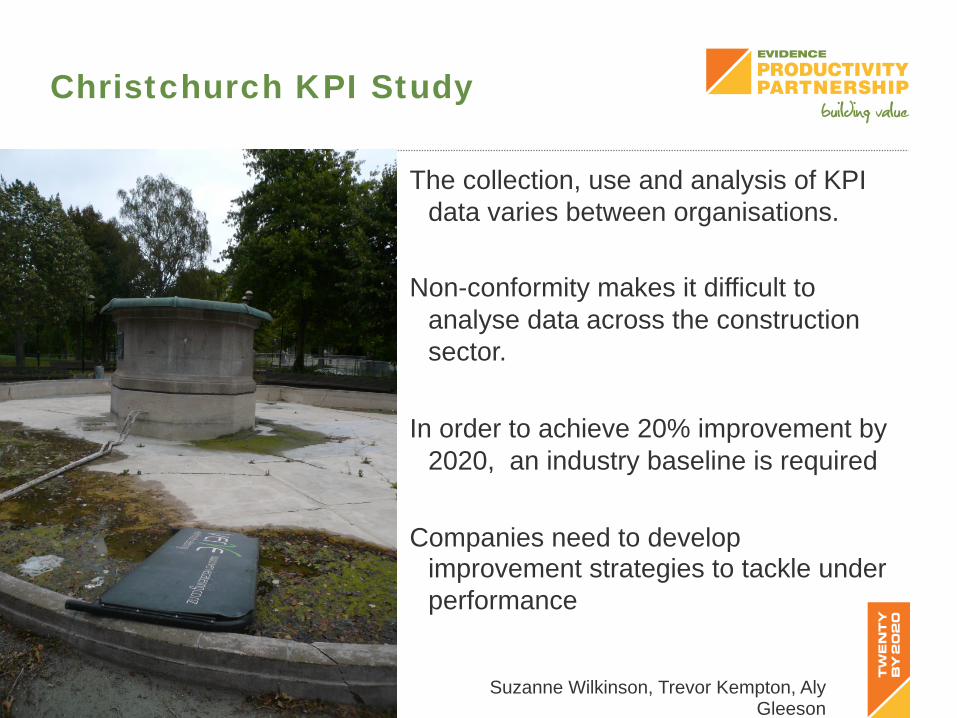
Christchurch KPI Study
The collection, use and analysis of KPI data varies between organisations.
Non-conformity makes it difficult to
analyse data across the construction sector.
In order to achieve 20% improvement by
2020, an industry baseline is required Companies need to develop
improvement strategies to tackle under performance
Suzanne Wilkinson, Trevor Kempton, Aly Gleeson
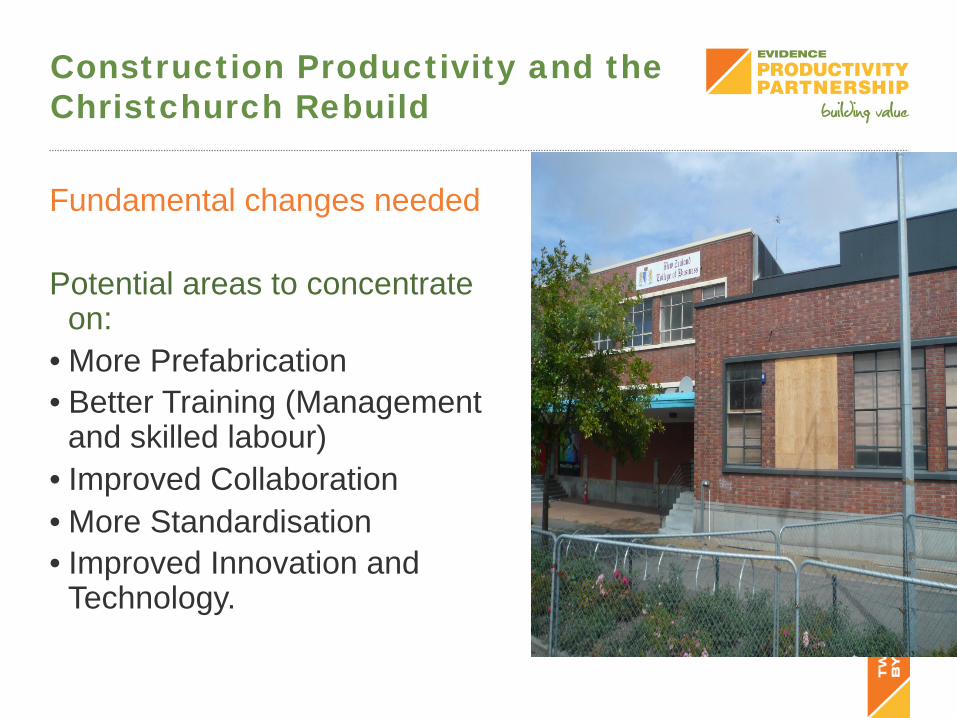
Construction Productivity and the Christchurch Rebuild
Fundamental changes needed Potential areas to concentrate
on: • More Prefabrication • Better Training (Management
and skilled labour) • Improved Collaboration • More Standardisation • Improved Innovation and
Technology.

Summary
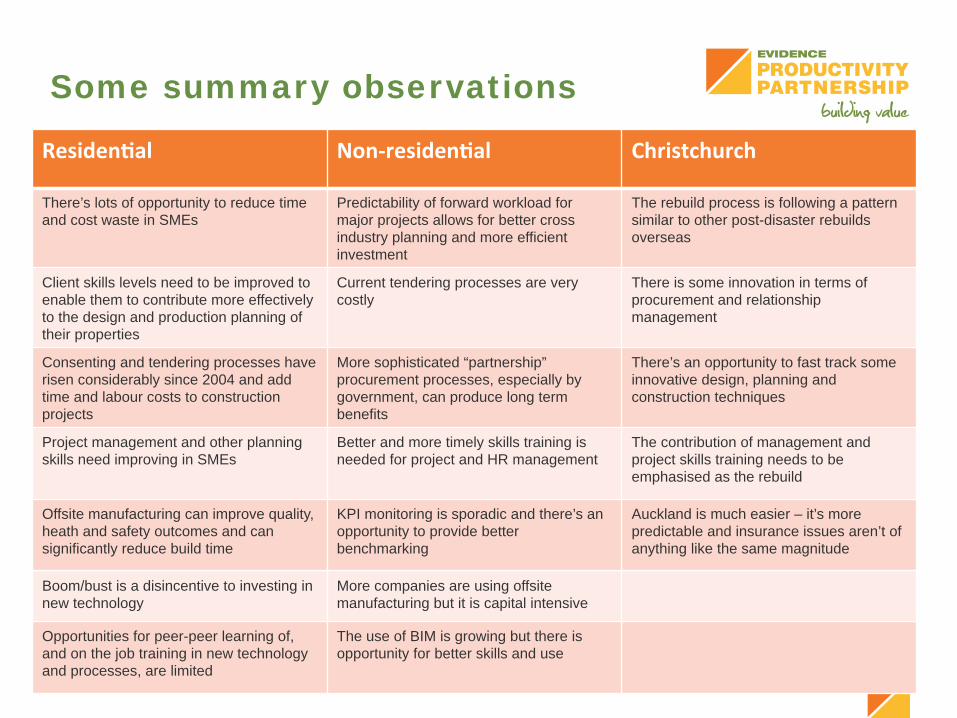
Some summary observations
Residen2al Non-‐residen2al Christchurch
There’s lots of opportunity to reduce time and cost waste in SMEs
Predictability of forward workload for major projects allows for better cross industry planning and more efficient investment
The rebuild process is following a pattern similar to other post-disaster rebuilds overseas
Client skills levels need to be improved to enable them to contribute more effectively to the design and production planning of their properties
Current tendering processes are very costly
There is some innovation in terms of procurement and relationship management
Consenting and tendering processes have risen considerably since 2004 and add time and labour costs to construction projects
More sophisticated “partnership” procurement processes, especially by government, can produce long term benefits
There’s an opportunity to fast track some innovative design, planning and construction techniques
Project management and other planning skills need improving in SMEs
Better and more timely skills training is needed for project and HR management
The contribution of management and project skills training needs to be emphasised as the rebuild
Offsite manufacturing can improve quality, heath and safety outcomes and can significantly reduce build time
KPI monitoring is sporadic and there’s an opportunity to provide better benchmarking
Auckland is much easier – it’s more predictable and insurance issues aren’t of anything like the same magnitude
Boom/bust is a disincentive to investing in new technology
More companies are using offsite manufacturing but it is capital intensive
Opportunities for peer-peer learning of, and on the job training in new technology and processes, are limited
The use of BIM is growing but there is opportunity for better skills and use
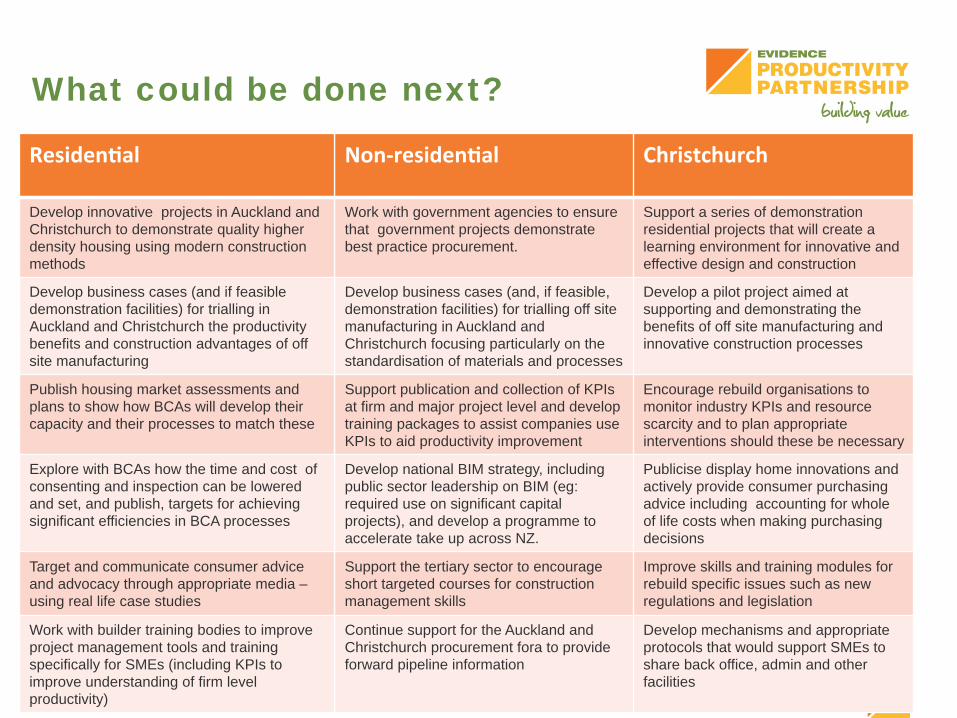
What could be done next?
Residen2al Non-‐residen2al Christchurch
Develop innovative projects in Auckland and Christchurch to demonstrate quality higher density housing using modern construction methods
Work with government agencies to ensure that government projects demonstrate best practice procurement.
Support a series of demonstration residential projects that will create a learning environment for innovative and effective design and construction
Develop business cases (and if feasible demonstration facilities) for trialling in Auckland and Christchurch the productivity benefits and construction advantages of off site manufacturing
Develop business cases (and, if feasible, demonstration facilities) for trialling off site manufacturing in Auckland and Christchurch focusing particularly on the standardisation of materials and processes
Develop a pilot project aimed at supporting and demonstrating the benefits of off site manufacturing and innovative construction processes
Publish housing market assessments and plans to show how BCAs will develop their capacity and their processes to match these
Support publication and collection of KPIs at firm and major project level and develop training packages to assist companies use KPIs to aid productivity improvement
Encourage rebuild organisations to monitor industry KPIs and resource scarcity and to plan appropriate interventions should these be necessary
Explore with BCAs how the time and cost of consenting and inspection can be lowered and set, and publish, targets for achieving significant efficiencies in BCA processes
Develop national BIM strategy, including public sector leadership on BIM (eg: required use on significant capital projects), and develop a programme to accelerate take up across NZ.
Publicise display home innovations and actively provide consumer purchasing advice including accounting for whole of life costs when making purchasing decisions
Target and communicate consumer advice and advocacy through appropriate media – using real life case studies
Support the tertiary sector to encourage short targeted courses for construction management skills
Improve skills and training modules for rebuild specific issues such as new regulations and legislation
Work with builder training bodies to improve project management tools and training specifically for SMEs (including KPIs to improve understanding of firm level productivity)
Continue support for the Auckland and Christchurch procurement fora to provide forward pipeline information
Develop mechanisms and appropriate protocols that would support SMEs to share back office, admin and other facilities
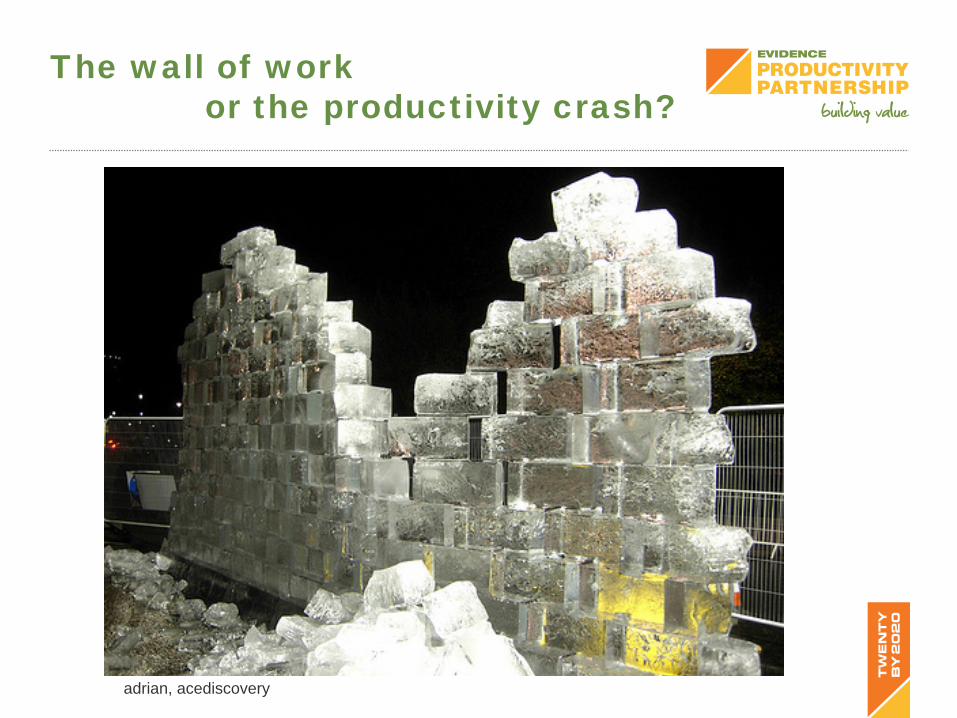
The wall of work or the productivity crash?
adrian, acediscovery

More information
All research papers and relevant summaries are available at:
www.buildingvalue.co.nz