Embed Size (px)
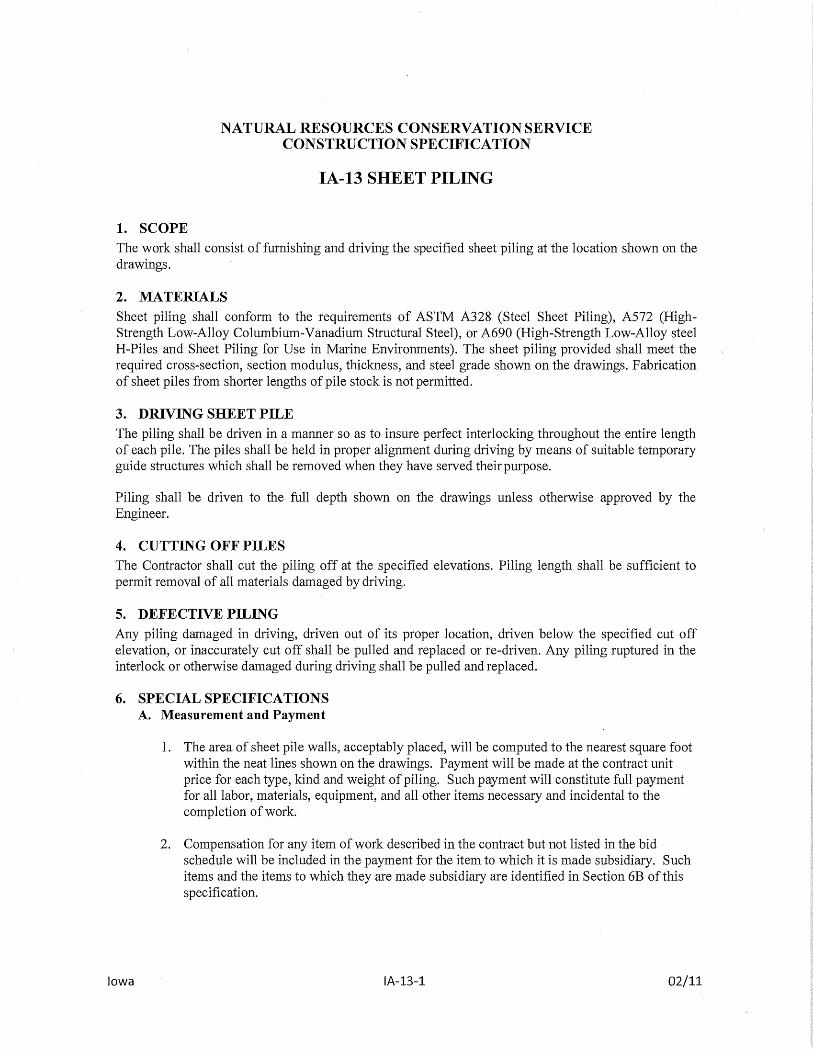
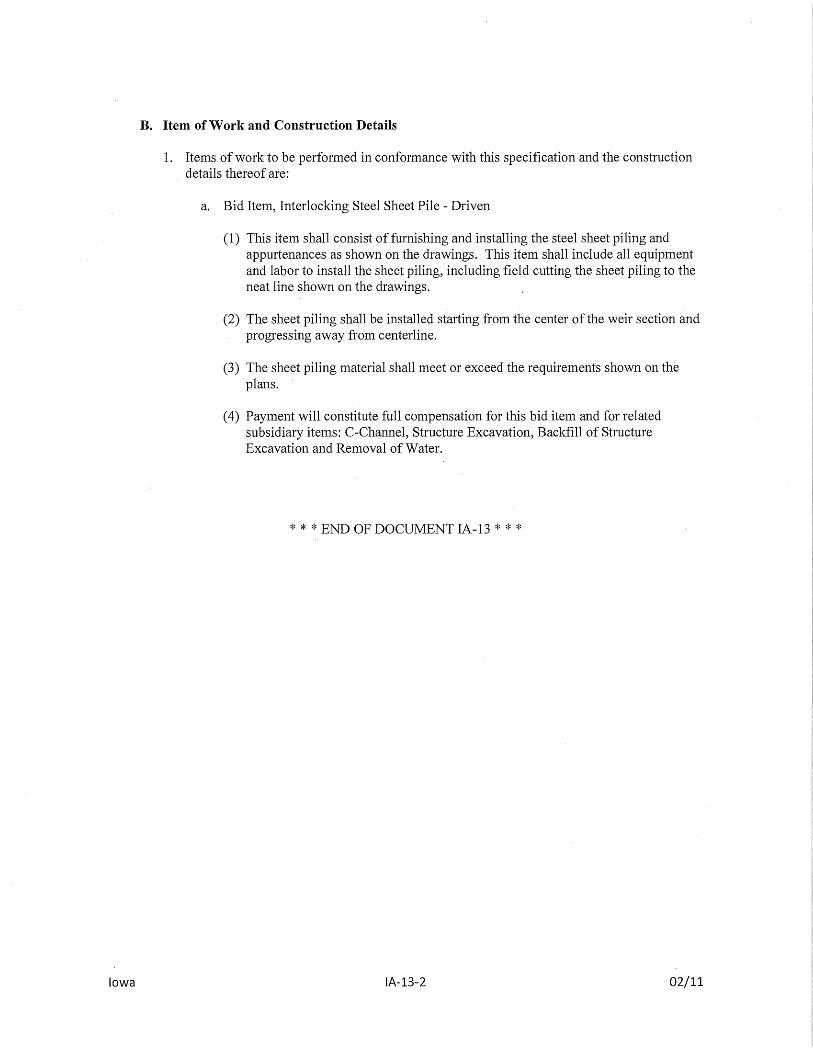
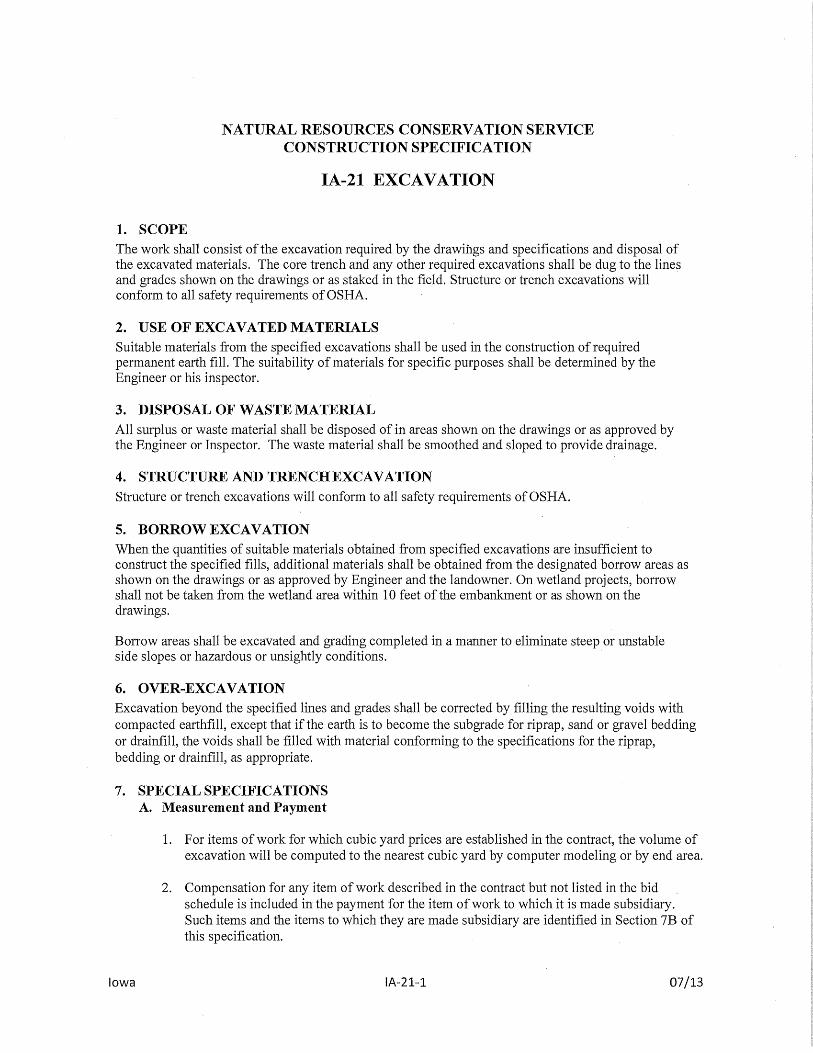
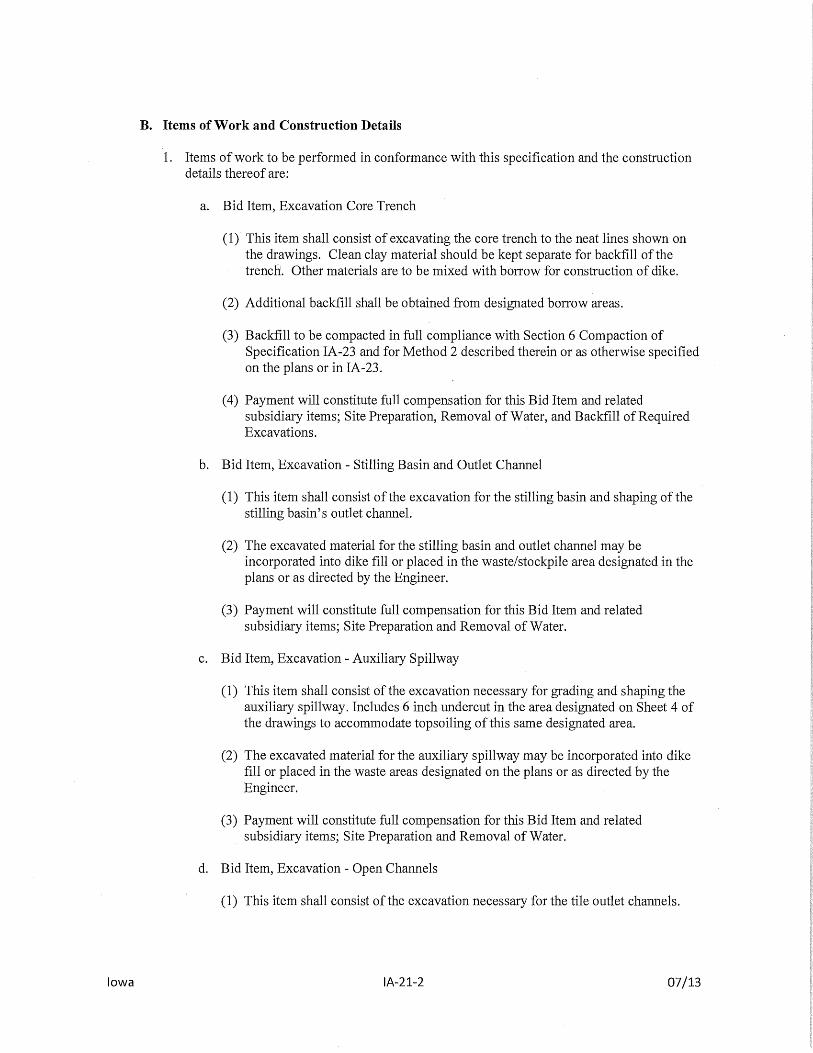
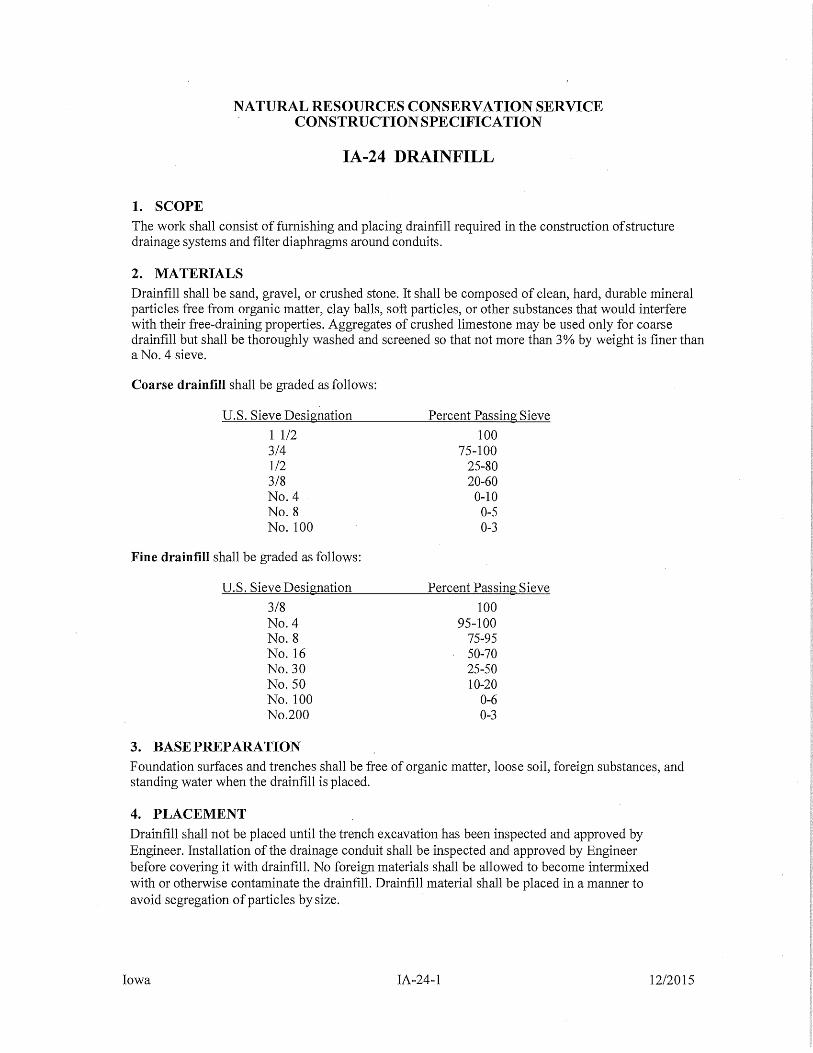
Citation preview


Owner: FROM:
IOWA DEPARTMENT OF AGRICULTURE IVAN DROESSLER, PE
AND LAND STEWARDSHIP ISG 502 EAST 9TH STREET 1725 N. LAKE AVE. DES MOINES, IOWA 50319 STORM LAKE, IOWA 50588 515-281-3857 712-732-7745
IOWA DEPARTMENT OF AGRICULTURE AND
LAND STEWARDSHIP HYDROLOGY AND HYDRAULIC DESIGN REPORT FOR BV913529C CREP WETLAND DRAINAGE DISTRICT NO. 101, BUENA VISTA COUNTY SEPTEMBER 2018 PROJECT NO. 17-21083
Table of Contents Page 1 of 1
HYDROLOGY AND HYDRAULIC DESIGN REPORT BV913529C CREP WETLAND DRAINAGE DISTRICT NO. 101 BUENA VISTA COUNTY, IOWA
TABLE OF CONTENTS
HYDROLOGY AND HYDRAULIC DESIGN REPORT
APPENDIX A – WATERSHED DRAINAGE AREA MAP
APPENDIX B – RUNOFF CURVE NUMBER
APPENDIX C – RAINFALL DATA
APPENDIX D – SEDIMENT CALCULATIONS
APPENDIX E – WEIR FLOW HYDRAULICS
APPENDIX F – XPSWMM REPORT:
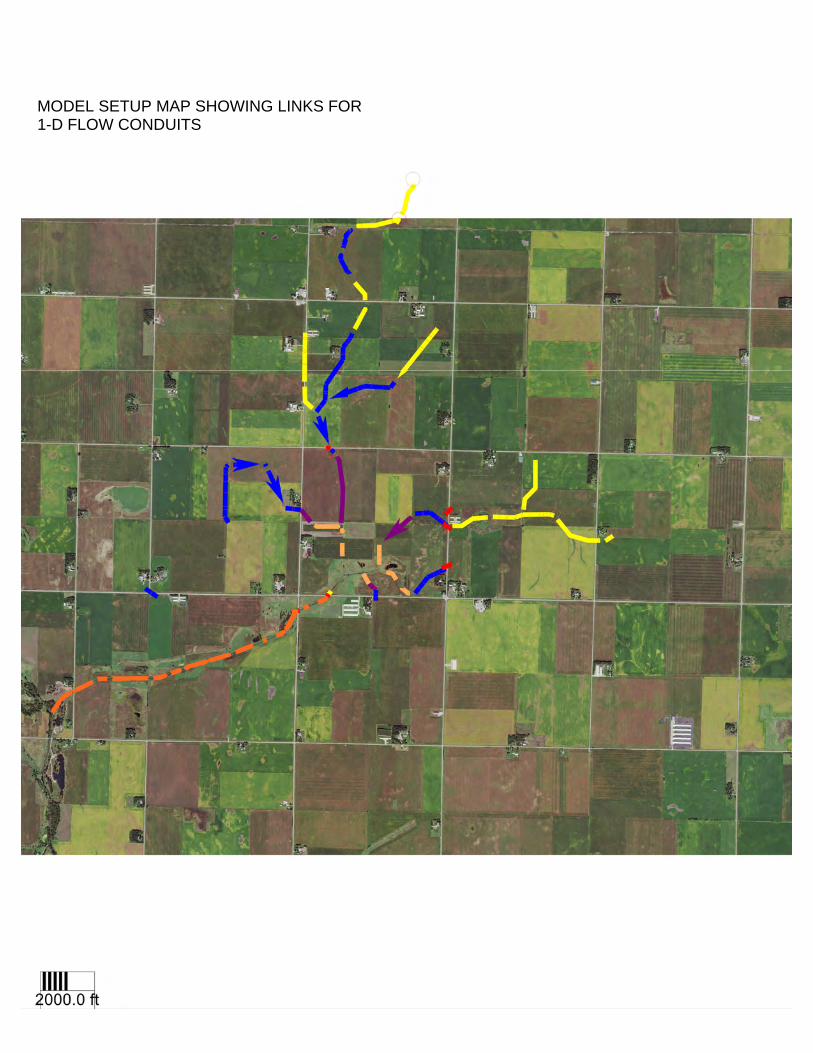
1. MODEL SETUP MAP 2. WEIR HYDROGRAPH FOR 25-, 50-, AND 100-YEAR, 24-HOUR STORMS
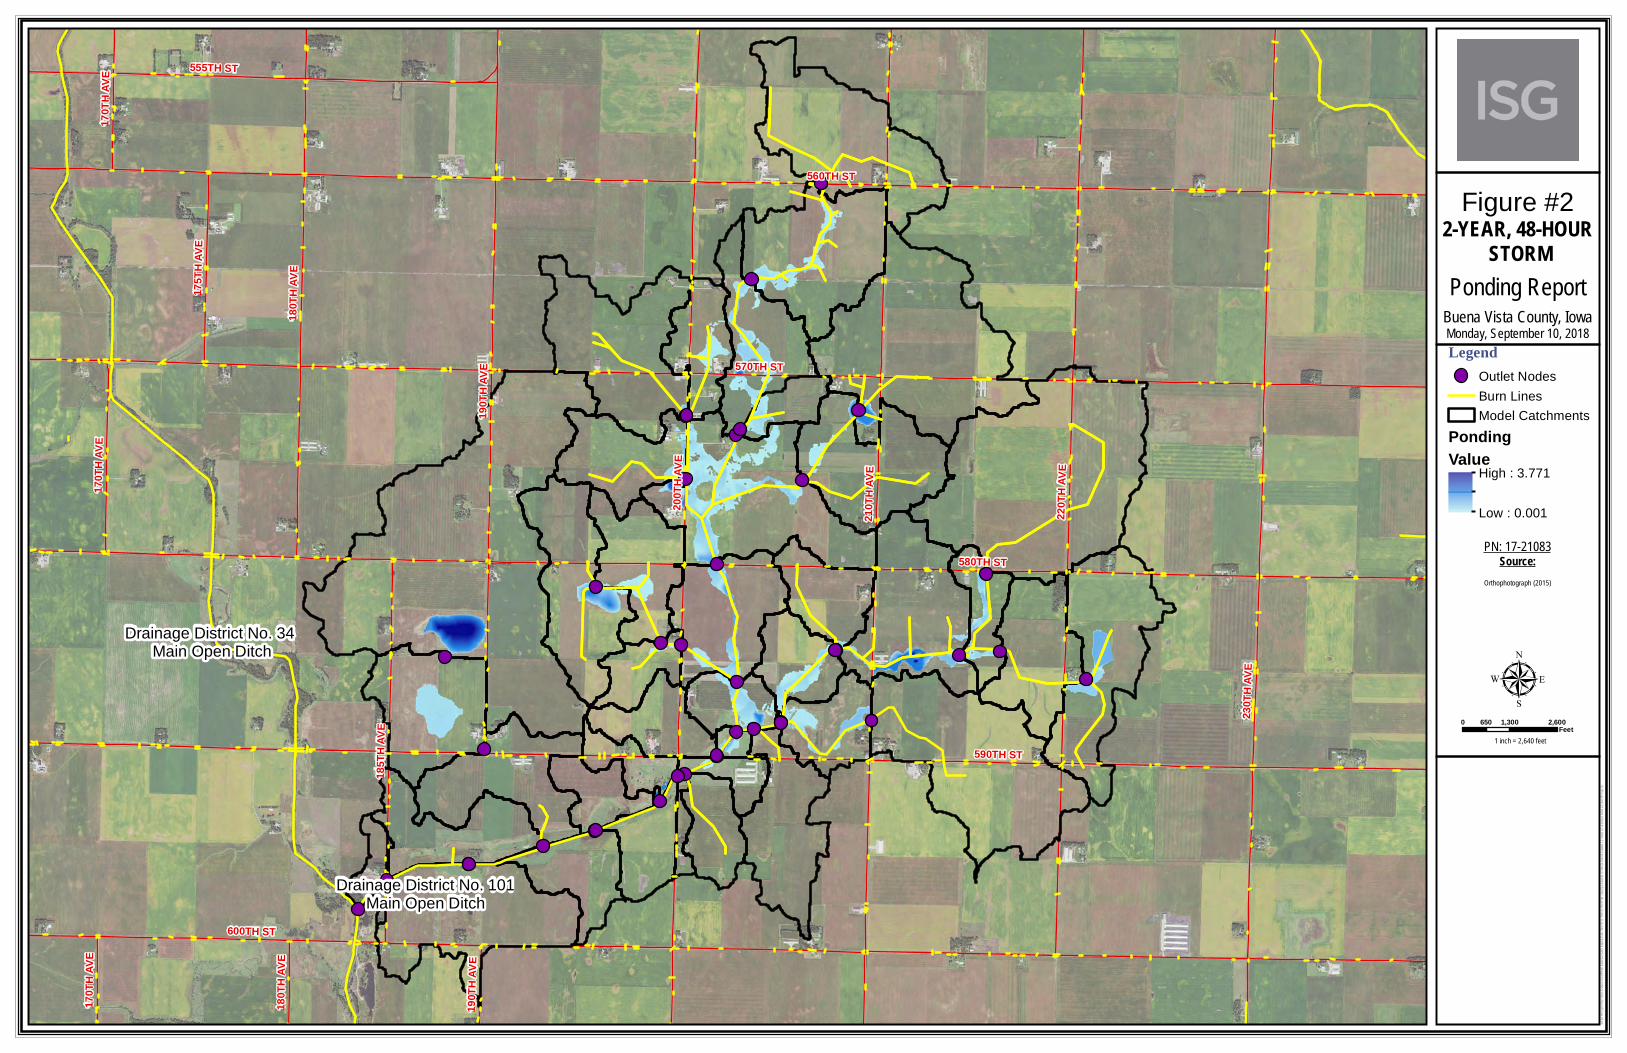
3. PONDING REPORT FOR 2-YEAR, 48-HOUR DRAINAGE STORM
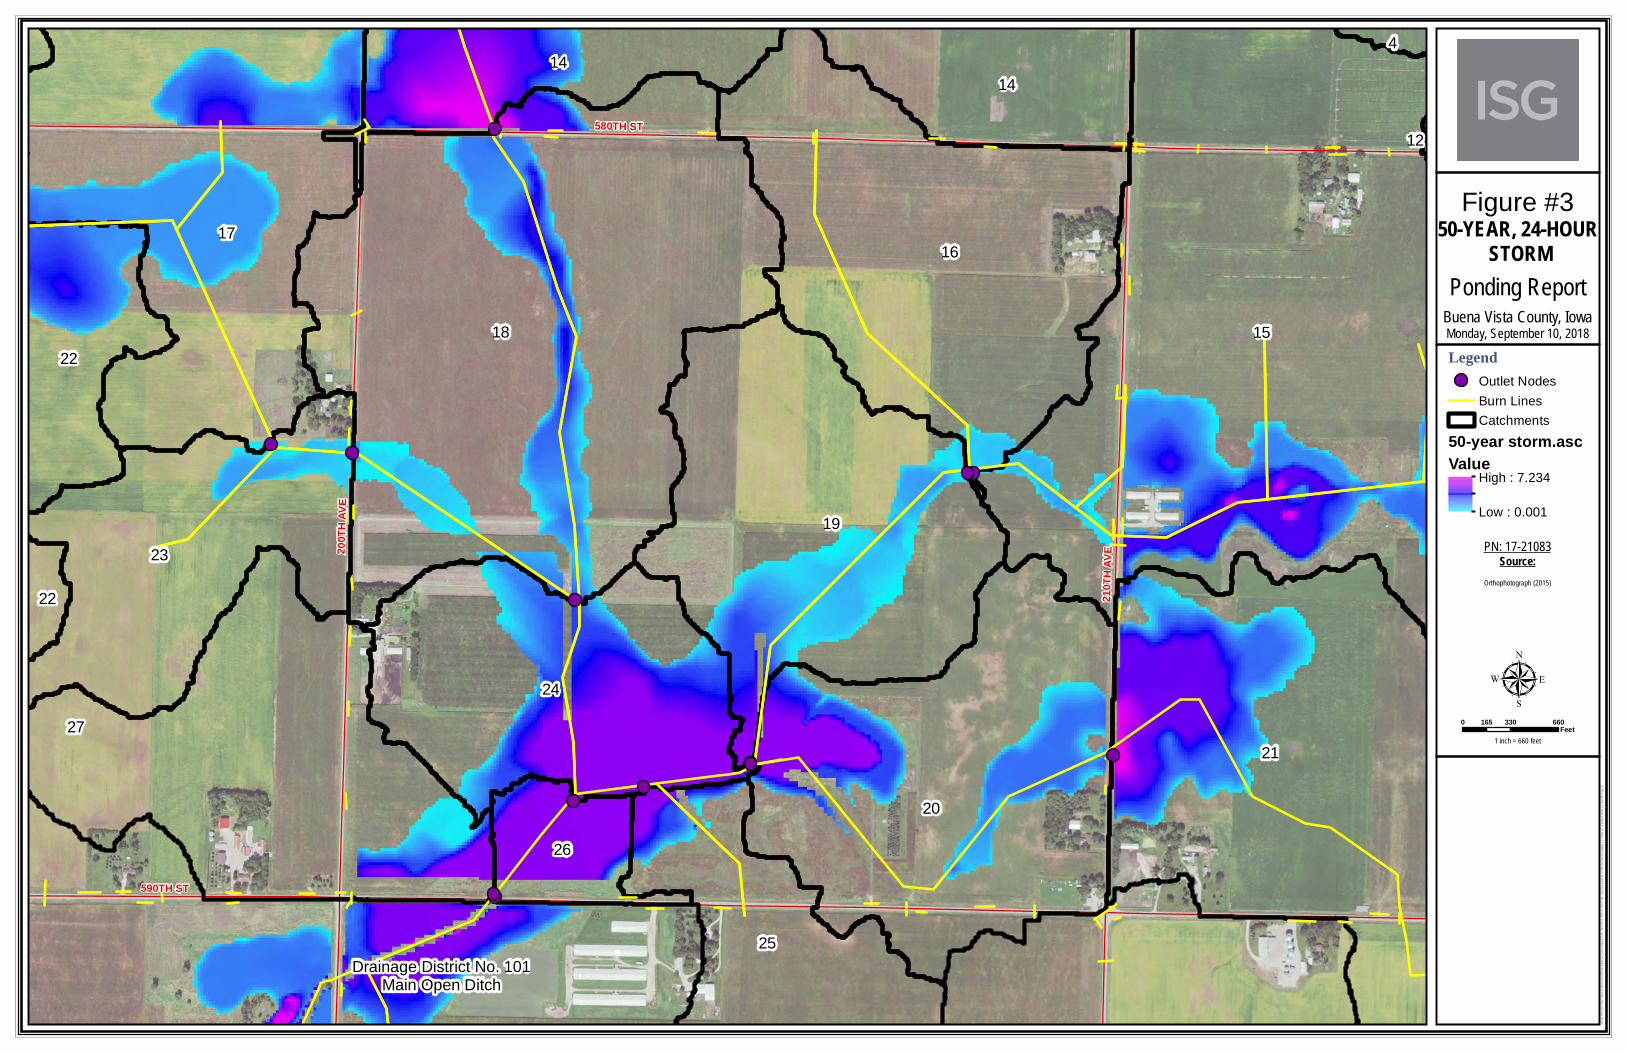
4. PONDING REPORT AT WETLAND SITE FOR 50-YEAR, 24-HOUR STORM
1725 North Lake Ave. + Storm Lake, IA 50588
712.732.7745 + www.is-grp.com
ARCHITECTURE + ENGINEERING + ENVIRONMENTAL + PLANNING
Hydrology and Hydraulic Design Report for BV913529C CREP ISG PROJECT NUMBER: 17-21083 IDALS SITE NUMBER: BV913529C SITE LOCATION: S29/T91-N/R35-W BUENA VISTA COUNTY, IOWA
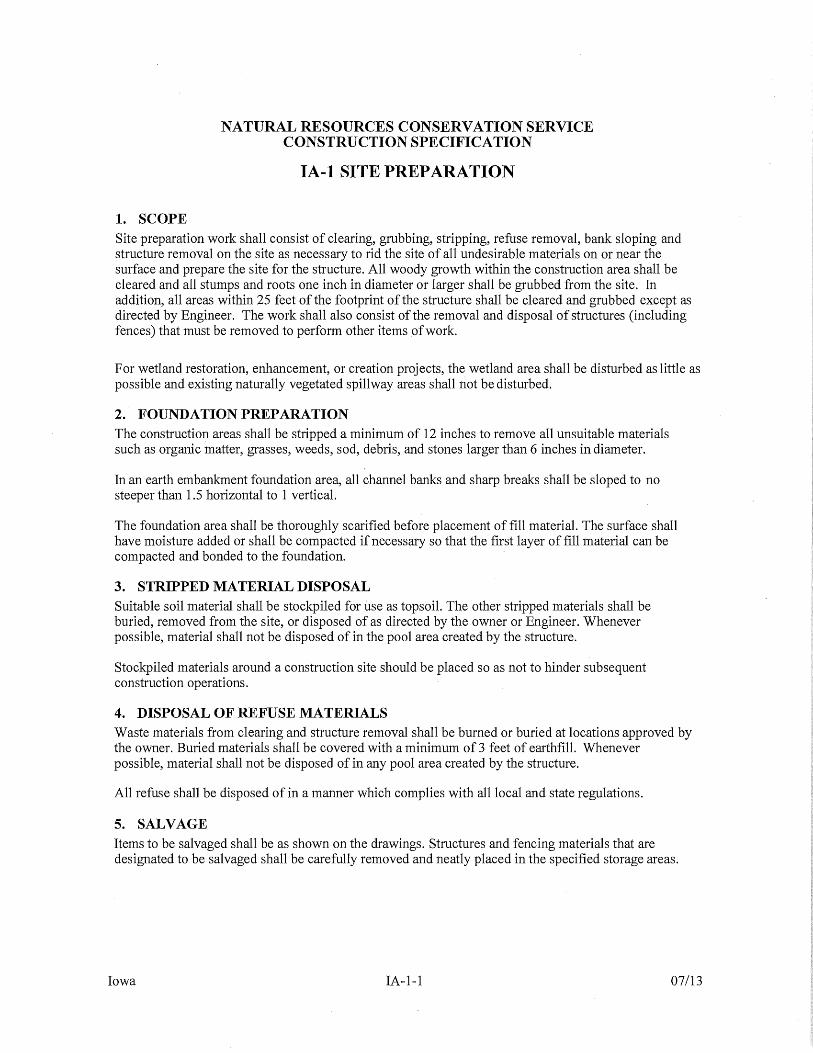
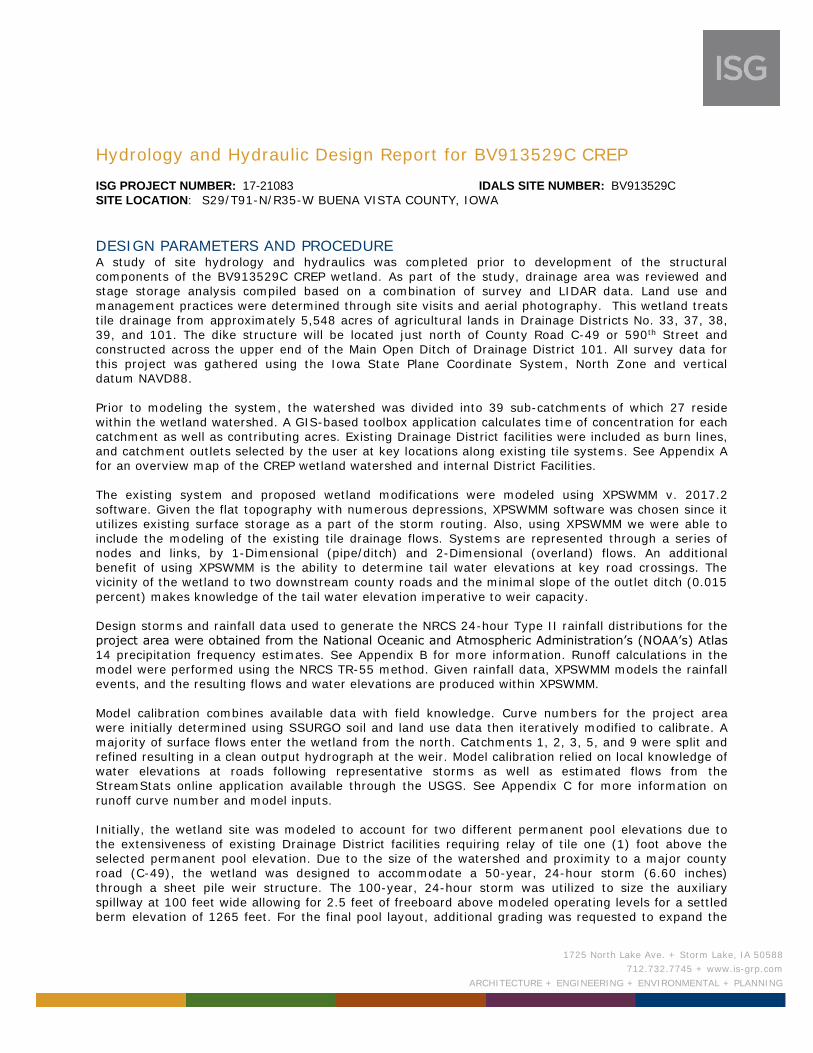
DESIGN PARAMETERS AND PROCEDURE A study of site hydrology and hydraulics was completed prior to development of the structural components of the BV913529C CREP wetland. As part of the study, drainage area was reviewed and stage storage analysis compiled based on a combination of survey and LIDAR data. Land use and
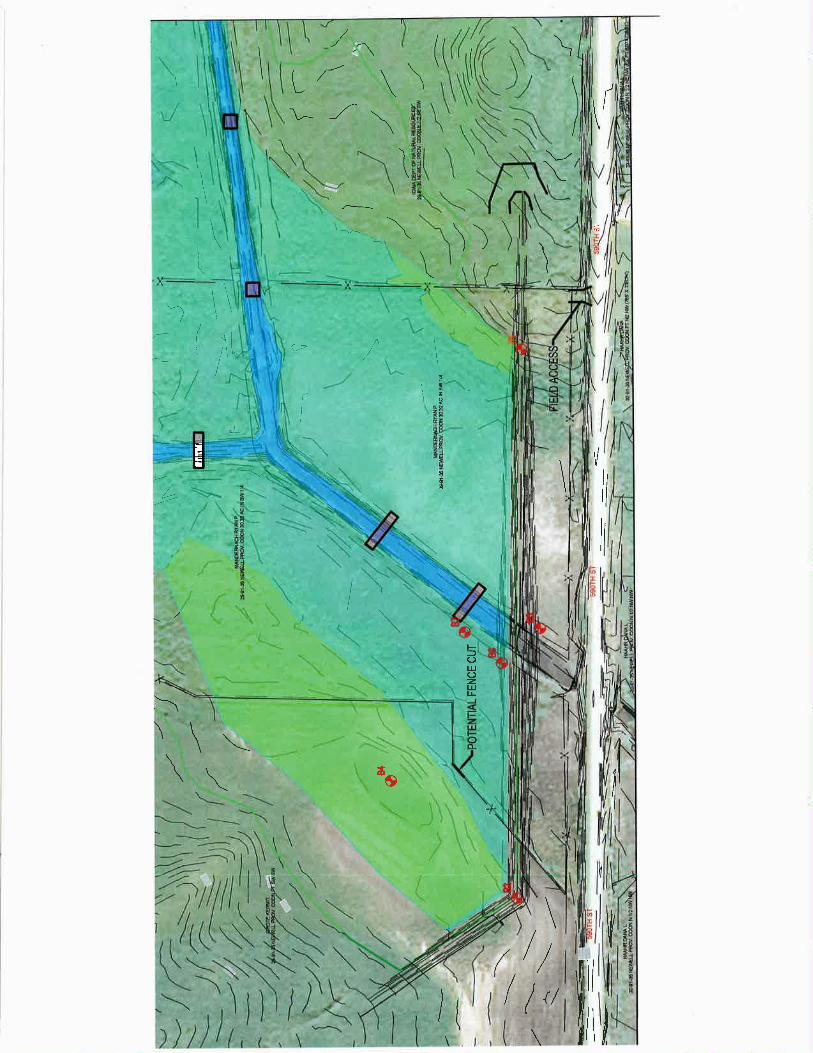
management practices were determined through site visits and aerial photography. This wetland treats tile drainage from approximately 5,548 acres of agricultural lands in Drainage Districts No. 33, 37, 38, 39, and 101. The dike structure will be located just north of County Road C-49 or 590th Street and constructed across the upper end of the Main Open Ditch of Drainage District 101. All survey data for
this project was gathered using the Iowa State Plane Coordinate System, North Zone and vertical datum NAVD88.
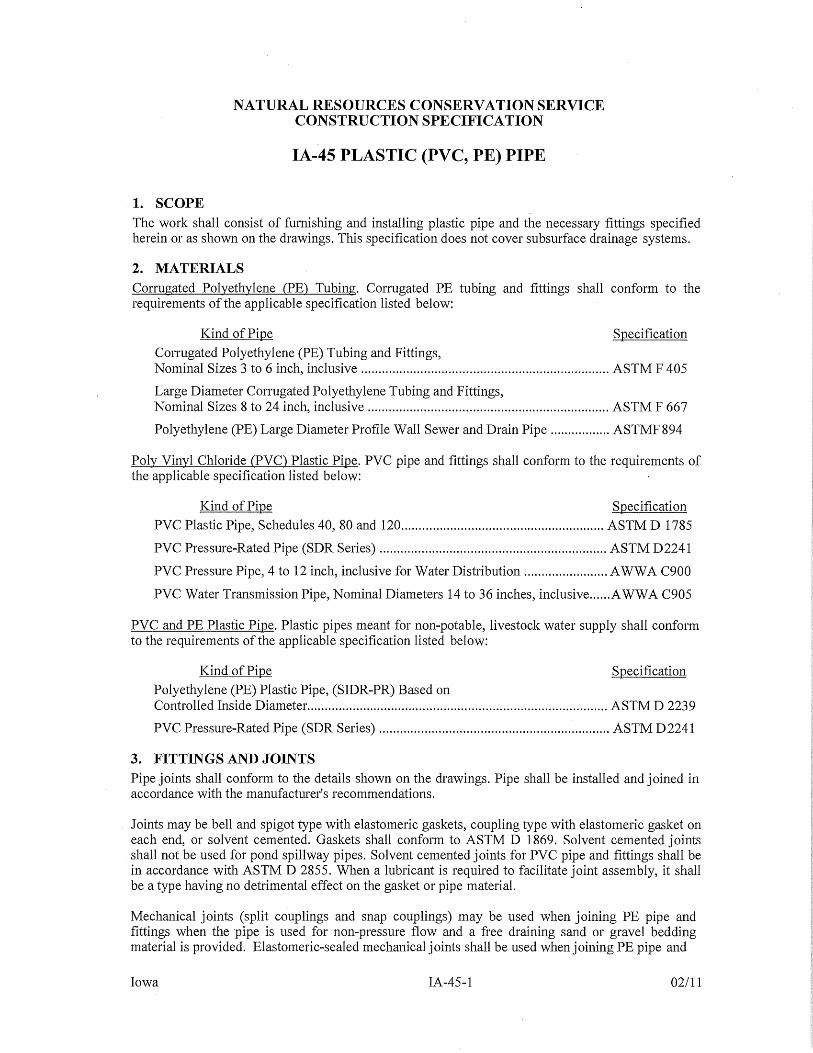
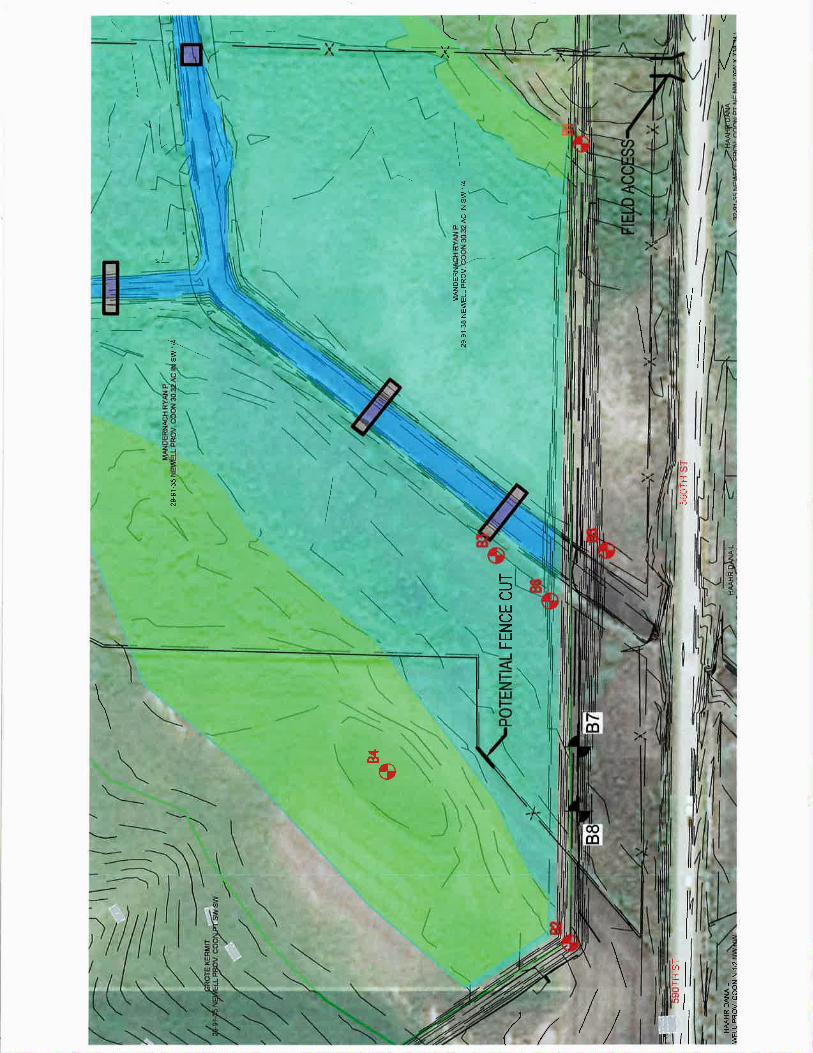
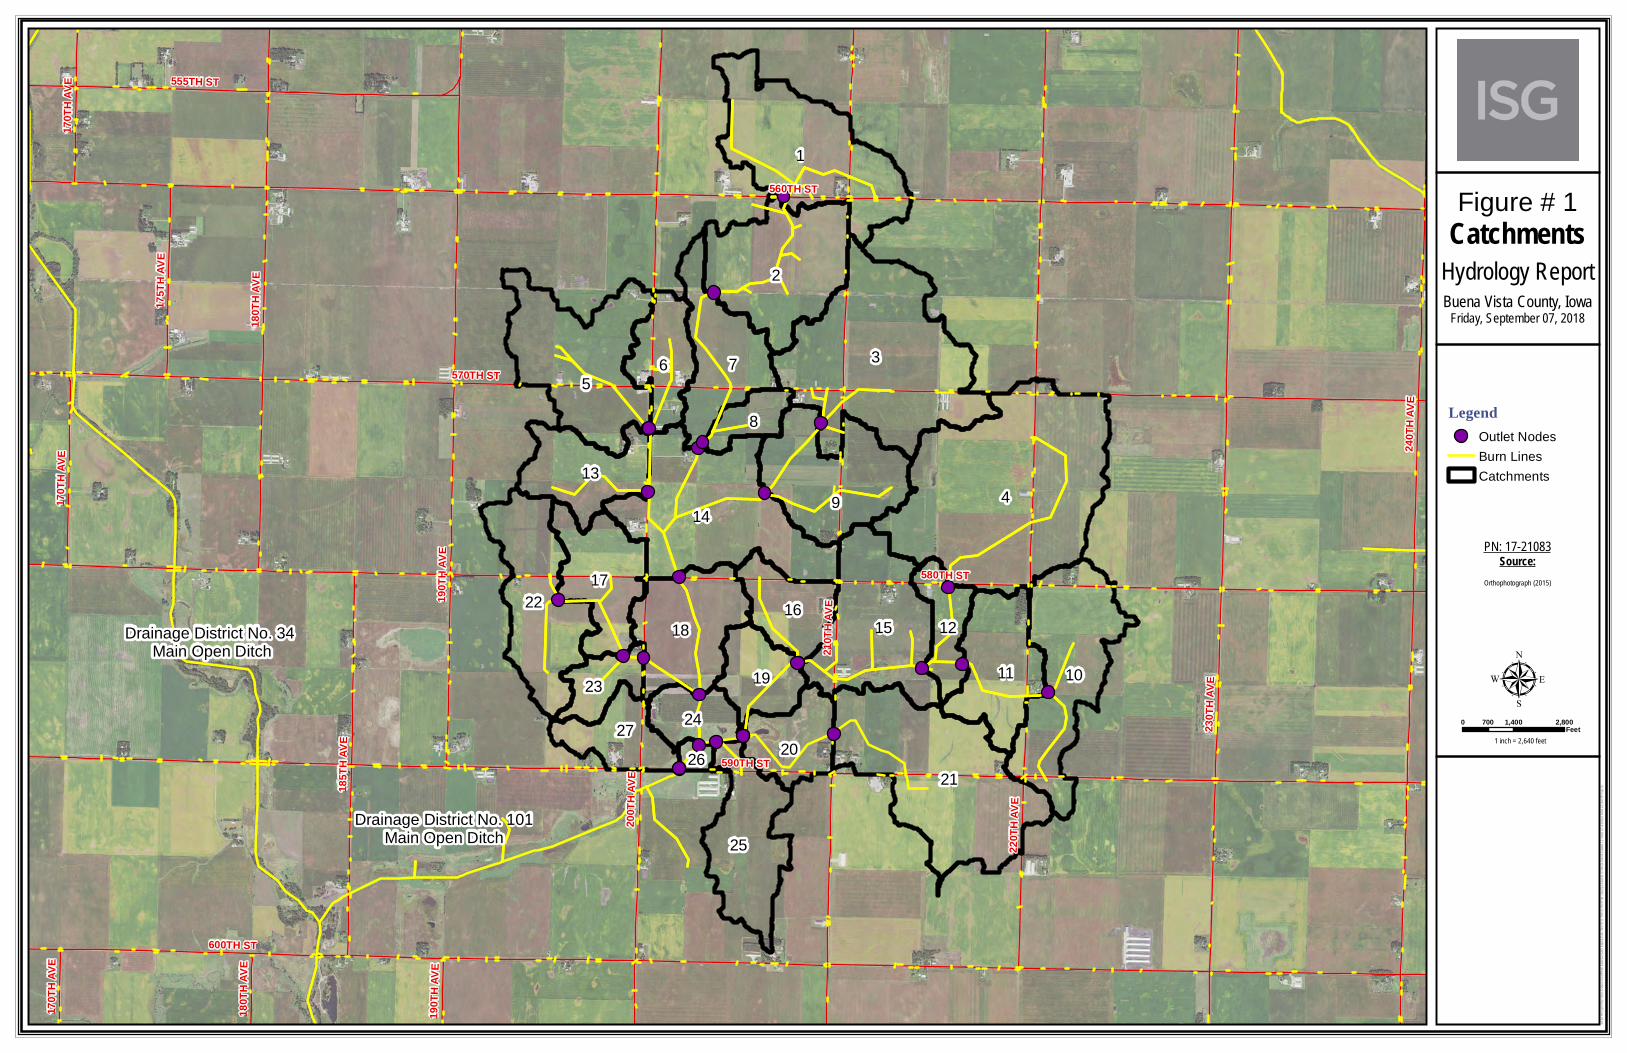
Prior to modeling the system, the watershed was divided into 39 sub-catchments of which 27 reside within the wetland watershed. A GIS-based toolbox application calculates time of concentration for each catchment as well as contributing acres. Existing Drainage District facilities were included as burn lines, and catchment outlets selected by the user at key locations along existing tile systems. See Appendix A for an overview map of the CREP wetland watershed and internal District Facilities. The existing system and proposed wetland modifications were modeled using XPSWMM v. 2017.2
software. Given the flat topography with numerous depressions, XPSWMM software was chosen since it utilizes existing surface storage as a part of the storm routing. Also, using XPSWMM we were able to include the modeling of the existing tile drainage flows. Systems are represented through a series of nodes and links, by 1-Dimensional (pipe/ditch) and 2-Dimensional (overland) flows. An additional benefit of using XPSWMM is the ability to determine tail water elevations at key road crossings. The vicinity of the wetland to two downstream county roads and the minimal slope of the outlet ditch (0.015
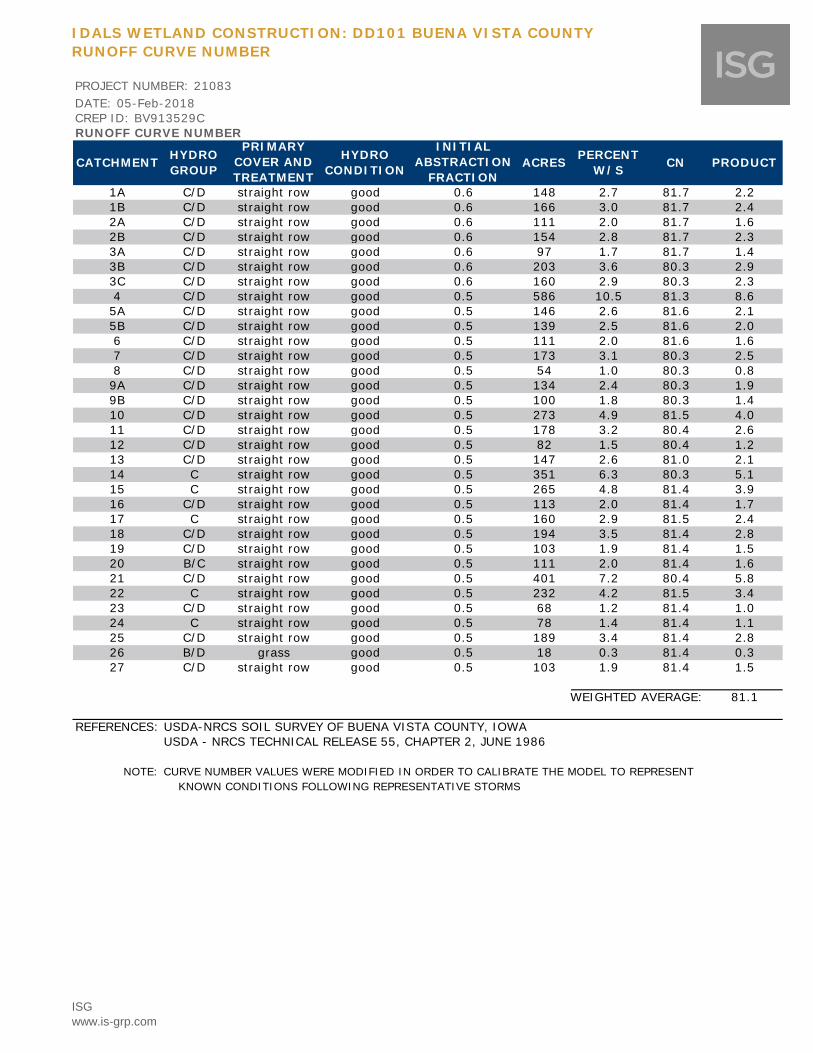
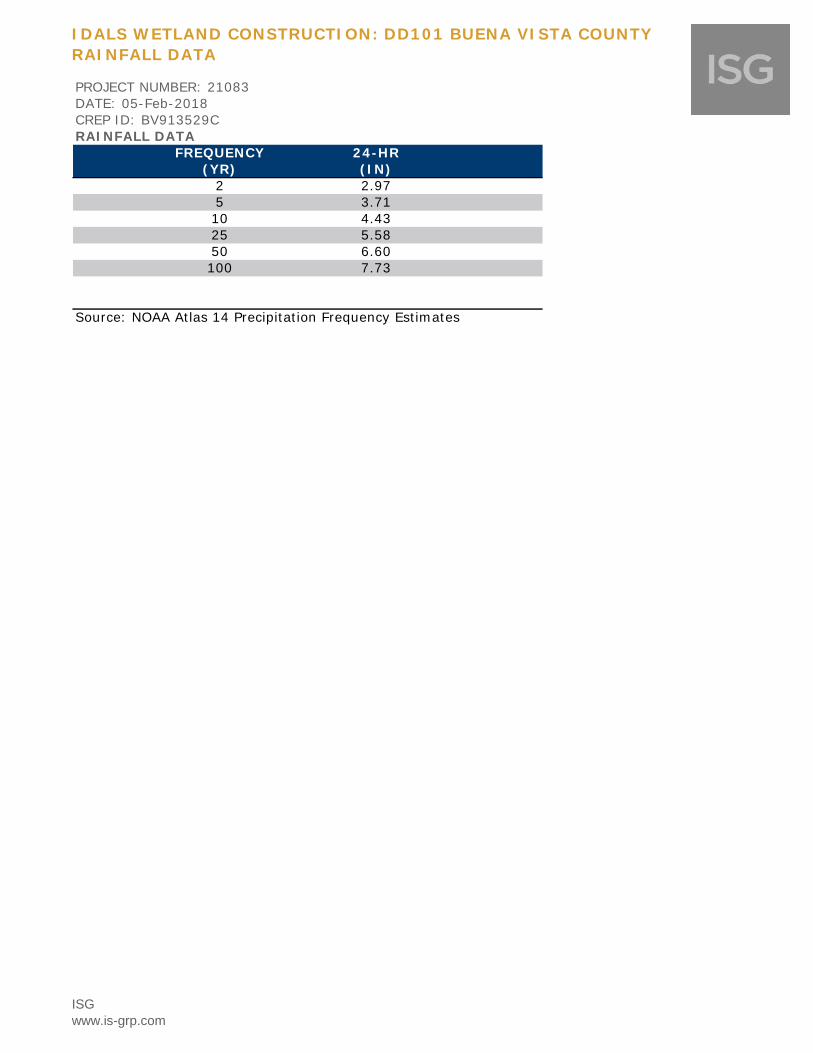
percent) makes knowledge of the tail water elevation imperative to weir capacity. Design storms and rainfall data used to generate the NRCS 24-hour Type II rainfall distributions for the project area were obtained from the National Oceanic and Atmospheric Administration’s (NOAA’s) Atlas 14 precipitation frequency estimates. See Appendix B for more information. Runoff calculations in the model were performed using the NRCS TR-55 method. Given rainfall data, XPSWMM models the rainfall events, and the resulting flows and water elevations are produced within XPSWMM.
Model calibration combines available data with field knowledge. Curve numbers for the project area were initially determined using SSURGO soil and land use data then iteratively modified to calibrate. A majority of surface flows enter the wetland from the north. Catchments 1, 2, 3, 5, and 9 were split and refined resulting in a clean output hydrograph at the weir. Model calibration relied on local knowledge of water elevations at roads following representative storms as well as estimated flows from the StreamStats online application available through the USGS. See Appendix C for more information on
runoff curve number and model inputs.
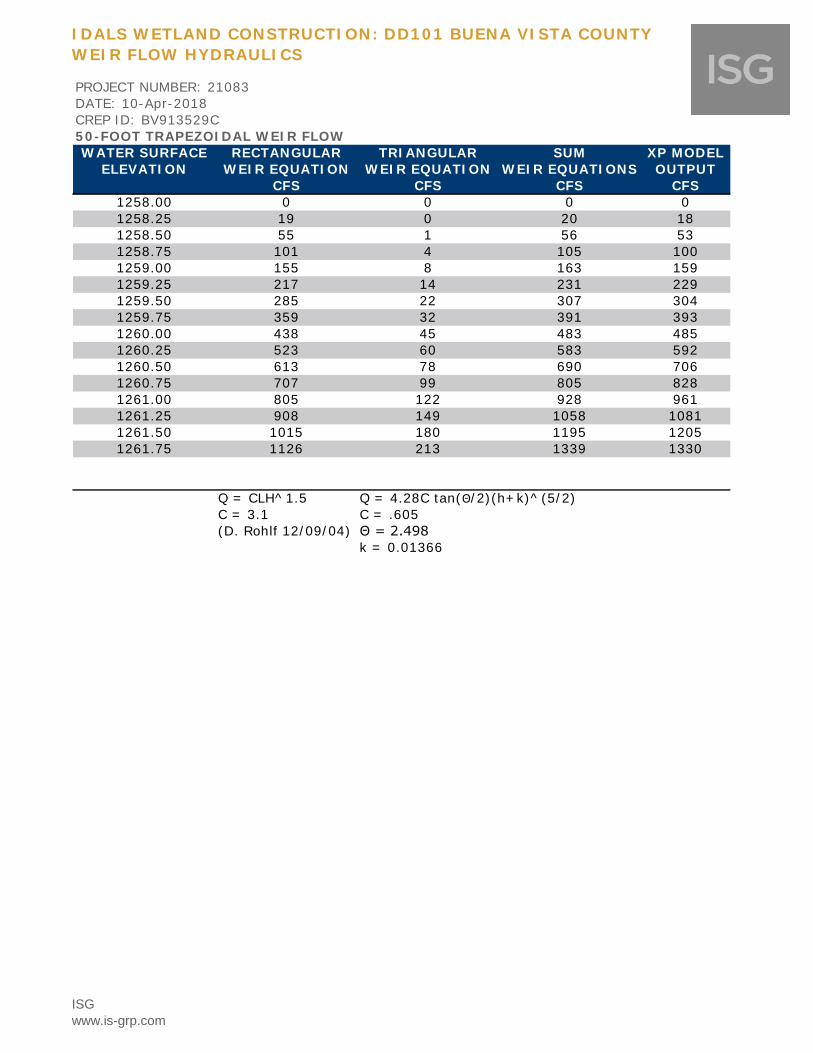
Initially, the wetland site was modeled to account for two different permanent pool elevations due to the extensiveness of existing Drainage District facilities requiring relay of tile one (1) foot above the selected permanent pool elevation. Due to the size of the watershed and proximity to a major county road (C-49), the wetland was designed to accommodate a 50-year, 24-hour storm (6.60 inches)
through a sheet pile weir structure. The 100-year, 24-hour storm was utilized to size the auxiliary spillway at 100 feet wide allowing for 2.5 feet of freeboard above modeled operating levels for a settled berm elevation of 1265 feet. For the final pool layout, additional grading was requested to expand the
Page 2 of 3
712.732.7745 + www.is-grp.com
pool area for a better ratio of wetland surface area to drainage area and to reduce lengthiness of tile outlet channels.
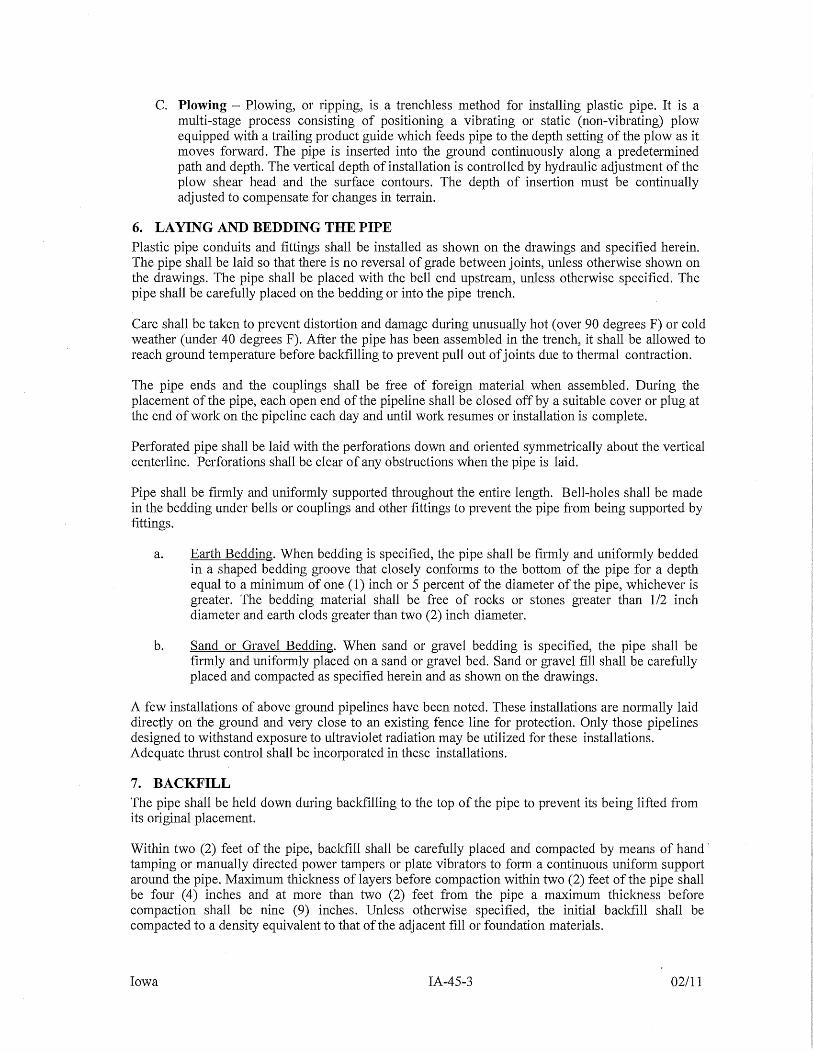
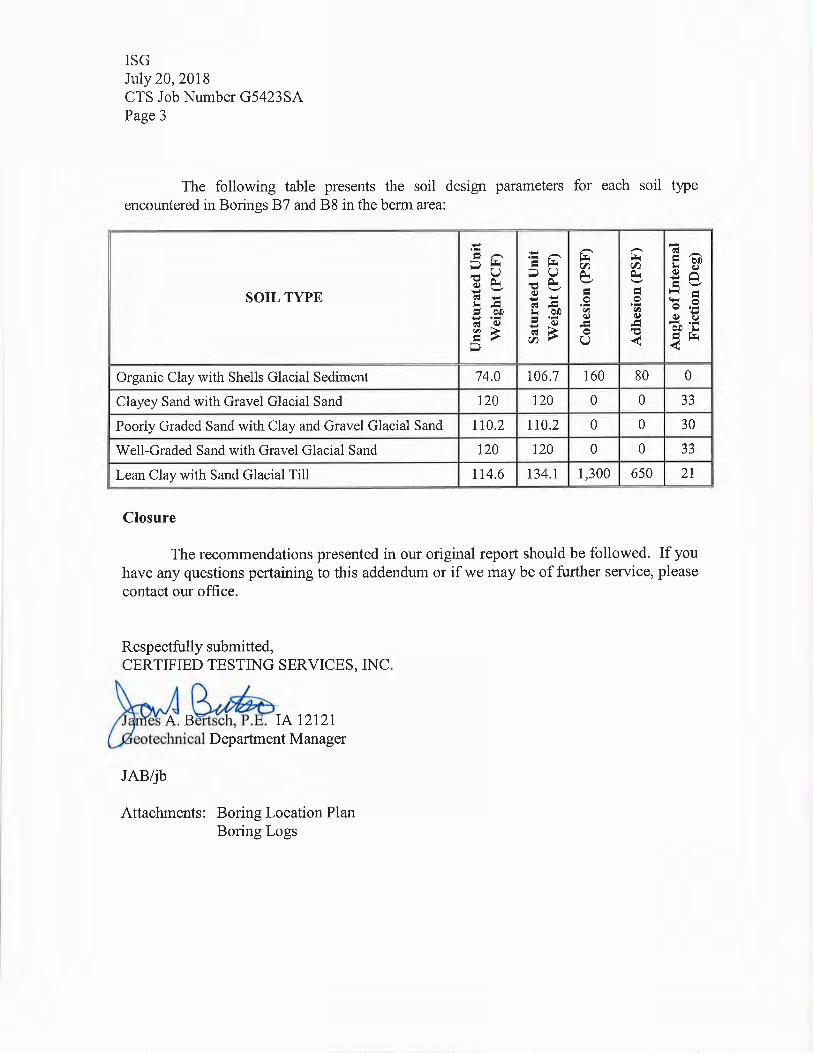
WEIR STRUCTURE DESIGN: Hydraulic Soils Group: C/D Average Runoff Curve Number: 81.1 Time of Concentration for 50-year, 24-hour storm: 18.6 hours Time of Concentration for 100-year, 24-hour storm: 18.0 hours Primary Spillway Weir Coefficient: 3.1
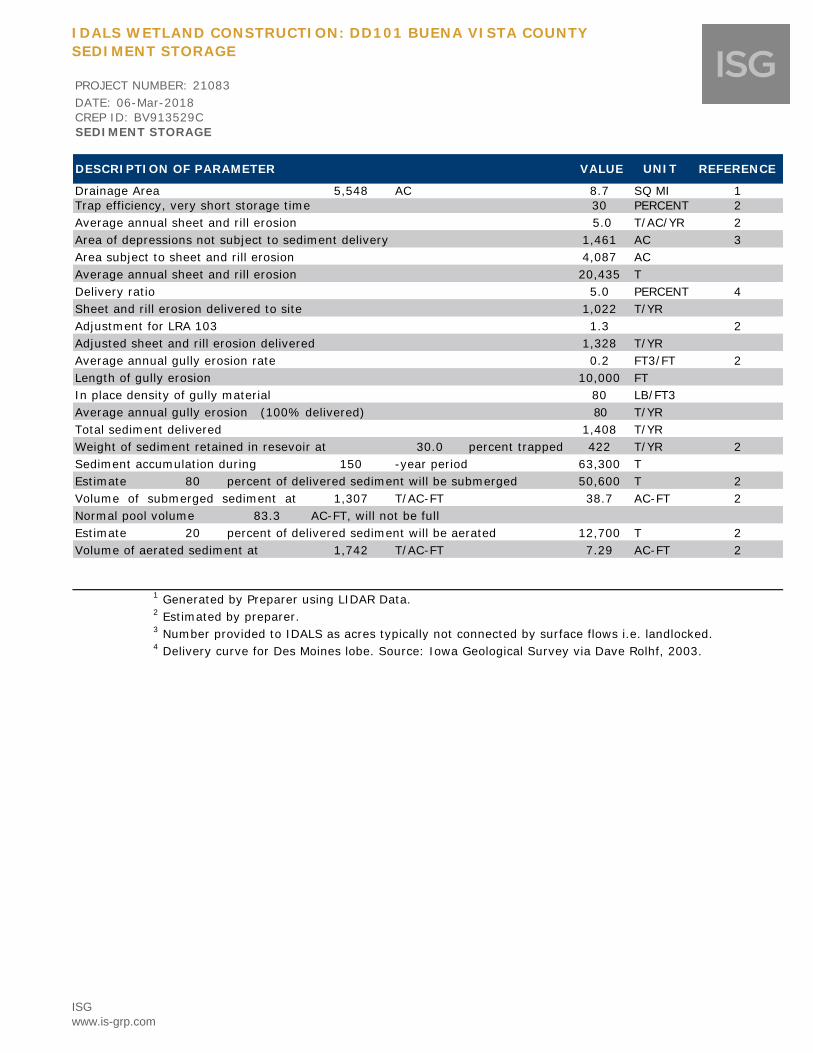
Design Life: The pool expansion as requested by IDALS results in a 122 acre-foot permanent pool for the wetland. Given the size of the pool and the estimated sediment delivery, it would take approximately 470 years for the permanent wetland pool to silt in completely, well exceeding the expected 150-year lifespan.
Weir capacity modeled in XPSWMM was verified with weir flow equation.
ADDITIONAL STRUCTURE DETAILS: Sediment delivery is 5% with a trap efficiency of 30%. The normal pool will contain 80% of the delivered sediment for the 150-year design life,
reducing permanent pool storage by 38.7 acre-feet. Normal pool area is 56.5 acres; the drainage watershed is 5,548 acres or 8.7 square miles.
Start routing at elevation 1258 with a maximum pool elevation for Q100 at 1262.5 feet. See Appendix D for sediment storage calculations.
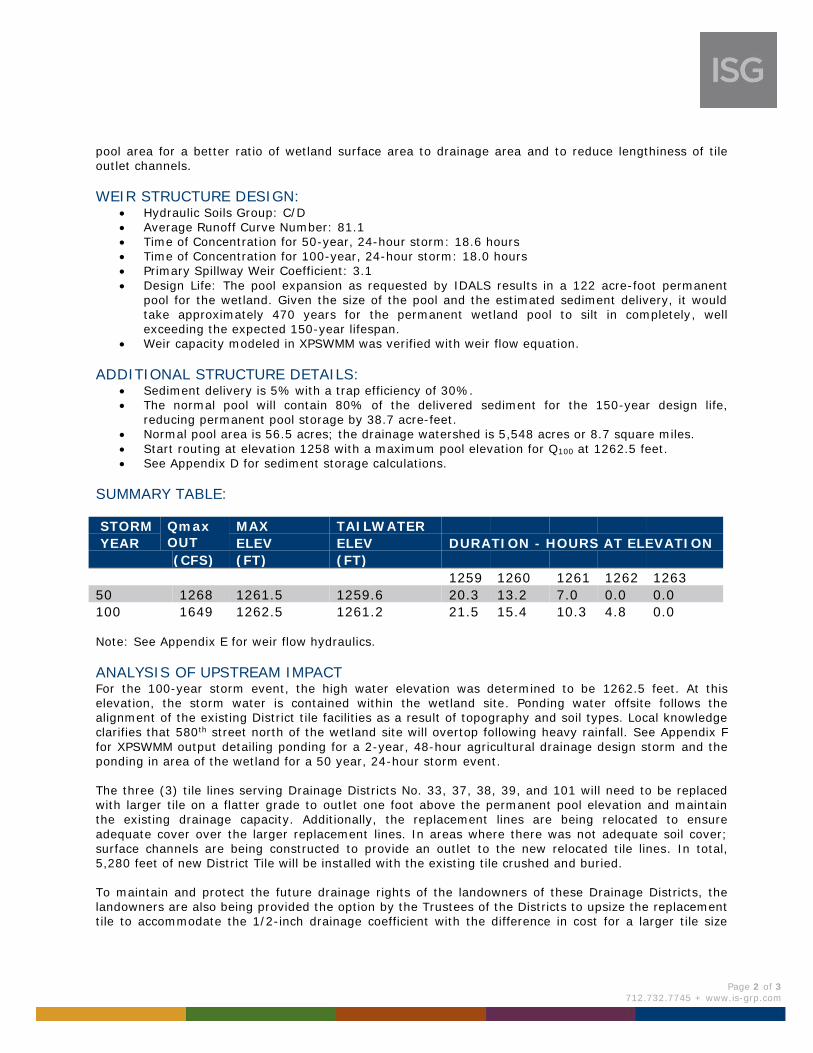
SUMMARY TABLE:
STORM Qmax
OUT
MAX TAILWATER
YEAR ELEV ELEV DURATION - HOURS AT ELEVATION
(CFS) (FT) (FT)
1259 1260 1261 1262 1263
50 1268 1261.5 1259.6 20.3 13.2 7.0 0.0 0.0
100 1649 1262.5 1261.2 21.5 15.4 10.3 4.8 0.0 Note: See Appendix E for weir flow hydraulics.
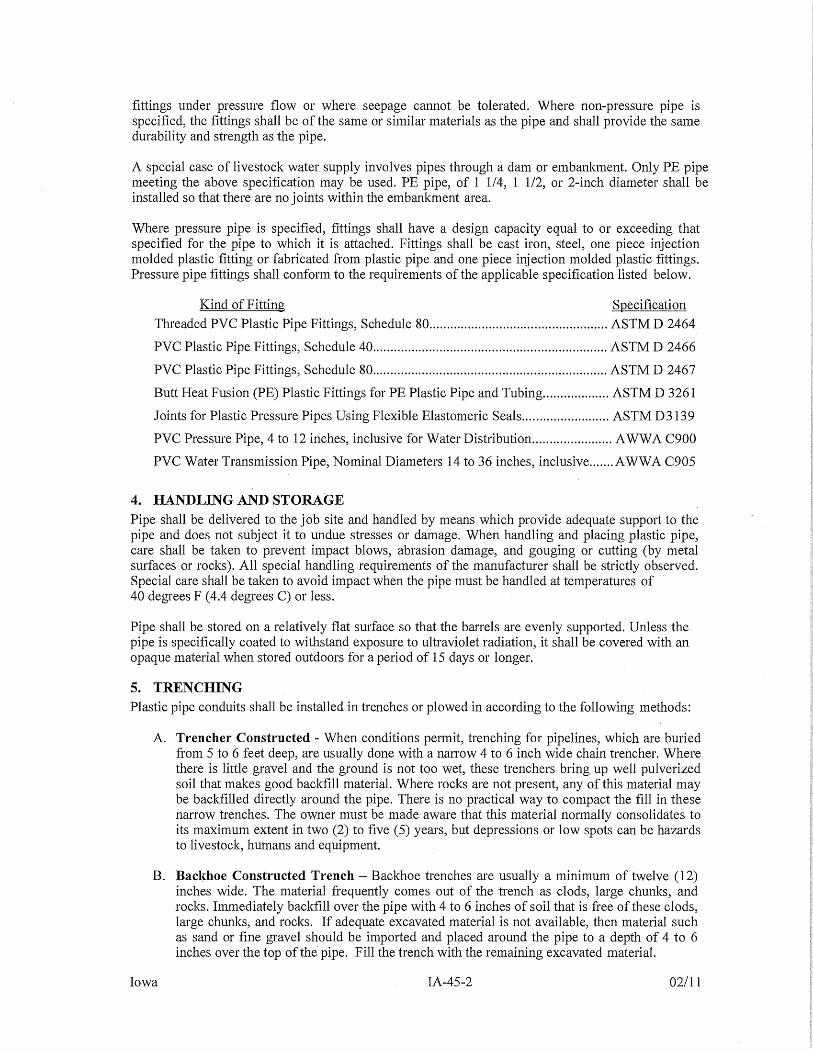
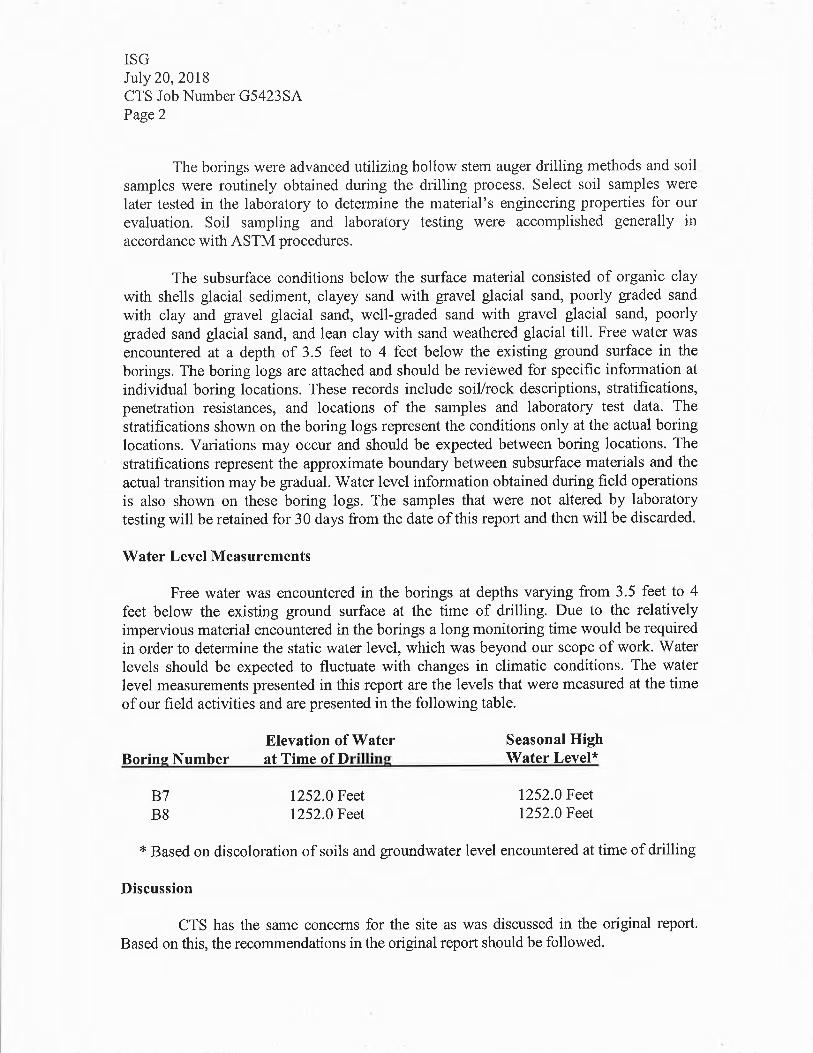
ANALYSIS OF UPSTREAM IMPACT For the 100-year storm event, the high water elevation was determined to be 1262.5 feet. At this elevation, the storm water is contained within the wetland site. Ponding water offsite follows the alignment of the existing District tile facilities as a result of topography and soil types. Local knowledge clarifies that 580th street north of the wetland site will overtop following heavy rainfall. See Appendix F
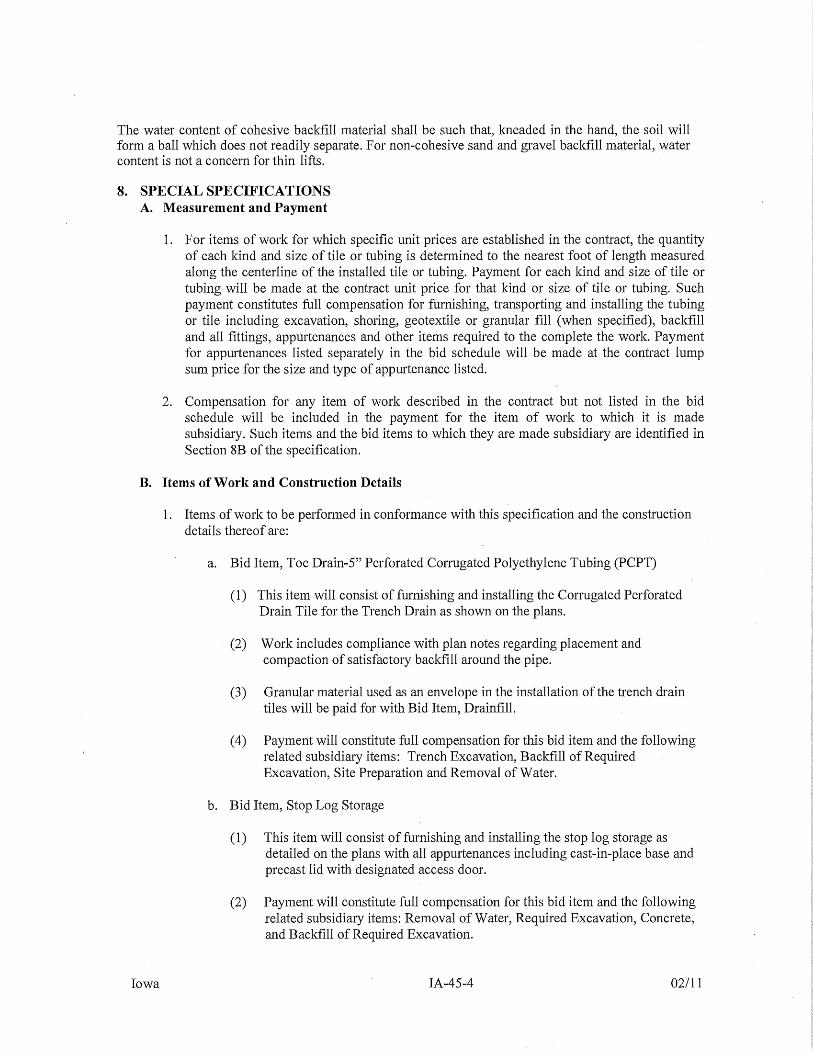
for XPSWMM output detailing ponding for a 2-year, 48-hour agricultural drainage design storm and the ponding in area of the wetland for a 50 year, 24-hour storm event. The three (3) tile lines serving Drainage Districts No. 33, 37, 38, 39, and 101 will need to be replaced with larger tile on a flatter grade to outlet one foot above the permanent pool elevation and maintain the existing drainage capacity. Additionally, the replacement lines are being relocated to ensure
adequate cover over the larger replacement lines. In areas where there was not adequate soil cover; surface channels are being constructed to provide an outlet to the new relocated tile lines. In total, 5,280 feet of new District Tile will be installed with the existing tile crushed and buried. To maintain and protect the future drainage rights of the landowners of these Drainage Districts, the landowners are also being provided the option by the Trustees of the Districts to upsize the replacement tile to accommodate the 1/2-inch drainage coefficient with the difference in cost for a larger tile size

Page 3 of 3
712.732.7745 + www.is-grp.com
paid for by landowners benefitting from the improvement. This work will be discussed with the landowners at public hearing on September 25, 2018; if approved, the plans for the tile replacement lines will be updated to reflect the upsized tile lines.
ANALYSIS OF DOWNSTREAM CHANNEL The CREP wetland will outlet directly into the Main Open Ditch of Drainage District No. 101, just north of County Road C-49. The culvert through C-49 was recently replaced with a twin 10’x12’ box culvert to accommodate peak flows from the wetland as well as reduce the frequency of overtopping at C-49 that occurs as a result of large storms. The outlet of the wetland will be graded to the flow line of the new
culverts at approximately 1-2% grade. Typically, Buena Vista County installs culverts 0.5 feet below the existing channel grade to accommodate some sedimentation within the culverts. Model results indicate the maximum velocity through the weir to be 6 CFS for the 50-year, 24-hour design storm. Further downstream, the open ditch of DD101 traverses County Road M-53 by means of an 84-inch
diameter culvert. This culvert is under sized for the 50-year, 24-hour discharge from the planned
wetland; thereby causing backwater on the new box culvert through C-49. However, the Buena Vista County Engineer has plans to update that existing culvert in the near future. Additionally, the grade of the Main Open Ditch of DD101 downstream of the wetland is constrained by the outlet elevation at the North Raccoon River; with the existing design grade of the channel being 0.015%. Drainage District No. 101 has approved a cleanout project for this open ditch facility with the work to be performed in 2019. This work is being performed to remove sediment buildup in the channel
and to maintain a uniform cross-section for maximum drainage carrying capacity. Due to the flat grade of the channel, there is no need for grade stabilization measures downstream of the wetland outlet.
4
3
1
5
2
21
914
7
10
15
22
18
25
11
6
17
13
16
20
19
27
8
12
24
23
26
560TH ST
570TH ST
580TH ST
600TH ST
590TH ST
230T
H AV
E
210T
H AV
E
200T
H AV
E
220T
H AV
E
240T
H AV
E
190T
H AV
E
180T
H AV
E
555TH ST
185T
H AV
E
170T
H AV
E
175T
H AV
E
180T
H AV
E
170T
H AV
E
190T
H AV
E
170T
H AV
E
S:\P
roje
cts
\21
00
0 P
RO
J\2
10
00-2
109
9\2
10
83 ID
ALS
BV
91
352
9C
-Bu
ena
Vis
ta C
ou
nty
IA\2
10
83 G
IS\2
10
83
Ma
pD
ocs\S
torm
Su
rface
Flo
w.m
xd
1 inch = 2,640 feet
LegendOutlet Nodes
Burn Lines
Catchments
0 1,400 2,800700Feet
µ
Orthophotograph (2015)
PN: 17-21083Source:
Figure # 1
CatchmentsHydrology ReportBuena Vista County, Iowa
Friday, September 07, 2018
Drainage District No. 34 Main Open Ditch
Drainage District No. 101Main Open Ditch
IDALS WETLAND CONSTRUCTION: DD101 BUENA VISTA COUNTY
RUNOFF CURVE NUMBER
PROJECT NUMBER: 21083
DATE: 05-Feb-2018
CREP ID: BV913529C
RUNOFF CURVE NUMBER
1A C/D straight row good 0.6 148 2.7 81.7 2.2
1B C/D straight row good 0.6 166 3.0 81.7 2.4
2A C/D straight row good 0.6 111 2.0 81.7 1.6
2B C/D straight row good 0.6 154 2.8 81.7 2.3
3A C/D straight row good 0.6 97 1.7 81.7 1.4
3B C/D straight row good 0.6 203 3.6 80.3 2.9
3C C/D straight row good 0.6 160 2.9 80.3 2.3
4 C/D straight row good 0.5 586 10.5 81.3 8.6
5A C/D straight row good 0.5 146 2.6 81.6 2.1
5B C/D straight row good 0.5 139 2.5 81.6 2.0
6 C/D straight row good 0.5 111 2.0 81.6 1.6
7 C/D straight row good 0.5 173 3.1 80.3 2.5
8 C/D straight row good 0.5 54 1.0 80.3 0.8
9A C/D straight row good 0.5 134 2.4 80.3 1.9
9B C/D straight row good 0.5 100 1.8 80.3 1.4
10 C/D straight row good 0.5 273 4.9 81.5 4.0
11 C/D straight row good 0.5 178 3.2 80.4 2.6
12 C/D straight row good 0.5 82 1.5 80.4 1.2
13 C/D straight row good 0.5 147 2.6 81.0 2.1
14 C straight row good 0.5 351 6.3 80.3 5.1
15 C straight row good 0.5 265 4.8 81.4 3.9
16 C/D straight row good 0.5 113 2.0 81.4 1.7
17 C straight row good 0.5 160 2.9 81.5 2.4
18 C/D straight row good 0.5 194 3.5 81.4 2.8
19 C/D straight row good 0.5 103 1.9 81.4 1.5
20 B/C straight row good 0.5 111 2.0 81.4 1.6
21 C/D straight row good 0.5 401 7.2 80.4 5.8
22 C straight row good 0.5 232 4.2 81.5 3.4
23 C/D straight row good 0.5 68 1.2 81.4 1.0
24 C straight row good 0.5 78 1.4 81.4 1.1
25 C/D straight row good 0.5 189 3.4 81.4 2.8
26 B/D grass good 0.5 18 0.3 81.4 0.3
27 C/D straight row good 0.5 103 1.9 81.4 1.5
WEIGHTED AVERAGE: 81.1
REFERENCES: USDA-NRCS SOIL SURVEY OF BUENA VISTA COUNTY, IOWA
USDA - NRCS TECHNICAL RELEASE 55, CHAPTER 2, JUNE 1986
NOTE: CURVE NUMBER VALUES WERE MODIFIED IN ORDER TO CALIBRATE THE MODEL TO REPRESENT
KNOWN CONDITIONS FOLLOWING REPRESENTATIVE STORMS
CATCHMENT
PRIMARY
COVER AND
TREATMENT
HYDRO
CONDITION
INITIAL
ABSTRACTION
FRACTION
ACRESPERCENT
W/SCN PRODUCT
HYDRO
GROUP
ISG
www.is-grp.com
IDALS WETLAND CONSTRUCTION: DD101 BUENA VISTA COUNTY
RAINFALL DATA
PROJECT NUMBER: 21083
DATE: 05-Feb-2018
CREP ID: BV913529C
RAINFALL DATA
FREQUENCY 24-HR
(YR) (IN)
2 2.97
5 3.71
10 4.43
25 5.58
50 6.60
100 7.73
Source: NOAA Atlas 14 Precipitation Frequency Estimates
ISG
www.is-grp.com
IDALS WETLAND CONSTRUCTION: DD101 BUENA VISTA COUNTY
SEDIMENT STORAGE
PROJECT NUMBER: 21083
DATE: 06-Mar-2018
CREP ID: BV913529C
SEDIMENT STORAGE
Drainage Area 5,548 AC 8.7 SQ MI 1
Trap efficiency, very short storage time 30 PERCENT 2
Average annual sheet and rill erosion 5.0 T/AC/YR 2
Area of depressions not subject to sediment delivery 1,461 AC 3
Area subject to sheet and rill erosion 4,087 AC
Average annual sheet and rill erosion 20,435 T
Delivery ratio 5.0 PERCENT 4
Sheet and rill erosion delivered to site 1,022 T/YR
Adjustment for LRA 103 1.3 2
Adjusted sheet and rill erosion delivered 1,328 T/YR
Average annual gully erosion rate 0.2 FT3/FT 2
Length of gully erosion 10,000 FT
In place density of gully material 80 LB/FT3
Average annual gully erosion (100% delivered) 80 T/YR
Total sediment delivered 1,408 T/YR
Weight of sediment retained in resevoir at 30.0 percent trapped 422 T/YR 2
Sediment accumulation during 150 -year period 63,300 T
Estimate 80 percent of delivered sediment will be submerged 50,600 T 2
Volume of submerged sediment at 1,307 T/AC-FT 38.7 AC-FT 2
Normal pool volume 83.3 AC-FT, will not be full
Estimate 20 percent of delivered sediment will be aerated 12,700 T 2
Volume of aerated sediment at 1,742 T/AC-FT 7.29 AC-FT 2
1Generated by Preparer using LIDAR Data.
2Estimated by preparer.
3Number provided to IDALS as acres typically not connected by surface flows i.e. landlocked.
4Delivery curve for Des Moines lobe. Source: Iowa Geological Survey via Dave Rolhf, 2003.
VALUE UNIT DESCRIPTION OF PARAMETER REFERENCE
ISG
www.is-grp.com
IDALS WETLAND CONSTRUCTION: DD101 BUENA VISTA COUNTY
WEIR FLOW HYDRAULICS
PROJECT NUMBER: 21083
DATE: 10-Apr-2018
CREP ID: BV913529C
50-FOOT TRAPEZOIDAL WEIR FLOW
WATER SURFACE RECTANGULAR TRIANGULAR SUM XP MODEL
ELEVATION WEIR EQUATION WEIR EQUATION WEIR EQUATIONS OUTPUT
CFS CFS CFS CFS
1258.00 0 0 0 0
1258.25 19 0 20 18
1258.50 55 1 56 53
1258.75 101 4 105 100
1259.00 155 8 163 159
1259.25 217 14 231 229
1259.50 285 22 307 304
1259.75 359 32 391 393
1260.00 438 45 483 485
1260.25 523 60 583 592
1260.50 613 78 690 706
1260.75 707 99 805 828
1261.00 805 122 928 961
1261.25 908 149 1058 1081
1261.50 1015 180 1195 1205
1261.75 1126 213 1339 1330
Q = CLH^1.5 Q = 4.28C tan(Θ/2)(h+k)^(5/2)
C = 3.1 C = .605
(D. Rohlf 12/09/04) Θ = 2.498
k = 0.01366
ISG
www.is-grp.com
IDALS WETLAND CONSTRUCTION: DD101 BUENA VISTA COUNTY
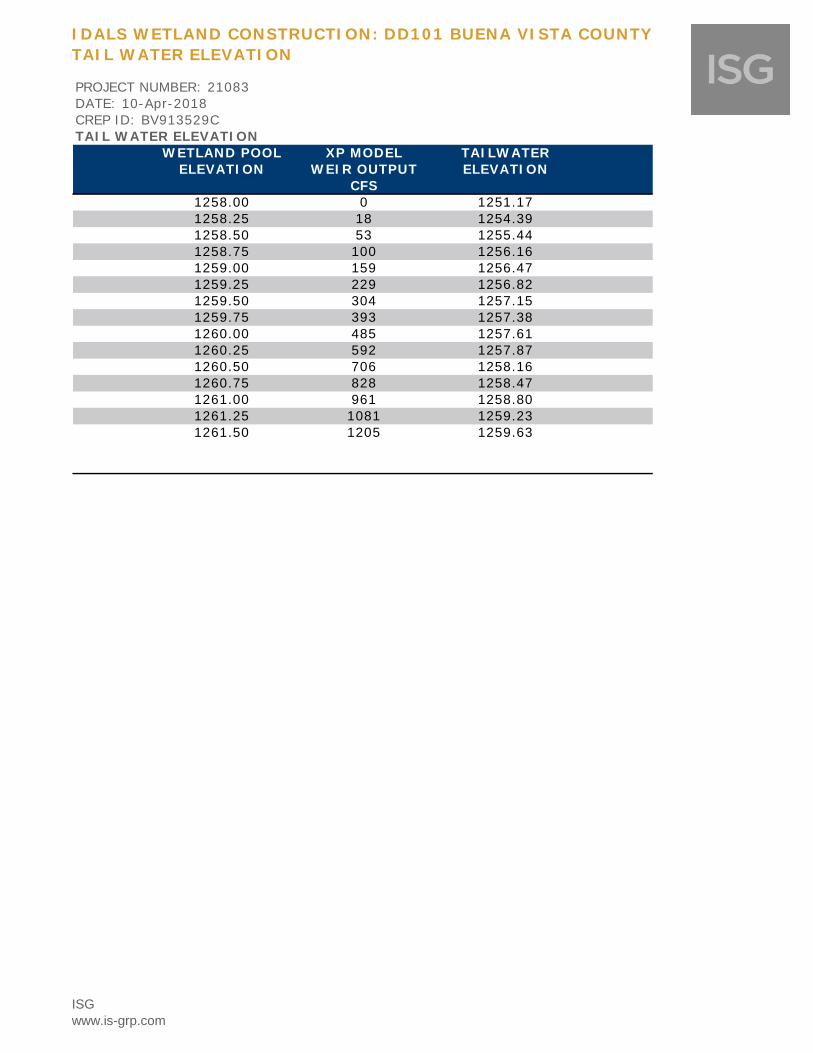
TAIL WATER ELEVATION
PROJECT NUMBER: 21083
DATE: 10-Apr-2018
CREP ID: BV913529C
TAIL WATER ELEVATION
WETLAND POOL XP MODEL TAILWATER
ELEVATION WEIR OUTPUT ELEVATION
CFS
1258.00 0 1251.17
1258.25 18 1254.39
1258.50 53 1255.44
1258.75 100 1256.16
1259.00 159 1256.47
1259.25 229 1256.82
1259.50 304 1257.15
1259.75 393 1257.38
1260.00 485 1257.61
1260.25 592 1257.87
1260.50 706 1258.16
1260.75 828 1258.47
1261.00 961 1258.80
1261.25 1081 1259.23
1261.50 1205 1259.63
ISG
www.is-grp.com
1258.0
1258.5
1259.0
1259.5
1260.0
1260.5
1261.0
1261.5
1262.0
1262.5
1 FriJun 2018
2 Sat 3 Sun
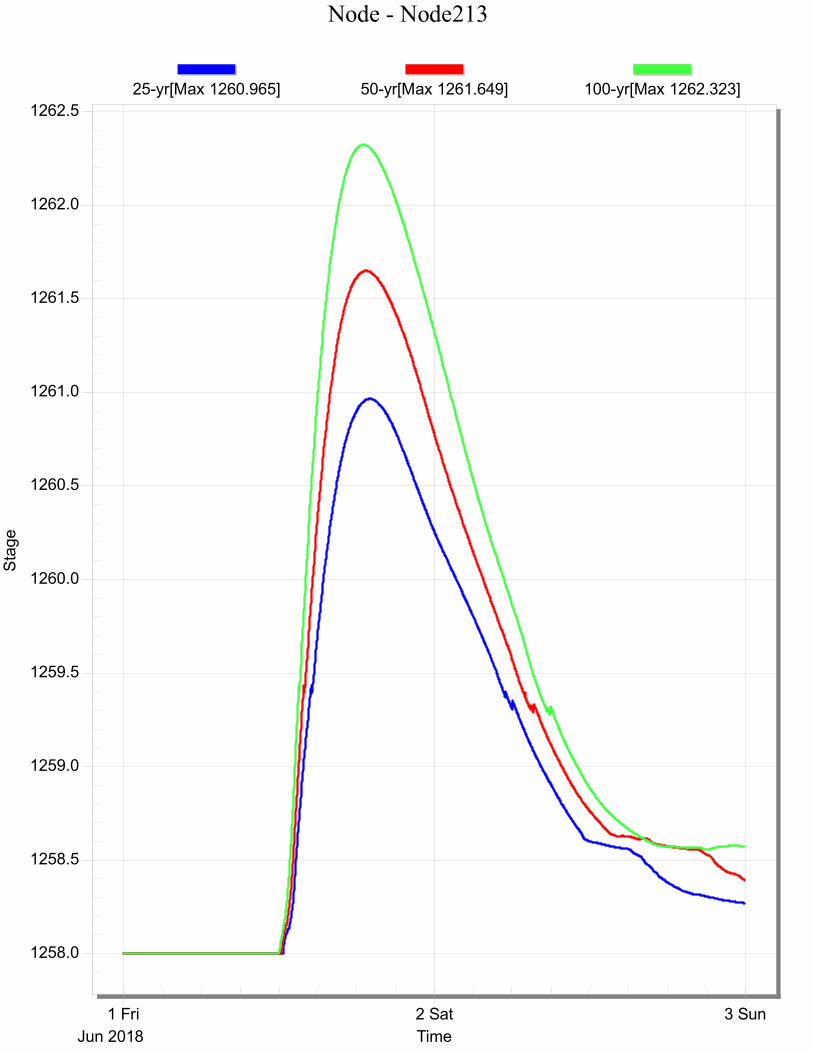
Node - Node213S
tage
Time
25-yr[Max 1260.965] 50-yr[Max 1261.649] 100-yr[Max 1262.323]
0
200
400
600
800
1000
1200
1400
1600
1 FriJun 2018
2 Sat 3 Sun
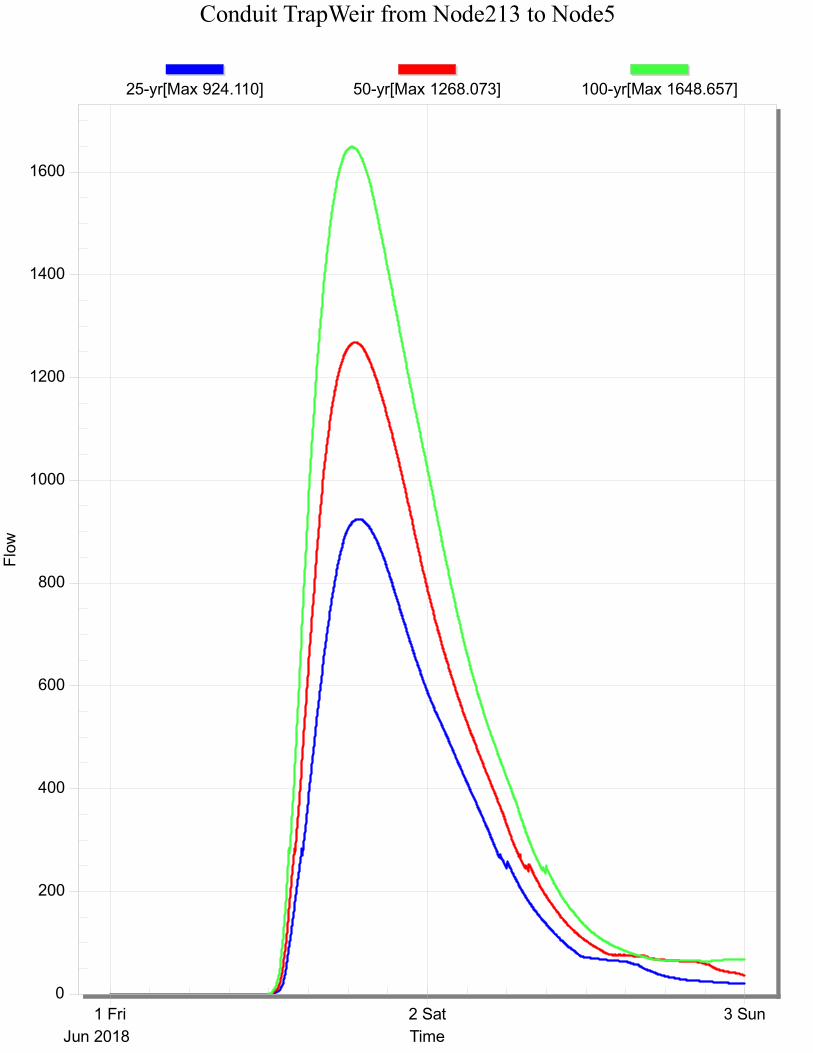
Conduit TrapWeir from Node213 to Node5F
low
Time
25-yr[Max 924.110] 50-yr[Max 1268.073] 100-yr[Max 1648.657]
1251
1252
1253
1254
1255
1256
1257
1258
1259
1260
1261
1 FriJun 2018
2 Sat 3 Sun
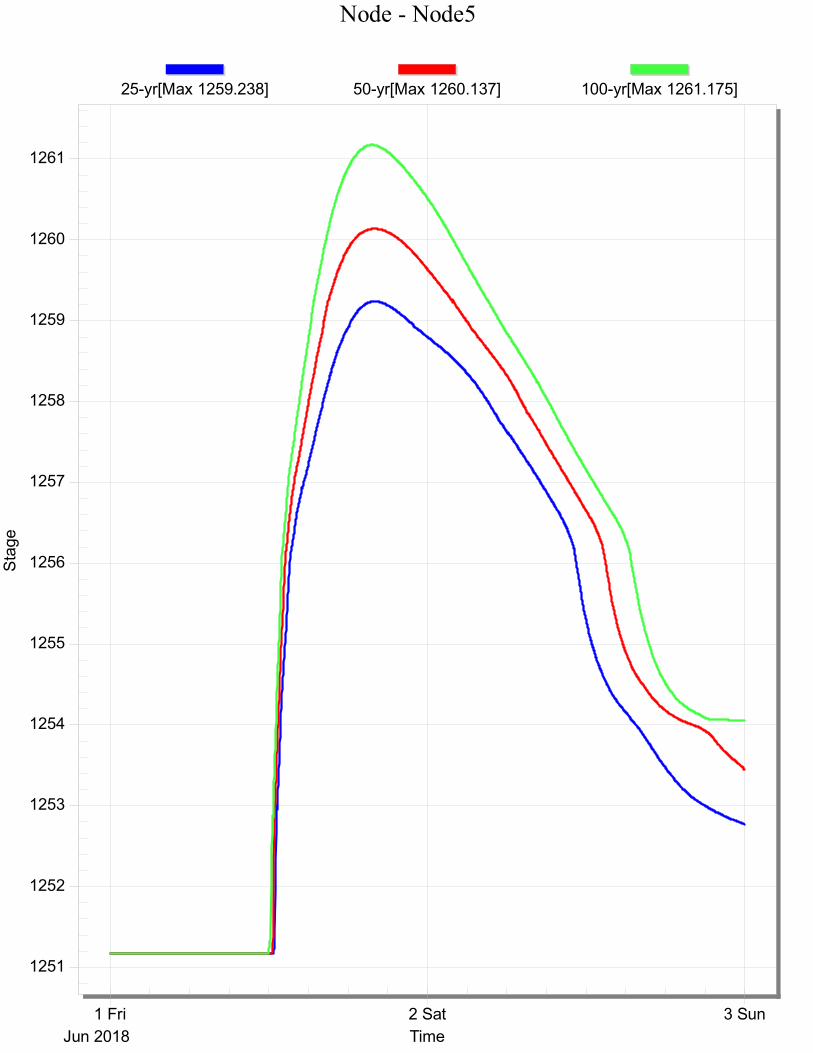
Node - Node5S
tage
Time
25-yr[Max 1259.238] 50-yr[Max 1260.137] 100-yr[Max 1261.175]
570TH ST
560TH ST
580TH ST
590TH ST
600TH ST
230T
H AV
E
200T
H AV
E
210T
H AV
E
220T
H AV
E
190T
H AV
E
180T
H AV
E
555TH ST
185T
H AV
E
170T
H AV
E
175T
H AV
E
180T
H AV
E
170T
H AV
E
190T
H AV
E
170T
H AV
E
S:\P
roje
cts
\21
00
0 P
RO
J\2
10
00-2
109
9\2
10
83 ID
ALS
BV
91
352
9C
-Bu
ena
Vis
ta C
ou
nty
IA\2
10
83 G
IS\2
10
83
Ma
pD
ocs\S
torm
Su
rface
Flo
w.m
xd
1 inch = 2,640 feet
LegendOutlet Nodes
Burn Lines
Model Catchments
PondingValue
High : 3.771
Low : 0.001
0 1,300 2,600650Feet
µ
Orthophotograph (2015)
PN: 17-21083Source:
Figure #22-YEAR, 48-HOUR
STORMPonding Report
Buena Vista County, IowaMonday, September 10, 2018
Drainage District No. 34 Main Open Ditch
Drainage District No. 101Main Open Ditch
Scale 1 : 41104.47
MODEL SETUP MAP SHOWING LINKS FOR1-D FLOW CONDUITS
1518
21
16
20
17
19
27
24
23
25
14
14
22
26
22
4
12580TH ST
590TH ST
210T
H AV
E200T
H AV
E
S:\P
roje
cts
\21
00
0 P
RO
J\2
10
00-2
109
9\2
10
83 ID
ALS
BV
91
352
9C
-Bu
ena
Vis
ta C
ou
nty
IA\2
10
83 G
IS\2
10
83
Ma
pD
ocs\S
torm
Su
rface
Flo
w.m
xd
1 inch = 660 feet
LegendOutlet Nodes
Burn Lines
Catchments
50-year storm.ascValue
High : 7.234
Low : 0.001
0 330 660165Feet
µ
Orthophotograph (2015)
PN: 17-21083Source:
Figure #350-YEAR, 24-HOUR
STORMPonding Report
Buena Vista County, IowaMonday, September 10, 2018
Drainage District No. 101Main Open Ditch