Embed Size (px)
Citation preview


c o n s u l t i n g ♦ t r a i n i n g ♦ d a t a s y s t e m s
www.ZephyrEnv.com ♦ www.HazMatAcademy.com
2600 Via Fortuna, Suite 450 ♦ Austin, Texas 78746 ♦ PH 512.329.5544 ♦ FAX 512.329.8253
May 09, 2014 Mr. Sean O’Brien Air Permits Division Texas Commission on Environmental Quality Mail Code 163 12100 Park 35 Circle Austin, Texas 78753 Re: Update to Application for Permit No. 108819/PSD-TX-1354 M&G Resins USA, LLC Corpus Christi, Nueces County, Texas Mr. O’Brien: Zephyr Environmental Corporation (Zephyr), on behalf of M&G Resins USA, LLC (M&G), hereby submits this revision to the application for Permit No. 108819/PSD-TX-1354. This revision contains the following changes:
M&G proposes two separate options for the Utility Plant: (Option 1) a General Electric LM6000 natural gas-fired combustion turbine exhausting to a natural gas-fired heat recovery steam generator (EPN: CTG) and two natural gas-fired auxiliary boilers (EPNs: AUXBLRA1 and AUXBLRB); or (Option 2) three natural gas-fired auxiliary boilers with no combustion turbine (EPNs: AUXBLRA1, AUXBLRA2, and AUXBLRB).
The proposed firing rates for the combustion turbine and Heat Recovery Steam Generators duct burners have changed slightly, as shown in revised emission calculation Table A-1.
The maximum firing rate for Auxiliary Boiler A1 has been reduced to 445 MMBtu/hr. Revised emission calculations for Auxiliary Boiler A1 are in Tables A-8A, A-8B, A-8C, and A-8D.
A second boiler, identical to Auxiliary Boiler A1, is included in Option 2. Emission calculations for Auxiliary Boiler A2 are in Tables A-9A, A-9B, A-9C, and A-9D.
The maximum firing rate for Auxiliary Boiler B has been increased to 250 MMBtu/hr and the annual operating schedule is increased to 8,760 hours per year. Revised emission calculations for Auxiliary Boiler B are in revised Tables A-10A, A-10B, A-10C, and A-10D.
The revisions described above are incorporated into the following revised sections of the air application:

Mr. Sean O’Brien May 09, 2014 Page 2
Introduction;
Section VII.A.4.- Process Flow Diagram
Section VII.A.5 – Process Description
Section VII.A.6 – Emissions Data and Calculations
Section VII.A.7 – Table 1a
Section VIII.A – Compliance with TCEQ Rules and Regulations
Section VIII.B – Measurement of Emissions
Section VIII.C – Best Available Control Technology
Section IX.A – New Source Performance Standards
Section IX.C – Maximum Achievable Control Technologies for NESHAP Source Categories
Section IX.E – Prevention of Significant Deterioration Permitting Requirements
Appendix A – Revised Emission Calculation Tables.
Appendix C – Revised TCEQ Equipment Tables
Appendix D – Revised Netting Tables 1F and 2F.
If you have any questions regarding this information, please contact me at [email protected] or by telephone at (512) 879-6619. Sincerely,
Larry A. Moon, P.E. Principal Enclosures cc: Ms. Susan Clewis, Regional Director, TCEQ Region 14, Corpus Christi
Ms. Stephanie Kordzi, EPA Region 6 (electronic copy by email) Ms. Allana Whitney, Chemtex Mr. Mauro Fenoglio, M&G Mr. Flavio Assis, M&G Mr. Thomas Sullivan, P.E., Zephyr Environmental

ATTACHMENT
Application Revisions

APPLICATION FOR AN AIR QUALITY PERMIT CORPUS CHRIST UTILITY PLANT
CORPUS CHRISTI, TEXAS
SUBMITTED TO: TEXAS COMMISSION ON ENVIRONMENTAL QUALITY
OFFICE OF PERMITTING, REMEDIATION, AND REGISTRATION AIR PERMITS DIVISION
P. O. BOX 13087 AUSTIN, TEXAS 78711-3087
SUBMITTED BY: M&G RESINS USA, LLC
450 GEARS ROAD, SUITE 240 HOUSTON, TX 77067
PREPARED BY: ZEPHYR ENVIRONMENTAL CORPORATION
TEXAS REGISTERED ENGINEERING FIRM F-102 2600 VIA FORTUNA, SUITE 450
AUSTIN, TEXAS 78746
REVISED MAY 2014

AIR QUALITY PERMIT AMENDMENT APPLICATION CORPUS CHRISTI COMBINED HEAT AND POWER PLANT
M&G RESINS USA, LLC
Zephyr Environmental Corporation
Revised May 9, 2014
i
TABLE OF CONTENTS
INTRODUCTION .......................................................................................................................... 1
FORM PI-1 GENERAL APPLICATION, CORE DATA FORM ...................................................... 2
AND PERMIT FEE INFORMATION .............................................................................................. 2
VII. TECHNICAL INFORMATION ........................................................................................... 16
VII.A.1 AREA MAP ..................................................................................................................... 17
VII.A.2 PLOT PLANS ................................................................................................................. 18
VII. A.3 EXISTING AUTHORIZATIONS ..................................................................................... 20
VII.A.4 PROCESS FLOW DIAGRAM ........................................................................................ 21
VII.A.5 PROCESS DESCRIPTION ............................................................................................ 23
VII.A.6 EMISSIONS DATA AND CALCULATIONS ................................................................... 28
VII.A.7 TCEQ TABLES .............................................................................................................. 32
VII.E. DISASTER REVIEW ..................................................................................................... 44
VIII. STATE REGULATORY REQUIREMENTS ..................................................................... 45
VIII.A. COMPLIANCE WITH TCEQ RULES AND REGULATIONS ........................................... 45
VIII.B. MEASUREMENT OF EMISSIONS ................................................................................. 51
VIII.C. BEST AVAILABLE CONTROL TECHNOLOGY (BACT)................................................. 52
VIII.D. PERFORMANCE DEMONSTRATION ........................................................................... 60
IX. FEDERAL REGULATORY REQUIREMENTS .................................................................. 61
IX.A. NEW SOURCE PERFORMANCE STANDARDS ............................................................. 61
IX.B. NATIONAL EMISSION STANDARDS FOR HAZARDOUS AIR POLLUTANTS ............... 62
IX.C. MAXIMUM ACHIEVABLE CONTROL TECHNOLOGIES FOR ........................................ 63
NESHAP SOURCE CATEGORIES ............................................................................................ 63
IX.D. NONATTAINMENT PERMITTING REQUIREMENTS ...................................................... 64
IX.E. PREVENTION OF SIGNIFICANT DETERIORATION PERMITTING REQUIREMENTS ........................................................................................................ 65
APPENDICES
APPENDIX A: EMISSION CALCULATIONS APPENDIX B: BACT/LAER SUPPORT DOCUMENTS APPENDIX C: TCEQ EQUIPMENT TABLES APPENDIX D: PSD NETTING TABLES

AIR QUALITY PERMIT AMENDMENT APPLICATION CORPUS CHRISTI COMBINED HEAT AND POWER PLANT
M&G RESINS USA, LLC
Zephyr Environmental Corporation
Revised May 9, 2014
1
INTRODUCTION
M&G Resins USA, LLC (M&G) is hereby submitting this application for an air quality permit for the construction of a new Utility Plant to be a support facility for a new plastic resins manufacturing facility located in Corpus Christi, Nueces County, Texas. The M&G Utility plant will provide steam and electricity to an adjoining Polyethylene Terephthalate (PET) and Terephthalic Acid (PTA) Manufacturing Plant which will also be owned and operated by M&G Resins USA, LLC. A separate air quality application was submitted for the PET Plant by M&G. The Utility Plant will consist of one of the following two options: (1) a General Electric LM6000 natural gas-fired combustion turbine exhausting to a natural gas-fired heat recovery steam generator (HRSG) and two natural gas-fired auxiliary boilers, or (2) three natural gas-fired auxiliary boilers with no combustion turbine. The combustion turbine has a maximum electric power output of approximately 49 MW. The final selection of the Utility Plant option will not be made until after the permit is issued. Nueces County is designated as attainment/unclassifiable for all criteria pollutants. As a Major Stationary Source, emissions from the proposed plant trigger Prevention of Significant Deterioration (PSD) review. Since the M&G Utility Plant will be a support facility for the adjoining PET Plant, the Utility Plant and PET Plant will be considered to be one stationary source for PSD applicability purposes. The remainder of the application presents all information required for an air quality construction permit according to the TCEQ’s Form PI-1, with information presented in the order that it is addressed on the PI-1 Form. The dispersion modeling component of this application, including evaluations required under PSD review, will be submitted after consultation with the TCEQ.

AIR QUALITY PERMIT AMENDMENT APPLICATION CORPUS CHRISTI COMBINED HEAT AND POWER PLANT
M&G RESINS USA, LLC
Zephyr Environmental Corporation
Revised May 9, 2014
16
VII. TECHNICAL INFORMATION
A.1. Area Map and A.2. Plot Plan An area map is provided with a USGS underlay that shows the surrounding land use and a 3,000-foot radius around the site property line. The attached plot plan shows the scale, a north arrow, two benchmarks, and emission points associated with the facility.

PLOT PLAN - Utility Plant Option 1M & G Resins, U.S.A. - Corpus Christi, Texas
Drafted By: J. Knowles Date: 05.02.2014Project No.: 12453.002Reviewed By: L. Moon
Map Sources: ESRI Imagery & Streets Basemaps;
!.
!.
!.
!.
!.
!.
CTLOV CTG
AUXBLRA1
AUXBLRBNH3-FUG
MSS-FUG,NG-FUG
s 0 50 100Feet
0 10 20Meters
_̂ Document Path: H:\Chemtex\GIS\ArcGIS\Plot Plans\Combined Heat & Power Plant Opt.1- Plot Plan.mxd
ss
EPN Easting NorthingAUXBLRA1 647,878.27 3,079,940.50AUXBLRB 647,852.64 3,079,947.82CTG 647,901.54 3,079,972.94CTLOV 647,874.67 3,079,993.22MSS-FUG, NG-FUG 647,835.88 3,079,968.44NH3-FUG 647,841.49 3,079,953.83
!. EPNStructureFugitive AreaPlant AreaProperty Boundary
Benchmark 1:UTM Zone 14647,863 mE3,080,018 mN
Benchmark 2:647,874 mE3,079,929 mN
Plant Area Extent

PLOT PLAN - Utility Plant Option 2M & G Resins, U.S.A. - Corpus Christi, Texas
Drafted By: J. Knowles Date: 05.02.2014Project No.: 12453.002Reviewed By: L. Moon
Map Sources: ESRI Imagery & Streets Basemaps;
!.
!.
!.
!.
!.
AUXBLRA2
AUXBLRA1
AUXBLRBNH3-FUG
MSS-FUG,NG-FUG
s 0 50 100Feet
0 10 20Meters
_̂ Document Path: H:\Chemtex\GIS\ArcGIS\Plot Plans\Combined Heat & Power Plant Opt.2- Plot Plan.mxd
ss
!. EPNStructureFugitive AreaPlant AreaProperty Boundary
Benchmark 1:UTM Zone 14647,863 mE3,080,018 mN
Benchmark 2:647,874 mE3,079,929 mN
Plant Area Extent
EPN Easting NorthingAUXBLRB 647,852.64 3,079,947.82AUXBLRA1 647,878.27 3,079,940.50MSS-FUG, NG-FUG 647,835.88 3,079,968.44NH3-FUG 647,841.49 3,079,953.83AUXBLRA2 647,896.66 3,079,966.60
ELECTRICITY TO M&G PET Plant
WATER
STEAM
WATER STEAM
Permit Application Filename: 2013‐0206 NRG CHP PFD.xlsDrawn by: Checked by: Project No.: Date: Sheet:Z. Trieff L. Moon 012563 5/9/2014 1 of 1
PROCESS FLOW DIAGRAMM&G Utility Plant (Option 1)
OPTION 1
WATER STEAM TO M&G PET PlantCOMBUSTOR
HEAT RECOVERY STEAM GENERATOR & SCR + OXIDATION CATALYST
EPN: CTG
COMPRESSOR TURBINE
AIR
ELECTRIC GENERATOR
NATURAL GAS
AMMONIASTORAGE AND DISTRIBUTION
AUXILIARY BOILER A1
EPN: AUXBLRA1
AUXILIARYBOILER B
EPN: AUXBLRB
EPN: NGFUG
EPN: NH3FUG
EPN: CTLOV

WATER
WATER
WATER
Permit Application Filename: 2013‐0206 NRG CHP PFD.xlsDrawn by: Checked by: Project No.: Date: Sheet:Z. Trieff L. Moon 012563 5/9/2014 1 of 1
OPTION 2
M&G Utility Plant (Option 2) PROCESS FLOW DIAGRAM
STEAM TO M&G PET Plant
NATURAL GAS
AMMONIASTORAGE AND
AUXILIARY BOILER A2
EPN: AUXBLRA2
AUXILIARYBOILER B
EPN: AUXBLRB
AUXILIARY BOILER A1
EPN: AUXBLRA1
STEAM
STEAM
STEAM
EPN: NGFUG
EPN: NH3FUG

AIR QUALITY PERMIT AMENDMENT APPLICATION CORPUS CHRISTI COMBINED HEAT AND POWER PLANT
M&G RESINS USA, LLC
Zephyr Environmental Corporation
Revised May 9, 2014
23
VII.A.5 PROCESS DESCRIPTION 1.0 Introduction With this application, M&G is seeking authorization to construct a new Utility Plant in Nueces County, Texas. The emission sources associated with the Utility Plant will consist of one of the following two options: Option 1
One natural gas-fired combustion turbine equipped with lean pre-mix low-NOx combustors
One natural gas-fired duct burner system One 445 MMBtu/hr, natural gas-fired Auxiliary Boiler A1 One 250 MMBtu/hr, natural gas-fired Auxiliary Boiler B Lube oil vents for the turbine lube oil recirculation systems Three selective catalytic reduction (SCR) systems for additional nitrogen oxide (NOx)
emissions control for the combustion turbine unit and the two auxiliary boilers Aqueous ammonia storage and handling equipment to support the SCR systems An oxidation catalyst (OC) system for additional carbon monoxide (CO)/volatile organic
compound (VOC) emissions control for the combustion turbine Natural gas piping and metering
Option 2
One 445 MMBtu/hr, natural gas-fired Auxiliary Boiler A1 One 445 MMBtu/hr, natural gas-fired Auxiliary Boiler A2 One 250 MMBtu/hr, natural gas-fired Auxiliary Boiler B Three selective catalytic reduction (SCR) systems for additional nitrogen oxide (NOx)
emissions control for the three boilers Aqueous ammonia storage and handling equipment to support the SCR systems Natural gas piping and metering
A process flow diagram is included as Figure VII.A.4 and a TCEQ Material Balance Table 2 is included in Section VII.A.7. 2.0 Combustion Turbine and Heat Recovery Steam Generator The Utility Plant, Option 1, will include one GE LM6000 natural gas-fired combustion turbine generator (CTG) which will exhaust to a HRSG. The emission point number (EPN) for the combustion turbine/HRSG unit is CTG. The combustion turbine burns pipeline natural gas to rotate an electrical generator to generate electricity. The main components of a combustion turbine generator consist of a compressor, combustor, turbine, and generator. The compressor pressurizes combustion air to the

AIR QUALITY PERMIT AMENDMENT APPLICATION CORPUS CHRISTI COMBINED HEAT AND POWER PLANT
M&G RESINS USA, LLC
Zephyr Environmental Corporation
Revised May 9, 2014
24
combustor where the fuel is mixed with the combustion air and burned. Hot exhaust gases then enter the turbine where the gases expand across the turbine blades, driving a shaft to power an electric generator. The exhaust gas exits the combustion turbine and is routed to the HRSG for steam production. Heat recovered in the HRSG will be utilized to produce steam. Steam generated within the HRSG will be supplied to the PET plant. The HRSG will be equipped with duct burners for supplemental steam production. The duct burners will be fired with pipeline-quality natural gas. The duct burners have a maximum heat input capacity of 263 MMBtu/hr. The exhaust gases from the unit, including emissions from the CTG and the duct burners, will exit through a stack to the atmosphere. The normal duct burner operation will vary from 0 to 100 percent of the maximum capacity. Duct burners will be located in the HRSG prior to the selective catalytic reduction system. Steam produced by the HRSG will be routed to the steam header. The combustion turbine will be coupled to electric generators to produce electricity for use in the PET plant. The CTG has a maximum electric power output of approximately 49 MW. NOx emissions generated from combustion in the combustion turbine unit will be minimized through the use of low-NOx combustors and an SCR system. CO/VOC emissions generated from combustion in the combustion turbine unit will be minimized through the use of oxidation catalyst system. 3.0 Turbine Lube Oil Recirculation System The CTG will include a closed-loop lube oil recirculation system to lubricate moving parts of the turbine. The lube oil system includes a main lube oil storage tank. Oil vapor (constituting VOC) and oil mist (constituting PM) emissions are generated by oil vaporization resulting from heating of lube oil in the CTG and subsequent condensation of droplets when the vapor is cooled in the cooler zones of the storage reservoir compartment. Lube oil mist emissions from the reservoir compartment are controlled by a mist eliminator exhausted through a dedicated reservoir vent (EPN CTLOV). The mist eliminator operates when the CTG is operating, including during CT startup and shutdown plus additional time before and after CTG operation. When the CTG is not operating, such that oil temperatures are closer to ambient air temperatures, minor oil vapor breathing and filling losses could be expected to occur from the oil reservoir.
AIR QUALITY PERMIT AMENDMENT APPLICATION CORPUS CHRISTI COMBINED HEAT AND POWER PLANT
M&G RESINS USA, LLC
Zephyr Environmental Corporation
Revised May 9, 2014
25
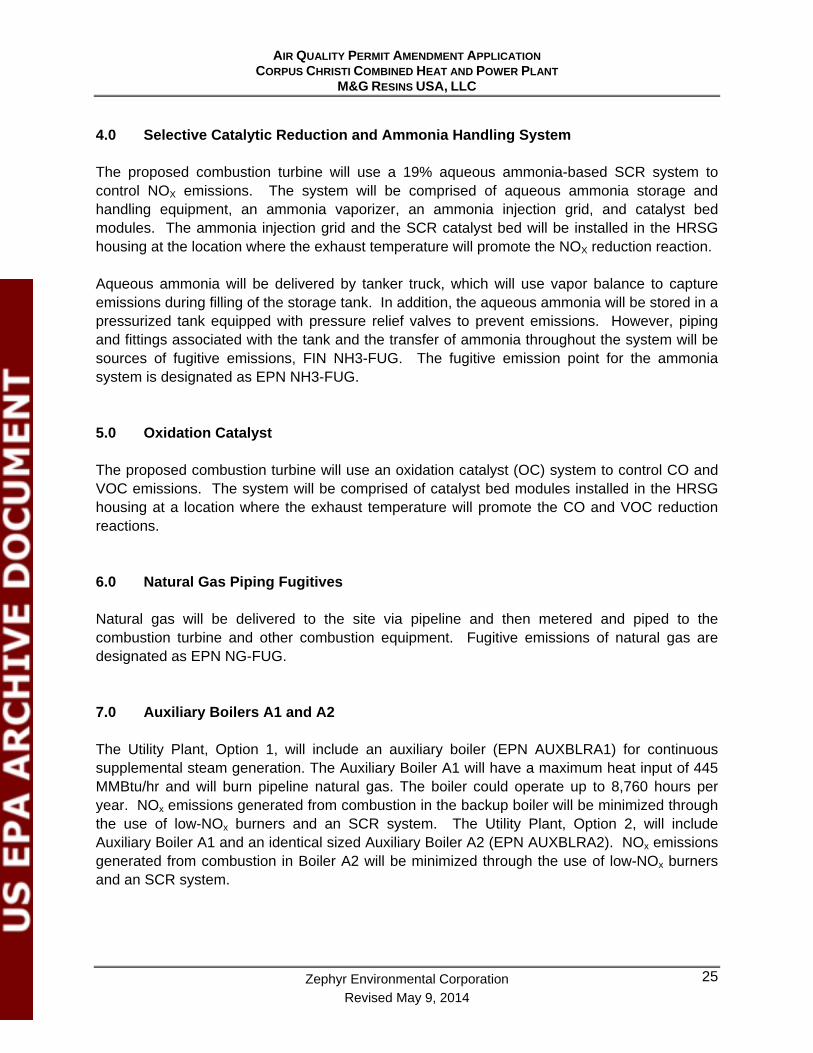
4.0 Selective Catalytic Reduction and Ammonia Handling System The proposed combustion turbine will use a 19% aqueous ammonia-based SCR system to control NOX emissions. The system will be comprised of aqueous ammonia storage and handling equipment, an ammonia vaporizer, an ammonia injection grid, and catalyst bed modules. The ammonia injection grid and the SCR catalyst bed will be installed in the HRSG housing at the location where the exhaust temperature will promote the NOX reduction reaction. Aqueous ammonia will be delivered by tanker truck, which will use vapor balance to capture emissions during filling of the storage tank. In addition, the aqueous ammonia will be stored in a pressurized tank equipped with pressure relief valves to prevent emissions. However, piping and fittings associated with the tank and the transfer of ammonia throughout the system will be sources of fugitive emissions, FIN NH3-FUG. The fugitive emission point for the ammonia system is designated as EPN NH3-FUG. 5.0 Oxidation Catalyst The proposed combustion turbine will use an oxidation catalyst (OC) system to control CO and VOC emissions. The system will be comprised of catalyst bed modules installed in the HRSG housing at a location where the exhaust temperature will promote the CO and VOC reduction reactions. 6.0 Natural Gas Piping Fugitives Natural gas will be delivered to the site via pipeline and then metered and piped to the combustion turbine and other combustion equipment. Fugitive emissions of natural gas are designated as EPN NG-FUG. 7.0 Auxiliary Boilers A1 and A2 The Utility Plant, Option 1, will include an auxiliary boiler (EPN AUXBLRA1) for continuous supplemental steam generation. The Auxiliary Boiler A1 will have a maximum heat input of 445 MMBtu/hr and will burn pipeline natural gas. The boiler could operate up to 8,760 hours per year. NOx emissions generated from combustion in the backup boiler will be minimized through the use of low-NOx burners and an SCR system. The Utility Plant, Option 2, will include Auxiliary Boiler A1 and an identical sized Auxiliary Boiler A2 (EPN AUXBLRA2). NOx emissions generated from combustion in Boiler A2 will be minimized through the use of low-NOx burners and an SCR system.

AIR QUALITY PERMIT AMENDMENT APPLICATION CORPUS CHRISTI COMBINED HEAT AND POWER PLANT
M&G RESINS USA, LLC
Zephyr Environmental Corporation
Revised May 9, 2014
26
8.0 Auxiliary Boiler B The Utility Plant, Options 1 and 2, will include a smaller Auxiliary Boiler B (EPN AUXBLRB) that will be available to provide the steam requirements of the customer during time where steam loads are less than the minimum output of either the combustion turbine or Auxiliary Boiler A1. Auxiliary Boiler B will have a maximum heat input of 250 MMBtu/hr and will burn pipeline natural gas. The boiler could operate up to 8,760 hours per year. NOx emissions generated from combustion in the backup boiler will be minimized through the use of low-NOx burners and an SCR system. 9.0 Startup/Shutdown Activities Startup and shutdown of the proposed CTG/HRSG combustion turbine is part of the regularly scheduled operations at the facility. Startup and shutdown periods for the gas turbine are defined by monitored operating conditions. For the combustion turbine, a startup period begins when an initial flame detection signal is recorded in the plant’s Data Acquisition and Handling System (DAHS) and ends when the combustion turbine reaches emissions compliance status. The shutdown period begins when the gas turbine output drops below 40% load and the operator has initiated shutdown, and ends when a flame detection signal is no longer recorded in the plant’s DAHS. The startup and shutdown duration time for the combustion turbine is still being developed and will be submitted later in the permit application review process. During maintenance, startup, and shutdown (MSS) periods, NOX, CO, VOC, NH3 and opacity are emitted at higher levels than normal operating conditions. During startup, higher NOX emissions occur during the transition period before the dry low-NOX burners enter the lean, pre-mix combustion mode. Additionally, the SCR catalyst must be between 500°F and 750°F for efficient NOX reduction and higher NOX emissions will occur until the turbine exhaust heats the SCR catalyst to the required temperature. If the SCR operation is initiated prior to the unit reaching the required temperature, an excess of unconverted NH3 can build up in the HRSG. Higher CO and VOC emissions during startup and shutdown are caused due to incomplete combustion. Incomplete combustion occurs during startup as combustion is transitioned to a lean pre-mix mode. Finally, during startup higher than normal opacity may be experienced due to incomplete combustion and NO2 emissions. However, visible opacity is not expected to exceed the 15% limit of 30 TAC 111(a)(1)(C). 10.0 Non-Inherently Low Emitting Maintenance Activities MSS-related maintenance activities with potential emissions that are not considered to be Inherently Low Emitting (ILE) are being included with this application. These non-ILE maintenance activities are summarized in the table included in Appendix A.

AIR QUALITY PERMIT AMENDMENT APPLICATION CORPUS CHRISTI COMBINED HEAT AND POWER PLANT
M&G RESINS USA, LLC
Zephyr Environmental Corporation
Revised May 9, 2014
27
11.0 Inherently Low Emitting Maintenance Activities Several MSS-related activities associated with the new facility are expected to have inherently small emissions such that it is not necessary to require burdensome compliance recordkeeping for these activities. These ILE maintenance activities are summarized in the table included in Appendix A; specific calculations for these activities are also included in Appendix A.

AIR QUALITY PERMIT AMENDMENT APPLICATION CORPUS CHRISTI COMBINED HEAT AND POWER PLANT
M&G RESINS USA, LLC
Zephyr Environmental Corporation
Revised May 9, 2014
28
VII.A.6 EMISSIONS DATA AND CALCULATIONS
1.0 Introduction This section presents the basis for and calculations of emissions to be authorized under the permit. Detailed calculations are provided in Appendix A. A TCEQ Table 1(a) (Emission Point Summary) is provided in Section VII.A.7. This table lists the maximum hourly emission rates and average annual emission rates for pollutants from each EPN and also shows emission point location and exhaust parameters. Supporting emission calculations are found in Appendix A of this application. TCEQ equipment tables for the proposed equipment are presented in Appendix C. 2.0 Combustion Turbine Emissions The CTG/HRSG emission rates have been based upon data provided by the equipment manufacturer. The most conservative (worst-case) emission rates for the unit was determined using the maximum emission rates for firing at full load, at partial loads, with auxiliary firing of the duct burners and without auxiliary firing of the duct burners. The unit’s maximum hourly emissions have been estimated at various air intake temperatures representing the expected range of ambient conditions. Short-term pound per hour (lb/hr) emission rates were determined from the firing rate and ambient condition case that produced the highest lb/hr rate. Annual tons per year (tpy) emission rates were determined from the case with annual average ambient conditions and maximum firing.
The following is an explanation of the methods used to calculate the hourly emission rates for each airborne pollutant of concern. Detailed calculations and emissions summaries are presented in Appendix A for a variety of operating scenarios.
Post-SCR NOx emissions were calculated using a stack exhaust concentration of 2.0 parts per million by volume, dry (ppmvd) corrected to 15 percent oxygen.
Post-oxidation catalyst CO emissions were calculated using a stack exhaust concentration of 4.0 ppmvd corrected to 15 percent oxygen.
SO2 emissions were calculated using a sulfur content of 1.0 grains/100 scf for both short-term and annual emissions. The sulfur content in the fuel was multiplied by the volumetric flow rate of fuel consumed to determine the total flow of sulfur. One hundred percent of the sulfur in the fuel was assumed to convert (stoichiometrically) to SO2.
PM/PM10/PM2.5 emissions were based on data provided by equipment providers. Total PM emission rates were calculated including both the filterable and condensable (front and back half) PM rates. PM emissions include the contribution from ammonium sulfate ((NH4)2SO4).
Post-oxidation catalyst VOC emissions were calculated using a stack exhaust concentration of 4.0 ppmvd corrected to 15 percent oxygen.
AIR QUALITY PERMIT AMENDMENT APPLICATION CORPUS CHRISTI COMBINED HEAT AND POWER PLANT
M&G RESINS USA, LLC
Zephyr Environmental Corporation
Revised May 9, 2014
29
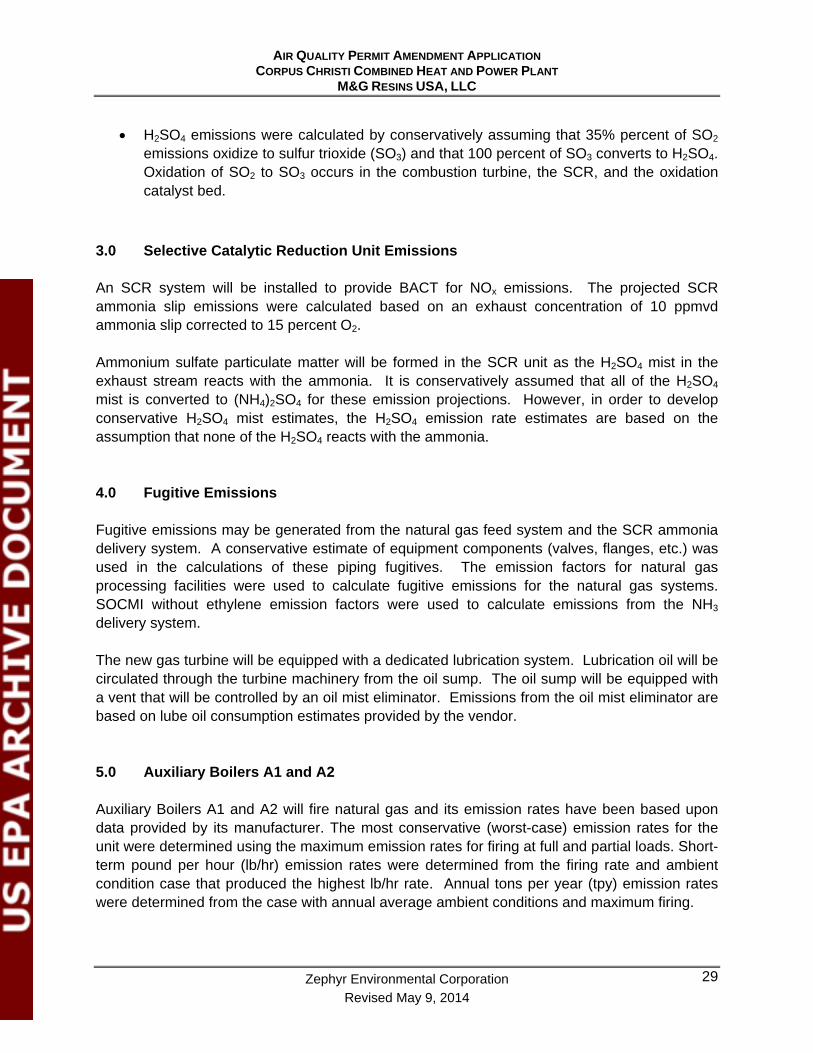
H2SO4 emissions were calculated by conservatively assuming that 35% percent of SO2 emissions oxidize to sulfur trioxide (SO3) and that 100 percent of SO3 converts to H2SO4. Oxidation of SO2 to SO3 occurs in the combustion turbine, the SCR, and the oxidation catalyst bed.
3.0 Selective Catalytic Reduction Unit Emissions An SCR system will be installed to provide BACT for NOx emissions. The projected SCR ammonia slip emissions were calculated based on an exhaust concentration of 10 ppmvd ammonia slip corrected to 15 percent O2. Ammonium sulfate particulate matter will be formed in the SCR unit as the H2SO4 mist in the exhaust stream reacts with the ammonia. It is conservatively assumed that all of the H2SO4 mist is converted to (NH4)2SO4 for these emission projections. However, in order to develop conservative H2SO4 mist estimates, the H2SO4 emission rate estimates are based on the assumption that none of the H2SO4 reacts with the ammonia. 4.0 Fugitive Emissions Fugitive emissions may be generated from the natural gas feed system and the SCR ammonia delivery system. A conservative estimate of equipment components (valves, flanges, etc.) was used in the calculations of these piping fugitives. The emission factors for natural gas processing facilities were used to calculate fugitive emissions for the natural gas systems. SOCMI without ethylene emission factors were used to calculate emissions from the NH3 delivery system. The new gas turbine will be equipped with a dedicated lubrication system. Lubrication oil will be circulated through the turbine machinery from the oil sump. The oil sump will be equipped with a vent that will be controlled by an oil mist eliminator. Emissions from the oil mist eliminator are based on lube oil consumption estimates provided by the vendor. 5.0 Auxiliary Boilers A1 and A2 Auxiliary Boilers A1 and A2 will fire natural gas and its emission rates have been based upon data provided by its manufacturer. The most conservative (worst-case) emission rates for the unit were determined using the maximum emission rates for firing at full and partial loads. Short-term pound per hour (lb/hr) emission rates were determined from the firing rate and ambient condition case that produced the highest lb/hr rate. Annual tons per year (tpy) emission rates were determined from the case with annual average ambient conditions and maximum firing.

AIR QUALITY PERMIT AMENDMENT APPLICATION CORPUS CHRISTI COMBINED HEAT AND POWER PLANT
M&G RESINS USA, LLC
Zephyr Environmental Corporation
Revised May 9, 2014
30
Short-term and annual SO2 emissions were based on a maximum fuel sulfur content of 1 gr/100 scf. A post-SCR NOx emission rate of 8.3 ppmvd at 3% O2 was used to calculate NOx emissions. The projected SCR ammonia slip emissions were calculated based on an exhaust concentration of 10 ppmvd ammonia slip corrected to 3% O2. 6.0 Auxiliary Boiler B Auxiliary Boiler B will fire natural gas. Emissions of NOx and CO were calculated using manufacturers’ emission factors while particulate and VOC emissions were calculated using EPA AP-42 factors. Short-term and annual SO2 emissions were based on a maximum fuel sulfur content of 1 gr/100 scf. A post-SCR NOx emission rate of 8.3 ppmvd at 3% O2 was used to calculate NOx emissions. The projected SCR ammonia slip emissions were calculated based on an exhaust concentration of 10 ppmvd ammonia slip corrected to 3% O2. 7.0 Additional Facilities In addition to the sources listed above, there are additional facilities being proposed that would have negligible or no emissions associated with them including water storage tanks and water treatment chemical storage tanks. 8.0 MSS Emissions from Startup, Shutdown and Non-ILE Maintenance Activities NOX, CO, and VOC emissions during startup of the combustion turbine are calculated based on vendor estimates with a safety margin added for the maximum hourly emission rates. The estimated emissions of NOX, CO, and VOC are meant to represent maximum hourly average emissions expected during MSS periods. Startup emissions for the combustion turbine are summarized in Table A-4. NOX and VOC emissions during startup of Auxiliary Boilers A1, A2, and B are calculated based on vendor estimates with a safety margin added for the maximum hourly emission rates. Startup emissions for Boilers A1, A2, and B are summarized on Tables A-7D, A-8D, and A-9D, respectively. 9.0 MSS Emissions from ILE Sources and Activities This section provides a broad description of the emission calculation methodologies used to calculate the estimated ILE emissions. Specific calculations for these activities are found in Appendix A. The emission calculation methodologies approved by the TCEQ for the Electric Utility MSS Workgroup for ILE sources and activities are utilized in this application. The basis of the emission estimates provided (such as the typical number of activities and average emissions

AIR QUALITY PERMIT AMENDMENT APPLICATION CORPUS CHRISTI COMBINED HEAT AND POWER PLANT
M&G RESINS USA, LLC
Zephyr Environmental Corporation
Revised May 9, 2014
31
per activity) are not intended to be a representation under 116.116(e) but are the best estimate of actual MSS activities experienced historically. Several of the categories are compilations of many MSS activities performed which may have slight variations in procedure or equipment configuration. These emissions calculations are based on worst-case assumptions, actual operation practices and procedures, process knowledge and engineering estimates. Therefore, the calculation basis for each category of MSS emissions should not be considered a 116.116(e) representation which limits the number of specific MSS activities in a category or the amount of emissions from any individual MSS activity. Instead, these are provided as a reasonable basis for emission estimates which is expected to become an annual emission limit for the permit MAERT. Emission rates are calculated based on scientific principles (such as the ideal gas law), process knowledge, AP-42 factors, TCEQ guidance, or a combination of these. Any representations in the emission calculations concerning individual emission categories are not intended to be interpreted as individual emission rate limitations but rather as an example of the emission calculation approach for the total category emission estimate.
AIR QUALITY PERMIT AMENDMENT APPLICATION CORPUS CHRISTI COMBINED HEAT AND POWER PLANT
M&G RESINS USA, LLC
Zephyr Environmental Corporation
Revised May 9, 2014
32
VII.A.7 TCEQ TABLES
A TCEQ Table 1(a) (Emission Point Summary) and Table 2 (Material Balance) are provided in this section.

TEXAS COMMISSION ON ENVIRONMENTAL QUALITYTable 1(a) Emission Point Summary
Date: 05/09/2014 Permit No.: 108819/PSD-TX-1354 Regulated Entity No.: RN106631427
Area Name: Utility Plant (Option 1) Customer Reference No.: CN604279455
Review of applications and issuance of permits will be expedited by supplying all necessary information requested on this Table.
AIR CONTAMINANT DATA
1. Emission Point 2. Component or Air Contaminant Name 3. Air Contaminant Emission Rate
(A) EPN (B) FIN (C) NAME (A) Pounds per Hour (B) TPYCTG CTG/HRSG GE LM-6000 Natural Gas Turbine Normal Operating Emissions
NOX 5.43 - - -
CO 6.61 - - -
VOC 3.78 - - -SO2 2.09 - - -
PM/PM10/PM2.5 8.24 - - -H2SO4 1.12 - - -
(NH4)2SO4 1.51 - - -NH3 10.06 - - -
MSS EmissionsNOX 47.02 - - -
CO 203.59 - - -
VOC 15.00 - - -SO2 2.09 - - -
PM/PM10/PM2.5 8.24 - - -H2SO4 1.12 - - -
(NH4)2SO4 1.51 - - -NH3 10.06 - - -
Combined Normal and MSS EmissionsNOX --- 33.05
CO --- 76.82
VOC --- 18.56SO2 --- 8.70
PM/PM10/PM2.5 --- 34.98H2SO4 --- 4.66
(NH4)2SO4 --- 6.28NH3 --- 41.80
Page 1 of 5
TEXAS COMMISSION ON ENVIRONMENTAL QUALITYTable 1(a) Emission Point Summary
Date: 05/09/2014 Permit No.: 108819/PSD-TX-1354 Regulated Entity No.: RN106631427
Area Name: Utility Plant (Option 1) Customer Reference No.: CN604279455
Review of applications and issuance of permits will be expedited by supplying all necessary information requested on this Table.
AIR CONTAMINANT DATA
1. Emission Point 2. Component or Air Contaminant Name 3. Air Contaminant Emission Rate
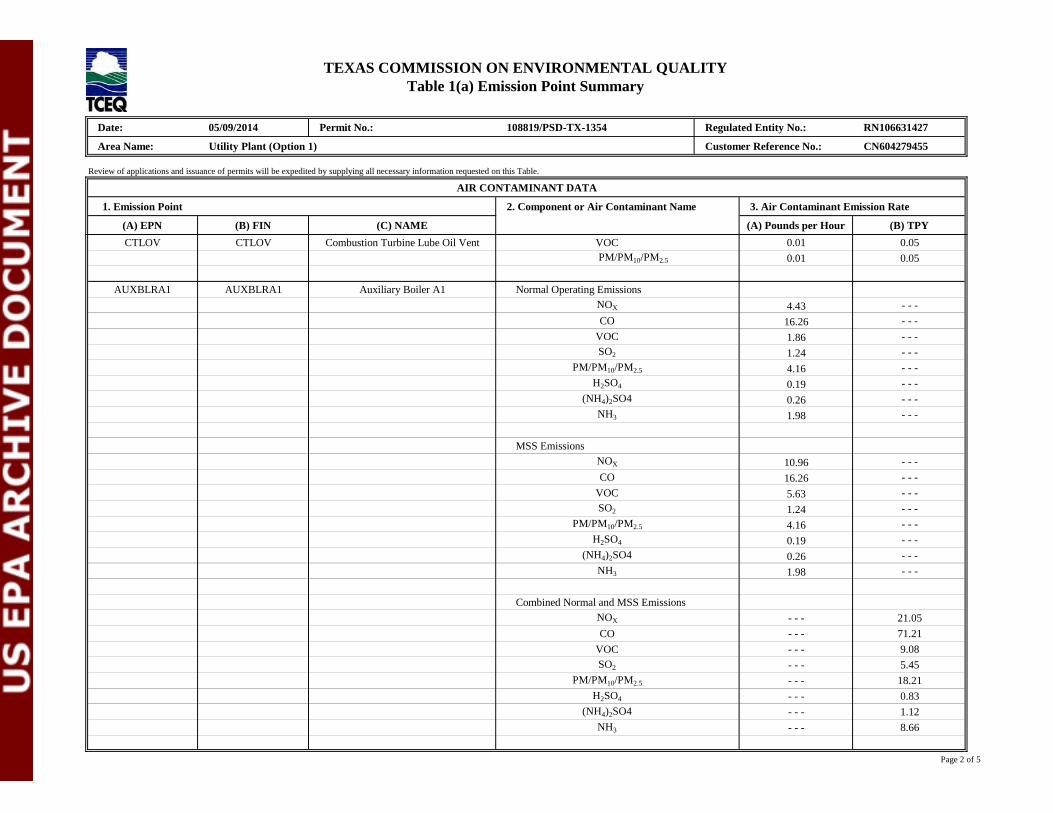
(A) EPN (B) FIN (C) NAME (A) Pounds per Hour (B) TPYCTLOV CTLOV Combustion Turbine Lube Oil Vent VOC 0.01 0.05
0.01 0.05
AUXBLRA1 AUXBLRA1 Auxiliary Boiler A1 Normal Operating EmissionsNOX 4.43 - - -
CO 16.26 - - -
VOC 1.86 - - -SO2 1.24 - - -
PM/PM10/PM2.5 4.16 - - -H2SO4 0.19 - - -
(NH4)2SO4 0.26 - - -NH3 1.98 - - -
MSS EmissionsNOX 10.96 - - -
CO 16.26 - - -
VOC 5.63 - - -SO2 1.24 - - -
PM/PM10/PM2.5 4.16 - - -H2SO4 0.19 - - -
(NH4)2SO4 0.26 - - -NH3 1.98 - - -
Combined Normal and MSS EmissionsNOX - - - 21.05
CO - - - 71.21
VOC - - - 9.08SO2 - - - 5.45
PM/PM10/PM2.5 - - - 18.21H2SO4 - - - 0.83
(NH4)2SO4 - - - 1.12NH3 - - - 8.66
PM/PM10/PM2.5
Page 2 of 5

TEXAS COMMISSION ON ENVIRONMENTAL QUALITYTable 1(a) Emission Point Summary
Date: 05/09/2014 Permit No.: 108819/PSD-TX-1354 Regulated Entity No.: RN106631427
Area Name: Utility Plant (Option 1) Customer Reference No.: CN604279455
Review of applications and issuance of permits will be expedited by supplying all necessary information requested on this Table.
AIR CONTAMINANT DATA
1. Emission Point 2. Component or Air Contaminant Name 3. Air Contaminant Emission Rate
(A) EPN (B) FIN (C) NAME (A) Pounds per Hour (B) TPYAUXBLRB AUXBLRB Auxiliary Boiler B Normal Operating Emissions
NOX 2.49 - - -
CO 9.13 - - -
VOC 1.04 - - -SO2 0.70 - - -
PM/PM10/PM2.5 1.84 - - -H2SO4 0.11 - - -
(NH4)2SO4 0.14 - - -NH3 1.11 - - -
MSS EmissionsNOX 6.01
CO 9.13
VOC 5.63SO2 0.70
PM/PM10/PM2.5 1.84H2SO4 0.11
(NH4)2SO4 0.14NH3 1.11
Combined Normal and MSS EmissionsNOX - - - 11.78
CO - - - 39.99
VOC - - - 5.71SO2 - - - 3.06
PM/PM10/PM2.5 - - - 7.91H2SO4 - - - 0.47
(NH4)2SO4 - - - 0.63NH3 - - - 4.86
Page 3 of 5

TEXAS COMMISSION ON ENVIRONMENTAL QUALITYTable 1(a) Emission Point Summary
Date: 05/09/2014 Permit No.: 108819/PSD-TX-1354 Regulated Entity No.: RN106631427
Area Name: Utility Plant (Option 1) Customer Reference No.: CN604279455
Review of applications and issuance of permits will be expedited by supplying all necessary information requested on this Table.
AIR CONTAMINANT DATA
1. Emission Point 2. Component or Air Contaminant Name 3. Air Contaminant Emission Rate
(A) EPN (B) FIN (C) NAME (A) Pounds per Hour (B) TPYNG-FUG NG-FUG Natural Gas Fugitive Emissions VOC 0.13 0.57
NH3-FUG NH3-FUG Ammonia Fugitive Emissions NH3 0.12 0.51
MSS-FUG MSS-FUG ILE Turbine Maintenance Fugitives NOX <0.01 <0.01
CO <0.01 <0.01
VOC 0.27 <0.01
PM 0.05 0.01PM10 0.05 0.01PM2.5 0.05 0.01NH3 <0.01 <0.01
Page 4 of 5

TEXAS COMMISSION ON ENVIRONMENTAL QUALITYTable 1(a) Emission Point Summary
Date: 05/09/2014 Permit No.: 108819/PSD-TX-1354 Regulated Entity No.: RN106631427
Area Name: Utility Plant (Option 1) Customer Reference No.: CN604279455
Review of applications and issuance of permits will be expedited by supplying all necessary information requested on this Table.
AIR CONTAMINANT DATA EMISSION POINT DISCHARGE PARAMETERS
Source
7. Stack Exit Data 8. Fugitives
(A) EPN (B) FIN (C) NAME Zone East (Meters) North (Meters)(A)
Diameter(ft.)
(B) Velocity (fps)
(C) Temperature
(°F)
(A) Length
(ft.)
(B) Width
(ft.)
(C) AxisDegrees
CTG CTG/HRSG GE LM-6000 Natural Gas Turbine 14 N 647,902 3,079,973 130 10.00 87.8 339
CTLOV CTLOV Combustion Turbine Lube Oil Vent 14 N 647,875 3,079,993 28 0.003 0.003 115
AUXBLRA1 AUXBLRA1 Auxiliary Boiler A1 14 N 647,878 3,079,941 130 6.50 65.12 293
AUXBLRB AUXBLRB Auxiliary Boiler B 14 N 647,853 3,079,948 130 5.00 62.7 298
NG-FUG NG-FUG Natural Gas Fugitive Emissions 14 N 647,836 3,079,968 180.0 150.0 53
NH3-FUG NH3-FUG Ammonia Fugitive Emissions 14 N 647,841 3,079,954 170.0 75.0 53
MSS-FUG MSS-FUG ILE Turbine Maintenance Fugitives 14 N 647,836 3,079,968 180.0 150.0 53
EPN = Emission Point Number
FIN = Facility Identification Number
TCEQ - 10153 (Revised 04/08) Table 1(a)
This form is for use by sources subject to air quality permit requirements and
may be revised periodically. (APDG 5178 v5)
1. Emission Point 4. UTM Coordinates ofEmission Point
5. Building Height (ft.)
6. Height Above
Ground (ft.)
Page 5 of 5

TEXAS COMMISSION ON ENVIRONMENTAL QUALITYTable 1(a) Emission Point Summary
Date: 05/09/2014 Permit No.: 108819/PSD-TX-1354 Regulated Entity No.: RN106631427
Area Name: Utility Plant (Option 2) Customer Reference No.: CN604279455
Review of applications and issuance of permits will be expedited by supplying all necessary information requested on this Table.
AIR CONTAMINANT DATA
1. Emission Point 2. Component or Air Contaminant Name 3. Air Contaminant Emission Rate
(A) EPN (B) FIN (C) NAME (A) Pounds per Hour (B) TPYAUXBLRA1 AUXBLRA1 Auxiliary Boiler A1 Normal Operating Emissions
NOX 4.43 - - -
CO 16.26 - - -
VOC 1.86 - - -
SO2 1.24 - - -
PM/PM10/PM2.5 4.16 - - -
H2SO4 0.19 - - -
(NH4)2SO4 0.26 - - -
NH3 1.98 - - -
MSS Emissions
NOX 10.96 - - -
CO 16.26 - - -
VOC 5.63 - - -
SO2 1.24 - - -
PM/PM10/PM2.5 4.16 - - -
H2SO4 0.19 - - -
(NH4)2SO4 0.26 - - -
NH3 1.98 - - -
Combined Normal and MSS Emissions
NOX - - - 21.05
CO - - - 71.21
VOC - - - 9.08
SO2 - - - 5.45
PM/PM10/PM2.5 - - - 18.21
H2SO4 - - - 0.83
(NH4)2SO4 - - - 1.12
NH3 - - - 8.66
Page 1 of 5

TEXAS COMMISSION ON ENVIRONMENTAL QUALITYTable 1(a) Emission Point Summary
Date: 05/09/2014 Permit No.: 108819/PSD-TX-1354 Regulated Entity No.: RN106631427
Area Name: Utility Plant (Option 2) Customer Reference No.: CN604279455
Review of applications and issuance of permits will be expedited by supplying all necessary information requested on this Table.
AIR CONTAMINANT DATA
1. Emission Point 2. Component or Air Contaminant Name 3. Air Contaminant Emission Rate
(A) EPN (B) FIN (C) NAME (A) Pounds per Hour (B) TPYAUXBLRA2 AUXBLRA2 Auxiliary Boiler A2 Normal Operating Emissions
NOX 4.43 - - -
CO 16.26 - - -
VOC 1.86 - - -
SO2 1.24 - - -
PM/PM10/PM2.5 4.16 - - -
H2SO4 0.19 - - -
(NH4)2SO4 0.26 - - -
NH3 1.98 - - -
MSS Emissions
NOX 10.96CO 16.26
VOC 5.63SO2 1.24
PM/PM10/PM2.5 4.16H2SO4 0.19
(NH4)2SO4 0.26NH3 1.98
Combined Normal and MSS Emissions
NOX - - - 21.05
CO - - - 71.21
VOC - - - 9.08
SO2 - - - 5.45
PM/PM10/PM2.5 - - - 18.21
H2SO4 - - - 0.83
(NH4)2SO4 - - - 1.12
NH3 - - - 8.66
Page 2 of 5

TEXAS COMMISSION ON ENVIRONMENTAL QUALITYTable 1(a) Emission Point Summary
Date: 05/09/2014 Permit No.: 108819/PSD-TX-1354 Regulated Entity No.: RN106631427
Area Name: Utility Plant (Option 2) Customer Reference No.: CN604279455
Review of applications and issuance of permits will be expedited by supplying all necessary information requested on this Table.
AIR CONTAMINANT DATA
1. Emission Point 2. Component or Air Contaminant Name 3. Air Contaminant Emission Rate
(A) EPN (B) FIN (C) NAME (A) Pounds per Hour (B) TPYAUXBLRB AUXBLRB Auxiliary Boiler B Normal Operating Emissions
NOX 2.49 - - -
CO 9.13 - - -
VOC 1.04 - - -
SO2 0.70 - - -
PM/PM10/PM2.5 1.84 - - -
H2SO4 0.11 - - -
(NH4)2SO4 0.14 - - -
NH3 1.11 - - -
MSS Emissions
NOX 0.00
CO 9.13
VOC 5.63
SO2 0.70
PM/PM10/PM2.5 1.84
H2SO4 0.11
(NH4)2SO4 0.14
NH3 1.11
Combined Normal and MSS Emissions
NOX - - - 11.78
CO - - - 39.99
VOC - - - 5.71
SO2 - - - 3.06
PM/PM10/PM2.5 - - - 7.91
H2SO4 - - - 0.47
(NH4)2SO4 - - - 0.63
NH3 - - - 4.86
Page 3 of 5

TEXAS COMMISSION ON ENVIRONMENTAL QUALITYTable 1(a) Emission Point Summary
Date: 05/09/2014 Permit No.: 108819/PSD-TX-1354 Regulated Entity No.: RN106631427
Area Name: Utility Plant (Option 2) Customer Reference No.: CN604279455
Review of applications and issuance of permits will be expedited by supplying all necessary information requested on this Table.
AIR CONTAMINANT DATA
1. Emission Point 2. Component or Air Contaminant Name 3. Air Contaminant Emission Rate
(A) EPN (B) FIN (C) NAME (A) Pounds per Hour (B) TPYNG-FUG NG-FUG Natural Gas Fugitive Emissions VOC 0.13 0.57
NH3-FUG NH3-FUG Ammonia Fugitive Emissions NH3 0.12 0.51
MSS-FUG MSS-FUG ILE Turbine Maintenance Fugitives NOX <0.01 <0.01
CO <0.01 <0.01
VOC 0.27 <0.01
NH3 <0.01 <0.01
Page 4 of 5
TEXAS COMMISSION ON ENVIRONMENTAL QUALITYTable 1(a) Emission Point Summary
Date: 05/09/2014 Permit No.: 108819/PSD-TX-1354 Regulated Entity No.: RN106631427
Area Name: Utility Plant (Option 2) Customer Reference No.: CN604279455
Review of applications and issuance of permits will be expedited by supplying all necessary information requested on this Table.
AIR CONTAMINANT DATA EMISSION POINT DISCHARGE PARAMETERS
Source
7. Stack Exit Data 8. Fugitives
(A) EPN (B) FIN (C) NAME Zone East (Meters) North (Meters)(A)
Diameter(ft.)
(B) Velocity (fps)
(C) Temperature
(°F)
(A) Length
(ft.)
(B) Width
(ft.)
(C) AxisDegrees
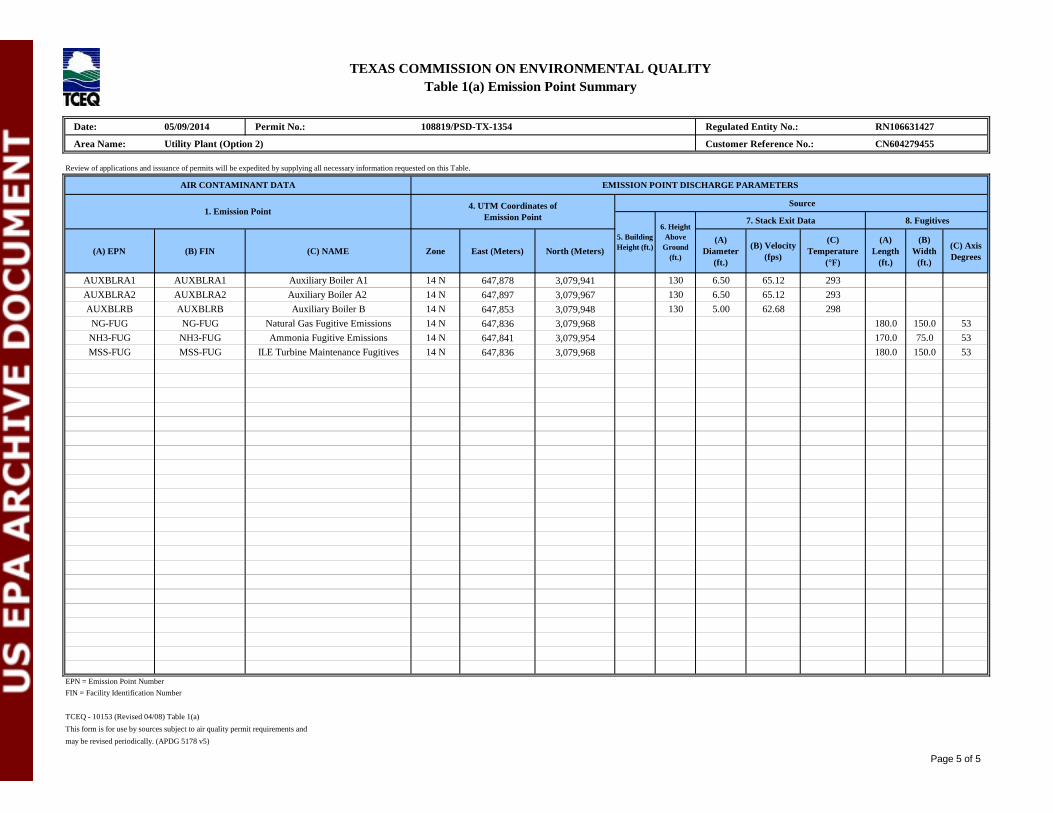
AUXBLRA1 AUXBLRA1 Auxiliary Boiler A1 14 N 647,878 3,079,941 130 6.50 65.12 293
AUXBLRA2 AUXBLRA2 Auxiliary Boiler A2 14 N 647,897 3,079,967 130 6.50 65.12 293
AUXBLRB AUXBLRB Auxiliary Boiler B 14 N 647,853 3,079,948 130 5.00 62.68 298
NG-FUG NG-FUG Natural Gas Fugitive Emissions 14 N 647,836 3,079,968 180.0 150.0 53
NH3-FUG NH3-FUG Ammonia Fugitive Emissions 14 N 647,841 3,079,954 170.0 75.0 53
MSS-FUG MSS-FUG ILE Turbine Maintenance Fugitives 14 N 647,836 3,079,968 180.0 150.0 53
EPN = Emission Point Number
FIN = Facility Identification Number
TCEQ - 10153 (Revised 04/08) Table 1(a)
This form is for use by sources subject to air quality permit requirements and
may be revised periodically. (APDG 5178 v5)
1. Emission Point 4. UTM Coordinates ofEmission Point
5. Building Height (ft.)
6. Height Above
Ground (ft.)
Page 5 of 5

AIR QUALITY PERMIT AMENDMENT APPLICATION CORPUS CHRISTI COMBINED HEAT AND POWER PLANT
M&G RESINS USA, LLC
Zephyr Environmental Corporation
Revised May 9, 2014
45
VIII. STATE REGULATORY REQUIREMENTS
VIII.A. COMPLIANCE WITH TCEQ RULES AND REGULATIONS
M&G will comply with all the rules and regulations of the TCEQ and the intent of the Texas Clean Air Act (TCAA), including protection of the health and physical property of the public. No schools are located within 3,000 feet of the site. Applicable rules and regulations of the Commission are discussed below. 30 TAC Chapter 101, Subchapter A – General Rules §101.2 Multiple Air Contaminant Sources or Properties – M&G will demonstrate through air dispersion modeling that the sources to be permitted will not cause or contribute to violations of any TCEQ standards. §101.3 Circumvention – M&G will not use any plan, activity, device, or contrivance that will, without resulting in an actual reduction of air contaminants, conceal or appear to minimize the effects of emissions which would otherwise constitute a violation of the TCAA or TCEQ regulations. §101.4 Nuisance – M&G will demonstrate through air dispersion modeling that discharges to the atmosphere from the Plant will not be in such concentration and of such duration that they will or may tend to be injurious to or adversely affect human health or welfare, animal life, vegetation, or property, or interfere with the normal use and enjoyment of animal life, vegetation, or property. §101.5 Traffic Hazard – No discharge of air contaminants, uncombined water or other materials from the Plant will cause or have a tendency to cause a traffic hazard or an interference with normal road use. §101.8 Sampling – All stack testing and sampling will meet requirements imposed by §101.8, and data will be reported and maintained as required. §101.9 Sampling Ports – M&G will comply with TCEQ requests for location of sampling ports in accordance with §101.9. §101.10 Emissions Inventory Requirements – M&G will submit emissions inventories as required by §101.10. §101.20 Compliance with Environmental Protection Agency Standards – As described in the sections which follow, M&G will comply with applicable requirements of New Source Performance Standards (40 CFR 60) and the National Emission Standards for Hazardous Air Pollutants for Source Categories (40 CFR 63). The Utility Plant is not subject to National Emissions Standards for Hazardous Air Pollutants under 40 CFR 61. The project is not located

AIR QUALITY PERMIT AMENDMENT APPLICATION CORPUS CHRISTI COMBINED HEAT AND POWER PLANT
M&G RESINS USA, LLC
Zephyr Environmental Corporation
Revised May 9, 2014
46
in a designated nonattainment area and is not subject to federal Nonattainment New Source Review (NNSR). However, the project will be a Major Stationary Source, as defined at 30 TAC §116.160, and will be subject to and will comply with Prevention of Significant Deterioration (PSD) requirements. §101.24-27 Fees – M&G will comply with all applicable requirements identified in this section and will pay the required fees and surcharges as specified. 30 TAC Chapter 101, Subchapter F – Emissions Events and Scheduled Maintenance, Startup, and Shutdown Activities §101.201 Emissions Event Reporting and Recordkeeping Requirements – M&G will follow the notification requirements in §101.201, should a reportable emissions event, as defined in §101.1, occur. §101.211 Scheduled Maintenance, Start-up and Shutdown Reporting, and Recordkeeping Requirements – M&G will comply with the provisions of §101.211 to the extent that they apply to the operation of the facilities described in this application. §101.221-§101.224 Operational Requirements, Demonstrations, and Excessive Emissions Events – M&G will comply with these provisions to the extent that they apply to the facilities described in this application. In particular, M&G will maintain in good working order and properly operate all pollution emission capture and abatement equipment. 30 TAC Chapter 111 – Control of Air Pollution from Visible Emissions and Particulate Matter §111.111(a) (1) Requirements for Specified Sources: Stationary Vents – Emissions from the combustion turbine stack will meet the requirement of §111.111(a) (1) (C) specifying an opacity limitation of 15 percent averaged over a six-minute period. Initial stack testing will be performed using EPA Method 9. Emissions from other vents at the site are not expected to exceed the six-minute opacity limit of 20 percent in §111.111(a)(1)(B). §111.111(a) (7) (A) Requirements for Specified Sources: Structures – Emissions from buildings, enclosed facilities and structures at the site will meet the opacity limitation of 30 percent averaged over a six-minute period. §111.151. Allowable Emissions Limits – Emissions of total suspended particulates from all sources with specific stack flow rates will be within the limits specified in §111.151(a), Table 1, based on calculated emission rates.

AIR QUALITY PERMIT AMENDMENT APPLICATION CORPUS CHRISTI COMBINED HEAT AND POWER PLANT
M&G RESINS USA, LLC
Zephyr Environmental Corporation
Revised May 9, 2014
47
30 TAC Chapter 112 – Control of Air Pollution from Sulfur Compounds §112.2. Compliance, Reporting, and Recordkeeping – M&G will maintain on site and submit all records requested by the TCEQ to demonstrate compliance with Chapter 112 SO2 limits. §112.3. Net Ground Level Concentrations – The only sources of SO2 at the Utility Plant will be the combustion of natural gas in the combustion turbine unit and boilers. Therefore, M&G will not cause the net ground level property line standard for SO2 to be exceeded. §112.41. Sulfuric Acid Emission Limits – The only source of H2SO4 at the Utility Plant will be the combustion of natural gas in the combustion turbine unit and boilers. Therefore, M&G will not cause the net ground level property line standard for H2SO4 to be exceeded. No other paragraphs in Chapter 112 apply to the Utility Plant. 30 TAC Chapter 113, Control of Air Pollution from Toxic Materials Chapter 113 incorporates by reference National Emission Standards for Hazardous Air Pollutants for Source Categories (40 CFR Part 63). Since the combined site for the proposed PET Plant and Utility Plant will be a major source for Hazardous Air Pollutants (HAPs), MACT Subpart YYYY, National Emission Standards for Hazardous Air Pollutants for Stationary Gas Turbines applies to the combustion turbine. However, in accordance with 40 CFR 63.6095(d), the Subpart YYYY emission standards are stayed for new lean premix gas-fired stationary combustion turbines and only the initial notification requirements of Subpart YYYY will be applicable to the M&G combustion turbine. Since the combined site for the proposed PET Plant and Utility Plant will be a major HAP source, MACT Subpart DDDDD, National Emission Standards for Hazardous Air Pollutants for Industrial, Commercial, and Institutional Boilers and Heaters will apply to the Heat Recovery Steam Generator, Auxiliary Boiler A1, Auxiliary Boiler A2, and Auxiliary Boiler B. M&G will comply with all applicable CO emissions limits, monitoring, recordkeeping and reporting requirements of this subpart. MACT Subpart UUUUU, National Emission Standards for Hazardous Air Pollutants: Coal and Oil Fired Electric Utility Steam Generating Units, does not apply to gas fired electric generating units. 30 TAC Chapter 114, Control of Air Pollution from Motor Vehicles The Utility Plant will comply with all applicable requirements of this regulation regarding inspection, maintenance and operation of air pollution control systems/devices for motor vehicles operated at the proposed facility.

AIR QUALITY PERMIT AMENDMENT APPLICATION CORPUS CHRISTI COMBINED HEAT AND POWER PLANT
M&G RESINS USA, LLC
Zephyr Environmental Corporation
Revised May 9, 2014
48
30 TAC Chapter 115, Control of Air Pollution from Volatile Organic Compounds The proposed combustion turbine power train, heat recovery steam generator and piping equipment fugitives are not process units covered under this regulation. Therefore, these rules do not apply. 30 TAC Chapter 116, Subchapter B. Control of Air Pollution by Permits for New Construction or Modification §116.111(a)(1) – PI-1 Form, General Application – This application provides complete information required by the TCEQ’s Form PI-1, General Application Form. As such, the completed form, signed by an authorized M&G representative, is included. All additional support information specified on the form is provided as part of this application or will be provided in the air dispersion modeling report, which will be submitted at a later date and after consultation with the TCEQ permit reviewer. §116.111(a)(2)(A) – Protection of Public Health and Welfare – As described in this application and in the air dispersion modeling report to be submitted, emissions from the Plant will comply with all the rules and regulations of the Commission and the intent of the TCAA, including protection of the health and physical property of the public. There are no schools located within 3,000 feet of the Plant. §116.111(a)(2)(B) – Measurement of Emissions – In addition to compliance with applicable NSPS requirements, M&G will measure emissions as described in Section VIII.B. of this application and install sampling ports in accordance with guidelines in the "Texas Commission on Environmental Quality (TCEQ) Sampling Procedures Manual." §116.111(a)(2)(C) – Best Available Control Technology (BACT) – As demonstrated in this application, best available control technology will be used to control emissions from the proposed facilities. §116.111(a)(2)(D) – Federal New Source Performance Standards (NSPS) – The combustion turbine and duct fired heat recovery steam generator will be subject to NSPS Subpart KKKK, Standards of Performance for Stationary Combustion Turbines. Auxiliary Boiler A1, Auxiliary Boiler A2, and Auxiliary Boiler B will be subject to NSPS Subpart Db, Standards of Performance for Industrial, Commercial, and Institutional Steam Generating Units, M&G will comply with all applicable emissions limits, monitoring, recordkeeping and reporting requirements of these subparts. §116.111(a)(2)(E) – National Emission Standards for Hazardous Air Pollutants (NESHAP) – The Utility Plant will not be subject to any of the provisions of 40 CFR Part 61.
AIR QUALITY PERMIT AMENDMENT APPLICATION CORPUS CHRISTI COMBINED HEAT AND POWER PLANT
M&G RESINS USA, LLC
Zephyr Environmental Corporation
Revised May 9, 2014
49
§116.111(a)(2)(F) – NESHAP for Source Categories, MACT Standards, 40 CFR Part 63 – Since the combined site for the proposed PET Plant and Utility Plant will be a major HPA source, MACT Subpart YYYY, National Emission Standards for Hazardous Air Pollutants for Stationary Gas Turbines applies to the combustion turbine. However, in accordance with 40 CFR 63.6095(d), the Subpart YYYY emission standards are stayed for new lean premix gas-fired stationary combustion turbines and only the initial notification requirements of Subpart YYYY will be applicable to the M&G combustion turbine. Since the combined site for the proposed PET Plant and Utility Plant will be a major HAP source, MACT Subpart DDDDD, National Emission Standards for Hazardous Air Pollutants for Industrial, Commercial, and Institutional Boilers and Heaters will apply to the Heat Recovery Steam Generator, Auxiliary Boiler A1, Auxiliary Boiler A2, and Auxiliary Boiler B. M&G will comply with all applicable CO emissions limits, monitoring, recordkeeping and reporting requirements of this subpart. §116.111(a)(2)(G) – Performance Demonstration – The Utility Plant will achieve the performance specified in the representations in this application and required by the permit. M&G will submit any additional information as may be required by the TCEQ to demonstrate that the represented performance will be achieved. §116.111(a)(2)(H) – Nonattainment Review – Nueces County is not located in a designated nonattainment area. Therefore, Nonattainment New Source Review (NNSR) will not apply to the proposed facilities. §116.111(a)(2)(I) – Prevention of Significant Deterioration (PSD) Review – Since the M&G Utility Plant will be a support facility for the adjoining PET Plant, the Utility Plant and PET Plant will be considered to be one stationary source for PSD applicability purposes. The combined Utility Plant and PET Plant site will be a major modification under 30 TAC §116.160. Therefore, a PSD permit is required for the PSD-regulated contaminants for which there will be a significant net emissions increase. Compliance with PSD permitting requirements is described in Section IX.E and the air dispersion modeling report to be submitted. BACT is discussed in Section VIII.C. of this application §116.111(a)(2)(J) – Air Dispersion Modeling – M&G will perform air dispersion modeling study that is expected to demonstrate compliance with applicable standards. This study will be completed upon acceptance of emissions calculations and proposed BACT by the TCEQ permit reviewer. §116.111(a)(2)(K) – Hazardous Air Pollutants – The case-by-case MACT requirements in Chapter 116, Subchapter E, do not apply because the United States Environmental Protection Agency has promulgated MACT standards under 40 CFR Part 63 which apply to the facilities in this application. §116.111(a)(2)(L) – Mass Cap and Trade Allowances – Nueces County is not subject to the Emissions Cap and Trade Program in Chapter 101, Subchapter H, Division 3.

AIR QUALITY PERMIT AMENDMENT APPLICATION CORPUS CHRISTI COMBINED HEAT AND POWER PLANT
M&G RESINS USA, LLC
Zephyr Environmental Corporation
Revised May 9, 2014
50
30 TAC Chapter 117, Control of Air Pollution from Nitrogen Compounds M&G will comply with the emission specifications for the combustion turbine contained in Chapter 117, Subchapter E, Division 1: Utility Electric Generation in East and Central Texas, 30 TAC Chapter 118, Control of Air Pollution Episodes The Utility Plant will be operated in compliance with orders of the Commission relating to generalized and localized air pollution episodes. 30 TAC Chapter 122, Federal Operating Permits M&G will apply for a Federal Operating Permit.

AIR QUALITY PERMIT AMENDMENT APPLICATION CORPUS CHRISTI COMBINED HEAT AND POWER PLANT
M&G RESINS USA, LLC
Zephyr Environmental Corporation
Revised May 9, 2014
51
VIII.B. MEASUREMENT OF EMISSIONS M&G will measure emissions of regulated air contaminants from the generating units through emissions performance testing, continuous emissions monitoring, and parameter monitoring. Emissions measurement and testing primarily will be those associated with the following standards:
New Source Performance Standard (40 CFR 60, Subpart Db), applicable to Auxiliary Boiler A1, Auxiliary Boiler A2, and Auxiliary Boiler B
New Source Performance Standard (40 CFR 60, Subpart KKKK), applicable to the natural gas-fired combustion turbine unit
Maximum Achievable Control Technology (40 CFR 63, Subpart DDDDD), applicable to the heat recovery steam generator, Auxiliary Boiler A1, Auxiliary Boiler A2, and Auxiliary Boiler B.
In addition, as discussed in Section VIII.C. of this application, M&G will employ procedures to continuously demonstrate compliance with the requirements of the permit for those pollutants/sources not subject to the New Source Performance Standards. The methods which will be used to continuously demonstrate compliance are summarized in the table below:
Table VIII.B-1 Methods of Compliance – Measurement of Emissions Source Pollutant Demonstration Method
Auxiliary Boilers A1, A2, and B
NOx Proper operation of units CO CEMs
SO2, H2SO4,
(NH4)2SO4 Use of gaseous fuel; keeping of records showing
fuel sulfur content PM/PM10/PM2.5 Proper operation of units
VOC Proper operation of units NH3 Method acceptable to TCEQ
CTG/HRSG
NOx CEMS CO CEMS
SO2, H2SO4,
(NH4)2SO4 Use of gaseous fuel; keeping of records showing
fuel sulfur content PM/PM10/PM2.5 Proper operation of units
VOC Proper operation of units NH3 Method acceptable to TCEQ
Piping Fugitives NH3 Audio/visual/olfactory observations

AIR QUALITY PERMIT AMENDMENT APPLICATION CORPUS CHRISTI COMBINED HEAT AND POWER PLANT
M&G RESINS USA, LLC
Zephyr Environmental Corporation
Revised May 9, 2014
52
VIII.C. BEST AVAILABLE CONTROL TECHNOLOGY (BACT) 1.0 Introduction This section presents the analysis of Best Available Control Technology (BACT) for emissions sources associated with the proposed project. The TCAA and 30 TAC §116.111(a)(2)(C) require that facilities use BACT, with consideration given to the technical practicability and economic reasonableness of reducing or eliminating the emissions from the facilities. M&G prepared this BACT analysis consistent with the TCEQ's 3-tier approach and its guidance provided in the TCEQ’s April 2001 document, Evaluating Best Available Control Technology (BACT) in Air Permit Applications (Draft RG-383). As such, the BACT analysis process involved answering the following questions:
Has the proposal been demonstrated to work in actual operation? Can the proposal reasonably be expected to work based on technical analysis? Is the project cost reasonable to achieve the emission reduction?
According to TCEQ guidance, the process begins at the first tier (i.e., emission performance levels accepted as BACT in recent permit reviews for the same process and/or industry) and continues sequentially through the second and third tiers only if BACT cannot be established through a Tier I analysis. As stated in the TCEQ’s RG-383 BACT guidance, “Tier I of the BACT evaluation involves a comparison of the applicant’s BACT proposal to emission reduction performance levels accepted as BACT in recent permit reviews”. RG-383 further indicates that the BACT review is complete if the Air Permits Division has not identified emission reduction options with better performance that should be evaluated. As will be presented in the following sections, BACT for the facilities at the Plant is established at the Tier I level. 2.0 BACT for the Natural Gas-Fired Combustion Turbines with Duct Burners The BACT determinations for the operation of the proposed combustion turbine and duct burners are based on the latest information available from the TCEQ and the EPA concerning the evaluation of BACT in permit applications for combustion turbine units. Additional relevant documentation that provided technical background information for the BACT assessment of the proposed units included the following:
The TCEQ’s Air Permit Reviewer Reference Guide, Air Pollution Control, How to Conduct a Pollution Control Evaluation, APDG 6110 (Jan. 2011)
TCEQ Combustion Sources – Current Best Available Control Technology (BACT) Requirements (July 2012)
The TCEQ “gas turbine permit list” (updated September 17, 2012)

AIR QUALITY PERMIT AMENDMENT APPLICATION CORPUS CHRISTI COMBINED HEAT AND POWER PLANT
M&G RESINS USA, LLC
Zephyr Environmental Corporation
Revised May 9, 2014
53
U.S. EPA RACT/BACT/LAER Clearinghouse (RBLC) listings for the “process type” or source category representative of the proposed project emission sources
Copies of these references are included in Appendix B to this application. As discussed in the Process Description section (VII.A.5.) of this application, the proposed generating unit will consist of one combustion turbine and one HRSG equipped with duct burners. Heat recovered by the HRSG will be utilized to produce steam, with this steam being provided to the neighboring PET plant. The specific model turbine to be constructed as part of the combustion turbine unit is the GE LM6000, which is an aeroderivative-type turbine. The emissions control methods and BACT-based emission rates proposed for this unit are consistent with the TCEQ BACT guidance. 2.1 NOx Emissions Emissions of NOx from the proposed combustion turbine will be generated through the oxidation of nitrogen in the high-temperature combustion zones. As a review of recently issued permits demonstrates, a combination of combustion and post-combustion controls are typically used to limit the emissions of NOx. TCEQ’s recent BACT determinations and BACT guidance for gas fired combustion turbines (with or without duct burner firing) reflect that dry low-NOX (DLN) combustors in combination with selective catalytic reduction (SCR) constitute BACT for NOx. DLN combustors are considered a combustion control as they are designed to minimize combustion temperatures by providing a lean pre-mixed air-fuel mixture prior to fuel combustion. This design minimizes fuel-rich pockets and allows the excess air to act as a heat sink. The lower temperatures inhibit NOx formation. SCR is a post-combustion technology that uses ammonia as a reagent to reduce oxides of nitrogen to molecular nitrogen and water in the presence of a catalyst. SCR systems must be operated in the HRSG within the temperature window at which the catalyst is effective; typically, between 500°F and 750°F. According to the TCEQ gas turbine permit list as well as the TCEQ’s current BACT requirements document, at the time of this submittal, Tier I BACT for NOx emissions in HRSG exhausts has been established at 2 ppmvd, corrected to 15% oxygen (with or without duct burner firing). According to the TCEQ’s Tier I BACT guidance, this limit is expressed as a 24-hr rolling average for gas turbines located in ozone NAAQS attainment counties. Equipment vendors are now able to ensure NOx levels of 2 ppmvd on an annual basis and 2 ppmvd on a 24-hr rolling average basis (both when corrected to 15% oxygen) with the use of DLN combustors in conjunction with SCR. M&G has corroborated this conclusion through discussions with its potential vendors. A search of the RBLC, which returned 42 natural gas-fired combustion turbine projects with NOx emission limits permitted within the last five years (more precisely, since January 1, 2007), substantiates the 2 ppmvd @ 15% O2 limit as BACT. Of those 42 projects, BACT limits for NOx

AIR QUALITY PERMIT AMENDMENT APPLICATION CORPUS CHRISTI COMBINED HEAT AND POWER PLANT
M&G RESINS USA, LLC
Zephyr Environmental Corporation
Revised May 9, 2014
54
are reported for 32. (Note that five of these 32 projects are located in ozone nonattainment areas in California and were subject to Nonattainment New Source Review (NNSR); therefore, in actuality, those determinations are considered LAER.) A review of the 27 facilities with BACT determinations located in ozone attainment areas shows that one involves the use of water injection (solely) and three involve the use of DLN combustors (solely) to control NOx emissions. The other facilities with BACT determinations involve the use of SCR, typically in combination with DLN combustors. The SCR-based BACT determinations show NOx emission limits ranging from 2.0 to 5.0 ppmvd @ 15% O2, i.e., none of the RBLC determinations resulted in NOx emission levels lower than 2.0 ppmvd @ 15% O2. Additionally, none of the BACT determinations on the TCEQ gas turbine permit list were for NOx emission levels lower than 2.0 ppmvd @ 15% O2. M&G proposes to satisfy BACT for NOx emissions from the proposed combustion turbine unit through use of DLN combustors and an aqueous ammonia (19% concentration)-based or anhydrous ammonia-based SCR system. With these emissions controls, NOx emissions from the unit will not exceed 2.0 ppmvd @ 15% O2, with or without duct burner firing. Compliance with this emissions limit would be demonstrated on a rolling 24-hour average basis and would exclude periods of startup and shutdown. This proposed limit is equivalent to the lowest BACT-based emission rate permitted for recent combustion turbine projects both inside and outside Texas; therefore, it satisfies TCEQ’s Tier I BACT. M&G will demonstrate that BACT for NOx is achieved through the initial stack testing of the combustion turbine unit and through the continuous monitoring of NOx emissions from the HRSG stack. 2.2 NH3 Emissions M&G will operate the SCR system in a manner that ammonia slip (i.e., the emission of unreacted ammonia to the atmosphere) is minimized while ensuring that the NOx emissions limits are met. Careful control of the ammonia injection system and operating parameters will be maintained to control ammonia slip in the HRSG exhaust stream to levels not exceeding 10 ppmvd on a 24-hour rolling average basis and 10 ppmvd on an annual average basis – levels represented by GE for their unit. This level of emissions control is within the BACT-based emissions range for ammonia slip associated with gas-fired combustion turbines (7 to 10 ppmvd @ 15% O2), as published by the TCEQ in its most recent combustion sources BACT requirements document. M&G will demonstrate that BACT for NH3 is achieved through the initial stack testing and through a monitoring method acceptable to the TCEQ.

AIR QUALITY PERMIT AMENDMENT APPLICATION CORPUS CHRISTI COMBINED HEAT AND POWER PLANT
M&G RESINS USA, LLC
Zephyr Environmental Corporation
Revised May 9, 2014
55
2.3 CO Emissions Combustion is a thermal oxidation process in which carbon and hydrogen in the fuel combine with oxygen to primarily form CO2 and water vapor. Emissions of CO are the result of incomplete combustion of the carbon in a fuel. The primary factors influencing the generation of CO emissions are temperature and residence time within the combustion zone. The TCEQ’s current Tier I BACT guidance for CO emissions from gas-fired combustion turbines (with or without duct burner firing), as reflected in its combustion source guidance and on its gas turbine list, is a limit of 2 to 4 ppmvd @ 15% O2 for units using oxidation catalysts and 4.0 ppmvd @ 15% O2, for units using only good combustion practices. A search of the RBLC returned 39 natural gas-fired combustion turbine projects with CO emission limits permitted within the last five years. Of those 39 projects, 20 were required to use some form of good or proper operation/combustion practices alone as BACT, 16 were required to use oxidation catalyst equipment as BACT (with or without good combustion practices), and, for three, no control method was specified. The CO emission limits associated with duct burner firing in the RBLC range from 1.7 to 25.0 ppmvd @ 15% O2; for units equipped with oxidation catalysts, this range narrows to 1.7 to 4.0 ppmvd @ 15% O2. The lowest CO emission limit – 1.7 ppmvd – cited for combustion turbine units in the RBLC is for the Kleen Energy Systems, LLC (KES) combined cycle power plant located in Middlesex County, Connecticut. (The KES permit also stipulates a CO emission limit of 0.9 ppmvd @ 15% O2 with no duct burner firing.) The next lowest CO emission limit in the RBLC associated with duct burner firing – 1.8 ppmvd @ 15% O2 – is for the Southern Company McDonough plant located in Cobb County, GA. However, both Middlesex and Cobb counties are located in ozone nonattainment areas, and the lower CO emission levels are an indirect benefit of the add-on control equipment used to minimize VOC emission levels to meet LAER. According to the RBLC, recent permits (issued in 2012) for combustion turbine units show a permitted CO emission limit of 4.0 ppmvd. Three of these projects were permitted in Texas. One of the four projects – Black Hills Power – Cheyenne Prairie – involved the permitting of GE LM6000 combustion turbines equipped with an oxidation catalyst. Based on the findings summarized above, M&G proposes to satisfy BACT for CO emissions from the proposed combustion turbine unit through use of an oxidation catalyst and operating procedures directed at the most efficient levels of operation, i.e., good combustion practices – controlled fuel/air mixing and sufficient temperature and gas residence time. With an oxidation catalyst and good combustion practices, CO emissions associated with the GE model turbine will not exceed 4 ppmvd @15% O2, with or without duct burner firing. The compliance basis for this emission limit would be a rolling 24-hour averaging period, and would exclude periods of startup and shutdown. M&G’s proposed CO emission rate is consistent with recent limits reported in the RBLC, especially for the GE LM6000 unit. Also, M&G’s proposed CO emission
AIR QUALITY PERMIT AMENDMENT APPLICATION CORPUS CHRISTI COMBINED HEAT AND POWER PLANT
M&G RESINS USA, LLC
Zephyr Environmental Corporation
Revised May 9, 2014
56
rate is at the high end of the range given in TCEQ’s current Tier I BACT guidance; therefore, the rate satisfies TCEQ’s Tier I BACT requirements. M&G will achieve BACT for CO through the use of an oxidation catalyst and through proper operation of the combustion turbine and will demonstrate that BACT has been achieved through the initial stack testing and through the continuous monitoring of CO emissions from the HRSG stack. 2.4 VOC Emissions Similar to CO emissions generation, VOC emissions will result from the incomplete combustion of the natural gas. The primary factors influencing the generation of VOC emissions are temperature and residence time within the combustion zone. The TCEQ’s current combustion source Tier I BACT requirements for VOC emissions from gas-fired combustion turbines, as reflected in its combustion source guidance and on its gas turbine list, is 2 ppmvd @ 15% O2 with no duct burner firing and 4 ppmvd @ 15% O2 with duct burner firing. A search of the RBLC returned 32 natural gas-fired combustion turbine projects with VOC emission limits permitted within the last five years. Of those 32 projects, BACT limits for VOC are reported for 23. (Note that three of these 23 projects are located in ozone nonattainment areas in various states and were subject to NNSR; therefore, in actuality, those determinations are considered LAER.) A review of the remaining 20 facilities with BACT limits shows that 10 are required to use some form of good or proper operation/combustion practices alone, six are required to use oxidation catalyst (in many cases, combined with good combustion practices), and four determinations did not specify a control method. The lowest BACT emission limits associated with duct burner firing in the RBLC range from 0.3 to 4.9 ppmvd @ 15% O2 regardless of the form of VOC controls. Interestingly, the lowest RBLC-listed emission limit of 0.3 ppmvd @ 15% O2, for the Associated Electric Cooperative Chouteau facility, is not given in the facility’s permit-to-construct; the only enforceable VOC emission limit (in the permit) is 5.27 lb/hr. The next lowest VOC emission limit – 1.5 ppmvd @ 15% O2 – cited in the RBLC for combustion turbine units with duct burner firing is associated with the Florida Power & Light West County (Units 1, 2, and 3) and the Progress Energy Florida Bartow facilities in Florida. Despite these permitted lower VOC emissions levels, the CO emissions were permitted at relatively elevated levels, on the order of 6 to 8 ppmvd @ 15% O2 (compared to the proposed 4 ppmvd level for the M&G combustion turbine unit). The balance of BACT emission limits in the RBLC range from 2 ppmvd to 4.9 ppmvd @ 15% O2 for units equipped with duct burners. Based on the findings in the RBLC, as summarized above, M&G is proposing the use of an oxidation catalyst and good combustion practices as BACT for VOC emissions. With these controls, VOC emissions will not exceed 4 ppmvd at @ 15% O2, with or without duct burner

AIR QUALITY PERMIT AMENDMENT APPLICATION CORPUS CHRISTI COMBINED HEAT AND POWER PLANT
M&G RESINS USA, LLC
Zephyr Environmental Corporation
Revised May 9, 2014
57
firing. Compliance with this emission limit would be based on a 3-hour average and would exclude periods of startup and shutdown. M&G’s proposed CO emission rate is consistent with recent limits reported in the RBLC, especially for the GE LM6000 unit. Also, M&G’s proposed CO emission rate is within the range given in TCEQ’s current Tier I BACT guidance; therefore, the rate satisfies TCEQ’s Tier I BACT requirements. M&G will demonstrate that BACT for VOC is achieved through the initial stack testing, with use of an oxidation catalyst, and with the proper operation of the combustion turbine and duct burners. 2.5 PM/PM10/PM2.5 Emissions In general, PM is emitted from combustion processes as a result of inorganic constituents contained in the fuel, particulate matter in the inlet air, and incomplete combustion of the organic constituents in the fuel. Because the combustion turbine and duct burners will fire only natural gas, PM/PM10/PM2.5 emissions are anticipated to be relatively low. Consistent with recent combustion turbine permits, for which the TCEQ has determined that firing pipeline quality natural gas is BACT for PM, M&G will fire pipeline-quality natural gas and apply good combustion controls to minimize emissions of PM/PM10/PM2.5 from the proposed unit. Therefore, the use of pipeline-quality natural gas and the application of good combustion controls for the M&G units constitute BACT for PM/PM10/PM2.5. M&G will demonstrate that BACT for PM/PM10/PM2.5 is achieved through the initial stack testing with the and proper operation of the combustion turbine and duct burners. 2.6 Sulfur Compound Emissions Emissions of SO2 will occur as a result of oxidation of sulfur in the natural gas fired in the combustion turbine and duct burners, with the majority of the sulfur converted to SO2 and a portion to H2SO4 and (NH4)2SO4 (the latter being a conversion contribution due to operation of the SCR system). Consistent with recent combustion turbine permits, for which the TCEQ has determined that firing pipeline quality natural gas is BACT for sulfur compounds, M&G will minimize the formation and emissions of SO2 and other sulfur oxide compounds by using pipeline-quality natural gas. The sulfur content of this natural gas will not exceed 5 grains per 100 standard cubic feet on an hourly basis and 1 grain per 100 standard cubic feet on an annual average basis. M&G will demonstrate that BACT for SOx compounds is achieved through the maintenance of records of contractual limits on sulfur content; valid purchase contracts, tariff sheets, or transportation contracts showing the sulfur content of the fuel.

AIR QUALITY PERMIT AMENDMENT APPLICATION CORPUS CHRISTI COMBINED HEAT AND POWER PLANT
M&G RESINS USA, LLC
Zephyr Environmental Corporation
Revised May 9, 2014
58
2.7 Maintenance, Startup, and Shutdown Emissions Operation of the combustion turbine and duct burners will result in emissions from startups and shutdowns of the units. However, the units will be started up and shut down in a manner that minimizes the emissions during these events. BACT will be achieved by 1) limiting the duration of each startup and shutdown; and 2) engaging the pollution control equipment (e.g., the SCR and oxidation catalyst systems) as soon as practicable, based on vendor recommendations. The Process Description section of this application describes typical durations of startups and shutdowns of the units. The startup and shutdown duration time for the combustion turbine is still being developed and will be submitted later in the permit application review process. 3.0 BACT for Turbine Oil Mist Vent Emissions The heating of recirculating lubrication oil in the combustion turbine and steam turbine housing generates oil vapor and oil condensate droplets in the oil reservoir compartments. The venting of turbine lubrication oil is a minor source of VOC and PM emissions. These emissions will be controlled with oil mist eliminators, which are BACT for emissions from these vents. 4.0 BACT for Fugitive Natural Gas Component Leaks Fugitive VOC emissions were estimated for metering, compression, and piping components in natural gas service. M&G proposes that the proper design of the fuel delivery and handling system and the use of best operating practices satisfy the requirements of BACT for fugitive emissions from natural gas system components. 5.0 BACT for Ammonia Component Leaks To ensure that fugitive emissions from the piping components in ammonia service are adequately controlled, M&G will follow an audio, visual, and olfactory (AVO) inspection and maintenance program, performing an inspection once every 12 hours. This program will meet the requirements of the TCEQ’s technical guidance package for chemical source equipment leak fugitives. Therefore, the proposed program will meet or exceed the requirements of BACT. M&G will demonstrate that BACT for fugitive NH3 emissions is achieved through the keeping of records of the AVO inspections and maintenance activities.
AIR QUALITY PERMIT AMENDMENT APPLICATION CORPUS CHRISTI COMBINED HEAT AND POWER PLANT
M&G RESINS USA, LLC
Zephyr Environmental Corporation
Revised May 9, 2014
59
6.0 BACT for Auxiliary Boilers The proposed project includes three natural gas-fired auxiliary boilers: 445-MMBtu/hr Auxiliary Boiler A1, 445-MMBtu/hr Auxiliary Boiler A2, and 250-MMBtu/hr Auxiliary Boiler B. Each boiler will be authorized to operate up to 8,760 hours per year. For each auxiliary boiler, M&G is proposing a maximum NOx emission rate of 0.01 lb/MMBtu based on the use of SCR, low-NOx burners, and proper operation and maintenance of the boiler. A review of the RBLC listing for natural gas-fired boilers with a heat input of between 25 and 1,000 MMBtu/hr and located in an ozone attainment area (see Appendix B) shows that the NOx emission rate proposed by M&G is less than the lowest permit limits. M&G also is proposing a maximum CO emission rate of 0.0366 lb/MMBtu (50 ppmvd @ 3% O2) based on the proper operation and maintenance of the boiler. A review of the RBLC listing for natural gas-fired boilers with a heat input of between 25 and 1,000 MMBtu/hr and located in an ozone attainment area shows two CO emission limits lower than the level proposed by M&G. (Note that the location of a source in an ozone nonattainment area typically will dictate lower VOC emissions for that source to comply with LAER requirements; the techniques, practices and equipment used to reduce VOC emissions will yield lower CO emissions as well.) However, because these limits are associated with projects that, to date, have not been constructed, compliance with these limits has not been demonstrated in practice. The CO emission rate proposed by M&G is nearly equivalent to the next lowest permit limit (0.035 lb/MMBtu) listed in the RBLC. Emissions of VOC, particulate matter, and sulfur compounds will be reduced through good combustion practices and firing pipeline quality natural gas. M&G proposes that the use of SCR, low-NOx burners, firing of pipeline quality natural gas, and the proper operation and maintenance of the unit constitute Tier I BACT for this auxiliary boiler. M&G will demonstrate that BACT is achieved through the keeping of records of operations and maintenance for each auxiliary boiler and the keeping of records of valid purchase contracts tariff sheets or transportation contracts for the fuel that show its sulfur content.
AIR QUALITY PERMIT AMENDMENT APPLICATION CORPUS CHRISTI COMBINED HEAT AND POWER PLANT
M&G RESINS USA, LLC
Zephyr Environmental Corporation
Revised May 9, 2014
61
IX. FEDERAL REGULATORY REQUIREMENTS
IX.A. NEW SOURCE PERFORMANCE STANDARDS
NSPS Subpart Db, Standards of Performance for Industrial-Commercial-Institutional Steam Generating Units will apply to the Auxiliary Boiler A1, Auxiliary Boiler A2, and Auxiliary Boiler B. NSPS Subpart KKKK, Standards of Performance for Stationary Combustion Turbines will apply to the CTG/HRSG unit.

AIR QUALITY PERMIT AMENDMENT APPLICATION CORPUS CHRISTI COMBINED HEAT AND POWER PLANT
M&G RESINS USA, LLC
Zephyr Environmental Corporation
Revised May 9, 2014
63
IX.C. MAXIMUM ACHIEVABLE CONTROL TECHNOLOGIES FOR NESHAP SOURCE CATEGORIES
Since the combined site for the proposed PET Plant and Utility Plant will be a major HAP source, MACT Subpart YYYY, National Emission Standards for Hazardous Air Pollutants for Stationary Gas Turbines applies to the combustion turbine. However, in accordance with 40 CFR 63.6095(d), the Subpart YYYY emission standards are stayed for new lean premix gas-fired stationary combustion turbines and only the initial notification requirements of Subpart YYYY will be applicable to the M&G combustion turbine. Since the combined site for the proposed PET Plant and Utility Plant will be a major HAP source, MACT Subpart DDDDD, National Emission Standards for Hazardous Air Pollutants for Industrial, Commercial, and Institutional Boilers and Heaters will apply to the Heat Recovery Steam Generator, Auxiliary Boiler A1, Auxiliary Boiler A2, and Auxiliary Boiler B. M&G will comply with all applicable CO emissions limits, monitoring, recordkeeping and reporting requirements of this subpart.

AIR QUALITY PERMIT AMENDMENT APPLICATION CORPUS CHRISTI COMBINED HEAT AND POWER PLANT
M&G RESINS USA, LLC
Zephyr Environmental Corporation
Revised May 9, 2014
65
IX.E. PREVENTION OF SIGNIFICANT DETERIORATION PERMITTING REQUIREMENTS Since the M&G Utility Plant will be a support facility for the adjoining PET Plant, the Utility Plant and PET Plant will be considered to be one stationary source for PSD applicability purposes. The combined Utility Plant and PET Plant site will be a “major source” under 40 CFR §52.21; thus, a PSD review is required for all PSD-regulated contaminants for which there will be a significant net emissions increase. Based on a comparison between the combined potentials to emit for the Utility Plant and PET Plant and the PSD thresholds, PSD review is triggered for NOx, VOC, CO, PM, PM10, PM2.5, and greenhouse gas emissions (GHG). PSD netting tables for the M&G Utility emissions are included in Tables 1F and 2F, provided in Appendix D. Separate GHG PSD applications are being submitted to U.S. Environmental Protection Agency Region 6. Aspects of the PSD analysis related to impacts on soils, vegetation, visibility, and Class I areas, as well as the demonstration that the proposed project will not cause exceedances of the NAAQS and the PSD increments will be included in the air quality analysis report (the dispersion modeling analysis) to be provided as a separate submittal.

AIR QUALITY PERMIT AMENDMENT APPLICATION CORPUS CHRISTI COMBINED HEAT AND POWER PLANT
M&G RESINS USA, LLC
Zephyr Environmental Corporation
Revised May 9, 2014
APPENDIX A EMISSION CALCULATIONS

REFERENCE CASE NUMBER Case 1CT Case 2CT Case 3CT Case 4CT Case 5CT Case 6CT Case 7CT Case 8CT Case 9CT Case 10CT
20°F, 100% load, duct firing on, inlet chiller
off
71°F, 100% load, duct firing on, inlet chiller
off
100°F, 100% load, duct firing on, inlet chiller
off
100% load, duct firing on, 55°F inlet air with
chiller on
20°F, 75% load, duct firing off, inlet chiller off
71°F, 75% load, duct firing off, inlet chiller off
100°F, 75% load, duct firing off, inlet chiller
off
20°F, 50% load, duct firing off, inlet chiller off
71°F, 50% load, duct firing off, inlet chiller off
100°F, 50% load, duct firing off, inlet chiller
off
GE LM6000
Gas Fired Emission Estimates (per CT/HRSG)
TABLE A-1GAS TURBINE CALCULATIONS
UTILITY PLANT
SITE CONDITIONS
Ambient Temperature °F 20 71 100 100 20 71 100 20 71 100
Relative Humidity % 45 81 45 45 45 81 45 45 81 45
Site Elevation feet
Atmospheric Pressure psia 14.68 14.68 14.68 14.68 14.68 14.68 14.68 14.68 14.68 14.68
FACILITY CONDITIONS
CT Fuel Type Natural Gas Natural Gas Natural Gas Natural Gas Natural Gas Natural Gas Natural Gas Natural Gas Natural Gas Natural Gas
CT Model GE-LM6000 GE-LM6000 GE-LM6000 GE-LM6000 GE-LM6000 GE-LM6000 GE-LM6000 GE-LM6000 GE-LM6000 GE-LM6000
CT Load %
CT Evaporative Coolers ON/OFF
CT Gross Power Output kW 49,075 43,843 36,260 45,687 36,806 32,883 27,199 24,538 21,922 18,130
CT Heat Consumption (LHV) MMBtu/hr 437 406 351 419.00 356 322 288.00 283.0 255 232
CT Heat Consumption (HHV) MMBtu/hr 485.0 451.0 390 465.00 395 358 319.00 314.0 283 258
CT Fuel Flow Rate lb/hr 21,125 19,644 16,987 20,254 17,205 15,593 13,894 13,677 12,326 11,237
CT Fuel Flow Rate scf/hr 475,263.47 441,946.03 382,170.62 455,664.97 387,070.25 350,813.03 312,595.97 307,696.35 277,318.68 252,820.57
CT Exhaust Gas Flow Rate lb/hr 1,193,535.0 1,093,704.0 959,677 1,126,456.00 1,110,185 1,044,470 879,438.00 922,397.0 820,183 765,180
CT Exhaust Gas Temperature °F 838.0 863.0 898 853.00 854 873 923.00 891.0 944 970
DB Heat Consumption (HHV) MMBtu/hr 263.0 235.6 196.5 245.3 204.7 198.8 155.9 166.7 138.0 123.0
DB Fuel Flow Rate lb/hr 11,455 10,262 8,559 10,684 8,916 8,659 6,790 7,261 6,011 5,357
DB Fuel Flow Rate scf/hr 257,720 230,870 192,555 240,376 200,591 194,809 152,770 163,353 135,230 120,531
Fuel HHV Btu/lb 22,959 22,959 22,959 22,959 22,959 22,959 22,959 22,959 22,959 22,959
Fuel HHV Btu/ft3 1,020.5 1,020.5 1,020.5 1,020.5 1,020.5 1,020.5 1,020.5 1,020.5 1,020.5 1,020.5
COMBUSTION TURBINE EXHAUST ANALYSIS
Argon, Ar 39.948 % vol 0.900 0.870 0.860 0.870 0.900 0.890 0.860 0.900 0.890 0.880
Nitrogen, N2 28.014 % vol 75.56 72.99 72.47 73.25 75.86 74.49 72.62 75.94 74.48 73.89
Oxygen, O2 31.998 % vol 14.21 13.52 13.49 13.57 15.04 14.91 14.15 15.29 14.87 14.85
Carbon Dioxide, CO2 44.009 % vol 3.12 3.12 3.07 3.13 2.74 2.62 2.75 2.63 2.64 2.57
Water, H2O 18.015 % vol 6.16 9.45 10.06 9.13 5.41 7.05 9.57 5.20 7.09 7.77
Total 99.95 99.95 99.95 99.95 99.95 99.96 99.95 99.96 99.97 99.96
Molecular weight lb/lbmol 28.56 28.20 28.13 28.23 28.60 28.42 28.15 28.62 28.42 28.33
DUCT BURNER EFFECTS
CTG EXHAUST FLOW, mol/hr 41,795 38,789 34,122 39,900 38,812 36,755 31,242 32,229 28,862 27,006
INLET OXYGEN (mol/hr) 5,939 5,244 4,603 5,414 5,837 5,480 4,421 4,928 4,292 4,010
INLET CARBON DIOXIDE (mol/hr) 1,304 1,210 1,048 1,249 1,063 963 859 848 762 694
INLET WATER (mol/hr) 2,575 3,666 3,433 3,643 2,100 2,591 2,990 1,676 2,046 2,098
INLET NITROGEN (mol/hr) 31,581 28,312 24,728 29,227 29,443 27,379 22,688 24,475 21,496 19,955
INLET ARGON (mol/hr) 376 337 293 347 349 327 269 290 257 238
DB FUEL FLOW, lb/hr 11,455 10,262 8,559 10,684 8,916 8,659 6,790 7,261 6,011 5,357
DB FUEL FLOW, mol/hr 679 608 507 633 529 513 403 430 356 318
OXYGEN CONSUMED, mol/hr 1,372 1,229 1,025 1,280 1,068 1,037 814 870 720 642
CO2 PRODUCED, mol/hr 692 620 517 645 538 523 410 438 363 324
H2O PRODUCED, mol/hr 1,361 1,219 1,017 1,270 1,060 1,029 807 863 714 637
EXIT OXYGEN (mol/hr) 4,567 4,015 3,578 4,134 4,769 4,443 3,607 4,058 3,572 3,369
EXIT CARBON DIOXIDE (mol/hr) 1,996 1,830 1,564 1,894 1,602 1,486 1,269 1,286 1,125 1,018
EXIT WATER (mol/hr) 3,936 4,885 4,450 4,913 3,159 3,620 3,797 2,539 2,761 2,735
EXIT NITROGEN (mol/hr) 31,581 28,312 24,728 29,227 29,443 27,379 22,688 24,475 21,496 19,955
EXIT ARGON (mol/hr) 376 337 293 347 349 327 269 290 257 238
EXIT EXHAUST FLOW, lbm/hr 1,204,990 1,103,966 968,236 1,137,140 1,119,101 1,053,129 886,228 929,658 826,194 770,537
EXIT OXYGEN (% VOL) 10.76 10.20 10.34 10.20 12.13 11.93 11.40 12.43 12.23 12.33
EXIT CARBON DIOXIDE (% VOL) 4.70 4.65 4.52 4.68 4.07 3.99 4.01 3.94 3.85 3.73
EXIT WATER (% VOL) 9.27 12.41 12.86 12.13 8.03 9.72 12.00 7.78 9.45 10.01
EXIT NITROGEN (% VOL) 74.39 71.90 71.44 72.14 74.88 73.49 71.73 74.97 73.59 73.06
EXIT ARGON (% VOL) 0.89 0.86 0.85 0.86 0.89 0.88 0.85 0.89 0.88 0.87
EXIT MOLECULAR WEIGHT 28.38 28.03 27.97 28.07 28.46 28.27 28.02 28.48 28.28 28.21
Exit Flow Rate SCFH 16,366,452 15,180,551 13,343,342 15,618,382 15,158,907 14,361,688 12,193,267 12,585,633 11,260,578 10,529,407
Exit Flow Rate scfh dry 14,849,161 13,297,384 11,627,970 13,724,600 13,941,001 12,966,091 10,729,601 11,606,940 10,196,366 9,475,052
Revised 05/09/2014

REFERENCE CASE NUMBER Case 1CT Case 2CT Case 3CT Case 4CT Case 5CT Case 6CT Case 7CT Case 8CT Case 9CT Case 10CT
20°F, 100% load, duct firing on, inlet chiller
off
71°F, 100% load, duct firing on, inlet chiller
off
100°F, 100% load, duct firing on, inlet chiller
off
100% load, duct firing on, 55°F inlet air with
chiller on
20°F, 75% load, duct firing off, inlet chiller off
71°F, 75% load, duct firing off, inlet chiller off
100°F, 75% load, duct firing off, inlet chiller
off
20°F, 50% load, duct firing off, inlet chiller off
71°F, 50% load, duct firing off, inlet chiller off
100°F, 50% load, duct firing off, inlet chiller
off
GE LM6000
Gas Fired Emission Estimates (per CT/HRSG)
TABLE A-1GAS TURBINE CALCULATIONS
UTILITY PLANT
HRSG STACK EMISSIONS AT 1 GRAINS/100 SCF FUEL SULFUR CONTENT (Based on USEPA Test Methods):
NOX, ppmvd @ 15% O2 2.0 2.0 2.0 2.0 2.0 2.0 2.0 2.0 2.0 2.0
NOx, ppmvd 3.1 3.1 3.1 3.1 2.6 2.6 2.7 2.5 2.5 2.4
NOX, lbm/hr as NO2 5.4 5.0 4.3 5.2 4.3 4.0 3.4 3.5 3.1 2.8
NH3, ppmvd @ 15% O2 10.0 10.0 10.0 10.0 10.0 10.0 10.0 10.0 10.0 10.0
NH3, ppmvd 15.3 15.7 15.3 15.7 13.1 13.0 13.5 12.6 12.5 12.2
NH3, lbm/hr 10.1 9.2 7.9 9.5 8.1 7.5 6.4 6.5 5.6 5.1
CO, ppmvd @ 15% O2 4.0 4.0 4.0 4.0 4.6 4.7 4.5 5.6 5.5 5.6
CO, ppmvd 6.1 6.3 6.1 6.3 6.0 6.1 6.1 7.0 6.9 6.8
CO, lbm/hr 6.6 6.1 5.2 6.3 6.1 5.8 4.7 5.9 5.1 4.7
SO2, lbm/hr 2.1 1.9 1.6 2.0 1.7 1.6 1.3 1.3 1.2 1.1
VOC, ppmvd @ 15% O2 as CH4 4 4 4 4.0 4.0 4.0 4.0 4.0 4.0 4.0
VOC, ppmvd 6.1 6.3 6.1 6.3 5.2 5.2 5.4 5.0 5.0 4.9
VOC, lbm/hr as CH4 3.8 3.5 3.0 3.6 3.0 2.8 2.4 2.4 2.1 1.9
Particulates from Turbine, lbm/hr 4.1 4.1 4.1 4.1 4.1 4.1 4.1 4.1 4.1 4.1
Particulates from Duct Burner, lbm/hr 2.6 2.36 1.97 2.45 2.05 1.99 1.56 1.67 1.38 1.23
Conversion of SO2 to SO3 35% 35% 35% 35% 35% 35% 35% 35% 35% 35%
H2SO4 exclusively, lbm/hr 1.1 1.0 0.9 1.1 0.9 0.8 0.7 0.7 0.6 0.6
(NH4)2SO4 exclusively, lbm/hr 1.5 1.4 1.2 1.4 1.2 1.1 1.0 1.0 0.9 0.8
Total Particulates From Stack, lbm/hr 8.2 7.8 7.2 8.0 7.4 7.2 6.6 6.7 6.3 6.1
Stack Conditions (per CT/HRSG)
Stack Height ft 130 130 130 130 130 130 130 130 130 130
Internal Diameter ft 10.0 10.0 10.0 10.0 10.0 10.0 10.0 10.0 10.0 10.0
Flow scfm 272,774 253,009 222,389 260,306 252,648 239,361 203,221 209,761 187,676 175,490
Temperature oF 341 337 333 339 364 364 359 357 354 353
Flow acfm 413,811 381,910 334,005 393,911 394,285 373,549 315,224 324,573 289,334 270,215
Exit Velocity ft/s 87.81 81.04 70.88 83.59 83.67 79.27 66.89 68.88 61.40 57.34
Revised 05/09/2014

TABLE A-2GAS TURBINE HOURLY EMISSION SUMMARY
UTILITY PLANT
PollutantMax Hourly
Emissions During Normal Operations
GE Reference Case Number
Annual Average Hourly Emissions
During Normal Operations
GE Reference Case Number
(lb/hr) (lb/hr)
NOX 5.43 Case 1CT: 20°F, 100% load, duct firing on, inlet chiller off 5.16 Case 4CT: 100% load, duct firing on, 55°F inlet air with chiller on
CO 6.61 Case 1CT: 20°F, 100% load, duct firing on, inlet chiller off 6.28 Case 4CT: 100% load, duct firing on, 55°F inlet air with chiller on
VOC 3.78 Case 1CT: 20°F, 100% load, duct firing on, inlet chiller off 3.59 Case 4CT: 100% load, duct firing on, 55°F inlet air with chiller on
SO22.09 Case 1CT: 20°F, 100% load, duct firing on, inlet chiller off, 5 gr S/100 scf Natural Gas 1.99
Case 4CT: 100% load, duct firing on, 55°F inlet air with chiller on, 1 gr S/100 scf Natural Gas
PM/PM10/PM2.58.24 Case 1CT: 20°F, 100% load, duct firing on, inlet chiller off, 5 gr S/100 scf Natural Gas 7.99
Case 4CT: 100% load, duct firing on, 55°F inlet air with chiller on, 1 gr S/100 scf Natural Gas
H2SO4 1.12 Case 1CT: 20°F, 100% load, duct firing on, inlet chiller off, 5 gr S/100 scf Natural Gas 1.06
Case 4CT: 100% load, duct firing on, 55°F inlet air with chiller on, 1 gr S/100 scf Natural Gas
(NH4)2SO41.51 Case 1CT: 20°F, 100% load, duct firing on, inlet chiller off, 5 gr S/100 scf Natural Gas 1.43
Case 4CT: 100% load, duct firing on, 55°F inlet air with chiller on, 1 gr S/100 scf Natural Gas
NH3 10.06 Case 1CT: 20°F, 100% load, duct firing on, inlet chiller off 9.54 Case 4CT: 100% load, duct firing on, 55°F inlet air with chiller on
Revised 05/09/2014

TABLE A-3GAS TURBINE ANNUAL EMISSION SUMMARY
UTILITY PLANT
PollutantAnnual Emissions
Based on 8,760 hrs/yr of Normal Operations
Estimated Annual Emissions From SS
Operations
Estimated SS Annual Operating
Hours1
Pro-Rated Annual Emissions
(tons/yr) (tons/yr) (hrs/yr) (tons/yr)
NOX 22.58 11.75 500 33.05
CO 27.49 50.90 500 76.82
VOC 15.71 3.75 500 18.56
SO2 8.70 --- --- 8.70
PM/PM10/PM2.5 34.98 --- --- 34.98
H2SO4 4.66 --- --- 4.66
(NH4)2SO4 6.28 --- --- 6.28NH3 41.80 --- --- 41.80
05/09/2014
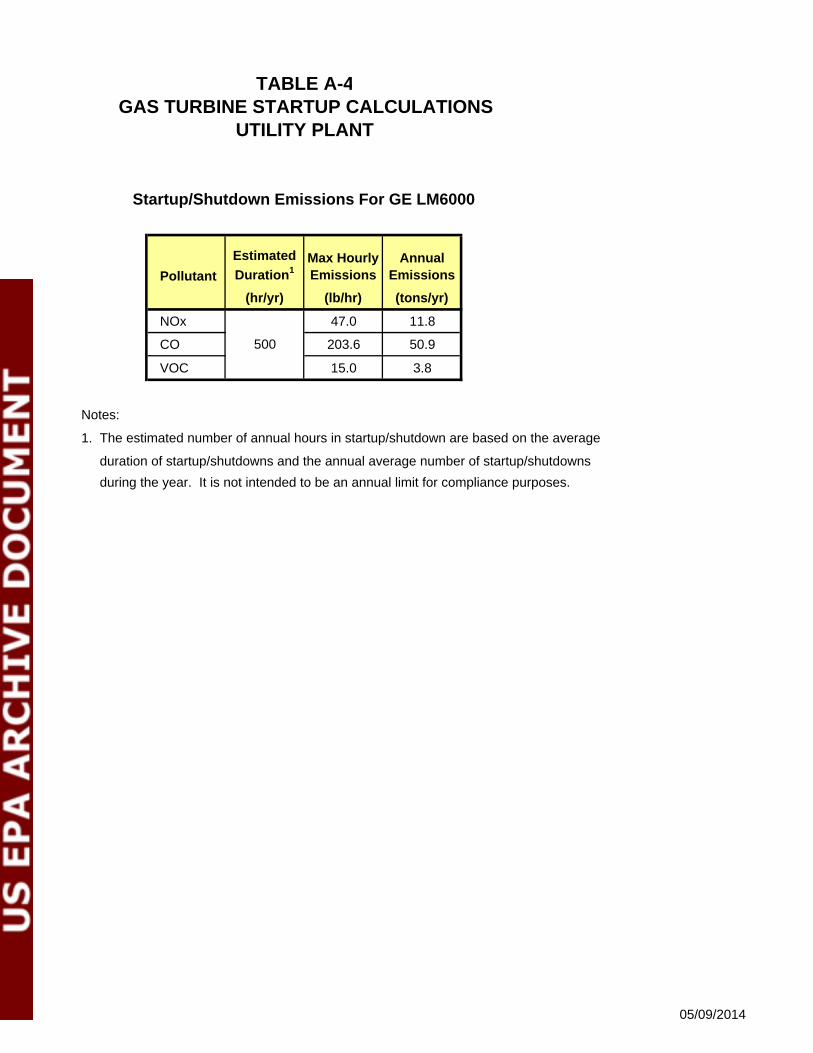
Pollutant
Estimated
Duration1Max Hourly Emissions
Annual Emissions
(hr/yr) (lb/hr) (tons/yr)
NOx 47.0 11.8
CO 203.6 50.9
VOC 15.0 3.8
Notes:
1. The estimated number of annual hours in startup/shutdown are based on the average
duration of startup/shutdowns and the annual average number of startup/shutdowns
during the year. It is not intended to be an annual limit for compliance purposes.
500
TABLE A-4GAS TURBINE STARTUP CALCULATIONS
UTILITY PLANT
Startup/Shutdown Emissions For GE LM6000
05/09/2014

TABLE A-6SAMPLE EMISSION CALCULATION - TURBINE AND DUCT BURNER
UTILITY PLANT
13,724,600 scfh dry465 MMBtu / hr, HHV245 MMBtu / hr, HHV
1,020.5 Btu / scf, HHV10.20 % O2 wet12.13 % H2O385.5 scf / lbmole
Convert Oxygen Concentration to Dry Basis
10.2 % wet(1 - (12.13 /100))
Fuel Gas Usage
CTG NG Flow = 465 MMBtu HHV 1,000,000 Btu scfhr MMBtu 1020.5 Btu
DB RG Flow = 245 MMBtu HHV 1,000,000 Btu scfhr MMBtu 1020.5 Btu
Sample Calculation - NOx
Emission Factor 2.0 ppmvd NOx @ 15% O2
NO2 MW 46.00 lb / lbmole
Emission Factor Corrected for Actual Oxygen Concentration - Oxides of Nitrogen
2 ppmd @ 15% ( 20.9 - 11.61 )( 20.9 - 15 )
Emission Rate Calculation - Oxides of Nitrogen
3.15 scf NOx 13724600 scf exhaust lbmole NOx 46 lb NOx = 5.16 lb/hr NOx as NO21,000,000 scf exhaust hr 385.5 scf NOx lbmole NOx
Sample Calculation - NH3
Emission Factor 10 ppmvd @ 15% O2
NH3 MW 17.03 lb / lbmole
Emission Factor Corrected for Actual Oxygen Concentration - Ammonia
10 ppmd @ 15% ( 20.9 - 11.61 )( 20.9 - 15 )
Emission Rate Calculation - Ammonia
15.74 scf NH3 13724600 scf exhaust lbmole NH3 17.03 lb NH3 = 9.54 lb/hr NH31,000,000 scf exhaust hr 385.5 scf NH3 lbmole NH3
Sample Calculation - CO
Emission Factor 4.0 ppmvd CO @ 15% O2
CO MW 28.00 lb / lbmole
Emission Factor Corrected for Actual Oxygen Concentration - CO
4 ppmd @ 15% ( 20.9 - 11.61 )( 20.9 - 15 )
CTG Heat InputDB Heat InputNatural Gas
Case 4CT: 100% load, duct firing on, 55°F inlet air with chiller onExhaust Flow Rate
O2 = = 11.61 % dry
= 455665 scfh
= 240376 scfh
Exhaust ContentExhaust Content
Gas Constant
Factor = = 3.15 ppmvd NOX
Emissions =
Factor = = 15.74 ppmvd NH3
Emissions =
Factor = = 6.3 ppmvd CO
Revised 05/09/2014

TABLE A-6SAMPLE EMISSION CALCULATION - TURBINE AND DUCT BURNER
UTILITY PLANT
Emission Rate Calculation - CO
6.3 scf CO 13724600 scf exhaust lbmole CO 28 lb CO = 6.28 lb/hr CO1,000,000 scf exhaust hr 385.5 scf CO lbmole CO
Sample Calculation - VOC
Emission Factor 4.0 ppmvd VOC @ 15% O2
CH4 MW 16.00 lb / lbmole
Emission Factor Corrected for Actual Oxygen Concentration - VOC
4 ppmd @ 15% ( 20.9 - 11.61 )( 20.9 - 15 )
Emission Rate Calculation - VOC
6.3 scf VOC 13724600 scf exhaust lbmole VOC 16 lb VOC = 3.59 lb/hr VOC1,000,000 scf exhaust hr 385.5 scf VOC lbmole VOC
Sample Calculation - SO2, H2SO4 and (NH4)2SO4
Emission Factor 1 grain S / 100 scf, Annual Avg Natural GasS MW 32.06 lb / lbmole
SO2 MW 64.06 lb / lbmole
H2SO4 MW 98.07 lb / lbmole
(NH4)2SO4 MW 132.13 lb / lbmole
Conversion of SO2 to SO3 35%
Sample Calculation - Sulfur Dioxide (SO2)
1 grain S lb 455665 scf 64.06 lbmole SO2100 scf 7000 grain hr 32.06 lbmole S
1 grain S lb 240376 scf 64.06 lbmole SO2100 scf 7000 grain hr 32.06 lbmole S
Emissions = 1.301 lb/hr SO2 + 0.686 lb/hr SO2 = 1.99 lb/hr SO2CTG DB, Natural Gas
Sample Calculation - Sulfuric Acid (H2SO4)
Assume 35% SO2 converts to SO3
Assume 100% SO3 converts to H2SO4
1.987 lb SO2 lbmole SO2 0.35 lbmole H2SO4 98.07 lb H2SO4 = 1.06 lb/hr H2SO4hr 64.06 lb SO2 lbmole SO2 lbmole H2SO4
Sample Calculation - Ammonium Sulfate ((NH4)2SO4)
Assume 100% of H2SO4.converts to (NH4)2SO4.
1.0645 lb H2SO4 lbmole H2SO4 lbmole (NH4)2SO4 132.13 lb (NH4)2SO4 = 1.43 lb/hr (NH4)2SO4hr 98.07 lb H2SO4 lbmole H2SO4 lbmole (NH4)2SO4
ST Emissions =
ST Emissions =
Factor = = 6.3 ppmvd VOC
Emissions =
CTG Emissions =
= 1.3 lb/hr SO2
DB Emissions = = 0.69 lb/hr SO2
Emissions =
Revised 05/09/2014

TABLE A-6SAMPLE EMISSION CALCULATION - TURBINE AND DUCT BURNER
UTILITY PLANT
Sample Calculation - PM, PM10, PM2.5
CTG Emission Rate 4.10 lb/hr, front and back half, vendor suppliedDB Emission Factor 0.010 lb/MMBtu HHV(NH4)2SO4 Emissions 1.434 lb/hr
DB Emission 0.01 lb 245 MMBtu HHVMMBtu HHV hr
Total PM emissions CTG, DB plus (NH4)2SO4 Emissions from SCR.
Emissions = = 7.99 lb/hr PM10, total4.1 lb/hr + 2.45 lb/hr + 1.434 lb/hr
= 2.45 lb/hr PM, Duct Burner
Revised 05/09/2014

REFERENCE CASE NUMBER Case 1A Case 2A Case 3A Case 4A
71°F, 100% load
71°F, 75% load 71°F, 50% load 71°F, 25% load
SITE CONDITIONS
Ambient Temperature °F 71 71 71 71
Relative Humidity % 81 81 81 81
Site Elevation feet
Atmospheric Pressure psia 14.68 14.68 14.68 14.68
FACILITY CONDITIONS
Boiler Fuel Type Natural Gas Natural Gas Natural Gas Natural Gas
Boiler Heat Consumption (LHV) MMBtu/hr 401 293 198 96
Boiler Heat Consumption (HHV) MMBtu/hr 445 325 220 107
Boiler Fuel Flow Rate lb/hr 19,382 14,156 9,582 4,660
Boiler Fuel Flow Rate scf/hr 436,066.48 318,475.52 215,583.43 104,851.94
BoilerT Exhaust Gas Flow Rate lb/hr 392,450 293,392 194,743 106,341
Boiler Exhaust Gas Temperature °F 293 274 257 248
Fuel HHV Btu/lb 22,959 22,959 22,959 22,959
Fuel HHV Btu/ft3 1,020.5 1,020.5 1,020.5 1,020.5
BOILER EXHAUST ANALYSIS
Argon, Ar 39.948 % vol 0.830 0.840 0.830 0.840
Nitrogen, N2 28.014 % vol 70.08 70.22 70.10 70.77
Oxygen, O2 31.998 % vol 2.42 2.82 2.48 4.39
Carbon Dioxide, CO2 44.009 % vol 8.39 8.20 8.36 7.48
Water, H2O 18.015 % vol 18.15 17.79 18.09 16.40
Total 99.87 99.87 99.86 99.88
Molecular weight lb/lbmol 27.74 27.76 27.74 27.85
Exit Flow Rate SCFH 5,454,573 4,074,444 2,706,340 1,472,210
Exit Flow Rate scfh dry 4,464,568 3,349,600 2,216,763 1,230,767
BOILER STACK EMISSIONS AT 1 GRAINS/100 SCF FUEL SULFUR CONTENT (Based on USEPA Test Methods):
NOX, ppmvd @ 3% O2 8.3 8.3 8.3 8.3
NOX, ppmvd 8.3 8.1 8.3 7.3
NOX, lbm/hr as NO2 4.4 3.2 2.2 1.1
NH3, ppmvd @ 3% O2 10.0 10.0 10.0 10.0
NH3, ppmvd 10.0 9.8 10.0 8.7
NH3, lbm/hr 2.0 1.4 1.0 0.5
CO, ppmvd @ 3% O2 50.0 50.0 50.0 50.0
CO, ppmvd 50.1 48.8 49.9 43.7
CO, lbm/hr 16.3 11.9 8.0 3.9
SO2, lbm/hr 1.2 0.9 0.6 0.3
VOC, ppmvd @ 3% O2 as CH4 10.0 10.0 10.0 10.0
VOC, ppmvd 10.0 9.8 10.0 8.7
VOC, lbm/hr as CH4 1.9 1.4 0.9 0.4
Particulates from Boiler, lbm/hr 3.9 2.9 1.9 1.0
Conversion of SO2 to SO3 10% 10% 10% 10%
H2SO4 exclusively, lbm/hr 0.2 0.1 0.1 0.05
(NH4)2SO4 exclusively, lbm/hr 0.3 0.2 0.1 0.1
Total Particulates From Stack, lbm/hr 4.2 3.1 2.0 1.1
TABLE A-7AAUXILIARY BOILER A1 CALCULATIONS
UTILITY PLANT
Revised 05/09/2014

REFERENCE CASE NUMBER Case 1A Case 2A Case 3A Case 4A
71°F, 100% load
71°F, 75% load 71°F, 50% load 71°F, 25% load
TABLE A-7AAUXILIARY BOILER A1 CALCULATIONS
UTILITY PLANT
Stack Conditions (per CT/HRSG)
Stack Height ft 130 130 130 130
Internal Diameter ft 6.5 6.5 6.5 6.5
Flow scfm 90,910 67,907 45,106 24,537
Temperature oF 293.0 274.0 257.0 248.0
Flow acfm 129,649 94,402 61,251 32,902
Exit Velocity ft/s 65.12 47.41 30.76 16.53
Revised 05/09/2014

TABLE A-7BAUXILIARY BOILER A1 HOURLY EMISSION SUMMARY
UTILITY PLANT
PollutantMax Hourly Emissions
During Normal
Operations1GE Reference Case Number
Annual Average Hourly Emissions During Normal Operations
GE Reference Case Number
(lb/hr) (lb/hr)
NOX 4.43 Case 1A: 71°F, 100% load 4.43 Case 1A: 71°F, 100% load
CO 16.26 Case 1A: 71°F, 100% load 16.26 Case 1A: 71°F, 100% load
VOC 1.86 Case 1A: 71°F, 100% load 1.86 Case 1A: 71°F, 100% load
SO2 1.24 Case 1A: 71°F, 100% load, 5 gr S/100scf Natural Gas 1.24 Case 1A: 71°F, 100% load, 1 gr S/100 scf Natural Gas
PM/PM10/PM2.5 4.16 Case 1A: 71°F, 100% load, 5 gr S/100scf Natural Gas 4.16 Case 1A: 71°F, 100% load, 1 gr S/100 scf Natural Gas
H2SO4 0.19 Case 1A: 71°F, 100% load, 5 gr S/100scf Natural Gas 0.19 Case 1A: 71°F, 100% load, 1 gr S/100 scf Natural Gas
(NH4)2SO4 0.26 Case 1A: 71°F, 100% load, 5 gr S/100scf Natural Gas 0.26 Case 1A: 71°F, 100% load, 1 gr S/100 scf Natural Gas
NH3 1.98 Case 1A: 71°F, 100% load 1.98 Case 1A: 71°F, 100% load
Revised 05/09/2014
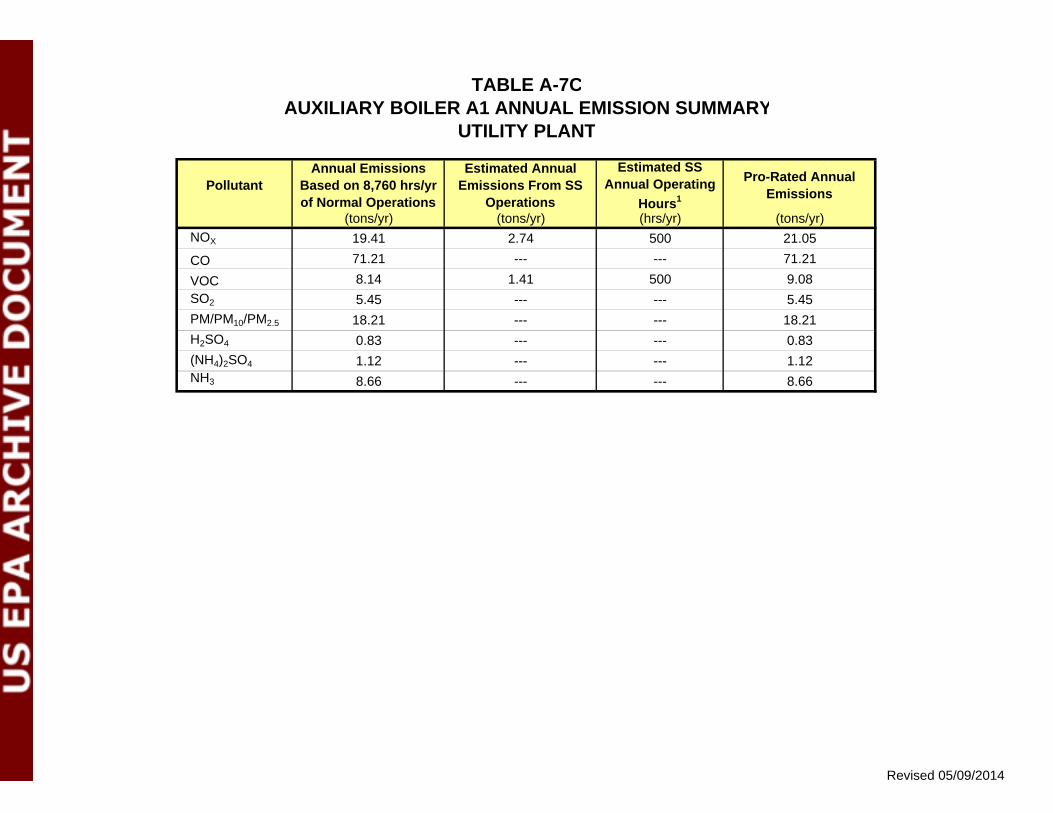
TABLE A-7CAUXILIARY BOILER A1 ANNUAL EMISSION SUMMARY
UTILITY PLANT
PollutantAnnual Emissions
Based on 8,760 hrs/yr of Normal Operations
Estimated Annual Emissions From SS
Operations
Estimated SS Annual Operating
Hours1
Pro-Rated Annual Emissions
(tons/yr) (tons/yr) (hrs/yr) (tons/yr)
NOX 19.41 2.74 500 21.05
CO 71.21 --- --- 71.21
VOC 8.14 1.41 500 9.08
SO2 5.45 --- --- 5.45
PM/PM10/PM2.5 18.21 --- --- 18.21
H2SO4 0.83 --- --- 0.83
(NH4)2SO4 1.12 --- --- 1.12NH3 8.66 --- --- 8.66
Revised 05/09/2014

Pollutant
Estimated
Duration1Max Hourly Emissions
Annual Emissions
(hr/yr) (lb/hr) (tons/yr)
NOx 500 10.96 2.74
VOC 500 5.63 1.41
Notes:
1. The estimated number of annual hours in startup/shutdown are based on the average
duration of startup/shutdowns and the annual average number of startup/shutdowns
during the year. It is not intended to be an annual limit for compliance purposes.
TABLE A-7DAUXILIARY BOILER A1 STARTUP CALCULATIONS
UTILITY PLANT
Startup/Shutdown Emissions For Auxiliary Boiler A
Revised 05/09/2014

REFERENCE CASE NUMBER Case 1A Case 2A Case 3A Case 4A
71°F, 100% load
71°F, 75% load 71°F, 50% load 71°F, 25% load
SITE CONDITIONS
Ambient Temperature °F 71 71 71 71
Relative Humidity % 81 81 81 81
Site Elevation feet
Atmospheric Pressure psia 14.68 14.68 14.68 14.68
FACILITY CONDITIONS
Boiler Fuel Type Natural Gas Natural Gas Natural Gas Natural Gas
Boiler Heat Consumption (LHV) MMBtu/hr 401 293 198 96
Boiler Heat Consumption (HHV) MMBtu/hr 445 325 220 107
Boiler Fuel Flow Rate lb/hr 19,382 14,156 9,582 4,660
Boiler Fuel Flow Rate scf/hr 436,066.48 318,475.52 215,583.43 104,851.94
BoilerT Exhaust Gas Flow Rate lb/hr 392,450 293,392 194,743 106,341
Boiler Exhaust Gas Temperature °F 293 274 257 248
Fuel HHV Btu/lb 22,959 22,959 22,959 22,959
Fuel HHV Btu/ft3 1,020.5 1,020.5 1,020.5 1,020.5
BOILER EXHAUST ANALYSIS
Argon, Ar 39.948 % vol 0.830 0.840 0.830 0.840
Nitrogen, N2 28.014 % vol 70.08 70.22 70.10 70.77
Oxygen, O2 31.998 % vol 2.42 2.82 2.48 4.39
Carbon Dioxide, CO2 44.009 % vol 8.39 8.20 8.36 7.48
Water, H2O 18.015 % vol 18.15 17.79 18.09 16.40
Total 99.87 99.87 99.86 99.88
Molecular weight lb/lbmol 27.74 27.76 27.74 27.85
Exit Flow Rate SCFH 5,454,573 4,074,444 2,706,340 1,472,210
Exit Flow Rate scfh dry 4,464,568 3,349,600 2,216,763 1,230,767
BOILER STACK EMISSIONS AT 1 GRAINS/100 SCF FUEL SULFUR CONTENT (Based on USEPA Test Methods):
NOX, ppmvd @ 3% O2 8.3 8.3 8.3 8.3
NOX, ppmvd 8.3 8.1 8.3 7.3
NOX, lbm/hr as NO2 4.4 3.2 2.2 1.1
NH3, ppmvd @ 3% O2 10.0 10.0 10.0 10.0
NH3, ppmvd 10.0 9.8 10.0 8.7
NH3, lbm/hr 2.0 1.4 1.0 0.5
CO, ppmvd @ 3% O2 50.0 50.0 50.0 50.0
CO, ppmvd 50.1 48.8 49.9 43.7
CO, lbm/hr 16.3 11.9 8.0 3.9
SO2, lbm/hr 1.2 0.9 0.6 0.3
VOC, ppmvd @ 3% O2 as CH4 10.0 10.0 10.0 10.0
VOC, ppmvd 10.0 9.8 10.0 8.7
VOC, lbm/hr as CH4 1.9 1.4 0.9 0.4
Particulates from Boiler, lbm/hr 3.9 2.9 1.9 1.0
Conversion of SO2 to SO3 10% 10% 10% 10%
H2SO4 exclusively, lbm/hr 0.2 0.1 0.1 0.05
(NH4)2SO4 exclusively, lbm/hr 0.3 0.2 0.1 0.1
Total Particulates From Stack, lbm/hr 4.2 3.1 2.0 1.1
TABLE A-8AAUXILIARY BOILER A2 CALCULATIONS
UTILITY PLANT
Revised 05/09/2014

REFERENCE CASE NUMBER Case 1A Case 2A Case 3A Case 4A
71°F, 100% load
71°F, 75% load 71°F, 50% load 71°F, 25% load
TABLE A-8AAUXILIARY BOILER A2 CALCULATIONS
UTILITY PLANT
Stack Conditions (per CT/HRSG)
Stack Height ft 130 130 130 130
Internal Diameter ft 6.5 6.5 6.5 6.5
Flow scfm 90,910 67,907 45,106 24,537
Temperature oF 293.0 274.0 257.0 248.0
Flow acfm 129,649 94,402 61,251 32,902
Exit Velocity ft/s 65.12 47.41 30.76 16.53
Revised 05/09/2014

TABLE A-9BAUXILIARY BOILER A2 HOURLY EMISSION SUMMARY
UTILITY PLANT
PollutantMax Hourly Emissions
During Normal
Operations1GE Reference Case Number
Annual Average Hourly Emissions During Normal Operations
GE Reference Case Number
(lb/hr) (lb/hr)
NOX 4.43 Case 1A: 71°F, 100% load 4.43 Case 1A: 71°F, 100% load
CO 16.26 Case 1A: 71°F, 100% load 16.26 Case 1A: 71°F, 100% load
VOC 1.86 Case 1A: 71°F, 100% load 1.86 Case 1A: 71°F, 100% load
SO2 1.24 Case 1A: 71°F, 100% load, 5 gr S/100scf Natural Gas 1.24 Case 1A: 71°F, 100% load, 1 gr S/100 scf Natural Gas
PM/PM10/PM2.5 4.16 Case 1A: 71°F, 100% load, 5 gr S/100scf Natural Gas 4.16 Case 1A: 71°F, 100% load, 1 gr S/100 scf Natural Gas
H2SO4 0.19 Case 1A: 71°F, 100% load, 5 gr S/100scf Natural Gas 0.19 Case 1A: 71°F, 100% load, 1 gr S/100 scf Natural Gas
(NH4)2SO4 0.26 Case 1A: 71°F, 100% load, 5 gr S/100scf Natural Gas 0.26 Case 1A: 71°F, 100% load, 1 gr S/100 scf Natural Gas
NH3 1.98 Case 1A: 71°F, 100% load 1.98 Case 1A: 71°F, 100% load
Revised 05/09/2014

TABLE A-8CAUXILIARY BOILER A2 ANNUAL EMISSION SUMMARY
UTILITY PLANT
PollutantAnnual Emissions
Based on 8,760 hrs/yr of Normal Operations
Estimated Annual Emissions From SS
Operations
Estimated SS Annual Operating
Hours1
Pro-Rated Annual Emissions
(tons/yr) (tons/yr) (hrs/yr) (tons/yr)
NOX 19.41 2.74 500 21.05
CO 71.21 --- --- 71.21
VOC 8.14 1.41 500 9.08
SO2 5.45 --- --- 5.45
PM/PM10/PM2.5 18.21 --- --- 18.21
H2SO4 0.83 --- --- 0.83
(NH4)2SO4 1.12 --- --- 1.12NH3 8.66 --- --- 8.66
Revised 05/09/2014

Pollutant
Estimated
Duration1Max Hourly Emissions
Annual Emissions
(hr/yr) (lb/hr) (tons/yr)
NOx 500 10.96 2.74
VOC 500 5.63 1.41
Notes:
1. The estimated number of annual hours in startup/shutdown are based on the average
duration of startup/shutdowns and the annual average number of startup/shutdowns
during the year. It is not intended to be an annual limit for compliance purposes.
TABLE A-8DAUXILIARY BOILER A2 STARTUP CALCULATIONS
NRG Combined Heat and Power Plant
Startup/Shutdown Emissions For Auxiliary Boiler A2
Revised 05/09/2014
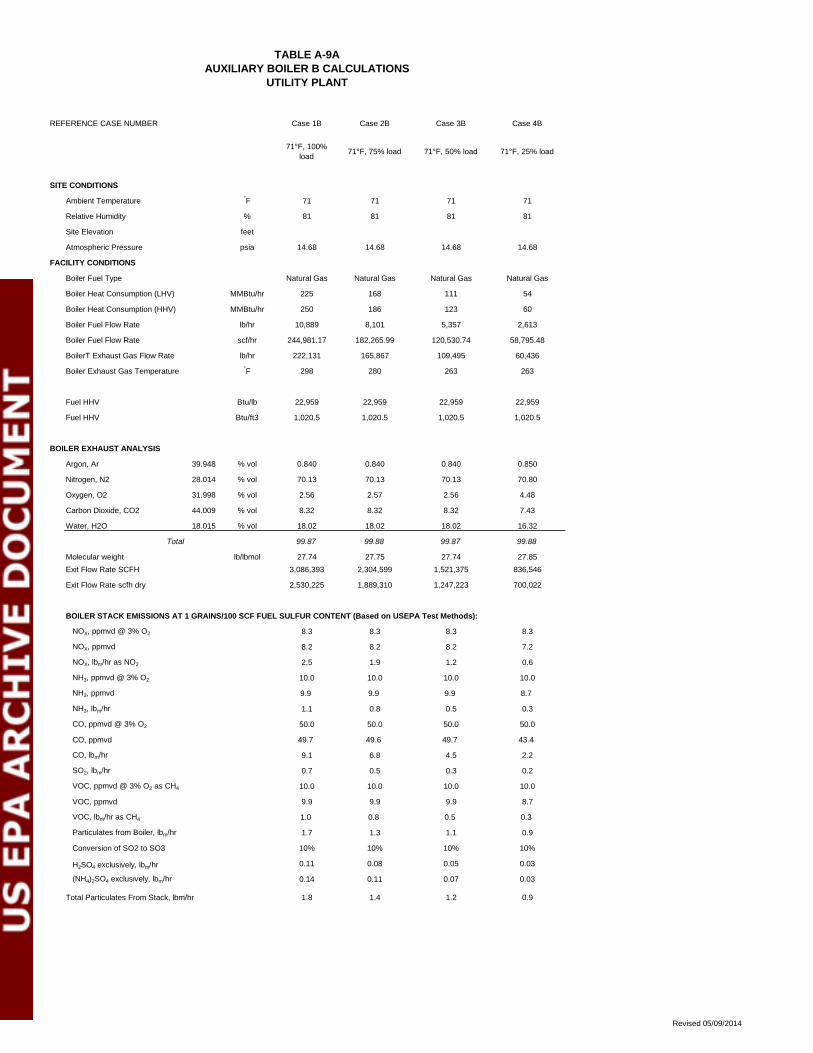
REFERENCE CASE NUMBER Case 1B Case 2B Case 3B Case 4B
71°F, 100% load
71°F, 75% load 71°F, 50% load 71°F, 25% load
SITE CONDITIONS
Ambient Temperature °F 71 71 71 71
Relative Humidity % 81 81 81 81
Site Elevation feet
Atmospheric Pressure psia 14.68 14.68 14.68 14.68
FACILITY CONDITIONS
Boiler Fuel Type Natural Gas Natural Gas Natural Gas Natural Gas
Boiler Heat Consumption (LHV) MMBtu/hr 225 168 111 54
Boiler Heat Consumption (HHV) MMBtu/hr 250 186 123 60
Boiler Fuel Flow Rate lb/hr 10,889 8,101 5,357 2,613
Boiler Fuel Flow Rate scf/hr 244,981.17 182,265.99 120,530.74 58,795.48
BoilerT Exhaust Gas Flow Rate lb/hr 222,131 165,867 109,495 60,436
Boiler Exhaust Gas Temperature °F 298 280 263 263
Fuel HHV Btu/lb 22,959 22,959 22,959 22,959
Fuel HHV Btu/ft3 1,020.5 1,020.5 1,020.5 1,020.5
BOILER EXHAUST ANALYSIS
Argon, Ar 39.948 % vol 0.840 0.840 0.840 0.850
Nitrogen, N2 28.014 % vol 70.13 70.13 70.13 70.80
Oxygen, O2 31.998 % vol 2.56 2.57 2.56 4.48
Carbon Dioxide, CO2 44.009 % vol 8.32 8.32 8.32 7.43
Water, H2O 18.015 % vol 18.02 18.02 18.02 16.32
Total 99.87 99.88 99.87 99.88
Molecular weight lb/lbmol 27.74 27.75 27.74 27.85
Exit Flow Rate SCFH 3,086,393 2,304,599 1,521,375 836,546
Exit Flow Rate scfh dry 2,530,225 1,889,310 1,247,223 700,022
BOILER STACK EMISSIONS AT 1 GRAINS/100 SCF FUEL SULFUR CONTENT (Based on USEPA Test Methods):
NOX, ppmvd @ 3% O2 8.3 8.3 8.3 8.3
NOX, ppmvd 8.2 8.2 8.2 7.2
NOX, lbm/hr as NO2 2.5 1.9 1.2 0.6
NH3, ppmvd @ 3% O2 10.0 10.0 10.0 10.0
NH3, ppmvd 9.9 9.9 9.9 8.7
NH3, lbm/hr 1.1 0.8 0.5 0.3
CO, ppmvd @ 3% O2 50.0 50.0 50.0 50.0
CO, ppmvd 49.7 49.6 49.7 43.4
CO, lbm/hr 9.1 6.8 4.5 2.2
SO2, lbm/hr 0.7 0.5 0.3 0.2
VOC, ppmvd @ 3% O2 as CH4 10.0 10.0 10.0 10.0
VOC, ppmvd 9.9 9.9 9.9 8.7
VOC, lbm/hr as CH4 1.0 0.8 0.5 0.3
Particulates from Boiler, lbm/hr 1.7 1.3 1.1 0.9
Conversion of SO2 to SO3 10% 10% 10% 10%
H2SO4 exclusively, lbm/hr 0.11 0.08 0.05 0.03
(NH4)2SO4 exclusively, lbm/hr 0.14 0.11 0.07 0.03
Total Particulates From Stack, lbm/hr 1.8 1.4 1.2 0.9
TABLE A-9AAUXILIARY BOILER B CALCULATIONS
UTILITY PLANT
Revised 05/09/2014
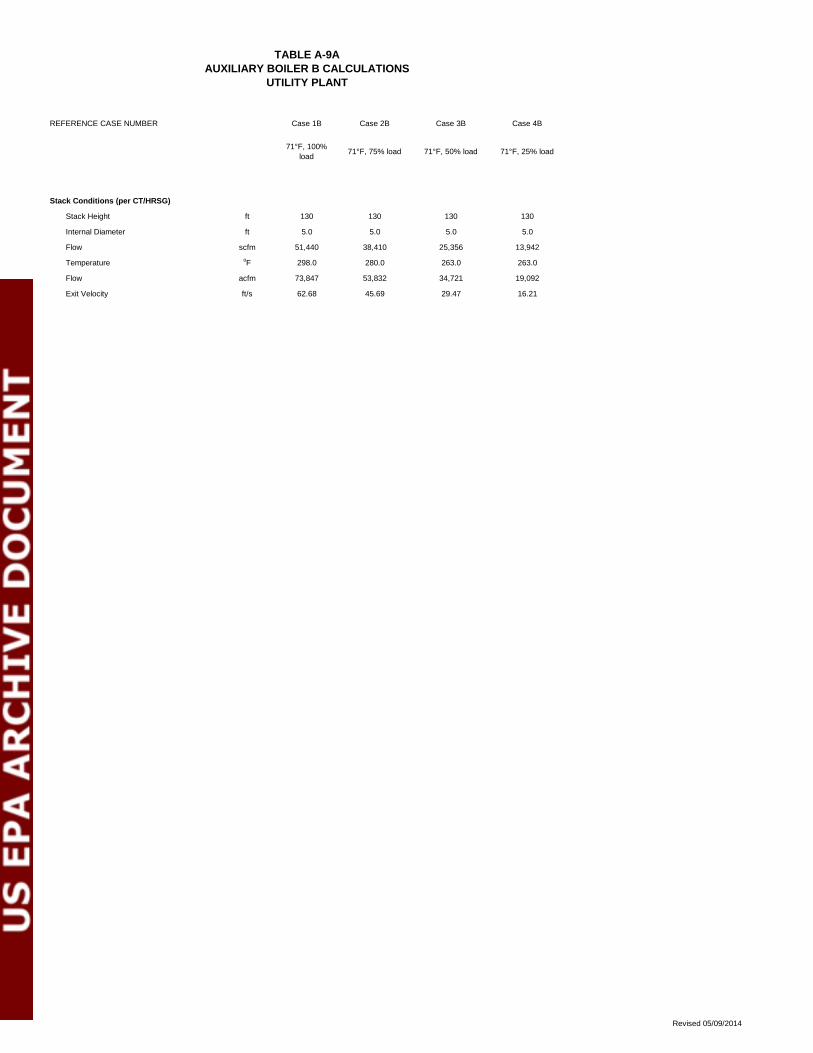
REFERENCE CASE NUMBER Case 1B Case 2B Case 3B Case 4B
71°F, 100% load
71°F, 75% load 71°F, 50% load 71°F, 25% load
TABLE A-9AAUXILIARY BOILER B CALCULATIONS
UTILITY PLANT
Stack Conditions (per CT/HRSG)
Stack Height ft 130 130 130 130
Internal Diameter ft 5.0 5.0 5.0 5.0
Flow scfm 51,440 38,410 25,356 13,942
Temperature oF 298.0 280.0 263.0 263.0
Flow acfm 73,847 53,832 34,721 19,092
Exit Velocity ft/s 62.68 45.69 29.47 16.21
Revised 05/09/2014
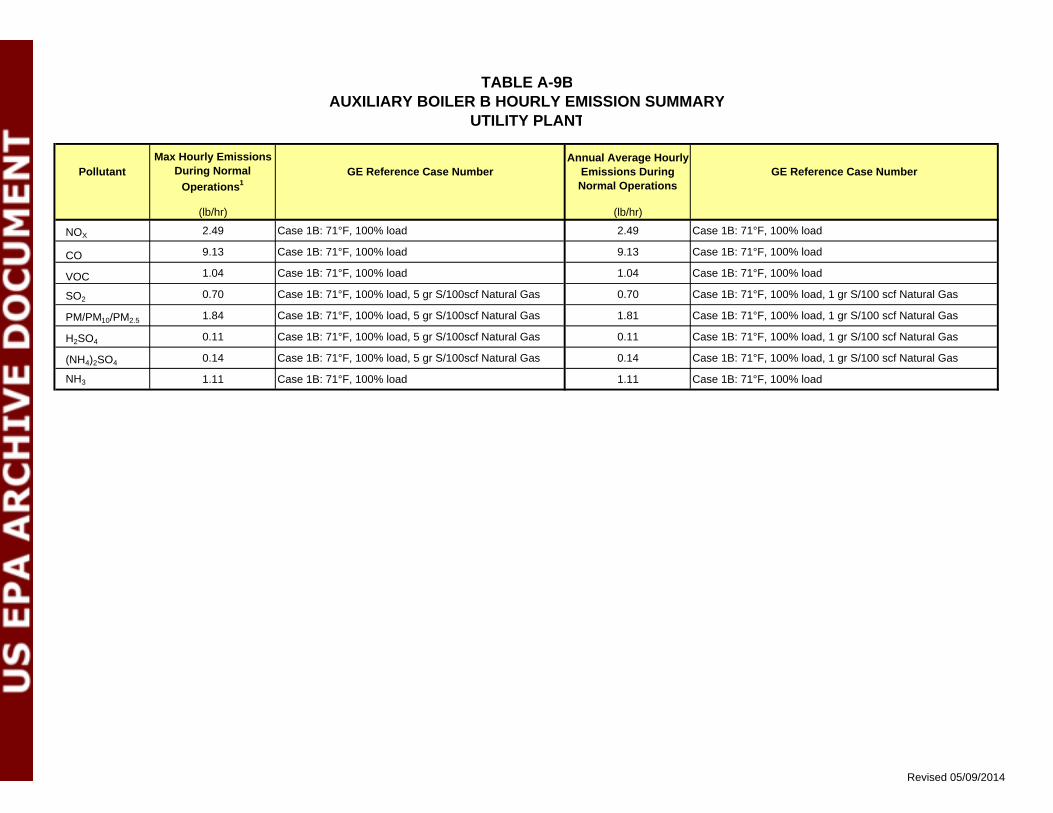
TABLE A-9BAUXILIARY BOILER B HOURLY EMISSION SUMMARY
UTILITY PLANT
PollutantMax Hourly Emissions
During Normal
Operations1GE Reference Case Number
Annual Average Hourly Emissions During Normal Operations
GE Reference Case Number
(lb/hr) (lb/hr)
NOX 2.49 Case 1B: 71°F, 100% load 2.49 Case 1B: 71°F, 100% load
CO 9.13 Case 1B: 71°F, 100% load 9.13 Case 1B: 71°F, 100% load
VOC 1.04 Case 1B: 71°F, 100% load 1.04 Case 1B: 71°F, 100% load
SO2 0.70 Case 1B: 71°F, 100% load, 5 gr S/100scf Natural Gas 0.70 Case 1B: 71°F, 100% load, 1 gr S/100 scf Natural Gas
PM/PM10/PM2.5 1.84 Case 1B: 71°F, 100% load, 5 gr S/100scf Natural Gas 1.81 Case 1B: 71°F, 100% load, 1 gr S/100 scf Natural Gas
H2SO4 0.11 Case 1B: 71°F, 100% load, 5 gr S/100scf Natural Gas 0.11 Case 1B: 71°F, 100% load, 1 gr S/100 scf Natural Gas
(NH4)2SO4 0.14 Case 1B: 71°F, 100% load, 5 gr S/100scf Natural Gas 0.14 Case 1B: 71°F, 100% load, 1 gr S/100 scf Natural Gas
NH3 1.11 Case 1B: 71°F, 100% load 1.11 Case 1B: 71°F, 100% load
Revised 05/09/2014

TABLE A-9CAUXILIARY BOILER B ANNUAL EMISSION SUMMARY
UTILITY PLANT
PollutantAnnual Emissions
Based on 8,760 hrs/yr of Normal Operations
Estimated Annual Emissions From SS
Operations
Estimated SS Annual Operating
Hours1
Pro-Rated Annual Emissions
(tons/yr) (tons/yr) (hrs/yr) (tons/yr)
NOX 10.90 1.50 500 11.78
CO 39.99 --- --- 39.99
VOC 4.57 1.41 500 5.71
SO2 3.06 --- --- 3.06
PM/PM10/PM2.5 7.91 --- --- 7.91
H2SO4 0.47 --- --- 0.47
(NH4)2SO4 0.63 --- --- 0.63NH3 4.86 --- --- 4.86
Revised 05/09/2014

Pollutant
Estimated
Duration1Max Hourly Emissions
Annual Emissions
(hr/yr) (lb/hr) (tons/yr)
NOx 500 6.01 1.50
VOC 500 5.63 1.41
Notes:
1. The estimated number of annual hours in startup/shutdown are based on the average
duration of startup/shutdowns and the annual average number of startup/shutdowns
during the year. It is not intended to be an annual limit for compliance purposes.
TABLE A-9DAUXILIARY BOILER B STARTUP CALCULATIONS
UTILITY PLANT
Startup/Shutdown Emissions For Auxiliary Boiler B
Revised 05/09/2014

TABLE A-16AINHERENTLY LOW EMITTING MAINTENANCE ACTIVITIES (OPTION 1)
Estimated Emissions (tpy)
NOx CO VOC PM NH3
Turbine Washing, Unit On-Line TABLE A-17 0.008
Air Intake Filter Maintenance TABLE A-18 4.93E-06
Ammonia Equipment Maintenance TABLE A-20 2.15E-05
Fuel Gas Venting TABLE A-21 1.86E-03
Boiler Tube Cleaning TABLE A-22 1.36E-04
CEMS Calibration TABLE A-23 5.97E-07 3.64E-07
Analytical Equipment TABLE A-24 4.35E-05
5.97E-07 3.64E-07 0.002 0.008 2.15E-05Totals =
UTILITY PLANT
MSS Activity Calculation Table
Revised 05/09/2014

TABLE A-16BINHERENTLY LOW EMITTING MAINTENANCE ACTIVITIES (OPTION 2)
Estimated Emissions (tpy)
NOx CO VOC PM NH3
Ammonia Equipment Maintenance TABLE A-20 2.15E-05
Fuel Gas Venting TABLE A-21 1.86E-03
Boiler Tube Cleaning TABLE A-22 1.36E-04
CEMS Calibration TABLE A-23 5.97E-07 3.64E-07
Analytical Equipment TABLE A-24 4.35E-05
5.97E-07 3.64E-07 0.002 0.000 2.15E-05
UTILITY PLANT
MSS Activity Calculation Table
Totals =
Revised 05/09/2014

AIR QUALITY PERMIT AMENDMENT APPLICATION CORPUS CHRISTI COMBINED HEAT AND POWER PLANT
M&G RESINS USA, LLC
Zephyr Environmental Corporation
Revised May 9, 2014
APPENDIX C TCEQ EQUIPMENT TABLES

Form PI-2(74-7)
TABLE 6BOILERS AND HEATERS
Type of Device: Auxiliary Boiler A1 & A2 Manufacturer: To be determinedNumber from flow diagram: AUXBLRA1 & AUXBLRA2 Model Number: N.A.
CHARACTERISTICS OF INPUT
Type FuelChemical composition (%
by weight)Inlet Air Temp oF
(after preheat) Fuel Flow Rate (scf/hr)Average Design Maximum
Natural Gas See Fuel Analysis 436,066in TABLE A-5
Gross Heating Value Total Air Supplied and Excess Airof Fuel
(specify units) Average Design Maximum scfm* scfm*
1020 Btu/scf excess excess(vol.) (vol.)
HEAT TRANSFER MEDIUM
Type Transfer Medium Temperature oF Pressure (psia) Flow Rate (specify units)Water, oil, etc. Input Output Input Output Average Design Maximum
Water/Steam
OPERATING CHARACTERISTICSAve. Fire Box Temp.
at max. firing rateFire Box Volume (ft.3),
(from drawing)Gas Velocity in Fire Box (ft/sec) at
max. firing rateResidence Time in Fire Box at max.
firing rate (sec)
STACK PARAMETERSStack Diameter Stack Height Stack Gas Velocity (ft/sec) Stack Gas Exhaust
feet feet(@Ave. Fuel Flow
Rate)(@ Max. Fuel Flow
Rate) Temp oF acfm293 129,649
CHARACTERISTICS OF OUTPUTMaterial Chemical Composition of Exit Gas Released (% by Volume)
Combustion Products - See Table 1(a)
Attach an explanation on how temperature, air flow rate, excess air or other operating variables are controlled.
Also supply an assembly drawing, dimensioned and to scale, in plan, elevation and as many sections as are needed to show clearly the operation of the combustion unit. Show interior dimensions and features ofthe equipment necessary to calculate in performance
* Standard Conditions: 70oF, 14.7 psia
65.16.50 130 65.1
N/A
Revised 05/09/2013
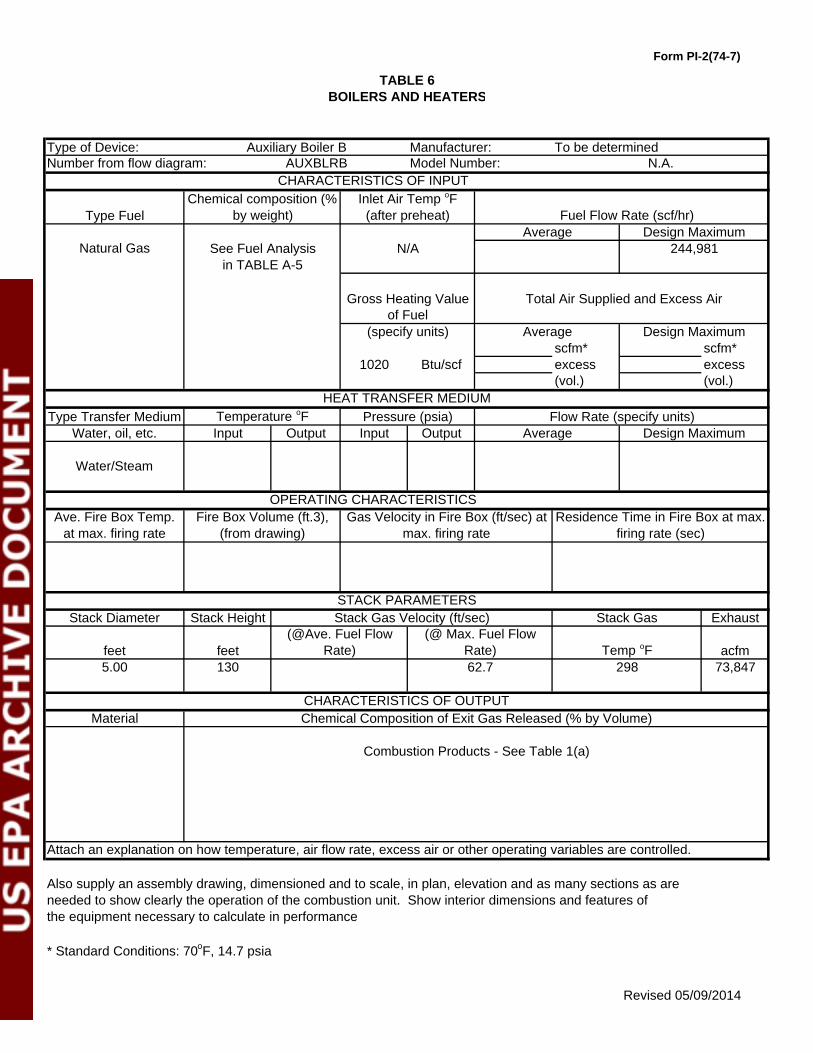
Form PI-2(74-7)
TABLE 6BOILERS AND HEATERS
Type of Device: Auxiliary Boiler B Manufacturer: To be determinedNumber from flow diagram: AUXBLRB Model Number: N.A.
CHARACTERISTICS OF INPUT
Type FuelChemical composition (%
by weight)Inlet Air Temp oF
(after preheat) Fuel Flow Rate (scf/hr)Average Design Maximum
Natural Gas See Fuel Analysis 244,981in TABLE A-5
Gross Heating Value Total Air Supplied and Excess Airof Fuel
(specify units) Average Design Maximum scfm* scfm*
1020 Btu/scf excess excess(vol.) (vol.)
HEAT TRANSFER MEDIUM
Type Transfer Medium Temperature oF Pressure (psia) Flow Rate (specify units)Water, oil, etc. Input Output Input Output Average Design Maximum
Water/Steam
OPERATING CHARACTERISTICSAve. Fire Box Temp.
at max. firing rateFire Box Volume (ft.3),
(from drawing)Gas Velocity in Fire Box (ft/sec) at
max. firing rateResidence Time in Fire Box at max.
firing rate (sec)
STACK PARAMETERSStack Diameter Stack Height Stack Gas Velocity (ft/sec) Stack Gas Exhaust
feet feet(@Ave. Fuel Flow
Rate)(@ Max. Fuel Flow
Rate) Temp oF acfm5.00 130 62.7 298 73,847
CHARACTERISTICS OF OUTPUTMaterial Chemical Composition of Exit Gas Released (% by Volume)
Combustion Products - See Table 1(a)
Attach an explanation on how temperature, air flow rate, excess air or other operating variables are controlled.
Also supply an assembly drawing, dimensioned and to scale, in plan, elevation and as many sections as are needed to show clearly the operation of the combustion unit. Show interior dimensions and features ofthe equipment necessary to calculate in performance
* Standard Conditions: 70oF, 14.7 psia
N/A
Revised 05/09/2014

Form PI-2(74-7)
TABLE 6BOILERS AND HEATERS
Type of Device: HRSG Manufacturer: To be determinedNumber from flow diagram: CTG Model Number: N.A.
CHARACTERISTICS OF INPUT
Type FuelChemical composition (%
by weight)Inlet Air Temp oF
(after preheat) Fuel Flow Rate (scf/hr)Average Design Maximum
Natural Gas See Fuel Analysis 257,720in TABLE A-5
Gross Heating Value Total Air Supplied and Excess Airof Fuel
(specify units) Average Design Maximum scfm* scfm*
1020 Btu/scf excess excess(vol.) (vol.)
HEAT TRANSFER MEDIUM
Type Transfer Medium Temperature oF Pressure (psia) Flow Rate (specify units)Water, oil, etc. Input Output Input Output Average Design Maximum
Water/Steam 230 565 1100 780 280,000 lb/hr
OPERATING CHARACTERISTICSAve. Fire Box Temp.
at max. firing rateFire Box Volume (ft.3),
(from drawing)Gas Velocity in Fire Box (ft/sec) at
max. firing rateResidence Time in Fire Box at max.
firing rate (sec)
STACK PARAMETERSStack Diameter Stack Height Stack Gas Velocity (ft/sec) Stack Gas Exhaust
feet feet(@Ave. Fuel Flow
Rate)(@ Max. Fuel Flow
Rate) Temp oF acfm10.00 130 87.8 341 413,811
CHARACTERISTICS OF OUTPUTMaterial Chemical Composition of Exit Gas Released (% by Volume)
Combustion Products - See Table 1(a)
Attach an explanation on how temperature, air flow rate, excess air or other operating variables are controlled.
Also supply an assembly drawing, dimensioned and to scale, in plan, elevation and as many sections as are needed to show clearly the operation of the combustion unit. Show interior dimensions and features ofthe equipment necessary to calculate in performance
* Standard Conditions: 70oF, 14.7 psia
330,000 lb/hr
N/A
Revised 05/09/2014

AIR QUALITY PERMIT AMENDMENT APPLICATION CORPUS CHRISTI COMBINED HEAT AND POWER PLANT
M&G RESINS USA, LLC
Zephyr Environmental Corporation
Revised May 9, 2014
APPENDIX D PSD NETTING TABLES
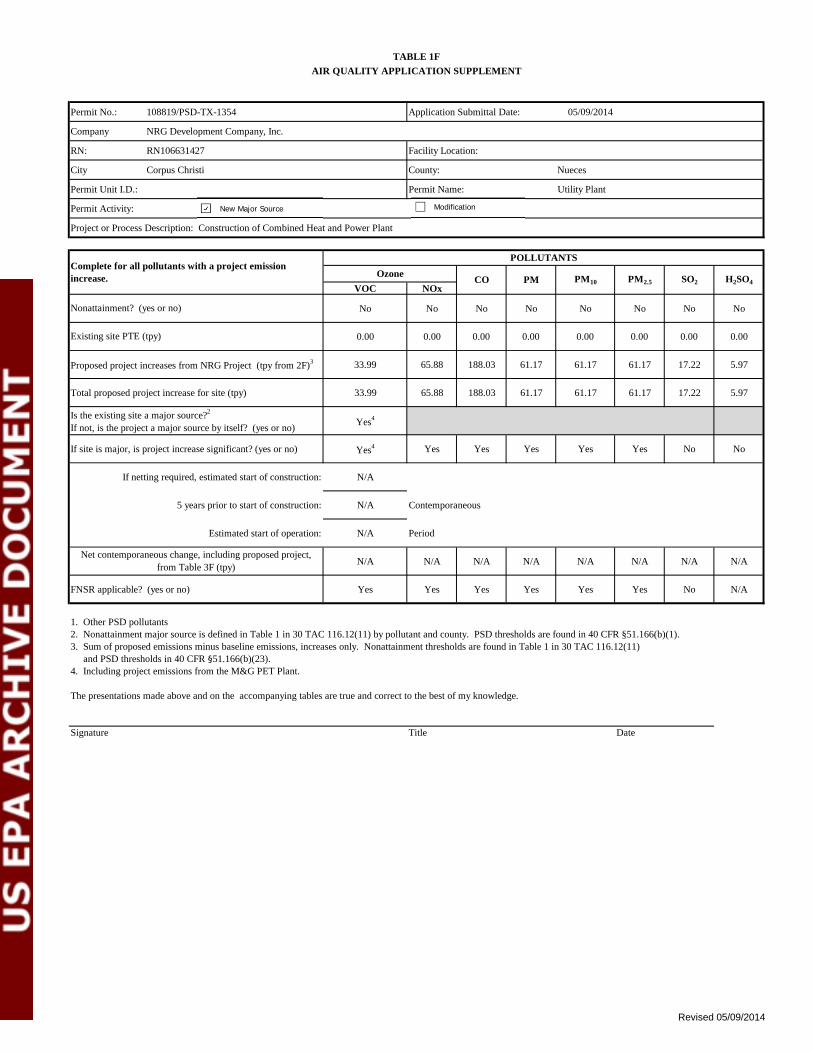
Permit No.: 108819/PSD-TX-1354 Application Submittal Date: 05/09/2014
Company NRG Development Company, Inc.
RN: RN106631427 Facility Location:
City Corpus Christi County: Nueces
Permit Unit I.D.: Permit Name: Utility Plant
Permit Activity:
Project or Process Description: Construction of Combined Heat and Power Plant
VOC NOx
No No No No No No No No
0.00 0.00 0.00 0.00 0.00 0.00 0.00 0.00
33.99 65.88 188.03 61.17 61.17 61.17 17.22 5.97
Total proposed project increase for site (tpy) 33.99 65.88 188.03 61.17 61.17 61.17 17.22 5.97
Yes4
If site is major, is project increase significant? (yes or no) Yes4 Yes Yes Yes Yes Yes No No
If netting required, estimated start of construction: N/A
5 years prior to start of construction: N/A Contemporaneous
Estimated start of operation: N/A Period
N/A N/A N/A N/A N/A N/A N/A N/A
FNSR applicable? (yes or no) Yes Yes Yes Yes Yes Yes No N/A
1. Other PSD pollutants2. Nonattainment major source is defined in Table 1 in 30 TAC 116.12(11) by pollutant and county. PSD thresholds are found in 40 CFR §51.166(b)(1).3. Sum of proposed emissions minus baseline emissions, increases only. Nonattainment thresholds are found in Table 1 in 30 TAC 116.12(11) and PSD thresholds in 40 CFR §51.166(b)(23).4. Including project emissions from the M&G PET Plant.
The presentations made above and on the accompanying tables are true and correct to the best of my knowledge.
Signature Title Date
Net contemporaneous change, including proposed project, from Table 3F (tpy)
TABLE 1FAIR QUALITY APPLICATION SUPPLEMENT
Complete for all pollutants with a project emission increase.
POLLUTANTSOzone CO PM PM10 PM2.5 SO2 H2SO4
Nonattainment? (yes or no)
Existing site PTE (tpy)
Proposed project increases from NRG Project (tpy from 2F)3
Is the existing site a major source?2
If not, is the project a major source by itself? (yes or no)
New Major Source Modification
Revised 05/09/2014

TABLE 2FPROJECT EMISSION INCREASE
Pollutant(1): VOC Permit: 108819/PSD-TX-1354
Baseline Period: N/A to N/A
A BAffected or Modified Facilities(2) Permit No.
FIN EPN
1 CTG/HRSG CTG108819/PSD-TX-
13540.00 0.00 18.56 18.56 18.56
2 CTLOV CTLOV108819/PSD-TX-
13540.00 0.00 0.05 0.05 0.05
3 AUXBLRA1 AUXBLRA1108819/PSD-TX-
13540.00 0.00 9.08 9.08 9.08
4 AUXBLRB AUXBLRB108819/PSD-TX-
13540.00 0.00 5.71 5.71 5.71
5 NG-FUG NG-FUG108819/PSD-TX-
13540.00 0.00 0.57 0.57 0.57
6 MSS-FUG MSS-FUG108819/PSD-TX-
13540.00 0.00 <0.01 0.01 0.01
7
8
9
10
11
12
14
15
Page Subotal(9) 33.99
Project Increase(8)
Actual Emissions(3)
Baseline Emissions(4)
Proposed Emissions(5)
ProjectedActual
Emissions
Difference(B - A) (6)
Correction(7)
Revised 05/09/2014

TABLE 2FPROJECT EMISSION INCREASE
Pollutant(1): NOx Permit: 108819/PSD-TX-1354
Baseline Period: N/A to N/A
A BAffected or Modified Facilities(2) Permit No.
FIN EPN
1 CTG/HRSG CTG108819/PSD-TX-
13540.00 0.00 33.05 33.05 33.05
2 AUXBLRA1 AUXBLRA1108819/PSD-TX-
13540.00 0.00 21.05 21.05 21.05
3 AUXBLRB AUXBLRB108819/PSD-TX-
13540.00 0.00 11.78 11.78 11.78
4 MSS-FUG MSS-FUG108819/PSD-TX-
13540.00 0.00 <0.01 0.01 0.01
5
6
7
8
9
10
11
12
13
14
15
Page Subotal(9) 65.88
Actual Emissions(3)
Baseline Emissions(4)
Proposed Emissions(5)
ProjectedActual
Emissions
Difference(B - A) (6)
Correction(7) Project Increase(8)
Revised 05/09/2014

TABLE 2FPROJECT EMISSION INCREASE
Pollutant(1): CO Permit: 108819/PSD-TX-1354
Baseline Period: N/A to N/A
A BAffected or Modified Facilities(2) Permit No.
FIN EPN
1 CTG/HRSG CTG108819/PSD-TX-
13540.00 0.00 76.82 76.82 76.82
2 AUXBLRA1 AUXBLRA1108819/PSD-TX-
13540.00 0.00 71.21 71.21 71.21
3 AUXBLRB AUXBLRB108819/PSD-TX-
13540.00 0.00 39.99 39.99 39.99
4 MSS-FUG MSS-FUG108819/PSD-TX-
13540.00 0.00 <0.01 0.01 0.01
5
6
7
8
9
10
11
12
13
14
15
Page Subotal(9) 188.03
Project Increase(8)
Actual Emissions(3)
Baseline Emissions(4)
Proposed Emissions(5)
ProjectedActual
Emissions
Difference(B - A) (6)
Correction(7)
Revised 05/09/2014

TABLE 2FPROJECT EMISSION INCREASE
Pollutant(1): PM Permit: 108819/PSD-TX-1354
Baseline Period: N/A to N/A
A BAffected or Modified Facilities(2) Permit No.
FIN EPN
1 CTG/HRSG CTG108819/PSD-TX-
13540.00 0.00 34.98 34.98 34.98
2 CTLOV CTLOV108819/PSD-TX-
13540.00 0.00 0.05 0.05 0.05
3 AUXBLRA1 AUXBLRA1108819/PSD-TX-
13540.00 0.00 18.21 18.21 18.21
4 AUXBLRB AUXBLRB108819/PSD-TX-
13540.00 0.00 7.91 7.91 7.91
5 MSS-FUG MSS-FUG108819/PSD-TX-
13540.00 0.00 0.01 0.01 0.0109
6
7
8
9
10
11
12
13
14
15
Page Subotal(9) 61.17
Actual Emissions(3)
Baseline Emissions(4)
Proposed Emissions(5)
ProjectedActual
Emissions
Difference(B - A) (6)
Correction(7) Project Increase(8)
Revised 05/09/2014

TABLE 2FPROJECT EMISSION INCREASE
Pollutant(1): PM10 Permit: 108819/PSD-TX-1354
Baseline Period: N/A to N/A
A BAffected or Modified Facilities(2) Permit No.
FIN EPN
1 CTG/HRSG CTG108819/PSD-TX-
13540.00 0.00 34.98 34.98 34.98
2 CTLOV CTLOV108819/PSD-TX-
13540.00 0.00 0.05 0.05 0.05
3 AUXBLRA1 AUXBLRA1108819/PSD-TX-
13540.00 0.00 18.21 18.21 18.21
4 AUXBLRB AUXBLRB108819/PSD-TX-
13540.00 0.00 7.91 7.91 7.91
5 MSS-FUG MSS-FUG108819/PSD-TX-
13540.00 0.00 0.01 0.01 0.01
6
7
8
9
10
11
12
13
14
15
Page Subotal(9) 61.17
Project Increase(8)
Actual Emissions(3)
Baseline Emissions(4)
Proposed Emissions(5)
ProjectedActual
Emissions
Difference(B - A) (6)
Correction(7)
Revised 05/09/2014

TABLE 2FPROJECT EMISSION INCREASE
Pollutant(1): PM2.5 Permit: 108819/PSD-TX-1354
Baseline Period: N/A to N/A
A BAffected or Modified Facilities(2) Permit No.
FIN EPN
1 CTG/HRSG CTG108819/PSD-TX-
13540.00 0.00 34.98 34.98 34.98
2 CTLOV CTLOV108819/PSD-TX-
13540.00 0.00 0.05 0.05 0.05
3 AUXBLRA1 AUXBLRA1108819/PSD-TX-
13540.00 0.00 18.21 18.21 18.21
4 AUXBLRB AUXBLRB108819/PSD-TX-
13540.00 0.00 7.91 7.91 7.91
5 MSS-FUG MSS-FUG108819/PSD-TX-
13540.00 0.00 0.01 0.01 0.01
6
7
8
9
10
11
12
13
14
15
Page Subotal(9) 61.17
Actual Emissions(3)
Baseline Emissions(4)
Proposed Emissions(5)
ProjectedActual
Emissions
Difference(B - A) (6)
Correction(7) Project Increase(8)
Revised 05/09/2014

TABLE 2FPROJECT EMISSION INCREASE
Pollutant(1): SO2 Permit: 108819/PSD-TX-1354
Baseline Period: N/A to N/A
A BAffected or Modified Facilities(2) Permit No.
FIN EPN
1 CTG/HRSG CTG108819/PSD-TX-
13540.00 0.00 8.70 8.70 8.70
2 AUXBLRA1 AUXBLRA1108819/PSD-TX-
13540.00 0.00 5.45 5.45 5.45
3 AUXBLRB AUXBLRB108819/PSD-TX-
13540.00 0.00 3.06 3.06 3.06
4
5
6
7
8
9
10
11
12
13
14
15
Page Subotal(9) 17.22
Actual Emissions(3)
Baseline Emissions(4)
Proposed Emissions(5)
ProjectedActual
Emissions
Difference(B - A) (6)
Correction(7) Project Increase(8)
Revised 05/09/2014

TABLE 2FPROJECT EMISSION INCREASE
Pollutant(1): H2SO4 Permit: 108819/PSD-TX-1354
Baseline Period: N/A to N/A
A BAffected or Modified Facilities(2) Permit No.
FIN EPN
1 CTG/HRSG CTG108819/PSD-TX-
13540.00 0.00 4.66 4.66 4.66
2 AUXBLRA1 AUXBLRA1108819/PSD-TX-
13540.00 0.00 0.83 0.83 0.83
3 AUXBLRB AUXBLRB108819/PSD-TX-
13540.00 0.00 0.47 0.47 0.47
4
5
6
7
8
9
10
11
12
13
14
15
Page Subotal(9) 5.97
Project Increase(8)
Actual Emissions(3)
Baseline Emissions(4)
Proposed Emissions(5)
ProjectedActual
Emissions
Difference(B - A) (6)
Correction(7)
Revised 05/09/2014

1. Individual Table 2F's should be used to summarize the project emission increase for each criteria pollutant
2. Emission Point Number as designated in NSR Permit or Emissions Inventory
3. All records and calculations for these values must be available upon request
4. Correct actual emissions for currently applicable rule or permit requirements, and periods of non-compliance. These corrections, as well as any MSS previously demonstrated
under 30 TAC 101, should be explained in the Table 2F supplement
5. If projected actual emission is used it must be noted in the next column and the basis for the projection identified in the Table 2F supplement
6. Proposed Emissions (column B) minus Baseline Emissions (column A)
7. Correction made to emission increase for what portion could have been accommodated during the baseline period. The justification and basis for this estimate must be provided
in the Table 2F supplement
8. Obtained by subtracting the correction from the difference. Must be a positive number.
9. Sum all values for this page.
TCEQ - 20470(Revised 04/12) Table 2F
Revised 05/09/2014