Embed Size (px)
Citation preview
MAKERERE UNIVERSITY
CONSUMER ATTITUDES, FINANCIAL LITERACY AND
CONSUMPTION OF INSURANCE IN KAMPALA,
UGANDA
KASULE SAMUEL
2003/HD10/406U
A RESEARCH REPORT SUBMITTED TO MAKERERE UNIVERSITY IN PARTIAL
FULFILLMENT OF THE REQUIREMENTS FOR THE AWARD OF A DEGREE OF MASTERS
OF SCIENCE IN ACCOUNTING AND FINANCE.
AUGUST, 2011

ii
DECLARATION
I Samuel Kasule, declare that this work is original and has not been submitted for award of a
degree in any other institution.
Signed……………………………………………….Date…………………………………..
Samuel Kasule
2003/HD10/406U

iii
APPROVAL
The following Research by Samuel Kasule which has been carried out under the title
‘’Consumer Attitudes, Financial Literacy and Consumption of Insurance in Kampala,
Uganda’’, and has been under my supervision is now ready for submission to Makerere
University with my approval.
Signed………………………………………………Date………………………………………
Dr. Nabeta Nkote
(Supervisor)
Signed……………………………………………..Date…………………………………………
Dr. Ntayi Joseph
(Supervisor)

iv
DEDICATION
The researcher dedicates this work to his family and all invaluable friends who seek knowledge
as the way to go.
v
ACKNOWLEDGEMENT
I am grateful to my supervisors Dr. Nkote Nabeta and Dr. Ntayi Joseph, for their skilled and
patient guidance and supervision during the writing of this thesis. You not only gave me valuable
suggestions and encouragements but also helped in building my research capacity. I wish to
acknowledge my employers for granting me time off to do this research, I wish to thank Mr.
Muliira Al for giving me his precious time and many valuable comments in survey. I would like
to thank all the lecturers that have been teaching me in MUBS and MUK. You have given me
priceless experience and knowledge for my life. Then last but not least, I thank my family, and
all my relatives and friends, since without their support and encouragement, this work would not
have been completed.
vi
TABLE OF CONTENTS
Declaration ________________________________________________________________ ii
Approval __________________________________________________________________ iii
Dedication _________________________________________________________________ iv
Acknowledgement ___________________________________________________________ v
Table Of Contents ___________________________________________________________ vi
Abstract ___________________________________________________________________ ix
Chapter One: Introduction __________________________________________________ 1
1.0 Background of the Study ________________________________________________ 1
1.2 Statement of the Problem ________________________________________________ 3
1.3 Purpose of the Study ___________________________________________________ 4
1.4 Research Objectives ____________________________________________________ 4
1.5 Research Questions ____________________________________________________ 4
1.6 Scope of Study ________________________________________________________ 5
1.7 Significance of the study ________________________________________________ 5
1.8 The Conceptual Framework ______________________________________________ 6
Chapter Two: Literature Review______________________________________________ 9
2.1 Introduction __________________________________________________________ 9
2.2 Consumer Attitudes ___________________________________________________ 10
2.3 Financial Literacy _____________________________________________________ 19
2.5 Insurance Consumption ________________________________________________ 23
2.6 Consumer Attitudes and Financial Literacy _________________________________ 27
2.7 Consumer Attitudes and Consumption Intention _____________________________ 28
2.8 Consumption Intention and Consumption of Insurance ________________________ 30
2.9 Consumer Financial Literacy and Consumption of Insurance ___________________ 30
Chapter Three: Research Methodology _______________________________________ 33
3.1 Introduction _________________________________________________________ 33
3.2 Research Design _____________________________________________________ 33
3.3 Population and Sample size ____________________________________________ 33
3.4 Sampling design and procedure __________________________________________ 33
3.5 Data Sources _________________________________________________________ 34
3.6 Data Collection Instruments _____________________________________________ 34
3.7 Measure of Research Variables __________________________________________ 34
3.8 Reliability and Validity of Research Instruments ____________________________ 35
3.9 Data Analysis ________________________________________________________ 35
3.10 Limitations of the study ________________________________________________ 36
Chapter Four: Data Presentation, Analysis And Interpretation Of Findings_________ 37
4.1 Introduction _________________________________________________________ 37
4.2 Descriptive analysis ___________________________________________________ 37
4.3 Factor Analysis _______________________________________________________ 41
4.4 Objective Two:Level of Financial literacy of Insurance Consumers ______________ 45
4.5 Objective Three: To establish the degree of insurance consumption in Kampala ____ 46
Chapter Five: Discussion, Conclusion And Recommendations ____________________ 53

vii
5.1 Introduction _________________________________________________________ 53
5.2 Discussion of Study Findings ____________________________________________ 53
5.3 Conclusion __________________________________________________________ 57
5.4 Recommendations ____________________________________________________ 58
5.5 Areas for further research _______________________________________________ 60
REFERENCES ___________________________________________________________ 61
viii
LIST OF TABLES AND FIGURES Page
1.0 Table 1: Insurance Penetration in Uganda and the top 5 countries in Africa…………...2
1.1 Figure 1: Conceptual Model…………………………………………………………….7
3.8 Table 2: Reliability and validity table…………………………………………………..35
4.2.1 Table 3: Response by age……………………………………………………………….39
4.2.2 Table4: Education level of Respondents……………………………………………….40
4.2.3 Table5: Working status of respondents………………………………………………....40
4.2.4 Table6: Monthly household income of respondents…………………………………….41
4.2.5 Table7: Ownership of Insurance policy…………………………………………………42
4.2.6 Table8: Gender of respondents………………………………………………………….42
4.3.1 Table9: Rotated component matrix of consumer attitudes towards insurance………….44
4.4 Table10: Response on Financial Literacy……………………………………………….46
4.5 Table11: Rotated component matrix for consumption of insurance ……………………48
4.6 Table12: Pearson Correlation Coefficient……………………………………………….50
4.6.2 Table13: Regression Model……………………………………………………………...52
ix
ABSTRACT
The study examined consumer attitudes, financial literacy and consumption of insurance. The
purpose was to examine the extent to which consumer attitudes and financial literacy can explain
insurance consumption in Uganda insurance industry.
The study was cross sectional and a structured questionnaire consisting of attitude, financial
literacy, consumption intention and consumption was used to obtain data from 118 respondents.
The data was analyzed using SPSS and regression and correlation analysis was run because of its
capacity to indicate precisely what happens to the conceptual model as different predictor
variables are introduced.
The findings revealed that consumer attitudes and financial literacy are strong predictors of
insurance consumption and they account for 34.2 percent of variance in consumption. However,
consumer attitudes explained more of the variance in insurance consumption. The findings show
negative attitude towards insurance products as a result of lack of trust and confidence in the
insurance firms. Prices of insurance products, Ignoring risks and reliance on family and friends
for help in emergencies are the other factors preventing purchase of insurance. The findings
further display low financial literacy of consumers.
Findings can help marketers of insurance products in formulation and implementation of relevant
marketing strategies towards addressing the nonchalant attitudes of consumers and financial
illiteracy to stimulate and boost patronage and perception of insurance services.
1
CHAPTER ONE
INTRODUCTION
1.0 Background of the Study
In a consumer behavioral perspective, many different psychological models within
different disciplines have been proposed to explain consumer‟s attitudes, motivation and
consumption of insurance. The most popular theoretical models applied in products and
services consumption studies are the theory of reason action (TRA) and the theory of
planned behavior (TPB) (Fishbein & Ajzen, 1975, 1980; Ajzen, 1991), behavioral
perspective models Foxall (1990; 1999), and classical attitude-behavior models.
The main advantage of these models is the inclusion of all person-, product-, and related
situation factors in explaining variations of insurance consumption frequency.
An attitude is a learned predisposition to respond to a given object or class of objects in a
consistently favorable or unfavorable way. The widespread view is that attitudes are
complex systems made up of three components. These are; cognitive component referring
to the person‟s thoughts, affective component referring to person‟s feelings, and the
conative component referring to the person‟s behavioral tendencies (Ajzen and Fishbein,
1980). In marketing context, it is stated that consumers can develop attitudes to any kind
of product or service, or indeed to any aspect of the marketing mix, and these attitudes
will affect consumption indirectly through intention to consume .(Brassington and Pettitt,
2003).
2
On addition to attitudes, consumers confront complicated financial decisions (insurance
inclusive) in today‟s demanding financial environment, which require financial literacy to
interpret. Financial literacy is the ability to process financial information and make
informed decisions involving numeracy, time value of money, interest compounding, and
money illusion and inflation aspects of personal finance (Shawn cole & Nilesh Fernando,
2008). Increasingly, individuals are in charge of their own financial security and are
confronted with ever more complex insurance policies.
Previous research has shown that both attitudes and financial literacy have significant
impact on insurance consumption. However, the conclusions come mainly from the
studies in developed countries and Western cultures, whereas preference and financial
services choice insurance consumption being one of them is various across situations and
cultures (Tajuden 2007). Lewis (1989) defines insurance consumption in terms of
Insurance penetration, insurance density and insurance in force to GDP.
Literature reviewed has shown that insurance business has a high growth rate potential in
Uganda (UIC, 2008). On the other hand, relatively low penetration of the sector (UIC,
2008) indicates that there is still a considerable unexploited potential. Despite this
potential, Uganda is still lagging seriously behind in the African insurance market
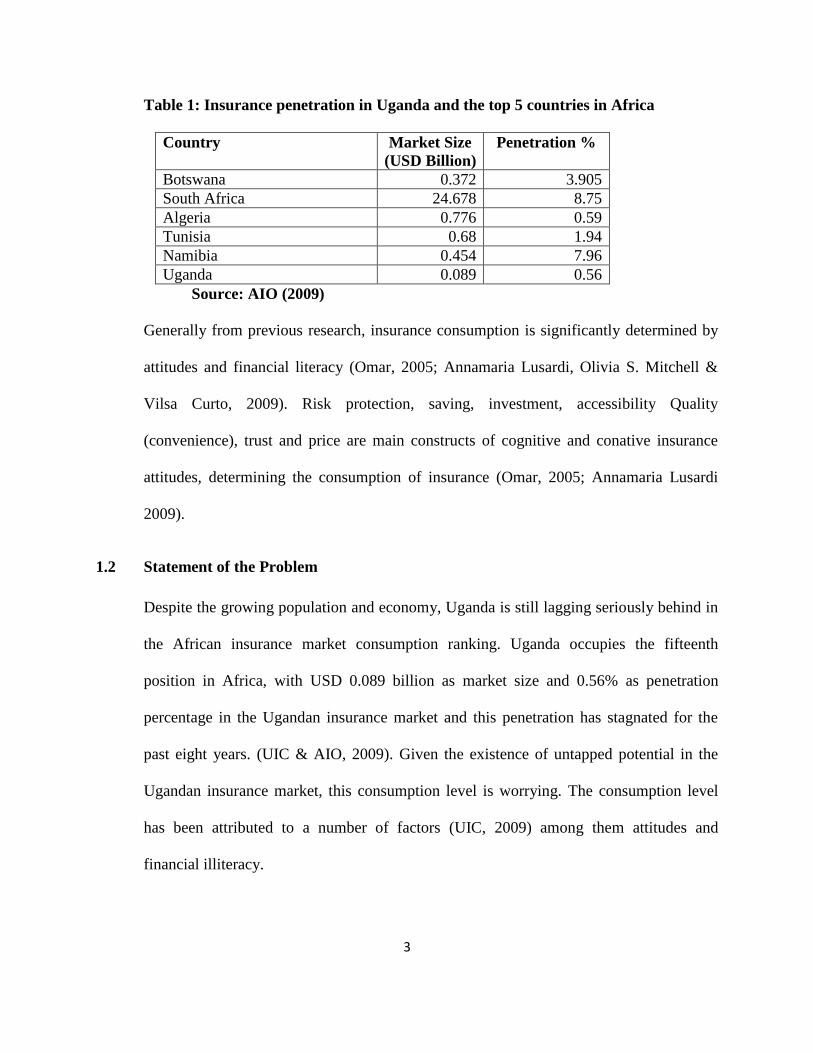
ranking. Table 1 below shows that the Ugandan insurance industry is far below the
performance of the top 5 countries in Africa.
3
Table 1: Insurance penetration in Uganda and the top 5 countries in Africa
Country Market Size
(USD Billion)
Penetration %
Botswana 0.372 3.905
South Africa 24.678 8.75
Algeria 0.776 0.59
Tunisia 0.68 1.94
Namibia 0.454 7.96
Uganda 0.089 0.56
Source: AIO (2009)
Generally from previous research, insurance consumption is significantly determined by
attitudes and financial literacy (Omar, 2005; Annamaria Lusardi, Olivia S. Mitchell &
Vilsa Curto, 2009). Risk protection, saving, investment, accessibility Quality
(convenience), trust and price are main constructs of cognitive and conative insurance
attitudes, determining the consumption of insurance (Omar, 2005; Annamaria Lusardi
2009).
1.2 Statement of the Problem
Despite the growing population and economy, Uganda is still lagging seriously behind in
the African insurance market consumption ranking. Uganda occupies the fifteenth
position in Africa, with USD 0.089 billion as market size and 0.56% as penetration
percentage in the Ugandan insurance market and this penetration has stagnated for the
past eight years. (UIC & AIO, 2009). Given the existence of untapped potential in the
Ugandan insurance market, this consumption level is worrying. The consumption level
has been attributed to a number of factors (UIC, 2009) among them attitudes and
financial illiteracy.
4
1.3 Purpose of the Study
The study sought to establish the structure of consumer attitudes, level of financial
literacy and degree of insurance consumption and the relationship between consumer
attitudes and financial literacy, consumer attitudes and consumption intention and
consumption and financial literacy and consumption intention and consumption of
insurance services in Kampala Uganda.
1.4 Research Objectives
i) To examine the structure of consumer attitudes towards insurance in Kampala, Uganda.
ii) To examine the level of consumer financial literacy in Kampala, Uganda
iii) To establish the degree of insurance consumption in Kampala Uganda.
iv) To establish the relationship between consumer attitudes and financial literacy
v) To establish the relationship between consumer attitudes and consumption intention of
insurance
vi) To determine the relationship between consumer financial literacy and insurance
consumption
vii) To determine the relationship between consumption intention and Insurance
Consumption.
1.5 Research Questions
i) What is the structure of consumer attitudes towards insurance in Kampala,
Uganda?
ii) What is the level of consumer financial literacy in Kampala, Uganda?
iii) What is the degree of insurance consumption in Kampala, Uganda?
5
iv) What is the relationship between consumer attitudes and financial literacy?
v) What is the relationship between consumer attitudes and consumption intention of
insurance?
vi) What is the relationship between consumption intention and consumption of
insurance?
vii) What is the relationship between financial literacy and insurance consumption?
1.6 Scope of Study
Subject scope
The study focused on consumer attitudes towards insurance, financial literacy,
consumption intention and insurance consumption.
Geographical Scope
The study was carried out in Kampala. Kampala was chosen because it has the
headquarters of all registered Insurance firms and is the capital territory of Ugandan.
1.7 Significance of the study
The study shall make the following contributions:
(i) The study shall contribute knowledge in the area of consumer behavior for
insurance firms to identify the nature of consumers‟ attitudes towards insurance
among non-users and their financial literacy so that appropriate marketing
strategies can be developed.
6
(ii) The study shall contribute to the existing wealth of knowledge in the area of
psychological modeling for scholars and thus stimulate further research in
consumer behavior.
iii) The study shall contribute knowledge in the area of consumption of insurance
services for consumers by identifying predictors of consumption from a
developing country context.
1.8 The Conceptual Framework
The conceptual framework is based on the theory of reasoned action and planned
behavior (TRA & TPB) and extensive review on existing literature on financial literacy
and insurance consumption.
In the psychological perspective, many empirical studies have combined a number of
interrelated factors to explain the behavior towards financial services choice and
consumption. In insurance context, the theories which are most frequently applied are
theory of reasoned action and the theory of planned behavior (Omar, 2005; Norman &
Conner, 2006; Tajuden, 2007; Verbeke and Vackier, 2005). In general, these applications
all showed that choice and motivation towards insurance consumption are driven by
attitude toward the service via intentions to purchase the service and financial literacy.
This study is a quantitative research in psychological perspective, in which TRA & TPB
are used as the basis for the conceptual framework.
The model explains the relationship between the variables under study. Consumption
(behavioral) intention is a function of attitude toward the behavior (consumption) and
attitudes affect consumption indirectly through intentions. Financial literacy is also
7
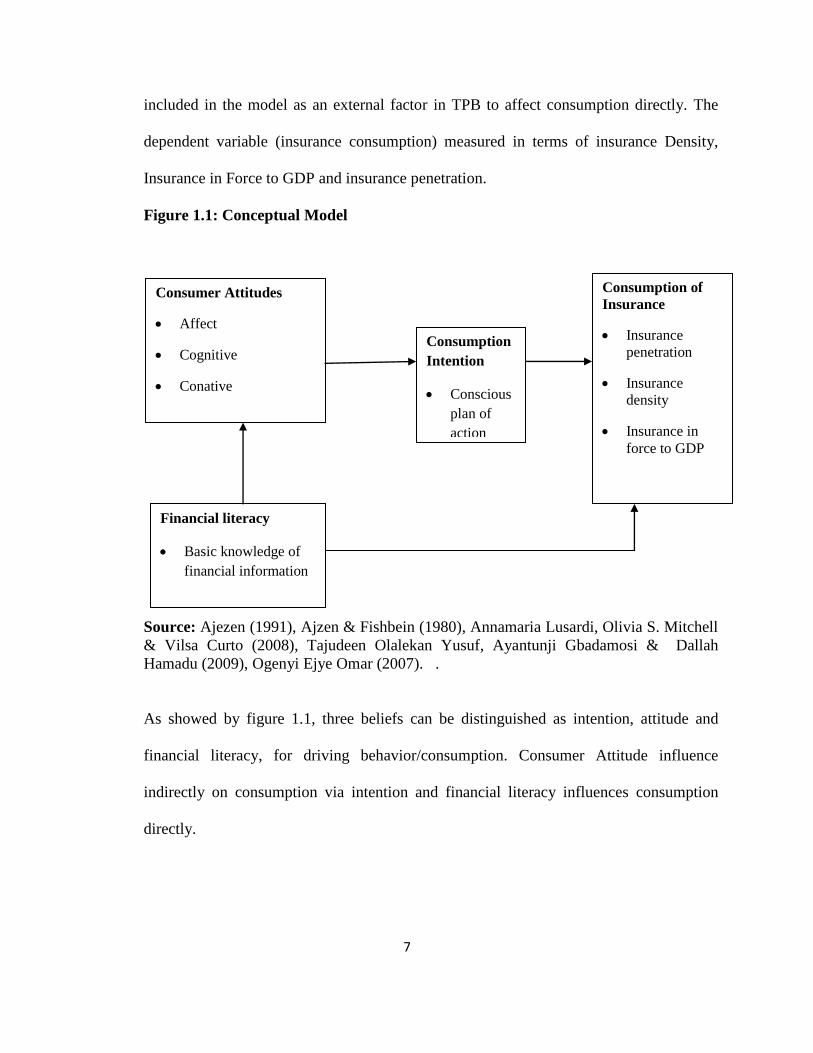
included in the model as an external factor in TPB to affect consumption directly. The
dependent variable (insurance consumption) measured in terms of insurance Density,
Insurance in Force to GDP and insurance penetration.
Figure 1.1: Conceptual Model
Source: Ajezen (1991), Ajzen & Fishbein (1980), Annamaria Lusardi, Olivia S. Mitchell
& Vilsa Curto (2008), Tajudeen Olalekan Yusuf, Ayantunji Gbadamosi & Dallah
Hamadu (2009), Ogenyi Ejye Omar (2007). .
As showed by figure 1.1, three beliefs can be distinguished as intention, attitude and
financial literacy, for driving behavior/consumption. Consumer Attitude influence
indirectly on consumption via intention and financial literacy influences consumption
directly.
Consumer Attitudes
Affect
Cognitive
Conative
Financial literacy
Basic knowledge of
financial information
Consumption
Intention
Conscious
plan of
action
Consumption of
Insurance
Insurance
penetration
Insurance
density
Insurance in
force to GDP
8
In insurance, three components influence on attitude and are affective, cognitive and
conative and are often paid attention via perceived insurance benefits as such risk
protection, saving, investment, accessibility, trust and price/cost (Omar, 2005).
Financial literacy is an integral and a fundamental aspect for consumer decision making
in insurance consumption. Financial literacy affects financial decision-making from the
cognitive capacity of basic but fundamental financial knowledge in numeracy, time value
of money, interest compounding, money illusion and inflation (Annamaria Lusardi,
2005).
9
CHAPTER TWO
LITERATURE REVIEW
2.1 Introduction
The abysmal level of insurance culture in developing economies has attracted relative
interests among researchers and practitioners alike (Udry, 1994). Some of the problems
associated with this level have been marketing insurance in communities with negative
attitude and financial illiteracy. For example, Omar (2005) assesses consumers‟ attitudes
towards life insurance patronage in Nigeria and found out that there is lack of trust and
confidence in the insurance companies. Other major reason for this attitude is lack of
knowledge about life insurance product and financial illiteracy.
In insurance consumption context, the theories which are most frequently applied are
Theory of Reasoned Action (TRA-Fishbein & Ajzen, 1975; 1980) and the Theory of
Planned Behavior (TPB-Ajzen, 1991). These two theories show that choice and
motivation toward insurance consumption are driven by attitude toward the service and
financial literacy as an external factor in the model.
The critical assumption of the Theory of Reasoned Action (TRA) is that humans behave
under their volitional control. A person will perform a given behavior (Consumption)
according to his intention, attitude and beliefs about performance of the behavior.
Intention is assumed as the best predictor of behavior. The stronger the intention to
engage in the behavior, the more likely should be its performance. Intention is assumed
as motivational factors influencing the behavior; it indicates the individual‟s willing and
10
effort to perform the behavior (Ajzen 1991). According to TPB, behavioral intention is
something like a plan to achieve the behavior. The link between intention and behavior
reflects the fact that people tend to engage in behavior they intend to perform.
Within conceptual framework of TRA, beliefs about a given behavior provide the basis
for formation of intention toward performing the behavior. Beliefs refer to a person‟s
subjective probability judgments concerning some discriminately aspects of his world;
they deal with the person‟s perception of himself and his environment (Fishbein, 1975).
Behavioral beliefs guide the attitude of individual toward the objects. Attitudes represent
a person‟s general feelings of favorableness or unfavorableness towards some stimulus
object (Fishbein & Ajzen, 1975). When a person forms beliefs about an object, he
automatically and simultaneously acquires an attitude toward that object. Each belief
links the object to some attributes; the person‟s attitude toward the object is a function of
his evaluations of these attributes.
Fishbein and Ajzen (1975, 2005) also mentioned the role of external factors if they are
proven to have impact on behavior. A multitude of variables related to social, economic,
demographic factors and personal traits could potentially influence the beliefs people
hold. The connection between background factors and behavioral, normative, and control
beliefs are in indirect way, difficult to know and belong to an empirical question.
2.2 Consumer Attitudes.
Common to all of definitions, attitudes are often considered as an evaluative or cognitive
process, and a disposition to behave in certain ways (Jaccard & Blanton, 2005). A
broadly accepted definition of attitude is as “a psychological tendency that is expressed
11
by evaluating a particular entity with some degree of favor or disfavor” (Eagly &
Chaiken 1993,). In this definition, attitude is focused on a particular entity or object,
rather than all objects and situations with which it is related; and an attitude is a
predisposition to like or dislike that entity.
According to the multi-component view of attitude, all responses to a stimulus object are
mediated by the person‟s attitude toward that object. These responses then are classified
into three categories called as three components of attitude. Cognitive component refers
to perceptual response and verbal statement of belief (person‟s thoughts); affective or
emotional component are sympathetic nervous responses and verbal statements of belief
(person‟s feelings); and behavioral or conative component implies overt actions and
verbal statement concerning behavior (behavioral tendencies) (Fishbein & Ajzen, 1975).
Although any response can be used to infer a person‟s attitude (Fishbein & Ajzen, 1975),
a single evaluative score cannot adequately represent the attitude construct in all its
complexity (Ajzen & Fishbein, 2005).
.
According to Fishbein and Ajzen, (1975), general attitude toward an object (e.g. service
or product) is formed by salient beliefs. Salient beliefs are defined as “the subjective
probability of a relation between the object of the belief and some other object, value,
concept, or attribute” (Fishbein & Ajzen, 1975).
12
2.2.1 Affective or emotional attributes of insurance
Affective or emotional component of attitude are sympathetic nervous responses and
verbal statements of belief (person‟s feelings). The affective component in the theory
refers to the individual‟s general level of positive or negative feelings concerning the
issue (Kernan & Trebbi, 1973; Kothandapani, 1971; Ostrom, 1969). In marketing
context, it is stated that consumers can develop emotional attitudes perceiving the product
as being „bad or good to buy‟; „foolish or wise to buy‟; and „useless or useful. These
attitudes will affect behavior of the consumer (Fishbein & Ajzen, 1975; Ajzen &
Fishbein, 2005; Brassington and Pettitt, 2003, Ogyenyi Omar, 2005).
2.2.2 Cognitive or evaluative attributes of insurance consumption
Common to all of definitions, attitudes are often considered as an evaluative or cognitive
process, and a disposition to behave in certain ways (Jaccard & Blanton, 2005). A
broadly accepted definition of attitude is as “a psychological tendency that is expressed
by evaluating a particular entity with some degree of favor or disfavor” (Eagly &
Chaiken 1993,). In this definition, attitude is focused on a particular entity or object,
rather than all objects and situations with which it is related; and an attitude is a
predisposition to like or dislike that entity. According to Fishbein & Ajzen, (1975) and
Ajzen & Fishbein, (2005), Cognitive component refers to perceptual response and verbal
statement of belief (person‟s thoughts). The cognitive component consists of the
individual‟s beliefs, judgment or thoughts concerning the issue (Ross Norman, 1975).
When the attitude issue is an action or behavior, the relevant cognitive structure is
considered to be the individual‟s beliefs about the instrumental utility of the action for the
13
attainment or blocking of his or her goals weighted by the value placed on such goals
(Fishbein & Ajzen, 1975).
In the insurance context these attributes are; insurance risk protection benefits, insurance
as a saving vehicle and insurance as an investment.
Insurance is a way of dealing with risk for consumers and also plays important
psychological and social roles (Black & Skipper, 2000). As Hofstede (1995) stated, “the
major function of insurance is to protect against financial loss from loss of property and
human life. Besides covering loss of property and life, it also covers the risks of
disability, critical illness, and superannuation”. Insurance is therefore developed on the
concept of property and human life value (Sayin, 2003).
Human life and property value approach focuses on the economic component of human
and property life. Any event affecting an individual‟s (both business and human) earning
capacity has an impact on property and individual‟s human life value. This event may be
fatal accident, catastrophe, premature death, incapacity, retirement, unemployment or
anything that can cause loss of value to both human and property (Black & Skipper,
2000). The human and property life value concept provides the philosophical basis for
both life and non-life insurance, which are products designed to protect the individual
against three distinctive risks: premature death, superannuation and destruction of
property (Brown & Kim, 1993). Thus while death and accident is not a risk, the timing of
both is. Insurance thus becomes the mechanism for one to ensure a continuous stream of
income to the beneficiaries and property value (Black & Skipper, 2000). In this regard,
14
insurance may be regarded as a way of dealing with risks (Omar & Owusu Frimpong,
2006).
Omar (2005) found that consumers‟ perception of life insurance purchase was guarantee
of same standards of living for dependants in case of death, ability to maintain same
standard of living in case of disability, having lump sum money in case of critical illness
and covering of loss or damage on property in case of accident.
Saving in insurance is attained from purchasing life insurance policies providing both
death coverage and a saving component and policies serving primarily as saving vehicles
(Thorsten Beck & Ian Webb, 2002). These are endowment life insurance policies, which
are a term life insurance with a saving component (Black & Skipper, 2000). These
policies generally have higher premiums that include an explicitly or implicitly defined
saving component (Thorsten Beck & Ian Webb, 2002). These policies are anticipated to
help consumers to put from time to time some money aside in a systematic way rather
than in an ad-hoc manner (Michal Matul 2005). Holders of these policies serving
primarily as saving vehicles anticipate achieving regular saving for the future (Omar,
2006). They also expect from such policies to make long term savings. By buying saving
policies consumers also expect not to rely on state pension for future survival (Omar &
Owusu Frimpong, 2006). For instance, when one takes a policy that allows him to keep
the same premium until the age of say 65, they will have considerable savings when they
reach that age. Morduch (1994) identifies week financial institutions in low-income
countries as one of the causes of low savings. He explains that people be sought to
15
second-best arrangement such as borrowing from neighbors, money lenders and relatives
and selling durable assets to cushion the effects of unforeseen tragic circumstances.
People tend to view insurance as an investment, rather than as risk protection. A policy is
viewed “as an investment aimed at maximizing claim payments in case the hazard should
occur” (Schoemaker, 1980). Because low-probability events are unlikely to happen, there
is in fact little chance of getting a payback. Hence, most people prefer to insure against
higher probability, low-loss hazards (Kunreuther & Slovic, 1978). By viewing insurance
as an investment, consumers want to see some return on their premiums. This leads to a
desire to “trade dollars with the insurance company even though it is very costly” (Slovic,
1984).
The additional component of saving in life insurance, typically earns interest and
consumers anticipate that the interest will be returned to them in form of policy
dividends, cash-values on termination of the policy, or endowment sum on maturation of
the policy (Thorsten Beck & Ian Webb, 2002).
In addition to life policies, insurers sell annuity policies (Thorsten Beck & Ian Webb,
2002). Annuities are insurance policies wherein the insurer promises to pay the insured a
series of periodic payments, often over the reminder of his/her lifetime, upon payment of
a lump sum at the beginning of the period. Consumers buying this kind of policy will
anticipate receiving these periodic payments.
Pritchett et al., (1996) observed that Insurance was understood by most people to be
critical to a well-functioning economy. By providing payment in the event of unexpected
16
losses, insurance introduces security into personal and business situation. It also serves as
a basis of credit for investment as no financial institution would lend money for purchase
of capital goods. Research on life insurance consumption revealed that consumers are
compelled to buy life insurance as a result of the perception that they are in doing so
making reliable investment on a tax free saving, hoping to achieve higher returns in
future and hoping to attain future cash.
Many insurance products couple insurance with a tax shield. The buildup in whole life
insurance is not taxed, for example, making that product an excellent vehicle for saving.
Health insurance that pays for routine care costs is also a tax dodge, saving the taxation
that would be associated with wage and salary payments. The primary motivation for
such policies is not the financial risk per se, but the combination of risk reduction and tax
rewards (David M & Zeckhauser, 2003).
2.2.3 Behavioral or conative attributes of insurance
Behavioral or conative component of attitude implies overt actions and verbal statements
concerning behavior (Ajazen & Fishbein, 2005). It refers to the primary motivational or
behavioral consequences of attitudes. In insurance context, consequences or motivational
factors of buying insurance are agreed as; accessibility or convenience of insurance
services, trust and credibility of insurance firms, price of insurance products or actuarial
fairness and knowledge of the service (Omar, 2005).
17
In modern societies, convenience is perceived as important characteristics in selecting a
service or product. According to Gofton (1995), convenience is an outcome of product or
service use, and relates to the capacity of consumer to employ a particular resource as
well as simple time available. Convenience is a complex concept in marketing literature.
Convenience is not only the ease of purchase or quick consumption, it also means saving
of time, physical or mental energy at one or more stages of the overall insuring process
such as planning and purchase, servicing, settling claims and consumption, (Nguyen,
2007). Furst et al (1996) mentioned time as important component of convenience, and
time is often spoken as commodity to be spent and saved. The easy accessibility of
insurance is another most coveted insurance benefit that the customers look for and is
very important in developing a positive attitude towards consumption (standard bank,
2007). The online access to insurance companies and their policies has made them more
lucrative to the customers. In developed economies, customers can search, compare and
select their insurance coverage through the click of a mouse from their own residence
(Thorsten Beck & Ian Webb, 2002). This has been observed that through online services,
the insurance companies have been able to reach more number of customers and
consequently their customer base has also mopped up significantly. Online services not
only provide convenience of accessibility of insurance services, but also knowledge of
the premiums offered and which insurance firms offer them.
Lack of trust in insurance companies to settle claims in case of actual loss (hazard or
damage), is one of the most important issues pointed out by researchers on insurance
consumption in developing countries. Omar (2005) assesses consumers‟ attitudes towards
18
life insurance patronage in Nigeria and found out that there is lack of trust and confidence
in the insurance companies. People reject insurance on grounds that insurers do not pay
when it comes to claims settlement and that the bureaucracy is too much. Trust in
insurance is very volatile, any possible bad experience with insurance that might be easily
spread by media or word of mouth, can turn to those neutral into distrustful, thus
reducing the market size significantly (Michael Matul, 2005).
Kuhlemeyer & Allen (1999) find out that consumer satisfaction with life insurance
products is largely accounted for by the trust they repose in the sales agents in contrast to
those who purchase direct from insurance companies. The surveyed population who
purchased from sales agents was more satisfied with insurance industry than those who
purchased directly from insurance companies. This apparently justifies the view held
earlier by Pritchett et al. (1996) that „‟insurance is sold rather than bought‟‟.
The foremost insurance benefit in today‟s world is low insurance rate and premium one
has to pay (economy watch, 2008). While choosing an insurance policy, every customer
looks at the rate first and then to the other associated benefits. The lesser the insurance
rate, the more affordable the insurance becomes. Among all the insurance benefits, low
insurance rate and premium is the most coveted one (Jonathan Gruber, 2008).
Individuals may be unwilling to purchase insurance if it is not available at an actuarially
fair price to the individual (Jonathan Gruber, 2008). Clearly, high prices of insurance are
a major cause of un-insurance. Indeed, Chernew et al. (2006) estimate that two-thirds of
the increase in the number of uninsured over the past decade can be traced to rising health
19
insurance costs. In a standard model, while rising insurance loads will lead to less
insurance; a pure rise in the costs of treating medical illness should lead to fewer
uninsured, not more. While Leek et al (2000), Honkanen et al (1988), and Olsen (2004)
reported that price, value for money and household income were not perceived as barrier
for insurance consumption, Verbeke and Vackier (2005) found that high price had
negative impact on attitude toward consumption.
2.3 Financial Literacy
Within TRA and TPB, Fishbein and Ajzen (1975) and Ajzen (1991) mentioned the
external factors such as personal traits, moral norms, past behavior and habits. The
authors suggested that the theories are open to inclusion of additional predictors if it can
be shown that they capture a significant proportion of the variance in intention or
behavior (Ajzen, 1991). From the conceptual and empirical perspectives, several authors
found that financial literacy can be a significant predictor of insurance consumption.
2.3.1 Basic Knowledge of Financial Information
Financial literacy is defined as the ability to process basic financial information and make
informed decisions involving numeracy, time value of money, interest compounding,
money illusion and inflation aspects of personal finance (Shawn cole & Nilesh Fernando,
2008). Financial decisions can be difficult, comparing saving or borrowing, investing or
general insurance policy options with different interest rates and term structures can be
difficult for those without cognitive ability in financial savvy, even knowledgeable
individuals may need to rely on calculators or spreadsheets to make truly informed
20
decisions (Kondo, Toshio, et. al. 2008). Many households are not knowledgeable, and
often receive little assistance when choosing insurance policy options for saving,
investment and risk protection. Unlike the decision to visit a restaurant or purchase a
particular car, insurance consumers especially in life insurance, in many cases don‟t
receive useful feedback on the value of the insurance product they have purchased, yet
these policies involve calculation of interests, time value of money and have inflation
impact (Shawn cole & Nilesh Fernando, 2008).
Financial literacy allows people to increase and better manage their earnings, and
therefore better manage life events like risk management, education, illness, job loss, or
retirement. It also promotes understanding and acceptance of important political reforms,
such as health care or pension reforms. While the significance of financial literacy has
not yet been fully articulated and recognized by the international development
community or by policy makers and practitioners in developing countries measures to
promote and improve financial education are becoming more frequent (Shawn cole &
Nilesh Fernando, 2008).
In developing countries, the expansion of microfinance, often accompanied by micro
insurance and savings products, has vastly increased: a household may have the choice of
insurance products for health, livestock, life, and even index-based weather derivatives
(Shawn cole & Nilesh Fernando, 2008). Many of these products are complex, and a
growing body of evidence suggests that low levels of financial literacy may prevent
consumers from making good decisions about financial products. Much of this evidence
is from the United States, a country with an unusually wide array of financial products. A
21
survey of Australian consumers revealed that only 28% were able to correctly calculate
compound interest; the figure for American consumers was even lower at 18% (Shawn
cole & Nilesh Fernando, 2008).
Research on levels of financial literacy in developing countries remains comparatively
slim. However, a small number of studies show even lower levels of financial literacy. A
study conducted in Zambia by the Department for International Development showed
that only half the adult population knew how to use basic financial products.
There exist very few surveys that provide information on financial literacy. To remedy
this lack of data, Lusardi and Mitchell (2006) devised a module on financial literacy for
the 2004 US Health and Retirement Study (HRS). Their questions aimed to test basic
financial knowledge related to the working of interest compounding, time value of
money, the effects of inflation, money illusion and risk diversification.
The literacy questions developed by Annamaria Lusardi and her group tested the
knowledge of basic but fundamental financial concepts. The first three questions were
referred to as the „‟numeracy‟‟, “interest rate” and “inflation” questions; they tested
whether respondents are knowledgeable about inflation, interest rates and possessed basic
financial numeracy. The fourth question, on “interest compounding”, evaluated
respondents‟ knowledge on compound interest, a crucial element of an informed
investment and saving decisions, the fifth question tested respondents on money illusion
basics (Lusardi & Mitchell, 2006, 2008).
22
2.4 Consumption Intention
Intention is the best predictor of planned consumption, also an unbiased predictor of
action (Bagozzi, Baumgartner, & Yi, 1989). Fredricks and Dossett (1983) describe
consumption intention as the immediate determinant of overt volitional consumption.
Intention can be viewed as the conscious plan to carry out a particular behavior and the
motivation to perform it (Patch et al. 2005).
Understanding the fundamental determinants of consumption (behavior) has been a
paramount goal for many theorists in the social and decision making sciences (Mei-Fang
Chen, 2007). The underlying psychological assumption driving the linkage between
intentions and consumption is that most human behavior is under volitional control
(Ryan, 1970). Fishbein and Ajzen (1975) have defined intentions as a person‟s location
on subjective probability dimension involving a relation between himself and some
action. Intentions are the single best predictor of planned behavior and intentions are also
an unbiased predictor of action because they are the conscious plan of action. (Bagozzi,
Baumgartner, & Yi, 1989).
2.4.1 Conscious Plan of Action
Intention can be viewed as the conscious plan to carry out a particular behavior and the
motivation to perform it (Patch et al. 2005). The construct of intention is often measured
in term of will, expect, should, wish/intend, determined or want with the probability
estimates such as “unlikely and likely” in social science (Armitage & Conner, 2001) and
23
also in insurance consumption context (Sparks et al, 1992; 1995; Verbeke & Vackier,
2005).
The consumption intention, based on the theory of reasoned action (TRA) (Ajzen &
Fishbein, 1980), is basically determined by two factors: the attitude that the person holds
towards engaging in the behavior (i.e., consumption attitude) and the degree of social
pressure felt by the person with regard to the behavior (i.e.,. subjective norm).
Intention is proposed as the closest cognitive antecedent of actual consumption
performance rather than attitude and attitudes affect consumption indirectly through
intention (Fishbein & Ajzen 1975; Gollwitzer, 1993; Triandis, 1977).
2.5 Insurance Consumption
Jaccard and Blanton (2005) defined behavior as “any denotable overt action that an
individual, a group of individuals, or some living system (e.g., a business, a town, and a
nation) performs. An action has a denotable beginning and a denotable ending and is
performed in an environmental context in which the individual or group is embedded”.
This definition is probably quoted most frequently in social science and marketing
research (Nguyen Tien Thom, 2007).
Behaviors might be measured in forms of dichotomous (e. g., whether a person has
bought insurance), discrete (e. g., how many times in the last 10 years the person has
bought insurance), and continuous scores (e. g., the number of policies someone buys or
is willing to buy in a given time) (Jaccard & Blanton, 2005). The kind of behavioral
scores chosen depends on the theories that are adapted. According to Jaccard and Blanton
24
(2005), when theories are adapted to take into account the multiple attitudes that assumed
to underlie the behavior, the quantitative and continuous scores of insurance penetration,
density and inforce to GDP are suited for consumption measure.
Yaari (1965) and Hakansson (1969) were the first to develop a theoretical framework to
Explain the consumption of insurance. Within this framework, the consumption of
insurance is attributed to a person's desire to bequeath investment to dependents and
provide income for retirement (savings). The consumer maximizes lifetime utility subject
to a vector of interest rates and a vector of prices including insurance premium rates. The
framework posits the consumption for insurance to be a function of investment, expected
income over an individual's lifetime, the level of interest rates, the cost of insurance
policies (administrative costs), and the assumed subjective discount rate for current over
future consumption. Lewis (1989) extends this framework by explicitly incorporating the
preferences of the dependents and beneficiaries into the model. Specifically, he derives
the demand for insurance consumption as being Insurance penetration, insurance density
and insurance in force to GDP.
2.5.1 Insurance Penetration
Insurance Penetration is defined as the ratio of both life and non-life insurance premium
volume to GDP. It measures the importance of insurance activity relative to the size of
the economy. Both numerator and denominator are in local currency, with GDP numbers
25
coming from the International Monetary Fund (IMF)'s International Financial Statistics
(IFS).
2.5.2 Insurance Density,
The second indicator of life insurance consumption is Insurance Density, defined as
premiums per capita, expressed in international real dollars. It indicates how much each
inhabitant of the country spends on average on insurance in real international dollars
(Browne and Kim, 1993). To calculate these ratios, we first convert the premium volume
into international dollars by multiplying it with Purchasing Power Parity (PPP)
conversion factors from the World Bank's World Development Indicators (WDI). The
Purchasing Power Parity conversion factor is defined as the number of units of a
country's currency required to buy the same amounts of goods and services in the
domestic market as one U.S. dollar would buy in the United States. Using PPP
conversion factors is preferable to using exchange rates, since the latter are distorted by
differences in exchange rate regimes. Furthermore, PPP conversion factors take into
account that the price of non-traded goods relative to traded goods increases with the
income level of economies.
We then divide the premium volume in international dollars by the population size, also
obtained from the WDI and deflate the numbers by the U.S. Consumer Price Index (CPI),
obtained from the IFS, to make the indicator comparable over time. Since data on the
PPP conversion factor are only available for the period 1980-96, the insurance densities
in international real dollars are constrained to this period. Insurance densities using
26
average-period exchange rates from the IFS are also calculated for the years 1960-1996
for use in the panel estimation. Although both Insurance Penetration and Insurance
Density use gross premiums, there remain important differences between both measures
with repercussions for cross-country comparisons. Insurance Penetration measures
insurance consumption relative to the size of the economy, while Insurance Density
compares insurance consumption across countries without adjusting for the income level
of the economy.
2.5.3 Insurance in Force to GDP
The third measure of insurance consumption is Insurance in Force to GDP.
It equals the sum of the face amounts plus dividend additions of insurance policies
outstanding as a share of GDP. It is a quantity measure of insurance consumption, the
quantity being risk underwritten plus savings accumulated. Insurance in force thus
contains both the cash value of policies, associated with the savings component of
insurance policies and the net amount of risk faced by insurers (Beck, Demirgac-Kunt,
and Levine, 2000). Unlike insurance penetration and insurance density, insurance in force
to GDP does not include the price and measure only quantity. Since the numerator is a
stock and the denominator a flow variable, both variables have to be deflated
accordingly. According to Beck, Demirguc-kunt, and Levine (2000), the stock variable is
deflated by end-of-year consumer price indices (CPI) and the GDP by the annual CPI.
Then the average of the deflated stock variable in year and t-1 is computed and divided
by real GDP measured in year t.
27
2.6 Consumer Attitudes and Financial Literacy
Financial literacy is strongly and positively related to attitudes towards insurance
consumption (Lewis, 1989). Specifically, an educated person and whose parents had
insurance and retirement savings is about 50 percentage points more likely to know about
insurance and risk diversification than a person with less than a high school education
and whose parents were not insured and had no retirement savings (Anna-Maria Lusardi
& Olivia. S. Mitchell, 2009).
Given that many developing countries have a large number of their population engaged in
agriculture, such communities are especially vulnerable to income shocks which result
from weather risk and price volatility in the goods they produce. As such, insurance can
be critical in allowing households to smooth consumption and support longer-term
investments in human and physical capital (Mandell, Lewis. 2004).
While research connecting financial literacy to household attitude towards savings and
investment decisions remains limited in developing countries, a rich strand of research
exists for developed countries. According to Lusardi (2007), data from the Health and
Retirement Study showed that attending employer-sponsored retirement planning
seminars is associated with an increase in both financial and total net worth, particularly
for families at the bottom of the wealth distribution. The increases were as much as 20%
for those coming from a background of low education.
While much of the attention on financial literacy in the US focuses on investment
decisions, economists regularly wonder why, for example, S&P 500 index mutual funds
28
survive in the market, charging relatively high fees, when very low-cost alternatives
exist. A consumer may not perceive a big difference between two funds, each earning 7%
before fees, but with the ability to understand these nuances can dramatically change the
financial well-being of an individual. Such calculations are important in developing
countries as well. Inflation risk is often substantial, and financial literacy is required to
understand which insurance policies provide protection against inflation.
Similarly, a nuanced understanding of the importance of how the value of various assets
correlates with each other can help households diversify risk efficiently (Woodward,
Susan E. 2003). Consumer Attitudes towards financial services were found to correlate
well with financial literacy, with mean correlations ranging from 0.35 to 0.55
(Woodward, Susan E. 2003).
2.7 Consumer Attitudes and Consumption Intention
Because attitudes are recognized as one major factor that guides human behavior, it is
reasonable to expect a relationship between attitudes about insurance and likely
consumption of insurance via consumption intentions (behavioral intention) (Sarah A.
Nonis & Gauri S.Guha, 2007). Intention is determined by the attitude towards the
behavior object in question (consumption)
A person‟s attitude towards consumption of insurance represents evaluation of the
behavior and its outcomes. If a person considers that consumption of insurance will have
a favorable outcome, it is more likely that they will consume insurance. Thus his attitude
towards insurance will significantly predict consumption intention. Several meta-analyses
of the empirical literature have provided evidence to show that intentions can be
29
predicted with considerable accuracy from measures of attitudes towards the behavior
(Armitage & Conner, 2001). Attitudes were found to correlate well with intentions, with
mean correlations ranging from 0.45 to 0.60 (Ajzen & Fishbein, 1975).
The construct of attitude to the consumption of one product is akin to the perceptions of
the personal desirability of performing a particular behavior. This attitude depends on
ones intention to consume subject to expectations of and beliefs in the personal impacts
on the outcomes resulting from that consumption. In other words, attitudes influence
consumption indirectly through intentions. When attitude is assessed at general level, it is
expected to be an appropriate predictor of behavioral (consumption) categories (Fishbein
& Ajzen, 1975). However, this relationship is mediated through behavioral intention
(Fishbein & Ajzen, 1975; Ajzen & Fishbein, 2005). Empirical evidence in social science
and marketing research shows that when the principle of compatibility is met, overall
attitude correlates well with intentions, (Ajzen & Fishbein, 2005)
The expectations of the critical outcomes resulting from the behavior are an important
antecedent to a behavioral intention. Benefits of investment, saving, risk management,
trust and insurance knowledge influence the consumption intention towards insurance.
Thus attitudes influence consumption indirectly through intentions and intentions directly
influence consumption.
The theorists suggested that a specific behavior could be predicted when the behavioral
intention is appropriately measured (Ajzen & Fishbein, 1975; 2005), Many studies have
substantiated the predictive validity of behavioral intention.
30
2.8 Consumption Intention and Consumption of Insurance
A number of theorists have proposed that the intention to perform a behavior (consume),
rather than the attitude, is the closest cognitive antecedent of actual behavioral
performance (Fishbein & Ajzen, 1975; Fisher & Fisher, 1992; Gollwitzer, 1993).
Intention plays an important role in determining the frequency of insurance consumption
(Verbeke & Vackier, 2005). As some studies reported a high positive correlation between
intention and insurance consumption frequency of around 0.65 (Olsen, 2001; Verbeke &
Vackier, 2005). Intention is measured as likelihood that a person is willing to act in
insurance consumption (Fishbein & Ajzen, 1975: Ajzen, 1991).
Meta-analyses covering diverse behavioral domains have reported the mean intention-
consumption (behavior) correlation of from .44 to .62 ( Ajzen & Fishbein, 2005, ). The
studies in insurance consumption also confirm the important role of intention in
determining the behavior frequency. According to the TPB (Ajzen, 1991), when a
person‟s attitude towards engaging in a behavior is positive then he or she is more likely
to develop intentions towards that behavior. In other words, when the consumer‟s attitude
to insurance products is positive, he will certainly develop intention to consume and will
definitely consume insurance (Omar 2005).
2.9 Consumer Financial Literacy and Consumption of Insurance
Financial literacy allows people to increase and better manage their earnings, and
therefore better manage life events like risk, illness, job loss, or retirement (Shawn Cole
& Nilesh Fernando, 2008).
31
One of the most straightforward consequences of limited financial literacy may be limited
financial market participation. Households that are not familiar with the workings of a
life insurance firm for example, are unlikely to buy life insurance policies, and may
instead choose to rely on government pension schemes and friends in case of
emergencies (Pasricha, Nicole. 2008).
Field experience suggests that financial literacy is even more important with respect to
insurance contracts. Many households considering microinsurance policies are buying
insurance for the first time, and may not have a good understanding of the probability that
insurable events will occur, or how the payouts will be calculated. Households with
greater levels of financial literacy may better understand the advantages and
disadvantages of insurance policies, and make better decisions (Shawn Cole & Nilesh
Fernando, 2008).
Individuals make many financial decisions each year. These relate to a wide range of
financial matters, including decisions on how to hedge risk (insure), how much to spend
and to save, where to invest their money, how to manage their financial risks, how much
debt they may need to fund their expenditure, and what form that debt should take. These
decisions range in complexity, but all require at least a basic level of financial literacy. In
a world of escalating financial complexity, there is an increasing need for financial
knowledge and at least basic financial skills (Morris 2001). There is an ever increasing
diversity of financial products and services, including insurance products and investment
opportunities available to the public. While this provides increased benefits, it also entails
more complex risks, including risks that are not always readily apparent to the unwary.
32
Accordingly, the scope and complexity of the financial decisions an individual has to
make in managing their financial affairs has grown significantly. Individuals must be able
to differentiate between a wide range of financial products and services, and providers of
those products and services.
The ability to make well-informed financial decisions plays an important part in the
ability of individuals to manage their financial affairs. The outcomes of financial
decisions have significant implications for an individual‟s financial security and standard
of living. A person with a good level of financial literacy is likely to be better placed than
someone without those skills and knowledge to manage their financial affairs prudently;
all else being equal, they are more likely to budget effectively, invest wisely and manage
their debt level in a sustainable manner. By contrast, poor financial choices, possibly
based on a lack of understanding of financial matters, can result in a number of negative
outcomes, including a lower level of financial wealth and imprudent debt levels.
Financial literacy has a clear impact on the ability of households to consume insurance
products.
Omar (2007) found that Nigerian‟s were consuming little insurance due having poor
saving culture, with fewer people holding savings accounts. He attributed this to low
financial literacy, poor money management skills and low incomes.
33
CHAPTER THREE
RESEARCH METHODOLOGY
3.1 Introduction
The objective of this study was understand the perceived triggers and barriers of
consuming insurance among the defined target population in Kampala Uganda and the
relationship between the triggers and barriers with consumption.
3.2 Research Design
A cross-sectional research design based on quantitative data from secondary and primary
sources was done. Descriptive, correlation and regression was combined with cross-
sectional study design to ascertain the relationship between the variables.
3.3 Population and Sample size
The population of interest was people aged 25-65 years (insurable years); belonging to
high and middle social classes , and who do not currently have insurance cover in
Kampala, agents of insurance and marketing executives in insurance. A total sample of
150 respondents was determined. The choice of Kampala was due to its nature as a
metropolitan city where most Ugandan ethnic groups are largely presented.
3.4 Sampling design and procedure
Sampling area was defined as Kampala because is the head quarter of all insurance firms
and is the capital territory and Ugandans from all tribes and social class backgrounds are
represented in the capital. Similarly, it has a heterogeneous structure. Simple random
34
sampling method based on demographical variables of age, gender and socio-economic
status was used.
3.5 Data Sources
Data was collected from primary sources
Primary Data
Primary data was obtained using self administered questionnaire served to 150 people in
Kampala.
3.6 Data Collection Instruments
Questionnaire
Close ended and self administered structured questionnaire were developed out of
literature review of the independent and dependent variables attitudes, intentions and
financial literacy and consumption. A structured questionnaire consisting of three
distinctive but related sections was designed for this investigation. The first part consisted
of demographic profile of the respondents; the second part covered the construct of
attitudes, intention, financial literacy and consumption.
3.7 Measure of Research Variables
All variables explaining attitudes and intention were operated using the guidelines
suggested by (Ajzen; 1991) and were measured with Cronbach-Alpha coefficient by a
seven point Likert type scale with „strongly disagree‟ to „strongly agree‟ as the anchor
points. Financial literacy was measured by a seven point rating scale with answers
ranging from wrong to correct, don‟t know and refusal.
35
Insurance consumption (behavior) was measured on a seven likert scale with anchor
points being‟ totally disagree‟ and „totally agree‟.
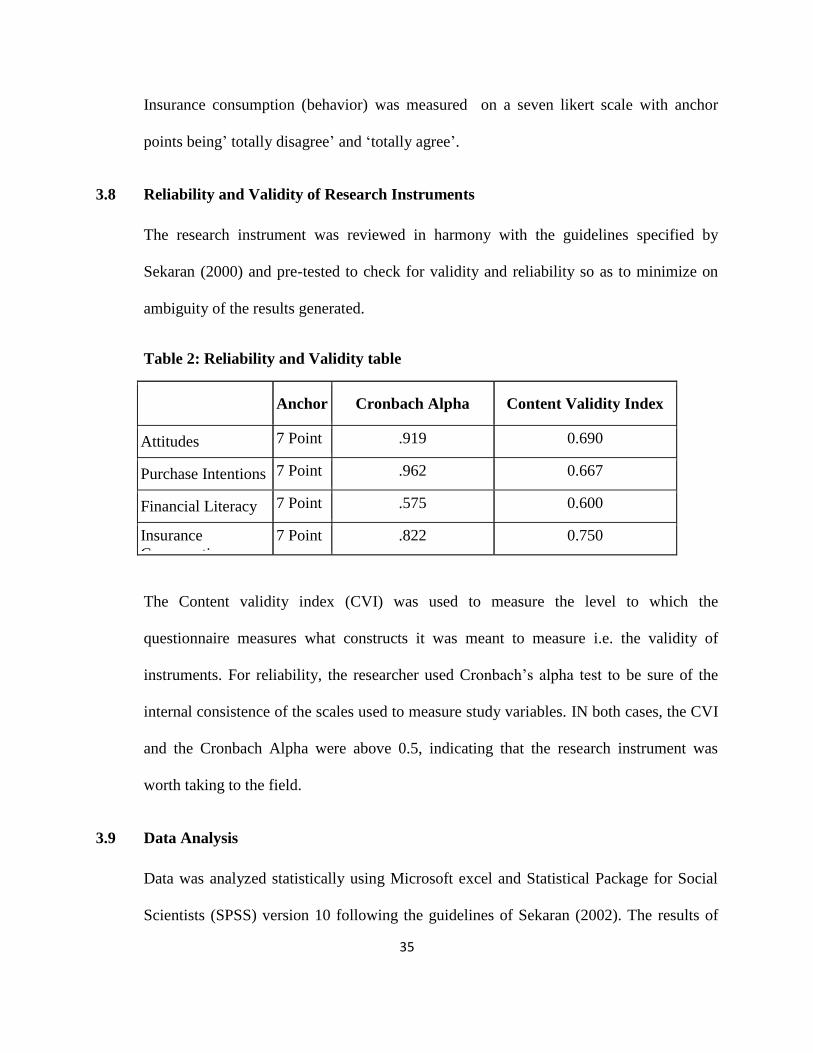
3.8 Reliability and Validity of Research Instruments
The research instrument was reviewed in harmony with the guidelines specified by
Sekaran (2000) and pre-tested to check for validity and reliability so as to minimize on
ambiguity of the results generated.
Table 2: Reliability and Validity table
Anchor Cronbach Alpha Content Validity Index
Attitudes 7 Point .919 0.690
Purchase Intentions 7 Point .962 0.667
Financial Literacy 7 Point .575 0.600
Insurance
Consumption
7 Point .822 0.750
The Content validity index (CVI) was used to measure the level to which the
questionnaire measures what constructs it was meant to measure i.e. the validity of
instruments. For reliability, the researcher used Cronbach‟s alpha test to be sure of the
internal consistence of the scales used to measure study variables. IN both cases, the CVI
and the Cronbach Alpha were above 0.5, indicating that the research instrument was
worth taking to the field.
3.9 Data Analysis
Data was analyzed statistically using Microsoft excel and Statistical Package for Social
Scientists (SPSS) version 10 following the guidelines of Sekaran (2002). The results of
36
the analysis were presented in form of tables, graphs and charts for interpretation.
Microsoft excel analysis was used to compute the dependent variable‟s ratios. Attitudes,
intention, financial literacy and consumption data was transferred to SPSS to ascertain
their relationship.
Factor analysis was performed to group the consumers and predict their attitude and
consumption of insurance. This process helped to identify the underlying factors leading
to attitude formation and consumption.
Pearson correlation analysis was used to determine the relationship between attitudes,
intention, financial literacy and insurance consumption. Regression analysis was used to
determine the relationship and impact of Attitudes, intention and financial literacy to
insurance consumption.
3.10 Limitations of the study
It is noteworthy that the study sample has a geographical limitation as the data used was
collected only from Kampala and on a relatively small sample. Also, the sample might be
biased toward those who belong to high and middle social classes and who are aged
between 25 and 65, compared to the insurable consumer population in Uganda. The study
was also limited by resources and time.
37
CHAPTER FOUR
DATA PRESENTATION, ANALYSIS AND INTERPRETATION OF FINDINGS
4.1 Introduction
This chapter presents and explains results from the survey data. The variables analyzed
were consumer attitudes, financial literacy, purchase intention and consumption of
insurance.
The chapter presents descriptive analysis, specific responses on the study variable, factor
analysis showing the most important contributing factors to study variables, correlation
analysis and regression analysis ascertaining the relationship of the study variables.
4.2 Descriptive analysis
Percentages were used to describe the characteristics of the respondents that have to say
age group, levels of education, working status, sex, ownership of insurance policy and
income levels.
4.2.1 Age group
The age group was used to establish the respondents‟ level of competence and insurable
age and the results are indicated in table 2 below.
38
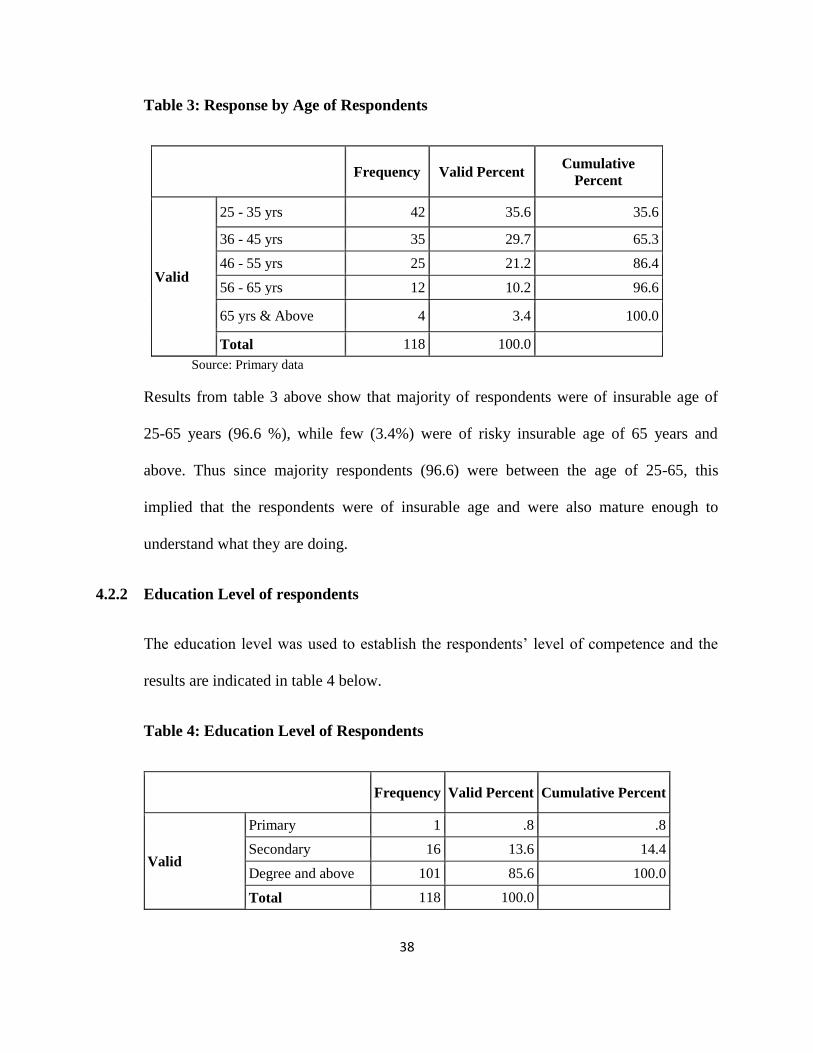
Table 3: Response by Age of Respondents
Frequency Valid Percent
Cumulative
Percent
Valid
25 - 35 yrs 42 35.6 35.6
36 - 45 yrs 35 29.7 65.3
46 - 55 yrs 25 21.2 86.4
56 - 65 yrs 12 10.2 96.6
65 yrs & Above 4 3.4 100.0
Total 118 100.0
Source: Primary data
Results from table 3 above show that majority of respondents were of insurable age of
25-65 years (96.6 %), while few (3.4%) were of risky insurable age of 65 years and
above. Thus since majority respondents (96.6) were between the age of 25-65, this
implied that the respondents were of insurable age and were also mature enough to
understand what they are doing.
4.2.2 Education Level of respondents
The education level was used to establish the respondents‟ level of competence and the
results are indicated in table 4 below.
Table 4: Education Level of Respondents
Frequency Valid Percent Cumulative Percent
Valid
Primary 1 .8 .8
Secondary 16 13.6 14.4
Degree and above 101 85.6 100.0
Total 118 100.0
39
Results from table 4 above show that majority of respondents had a bachelors degree and
above (85.6%), while very few (13.6%) had a secondary certificate. Thus since majority
of respondents had at least a degree this implied that they were knowledgeable enough
and understand what they are doing.
4.2.3 Working status
Working status could help consumers to have income to afford insurance products and
also possess insurable assets. Table 5 below shows the results.
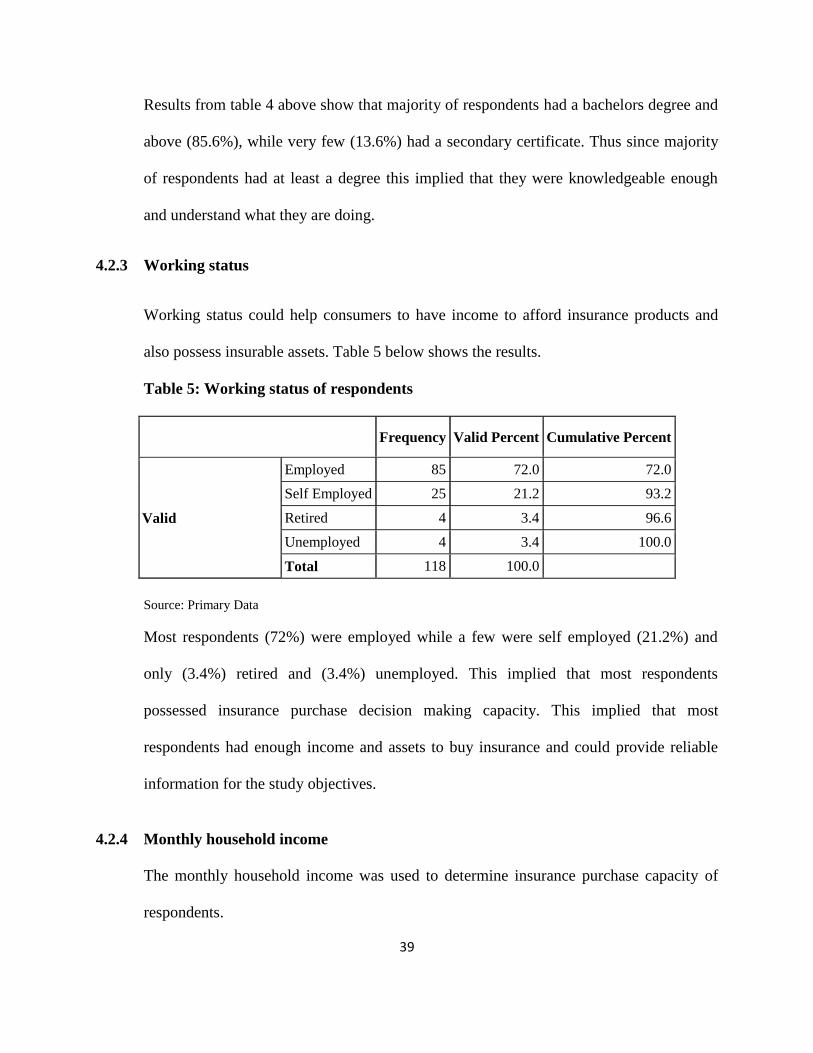
Table 5: Working status of respondents
Frequency Valid Percent Cumulative Percent
Valid
Employed 85 72.0 72.0
Self Employed 25 21.2 93.2
Retired 4 3.4 96.6
Unemployed 4 3.4 100.0
Total 118 100.0
Source: Primary Data
Most respondents (72%) were employed while a few were self employed (21.2%) and
only (3.4%) retired and (3.4%) unemployed. This implied that most respondents
possessed insurance purchase decision making capacity. This implied that most
respondents had enough income and assets to buy insurance and could provide reliable
information for the study objectives.
4.2.4 Monthly household income
The monthly household income was used to determine insurance purchase capacity of
respondents.
40
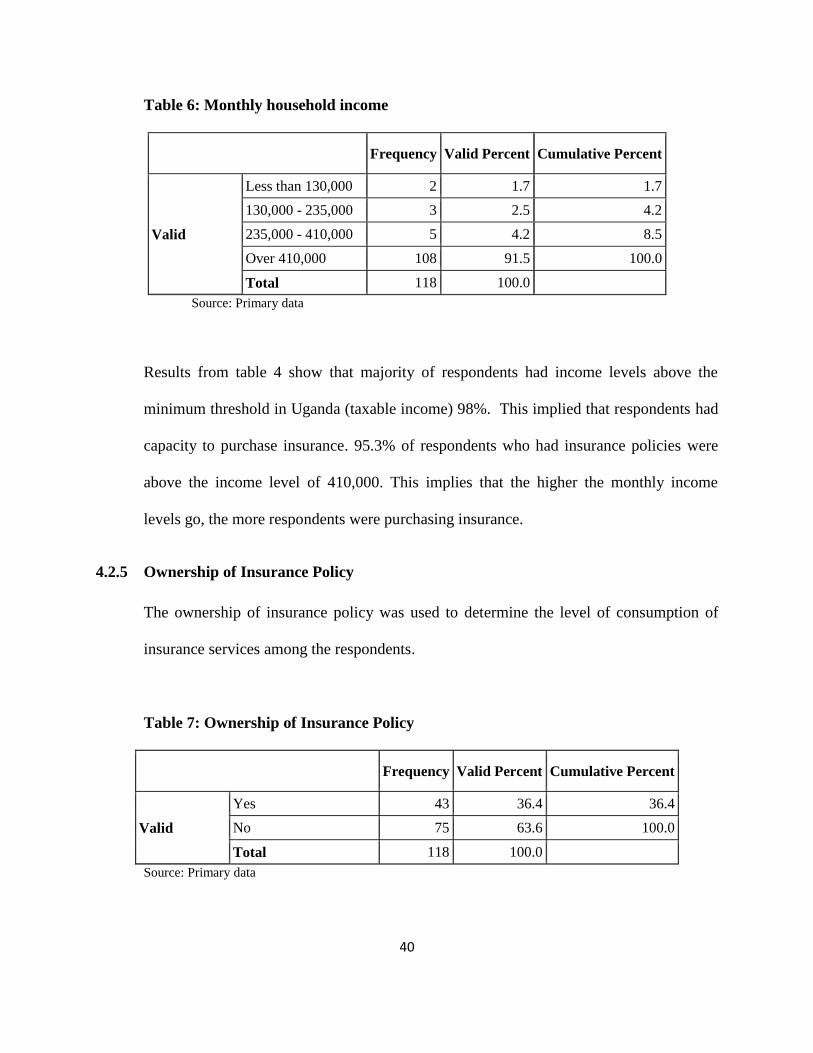
Table 6: Monthly household income
Frequency Valid Percent Cumulative Percent
Valid
Less than 130,000 2 1.7 1.7
130,000 - 235,000 3 2.5 4.2
235,000 - 410,000 5 4.2 8.5
Over 410,000 108 91.5 100.0
Total 118 100.0
Source: Primary data
Results from table 4 show that majority of respondents had income levels above the
minimum threshold in Uganda (taxable income) 98%. This implied that respondents had
capacity to purchase insurance. 95.3% of respondents who had insurance policies were
above the income level of 410,000. This implies that the higher the monthly income
levels go, the more respondents were purchasing insurance.
4.2.5 Ownership of Insurance Policy
The ownership of insurance policy was used to determine the level of consumption of
insurance services among the respondents.
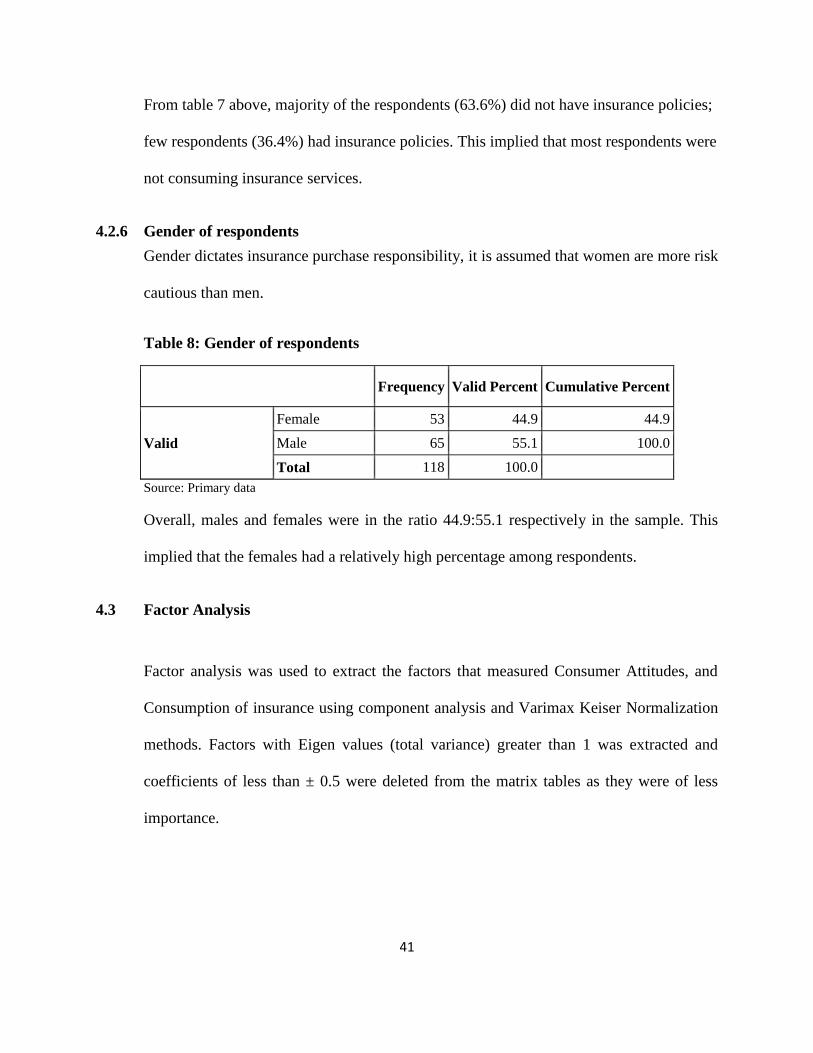
Table 7: Ownership of Insurance Policy
Frequency Valid Percent Cumulative Percent
Valid
Yes 43 36.4 36.4
No 75 63.6 100.0
Total 118 100.0
Source: Primary data
41
From table 7 above, majority of the respondents (63.6%) did not have insurance policies;
few respondents (36.4%) had insurance policies. This implied that most respondents were
not consuming insurance services.
4.2.6 Gender of respondents
Gender dictates insurance purchase responsibility, it is assumed that women are more risk
cautious than men.
Table 8: Gender of respondents
Frequency Valid Percent Cumulative Percent
Valid
Female 53 44.9 44.9
Male 65 55.1 100.0
Total 118 100.0
Source: Primary data
Overall, males and females were in the ratio 44.9:55.1 respectively in the sample. This
implied that the females had a relatively high percentage among respondents.
4.3 Factor Analysis
Factor analysis was used to extract the factors that measured Consumer Attitudes, and
Consumption of insurance using component analysis and Varimax Keiser Normalization
methods. Factors with Eigen values (total variance) greater than 1 was extracted and
coefficients of less than ± 0.5 were deleted from the matrix tables as they were of less
importance.
42
4.3.1 Objective One: An examination of the structure of Consumer attitudes towards
insurance in Kampala Uganda
Factor analysis was performed to understand the underlying patterns of the attitudes of
consumers relative to Purchase of insurance products. This process helped to identify the
underlying factors leading to attitude formation. The evidence in table 9 shows that when
the Principal Component (PC) factors and Varimax rotation were conducted, three
underlying factors were identified
43
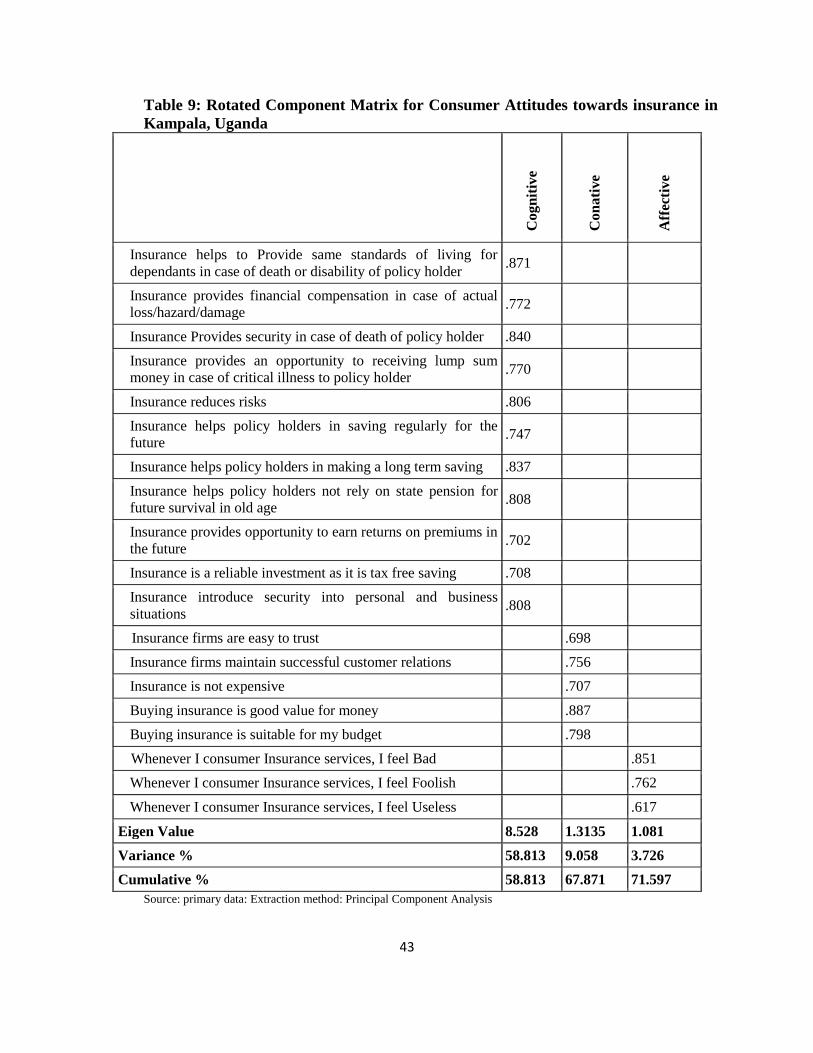
Table 9: Rotated Component Matrix for Consumer Attitudes towards insurance in
Kampala, Uganda
Co
gn
itiv
e
Co
na
tive
Aff
ecti
ve
Insurance helps to Provide same standards of living for
dependants in case of death or disability of policy holder .871
Insurance provides financial compensation in case of actual
loss/hazard/damage .772
Insurance Provides security in case of death of policy holder .840
Insurance provides an opportunity to receiving lump sum
money in case of critical illness to policy holder .770
Insurance reduces risks .806
Insurance helps policy holders in saving regularly for the
future .747
Insurance helps policy holders in making a long term saving .837
Insurance helps policy holders not rely on state pension for
future survival in old age .808
Insurance provides opportunity to earn returns on premiums in
the future .702
Insurance is a reliable investment as it is tax free saving .708
Insurance introduce security into personal and business
situations .808
Insurance firms are easy to trust .698
Insurance firms maintain successful customer relations .756
Insurance is not expensive .707
Buying insurance is good value for money .887
Buying insurance is suitable for my budget .798
Whenever I consumer Insurance services, I feel Bad .851
Whenever I consumer Insurance services, I feel Foolish .762
Whenever I consumer Insurance services, I feel Useless .617
Eigen Value 8.528 1.3135 1.081
Variance % 58.813 9.058 3.726
Cumulative % 58.813 67.871 71.597
Source: primary data: Extraction method: Principal Component Analysis
44
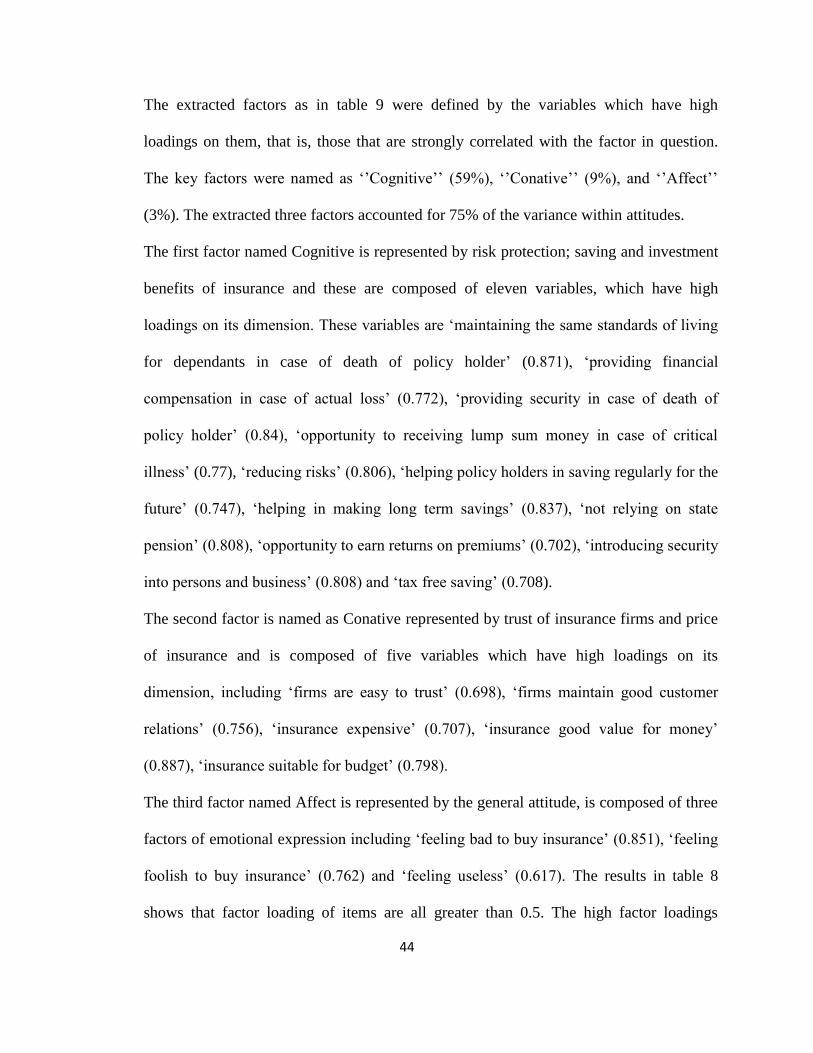
The extracted factors as in table 9 were defined by the variables which have high
loadings on them, that is, those that are strongly correlated with the factor in question.
The key factors were named as „‟Cognitive‟‟ (59%), „‟Conative‟‟ (9%), and „‟Affect‟‟
(3%). The extracted three factors accounted for 75% of the variance within attitudes.
The first factor named Cognitive is represented by risk protection; saving and investment
benefits of insurance and these are composed of eleven variables, which have high
loadings on its dimension. These variables are „maintaining the same standards of living
for dependants in case of death of policy holder‟ (0.871), „providing financial
compensation in case of actual loss‟ (0.772), „providing security in case of death of
policy holder‟ (0.84), „opportunity to receiving lump sum money in case of critical
illness‟ (0.77), „reducing risks‟ (0.806), „helping policy holders in saving regularly for the
future‟ (0.747), „helping in making long term savings‟ (0.837), „not relying on state
pension‟ (0.808), „opportunity to earn returns on premiums‟ (0.702), „introducing security
into persons and business‟ (0.808) and „tax free saving‟ (0.708).
The second factor is named as Conative represented by trust of insurance firms and price
of insurance and is composed of five variables which have high loadings on its
dimension, including „firms are easy to trust‟ (0.698), „firms maintain good customer
relations‟ (0.756), „insurance expensive‟ (0.707), „insurance good value for money‟
(0.887), „insurance suitable for budget‟ (0.798).
The third factor named Affect is represented by the general attitude, is composed of three
factors of emotional expression including „feeling bad to buy insurance‟ (0.851), „feeling
foolish to buy insurance‟ (0.762) and „feeling useless‟ (0.617). The results in table 8
shows that factor loading of items are all greater than 0.5. The high factor loadings
45
indicate that the three factors have successfully explained the variance in direct attitude.
These eleven items are important in explaining the factors of Cognitive, Conative and
affect consumer attitudes. In general the mentioned eleven variables are the underlying
factors in the formation of attitudes towards insurance in Kampala, Uganda.
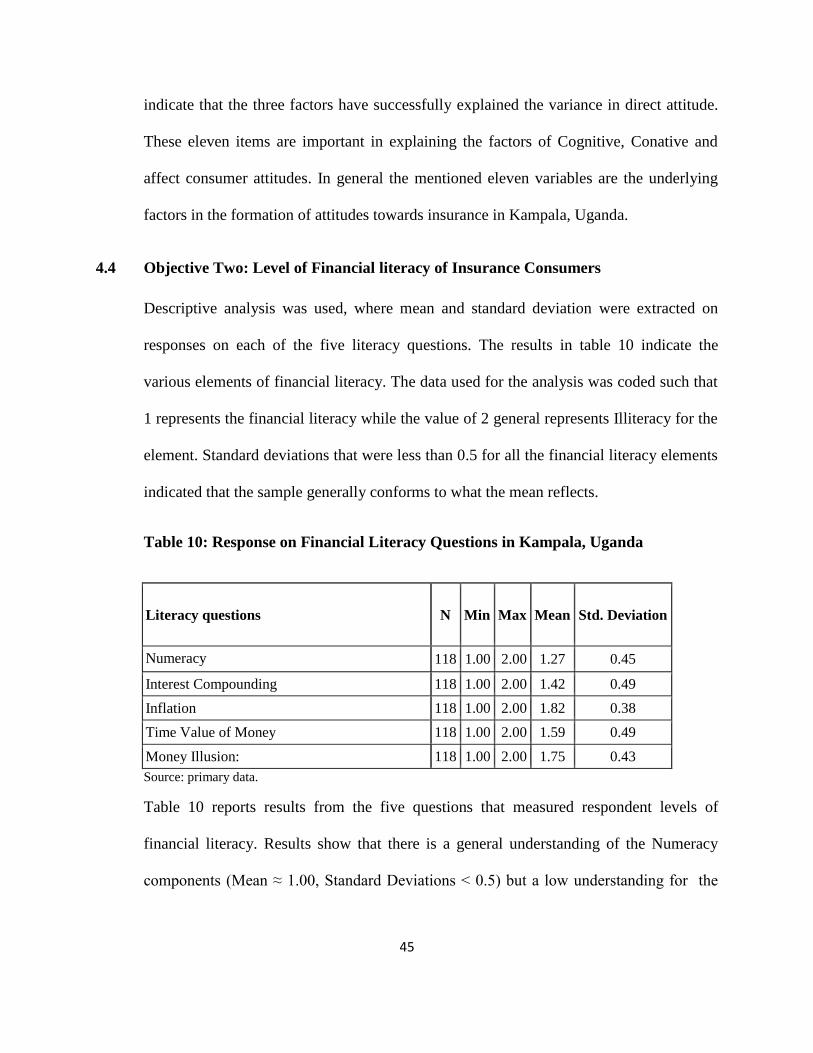
4.4 Objective Two: Level of Financial literacy of Insurance Consumers
Descriptive analysis was used, where mean and standard deviation were extracted on
responses on each of the five literacy questions. The results in table 10 indicate the
various elements of financial literacy. The data used for the analysis was coded such that
1 represents the financial literacy while the value of 2 general represents Illiteracy for the
element. Standard deviations that were less than 0.5 for all the financial literacy elements
indicated that the sample generally conforms to what the mean reflects.
Table 10: Response on Financial Literacy Questions in Kampala, Uganda
Literacy questions N Min Max Mean Std. Deviation
Numeracy 118 1.00 2.00 1.27 0.45
Interest Compounding 118 1.00 2.00 1.42 0.49
Inflation 118 1.00 2.00 1.82 0.38
Time Value of Money 118 1.00 2.00 1.59 0.49
Money Illusion: 118 1.00 2.00 1.75 0.43
Source: primary data.
Table 10 reports results from the five questions that measured respondent levels of
financial literacy. Results show that there is a general understanding of the Numeracy
components (Mean ≈ 1.00, Standard Deviations < 0.5) but a low understanding for the
46
elements of Interest compounding, Inflation, Time Value of Money and Money Illusion
(Mean ≈ 2.00, Standard Deviations < 0.5)
Most respondents were between the ages of 25 and 55. The sample composed mostly of
highly educated (over 80% had at least a higher education) and high-income (almost 95%
percent earn Shs.410, 000 or more).
Though the questions tasted educated people on basic but fundamental financial
knowledge, the large percentage failed the questions, indicating highly low levels of basic
financial literacy among consumers. This implies that consumers have difficulty in
understanding and interpreting insurance policies especially life insurance which has
saving and investment components and thus affecting purchase.
4.5 Objective Three: To establish the degree of insurance consumption in Kampala,
Uganda
The study sought to establish the degree of insurance consumption in Kampala, Uganda.
Insurance consumption can be measured in terms of Insurance penetration, insurance
density and insurance in force to GDP. The constructs of the three measures of insurance
consumption were extracted from the seven items as shown in the rotated matrix table 11
below. Factor analysis was performed to group the consumers and predict the
consumption of insurance. This process helped to identify the underlying factors
measuring consumption. The evidence in table 11 shows that when the Principal
Component (PC) factors and Varimax rotation were conducted, three underlying factors
were identified.
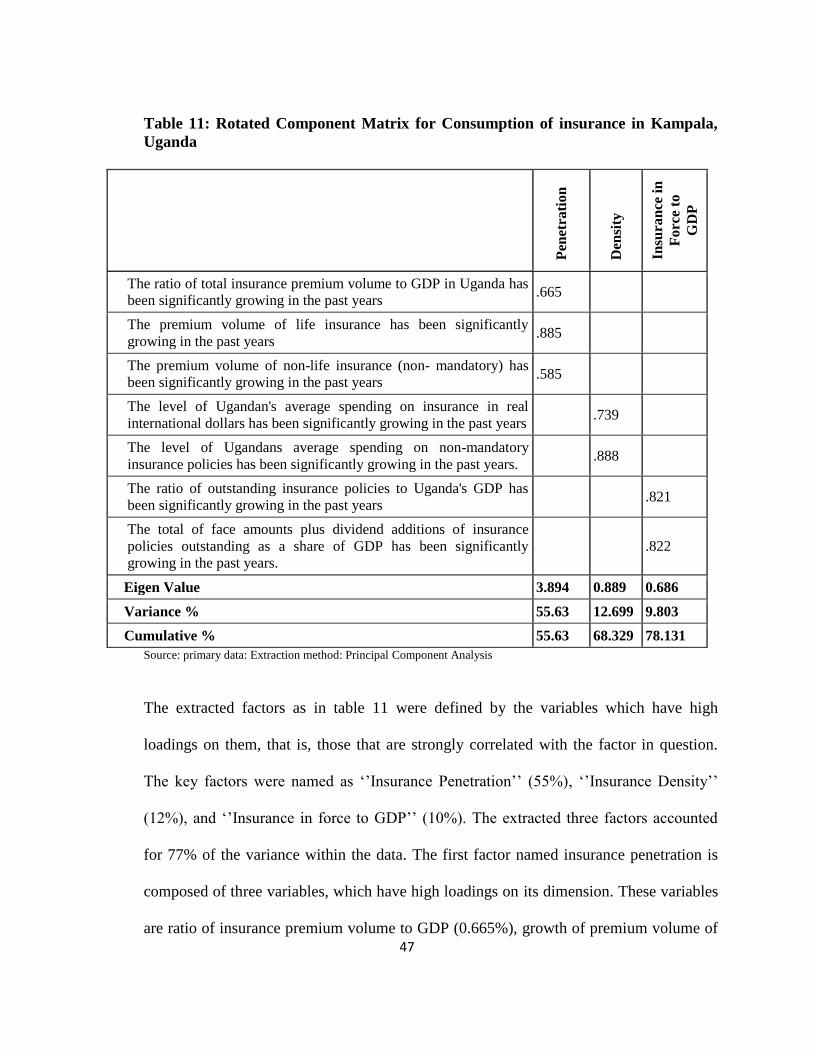
47
Table 11: Rotated Component Matrix for Consumption of insurance in Kampala,
Uganda
Pen
etra
tio
n
Den
sity
Insu
ran
ce i
n
Fo
rce
to
GD
P
The ratio of total insurance premium volume to GDP in Uganda has
been significantly growing in the past years .665
The premium volume of life insurance has been significantly
growing in the past years .885
The premium volume of non-life insurance (non- mandatory) has
been significantly growing in the past years .585
The level of Ugandan's average spending on insurance in real
international dollars has been significantly growing in the past years .739
The level of Ugandans average spending on non-mandatory
insurance policies has been significantly growing in the past years. .888
The ratio of outstanding insurance policies to Uganda's GDP has
been significantly growing in the past years .821
The total of face amounts plus dividend additions of insurance
policies outstanding as a share of GDP has been significantly
growing in the past years.
.822
Eigen Value 3.894 0.889 0.686
Variance % 55.63 12.699 9.803
Cumulative % 55.63 68.329 78.131
Source: primary data: Extraction method: Principal Component Analysis
The extracted factors as in table 11 were defined by the variables which have high
loadings on them, that is, those that are strongly correlated with the factor in question.
The key factors were named as „‟Insurance Penetration‟‟ (55%), „‟Insurance Density‟‟
(12%), and „‟Insurance in force to GDP‟‟ (10%). The extracted three factors accounted
for 77% of the variance within the data. The first factor named insurance penetration is
composed of three variables, which have high loadings on its dimension. These variables
are ratio of insurance premium volume to GDP (0.665%), growth of premium volume of
48
life insurance (0.885) and growth of premium volume of non-mandatory non-life policies
(0.585). The second factor is Insurance Density, composed of two variables growth of
level of average spending on insurance in dollars (0.739) and growth of spending on non
mandatory policies in (0.884). The third factor named Insurance in force to GDP is
composed of two variables including ratio of outstanding policies to GDP (0.821) and
face amounts plus dividend additions of insurance policies outstanding as a share of GDP
(0.822). The results in table 11 shows that factor loading of items are all greater than 0.5.
The high factor loadings indicate that the tree factors have successfully explained the
variance in consumption of insurance. In general the variables are the underlying factors
in the measurement of the degree of insurance consumption in Kampala, Uganda.
4.6 Objective Four, Five, Six and Seven: Relationships between attitudes, intention to
consume, Financial Literacy and Insurance Consumption.
Objective four was to determine the relationships between attitudes, intention to
consume, Financial Literacy and Insurance Consumption. The degree of relationship was
determined by Pearson (r) correlation coefficient and the predictability of consumption
was determined through regression analysis.
4.6.1 Pearson (r) Correlation Coefficient
Pearson correlation coefficient was used to determine the degree of relationship between
Attitudes, purchase intention, Financial Literacy and Insurance Consumption. The
relationship was established by running independent variables against the dependent
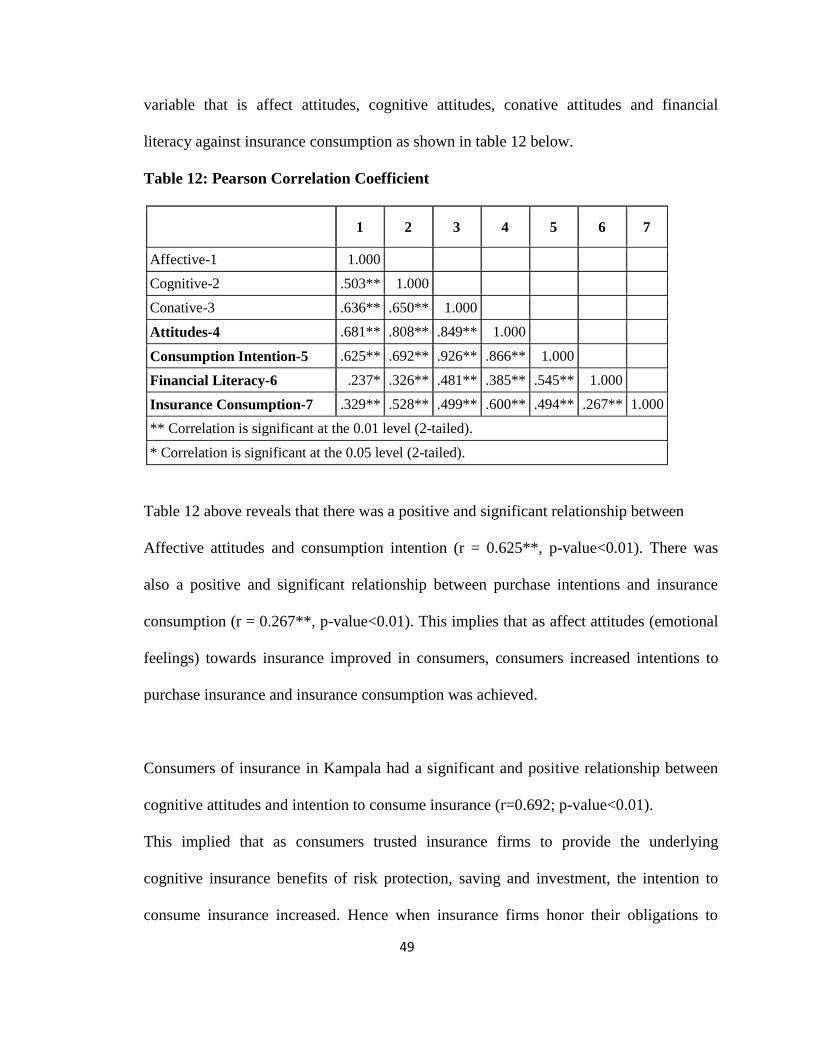
49
variable that is affect attitudes, cognitive attitudes, conative attitudes and financial
literacy against insurance consumption as shown in table 12 below.
Table 12: Pearson Correlation Coefficient
1 2 3 4 5 6 7
Affective-1 1.000
Cognitive-2 .503** 1.000
Conative-3 .636** .650** 1.000
Attitudes-4 .681** .808** .849** 1.000
Consumption Intention-5 .625** .692** .926** .866** 1.000
Financial Literacy-6 .237* .326** .481** .385** .545** 1.000
Insurance Consumption-7 .329** .528** .499** .600** .494** .267** 1.000
** Correlation is significant at the 0.01 level (2-tailed).
* Correlation is significant at the 0.05 level (2-tailed).
Table 12 above reveals that there was a positive and significant relationship between
Affective attitudes and consumption intention (r = 0.625**, p-value<0.01). There was
also a positive and significant relationship between purchase intentions and insurance
consumption (r = 0.267**, p-value<0.01). This implies that as affect attitudes (emotional
feelings) towards insurance improved in consumers, consumers increased intentions to
purchase insurance and insurance consumption was achieved.
Consumers of insurance in Kampala had a significant and positive relationship between
cognitive attitudes and intention to consume insurance (r=0.692; p-value<0.01).
This implied that as consumers trusted insurance firms to provide the underlying
cognitive insurance benefits of risk protection, saving and investment, the intention to
consume insurance increased. Hence when insurance firms honor their obligations to
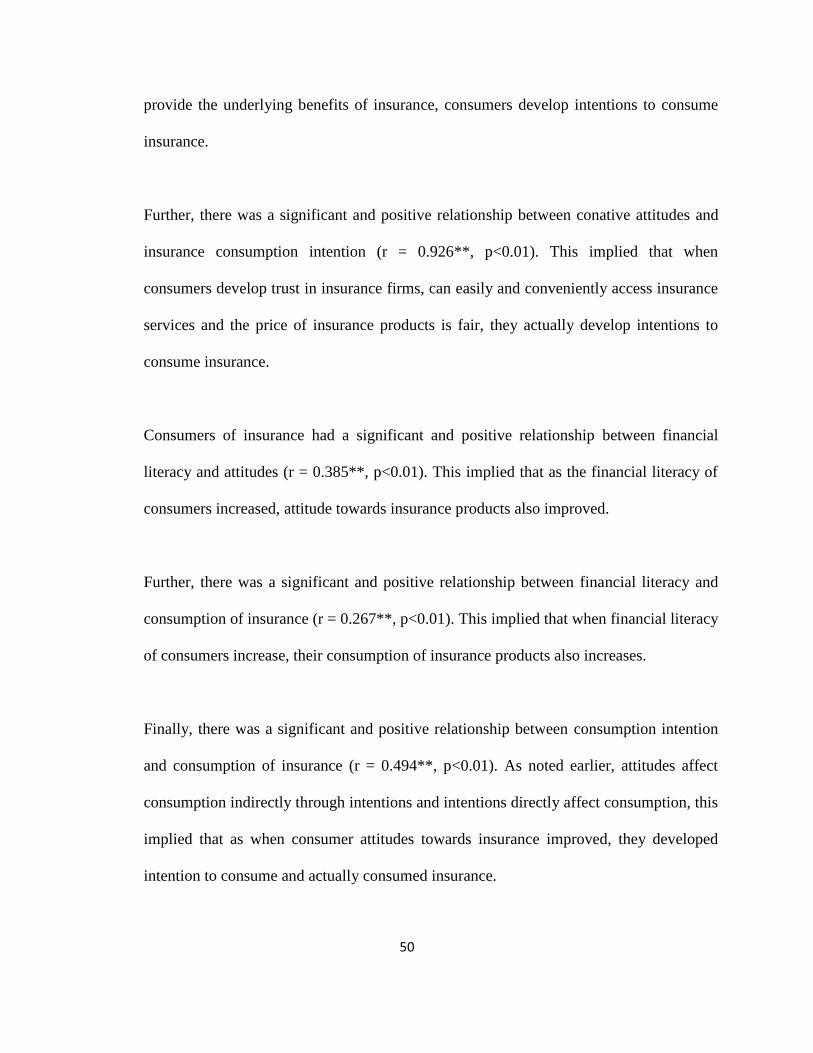
50
provide the underlying benefits of insurance, consumers develop intentions to consume
insurance.
Further, there was a significant and positive relationship between conative attitudes and
insurance consumption intention (r = 0.926**, p<0.01). This implied that when
consumers develop trust in insurance firms, can easily and conveniently access insurance
services and the price of insurance products is fair, they actually develop intentions to
consume insurance.
Consumers of insurance had a significant and positive relationship between financial
literacy and attitudes (r = 0.385**, p<0.01). This implied that as the financial literacy of
consumers increased, attitude towards insurance products also improved.
Further, there was a significant and positive relationship between financial literacy and
consumption of insurance (r = 0.267**, p<0.01). This implied that when financial literacy
of consumers increase, their consumption of insurance products also increases.
Finally, there was a significant and positive relationship between consumption intention
and consumption of insurance (r = 0.494**, p<0.01). As noted earlier, attitudes affect
consumption indirectly through intentions and intentions directly affect consumption, this
implied that as when consumer attitudes towards insurance improved, they developed
intention to consume and actually consumed insurance.
51
Therefore, basing on the different constructs that measured attitudes, financial literacy,
and consumption, all results reveal that the relationship between attitudes, financial
literacy and consumption is significant and positive. This implied that consumers with a
positive attitude towards insurance and financial literacy increase insurance penetration,
insurance density and insurance in force to GDP. Thus attitude and financial literacy have
great influence on consumption of insurance though also other factors exist.
4.6.2 Regression Analysis
Regression analysis revealed the extent to which Attitudes, Financial Literacy and
Intention predicted the consumption of insurance as shown by table 12 below.
Table 12: Regression Model
Magnitude Of the
Regression Coefficients
Unstandardized
Coefficients
Standardized
Coefficients t Sig.
Model B Std. Error Beta
(Constant) .220 .621 .355 .724
Attitudes .768 .173 .694 4.439 .000
Consumption Intention .102 .109 .160 .931 .354
Financial Literacy .223 .212 .098 1.053 .295
Dependent Variable: Insurance Consumption
R Square 0.359
Adjusted R Square 0.342
F Statistic 20.540
Sig. .000
Results in the regression table 12 above indicate a linear relationship between Consumer
Attitudes, Financial literacy, intentions and consumption of insurance.
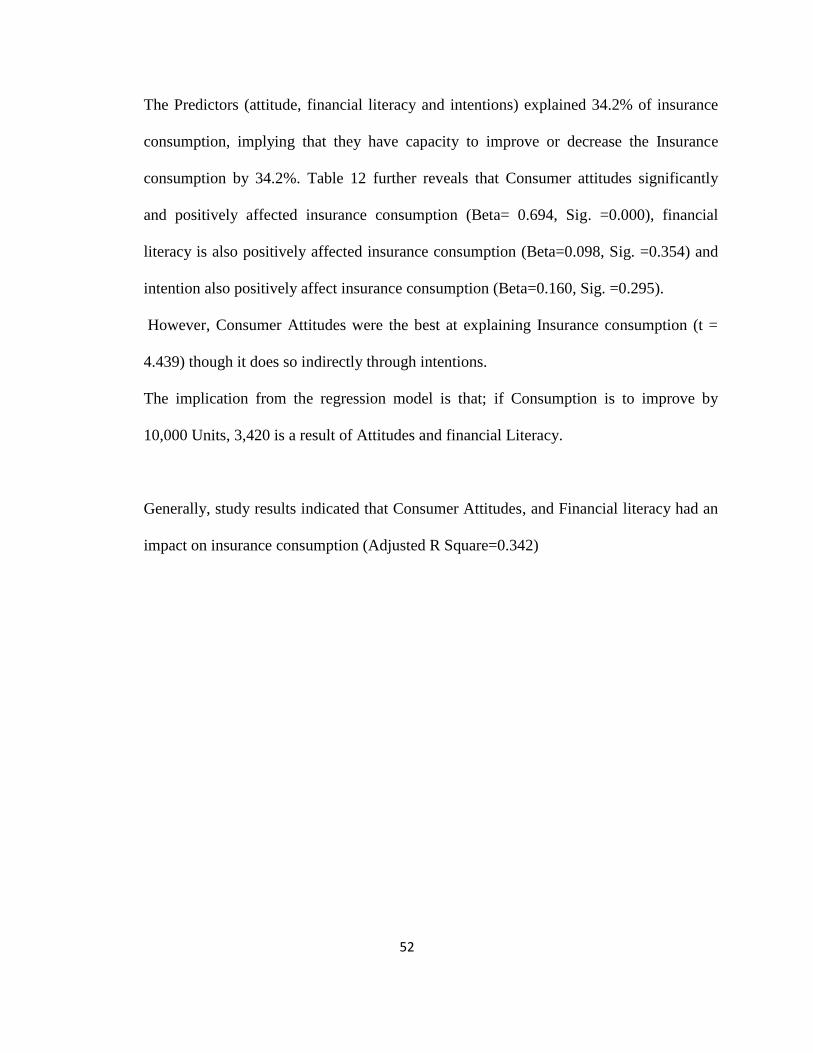
52
The Predictors (attitude, financial literacy and intentions) explained 34.2% of insurance
consumption, implying that they have capacity to improve or decrease the Insurance
consumption by 34.2%. Table 12 further reveals that Consumer attitudes significantly
and positively affected insurance consumption (Beta= 0.694, Sig. =0.000), financial
literacy is also positively affected insurance consumption (Beta=0.098, Sig. =0.354) and
intention also positively affect insurance consumption (Beta=0.160, Sig. =0.295).
However, Consumer Attitudes were the best at explaining Insurance consumption (t =
4.439) though it does so indirectly through intentions.
The implication from the regression model is that; if Consumption is to improve by
10,000 Units, 3,420 is a result of Attitudes and financial Literacy.
Generally, study results indicated that Consumer Attitudes, and Financial literacy had an
impact on insurance consumption (Adjusted R Square=0.342)
53
CHAPTER FIVE
DISCUSSION, CONCLUSION AND RECOMMENDATIONS
5.1 Introduction
This chapter presents the discussion, conclusion and recommendations arising out of the
research findings in chapter 4 and suggest areas for further study. The study has
generated findings several of which are in line with existing literature and previous
research findings.
5.2 Discussion of Study Findings
The findings are discussed according to research objectives.
5.2.1 To examine the structure of consumer attitudes towards insurance in Kampala,
Uganda.
Basing on the different constructs that explained Consumer Attitudes namely Conative,
Cognitive and Affect, the results confirm that risk protection, saving, investment, trust,
convenience and price were the underlying factors leading to cognitive conative and
affect attitude formation. The findings support the TPB and TRA model, in which
consumption is impacted by attitudes through intention (Ajzen, 1991). Intention is a
mediator between attitude and behavior.
Results from this research show that lack of trust and confidence in the insurance
companies to manage consumers‟ risks, meeting consumers‟ saving and investment
expectations and financial illiteracy are the foremost reasons for not buying insurance
policies in Uganda. Relatively, less influential reasons for not buying insurance is the
54
price and accessibility of insurance products. Thus, people who are financially literate
and have an attitude that is more fearful of loss/hazard/ accidents and premature death are
more likely to buy insurance. Almost 63 percent of the respondents do not have any
protection against the financial loss that can result from accident or disaster, death,
disability or critical illness. The relative frequencies of alternative ways of dealing with
risk revealed that the reliance on help from family and/or other relatives and money
lenders is higher than the self-retaining method of saving and investing in insurance.
1.2.2 To examine the level of consumers’ financial literacy.
Results on financial literacy show very low levels of literacy. Findings showed that
consumers most weakness was on knowledge of numeracy interest rate compounding and
time value of money.
The large majority did not know or answer correctly the question about numeracy.
Moreover, the large majority did not have a good grasp of the power of interest
compounding. Of those who got the interest question wrong, most of them undertook a
simple interest calculation, thereby ignoring the interest accruing on both principal and
interest. These are not comforting findings, especially considering that these respondents
have to deal with insurance policies especially life insurance products which have interest
rate, numeric, time value of money and inflation computations.
55
1.2.3 To establish the degree of insurance consumption in Kampala, Uganda.
Results on insurance consumption identified insurance penetration, insurance density and
insurance in force to GDP as the underlying factors measuring insurance consumption.
Results showed a very low consumption level of insurance, due to the low insurance
penetration, insurance density and insurance in force to GDP. These results are supported
by Lewis (1989), assertion that consumption measures that assess units of insurance
consumption in real dollars (purchasing power parity), premium volume to GDP and the
premium volume in international dollars to the population size, are essential to monitor
overall insurance consumption. Yaari (1965) and Hakansson (1969) confirm that if the
insurance penetration and insurance density margins are low, it is an indication that the
overall consumption of insurance is low.
5.2.4 To determine the relationship between consumer attitudes, financial literacy,
consumption intention and consumption of insurance.
The general findings show a positive relationship between attitudes, financial literacy,
consumption intention and consumption of insurance. All the different constructs of
attitudes namely affect, conative and cognitive, and the construct of financial literacy
positively correlated to insurance consumption intention and consumption of insurance.
The study confirmed that attitude was the strongest predictor of consumption through
consumption intention the correlation of attitude and intention and intention and
consumption was significant high.
56
Specifically, the correlation test established significant positive relationships between
attitudes and intention and intention with insurance consumption. This is supported by
(Fazio, 1990) that, attitudes guide consumption through two ways: either as deliberate
(e.g. controlled) or as spontaneous (e.g. automatic) fashion through intentions.
Where the individual is highly motivated and capable of thinking in a controlled fashion,
behavior is held to be thoughtfully planned, based on one‟s attitude toward the behavior
(deliberative process). In this mechanism, the influence of attitude on behavior is
mediated by the plan (intention) as described by TPB. However, where motivation or
opportunity for controlled process is absent, attitudes are held to impact on the behavior
in an automatic way (spontaneous process). In the spontaneous process, attitudes toward
an object/target are assumed to be strong (highly accessible), and may automatically be
activated from the memory to guide consumption directly (Ajzen & Fishbein, 2005;
Conner & Armitage, 1998). The customers‟ behavior of buying insurance may
correspond with their prior intention or they may have not prior intention. For both cases,
the evaluation of insurance as a good product plays a significant role in determining
consumption.
Findings further show that financial literacy had a positive influence on consumption
though not significant. This is in line with Annamaria Lusardi (2008), who found out that
financial literacy was essential for consumer choice of financial services. Her findings
revealed that consumers who possessed capacity to perform numeracy, interest
compounding, time value of money, inflation and money illusion were in better position
57
to understand and appreciate the value of financial products on the market especially
retirement schemes, insurance and stock market products.
Generally, the Pearson correlation test established a significant positive relationship
between attitudes, financial literacy, consumption intention and consumption of
insurance. The relationship is further confirmed in the regression model with attitude,
financial literacy and intention established as a significant predictor of consumption of
insurance. This is supported by Azjen & Fishbein (1980) that attitude influence behavior
(consumption) through intentions. The results are also further supported by the extended
TPB (Azjen & Fishbein, 1991), which concludes that external factors (Financial Literacy)
if found to have impact on behavior also influence behavior (consumption).
5.3 Conclusion
Attitudes and financial literacy have complicated the insurance business.
Given that attitude and financial literacy are strongly linked to consumption, marketers of
insurance services targeting Ugandans are confronted with the challenge of encouraging
people to embrace insurance institution and its associated benefits. Based on the findings,
this paper confirms negative attitudes of Ugandans towards insurance products and low
financial literacy.
Relatively, less influential reasons for not buying insurance is lack of knowledge about
insurance products. Thus, people who are financially literate are more fearful of risks
arising from accidents and premature death and are more likely to buy insurance. Almost
65 percent of the respondents do not have any protection against the financial loss that
58
can result from accidents, death, disability or critical illness. The relative frequencies of
alternative ways of dealing with risk revealed that the reliance on help from family and/or
other relatives is higher than the self-retaining method of saving money with insurance
firms. At least 65 percent of respondents will rely on relatives to meet their financial
requirements.
As shown again throughout this paper, findings revealed high levels of financial
illiteracy. The existence of financial illiteracy should not be taken for granted for insurers
as it affects consumption of insurance products. Financial illiteracy is widespread and
particularly acute among specific groups, including those with higher education, women,
and minorities. Given the increased complexity of day-to-day financial transactions, the
evidence of illiteracy raises important questions especially the ability to understand
insurance policies.
Therefore, the nature of insurance business and low levels of consumption requires firms
to improve on their marketing strategies to counter the problem of poor attitude and
financial illiteracy.
5.4 Recommendations
Basing on the study findings, the following recommendations are suggested:
The findings serve as inputs to marketers of insurance services on how they formulate
and implement relevant marketing strategies towards addressing the nonchalant attitude
of Ugandans to insurance.
59
1. Specific marketing strategies are required to encourage the young generation below
45 year of age, the divorced/separated, and the less-educated to embrace and
appreciate the role of insurance. Since, the basic issue associated with this lack of
interest rests mainly in their lack of appreciation of the roles of benefits of insurance
services; it is recommended that significant marketing communication activities be
targeted more at this set of people highlighted. This will help to kindle their interest in
the business and brings the insurance institution to the highly exalted position it
belongs in their perception.
Insurance services providers will, therefore, have to introduce proactive strategies that
are primarily aimed at educating consumers and encouraging greater usage of
insurance.
2. Overall, the peculiar feature of most financial transactions in the developing world
has been weak contract certainty which in turn, erodes the trust of the insuring public.
This is where the regulatory authority wades in to strengthen regulation and
supervision that would further boost the public confidence and trust in the insurance
industry. In the case of Uganda specifically, the present government„s cardinal
program of strict adherence to the rule of law should be extended to the insurance
industry where impunity seems to be holding sway at the moment. It is when the
public realizes the availability of seeking redress in case of insurance disputes that
they can repose confidence and positive attitude to the industry. Nevertheless, the
efficacy of marketing-orientation rather than selling by insurers would go a long way
in addressing the attitudinal problem
60
3. Insurance regulatory authority in Uganda (UIC) should help its members by offering
basic financial literacy courses to the general public (customers of insurance
services).
Students of Financial literacy” do not necessarily have to attend classes at school, but
can learn from courses online (or from CDs or DVDs) from their homes. Courses can
be customized and tailored to various needs and levels of financial knowledge in
insurance business.
5.5 Areas for further research
The study concentrated on only consumer attitudes, financial literacy, intentions and
consumption of insurance; however a similar study can be carried out covering all
variables of the Theory of Planned Behavior (TPB) to include Subjective Norms (SN)
and Perceived Behavioral Control (PBC) because these factors also affect consumption
(behavior).
61
REFERENCES
Ajzen, I. (1991). The theory of planned behavior, Organizational Behavior and Human Decision
Processes. Vol. 50 No 2, pp. 179-211
Ajzen, I. and Fishbein, M.A. (1980). Attitudes and the Attitude–Behavior Reasoned and
Automatic Processes. Published in W.Stroebe and M. Hewstone (Eds.) European Review
of Social Psychology. John Wiley & Sons Black, K. and Skipper, H.D. (2000) Life and
Health Insurance, Upper Saddle River, NJ; Prentice-Hall
Aarts, H., Verplanken, B., & Knippenberg, A.V. (1998). Predicting behavior from actions in the
past repeated decision making or a matter of habit? Journal of Applied Social
Psychology 28(15): 1355-1374.
Acebron, L. B., Mangin, J.P.L, & Dopico, D.C. (2000). A proposal of the buying model for
fresh food products: the case of fresh mussels. Journal of International Food &
Agribusiness Marketing 11(3): 75.
Ajzen, I., & Fishbein, M. (2005). The influence of attitudes on behavior. In D.Albarracín,
B.T.Johnson, & M.P.Zanna (eds). The Handbook of Attitudes, pp.173-221. Lawrence
Erlbaum Associates.
Ajzen, I. (1987). Attitudes, traits, and actions-dispositional prediction of behavior in
personality and social-psychology. Advances In Experimental Social Psychology 20:1-63.
Ajzen, I. (1991). The theory of planned behavior. Organizational Behaviour and Human
Decision Processes, 50(2): 179.
Ajzen, I., & Driver, B.L. (1992). Application of the theory of planned behavior to leisure
choice. Journal of Leisure Research 24(3): 207.
Allport, G.M. (1935). Attitude. In Murchison, C. (ed.), Handbook of Social Psychology,
pp.798-844. Worchester, Clark University.Press.
Anderson, N.H.(1981). Foundations of information integration theory. New York:
Academic Press.
Anderson, J.C. (1988). Structural equation modeling in practice: a review and
recommended two-step approach. Psychological Bulletin 103(3): 411.
Anderson, J.L. (1995). Purchase behavior, food Safety, and quality control in seafood and.
aquaculturemarketing: discussion. American Journal of Agricultural Economics77(5):
1319-1321.
Armitage, C.J., & Conner, M. (2001). Efficacy of the theory of planned behaviour: a meta-
analytic review.The British Journal of Social Psychology 40(4): 471-99.
62
Armitage, C. J. (1999). Predictive validity of the theory of planned behaviour: the role of
questionnaire format and social desirability. Journal of Community & Applied
SocialPsychology 9(4): 261.
Annamaria Lusardi, Olivia S. Mitchell, and Vilsa Curto, (2009). Financial Literacy among the
Young. Evidence and Implications for Consumer Policy
Bagozzi, R.P.W.T. (1991). Assessing construct validity in organizational research
Administrative Science Quarterly 36(3): 421.
Brassington,Pettitt (2003). Assessing construct validity in organizational research.
Administrative Science Quarterly 36(3): 421.
Bobbitt, L.M. and Dabholkar, P.A. (2001) „Integrating attitudinal theories to understand and
predict use of technology-based self-service: the internet as an illustration‟, International
Journal of Service industry Management, 12 (5), pp. 423-450.
Browne, M.J. and Kim, K. (1993) „An international analysis of life insurance demand‟, Journal.
of.Risk and.Insurance, Vol. 60 No 4, pp. 616-634
Beck, T.; Demirguic-Kunt, A. and Levine, R. (2000): A New Database on Financial
Development and Structure, World Bank Economic Review, forthcoming.
Beenstock, M., Dickinson, G. and Khajuria, S. (1986), The Determination of Life Premiums:
an International Cross-Section Analysis 1970-1981, Insurance: Mathematics and
Economics 5, 261-70..
Bagozzi, R., Baumgartner, H., & Yi, Y. (1989). An investigation into the role of intentions as
mediators of the attitude–behavior relationship. Journal of Economic Psychology, 10,
35–62.
Bredahl, L. (2001). Determinants of consumer attitudes and purchase intentions with regard to
genetically. modified foods – Results of across-national survey. Journal of Consumer
Policy, 24, 23–61.
Beenstock, M., Dickinson, G. and Khajuria, S. (1986), the Determination of Life Premiums: an.
International Cross-Section Analysis 1970-1981, Insurance: Mathematics and
Economics 5, 261-70.
Browne, Mark J. and Kim, Kihong (1993): An International Analysis of Life Insurance Demand.
Journal of Risk and Insurance 60, 616-634.
Benjamin, Daniel J., Sebastian A. Brown, and Jesse M. Shapiro. (2006). Who Is “Behavioral”?
Cognitive. Ability and Anomalous Preferences.
63
Conner, M., & Armitage, C.J. (1998). Extending the theory of planned behavior: a review
and avenues for further research. Journal of Applied Social Psychology 28(15):
1429-1464.
Doug Widdowson and Kim Hailwood (2002). Financial literacy and its role in promoting a sound
Financial system
Eagly, A.H., & Chaiken, S. (1993). The psychology of attitudes, Fort Worth, TX:
Harcourt Brace Jovanovich.
Eagly, A. H., & Chaiken, S. (1993). The psychology of attitudes. Fort Worth, TX: Harcourt
Brace Jovanovich College Publishers. American Council of Life Insurance (various
years): Life Insurance Fact Book. Washington, D.C.
Fazio, R. H. (1995). Attitudes as object-evaluation associations: Determinants,
consequences, and correlates of attitude accessibility. In R. E. Petty & J. A.
Fishbein, M.A. (1967). „Attitude and the prediction of behavior‟, in M.A. Fishbein (Ed.);.
Readings in Attitude Theory and Measurement, New York: Wiley, pp. 477-492.
Fishbein, M.A. and Ajzen, I. (1975) Belief, Attitude, Intention, and Behaviour: An Introduction
Theory and Research, Reading, Massachusetts: Addison-Westley
Foxall (1990; 1999). Behavioral perspective models and classical attitude-behavior models. Vol
10 No2 , pp. 56-61
Foxall, G., Leek, S., & Maddock, S.. (1998). Cognitive antecedents of consumers'
willingness to purchase fish rich in polyunsaturated fatty acids (PUFA). Appetite
31(3): 391-402.
Foxall, G.R. (1990). Consumer psychology in behavioral perspective. London and New
York, Routledge.
Foxall, G.R. (1999). The behavioral perspective model. European Journal of Marketing
33(5/6): 570
Godin, G. and Kok, G. (1996) „the theory of planned behaviour: a review of its applications to
health related behaviors‟, American Journal of Health Promotion
Gofton (1995), Retailing insurance services in the European Union.European Journal of
Marketing 45(4/8): 671
Gruber (2008). Actuarial fairness in the Australian insurance market. vol.11
No.4, pp.21-42
Hakansson, N.H. (1969): Optimal Investment and Consumption Strategies Under Risk, and
Under Uncertain Lifetime and Insurance, International Economic Review 10, 443-66.
Jaccard, J., & Blanton, H. (2005). The origins and structure of behavior: conceptualizing
64
behavioral criteria in attitude research. In D.Albarracín, B.T.Johnson, &
M.P.Zanna (eds). The Handbook of Attitudes, pp.125-172. Lawrence Erlbaum
Associates.
Javalgi, R. G. and D. S. White (2002). Strategic Challenges for the Marketing of Services
Internationally, International Marketing Review, 19(6), 563-581.
Joseph, M., Stone, G. and Anderson, K. (2003), Insurance Customers„Assessment of Service
Quality: A critical Evaluation, Journal of Small Business and Enterprise Development,
vol.10, No.1, pp.81-92
Kotler, P. (2003), ‗marketing management, 11th ed. Upper Saddle river New Jersey Pearson
Education Inc.,pp132-133
Kim, Doocheol (1988), The Determinants of Life Insurance Growth in Developing Countries,
With Particular Reference to the Republic of Korea. Atlanta: Georgia State University
Dissertations.
Lewis, Frank, D. (1989): Dependents and the Demand for Life Insurance, American
Economic Review 79, 452-466.
Lusardi, Mitchell, (2006, 2008). Financial Literacy and consumer choice in the US.
Mei-Fang Chen (2007). Consumer attitudes and purchase intentions in relation to organic foods in
Taiwan:
Moderating effects of food-related personality traits Department of Business
Management, Tatung University, No. 40, Chung-Shan North Road, Section 3, Taipei,
Taiwan
Maarten van Rooij, De Nederlandsche Bank and Netspar (2007). Financial Literacy and Stock
Market Participation
Nguen tien Thom (2007), Masters Thesis in international Fisheries Management University of
tromso.
Ogenyi Ejye Omar (2007). „The retailing of life Insurance in Nigeria‟: An assessment of
Consumers‟ attitude, Journal of Retail Marketing Management Research, vol. No. 1,
October 2007
Pritchett, S. T., J. T. Schmit, H. I. Doerpinghaus, and J. L. Athearn (1996). Risk Management
and Insurance. New York: West Publishing Company.
Ross Norman (1975), Cognitive attitude component and behavioral change
Sekaran (2000), Research Methods for business
65
Shawn cole, Nilesh Fernando (2008). Financial Literacy and financial services choice.
Journal of Applied Psychology, Vol. 12, No.3, pp.18 – 33.
Truett, D.B. and Truett, Lila J. (1990): The Demand for Life Insurance in Mexico and the.
United States: A Comparative Study the Journal of Risk and Insurance 57, 321-328
Tajudeen Olalekan Yusuf, Ayantunji Gbadamosi & Dallah Hamadu (2009). Attitudes of
Nigerians towards Insurance services. African Journal of Accounting, Economics,
Finance and Banking Research Vol. 4. No. 4. 2009
Thorsten Beck and Ian Webb (2002). Determinants of Insurance Consumption across Countries. .
Policy research paper 2792
Thorsten Beck and Ian Webb the World Bank Development Research Group February 2002
Determinants of Life Insurance Consumption across Countries
UIC, AIO (2009). Insurance market penetration in Africa, vol 15 No. 7 2009
Udry, C. (1994) Risk and Insurance in a Rural Credit Market: An Empirical Investigation in
Northern Nigeria. The Review of Economic Studies, Vol. 61, No. 3 pp. 495-526.
Yaari, Menahem E. (1965): Uncertain Lifetime, Life Insurance, and the Theory of the
Consumer, Review of Economic Studies 32, 137-150.
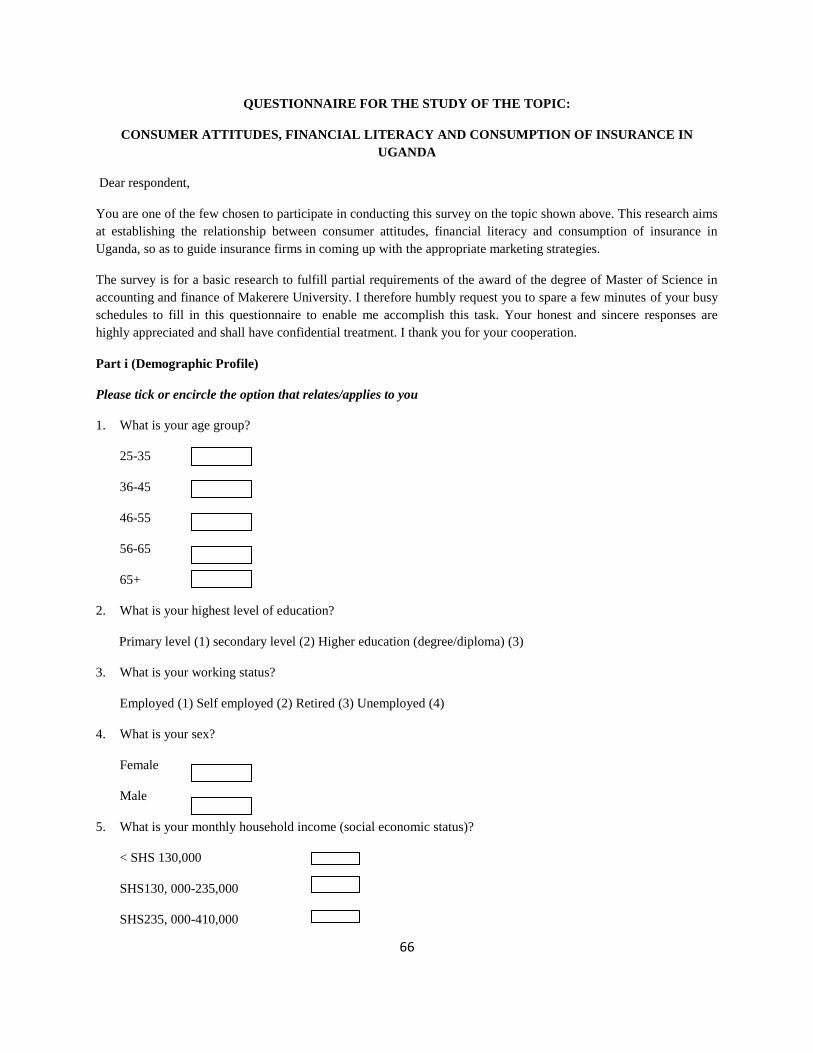
66
QUESTIONNAIRE FOR THE STUDY OF THE TOPIC:
CONSUMER ATTITUDES, FINANCIAL LITERACY AND CONSUMPTION OF INSURANCE IN
UGANDA
Dear respondent,
You are one of the few chosen to participate in conducting this survey on the topic shown above. This research aims
at establishing the relationship between consumer attitudes, financial literacy and consumption of insurance in
Uganda, so as to guide insurance firms in coming up with the appropriate marketing strategies.
The survey is for a basic research to fulfill partial requirements of the award of the degree of Master of Science in
accounting and finance of Makerere University. I therefore humbly request you to spare a few minutes of your busy
schedules to fill in this questionnaire to enable me accomplish this task. Your honest and sincere responses are
highly appreciated and shall have confidential treatment. I thank you for your cooperation.
Part i (Demographic Profile)
Please tick or encircle the option that relates/applies to you
1. What is your age group?
25-35
36-45
46-55
56-65
65+
2. What is your highest level of education?
Primary level (1) secondary level (2) Higher education (degree/diploma) (3)
3. What is your working status?
Employed (1) Self employed (2) Retired (3) Unemployed (4)
4. What is your sex?
Female
Male
5. What is your monthly household income (social economic status)?
< SHS 130,000
SHS130, 000-235,000
SHS235, 000-410,000
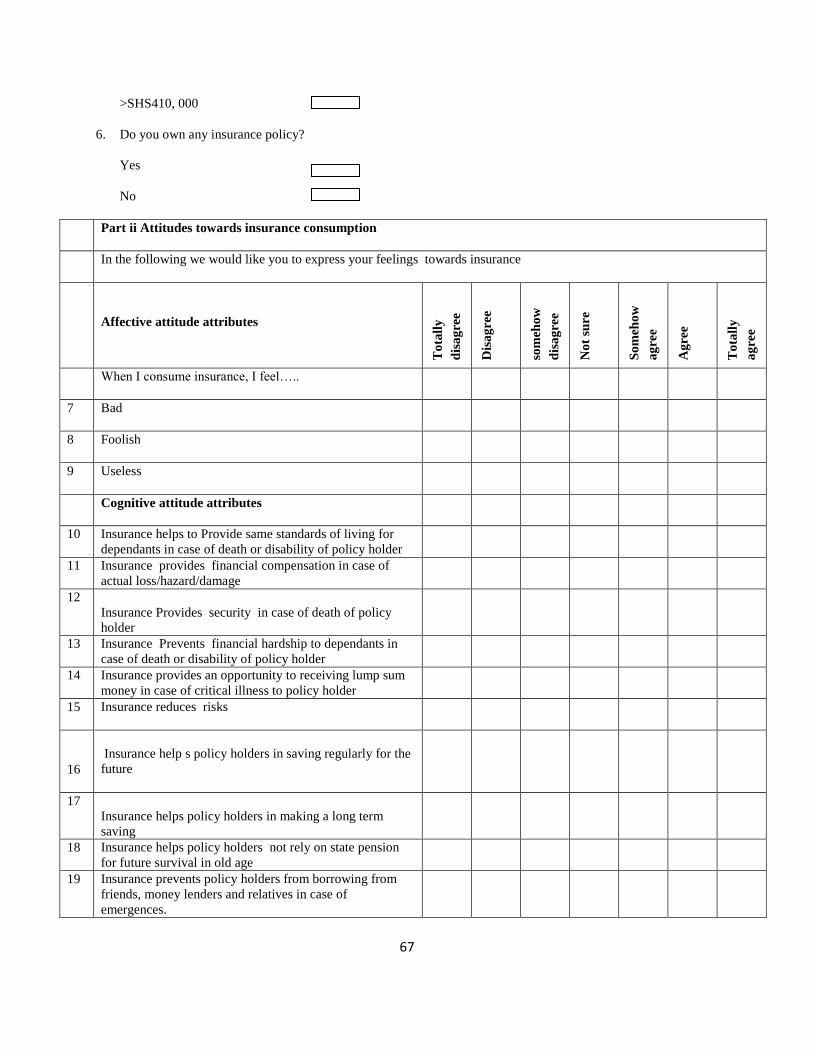
67
>SHS410, 000
6. Do you own any insurance policy?
Yes
No
Part ii Attitudes towards insurance consumption
In the following we would like you to express your feelings towards insurance
Affective attitude attributes
To
tall
y
dis
ag
ree
Dis
ag
ree
som
eho
w
dis
ag
ree
No
t su
re
So
meh
ow
ag
ree
Ag
ree
To
tall
y
ag
ree
When I consume insurance, I feel…..
7 Bad
8 Foolish
9 Useless
Cognitive attitude attributes
10 Insurance helps to Provide same standards of living for
dependants in case of death or disability of policy holder
11 Insurance provides financial compensation in case of
actual loss/hazard/damage
12
Insurance Provides security in case of death of policy
holder
13 Insurance Prevents financial hardship to dependants in
case of death or disability of policy holder
14 Insurance provides an opportunity to receiving lump sum
money in case of critical illness to policy holder
15 Insurance reduces risks
16
Insurance help s policy holders in saving regularly for the
future
17
Insurance helps policy holders in making a long term
saving
18 Insurance helps policy holders not rely on state pension
for future survival in old age
19 Insurance prevents policy holders from borrowing from
friends, money lenders and relatives in case of
emergences.
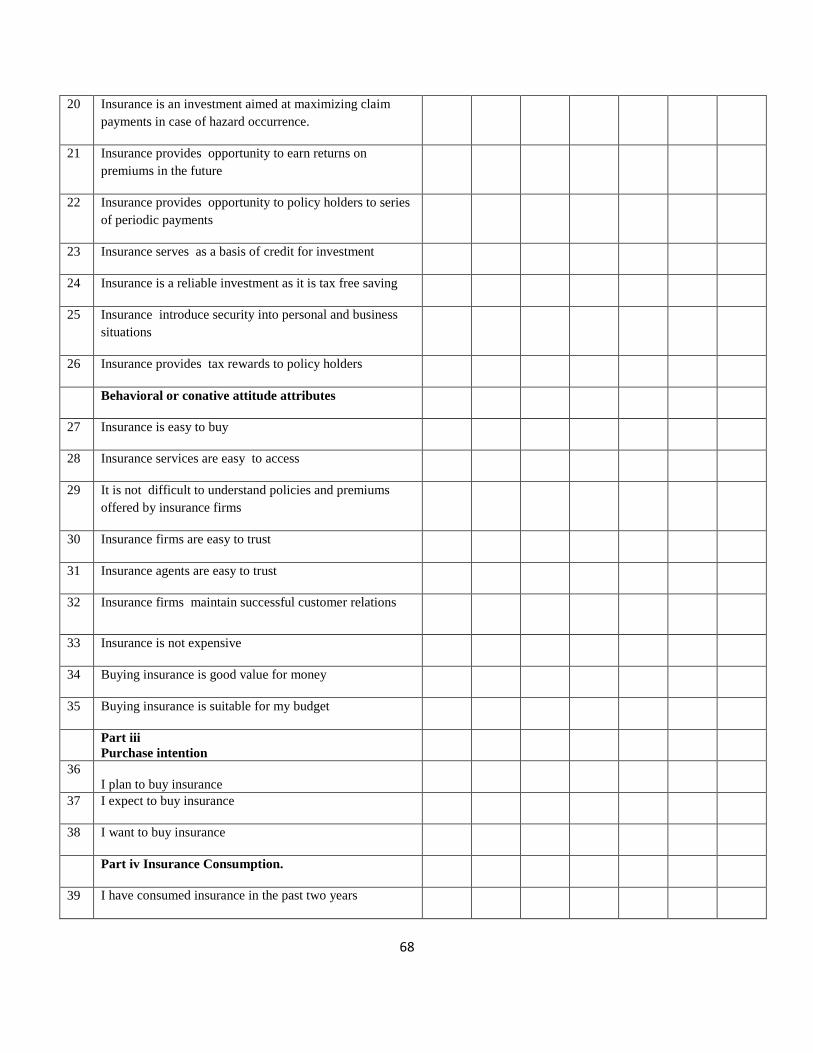
68
20 Insurance is an investment aimed at maximizing claim
payments in case of hazard occurrence.
21 Insurance provides opportunity to earn returns on
premiums in the future
22 Insurance provides opportunity to policy holders to series
of periodic payments
23 Insurance serves as a basis of credit for investment
24 Insurance is a reliable investment as it is tax free saving
25 Insurance introduce security into personal and business
situations
26 Insurance provides tax rewards to policy holders
Behavioral or conative attitude attributes
27 Insurance is easy to buy
28 Insurance services are easy to access
29 It is not difficult to understand policies and premiums
offered by insurance firms
30 Insurance firms are easy to trust
31 Insurance agents are easy to trust
32 Insurance firms maintain successful customer relations
33 Insurance is not expensive
34 Buying insurance is good value for money
35 Buying insurance is suitable for my budget
Part iii
Purchase intention
36
I plan to buy insurance
37 I expect to buy insurance
38 I want to buy insurance
Part iv Insurance Consumption.
39 I have consumed insurance in the past two years
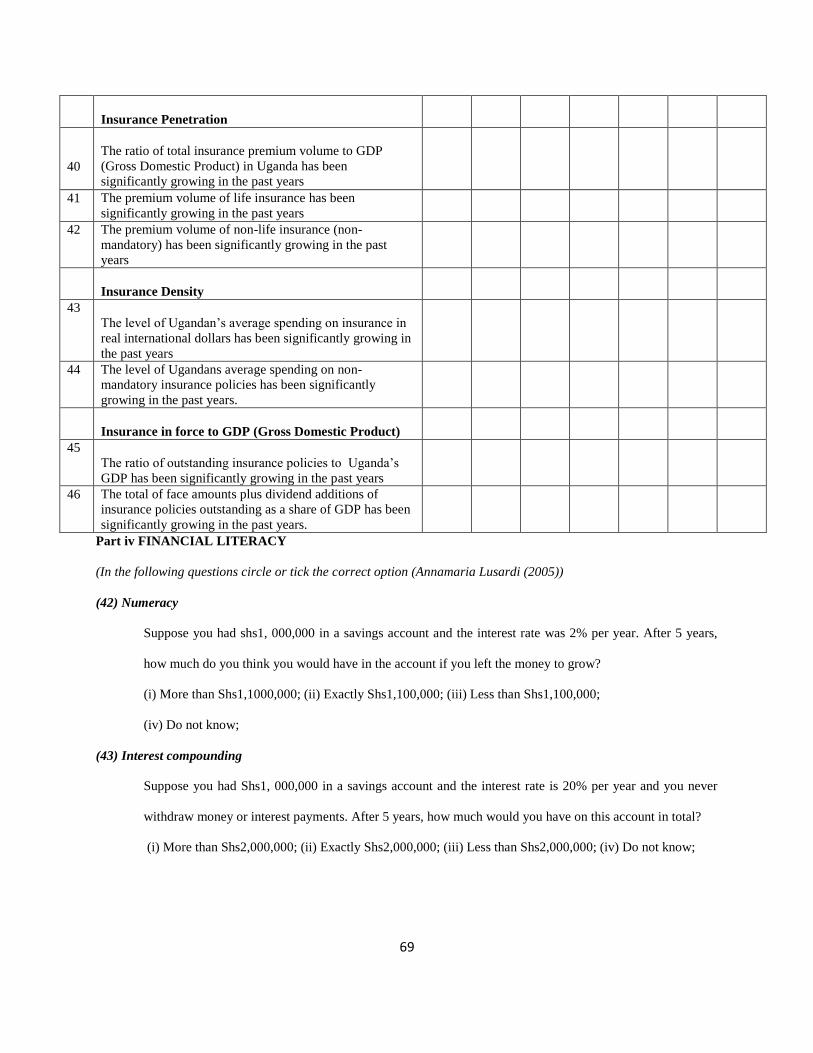
69
Insurance Penetration
40
The ratio of total insurance premium volume to GDP
(Gross Domestic Product) in Uganda has been
significantly growing in the past years
41 The premium volume of life insurance has been
significantly growing in the past years
42 The premium volume of non-life insurance (non-
mandatory) has been significantly growing in the past
years
Insurance Density
43
The level of Ugandan‟s average spending on insurance in
real international dollars has been significantly growing in
the past years
44 The level of Ugandans average spending on non-
mandatory insurance policies has been significantly
growing in the past years.
Insurance in force to GDP (Gross Domestic Product)
45
The ratio of outstanding insurance policies to Uganda‟s
GDP has been significantly growing in the past years
46 The total of face amounts plus dividend additions of
insurance policies outstanding as a share of GDP has been
significantly growing in the past years.
Part iv FINANCIAL LITERACY
(In the following questions circle or tick the correct option (Annamaria Lusardi (2005))
(42) Numeracy
Suppose you had shs1, 000,000 in a savings account and the interest rate was 2% per year. After 5 years,
how much do you think you would have in the account if you left the money to grow?
(i) More than Shs1,1000,000; (ii) Exactly Shs1,100,000; (iii) Less than Shs1,100,000;
(iv) Do not know;
(43) Interest compounding
Suppose you had Shs1, 000,000 in a savings account and the interest rate is 20% per year and you never
withdraw money or interest payments. After 5 years, how much would you have on this account in total?
(i) More than Shs2,000,000; (ii) Exactly Shs2,000,000; (iii) Less than Shs2,000,000; (iv) Do not know;
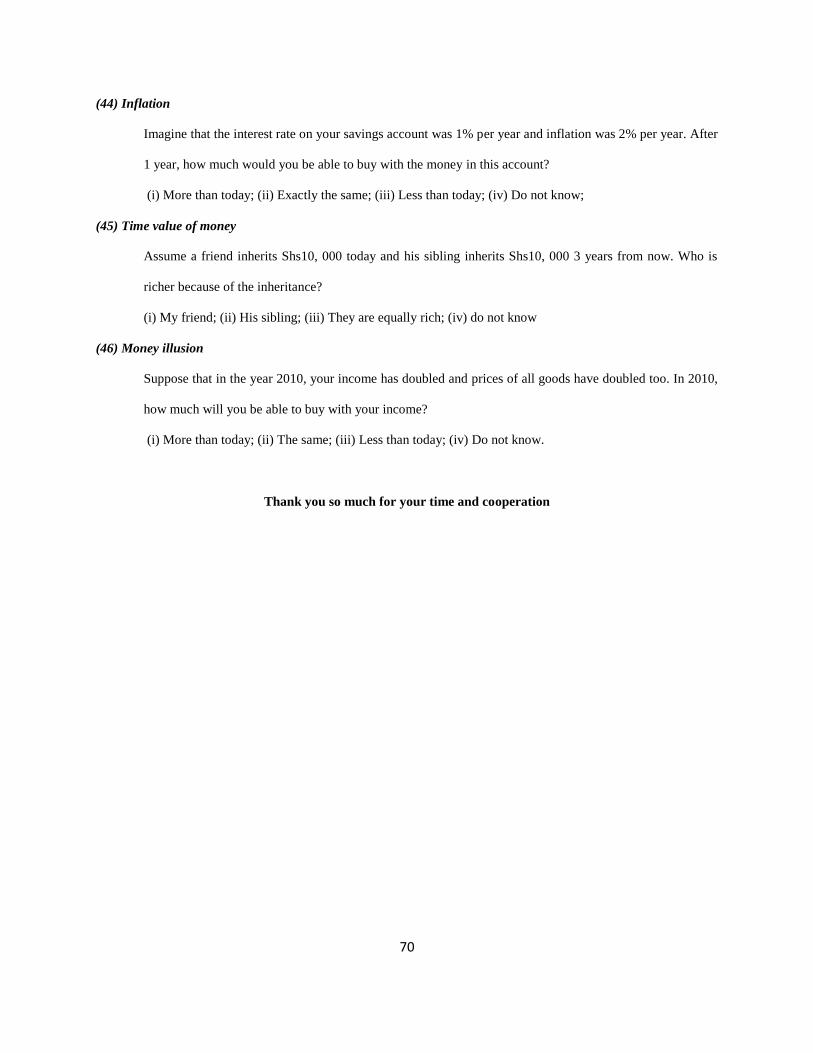
70
(44) Inflation
Imagine that the interest rate on your savings account was 1% per year and inflation was 2% per year. After
1 year, how much would you be able to buy with the money in this account?
(i) More than today; (ii) Exactly the same; (iii) Less than today; (iv) Do not know;
(45) Time value of money
Assume a friend inherits Shs10, 000 today and his sibling inherits Shs10, 000 3 years from now. Who is
richer because of the inheritance?
(i) My friend; (ii) His sibling; (iii) They are equally rich; (iv) do not know
(46) Money illusion
Suppose that in the year 2010, your income has doubled and prices of all goods have doubled too. In 2010,
how much will you be able to buy with your income?
(i) More than today; (ii) The same; (iii) Less than today; (iv) Do not know.
Thank you so much for your time and cooperation