Embed Size (px)
Citation preview
Prepared by: NRG Research Group
Suite 1380-1100 Melville Street Vancouver, BC V6E 4A6
Ministry of Environment and Climate Change Strategy
Consumer Awareness Survey of Extended Producer Responsibility (EPR) Programs in BC
September 27, 2018

Executive Summary 3
Background 5
Methodology 6
Awareness and Participation of EPR Programs 9
Knowledge of Programs 20
Consumer Behaviour and Recycling 23
Recycling Education 27
Recycling Council of BC website/hotline 31
Appendix - Questionnaire 36
2
Table of Contents

Executive Summary
3
• Reasons related to the environment are predominantly why people recycle.
• Over four in five consider themselves knowledgeable about the impacts of not recycling.
• Overall awareness of what products can be recycled through Extended Producer Responsibility (EPR) programs has increased from 2015, most notably among many of the less well known products (e.g. thermostats).
• Products with high turnover (i.e. beverage containers, etc.) are the most likely to be recycled/returned. The types of items most likely to be thrown in the garbage are polystyrene (referred to in the survey under the trade name Styrofoam), lighting products, batteries and pharmaceuticals. o Among those who have thrown these types of items in the garbage, the primary
reasons for not recycling them is they did not know the item was recyclable and did not know where to take it to be recycled.
• The leading areas that consumers recommend to enhance their likelihood or their experience with recycling relate to convenience (e.g. curbside pickup of all recyclables), information (e.g. more information on what is recyclable) and location (e.g. more accessible locations for recycling depots).
• The perception of who is responsible for funding the EPR programs tends to be spread across municipalities, the provincial government and consumers. While the perception of who is responsible for operating the EPR programs is primarily linked to municipalities, with the provincial government a distant second.
Executive Summary
4
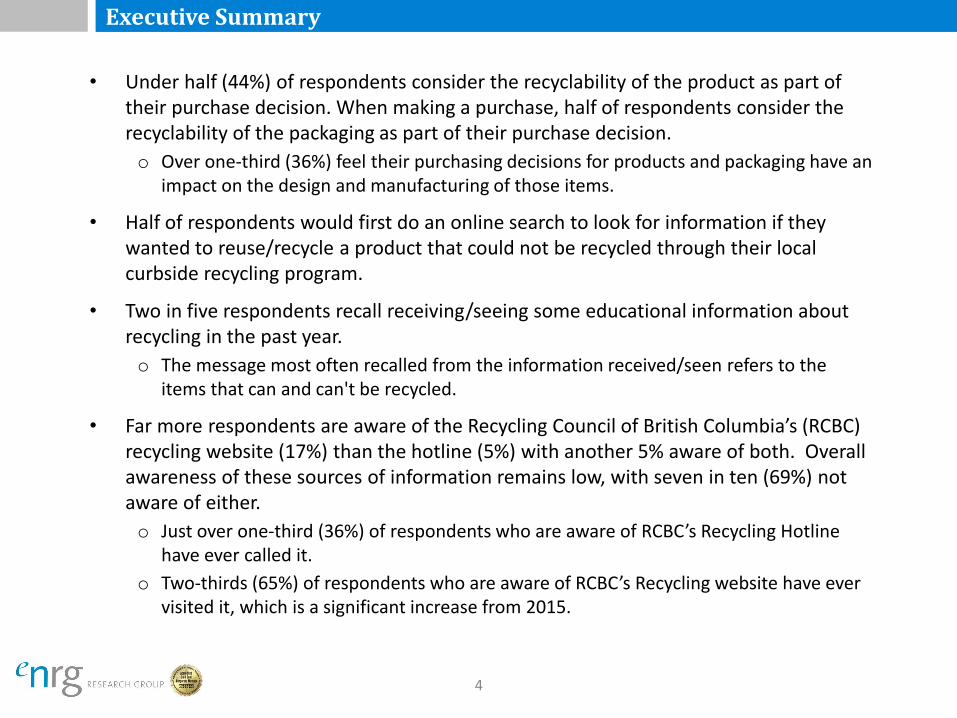
• Under half (44%) of respondents consider the recyclability of the product as part of their purchase decision. When making a purchase, half of respondents consider the recyclability of the packaging as part of their purchase decision.
o Over one-third (36%) feel their purchasing decisions for products and packaging have an impact on the design and manufacturing of those items.
• Half of respondents would first do an online search to look for information if they wanted to reuse/recycle a product that could not be recycled through their local curbside recycling program.
• Two in five respondents recall receiving/seeing some educational information about recycling in the past year.
o The message most often recalled from the information received/seen refers to the items that can and can't be recycled.
• Far more respondents are aware of the Recycling Council of British Columbia’s (RCBC) recycling website (17%) than the hotline (5%) with another 5% aware of both. Overall awareness of these sources of information remains low, with seven in ten (69%) not aware of either.
o Just over one-third (36%) of respondents who are aware of RCBC’s Recycling Hotline have ever called it.
o Two-thirds (65%) of respondents who are aware of RCBC’s Recycling website have ever visited it, which is a significant increase from 2015.

Background
5
• The main objective of conducting this survey is to measure consumer awareness of Extended Producer Responsibility (EPR) Programs in British Columbia.
• In reviewing the results, it is worth noting that mentions of the products recycled in this survey are based on consumer awareness of the recycling programs, and these results cannot be extrapolated to calculate the actual amount of products recycled.
• For information on recycling options, locations near you, and community-based recycling initiatives, please contact the Recycling Council of British Columbia (RCBC): http://www.rcbc.bc.ca.
• For information on the provincial government’s policy with respect to waste reduction and extended producer responsibility, please visit: www.recycling.gov.bc.ca.
• For information on the stewardship agencies and their programs/services please visit their collective site: http://www.bcrecycles.ca/.
Methodology
6
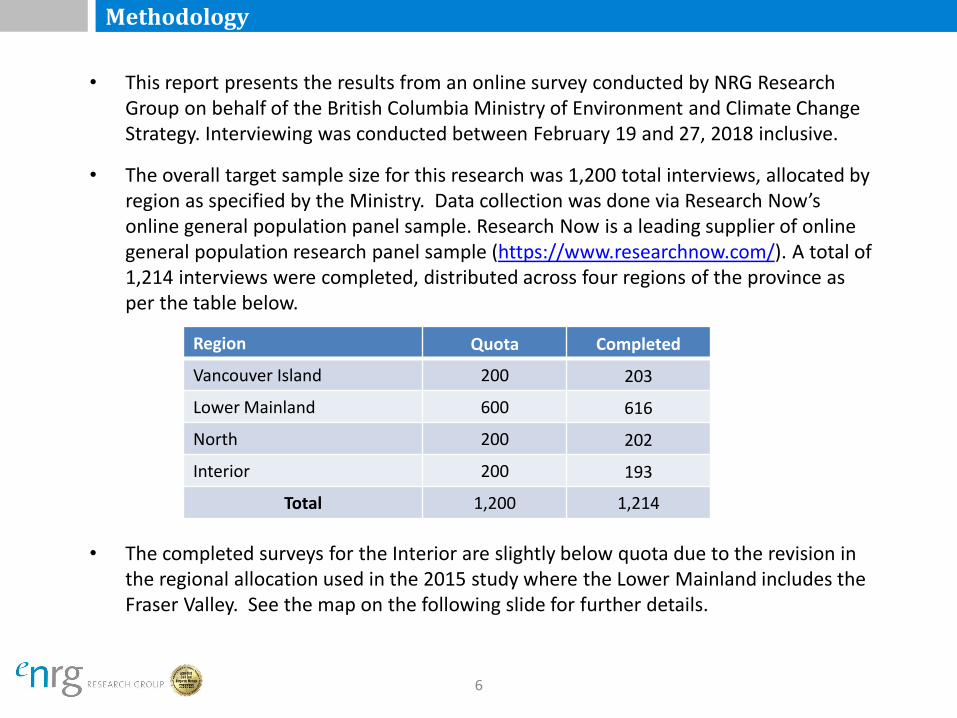
• This report presents the results from an online survey conducted by NRG Research Group on behalf of the British Columbia Ministry of Environment and Climate Change Strategy. Interviewing was conducted between February 19 and 27, 2018 inclusive.
• The overall target sample size for this research was 1,200 total interviews, allocated by region as specified by the Ministry. Data collection was done via Research Now’s online general population panel sample. Research Now is a leading supplier of online general population research panel sample (https://www.researchnow.com/). A total of 1,214 interviews were completed, distributed across four regions of the province as per the table below.
• The completed surveys for the Interior are slightly below quota due to the revision in the regional allocation used in the 2015 study where the Lower Mainland includes the Fraser Valley. See the map on the following slide for further details.
Region Quota Completed
Vancouver Island 200 203
Lower Mainland 600 616
North 200 202
Interior 200 193
Total 1,200 1,214
Methodology - Regional Definitions
7
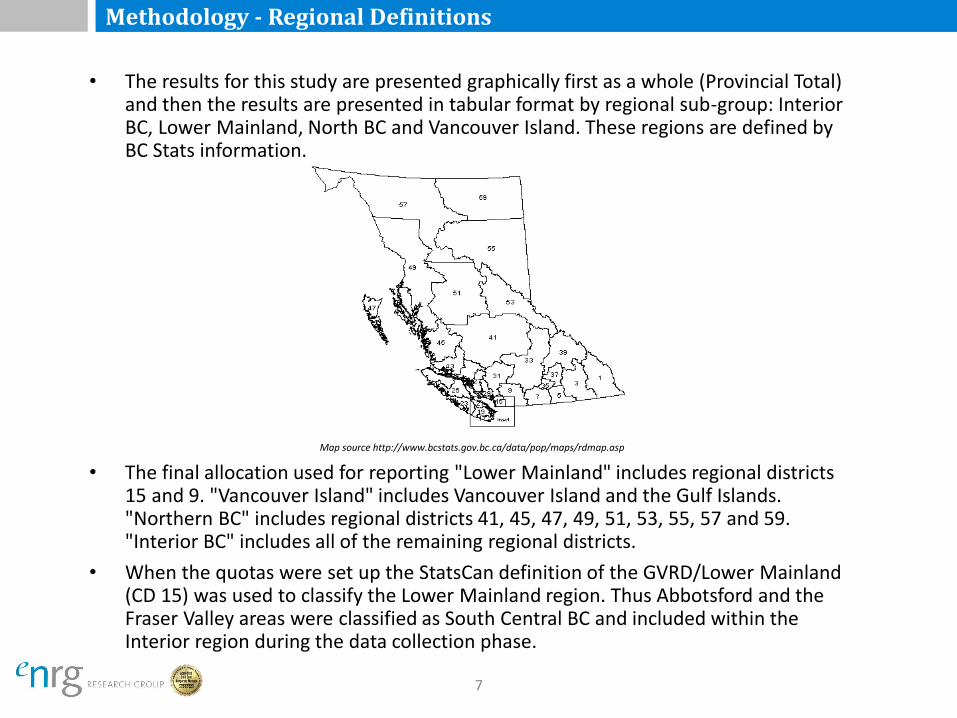
• The results for this study are presented graphically first as a whole (Provincial Total) and then the results are presented in tabular format by regional sub-group: Interior BC, Lower Mainland, North BC and Vancouver Island. These regions are defined by BC Stats information.
Map source http://www.bcstats.gov.bc.ca/data/pop/maps/rdmap.asp
• The final allocation used for reporting "Lower Mainland" includes regional districts 15 and 9. "Vancouver Island" includes Vancouver Island and the Gulf Islands. "Northern BC" includes regional districts 41, 45, 47, 49, 51, 53, 55, 57 and 59. "Interior BC" includes all of the remaining regional districts.
• When the quotas were set up the StatsCan definition of the GVRD/Lower Mainland (CD 15) was used to classify the Lower Mainland region. Thus Abbotsford and the Fraser Valley areas were classified as South Central BC and included within the Interior region during the data collection phase.
Methodology - Weighting
8
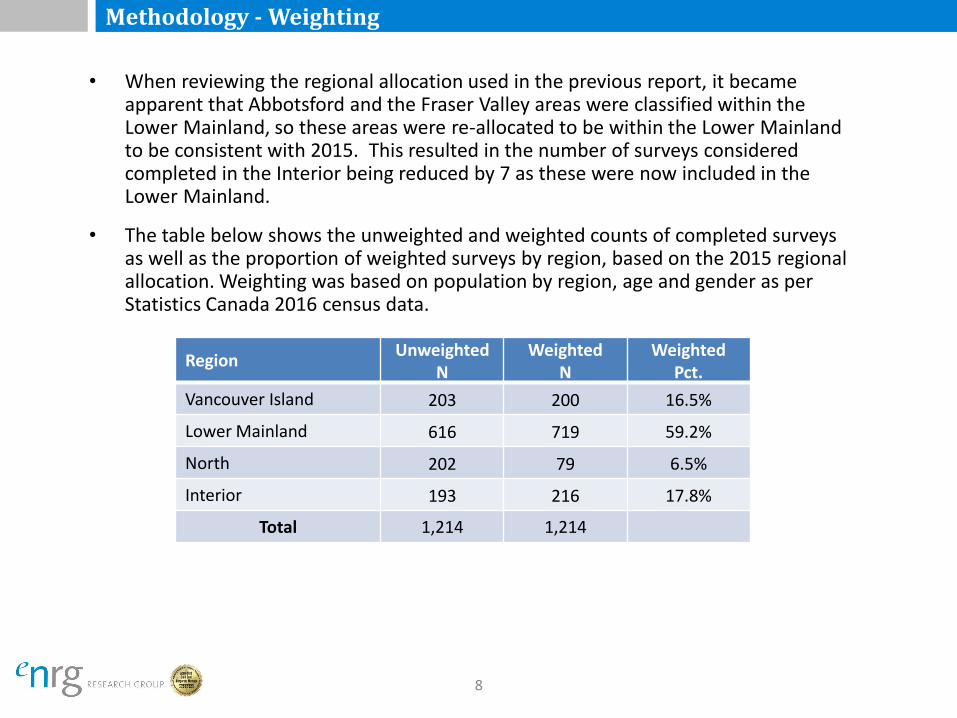
• When reviewing the regional allocation used in the previous report, it became apparent that Abbotsford and the Fraser Valley areas were classified within the Lower Mainland, so these areas were re-allocated to be within the Lower Mainland to be consistent with 2015. This resulted in the number of surveys considered completed in the Interior being reduced by 7 as these were now included in the Lower Mainland.
• The table below shows the unweighted and weighted counts of completed surveys as well as the proportion of weighted surveys by region, based on the 2015 regional allocation. Weighting was based on population by region, age and gender as per Statistics Canada 2016 census data.
Region Unweighted
N Weighted
N Weighted
Pct.
Vancouver Island 203 200 16.5%
Lower Mainland 616 719 59.2%
North 202 79 6.5%
Interior 193 216 17.8%
Total 1,214 1,214
Awareness and Participation of Extended Producer
Responsibility Programs
9
10
Reasons for Recycling (General – open-ended)
79%
57%
33%
9%
19%
13%
4%
4%
2%
4%
2%
Environment (NET)
Good (better) for the environment
Reduce waste/ less garbage in landfills
Save and reuse resources/ make new things
Social/ Community (NET)
Right thing to do/ social responsibility
Future generations
Benefits or Incentives (NET)
Others
Don't know
I don't recycle
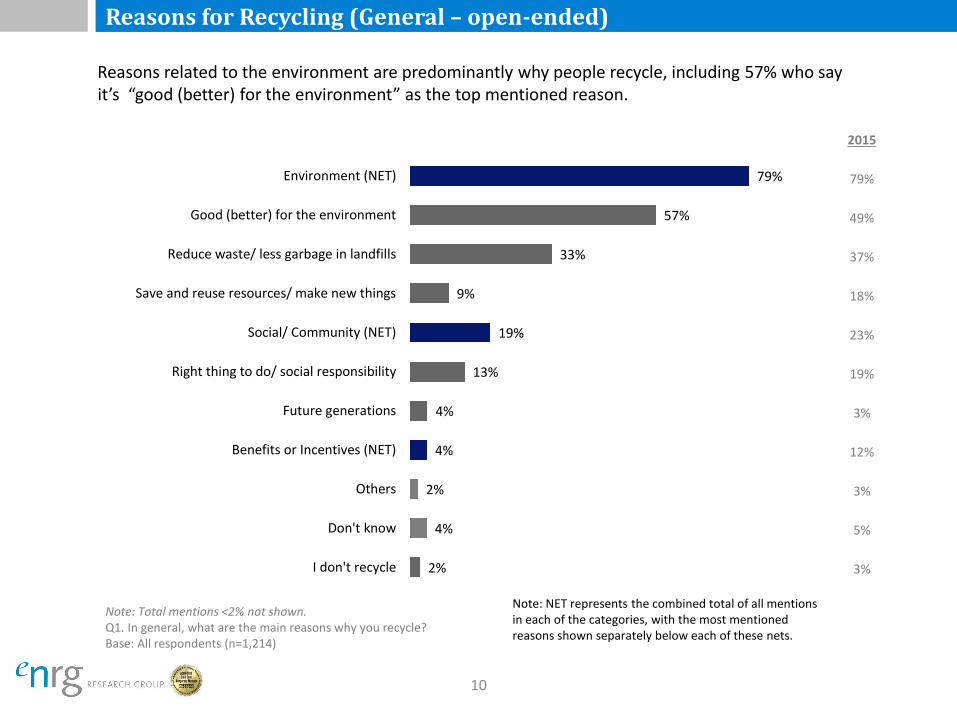
Note: Total mentions <2% not shown. Q1. In general, what are the main reasons why you recycle? Base: All respondents (n=1,214)
Reasons related to the environment are predominantly why people recycle, including 57% who say it’s “good (better) for the environment” as the top mentioned reason.
2015
79%
49%
37%
18%
23%
19%
3%
12%
3%
5%
3%
Note: NET represents the combined total of all mentions in each of the categories, with the most mentioned reasons shown separately below each of these nets.
11
Knowledge Level of Impacts of NOT Recycling
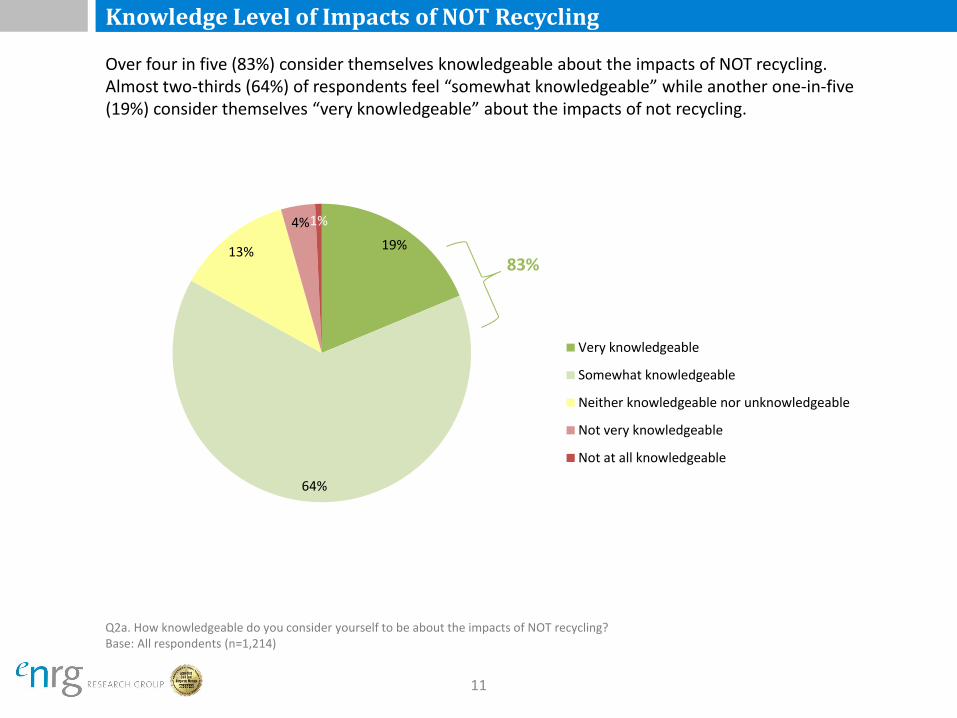
Q2a. How knowledgeable do you consider yourself to be about the impacts of NOT recycling? Base: All respondents (n=1,214)
19%
64%
13%
4% 1%
Very knowledgeable
Somewhat knowledgeable
Neither knowledgeable nor unknowledgeable
Not very knowledgeable
Not at all knowledgeable
Over four in five (83%) consider themselves knowledgeable about the impacts of NOT recycling. Almost two-thirds (64%) of respondents feel “somewhat knowledgeable” while another one-in-five (19%) consider themselves “very knowledgeable” about the impacts of not recycling.
83%
12
Aided Awareness of Recyclable Products
90%
88%
85%
82%
76%
75%
74%
69%
68%
68%
65%
60%
53%
50%
44%
44%
43%
39%
33%
Beer cans and bottles
Beverage containers
Electronics
Batteries (household)
Cell phones
Small appliances
Car batteries
Tires
Lighting products
Paints
Large appliances
Used lubricating oil, filters and containers
Styrofoam
Solvents, flammable liquids, gasoline, pesticides
Outdoor power equipment
Pharmaceuticals
Smoke/fire/carbon monoxide detectors/alarms
Heating, ventilation, AC, plumbing products
Thermostats
Q3. Extended Producer Responsibility programs in B.C. allow many different products to be recycled. Before today, which of the following products did you know could be recycled through these programs? Base: All respondents (n=1,214)
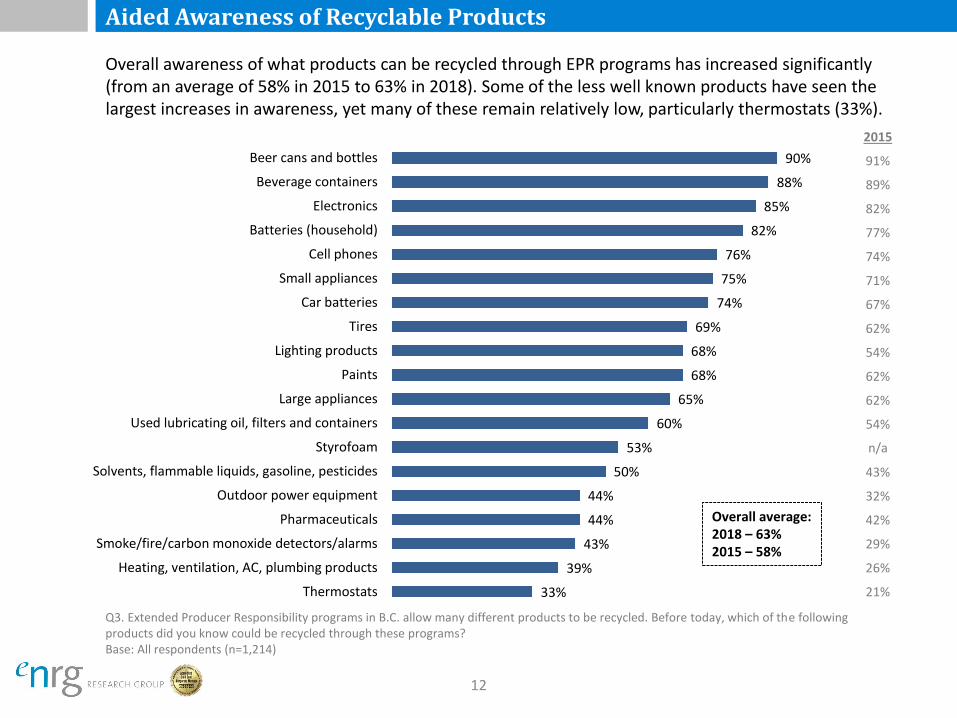
Overall awareness of what products can be recycled through EPR programs has increased significantly (from an average of 58% in 2015 to 63% in 2018). Some of the less well known products have seen the largest increases in awareness, yet many of these remain relatively low, particularly thermostats (33%).
2015
91%
89%
82%
77%
74%
71%
67%
62%
54%
62%
62%
54%
n/a
43%
32%
42%
29%
26%
21%
Overall average: 2018 – 63% 2015 – 58%
13
Prevalence of Recycling Products
Q4. In the last few years, which of these products have you personally recycled and which ones have you thrown in the garbage? Base: All respondents (n=1,214)
91%
90%
69%
59%
48%
54%
44%
50%
49%
47%
48%
43%
39%
41%
30%
21%
20%
18%
14%
5%
4%
9%
16%
16%
9%
16%
6%
4%
6%
4%
5%
8%
5%
7%
6%
5%
6%
4%
96%
93%
78%
75%
64%
63%
60%
56%
53%
53%
52%
49%
47%
46%
36%
27%
25%
25%
19%
Beverage containers
Beer cans and bottles
Electronics
Batteries (household)
Lighting products
Small appliances
Styrofoam
Cell phones
Car batteries
Paints
Tires
Large appliances
Pharmaceuticals
Used lubricating oil, filters and containers
Solvents, flammable liquids, gasoline, pesticides
Smoke/fire/carbon monoxide detectors/alarms
Outdoor power equipment
Heating, ventilation, AC, plumbing products
Thermostats
Recycled or returned
Sometimes recycle, sometimes garbage
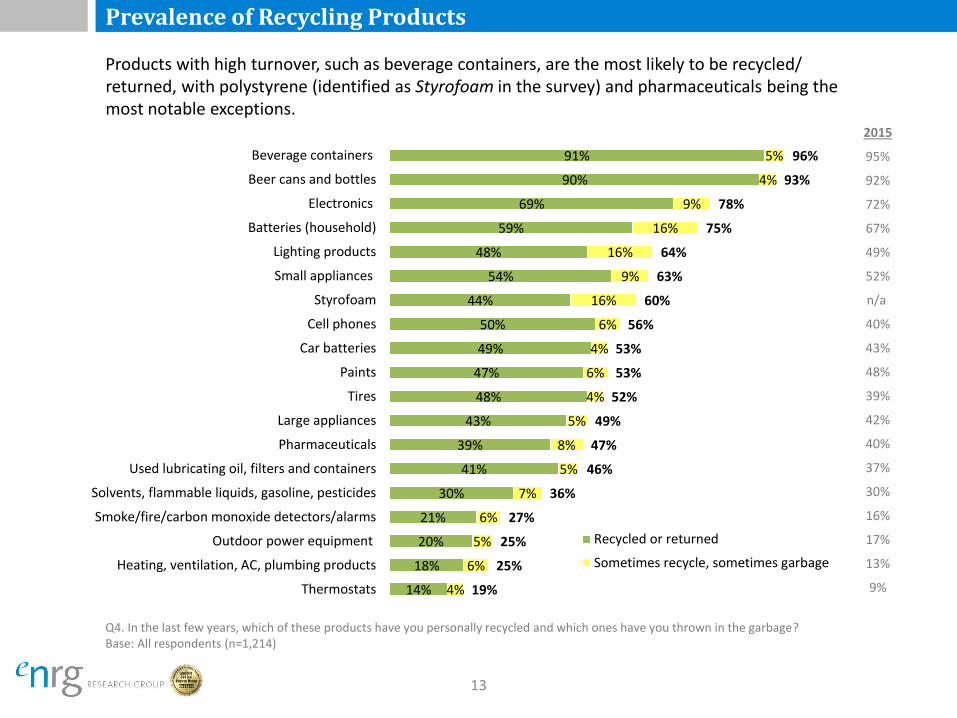
Products with high turnover, such as beverage containers, are the most likely to be recycled/ returned, with polystyrene (identified as Styrofoam in the survey) and pharmaceuticals being the most notable exceptions.
2015
95%
92%
72%
67%
49%
52%
n/a
40%
43%
48%
39%
42%
40%
37%
30%
16%
17%
13%
9%
14
Prevalence of Throwing Products in Garbage
Note: Numbers less than 3% are not displayed in the bar. Q4. In the last few years, which of these products have you personally recycled and which ones have you thrown in the garbage? Base: All respondents (n=1,214)
28%
22%
16%
16%
6%
7%
7%
3%
5%
6%
5%
4%
4%
5%
4%
16%
16%
16%
8%
9%
6%
6%
9%
7%
4%
5%
6%
6%
5%
5%
4%
5%
4%
4%
44%
39%
31%
24%
15%
13%
13%
12%
12%
10%
10%
10%
10%
9%
9%
6%
6%
6%
6%
Styrofoam
Lighting products
Batteries (household)
Pharmaceuticals
Small appliances
Paints
Smoke/fire/carbon monoxide detectors/alarms
Electronics
Solvents and flammable liquids, gasoline, pesticides
Thermostats
Used lubricating oil, filters and containers
Cell phones
Heating, ventilation, AC, plumbing products
Outdoor power equipment
Large appliances
Tires
Beverage containers
Car batteries
Beer cans and bottles
Thrown in garbage
Sometimes recycle, sometimes garbage
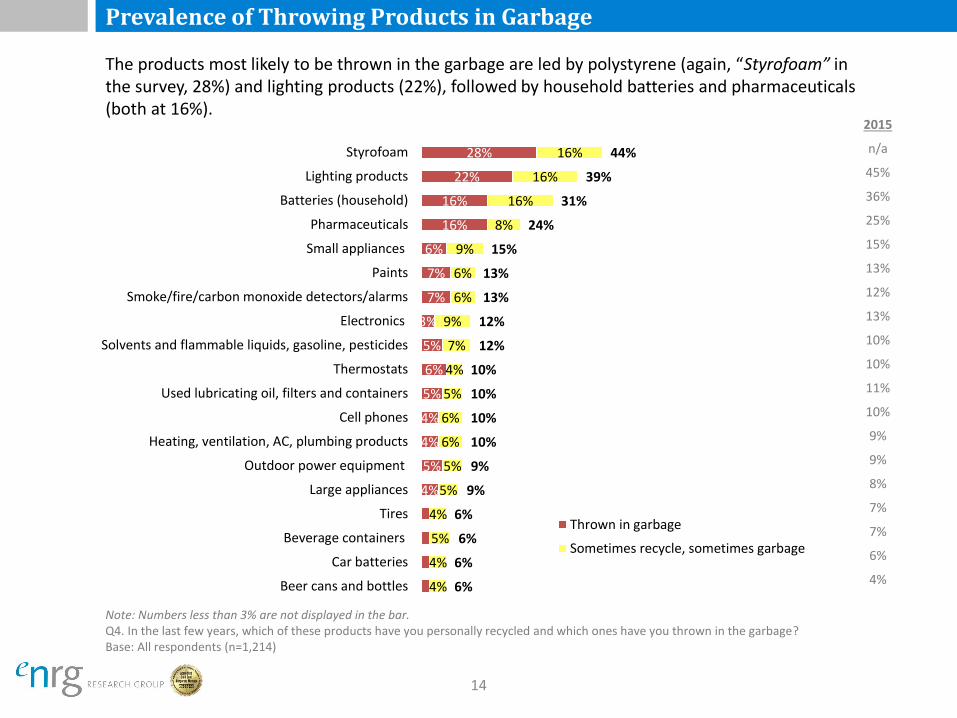
The products most likely to be thrown in the garbage are led by polystyrene (again, “Styrofoam” in the survey, 28%) and lighting products (22%), followed by household batteries and pharmaceuticals (both at 16%).
2015
n/a
45%
36%
25%
15%
13%
12%
13%
10%
10%
11%
10%
9%
9%
8%
7%
7%
6%
4%

15
Convenience of Recycling: Type of Product
Q4a.When you last recycled each of these types of products, how convenient was the process? Base: Those that “recycled or returned” or “sometimes recycle, sometimes garbage” each of these items
76%
74%
61%
52%
53%
50%
45%
45%
46%
46%
47%
52%
45%
40%
39%
37%
35%
32%
33%
21%
22%
30%
35%
32%
35%
39%
37%
36%
36%
35%
30%
35%
40%
37%
39%
40%
39%
38%
96%
96%
90%
87%
85%
84%
84%
82%
82%
82%
82%
82%
80%
80%
76%
76%
75%
71%
71%
Beer cans and bottles
Beverage containers
Pharmaceuticals
Cell phones
Car batteries
Batteries (household)
Lighting products
Electronics
Smoke/fire/carbon monoxide detectors/alarms
Small appliances
Tires
Styrofoam
Paints
Thermostats
Used lubricating oil, filters and containers
Outdoor power equipment
Solvents, flammable liquids, gasoline, pesticides
Heating, ventilation, AC, plumbing products
Large appliances
Very Convenient
Somewhat convenient
Convenience of the recycling process is rated very highly across most products that people have recycled or returned, although relatively less so for HVAC/plumbing and large appliances (with 71% rating both these as either “very convenient” or “somewhat convenient”).
16
Reasons for Not Recycling Specific Items
Q5. What is the main reason(s) that you have not recycled the following items? Base: All respondents who have either selected “Thrown in garbage “or “Sometimes recycle, sometimes garbage” at Q4
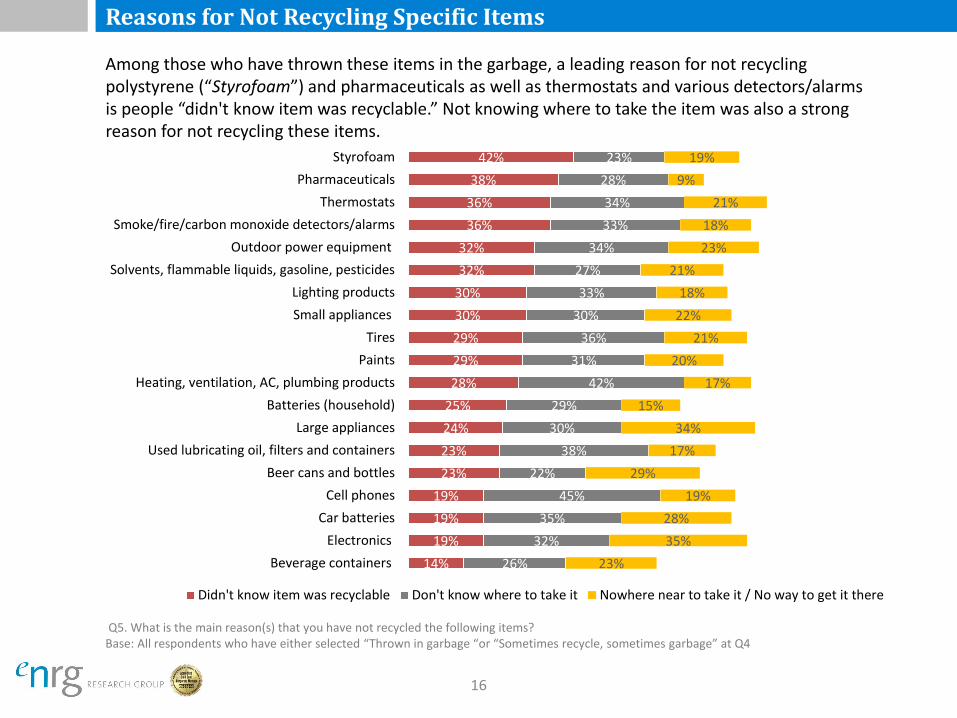
Among those who have thrown these items in the garbage, a leading reason for not recycling polystyrene (“Styrofoam”) and pharmaceuticals as well as thermostats and various detectors/alarms is people “didn't know item was recyclable.” Not knowing where to take the item was also a strong reason for not recycling these items.
42%
38%
36%
36%
32%
32%
30%
30%
29%
29%
28%
25%
24%
23%
23%
19%
19%
19%
14%
23%
28%
34%
33%
34%
27%
33%
30%
36%
31%
42%
29%
30%
38%
22%
45%
35%
32%
26%
19%
9%
21%
18%
23%
21%
18%
22%
21%
20%
17%
15%
34%
17%
29%
19%
28%
35%
23%
Styrofoam
Pharmaceuticals
Thermostats
Smoke/fire/carbon monoxide detectors/alarms
Outdoor power equipment
Solvents, flammable liquids, gasoline, pesticides
Lighting products
Small appliances
Tires
Paints
Heating, ventilation, AC, plumbing products
Batteries (household)
Large appliances
Used lubricating oil, filters and containers
Beer cans and bottles
Cell phones
Car batteries
Electronics
Beverage containers
Didn't know item was recyclable Don't know where to take it Nowhere near to take it / No way to get it there

17
Products at Home – Not Yet Recycled
Q6. Which of the following products do you currently have in your home that are no longer in use/broken/expired that you have not returned for recycling? Base: Total but excludes those that selectedI as ‘I have not owned or used this item ‘ at Q4
27%
26%
24%
22%
21%
20%
17%
17%
14%
12%
7%
7%
6%
5%
5%
5%
4%
3%
3%
31%
Batteries (household)
Cell phones
Beverage containers
Electronics
Beer cans and bottles
Paints
Lighting products
Pharmaceuticals
Styrofoam
Small appliances
Solvents and flammable liquids, gasoline, pesticides
Used lubricating oil, filters and containers
Tires
Large appliances
Outdoor power equipment
Smoke/fire/carbon monoxide detectors/alarms
Car batteries
Thermostats
Heating, ventilation, large air conditioning, plumbing products
None of these
There are a range of items that consumers have in their home that are no longer in use that they have not returned for recycling, led by batteries (27%), cell phones (26%) and beverage containers (24%). This profile is very consistent with results from 2015.
2015
28%
29%
26%
22%
23%
20%
15%
15%
n/a
10%
7%
5%
7%
4%
4%
3%
4%
2%
2%
30%

18
Main Reasons for Not Recycling – Any Product
Q7. What is the main reason(s) that you have not recycled the following items? Base: Respondents with an unused, broken, expired recyclable product in the home
35%
24%
16%
16%
12%
11%
11%
9%
9%
8%
7%
8%
5%
I keep recyclables until I have enough to make a trip worthwhile
I don't know where to take it
I know where to take it, but I don’t have the time to return it
I didn't know the item was recyclable
I have no way to get it to where it can be recycled
I am still using the item
I plan to sell the item or give it away
I am not using it, but plan to use it again in the future
I can't be bothered
I plan to fix it
It is hazardous and I do not want to handle it
Other
Don't Know
The main reasons for not recycling the items being assessed include “I keep recyclables until I have enough to make a trip worthwhile” (35% average mentions across all products), followed by “I don't know where to take it” (24% average mentions). Far fewer reasons for not recycling were selected this year compared to 2015, with the largest drop being for people not keep recyclables until they have enough to make a trip worthwhile.
2015
63%
31%
24%
23%
14%
19%
24%
23%
14%
13%
9%
6%
2%
19
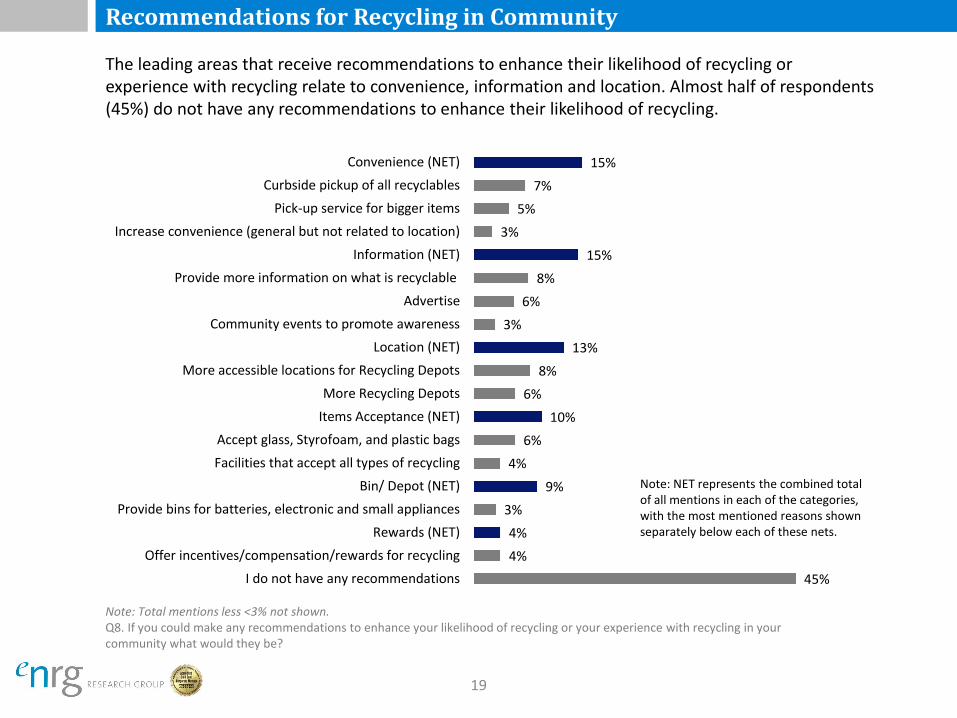
Recommendations for Recycling in Community
Note: Total mentions less <3% not shown. Q8. If you could make any recommendations to enhance your likelihood of recycling or your experience with recycling in your community what would they be?
15%
7%
5%
3%
15%
8%
6%
3%
13%
8%
6%
10%
6%
4%
9%
3%
4%
4%
45%
Convenience (NET)
Curbside pickup of all recyclables
Pick-up service for bigger items
Increase convenience (general but not related to location)
Information (NET)
Provide more information on what is recyclable
Advertise
Community events to promote awareness
Location (NET)
More accessible locations for Recycling Depots
More Recycling Depots
Items Acceptance (NET)
Accept glass, Styrofoam, and plastic bags
Facilities that accept all types of recycling
Bin/ Depot (NET)
Provide bins for batteries, electronic and small appliances
Rewards (NET)
Offer incentives/compensation/rewards for recycling
I do not have any recommendations
The leading areas that receive recommendations to enhance their likelihood of recycling or experience with recycling relate to convenience, information and location. Almost half of respondents (45%) do not have any recommendations to enhance their likelihood of recycling.
Note: NET represents the combined total of all mentions in each of the categories, with the most mentioned reasons shown separately below each of these nets.

Knowledge of Programs
20
21
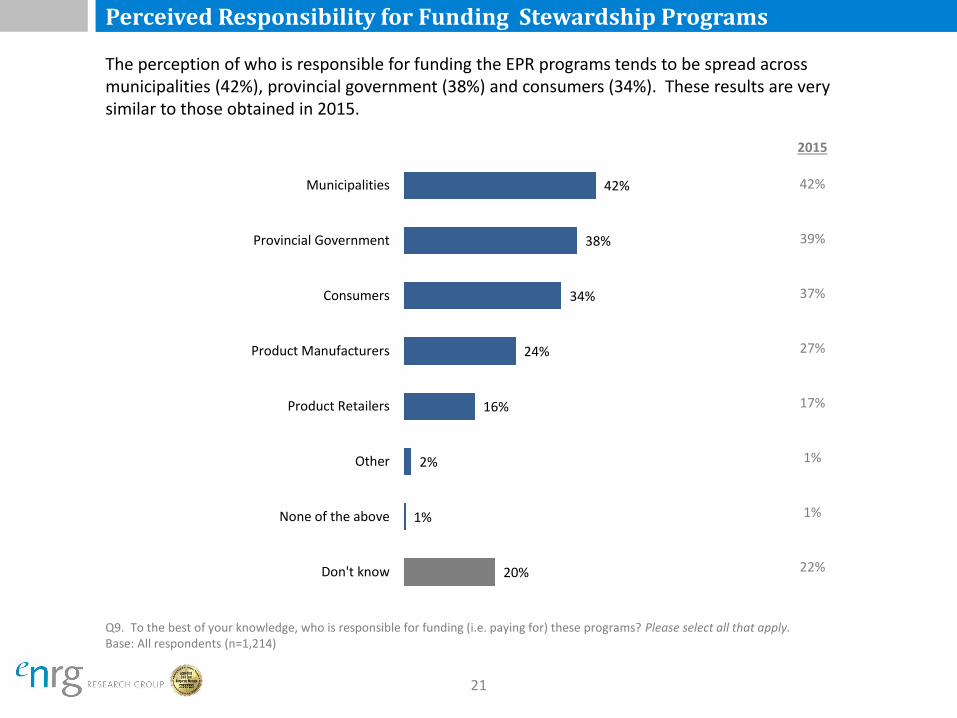
Perceived Responsibility for Funding Stewardship Programs
Q9. To the best of your knowledge, who is responsible for funding (i.e. paying for) these programs? Please select all that apply. Base: All respondents (n=1,214)
2015
42%
39%
37%
27%
17%
1%
1%
22%
42%
38%
34%
24%
16%
2%
1%
20%
Municipalities
Provincial Government
Consumers
Product Manufacturers
Product Retailers
Other
None of the above
Don't know
The perception of who is responsible for funding the EPR programs tends to be spread across municipalities (42%), provincial government (38%) and consumers (34%). These results are very similar to those obtained in 2015.
22
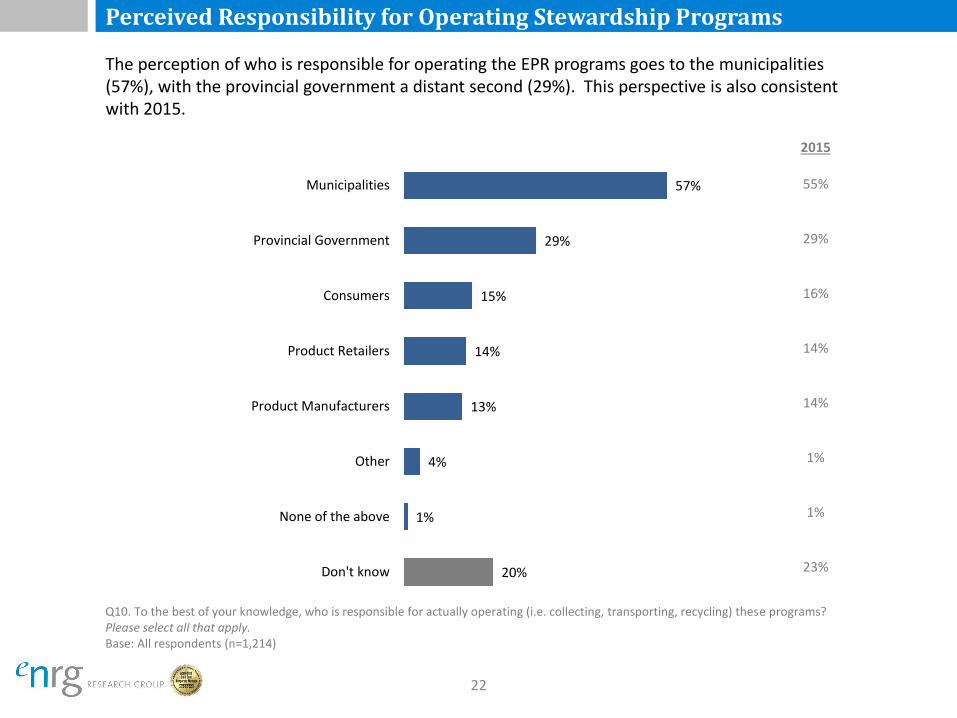
Perceived Responsibility for Operating Stewardship Programs
2015
55%
29%
16%
14%
14%
1%
1%
23%
57%
29%
15%
14%
13%
4%
1%
20%
Municipalities
Provincial Government
Consumers
Product Retailers
Product Manufacturers
Other
None of the above
Don't know
Q10. To the best of your knowledge, who is responsible for actually operating (i.e. collecting, transporting, recycling) these programs? Please select all that apply. Base: All respondents (n=1,214)
The perception of who is responsible for operating the EPR programs goes to the municipalities (57%), with the provincial government a distant second (29%). This perspective is also consistent with 2015.
Consumer Behaviour and Recycling
23
24
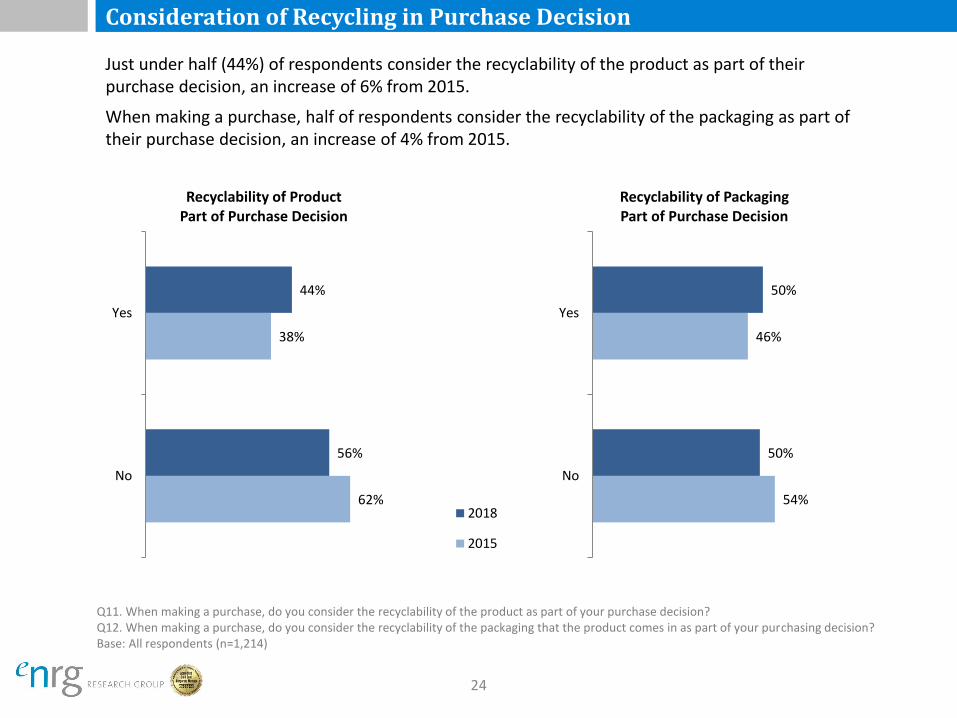
Consideration of Recycling in Purchase Decision
Q11. When making a purchase, do you consider the recyclability of the product as part of your purchase decision? Q12. When making a purchase, do you consider the recyclability of the packaging that the product comes in as part of your purchasing decision? Base: All respondents (n=1,214)
62%
38%
56%
44%
No
Yes
Recyclability of Product Part of Purchase Decision
2018
2015
54%
46%
50%
50%
No
Yes
Recyclability of Packaging Part of Purchase Decision
Just under half (44%) of respondents consider the recyclability of the product as part of their purchase decision, an increase of 6% from 2015.
When making a purchase, half of respondents consider the recyclability of the packaging as part of their purchase decision, an increase of 4% from 2015.
25
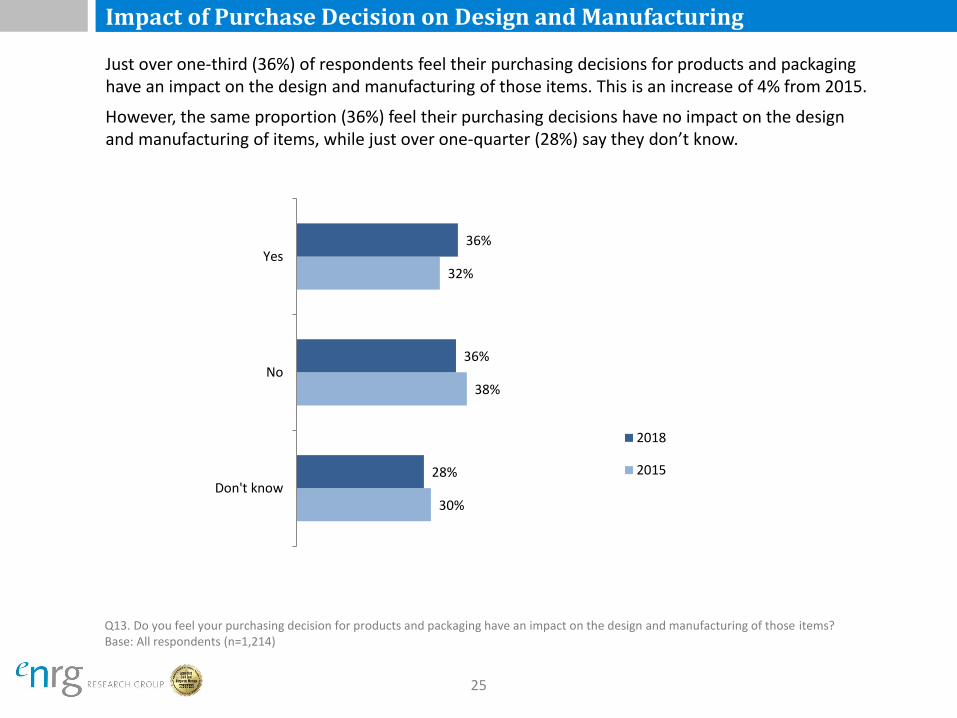
Impact of Purchase Decision on Design and Manufacturing
Q13. Do you feel your purchasing decision for products and packaging have an impact on the design and manufacturing of those items? Base: All respondents (n=1,214)
30%
38%
32%
28%
36%
36%
Don't know
No
Yes
2018
2015
Just over one-third (36%) of respondents feel their purchasing decisions for products and packaging have an impact on the design and manufacturing of those items. This is an increase of 4% from 2015.
However, the same proportion (36%) feel their purchasing decisions have no impact on the design and manufacturing of items, while just over one-quarter (28%) say they don’t know.
26
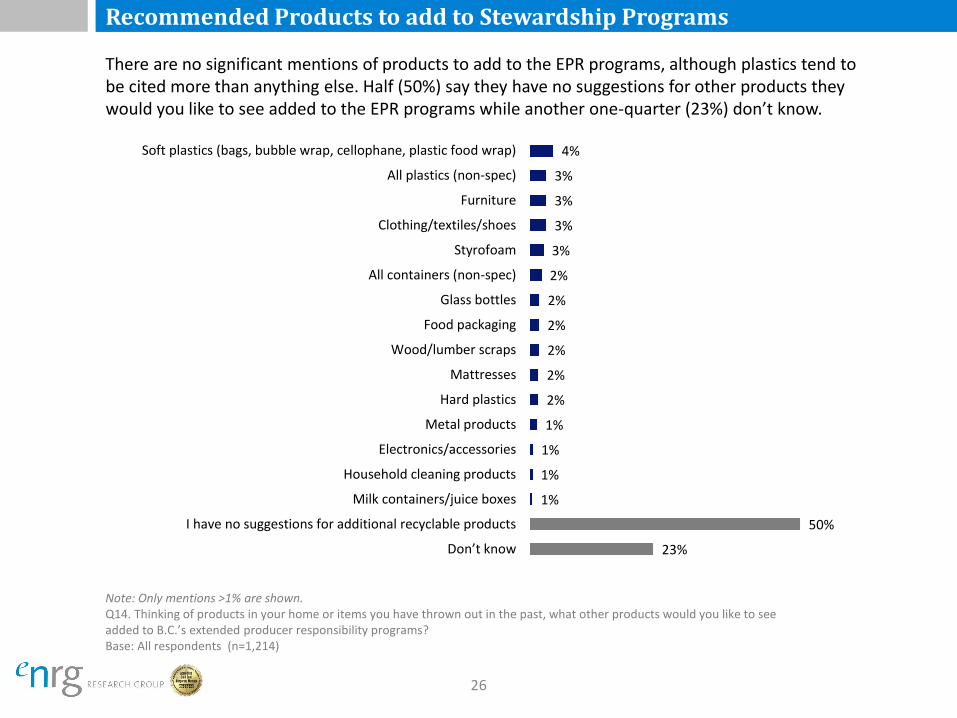
Recommended Products to add to Stewardship Programs
Note: Only mentions >1% are shown. Q14. Thinking of products in your home or items you have thrown out in the past, what other products would you like to see added to B.C.’s extended producer responsibility programs? Base: All respondents (n=1,214)
4%
3%
3%
3%
3%
2%
2%
2%
2%
2%
2%
1%
1%
1%
1%
50%
23%
Soft plastics (bags, bubble wrap, cellophane, plastic food wrap)
All plastics (non-spec)
Furniture
Clothing/textiles/shoes
Styrofoam
All containers (non-spec)
Glass bottles
Food packaging
Wood/lumber scraps
Mattresses
Hard plastics
Metal products
Electronics/accessories
Household cleaning products
Milk containers/juice boxes
I have no suggestions for additional recyclable products
Don’t know
There are no significant mentions of products to add to the EPR programs, although plastics tend to be cited more than anything else. Half (50%) say they have no suggestions for other products they would you like to see added to the EPR programs while another one-quarter (23%) don’t know.
Recycling Education
27
28
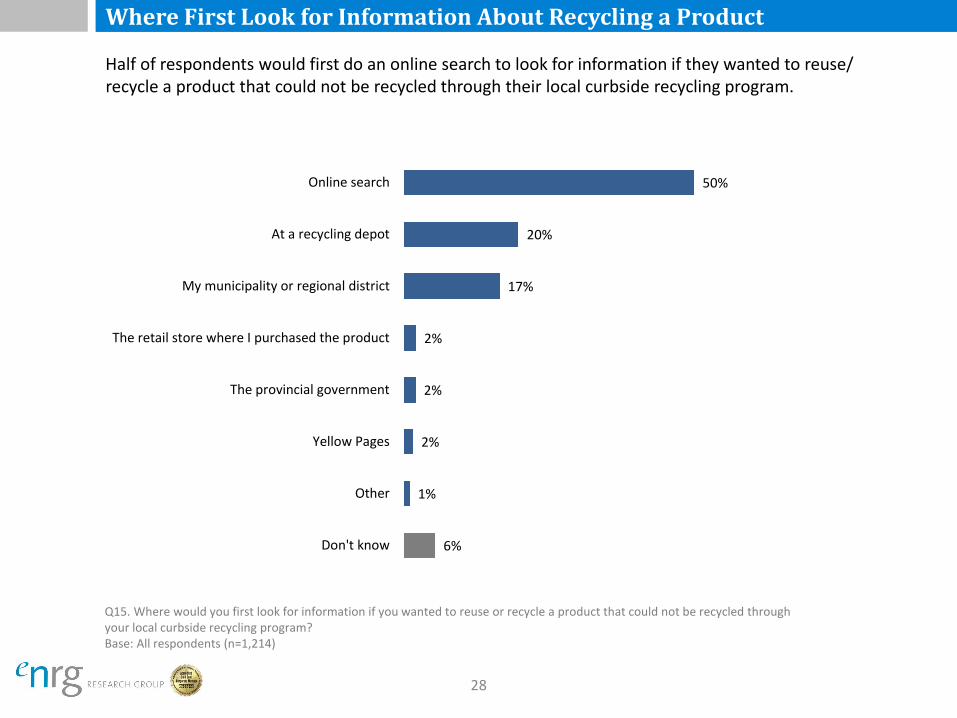
Where First Look for Information About Recycling a Product
Q15. Where would you first look for information if you wanted to reuse or recycle a product that could not be recycled through your local curbside recycling program? Base: All respondents (n=1,214)
50%
20%
17%
2%
2%
2%
1%
6%
Online search
At a recycling depot
My municipality or regional district
The retail store where I purchased the product
The provincial government
Yellow Pages
Other
Don't know
Half of respondents would first do an online search to look for information if they wanted to reuse/ recycle a product that could not be recycled through their local curbside recycling program.
29
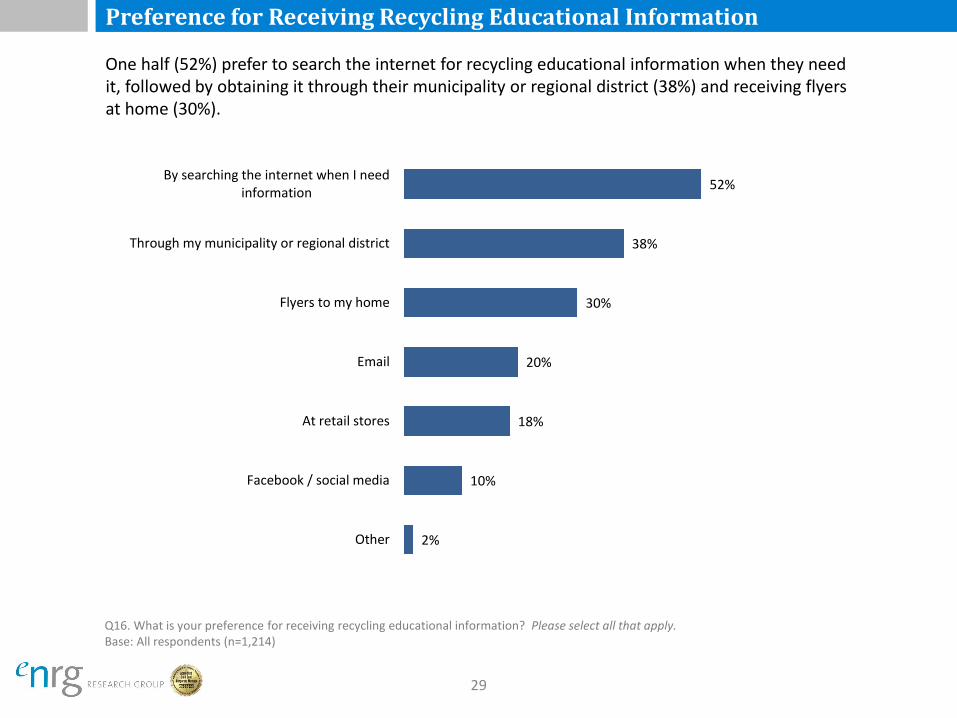
Preference for Receiving Recycling Educational Information
Q16. What is your preference for receiving recycling educational information? Please select all that apply. Base: All respondents (n=1,214)
52%
38%
30%
20%
18%
10%
2%
By searching the internet when I needinformation
Through my municipality or regional district
Flyers to my home
At retail stores
Facebook / social media
Other
One half (52%) prefer to search the internet for recycling educational information when they need it, followed by obtaining it through their municipality or regional district (38%) and receiving flyers at home (30%).
30
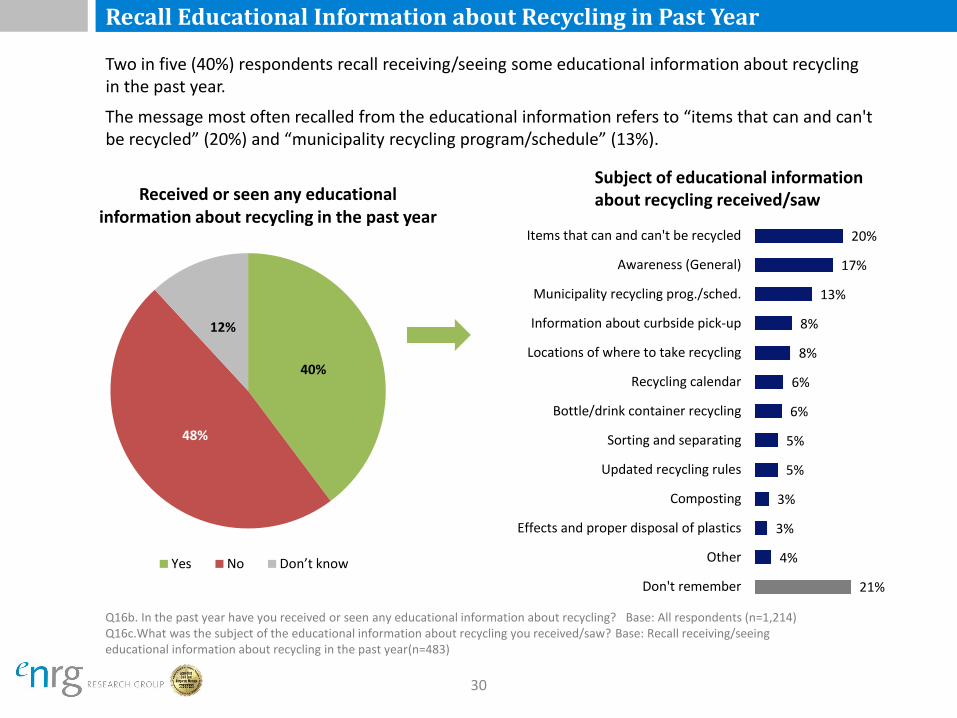
Recall Educational Information about Recycling in Past Year
Q16b. In the past year have you received or seen any educational information about recycling? Base: All respondents (n=1,214) Q16c.What was the subject of the educational information about recycling you received/saw? Base: Recall receiving/seeing educational information about recycling in the past year(n=483)
40%
48%
12%
Received or seen any educational information about recycling in the past year
Yes No Don’t know
20%
17%
13%
8%
8%
6%
6%
5%
5%
3%
3%
4%
21%
Items that can and can't be recycled
Awareness (General)
Municipality recycling prog./sched.
Information about curbside pick-up
Locations of where to take recycling
Recycling calendar
Bottle/drink container recycling
Sorting and separating
Updated recycling rules
Composting
Effects and proper disposal of plastics
Other
Don't remember
Two in five (40%) respondents recall receiving/seeing some educational information about recycling in the past year.
The message most often recalled from the educational information refers to “items that can and can't be recycled” (20%) and “municipality recycling program/schedule” (13%).
Subject of educational information about recycling received/saw

Recycling Council of BC website/hotline
31
32
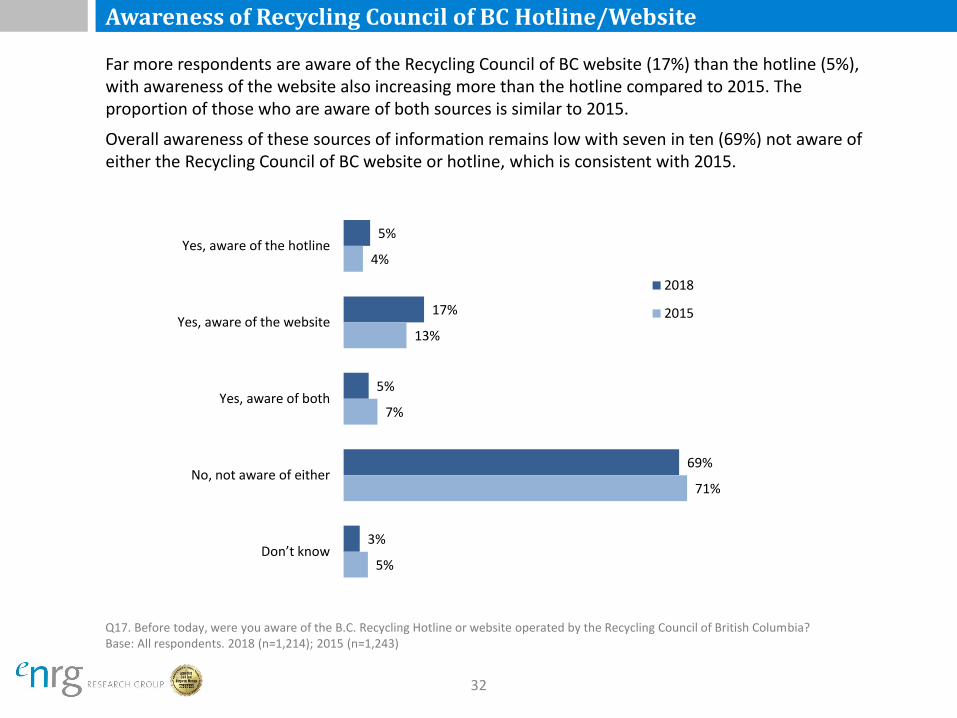
Awareness of Recycling Council of BC Hotline/Website
Q17. Before today, were you aware of the B.C. Recycling Hotline or website operated by the Recycling Council of British Columbia? Base: All respondents. 2018 (n=1,214); 2015 (n=1,243)
5%
17%
5%
69%
3%
4%
13%
7%
71%
5%
Yes, aware of the hotline
Yes, aware of the website
Yes, aware of both
No, not aware of either
Don’t know
2018
2015
Far more respondents are aware of the Recycling Council of BC website (17%) than the hotline (5%), with awareness of the website also increasing more than the hotline compared to 2015. The proportion of those who are aware of both sources is similar to 2015.
Overall awareness of these sources of information remains low with seven in ten (69%) not aware of either the Recycling Council of BC website or hotline, which is consistent with 2015.
33
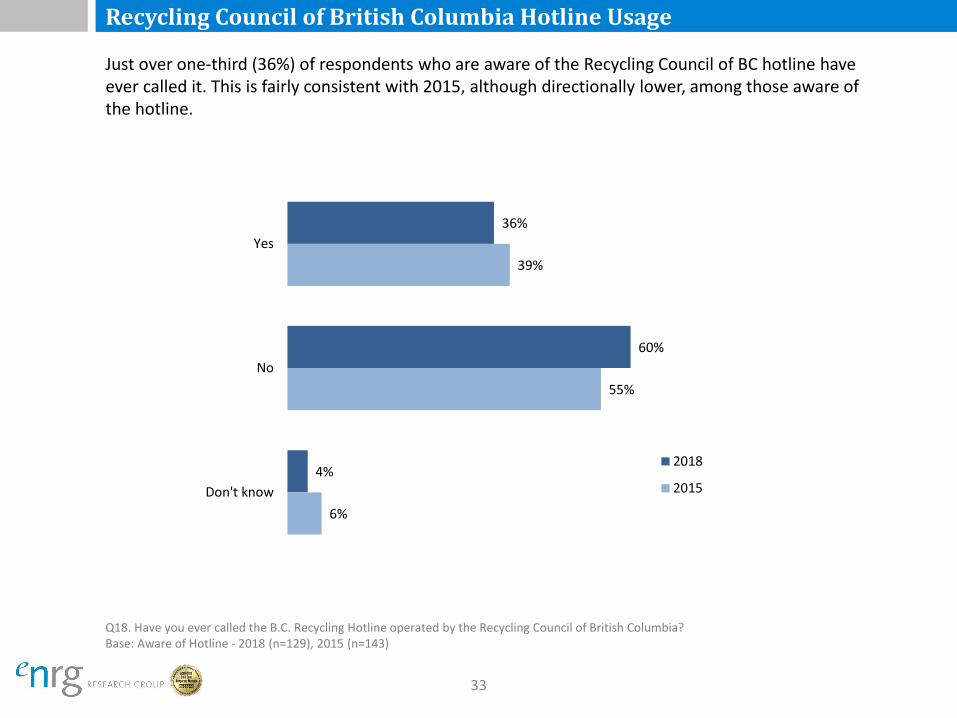
Recycling Council of British Columbia Hotline Usage
Q18. Have you ever called the B.C. Recycling Hotline operated by the Recycling Council of British Columbia? Base: Aware of Hotline - 2018 (n=129), 2015 (n=143)
36%
60%
4%
39%
55%
6%
Yes
No
Don't know
2018
2015
Just over one-third (36%) of respondents who are aware of the Recycling Council of BC hotline have ever called it. This is fairly consistent with 2015, although directionally lower, among those aware of the hotline.
34
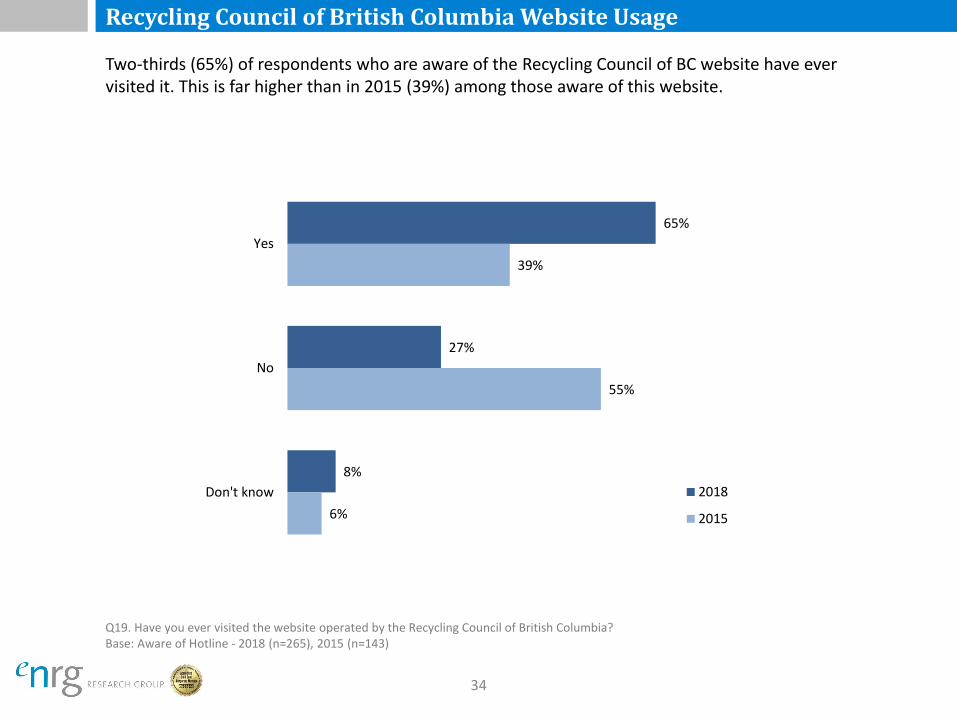
Recycling Council of British Columbia Website Usage
Q19. Have you ever visited the website operated by the Recycling Council of British Columbia? Base: Aware of Hotline - 2018 (n=265), 2015 (n=143)
65%
27%
8%
39%
55%
6%
Yes
No
Don't know 2018
2015
Two-thirds (65%) of respondents who are aware of the Recycling Council of BC website have ever visited it. This is far higher than in 2015 (39%) among those aware of this website.

35
Additional comments about Extended Producer Responsibility program
Q20. Do you have any additional comments on the Extended Producer Responsibility program in B.C.? Base: All respondents (n=1,214)
2%
2%
1%
1%
1%
1%
1%
1%
1%
88%
Education/awareness in schools and communities
Manufacturers should reduce amount of packaging
More advertising
Expand program
Promote reduction of wasteful products
Have accessible recycling depots/bins
Return hard plastic packaging to stores
Readily available information
Offer incentives/compensation for recycling
I have no further comments on the Extended ProducerResponsibility program in B.C.
The vast majority of respondents do not have any further comments about the Extended Producer Responsibility program. The few that do refer to “education/awareness in schools and communities” and “manufacturers should reduce amount of packaging.”
APPENDIX 2018 Questionnaire
36

37
Questionnaire
38
Questionnaire
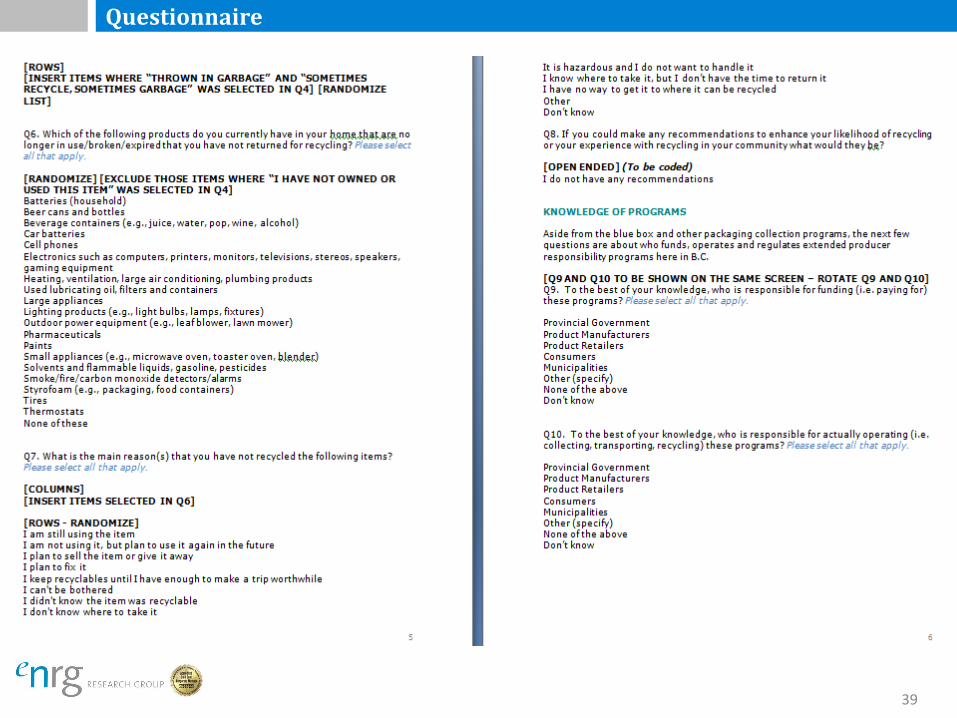
39
Questionnaire
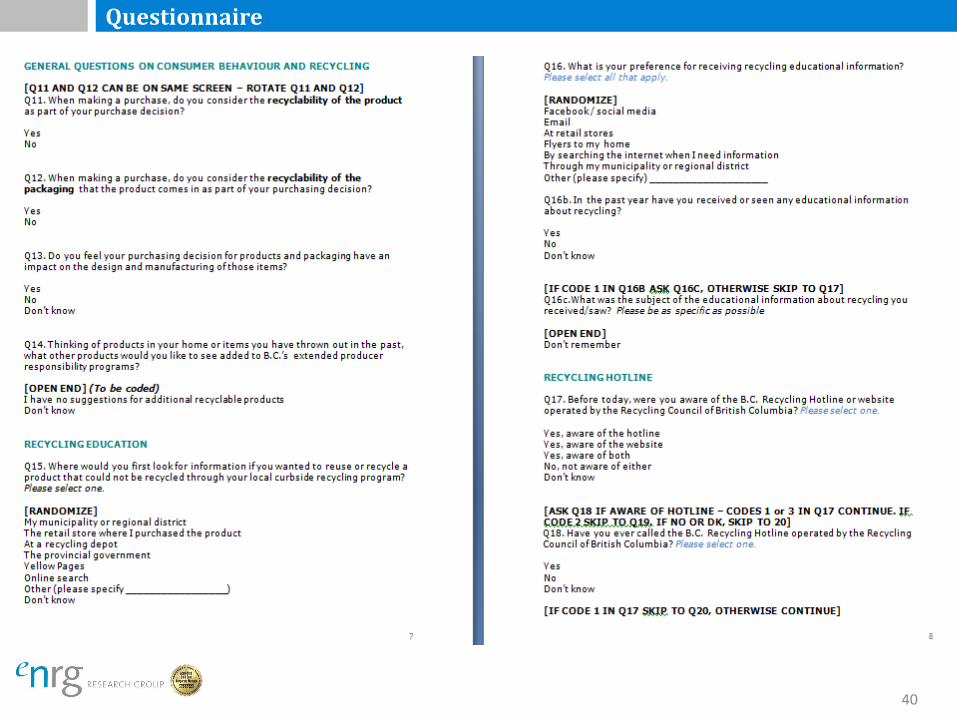
40
Questionnaire
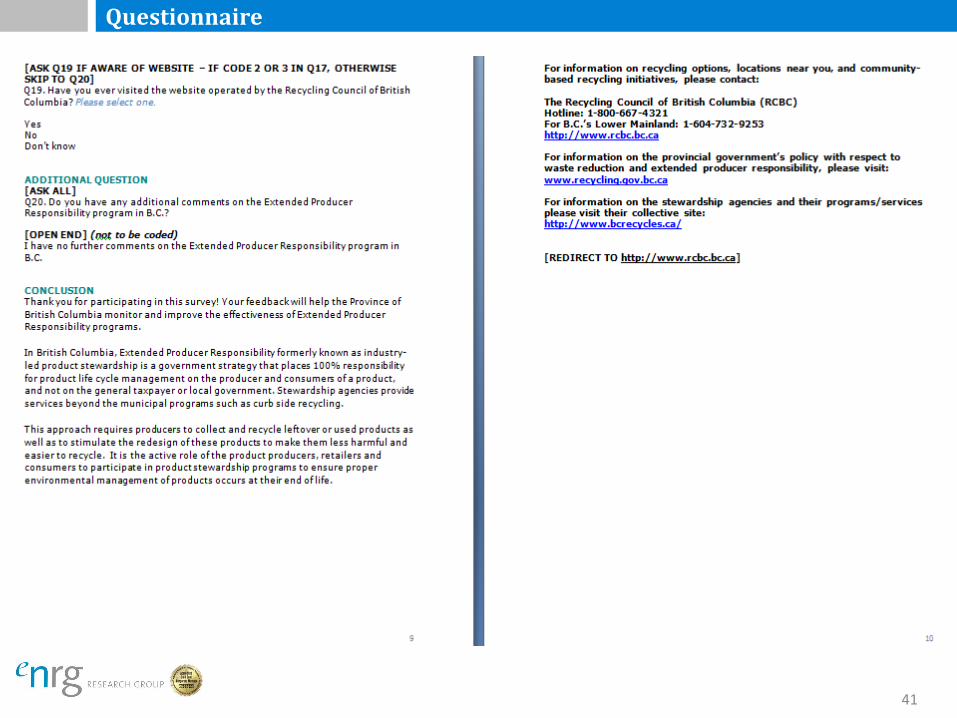
41
Questionnaire