Embed Size (px)
Citation preview

Consumer Decision-making Styles:Comparison Between
Shanghai and Hong KongUniversity Consumers
A Consumer Styles Inventory Approach
BY
Chan Hoi Yee, Bertha02005174
China Business Studies Option
An Honours Degree Project Submitted to theSchool of Business in Partial Fulfillment
of the Graduation Requirement for the Degree ofBachelor of Business Administration (Honours)
Hong Kong Baptist UniversityHong KongApril 2005

ii
Acknowledgements
I would like to give my heartiest thanks to my supervisor Dr. Shi Yi Zheng who has
sacrificed a lot of his valuable time for guiding me in doing this honor project,
suggesting precious advice, pointing out and correcting my mistakes. He is very
patient in answering and explaining my questions all the time. I really have learnt a lot
from him.
In addition, I would like to express my sincere thanks to my dearest friends, Mr. Peter
Wong and Miss Susanna Wong, for squeezing lots of time for helping me in
conducting survey.
Also, I would like to thank my family and friends who always gave me support and
encouraged me when I feel depressed in doing the project.
Last but not least, I would like to thank all the teachers in the Hong Kong Baptist
University who teach me a lot about marketing knowledge in the past three years.
_____________________
Chan Hoi Yee, Bertha
26th April, 2005

iii
Abstract
Consumers use a variety of decision-making styles. This study investigates
decision-making styles of consumers in Shanghai and Hong Kong by analyzing the
Consumer Style Inventory (CSI), which is administered to 150 Shanghai and Hong
Kong university consumers respectively. Factor analysis is adopted to develop the
CSI inventories.
Findings indicate that six types of decision-making styles and fifteen statements are
valid and reliable in Shanghai, whereas five types of decision-making styles and
twenty statements are valid and reliable in Hong Kong. Significant differences can be
found in the dimension of quality conscious, brand conscious, fashion conscious and
shopping carefulness. Business implications, which address the above findings, are
provided for marketers in the following section. Limitations of this paper are the final
chapter.

iv
Table of Contents
Content Page
Acknowledgements ii
Abstract iii
Chapter 1. Introduction1.1 Background Information 11.2 Research Problem Development 1.2.1 Why Shanghai vs. Hong Kong? 1 1.2.2 Why University Students? 21.3 Research Objectives 3
Chapter 2. Literature Review2.1 Historical Researches on Decision-making Styles 42.2 The Consumer Style Inventory (CSI) 42.3 Application of CSI Across Cultures 6
Chapter 3. Research Methodology 3.1 The Sample 7
3.2 Instrument 7 3.3 Data Collection Method 8 3.4 Data Analysis Method 8
Chapter 4. Hypothesis Development 4.1 Differences in Brand Consciousness and Price Consciousness 10 4.2 Differences in Fashion Consciousness and Confusion by Overchoice
11
Chapter 5. Research Findings and Analysis 5.1 Personal Information of the 300 Samples from Shanghai and
Hong Kong 5.1.1 Shanghai 13 5.1.2 Hong Kong 13 5.1.3 Comparison 14 5.2 Decision-making Styles of Shanghai University Consumers 15 5.3 Decision-making Styles of Hong Kong University Consumers 16 5.4 Comparison of Decision-making Styles Between Shanghai and
Hong Kong University Consumers 5.4.1 Number of Dimensions 18 5.4.1 Item Loadings 20 5.4.1 T-test: Test of Hypotheses 21
Chapter 6. Business Implications 6.1 For Shanghai 26 6.2 For Hong Kong 27 6.3 For both Shanghai and Hong Kong 27

v
Chapter 7. Limitations 7.1 Generality of Consumer Characteristics 28 7.2 Limitation of the Sample 28 7.3 Limitation of Culture and Economic Background 29
Chapter 8. Conclusion 30
Chapter 9. References 31
Chapter 10. Appendix 3510.1 Explanation of the eight factors loading by Sproles and Kendall 36
10.2 Tables 38 10.3 Questionnaires 47 10.4 SPSS Outputs 58

1
Chapter 1. Introduction
1.1 Background Information
Decision-making is more complex and even more important for consumers today than
in the past. Consumers are besieged by advertising, news articles, and direct mailings
that provide an abundance of information, much of it with mixed messages. In
addition, increases in the number and variety of goods, stores, and shopping malls,
and the availability of multi-component products and electronic purchasing
capabilities have broadened the sphere for the consumer choice and have complicated
decision making [Hafstrom, Chae, and Chung, 1992].
Profiling consumers’ decision-making styles focuses on studies of the majority of
consumer interest (eg, Bettman, 1979; Sproles, 1985; Thorelli, Becker, and Engeldow
1975; WestBrook and Black, 1985). Consumer affairs specialists use such profiles to
understand consumers’ shopping behaviour, while advertisers and marketing
researchers use them to segment the consumers into various niches for product
positioning [Srinivas and Andrews, 1993].
1.1 Research Problem Development
1.2.1 Why Shanghai vs. Hong Kong?
Shanghai is the most metropolitan province in China, and Hong Kong is also a very
prosperous city in the world. Hong Kong and Shanghai are relevant cities in China for
comparative studies. They have several similarities. Geographically, both cities are
located at the coast of China. Historically, both cities had experienced western

2
colonization for a long time. Culturally, both cities have shared modern and traditional
characterizations. They both are international metropolises that have much
international links. However, there are something different. For example, number of
brothers and sisters, source of income, source of information and culture.
Comparing between these two cities can help companies formulating marketing
strategies. For those companies who have only invested in Hong Kong and have
interest to enter into the Shanghai market, they can study the difference and
similarities between these two cities and then formulate an entering strategy for
Shanghai based on the existing marketing strategy for Hong Kong, and vice versa.
1.2.2 Why University Students?
The university students market is quite large. According to the statistics, there are
189,400 university students in Hong Kong in 2004, amounting about 11.5% of the
educational population [Hong Kong Census and Statistics Department, 2004]. And
there are 378,500 university students in Shanghai in 2004, amounting about 10.8% of
the educational population [Shanghai Statistical Yearbook, 2004]. It is a significant
market in both Shanghai and Hong Kong.
The role of the young especially in consumer decision making should be defined and
examined for several reasons. Young people are eager to consume, are conscious of
their experience [Sproles and Kendall, 1986]. Young consumers are recognized as a
specialized market segment for a variety of goods and services [Moschis and Moore,
1979]. The young within the family often influence family purchasing decisions [Turk
and Bell, 1972]. Consumer socialization is defined as “process by which young

3
people acquire skills, knowledge, and attitudes relevant to their functioning as
consumers in the marketplace” [Ward, 1972]. Socialization usually takes place within
the family and may shape consumer patterns. In this way, it may affect not only
present but also future consumer well-being.
1.2 Research Objectives
Although the CSI research is widely conducted in different nations, few of it is related
to Chinese society, related to the comparison between Hong Kong and Shanghai, and
focused on universities students.
There are three main objectives in this paper:
1. To investigate the decision-making style of Shanghai universities consumers by
purifying the items of CSI.
2. To investigate the decision-making style of Hong Kong universities consumers
by purifying the items of CSI.
3. Comparison of decision-making styles between Shanghai and Hong Kong
universities consumers.

4
Chapter 2. Literature Review
2.1 Historical Researches on Decision-making Styles
Consumer-interest researchers have long been interested in identifying the underlying
decision styles of shoppers. For example, consumers are identified as economic
shoppers, personalizing shoppers, ethical shoppers, apathetic shoppers [Bellenger and
korgaonkar, 1980; Darden and Reynolds, 1971; Stone, 1954], store-loyal shoppers
[Moschis and Gorge, 1976; Stephenson and Willett, 1969], recreational shoppers
[Bellenger and Korgaonkar, 1980; Stephenson and Willett, 1969], convenience
shoppers [Korgaonkar, 1984; Stephenson and Willett, 1969; Williams et al., 1978],
price-oriented shoppers [Korgaonkar, 1984; Stephenson and Willett, 1969; Williams
et al. 1978], brand-loyal shoppers [Jocoby and Chestnut, 1978; Moschis and Gorge,
1976], name-conscious shoppers [Darden and Ashton, 1974-75], fashion shoppers
[Lumpkin, 1985], brand conscious shoppers [Korgaonkar, 1984] and impulse
shoppers [Gehrt and Cater, 1992]. These classifications have provided a number of
measuring methods for the marketers to segment the general public in the consumer
markets [Alice and Noel, 2001].
2.2 The Consumer Style Inventory (CSI)
To further consolidate the above various approaches, Sproles and Kendall [1986]
designed a new model to measure decision-making styles of consumers.
According to Sproles and Kendall [1986], a consumer decision-making style is
defined as a mental orientation characterizing a consumer's approach to make

5
consumer choices. Broadly speaking, there are three types of approaches in studying
consumer decision-making styles: the psychographic/lifestyle approach, which
identifies hundreds of characteristics related to consumer behavior; the consumer
typology approach, which classifies consumers into several types; and the consumer
characteristics approach, which focuses on different cognitive dimensions of
consumer decision-making. For a review of these different approaches, see Sproles
and Kendall [1986].
Building on the literature related to consumer decision-making in the field of
marketing and consumer studies [Maynes, 1976; Miller, 1981; Sproles, 1979; Thorelli,
Becker and Engledow, 1975], Sproles [1985] identified nine decision-making style
traits and developed a 50-item instrument using the consumer characteristics approach.
Using data collected from 111 undergraduate women in two classes at the University
of Arizona and employing a factor analysis technique, Sproles [1985] found that six
out of the nine traits were confirmed to be present.
In a later study, Sproles and Kendall [1986] used a similar approach with a slightly
revised model of consumer decision-making with eight dimensions. An instrument of
48 items was developed. Each dimension of consumer decision-making was
represented by six questions. The questionnaire was administered to 482 students in
29 home economics classes in five high schools in the Tucson, Arizona area. The
eight-factor model was confirmed by a factor analysis using the survey data, although
not all questions were deemed to be useful in representing intended dimensions of a
consumer styles inventory [CSI]. The eight dimensions included in the CSI were:

6
1. Perfectionistic and high-quality conscious consumer,
2. Brand conscious and price equals quality consumer,
3. Novelty and fashion-conscious consumer,
4. Recreational and hedonistic consumer,
5. Price conscious and value for money consumer,
6. Impulsive and careless consumer,
7. Confused by over-choice consumer, and
8. Habitual and brand-loyal consumer.
Appendix 10.1 (page 35) shows the explanations of the eight factors loading by
Sproles and Kendall. It is a pretty good benchmark for us to explain our data analysis
result.
2.3 Application of CSI Across Cultures
The applicability of the CSI has been investigated across several cultures [Alice and
Noel, 2001; Durvasula et al., 1993; Fan and Xiao, 1998; Hafstrom et al., 1992:
Lysonski et al., 1996; Shim and Gehrt, 1996]. These cross-cultural studies have
shown that four consumer styles are relatively more applicable to different countries
as suggested by the factor structure and reliability estimates of the factors. They are
namely quality conscious, brand conscious, fashion conscious and recreational
conscious [Alice and Noel, 2001].
7
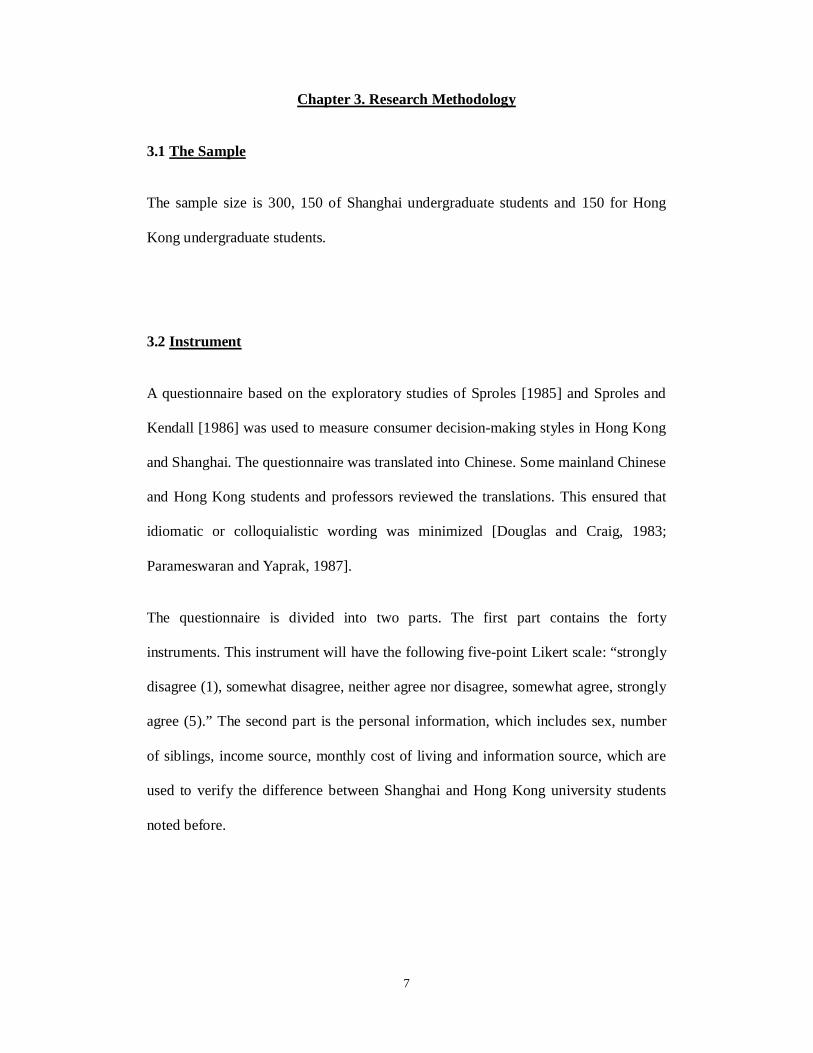
Chapter 3. Research Methodology
3.1 The Sample
The sample size is 300, 150 of Shanghai undergraduate students and 150 for Hong
Kong undergraduate students.
3.2 Instrument
A questionnaire based on the exploratory studies of Sproles [1985] and Sproles and
Kendall [1986] was used to measure consumer decision-making styles in Hong Kong
and Shanghai. The questionnaire was translated into Chinese. Some mainland Chinese
and Hong Kong students and professors reviewed the translations. This ensured that
idiomatic or colloquialistic wording was minimized [Douglas and Craig, 1983;
Parameswaran and Yaprak, 1987].
The questionnaire is divided into two parts. The first part contains the forty
instruments. This instrument will have the following five-point Likert scale: “strongly
disagree (1), somewhat disagree, neither agree nor disagree, somewhat agree, strongly
agree (5).” The second part is the personal information, which includes sex, number
of siblings, income source, monthly cost of living and information source, which are
used to verify the difference between Shanghai and Hong Kong university students
noted before.

8
3.3 Data Collection Method
A non-probability sampling survey method is conducted in the universities in Hong
Kong and Shanghai during March 2005. I did the survey in Hong Kong by myself.
The survey in Shanghai universities were done by my relatives who live in Shanghai,
as it is prohibited for the non-Chinese residents to conduct survey without
authorization by the local government and due to the huge transportation fee occurred.
3.4 Data Analysis Method
SPSS was used to analyze the data collected.
Firstly, frequency was used to display the distribution of consumers’ demographic
background and personal information.
Secondary, CSI for Hong Kong and Shanghai will be developed in two steps
following the method used by Sproles [1985] and Sproles and Kendell [1986].
In the first step, factor analysis, the principal components method with varimax
rotation of factors, was performed to identify characteristics of consumer decision-
making. Factor analysis is designed to identify a set of variables in terms of a smaller
number of hypothetical variables or to explore underlying dimensions [Kim and
Mueller, 1978].
In the second step, Cronbach's alpha, a conservative technique for assessing
reliabilities for each factor [Carmines and Zeller, 1979] was used. For consistency, it
was decided that reliabilities should not be below 0.4, the same level used by Sproles

9
and Kendall [1986].
Thirdly, comparison between Shanghai and Hong Kong was done by comparing the
CSI and by calculating the T-Test (by taking the mean score for each of the factor of
CSI).
The negatively worded items had been reversed before the data analysis proceeded, in
order to analyze the data easily. The scores of question 5, 7, 20, 22, 24, 31, 32 and 40
had been reversed.

10
Chapter 4. Hypothesis Development
We expect that Shanghai and Hong Kong university consumers will differ in terms of
brand consciousness, fashion consciousness, price consciousness and confusion by
overchoice, based on the explanations as follows.
4.1 Differences in Brand Consciousness and Price Consciousness
Since the late 1970s, one-child-per-couple campaign was taken to curtail the
population explosion. As Chinese per capita income has risen and fertility declined,
Chinese parents' love and money have focused on a single child, resulting in unique
social and economic implications such as the perilous 4-2-1 indulgence: four
grandparents and two parents indulging one child. Many of these children are
self-centered and demand material luxuries from their parents [Baker 1987]. While in
Hong Kong, government did not practice “One Child Policy”. Many families had two
to four children in the 1980s [The International Encyclopedia of Sexuality: Hong
Kong].
On the other hand, many Shanghai universities students depend on their parents as
their only income source, parents must pay for what they want. While in Hong Kong,
students have multiple income sources, especially part time jobs, they treasure what
they earn [Francis, 2004].
Based on the above differences, we expect that university consumers in Shanghai are
more brand conscious and less price conscious than Hong Kong university consumers.

11
H1: Shanghai university consumers are more brand consciousness than Hong
Kong university consumers.
H2: Hong Kong university consumers are more price consciousness than
Shanghai university consumers.
4.2 Differences in Fashion Consciousness and Confusion by Overchoice
Hong Kong was a British colony for over 150 years (1842-1997). Citizens were
educated to apprehend Western values. Hong Kong people have long been exposed to,
and fast to learn from, Western culture [Alex, Guijun, Fuan, Nan, 2003]. Nowadays,
Hong Kong people are accustomed to, and want to continue, this lifestyle: Their
aversion to the return of sovereignty to China reflected a fear of lifestyle discontinuity
[Lau and Kuan, 1989]
China adopted an open door policy in 1979; however, the country is not fully open to
Western culture. Nowadays, the Chinese government viewed, and still views, the
inflow of the Western lifestyle as a double-edged sword. Western products improve
people’s material well-being, but at the same time they foster capitalistic consumption
values and Western political ideologies, which corrupt Chinese’s people spiritual life
and threaten communist rule. The Chinese government has launched a number of
movements to counteract the inflow of Western thoughts, including the 1983
Anti-Spiritual Pollution movement and the 1989 Anti-Liberalization of the
Bourgeoisie Class movement [Alex, Guijun, Fuan and Nan, 2003]. The government
also keeps a close eye on electronic media and filters “sensitive” Western materials
such as the websites of CNN, Washington Post, Playboy, and Penthouse [Edupage,

12
1996]. When the movie “Titanic” broke the box-office records across Chinese cities in
1997, Chinese officials expressed their concerned that Western movies could be a
“Trojan horse” aimed at speeding up the American cultural invasion of China [Platt,
1998].
As Hong Kong universities consumers always and easily come into contact with
information than Shanghai, and Hong Kong has a longer history involvement of
Western values, we expect that university consumers in Hong Kong are more fashion
conscious and more confused by overchoice than Shanghai university consumers.
H3: Hong Kong university consumers are more fashion consciousness than
Shanghai university consumers.
H4: Hong Kong university consumers are more confused by over choice than
Shanghai university consumers.

13
Chapter 5. Research Findings and Analysis
5.1 Personal Information of the 300 samples from Shanghai and Hong Kong
5.1.1 Shanghai
Among the 150 university student respondents in Shanghai, 44% (66) were male and
56% (84) were female. Most of the respondents have no sibling (125, 83.3%), few
respondents have two to three siblings (25, 16.7%), while no respondents have more
than three siblings. A majority of them viewed parents as their only income source
(111, 74%), while few of them had multiple income sources (39, 26%). Over one-third
of them paid ¥1001-¥1500 as their cost of living (52, 34.7%); then “¥501-¥
1000” (48, 32%); “≦¥500” (26, 17.3%); and “>¥1501” (24, 16%). Finally,
overwhelming of them viewed television (125, 83.3%), Internet (119, 79.3%),
magazine (113, 75.3%) and family and friends (96, 64%) as their information source.
5.1.2 Hong Kong
Among the 150 university student respondents in Hong Kong, 37.3% (56) were male
and 62.7% (94) were female. Most of the respondents have two (52, 34.7%) or three
(52, 34.7%) siblings. A number of them have three siblings (30, 20%), while only few
respondents have no sibling (16, 10.7%). A majority of them had multiple income
sources (109, 72.7%), while few of them viewed parents as their only income source
(41, 27.3%). Most of them paid $1501-$2000 as their cost of living (45, 30%); then
“≦$1500” (42, 28%); “>$2501” (32, 21.3%); and “$2001-$2500” (31, 20.7%).
Finally, overwhelming of them viewed television (127, 84.7%), family and friends

14
(114, 76%), Internet (103, 68.7%), magazine (102, 68%) and newspaper (96, 64%) as
their information source.
---------------------------------------------------------------------------------------------
Table 1: Personal Information of the 300 samplesfrom Shanghai and Hong Kong (Page 39)
---------------------------------------------------------------------------------------------
5.1.3 Comparison
Comparing the characteristics of the two sets of respondents in Hong Kong and
Shanghai, there were some similarities and differences identified.
Similarities
1. The cost of living in Hong Kong and Shanghai are very similar.
2. The information source in Hong Kong and Shanghai are very similar.
Differences
1. Most of the respondents in Hong Kong had siblings, while most of those in
Shanghai had not.
2. Most of the respondents in Hong Kong had multiple income sources, while most
of them in Shanghai viewed parents as their only income source.

15
5.2 Decision-making styles of Shanghai university consumers
The 40 items of the consumer decision-making scales of Shanghai were subjected to
principal components analysis (PCA) using SPSS. Prior to performing PCA the
suitability of data for factor analysis was assessed. Inspection of the correlation matrix
revealed the presence of many coefficients of 0.3 and above. The Kaiser-Meyer-Oklin
value was 0.608 [Kaiser, 1970, 1974] and the Barlett’s Test of Sphericity [Bartlett,
1954] reached statistical significance, supporting the factorability of the correlation
matrix.
Principal components analysis revealed the presence of 12 components with
eigenvalues exceeding 1, explaining 15.113%, 12.663%, 8.073%, 6.216%, 5.901%,
5.401%, 4.747%, 3.783%, 3.310%, 3.055%, 2.853% and 2.686% of the variance
respectively. An inspection of the screeplot revealed a clear break after the six
components. Using Catell’s [1996] scree test, it was decided to retain six components,
Varimax rotation was performed. The cross-loading items and items that had a factor
loading value less than 0.4 were removed. The rotated solution (presented in
Appendix page 84) revealed the presence of simple structure [Thurstone, 1947], with
all components showing a number of strong loadings, and all variables loading
substantially on only one component. The eight factor solution explained a total of
68.887% of the variance, with the six components contributing 14.194%, 13.467%,
12.586%, 11.910%, 9.709% and 7.021% respectively (more details are presented in
Appendix 10.4.2, page 65).

16
The interpretation of the six components was consistent with previous research on the
CSI, with Novelty-fashion consciousness items loading strongly on Component 1,
Perfectionistic and high-quality consciousness items loading strongly on Component
2, Habitual and brand-loyal consumer orientation items loading strongly on
Component 3, Impulsive and careless consumer orientation items loading strongly
on Component 4, Price consciousness and “value for money” orientation items
loading strongly on Component 5 and Brand consciousness and “price equals
quality” items loading strongly on Component 6. The results of this analysis support
the use of CSI as separate scales.
---------------------------------------------------------------------------------------------
Table 2: Factor Loadings and Construct Reliability of Shanghai CSI (Page 41)
---------------------------------------------------------------------------------------------
5.3 Decision-marking styles of Hong Kong university consumers
The 40 items of the consumer decision-making scales of Hong Kong were subjected
to principal components analysis (PCA) using SPSS. Prior to performing PCA the
suitability of data for factor analysis was assessed. Inspection of the correlation matrix
revealed the presence of many coefficients of 0.3 and above. The Kaiser-Meyer-Oklin
value was 0.649 [Kaiser, 1970, 1974] and the Barlett’s Test of Sphericity [Bartlett,
1954] reached statistical significance, supporting the factorability of the correlation
matrix.
Principal components analysis revealed the presence of 14 components with

17
eigenvalues exceeding 1, explaining 4.902%, 3.565%, 2.931%, 2.367%, 1.967%,
1.568%, 1.491%, 1.332%, 1.281%, 1.241%, 1.141%, 1.130%, 1.064% and 1.015% of
the variance respectively. An inspection of the screeplot revealed a clear break after
the five components. Using Catell’s [1996] scree test, it was decided to retain five
components, Varimax rotation was performed. The cross-loading items and items that
had a factor loading value less than 0.4 were removed. The rotated solution (presented
in Appendix page 107) revealed the presence of simple structure [Thurstone, 1947],
with all components showing a number of strong loadings, and all variables loading
substantially on only one component. The five factor solution explained a total of
53.140% of the variance, with the five components contributing 13.82%, 10.98%,
10.22%, 10.10% and 7.99% respectively.
The interpretation of the five components was consistent with previous research on
the CSI, with Brand consciousness and “price equals quality” items loading strongly
on Component 1, Perfectionistic and high-quality consciousness items loading
strongly on Component 2, Novelty-fashion consciousness items loading strongly on
Component 3, Habitual and brand-loyal consumer orientation items loading
strongly on Component 4 and Price consciousness and “value for money”
orientation items loading strongly on Component 5. The results of this analysis
support the use of CSI as separate scales (more details are presented in Appendix
10.4.4, page 90).
---------------------------------------------------------------------------------------------
Table 3: Factor Loadings and Construct Reliabilityof Hong Kong CSI about here (Page 42)
---------------------------------------------------------------------------------------------

18
5.4 Comparison of decision-making styles between Shanghai and Hong Kong
universities consumers
5.4.1 Number of Dimensions
The identified dimensions of CSI are very similar for university consumers in
Shanghai and Hong Kong. Shanghai has six and Hong Kong has five dimensions.
With the same dimensions: (1) fashion conscious, (2) high-quality conscious, (3)
brand-loyal, (4) price conscious, and (5) brand conscious. The dimension of
“Impulsive and careless” was found only in Shanghai CSI.
There is no cross-loading item between Shanghai and Hong Kong CSI. So, the results
support the use of CSI as separate scales.
“Impulsiveness” is not identified as a dimension of consumer decision-making styles
for the Hong Kong university consumers. The reasons are as follows.
Impulsive shopping is opposite to habitual shopping [Fan and Xiao, 1998], in order to
find out why Shanghai has the dimension of “impulsiveness” while Hong Kong does
not, we take a look into the “habitual” dimension.
---------------------------------------------------------------------------------------------
Table 4: Comparison of “Habitual and brand-loyal consumer”dimension of Shanghai and Hong Kong (Page 43)
---------------------------------------------------------------------------------------------
Question 37 and 39 loaded on both Shanghai and Hong Kong in the “habitual”
dimension. Question 33 “There are so many brands to choose from that often I feel
confused” loaded positively on the “habitual” dimension for the Shanghai sample, but

19
did not load significantly on any factor for the Hong Kong sample. This may be
caused by differences in the interpretation of the question asked in different languages.
However, it is also possible that Shanghai university consumers are loyal to some
brands but at the same time, they are still facing confusion because there are still
many new brands invading into their minds every day. As noted earlier, as more and
more consumer products are becoming available in Shanghai, Shanghai university
students may feel confused and have to “try” these new brands in a certain extent.
While in Hong Kong, many brands are already in the consumers’ minds, they do not
have to “try”, so Hong Kong university consumers are less impulsive.
There is still one reason of why Shanghai has the dimension of “impulsiveness” while
Hong Kong does not. “Impulsive purchases” may be interpreted as “I have not
gathered enough information for this product before I purchase” in Chinese [Fan and
Xiao, 1998]. China has many counterfeit products. How to differentiate and avoid
buying counterfeit products is one of the most salient consumer issues in China. Many
famous brands, both domestic and foreign, are being counterfeited and sold in the
market, and these counterfeit products are usually of poor quality yet have high prices.
Thus, the consequences of buying the wrong products for Chinese consumers may be
different from those for Hong Kong consumers when they make careless purchases.
The careless purchases by Hong Kong consumers may result in a waste of money. For
Chinese consumers, the products bought carelessly may not only be counterfeit and
expensive, but also unable to perform basic functions, and may sometimes be unsafe
and even fatal (examples are some food and electronic products) [Fan and Xiao, 1998].
So, customers in Shanghai may always find themselves impulsive in shopping.

20
5.4.2 Item Loadings
The items loading on each dimension are quite similar, although not exactly the same.
Now, let’s take a look of the dimensions while includes more differentiation between
Shanghai and Hong Kong. They are “brand conscious” and “fashion conscious”.
Firstly, let’s take a look in the “brand conscious” dimension.
---------------------------------------------------------------------------------------------
Table 5: Comparison of “Brand conscious and price equals quality consumer” dimension of Shanghai and Hong Kong (Page 44)
---------------------------------------------------------------------------------------------
Only Question 14 loaded the same in both places, while Question 11, 12, 13 and 35
only loaded on Hong Kong but did not load significantly on any factor for the
Shanghai sample. As suggested by Fan and Xiao [1998], national brands may be
treated as a quality product, and the newly imported brands will be treated as
brand-named product by Chinese consumers. We did not consider this concept when
items were constructed. So, this may be a reason why the items loaded differed from
Shanghai to Hong Kong in the dimension of “brand conscious”.
Secondly, let’s take a look in the “fashion conscious” dimension.
---------------------------------------------------------------------------------------------
Table 6: Comparison of “Novelty and fashion-conscious consumer”dimension of Shanghai and Hong Kong (Page 45)
---------------------------------------------------------------------------------------------

21
Only Question 15 loaded the same in both places, while Question 16 and 21 only
loaded on Shanghai but not on Hong Kong, and Question 18, 20 and 22 loaded on
Hong Kong but not in Shanghai. It seems very different, however, it is not. Items 20,
21 and 22 have loaded on the “recreational and hedonistic conscious” dimension in
Sproles and Kendall’s research [1986]. Sproles and Kendall also found their
fashion-consciousness factor was significantly correlated with recreational
consciousness factor. This correlation is quite intuitive because for most consumers to
be fashion conscious, they have to spend time paying attention to changing fashions
[Fan and Xiao, 1998]. To conclude, although the items loaded in Shanghai are
different from Hong Kong, the nature of the items are similar.
5.4.3 T-test: Test of Hypotheses
Independent-sample t-test was conducted to compare the CSI scores for Shanghai and
Hong Kong university consumers, six t-tests instead of only four mentioned in the
“Hypothesis Development” were performed in order to discover a full picture of
difference. We first look at if there is any difference, then look at the effect size, it
provide an indication of the magnitude of the differences between groups. The
guidelines [Cohen, 1988] for interpreting these values are: 0.01 =small effect, 0.06
=moderate effect, 0.14 =large effect.
---------------------------------------------------------------------------------------------
Table 7: Comparison of decision-making styles betweenShanghai and Hong Kong universities consumers (Page 46)
---------------------------------------------------------------------------------------------

22
T-Test 1: Brand conscious and price equals quality consumer
There was significant difference in scores for Shanghai (M =2.3933, SD =0.75881)
and Hong Kong (M =2.8813, SD =0.63799; t(289.46) =-6.029, p =0.00) university
consumers. The magnitude of the differences in the means was large (eta squared
=0.11).
Hong Kong university consumers are more brand conscious than Shanghai. It is
different from what we expected (H1: Shanghai university consumers are more
brand consciousness than Hong Kong university consumers). One possible reason is
the different exposure to brand names. As noted before, Hong Kong is more open to
foreign cultures and brands. The more brands they know the more chance they would
become brand conscious. Furthermore, although the Shanghai university consumers
are indulged by their parents, it is not necessary that they will become brand
conscious.
T-Test 2: Perfectionistic and high-quality conscious consumer
There was significant difference in scores for Shanghai (M =4.2222, SD =0.67739)
and Hong Kong (M =3.7973, SD =0.49480; t(272.76) =6.203, p =0.00) university
consumers. The magnitude of the differences in the means was large (eta squared
=0.11).
Shanghai university consumers are more quality conscious than Hong Kong. We did
not expect this. But this is consistent to the result that Shanghai university consumers
are not as brand conscious as Hong Kong. When you are quality conscious, you

23
would not consider too much about brands. In addition, according to Oliver [1994],
consumers in China always focus on durability when shopping, so Shanghai
university consumers focus on quality in their shopping.
T-Test 3: Novelty and fashion-conscious consumer
There was significant difference in scores for Shanghai (M =3.0156, SD =0.89521)
and Hong Kong (M =3.4333, SD =0.65517; t(273.03) =-4.612, p =0.00) university
consumers. The magnitude of the differences in the means was moderate (eta squared
=0.07).
Hong Kong university consumers are more fashion conscious than the Shanghai. This
result is the same as we expected (H3: Hong Kong university consumers are more
fashion consciousness than Shanghai university consumers).
T-Test 4: Habitual and brand-loyal consumer
There was no significant difference in scores for Shanghai (M =2.9222, SD =0.82143)
and Hong Kong (M =3.0422, SD =0.78890; t(298) =-1.290, p =0.198) university
consumers. The magnitude of the differences in the means was small (eta squared
=0.01).
This result is the same as we expected. According to the mean, we can see that both
places are not very focus on brand-loyalty.

24
T-Test 5: Price conscious and value for money consumer
There was no significant difference in scores for Shanghai (M =3.6000, SD =0.81306)
and Hong Kong (M =3.5689, SD =0.71476; t(298) =-1.290, p =0.725) university
consumers. The magnitude of the differences in the means was small (eta squared
=0.00).
We expect that Hong Kong university consumers are more price consciousness than
Shanghai university consumers (H2), but this is not the case, there are no differences
between them, and both of them are quite price conscious. According to Oliver [1994],
consumers in China are still encouraging frugality, many of them still have the mind
that “To practice thrift is a virtue” (節儉是美德). This may be one of the reasons that
Shanghai university consumers are as price conscious as the Hong Kong students.
T-Test 6: Impulsive and careless consumer
There was significant difference in scores for Shanghai (M =2.6778, SD =0.53431)
and Hong Kong (M =0, SD =0; t(149.00) =61.380, p =0.00) university consumers.
The magnitude of the differences in the means was very large (eta squared =0.93).
Shanghai university consumers are more impulsive than the Hong Kong. We did not
expect this. The same as the result of the above factor analysis, we have found that the
“impulsive” dimension appear in the Shanghai sample but not in Hong Kong. The
main reasons are noted above in the part of 5.4.1.

25
We also expect that Hong Kong university consumers are more confused by over
choice than Shanghai university consumers (H4), however, from the result of factor
analysis, the “confused” dimension is even not appear in both places. It shows that
university consumers in Shanghai and Hong Kong can take advantage of the available
information and make better choices [Fan and Xiao, 1998]. It may be because both of
them are highly educated and have certain judgment of the markets, so they can utilize
the information, regardless of the information received.

26
Chapter 6. Business Implications
6.1 For Shanghai
Shanghai university consumers are perfectionistic and impulsive. They always make
special effort to obtain the best quality and perfect choice; however, there are too
many counterfeit products that make them feel regretted after the purchase. Marketers
should stress on improving the overall attributes of the products so that the quality of
product could match the requirement of consumers. Overall quality of product can be
divided into two items: extrinsic and intrinsic [Olson and Jacoby, 1972; Jonansson,
1989; Gabbot, 1991]. Extrinsic attributes refer to the brand, country of origin,
advertising, independent consumer, price, after sell services, and distribution channel.
Intrinsic attributes refer to physical product attributes such as shape, type of surface,
color, weight, material used, taste and performance. Using “good quality” as an
outstanding and clear image would catch the attention of the consumers. Better
customer services should also be provided. As the consumers are still in the stage of
impulsive purchasing, they are still trying each product, offering them a good product
and service can keep them as long term customers.

27
6.2 For Hong Kong
Hong Kong university consumers are brand and fashion conscious. Therefore,
companies should try to do deep marketing researches to and build their brand once
they enter Hong Kong market. In addition, the content and style of marketing and
promotion programs should be fun, trendy and fashionable.
6.3 For both Shanghai and Hong Kong
Both Shanghai and Hong Kong university students are price conscious. Marketers
should promote their products by offering benefits to consumers, in order to make
them feel that their purchases are “value for money”.

28
Chapter 7. Limitations
There are several limitations that warrant future research.
7.1 Generality of Consumer Characteristics
Consumers have different perceptions on different types of products. For example,
their value for a luxury and durable product, which is totally different from an inferior
and non-durable product [Kaynak,E. & Cavusgil, S.T., 1983]. We cannot assume that
a consumer with high brand consciousness would consider “name” products on every
decision. Other characteristics may lack perfect generality as well [Sproles and
Kendall, 1986]. Indeed, a consumer may have different consumer styles for each
product category. Therefore, future research should look at consumer decision-making
in various product categories for details.
7.2 Limitation of the Sample
The sample may not represent the true population we want to obtain. Hong Kong
(Shanghai) university students may not be real Hong Kong (Shanghai) university
students, some of them maybe the exchange students who live here for only a short
period and may leave very soon. So, their answer may not represent the true
population.
Last but not least, due to time and coast constraints, the sample size was limited to
150 for each place. This small sample size may not completely representative of all

29
university consumers in Shanghai and Hong Kong.
7.3 Limitation of Culture and Economic Background
The Shanghai and Hong Kong student sample may not exhibit certain consumer
decision-making characteristics due to the cultural reasons, for example the Man-to
nature orientation, Man-to-himself orientation, Relational orientation, Time
orientation and Personal-activity orientation [Oliver, 1994]. And the economic
reasons, for example, the income of the families, should also be take into account also.
However, the CSI used in this study provides a good starting point for further
development of the CSI inventory in Shanghai and Hog Kong consumer context.
More items and dimensions that are idiosyncratic to Shanghai and Hong Kong culture
need to be developed in future studies. It would be helpful to develop more items to
improve the psychometric properties of three dimensions; they are quality and price
conscious.

30
Chapter 8. Conclusion
The objectives of this study were fulfilled. Decision-making styles of university
consumers in Shanghai and Hong Kong are classified, and several similarities and
differences in decision-making styles were identified. The most important findings are
that Shanghai university consumers are perfectionistic and impulsive, whereas Hong
Kong university consumers are brand conscious and fashion conscious, and they both
have the characteristic of price conscious. This paper provides a good starting point
for marketers who want to enter Shanghai or Hong Kong market. Marketers should
pay more attention in these aspects as to win consumers’ hearts. They should also take
into account of the culture issues that do not cover in this paper.

31
Chapter 9. References
Journals
1. Alex S. L. Tsang, Guijun Zhuang, Fuan Li, Nan Zhou (2003), “A Comparison of
Shopping Behavior in Xi’an and Hong Kong Malls: Utilitarian versus
Non-Utilitarian Shoppers”, Journal of International Cousumer Marketing, Vol.
16(1) 2003
2. Alice S.Y.HIU, Noel Y.M. Siu and Charlie C. L. Wang, and Ludwig, M.K. Chang,
(2001) “An Investigation of Decision-Making Styles of Consumers in China”, The
Journal of Consumer Affairs: (Winter); 35,2; 326-345
3. Baker, Rod. (1987). "Little Emperors' born of a one-child policy." Far Eastern
Economic Review, 137 (July 16): 43-44
4. Bartlett M. S. (1954) A note on the multiplying Faciors for various chi square
approximations. Journal of the Royal Statistical Society, 16(Series B), 296-298
5. Bellenger, Danny N. and Pradeep K. Korgaonkar.(1980). “Profiling Recreational
Shopper”. Journal of Retailing 56 (fall) 77-91
6. Bettman, Jams R. (1979), “An Information Processing Theory of Consumer
Choice, Reading”, MA: Addison-Wesley Publishing Company
7. Carmins, Edward G. and Richard A. Zeller (1979), Realiablility and Validity
Assessment, Beverly Hills, CA:Stage Publications.
8. Catell’s, R.B. (1996) The scree test for number of factors. Multivariate Behavioral
Research, 1245-276
9. Darden, William R. and Dub Ashton. (1974-75) “Psychographic Profiles of
Patronage Preference Groups”, Journal of Retailing, 50(Winter): 99-112
10. Douglas,Susan and C. Sammel craig.(1983). International Marketing Research,
Englewood Cliffs. NJ Prentice-Hall, Inc.
11. Durvasula. Sribivas. Steven Lysonski, and J. Craig Andrews. (1993). Corss culture
generlizability of a Scale for Profiling Consumers’ Decision making Styles. The
Journal pf Consumer Affairs, 27,1:55-65
12. Fan, Jessie X. and Jing J. Xiao. (1998). “Consumer Decision-making Styles of
Young-adult Chinese.” The Journal of Consumer Affairs, 32:275-294
13. Francis Wing-lin Lee (2004), Life values of young people: a comparative study
between Hong Kong and Shanghai [Hong Kong], Dept. of Social Work and

32
Social Administration, University of Hong Kong.
14. Gabbot, Mark (1991), “The Role of Product Cues in Assessing Zrisk in
Secondhand Markets,” European Journal of Marketing, 25,9, 38-50
15. Gehrt, Kenneth C. and Kent Carter. (1992). “An Explortory Assessment Catalog
Shopping Orientations”. Journal of Direct Marketing, 6:29-39
16. Hafstrom, Jeanne L., Chae, Jung Sook, Chung, Young Sook. (1992), “Consumer
Decision-Making Styles: Comparsion Between United States and Korean Young
Consumers”, The Journal of Consumer Affairs. Madison: 26, Iss 1, (Summer);
P146-159
17. Hong Kong Trade Development Council (2001), The two cities: Shanghai, Hong
Kong / Research Department, Hong Kong: The Council.
18. Jacoby, Jacob and Robert W. Chestnut. (1978) “Brand Loyalty: Measurement and
Management”, New York: John Wiley and Sons.
19. Johansson, Johny K. (1989), “Determinants andEfects of the Use of “Made in
Labels”, International Marketing Review, 6,1, pp 47-58
20. Kaiser (1970), A second generation Little Jiffy. Psychometrika, 35, 401-415
21. Kaynak,E. & Cavusgil, S.T. (1983).“Consumer attitudes towards products of
foreign origin: do they vary across product classes?” International Journal of
Advertising, 2, pp.147-157
22. Kim, Jae-On and Charles W.Mueller (1978), “Introduction to Factor Analysis:
What it is and How to Do it, Bevely Hills”, CA: Sage Publications.
23. Korgaonkar, Pradeep K. (1984). “Consumer Shopping Orientations, Non-store
Retailers, and Consumers’ Patronage Intentions: A Multivariate
Investigation”.Journal of the Academy of Marketing Science, 12:11-22
24. Lau, A and Kuan, H. (1989) The Ethos of the Hong Kong Chinese. Hong Kong:
The Chinese University Press, P.19
25. Lumpkin, James R. (1985) “Shopping Orientation Segmentation of the Elderly
Consumer”, Journal of Academic of Marketing Science, 13:271-289
26. Lysonski, Steven, Srini Durvasula, and Yiorgos Zotos. (1996). “Consumer
Decision-making Styles: A Multi-country Investigation”. European Journal of
Marketing, 30,12:10-21
27. Maynes,E. Scott (1976), “Decision-making for Consumers: An Introduction to
Consumer Economics”, New York: Macmillan.
28. Miller, Roger LeRoy (1981) Economic Issuse for Consumers, Third Edition, and

33
New York: West Publishing Company.
29. Moschis, George P. (1976), “Shopping orientations and Consumer Uses of
Information”. Journal of Retailing, 52(Summer): 61-70,93
30. Moschis, George P. (1976), “Shopping orientations and Consumer Uses of
Information”. Journal of Retailing, 52(Summer): 61-70,93
31. Moschis, George P. and Roy L, Moore (1979), “Decision making amoung the
Youth: A Socialization perspective,” Journal of Consumer Research, 6(setember):
101-102
32. Oliver H. M. Yau (1994) Consumer Behaviour in China Customer satisfaction and
cultural valves Routledge Lodon and New York
33. Olson, Jerry C. and Jacob Jacoby: (1972), “ Cue Utilization in the Quality
Perception Processes, in M. Venkatesan (ed), The Journal of Consumer Affairs:
(Winter); 12,2; pp.167-179
34. Parameswaran, Ravi and Attila Yaprak (1987), “A Cross-National Comparison of
Consumer Research Measures,” Journal of International Business Studies, 18
(Spring): 35-49.
35. Shanghai Statistical Yearbook, (2004)
36. Shim, Soyeon and Kenneth C. Gehrt. (1996), “Hispanic and American
Adolescents: An Exploratory Study of Their Approach to Shopping”, Journal of
Retailing, 72,3:307-324
37. Sproles, George B (1985), From Perfectionism to Fadism: Measuring Consumers’
Decision Making styles,” Proceedings, American Council on Consumer interests:
79-85
38. Sproles, George B. (1979), Fasion: Consumer Behaviour Toward Dress,
Minneapolis: Burgess Publishing Company
39. Sproles, George B. and Elizabeth L. Kendall (1986), “A Methodology for
Profiling Consumers’ Decision-Making Styles,” The Journal of Consumer Affairs.
20(Winter): 267-279
40. Srinivas Durvasula, Steven Lysonski, and J. Craig Andrews (1993), “Cross-
Cultural Generalizability of a Scale for Profiling Counsumers’ Decision-Making
Styles,” The Journal of Consumer Affairs, 27 (Summer): P.55-65
41. Stephenson, R.P. and R.P. Willett. (1969), “Analysis of Consumers’ Retail
Patronage Strategies. In Marketing Involvement in Society and The Economy”,
edited by P.R. Mcdonald, Chicage: American MarketingAssociation, 316-322

34
42. Stone, Gregory. P. (1954) “City Shoppers and Urban Identification: Obervations
on the Social Psychology of City Life.”, American Jounral of Sociology, 60:36-45
43. Thorelli, Hans B., Helmut Becker, and Jack Engeldow (1975), “The In formation
Seekers; An International Study of Consumer Information and Advertising Image”,
Cambridgek,MA: Ballinger.
44. Thorelli, Hans B., Helmut Becker, and Jack Engeldow (1975), “The In formation
Seekers; An International Study of Consumer Information and Advertising Image”,
Cambridgek,MA: Ballinger.
45. Thurstone, L. L. (1947) Multiple factor analysis. Chicago: University of Chicago
Press.
46. Turk James L. and Norman W. Bell, (1972) “measuring Power in the Family,”
Journal of Marriage and the Family, 34(May): 215-222
47. Ward, Scott (1974) “ Journal of Consumer Research, 1(September): 1-14
48. Westbrook, Robert A. and William C. Black (1985), “A Motivation-Based
Shopper Typology,” The Journal of Retailing, 61(Spring): 78-103
49. Williams, Robert H., Jon J. Painter, and Herbert R. Nicholas (1978), “A
Policyoriented Typology of Grocery Shoppers”, Jounral of Retailing, 54 (Spring):
27-34.
Websites
1. Platt, K (1998). “Titanic” Cultural Invasion Hits China. The Christian Science
Monitor.
http://www.csmnitor.com/durable/1998/04/20/pls3.htm (April20)
2. The International Encyclopedia of Sexuality: Hong Kong,
http://www2.hu-berlin.de/sexology/IES/hongkong.html
3. Edupage. (1996). China Screens Out “Spiritual Pollution” on Net. WWW URT:
http://www.edupage.edu/pub/ edupage/archives/96/ edupage-0905.htm
(September 5)
4. Hong Kong Census and Statistics Department, 2004
http://www.info.gov.hk/censtatd/home.html

35
Chapter 10. Appendix
Appendix Page
10.1Explanation of the eight factors loading by Sproles and Kendall 36
10.2Tables 38
10.3Questionnaires 47
10.4SPSS Outputs 58

36
10.1 Explanation of the eight factors loading by Sproles and Kendall
Factor 1: Perfectionistic and high-quality consciousness
Items loading on this factor measure a consumer’s search for the best quality in
products. Those consumers who have higher perfectionism could also be expected to
shop more carefully and systematically. They are not satisfied with the “good enough”
product.
Factor 2: Brand consciousness and “price equals quality”
It measures consumers’ orientations toward buying the more expensive, well-known
national brands. High scorers are likely to believe that a higher price means better
quality. They appear to have positive attitudes toward department and specialty stores,
where brand names and higher prices are prevalent. They also appear to prefer best
selling, advertised brands.
Factor 3: Novelty-fashion consciousness
High scorers on this characteristic are fashion conscious and apparently novelty
conscious as well. They are likely to gain excitement and pleasure from seeking out
new things. They keep up-to-date with styles, and being in trendy is important to them.
Variety-seeking also appears to be an important aspect of this characteristic.
Factor 4: Recreational and hedonistic shopping consciousness
Those scoring high on it find shopping pleasant. They shop just for fun of it. In
previous research, this was a “shopping avoider” or time-saver factor, and thus several
37
items load negatively on it. However, the loadings show that this factor measures
shopping for recreation and entertainment.
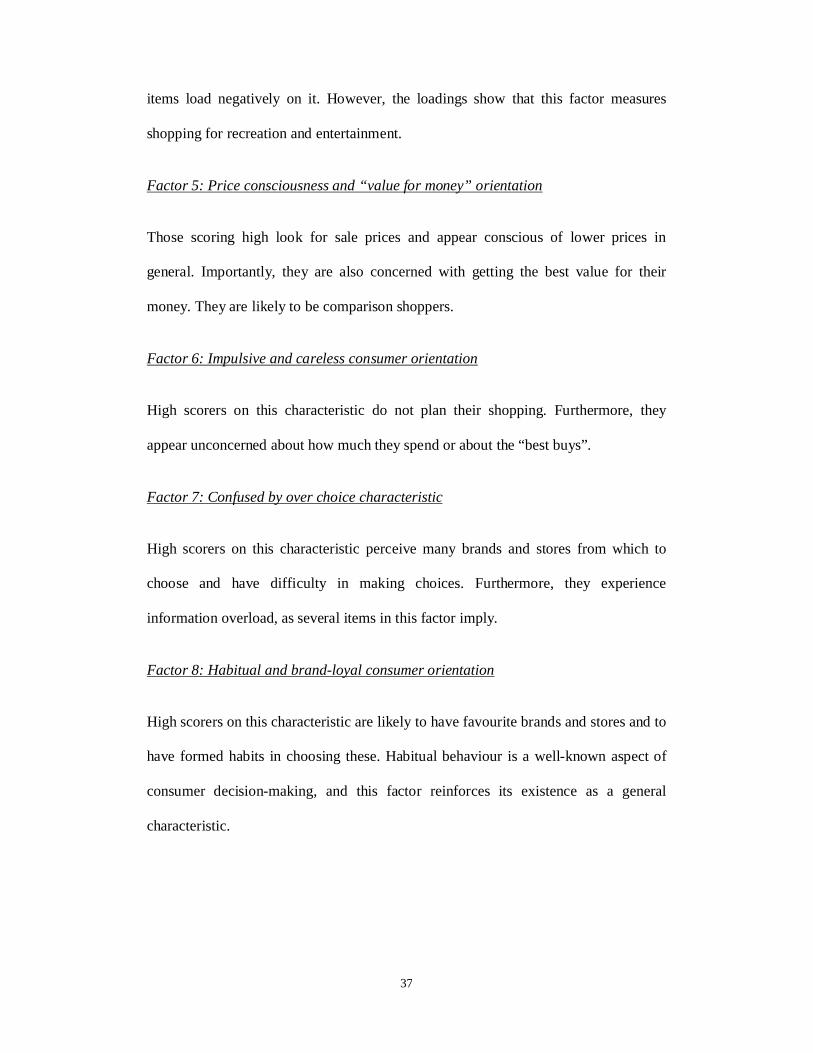
Factor 5: Price consciousness and “value for money” orientation
Those scoring high look for sale prices and appear conscious of lower prices in
general. Importantly, they are also concerned with getting the best value for their
money. They are likely to be comparison shoppers.
Factor 6: Impulsive and careless consumer orientation
High scorers on this characteristic do not plan their shopping. Furthermore, they
appear unconcerned about how much they spend or about the “best buys”.
Factor 7: Confused by over choice characteristic
High scorers on this characteristic perceive many brands and stores from which to
choose and have difficulty in making choices. Furthermore, they experience
information overload, as several items in this factor imply.
Factor 8: Habitual and brand-loyal consumer orientation
High scorers on this characteristic are likely to have favourite brands and stores and to
have formed habits in choosing these. Habitual behaviour is a well-known aspect of
consumer decision-making, and this factor reinforces its existence as a general
characteristic.

38
10.2 Tables
Table Page
Table 1Personal Information of the 300 samples from Shanghai and Hong Kong 39
Table 2Factor Loadings and Construct Reliability of Shanghai CSI 41
Table 3Factor Loadings and Construct Reliability of Hong Kong CSI 42
Table 4Comparison of “Habitual and brand-loyal consumer” dimensionof Shanghai and Hong Kong
43
Table 5Comparison of “Brand conscious and price equals quality consumer” dimensionof Shanghai and Hong Kong
44
Table 6Comparison of “Novelty and fashion-conscious consumer” dimensionof Shanghai and Hong Kong
45
Table 7Comparison of decision-making styles between Shanghai and Hong Kong universities consumers
46

39
Table 1Personal Information of the 300 samples from Shanghai and Hong Kong
Shanghai Hong Kong
Frequency
Percentage
Frequency
Percentage
Male 66 44.0 56 37.3Female 84 56.0 94 62.7
Gender
Total 150 100.0 150 100.01 125 83.3 16 10.72 13 8.7 52 34.73 12 8.0 52 34.7More than 3 0 0 30 20.0
NumberofBlood Siblings
Total 150 100.0 150 100.0Parents 111 74.0 41 27.3Scholarship/Grant/Loan 8 5.3 6 4.0Part-time 3 2.0 30 20.0Partly Parents, partly Part-time
15 10.0 41 27.3
Partly Parents, partly Scholarship/Grant/Loan
7 4.7 9 6.0
Partly Scholarship/Grant/Loan, partly Part-time
3 2.0 13 8.7
Partly Parents, Scholarship/Grant/Loan, and Part-time
3 2.0 10 6.7
Income Source
Total 150 100.0 150 100.0

40
¥500 26 17.3
$1500 42 28.0¥501-¥1000 48 32.0$1501-$2000 45 30.0
¥1001-¥1500 52 34.7
$2001-$2500 31 20.7>¥1501 24 16.0
>$2501 32 21.3
CostofLiving
Total 150 100.0 150 100.0Television 125 83.3 127 84.7Radio 26 17.3 44 29.3Newspaper 86 57.3 96 64Magazine 113 75.3 102 68Internet 119 79.3 103 68.7Transportation Advertisement
65 43.3 64 42.7
Exhibition 26 17.3 20 13.3Family and friends 96 64 114 76Others 0 0 9 6
Inform-ationSource
Total 656 437.1 679 452.7

41
Table 2Factor Loadings and Construct Reliability of Shanghai CSI
Shanghai CSI Construct Reliability
Factor Loading
Novelty and fashion-conscious consumer 0.7647shcsi15 I usually have one or more outfits of the very newest style. .848shcsi16 I keep my wardrobe up-to-date with the changing fashions. .884shcsi21 Going shopping is one of the enjoyable activities of my life. .702Perfectionistic and high-quality conscious consumer 0.7283shcsi01 Getting very good quality is very important to me. .893shcsi02 When it comes to purchasing products, I try to get the very best or perfect choice.
.690
shcsi04 I make special effort to choose the very best quality products. .799Habitual and brand-loyal consumer 0.6791shcsi33 There are so many brands to choose from that often I feel confused. .774shcsi37 I have favorite brands I buy over and over. .708shcsi39 I go to the same stores each time I shop. .831Impulsive and careless consumer 0.6189shcsi30 Often I make careless purchases I later wish I had not. .640shcsi31 I take the time to shop carefully for best buys. .802*shcsi32 I carefully watch how much I spend. .640*Price conscious and value for money consumer 0.4742shcsi05 I really don’t give my purchases much thought or care. .803shcsi07 I shop quickly, buying the first product or brand I find that seems good enough.
.763*
Brand conscious and price equals quality consumer -shcsi14 The most advertised brands are usually very good choices. .93
*Scores had been reversed

42
Table 3Factor Loadings and Construct Reliability of Hong Kong CSI
Hong Kong CSI Construct Reliability
Factor Loading
Brand conscious and price equals quality consumer 0.7501hkcsi11 The higher the price of a product, the better its quality. .666hkcsi12 Nice department and specialty stores offer me the best products. .734hkcsi13 I prefer buying the best-selling brands. .786hkcsi14 The most advertised brands are usually very good choices. .764hkcsi35 The more I learn about products, the harder it seems to choose the best.
.53
Perfectionistic and high-quality conscious consumer 0.6006hkcsi01 Getting very good quality is very important to me. .582hkcsi02 When it comes to purchasing products, I try to get the very best or perfect choice.
.692
hkcsi03 In general, I usually try to buy the best overall quality. .582hkcsi04 I make special effort to choose the very best quality products. .573hkcsi08 A product doesn’t have to be perfect, or the best, to satisfy me. .50Novelty and fashion-conscious consumer 0.6491hkcsi15 I usually have one or more outfits of the very newest style. .675hkcsi18 To get variety, I shop different stores and choose different brands. .553hkcsi20 Shopping is not a pleasant activity to me. .786*hkcsi22 Shopping other stores wastes my time. .729*Habitual and brand-loyal consumer 0.7339hkcsi37 I have favorite brands I buy over and over. .797hkcsi38 Once I find a product or brand I like, I stick with it. .827hkcsi39 I go to the same stores each time I shop. .752Price conscious and value for money consumer 0.5055hkcsi05 I really don’t give my purchases much thought or care. .706*hkcsi07 I shop quickly, buying the first product or brand I find that seems good enough.
.770
hkcsi25 I buy as much as possible at sale price. .59
* Scores had been reversed

43
Table 4Comparison of “Habitual and brand-loyal consumer” dimension of Shanghai and Hong Kong
Habitual and brand-loyal consumerShanghai Hong Kongshcsi33There are so many brands to choose from that often I feel confused.
shcsi37 + hkcsi37I have favorite brands I buy over and over.
shcsi39 + hkcsi39I go to the same stores each time I shop.
hkcsi38Once I find a product or brand I like, I stick with it.

44
Table 5Comparison of “Brand conscious and price equals quality consumer” dimension of Shanghai and Hong Kong
Brand conscious and price equals quality consumerShanghai Hong Kong
hkcsi11The higher the price of a product, the better its quality.hkcsi12Nice department and specialty stores offer me the best products.hkcsi13I prefer buying the best-selling brands.
shcsi14 + hkcsi14The most advertised brands are usually very good choices.
hkcsi35The more I learn about products, the harder it seems to choose the best.

45
Table 6Comparison of “Novelty and fashion-conscious consumer” dimension of Shanghai and Hong Kong
Novelty and fashion-conscious consumerShanghai Hong Kong
shcsi15 + hkcsi15I usually have one or more outfits of the very newest style.
shcsi16I keep my wardrobe up-to-date with the changing fashions.
hkcsi18To get variety, I shop different stores and choose different brands.hkcsi20Shopping is not a pleasant activity to me.
shcsi21Going shopping is one of the enjoyable activities of my life.
hkcsi22Shopping other stores wastes my time.

46
Table 7Comparison of decision-making styles between Shanghai and Hong Kong universities consumers
Mean Std. Deviation
Sig. (2-tailed)
Significance Difference?
eta squared
Effect size
T-Test 1: Brand conscious and price equals quality consumerSH 2.3933 .75881HK 2.8813 .63799
0.00 0.11 Large
T-Test 2: Perfectionistic and high-quality conscious consumerSH 4.2222 .67739HK 3.7973 .49480
0.00 0.11 Large
T-Test 3: Novelty and fashion-conscious consumerSH 3.0156 .89521HK 3.4333 .65517
0.00 0.07 Moderate
T-Test 4: Habitual and brand-loyal consumerSH 2.9222 .82143HK 3.0422 .78890
0.198 0.01 Small
T-Test 5: Price conscious and value for money consumerSH 3.6000 .81306HK 3.5689 .71476
0.725 0.00 Small
T-Test 6: Impulsive and careless consumerSH 2.6778 .53431HK .0000 .00000
0.00 0.93 Very large

47
10.3 Questionnaires
Questionnaires Page
Shanghai Version 48
Hong Kong Version 53

48
编号︰________
上海大学生购物决定的问卷调查
你好!本人为香港浸会大学学生,现正进行一项有关于上海大学生购物决定的问
卷调查。这份问卷调查只需约数分钟便可完成,搜集的资料只供学术研究分析。
多谢你的合作!
你是大学生吗?
是:请看甲部。
否:问卷已完成,谢谢!
<甲部>
首先,我们想知道你一般购物时考虑的因素。若你非常同意该句子,请选择「5」,若你非常不同意该句子,请选择「1」。如此类推。
1. 好质量的货物对于我来说是相当重要的。
非常不同意 1 2 3 4 5 非常同意
2. 每次购物,我要得到最好/完美的选择。
非常不同意 1 2 3 4 5 非常同意
3. 通常而言,我会购买那些质素最好的货物。
非常不同意 1 2 3 4 5 非常同意
4. 我尽量会选择最好质素的货物。
非常不同意 1 2 3 4 5 非常同意
5. 每次购物,我都不会特别留意和思索。
非常不同意 1 2 3 4 5 非常同意
6. 我对货物的期望和标准是相当高。
非常不同意 1 2 3 4 5 非常同意

49
7. 我的购物过程很快,购买第一次接触的货物和品牌不需经过太多考虑。
非常不同意 1 2 3 4 5 非常同意
8. 一件不完美/不是最好的货物是不能满足我的要求。
非常不同意 1 2 3 4 5 非常同意
9. 全球最知名品牌的货品对我来说是最好的。
非常不同意 1 2 3 4 5 非常同意
10. 越贵的货物我越会选择。
非常不同意 1 2 3 4 5 非常同意
11. 货物的价钱越高,质量越好。
非常不同意 1 2 3 4 5 非常同意
12. 出色/好的连锁店能为我提供最好的货物。
非常不同意 1 2 3 4 5 非常同意
13. 我较为喜欢购买最好销量的货物。
非常不同意 1 2 3 4 5 非常同意
14. 广告越多的货物通常是最好的。
非常不同意 1 2 3 4 5 非常同意
15. 我通常拥有多过一件最时款的服装。
非常不同意 1 2 3 4 5 非常同意
16. 我会转换时装,令到我衣柜里的衣服追上潮流。
非常不同意 1 2 3 4 5 非常同意
17. 时髦的/吸引人的款式对我来说是非常重要的。
非常不同意 1 2 3 4 5 非常同意

50
18. 逛不同店铺和选择不同品牌能令我得到更多种类的选择。
非常不同意 1 2 3 4 5 非常同意
19. 购买新奇和特别的货物是有趣的。
非常不同意 1 2 3 4 5 非常同意
20. 购物对我来说不是愉快的活动。
非常不同意 1 2 3 4 5 非常同意
21. 逛街购物是我生活其中一个最享受的节目。
非常不同意 1 2 3 4 5 非常同意
22. 到不同地方购物很浪费我的时间。
非常不同意 1 2 3 4 5 非常同意
23. 我喜欢购物只因为它是有趣的。
非常不同意 1 2 3 4 5 非常同意
24. 我很快完成我每次购物的旅程。
非常不同意 1 2 3 4 5 非常同意
25. 我尽量在减价时购物。
非常不同意 1 2 3 4 5 非常同意
26. 越平价的货物我越会选择。
非常不同意 1 2 3 4 5 非常同意
27. 我小心地花钱,并且花得最有价值。
非常不同意 1 2 3 4 5 非常同意
28. 我应该更好地计划我的购物情况。
非常不同意 1 2 3 4 5 非常同意

51
29. 我在购物时显得冲动。
非常不同意 1 2 3 4 5 非常同意
30. 我经常乱购物而且感到后悔。
非常不同意 1 2 3 4 5 非常同意
31. 我会花时间来选购最好的货物。
非常不同意 1 2 3 4 5 非常同意
32. 我会好好计划花多少金钱于购物上。
非常不同意 1 2 3 4 5 非常同意
33. 我会为很多品牌而感到困惑。
非常不同意 1 2 3 4 5 非常同意
34. 有时我会很难决定到那些商店购物。
非常不同意 1 2 3 4 5 非常同意
35. 对所有的货物认识越深,我越难从中选择最好的。
非常不同意 1 2 3 4 5 非常同意
36. 取得多种货物的信息会令我更困惑。
非常不同意 1 2 3 4 5 非常同意
37. 我有一个固定而喜欢的品牌,并且买了很长时间。
非常不同意 1 2 3 4 5 非常同意
38. 如果发现一个十分喜欢的品牌和货物,我会忠于它。
非常不同意 1 2 3 4 5 非常同意
39. 每次我都会到同一商店购物。
非常不同意 1 2 3 4 5 非常同意

52
40. 我定期转换货物的品牌。
非常不同意 1 2 3 4 5 非常同意
<乙部> 最后,我们想知道你一些简单的个人资料,搜集的资料只供学术研究分析,内容绝对保密。
性别
1. 男
2. 女
家庭(亲)兄弟姊妹数目 (包括你自己)1. 12. 23. 34. 多于 3
生活费来源
1. 父母
2. 奖学金/助学金/贷款3. 本人兼职
4. 部分由父母提供,部分靠本人兼职
5. 部分由父母提供,部分依赖奖学金/助学金/贷款6. 部分依赖奖学金/助学金/贷款,部分靠本人兼职7. 部分由父母提供,部分依赖奖学金/助学金/贷款,部分靠本人兼职
每月生活费(人民币)数额 (包括食宿交通及零用钱,但不包括学费)1. 500或以下2. 501 – 10003. 1001 – 15004. 1501或以上
接收信息的主要来源 (可选多项)1. 电视
2. 电台
3. 报章
4. 杂志
5. 互联网
6. 车厢/地铁广告7. 展览
8. 家人朋友
9. 其它 (请注明) _____________________________
问卷已经完结,谢谢你热心的合作!

53
編號︰________
香港大學生購物決定的問卷調查
你好!本人為香港浸會大學學生,現正進行一項有關於香港大學生購物決定的問
卷調查。這份問卷調查只需約數分鐘便可完成,搜集的資料只供學術研究分析。
多謝你的合作!
你是大學生嗎?
是:請看甲部。
否:問卷已完成,謝謝!
<甲部>
首先,我們想知道你一般購物時考慮的因素。若你非常同意該句子,請選擇「5」,若你非常不同意該句子,請選擇「1」。如此類推。
1. 好質量的貨物對於我來說是相當重要的。
非常不同意 1 2 3 4 5 非常同意
2. 每次購物,我要得到最好/完美的選擇。
非常不同意 1 2 3 4 5 非常同意
3. 通常而言,我會購買那些質素最好的貨物。
非常不同意 1 2 3 4 5 非常同意
4. 我盡量會選擇最好質素的貨物。
非常不同意 1 2 3 4 5 非常同意
5. 每次購物,我都不會特別留意和思索。
非常不同意 1 2 3 4 5 非常同意
6. 我對貨物的期望和標準是相當高。
非常不同意 1 2 3 4 5 非常同意

54
7. 我的購物過程很快,購買第一次接觸的貨物和品牌不需經過太多考慮。
非常不同意 1 2 3 4 5 非常同意
8. 一件不完美/不是最好的貨物是不能滿足我的要求。
非常不同意 1 2 3 4 5 非常同意
9. 全球最知名品牌的貨品對我來說是最好的。
非常不同意 1 2 3 4 5 非常同意
10. 越貴的貨物我越會選擇。
非常不同意 1 2 3 4 5 非常同意
11. 貨物的價錢越高,質量越好。
非常不同意 1 2 3 4 5 非常同意
12. 出色/好的連鎖店能為我提供最好的貨物。
非常不同意 1 2 3 4 5 非常同意
13. 我較為喜歡購買最好銷量的貨物。
非常不同意 1 2 3 4 5 非常同意
14. 廣告越多的貨物通常是最好的。
非常不同意 1 2 3 4 5 非常同意
15. 我通常擁有多過一件最時款的服裝。
非常不同意 1 2 3 4 5 非常同意
16. 我會轉換時裝,令到我衣櫃裏的衣服追上潮流。
非常不同意 1 2 3 4 5 非常同意
17. 時髦的/吸引人的款式對我來說是非常重要的。
非常不同意 1 2 3 4 5 非常同意

55
18. 逛不同店鋪和選擇不同品牌能令我得到更多種類的選擇。
非常不同意 1 2 3 4 5 非常同意
19. 購買新奇和特別的貨物是有趣的。
非常不同意 1 2 3 4 5 非常同意
20. 購物對我來說不是愉快的活動。
非常不同意 1 2 3 4 5 非常同意
21. 逛街購物是我生活其中一個最享受的節目。
非常不同意 1 2 3 4 5 非常同意
22. 到不同地方購物很浪費我的時間。
非常不同意 1 2 3 4 5 非常同意
23. 我喜歡購物只因為它是有趣的。
非常不同意 1 2 3 4 5 非常同意
24. 我很快完成我每次購物的旅程。
非常不同意 1 2 3 4 5 非常同意
25. 我盡量在減價時購物。
非常不同意 1 2 3 4 5 非常同意
26. 越平價的貨物我越會選擇。
非常不同意 1 2 3 4 5 非常同意
27. 我小心地花錢,並且花得最有價值。
非常不同意 1 2 3 4 5 非常同意
28. 我應該更好地計劃我的購物情況。
非常不同意 1 2 3 4 5 非常同意

56
29. 我在購物時顯得衝動。
非常不同意 1 2 3 4 5 非常同意
30. 我經常亂購物而且感到後悔。
非常不同意 1 2 3 4 5 非常同意
31. 我會花時間來選購最好的貨物。
非常不同意 1 2 3 4 5 非常同意
32. 我會好好計劃花多少金錢於購物上。
非常不同意 1 2 3 4 5 非常同意
33. 我會為很多品牌而感到困惑。
非常不同意 1 2 3 4 5 非常同意
34. 有時我會很難決定到那些商店購物。
非常不同意 1 2 3 4 5 非常同意
35. 對所有的貨物認識越深,我越難從中選擇最好的。
非常不同意 1 2 3 4 5 非常同意
36. 取得多種貨物的資訊會令我更困惑。
非常不同意 1 2 3 4 5 非常同意
37. 我有一個固定而喜歡的品牌,並且買了很長時間。
非常不同意 1 2 3 4 5 非常同意
38. 如果發現一個十分喜歡的品牌和貨物,我會忠於它。
非常不同意 1 2 3 4 5 非常同意
39. 每次我都會到同一商店購物。
非常不同意 1 2 3 4 5 非常同意

57
40. 我定期轉換貨物的品牌。
非常不同意 1 2 3 4 5 非常同意
<乙部> 最後,我們想知道你一些簡單的個人資料,搜集的資料只供學術研究分析,內容絕對保密。
性別
1. 男
2. 女
家庭(親)兄弟姊妹數目 (包括你自己) 1. 12. 23. 34. 多於 3
生活費來源
1. 父母
2. 獎學金/助學金/貸款3. 本人兼職
4. 部分由父母提供,部分靠本人兼職
5. 部分由父母提供,部分依賴獎學金/助學金/貸款6. 部分依賴獎學金/助學金/貸款,部分靠本人兼職7. 部分由父母提供,部分依賴獎學金/助學金/貸款,部分靠本人兼職
每月生活費(港幣)數額 (包括食宿交通及零用錢,但不包括學費)1. 1500或以下2. 1501 – 20003. 2001 – 25004. 2501或以上
接收資訊的主要來源 (可選多項)1. 電視
2. 電臺
3. 報章
4. 雜誌
5. 互聯網
6. 車廂/地鐵廣告7. 展覽
8. 家人朋友
9. 其他 (請注明) ____________________________
問卷已經完結,謝謝你熱心的合作!

58
10.4 SPSS Outputs
SPSS Outputs Page
10.4.1Personal Information of the 300 samples from Shanghai and Hong Kong 59
10.4.2Decision-making styles of Shanghai university consumers 65
10.4.3Cronbach’s alpha Reliability method: Shanghai CSI 85
10.4.4Decision-making styles of Hong Kong university consumers 90
10.4.5Cronbach’s alpha Reliability method: Hong Kong CSI 108
10.4.6Comparison of decision-making styles between Shanghai and Hong Kong universities consumers
113

59
10.4.1 Personal Information of the 300 samples from Shanghai and Hong Kong
Shanghai
Sex (SH)
66 22.0 44.0 44.084 28.0 56.0 100.0150 50.0 100.0150 50.0300 100.0
MaleFemaleTotal
Valid
SystemMissingTotal
Frequency Percent Valid PercentCumulativePercent
Number of Blood Siblings (SH)
125 41.7 83.3 83.313 4.3 8.7 92.012 4.0 8.0 100.0150 50.0 100.0150 50.0300 100.0
123Total
Valid
SystemMissingTotal
Frequency Percent Valid PercentCumulativePercent
Source of Income (SH)
111 37.0 74.0 74.08 2.7 5.3 79.33 1.0 2.0 81.3
15 5.0 10.0 91.3
7 2.3 4.7 96.0
3 1.0 2.0 98.0
3 1.0 2.0 100.0
150 50.0 100.0150 50.0300 100.0
ParentsScholarship/Grant/LoanPart-timePartly Parents, partlyPart-timePartly Parents, partlyScholarship/Grant/LoanPartlyScholarship/Grant/Loan,partly Part-timePartly Parents,Scholarship/Grant/Loan,and Part-timeTotal
Valid
SystemMissingTotal
Frequency Percent Valid PercentCumulativePercent

60
Cost of Living (SH)
26 8.7 17.3 17.348 16.0 32.0 49.352 17.3 34.7 84.024 8.0 16.0 100.0150 50.0 100.0150 50.0300 100.0
</=$500$501-$1000$1001-$1500>$1501Total
Valid
SystemMissingTotal
Frequency Percent Valid PercentCumulativePercent
Information Source (SH)
300 100.0SystemMissingFrequency Percent
Television (SH)
25 8.3 16.7 16.7125 41.7 83.3 100.0150 50.0 100.0150 50.0300 100.0
NoYesTotal
Valid
SystemMissingTotal
Frequency Percent Valid PercentCumulativePercent
Radio (SH)
124 41.3 82.7 82.726 8.7 17.3 100.0150 50.0 100.0150 50.0300 100.0
NoYesTotal
Valid
SystemMissingTotal
Frequency Percent Valid PercentCumulativePercent
Newspaper (SH)
64 21.3 42.7 42.786 28.7 57.3 100.0150 50.0 100.0150 50.0300 100.0
NoYesTotal
Valid
SystemMissingTotal
Frequency Percent Valid PercentCumulativePercent
Magazine (SH)
37 12.3 24.7 24.7113 37.7 75.3 100.0150 50.0 100.0150 50.0300 100.0
NoYesTotal
Valid
SystemMissingTotal
Frequency Percent Valid PercentCumulativePercent

61
Internet (SH)
31 10.3 20.7 20.7119 39.7 79.3 100.0150 50.0 100.0150 50.0300 100.0
NoYesTotal
Valid
SystemMissingTotal
Frequency Percent Valid PercentCumulativePercent
Transportation Advertisment (SH)
85 28.3 56.7 56.765 21.7 43.3 100.0150 50.0 100.0150 50.0300 100.0
NoYesTotal
Valid
SystemMissingTotal
Frequency Percent Valid PercentCumulativePercent
Exhibition (SH)
124 41.3 82.7 82.726 8.7 17.3 100.0150 50.0 100.0150 50.0300 100.0
NoYesTotal
Valid
SystemMissingTotal
Frequency Percent Valid PercentCumulativePercent
Family and friends (SH)
54 18.0 36.0 36.096 32.0 64.0 100.0150 50.0 100.0150 50.0300 100.0
NoYesTotal
Valid
SystemMissingTotal
Frequency Percent Valid PercentCumulativePercent
Others (SH)
150 50.0 100.0 100.0150 50.0300 100.0
NoValidSystemMissing
Total
Frequency Percent Valid PercentCumulativePercent

62
Hong Kong
Sex (HK)
56 18.7 37.3 37.394 31.3 62.7 100.0150 50.0 100.0150 50.0300 100.0
MaleFemaleTotal
Valid
SystemMissingTotal
Frequency Percent Valid PercentCumulativePercent
Number of Blood Siblings (HK)
16 5.3 10.7 10.752 17.3 34.7 45.352 17.3 34.7 80.030 10.0 20.0 100.0150 50.0 100.0150 50.0300 100.0
123>3Total
Valid
SystemMissingTotal
Frequency Percent Valid PercentCumulativePercent
Source of Income (HK)
41 13.7 27.3 27.36 2.0 4.0 31.330 10.0 20.0 51.3
41 13.7 27.3 78.7
9 3.0 6.0 84.7
13 4.3 8.7 93.3
10 3.3 6.7 100.0
150 50.0 100.0150 50.0300 100.0
ParentsScholarship/Grant/LoanPart-timePartly Parents, partlyPart-timePartly Parents, partlyScholarship/Grant/LoanPartlyScholarship/Grant/Loan,partly Part-timePartly Parents,Scholarship/Grant/Loan,and Part-timeTotal
Valid
SystemMissingTotal
Frequency Percent Valid PercentCumulativePercent
Cost of Living (HK)
42 14.0 28.0 28.045 15.0 30.0 58.031 10.3 20.7 78.732 10.7 21.3 100.0150 50.0 100.0150 50.0300 100.0
</=$1500$1501-$2000$2001-$2500>$2501Total
Valid
SystemMissingTotal
Frequency Percent Valid PercentCumulativePercent

63
Information Source (HK)
300 100.0SystemMissingFrequency Percent
Television (HK)
23 7.7 15.3 15.3127 42.3 84.7 100.0150 50.0 100.0150 50.0300 100.0
NoYesTotal
Valid
SystemMissingTotal
Frequency Percent Valid PercentCumulativePercent
Radio (HK)
106 35.3 70.7 70.744 14.7 29.3 100.0150 50.0 100.0150 50.0300 100.0
NoYesTotal
Valid
SystemMissingTotal
Frequency Percent Valid PercentCumulativePercent
Newspaper (HK)
54 18.0 36.0 36.096 32.0 64.0 100.0150 50.0 100.0150 50.0300 100.0
NoYesTotal
Valid
SystemMissingTotal
Frequency Percent Valid PercentCumulativePercent
Magazine (HK)
48 16.0 32.0 32.0102 34.0 68.0 100.0150 50.0 100.0150 50.0300 100.0
NoYesTotal
Valid
SystemMissingTotal
Frequency Percent Valid PercentCumulativePercent
Internet (HK)
47 15.7 31.3 31.3103 34.3 68.7 100.0150 50.0 100.0150 50.0300 100.0
NoYesTotal
Valid
SystemMissingTotal
Frequency Percent Valid PercentCumulativePercent

64
Transportation Advertisment (HK)
86 28.7 57.3 57.364 21.3 42.7 100.0150 50.0 100.0150 50.0300 100.0
NoYesTotal
Valid
SystemMissingTotal
Frequency Percent Valid PercentCumulativePercent
Exhibition (HK)
130 43.3 86.7 86.720 6.7 13.3 100.0150 50.0 100.0150 50.0300 100.0
NoYesTotal
Valid
SystemMissingTotal
Frequency Percent Valid PercentCumulativePercent
Family and friends (HK)
36 12.0 24.0 24.0114 38.0 76.0 100.0150 50.0 100.0150 50.0300 100.0
NoYesTotal
Valid
SystemMissingTotal
Frequency Percent Valid PercentCumulativePercent
Others (HK)
141 47.0 94.0 94.09 3.0 6.0 100.0
150 50.0 100.0150 50.0300 100.0
NoYesTotal
Valid
SystemMissingTotal
Frequency Percent Valid PercentCumulativePercent

65
10.4.2 Decision-making styles of Shanghai university consumers
Shanghai CSI – Factor Analysis

66
Correlation Matrix SH CSI 01 SH CSI 02 SH CSI 03 SH CSI 04 SH CSI 05 SH CSI 06
SH CSI 01 1 0.468476 0.566205 0.619297 -0.06757 0.415655
SH CSI 02 0.468476 1 0.468217 0.361046 0.116942 0.526069
SH CSI 03 0.566205 0.468217 1 0.603896 -0.20735 0.476839
SH CSI 04 0.619297 0.361046 0.603896 1 -0.03195 0.490067
SH CSI 05 -0.06757 0.116942 -0.20735 -0.03195 1 0.004879
SH CSI 06 0.415655 0.526069 0.476839 0.490067 0.004879 1
SH CSI 07 0.04714 0.021945 -0.22114 0.025578 0.311903 0.14484
SH CSI 08 0.336379 0.456334 0.297271 0.350266 0.063793 0.358551
SH CSI 09 0.296712 0.266531 0.321982 0.382919 -0.32896 0.368282
SH CSI 10 0.098645 0.311492 0.286536 0.170389 -0.22654 0.330286
SH CSI 11 0.107465 0.159822 0.34144 0.242674 -0.24135 0.235988
SH CSI 12 0.166504 0.130526 0.249611 0.254599 -0.12626 0.329876
SH CSI 13 0.115883 0.275283 0.227922 0.180403 0.010653 0.248206
SH CSI 14 -0.11262 -0.02891 -0.07222 -0.18696 -0.02553 -0.035
SH CSI 15 0.184559 0.240006 0.08335 0.202646 -0.04431 0.166949
SH CSI 16 0.052591 0.160901 0.03193 0.081044 -0.03375 0.034904
SH CSI 17 0.091405 0.278279 -0.00845 0.120837 -0.0954 0.062353
SH CSI 18 0.290323 0.428142 0.119435 0.36165 0.224544 0.234709
SH CSI 19 0.172789 0.236736 0.238647 0.365102 -0.06007 0.191606
SH CSI 20 0.114939 0.000614 -0.04404 0.183556 0.193714 0.043689
SH CSI 21 0.063491 0.084534 -0.03089 0.127326 0.179243 0.111281
SH CSI 22 0.031155 -0.16607 -0.18548 0.07138 0.275827 0.031092
SH CSI 23 -0.02519 0.168893 -0.13455 -0.03377 -0.00609 0.102139
SH CSI 24 -0.10137 -0.07199 -0.40816 -0.15303 0.384698 -0.34038
SH CSI 25 -0.07456 0.090315 -0.10635 -0.06155 0.168385 -0.08957
SH CSI 26 -0.17149 -0.05438 0.007934 -0.22402 0.070522 -0.05587
SH CSI 27 0.159842 0.111958 0.140431 0.05066 0.030338 0.159087
SH CSI 28 -0.12027 -0.15977 -0.19381 -0.13081 0.086874 -0.02127
SH CSI 29 -0.14442 -0.07272 0.012693 0.012588 0.014687 0.092807
SH CSI 30 -0.11565 -0.02445 -0.01161 0.022937 -0.04382 0.088939
SH CSI 31 -0.04734 -0.09935 -0.03373 0.029641 0.04515 0.061392
SH CSI 32 -0.01788 -0.06863 -0.00674 0.017185 0.198426 -0.03032
SH CSI 33 0.002357 0.047232 0.324585 0.080661 -0.08777 0.23385
SH CSI 34 -0.05893 -0.06103 0.137522 -0.03445 -0.02897 0.029917
SH CSI 35 0.186406 0.041669 0.101024 0.089405 -0.09579 0.224157
SH CSI 36 0.163018 -0.01553 0.211936 0.131073 0.062321 0.250116
SH CSI 37 0.100394 0.151943 0.330955 0.311958 -0.07669 0.232156
SH CSI 38 0.24923 0.1214 0.194888 0.251114 -0.12407 0.189153
SH CSI 39 0.102622 0.171759 0.376568 0.210017 -0.14946 0.397655
Correlation
SH CSI 40 0.01186 0.087681 0.018698 0.080959 0.202147 -0.06718

67
Correlation Matrix SH CSI 07 SH CSI 08 SH CSI 09 SH CSI 10 SH CSI 11 SH CSI 12
SH CSI 01 0.04714 0.336379 0.296712 0.098645 0.107465 0.166504
SH CSI 02 0.021945 0.456334 0.266531 0.311492 0.159822 0.130526
SH CSI 03 -0.22114 0.297271 0.321982 0.286536 0.34144 0.249611
SH CSI 04 0.025578 0.350266 0.382919 0.170389 0.242674 0.254599
SH CSI 05 0.311903 0.063793 -0.32896 -0.22654 -0.24135 -0.12626
SH CSI 06 0.14484 0.358551 0.368282 0.330286 0.235988 0.329876
SH CSI 07 1 -0.19982 0.217684 -0.01742 -0.04106 0.043123
SH CSI 08 -0.19982 1 0.34122 0.376158 0.315378 0.135987
SH CSI 09 0.217684 0.34122 1 0.618969 0.510331 0.592811
SH CSI 10 -0.01742 0.376158 0.618969 1 0.667219 0.469828
SH CSI 11 -0.04106 0.315378 0.510331 0.667219 1 0.495489
SH CSI 12 0.043123 0.135987 0.592811 0.469828 0.495489 1
SH CSI 13 -0.05652 0.311848 0.150963 0.089085 0.248123 0.223821
SH CSI 14 -0.08476 0.109365 0.106239 0.166047 0.213947 0.279788
SH CSI 15 -0.09763 0.144413 0.158689 0.112215 -0.00038 0.090177
SH CSI 16 -0.12978 0.096432 0.046423 0.090299 -0.07101 -0.00178
SH CSI 17 0.073631 0.081187 0.286752 0.181063 0.026743 0.266663
SH CSI 18 0.080854 0.273392 0.154152 0.213067 -0.02955 0.127527
SH CSI 19 -0.21438 0.086988 0.093844 0.21999 0.055726 -0.02365
SH CSI 20 0.130962 -0.08556 -0.04257 -0.20139 -0.18227 0.053875
SH CSI 21 0.117302 0.132127 -0.06244 -0.03551 -0.1154 -0.00979
SH CSI 22 0.227257 -0.10491 -0.16738 -0.25896 -0.22048 -0.0087
SH CSI 23 -0.07567 0.17075 -0.14382 0.052334 -0.08367 -0.18249
SH CSI 24 0.385143 -0.16932 -0.19552 -0.19291 -0.23399 -0.01622
SH CSI 25 0.214487 0.086416 0.022627 0.025939 0.080108 0.024743
SH CSI 26 0.019374 -0.15726 -0.29577 -0.25053 -0.23299 -0.33964
SH CSI 27 0.288911 0.021897 0.104228 0.048302 0.123542 0.07965
SH CSI 28 0.103636 -0.10145 -0.28281 -0.21699 -0.01937 -0.20937
SH CSI 29 -0.02228 0.077831 -0.14313 -0.08942 -0.08565 -0.0873
SH CSI 30 -0.03977 0.02501 -0.02684 -0.02764 -0.01302 -0.0009
SH CSI 31 0.050979 -0.11593 -0.08953 -0.15588 -0.12319 -0.03898
SH CSI 32 0.089642 -0.03119 -0.10897 -0.10186 -0.03409 -0.0622
SH CSI 33 -0.07506 0.098755 0.230508 0.276255 0.187547 -0.0077
SH CSI 34 0.005538 -0.11702 -0.04927 -0.05971 -0.06277 -0.16503
SH CSI 35 -0.11455 0.235598 0.193045 0.118792 0.086134 0.102519
SH CSI 36 -0.00709 0.241797 0.150678 0.056683 0.117848 -0.00274
SH CSI 37 0.018949 0.3238 0.363952 0.141651 0.200306 0.250098
SH CSI 38 0.25548 0.128561 0.527268 0.228221 0.281485 0.588595
SH CSI 39 -0.06936 0.295995 0.401304 0.23785 0.252226 0.244111
Correlation
SH CSI 40 -0.13938 0.193496 -0.21592 -0.22883 -0.21056 -0.30351

68
Correlation Matrix SH CSI 13 SH CSI 14 SH CSI 15 SH CSI 16 SH CSI 17 SH CSI 18
SH CSI 01 0.115883 -0.11262 0.184559 0.052591 0.091405 0.290323
SH CSI 02 0.275283 -0.02891 0.240006 0.160901 0.278279 0.428142
SH CSI 03 0.227922 -0.07222 0.08335 0.03193 -0.00845 0.119435
SH CSI 04 0.180403 -0.18696 0.202646 0.081044 0.120837 0.36165
SH CSI 05 0.010653 -0.02553 -0.04431 -0.03375 -0.0954 0.224544
SH CSI 06 0.248206 -0.035 0.166949 0.034904 0.062353 0.234709
SH CSI 07 -0.05652 -0.08476 -0.09763 -0.12978 0.073631 0.080854
SH CSI 08 0.311848 0.109365 0.144413 0.096432 0.081187 0.273392
SH CSI 09 0.150963 0.106239 0.158689 0.046423 0.286752 0.154152
SH CSI 10 0.089085 0.166047 0.112215 0.090299 0.181063 0.213067
SH CSI 11 0.248123 0.213947 -0.00038 -0.07101 0.026743 -0.02955
SH CSI 12 0.223821 0.279788 0.090177 -0.00178 0.266663 0.127527
SH CSI 13 1 0.418649 0.287159 0.309919 0.154354 0.049854
SH CSI 14 0.418649 1 0.129874 0.052354 0.211116 -0.19813
SH CSI 15 0.287159 0.129874 1 0.689501 0.425182 0.191463
SH CSI 16 0.309919 0.052354 0.689501 1 0.45665 0.312971
SH CSI 17 0.154354 0.211116 0.425182 0.45665 1 0.343528
SH CSI 18 0.049854 -0.19813 0.191463 0.312971 0.343528 1
SH CSI 19 -0.1313 -0.25004 0.204408 0.255884 0.276206 0.613846
SH CSI 20 0.218704 -0.04276 0.301506 0.3644 0.383572 0.309045
SH CSI 21 0.204634 0.217297 0.450454 0.44442 0.298588 0.302609
SH CSI 22 0.204973 0.053929 0.392409 0.492136 0.13009 0.16353
SH CSI 23 0.311207 0.153723 0.431493 0.429013 0.063272 0.152282
SH CSI 24 -0.04929 0.159589 0.15576 0.230321 0.325447 0.229426
SH CSI 25 -0.07488 0.016548 -0.20264 -0.33997 -0.1275 -0.11964
SH CSI 26 0.239134 0.069945 -0.06079 0.094308 -0.23782 -0.17081
SH CSI 27 -0.11432 -0.01428 -0.1761 -0.26357 0.006785 -0.14792
SH CSI 28 -0.09216 -0.1168 -0.15295 -0.10237 -0.20252 -0.09319
SH CSI 29 -0.03755 -0.11681 -0.12298 -0.04737 -0.09237 -0.00538
SH CSI 30 0.07942 0.051632 0.039347 0.075177 -0.00011 -0.1414
SH CSI 31 -0.0261 0.04364 0.028546 -0.04042 -0.18369 -0.14398
SH CSI 32 -0.00615 0.099563 -0.00657 -0.01308 -0.05435 -0.03285
SH CSI 33 -0.01435 -0.13793 -0.06545 0.008675 -0.20978 -0.0746
SH CSI 34 -0.13287 -0.32596 -0.237 -0.07618 -0.32963 -0.046
SH CSI 35 0.112613 0.007051 -0.03542 0.045735 -0.23392 -0.08214
SH CSI 36 0.068868 -0.00624 -0.12303 -0.05865 -0.25888 -0.20032
SH CSI 37 0.229355 -0.08177 0.146172 0.137662 0.034302 0.092869
SH CSI 38 0.074189 0.145494 0.078793 0.030218 0.297275 0.119205
SH CSI 39 0.184583 -0.12923 -0.06907 0.036125 -0.2465 -0.01003
Correlation
SH CSI 40 0.28503 0.098963 0.093642 -0.03466 -0.02727 -0.02646

69
Correlation Matrix SH CSI 19 SH CSI 20 SH CSI 21 SH CSI 22 SH CSI 23 SH CSI 24
SH CSI 01 0.172789 0.114939 0.063491 0.031155 -0.02519 -0.10137
SH CSI 02 0.236736 0.000614 0.084534 -0.16607 0.168893 -0.07199
SH CSI 03 0.238647 -0.04404 -0.03089 -0.18548 -0.13455 -0.40816
SH CSI 04 0.365102 0.183556 0.127326 0.07138 -0.03377 -0.15303
SH CSI 05 -0.06007 0.193714 0.179243 0.275827 -0.00609 0.384698
SH CSI 06 0.191606 0.043689 0.111281 0.031092 0.102139 -0.34038
SH CSI 07 -0.21438 0.130962 0.117302 0.227257 -0.07567 0.385143
SH CSI 08 0.086988 -0.08556 0.132127 -0.10491 0.17075 -0.16932
SH CSI 09 0.093844 -0.04257 -0.06244 -0.16738 -0.14382 -0.19552
SH CSI 10 0.21999 -0.20139 -0.03551 -0.25896 0.052334 -0.19291
SH CSI 11 0.055726 -0.18227 -0.1154 -0.22048 -0.08367 -0.23399
SH CSI 12 -0.02365 0.053875 -0.00979 -0.0087 -0.18249 -0.01622
SH CSI 13 -0.1313 0.218704 0.204634 0.204973 0.311207 -0.04929
SH CSI 14 -0.25004 -0.04276 0.217297 0.053929 0.153723 0.159589
SH CSI 15 0.204408 0.301506 0.450454 0.392409 0.431493 0.15576
SH CSI 16 0.255884 0.3644 0.44442 0.492136 0.429013 0.230321
SH CSI 17 0.276206 0.383572 0.298588 0.13009 0.063272 0.325447
SH CSI 18 0.613846 0.309045 0.302609 0.16353 0.152282 0.229426
SH CSI 19 1 0.163781 0.186896 0.063998 0.164519 -0.04705
SH CSI 20 0.163781 1 0.501429 0.636987 0.179964 0.463182
SH CSI 21 0.186896 0.501429 1 0.621332 0.502195 0.430473
SH CSI 22 0.063998 0.636987 0.621332 1 0.328238 0.492539
SH CSI 23 0.164519 0.179964 0.502195 0.328238 1 0.216493
SH CSI 24 -0.04705 0.463182 0.430473 0.492539 0.216493 1
SH CSI 25 -0.17609 -0.29965 -0.05585 -0.18114 -0.00083 0.082917
SH CSI 26 -0.26623 -0.00959 0.16801 -0.00217 0.202167 -0.01863
SH CSI 27 -0.17821 -0.1628 -0.1753 -0.27951 -0.18733 -0.02181
SH CSI 28 -0.06916 -0.04137 0.028492 0.054004 0.045738 0.02352
SH CSI 29 0.000745 0.017154 -0.00369 0.037179 0.004073 0.031297
SH CSI 30 -0.03889 -0.06869 0.109098 -0.02337 0.137421 -0.06713
SH CSI 31 -0.04057 -0.04742 0.074948 0.031018 0.102984 -0.09753
SH CSI 32 0.062217 0.045102 0.176629 0.100556 0.051896 0.069455
SH CSI 33 0.087074 -0.28358 -0.25043 -0.21302 -0.15777 -0.43729
SH CSI 34 -0.07105 -0.24256 -0.17726 -0.16898 -0.14364 -0.29116
SH CSI 35 -0.1949 -0.07053 -0.00184 0.055175 0.02842 -0.22625
SH CSI 36 -0.19169 -0.28134 -0.1111 -0.11607 -0.08442 -0.40713
SH CSI 37 0.085598 -0.09436 0.064906 -0.04794 0.005501 -0.21173
SH CSI 38 -0.01783 -0.04399 0.028196 -0.06865 -0.32063 0.072377
SH CSI 39 -0.02546 -0.14685 -0.12211 -0.19658 -0.07201 -0.49965
Correlation
SH CSI 40 -0.06896 0.118116 0.135859 0.058149 0.026669 0.045132

70
Correlation Matrix SH CSI 25 SH CSI 26 SH CSI 27 SH CSI 28 SH CSI 29 SH CSI 30
SH CSI 01 -0.07456 -0.17149 0.159842 -0.12027 -0.14442 -0.11565
SH CSI 02 0.090315 -0.05438 0.111958 -0.15977 -0.07272 -0.02445
SH CSI 03 -0.10635 0.007934 0.140431 -0.19381 0.012693 -0.01161
SH CSI 04 -0.06155 -0.22402 0.05066 -0.13081 0.012588 0.022937
SH CSI 05 0.168385 0.070522 0.030338 0.086874 0.014687 -0.04382
SH CSI 06 -0.08957 -0.05587 0.159087 -0.02127 0.092807 0.088939
SH CSI 07 0.214487 0.019374 0.288911 0.103636 -0.02228 -0.03977
SH CSI 08 0.086416 -0.15726 0.021897 -0.10145 0.077831 0.02501
SH CSI 09 0.022627 -0.29577 0.104228 -0.28281 -0.14313 -0.02684
SH CSI 10 0.025939 -0.25053 0.048302 -0.21699 -0.08942 -0.02764
SH CSI 11 0.080108 -0.23299 0.123542 -0.01937 -0.08565 -0.01302
SH CSI 12 0.024743 -0.33964 0.07965 -0.20937 -0.0873 -0.0009
SH CSI 13 -0.07488 0.239134 -0.11432 -0.09216 -0.03755 0.07942
SH CSI 14 0.016548 0.069945 -0.01428 -0.1168 -0.11681 0.051632
SH CSI 15 -0.20264 -0.06079 -0.1761 -0.15295 -0.12298 0.039347
SH CSI 16 -0.33997 0.094308 -0.26357 -0.10237 -0.04737 0.075177
SH CSI 17 -0.1275 -0.23782 0.006785 -0.20252 -0.09237 -0.00011
SH CSI 18 -0.11964 -0.17081 -0.14792 -0.09319 -0.00538 -0.1414
SH CSI 19 -0.17609 -0.26623 -0.17821 -0.06916 0.000745 -0.03889
SH CSI 20 -0.29965 -0.00959 -0.1628 -0.04137 0.017154 -0.06869
SH CSI 21 -0.05585 0.16801 -0.1753 0.028492 -0.00369 0.109098
SH CSI 22 -0.18114 -0.00217 -0.27951 0.054004 0.037179 -0.02337
SH CSI 23 -0.00083 0.202167 -0.18733 0.045738 0.004073 0.137421
SH CSI 24 0.082917 -0.01863 -0.02181 0.02352 0.031297 -0.06713
SH CSI 25 1 0.07485 0.312088 0.166662 0.023446 0.148611
SH CSI 26 0.07485 1 0.08148 0.134348 0.138943 0.161239
SH CSI 27 0.312088 0.08148 1 0.095973 0.047732 -0.00105
SH CSI 28 0.166662 0.134348 0.095973 1 0.409196 0.38436
SH CSI 29 0.023446 0.138943 0.047732 0.409196 1 0.269808
SH CSI 30 0.148611 0.161239 -0.00105 0.38436 0.269808 1
SH CSI 31 0.036258 0.158963 -0.06588 0.285262 0.094412 0.235161
SH CSI 32 0.058524 0.126821 0.04505 0.250734 0.129467 0.303691
SH CSI 33 -0.11585 0.229366 0.173602 -0.00775 0.036308 -0.08865
SH CSI 34 -0.03866 0.374066 -0.07267 0.19942 0.09705 0.02168
SH CSI 35 -0.13239 0.075263 -0.06784 0.036418 -0.02934 -0.0116
SH CSI 36 -0.10513 0.215792 0.257581 -0.02061 0.004677 -0.01873
SH CSI 37 0.069303 0.09702 0.135907 -0.23075 0.00028 -0.0063
SH CSI 38 0.107976 -0.19871 0.337204 -0.25368 -0.16082 -0.14699
SH CSI 39 -0.06913 0.174095 0.084299 0.05051 0.092559 0.118007
Correlation
SH CSI 40 -0.09133 0.199637 -0.18495 -0.14726 0.066304 0.094883

71
Correlation Matrix SH CSI 31 SH CSI 32 SH CSI 33 SH CSI 34 SH CSI 35 SH CSI 36
SH CSI 01 -0.04734 -0.01788 0.002357 -0.05893 0.186406 0.163018
SH CSI 02 -0.09935 -0.06863 0.047232 -0.06103 0.041669 -0.01553
SH CSI 03 -0.03373 -0.00674 0.324585 0.137522 0.101024 0.211936
SH CSI 04 0.029641 0.017185 0.080661 -0.03445 0.089405 0.131073
SH CSI 05 0.04515 0.198426 -0.08777 -0.02897 -0.09579 0.062321
SH CSI 06 0.061392 -0.03032 0.23385 0.029917 0.224157 0.250116
SH CSI 07 0.050979 0.089642 -0.07506 0.005538 -0.11455 -0.00709
SH CSI 08 -0.11593 -0.03119 0.098755 -0.11702 0.235598 0.241797
SH CSI 09 -0.08953 -0.10897 0.230508 -0.04927 0.193045 0.150678
SH CSI 10 -0.15588 -0.10186 0.276255 -0.05971 0.118792 0.056683
SH CSI 11 -0.12319 -0.03409 0.187547 -0.06277 0.086134 0.117848
SH CSI 12 -0.03898 -0.0622 -0.0077 -0.16503 0.102519 -0.00274
SH CSI 13 -0.0261 -0.00615 -0.01435 -0.13287 0.112613 0.068868
SH CSI 14 0.04364 0.099563 -0.13793 -0.32596 0.007051 -0.00624
SH CSI 15 0.028546 -0.00657 -0.06545 -0.237 -0.03542 -0.12303
SH CSI 16 -0.04042 -0.01308 0.008675 -0.07618 0.045735 -0.05865
SH CSI 17 -0.18369 -0.05435 -0.20978 -0.32963 -0.23392 -0.25888
SH CSI 18 -0.14398 -0.03285 -0.0746 -0.046 -0.08214 -0.20032
SH CSI 19 -0.04057 0.062217 0.087074 -0.07105 -0.1949 -0.19169
SH CSI 20 -0.04742 0.045102 -0.28358 -0.24256 -0.07053 -0.28134
SH CSI 21 0.074948 0.176629 -0.25043 -0.17726 -0.00184 -0.1111
SH CSI 22 0.031018 0.100556 -0.21302 -0.16898 0.055175 -0.11607
SH CSI 23 0.102984 0.051896 -0.15777 -0.14364 0.02842 -0.08442
SH CSI 24 -0.09753 0.069455 -0.43729 -0.29116 -0.22625 -0.40713
SH CSI 25 0.036258 0.058524 -0.11585 -0.03866 -0.13239 -0.10513
SH CSI 26 0.158963 0.126821 0.229366 0.374066 0.075263 0.215792
SH CSI 27 -0.06588 0.04505 0.173602 -0.07267 -0.06784 0.257581
SH CSI 28 0.285262 0.250734 -0.00775 0.19942 0.036418 -0.02061
SH CSI 29 0.094412 0.129467 0.036308 0.09705 -0.02934 0.004677
SH CSI 30 0.235161 0.303691 -0.08865 0.02168 -0.0116 -0.01873
SH CSI 31 1 0.548857 0.043867 0.196687 0.0855 0.076242
SH CSI 32 0.548857 1 -0.00467 0.009107 -0.03115 0.04924
SH CSI 33 0.043867 -0.00467 1 0.575557 0.329761 0.40587
SH CSI 34 0.196687 0.009107 0.575557 1 0.390302 0.259667
SH CSI 35 0.0855 -0.03115 0.329761 0.390302 1 0.55982
SH CSI 36 0.076242 0.04924 0.40587 0.259667 0.55982 1
SH CSI 37 -0.04729 0.023355 0.266158 0.132354 0.201932 0.400369
SH CSI 38 -0.07182 -0.03519 0.10887 0.022072 0.101346 0.14102
SH CSI 39 0.107089 -0.00335 0.506363 0.470278 0.391008 0.367425
Correlation
SH CSI 40 -0.02112 0.075195 -0.20179 -0.27563 -0.25619 -0.1356

72
Correlation Matrix SH CSI 37 SH CSI 38 SH CSI 39 SH CSI 40
SH CSI 01 0.100394 0.24923 0.102622 0.01186
SH CSI 02 0.151943 0.1214 0.171759 0.087681
SH CSI 03 0.330955 0.194888 0.376568 0.018698
SH CSI 04 0.311958 0.251114 0.210017 0.080959
SH CSI 05 -0.07669 -0.12407 -0.14946 0.202147
SH CSI 06 0.232156 0.189153 0.397655 -0.06718
SH CSI 07 0.018949 0.25548 -0.06936 -0.13938
SH CSI 08 0.3238 0.128561 0.295995 0.193496
SH CSI 09 0.363952 0.527268 0.401304 -0.21592
SH CSI 10 0.141651 0.228221 0.23785 -0.22883
SH CSI 11 0.200306 0.281485 0.252226 -0.21056
SH CSI 12 0.250098 0.588595 0.244111 -0.30351
SH CSI 13 0.229355 0.074189 0.184583 0.28503
SH CSI 14 -0.08177 0.145494 -0.12923 0.098963
SH CSI 15 0.146172 0.078793 -0.06907 0.093642
SH CSI 16 0.137662 0.030218 0.036125 -0.03466
SH CSI 17 0.034302 0.297275 -0.2465 -0.02727
SH CSI 18 0.092869 0.119205 -0.01003 -0.02646
SH CSI 19 0.085598 -0.01783 -0.02546 -0.06896
SH CSI 20 -0.09436 -0.04399 -0.14685 0.118116
SH CSI 21 0.064906 0.028196 -0.12211 0.135859
SH CSI 22 -0.04794 -0.06865 -0.19658 0.058149
SH CSI 23 0.005501 -0.32063 -0.07201 0.026669
SH CSI 24 -0.21173 0.072377 -0.49965 0.045132
SH CSI 25 0.069303 0.107976 -0.06913 -0.09133
SH CSI 26 0.09702 -0.19871 0.174095 0.199637
SH CSI 27 0.135907 0.337204 0.084299 -0.18495
SH CSI 28 -0.23075 -0.25368 0.05051 -0.14726
SH CSI 29 0.00028 -0.16082 0.092559 0.066304
SH CSI 30 -0.0063 -0.14699 0.118007 0.094883
SH CSI 31 -0.04729 -0.07182 0.107089 -0.02112
SH CSI 32 0.023355 -0.03519 -0.00335 0.075195
SH CSI 33 0.266158 0.10887 0.506363 -0.20179
SH CSI 34 0.132354 0.022072 0.470278 -0.27563
SH CSI 35 0.201932 0.101346 0.391008 -0.25619
SH CSI 36 0.400369 0.14102 0.367425 -0.1356
SH CSI 37 1 0.474271 0.474215 -0.13257
SH CSI 38 0.474271 1 0.2292 -0.35028
SH CSI 39 0.474215 0.2292 1 -0.25562
Correlation
SH CSI 40 -0.13257 -0.35028 -0.25562 1

73
KMO and Bartlett's Test
.608
3602.776
780
.000
Kaiser-Meyer-Olkin Measure of SamplingAdequacy.
Approx. Chi-Square
df
Sig.
Bartlett's Test ofSphericity
Scree Plot
Component Number
39373533312927252321191715131197531
Eig
enva
lue
7
6
5
4
3
2
1
0

74
Communalities
1.000 .793
1.000 .752
1.000 .752
1.000 .751
1.000 .755
1.000 .682
1.000 .721
1.000 .794
1.000 .726
1.000 .801
1.000 .662
1.000 .761
1.000 .740
1.000 .703
1.000 .688
1.000 .784
1.000 .665
1.000 .780
1.000 .783
1.000 .747
1.000 .676
1.000 .803
1.000 .760
1.000 .775
1.000 .635
1.000 .801
1.000 .680
1.000 .720
1.000 .681
1.000 .600
1.000 .753
1.000 .768
1.000 .696
1.000 .758
1.000 .753
1.000 .706
1.000 .808
1.000 .810
1.000 .713
1.000 .782
SH CSI 01
SH CSI 02
SH CSI 03
SH CSI 04
SH CSI 05
SH CSI 06
SH CSI 07
SH CSI 08
SH CSI 09
SH CSI 10
SH CSI 11
SH CSI 12
SH CSI 13
SH CSI 14
SH CSI 15
SH CSI 16
SH CSI 17
SH CSI 18
SH CSI 19
SH CSI 20
SH CSI 21
SH CSI 22
SH CSI 23
SH CSI 24
SH CSI 25
SH CSI 26
SH CSI 27
SH CSI 28
SH CSI 29
SH CSI 30
SH CSI 31
SH CSI 32
SH CSI 33
SH CSI 34
SH CSI 35
SH CSI 36
SH CSI 37
SH CSI 38
SH CSI 39
SH CSI 40
Initial Extraction
Extraction Method: Principal Component Analysis.

75
Total Variance Explained
6.045 15.113 15.113 6.045 15.113 15.113
5.065 12.663 27.776 5.065 12.663 27.776
3.229 8.073 35.849 3.229 8.073 35.849
2.486 6.216 42.064 2.486 6.216 42.064
2.360 5.901 47.965 2.360 5.901 47.965
2.160 5.401 53.366 2.160 5.401 53.366
1.899 4.747 58.112 1.899 4.747 58.112
1.513 3.783 61.895 1.513 3.783 61.895
1.324 3.310 65.205 1.324 3.310 65.205
1.222 3.055 68.260 1.222 3.055 68.260
1.141 2.853 71.113 1.141 2.853 71.113
1.074 2.686 73.799 1.074 2.686 73.799
.955 2.387 76.186
.879 2.198 78.383
.842 2.105 80.488
.717 1.792 82.280
.696 1.740 84.019
.639 1.598 85.617
.596 1.490 87.107
.526 1.316 88.423
.498 1.246 89.669
.447 1.119 90.787
.409 1.023 91.810
.395 .987 92.797
.349 .872 93.669
.331 .828 94.497
.283 .707 95.204
.259 .647 95.851
.229 .572 96.423
.204 .510 96.934
.199 .496 97.430
.188 .471 97.901
.153 .383 98.284
.148 .369 98.653
.129 .323 98.976
.111 .277 99.253
9.277E-02 .232 99.485
8.516E-02 .213 99.698
6.649E-02 .166 99.864
5.450E-02 .136 100.000
Component1
2
3
4
5
6
7
8
9
10
11
12
13
14
15
16
17
18
19
20
21
22
23
24
25
26
27
28
29
30
31
32
33
34
35
36
37
38
39
40
Total % of Variance Cumulative % Total % of Variance Cumulative %
Initial Eigenvalues Extraction Sums of Squared Loadings
Extraction Method: Principal Component Analysis.

76
Component Matrixa
Component
1 2 3 4 5 6
SH CSI 01 0.525 0.346
SH CSI 02 0.530 0.351
SH CSI 03 0.692
SH CSI 04 0.606 0.368
SH CSI 05 0.445
SH CSI 06 0.644
SH CSI 07 0.518 0.529
SH CSI 08 0.552 0.391
SH CSI 09 0.755
SH CSI 10 0.640
SH CSI 11 0.593
SH CSI 12 0.568 -0.374 0.363
SH CSI 13 0.334 -0.391
SH CSI 14 0.483 -0.535
SH CSI 15 0.655
SH CSI 16 0.636 0.333 -0.306
SH CSI 17 0.632 -0.300
SH CSI 18 0.541 0.397
SH CSI 19 0.373 -0.529
SH CSI 20 0.680
SH CSI 21 0.689 0.334
SH CSI 22 0.631 -0.328
SH CSI 23 0.465 0.413
SH CSI 24 -0.445 0.569 0.329
SH CSI 25 0.380 0.368
SH CSI 26 0.577
SH CSI 27 0.356 0.364
SH CSI 28 0.330
SH CSI 29
SH CSI 30 0.322 0.372
SH CSI 31 0.405
SH CSI 32 0.320 0.325
SH CSI 33 0.419 -0.445 0.320
SH CSI 34 -0.511 0.450 -0.407
SH CSI 35 0.338 0.391 -0.325
SH CSI 36 0.366 -0.399 0.368
SH CSI 37 0.548
SH CSI 38 0.534 -0.350 0.417 -0.308
SH CSI 39 0.584 -0.347 0.393
SH CSI 40 0.548
Extraction Method: Principal Component Analysis.
12 components extracted.
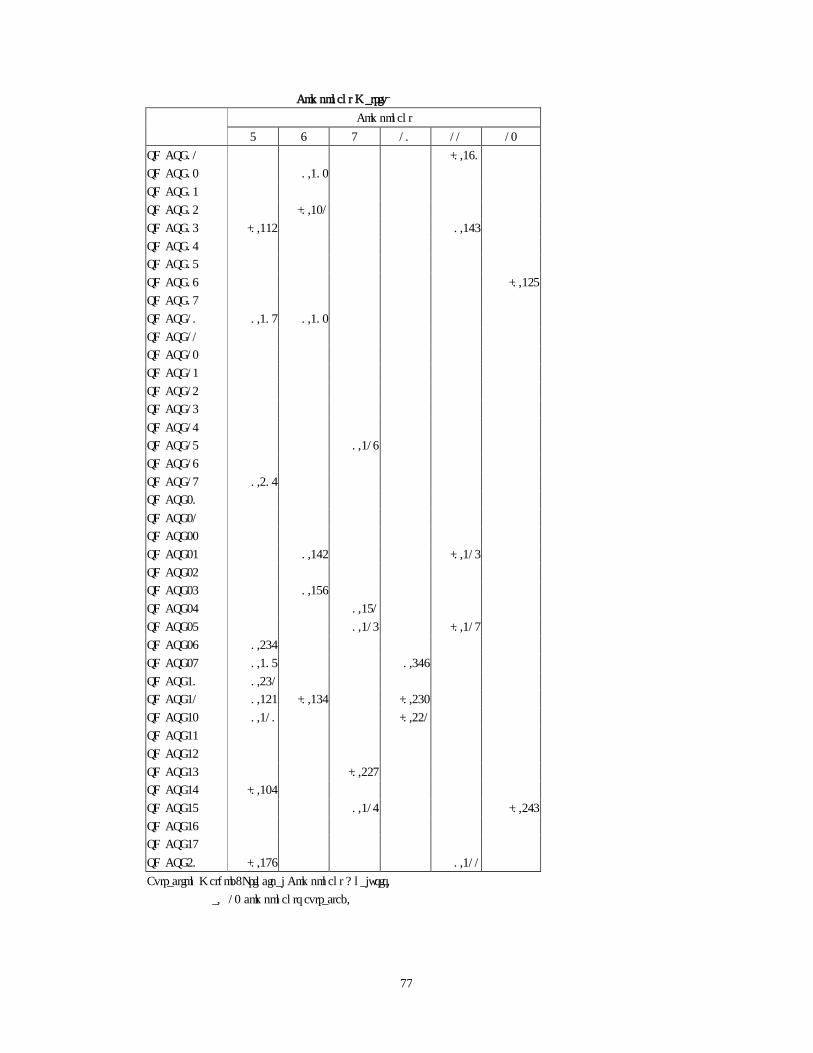
77
Component Matrixa
Component
7 8 9 10 11 12
SH CSI 01 -0.380
SH CSI 02 0.302
SH CSI 03
SH CSI 04 -0.321
SH CSI 05 -0.334 0.365
SH CSI 06
SH CSI 07
SH CSI 08 -0.347
SH CSI 09
SH CSI 10 0.309 0.302
SH CSI 11
SH CSI 12
SH CSI 13
SH CSI 14
SH CSI 15
SH CSI 16
SH CSI 17 0.318
SH CSI 18
SH CSI 19 0.406
SH CSI 20
SH CSI 21
SH CSI 22
SH CSI 23 0.364 -0.315
SH CSI 24
SH CSI 25 0.378
SH CSI 26 0.371
SH CSI 27 0.315 -0.319
SH CSI 28 0.456
SH CSI 29 0.307 0.568
SH CSI 30 0.451
SH CSI 31 0.343 -0.356 -0.452
SH CSI 32 0.310 -0.441
SH CSI 33
SH CSI 34
SH CSI 35 -0.449
SH CSI 36 -0.326
SH CSI 37 0.316 -0.465
SH CSI 38
SH CSI 39
SH CSI 40 -0.398 0.311
Extraction Method: Principal Component Analysis.
a. 12 components extracted.

78
Shanghai CSI - Factor Rotation (1st trail)
Rotated Component Matrixa
.682
.733
.697 .301
.776
.434
.667
.722
.585 .381
.407 -.394 .390 .404
.373 -.386 .437
.532
-.344 .458 .490
.347 .601
.745
.664
.784
.438 -.322 -.349
.564 .377
.519 -.334
.694
.752
.794
.536 -.304
.501 -.518 .376
-.360 .337 .334
.322 .506
-.358 .490
.577
.419
.494
.496
.544
.717
.699 -.354
.676
.650
.479
-.301 .698
.742
-.388 -.475
SH CSI 01
SH CSI 02
SH CSI 03
SH CSI 04
SH CSI 05
SH CSI 06
SH CSI 07
SH CSI 08
SH CSI 09
SH CSI 10
SH CSI 11
SH CSI 12
SH CSI 13
SH CSI 14
SH CSI 15
SH CSI 16
SH CSI 17
SH CSI 18
SH CSI 19
SH CSI 20
SH CSI 21
SH CSI 22
SH CSI 23
SH CSI 24
SH CSI 25
SH CSI 26
SH CSI 27
SH CSI 28
SH CSI 29
SH CSI 30
SH CSI 31
SH CSI 32
SH CSI 33
SH CSI 34
SH CSI 35
SH CSI 36
SH CSI 37
SH CSI 38
SH CSI 39
SH CSI 40
1 2 3 4 5 6
Component
Extraction Method: Principal Component Analysis. Rotation Method: Varimax with Kaiser Normalization.
Rotation converged in 8 iterations.a.

79
Shanghai CSI - Factor Rotation (2nd trail)
Rotated Component Matrix a
.755
.759
.778
.722
.728
.677
.351 -.328 .327
.735
.733
.811
.684
.757
.805 .356
.614 -.447
.395 -.615
.677
.700
.733
.691
.722
.795
.595
.692
SH CSI01SH CSI02SH CSI04SH CSI05SH CSI06SH CSI07SH CSI11SH CSI14SH CSI15SH CSI16SH CSI20SH CSI21SH CSI22SH CSI28SH CSI29SH CSI30SH CSI31SH CSI32SH CSI33SH CSI35SH CSI36SH CSI37SH CSI39
1 2 3 4 5 6Component
Extraction Method: Principal Component Analysis. Rotation Method: Varimax with Kaiser Normalization.
Rotation converged in 11 iterations.a.

80
Shanghai CSI - Factor Rotation (3rd trail)
Rotated Component Matrix a
.822
.750
.757
.777
.312 .731
.725
.848
.796
.856
.631 .340
.732
.668
.788
.798
.703
.692
.786
.619
.715
SH CSI01SH CSI02SH CSI04SH CSI05SH CSI06SH CSI07SH CSI14SH CSI15SH CSI16SH CSI20SH CSI21SH CSI30SH CSI31SH CSI32SH CSI33SH CSI35SH CSI36SH CSI37SH CSI39
1 2 3 4 5 6Component
Extraction Method: Principal Component Analysis. Rotation Method: Varimax with Kaiser Normalization.
Rotation converged in 6 iterations.a.

81
Shanghai CSI - Factor Rotation (4th trail)
Rotated Component Matrix a
.902
.668
.805
.807
.751
.729
.844
.872
.690
.649
.796
.809
.725
.656 .455
.758 .332
.644
.756
SH CSI01SH CSI02SH CSI04SH CSI05SH CSI07SH CSI14SH CSI15SH CSI16SH CSI21SH CSI30SH CSI31SH CSI32SH CSI33SH CSI35SH CSI36SH CSI37SH CSI39
1 2 3 4 5 6Component
Extraction Method: Principal Component Analysis. Rotation Method: Varimax with Kaiser Normalization.
Rotation converged in 7 iterations.a.

82
Shanghai CSI - Factor Rotation (5th and the final trail)
Communalities
1.000
1.000
1.000
1.000
1.000
1.000
1.000
1.000
1.000
1.000
1.000
1.000
1.000
1.000
1.000
SH CSI01SH CSI02SH CSI04SH CSI05SH CSI07SH CSI14SH CSI15SH CSI16SH CSI21SH CSI30SH CSI31SH CSI32SH CSI33SH CSI37SH CSI39
Initial
Extraction Method: Principal Component Analysis.

83
Total Variance Explained
2.584 17.224 17.224 2.129 14.194 14.1942.209 14.727 31.952 2.020 13.467 27.6611.823 12.155 44.106 1.888 12.586 40.2471.608 10.721 54.828 1.786 11.910 52.1571.192 7.945 62.773 1.456 9.709 61.866.917 6.114 68.887 1.053 7.021 68.887.861 5.740 74.627.811 5.405 80.031.656 4.376 84.408.539 3.593 88.000.485 3.234 91.234.435 2.899 94.134.360 2.399 96.533.277 1.844 98.377.243 1.623 100.000
Component123456789101112131415
Total% ofVariance
Cumulative% Total
% ofVariance
Cumulative%
Initial Eigenvalues Rotation Sums of Squared Loadings
Extraction Method: Principal Component Analysis.
Component Matrix a
6 components extracted.a.

84
Rotated Component Matrix a
.893
.690
.799
.803
.763
.939
.848
.884
.702
.640
.802
.808
.774
.708
.831
SH CSI01SH CSI02SH CSI04SH CSI05SH CSI07SH CSI14SH CSI15SH CSI16SH CSI21SH CSI30SH CSI31SH CSI32SH CSI33SH CSI37SH CSI39
1 2 3 4 5 6Component
Extraction Method: Principal Component Analysis. Rotation Method: Varimax with Kaiser Normalization.
Rotation converged in 5 iterations.a.
Component Transformation Matrix
.592 .704 .387 .016 -.044 -.052
.622 -.174 -.584 .324 .218 .299-.161 -.097 .403 .882 .157 -.003-.352 .512 -.335 .022 .692 -.150.261 -.423 .452 -.324 .665 -.041-.211 .157 .174 -.110 .068 .940
Component123456
1 2 3 4 5 6
Extraction Method: Principal Component Analysis. Rotation Method: Varimax with Kaiser Normalization.

85
10.4.3 Cronbach’s alpha Reliability method: Shanghai CSI
Factor 1: Novelty and fashion-conscious consumer
R E L I A B I L I T Y A N A L Y S I S - S C A L E (A L P H A)
Mean Std Dev Cases
1. SHCSI15 3.1267 1.0574 150.0 2. SHCSI16 2.6933 1.0294 150.0 3. SHCSI21 3.2267 1.1652 150.0
N ofStatistics for Mean Variance Std Dev Variables SCALE 9.0467 7.2126 2.6856 3
Item-total Statistics
Scale Scale Corrected Mean Variance Item- Alpha if Item if Item Total if Item Deleted Deleted Correlation Deleted
SHCSI15 5.9200 3.4835 .6615 .6121SHCSI16 6.3533 3.5857 .6585 .6191SHCSI21 5.8200 3.6788 .4869 .8160
Reliability Coefficients
N of Cases = 150.0 N of Items = 3
Alpha = .7647

86
Factor 2: Perfectionistic and high-quality conscious consumer
R E L I A B I L I T Y A N A L Y S I S - S C A L E (A L P H A)
Mean Std Dev Cases
1. SHCSI01 4.3400 .9471 150.0 2. SHCSI02 3.9467 .8731 150.0 3. SHCSI04 4.3800 .6822 150.0
N ofStatistics for Mean Variance Std Dev Variables SCALE 12.6667 4.1298 2.0322 3
Item-total Statistics
Scale Scale Corrected Mean Variance Item- Alpha if Item if Item Total if Item Deleted Deleted Correlation Deleted
SHCSI01 8.3267 1.6577 .6458 .5189SHCSI02 8.7200 2.1627 .4692 .7401SHCSI04 8.2867 2.4340 .5780 .6366
Reliability Coefficients
N of Cases = 150.0 N of Items = 3
Alpha = .7283

87
Factor 3: Habitual and brand-loyal consumer
R E L I A B I L I T Y A N A L Y S I S - S C A L E (A L P H A)
Mean Std Dev Cases
1. SHCSI33 2.6600 1.0221 150.0 2. SHCSI37 3.4600 1.0969 150.0 3. SHCSI39 2.6467 1.0371 150.0
N ofStatistics for Mean Variance Std Dev Variables SCALE 8.7667 6.0727 2.4643 3
Item-total Statistics
Scale Scale Corrected Mean Variance Item- Alpha if Item if Item Total if Item Deleted Deleted Correlation Deleted
SHCSI33 6.1067 3.3577 .4459 .6427SHCSI37 5.3067 3.1939 .4274 .6723SHCSI39 6.1200 2.8446 .6153 .4196
Reliability Coefficients
N of Cases = 150.0 N of Items = 3
Alpha = .6791
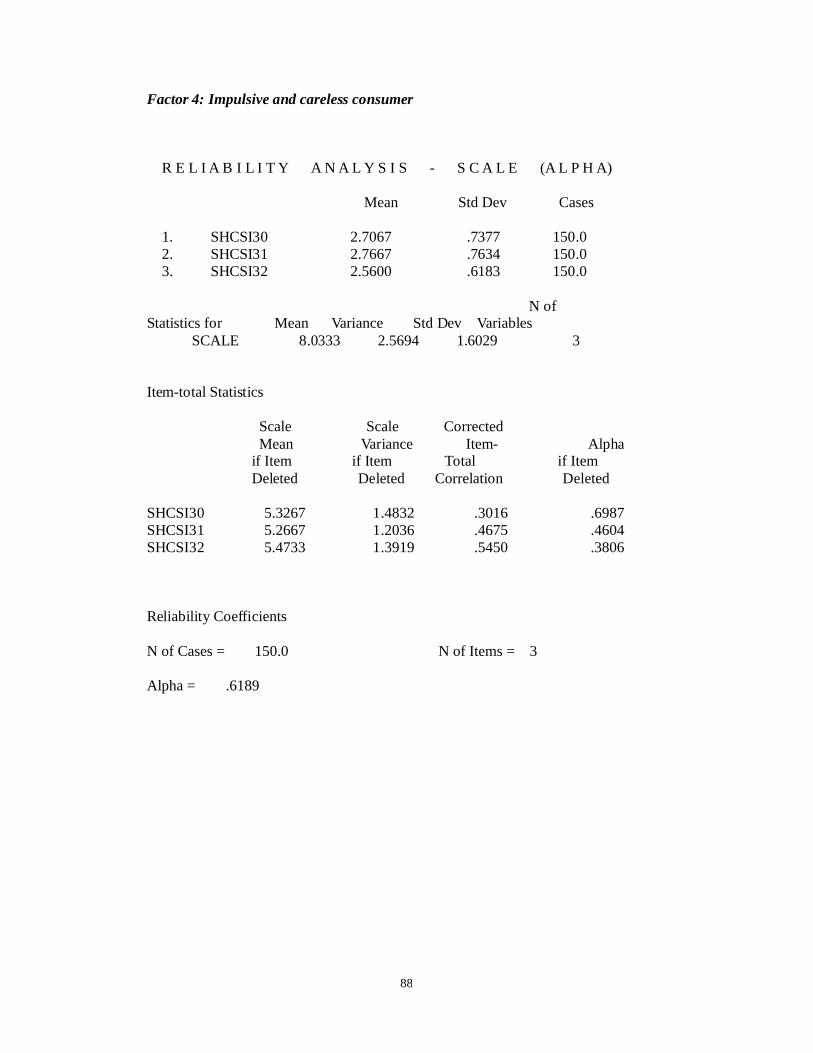
88
Factor 4: Impulsive and careless consumer
R E L I A B I L I T Y A N A L Y S I S - S C A L E (A L P H A)
Mean Std Dev Cases
1. SHCSI30 2.7067 .7377 150.0 2. SHCSI31 2.7667 .7634 150.0 3. SHCSI32 2.5600 .6183 150.0
N ofStatistics for Mean Variance Std Dev Variables SCALE 8.0333 2.5694 1.6029 3
Item-total Statistics
Scale Scale Corrected Mean Variance Item- Alpha if Item if Item Total if Item Deleted Deleted Correlation Deleted
SHCSI30 5.3267 1.4832 .3016 .6987SHCSI31 5.2667 1.2036 .4675 .4604SHCSI32 5.4733 1.3919 .5450 .3806
Reliability Coefficients
N of Cases = 150.0 N of Items = 3
Alpha = .6189

89
Factor 5: Price conscious and value for money consumer
R E L I A B I L I T Y A N A L Y S I S - S C A L E (A L P H A)
Mean Std Dev Cases
1. SHCSI05 3.8267 .9606 150.0 2. SHCSI07 3.3733 1.0462 150.0
N ofStatistics for Mean Variance Std Dev Variables SCALE 7.2000 2.6443 1.6261 2
Item-total Statistics
Scale Scale Corrected Mean Variance Item- Alpha if Item if Item Total if Item Deleted Deleted Correlation Deleted
SHCSI05 3.3733 1.0946 .3119 .SHCSI07 3.8267 .9228 .3119 .
Reliability Coefficients
N of Cases = 150.0 N of Items = 2
Alpha = .4742

90
10.4.4 Decision-making styles of Hong Kong university consumers
HK CSI - Factor Analysis

91
Correlation Matrix HK CSI 01 HK CSI 02 HK CSI 03 HK CSI 04 HK CSI 05 HK CSI 06
HK CSI 01 1.000 0.181 0.318 0.237 -0.040 0.260
HK CSI 02 0.181 1.000 0.467 0.141 0.046 0.329
HK CSI 03 0.318 0.467 1.000 0.320 -0.041 0.398
HK CSI 04 0.237 0.141 0.320 1.000 -0.016 0.285
HK CSI 05 -0.040 0.046 -0.041 -0.016 1.000 0.161
HK CSI 06 0.260 0.329 0.398 0.285 0.161 1.000
HK CSI 07 -0.027 -0.039 -0.049 -0.082 0.393 0.198
HK CSI 08 0.088 0.353 0.224 0.154 0.034 0.365
HK CSI 09 0.036 0.208 0.224 0.040 -0.289 0.139
HK CSI 10 0.026 0.077 0.096 -0.043 -0.329 0.022
HK CSI 11 0.005 0.014 0.036 0.008 -0.147 0.056
HK CSI 12 -0.039 0.132 0.119 -0.049 -0.147 0.148
HK CSI 13 -0.116 0.061 0.127 -0.058 -0.070 0.061
HK CSI 14 -0.099 -0.080 0.114 -0.063 -0.265 -0.028
HK CSI 15 0.050 0.044 -0.020 -0.091 -0.023 0.100
HK CSI 16 0.044 0.060 0.127 0.007 -0.157 -0.042
HK CSI 17 -0.016 0.129 0.127 0.041 -0.267 0.057
HK CSI 18 0.169 0.125 0.034 0.169 -0.045 0.146
HK CSI 19 0.160 0.045 0.117 0.198 -0.098 0.160
HK CSI 20 0.015 -0.057 -0.129 0.102 0.243 0.121
HK CSI 21 0.000 0.114 0.059 0.081 0.163 0.205
HK CSI 22 -0.087 -0.092 -0.113 -0.016 0.174 0.030
HK CSI 23 0.070 0.091 0.184 0.054 -0.088 0.168
HK CSI 24 -0.057 0.047 -0.090 0.058 0.259 0.013
HK CSI 25 0.088 0.076 0.039 0.159 0.107 0.150
HK CSI 26 -0.098 0.040 0.056 -0.010 0.058 0.116
HK CSI 27 0.087 0.096 0.075 0.054 0.182 0.119
HK CSI 28 0.010 -0.089 0.022 0.013 0.050 0.117
HK CSI 29 -0.011 0.014 -0.065 0.041 -0.016 0.005
HK CSI 30 -0.057 -0.020 -0.043 -0.134 0.122 0.026
HK CSI 31 -0.073 -0.051 -0.239 -0.034 0.182 -0.013
HK CSI 32 -0.013 0.026 0.021 -0.050 0.022 0.129
HK CSI 33 -0.094 -0.030 0.196 0.017 -0.105 0.009
HK CSI 34 0.011 0.045 0.128 0.066 -0.082 0.097
HK CSI 35 0.090 0.198 0.241 0.029 -0.121 0.230
HK CSI 36 0.022 0.027 0.111 -0.015 -0.048 0.156
HK CSI 37 -0.003 0.105 0.132 0.060 -0.089 0.245
HK CSI 38 0.063 0.053 0.032 0.001 -0.078 0.186
HK CSI 39 -0.043 -0.001 0.023 -0.020 -0.063 0.068
Correlation
HK CSI 40 0.050 0.017 0.153 0.149 0.135 -0.013

92
Correlation Matrix HK CSI 07 HK CSI 08 HK CSI 09 HK CSI 10 HK CSI 11 HK CSI 12
HK CSI 01 -0.027 0.088 0.036 0.026 0.005 -0.039
HK CSI 02 -0.039 0.353 0.208 0.077 0.014 0.132
HK CSI 03 -0.049 0.224 0.224 0.096 0.036 0.119
HK CSI 04 -0.082 0.154 0.040 -0.043 0.008 -0.049
HK CSI 05 0.393 0.034 -0.289 -0.329 -0.147 -0.147
HK CSI 06 0.198 0.365 0.139 0.022 0.056 0.148
HK CSI 07 1.000 -0.047 -0.086 -0.168 0.100 0.006
HK CSI 08 -0.047 1.000 0.209 0.160 0.161 0.216
HK CSI 09 -0.086 0.209 1.000 0.543 0.291 0.329
HK CSI 10 -0.168 0.160 0.543 1.000 0.463 0.355
HK CSI 11 0.100 0.161 0.291 0.463 1.000 0.381
HK CSI 12 0.006 0.216 0.329 0.355 0.381 1.000
HK CSI 13 0.115 0.049 0.222 0.307 0.469 0.527
HK CSI 14 -0.036 0.055 0.292 0.369 0.380 0.434
HK CSI 15 0.032 0.061 0.126 0.158 0.071 0.114
HK CSI 16 -0.126 0.020 0.273 0.287 0.176 0.116
HK CSI 17 -0.072 -0.014 0.462 0.411 0.277 0.271
HK CSI 18 0.132 0.120 0.192 0.119 0.053 0.132
HK CSI 19 -0.067 -0.008 0.010 -0.090 0.052 0.011
HK CSI 20 0.150 0.166 -0.055 -0.152 0.022 0.103
HK CSI 21 0.278 0.089 0.052 -0.071 0.107 0.113
HK CSI 22 0.032 -0.082 -0.200 -0.077 -0.052 -0.135
HK CSI 23 0.000 0.048 0.139 0.072 0.124 0.083
HK CSI 24 0.328 -0.046 -0.063 -0.044 -0.027 -0.117
HK CSI 25 0.236 0.116 -0.010 -0.114 0.047 0.105
HK CSI 26 0.108 -0.002 -0.095 -0.089 0.002 0.058
HK CSI 27 0.300 0.108 0.015 -0.121 -0.155 -0.090
HK CSI 28 0.097 0.090 0.021 -0.032 -0.054 -0.058
HK CSI 29 -0.050 0.011 0.019 -0.029 -0.014 -0.060
HK CSI 30 0.179 0.115 -0.011 0.023 0.192 0.150
HK CSI 31 0.118 -0.067 -0.049 -0.133 -0.163 -0.113
HK CSI 32 0.106 0.032 0.112 0.094 0.055 0.031
HK CSI 33 0.212 0.052 0.154 0.112 0.254 0.170
HK CSI 34 0.130 0.023 0.092 -0.024 0.141 0.119
HK CSI 35 -0.015 0.216 0.183 0.219 0.248 0.333
HK CSI 36 -0.075 0.244 0.103 0.060 0.073 0.203
HK CSI 37 0.027 0.236 0.196 0.051 0.125 0.173
HK CSI 38 0.029 0.075 0.259 0.109 0.202 0.226
HK CSI 39 -0.021 0.195 0.150 0.043 0.127 0.172
Correlation
HK CSI 40 0.050 -0.027 -0.151 -0.266 -0.094 -0.219

93
Correlation Matrix HK CSI 13 HK CSI 14 HK CSI 15 HK CSI 16 HK CSI 17 HK CSI 18
HK CSI 01 -0.116 -0.099 0.050 0.044 -0.016 0.169
HK CSI 02 0.061 -0.080 0.044 0.060 0.129 0.125
HK CSI 03 0.127 0.114 -0.020 0.127 0.127 0.034
HK CSI 04 -0.058 -0.063 -0.091 0.007 0.041 0.169
HK CSI 05 -0.070 -0.265 -0.023 -0.157 -0.267 -0.045
HK CSI 06 0.061 -0.028 0.100 -0.042 0.057 0.146
HK CSI 07 0.115 -0.036 0.032 -0.126 -0.072 0.132
HK CSI 08 0.049 0.055 0.061 0.020 -0.014 0.120
HK CSI 09 0.222 0.292 0.126 0.273 0.462 0.192
HK CSI 10 0.307 0.369 0.158 0.287 0.411 0.119
HK CSI 11 0.469 0.380 0.071 0.176 0.277 0.053
HK CSI 12 0.527 0.434 0.114 0.116 0.271 0.132
HK CSI 13 1.000 0.494 0.183 0.123 0.320 0.078
HK CSI 14 0.494 1.000 0.137 0.215 0.290 -0.053
HK CSI 15 0.183 0.137 1.000 0.652 0.399 0.301
HK CSI 16 0.123 0.215 0.652 1.000 0.514 0.208
HK CSI 17 0.320 0.290 0.399 0.514 1.000 0.300
HK CSI 18 0.078 -0.053 0.301 0.208 0.300 1.000
HK CSI 19 0.049 0.012 0.161 0.212 0.146 0.235
HK CSI 20 -0.010 -0.086 0.322 0.294 0.054 0.258
HK CSI 21 0.103 -0.071 0.317 0.222 0.174 0.279
HK CSI 22 0.011 -0.089 0.295 0.287 0.041 0.149
HK CSI 23 0.187 0.026 0.241 0.141 0.127 0.017
HK CSI 24 -0.099 -0.214 0.111 0.149 -0.022 0.071
HK CSI 25 0.225 0.043 -0.068 -0.062 -0.041 0.018
HK CSI 26 0.129 0.139 -0.163 -0.181 -0.088 -0.204
HK CSI 27 -0.100 -0.046 -0.002 -0.115 -0.186 0.017
HK CSI 28 0.010 -0.046 0.061 -0.038 0.031 0.052
HK CSI 29 -0.066 -0.140 0.055 0.061 -0.083 -0.014
HK CSI 30 0.182 0.102 0.002 -0.072 0.082 -0.059
HK CSI 31 -0.064 -0.019 0.001 -0.106 -0.065 -0.023
HK CSI 32 0.027 0.132 -0.033 -0.021 0.086 0.050
HK CSI 33 0.272 0.162 0.072 0.092 0.132 0.064
HK CSI 34 0.134 0.029 -0.181 -0.175 -0.004 0.020
HK CSI 35 0.255 0.350 0.071 0.035 0.291 -0.021
HK CSI 36 0.032 0.211 -0.102 -0.161 -0.050 -0.092
HK CSI 37 0.168 0.093 0.146 0.011 0.058 0.110
HK CSI 38 -0.116 -0.099 0.050 0.044 -0.016 0.169
HK CSI 39 0.061 -0.080 0.044 0.060 0.129 0.125
Correlation
HK CSI 40 0.127 0.114 -0.020 0.127 0.127 0.034

94
Correlation Matrix HK CSI 19 HK CSI 20 HK CSI 21 HK CSI 22 HK CSI 23 HK CSI 24
HK CSI 01 0.160 0.015 0.000 -0.087 0.070 -0.057
HK CSI 02 0.045 -0.057 0.114 -0.092 0.091 0.047
HK CSI 03 0.117 -0.129 0.059 -0.113 0.184 -0.090
HK CSI 04 0.198 0.102 0.081 -0.016 0.054 0.058
HK CSI 05 -0.098 0.243 0.163 0.174 -0.088 0.259
HK CSI 06 0.160 0.121 0.205 0.030 0.168 0.013
HK CSI 07 -0.067 0.150 0.278 0.032 0.000 0.328
HK CSI 08 -0.008 0.166 0.089 -0.082 0.048 -0.046
HK CSI 09 0.010 -0.055 0.052 -0.200 0.139 -0.063
HK CSI 10 -0.090 -0.152 -0.071 -0.077 0.072 -0.044
HK CSI 11 0.052 0.022 0.107 -0.052 0.124 -0.027
HK CSI 12 0.011 0.103 0.113 -0.135 0.083 -0.117
HK CSI 13 0.049 -0.010 0.103 0.011 0.187 -0.099
HK CSI 14 0.012 -0.086 -0.071 -0.089 0.026 -0.214
HK CSI 15 0.161 0.322 0.317 0.295 0.241 0.111
HK CSI 16 0.212 0.294 0.222 0.287 0.141 0.149
HK CSI 17 0.146 0.054 0.174 0.041 0.127 -0.022
HK CSI 18 0.235 0.258 0.279 0.149 0.017 0.071
HK CSI 19 1.000 0.239 0.158 0.119 0.253 0.033
HK CSI 20 0.239 1.000 0.526 0.541 0.173 0.327
HK CSI 21 0.158 0.526 1.000 0.454 0.359 0.322
HK CSI 22 0.119 0.541 0.454 1.000 0.184 0.406
HK CSI 23 0.253 0.173 0.359 0.184 1.000 0.008
HK CSI 24 0.033 0.327 0.322 0.406 0.008 1.000
HK CSI 25 0.110 0.030 0.055 -0.128 0.025 -0.014
HK CSI 26 -0.115 -0.136 0.122 -0.086 0.040 -0.030
HK CSI 27 0.032 0.104 0.039 -0.052 0.064 0.105
HK CSI 28 0.017 -0.043 -0.045 -0.003 0.091 0.045
HK CSI 29 -0.028 0.125 0.147 0.025 -0.056 0.120
HK CSI 30 -0.184 -0.072 0.022 -0.155 -0.058 -0.033
HK CSI 31 0.045 0.129 0.039 0.123 0.023 0.044
HK CSI 32 -0.112 -0.040 0.027 -0.010 -0.040 0.067
HK CSI 33 0.051 -0.178 -0.030 -0.145 0.072 -0.010
HK CSI 34 -0.013 -0.176 -0.060 -0.214 0.096 0.034
HK CSI 35 -0.034 -0.098 0.051 -0.094 0.076 -0.062
HK CSI 36 -0.118 -0.136 -0.109 -0.228 -0.011 -0.163
HK CSI 37 0.183 0.036 0.107 -0.030 0.174 -0.260
HK CSI 38 0.108 -0.030 0.056 -0.103 0.092 -0.198
HK CSI 39 -0.048 -0.061 0.010 -0.064 0.103 -0.245
Correlation
HK CSI 40 -0.027 0.052 -0.073 0.051 -0.212 0.025

95
Correlation Matrix HK CSI 25 HK CSI 26 HK CSI 27 HK CSI 28 HK CSI 29 HK CSI 30
HK CSI 01 0.088 -0.098 0.087 0.010 -0.011 -0.057
HK CSI 02 0.076 0.040 0.096 -0.089 0.014 -0.020
HK CSI 03 0.039 0.056 0.075 0.022 -0.065 -0.043
HK CSI 04 0.159 -0.010 0.054 0.013 0.041 -0.134
HK CSI 05 0.107 0.058 0.182 0.050 -0.016 0.122
HK CSI 06 0.150 0.116 0.119 0.117 0.005 0.026
HK CSI 07 0.236 0.108 0.300 0.097 -0.050 0.179
HK CSI 08 0.116 -0.002 0.108 0.090 0.011 0.115
HK CSI 09 -0.010 -0.095 0.015 0.021 0.019 -0.011
HK CSI 10 -0.114 -0.089 -0.121 -0.032 -0.029 0.023
HK CSI 11 0.047 0.002 -0.155 -0.054 -0.014 0.192
HK CSI 12 0.105 0.058 -0.090 -0.058 -0.060 0.150
HK CSI 13 0.225 0.129 -0.100 0.010 -0.066 0.182
HK CSI 14 0.043 0.139 -0.046 -0.046 -0.140 0.102
HK CSI 15 -0.068 -0.163 -0.002 0.061 0.055 0.002
HK CSI 16 -0.062 -0.181 -0.115 -0.038 0.061 -0.072
HK CSI 17 -0.041 -0.088 -0.186 0.031 -0.083 0.082
HK CSI 18 0.018 -0.204 0.017 0.052 -0.014 -0.059
HK CSI 19 0.110 -0.115 0.032 0.017 -0.028 -0.184
HK CSI 20 0.030 -0.136 0.104 -0.043 0.125 -0.072
HK CSI 21 0.055 0.122 0.039 -0.045 0.147 0.022
HK CSI 22 -0.128 -0.086 -0.052 -0.003 0.025 -0.155
HK CSI 23 0.025 0.040 0.064 0.091 -0.056 -0.058
HK CSI 24 -0.014 -0.030 0.105 0.045 0.120 -0.033
HK CSI 25 1.000 0.365 0.134 -0.017 -0.093 0.131
HK CSI 26 0.365 1.000 0.029 -0.056 -0.009 -0.018
HK CSI 27 0.134 0.029 1.000 -0.032 -0.043 0.005
HK CSI 28 -0.017 -0.056 -0.032 1.000 -0.085 -0.020
HK CSI 29 -0.093 -0.009 -0.043 -0.085 1.000 -0.051
HK CSI 30 0.131 -0.018 0.005 -0.020 -0.051 1.000
HK CSI 31 0.060 0.147 0.157 0.017 -0.029 -0.063
HK CSI 32 0.046 -0.017 0.022 0.153 -0.054 -0.015
HK CSI 33 0.097 0.090 0.022 0.014 -0.091 0.092
HK CSI 34 0.173 0.228 0.089 0.100 -0.070 0.028
HK CSI 35 0.036 0.173 0.066 -0.029 -0.031 0.122
HK CSI 36 0.045 0.170 -0.076 -0.024 0.066 0.127
HK CSI 37 0.072 0.123 0.082 0.126 -0.036 -0.015
HK CSI 38 0.014 0.064 0.040 0.140 -0.128 0.006
HK CSI 39 0.058 0.220 -0.009 0.119 0.001 -0.004
Correlation
HK CSI 40 -0.009 -0.001 0.049 -0.179 0.111 -0.059

96
Correlation Matrix HK CSI 31 HK CSI 32 HK CSI 33 HK CSI 34 HK CSI 35 HK CSI 36
HK CSI 01 -0.073 -0.013 -0.094 0.011 0.090 0.022
HK CSI 02 -0.051 0.026 -0.030 0.045 0.198 0.027
HK CSI 03 -0.239 0.021 0.196 0.128 0.241 0.111
HK CSI 04 -0.034 -0.050 0.017 0.066 0.029 -0.015
HK CSI 05 0.182 0.022 -0.105 -0.082 -0.121 -0.048
HK CSI 06 -0.013 0.129 0.009 0.097 0.230 0.156
HK CSI 07 0.118 0.106 0.212 0.130 -0.015 -0.075
HK CSI 08 -0.067 0.032 0.052 0.023 0.216 0.244
HK CSI 09 -0.049 0.112 0.154 0.092 0.183 0.103
HK CSI 10 -0.133 0.094 0.112 -0.024 0.219 0.060
HK CSI 11 -0.163 0.055 0.254 0.141 0.248 0.073
HK CSI 12 -0.113 0.031 0.170 0.119 0.333 0.203
HK CSI 13 -0.064 0.027 0.272 0.134 0.255 0.032
HK CSI 14 -0.019 0.132 0.162 0.029 0.350 0.211
HK CSI 15 0.001 -0.033 0.072 -0.181 0.071 -0.102
HK CSI 16 -0.106 -0.021 0.092 -0.175 0.035 -0.161
HK CSI 17 -0.065 0.086 0.132 -0.004 0.291 -0.050
HK CSI 18 -0.023 0.050 0.064 0.020 -0.021 -0.092
HK CSI 19 0.045 -0.112 0.051 -0.013 -0.034 -0.118
HK CSI 20 0.129 -0.040 -0.178 -0.176 -0.098 -0.136
HK CSI 21 0.039 0.027 -0.030 -0.060 0.051 -0.109
HK CSI 22 0.123 -0.010 -0.145 -0.214 -0.094 -0.228
HK CSI 23 0.023 -0.040 0.072 0.096 0.076 -0.011
HK CSI 24 0.044 0.067 -0.010 0.034 -0.062 -0.163
HK CSI 25 0.060 0.046 0.097 0.173 0.036 0.045
HK CSI 26 0.147 -0.017 0.090 0.228 0.173 0.170
HK CSI 27 0.157 0.022 0.022 0.089 0.066 -0.076
HK CSI 28 0.017 0.153 0.014 0.100 -0.029 -0.024
HK CSI 29 -0.029 -0.054 -0.091 -0.070 -0.031 0.066
HK CSI 30 -0.063 -0.015 0.092 0.028 0.122 0.127
HK CSI 31 1.000 0.095 -0.164 0.034 -0.052 -0.096
HK CSI 32 0.095 1.000 0.060 0.095 0.065 0.064
HK CSI 33 -0.164 0.060 1.000 0.354 0.156 0.173
HK CSI 34 0.034 0.095 0.354 1.000 0.180 0.320
HK CSI 35 -0.052 0.065 0.156 0.180 1.000 0.420
HK CSI 36 -0.096 0.064 0.173 0.320 0.420 1.000
HK CSI 37 0.138 -0.015 0.271 0.042 0.072 0.015
HK CSI 38 0.057 0.088 0.358 0.239 0.169 0.095
HK CSI 39 0.058 -0.009 0.152 0.113 0.186 0.107
Correlation
HK CSI 40 -0.016 -0.025 -0.045 -0.100 -0.103 -0.025

97
Correlation Matrix HK CSI 37 HK CSI 38 HK CSI 39 HK CSI 40
HK CSI 01 -0.003 0.063 -0.043 0.050
HK CSI 02 0.105 0.053 -0.001 0.017
HK CSI 03 0.132 0.032 0.023 0.153
HK CSI 04 0.060 0.001 -0.020 0.149
HK CSI 05 -0.089 -0.078 -0.063 0.135
HK CSI 06 0.245 0.186 0.068 -0.013
HK CSI 07 0.027 0.029 -0.021 0.050
HK CSI 08 0.236 0.075 0.195 -0.027
HK CSI 09 0.196 0.259 0.150 -0.151
HK CSI 10 0.051 0.109 0.043 -0.266
HK CSI 11 0.125 0.202 0.127 -0.094
HK CSI 12 0.173 0.226 0.172 -0.219
HK CSI 13 0.168 0.227 0.169 -0.060
HK CSI 14 0.093 0.137 0.209 -0.022
HK CSI 15 0.146 0.031 0.005 -0.294
HK CSI 16 0.011 0.029 0.062 -0.203
HK CSI 17 0.058 0.144 0.028 -0.153
HK CSI 18 0.110 0.170 -0.070 -0.100
HK CSI 19 0.183 0.108 -0.048 -0.027
HK CSI 20 0.036 -0.030 -0.061 0.052
HK CSI 21 0.107 0.056 0.010 -0.073
HK CSI 22 -0.030 -0.103 -0.064 0.051
HK CSI 23 0.174 0.092 0.103 -0.212
HK CSI 24 -0.260 -0.198 -0.245 0.025
HK CSI 25 0.072 0.014 0.058 -0.009
HK CSI 26 0.123 0.064 0.220 -0.001
HK CSI 27 0.082 0.040 -0.009 0.049
HK CSI 28 0.126 0.140 0.119 -0.179
HK CSI 29 -0.036 -0.128 0.001 0.111
HK CSI 30 -0.015 0.006 -0.004 -0.059
HK CSI 31 0.138 0.057 0.058 -0.016
HK CSI 32 -0.015 0.088 -0.009 -0.025
HK CSI 33 0.271 0.358 0.152 -0.045
HK CSI 34 0.042 0.239 0.113 -0.100
HK CSI 35 0.072 0.169 0.186 -0.103
HK CSI 36 0.015 0.095 0.107 -0.025
HK CSI 37 1.000 0.548 0.399 -0.141
HK CSI 38 0.548 1.000 0.493 -0.118
HK CSI 39 0.399 0.493 1.000 -0.023
Correlation
HK CSI 40 -0.141 -0.118 -0.023 1.000

98
KMO and Bartlett's Test
.649
1868.653
780
.000
Kaiser-Meyer-Olkin Measure of SamplingAdequacy.
Approx. Chi-Square
df
Sig.
Bartlett's Test ofSphericity
Scree Plot
Component Number
39373533312927252321191715131197531
Eig
enva
lue
6
5
4
3
2
1
0

99
Communalities
1.000 .451
1.000 .641
1.000 .793
1.000 .548
1.000 .607
1.000 .621
1.000 .715
1.000 .611
1.000 .689
1.000 .710
1.000 .651
1.000 .602
1.000 .690
1.000 .739
1.000 .778
1.000 .767
1.000 .676
1.000 .626
1.000 .605
1.000 .766
1.000 .672
1.000 .714
1.000 .733
1.000 .673
1.000 .724
1.000 .758
1.000 .733
1.000 .643
1.000 .573
1.000 .571
1.000 .634
1.000 .591
1.000 .735
1.000 .688
1.000 .662
1.000 .773
1.000 .712
1.000 .714
1.000 .641
1.000 .765
HK CSI 01
HK CSI 02
HK CSI 03
HK CSI 04
HK CSI 05
HK CSI 06
HK CSI 07
HK CSI 08
HK CSI 09
HK CSI 10
HK CSI 11
HK CSI 12
HK CSI 13
HK CSI 14
HK CSI 15
HK CSI 16
HK CSI 17
HK CSI 18
HK CSI 19
HK CSI 20
HK CSI 21
HK CSI 22
HK CSI 23
HK CSI 24
HK CSI 25
HK CSI 26
HK CSI 27
HK CSI 28
HK CSI 29
HK CSI 30
HK CSI 31
HK CSI 32
HK CSI 33
HK CSI 34
HK CSI 35
HK CSI 36
HK CSI 37
HK CSI 38
HK CSI 39
HK CSI 40
Initial Extraction
Extraction Method: Principal Component Analysis.

100
Total Variance Explained
4.902 12.255 12.255 4.902 12.255 12.255
3.565 8.911 21.166 3.565 8.911 21.166
2.931 7.326 28.492 2.931 7.326 28.492
2.367 5.919 34.411 2.367 5.919 34.411
1.967 4.916 39.327 1.967 4.916 39.327
1.568 3.921 43.248 1.568 3.921 43.248
1.491 3.728 46.976 1.491 3.728 46.976
1.332 3.329 50.306 1.332 3.329 50.306
1.281 3.203 53.508 1.281 3.203 53.508
1.241 3.102 56.610 1.241 3.102 56.610
1.141 2.852 59.463 1.141 2.852 59.463
1.130 2.826 62.289 1.130 2.826 62.289
1.064 2.659 64.948 1.064 2.659 64.948
1.015 2.537 67.485 1.015 2.537 67.485
.931 2.327 69.812
.894 2.234 72.046
.826 2.065 74.111
.805 2.012 76.124
.771 1.928 78.051
.739 1.848 79.900
.706 1.765 81.665
.651 1.629 83.293
.624 1.560 84.853
.616 1.539 86.393
.546 1.366 87.758
.514 1.286 89.044
.495 1.237 90.281
.463 1.157 91.437
.452 1.130 92.567
.399 .999 93.566
.383 .958 94.524
.316 .791 95.315
.304 .761 96.076
.278 .694 96.770
.263 .658 97.428
.255 .637 98.065
.239 .598 98.664
.212 .529 99.193
.175 .438 99.631
.147 .369 100.000
Component1
2
3
4
5
6
7
8
9
10
11
12
13
14
15
16
17
18
19
20
21
22
23
24
25
26
27
28
29
30
31
32
33
34
35
36
37
38
39
40
Total % of Variance Cumulative % Total % of Variance Cumulative %
Initial Eigenvalues Extraction Sums of Squared Loadings
Extraction Method: Principal Component Analysis.

101
Component Matrixa
Component
1 2 3 4 5 6 7 8
HK CSI 01 -0.510
HK CSI 02 0.335 -0.442
HK CSI 03 0.367 0.344 -0.540
HK CSI 04 0.333 -0.454
HK CSI 05 -0.334 0.453
HK CSI 06 0.320 0.587
HK CSI 07 0.454 0.491 -0.357
HK CSI 08 0.353 0.346 0.467
HK CSI 09 0.627
HK CSI 10 0.584 -0.416
HK CSI 11 0.580
HK CSI 12 0.642
HK CSI 13 0.606 0.350
HK CSI 14 0.565
HK CSI 15 0.338 0.603
HK CSI 16 0.384 0.545 -0.391
HK CSI 17 0.588 -0.342
HK CSI 18 0.444 -0.328
HK CSI 19 0.370 -0.310 -0.431
HK CSI 20 0.739
HK CSI 21 0.662
HK CSI 22 0.690
HK CSI 23 0.301 0.307 0.354
HK CSI 24 0.499 0.367
HK CSI 25 0.431 -0.335
HK CSI 26 0.365 0.302 0.359 0.302
HK CSI 27 0.434
HK CSI 28 -0.401
HK CSI 29
HK CSI 30 0.350 -0.316
HK CSI 31
HK CSI 32 -0.367
HK CSI 33 0.417 -0.327
HK CSI 34 -0.314 0.334 0.429
HK CSI 35 0.519
HK CSI 36 -0.402 0.358
HK CSI 37 0.422 -0.592
HK CSI 38 0.486 -0.535
HK CSI 39 0.358 -0.448
HK CSI 40 -0.317
Extraction Method: Principal Component Analysis.

102
Component Matrixa
Component
9 10 11 12 13 14
HK CSI 01
HK CSI 02
HK CSI 03 -0.422
HK CSI 04
HK CSI 05
HK CSI 06
HK CSI 07
HK CSI 08
HK CSI 09
HK CSI 10
HK CSI 11
HK CSI 12
HK CSI 13
HK CSI 14
HK CSI 15
HK CSI 16
HK CSI 17
HK CSI 18 0.361
HK CSI 19
HK CSI 20
HK CSI 21
HK CSI 22
HK CSI 23 -0.397
HK CSI 24
HK CSI 25 -0.329 0.356
HK CSI 26 0.327
HK CSI 27 -0.426 -0.386
HK CSI 28 0.481
HK CSI 29 0.420 -0.328
HK CSI 30 -0.422
HK CSI 31 -0.435 0.360
HK CSI 32 0.454 0.323
HK CSI 33 0.416
HK CSI 34
HK CSI 35 0.380
HK CSI 36 0.370
HK CSI 37
HK CSI 38
HK CSI 39
HK CSI 40 0.449
Extraction Method: Principal Component Analysis.
a. 14 components extracted.

103
HK CSI - Factor Rotation (1st trail)
Rotated Component Matrixa
.554
.640
.735
.562
.608
.641
.702
.497
.519
.638 -.377
.665
.678
.678
.667
.671
.308 .608 -.371
.551 .357 -.319
.463
.382
.722
.670 .334
.678
.357
.436 .352 -.387
.450
.435
.360
.310
.338
.367 .337
.529
.310 -.384
.758
.751
.631
HK CSI 01
HK CSI 02
HK CSI 03
HK CSI 04
HK CSI 05
HK CSI 06
HK CSI 07
HK CSI 08
HK CSI 09
HK CSI 10
HK CSI 11
HK CSI 12
HK CSI 13
HK CSI 14
HK CSI 15
HK CSI 16
HK CSI 17
HK CSI 18
HK CSI 19
HK CSI 20
HK CSI 21
HK CSI 22
HK CSI 23
HK CSI 24
HK CSI 25
HK CSI 26
HK CSI 27
HK CSI 28
HK CSI 29
HK CSI 30
HK CSI 31
HK CSI 32
HK CSI 33
HK CSI 34
HK CSI 35
HK CSI 36
HK CSI 37
HK CSI 38
HK CSI 39
HK CSI 40
1 2 3 4 5
Component
Extraction Method: Principal Component Analysis. Rotation Method: Varimax with Kaiser Normalization.
Rotation converged in 9 iterations.a.

104
HK CSI - Factor Rotation (2nd trail)
Rotated Component Matrix a
.560
.673
.726
.551
.645
.658 .301
.651
.508
.460 -.364
.665
.733
.773
.762
.641
.568
.772
.669
.595
-.416 .545
.519
.795
.817
.752
HK CSI01HK CSI02HK CSI03HK CSI04HK CSI05HK CSI06HK CSI07HK CSI08HK CSI09HK CSI11HK CSI12HK CSI13HK CSI14HK CSI15HK CSI18HK CSI20HK CSI22HK CSI25HK CSI26HK CSI35HK CSI37HK CSI38HK CSI39
1 2 3 4 5Component
Extraction Method: Principal Component Analysis. Rotation Method: Varimax with Kaiser Normalization.
Rotation converged in 5 iterations.a.

105
HK CSI - Factor Rotation (3rd and the final trail)
Communalities
1.000
1.000
1.000
1.000
1.000
1.000
1.000
1.000
1.000
1.000
1.000
1.000
1.000
1.000
1.000
1.000
1.000
1.000
1.000
1.000
HK CSI01HK CSI02HK CSI03HK CSI04HK CSI05HK CSI07HK CSI08HK CSI11HK CSI12HK CSI13HK CSI14HK CSI15HK CSI18HK CSI20HK CSI22HK CSI25HK CSI35HK CSI37HK CSI38HK CSI39
Initial
Extraction Method: Principal Component Analysis.

106
Total Variance Explained
3.316 16.578 16.578 2.765 13.824 13.8242.142 10.711 27.289 2.197 10.986 24.8102.089 10.443 37.731 2.045 10.227 35.0371.581 7.905 45.636 2.021 10.105 45.1421.501 7.505 53.140 1.600 7.999 53.1401.126 5.630 58.770.994 4.969 63.740.909 4.546 68.285.821 4.103 72.389.795 3.973 76.362.683 3.416 79.778.649 3.243 83.020.596 2.981 86.002.541 2.706 88.707.520 2.600 91.307.439 2.194 93.502.395 1.976 95.477.329 1.645 97.123.317 1.587 98.710.258 1.290 100.000
Component1234567891011121314151617181920
Total% ofVariance
Cumulative% Total
% ofVariance
Cumulative%
Initial Eigenvalues Rotation Sums of Squared Loadings
Extraction Method: Principal Component Analysis.
Component Matrix a
5 components extracted.a.

107
Rotated Component Matrix a
.582
.692
.733
.573
.706
.770
.502
.666
.734
.786
.764
.675
.553
.786
.729
.594
.538
.797
.827
.752
HK CSI01HK CSI02HK CSI03HK CSI04HK CSI05HK CSI07HK CSI08HK CSI11HK CSI12HK CSI13HK CSI14HK CSI15HK CSI18HK CSI20HK CSI22HK CSI25HK CSI35HK CSI37HK CSI38HK CSI39
1 2 3 4 5Component
Extraction Method: Principal Component Analysis. Rotation Method: Varimax with Kaiser Normalization.
Rotation converged in 5 iterations.a.

108
10.4.5 Cronbach’s alpha Reliability method: Hong Kong CSI
Factor 1: Brand conscious and price equals quality consumer
R E L I A B I L I T Y A N A L Y S I S - S C A L E (A L P H A)
Mean Std Dev Cases
1. HKCSI11 2.8467 .9675 150.0 2. HKCSI12 3.1200 .8507 150.0 3. HKCSI13 2.9933 .8553 150.0 4. HKCSI14 2.3867 .8009 150.0 5. HKCSI35 3.0600 1.0182 150.0
N ofStatistics for Mean Variance Std Dev Variables SCALE 14.4067 10.1758 3.1900 5
Item-total Statistics
Scale Scale Corrected Mean Variance Item- Alpha if Item if Item Total if Item Deleted Deleted Correlation Deleted
HKCSI11 11.5600 6.7581 .4933 .7151HKCSI12 11.2867 6.8904 .5735 .6859HKCSI13 11.4133 6.7810 .5979 .6770HKCSI14 12.0200 7.1070 .5684 .6902HKCSI35 11.3467 7.0602 .3842 .7606
Reliability Coefficients
N of Cases = 150.0 N of Items = 5
Alpha = .7501

109
Factor 2: Perfectionistic and high-quality conscious consumer
R E L I A B I L I T Y A N A L Y S I S - S C A L E (A L P H A)
Mean Std Dev Cases
1. HKCSI01 4.1133 .8072 150.0 2. HKCSI02 3.7600 .7389 150.0 3. HKCSI03 3.7267 .7226 150.0 4. HKCSI04 4.1200 .6647 150.0 5. HKCSI08 3.2667 .9944 150.0
N ofStatistics for Mean Variance Std Dev Variables SCALE 18.9867 6.1206 2.4740 5
Item-total Statistics
Scale Scale Corrected Mean Variance Item- Alpha if Item if Item Total if Item Deleted Deleted Correlation Deleted
HKCSI01 14.8733 4.4872 .2871 .5908HKCSI02 15.2267 4.2033 .4526 .5072HKCSI03 15.2600 4.0997 .5122 .4786HKCSI04 14.8667 4.7740 .3114 .5769HKCSI08 15.7200 3.9479 .2996 .6033
Reliability Coefficients
N of Cases = 150.0 N of Items = 5
Alpha = .6066

110
Factor 3: Novelty and fashion-conscious consumer
R E L I A B I L I T Y A N A L Y S I S - S C A L E (A L P H A)
Mean Std Dev Cases
1. HKCSI15 2.8267 .9813 150.0 2. HKCSI18 3.8267 .7836 150.0 3. HKCSI20 3.6600 1.0022 150.0 4. HKCSI22 3.4200 .9712 150.0
N ofStatistics for Mean Variance Std Dev Variables SCALE 13.7333 6.8680 2.6207 4
Item-total Statistics
Scale Scale Corrected Mean Variance Item- Alpha if Item if Item Total if Item Deleted Deleted Correlation Deleted
HKCSI15 10.9067 4.2463 .4101 .5951HKCSI18 9.9067 5.1590 .3076 .6537HKCSI20 10.0733 3.7731 .5369 .4980HKCSI22 10.3133 4.0824 .4695 .5515
Reliability Coefficients
N of Cases = 150.0 N of Items = 4
Alpha = .6491

111
Factor 4: Habitual and brand-loyal consumer
R E L I A B I L I T Y A N A L Y S I S - S C A L E (A L P H A)
Mean Std Dev Cases
1. HKCSI37 3.0800 .9378 150.0 2. HKCSI38 3.3267 .9796 150.0 3. HKCSI39 2.7200 1.0108 150.0
N ofStatistics for Mean Variance Std Dev Variables SCALE 9.1267 5.6013 2.3667 3
Item-total Statistics
Scale Scale Corrected Mean Variance Item- Alpha if Item if Item Total if Item Deleted Deleted Correlation Deleted
HKCSI37 6.0467 2.9575 .5470 .6601HKCSI38 5.8000 2.6577 .6211 .5693HKCSI39 6.4067 2.8469 .5079 .7080
Reliability Coefficients
N of Cases = 150.0 N of Items = 3
Alpha = .7339

112
Factor 5: Price conscious and value for money consumer
R E L I A B I L I T Y A N A L Y S I S - S C A L E (A L P H A)
Mean Std Dev Cases
1. HKCSI05 3.5933 1.0561 150.0 2. HKCSI07 3.3933 1.1167 150.0 3. HKCSI25 3.7200 .8284 150.0
N ofStatistics for Mean Variance Std Dev Variables SCALE 10.7067 4.5979 2.1443 3
Item-total Statistics
Scale Scale Corrected Mean Variance Item- Alpha if Item if Item Total if Item Deleted Deleted Correlation Deleted
HKCSI05 7.1133 2.3696 .3423 .3684HKCSI07 7.3133 1.9884 .4327 .1879HKCSI25 6.9867 3.2884 .2075 .5632
Reliability Coefficients
N of Cases = 150.0 N of Items = 3
Alpha = .5055

113
10.4.6 Comparison of decision-making styles between Shanghai and Hong Kong
university consumer
T-Test 1: Brand conscious and price equals quality consumer
Group Statistics
150 2.3933 .75881 .06196
150 2.8813 .63799 .05209
PlaceShanghai
Hong Kong
Brand consciousand price equalsquality consumer
N Mean Std. DeviationStd. Error
Mean
Independent Samples Test
12.970 .000 -6.029 298 .000 -.4880 .08095 -.64730 -.32870
-6.029 289.465 .000 -.4880 .08095 -.64732 -.32868
Equal variancesassumed
Equal variancesnot assumed
Brand consciousand price equalsquality consumer
F Sig.
Levene's Test forEquality of Variances
t df Sig. (2-tailed)Mean
DifferenceStd. ErrorDifference Lower Upper
95% ConfidenceInterval of the
Difference
t-test for Equality of Means

114
T-Test 2: Perfectionistic and high-quality conscious consumer
Group Statistics
150 4.2222 .67739 .05531
150 3.7973 .49480 .04040
PlaceShanghai
Hong Kong
Perfectionistic andhigh-qualityconscious consumer
N Mean Std. DeviationStd. Error
Mean
Independent Samples Test
15.225 .000 6.203 298 .000 .4249 .06849 .29010 .55968
6.203 272.765 .000 .4249 .06849 .29005 .55973
Equal variancesassumed
Equal variancesnot assumed
Perfectionistic andhigh-qualityconscious consumer
F Sig.
Levene's Test forEquality of Variances
t df Sig. (2-tailed)Mean
DifferenceStd. ErrorDifference Lower Upper
95% ConfidenceInterval of the
Difference
t-test for Equality of Means

115
T-Test 3: Novelty and fashion-conscious consumer
Group Statistics
150 3.0156 .89521 .07309
150 3.4333 .65517 .05349
PlaceShanghai
Hong Kong
Novelty andfashion-consciousconsumer
N Mean Std. DeviationStd. Error
Mean
Independent Samples Test
10.653 .001 -4.612 298 .000 -.4178 .09058 -.59603 -.23952
-4.612 273.033 .000 -.4178 .09058 -.59610 -.23946
Equal variancesassumed
Equal variancesnot assumed
Novelty andfashion-consciousconsumer
F Sig.
Levene's Test forEquality of Variances
t df Sig. (2-tailed)Mean
DifferenceStd. ErrorDifference Lower Upper
95% ConfidenceInterval of the
Difference
t-test for Equality of Means

116
T-Test 4: Habitual and brand-loyal consumer
Group Statistics
150 2.9222 .82143 .06707
150 3.0422 .78890 .06441
PlaceShanghai
Hong Kong
Habitual andbrand-loyal consumer
N Mean Std. DeviationStd. Error
Mean
Independent Samples Test
.812 .368 -1.290 298 .198 -.1200 .09299 -.30300 .06300
-1.290 297.515 .198 -.1200 .09299 -.30300 .06300
Equal variancesassumed
Equal variancesnot assumed
Habitual andbrand-loyal consumer
F Sig.
Levene's Test forEquality of Variances
t df Sig. (2-tailed)Mean
DifferenceStd. ErrorDifference Lower Upper
95% ConfidenceInterval of the
Difference
t-test for Equality of Means

117
T-Test 5: Price conscious and value for money consumer
Group Statistics
150 3.6000 .81306 .06639
150 3.5689 .71476 .05836
PlaceShanghai
Hong Kong
Price consciousand value formoney consumer
N Mean Std. DeviationStd. Error
Mean
Independent Samples Test
1.209 .272 .352 298 .725 .0311 .08839 -.14284 .20506
.352 293.185 .725 .0311 .08839 -.14285 .20507
Equal variancesassumed
Equal variancesnot assumed
Price consciousand value formoney consumer
F Sig.
Levene's Test forEquality of Variances
t df Sig. (2-tailed)Mean
DifferenceStd. ErrorDifference Lower Upper
95% ConfidenceInterval of the
Difference
t-test for Equality of Means

118
T-Test 6: Impulsive and careless consumer
Group Statistics
150 2.6778 .53431 .04363
150 .0000 .00000 .00000
PlaceShanghai
Hong Kong
Impulsive andcareless consumer
N Mean Std. DeviationStd. Error
Mean
Independent Samples Test
282.813 .000 61.380 298 .000 2.6778 .04363 2.59192 2.76363
61.380 149.000 .000 2.6778 .04363 2.59157 2.76398
Equal variancesassumed
Equal variancesnot assumed
Impulsive andcareless consumer
F Sig.
Levene's Test forEquality of Variances
t df Sig. (2-tailed)Mean
DifferenceStd. ErrorDifference Lower Upper
95% ConfidenceInterval of the
Difference
t-test for Equality of Means