Embed Size (px)
Citation preview

1
Analysts:
Ben Coverick
Dwight Bode
Company Overview:
Under Armour, Inc. emerged in 1996 at the forefront of the new market of performance apparel.1 Under Armour’s core business operations are primarily based in the United States. However, over the past decade Under Armour has grown substantially in foreign markets, specifically in Europe and Asia. Under Armour’s FY2015 performance was another strong growth year, with $3.8B in net sales up 31% from 2014’s $2.9B in net sales.1
Stock Performance Highlights
52-week High $49.51
52-week Low $30.06
Average Daily Volume 5.28M
Share Highlights
Current Trading Price (11/14/16) $31.17
Market Capitalization 12.86B
Shares Outstanding 183.39M
Book Value Per Share 4.39
EPS 0.45
Trailing P/E Ratio 70.71
Target Price: $36.00 – $39.00
Current Price: $31.82
Company Performance Highlights
ROA 8.14%
ROE 15.00%
International Revenue $454M
Financial Ratios
Current Ratio 2.36
Debt to Equity 55.83%
Forward Ratios
2018 ROA 10.27%
2018 ROE 16.20%
Key Investment Information
• Under Armour’s rapid growth, especially internationally, is necessary in the future to keep up with Nike’s performance.
• Under Armour’s investments need to provide further stability in production to maintain competitive industry ratios.
• Sports Apparel Industry expected to grow by $83B to a $196B industry by 2020, which is an opportunity Under Armour needs to capitalize on.
Krause Fund Research Fall 2016
Recommendation: HOLD November 14, 2016
Consumer Discretionary Under Armour, Inc. (NYSE: UA)

2
Future Opportunities
Growing Customer Base: Under Armour has recently closed a few major deals to increase sales. Kohl’s and Sporting Direct International, United Kingdom’s version of Dick’s Sporting Goods, will begin selling Under Armour products beginning in 2017 in half of their retail outlets2. Outside of retail stores, they are growing customer by growing direct-to-customer at an impressive rate.
Source: Market Realist
International Growth: Over the past five years specifically, Under Armour’s international presence and growth has significantly increased. Last year’s overseas sales were $454M compared to 2011’s $89M1.
Products: Under Armour’s products continue to be at the top of the industry in terms of innovation. Recently, it has been with the addition of the Stephen Curry shoe line, which has grown the company’s footwear segment exponentially3. The company recently launched a new Under Armour Sportswear clothing line in an effort to enter into the normal retail clothing sector4.
Source: Bloomberg
One Year Stock Performance
The graph below represents Under Armour’s stock performance compared to the S&P 500 Index YTD. The purple line represents the performance of Under Armour and the green line represents the performance of the S&P 500.
Source: Bloomberg
We are issuing a HOLD rating for Under Armour, Inc. (UA) for the Krause Fund portfolio. This decision is based on Under Armour’s growth expectations, product innovation, and market share. Under Armour’s twenty-six straight quarter run at 20% or more quarter-over-quarter growth is impressive. We believe that this growth will continue into the future for Under Armour1. However, in the short-term, Under Armour still lacks in market share relative to the main competitor Nike. With less deep pockets and the needing to catch up, Under Armour will be required to invest heavily in the coming years. Long term, the company will perform well based off past history. In the short term, heavy investments in footwear, fitness technology, and innovative apparel will cause the company to be less profitable.
Executive Summary

3
Real GDP
The third quarter advanced estimate has real GDP growing at a rate of 2.9 percent. This is the fastest pace in over two years6.
Source: U.S. Bureau of Economic Analysis
The biggest drivers of the growth are seen through consumer spending, net exports, and inventory spending. If consumers are making more purchases and businesses are confident to be stocking up on inventory, it is a positive sign for retail sales going forward6. Business inventory added 0.61 percentage points, which is a great sign considering it was dragging down the number for the last 5 quarters6. Business investment, strong in Q2, is beginning to lag behind. This is due to uncertainty that is highly prevalent in the current economy6. With the election over and more news on interest rates in December, we expect a clearer picture of things to come. With a growing economy, we expect business investment to pick back up going forward.
US Retail Sales
U.S. retail sales picked back up after decelerating 0.2% in August. This was below consensus. Since then, sales have picked back up much quicker than expected, growing 0.6% in September, which beats the expectations of only 0.4%7.
Source: U.S. Census Bureau via Trading Economics
This is another positive sign for the retail space. In the last 3 months, consumers have been shying away from retail spending. In October, the consensus is that it will stay up at 0.5%. September data and October’s expectations paint the picture that the consumer is beginning to feel more comfortable spending again, which is a sign of good things to come moving forward7.
US Consumer Confidence
To further support the claim that consumers are becoming more comfortable, we took a look at the US Consumer Confidence data. In November, consumer confidence hit a 5 month high, with a reading of 91.6. This is up from 87.2 in October of 20168. Historically, dating back to 1952 the US average is 85.928. This data supports that US consumers are confident about the future and the current conditions.
Source: Trading Economics
Macroeconomic Outlook

4
Strength of the Dollar
The U.S. dollar has hit an 11-month high9. Expectations of Donald Trump cutting taxes, boosting fiscal policy, and future fed rate hikes are driving the change. Under Armour, who is currently heavily focused on international sales, will see a negative impact due to the currency headwinds. As long as the dollar continues to strengthen, Under Armour will see downward pressure on their bottom line profits. The following graph takes a look at the U.S. Dollar over the last 5 years and the last couple years shows an overwhelming trend of growing strength9. As the U.S. continues to be a strong economy relative to the rest of the world, the trend does not look like it will be reversing.
U.S. Dollar Index Historical Chart
Source: MacroTrends.net
Asia Pacific
Under Armour’s presence in the region is predominately in China. China, a hot-spot for growth, has seen a slow-down in recent years. However, relative to the rest of the world, China is still growing at a rapid rate. In the September quarter, the Chinese GDP grew at an annual rate of 6.7%, which is far more than its North American counterparts10.
China has also continued to display retail sales growth within their economy. In September, retail sales rose 10.7% year-over-year10. This is the highest it has been since December 2015. According to the
Euromonitor, China will exceed the United States and become the world’s largest apparel market by 201911. The future in the region looks optimistic, so Under Armour has a tremendous opportunity if they can capitalize on their investments here.
Latin-America
Latin-America, plagued by low commodity prices, political uncertainty, and financial market volatility creates an environment that does not provide a large opportunity for Under Amour in the near future. Latin America’s economy is projected to decelerate by 0.6% this year after seeing no growth at all in 201512. With the current conditions, their does not appear to be a large consumer base for Under Armour’s products. This summer, consumer confidence fell in 6 out of the 7 countries surveyed that make up the region and have yet to pick up significantly in recent quarters12.
However, thinking longer term, Latin-America will provide another consumer base for Under Armour. Although not as large as other countries, the middle-class has grown 11% since 200112. As a region that primarily profits from exports, when commodity prices bounce and countries like China begin to pick back up, the region will start to see more favorable growth. Long term, poverty appears to be dropping, incomes continue to grow, and as the region develops, it provides an opportunity for Under Armour to grow revenue.
5
Source: The Atlantic
Europe
Europe has seen relatively slow-growth in recent years. In their most recent quarter, Q3, the economy grew at a nearly flat pace of 0.3%. Also, inflation has recently hit a two-year high with a reading of 0.4%13. ECB President has called under 1% the danger zone for inflation and attributes it to slow growth and low oil prices14. The region has adopted policies of heavy quantitative easing as they try to stimulate inflation back to 2%, address their employment bottleneck, and to start heading into a growth phase14.
Under Armour is specifically targeting the Europe market as a long term strategy to grow their brand internationally. They are primarily in the region doing partnerships with major sports programs like the Tottenham Hotspurs and Scottland’s Andy Murray. In the short term, the European economy has been slow to recover from the economic crisis and has become a place of uncertainty due to Brexit. Because of that, it does not provide an opportunity for Under Armour to make a lot of money. However, going forward, if Under Armour can grow their brand in the region, when many of the world’s largest
economies begin to recover, they will be at the forefront to take advantage of the opportunity.
Overview
Our team identifies Under Armour to be operating in the Sports Apparel Industry, which primarily consists of providing products that are comfortable and agile during physical movements. The industry is dominated by a relatively small number of companies that include: Nike Inc., Adidas, Under Armour Inc.
Source: 1010data Facts for Econ Insights
Over the past decade the sub-industry has gone through an extreme low period during the recession years. However, following the recession there has been a notable acceleration. The acceleration has been linked to the importance of globalization. With a saturated United States market, many companies are attempting to tap into emerging and foreign markets to continue economic success15.
Industry Analysis

6
Source: Bird of Gold; MGI; HHTWS; McKinsey analysis
Industry Drivers & Trends
Increasing Disposable Income:
The Sports Apparel Industry is largely dependent on consumer’s ability to afford its trendy sports apparel. Therefore, disposable income is a large driver in determining whether the industry will have strong performance. A positive outlook and growth in many countries around the world has translated into the increase of sports apparel sales. In countries such as China the overall disposable income is up to $4.7B compared to $2.8B in 2011. The United States has also seen similar growth up to $41.0B from 2011’s $37.8B. Historical evidence, pictured below, indicates that the purchasing of clothing and disposable income are directly linked17.
Source: Statistic Canada, Distributive Trade Division
Fashion Trends:
Sports Apparel and footwear sales have jumped 42% to $270B over the past seven years2. Analysts at Morgan Stanley predict that the industry could add
another $83B in sales by 2020, which is over 30% growth from today15. What we wear is dependent on the society that influences the consumers. Across the world, healthy living and fitness are becoming a more intricate part of everyday life. For example, since 1980, the United States high school sports participation rate is up from 25% to 35% today17. China is another nation where active living is becoming more and more the social norm. The Chinese government plans to build 60% more sporting facilities throughout the country in an attempt to provoke further active lifestyles across the nation17. Overall, the world society is moving away from the old fashioned styles of a couple decades ago and moving to a “ath-leisure” style, which for many is believed to be the trend of the future.
Counterfeit Products:
The sports apparel industry provides higher quality products but come with a higher end price tag. Over the course of the past decade, the industry has come under threat from local suppliers replicating the products and distributing them at a lower more affordable price. During 2010, the United States Immigration and Customs Enforcement Agency estimated that the value of counterfeit trade during that year was approximately $600M18. Specifically, in the Sports Apparel industry, Adidas lost upwards of $12M due to counterfeit products18. The exposure that the industry has with counterfeit is relatively high. Counterfeit merchandise is prevalent in all parts of the world and poses a sales threat in the Sports Apparel Industry.
Competitive Environment
Comparable Company Analysis:
Our group identified two primary competitors: Adidas AG and Nike, Inc. (NYSE: NKE). These companies were chosen based on market capitalization, sales growth, and brand recognition. The following comparisons were chosen at the

7
discretion of our team to represent the competitive industry of sports apparel. Although VF Corporation has high performance in the revenue for the sporting goods industry, we do not believe they are a direct competitor of Under Armour, because VF Corporation focuses primarily on outdoor sporting. Under Armour focuses on performance based sporting apparel.
Source: Statista
Although Under Armour is not the leader of the Sports Apparel Industr0,y there are multiple promising signs that Under Armour will soon begin to threaten Nike, Inc. for the top position. First, Under Armour is by far the youngest competitor, recently going public in 2005. The company has shown exponential growth since its initial public offering growing its revenue from $281M in 2005 to 2015 $3.96B, a 1,309% growth1. In comparison to its main competitors, Adidas has only grown sales by 155% and Nike at 136%19 20. Under Armour also has the highest growth expectations through 2018 at 25% per year growth. Whereas Nike and Adidas are expected to grow at 9.2% and 15% respectively1.
Secondly, these company’s brand image is a major part in their financial success or demise. That being said, Under Armour has many more major influential athletes that market their products21. These athletes include: Stephen Curry, Cam Newton, Jordan Speith, Tom Brady and Michael Phelps. Some argue that these athletes have been a major part of their most
recent success. Adidas is specifically lacking in this crucial segment of the Sports Apparel industry. Their most notable athletes are Derrick Rose, Ricky Rubio, and Dwight Howard. In terms of Nike’s athletic sponsorships, many would argue that they have the best athletes, such as Michael Jordan, Lebron James, and Cristiano Ronaldo. Athletic sponsorships are a very impactful way of marketing your company21.
Source: HedgeEye
Another field that Under Armour, Adidas, and Nike compete for in terms of brand recognition is in the sponsorship of college and professional sports teams. This is an important element due to the fact that the entire team would be wearing the company’s brand during the actual games, rather than just making commercials for the company. Colleges typically earn between $1M and $15M annually with these sponsorship contracts23. Nike has historically dominated these sponsorships with about 53.1% of college’s wearing Nike apparel on game day, compared to Under Armour’s 11.7% and Adidas’s 24.2%23. However, this may be taking a change in the coming years due to contracts expiring in the major five power conferences. A study recently done at Louisville University breaks down how much money universities earn per fan23.

8
Source: The Cardinal Connect
This study shows that if universities are interested in earning maximum returns from the three major athletic apparel companies, that Under Armour is the best option. This is a great potential opportunity for Under Armour to pitch their company sponsorship and gain market share in the collegiate sporting universe.
Source: Bloomberg
Under Armour’s comparison to Nike is the most important, as Nike dominates the industry and is the purest comparable company. Most notably, Under Armour trades at a way higher premium. As a growth company, noted by their 30.09% 5-year growth rate, the future expectations are priced into the stock. On Nike’s side, they are veteran in the space. However, they are still experiencing growth and relative to the market, they trade at a slight premium as well. Nike still sees near double digit revenue growth and grew net income 6% in their most recent quarter23. Nike, as a pioneer in the space, already has the large market share that Under Armour is trying to steal. Nike had $3.07 Billion
dollars of revenue come from China and saw Chinese revenue up 21% in their recent earnings23. On the flip side, Under Armour only saw roughly 454 million in total international revenue1. In terms of growth opportunities for Under Armour, Nike is also positioned well ahead in the footwear space with 62% of the market share.
Source: The NPD Group Inc.; Retail Tracking Service
Nike is able to be more profitable, due to the lack of competition in these types of spaces, which is a big reason why they post nearly twice the net profit margin of Under Armour.
Going forward, Under Armour is going to have to continue their growth in order to keep up with Nike. Nike is clearly superior in the space, most efficient, and well established. However, if Under Armour can continue their growth, capture Nike’s market shares in key spaces, and begin to be more efficient with their investments going forward, then they have the opportunity to become the elite brand.
Porter’s Five Forces
Competitive Rivalry: HIGH
Competition is intense in the sports apparel industry. Customers can switch very easily among brands, making it a constant fight for business. Marketing and advertising becomes a huge impact as companies try to grow their brand name and differentiate from the pack. Apparel is also easily

9
duplicated, requiring companies to spend money investing in innovative and new product lines.
Bargaining Power of Suppliers: LOW
Raw materials for this industry can be supplied from numerous sources, limiting the power of the suppliers. Under Armour, Nike, Adidas, etc. are all large enough that they can make large volume deals with suppliers in numerous countries. Also, Under Armour has no contractual agreements with their suppliers, allowing them to have the freedom to move around and constantly negotiate costs1.
Bargaining Power of Customers: MEDIUM
This industry has two major types of customers: retailers and consumers. In terms of retailers, they have the ability to squeeze margins, because apparel companies rely on them to sell a large volume of their products. They have many products they can sell, with no obligation for any particular, so they demand more of the companies that want into their store. In terms of direct consumers, they have power as well. In sports apparel, there are many major brands, which allows for them to easily convert or move around. Companies like Under Armour must work with these customers, as building a loyal and strong customer base is vital.
Threat of New Entrants: LOW
This industry is extremely hard to succeed in and requires a lot of capital. This makes becoming a major player extremely difficult. Younger companies do not have the capital to afford the marketing and advertising that goes in to building a brand. Even if a company is able to afford growing, they still have to gain market share and grow in an extremely competitive environment.
Threat of Substitutes: LOW
The future of sports looks bright and the correct apparel is needed. So as long as there are sports, there will always be a need for the apparel.
Considering the history and future trends, the demand for sports apparel does not seem like an issue.
Analysis of Recent Earnings:
On October 25th, 2016, Under Armour reported better-than-expected Q# earnings. Under Armour reported earnings per share of $0.29 with $1.47 billion in revenue, which topped analyst expectations of $0.25 in earnings, with $1.45 billion in revenue2. However, the stock fell around 14% following the announcement. The sharp decline was driven by management’s guidance.
Under Armour, reporting its 26th consecutive quarter of +20% growth in revenue, has seen clearly seen tremendous growth in the past. Annual sales grew 27%, 32%, and 28% in 2013, 2014, and 2015 respectively2. Going forward, management is projecting a slowdown, with sales growth in the next two years being in the “low 20s”. The full-year 2016 revenues are projected to be a growth of 24%2.
Source: Under Armour via Fourtune
With that being said, Under Armour still is optimistic in the future, reiterating their 2015 investor day
Company Specific

10
goals of $7.5 billion in revenue and $800 million in operating income by 20182.
Products and Costs
Under Armour is known for producing high quality products that range from hot and cold gear to footwear.
Source: Under Armour Financial Statements
A majority of Under Armour’s revenue is through the sale of its apparel1. Looking forward, this is a very positive trend due to Global Industry Analysts and Wall Street Journal’s expectation for a growth of $89B or a 7.1% CAGR of the Sports Apparel Industry17. The drivers of this growth are represented in our industry outlook. As this growth of the industry continues, Under Armour is expected to receive the benefits of this through their sales of performance based apparel.
In an effort to remain the leader of innovation in the industry, Under Armour launched a new product line this September, which tends to differ from its typical performance based 4. The new line, Under Armour Sportswear, offers customers everyday apparel such as sweaters, jeans, t-shirts, khakis, and various casual shoe styles. Although this is a major shakeup in its historical business model Under Armour has historically performed strong after the release of new products.
Source: Market Realist
Under Armour’s footwear product line last year grew by a tremendous 57% on the year to $677M24. This large growth has been linked to the Stephen Curry shoe line, which according to retailers has been taking some market share away from Nike’s Lebron James shoe line24. The addition of Stephen Curry, who is the defending MVP of the NBA, shoe line has boosted shoe line sales tremendously and Under Armour is targeting its annual footwear sales to $1.7B by 201824.
The costs to produce Under Armour products are comparable to its rivals Nike and Adidas who post Gross Operating Margins of 45.72% and 48.24% respectively, to Under Armour’s 47.30%15. In terms of the future of costs for Under Armour’s manufacturing will continue to remain about the same percentage of sales as it is now. However, lower oil prices and an increase towards direct-to-customer sales will help Under Armour increase their current profit margin of about 5.94% to be more competitive with Nike’s 11.25%. Under Armour, in terms of profit margin, is better than Adidas’s 3.27%25. Overall, Nike has a high profit margin due to a few elements that Nike, as a mature company, still has the upper hand on compared to Under Armour. One is that Nike pays a significant lower tax rate. This is because Nike produces higher revenue streams from overseas markets that have lower tax
Apparel71%
Footwear17%
Accessories9%
License2%
Connected Fitness
1%
2015 REVENUE BREAKDOWN

11
rates26. In terms of manufacturing, Nike is moving to a more highly automated manufacturing technology, which is assisting in decreasing Nike’s labor costs by 50%26. Finally, Nike has historically had much higher direct-to-costumer sales relative to Under Armour. However, as of 2015, Under Armour has caught up to Nike’s 30% growth rate of DTC sales26. Overall, Under Armour is looking into the future with a positive outlook on lowering their costs, growing sales internationally, and increasing direct-to-costumer sales. All of these will tremendously help their profit margin in the future.
Fitness Tech:
The Connected Fitness is made up of MapMyFitness, Endomondo, and MyFitnessPal. The goal is to provide technology that helps train, perform, and improve. MapMyFitness allows users to map out, record, and track their workouts with detailed statistics. Endomondo allows users to track and share their fitness and health statistics. MyFitnessPal is a nutritional application that allows users to track their calorie count and create diet plans. Together, these applications create a greater fitness experience, while allowing Under Armour to better understand their target market. In 2015, it only accounted for 1.3% of total revenue, but it is expanding rapidly1. Connected fitness revenues grew 40% in Q3 to 20 million. They are adding 125,000 users per day and continuing to invest more27.
They are now developing and beginning to roll out the HealthBox system. They have a set of physical products including a UA band to measure heart rate, steps, and sleep, as well as a scale to track weight and body fat percentage27. They’ve also began selling a chest strap and wireless headphones that can both track your heart rate, while running. These products are relatively new, but with the fast growth they have seen in Connected Fitness, we and the company are both optimistic. Under Armour is well positioned to capture market share in the Fitness Technology space, which is a popular trend.
Catalysts for Growth
Footwear Expansion
Under Armour is seeing success in attempting to grow their footwear business. In 2012, the footwear line was only a $239 million part of the business, but now is approaching $1 billion in revenue for the firm. Footwear is outpacing apparel growth by 2.0x to 2.5x and the company is expecting that footwear could soon be larger than apparel28. In the first nine months of 2016, footwear sales increased 54% from a year ago, while apparel revenue jumped only 19%24. This year, during the back-to-school shopping season, Under Armour saw their footwear market share double28. If Under Armour can continue to grow their apparel sales and market share, then Under Armour will become very large.
International Growth
Under Armour has seen tremendous growth in international markets after expanding overseas. For example, Q3 2016 saw international revenues up 74% (80% without the effects of currency). That makes it now 15% of total revenue. This is largely due to growth in China2. When Under Armour started selling in China it was 2010 and they did about $1 million in revenue1. They are now projected over $150 million for the 2016 year (which represents a 157% increase YTD)2. Under Armour will continue this growth. They are currently only at 239 partner stores internationally, which is expanding as they are on track to have added 150 partner stores in 20162. They are also getting plenty of e-commerce business overseas, and with countries like China seeing massive growth in internet usage, Under Armour will get another international business boost.
Partnership with Kohl’s
Kohl’s will now sell Under Armour products. The CEO says this will be rolled out beginning right away in 201729. Kohl’s primary shopping demographic is

12
women29. This allows Under Armour to build on their women’s business, which is needed after a slow down.
Source: Morgan Stanley via Business Insider
The graph shows that women’s sales has seen high periods of growth in the last 3 years, but slowed down, before becoming negative in 201530. The graph demonstrates the opportunity for growth in the women’s apparel market, and the partnership with Kohl’s could recreate that opportunity30. The graph below shows how Piper Jaffrey’s survey of women revealed Kohl’s is consistently the number one choice for their clothing shopping.
Source: Piper Jaffrey via Business Insider
Direct-to-Consumer Sales
With the closing of Sport’s Authority and the struggles of brick-and-mortar stores, Under Armour needs to be able to adapt their business model. So far, they have been doing a good job of transitioning to selling directly with consumers. This has not only allowed them to survive via maintaining sales, but it
is also more profitable being able to sell at full price, rather than working with a distributor. Direct-to-consumer revenue has grown from 14% of total revenue in 2008 to 30% in 201531.
Source: Bloomberg
Under Armour has achieved this direct-to-consumer growth primarily through the e-commerce space. E-commerce sales grew 29% in their most recent quarter31. Under Armour should continue to see this growth going forward through the expansion of their Connected Fitness platform and international growth. The Connected Fitness platform has allowed Under Armour to capture data on geographic profiles, sleep, weight, diet, and exercise, given them information to better structure their websites. In terms of websites, they have also expanded into four new countries. They’ve launched websites in Mexico, Australia, New Zealand, and Chile bringing the total to 30 global sites. These developments in technology have grown global mobile traffic, which makes up 57% of their total e-commerce traffic. In 2011, it was only 5%31. The increase in mobile-friendly technology appears to be a huge success and space for growth moving forward.
SWOT Analysis
Strengths: Under Armour’s biggest strength is their ability to maintain rapid growth. With 26 consecutive quarters of 20% or more revenue growth, Under Armour has shown no sign of a slow-down. With the CEO Kevin Plank maintaining his goal

13
of becoming a bigger business, but still growing fast, we think that Under Armour has a strong future.
Weaknesses: Their biggest weakness is that Under Armour is still so heavily dependent on retail stores. Although they are beginning to transition, it still is a weakness for the company, as brick-and-mortar stores are not performing well.
Opportunities: Under Armour’s biggest opportunity is in the growth of their international sales. The growing middle class and sports apparel industry offers opportunities to continue capturing new markets. Under Armour also has the opportunity to capture the footwear market. With the help of Stephen Curry’s new shoe line, they have seen great success and the opportunity to get closer to Nike.
Threats: Competition in the space is their biggest threat. A veteran Nike company has far greater market share and efficient operations. Under Armour needs to invest heavily both nationally and internationally to effectively compete with Nike swoosh. Heavy investment poses a risk and requires significant capital for the company.
After our analysis of the economy, industry, and Under Armour we are issuing a HOLD rating of the Under Armour, Inc. (UA). We reached our target price, of $36.00-$39.00, by finding the intrinsic value of the stock by using a few different valuation methods. Although we used various valuation method’s such as the Discounted Cash Flow Method, Economic Profit Model and Dividend Discount Model, we have come to the conclusion that our DCF analysis has provided the best valuation going into the future of Under Armour. Throughout all of our valuation models we have moved our intrinsic value of the stock forward to November 14, 2016.
Forecasting Revenues
Revenue Decomposition
Our team broke down revenue into two distinct different categories, based on product type and geographic location. Forecasting our revenues, we believe that Under Armour will continue to go a relatively historical rate in the coming years. We made this assumption based on their consistent revenue growth numbers over the course of the last twenty-six quarters. Another reason why we continue their growth at such an elevated level is due to expectations that the Sports Apparel industry is expected to grow by an additional $83B in sales by the year 2020.
Product Revenue Decomposition
We believe that Under Armour’s continued speed of growth is due to their capitalization of the footwear product. The numbers we forecasted are aligned with management expectations in the future with footwear sales at $2.0B compared to our forecast of $1.85B by 2018. Another product we expect significant growth is Connected Fitness. Under Armour was able to reach their ambitious goal of 165 million users by the end of 2016. That, in combination with the results in the recent quarter,
Valuation Analysis

14
gave us proof of concept and steady strong growth in the future.
Geographic Revenue
We grew international revenue as a percentage of their total sales going forward. We increased that percentage going forward after examining the growth of Nike’s international revenues. Nike now has over 50% of their revenues coming from overseas. We ended with, and believe, that ten years from now Under Armour will have followed a similar path and will have 30% of their revenues coming internationally.
Cost of Goods Sold
We kept the cost of goods sold at the same percentage of sales it has been historically, which is 49.42%. We liked this number, because in the last 5 years, it has never been more than 0.50% different on either side. This demonstrates its consistency historically. Going forward, we have no reason to believe it will be adjusted by more. Under Armour has no set contracts with suppliers and hedges the risk of price fluctuations. Also, as a young company, they are still not a mature enough position to sacrifice any quality or bargain as much with suppliers. Also, we examined the cost of goods sold for Nike. There cost of goods sold is nearly 54% of revenue every year exactly. This led us to believe that cost of goods sold remains relatively constant with these companies and there was not much room for Under Amour to improve on cost.
Weighted Average Cost of Capital
Our weighted average cost of capital came out to be 12.56%. The value was heavily influenced by the cost of equity, as the weight of equity and debt is 93.6% and 6.4%, respectively.
Cost of Equity:
We used the CAPM model to derive the cost of equity. We used the Bloomberg terminal, and looked
at historical data to derive the beta calculation. We also used the terminal to calculate the expected return on the market. We then used the closing price of the 30-year treasury as of 11/14/2015 in order to derive our risk free rate. We used these values to derive a value of 13.19%.
Cost of Debt:
We used the default spread on Under Armour’s Baa2 rating and the risk free rate to calculate their pre-tax cost of debt. We then adjusted for taxes to find the after tax cost. We reached a value of 3.54%
Discounted Cash Flows and Economic Profit
The model that we are most confident in is are these two. The intrinsic value we derived from them is $37.10 dollars a share as of 11/14/2016. This puts the value $5.93 above the closing price of that day, which means there is approximately 19% upside. We believe this model is the best way to value a company, especially since they do not have dividends. We strongly believe in our future projections for the company and prefer these models, because they greatly impact this valuation.
Dividend Discount Model
We completed the Dividend Discount Model and derived the intrinsic value of the stock at $13.98. We believe that the Dividend Discount Model is not an accurate representation of the intrinsic value of the stock. The Dividend Discount Model is not accurate because our company does not currently pay out dividends, nor has it ever historically. We do not see any indication that Under Armour will be paying out dividends in the near future.

15
Relative Valuation
According to the relative P/E analysis, the price of Under Armor’s stock based on 2016’s EPS should be $48.94. This is much higher than the current stock price. The industry trades at an average P/E ratio of 29 in 2016. We believe that this number is abnormally high, considering it normally trades around a P/E ratio of around 18. The high multiple of the industry is hard to justify, and we are not putting much weight on this result.
Beta vs. Risk Free Rate
This analysis shows that when volatility is low and the risk free rate is low that Under Amour is worth a lot more. This leads us to believe that in a stronger market, where investors are confident in the market and the bond yields are low, then Under Amour’s stock will perform exceptionally well. However, Under Armour does not do well in a high risk environment. The company has a lot of growth expectations priced in and trades at a high multiple so if volatility picks up then there are drastic price movements.
CV Growth of ROIC vs CV Growth of NOPLAT
This analysis shows that there is not a whole lot of upside if Under Armour becomes more efficient. Under Armour lags Nike in terms of returns on investments. We wanted to see how beneficial it would be for them to become more efficient. We concluded that it is was significantly beneficial to improve upon their steady phase efficiencies.
WACC vs CV growth of NOPLAT
WACC is an important measure to analyze with Under Armour, because it is almost entirely made up of the cost of equity. We wanted to look at what
would happen if Under Armour was growing slower than expected in the long term, but they were able to decrease WACC. The table shows that WACC is far more significant than long term growth. If the company can lower their WACC, it will dramatically increase the Valuation.
COGS as % of sales vs SG+A as a % of sales
These two costs are critical to Under Armour so we wanted to evaluate how it drives their valuation. We found that these costs are nearly identically significant as valuation drivers. They are both highly sensitive and even 0.5% moves in either direction for both costs can change the valuation by a significant amount. If Under Armour can lower these costs in the future, which is a difficult task in the industry, it could create significant value.
Beta vs. Equity Risk Premium
Being that Under Armour’s WACC is nearly almost entirely cost of equity, the beta and equity risk premiums are two of the most influential drivers of the discount rate. If Under Armour’s beta, moves closer to 1.00 then it moves the intrinsic value to over $63 per share. Under Armour, being a high-growth stock, carries a lot more risk than other companies. If it can capture the trust of investors and increase stability, then they have an opportunity to gain massive upside.
Important Disclaimer
This report was created by students enrolled in the Security Analysis (6F:112) class at the University of Iowa. The report was originally created to offer an internal investment recommendation for the University of Iowa Krause Fund and its advisory board. The report also provides potential employers and other interested parties an example of the students’ skills, knowledge and abilities. Members of the Krause Fund are not registered investment advisors, brokers or officially licensed financial professionals. The investment advice contained in
Sensitivity Analysis
16
this report does not represent an offer or solicitation to buy or sell any of the securities mentioned. Unless otherwise noted, facts and figures included in this report are from publicly available sources. This report is not a complete compilation of data, and its accuracy is not guaranteed. From time to time, the University of Iowa, its faculty, staff, students, or the Krause Fund may hold a financial interest in the companies mentioned in this report.

17
References
1. Under Armour, Inc. (2016). 10-K Annual Report 2015. Retrieved from investor.underarmour.com.
2. Under Armour, Inc. Second Quarter 2016 Conference Call
3. Bernstein, Andrew. "Steph Curry’s Shoes Are Driving an Under Armour Revenue Surge." Reuters. Fortune, 25 July 2016. Web.
4. Smith, Ray A. "Under Armour Bets on High-End Clothing Line." WSJ. Wsj.com, 13 Sept. 2016. Web.
5. Turner, Nick. "Under Armour Expects to Hit $7.5 Billion in Revenue by 2018." Bloomberg.com. Bloomberg, 16 Sept. 2015. Web.
6. Matoloni, Lisa. "Bureau of Economic Analysis." US Department of Commerce, BEA,. N.p., 28 Oct. 2016. Web.
7. "U.S. Retail Sales | 1992-2016 | Data | Chart | Calendar | Forecast | News." U.S. Retail Sales | 1992-2016 | Data | Chart | Calendar | Forecast | News. Trading Economics, 14 Nov. 2016. Web.
8. "United States Consumer Sentiment | 1952-2016 | Data | Chart | Calendar." United States Consumer Sentiment | 1952-2016 | Data | Chart | Calendar. Trading Economics, 14 Nov. 2016. Web.
9. "U.S. Dollar Index Historical Chart." MacroTrends. N.p., 31 Oct. 2016. Web.
10. "China GDP | 1960-2016 | Data | Chart | Calendar | Forecast | News." China GDP | 1960-2016 | Data | Chart | Calendar | Forecast | News. Trading Economics, 14 Nov. 2016. Web.
11. "China to Overtake US as Largest Apparel Market by 2017." Euromonitor International Blog. N.p., 02 Sept. 2016. Web.
12. GLOBAL CONSUMER CONFIDENCE (n.d.): n. pag. The Nielsen, Apr. 2016. Web.
13. Jones, Claire. "ECB Cuts Rates to New Low and Expands QE." Financial Times, 10 Mar. 2016. Web.
14. Orlowski, Ralph. "What's Wrong with Europe's Quantitative Easing Strategy?" World Economic Forum, 5 Feb. 2016. Web.
15. "Sports Apparel Market." Allied Market Research, 1 Oct. 2015.
16. "United States Disposable Personal Income | 1959-2016 | Data | Chart." United States Disposable Personal Income | 1959-2016 | Data | Chart. Trading Economics, 14 Nov. 2016. Web.
17. "Athletic Lifestyles Keep Apparel Sales Healthy." Morgan Stanley. N.p., 30 Oct. 2015.
18. Melik, James. "Popular Trainer Brands Lose out to Fakes." BBC News. N.p., 19 July 2013.
19. Nike, Inc. (2016). 10-K Annual Report 2015. 20. Adidas, AG (2016). Annual Report 2015 21. By Dr. Karla Mccorm. "Athletic Endorsements and
Their Effect on Consumers’ Attitudes and Consumption." Athletic Endorsements and Their Effect on Consumers’ Attitudes and Consumption (2013): n. pag. Florida State University.
22. Duverge, By Gabe. "The University of Louisville Greatly Benefits From Their Deal With Adidas." – The Cardinal Connect. N.p., 21 Jan. 2014.
23. Nike, Inc. First Quarter 2017 Conference Call 24. Germano, Sara. "Under Armour Results Jump on
Strength of Stephen Curry Shoe Line." WSJ. Wsj.com, 21 Apr. 2016. Web.
25. Strider, Jeremiah. "Adidas Vs. Nike Vs. Under Armour: Which for 2016? (NKE,UA)." Investopedia. N.p., 26 Jan. 2016.
26. McNew, Seth. "4 Reasons Nike Inc Has Such a High Profit Margin." The Motley Fool. N.p., 15 Oct. 2015.
27. "UA Record™ Health & Fitness Network | Under Armour." Under Armour®. N.p., n.d. Web.
28. By Phalguni Soni - Disclosure | Apr 22, 2016 3:40 Pm EST. "Why Under Armour's Footwear Sales Growth Is Accelerating." - Market Realist. N.p., 22 Apr. 2016. Web.
29. Germano, Sara. "Under Armour to Begin Selling Products at Mid-Tier Department Store Kohl's." WSJ. Wsj.com, 26 July 2016.
30. Wahba, Phil. "Under Armour Makes Big Play for Women With Kohl’s Tie-Up." Fortune. N.p., 25 July 2016. Web.
31. Nijjar, Palbir. "The 3 Most Important Growth Drivers for Under Armour Inc." The Motley Fool. N.p., 01 Jan. 1970. Web.

Under Armour, Inc.
Key Assumptions of Valuation Model
Ticker Symbol UA
Current Share Price $31.17
Current Model Date 11/14/2016
Fiscal Year End Dec. 31
Pre‐Tax Cost of Debt 3.25%
Beta 1.2915
Risk‐Free Rate 3.01%
Equity Risk Premium 7.88%
CV Growth of NOPLAT 4.00%
Current Dividend Yield 0
Marginal Tax Rate 32.70%
Effective Tax Rate
DCF Price 37.10$
EP Price 37.10$
WACC 12.56%
CV ROIC 13%
Cost of Equity 13.19%
COGS as Percentage of Sales 49.421%
SG+A as Percentage of Sales 37.319%

Under Armour, Inc.
Revenue Decomposition
Fiscal Years Ending Dec. 31 2013 2014 2015 2016E 2017E 2018E 2019E 2020E 2021E 2022E 2023E 2024E 2025E
Apparel $1,762,150 $2,291,520 $2,801,062 $3,521,944 $4,428,352 $5,568,034 $7,001,025 $7,701,127 $8,471,240 $9,318,364 $9,877,466 $10,470,114 $11,098,321
Footwear 298,825 430,987 677,744 945,552 1,319,183 1,840,453 2,567,700 2,927,178 3,336,983 3,804,161 4,184,577 4,603,034 5,063,338
Accessories 216,098 275,409 346,885 441,377 561,610 714,594 909,251 1,000,176 1,100,194 1,210,213 1,282,826 1,359,796 1,441,383
Total Net Sales 2,277,073 2,997,916 3,825,691 4,888,474 6,246,500 7,981,788 10,199,142 11,628,482 12,908,417 14,332,738 15,344,869 16,432,944 17,603,042
License 54,978 67,229 84,207 103,736 127,793 157,430 193,939 213,333 234,666 258,133 273,621 290,038 307,441
Connected Fitness $ ‐ 19,225 53,415 68,254 87,215 111,443 142,402 181,962 232,511 297,103 379,639 485,103 619,866
Total Net Revenues 2,332,051 3,084,370 3,963,313 5,060,464 6,461,508 8,250,661 10,535,484 12,023,777 13,375,595 14,887,974 15,998,129 17,208,085 18,530,348
North America 2,193,739 2,796,374 3,455,737 4,243,378 5,418,149 6,511,374 8,314,465 9,473,452 9,857,313 10,943,153 11,713,867 11,706,088 12,537,338
International 137,244 268,771 454,161 748,831 956,144 1,627,844 2,078,616 2,368,363 3,285,771 3,647,718 3,904,622 5,016,895 5,373,145
Connected Fitness 1,068 19,225 53,415 68,254 87,215 111,443 142,402 181,962 232,511 297,103 379,639 485,103 619,866
Total Net Revenue 2,332,051$ 3,084,370$ 3,963,313$ $5,060,464 $6,461,508 $8,250,661 $10,535,484 $12,023,777 $13,375,595 $14,887,974 $15,998,129 $17,208,085 $18,530,348

Under Armour, Inc.
Balance Sheet
Fiscal Years Ending Dec. 31 2013 2014 2015 2016E 2017E 2018E 2019E 2020E 2021E 2022E 2023E 2024E 2025E
AssetsCurrent assetsCash and cash equivalents $347,489 $593,175 $129,852 (82,355) (159,962) (302,541) (542,388) (251,871) 132,016 526,733 1,035,382 1,570,399 2,134,227
Accounts receivable, net 209,952 279,835 433,638 479,347 612,510 782,666 1,000,092 1,140,248 1,265,754 1,405,418 1,504,664 1,611,356 1,726,092
Inventories 469,006 536,714 783,031 971,757 1,241,712 1,586,662 2,027,439 2,311,571 2,566,003 2,849,137 3,050,334 3,266,627 3,499,226
Prepaid expenses and other current assets 63,987 87,177 152,242 145,774 186,270 238,016 304,138 346,761 384,928 427,401 457,583 490,029 524,922
Deferred income taxes 38,377 52,498 0 - - - - - - - - - - Total current assets 1,128,811 1,549,399 1,498,763 1,514,522$ 1,880,530$ 2,304,804$ 2,789,281$ 3,546,709$ 4,348,701$ 5,208,689$ 6,047,963$ 6,938,413$ 7,884,467$
Property and equipment, net 223,952 305,564 538,531 740,698 1,018,760 1,401,208 1,927,228 2,119,951 2,331,946 2,565,141 2,821,655 3,103,821 3,414,203
Goodwill 122,244 123,256 585,181 585,181 585,181 585,181 585,181 585,181 585,181 585,181 585,181 585,181 585,181 Intangible assets, net 24,097 26,230 75,686 72,859 70,031 67,204 64,376 61,549 58,721 55,894 53,066 50,239 47,412
Deferred income taxes 31,094 33,570 92,157 57,614 71,942 89,603 111,282 128,892 144,031 161,061 171,583 182,992 195,415
Other long term assets 47,543 57,064 78,582 117,334 149,930 191,581 244,802 279,109 309,831 344,018 368,311 394,427 422,512
Total assets $1,577,741 $2,095,083 $2,868,900 3,088,208$ 3,776,375$ 4,639,581$ 5,722,151$ 6,721,391$ 7,778,411$ 8,919,984$ 10,047,759$ 11,255,072$ 12,549,190$
Liabilities and Stockholders' EquityCurrent liabilitiesRevolving credit facility $100,000 $275,000 ‐ ‐ ‐ ‐ ‐ ‐ ‐ ‐ ‐ ‐
Accounts payable 165,456 210,432 200,460 340,389 434,629 554,976 708,663 808,772 899,701 1,001,431 1,076,104 1,157,491 1,246,433
Accrued expenses 133,729 147,681 192,935 241,800 308,973 394,806 504,484 575,184 638,494 708,946 759,009 812,829 870,706
Current maturities of long term debt 4,972 28,951 42,000 38,269 47,512 59,652 75,614 84,168 92,293 101,308 108,781 116,895 125,710
Other current liabilities 22,473 34,563 43,415 34,732 27,786 22,228 17,783 14,226 11,381 9,105 7,284 5,827 4,662
Total current liabilities 426,630 421,627 478,810 655,191$ 818,900$ 1,031,662$ 1,306,543$ 1,482,350$ 1,641,869$ 1,820,789$ 1,951,178$ 2,093,043$ 2,247,510$
Long term debt, net of current maturities 47,951 255,250 352,000 315,403 391,581 491,634 623,186 693,689 760,651 834,948 896,537 963,416 1,036,064
Other long term liabilities 49,806 67,906 94,868 106,995 136,618 174,446 222,755 254,222 282,804 314,781 338,253 363,836 391,793
Total liabilities 524,387 744,783 1,200,678 1,077,588$ 1,347,098$ 1,697,743$ 2,152,485$ 2,430,262$ 2,685,325$ 2,970,517$ 3,185,968$ 3,420,294$ 3,675,367$
Stockholders' equityCommon Equity 397,248 508,350 636,630 672,761 708,892 745,022 781,153 817,284 853,415 853,415 853,415 853,415 853,415
Retained earnings 653,842 856,687 1,076,533 1,382,872 1,765,398 2,241,829 2,833,526 3,518,858 4,284,685 5,141,065 6,053,389 7,026,376 8,065,421
Accumulated other comprehensive income (loss) 2,194 -14,808 -45,013 (45,013) (45,013) (45,013) (45,013) (45,013) (45,013) (45,013) (45,013) (45,013) (45,013) Total stockholders' equity 1,053,354 1,350,300 1,668,222 $ 2,010,620 $ 2,429,276 $ 2,941,838 $ 3,569,666 $ 4,291,129 $ 5,093,087 $ 5,949,467 $ 6,861,790 $ 7,834,778 $ 8,873,823
Total liabilities and stockholders' equity $1,577,741 $2,095,083 $2,868,900 $ 3,088,208 $ 3,776,375 $ 4,639,581 $ 5,722,151 $ 6,721,391 $ 7,778,411 $ 8,919,984 $ 10,047,759 $ 11,255,072 $ 12,549,190

Under Armour, Inc.
Income Statement
Ending Dec. 31 2011 2012 2013 2014 2015 2016E 2017E 2018E 2019E 2020E 2021E 2022E 2023E 2024E 2025E
Net revenues $1,472,684 $1,834,921 $2,332,051 $3,084,370 $3,963,313 $5,060,464 $6,461,508 $8,250,661 $10,535,484 $12,023,777 $13,375,595 $14,887,974 $15,998,129 $17,208,085 $18,530,348
Cost of goods sold 727,148 915,824 1,147,081 1,508,564 1,970,666 $2,500,950 $3,193,365 $4,077,589 $5,206,779 $5,942,314 $6,610,401 $7,357,840 $7,906,493 $8,504,470 $9,157,950
Depreciation 32,700 39,800 48,300 63,600 87,100 $149,785 $206,015 $283,354 $389,726 $428,699 $471,569 $518,725 $570,598 $627,658 $690,424
Gross profit 712,836 879,297 1,136,670 1,512,206 1,905,547 $2,409,729 $3,062,128 $3,889,718 $4,938,978 $5,652,764 $6,293,625 $7,011,409 $7,521,038 $8,075,958 $8,681,974
Selling, general and 550,069 670,602 871,572 1,158,251 1,497,000 $1,888,519 $2,411,376 $3,079,071 $3,931,746 $4,487,164 $4,991,650 $5,556,056 $5,970,355 $6,421,900 $6,915,357
Income from ope 162,767 208,695 265,098 353,955 408,547 $521,210 $650,752 $810,647 $1,007,232 $1,165,600 $1,301,975 $1,455,353 $1,550,682 $1,654,057 $1,766,618
Interest expense, n -3,841 -5,183 -2,933 -5,335 -14,628 ‐$11,494 ‐$14,271 ‐$17,917 ‐$22,711 ‐$25,280 ‐$27,721 ‐$30,428 ‐$32,673 ‐$35,110 ‐$37,758
Other expense, net -2,064 -73 -1,172 -6,410 -7,234 $0 $0 $0 $0 $0 $0 $0 $0 $0 $0
Income before in 156,862 203,439 260,993 342,210 386,685 $509,716 $636,482 $792,730 $984,521 $1,140,320 $1,274,255 $1,424,925 $1,518,010 $1,618,947 $1,728,860
Provision for incom 59,943 74,661 98,663 134,168 154,112 $203,377 $253,956 $316,299 $392,824 $454,988 $508,428 $568,545 $605,686 $645,960 $689,815
Net income $96,919 $128,778 $162,330 $208,042 $232,573 $306,339 $382,526 $476,431 $591,697 $685,332 $765,827 $856,380 $912,324 $972,987 $1,039,045
Net income available per common shareBasic $0.94 $1.23 $0.77 $0.98 $1.08 $1.69 $2.11 $2.62 $3.26 $3.77 $4.22 $4.71 $5.02 $5.36 $5.72
EPS Growth 31% ‐37% 27% 10% 56% 25% 25% 24% 16% 12% 12% 7% 7% 7%
Weighted average common shares outstandingBasic 103,140 104,343 210,696 213,227 215,498 181,649 181,651 181,653 181,655 181,658 181,660 181,660 181,660 181,660 181,660
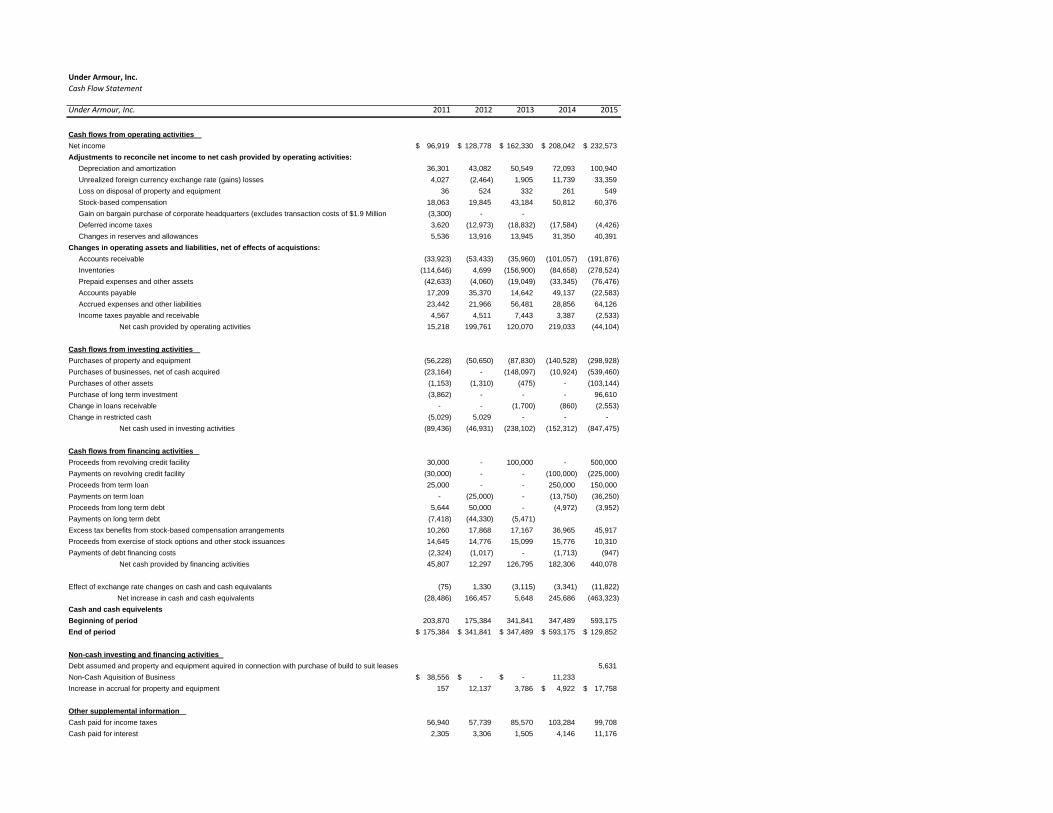
Under Armour, Inc.
Cash Flow Statement
Under Armour, Inc. 2011 2012 2013 2014 2015
Cash flows from operating activitiesNet income 96,919$ 128,778$ 162,330$ 208,042$ 232,573$ Adjustments to reconcile net income to net cash provided by operating activities: Depreciation and amortization 36,301 43,082 50,549 72,093 100,940 Unrealized foreign currency exchange rate (gains) losses 4,027 (2,464) 1,905 11,739 33,359 Loss on disposal of property and equipment 36 524 332 261 549 Stock-based compensation 18,063 19,845 43,184 50,812 60,376 Gain on bargain purchase of corporate headquarters (excludes transaction costs of $1.9 Million (3,300) - - Deferred income taxes 3,620 (12,973) (18,832) (17,584) (4,426) Changes in reserves and allowances 5,536 13,916 13,945 31,350 40,391Changes in operating assets and liabilities, net of effects of acquistions: Accounts receivable (33,923) (53,433) (35,960) (101,057) (191,876) Inventories (114,646) 4,699 (156,900) (84,658) (278,524) Prepaid expenses and other assets (42,633) (4,060) (19,049) (33,345) (76,476) Accounts payable 17,209 35,370 14,642 49,137 (22,583) Accrued expenses and other liabilities 23,442 21,966 56,481 28,856 64,126 Income taxes payable and receivable 4,567 4,511 7,443 3,387 (2,533) Net cash provided by operating activities 15,218 199,761 120,070 219,033 (44,104)
Cash flows from investing activitiesPurchases of property and equipment (56,228) (50,650) (87,830) (140,528) (298,928)Purchases of businesses, net of cash acquired (23,164) - (148,097) (10,924) (539,460)Purchases of other assets (1,153) (1,310) (475) - (103,144)Purchase of long term investment (3,862) - - - 96,610Change in loans receivable - - (1,700) (860) (2,553)Change in restricted cash (5,029) 5,029 - - - Net cash used in investing activities (89,436) (46,931) (238,102) (152,312) (847,475)
Cash flows from financing activitiesProceeds from revolving credit facility 30,000 - 100,000 - 500,000Payments on revolving credit facility (30,000) - - (100,000) (225,000)Proceeds from term loan 25,000 - - 250,000 150,000Payments on term loan - (25,000) - (13,750) (36,250)Proceeds from long term debt 5,644 50,000 - (4,972) (3,952)Payments on long term debt (7,418) (44,330) (5,471)Excess tax benefits from stock-based compensation arrangements 10,260 17,868 17,167 36,965 45,917Proceeds from exercise of stock options and other stock issuances 14,645 14,776 15,099 15,776 10,310Payments of debt financing costs (2,324) (1,017) - (1,713) (947) Net cash provided by financing activities 45,807 12,297 126,795 182,306 440,078
Effect of exchange rate changes on cash and cash equivalants (75) 1,330 (3,115) (3,341) (11,822) Net increase in cash and cash equivalents (28,486) 166,457 5,648 245,686 (463,323)Cash and cash equivelentsBeginning of period 203,870 175,384 341,841 347,489 593,175End of period 175,384$ 341,841$ 347,489$ 593,175$ 129,852$
Non-cash investing and financing activitiesDebt assumed and property and equipment aquired in connection with purchase of build to suit leases 5,631Non-Cash Aquisition of Business 38,556$ -$ -$ 11,233Increase in accrual for property and equipment 157 12,137 3,786 4,922$ 17,758$
Other supplemental informationCash paid for income taxes 56,940 57,739 85,570 103,284 99,708Cash paid for interest 2,305 3,306 1,505 4,146 11,176

Under Armour, Inc.Cash Flow Statement
Under Armour, Inc. 2016E 2017E 2018E 2019E 2020E 2021E 2022E 2023E 2024E 2025ECash flows from operating activitiesNet income $ 306,339 $ 382,526 $ 476,431 $ 591,697 $ 685,332 $ 765,827 $ 856,380 $ 912,324 $ 972,987 $ 1,039,045 Adjustments to reconcile net income to net cash provided by operating activities: Depreciation and amortization 149,785 206,015 283,354 389,726 428,699 471,569 518,725 570,598 627,658 690,424 Deferred income taxes 34,543 (14,329) (17,661) (21,678) (17,610) (15,139) (17,030) (10,521) (11,409) (12,424) ST DIT Goodwill Intangible Asset (2,827) (2,827) (2,827) (2,827) (2,827) (2,827) (2,827) (2,827) (2,827) (2,827) Changes in operating assets and liabilities, net of effects of acquistions: Accounts receivable (45,709) (133,163) (170,156) (217,426) (140,156) (125,506) (139,664) (99,246) (106,693) (114,736) Inventories (188,726) (269,956) (344,950) (440,777) (284,132) (254,432) (283,134) (201,197) (216,293) (232,598) Prepaid expenses and other assets 6,468 (40,496) (51,746) (66,121) (42,623) (38,168) (42,473) (30,182) (32,446) (34,892) Accounts payable 139,929 94,240 120,346 153,687 100,109 90,929 101,729 74,674 81,387 88,941 Accrued expenses and other liabilities 48,865 67,173 85,833 109,678 70,700 63,310 70,452 50,063 53,820 57,877 Other Current Liabilities (8,683) (6,946) (5,557) (4,446) (3,557) (2,845) (2,276) (1,821) (1,457) (1,165) Other Long Term Assets (38,752) (32,596) (41,651) (53,221) (34,307) (30,721) (34,187) (24,293) (26,116) (28,085) Other Long Term Liabilities 12,127 29,623 37,829 48,309 31,467 28,582 31,977 23,472 25,582 27,957 Net cash provided by operating activities 413,359 282,236 373,066 491,512 793,935 952,717 1,059,881 1,261,865 1,364,726 1,477,644
Cash flows from investing activitiesProperty Plant and Equipment (351,952) (484,077) (665,801) (915,747) (621,422) (683,564) (751,920) (827,112) (909,823) (1,000,806) Net cash used in investing activities (351,952) (484,077) (665,801) (915,747) (621,422) (683,564) (751,920) (827,112) (909,823) (1,000,806)
Cash flows from financing activitiesExcess tax benefits from stock-based compensation arrangements 5,583 2,682 1,832 743 2,815 3,515 3,445 4,834 5,121 5,527 Change Debt (315,328) 85,421 112,194 147,514 79,057 75,087 83,311 69,063 74,994 81,463 Change in Equity 36,131 36,131 36,131 36,131 36,131 36,131 - - - - Net cash provided by financing activities (273,614) 124,234 150,157 184,388 118,003 114,733 86,756 73,897 80,115 86,990
Increase (Decrease) in Cash (212,207) (77,607) (142,578) (239,847) 290,517 383,887 394,717 508,649 535,017 563,828 Beginning Cash 129,852 (82,355) (159,962) (302,541) (542,388) (251,871) 132,016 526,733 1,035,382 1,570,399 Ending Cash (82,355)$ (159,962)$ (302,541)$ (542,388)$ (251,871)$ 132,016$ 526,733$ 1,035,382$ 1,570,399$ 2,134,227$

Under Armour, Inc.Common Size Balance Sheet
Fiscal Years Ending Dec. 31 2013 2014 2015 2016E 2017E 2018E 2019E 2020E 2021E 2022E 2023E 2024E 2025EAssetsCurrent assetsCash and cash equivalents 14.90% 19.23% 3.28% ‐1.63% ‐2.48% ‐3.67% ‐5.15% ‐2.09% 0.99% 3.54% 6.47% 9.13% 11.52%Accounts receivable, net 9.00% 9.07% 10.94% 9.47% 9.48% 9.49% 9.49% 9.48% 9.46% 9.44% 9.41% 9.36% 9.31%Inventories 20.11% 17.40% 19.76% 19.20% 19.22% 19.23% 19.24% 19.22% 19.18% 19.14% 19.07% 18.98% 18.88%Prepaid expenses and other current assets 2.74% 2.83% 3.84% 2.88% 2.88% 2.88% 2.89% 2.88% 2.88% 2.87% 2.86% 2.85% 2.83%Deferred income taxes 1.65% 1.70% 0.00% 0.00% 0.00% 0.00% 0.00% 0.00% 0.00% 0.00% 0.00% 0.00% 0.00%Total current assets 48.40% 50.23% 37.82% 29.93% 29.10% 27.93% 26.48% 29.50% 32.51% 34.99% 37.80% 40.32% 42.55%Property and equipment, net 9.60% 9.91% 13.59% 14.64% 15.77% 16.98% 18.29% 17.63% 17.43% 17.23% 17.64% 18.04% 18.42%Goodwill 5.24% 4.00% 14.76% 11.56% 9.06% 7.09% 5.55% 4.87% 4.37% 3.93% 3.66% 3.40% 3.16%Intangible assets, net 1.03% 0.85% 1.91% 1.44% 1.08% 0.81% 0.61% 0.51% 0.44% 0.38% 0.33% 0.29% 0.26%Deferred income taxes 1.33% 1.09% 2.33% 1.14% 1.11% 1.09% 1.06% 1.07% 1.08% 1.08% 1.07% 1.06% 1.05%Other long term assets 2.04% 1.85% 1.98% 2.32% 2.32% 2.32% 2.32% 2.32% 2.32% 2.31% 2.30% 2.29% 2.28%Total assets 67.65% 67.93% 72.39% 61.03% 58.44% 56.23% 54.31% 55.90% 58.15% 59.91% 62.81% 65.41% 67.72%Liabilities and Stockholders' EquityCurrent liabilitiesRevolving credit facility 4.29% 0.00% 6.94% 0.00% 0.00% 0.00% 0.00% 0.00% 0.00% 0.00% 0.00% 0.00% 0.00%Accounts payable 7.09% 6.82% 5.06% 6.73% 6.73% 6.73% 6.73% 6.73% 6.73% 6.73% 6.73% 6.73% 6.73%Accrued expenses 5.73% 4.79% 4.87% 4.78% 4.78% 4.79% 4.79% 4.78% 4.77% 4.76% 4.74% 4.72% 4.70%Current maturities of long term debt 0.21% 0.94% 1.06% 0.76% 0.74% 0.72% 0.72% 0.70% 0.69% 0.68% 0.68% 0.68% 0.68%Other current liabilities 0.96% 1.12% 1.10% 0.69% 0.43% 0.27% 0.17% 0.12% 0.09% 0.06% 0.05% 0.03% 0.03%Total current liabilities 18.29% 13.67% 12.08% 12.95% 12.67% 12.50% 12.40% 12.33% 12.28% 12.23% 12.20% 12.16% 12.13%Long term debt, net of current maturities 2.06% 8.28% 8.88% 6.23% 6.06% 5.96% 5.92% 5.77% 5.69% 5.61% 5.60% 5.60% 5.59%Other long term liabilities 2.14% 2.20% 2.39% 2.11% 2.11% 2.11% 2.11% 2.11% 2.11% 2.11% 2.11% 2.11% 2.11%Total liabilities 22.49% 24.15% 30.29% 21.29% 20.85% 20.58% 20.43% 20.21% 20.08% 19.95% 19.91% 19.88% 19.83%Stockholders' equityAdditional paid-in capital 17.03% 16.48% 16.06% 13.29% 10.97% 9.03% 7.41% 6.80% 6.38% 5.73% 5.33% 4.96% 4.61%Retained earnings 28.04% 27.78% 27.16% 27.33% 27.32% 27.17% 26.90% 29.27% 32.03% 34.53% 37.84% 40.83% 43.53%Accumulated other comprehensive income (los 0.09% ‐0.48% ‐1.14% ‐0.89% ‐0.70% ‐0.55% ‐0.43% ‐0.37% ‐0.34% ‐0.30% ‐0.28% ‐0.26% ‐0.24%Total stockholders' equity 45.17% 43.78% 42.09% 39.73% 37.60% 35.66% 33.88% 35.69% 38.08% 39.96% 42.89% 45.53% 47.89%Total liabilities and stockholders' equity 67.65% 67.93% 72.39% 61.03% 58.44% 56.23% 54.31% 55.90% 58.15% 59.91% 62.81% 65.41% 67.72%

Under Armour, Inc.Common Size Income Statement
Fiscal Years Ending Dec. 31 2013 2014 2015 2016E 2017E 2018E 2019E 2020E 2021E 2022E 2023E 2024E 2025E
Net revenues 100% 100% 100% 100% 100% 100% 100% 100% 100% 100% 100% 100% 100%
Cost of goods sold 49.19% 48.91% 49.72% 49.42% 49.42% 49.42% 49.42% 49.42% 49.42% 49.42% 49.42% 49.42% 49.42%
Depreciation 2.07% 2.06% 2.20% 2.96% 3.19% 3.43% 3.70% 3.57% 3.53% 3.48% 3.57% 3.65% 3.73%
Gross profit 48.74% 49.03% 48.08% 47.62% 47.39% 47.14% 46.88% 47.01% 47.05% 47.09% 47.01% 46.93% 46.85%
Selling, general and administrative expenses 37.37% 37.55% 37.77% 37.32% 37.32% 37.32% 37.32% 37.32% 37.32% 37.32% 37.32% 37.32% 37.32%
Income from operations 11.37% 11.48% 10.31% 10.30% 10.07% 9.83% 9.56% 9.69% 9.73% 9.78% 9.69% 9.61% 9.53%
Interest expense, net ‐0.13% ‐0.17% ‐0.37% ‐0.23% ‐0.22% ‐0.22% ‐0.22% ‐0.21% ‐0.21% ‐0.20% ‐0.20% ‐0.20% ‐0.20%
Other expense, net ‐0.05% ‐0.21% ‐0.18% 0.00% 0.00% 0.00% 0.00% 0.00% 0.00% 0.00% 0.00% 0.00% 0.00%
Income before income taxes 11.19% 11.09% 9.76% 10.07% 9.85% 9.61% 9.34% 9.48% 9.53% 9.57% 9.49% 9.41% 9.33%
Provision for income taxes 4.23% 4.35% 3.89% 4.02% 3.93% 3.83% 3.73% 3.78% 3.80% 3.82% 3.79% 3.75% 3.72%
Net income 6.96% 6.75% 5.87% 6.05% 5.92% 5.77% 5.62% 5.70% 5.73% 5.75% 5.70% 5.65% 5.61%
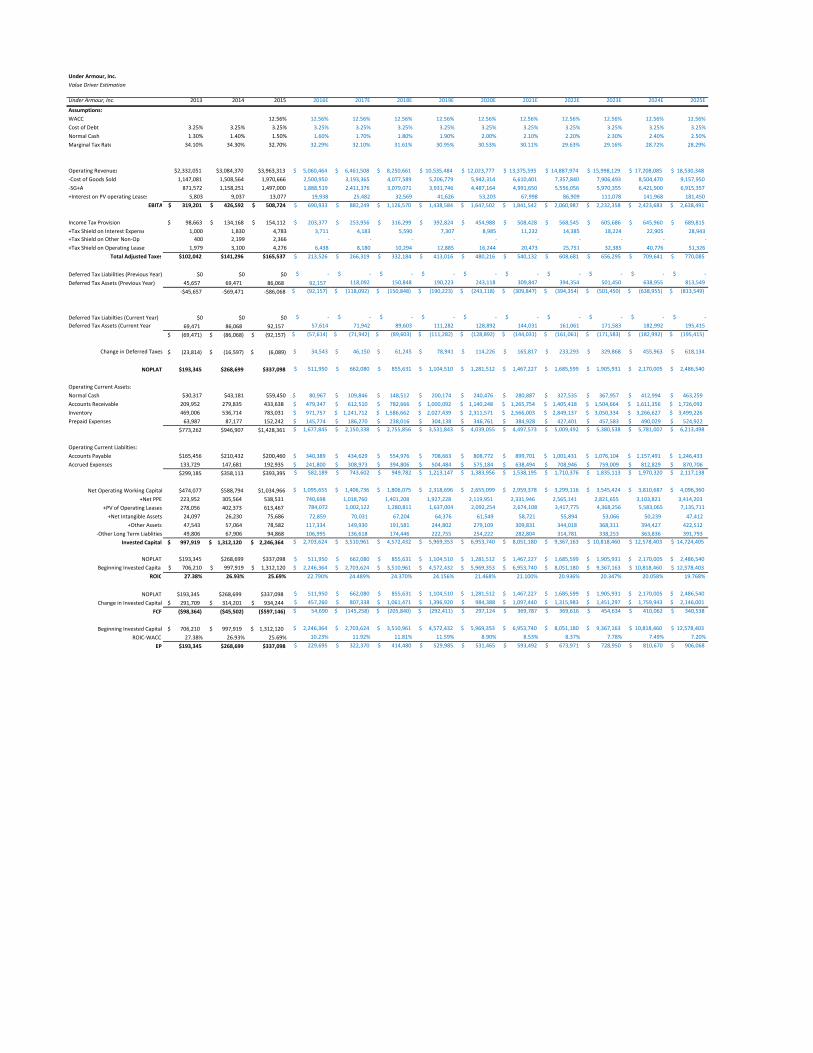
Under Armour, Inc.
Value Driver Estimation
Under Armour, Inc. 2013 2014 2015 2016E 2017E 2018E 2019E 2020E 2021E 2022E 2023E 2024E 2025E
Assumptions:
WACC 12.56% 12.56% 12.56% 12.56% 12.56% 12.56% 12.56% 12.56% 12.56% 12.56% 12.56%
Cost of Debt 3.25% 3.25% 3.25% 3.25% 3.25% 3.25% 3.25% 3.25% 3.25% 3.25% 3.25% 3.25% 3.25%
Normal Cash 1.30% 1.40% 1.50% 1.60% 1.70% 1.80% 1.90% 2.00% 2.10% 2.20% 2.30% 2.40% 2.50%
Marginal Tax Rate 34.10% 34.30% 32.70% 32.29% 32.10% 31.61% 30.95% 30.53% 30.11% 29.63% 29.16% 28.72% 28.29%
Operating Revenues $2,332,051 $3,084,370 $3,963,313 $ 5,060,464 $ 6,461,508 $ 8,250,661 $ 10,535,484 $ 12,023,777 $ 13,375,595 $ 14,887,974 $ 15,998,129 $ 17,208,085 $ 18,530,348
‐Cost of Goods Sold 1,147,081 1,508,564 1,970,666 2,500,950 3,193,365 4,077,589 5,206,779 5,942,314 6,610,401 7,357,840 7,906,493 8,504,470 9,157,950
‐SG+A 871,572 1,158,251 1,497,000 1,888,519 2,411,376 3,079,071 3,931,746 4,487,164 4,991,650 5,556,056 5,970,355 6,421,900 6,915,357
+Interest on PV operating Leases 5,803 9,037 13,077 19,938 25,482 32,569 41,626 53,203 67,998 86,909 111,078 141,968 181,450
EBITA $ 319,201 $ 426,592 $ 508,724 $ 690,933 $ 882,249 $ 1,126,570 $ 1,438,584 $ 1,647,502 $ 1,841,542 $ 2,060,987 $ 2,232,358 $ 2,423,683 $ 2,638,491
Income Tax Provision $ 98,663 $ 134,168 $ 154,112 $ 203,377 $ 253,956 $ 316,299 $ 392,824 $ 454,988 $ 508,428 $ 568,545 $ 605,686 $ 645,960 $ 689,815
+Tax Shield on Interest Expense 1,000 1,830 4,783 3,711 4,183 5,590 7,307 8,985 11,232 14,385 18,224 22,905 28,943
+Tax Shield on Other Non‐Op 400 2,199 2,366 ‐ ‐ ‐ ‐ ‐ ‐ ‐ ‐ ‐ ‐
+Tax Shield on Operating Leases 1,979 3,100 4,276 6,438 8,180 10,294 12,885 16,244 20,473 25,751 32,385 40,776 51,326
Total Adjusted Taxes $102,042 $141,296 $165,537 $ 213,526 $ 266,319 $ 332,184 $ 413,016 $ 480,216 $ 540,132 $ 608,681 $ 656,295 $ 709,641 $ 770,085
Deferred Tax Liabilities (Previous Year) $0 $0 $0 $ ‐ $ ‐ $ ‐ $ ‐ $ ‐ $ ‐ $ ‐ $ ‐ $ ‐ $ ‐
Deferred Tax Assets (Previous Year) 45,657 69,471 86,068 92,157 118,092 150,848 190,223 243,118 309,847 394,354 501,450 638,955 813,549
‐$45,657 ‐$69,471 ‐$86,068 $ (92,157) $ (118,092) $ (150,848) $ (190,223) $ (243,118) $ (309,847) $ (394,354) $ (501,450) $ (638,955) $ (813,549)
Deferred Tax Liabilties (Current Year) $0 $0 $0 $ ‐ $ ‐ $ ‐ $ ‐ $ ‐ $ ‐ $ ‐ $ ‐ $ ‐ $ ‐
Deferred Tax Assets (Current Year) 69,471 86,068 92,157 57,614 71,942 89,603 111,282 128,892 144,031 161,061 171,583 182,992 195,415
(69,471)$ (86,068)$ (92,157)$ $ (57,614) $ (71,942) $ (89,603) $ (111,282) $ (128,892) $ (144,031) $ (161,061) $ (171,583) $ (182,992) $ (195,415)
Change in Deferred Taxes (23,814)$ (16,597)$ (6,089)$ $ 34,543 $ 46,150 $ 61,245 $ 78,941 $ 114,226 $ 165,817 $ 233,293 $ 329,868 $ 455,963 $ 618,134
NOPLAT $193,345 $268,699 $337,098 $ 511,950 $ 662,080 $ 855,631 $ 1,104,510 $ 1,281,512 $ 1,467,227 $ 1,685,599 $ 1,905,931 $ 2,170,005 $ 2,486,540
Operating Current Assets:
Normal Cash $30,317 $43,181 $59,450 80,967$ 109,846$ 148,512$ 200,174$ 240,476$ 280,887$ 327,535$ 367,957$ 412,994$ 463,259$
Accounts Receivable 209,952 279,835 433,638 479,347$ 612,510$ 782,666$ 1,000,092$ 1,140,248$ 1,265,754$ 1,405,418$ 1,504,664$ 1,611,356$ 1,726,092$
Inventory 469,006 536,714 783,031 971,757$ 1,241,712$ 1,586,662$ 2,027,439$ 2,311,571$ 2,566,003$ 2,849,137$ 3,050,334$ 3,266,627$ 3,499,226$
Prepaid Expenses 63,987 87,177 152,242 145,774$ 186,270$ 238,016$ 304,138$ 346,761$ 384,928$ 427,401$ 457,583$ 490,029$ 524,922$
$773,262 $946,907 $1,428,361 $ 1,677,845 $ 2,150,338 $ 2,755,856 $ 3,531,843 $ 4,039,055 $ 4,497,573 $ 5,009,492 $ 5,380,538 $ 5,781,007 $ 6,213,498
Operating Current Liabilties:
Accounts Payable $165,456 $210,432 $200,460 340,389$ 434,629$ 554,976$ 708,663$ 808,772$ 899,701$ 1,001,431$ 1,076,104$ 1,157,491$ 1,246,433$
Accrued Expenses 133,729 147,681 192,935 241,800$ 308,973$ 394,806$ 504,484$ 575,184$ 638,494$ 708,946$ 759,009$ 812,829$ 870,706$
$299,185 $358,113 $393,395 $ 582,189 $ 743,602 $ 949,782 $ 1,213,147 $ 1,383,956 $ 1,538,195 $ 1,710,376 $ 1,835,113 $ 1,970,320 $ 2,117,138
Net Operating Working Capital $474,077 $588,794 $1,034,966 $ 1,095,655 $ 1,406,736 $ 1,806,075 $ 2,318,696 $ 2,655,099 $ 2,959,378 $ 3,299,116 $ 3,545,424 $ 3,810,687 $ 4,096,360
+Net PPE 223,952 305,564 538,531 740,698 1,018,760 1,401,208 1,927,228 2,119,951 2,331,946 2,565,141 2,821,655 3,103,821 3,414,203
+PV of Operating Leases 278,056 402,373 613,467 784,072 1,002,122 1,280,811 1,637,004 2,092,254 2,674,108 3,417,775 4,368,256 5,583,065 7,135,711
+Net Intangible Assets 24,097 26,230 75,686 72,859 70,031 67,204 64,376 61,549 58,721 55,894 53,066 50,239 47,412
+Other Assets 47,543 57,064 78,582 117,334 149,930 191,581 244,802 279,109 309,831 344,018 368,311 394,427 422,512
‐Other Long Term Liablities 49,806 67,906 94,868 106,995 136,618 174,446 222,755 254,222 282,804 314,781 338,253 363,836 391,793
Invested Capital 997,919$ 1,312,120$ 2,246,364$ $ 2,703,624 $ 3,510,961 $ 4,572,432 $ 5,969,353 $ 6,953,740 $ 8,051,180 $ 9,367,163 $ 10,818,460 $ 12,578,403 $ 14,724,405
NOPLAT $193,345 $268,699 $337,098 $ 511,950 $ 662,080 $ 855,631 $ 1,104,510 $ 1,281,512 $ 1,467,227 $ 1,685,599 $ 1,905,931 $ 2,170,005 $ 2,486,540
Beginning Invested Capital $ 706,210 $ 997,919 $ 1,312,120 $ 2,246,364 $ 2,703,624 $ 3,510,961 $ 4,572,432 $ 5,969,353 $ 6,953,740 $ 8,051,180 $ 9,367,163 $ 10,818,460 $ 12,578,403
ROIC 27.38% 26.93% 25.69% 22.790% 24.489% 24.370% 24.156% 21.468% 21.100% 20.936% 20.347% 20.058% 19.768%
NOPLAT $193,345 $268,699 $337,098 $ 511,950 $ 662,080 $ 855,631 $ 1,104,510 $ 1,281,512 $ 1,467,227 $ 1,685,599 $ 1,905,931 $ 2,170,005 $ 2,486,540
Change in Invested Capital 291,709$ 314,201$ 934,244$ $ 457,260 $ 807,338 $ 1,061,471 $ 1,396,920 $ 984,388 $ 1,097,440 $ 1,315,983 $ 1,451,297 $ 1,759,943 $ 2,146,001
FCF ($98,364) ($45,502) ($597,146) $ 54,690 $ (145,258) $ (205,840) $ (292,411) $ 297,124 $ 369,787 $ 369,616 $ 454,634 $ 410,062 $ 340,538
Beginning Invested Capital 706,210$ 997,919$ 1,312,120$ $ 2,246,364 $ 2,703,624 $ 3,510,961 $ 4,572,432 $ 5,969,353 $ 6,953,740 $ 8,051,180 $ 9,367,163 $ 10,818,460 $ 12,578,403
ROIC‐WACC 27.38% 26.93% 25.69% 10.23% 11.92% 11.81% 11.59% 8.90% 8.53% 8.37% 7.78% 7.49% 7.20%
EP $193,345 $268,699 $337,098 $ 229,695 $ 322,370 $ 414,480 $ 529,985 $ 531,465 $ 593,492 $ 673,971 $ 728,950 $ 810,670 $ 906,068

Under Armour, Inc.
Weighted Average Cost of Capital (WACC) Estimation
Fiscal Years Ending Dec. 31 2011 2012 2013 2014 2015
Risk Free 3.01%
Expected S&P Market Return 10.89%
Risk Premium 7.88%
Beta 1.2915
Cost of Equity 13.19%
Debt Rating Baa2
Default Spread 2.25%
Pre‐Tax Cost of Debt 3.25%
Risk Free Free 3.01%
Tax Rate 32.70%
After Tax Cost of Debt 3.54%
Cost of Preferred N/A
MV Weight of Equity 93.6% 5,716,266,300.00$
BV Weight of Debt 6.4% 394,000,000.00$
MV Weight of Preferred 0.0% ‐$
Total 100.0% 6,110,266,300.00$
WACC 12.56% 12.56%

Under Armour, Inc.
Discounted Cash Flow (DCF) and Economic Profit (EP) Valuation Models
Key Inputs:
CV Growth 4.00%
CV ROIC 13.00%
WACC 12.56%
Cost of Equity 13.19%
Dec. 31 2016E 2017E 2018E 2019E 2020E 2021E 2022E 2023E 2024E 2025E
DCF Model 2016E 2017E 2018E 2019E 2020E 2021E 2022E 2023E 2024E 2025E
NOPLAT $ 511,950 $ 662,080 $ 855,631 $ 1,104,510 $ 1,281,512 $ 1,467,227 $ 1,685,599 $ 1,905,931 $ 2,170,005 $ 2,486,540
ROIC 22.79% 24.49% 24.37% 24.16% 21.47% 21.10% 20.94% 20.35% 20.06% 19.77%
CAPEX $ 457,260 $ 807,338 $ 1,061,471 $ 1,396,920 $ 984,388 $ 1,097,440 $ 1,315,983 $ 1,451,297 $ 1,759,943 $ 2,146,001
FCF $ 54,690 $ (145,258) $ (205,840) $ (292,411) $ 297,124 $ 369,787 $ 369,616 $ 454,634 $ 410,062 $ 340,538
CV 20,098,750$
Cash Flow to Discount 54,690$ (145,258)$ (205,840)$ (292,411)$ 297,124$ 369,787$ 369,616$ 454,634$ 410,062$ 20,098,750$
Periods to Discount 1 2 3 4 5 6 7 8 9 9
PV of Free Cash Flows 48,586$ (114,639)$ (144,318)$ (182,130)$ 164,407$ 181,774$ 161,409$ 176,375$ 141,326$ 6,926,916$
7,359,706$
+ Excess Cash 70,402
+Other Long Term Assets 78,582
‐Other Current Liablities 43,415
‐Other Liabilities 94,868
‐Net Debt 394,000
613,467
257,051
6,105,889
183,390 Price (As of Dec. 31, 2015) 33.29$
Price Today 37.10$
EP Model 2016E 2017E 2018E 2019E 2020E 2021E 2022E 2023E 2024E 2025E
NOPLAT 511,950$ 662,080$ 855,631$ 1,104,510$ 1,281,512$ 1,467,227$ 1,685,599$ 1,905,931$ 2,170,005$ 2,486,540$
Beg IC 2,246,364.05$ 2,703,623.66$ 3,510,961.32$ 4,572,432.08$ 5,969,352.51$ 6,953,740.18$ 8,051,180.13$ 9,367,162.96$ 10,818,460.02$ 12,578,403.26$
ROIC 22.790% 24.489% 24.370% 24.156% 21.468% 21.100% 20.936% 20.347% 20.058% 19.768%
WACC 12.56% 12.56% 12.56% 12.56% 12.56% 12.56% 12.56% 12.56% 12.56% 12.56%
EP 229,695$ 322,370$ 414,480$ 529,985$ 531,465$ 593,492$ 673,971$ 728,950$ 810,670$ 906,068$
CV 7,520,347$
CF to Discount 229695 322370 414480 529985 531465 593492 673971 728950 810670 7,520,347$
Periods to Discount 1 2 3 4 5 6 7 8 9 9
PV of Free Cash Flows 204,056$ 254,419$ 290,599$ 330,104$ 294,075$ 291,740$ 294,319$ 282,795$ 279,393$ 2,591,843$
5,113,342$ 2,246,364 7,359,706
+ Excess Cash 70,402 +Other Long Term Assets 78,582 ‐Other Current Liablities 43,415 ‐Other Liabilities 94,868 ‐Net Debt 394,000 ‐PV of Operating Leases 613,467 ‐ESOP 257,051
6,105,889 183,390
Price (As of Dec. 31, 2015 33.29$ 37.10$
Today 11/15/2016
Next FYE 12/31/2016
Last FYE 12/31/2015
Days in FY 366
Days to FYE 320
Elapsed Fraction 0.874
Price Today
Enterprise Value
‐PV of Operating Leases
‐ESOP
Equity Value
Shares Outstanding
EP Value
Plus: Invested Capital
Enterprise Value
Equity Value
Shares Outstanding

Under Armour, Inc.
Dividend Discount Model (DDM) or Fundamental P/E Valuation Model
1 2 3 4 5 6 7 8 9 10Fiscal Years Ending Dec. 31 2016E 2017E 2018E 2019E 2020E 2021E 2022E 2023E 2024E 2025E
EPS 1.69$ 2.11$ 2.62$ 3.26$ 3.77$ 4.22$ 4.71$ 5.02$ 5.36$ 5.72$
Key Assumptions CV growth 4.00%
CV ROE 11.71%
Cost of Equity 13.19%
Future Cash Flows P/E Multiple (CV Year) 7.166474
EPS (CV Year) 5.95$
Payout Ratio
Future Stock Price 42.63$
Dividends Per Share (4.53)$ (1.22)$ (1.35)$ (1.50)$ 0.03$ 0.92$ 0.84$ 2.55$ 2.49$ 2.40$
Discounted Cash Flows (4.00)$ (0.95)$ (0.93)$ (0.91)$ 0.02$ 0.44$ 0.35$ 0.95$ 0.82$ 0.70$
Intrinsic Value 13.98$

Relative Valuation Models
EPS EPS Est. 5yr
Ticker Company Price 2016E 2017E P/E 16 P/E 17 EPS gr. PEG 16 PEG 17
NKE Nike, Inc. $50.49 $2.22 $2.37 22.7 21.3 12.6 1.80 1.69
ADS Adidas AG $81.78 $1.82 $5.39 44.9 15.2 10.5 4.30 1.45
VFC V.F. Corporation $54.16 $2.52 $3.13 21.5 17.3 9.2 2.34 1.89
LULU Lululemon $57.75 $2.01 $2.15 28.7 26.9 16.1 1.78 1.67
RL Ralph Lauren Corp $98.42 $3.62 $5.43 27.2 18.1 7.9 3.45 2.30
Average 29.0 19.8 2.7 1.8
UA Under Armour, Inc. $31.17 $1.69 $2.11 43.0 14.8 23.8 1.8 0.6
Implied Value:
Relative P/E (EPS16) $ 48.94
Relative P/E (EPS17) 41.60$
PEG Ratio (EPS16) 109.83$
PEG Ratio (EPS17) 90.16$

Present Value of Operating Lease Obligations (2015) Present Value of Operating Lease Obligations (2014) Present Value of Operating Lease Obligations (2013) Present Value of Operating Lease Obligations (2012) Present Value of Operating Lease Obligations (2011)
Operating Operating Operating Operating Operating
Fiscal Years Ending Dec. 31 Leases Fiscal Years Ending Dec. 31 Leases Fiscal Years Ending Leases Fiscal Years Ending 65.8564719654477 Leases Fiscal Years Ending 27.488957970927 Leases
2016 84,620$ 2015 56,452$ 2014 44,292$ 2013 30,610$ 2012 22,926$
2017 84,566$ 2016 57,079$ 2015 44,116$ 2014 33,558$ 2013 23,470$
2018 81,912$ 2017 52,172$ 2016 37,308$ 2015 31,848$ 2014 26,041$
2019 77,332$ 2018 48,345$ 2017 32,532$ 2016 24,980$ 2015 24,963$
2020 73,808$ 2019 44,313$ 2018 29,347$ 2017 20,181$ 2016 18,734$
Thereafter 314,836$ Thereafter 214,214$ Thereafter 136,329$ Thereafter 61,718$ Thereafter 69,044$
Total Minimum Payments 717,074$ Total Minimum Payments 472,575$ Total Minimum Payments 323,924$ Total Minimum Payments 202,895$ Total Minimum Payments 185,178$
Less: Interest 103,607$ Less: Interest 70,202$ Less: Interest 45,868$ Less: Interest 24,347$ Less: Interest 24,747$
PV of Minimum Payments 613,467$ PV of Minimum Payments 402,373$ PV of Minimum Payments 278,056$ PV of Minimum Payments 178,548$ PV of Minimum Payments 160,431$
15,359$
Capitalization of Operating Leases Capitalization of Operating Leases Capitalization of Operating Leases Capitalization of Operating Leases Capitalization of Operating Leases
Pre‐Tax Cost of Debt 3.25% Pre‐Tax Cost of Debt 3.25% Pre‐Tax Cost of Debt 3.25% Pre‐Tax Cost of Debt 3.25% Pre‐Tax Cost of Debt 3.25%
Number Years Implied by Year 6 Payment 4.3 Number Years Implied by Year 6 Payment 4.8 Number Years Implied by Year 6 Payment 4.6 Number Years Implied by Year 6 Payment 3.1 Number Years Implied by Year 6 Paym 3.7
Lease PV Lease Lease PV Lease Lease PV Lease Lease PV Lease Lease PV Lease
Year Commitment Payment Year Commitment Payment Year Commitment Payment Year Commitment Payment Year Commitment Payment
1 84,620$ 81,956$ 1 56,452$ 54,675$ 1 44,292$ 42,898$ 1 30,610$ 29,646$ 1 22,926$ 22,204$
2 84,566$ 79,326$ 2 57,079$ 53,542$ 2 44,116$ 41,382$ 2 33,558$ 31,479$ 2 23,470$ 22,016$
3 81,912$ 74,418$ 3 52,172$ 47,399$ 3 37,308$ 33,895$ 3 31,848$ 28,934$ 3 26,041$ 23,659$
4 77,332$ 68,045$ 4 48,345$ 42,539$ 4 32,532$ 28,625$ 4 24,980$ 21,980$ 4 24,963$ 21,965$
5 73,808$ 62,900$ 5 44,313$ 37,764$ 5 29,347$ 25,010$ 5 20,181$ 17,199$ 5 18,734$ 15,965$
6 & beyond 73,808$ 246,821$ 6 & beyond 44,313$ 166,454$ 6 & beyond 29,347$ 106,246$ 6 & beyond 20,181$ 49,310$ 6 & beyond 18,734$ 54,622$
PV of Minimum Payments 613,467$ PV of Minimum Payments 402,373$ PV of Minimum Payments 278,056$ PV of Minimum Payments 178,548$ PV of Minimum Payments 160,431$

VALUATION OF OPTIONS GRANTED IN ESOP
Ticker Symbol UA
Current Stock Price $31.17
Risk Free Rate 2.62%
Current Dividend Yield 0.00%
Annualized St. Dev. of Stock Returns 30.69%
Average Average B‐S Value
Range of Number Exercise Remaining Option of Options
Outstanding Options of Shares Price Life (yrs) Price Granted
2015 3,004 14.52 4.91 18.98$ 57,017$
2014 2,811 8.28 5.01 23.97$ 67,376$
2013 2,136 16.22 5.90 18.32$ 39,139$
2012 3,149 15.31 6.80 19.38$ 61,018$
2011 2,404 27.99 7.60 13.52$ 32,501$
Total 13,504 16.07$ 6.01 18.48$ 257,051$

Effects of ESOP Exercise and Share Repurchases on Common Stock Balance Sheet Account and Number of Shares Outstanding
Number of Options Outstanding (shares): 13,504
Average Time to Maturity (years): 6.01
Expected Annual Number of Options Exercised: 2,248
Current Average Strike Price: 16.07$
Cost of Equity: 13.19%
Current Stock Price: $31.17
2016E 2017E 2018E 2019E 2020E 2021E 2022E 2023E 2024E 2025E
Increase in Shares Outstanding: 2,248 2,248 2,248 2,248 2,248 2,248 0 0 0 0
Average Strike Price: 16.07$ 16.07$ 16.07$ 16.07$ 16.07$ 16.07$ 16.07$ 16.07$ 16.07$ 16.07$
Increase in Common Stock Account: 36,131 36,131 36,131 36,131 36,131 36,131 ‐ ‐ ‐ ‐
Change in Treasury Stock 0 0 0 0 0 0 0 0 0 0
Expected Price of Repurchased Shares: 31.17$ 35.28$ 39.93$ 45.20$ 51.16$ 57.91$ 65.54$ 74.18$ 83.97$ 95.04$
Number of Shares Repurchased: ‐ ‐ ‐ ‐ ‐ ‐ ‐ ‐ ‐ ‐
Shares Outstanding (beginning of the year) 181,646,468 181,648,716 181,650,964 181,653,212 181,655,460 181,657,708 181,659,956 181,659,956 181,659,956 181,659,956
Plus: Shares Issued Through ESOP 2,248 2,248 2,248 2,248 2,248 2,248 0 0 0 0
Less: Shares Repurchased in Treasury ‐ ‐ ‐ ‐ ‐ ‐ ‐ ‐ ‐ ‐
Shares Outstanding (end of the year) 181,648,716 181,650,964 181,653,212 181,655,460 181,657,708 181,659,956 181,659,956 181,659,956 181,659,956 181,659,956

Beta
37.10$ 0.9915 1.0915 1.1915 1.2915 1.3915 1.4915 1.5915
2.11% 80.50$ 65.86$ 54.54$ 45.58$ 38.35$ 32.42$ 27.49$
2.41% 74.18$ 61.01$ 50.73$ 42.52$ 35.85$ 30.35$ 25.75$
2.71% 68.52$ 56.63$ 47.25$ 39.70$ 33.54$ 28.42$ 24.13$
3.01% 63.42$ 52.63$ 44.05$ 37.10$ 31.39$ 26.62$ 22.61$
3.31% 58.81$ 48.99$ 41.11$ 34.70$ 29.39$ 24.95$ 21.19$
3.61% 54.62$ 45.65$ 38.40$ 32.46$ 27.53$ 23.38$ 19.85$
3.91% 50.81$ 42.58$ 35.90$ 30.39$ 25.79$ 21.90$ 18.60$
CV Growth of ROIC
37.10$ 11.50% 12.00% 12.50% 13.00% 13.50% 14.00% 14.50%
2.50% 35.50$ 35.97$ 36.40$ 36.80$ 37.17$ 37.51$ 37.83$
3.00% 35.25$ 35.84$ 36.39$ 36.89$ 37.36$ 37.79$ 38.19$
3.50% 34.97$ 35.70$ 36.37$ 36.99$ 37.56$ 38.10$ 38.59$
4.00% 34.66$ 35.54$ 36.35$ 37.10$ 37.80$ 38.44$ 39.04$
4.50% 34.31$ 35.37$ 36.34$ 37.23$ 38.06$ 38.83$ 39.54$
5.00% 33.92$ 35.17$ 36.31$ 37.37$ 38.35$ 39.26$ 40.11$
5.50% 33.47$ 34.94$ 36.29$ 37.53$ 38.69$ 39.76$ 40.76$
CV Growth of NOPLAT
37.10$ 3.25% 3.50% 3.75% 4.00% 4.25% 4.50% 4.75%
11.06% 51.78$ 52.15$ 52.54$ 52.97$ 53.42$ 53.91$ 54.44$
11.56% 46.16$ 46.39$ 46.64$ 46.90$ 47.18$ 47.48$ 47.81$
12.06% 41.25$ 41.38$ 41.52$ 41.66$ 41.82$ 41.98$ 42.16$
12.56% 36.94$ 36.99$ 37.05$ 37.10$ 37.16$ 37.23$ 37.30$
13.06% 33.13$ 33.12$ 33.12$ 33.11$ 33.10$ 33.09$ 33.09$
13.56% 29.75$ 29.70$ 29.65$ 29.59$ 29.53$ 29.47$ 29.41$
14.06% 26.73$ 26.65$ 26.56$ 26.47$ 26.38$ 26.28$ 26.17$
COGS as % of Sales
37.10$ 47.141% 47.901% 48.661% 49.421% 50.18% 50.94% 51.70%
35.82% 48.92$ 46.54$ 44.17$ 41.79$ 39.42$ 37.04$ 34.66$
36.32% 47.36$ 44.98$ 42.60$ 40.23$ 37.85$ 35.48$ 33.10$
36.82% 45.79$ 43.42$ 41.04$ 38.67$ 36.29$ 33.91$ 31.54$
37.32% 44.23$ 41.85$ 39.48$ 37.10$ 34.73$ 32.35$ 29.98$
37.82% 42.67$ 40.29$ 37.92$ 35.54$ 33.16$ 30.79$ 28.41$
38.32% 41.10$ 38.73$ 36.35$ 33.98$ 31.60$ 29.23$ 26.85$
38.82% 39.54$ 37.17$ 34.79$ 32.41$ 30.04$ 27.66$ 25.29$
Beta
37.10$ 0.9915 1.0915 1.1915 1.2915 1.3915 1.4915 1.5915
7.58% 68.24$ 56.81$ 47.71$ 40.34$ 34.28$ 29.22$ 24.96$
7.68% 66.58$ 55.37$ 46.45$ 39.23$ 33.28$ 28.33$ 24.15$
7.78% 64.98$ 53.98$ 45.23$ 38.15$ 32.32$ 27.46$ 23.37$
7.88% 63.42$ 52.63$ 44.05$ 37.10$ 31.39$ 26.62$ 22.61$
7.98% 61.92$ 51.33$ 42.91$ 36.09$ 30.48$ 25.81$ 21.88$
8.08% 60.46$ 50.06$ 41.80$ 35.11$ 29.61$ 25.03$ 21.17$
8.18% 59.04$ 48.84$ 40.73$ 34.16$ 28.76$ 24.26$ 20.48$
Sensitivity Analysis
WACC
SG+A as % of Sales
Equity Risk Premium
Risk‐Free Rate
CV Growth of NOPLAT