Embed Size (px)
Citation preview
Faculty of Bioscience Engineering
Academic year 2012– 2013
Consumer motivation and ability to process health
claims and symbols
Yung, Hung
Promoter : Prof. Dr. Ir. Wim Verbeke
Co-promoter : Dr. Ir. Christine Hoefkens
Master’s dissertation submitted in partial fulfilment of the
requirements for the degree of
Master of Science in Human Nutrition and Rural Development
Main subject: Human Nutrition

Deze pagina is niet beschikbaar omdat ze persoonsgegevens bevat.Universiteitsbibliotheek Gent, 2021.
This page is not available because it contains personal information.Ghent University, Library, 2021.
ii
ABSTRACT
In order to improve consumers' food choices and encourage the European food
industry to provide healthier food products, the EC Regulation 1924/2006 came into
force in January 2007 to support scientifically-sound nutrition and health claims on
food products. However, the legislation alone is insufficient, as the actual effects are
highly dependent on the perceptions and behaviour of consumers.
Serving as a pilot study for the CLYMBOL project -- “Role of health-related claims and
symbols in consumer behaviour”, a cross-sectional web-based survey in Belgium
(Flanders) (N = 565) was carried out. This study aimed to investigate consumers'
motivation and ability to process health claims and symbols, and examined the
changes in their reactions towards these food products bearing health claims in the
past six years.
The results indicated that consumers' motivation and perceived ability to process
health claims and symbols varied according to consumers' characteristics such as
their awareness of the link between diet and health, their current use of health
claims and symbols, familiarity with the specific functional foods, socio-demographic
background and diet-related medical history, as well as their reactions, in terms of
perceived credibility and purchase intention, to functional foods bearing a health
claim or symbol. Consumers' perceptions of health claims and symbols as marketing
gimmicks significantly lowered their motivation, but were not related to their ability.
The ability in terms of objective understanding was not associated to the motivation
nor other consumers' characteristics and reactions; this ability was only related to
their socio-demographic background.
With the changing regulatory climate in the last six years, consumers showed a lower
intention to purchase the functional products bearing a health claim. The
implications of these findings for policymakers and the food industry are also
discussed.

iii
ACKNOWLEDGEMENT
This dissertation would have remained a dream had it not been for many wonderful
and kind people around me, to only some of whom it is possible to give particular
mention here.
I wish to thank, first and foremost, Prof. Wim Verbeke for granting me this valuable
opportunity to learn and gain practical experience in his department, as well as his
inspiring teaching and feedback.
It is with immense gratitude that I acknowledge the guidance, support and
assistance from Dr. Christine Hoefkens along the way. Words are inadequate for
thanking her. It is one of the greatest blessings encountered in my life to have such
an amazing coach, an intelligent, helpful, kind teacher.
I am indebted to Ghent University and its staff for the financial, academic and
technical support which I received, particularly the award of Master Grants that
provided the necessary financial aids for my studies. I owe my deepest gratitude to
my programme coordinator, Ir. Anne-Marie Remaut-De Winter for her valuable,
useful, and important advice and assistance, without which I would not have
obtained the Master Grants nor many more academic achievements.
I am thankful to my many good friends from HuRuDe and flatmates at Home
Boudewijn who supported me and made the learning experiences wonderful and full
of joys.
Last but not least, I would not have made it to where I am without my parents, who
instilled into me a love of creative pursuits, science and languages, and filled me with
courage and love.
Thanks and praises be to God for putting these amazing people around me, and
giving me the privilege to pursue this master programme with inner strength and
wisdom.
iv
TABLE OF CONTENTS
COPYRIGHT ...................................................................................................................... i
ABSTRACT ....................................................................................................................... ii
ANOWLEDGEMENT ....................................................................................................... iii
TABLE OF CONTENTS..................................................................................................... iv
LIST OF FIGURES .......................................................................................................... viii
LIST OF TABLES ............................................................................................................ viii
LIST OF ACRONYMS AND ABBREVIATIONS...................................................................xi
CHAPTER 1: INTRODUCTION ......................................................................................... 1
1.1 Research objectives............................................................................................ 1
1.2 Justification ........................................................................................................ 1
1.3 Research questions ............................................................................................ 2
1.4 Research hypotheses ......................................................................................... 3
CHAPTER 2: LITERATURE REVIEW ................................................................................. 4
2.1 The role of EU legislation on health claims and symbols in the promotion of
healthy eating .................................................................................................... 4
2.2 Processing of health claims and symbols ........................................................... 5
2.2.1 Motivation to process ............................................................................ 5
2.2.2 Ability to process .................................................................................... 6
2.2.2.1 Subjective understanding .............................................................. 7
2.2.2.2 Objective understanding ................................................................ 7
2.2.3 Relation between motivation and ability ............................................... 7
2.3 Consumers' reactions towards health claims and symbols ............................... 8
2.3.1 Perceived credibility and purchase intention ........................................ 8
2.4 Consumers' characteristics influencing their processing of and reactions to
health claims and symbols ................................................................................. 8
2.4.1 Socio-demographic background............................................................. 9
CHAPTER 3: RESEARCH METHODOLOGY .................................................................... 10
3.1 Study design ..................................................................................................... 10
3.1.1 Pre-testing and study protocol ............................................................. 10
3.1.2 Sampling and data collection ............................................................... 10
v
3.2 Measures .......................................................................................................... 10
3.2.1 Dependent variables ............................................................................ 12
3.2.1.1 Motivation to process health claims and symbols ...................... 12
3.2.1.2 Ability to process health claims and symbols .............................. 12
3.2.1.3 Consumers' reactions in terms of perceived credibility and
purchase intention of product concepts .................................... 12
3.2.2 Independent variables .......................................................................... 13
3.2.2.1 Consumers' characteristics influencing processing of and
reactions towards health claims and symbols ............................ 13
3.3 Data analysis .................................................................................................... 14
3.3.1 Data cleaning and recoding .................................................................. 14
3.3.2 New constructs of variables and reliability test ................................... 14
3.3.3 Descriptive statistics ............................................................................. 15
3.3.4 Statistical analysis ................................................................................. 15
3.3.4.1 Assumptions and mean comparison............................................ 15
3.3.4.2 Correlations .................................................................................. 16
3.3.4.3 Chi-square statistics ..................................................................... 16
CHAPTER 4: RESULTS ................................................................................................... 17
4.1 Descriptive statistics ........................................................................................ 17
4.1.1 Socio-demographic background........................................................... 17
4.1.2 Background attitudes ........................................................................... 18
4.1.3 Product familiarity ................................................................................ 18
4.1.4 Consumers' reactions towards health claims and symbols ................. 18
4.1.4.1 Perceived credibility ..................................................................... 18
4.1.4.2 Purchase intention ....................................................................... 19
4.1.5 Motivation and ability to process health claims and symbols ............. 20
4.2 Relations between consumers' characteristics and the level of motivation and
ability to process health claims and symbols ................................................... 21
4.2.1 Awareness of the link between diet and health .................................. 21
4.2.2 Current usage of health claims and symbols ....................................... 22
4.2.3 Perception of validity ........................................................................... 23
4.2.4 Familiarity with specific functional food product concepts ................. 24
vi
4.2.4.1 Familiarity with calcium-enriched fruit juice ............................... 24
4.2.4.2 Familiarity with fibre-enriched breakfast cereals ........................ 25
4.2.4.3 Familiarity with omega-3-enriched spread .................................. 26
4.2.5 Diet-related medical history ................................................................. 27
4.2.6 Gender .................................................................................................. 28
4.2.7 Age ........................................................................................................ 28
4.2.8 Education level ..................................................................................... 30
4.2.9 Special diet status ................................................................................. 31
4.2.10 Role in the households ......................................................................... 32
4.3 Relations between consumers' motivation and ability to process health claims
and symbols ..................................................................................................... 33
4.4 Relations between consumers' reactions and the level of motivation and
ability to process health claims and symbols ................................................... 34
4.4.1 Perceived credibility of the product concepts ..................................... 34
4.4.1.1 Perceived credibility of calcium-enriched fruit juice bearing
health claim and symbol ............................................................. 34
4.4.1.2 Perceived credibility of fibre-enriched breakfast cereals bearing
health claim and symbol ............................................................. 36
4.4.1.3 Perceived credibility of omega-3-enriched spread bearing health
claim and symbol ........................................................................ 38
4.4.2 Purchase intention of the product concepts ....................................... 40
4.4.2.1 Purchase intention of calcium-enriched fruit juice bearing health
claim and symbol ........................................................................ 40
4.4.2.2 Purchase intention of fibre-enriched breakfast cereals bearing
health claim and symbol ............................................................. 42
4.4.2.3 Purchase intention of omega-3-enriched spread bearing health
claim and symbol ........................................................................ 44
4.5 Changes in consumers’ reactions towards health claims six years after
implementation of the Regulation ................................................................... 47
4.5.1 Perceived credibility of product concepts with health claims ............. 47
4.5.2 Purchase intention of product concepts with health claims ............... 47
4.5.3 Differences in socio-demographic characteristics of the samples in the
previous and follow-up study ............................................................... 48
vii
CHAPTER 5: DISCUSSION ............................................................................................. 49
5.1 Consumers' motivation and ability to process health claims and symbols ..... 49
5.1.1 Consumers' background attitudes ....................................................... 49
5.1.2 Familiarity ............................................................................................. 50
5.1.3 Socio-demographic background........................................................... 51
5.1.4 Relation between motivation and ability ............................................. 52
5.2 Consumers’ reactions towards health claims and symbols ............................. 52
5.2.1 Relation to motivation and ability ........................................................ 52
5.3 The change of consumers' reactions six years after the implementation of EC
Regulation 1924/2006 ...................................................................................... 53
5.4 Practical implications ....................................................................................... 53
5.5 Limitations of the study and future research .................................................. 54
CHAPTER 6: CONCLUSION ........................................................................................... 56
REFERENCE ................................................................................................................... 57
APPENDIX A: Survey......................................................................................................I
APPENDIX B: Dataset and statistics outputs...............................................................XI
viii
LIST OF FIGURES
FIGURE 1. AN EXAMPLE OF POSSIBLE HEALTH SYMBOLS ON THE LABELS OF FOOD PRODUCTS ..... 4
FIGURE 2. A THEORETICAL MODEL FOR THE EFFECTS OF NUTRITION INFORMATION SHOWN ON
FOOD LABELS ON CUSTOMERS’ INFORMATION PROCESSING AND USE .......................... 6
LIST OF TABLES
TABLE 1. PRODUCT CONCEPTS (I.E. CARRIER–ENRICHMENT–CLAIM OR SYMBOL) USED AS
EXAMPLE ......................................................................................................................... 11
TABLE 2. THE RELIABILITY TESTS FOR NEW CONSTRUCTS OF VARIABLES ...................................... 14
TABLE 3. SOCIO-DEMOGRAPHIC CHARACTERISTICS (MEAN ± SD) AND (N (%)) (N = 565) ............. 17
TABLE 4. BACKGROUND ATTITUDES (MEAN ± SD) (N = 565) .......................................................... 18
TABLE 5. PRODUCT FAMILIARITY TOWARDS THE PRODUCT CONCEPTS (MEAN ± SD) (N = 565) ... 18
TABLE 6. PERCEIVED CREDIBILITY TOWARDS THE PRODUCT CONCEPTS WITH HEALTH CLAIMS
AND SYMBOLS (MEAN ± SD) (N = 565) ........................................................................... 19
TABLE 7. PURCHASE INTENTION TOWARDS THE PRODUCT CONCEPTS WITH HEALTH CLAIMS AND
SYMBOLS (MEAN ± SD) (N = 565).................................................................................... 19
TABLE 8. MOTIVATION AND ABILITY TO PROCESS HEALTH CLAIMS AND SYMBOLS (MEAN ± SD)
(N = 565) ......................................................................................................................... 20
TABLE 9. RELATIONS BETWEEN CONSUMERS' DIET-HEALTH AWARENESS AND THEIR
MOTIVATION AND ABILITY TO PROCESS HEALTH CLAIMS AND SYMBOLS ..................... 21
TABLE 10. RELATIONS BETWEEN CONSUMERS' CURRENT USAGE OF AND THEIR MOTIVATION
AND ABILITY TO PROCESS HEALTH CLAIMS AND SYMBOLS ............................................ 22
TABLE 11. RELATIONS BETWEEN CONSUMERS' PERCEPTION OF VALIDITY OF AND THEIR
MOTIVATION AND ABILITY TO PROCESS HEALTH CLAIMS AND SYMBOLS ..................... 23
TABLE 12. RELATIONS BETWEEN CONSUMERS' FAMILIARITY WITH CALCIUM-ENRICHED FRUIT
JUICE AND THEIR MOTIVATION AND ABILITY TO PROCESS HEALTH CLAIMS AND
SYMBOLS ......................................................................................................................... 24
TABLE 13. RELATIONS BETWEEN CONSUMERS' FAMILIARITY WITH FIBRE-ENRICHED BREAKFAST
CEREALS AND THEIR MOTIVATION AND ABILITY TO PROCESS HEALTH CLAIMS AND
SYMBOLS. ........................................................................................................................ 25
ix
TABLE 14. RELATIONS BETWEEN CONSUMERS' FAMILIARITY WITH OMEGA-3-ENRICHED SPREAD
AND THEIR MOTIVATION AND ABILITY TO PROCESS HEALTH CLAIMS AND SYMBOLS .. 26
TABLE 15. RELATIONS BETWEEN THE PRESENCE OF DIET-RELATED MEDICAL HISTORY AND THEIR
MOTIVATION AND ABILITY TO PROCESS HEALTH CLAIMS AND SYMBOLS ..................... 27
TABLE 16. RELATIONS BETWEEN CONSUMERS' GENDER AND THEIR MOTIVATION AND ABILITY TO
PROCESS HEALTH CLAIMS AND SYMBOLS ...................................................................... 28
TABLE 17. RELATIONS BETWEEN CONSUMERS' AGE AND THEIR MOTIVATION AND ABILITY TO
PROCESS HEALTH CLAIMS AND SYMBOLS ...................................................................... 29
TABLE 18. RELATIONS BETWEEN CONSUMERS' EDUCATION LEVEL AND THEIR MOTIVATION AND
ABILITY TO PROCESS HEALTH CLAIMS AND SYMBOLS .................................................... 30
TABLE 19. RELATIONS BETWEEN CONSUMERS' SPECIAL DIET STATUS AND THEIR MOTIVATION
AND ABILITY TO PROCESS HEALTH CLAIMS AND SYMBOLS ............................................ 31
TABLE 20. RELATIONS BETWEEN CONSUMERS' ROLE IN THE HOUSEHOLDS AND THEIR
MOTIVATION AND ABILITY TO PROCESS HEALTH CLAIMS AND SYMBOLS ..................... 32
TABLE 21. RELATIONS BETWEEN CONSUMERS' MOTIVATION AND ABILITY TO PROCESS HEALTH
CLAIMS AND SYMBOLS ................................................................................................... 33
TABLE 22. RELATIONS BETWEEN CONSUMERS' PERCEIVED CREDIBILITY OF CALCIUM-ENRICHED
FRUIT JUICE BEARING HEALTH CLAIM AND THEIR MOTIVATION AND ABILITY TO
PROCESS HEALTH CLAIMS AND SYMBOLS. ..................................................................... 34
TABLE 23. RELATIONS BETWEEN CONSUMERS' PERCEIVED CREDIBILITY OF CALCIUM-ENRICHED
FRUIT JUICE BEARING HEALTH SYMBOL AND THEIR MOTIVATION AND ABILITY TO
PROCESS HEALTH CLAIMS AND SYMBOLS ...................................................................... 35
TABLE 24. RELATIONS BETWEEN CONSUMERS' PERCEIVED CREDIBILITY OF FIBRE-ENRICHED
BREAKFAST CEREALS BEARING HEALTH CLAIM AND THEIR MOTIVATION AND ABILITY
TO PROCESS HEALTH CLAIMS AND SYMBOLS ................................................................. 36
TABLE 25. RELATIONS BETWEEN CONSUMERS' PERCEIVED CREDIBILITY OF FIBRE-ENRICHED
BREAKFAST CEREALS BEARING HEALTH SYMBOLS AND THEIR MOTIVATION AND
ABILITY TO PROCESS HEALTH CLAIMS AND SYMBOLS .................................................... 37
TABLE 26. RELATIONS BETWEEN CONSUMERS' PERCEIVED CREDIBILITY OF OMEGA-3-ENRICHED
SPREAD BEARING HEALTH CLAIM AND THEIR MOTIVATION AND ABILITY TO PROCESS
HEALTH CLAIMS AND SYMBOLS ...................................................................................... 38
x
TABLE 27. RELATIONS BETWEEN CONSUMERS' PERCEIVED CREDIBILITY OF OMEGA-3-ENRICHED
SPREAD BEARING HEALTH SYMBOL AND THEIR MOTIVATION AND ABILITY TO PROCESS
HEALTH CLAIMS AND SYMBOLS ...................................................................................... 39
TABLE 28. RELATIONS BETWEEN CONSUMERS' PURCHASE INTENTION OF CALCIUM-ENRICHED
FRUIT JUICE BEARING HEALTH CLAIM AND THEIR MOTIVATION AND ABILITY TO
PROCESS HEALTH CLAIMS AND SYMBOLS ...................................................................... 40
TABLE 29. RELATIONS BETWEEN CONSUMERS' PURCHASE INTENTION OF CALCIUM-ENRICHED
FRUIT JUICE BEARING HEALTH SYMBOL AND THEIR MOTIVATION AND ABILITY TO
PROCESS HEALTH CLAIMS AND SYMBOLS ...................................................................... 41
TABLE 30. RELATIONS BETWEEN CONSUMERS' PURCHASE INTENTION OF FIBRE-ENRICHED
BREAKFAST CEREALS BEARING HEALTH CLAIM AND THEIR MOTIVATION AND ABILITY
TO PROCESS HEALTH CLAIMS AND SYMBOLS ................................................................. 42
TABLE 31. RELATIONS BETWEEN CONSUMERS' PURCHASE INTENTION OF FIBRE-ENRICHED
BREAKFAST CEREALS BEARING HEALTH SYMBOL AND THEIR MOTIVATION AND ABILITY
TO PROCESS HEALTH CLAIMS AND SYMBOLS ................................................................. 43
TABLE 32. RELATIONS BETWEEN CONSUMERS' PURCHASE INTENTION OF OMEGA-3-ENRICHED
SPREAD BEARING HEALTH CLAIM AND THEIR MOTIVATION AND ABILITY TO PROCESS
HEALTH CLAIMS AND SYMBOLS ...................................................................................... 44
TABLE 33. RELATIONS BETWEEN CONSUMERS' PURCHASE INTENTION OF OMEGA-3-ENRICHED
SPREAD BEARING HEALTH SYMBOL AND THEIR MOTIVATION AND ABILITY TO PROCESS
HEALTH CLAIMS AND SYMBOLS ...................................................................................... 45
TABLE 34. SUMMARY OF FINDINGS REGARDING THE ASSOCIATION BETWEEN CONSUMERS’
MOTIVATION AND ABILITY TO PROCESS HEALTH CLAIMS AND SYMBOLS, AND
CONSUMERS' CHARACTERISTICS AND REACTIONS TOWARDS THESE CLAIMS AND
SYMBOLS ......................................................................................................................... 46
TABLE 35. CHANGES IN CONSUMERS' PERCEIVED CREDIBILITY OF PRODUCT CONCEPTS BEARING
HEALTH CLAIMS IN FOLLOW-UP STUDY COMPARED TO THE PREVIOUS STUDY ............ 47
TABLE 36. CHANGES IN CONSUMERS' PURCHASE INTENTION OF PRODUCT CONCEPTS BEARING
HEALTH CLAIMS IN FOLLOW-UP STUDY COMPARED TO THE PREVIOUS STUDY ............ 48
TABLE 37. DIFFERENCES IN SOCIO-DEMOGRAPHIC CHARACTERISTICS OF THE SAMPLES IN THE
PREVIOUS AND FOLLOW-UP STUDY ............................................................................... 48
xi
L IST OF ACRONYMS AND ABBREVIATIONS
ANOVA Analysis of Variances
EC European Commission
e.g. Exempli gratia (for example)
EFSA European Food Safety Agency
EUFIC European Food Information Council
etc. Et cetera (and so forth)
FLABEL Food Labelling to Advance Better Education for Life
H Hypothesis
N Total sample size
n Subsample size
P Page (number)
p-value Probability value
Q Question
SD Standard Deviation
SPSS Statistical Package for Social Sciences
1
CHAPTER 1: INTRODUCTION
1.1 Research objectives
The objectives of this research study are to determine Belgian consumers'
motivation and ability to process health claims and symbols, as well as to examine
changes in consumers' reactions towards functional foods bearing health claims,
before and after the implementation of EC Regulation 1924/2006 (henceforth, ‘the
Regulation’). The study will serve as a pilot study for the CLYMBOL project -- “Role of
health-related claims and symbols in consumer behaviour”, which is a recently
funded project within FP7 of the European Commission (FP7-KBBE-6-2012-311963).
The overall objective of the project is to give future direction for the development of
health claims and symbols to strengthen informed choice and healthy eating.
1.2 Justification
The increase in consumer awareness of the relation between nutrition and health
has been a key driver underpinning both functional food development and
regulatory changes (American Dietetic Association, 2006). The Regulation came into
force in January 2007, supporting scientifically-sound nutrition and health claims on
food products, requiring that health claims be stringently regulated and standardized,
while health symbols are not (European Commission, 2007). The overall aim of the
Regulation is to help consumers make more informed and eventually healthier food
choices, and encourage European food industries to provide healthier food products.
However, the availability of health claims and symbols from a scientific perspective is
insufficient, as their actual effects depend on the interaction with consumers and
their resulting behaviour (Hieke & Taylor, 2012; Grunert & Wills, 2007; Moorman,
1990). Qualitative research suggested that consumers in general were not nutrition
experts (Bech-Larsen & Scholderer, 2007), and they had different characteristics,
such as diet-health awareness, use of and perception of the validity of health claims
and symbols, familiarity with specific functional food products, socio-demographic
background, special diet status and medical history, which could influence their
levels of information acquisition (Moorman, 1990).
Though functional foods promise health benefits beyond basic nutrition, consumers
are generally sceptical about the reliability of functional foods, as well as health
claims and symbols (William, 2005). Food industries can never take consumers'
acceptance of food products with health claims and/or symbols for granted (Verbeke,
2010). Up-to-date understanding of consumer perception gives competitive
advantages in the market, in which the food industries could have more strategic
2
targeting with respect to customization and innovation (Zimmer et al., 2010).
Furthermore, since it is a very costly, lengthy and often disappointing process to
substantiate claims and get approved under the current EU legislation (Verbeke,
2010), it is very important to determine how motivated and capable consumers are
to process these claims, and how they react to them. Hence, gaining consumer
insights may enable food industries to determine how worthwhile it is to invest in
continued research to scientifically substantiate these claims, as well as to provide
policy makers with a useful tool for designing public health programs that truly
benefit consumers (Annunziata & Vecchio, 2011).
Previous studies have invariably stressed the need for further research. With a time
interval of six years, consumers have had the opportunity to become more familiar
with specific functional foods and the health claims and symbols on the labels
(Verbeke, 2010). With the implementation of the Regulation, it would be the
appropriate time to conduct a study that clears uncertainties at the industrial as well
as governmental level, and to respond to the scepticism expressed by researchers
towards the potential for the new legislation to promote healthy food choices and
improve consumption behaviour (Bech-Larsen & Scholderer, 2007).
1.3 Research questions
Main questions
How motivated and capable are consumers to process health claims and symbols on
functional food products, and how much did their reactions towards functional foods
bearing health claims change six years after the implementation of the Regulation?
Specifically :
1) How do consumers' characteristics (diet-health awareness, current use of
health claims and symbols, perception of validity of health claims and
symbols, familiarity with specific functional food product concepts,
socio-demographic background, special diet status and diet-related medical
history) relate to the level of motivation and ability to process health claims
and symbols?
2) Is there any relation between consumers’ motivation and ability to process
health claims and symbols?
3) Are consumers' reactions towards health claims and symbols (in terms of
perceived credibility and purchase intention) related to the level of
motivation and ability to process these claims and symbols?
4) Are there changes in consumers’ reactions towards health claims six years
after the implementation of the Regulation?
3
1.4 Research hypotheses
The research questions will be answered by testing the following hypotheses:
Hypothesis 1 (H1): The level of motivation and ability to process health claims and
symbols are related to consumers' characteristics, specifically a higher motivation
and ability is expected among/with:
H1a: Participants with a higher awareness of the link between diet and health
H1b: Participants with a higher use of health claims and symbols
H1c: Participants who perceive that all health claims and symbols are regulated by
the European laws and substantiated by scientific evidence
H1d: Participants who are more familiar with the product concepts
H1e: Participants with diet-related medical history
H1f: Women versus men
H1g: Increasing age
H1h: Higher educational level
H1i: Participants on a diet or following health regimes
H1j: Participants responsible for the main food purchasing
Hypothesis 2 (H2): There is a positive relation between consumers’ motivation and
ability to process health claims and symbols.
Hypothesis 3 (H3): The level of motivation and ability to process health claims and
symbols are related to consumers' reactions towards the health claims and symbols,
specifically a higher motivation and ability is expected among:
H3a: Participants with a higher perceived credibility of the product concepts
H3b: Participants with a higher purchase intention of the product concepts
Hypothesis 4 (H4): There are changes in consumers’ reactions towards health claims
six years after implementation of the Regulation.
H4a: There is a significant decrease in participants’ credibility of functional foods
with health claims compared to six years ago
H4b: There is a significant decrease in participants' purchase intention of
functional foods with health claims compared to six years ago
4
CHAPTER 2: LITERATURE REVIEW
2.1 The role of EU legislation on health claims and symbols in the promotion of
healthy eating
Consumers have become increasingly aware of the relation between diet and health
(American Dietetic Association, 2006). More attention has been paid to the
information sources which are related to health during food purchase (Gerrior, 2010).
Recent market data showed that there was an increasing demand for functional
foods in many countries, even in a challenged economy (American Dietetic
Association, 2010). The growing market is explained by the increasing cost of health
care, the aging population, and the desire of consumers for an improved quality of
their later years (Siro et al., 2008).
However, consumers cannot simply observe or feel the nutritional value or the
health benefits of a food product, even after consumption (Caswell & Mojduszka,
1996). In general, consumers have limited motivation and ability to obtain and
understand complicated information about nutrition and health. As a result, they
only read the information superficially at the point of purchase (Gerrior, 2010). In
order to protect consumers from being misled by this superficial information on food
products, Regulation (EC) No 1924/2006 has come into force in the European Union
since January 2007 (European Commission, 2007), to regulate all types of claims.
Basically, two types of claims can be made on food products, namely nutrition claims
and health claims. Health claims can be subdivided into functional health claims,
reduction of disease risk claims, and claims referring to children's development and
health. In this study, only functional health claims were investigated, hereafter
referred to as "health claims". Health claims are defined as any message that states a
relation between a food category, a food or one of its constituents, and health, e.g.
"Calcium is needed to maintain healthy teeth". Whether generic or product-specific,
the health benefits claimed must be substantiated by scientific evidence that shows
the effect of the food or food constituents on health under normal or typical
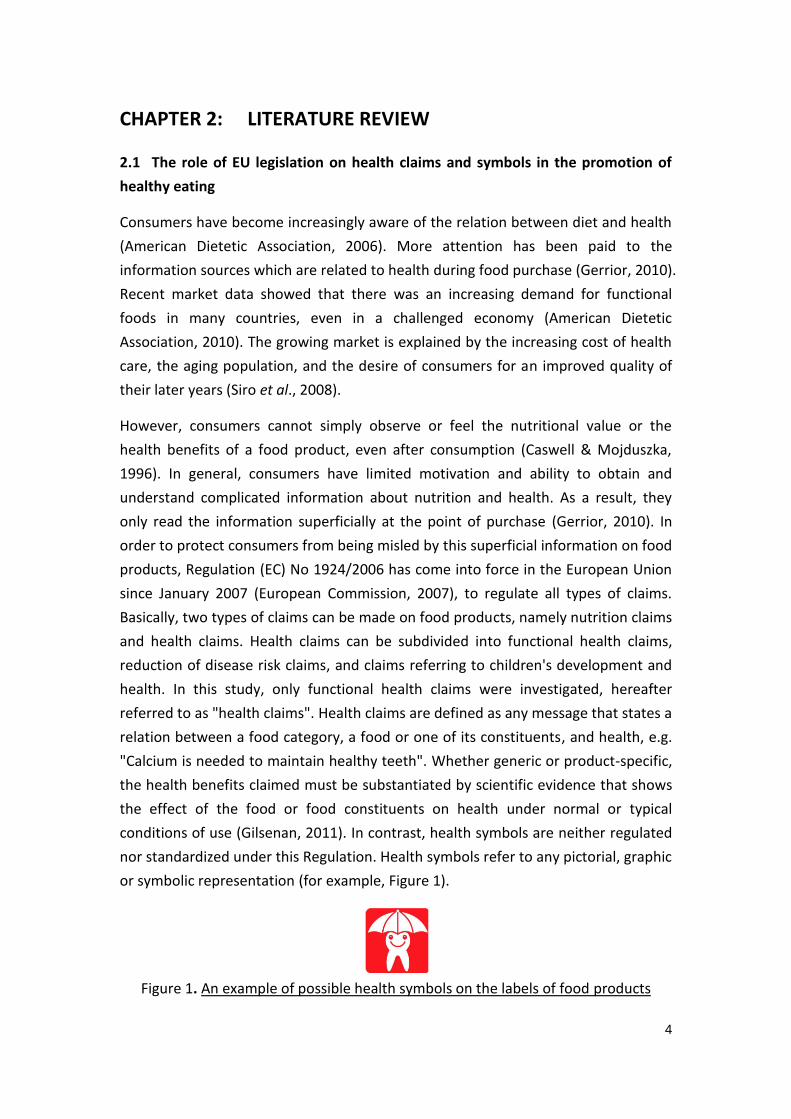
conditions of use (Gilsenan, 2011). In contrast, health symbols are neither regulated
nor standardized under this Regulation. Health symbols refer to any pictorial, graphic
or symbolic representation (for example, Figure 1).
Figure 1. An example of possible health symbols on the labels of food products
5
awarded to food products which meet certain nutrition requirements and constitute
the healthiest option within a product category (European Commission, 2007). In the
following sections, the term "health-related information" would be used to describe
health claims and symbols.
2.2 Processing of health claims and symbols
The availability of correct health claims and symbols from a scientific perspective
may help consumers to make more informed and healthier food choices. However,
there is no guarantee that consumers actually use and/or really benefit from the
information disclosures (Grunert & Wills, 2007). The actual effects highly depend on
the interaction with consumers, their characteristics and the resulting behaviour
(Hieke & Taylor, 2012; Moorman, 1990). This study focused on the primary
determinants of the processing level of health claims and symbols. Studies have
shown that consumers' level of processing depends on the opportunity, their
motivation and ability during or right after the information exposure (Maclnnis et al.,
1991). Assuming that the opportunity is present, in which there is sufficient
scientifically sound health claims and symbols available at an appropriate moment,
then the only uncertainties are the motivation and ability of consumers to process
these health-related information on food products. Both the motivation and ability
are important determinants of the actual and accurate use of health claims and
symbols, and they may further influence food choice and healthy eating behaviour
(Yoon & George, 2012).
2.2.1 Motivation to process
Motivation has been defined as goal-directed arousal, which can be explained in this
case as the desire or readiness of consumers to process health-related information
(Moorman, 1990). Consumers with a higher level of motivation tend to be more
willing to allocate processing resources (Maclnnis et al., 1991), thus it increases the
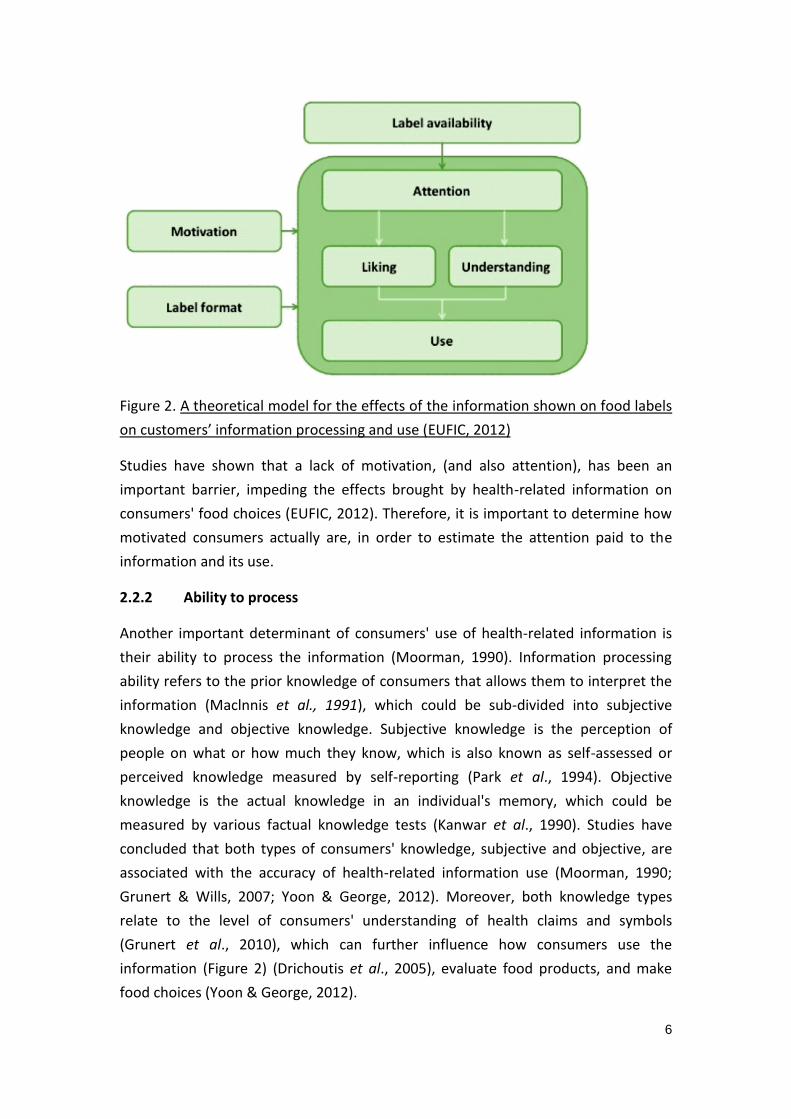
accessibility and the probability that the information is processed. As illustrated in
the following theoretical model (Figure 2), motivation influences attention which is
crucial to the use of the information. If consumers’ motivation is low, it is less likely
that they would pay attention to the information and then use the information
(EUFIC, 2012).
6
Figure 2. A theoretical model for the effects of the information shown on food labels
on customers’ information processing and use (EUFIC, 2012)
Studies have shown that a lack of motivation, (and also attention), has been an
important barrier, impeding the effects brought by health-related information on
consumers' food choices (EUFIC, 2012). Therefore, it is important to determine how
motivated consumers actually are, in order to estimate the attention paid to the
information and its use.
2.2.2 Ability to process
Another important determinant of consumers' use of health-related information is
their ability to process the information (Moorman, 1990). Information processing
ability refers to the prior knowledge of consumers that allows them to interpret the
information (Maclnnis et al., 1991), which could be sub-divided into subjective
knowledge and objective knowledge. Subjective knowledge is the perception of
people on what or how much they know, which is also known as self-assessed or
perceived knowledge measured by self-reporting (Park et al., 1994). Objective
knowledge is the actual knowledge in an individual's memory, which could be
measured by various factual knowledge tests (Kanwar et al., 1990). Studies have
concluded that both types of consumers' knowledge, subjective and objective, are
associated with the accuracy of health-related information use (Moorman, 1990;
Grunert & Wills, 2007; Yoon & George, 2012). Moreover, both knowledge types
relate to the level of consumers' understanding of health claims and symbols
(Grunert et al., 2010), which can further influence how consumers use the
information (Figure 2) (Drichoutis et al., 2005), evaluate food products, and make
food choices (Yoon & George, 2012).
7
2.2.2.1 Subjective understanding
Subjective understanding refers to the meaning that people attach to the perceived
information, as well as how much the individuals believe that they have understood
what have been communicated (Kardes et al., 2004). It significantly influences
consumers’ use of health claims and symbols (Drichoutis et al., 2005). However,
most studies are criticized for using samples of volunteer participants (Cowburn &
Stockley, 2005), who have different levels of subjective understanding compared to
the general population. It can hardly be used as the only evidence base to accurately
estimate consumers’ habitual use of health claims and symbols (Cowburn & Stockley,
2005). Therefore, Grunert and Wills (2007) suggested that it is important to also
determine what they have actually understood, through the probing of objective
understanding (see 2.2.2.2 Objective understanding), in order to study the health or
nutrition effects brought by the use of these health claims and symbols.
2.2.2.2 Objective understanding
Studies showed that a higher level of objective knowledge led to a better
understanding of health-related information, which made it the strongest indicator
of the ability of consumers to correctly understand health claims and symbols
(Grunert et al., 2010). Moorman (1993) suggested that objective understanding
could be measured by probing the understanding of terminology used in health
claims. Many studies reported that although consumers could understand many of
the terms or types of nutrients mentioned on food labels, they did not truly
understand the roles of the food products or functional ingredients played in their
diets and health (Cowburn & Stockley, 2005).
2.2.3 Relation between motivation and ability
The ability to process health-related information was reported to be higher in the
consumers with higher level of motivation (Petty and Cacioppo, 1986). Moorman
(1990) also reported that when there was more motivation, it led to a higher level of
understanding for health-related information. It was indicated that when consumers
had sufficient motivation to process health claims and symbols, the ability in terms
of knowledge and understanding would have significant effects on consumer food
decision-making (Yoon, & George, 2012). When understanding is the prerequisite for
meaningful use of health-related information (Moorman, 1990; Grunert & Wills,
2007; Yoon & George, 2012), many studies have also shown that the level of usage is
much lower than the level expected, given any particular level of understanding
(Grunert et al., 2010), thus it has been repeatedly emphasized that it is important to
consider consumers' motivation beside understanding.
8
2.3 Consumers' reactions towards health claims and symbols
This study would also serve as a follow-up research for the study conducted in 2006
among 341 Belgian consumers on their appeal of nutrition and health claims in three
different product concepts with three different types of claims (Verbeke et al., 2009).
The findings showed that consumers' reactions to health claims highly depended on
personal beliefs about the health benefits claimed, which were largely shaped by the
information and communication that consumers received from sources regarded as
trustworthy (Bech-Larsen & Grunert, 2003; Verbeke et al., 2009).
2.3.1 Perceived credibility and purchase intention
Perceived credibility can be defined as the judgement of consumers about the
quality and veracity of the information processed (Schiffman et al., 2008), such as
the health claims and symbols on food product labels. Purchase intention refers to
the reported probability of buying a product, which is associated with the intention
that the consumers would actually purchase the product (Whitlar et al., 1993). Both
types of consumers' reactions were found to be associated with the specific
claim–carrier combinations, and were measured by self-reporting and using different
food products with different health claims and symbols as stimuli (van Kleef et al.,
2005; Verbeke et al., 2009).
2.4 Consumers' characteristics influencing their processing of and reactions to
health claims and symbols
Consumers generally were found to have high awareness of the link between diet
and health (Armstrong et al,. 2005). Previous studies have shown that individuals
with higher awareness tended to be more motivated to use health-related
information such as health claims and symbols (Vyth et al., 2010). On the other hand,
consumers' motivation was also influenced by the perceived credibility and types of
health-related information (Krystallis et al., 2008). Consumers claimed to be more
motivated to process health-related information when they were unfamiliar with the
products, and that influenced significantly their purchase intention (Cowburn &
Stockley, 2005). However, consumers who were more motivated and with higher
level of subjective knowledge tended to evaluate the functional food items more
unfavourably, and were found to have a lower purchase intention (Yoon & George,
2012), but inconsistent results were reported in other studies.
A stronger belief that food has an impact on health, a higher level of product
familiarity and subjective knowledge were positively related to perceived credibility
and purchase intention, whereas attitudinal factors such as perceived control over
9
own health or perceptions of functional foods (e.g. as a marketing scam) were
negatively associated with perceived credibility and purchase intention (Urala &
Lähteenmäki, 2004 ; Urala & Lähteenmäki, 2007; Verbeke et al., 2009). Thus, it was
indicated that consumers' attitudes and familiarity with the product concept are
crucial determinants of the structure of functional food market (Verbeke, 2010).
Besides, Consumers’ processing of information is often associated with their trust in
and knowledge about the matters (Bech-Larsen & Grunert, 2003; Bech-Larsen &
Scholderer, 2007; Urala & Lähteenmäki, 2007). Consumers were expected to have
less trust in health claims if they were not aware of the Regulation (all claims have to
be scientifically substantiated) and might perceive that claims are just marketing
gimmicks (Verbeke et al., 2009). In contrast, consumers were expected to have more
trust in health symbols if they were not aware that they were not regulated.
2.4.1 Socio-demographic background
Females, consumers who follow health regimes or have been confronted with
diet-related diseases, were found to be more motivated to process health-related
information (Dean et al., 2012; Grunert et al., 2010; Urala, 2005; Yoon & George,
2012), as they are more interested in healthy eating and health in general (Bogue &
Ryan, 2000; Childs & Poryzees, 1997). Older consumers tend to be more motivated
than younger groups because of the increased health concerns (Grunert & Wills,
2007; Yoon & George, 2012), but have a lower ability to process health-related
information, especially in terms of objective understanding (Yoon & George, 2012).
Meanwhile, consumers with a higher educational level tend to be more capable to
process the information because of better understanding (Grunert et al., 2010).
Perceived credibility was reported to be positively associated with male and younger
age groups (Verbeke et al., 2009), while purchase intention was positively associated
with older age groups (Poulsen, 1999).
Generally, socio-demographic characteristics play important roles in the processing
of health-related information such as the motivation and ability to process health
claims and symbols (Bogue & Ryan, 2000; Grunert et al., 2010). However, they play a
relatively minor role in consumers' reactions, such as perceived credibility and
purchase intention, to functional food product with health claims, which poses
difficulties to food industries while they are targeting particular market segments
(Verbeke, 2005; Verbeke et al., 2009).
10
CHAPTER 3: RESEARCH METHODOLOGY
3.1 Study design
3.1.1 Pre-testing and study protocol
This study was conducted with the use of survey (Appendix A) which was developed
in English and translated into Dutch. A preliminary version of the survey was
pretested in a small sample of 21 researchers and university students (11 of the 21
are with formal nutrition education background) for clarity of content, language/
wording, overall understanding and length of the survey. The survey was then
refined and finalized according to the feedback, and included in the study protocol.
The Belgian Ethics Committee of the Ghent University Hospital granted ethics
approval (Ethics Approval No. B670201316620) after reviewing the study protocol.
3.1.2 Sampling and data collection
Quantitative descriptive data were collected through a cross-sectional structured
web-based consumer survey in the Dutch speaking part of Belgium (Flanders) in
February 2013. Total sample size was 565 participants. Participants were randomly
selected from the consumer panel provided by Thesistools. Such panels consist of
individuals who were recruited through off-line recruitment methods (e.g. random
walk or street contact procedures) and who agreed to take part in future surveys. All
contact and questionnaire administration procedures were electronic. Qualtrics was
used as the software carrying out the web-based survey.
All participants were asked to provide written consent before the study (Appendix A).
In order to guarantee the anonymity and confidentiality of the data, a code or id
number will be used as identity. As such, all data were coded and processed
anonymously.
3.2 Measures
The survey consisted of four parts: (1) motivation to process, (2) ability to process
health claims and symbols, (3) consumers' reactions in terms of perceived credibility
and purchase intention of product concepts, (4) consumer characteristics influencing
processing of health claims and symbols. As previous studies showed that different
functional foods could elicit different consumer reactions (Ares & Gambaro, 2007;
Urala & Lähteenmäki, 2004), thus, functional foods should be studied as separate
products within the various food categories instead of one homogeneous group (Siro
et al., 2008). Three types of food products were considered in this study (Table 1), i.e.
11
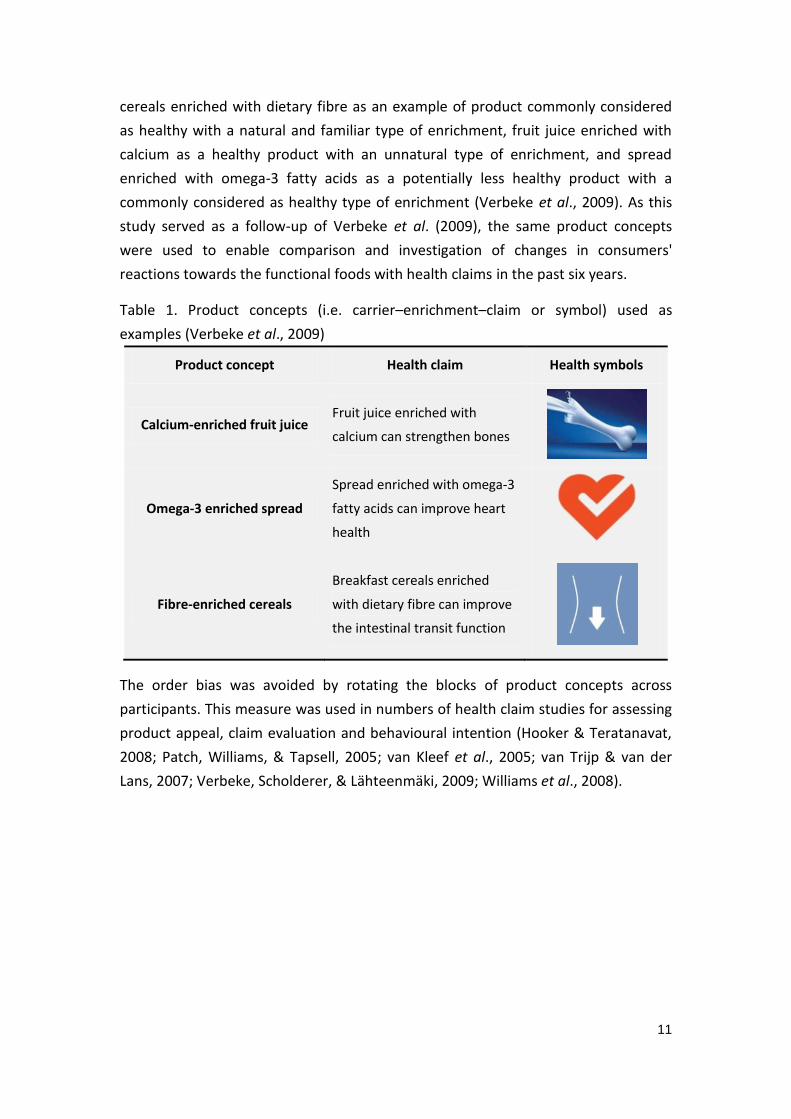
cereals enriched with dietary fibre as an example of product commonly considered
as healthy with a natural and familiar type of enrichment, fruit juice enriched with
calcium as a healthy product with an unnatural type of enrichment, and spread
enriched with omega-3 fatty acids as a potentially less healthy product with a
commonly considered as healthy type of enrichment (Verbeke et al., 2009). As this
study served as a follow-up of Verbeke et al. (2009), the same product concepts
were used to enable comparison and investigation of changes in consumers'
reactions towards the functional foods with health claims in the past six years.
Table 1. Product concepts (i.e. carrier–enrichment–claim or symbol) used as
examples (Verbeke et al., 2009)
Product concept Health claim Health symbols
Calcium-enriched fruit juice Fruit juice enriched with
calcium can strengthen bones
Omega-3 enriched spread
Spread enriched with omega-3
fatty acids can improve heart
health
Fibre-enriched cereals
Breakfast cereals enriched
with dietary fibre can improve
the intestinal transit function
The order bias was avoided by rotating the blocks of product concepts across
participants. This measure was used in numbers of health claim studies for assessing
product appeal, claim evaluation and behavioural intention (Hooker & Teratanavat,
2008; Patch, Williams, & Tapsell, 2005; van Kleef et al., 2005; van Trijp & van der
Lans, 2007; Verbeke, Scholderer, & Lähteenmäki, 2009; Williams et al., 2008).
12
3.2.1 Dependent variables
3.2.1.1 Motivation to process health claims and symbols
Motivation to process health claims and symbols was assessed in general (Q5) and
specifically for three product concepts (Q8, Q9, Q10), i.e. calcium-enriched fruit juice,
fibre-enriched breakfast cereals and omega-3-enriched spread (Table 1). The
measure used three items on a five-point Likert scale (e.g. "I am interested in looking
for health claims and symbols on food in general") based on Moorman (1990).
3.2.1.2 Ability to process health claims and symbols
Participants' ability to process health claims and symbols was evaluated based on
their subjective knowledge (Q11), subjective understanding of health claims (Q15)
and symbols (Q13), and objective understanding of health claims (Q18-Q22) and
symbols (Q14). Subjective or perceived knowledge of participants was measured on
a five-point Likert scale by means of three items adapted from Moorman et al. (2004)
(e.g. "Compared to most people, I am quite knowledgeable about health claims and
symbols") (Q11). Studies showed that subjective knowledge is an important
determinant influencing consumer behaviour such as information processing (Brucks,
1985; Rao & Sieben, 1992), and also associated with the accuracy of using
health-related information such as health claims and symbols (Moorman, 1993).
Subjective understanding of health claims and symbols was measured on a five-point
interval scale from “Do not understand at all” (=1) to “Understand extremely well”
(=5) (Q13, Q15). Objective understanding was measured based on factual knowledge
tests (Q14 and Q18-Q22) (Kanwar et al., 1990) in which participants were asked to
mark the correct meaning of a health claim (as approved by EFSA) or symbol among
other related meanings. The actual knowledge of consumers has been found to
influence the accuracy of using health-related information (Moorman, 1993).
3.2.1.3 Consumers' reactions in terms of perceived credibility and purchase
intention of product concepts
Participants were asked to evaluate the credibility of the three products with health
claims or symbols on a five-point interval scale ranging from “Not credible at all” (=1)
to “Extremely credible” (=5) (Q16). The second outcome variable was consumers’
intention to buy the product concepts (Q17), which was similarly assessed for the
three claim types on a five-point interval scale ranging from “Not likely at all” (=1) to
“Extremely likely” (=5). The perceived credibility and purchase intention of product
concepts were dependent variables for testing Hypothesis 4, and they were serving
as independent variables for testing of Hypothesis 3 (See P.3).
13
3.2.2 Independent variables
3.2.2.1 Consumers' characteristics influencing processing of and reactions
towards health claims and symbols
The studied influencing factors included diet-health awareness, current use of health
claims and symbols in general, perception of validity of health claims and symbols,
familiarity with the product concepts, socio-demographic background, special diet
status, and diet-related medical history.
Participants’ diet-health awareness was measured on a five-point Likert scale by
means of six items each (e.g. "Food plays an important role for keeping me in good
health") (Q3). It was related to the perceived control over their personal health with
diets, and they were asked to compare if they eat healthier than six years ago
(Verbeke et al., 2009).
To assess participants’ current usage of health-related information in general, and
health claims and symbols specifically, participants were asked to rate on a five-point
interval scale to show how often they used the information when food shopping,
ranging from "Never" (=1) to "Very often" (=5) (Q4).
Perceptions of the scientific validity of health claims and symbols consumers were
measured on a five-point Likert scale by means of three items each (e.g. Health
claims are just marketing gimmicks, usually food companies create the claims to
attract consumers) (Q6, Q7). As such, participants’ knowledge about the current EU
legislation on claims and symbols was evaluated as well.
Participants’ familiarity with the different product concepts was assessed using a
five-point frequency scale, ranging from ‘‘I have never seen it’’ (=1) to ‘‘I consume it
frequently’’ (=5) (Q12). Product familiarity was indicated as a key factor influencing
the type and extent of information-processing activities (Moorman 1990).
At last, socio-demographic information of the consumers were collected, such as
gender (Q30), age (based on Q31), educational level (Q32), and role in household
(Q37). In addition, participants were asked if they were following any health regime
(Q38), had any diet-related medical history (Q39). Since claims were perceived more
positively when it is personally relevant (Dean et al., 2012), thus, this study also
investigated participants’ special diet status and diet-related medical history, which
was not investigated in previous studies.
See Appendix A: Survey for the specific measures and scales.
14
3.3 Data analysis
3.3.1 Data cleaning and recoding
The statistical analyses were carried out with IBM® SPSS® Statistics 21.0 (SPSS Inc.,
2012). The data was available in an electronic form directly after the online survey. It
was firstly subjected to defining the variables, which included naming, labelling,
coding the values (e.g. 1 = Totally disagree), choosing the correct types (e.g. numeric
or string) and measures (ordinal, nominal, or scale). Parts of the data were
transformed and computed into different variables (e.g. calculation of age (in years)
from the year of birth, sum of score for objective understanding, and reversing scales
for the items in perception of validity that measured the same outcome with
opposite scales, etc.), and some were recorded differently (e.g. education recoded
into two levels, different diet-related health problems recoded into presence of
diet-related medical history, etc.).
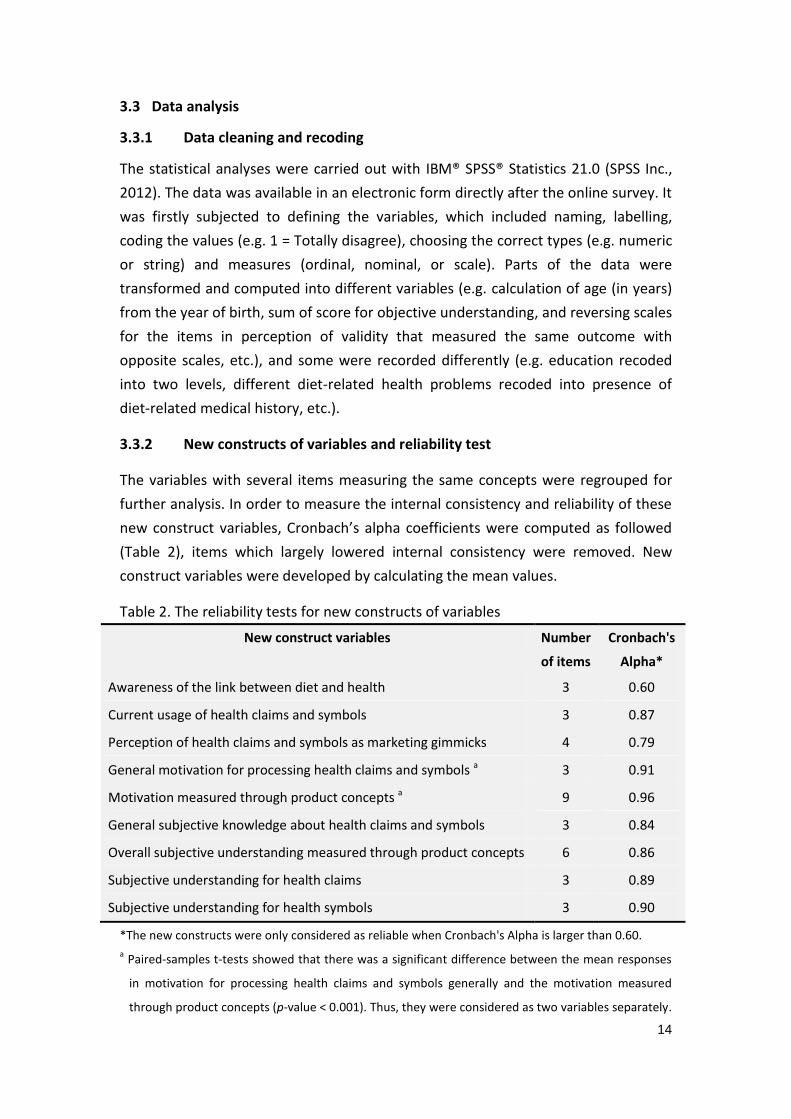
3.3.2 New constructs of variables and reliability test
The variables with several items measuring the same concepts were regrouped for
further analysis. In order to measure the internal consistency and reliability of these
new construct variables, Cronbach’s alpha coefficients were computed as followed
(Table 2), items which largely lowered internal consistency were removed. New
construct variables were developed by calculating the mean values.
Table 2. The reliability tests for new constructs of variables
New construct variables Number
of items
Cronbach's
Alpha*
Awareness of the link between diet and health 3 0.60
Current usage of health claims and symbols 3 0.87
Perception of health claims and symbols as marketing gimmicks 4 0.79
General motivation for processing health claims and symbols a 3 0.91
Motivation measured through product concepts a
General subjective knowledge about health claims and symbols
9 0.96
3 0.84
Overall subjective understanding measured through product concepts 6 0.86
Subjective understanding for health claims 3 0.89
Subjective understanding for health symbols 3 0.90
*The new constructs were only considered as reliable when Cronbach's Alpha is larger than 0.60.
a Paired-samples t-tests showed that there was a significant difference between the mean responses
in motivation for processing health claims and symbols generally and the motivation measured
through product concepts (p-value < 0.001). Thus, they were considered as two variables separately.
15
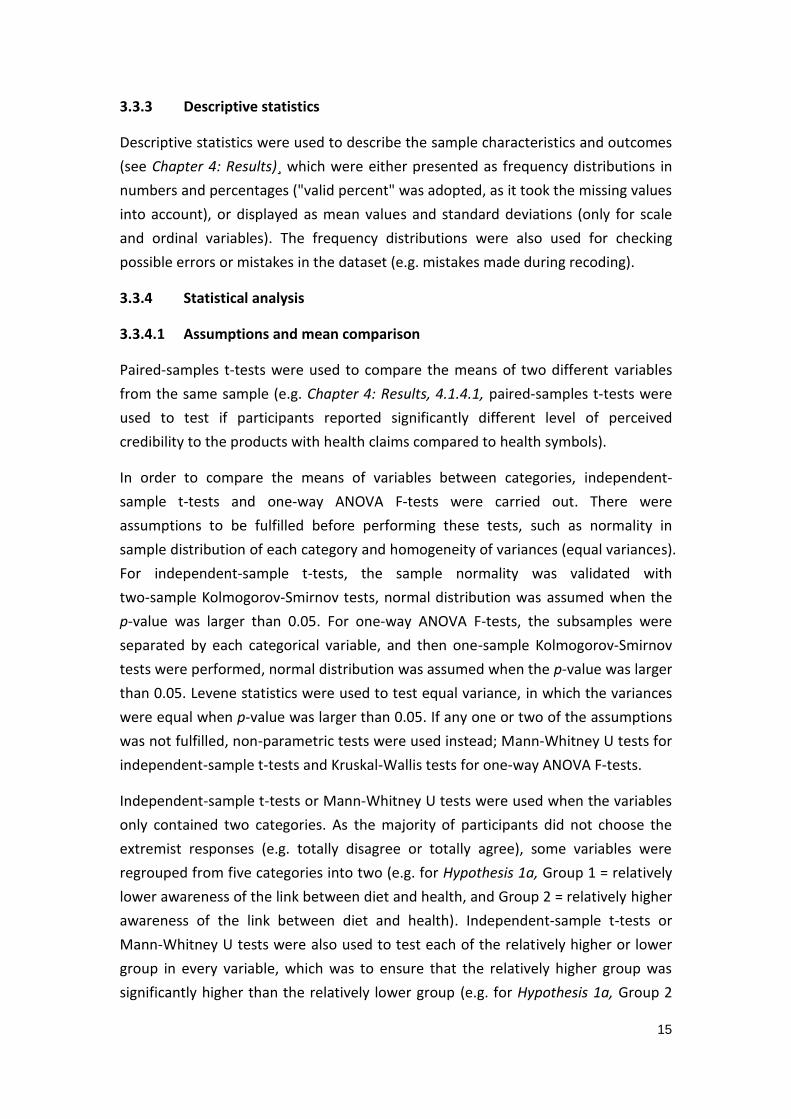
3.3.3 Descriptive statistics
Descriptive statistics were used to describe the sample characteristics and outcomes
(see Chapter 4: Results) ̧which were either presented as frequency distributions in
numbers and percentages ("valid percent" was adopted, as it took the missing values
into account), or displayed as mean values and standard deviations (only for scale
and ordinal variables). The frequency distributions were also used for checking
possible errors or mistakes in the dataset (e.g. mistakes made during recoding).
3.3.4 Statistical analysis
3.3.4.1 Assumptions and mean comparison
Paired-samples t-tests were used to compare the means of two different variables
from the same sample (e.g. Chapter 4: Results, 4.1.4.1, paired-samples t-tests were
used to test if participants reported significantly different level of perceived
credibility to the products with health claims compared to health symbols).
In order to compare the means of variables between categories, independent-
sample t-tests and one-way ANOVA F-tests were carried out. There were
assumptions to be fulfilled before performing these tests, such as normality in
sample distribution of each category and homogeneity of variances (equal variances).
For independent-sample t-tests, the sample normality was validated with
two-sample Kolmogorov-Smirnov tests, normal distribution was assumed when the
p-value was larger than 0.05. For one-way ANOVA F-tests, the subsamples were
separated by each categorical variable, and then one-sample Kolmogorov-Smirnov
tests were performed, normal distribution was assumed when the p-value was larger
than 0.05. Levene statistics were used to test equal variance, in which the variances
were equal when p-value was larger than 0.05. If any one or two of the assumptions
was not fulfilled, non-parametric tests were used instead; Mann-Whitney U tests for
independent-sample t-tests and Kruskal-Wallis tests for one-way ANOVA F-tests.
Independent-sample t-tests or Mann-Whitney U tests were used when the variables
only contained two categories. As the majority of participants did not choose the
extremist responses (e.g. totally disagree or totally agree), some variables were
regrouped from five categories into two (e.g. for Hypothesis 1a, Group 1 = relatively
lower awareness of the link between diet and health, and Group 2 = relatively higher
awareness of the link between diet and health). Independent-sample t-tests or
Mann-Whitney U tests were also used to test each of the relatively higher or lower
group in every variable, which was to ensure that the relatively higher group was
significantly higher than the relatively lower group (e.g. for Hypothesis 1a, Group 2
16
has significantly higher level of diet-health awareness than Group 1). In this study,
independent-sample t-tests or Mann-Whitney U tests were used to test Hypothesis
1a, 1b, 1c, 1d, 1e, 1f, 1h, 1i, 3a, 3b, 4a, and 4b (see P.3).
One-way ANOVA F-tests or Kruskal-Wallis tests were used when the variables
contained more than two categories, which were for testing Hypothesis 1g, and 1j
(see P.3). Scheffe post-hoc estimation (equal variance assumed) and Dunnett T3
post-hoc estimation (equal variance not assumed) were used to help comparing one
group to another, in which the size of groups was not equal.
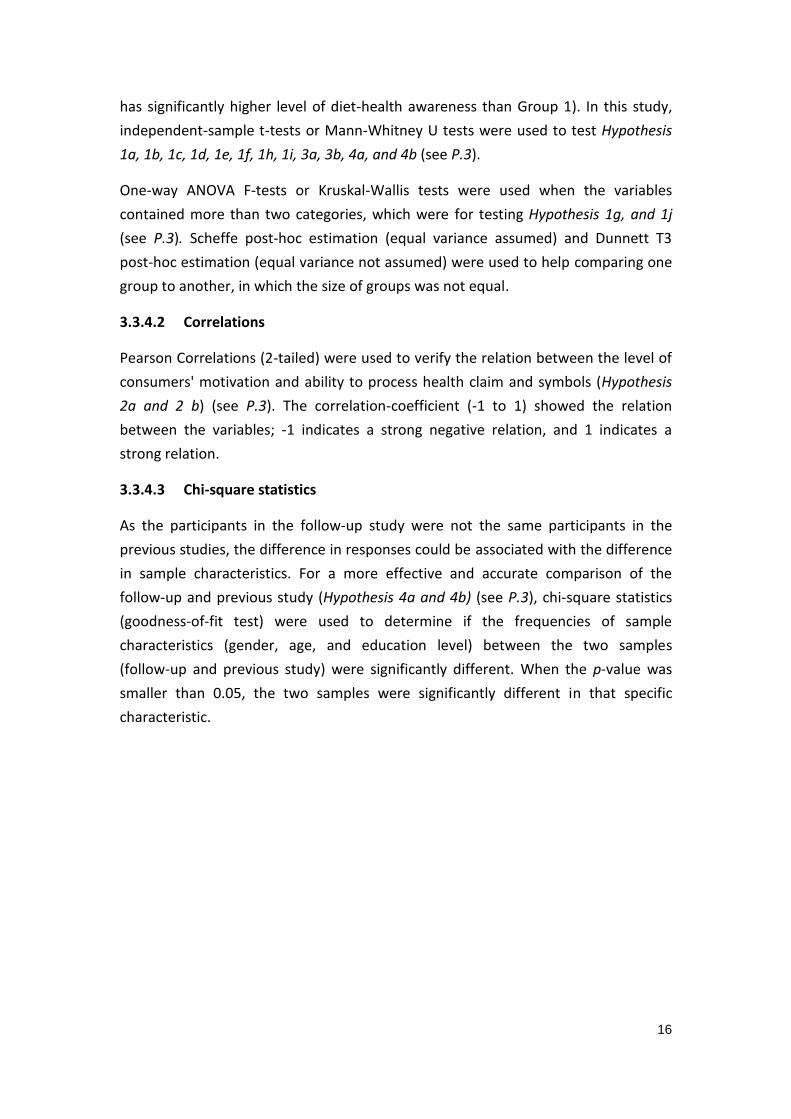
3.3.4.2 Correlations
Pearson Correlations (2-tailed) were used to verify the relation between the level of
consumers' motivation and ability to process health claim and symbols (Hypothesis
2a and 2 b) (see P.3). The correlation-coefficient (-1 to 1) showed the relation
between the variables; -1 indicates a strong negative relation, and 1 indicates a
strong relation.
3.3.4.3 Chi-square statistics
As the participants in the follow-up study were not the same participants in the
previous studies, the difference in responses could be associated with the difference
in sample characteristics. For a more effective and accurate comparison of the
follow-up and previous study (Hypothesis 4a and 4b) (see P.3), chi-square statistics
(goodness-of-fit test) were used to determine if the frequencies of sample
characteristics (gender, age, and education level) between the two samples
(follow-up and previous study) were significantly different. When the p-value was
smaller than 0.05, the two samples were significantly different in that specific
characteristic.
17
CHAPTER 4: RESULTS
4.1 Descriptive statistics
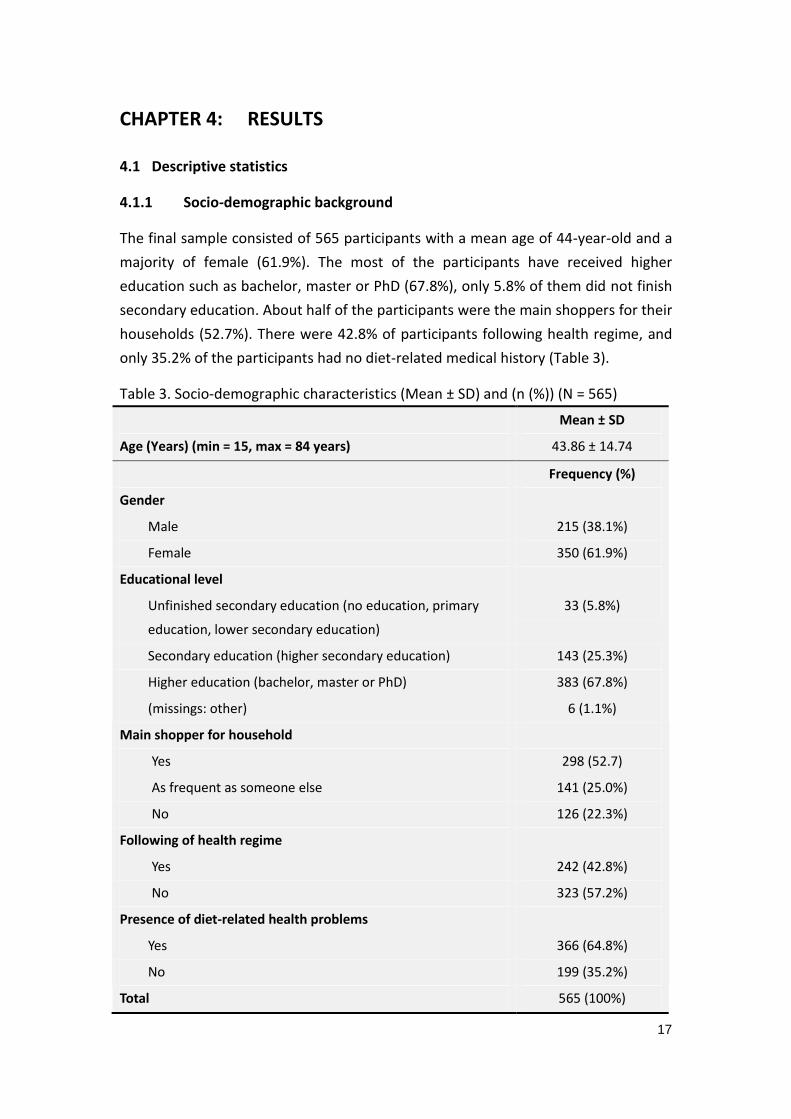
4.1.1 Socio-demographic background
The final sample consisted of 565 participants with a mean age of 44-year-old and a
majority of female (61.9%). The most of the participants have received higher
education such as bachelor, master or PhD (67.8%), only 5.8% of them did not finish
secondary education. About half of the participants were the main shoppers for their
households (52.7%). There were 42.8% of participants following health regime, and
only 35.2% of the participants had no diet-related medical history (Table 3).
Table 3. Socio-demographic characteristics (Mean ± SD) and (n (%)) (N = 565)
Mean ± SD
Age (Years) (min = 15, max = 84 years) 43.86 ± 14.74
Frequency (%)
Gender
Male 215 (38.1%)
Female 350 (61.9%)
Educational level
Unfinished secondary education (no education, primary
education, lower secondary education)
33 (5.8%)
Secondary education (higher secondary education) 143 (25.3%)
Higher education (bachelor, master or PhD) 383 (67.8%)
(missings: other) 6 (1.1%)
Main shopper for household
Yes 298 (52.7)
As frequent as someone else 141 (25.0%)
No 126 (22.3%)
Following of health regime
Yes 242 (42.8%)
No 323 (57.2%)
Presence of diet-related health problems
Yes 366 (64.8%)
No 199 (35.2%)
Total 565 (100%)
18
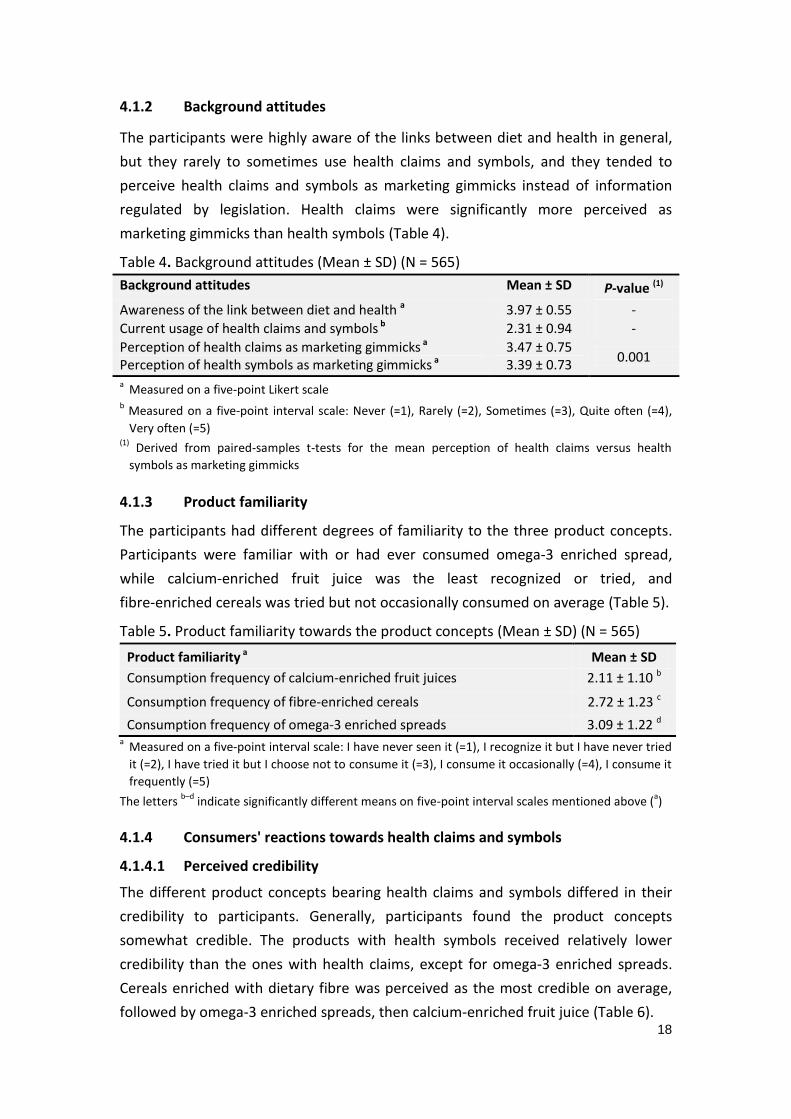
4.1.2 Background attitudes
The participants were highly aware of the links between diet and health in general,
but they rarely to sometimes use health claims and symbols, and they tended to
perceive health claims and symbols as marketing gimmicks instead of information
regulated by legislation. Health claims were significantly more perceived as
marketing gimmicks than health symbols (Table 4).
Table 4. Background attitudes (Mean ± SD) (N = 565)
Background attitudes Mean ± SD P-value (1)
Awareness of the link between diet and health a 3.97 ± 0.55 -
Current usage of health claims and symbols b 2.31 ± 0.94 -
Perception of health claims as marketing gimmicks a 3.47 ± 0.75 0.001
Perception of health symbols as marketing gimmicks a 3.39 ± 0.73 a Measured on a five-point Likert scale
b Measured on a five-point interval scale: Never (=1), Rarely (=2), Sometimes (=3), Quite often (=4),
Very often (=5) (1)
Derived from paired-samples t-tests for the mean perception of health claims versus health
symbols as marketing gimmicks
4.1.3 Product familiarity
The participants had different degrees of familiarity to the three product concepts.
Participants were familiar with or had ever consumed omega-3 enriched spread,
while calcium-enriched fruit juice was the least recognized or tried, and
fibre-enriched cereals was tried but not occasionally consumed on average (Table 5).
Table 5. Product familiarity towards the product concepts (Mean ± SD) (N = 565)
Product familiarity a Mean ± SD
Consumption frequency of calcium-enriched fruit juices 2.11 ± 1.10 b
Consumption frequency of fibre-enriched cereals 2.72 ± 1.23 c
Consumption frequency of omega-3 enriched spreads 3.09 ± 1.22 d
a Measured on a five-point interval scale: I have never seen it (=1), I recognize it but I have never tried
it (=2), I have tried it but I choose not to consume it (=3), I consume it occasionally (=4), I consume it
frequently (=5)
The letters b–d
indicate significantly different means on five-point interval scales mentioned above (a)
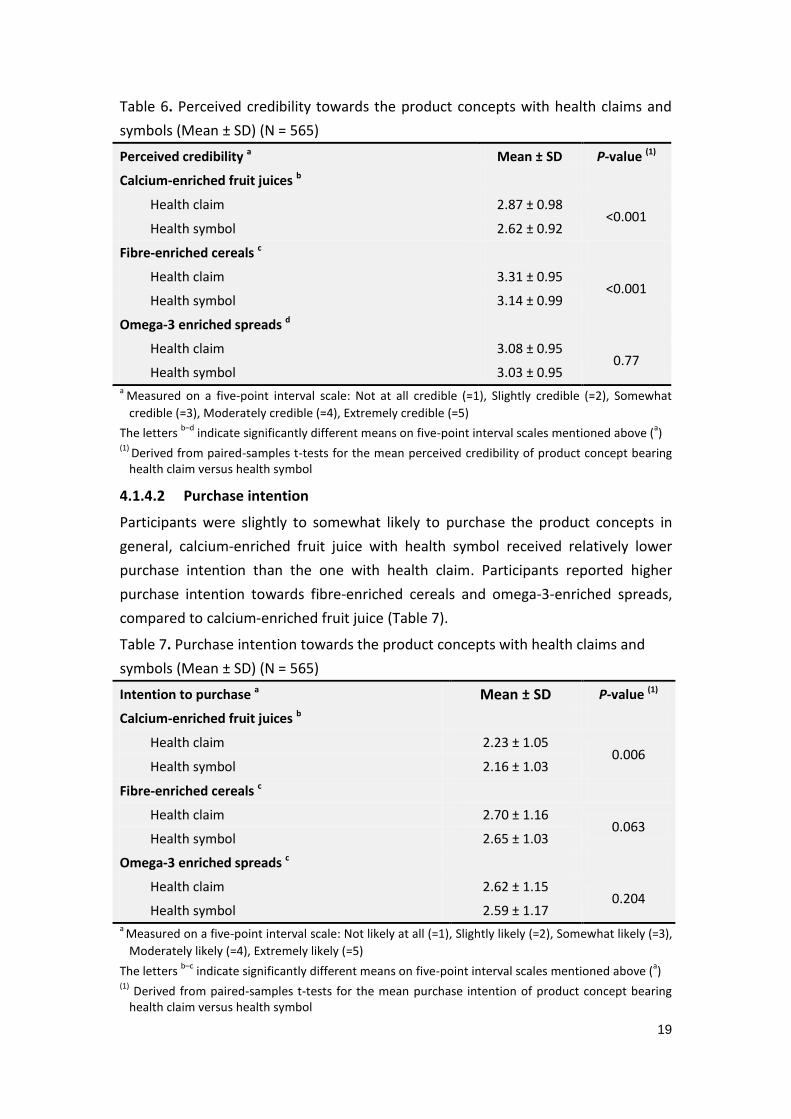
4.1.4 Consumers' reactions towards health claims and symbols
4.1.4.1 Perceived credibility
The different product concepts bearing health claims and symbols differed in their
credibility to participants. Generally, participants found the product concepts
somewhat credible. The products with health symbols received relatively lower
credibility than the ones with health claims, except for omega-3 enriched spreads.
Cereals enriched with dietary fibre was perceived as the most credible on average,
followed by omega-3 enriched spreads, then calcium-enriched fruit juice (Table 6).
19
Table 6. Perceived credibility towards the product concepts with health claims and
symbols (Mean ± SD) (N = 565)
Perceived credibility a Mean ± SD P-value (1)
Calcium-enriched fruit juices b
Health claim 2.87 ± 0.98 <0.001
Health symbol 2.62 ± 0.92
Fibre-enriched cereals c
Health claim 3.31 ± 0.95 <0.001
Health symbol 3.14 ± 0.99
Omega-3 enriched spreads d
Health claim 3.08 ± 0.95 0.77
Health symbol 3.03 ± 0.95 a
Measured on a five-point interval scale: Not at all credible (=1), Slightly credible (=2), Somewhat
credible (=3), Moderately credible (=4), Extremely credible (=5)
The letters b–d
indicate significantly different means on five-point interval scales mentioned above (a)
(1) Derived from paired-samples t-tests for the mean perceived credibility of product concept bearing health claim versus health symbol
4.1.4.2 Purchase intention
Participants were slightly to somewhat likely to purchase the product concepts in
general, calcium-enriched fruit juice with health symbol received relatively lower
purchase intention than the one with health claim. Participants reported higher
purchase intention towards fibre-enriched cereals and omega-3-enriched spreads,
compared to calcium-enriched fruit juice (Table 7).
Table 7. Purchase intention towards the product concepts with health claims and
symbols (Mean ± SD) (N = 565)
Intention to purchase a Mean ± SD P-value (1)
Calcium-enriched fruit juices b
Health claim 2.23 ± 1.05 0.006
Health symbol 2.16 ± 1.03
Fibre-enriched cereals c
Health claim 2.70 ± 1.16 0.063
Health symbol 2.65 ± 1.03
Omega-3 enriched spreads c
Health claim 2.62 ± 1.15 0.204
Health symbol 2.59 ± 1.17 a
Measured on a five-point interval scale: Not likely at all (=1), Slightly likely (=2), Somewhat likely (=3),
Moderately likely (=4), Extremely likely (=5)
The letters b–c
indicate significantly different means on five-point interval scales mentioned above (a)
(1) Derived from paired-samples t-tests for the mean purchase intention of product concept bearing health claim versus health symbol
20
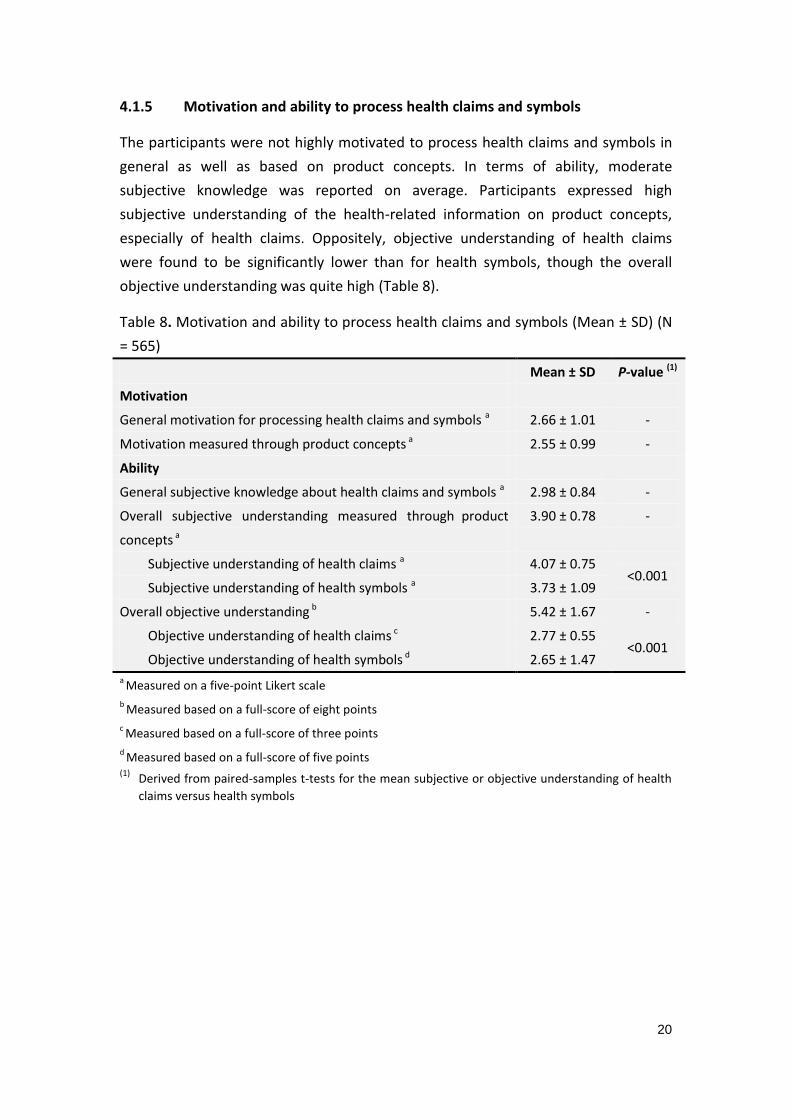
4.1.5 Motivation and ability to process health claims and symbols
The participants were not highly motivated to process health claims and symbols in
general as well as based on product concepts. In terms of ability, moderate
subjective knowledge was reported on average. Participants expressed high
subjective understanding of the health-related information on product concepts,
especially of health claims. Oppositely, objective understanding of health claims
were found to be significantly lower than for health symbols, though the overall
objective understanding was quite high (Table 8).
Table 8. Motivation and ability to process health claims and symbols (Mean ± SD) (N
= 565)
Mean ± SD P-value (1)
Motivation
General motivation for processing health claims and symbols a 2.66 ± 1.01 -
Motivation measured through product concepts a 2.55 ± 0.99 -
Ability
General subjective knowledge about health claims and symbols a 2.98 ± 0.84 -
Overall subjective understanding measured through product
concepts a
3.90 ± 0.78 -
Subjective understanding of health claims a 4.07 ± 0.75 <0.001
Subjective understanding of health symbols a 3.73 ± 1.09
Overall objective understanding b 5.42 ± 1.67 -
Objective understanding of health claims c 2.77 ± 0.55 <0.001
Objective understanding of health symbols d 2.65 ± 1.47
a Measured on a five-point Likert scale
b Measured based on a full-score of eight points
c Measured based on a full-score of three points
d Measured based on a full-score of five points
(1) Derived from paired-samples t-tests for the mean subjective or objective understanding of health
claims versus health symbols
21
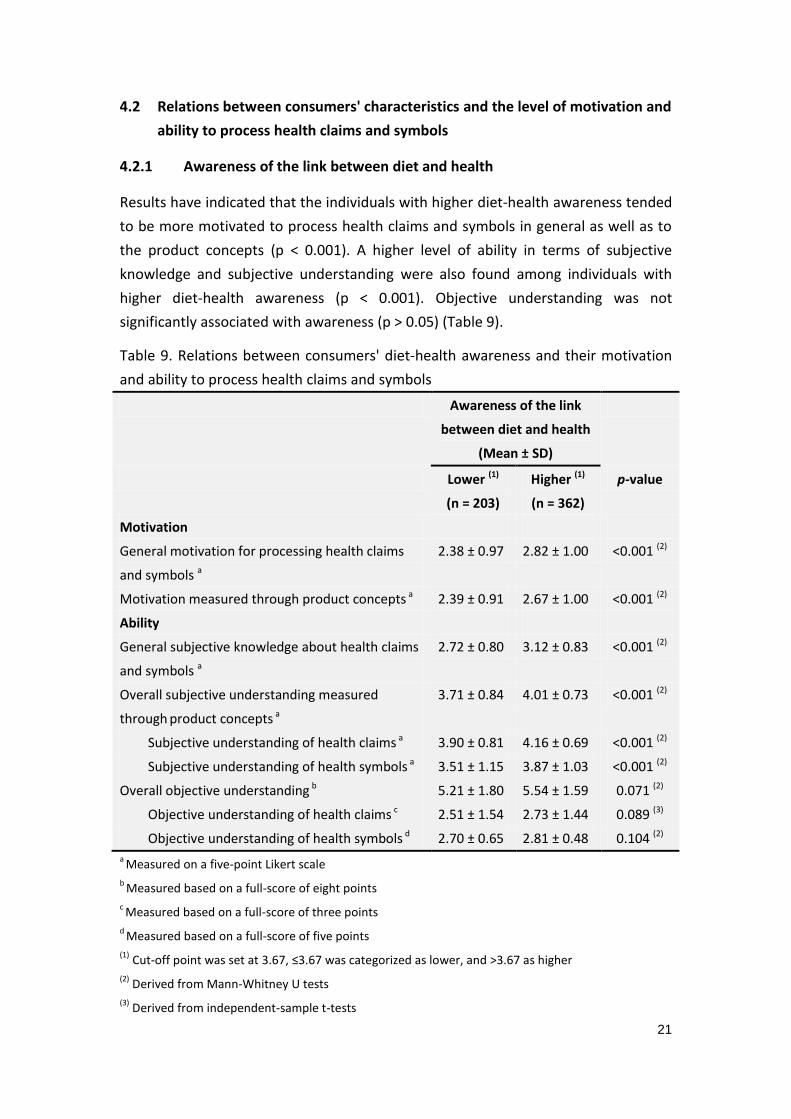
4.2 Relations between consumers' characteristics and the level of motivation and
ability to process health claims and symbols
4.2.1 Awareness of the link between diet and health
Results have indicated that the individuals with higher diet-health awareness tended
to be more motivated to process health claims and symbols in general as well as to
the product concepts (p < 0.001). A higher level of ability in terms of subjective
knowledge and subjective understanding were also found among individuals with
higher diet-health awareness (p < 0.001). Objective understanding was not
significantly associated with awareness (p > 0.05) (Table 9).
Table 9. Relations between consumers' diet-health awareness and their motivation
and ability to process health claims and symbols
Awareness of the link
between diet and health
(Mean ± SD)
Lower (1)
(n = 203)
Higher (1)
(n = 362)
p-value
Motivation
General motivation for processing health claims
and symbols a
2.38 ± 0.97 2.82 ± 1.00 <0.001 (2)
Motivation measured through product concepts a 2.39 ± 0.91 2.67 ± 1.00 <0.001 (2)
Ability
General subjective knowledge about health claims
and symbols a
2.72 ± 0.80 3.12 ± 0.83 <0.001 (2)
Overall subjective understanding measured
through product concepts a
3.71 ± 0.84 4.01 ± 0.73 <0.001 (2)
Subjective understanding of health claims a 3.90 ± 0.81 4.16 ± 0.69 <0.001 (2)
Subjective understanding of health symbols a 3.51 ± 1.15 3.87 ± 1.03 <0.001 (2)
Overall objective understanding b 5.21 ± 1.80 5.54 ± 1.59 0.071 (2)
Objective understanding of health claims c 2.51 ± 1.54 2.73 ± 1.44 0.089 (3)
Objective understanding of health symbols d 2.70 ± 0.65 2.81 ± 0.48 0.104 (2)
a Measured on a five-point Likert scale
b Measured based on a full-score of eight points
c Measured based on a full-score of three points
d Measured based on a full-score of five points
(1) Cut-off point was set at 3.67, ≤3.67 was categorized as lower, and >3.67 as higher
(2) Derived from Mann-Whitney U tests
(3) Derived from independent-sample t-tests
22
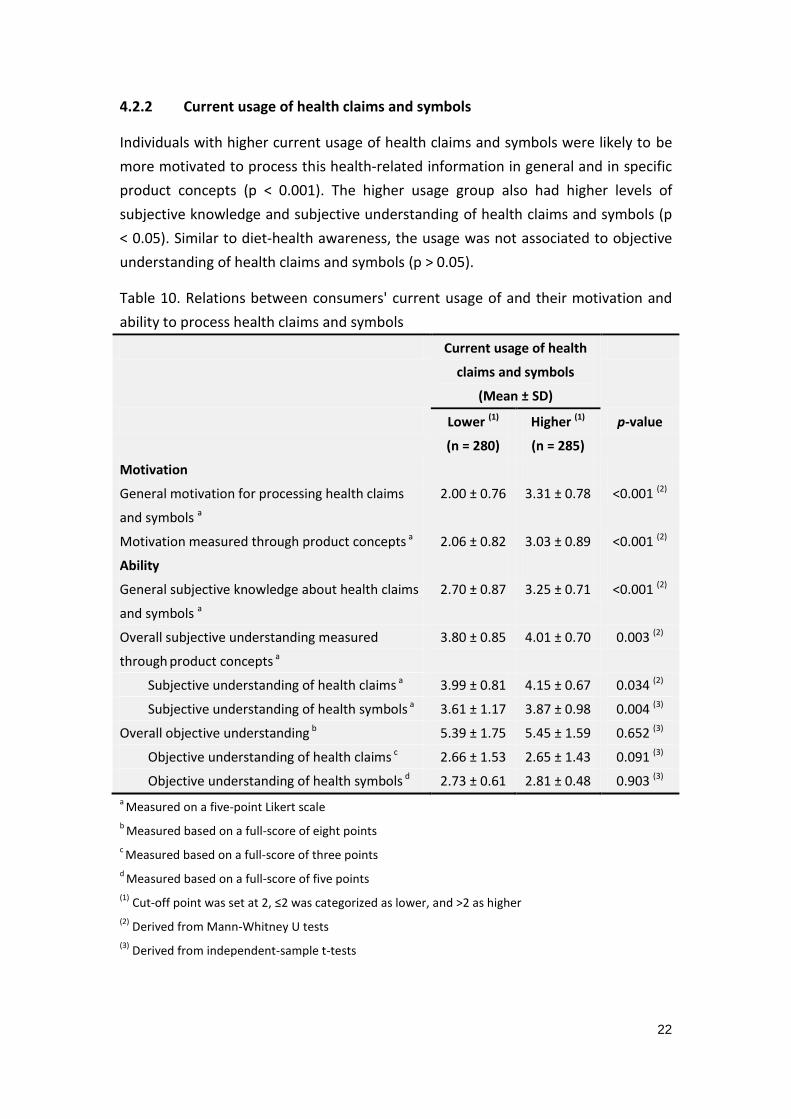
4.2.2 Current usage of health claims and symbols
Individuals with higher current usage of health claims and symbols were likely to be
more motivated to process this health-related information in general and in specific
product concepts (p < 0.001). The higher usage group also had higher levels of
subjective knowledge and subjective understanding of health claims and symbols (p
< 0.05). Similar to diet-health awareness, the usage was not associated to objective
understanding of health claims and symbols (p > 0.05).
Table 10. Relations between consumers' current usage of and their motivation and
ability to process health claims and symbols
Current usage of health
claims and symbols
(Mean ± SD)
Lower (1)
(n = 280)
Higher (1)
(n = 285)
p-value
Motivation
General motivation for processing health claims
and symbols a
2.00 ± 0.76 3.31 ± 0.78 <0.001 (2)
Motivation measured through product concepts a 2.06 ± 0.82 3.03 ± 0.89 <0.001 (2)
Ability
General subjective knowledge about health claims
and symbols a
2.70 ± 0.87 3.25 ± 0.71 <0.001 (2)
Overall subjective understanding measured
through product concepts a
3.80 ± 0.85 4.01 ± 0.70 0.003 (2)
Subjective understanding of health claims a 3.99 ± 0.81 4.15 ± 0.67 0.034 (2)
Subjective understanding of health symbols a 3.61 ± 1.17 3.87 ± 0.98 0.004 (3)
Overall objective understanding b 5.39 ± 1.75 5.45 ± 1.59 0.652 (3)
Objective understanding of health claims c 2.66 ± 1.53 2.65 ± 1.43 0.091 (3)
Objective understanding of health symbols d 2.73 ± 0.61 2.81 ± 0.48 0.903 (3)
a Measured on a five-point Likert scale
b Measured based on a full-score of eight points
c Measured based on a full-score of three points
d Measured based on a full-score of five points
(1) Cut-off point was set at 2, ≤2 was categorized as lower, and >2 as higher
(2) Derived from Mann-Whitney U tests
(3) Derived from independent-sample t-tests
23
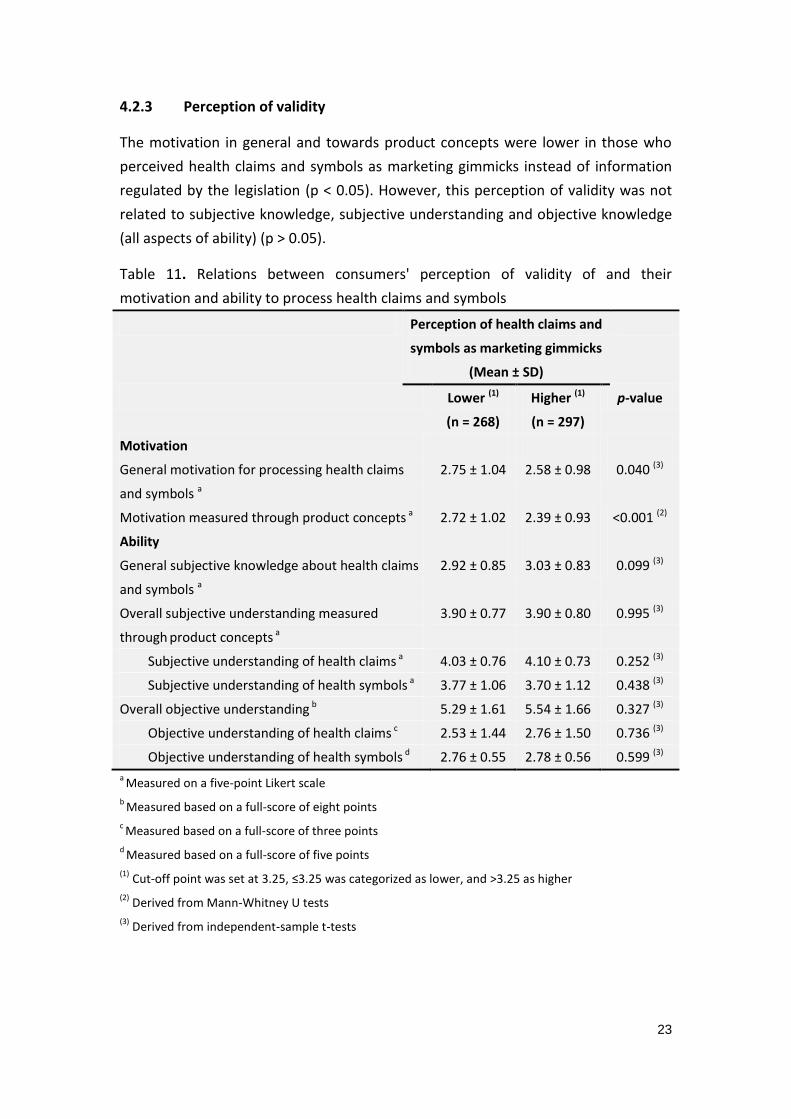
4.2.3 Perception of validity
The motivation in general and towards product concepts were lower in those who
perceived health claims and symbols as marketing gimmicks instead of information
regulated by the legislation (p < 0.05). However, this perception of validity was not
related to subjective knowledge, subjective understanding and objective knowledge
(all aspects of ability) (p > 0.05).
Table 11. Relations between consumers' perception of validity of and their
motivation and ability to process health claims and symbols
Perception of health claims and
symbols as marketing gimmicks
(Mean ± SD)
Lower (1)
(n = 268)
Higher (1)
(n = 297)
p-value
Motivation
General motivation for processing health claims
and symbols a
2.75 ± 1.04 2.58 ± 0.98 0.040 (3)
Motivation measured through product concepts a 2.72 ± 1.02 2.39 ± 0.93 <0.001 (2)
Ability
General subjective knowledge about health claims
and symbols a
2.92 ± 0.85 3.03 ± 0.83 0.099 (3)
Overall subjective understanding measured
through product concepts a
3.90 ± 0.77 3.90 ± 0.80 0.995 (3)
Subjective understanding of health claims a 4.03 ± 0.76 4.10 ± 0.73 0.252 (3)
Subjective understanding of health symbols a 3.77 ± 1.06 3.70 ± 1.12 0.438 (3)
Overall objective understanding b 5.29 ± 1.61 5.54 ± 1.66 0.327 (3)
Objective understanding of health claims c 2.53 ± 1.44 2.76 ± 1.50 0.736 (3)
Objective understanding of health symbols d 2.76 ± 0.55 2.78 ± 0.56 0.599 (3)
a Measured on a five-point Likert scale
b Measured based on a full-score of eight points
c Measured based on a full-score of three points
d Measured based on a full-score of five points
(1) Cut-off point was set at 3.25, ≤3.25 was categorized as lower, and >3.25 as higher
(2) Derived from Mann-Whitney U tests
(3) Derived from independent-sample t-tests
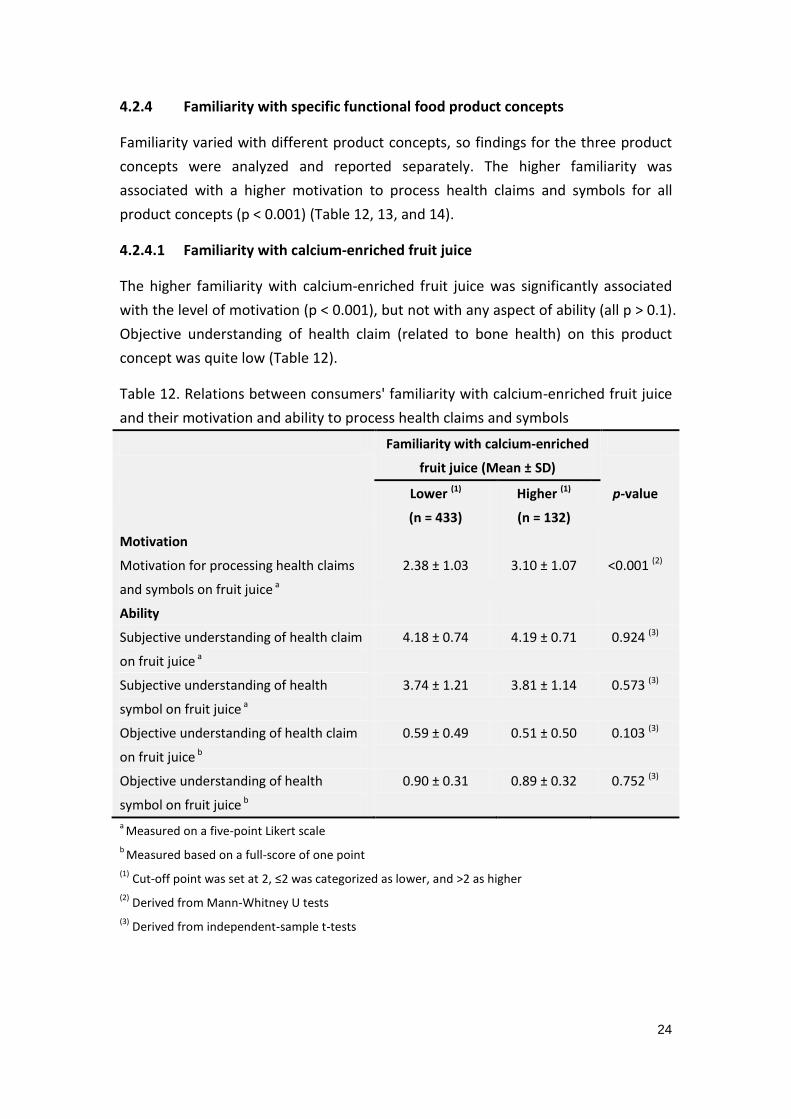
24
4.2.4 Familiarity with specific functional food product concepts
Familiarity varied with different product concepts, so findings for the three product
concepts were analyzed and reported separately. The higher familiarity was
associated with a higher motivation to process health claims and symbols for all
product concepts (p < 0.001) (Table 12, 13, and 14).
4.2.4.1 Familiarity with calcium-enriched fruit juice
The higher familiarity with calcium-enriched fruit juice was significantly associated
with the level of motivation (p < 0.001), but not with any aspect of ability (all p > 0.1).
Objective understanding of health claim (related to bone health) on this product
concept was quite low (Table 12).
Table 12. Relations between consumers' familiarity with calcium-enriched fruit juice
and their motivation and ability to process health claims and symbols
Familiarity with calcium-enriched
fruit juice (Mean ± SD)
Lower (1)
(n = 433)
Higher (1)
(n = 132)
p-value
Motivation
Motivation for processing health claims
and symbols on fruit juice a
2.38 ± 1.03 3.10 ± 1.07 <0.001 (2)
Ability
Subjective understanding of health claim
on fruit juice a
4.18 ± 0.74 4.19 ± 0.71 0.924 (3)
Subjective understanding of health
symbol on fruit juice a
3.74 ± 1.21 3.81 ± 1.14 0.573 (3)
Objective understanding of health claim
on fruit juice b
0.59 ± 0.49 0.51 ± 0.50 0.103 (3)
Objective understanding of health
symbol on fruit juice b
0.90 ± 0.31 0.89 ± 0.32 0.752 (3)
a Measured on a five-point Likert scale
b Measured based on a full-score of one point
(1) Cut-off point was set at 2, ≤2 was categorized as lower, and >2 as higher
(2) Derived from Mann-Whitney U tests
(3) Derived from independent-sample t-tests
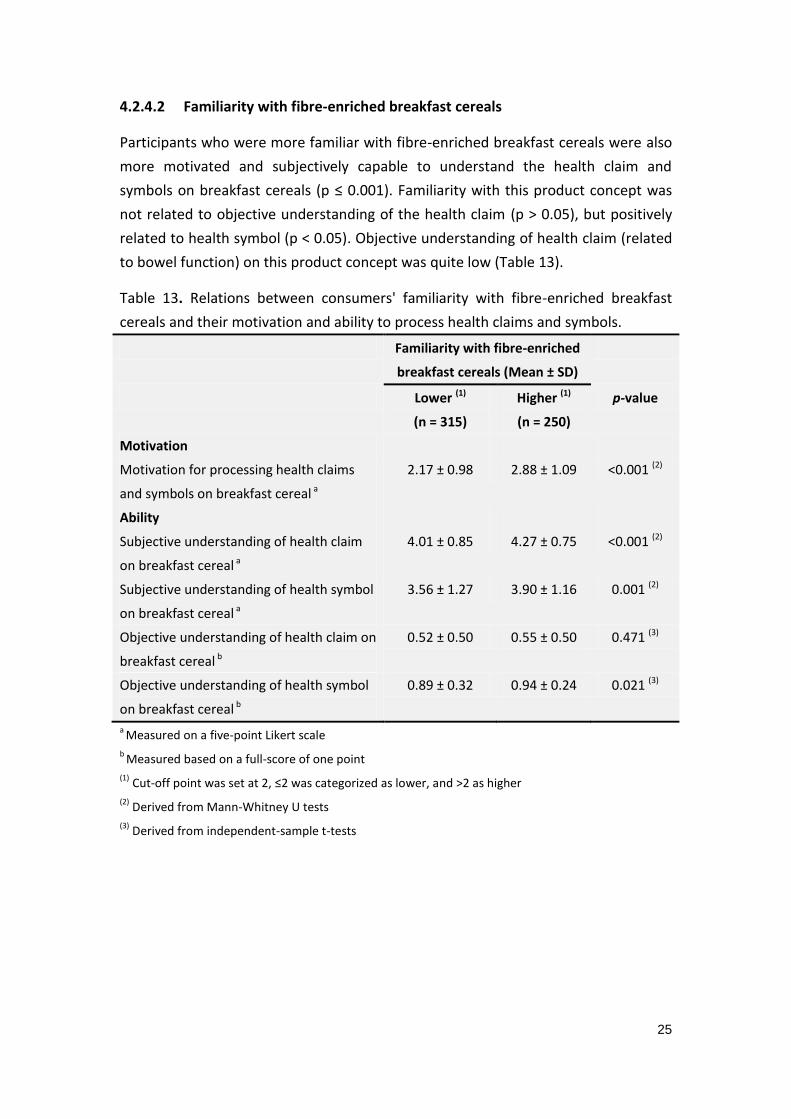
25
4.2.4.2 Familiarity with fibre-enriched breakfast cereals
Participants who were more familiar with fibre-enriched breakfast cereals were also
more motivated and subjectively capable to understand the health claim and
symbols on breakfast cereals (p ≤ 0.001). Familiarity with this product concept was
not related to objective understanding of the health claim (p > 0.05), but positively
related to health symbol (p < 0.05). Objective understanding of health claim (related
to bowel function) on this product concept was quite low (Table 13).
Table 13. Relations between consumers' familiarity with fibre-enriched breakfast
cereals and their motivation and ability to process health claims and symbols.
Familiarity with fibre-enriched
breakfast cereals (Mean ± SD)
Lower (1)
(n = 315)
Higher (1)
(n = 250)
p-value
Motivation
Motivation for processing health claims
and symbols on breakfast cereal a
2.17 ± 0.98 2.88 ± 1.09 <0.001 (2)
Ability
Subjective understanding of health claim
on breakfast cereal a
4.01 ± 0.85 4.27 ± 0.75 <0.001 (2)
Subjective understanding of health symbol
on breakfast cereal a
3.56 ± 1.27 3.90 ± 1.16 0.001 (2)
Objective understanding of health claim on
breakfast cereal b
0.52 ± 0.50 0.55 ± 0.50 0.471 (3)
Objective understanding of health symbol
on breakfast cereal b
0.89 ± 0.32 0.94 ± 0.24 0.021 (3)
a Measured on a five-point Likert scale
b Measured based on a full-score of one point
(1) Cut-off point was set at 2, ≤2 was categorized as lower, and >2 as higher
(2) Derived from Mann-Whitney U tests
(3) Derived from independent-sample t-tests
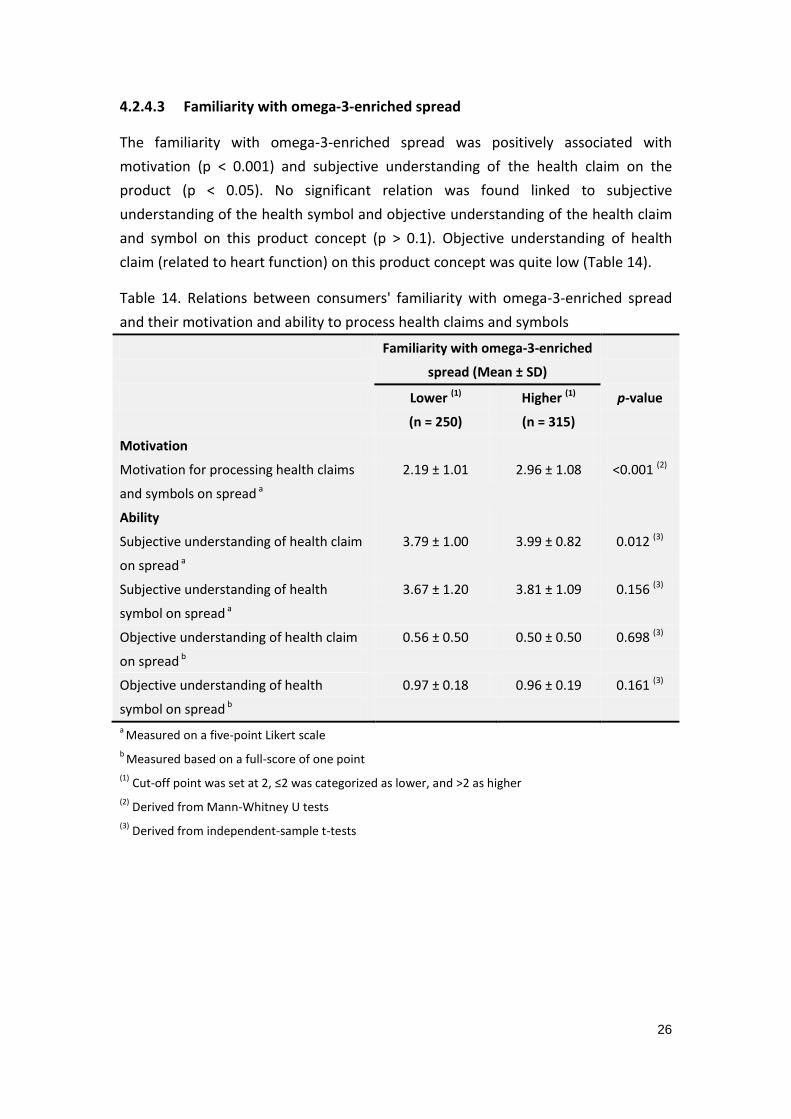
26
4.2.4.3 Familiarity with omega-3-enriched spread
The familiarity with omega-3-enriched spread was positively associated with
motivation (p < 0.001) and subjective understanding of the health claim on the
product (p < 0.05). No significant relation was found linked to subjective
understanding of the health symbol and objective understanding of the health claim
and symbol on this product concept (p > 0.1). Objective understanding of health
claim (related to heart function) on this product concept was quite low (Table 14).
Table 14. Relations between consumers' familiarity with omega-3-enriched spread
and their motivation and ability to process health claims and symbols
Familiarity with omega-3-enriched
spread (Mean ± SD)
Lower (1)
(n = 250)
Higher (1)
(n = 315)
p-value
Motivation
Motivation for processing health claims
and symbols on spread a
2.19 ± 1.01 2.96 ± 1.08 <0.001 (2)
Ability
Subjective understanding of health claim
on spread a
3.79 ± 1.00 3.99 ± 0.82 0.012 (3)
Subjective understanding of health
symbol on spread a
3.67 ± 1.20 3.81 ± 1.09 0.156 (3)
Objective understanding of health claim
on spread b
0.56 ± 0.50 0.50 ± 0.50 0.698 (3)
Objective understanding of health
symbol on spread b
0.97 ± 0.18 0.96 ± 0.19 0.161 (3)
a Measured on a five-point Likert scale
b Measured based on a full-score of one point
(1) Cut-off point was set at 2, ≤2 was categorized as lower, and >2 as higher
(2) Derived from Mann-Whitney U tests
(3) Derived from independent-sample t-tests
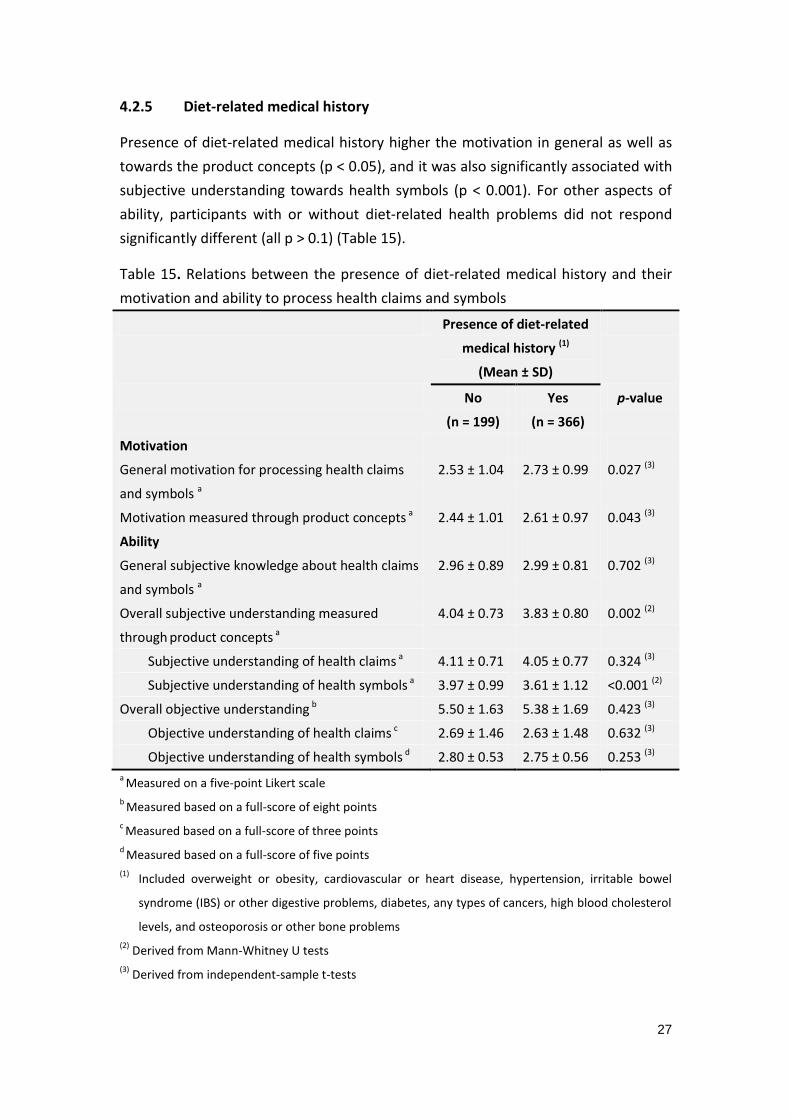
27
4.2.5 Diet-related medical history
Presence of diet-related medical history higher the motivation in general as well as
towards the product concepts (p < 0.05), and it was also significantly associated with
subjective understanding towards health symbols (p < 0.001). For other aspects of
ability, participants with or without diet-related health problems did not respond
significantly different (all p > 0.1) (Table 15).
Table 15. Relations between the presence of diet-related medical history and their
motivation and ability to process health claims and symbols
Presence of diet-related
medical history (1)
(Mean ± SD)
No
(n = 199)
Yes
(n = 366)
p-value
Motivation
General motivation for processing health claims
and symbols a
2.53 ± 1.04 2.73 ± 0.99 0.027 (3)
Motivation measured through product concepts a 2.44 ± 1.01 2.61 ± 0.97 0.043 (3)
Ability
General subjective knowledge about health claims
and symbols a
2.96 ± 0.89 2.99 ± 0.81 0.702 (3)
Overall subjective understanding measured
through product concepts a
4.04 ± 0.73 3.83 ± 0.80 0.002 (2)
Subjective understanding of health claims a 4.11 ± 0.71 4.05 ± 0.77 0.324 (3)
Subjective understanding of health symbols a 3.97 ± 0.99 3.61 ± 1.12 <0.001 (2)
Overall objective understanding b 5.50 ± 1.63 5.38 ± 1.69 0.423 (3)
Objective understanding of health claims c 2.69 ± 1.46 2.63 ± 1.48 0.632 (3)
Objective understanding of health symbols d 2.80 ± 0.53 2.75 ± 0.56 0.253 (3)
a Measured on a five-point Likert scale
b Measured based on a full-score of eight points
c Measured based on a full-score of three points
d Measured based on a full-score of five points
(1) Included overweight or obesity, cardiovascular or heart disease, hypertension, irritable bowel
syndrome (IBS) or other digestive problems, diabetes, any types of cancers, high blood cholesterol
levels, and osteoporosis or other bone problems
(2) Derived from Mann-Whitney U tests
(3) Derived from independent-sample t-tests
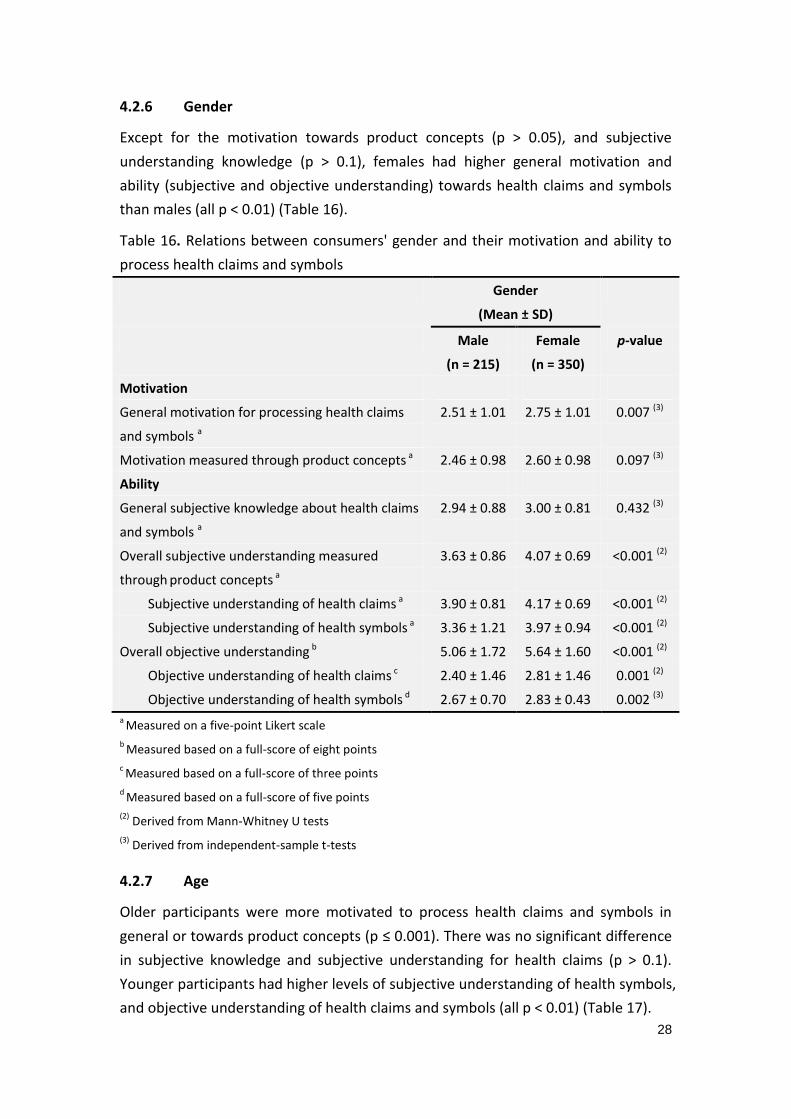
28
4.2.6 Gender
Except for the motivation towards product concepts (p > 0.05), and subjective
understanding knowledge (p > 0.1), females had higher general motivation and
ability (subjective and objective understanding) towards health claims and symbols
than males (all p < 0.01) (Table 16).
Table 16. Relations between consumers' gender and their motivation and ability to
process health claims and symbols
Gender
(Mean ± SD)
Male
(n = 215)
Female
(n = 350)
p-value
Motivation
General motivation for processing health claims
and symbols a
2.51 ± 1.01 2.75 ± 1.01 0.007 (3)
Motivation measured through product concepts a 2.46 ± 0.98 2.60 ± 0.98 0.097 (3)
Ability
General subjective knowledge about health claims
and symbols a
2.94 ± 0.88 3.00 ± 0.81 0.432 (3)
Overall subjective understanding measured
through product concepts a
3.63 ± 0.86 4.07 ± 0.69 <0.001 (2)
Subjective understanding of health claims a 3.90 ± 0.81 4.17 ± 0.69 <0.001 (2)
Subjective understanding of health symbols a 3.36 ± 1.21 3.97 ± 0.94 <0.001 (2)
Overall objective understanding b 5.06 ± 1.72 5.64 ± 1.60 <0.001 (2)
Objective understanding of health claims c 2.40 ± 1.46 2.81 ± 1.46 0.001 (2)
Objective understanding of health symbols d 2.67 ± 0.70 2.83 ± 0.43 0.002 (3)
a Measured on a five-point Likert scale
b Measured based on a full-score of eight points
c Measured based on a full-score of three points
d Measured based on a full-score of five points
(2) Derived from Mann-Whitney U tests
(3) Derived from independent-sample t-tests
4.2.7 Age
Older participants were more motivated to process health claims and symbols in
general or towards product concepts (p ≤ 0.001). There was no significant difference
in subjective knowledge and subjective understanding for health claims (p > 0.1).
Younger participants had higher levels of subjective understanding of health symbols,
and objective understanding of health claims and symbols (all p < 0.01) (Table 17).
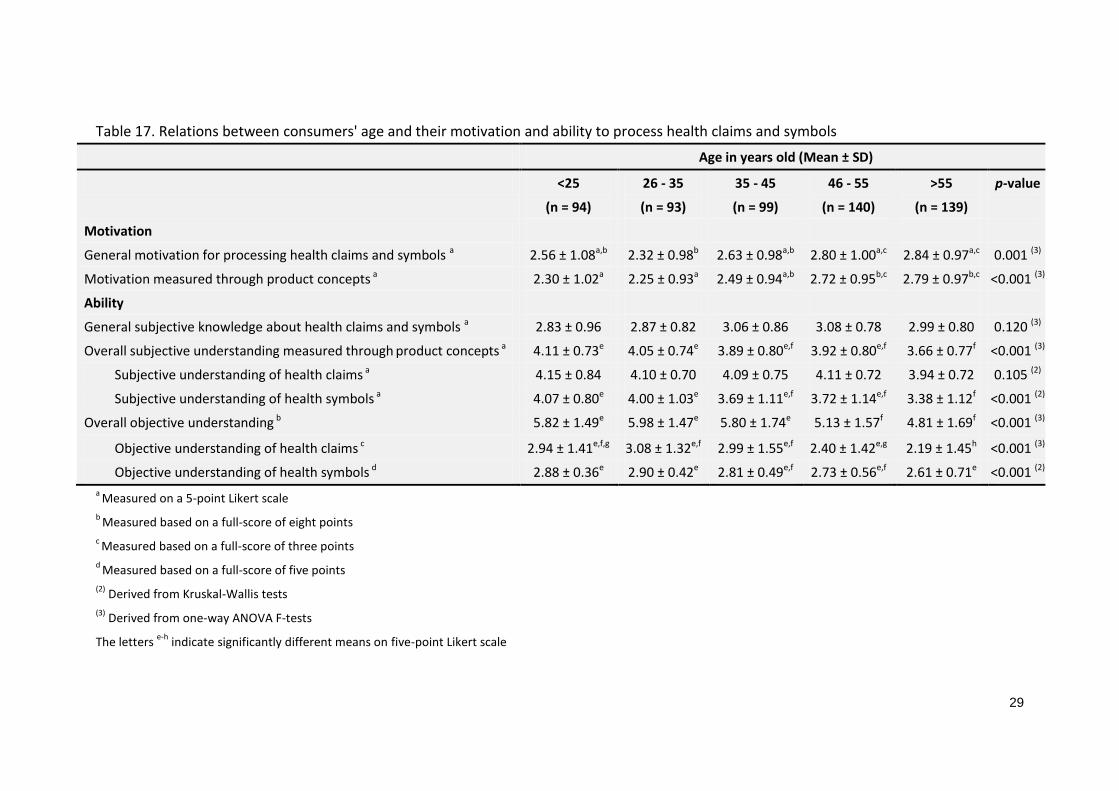
29
Table 17. Relations between consumers' age and their motivation and ability to process health claims and symbols
Age in years old (Mean ± SD)
<25
(n = 94)
26 - 35
(n = 93)
35 - 45
(n = 99)
46 - 55
(n = 140)
>55
(n = 139)
p-value
Motivation
General motivation for processing health claims and symbols a 2.56 ± 1.08a,b 2.32 ± 0.98b 2.63 ± 0.98a,b 2.80 ± 1.00a,c 2.84 ± 0.97a,c 0.001 (3)
Motivation measured through product concepts a 2.30 ± 1.02a 2.25 ± 0.93a 2.49 ± 0.94a,b 2.72 ± 0.95b,c 2.79 ± 0.97b,c <0.001 (3)
Ability
General subjective knowledge about health claims and symbols a 2.83 ± 0.96 2.87 ± 0.82 3.06 ± 0.86 3.08 ± 0.78 2.99 ± 0.80 0.120 (3)
Overall subjective understanding measured through product concepts a 4.11 ± 0.73e 4.05 ± 0.74e 3.89 ± 0.80e,f 3.92 ± 0.80e,f 3.66 ± 0.77f <0.001 (3)
Subjective understanding of health claims a 4.15 ± 0.84 4.10 ± 0.70 4.09 ± 0.75 4.11 ± 0.72 3.94 ± 0.72 0.105 (2)
Subjective understanding of health symbols a 4.07 ± 0.80e 4.00 ± 1.03e 3.69 ± 1.11e,f 3.72 ± 1.14e,f 3.38 ± 1.12f <0.001 (2)
Overall objective understanding b 5.82 ± 1.49e 5.98 ± 1.47e 5.80 ± 1.74e 5.13 ± 1.57f 4.81 ± 1.69f <0.001 (3)
Objective understanding of health claims c 2.94 ± 1.41e,f,g 3.08 ± 1.32e,f 2.99 ± 1.55e,f 2.40 ± 1.42e,g 2.19 ± 1.45h <0.001 (3)
Objective understanding of health symbols d 2.88 ± 0.36e 2.90 ± 0.42e 2.81 ± 0.49e,f 2.73 ± 0.56e,f 2.61 ± 0.71e <0.001 (2)
a Measured on a 5-point Likert scale
b Measured based on a full-score of eight points
c Measured based on a full-score of three points
d Measured based on a full-score of five points
(2) Derived from Kruskal-Wallis tests
(3) Derived from one-way ANOVA F-tests
The letters e-h
indicate significantly different means on five-point Likert scale
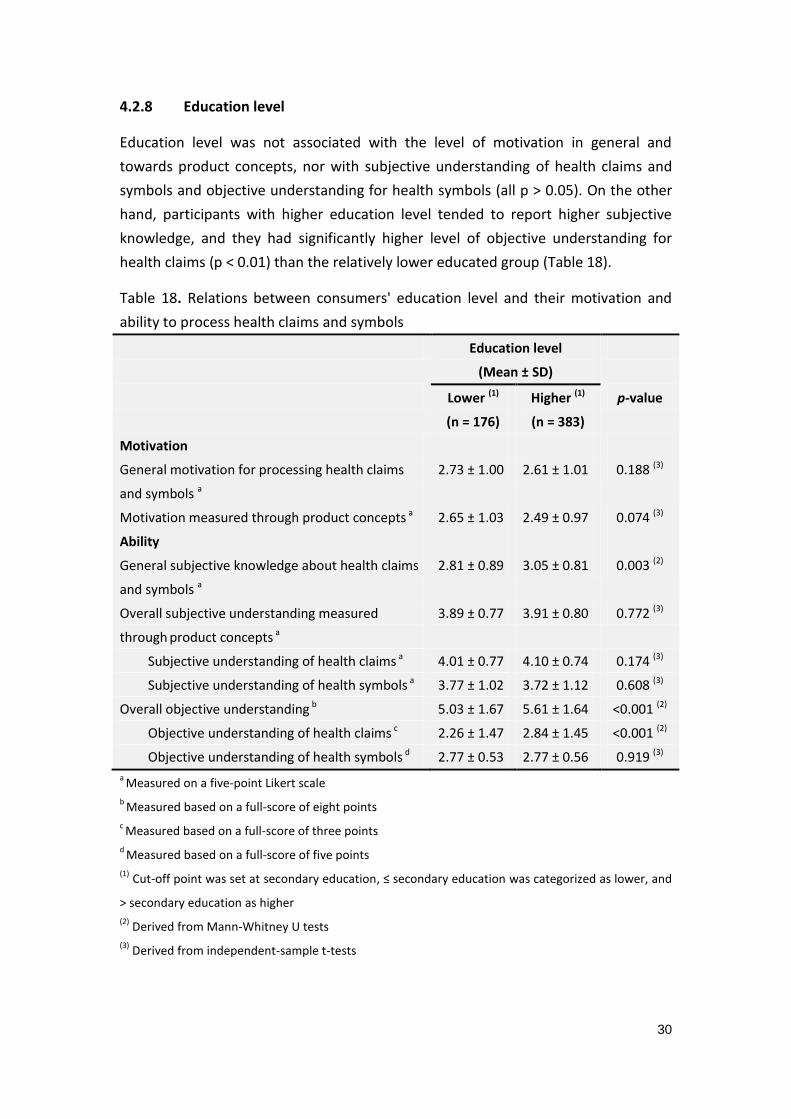
30
4.2.8 Education level
Education level was not associated with the level of motivation in general and
towards product concepts, nor with subjective understanding of health claims and
symbols and objective understanding for health symbols (all p > 0.05). On the other
hand, participants with higher education level tended to report higher subjective
knowledge, and they had significantly higher level of objective understanding for
health claims (p < 0.01) than the relatively lower educated group (Table 18).
Table 18. Relations between consumers' education level and their motivation and
ability to process health claims and symbols
Education level
(Mean ± SD)
Lower (1)
(n = 176)
Higher (1)
(n = 383)
p-value
Motivation
General motivation for processing health claims
and symbols a
2.73 ± 1.00 2.61 ± 1.01 0.188 (3)
Motivation measured through product concepts a 2.65 ± 1.03 2.49 ± 0.97 0.074 (3)
Ability
General subjective knowledge about health claims
and symbols a
2.81 ± 0.89 3.05 ± 0.81 0.003 (2)
Overall subjective understanding measured
through product concepts a
3.89 ± 0.77 3.91 ± 0.80 0.772 (3)
Subjective understanding of health claims a 4.01 ± 0.77 4.10 ± 0.74 0.174 (3)
Subjective understanding of health symbols a 3.77 ± 1.02 3.72 ± 1.12 0.608 (3)
Overall objective understanding b 5.03 ± 1.67 5.61 ± 1.64 <0.001 (2)
Objective understanding of health claims c 2.26 ± 1.47 2.84 ± 1.45 <0.001 (2)
Objective understanding of health symbols d 2.77 ± 0.53 2.77 ± 0.56 0.919 (3)
a Measured on a five-point Likert scale
b Measured based on a full-score of eight points
c Measured based on a full-score of three points
d Measured based on a full-score of five points
(1) Cut-off point was set at secondary education, ≤ secondary education was categorized as lower, and
> secondary education as higher
(2) Derived from Mann-Whitney U tests
(3) Derived from independent-sample t-tests
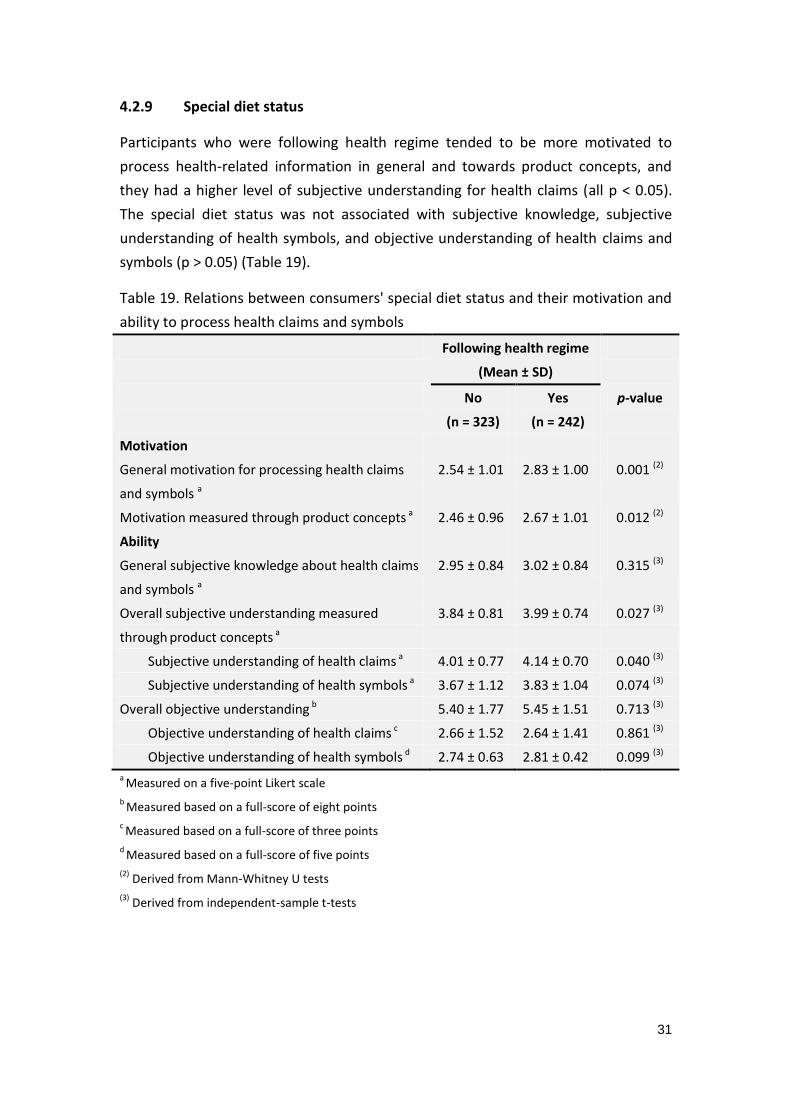
31
4.2.9 Special diet status
Participants who were following health regime tended to be more motivated to
process health-related information in general and towards product concepts, and
they had a higher level of subjective understanding for health claims (all p < 0.05).
The special diet status was not associated with subjective knowledge, subjective
understanding of health symbols, and objective understanding of health claims and
symbols (p > 0.05) (Table 19).
Table 19. Relations between consumers' special diet status and their motivation and
ability to process health claims and symbols
Following health regime
(Mean ± SD)
No
(n = 323)
Yes
(n = 242)
p-value
Motivation
General motivation for processing health claims
and symbols a
2.54 ± 1.01 2.83 ± 1.00 0.001 (2)
Motivation measured through product concepts a 2.46 ± 0.96 2.67 ± 1.01 0.012 (2)
Ability
General subjective knowledge about health claims
and symbols a
2.95 ± 0.84 3.02 ± 0.84 0.315 (3)
Overall subjective understanding measured
through product concepts a
3.84 ± 0.81 3.99 ± 0.74 0.027 (3)
Subjective understanding of health claims a 4.01 ± 0.77 4.14 ± 0.70 0.040 (3)
Subjective understanding of health symbols a 3.67 ± 1.12 3.83 ± 1.04 0.074 (3)
Overall objective understanding b 5.40 ± 1.77 5.45 ± 1.51 0.713 (3)
Objective understanding of health claims c 2.66 ± 1.52 2.64 ± 1.41 0.861 (3)
Objective understanding of health symbols d 2.74 ± 0.63 2.81 ± 0.42 0.099 (3)
a Measured on a five-point Likert scale
b Measured based on a full-score of eight points
c Measured based on a full-score of three points
d Measured based on a full-score of five points
(2) Derived from Mann-Whitney U tests
(3) Derived from independent-sample t-tests
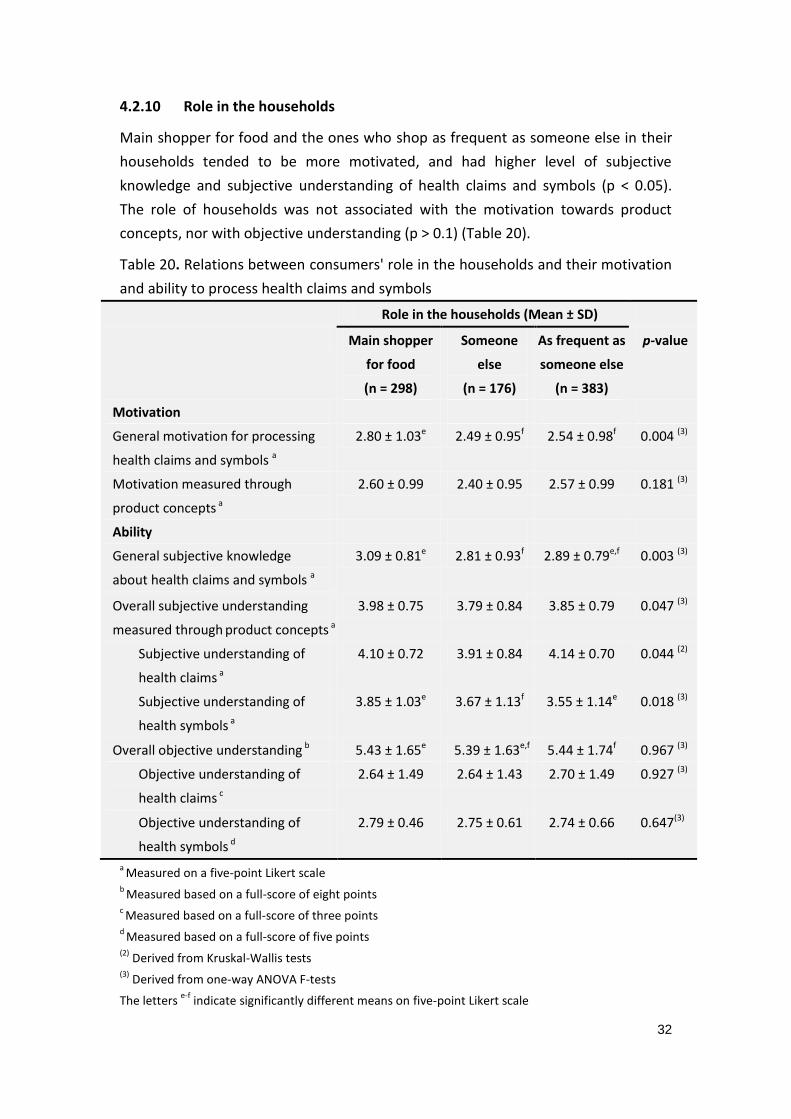
32
4.2.10 Role in the households
Main shopper for food and the ones who shop as frequent as someone else in their
households tended to be more motivated, and had higher level of subjective
knowledge and subjective understanding of health claims and symbols (p < 0.05).
The role of households was not associated with the motivation towards product
concepts, nor with objective understanding (p > 0.1) (Table 20).
Table 20. Relations between consumers' role in the households and their motivation
and ability to process health claims and symbols
Role in the households (Mean ± SD)
Main shopper
for food
(n = 298)
Someone
else
(n = 176)
As frequent as
someone else
(n = 383)
p-value
Motivation
General motivation for processing
health claims and symbols a
2.80 ± 1.03e 2.49 ± 0.95f 2.54 ± 0.98f 0.004 (3)
Motivation measured through
product concepts a
2.60 ± 0.99 2.40 ± 0.95 2.57 ± 0.99 0.181 (3)
Ability
General subjective knowledge
about health claims and symbols a
3.09 ± 0.81e 2.81 ± 0.93f 2.89 ± 0.79e,f 0.003 (3)
Overall subjective understanding
measured through product concepts a
3.98 ± 0.75 3.79 ± 0.84 3.85 ± 0.79 0.047 (3)
Subjective understanding of
health claims a
4.10 ± 0.72 3.91 ± 0.84 4.14 ± 0.70 0.044 (2)
Subjective understanding of
health symbols a
3.85 ± 1.03e 3.67 ± 1.13f 3.55 ± 1.14e 0.018 (3)
Overall objective understanding b 5.43 ± 1.65e 5.39 ± 1.63e,f 5.44 ± 1.74f 0.967 (3)
Objective understanding of
health claims c
2.64 ± 1.49 2.64 ± 1.43 2.70 ± 1.49 0.927 (3)
Objective understanding of
health symbols d
2.79 ± 0.46 2.75 ± 0.61 2.74 ± 0.66 0.647(3)
a Measured on a five-point Likert scale
b Measured based on a full-score of eight points
c Measured based on a full-score of three points
d Measured based on a full-score of five points
(2) Derived from Kruskal-Wallis tests
(3) Derived from one-way ANOVA F-tests
The letters e-f
indicate significantly different means on five-point Likert scale
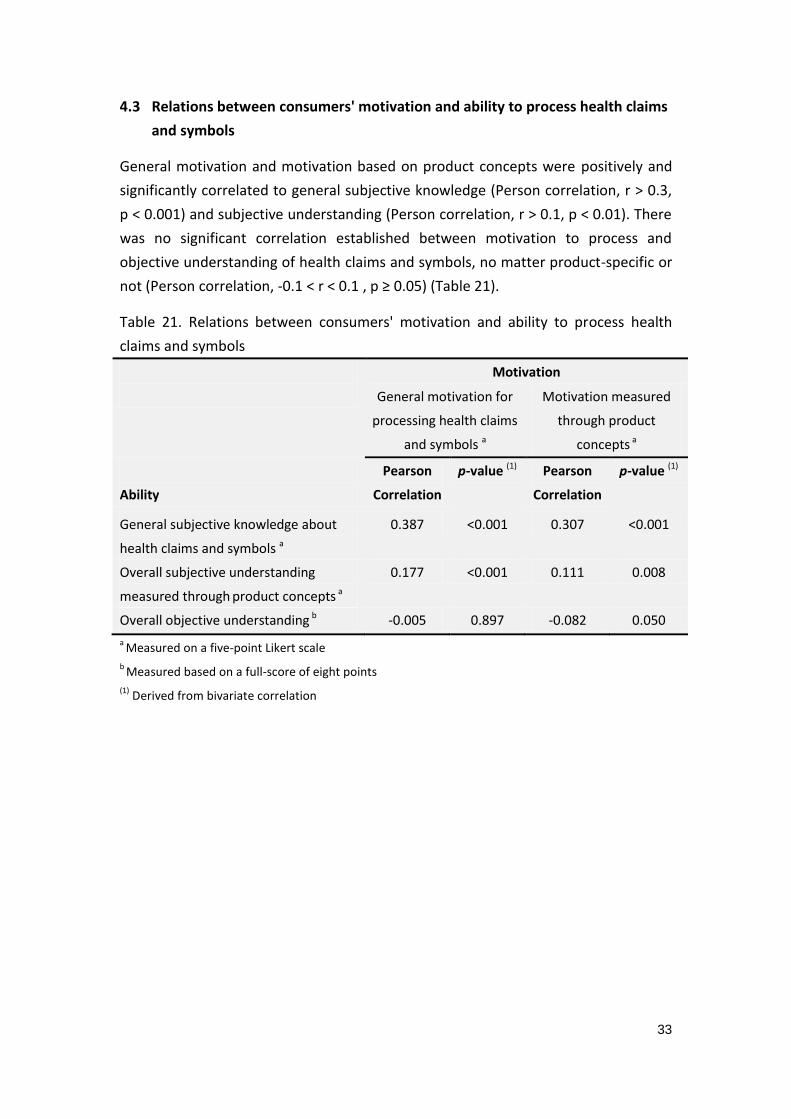
33
4.3 Relations between consumers' motivation and ability to process health claims
and symbols
General motivation and motivation based on product concepts were positively and
significantly correlated to general subjective knowledge (Person correlation, r > 0.3,
p < 0.001) and subjective understanding (Person correlation, r > 0.1, p < 0.01). There
was no significant correlation established between motivation to process and
objective understanding of health claims and symbols, no matter product-specific or
not (Person correlation, -0.1 < r < 0.1 , p ≥ 0.05) (Table 21).
Table 21. Relations between consumers' motivation and ability to process health
claims and symbols
Motivation
General motivation for
processing health claims
and symbols a
Motivation measured
through product
concepts a
Ability
Pearson
Correlation
p-value (1) Pearson
Correlation
p-value (1)
General subjective knowledge about
health claims and symbols a
0.387 <0.001 0.307 <0.001
Overall subjective understanding
measured through product concepts a
0.177 <0.001 0.111 0.008
Overall objective understanding b -0.005 0.897 -0.082 0.050
a Measured on a five-point Likert scale
b Measured based on a full-score of eight points
(1) Derived from bivariate correlation
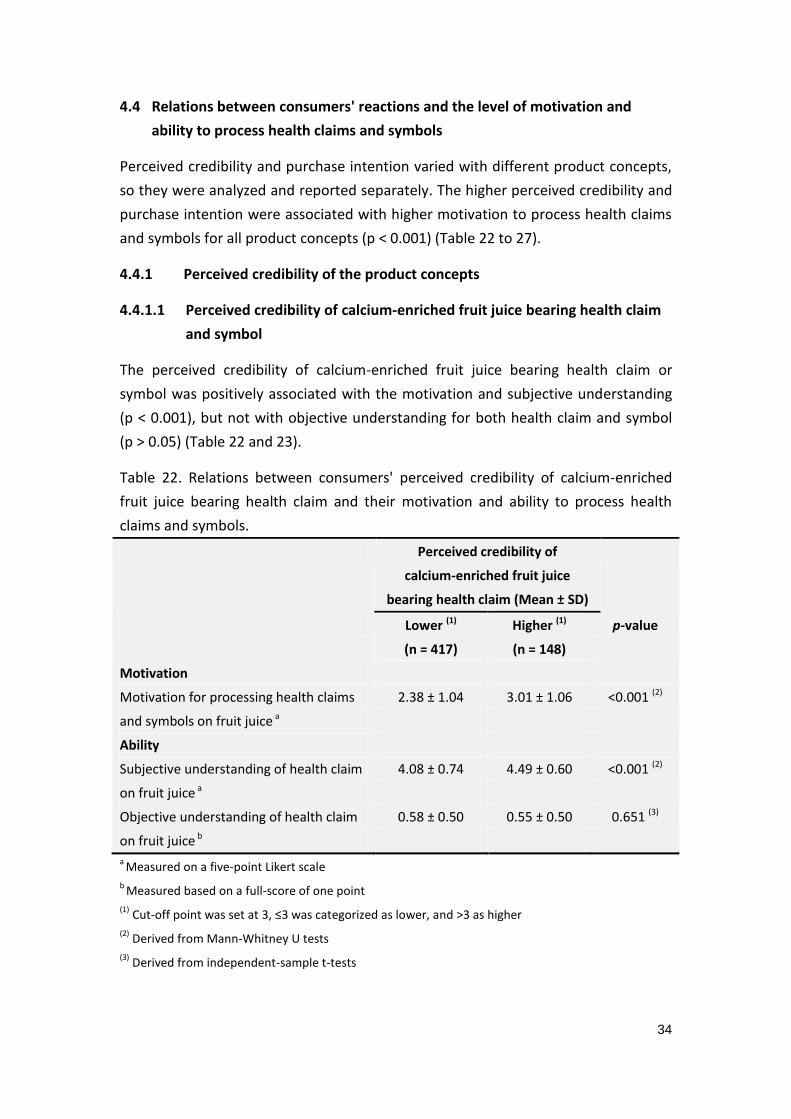
34
4.4 Relations between consumers' reactions and the level of motivation and
ability to process health claims and symbols
Perceived credibility and purchase intention varied with different product concepts,
so they were analyzed and reported separately. The higher perceived credibility and
purchase intention were associated with higher motivation to process health claims
and symbols for all product concepts (p < 0.001) (Table 22 to 27).
4.4.1 Perceived credibility of the product concepts
4.4.1.1 Perceived credibility of calcium-enriched fruit juice bearing health claim
and symbol
The perceived credibility of calcium-enriched fruit juice bearing health claim or
symbol was positively associated with the motivation and subjective understanding
(p < 0.001), but not with objective understanding for both health claim and symbol
(p > 0.05) (Table 22 and 23).
Table 22. Relations between consumers' perceived credibility of calcium-enriched
fruit juice bearing health claim and their motivation and ability to process health
claims and symbols.
Perceived credibility of
calcium-enriched fruit juice
bearing health claim (Mean ± SD)
Lower (1)
(n = 417)
Higher (1)
(n = 148)
p-value
Motivation
Motivation for processing health claims
and symbols on fruit juice a
2.38 ± 1.04 3.01 ± 1.06 <0.001 (2)
Ability
Subjective understanding of health claim
on fruit juice a
4.08 ± 0.74 4.49 ± 0.60 <0.001 (2)
Objective understanding of health claim
on fruit juice b
0.58 ± 0.50 0.55 ± 0.50 0.651 (3)
a Measured on a five-point Likert scale
b Measured based on a full-score of one point
(1) Cut-off point was set at 3, ≤3 was categorized as lower, and >3 as higher
(2) Derived from Mann-Whitney U tests
(3) Derived from independent-sample t-tests
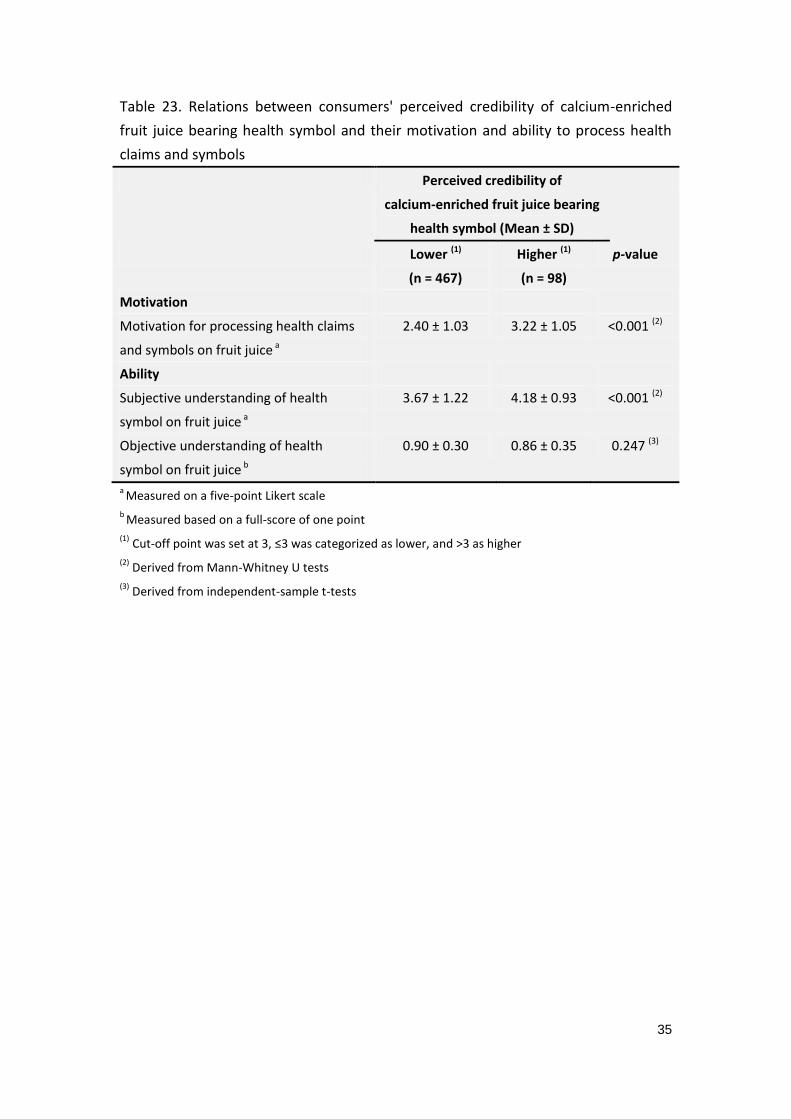
35
Table 23. Relations between consumers' perceived credibility of calcium-enriched
fruit juice bearing health symbol and their motivation and ability to process health
claims and symbols
Perceived credibility of
calcium-enriched fruit juice bearing
health symbol (Mean ± SD)
Lower (1)
(n = 467)
Higher (1)
(n = 98)
p-value
Motivation
Motivation for processing health claims
and symbols on fruit juice a
2.40 ± 1.03 3.22 ± 1.05 <0.001 (2)
Ability
Subjective understanding of health
symbol on fruit juice a
3.67 ± 1.22 4.18 ± 0.93 <0.001 (2)
Objective understanding of health
symbol on fruit juice b
0.90 ± 0.30 0.86 ± 0.35 0.247 (3)
a Measured on a five-point Likert scale
b Measured based on a full-score of one point
(1) Cut-off point was set at 3, ≤3 was categorized as lower, and >3 as higher
(2) Derived from Mann-Whitney U tests
(3) Derived from independent-sample t-tests
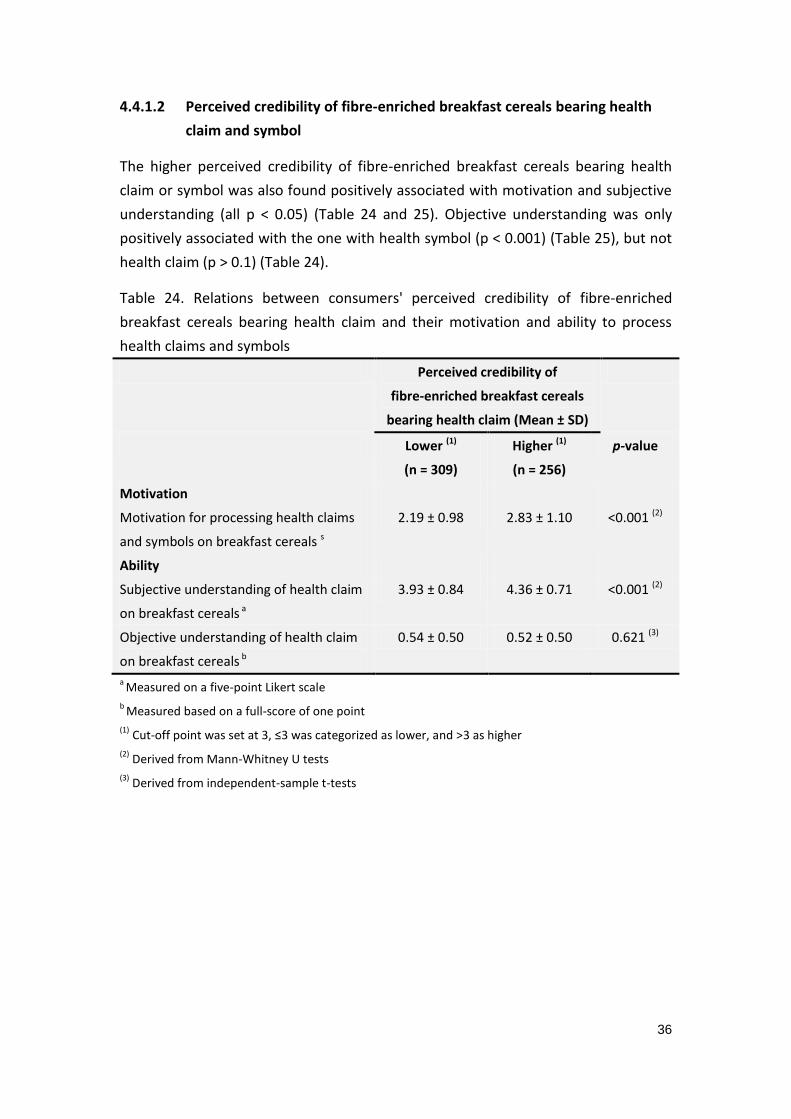
36
4.4.1.2 Perceived credibility of fibre-enriched breakfast cereals bearing health
claim and symbol
The higher perceived credibility of fibre-enriched breakfast cereals bearing health
claim or symbol was also found positively associated with motivation and subjective
understanding (all p < 0.05) (Table 24 and 25). Objective understanding was only
positively associated with the one with health symbol (p < 0.001) (Table 25), but not
health claim (p > 0.1) (Table 24).
Table 24. Relations between consumers' perceived credibility of fibre-enriched
breakfast cereals bearing health claim and their motivation and ability to process
health claims and symbols
Perceived credibility of
fibre-enriched breakfast cereals
bearing health claim (Mean ± SD)
Lower (1)
(n = 309)
Higher (1)
(n = 256)
p-value
Motivation
Motivation for processing health claims
and symbols on breakfast cereals s
2.19 ± 0.98 2.83 ± 1.10 <0.001 (2)
Ability
Subjective understanding of health claim
on breakfast cereals a
3.93 ± 0.84 4.36 ± 0.71 <0.001 (2)
Objective understanding of health claim
on breakfast cereals b
0.54 ± 0.50 0.52 ± 0.50 0.621 (3)
a Measured on a five-point Likert scale
b Measured based on a full-score of one point
(1) Cut-off point was set at 3, ≤3 was categorized as lower, and >3 as higher
(2) Derived from Mann-Whitney U tests
(3) Derived from independent-sample t-tests
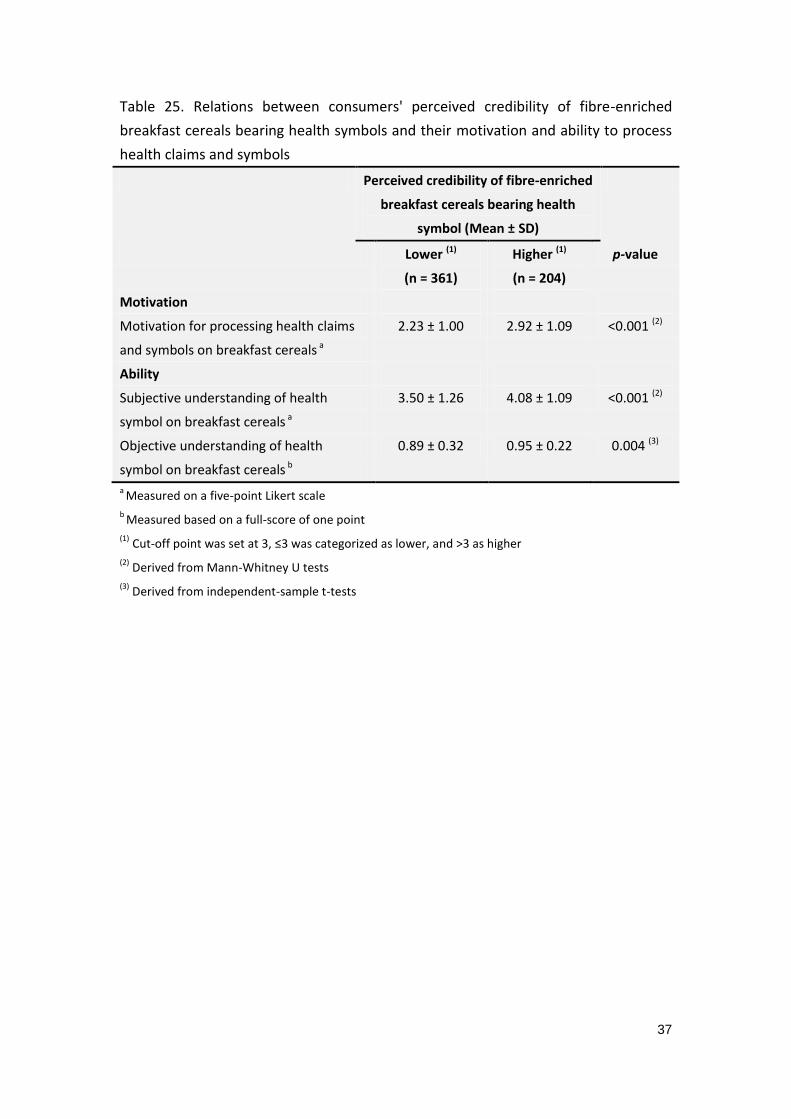
37
Table 25. Relations between consumers' perceived credibility of fibre-enriched
breakfast cereals bearing health symbols and their motivation and ability to process
health claims and symbols
Perceived credibility of fibre-enriched
breakfast cereals bearing health
symbol (Mean ± SD)
Lower (1)
(n = 361)
Higher (1)
(n = 204)
p-value
Motivation
Motivation for processing health claims
and symbols on breakfast cereals a
2.23 ± 1.00 2.92 ± 1.09 <0.001 (2)
Ability
Subjective understanding of health
symbol on breakfast cereals a
3.50 ± 1.26 4.08 ± 1.09 <0.001 (2)
Objective understanding of health
symbol on breakfast cereals b
0.89 ± 0.32 0.95 ± 0.22 0.004 (3)
a Measured on a five-point Likert scale
b Measured based on a full-score of one point
(1) Cut-off point was set at 3, ≤3 was categorized as lower, and >3 as higher
(2) Derived from Mann-Whitney U tests
(3) Derived from independent-sample t-tests
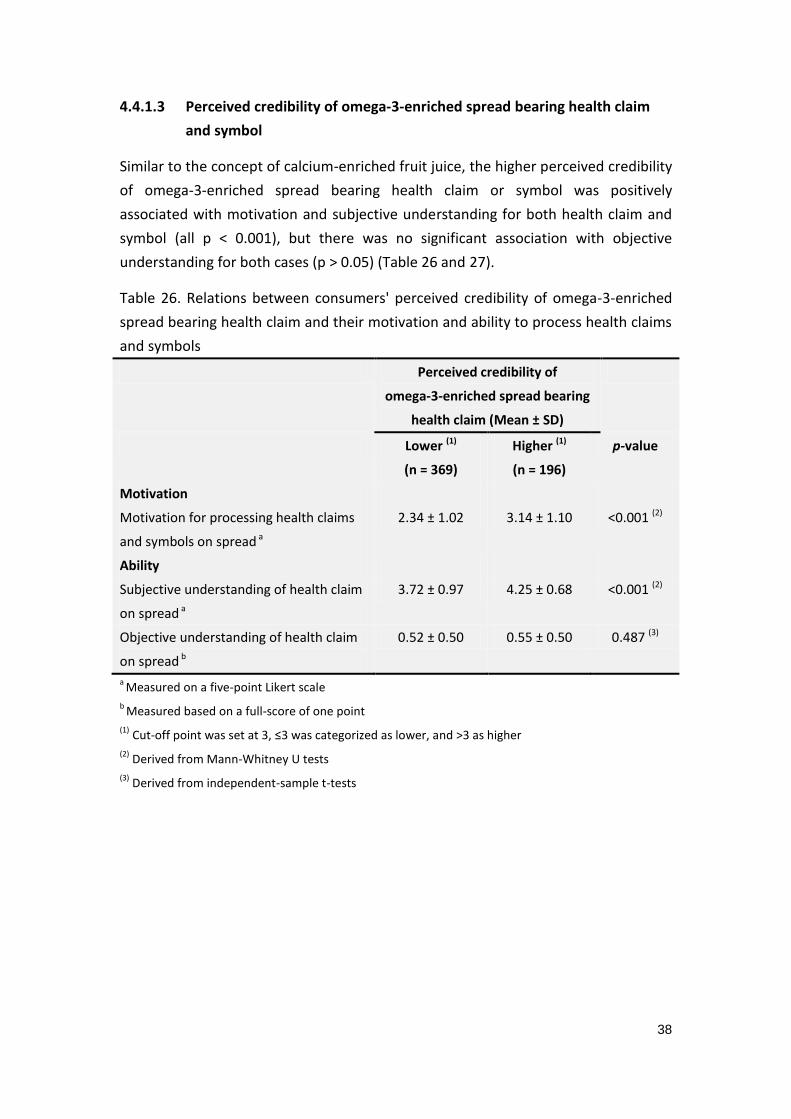
38
4.4.1.3 Perceived credibility of omega-3-enriched spread bearing health claim
and symbol
Similar to the concept of calcium-enriched fruit juice, the higher perceived credibility
of omega-3-enriched spread bearing health claim or symbol was positively
associated with motivation and subjective understanding for both health claim and
symbol (all p < 0.001), but there was no significant association with objective
understanding for both cases (p > 0.05) (Table 26 and 27).
Table 26. Relations between consumers' perceived credibility of omega-3-enriched
spread bearing health claim and their motivation and ability to process health claims
and symbols
Perceived credibility of
omega-3-enriched spread bearing
health claim (Mean ± SD)
Lower (1)
(n = 369)
Higher (1)
(n = 196)
p-value
Motivation
Motivation for processing health claims
and symbols on spread a
2.34 ± 1.02 3.14 ± 1.10 <0.001 (2)
Ability
Subjective understanding of health claim
on spread a
3.72 ± 0.97 4.25 ± 0.68 <0.001 (2)
Objective understanding of health claim
on spread b
0.52 ± 0.50 0.55 ± 0.50 0.487 (3)
a Measured on a five-point Likert scale
b Measured based on a full-score of one point
(1) Cut-off point was set at 3, ≤3 was categorized as lower, and >3 as higher
(2) Derived from Mann-Whitney U tests
(3) Derived from independent-sample t-tests
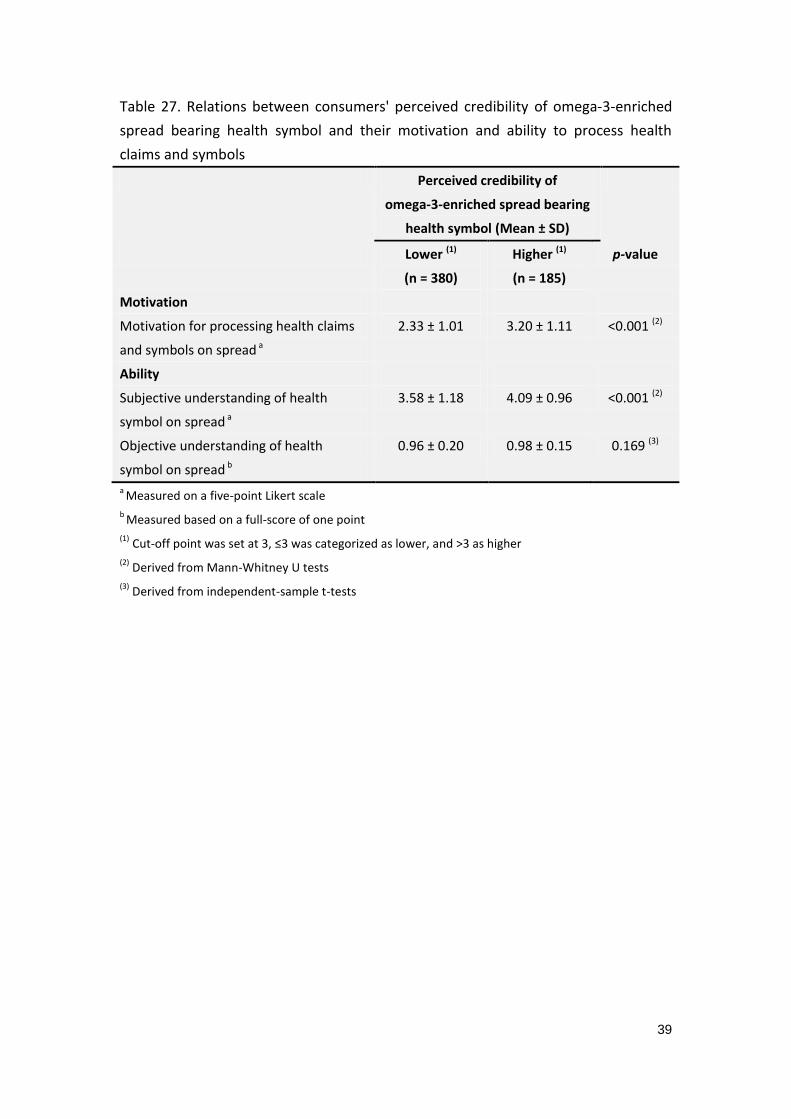
39
Table 27. Relations between consumers' perceived credibility of omega-3-enriched
spread bearing health symbol and their motivation and ability to process health
claims and symbols
Perceived credibility of
omega-3-enriched spread bearing
health symbol (Mean ± SD)
Lower (1)
(n = 380)
Higher (1)
(n = 185)
p-value
Motivation
Motivation for processing health claims
and symbols on spread a
2.33 ± 1.01 3.20 ± 1.11 <0.001 (2)
Ability
Subjective understanding of health
symbol on spread a
3.58 ± 1.18 4.09 ± 0.96 <0.001 (2)
Objective understanding of health
symbol on spread b
0.96 ± 0.20 0.98 ± 0.15 0.169 (3)
a Measured on a five-point Likert scale
b Measured based on a full-score of one point
(1) Cut-off point was set at 3, ≤3 was categorized as lower, and >3 as higher
(2) Derived from Mann-Whitney U tests
(3) Derived from independent-sample t-tests
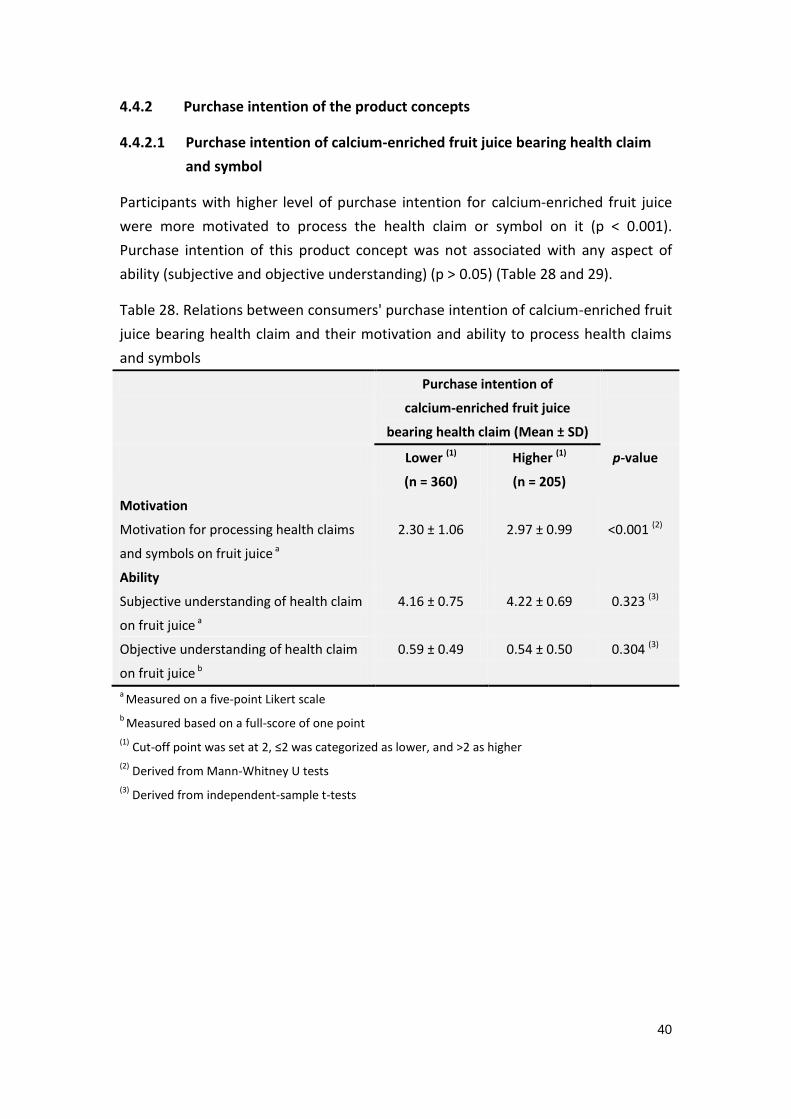
40
4.4.2 Purchase intention of the product concepts
4.4.2.1 Purchase intention of calcium-enriched fruit juice bearing health claim
and symbol
Participants with higher level of purchase intention for calcium-enriched fruit juice
were more motivated to process the health claim or symbol on it (p < 0.001).
Purchase intention of this product concept was not associated with any aspect of
ability (subjective and objective understanding) (p > 0.05) (Table 28 and 29).
Table 28. Relations between consumers' purchase intention of calcium-enriched fruit
juice bearing health claim and their motivation and ability to process health claims
and symbols
Purchase intention of
calcium-enriched fruit juice
bearing health claim (Mean ± SD)
Lower (1)
(n = 360)
Higher (1)
(n = 205)
p-value
Motivation
Motivation for processing health claims
and symbols on fruit juice a
2.30 ± 1.06 2.97 ± 0.99 <0.001 (2)
Ability
Subjective understanding of health claim
on fruit juice a
4.16 ± 0.75 4.22 ± 0.69 0.323 (3)
Objective understanding of health claim
on fruit juice b
0.59 ± 0.49 0.54 ± 0.50 0.304 (3)
a Measured on a five-point Likert scale
b Measured based on a full-score of one point
(1) Cut-off point was set at 2, ≤2 was categorized as lower, and >2 as higher
(2) Derived from Mann-Whitney U tests
(3) Derived from independent-sample t-tests
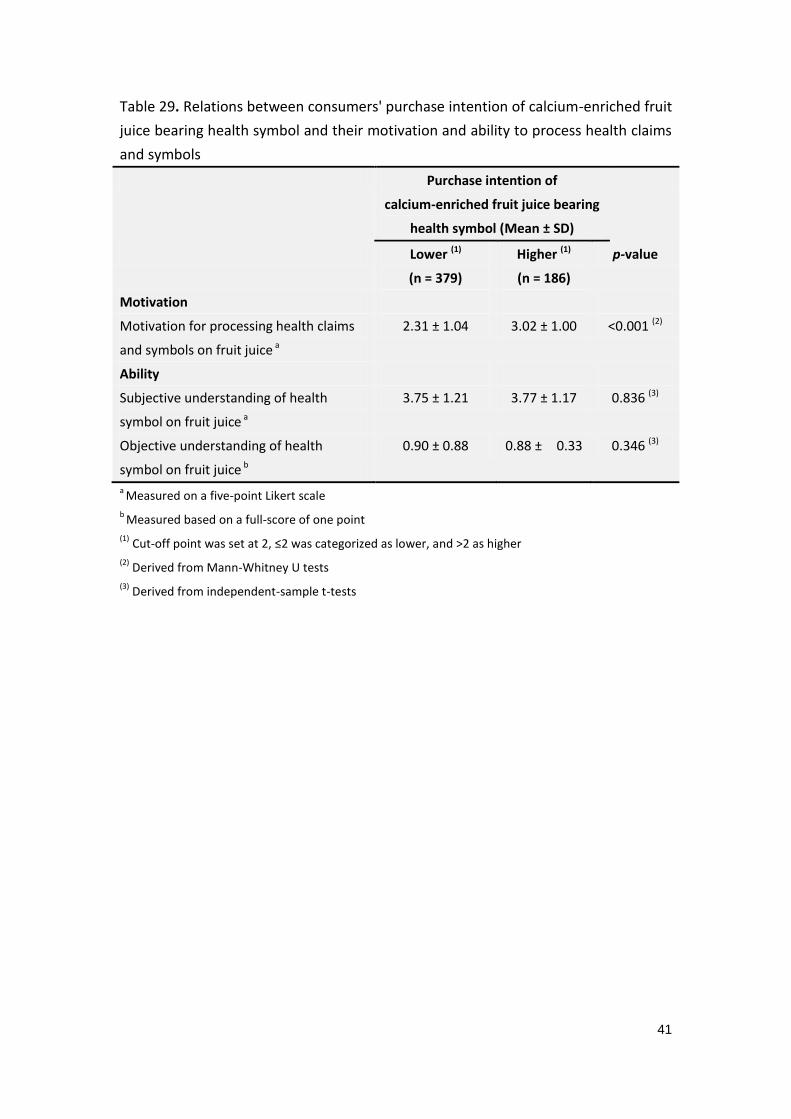
41
Table 29. Relations between consumers' purchase intention of calcium-enriched fruit
juice bearing health symbol and their motivation and ability to process health claims
and symbols
Purchase intention of
calcium-enriched fruit juice bearing
health symbol (Mean ± SD)
Lower (1)
(n = 379)
Higher (1)
(n = 186)
p-value
Motivation
Motivation for processing health claims
and symbols on fruit juice a
2.31 ± 1.04 3.02 ± 1.00 <0.001 (2)
Ability
Subjective understanding of health
symbol on fruit juice a
3.75 ± 1.21 3.77 ± 1.17 0.836 (3)
Objective understanding of health
symbol on fruit juice b
0.90 ± 0.88 0.88 ± 0.33 0.346 (3)
a Measured on a five-point Likert scale
b Measured based on a full-score of one point
(1) Cut-off point was set at 2, ≤2 was categorized as lower, and >2 as higher
(2) Derived from Mann-Whitney U tests
(3) Derived from independent-sample t-tests
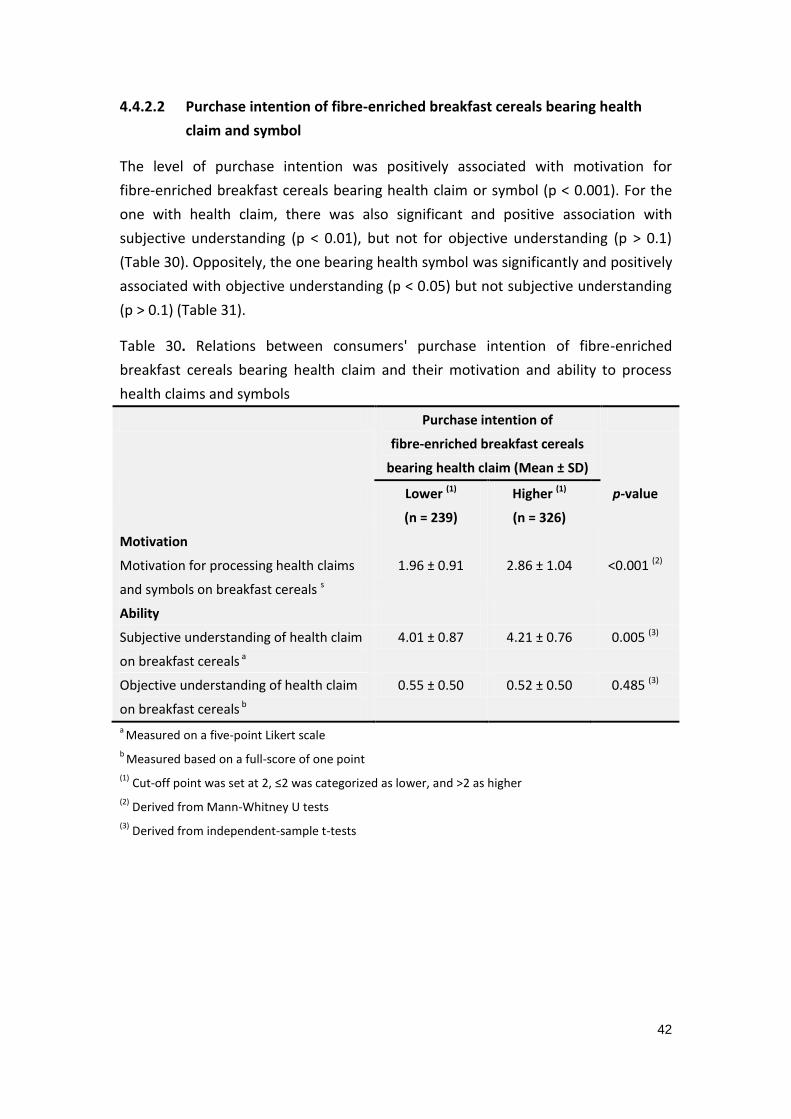
42
4.4.2.2 Purchase intention of fibre-enriched breakfast cereals bearing health
claim and symbol
The level of purchase intention was positively associated with motivation for
fibre-enriched breakfast cereals bearing health claim or symbol (p < 0.001). For the
one with health claim, there was also significant and positive association with
subjective understanding (p < 0.01), but not for objective understanding (p > 0.1)
(Table 30). Oppositely, the one bearing health symbol was significantly and positively
associated with objective understanding (p < 0.05) but not subjective understanding
(p > 0.1) (Table 31).
Table 30. Relations between consumers' purchase intention of fibre-enriched
breakfast cereals bearing health claim and their motivation and ability to process
health claims and symbols
Purchase intention of
fibre-enriched breakfast cereals
bearing health claim (Mean ± SD)
Lower (1)
(n = 239)
Higher (1)
(n = 326)
p-value
Motivation
Motivation for processing health claims
and symbols on breakfast cereals s
1.96 ± 0.91 2.86 ± 1.04 <0.001 (2)
Ability
Subjective understanding of health claim
on breakfast cereals a
4.01 ± 0.87 4.21 ± 0.76 0.005 (3)
Objective understanding of health claim
on breakfast cereals b
0.55 ± 0.50 0.52 ± 0.50 0.485 (3)
a Measured on a five-point Likert scale
b Measured based on a full-score of one point
(1) Cut-off point was set at 2, ≤2 was categorized as lower, and >2 as higher
(2) Derived from Mann-Whitney U tests
(3) Derived from independent-sample t-tests

43
Table 31. Relations between consumers' purchase intention of fibre-enriched
breakfast cereals bearing health symbol and their motivation and ability to process
health claims and symbols
Purchase intention of fibre-enriched
breakfast cereals bearing health
symbol (Mean ± SD)
Lower (1)
(n = 253)
Higher (1)
(n = 312)
p-value
Motivation
Motivation for processing health claims
and symbols on breakfast cereals a
2.00 ± 0.94 2.87 ± 1.04 <0.001 (2)
Ability
Subjective understanding of health
symbol on breakfast cereals a
3.65 ± 1.24 3.75 ± 1.23 0.334 (3)
Objective understanding of health
symbol on breakfast cereals b
0.88 ± 0.33 0.94 ± 0.25 0.019 (3)
a Measured on a five-point Likert scale
b Measured based on a full-score of one point
(1) Cut-off point was set at 2, ≤2 was categorized as lower, and >2 as higher
(2) Derived from Mann-Whitney U tests
(3) Derived from independent-sample t-tests
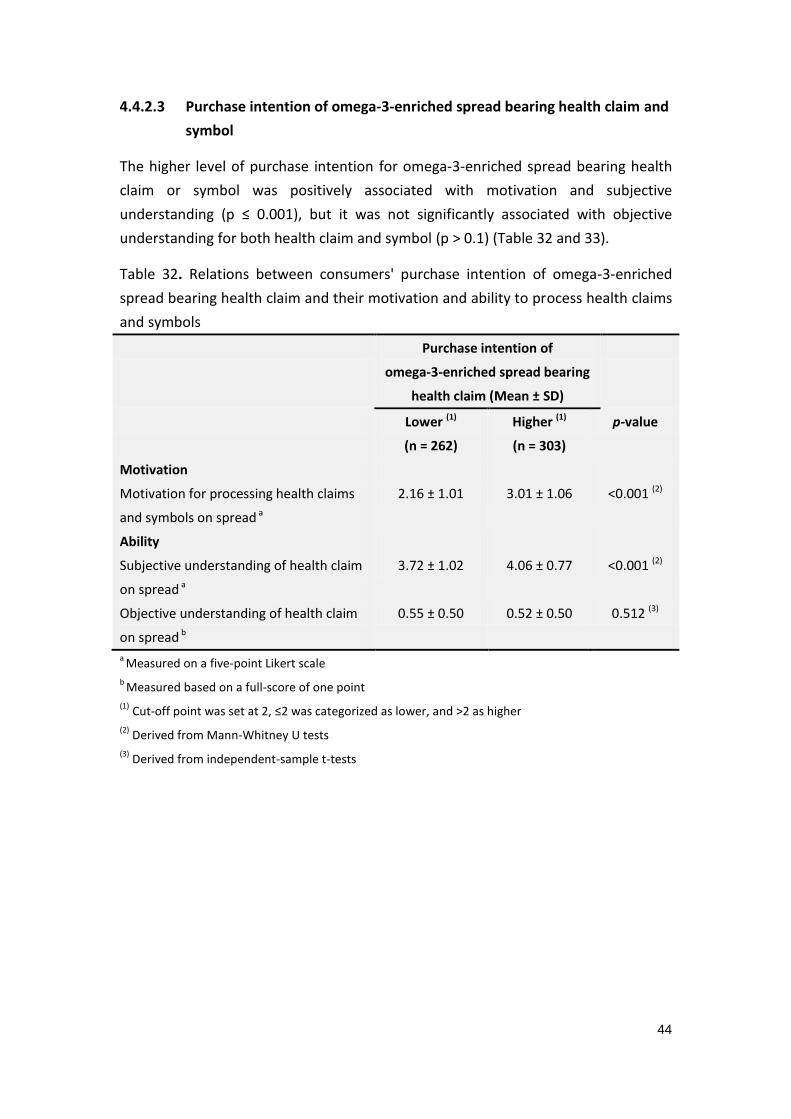
44
4.4.2.3 Purchase intention of omega-3-enriched spread bearing health claim and
symbol
The higher level of purchase intention for omega-3-enriched spread bearing health
claim or symbol was positively associated with motivation and subjective
understanding (p ≤ 0.001), but it was not significantly associated with objective
understanding for both health claim and symbol (p > 0.1) (Table 32 and 33).
Table 32. Relations between consumers' purchase intention of omega-3-enriched
spread bearing health claim and their motivation and ability to process health claims
and symbols
Purchase intention of
omega-3-enriched spread bearing
health claim (Mean ± SD)
Lower (1)
(n = 262)
Higher (1)
(n = 303)
p-value
Motivation
Motivation for processing health claims
and symbols on spread a
2.16 ± 1.01 3.01 ± 1.06 <0.001 (2)
Ability
Subjective understanding of health claim
on spread a
3.72 ± 1.02 4.06 ± 0.77 <0.001 (2)
Objective understanding of health claim
on spread b
0.55 ± 0.50 0.52 ± 0.50 0.512 (3)
a Measured on a five-point Likert scale
b Measured based on a full-score of one point
(1) Cut-off point was set at 2, ≤2 was categorized as lower, and >2 as higher
(2) Derived from Mann-Whitney U tests
(3) Derived from independent-sample t-tests

45
Table 33. Relations between consumers' purchase intention of omega-3-enriched
spread bearing health symbol and their motivation and ability to process health
claims and symbols
Purchase intention of
omega-3-enriched spread bearing
health symbol (Mean ± SD)
Lower (1)
(n = 283)
Higher (1)
(n = 282)
p-value
Motivation
Motivation for processing health claims
and symbols on spread a
2.19 ± 1.01 3.05 ± 1.06 <0.001 (2)
Ability
Subjective understanding of health
symbol on spread a
3.58 ± 1.21 3.91 ± 1.03 0.001 (2)
Objective understanding of health
symbol on spread b
0.96 ± 0.19 0.96 ± 0.19 0.994 (3)
a Measured on a five-point Likert scale
b Measured based on a full-score of one point
(1) Cut-off point was set at 2, ≤2 was categorized as lower, and >2 as higher
(2) Derived from Mann-Whitney U tests
(3) Derived from independent-sample t-tests
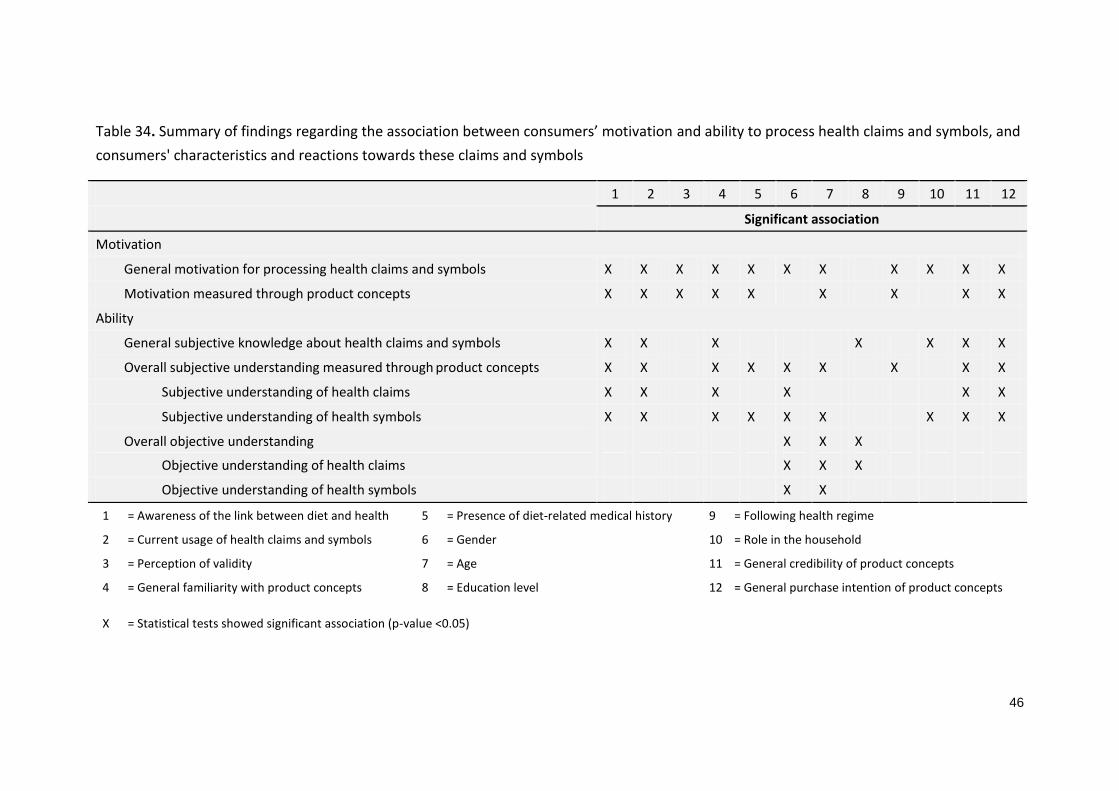
46
Table 34. Summary of findings regarding the association between consumers’ motivation and ability to process health claims and symbols, and
consumers' characteristics and reactions towards these claims and symbols
1 = Awareness of the link between diet and health 5 = Presence of diet-related medical history 9 = Following health regime
2 = Current usage of health claims and symbols 6 = Gender 10 = Role in the household
3 = Perception of validity 7 = Age 11 = General credibility of product concepts
4 = General familiarity with product concepts 8 = Education level 12 = General purchase intention of product concepts
X = Statistical tests showed significant association (p-value <0.05)
1 2 3 4 5 6 7 8 9 10 11 12
Significant association
Motivation
General motivation for processing health claims and symbols X X X X X X X X X X X
Motivation measured through product concepts X X X X X X X X X
Ability
General subjective knowledge about health claims and symbols X X X X X X X
Overall subjective understanding measured through product concepts X X X X X X X X X
Subjective understanding of health claims X X X X X X
Subjective understanding of health symbols X X X X X X X X X
Overall objective understanding X X X
Objective understanding of health claims X X X
Objective understanding of health symbols X X
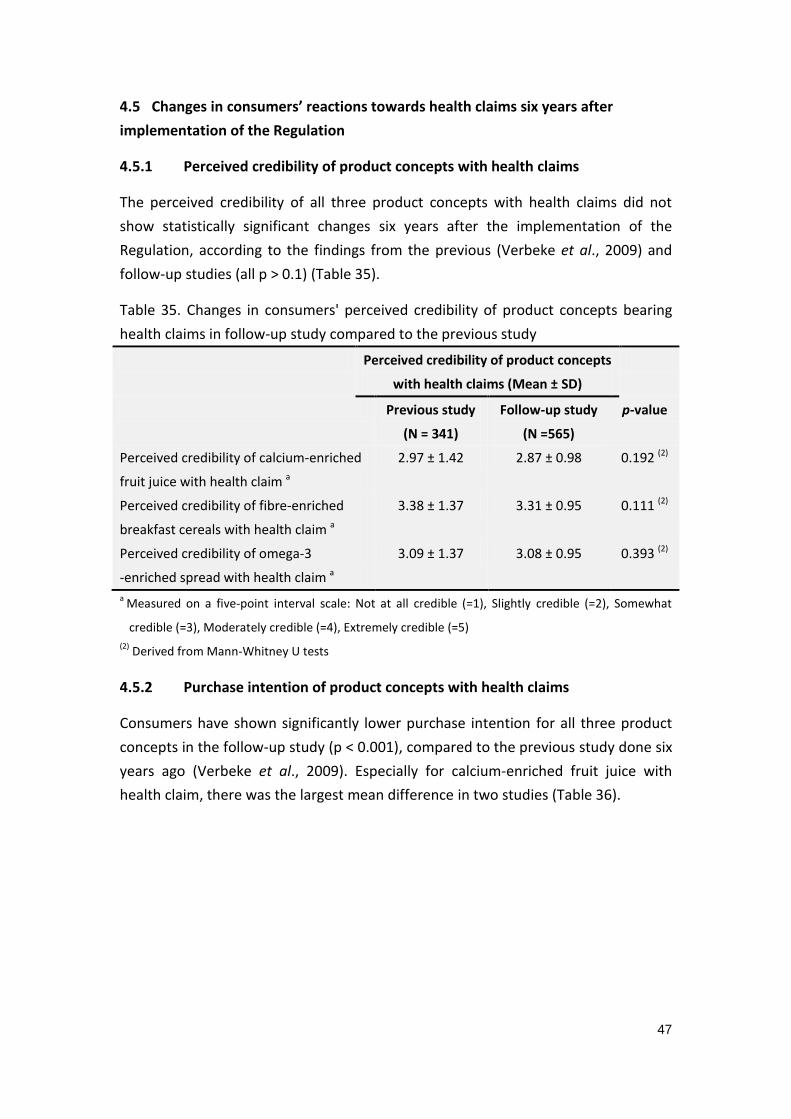
47
4.5 Changes in consumers’ reactions towards health claims six years after
implementation of the Regulation
4.5.1 Perceived credibility of product concepts with health claims
The perceived credibility of all three product concepts with health claims did not
show statistically significant changes six years after the implementation of the
Regulation, according to the findings from the previous (Verbeke et al., 2009) and
follow-up studies (all p > 0.1) (Table 35).
Table 35. Changes in consumers' perceived credibility of product concepts bearing
health claims in follow-up study compared to the previous study
Perceived credibility of product concepts
with health claims (Mean ± SD)
Previous study
(N = 341)
Follow-up study
(N =565)
p-value
Perceived credibility of calcium-enriched
fruit juice with health claim a
2.97 ± 1.42 2.87 ± 0.98 0.192 (2)
Perceived credibility of fibre-enriched
breakfast cereals with health claim a
3.38 ± 1.37 3.31 ± 0.95 0.111 (2)
Perceived credibility of omega-3
-enriched spread with health claim a
3.09 ± 1.37 3.08 ± 0.95 0.393 (2)
a Measured on a five-point interval scale: Not at all credible (=1), Slightly credible (=2), Somewhat
credible (=3), Moderately credible (=4), Extremely credible (=5)
(2) Derived from Mann-Whitney U tests
4.5.2 Purchase intention of product concepts with health claims
Consumers have shown significantly lower purchase intention for all three product
concepts in the follow-up study (p < 0.001), compared to the previous study done six
years ago (Verbeke et al., 2009). Especially for calcium-enriched fruit juice with
health claim, there was the largest mean difference in two studies (Table 36).
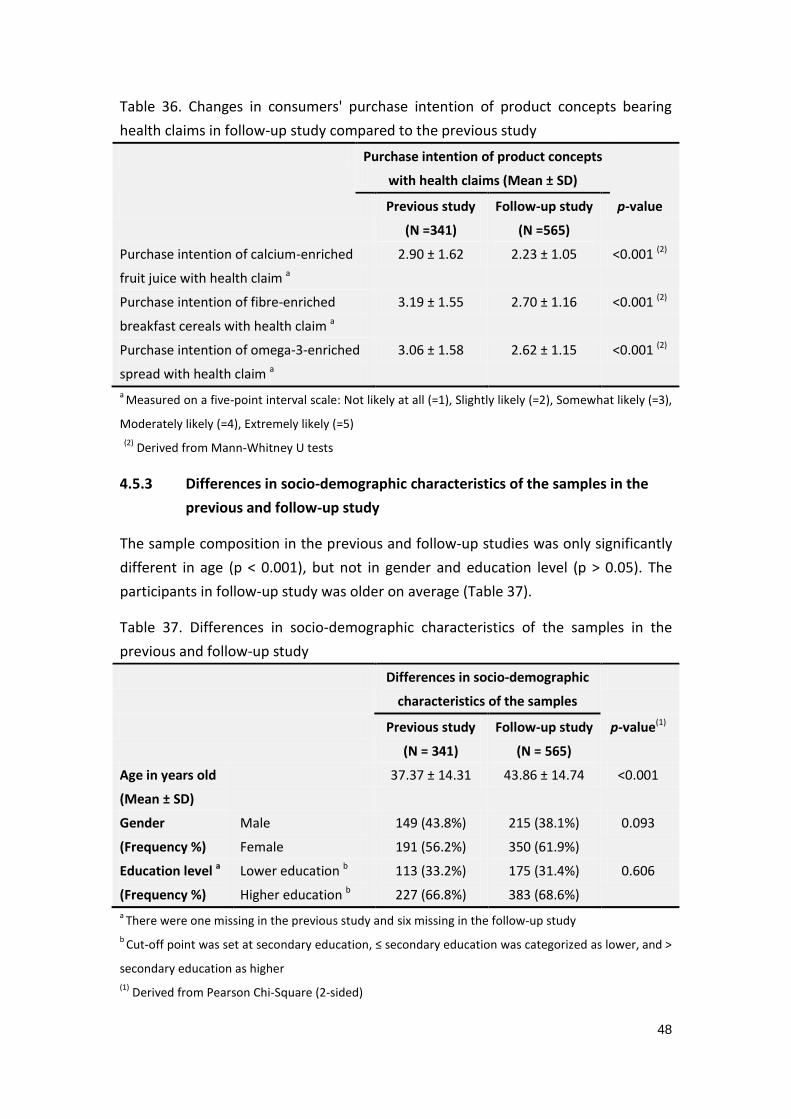
48
Table 36. Changes in consumers' purchase intention of product concepts bearing
health claims in follow-up study compared to the previous study
Purchase intention of product concepts
with health claims (Mean ± SD)
Previous study
(N =341)
Follow-up study
(N =565)
p-value
Purchase intention of calcium-enriched
fruit juice with health claim a
2.90 ± 1.62 2.23 ± 1.05 <0.001 (2)
Purchase intention of fibre-enriched
breakfast cereals with health claim a
3.19 ± 1.55 2.70 ± 1.16 <0.001 (2)
Purchase intention of omega-3-enriched
spread with health claim a
3.06 ± 1.58 2.62 ± 1.15 <0.001 (2)
a Measured on a five-point interval scale: Not likely at all (=1), Slightly likely (=2), Somewhat likely (=3),
Moderately likely (=4), Extremely likely (=5)
(2) Derived from Mann-Whitney U tests
4.5.3 Differences in socio-demographic characteristics of the samples in the
previous and follow-up study
The sample composition in the previous and follow-up studies was only significantly
different in age (p < 0.001), but not in gender and education level (p > 0.05). The
participants in follow-up study was older on average (Table 37).
Table 37. Differences in socio-demographic characteristics of the samples in the
previous and follow-up study
Differences in socio-demographic
characteristics of the samples
Previous study
(N = 341)
Follow-up study
(N = 565)
p-value(1)
Age in years old
(Mean ± SD)
37.37 ± 14.31 43.86 ± 14.74 <0.001
Gender
(Frequency %)
Male
Female
149 (43.8%)
191 (56.2%)
215 (38.1%)
350 (61.9%)
0.093
Education level a
(Frequency %)
Lower education b
Higher education b
113 (33.2%)
227 (66.8%)
175 (31.4%)
383 (68.6%)
0.606
a There were one missing in the previous study and six missing in the follow-up study
b Cut-off point was set at secondary education, ≤ secondary education was categorized as lower, and >
secondary education as higher
(1) Derived from Pearson Chi-Square (2-sided)
49
CHAPTER 5: DISCUSSION
This study aimed to get a realistic estimate of the levels of consumers' motivation
and ability to process health claims and symbols, and their relations with various
factors, as well as to serve as a follow-up study to illustrate the changes in
consumers' reactions to health claims in the last six years.
5.1 Consumers' motivation and ability to process health claims and symbols
The results showed that consumers were generally not highly motivated to process
health claims and symbols, no matter in general or product-specific, as suggested by
Gerrior (2010). In terms of ability, attributed to the extensive efforts of mass
communications through marketing activities or public health promotion
programmes, consumers expressed considerably high levels of knowledge and
understanding of health claims and symbols. However, the study sample of
volunteer participants might show different levels of subjective knowledge and
understanding than the general population (Cowburn & Stockley, 2005). Therefore,
the ability was studied in combination with a measurement of objective
understanding. In this study, consumers showed much higher objective
understanding of health symbols than of health claims. This finding was in line with
Cowburn & Stockley (2005), in which general consumers were able to correctly
locate and retrieve simple non-numerical information such as health symbols, but
they found technical wordings confusing, and did not truly understand the roles of
the food products or functional ingredients. Moreover, they could hardly
differentiate the subtle differences between the similar or related but actually
different technical wordings on health claims, which was also reported previously by
Trijp & van der Lans (2007).
5.1.1 Consumers' background attitudes
This study confirmed the findings of Armstrong et al. (2005) that consumers
generally reported to have high awareness of the link between diet and health. The
group of consumers with the highest awareness was also more motivated to process
health claims and symbols as according to Vyth et al. (2010), they perceived
themselves to have more knowledge and a higher understanding, as they might be
more interested and have processed more information as such.
The reported current usage was considerably low. Grunert and Wills (2007) found
that the reported use of health-related information tended to be higher than the
actual use, so the actual usage of health claims and symbols is expected to be quite
50
low. This could be due to the lack of motivation, which was related to the usage, and
it was reported as an important barrier impeding the usage of health-related
information (EUFIC, 2012). Lower usage was also significantly associated with lower
subjective knowledge, as subjective knowledge is an important predictor for
consumers' behaviour such as information processing and, further on, for food
choices (Verbeke, 2008).
Consumers who perceived functional foods as marketing scam tended to be less
favourable towards the products bearing claims (Verbeke et al., 2009). Perception of
health-related information as marketing gimmicks was a strong predictor of low
motivation to process health-related information (Bech-Larsen & Grunert, 2003;
Bech-Larsen & Scholderer, 2007).
Although it was not the main focus of this study, the results showed that not many
consumers were aware of or familiar with the legislation imposed on health claims
and symbols. Although health claims are stringently regulated and standardized,
while health symbols are not (European Commission, 2007), the majority of the
consumers in this study tended to perceive health claims as marketing gimmicks
instead of information that is strictly regulated.
5.1.2 Familiarity
Consumers expressed the highest familiarity with omega-3-enriched spread among
the three product concepts, which could be due to massive marketing activities with
the high availability of functional spread products on the market (van Kleef et al.,
2005). Consumers who were more familiar with product concepts reported to be
more motivated to process the health claims and symbols on the products. However,
a number of studies showed that consumers claimed to be more motivated when
they were unfamiliar with the products (Cowburn & Stockley, 2005), and early
studies reported higher levels of information processing occurring at moderate
product familiarity levels (Moorman, 1990).
Further analysis of consumers’ ability to process health-related information
confirmed the early findings. Increased product familiarity made consumers perceive
themselves as more able to process information. This raised the level of subjective
knowledge and perceived understanding (Moorman, 1990). However, it was not
related to the actual acquisition, comprehension and elaboration of the information,
so the level of objective understanding was not associated with familiarity (Park et
al., 1994). Besides, when consumers felt being more informed than they really were,
they tended to reduce processing, resulting in less actual information acquisition and
comprehension (Moorman, 1990).
51
5.1.3 Socio-demographic background
The results were generally consistent with previous findings, that females, and main
shoppers for food in households were more motivated to process health-related
information (Grunert et al., 2010; Krystallis, et al. 2008; Urala, 2005; Yoon & George,
2012), as females were generally more interested in healthy eating and health
(Bogue & Ryan, 2000; Childs & Poryzees, 1997) and main shoppers could be more
likely to feel responsible for food choices and consumption of household members.
Besides, consumers who were following health regimes and who have been
confronted with diet-related health problems were also more motivated, as they
were more likely to find health-related information more personally relevant (Dean
et al., 2012; Hoefkens & Verbeke, 2013). Grunert et al. (2010) found that gender was
not related to understanding, but females showed significantly higher subjective and
objective understanding than males in this study, which could be due to the higher
interest in healthy eating among females (Krystallis, et al., 2008), leading them to
actively search for or learn about health-related information.
With regard to age, the results were also generally in line with previous studies.
Older consumers were more motivated as they tended to have increased health
concerns (Yoon, & George, 2012). However, their levels of subjective and objective
understanding were lower than those of younger consumers (Yoon, & George, 2012).
As suggested by Moorman (1990), aging worsened their actual comprehension levels
of the information.
Some previous studies showed that consumers with a higher education level tended
to be more motivated and use health-related information more often (Anttolainen et
al., 2001; de Jong et al., 2004), while some showed the opposite, because the more
educated consumers may have thought that they had sufficient knowledge already
and were less motivated to search for additional information (Moorman, 1990). This
study found no significant relation between education level and motivation. The
more educated group showed a much higher objective understanding of health
claims, as according to Grunert et al. (2010). However, the more educated
consumers did not perceive themselves to have a higher understanding of the health
claims. Moorman (1990) suggested that education could increase knowledge, which
might as well increase awareness of what the consumers do not know, so that they
would rate themselves lower in terms of knowledge and understanding.
52
5.1.4 Relation between motivation and ability
The results were somewhat contrary to the expectations, but generally in line with
the findings of Moorman (1990), and Petty and Cacioppo (1986). Consumers'
motivation was positively associated with consumers' perceived ability to process
health claims and symbols, as reported by Moorman (1990). Generally, the ability
was reported to be higher when the consumers had a higher level of motivation as
well as the other way around (Petty and Cacioppo, 1986; Moorman, 1990). The
reciprocal effects of motivation and ability was also reported by Lutz et al. (1983).
Contrarily, this study found that the objective understanding of health claims and
symbols was not related to the level of motivation.
5.2 Consumers’ reactions towards health claims and symbols
The results concerning consumers' reactions confirmed the findings from previous
studies. Consumers' perceived credibility of health claims and symbols and purchase
intention for the corresponding functional food products both differed across
different claim–carrier combinations, as reported previously (van Kleef et al., 2005;
Verbeke et al., 2009). Cereals enriched with dietary fibre received the highest
perceived credibility and purchase intention, as it was a product commonly
considered as healthy, with a natural and familiar type of enrichment (Verbeke et al.,
2009). Omega-3-enriched spreads received medium level of perceived credibility,
and similarly high level of purchase intention to what fibre-enriched cereals received,
although it was a potentially less healthy product, probably because of the strong
health reputation of omega-3 established in recent years (Verbeke et al., 2009). Fruit
juice enriched with calcium received the lowest perceived credibility and purchase
intention, even though it was commonly perceived as a healthy product enriched
with the well-known qualifying nutrient (Grunert & Wills, 2007), as it was considered
a less natural combination which induced scepticism and more negative evaluations
of the claim–carrier combination (Hoefkens & Verbeke, 2013).
5.2.1 Relation to motivation and ability
In this study, consumers' motivation and subjective understanding were found to be
positively related to their perceived credibility and purchase intention in general.
Previous studies were not consistent in that regard. It was reported that consumers'
motivation was positively influenced by a higher perceived credibility of
health-related information and the types of information involved (Krystallis et al.,
2008). Yoon & George (2012) found that higher level of motivation and higher level
of subjective understanding lowered purchase intention, as the functional food
items were evaluated more unfavourably. Besides, when consumers’ subjective
53
knowledge and understanding was mainly the result of low trusted information
sources, such as mass-media coverage in the form of advertising (Verbeke, 2008),
the increase of this resulting subjective understanding was expected to lower
perceived credibility and purchase intention. In contrast, other studies showed that a
higher level of subjective understanding was positively associated with perceived
credibility and purchase intention (Urala & Lähteenmäki, 2004 ; Urala & Lähteenmäki,
2007).
5.3 The change of consumers' reactions six years after the implementation of EC
Regulation 1924/2006
The results indicated that there were no significant changes in perceived credibility,
but a decrease in purchase intention of product concepts compared to the previous
study (Verbeke et al., 2009). The sample of this follow-up study comprised older
participants on average. The results were contrary to the expectations, as credibility
was reported to be higher in younger age groups (Verbeke et al., 2009), and
purchase intention was higher in older age groups (Poulsen, 1999). The inconsistent
findings confirmed the conclusion of Verbeke et al. (2009), which stated that
socio-demographic background played a relatively minor role in consumers'
reactions. Consumers' reactions are influenced by various factors. Hoefkens and
Verbeke (2013) suggested that even consumers who had evaluated product
credibility positively may not intend to purchase the functional foods. Therefore, it
poses difficulties for functional food industries targeting particular market segments
(Verbeke, 2005; Verbeke et al., 2009).
The decrease in purchase intention could be the result of massive mass-media
coverage from low trusted information sources such as advertisements (Verbeke,
2008), causing consumers to perceive functional food products with health claims as
pure marketing gimmicks, undifferentiated from non-functional products without
health claims. Meanwhile, as a functional food market has been established for years,
consumers might have tried some of the products, yet they could not simply observe
or feel the health benefits (Caswell & Mojduszka, 1996), which could lower their
purchase intention.
5.4 Practical implications
The availability of correct health-related information from a scientific perspective is
only part of the solution for improved food choices. The success of the attempts to
improve food choices mainly depends on consumers' perceptions and behaviour
(Hieke & Taylor, 2012; Grunert & Wills, 2007; Moorman, 1990). Consumers need to
54
be motivated to process the information, truly understand the health benefits stated
and find it relevant to their personal health (Hoefkens & Verbeke, 2013).
Several implications can be drawn for both policymakers and food industries.
Currently, the Regulation focuses heavily on the context of claims such as wordings,
and distinction between claim types (van Trijp & van der Lans, 2007). However, the
results indicated a lack of correspondence between the Regulation, consumers'
perceptions and behaviour, and the actual market experiences. It puts in question
consumers’ awareness of this legislation and their behaviour towards this
scientifically-sound information, as well as the potential for this Regulation to
enlarge the European functional food market (Bech-Larsen & Scholderer, 2007). This
implies that more efforts in communication may be needed to inform consumers
about the existence and extent of this Regulation, and in education to establish
better consumer understanding of the links between nutrients and health-benefits.
For food industries, an important consideration is that additional and usually large
investments are required to obtain regulatory approval for health claims, yet, there
is no guarantee that the outcomes would be appealing enough. For health symbols,
though regulatory approval is not needed at this moment, food industries should
also take into account that consumers are generally sceptical about and not highly
motivated to process the health-related information on food products, so the
additional information as such on food products does not necessarily improve appeal
to consumers.
5.5 Limitations of the study and future research
The first limitation pertains to the claim or symbol-carrier combinations, with which
only three product concepts were evaluated. The health claims on product concepts
only included the enrichment of “positive” or qualifying nutrients, but no reduction
or omission of “negative” or disqualifying nutrients. Besides, there was a particular
active ingredient mentioned in every health claim example, but there were other
ingredients which give the same health benefits available in the market (e.g. other
than calcium, Vitamin D also contributes to the maintenance of normal bones (as
approved by EFSA)). Urala et al. (2003) reported that different active ingredients
might differ in terms of consumers' attitudes and familiarity, which could in turn
influence their perceptions of claims (van Trijp & van der Lans, 2007). Therefore, the
results of this study could neither be generalized to other food categories nor ones
with different symbols or different formulation of health claims (Verbeke et al.,
2009). It may be interesting for future studies to investigate different products,
different formulation of claims (e.g. different wordings or presentation format) and
symbols (e.g. different graphic or visual presentations) (Hoefkens & Verbeke, 2013).
55
Secondly, this study investigated the general population in Flanders, Belgium. Only
basic personal information was recorded from the subjects, i.e. up to the presence of
a diet-related medical history (see Survey in Appendix A). It did not account for
consumer groups with different socio-cultural backgrounds, or with particular
interests in functional foods (Pieniak et al., 2008). Owing to the regional scope and
specific characteristics of the study sample, generalisation to a wider population are
speculative.
Finally, a web-based survey with no real products or shopping settings was employed.
A hypothetical situation was created, in which consumers might have different
contexts in mind while evaluating the given product concepts. The design of this
study did not test interaction effects between different packaging designs, labelling,
brands, corporate images, etc. Besides, this study relied on self-reported data, as
most consumer research studies did. This provides valuable insights, but is often
subject to social desirability bias resulting in an under/over-reporting of the actual
behaviour (Fisher, 1993). Hence, observational and experimental studies are
recommended in the future, incorporating the use of real product settings and
shopping environments (Hoefkens & Verbeke, 2013), which enables the investigation
of potential interactions between different packaging designs, labelling, wordings or
visual presentations of health-related information, brands, corporate images, etc.
(van Trijp & van der Lans, 2007).
56
CHAPTER 6: CONCLUSION
Consumers' motivation and perceived ability to process health claims and symbols
were found to be correlated, and they were in general associated with various
consumers' characteristics, including their awareness of the link between diet and
health, perceptions and use of health claims and symbols, familiarity with specific
functional foods, socio-demographic background and diet-related medical history, as
well as their reactions, in terms of perceived credibility and purchase intention, to
functional foods bearing health claims or symbols. However, their ability in terms of
objective understanding was not related to motivation, consumers' reactions or
other characteristics, but only associated with socio-demographic background (see
Table 34 for summary).
Six years after the implementation of the Regulation, consumers have showed a
lower intention to purchase the functional products bearing health claims, which
could be due to the increased scepticism caused by the lack of correspondence
between the Regulation, consumers' perceptions and behaviour, and actual market
experiences. This has important implications for both policymakers and food
industries. Improved communication and education could be one of the essential
steps to align consumers' behaviour with the Regulation and its objectives through
changing their actual knowledge and perceptions. When there is no guaranteed
return from consumers, additional consideration would be recommended for food
industries to estimate if it remains worthwhile to invest extensively for placing this
health-related information on their functional food products.
57
REFERENCES
American Dietetic Association. (2006). Food and nutrition misinformation. Journal of the
American Dietetic Association, 106, 601-607.
American Dietetic Association. (2010). Functional foods: consumer attitudes, perceptions,
and behaviors in a growing market. Journal of the American Dietetic Association, 111, 804 -
810.
Annunziata, A., & Vecchio, R. (2011). Functional foods development in the European market:
A consumer perspective. Journal of Functional foods, 3, 223-228.
Anttolainen, M., Luoto, R., Uutela, A., Boice, J. D., Blot, W. J., McLaughlin, J. K., & Puska, P.
(2001). Characteristics of users and nonusers of plant stanol ester margarine in Finland: An
approach to study functional foods. Journal of the American Dietetic Association, 101,
1365–1368.
Ares, G., & Gambaro, A. (2007). Influence of gender, age and motives underlying food choice
on perceived healthiness and willingness to try functional foods. Appetite, 49, 148–158.
Armstrong, G., Farley, H., Gray, J. & Durkin, M. (2005) Marketing health-enhancing foods:
implications from the dairy sector. Marketing Intelligence & Planning, 23, 705–719.
Bech-Larsen, T., & Grunert, K. (2003). The perceived healthiness of functional foods: a
conjoint study of Danish, Finnish and American consumers’ perception on functional foods.
Appetite, 40, 9–14.
Bech-Larsen, T., & Scholderer, J. (2007). Functional foods in Europe: consumer research,
market experiences and regulatory aspects. Trends in Food Science & Technology, 18,
231–234.
Bogue, J., & Ryan, M. (2000). Market-oriented new product development: Functional foods
and the Irish consumer. Agribusiness Discussion Paper 27. Department of food economics.
Ireland: National University of Ireland.
Brucks, M. (1985). The effects of product class knowledge on information search behavior.
Journal of Consumer Research, 12, 1-16.
Caswell, J. A., & Mojduszka, E. M. (1996). Using informational labelling to influence the
market for quality in food products. American Journal of Agricultural Economics, 78,
1248–1253.
Childs, N. M., & Poryzees, G. H. (1997). Foods that help prevent disease: Consumer attitudes
and public policy implications. British Food Journal, 9, 419–426.
Cowburn, G., & Stockley, L. (2005) Consumer understanding and use of nutrition labelling: a
systematic review. Public Health Nutrition, 8, 21–28.
58
Dean, M., Lampila. P., Shepherd, R., Arvola, A., Saba, A., Vassallo, M., Claupein, E.,
Winkelmann, M., & Lähteenmäki, L. (2012). Perceived relevance and foods with
health-related claims. Food Quality and Preference, 24, 129-135.
de Jong, N., Simojoki, M., Laatikainen, T., Tapanainen, H., Valsta, L., Lahti-Koski, M. (2004).
The combined use of cholesterollowering drugs and cholesterol lowering bread spreads:
Health behaviour data from Finland. Preventive Medicine, 39, 849–855.
Drichoutis, A. C., Lazaridis, P., & Nayga Jr., R. M. (2005). Nutrition knowledge and consumer
use of nutritional food labels. European Review of Agricultural Economics, 32, 93–118.
EUFIC. (2012). New insights into nutrition labelling in Europe. EU Projects Supplement for
FLABEL. Retrieved from http://www.eufic.org/article/en/artid/New-insights-into-nutrition
-labelling-in-Europe/
European Commission. (2007). Regulation (EC) No 1924/2006 of the European Parliament
and of the Council of 20 December 2006 on nutrition and health claims made on foods.
Official Journal of the European Union, L 12/3–L 12/18.
Fisher, R.J. (1993). Social desirability bias and the validity of indirect questioning. Journal of
Consumer Research, 20, 303–315.
Gerrior, S. (2010). A nutrient profiling systems: are science and the consumer connected?
American Journal of Clinical Nutrition, 91, 1116-1117.
Gilsenan, M.B. (2011). Nutrition & health claims in the European Union: A regulatory
overview. Trends in Food Science & Technology, 22, 536-542.
Grunert, K., & Wills, J. (2007). A review of European research on consumer response to
nutrition information on food labels. Journal of Public Health, 15, 385–399.
Grunert, K. G., Wills, J. M., & Fernandez-Celemin L. (2010). Nutrition knowledge, and use and
understanding of nutrition information on food labels among consumers in the UK. Appetite,
55, 177-189.
Hieke, S., & Taylor, C. R. (2012). A critical review of the literature on nutrition labelling.
Journal of Consumer Affairs, 46, 120-156.
Hoefkens, C. & Verbeke, W. (2013). Consumers’ health-related motive orientations and
reactions to claims about dietary calcium. Nutrients, 5, 82-96.
Hooker, N. H., & Teratanavat, R. (2008). Dissecting qualified health claims: evidence from
experimental studies. Critical Reviews in Food Science and Nutrition, 48, 160–176.
Kanwar, R., Grund, L., & Olson, J. C. (1990). When Do the Measures of Knowledge Measure
What We Think They Are Measuring? Advances in Consumer Research, 17, 603-608.
Kardes, F. R., Posavac, S. S, & Cronley, M. L. (2004). Consumer inference: a review of
processes, bases, and judgment contexts. Journal of Consumer Psychology, 14, 230–256.
59
Krystallis, A., Maglaras, G., & Mamalis, S. (2008). Motivations and cognitive structures of
consumers in their purchasing of functional foods. Food Quality and Preference, 19, 525-538.
Lutz, R. J., MacKenzie, S.B., & Belch, G. E. (1983). Attitude toward the ad as a mediator of
advertising effectiveness: determinants and consequences. Advances in Consumer Research,
10, 532-539.
Maclnnis, D. J., Moorman, C., & Jaworski, B. J. (1991). Enhancing and measuring consumers'
motivation, opportunity, and ability to process brand information from ads. Journal of
Marketing, 55, 32-53.
Moorman, C. (1990). The effects of stimulus and consumer characteristics on the utilization
of nutrition information. Journal of Consumer Research, 17, 362–374.
Niva, M. (2007). ‘All foods affect health’: Understandings of functional foods and healthy
eating among health-oriented Finns. Appetite, 48, 384–393.
Park, C. W., Mothersbaugh, D. L., & Feick, L. (1994). Consumer Knowledge Assessment.
Journal of Consumer Research, 21, 71-82.
Patch, C., Williams, P. G., & Tapsell, L. (2005). Attitudes and intentions toward purchasing
novel foods enriched with omega-3 fatty acids. Journal of Nutrition Education and Behavior,
37, 235–241.
Petty, R. W., & Cacioppo, J. T. (1986). Communication and persuasion: central and peripheral
routes to attitude change. New York: Springer.
Pieniak, Z., Verbeke, W., Perez-Cueto, F., Brunsø, K., & De Henauw, S. (2008). Fish
consumption and its motives in households with versus without self-reported medical
history of CVD: a consumer survey from five European countries. BMC Public Health, 8, 306.
Poulsen, J. B. (1999). Danish consumers’ attitudes towards functional foods. Working paper
62. Denmark: The Arhus School of Business.
Rao, & Wanda, A. S. (1992). The effect of prior knowledge on price acceptability and the type
of information examined. Journal of Consumer Research, 19, 256-270.
Schiffman, L. G., Lazarkanuk, L. & Hansen, H. (2008). Credibility. Consumer Behaviour: A
Global Outlook. England: Pearson Education.
Siro, I., Kapolna, E., Kapolna, B., & Lugasi, A. (2008). Functional food. Product development,
marketing and consumer acceptance. Appetite, 51, 456–467.
SPSS Inc. (2012). SPSS Software, version 20.1. Chicago, IL, USA: IBM SPSS Inc.
Teratanavat, R., & Hooker, N. H. (2006). Consumer valuations and preference heterogeneity
for a novel functional food. Journal of Food Science, 71, 533–541.
Urala, N., & Lähteenmäki, L. (2004). Attitudes behind consumer’s willingness to use
functional foods. Food Quality and Preference, 15, 793–803.
60
Urala, N., & Lähteenmäki, L. (2006). Hedonic ratings and perceived healthiness in
experimental functional food choices. Appetite, 47, 302–314.
Urala, N., & Lähteenmäki, L. (2007). Consumers’ changing attitudes towards functional foods.
Food Quality and Preference, 18, 1–12.
van Kleef, E., van Trijp, H. C. M., & Luning, P. (2005). Functional foods: health claim-food
product compatibility and the impact of health claim framing on consumer evaluation.
Appetite, 44, 299–308.
van Trijp, H. C. M., & van der Lans, I. A. (2007). Consumer perceptions of nutrition and health
claims. Appetite, 48, 305–324.
Verbeke, W. (2005). Consumer acceptance of functional foods: Sociodemographic, cognitive
and attitudinal determinants. Food Quality and Preference, 16, 45–57.
Verbeke, W. (2008). Impact of communication on consumers' food choices. Proceedings of
the Nutrition Society, 67, 281-288.
Verbeke, W. (2010). Consumer reactions to foods with nutrition and health claims. Agro
Food industry hi-tech, 21, 5-8.
Verbeke, W., Scholderer, J., & Lähteenmäki, L. (2009). Consumer appeal of nutrition and
health claims in three existing product concepts. Appetite, 52, 684–692.
Vyth, E. L., Steenhuis, L. H. M, , Vlot, J. A., Wulp1, W. A., Hogenes, M. A., Looije, D. H., Brug, J.,
& Seidell, J. C. (2010). Actual use of a front-of-pack nutrition logo in the supermarket,
consumers' motives in food choice. Public Health Nutrition, 13, 1-8.
Whitlar, D.B., Geurts, M.D., & Swenson, M.J. (1993). New product forecasting with a
purchase intention survey. The Journal of Business Forecasting Methods Systems and
Systems, 12, 1-18.
Williams, P. G. (2005). Consumer understanding and use of health claims for foods, Nutrition
Reviews, 63, 256-264.
Williams, P. G., Ridges, L., Batterham, M., Ripper, B., & Hung, M. C. (2008). Australian
consumer attitudes to health claim—food product compatibility for functional foods. Food
Policy, 33, 640–643.
Yoon., H. J., & George, T. (2012). Nutritional information disclosure on the menu
International. Journal of Hospitality Management, 31, 1187– 1194.
Zimmer, J.C., Arsal, R., Al-Marzouq, M., Moore, D., & Grover, V. (2010). Knowing your
customers: Using a reciprocal relationship to enhance voluntary information disclosure.
Decision Support Systems, 48, 395–406.