Embed Size (px)
Citation preview
Louisiana State UniversityLSU Digital Commons
LSU Master's Theses Graduate School
2003
Consumer perception and application of ediblecoatings on fresh-cut fruits and vegetablesSirisha SontiLouisiana State University and Agricultural and Mechanical College, [email protected]
Follow this and additional works at: https://digitalcommons.lsu.edu/gradschool_theses
Part of the Life Sciences Commons
This Thesis is brought to you for free and open access by the Graduate School at LSU Digital Commons. It has been accepted for inclusion in LSUMaster's Theses by an authorized graduate school editor of LSU Digital Commons. For more information, please contact [email protected].
Recommended CitationSonti, Sirisha, "Consumer perception and application of edible coatings on fresh-cut fruits and vegetables" (2003). LSU Master'sTheses. 2225.https://digitalcommons.lsu.edu/gradschool_theses/2225

CONSUMER PERCEPTION AND APPLICATION OF EDIBLE COATINGS ON FRESH-CUT FRUITS AND VEGETABLES
A Thesis
Submitted to the Graduate Faculty of the Louisiana State University and
Agricultural and Mechanical College In partial fulfillment of the
Requirements for the degree of Master of Science
In
The Department of Food Science
By Sirisha Sonti
B.S., Osmania University College of Technology, 2000 May 2003

ii
ACKNOWLEDGEMENTS
I am grateful to Dr. Witoon Prinyawiwatkul, my Major Professor, who has
advised and guided me throughout my research. I want to thank my other committee
members, Dr. Jefferey Gillespie and Dr. J. Samuel Godber for their insights.
I would like to thank all my family members, especially my elder brother, Naresh
K. Sonti, who has helped me with my education and every aspect of my life and my
fiancé, Vijay K. Davuluri, for being there for me whenever I needed him. I also offer my
thanks to Rebecca Braud who helped me tremendously throughout my thesis. Without
her help this research would not have been possible.
I would like to thank Brett W. Craig and Ronald Ward for their understanding and
helping nature. I also offer thanks to Dr. Kay H. McWatters, who helped me do the
survey in University of Georgia, Dr. Marlene Janes, for allowing me to use her
microbiology laboratory, Richelle Beverly and Siow Ying Tan for helping me do the
survey in the Churches of Baton Rouge.
I also offer my thanks to Kandasamy Nadarajah, Sandeep Bhale, Sireesha
Bhattiprolu and Ashish Nimbarte for he lping in distributing the questionnaires in the first
study and product preparation during the second study.

iii
TABLE OF CONTENTS ACKNOWLEDGEMENTS ..............................................................................................ii LIST OF TABLES ...........................................................................................................vi LIST OF FIGURES .......................................................................................................viii ABSTRACT.....................................................................................................................ix CHAPTER 1. INTRODUCTION .....................................................................................1 CHAPTER 2. LITERATURE REVIEW ..........................................................................4
2.1. Fresh-cut Produce ...........................................................................................4 2.2. Problems with Whole and Fresh-cut Produce.................................................4 2.2.1. Problems with Some Whole Fruits and Vegetables..............................5 2.2.2. Problems with Fresh-cuts......................................................................6 2.3. Techniques Being Used to Preserve the Quality of the Produces and Their
Disadvantages .................................................................................................7 2.3.1. Low Temperature, High Relative Humidity....................................8 2.3.2. Modified Atmosphere Packaging (MAP) & Controlled Atmosphere
Packaging (CAP)..............................................................................8 2.3.3. Fungicides ........................................................................................9 2.3.4. Chemical Preservatives....................................................................9 2.3.5. Plastic Films ...................................................................................10
2.4. Other Possible Techniques............................................................................10 2.4.1. Edible Coatings and Films .............................................................11 2.4.1.1. Edible Coatings ...............................................................12 2.4.1.2. Edible Films ....................................................................12 2.5. Types of Edible Coatings and Films .............................................................13 2.5.1. Polysaccharide Based Coatings and Films ....................................14 2.5.2. Protein Based Coatings and Films ................................................14 2.5.3. Lipid Based Coatings and Films ....................................................15 2.5.4. Composite Coatings and Films ......................................................15 2.6. Advantages of Edible Coatings and Films ....................................................16 2.7. Disadvantages of Edible Coatings and Films ...............................................17 2.8. Effect of Edible Coatings and Films on Physical, Chemical, Sensory,
physiological Quality and Shelf- life of Fruits and Vegetables .....................18 2.8.1. Apple Wraps ..................................................................................18 2.8.2. Cellulose-based Coatings ............................................................. 18 2.8.3. NatureSeal® (NS) ......................................................................... 19
2.8.4. Chitosan Coatings ..........................................................................19 2.8.5. Corn-zein Coatings ........................................................................22
2.8.6. Mineral Oil Based Coatings ...........................................................23 2.8.7. Wax Coatings .................................................................................23 2.8.8. Milk Protein Coatings ....................................................................24

iv
2.8.8.1. Whey Protein Coatings ............................................... 24 2.8.8.2. Casein Coatings ............................................................25
2.8.9. Mineral Oil and Wax Coatings ......................................................26 2.8.10. Carbohydrate – Lipid Coatings ......................................................26 2.8.11. Sucrose Ester Coating ....................................................................26 2.8.11.1. Pro-long........................................................................26 2.8.11.2. Semperfresh .................................................................28
2.9. Thickness of Films or Coatings ....................................................................29 2.10. Additives and Their Applications .................................................................29
CHAPTER 3. A SURVEY ON CONSUMER ACCEPTANCE AND PREFERENCE OF FRESH-CUT FRUITS AND VEGETABLES WITH OR WITHOUT EDIBLE COATINGS ....................................................................................................................31
3.1. Introduction...................................................................................................31 3.2. Objectives......................................................................................................32 3.3. The Survey Procedure ...................................................................................33
3.3.1. Econometric Analysis .................................................................. 34 3.4. Results ...........................................................................................................35
3.4.1. Consumer Characteristics ..............................................................35 3.4.2. Comparison of Consumer Preferences of Different Forms of Fruits and Vegetables ...............................................................................37 3.4.3. Frequency of Use of FCFV Based on Age and Gender
Characteristics ................................................................................38 3.4.4. Consumer Perception of Edible Coatings ......................................41
3.4.5. Probit Analysis for Demographic Variables ..................................42 3.5. Discussions ....................................................................................................53 3.6. Limitations ....................................................................................................55 CHAPTER 4. PHYSICAL AND MICROBIAL QUALITY OF FRESH-CUT APPLES COATED WITH WHEY PROTEIN ..............................................................................57
4.1. Introduction................................................................................................. 57 4.2. Objective .................................................................................................... 58 4.3. Materials and Methods..................................................................................59 4.3.1. Preparation of Solutions.................................................................59 4.3.2. Preparation of Apple Pieces ...........................................................60 4.3.3. Color Analysis ................................................................................61 4.3.4. Texture Analysis .......................................................................... 62 4.3.5. Microbial Analysis .........................................................................63 4.3.6. Weight Loss Analysis ....................................................................64 4.3.7. Statistical Analysis .........................................................................64 4.4. Results and Discussions ................................................................................65
CHAPTER 5. CONCLUSIONS .................................................................................... 74 CHAPTER 6. RECOMMENDED FUTURE WORK ....................................................77

v
REFERENCES ...............................................................................................................78 APPENDIX A. CONSUMER QUESTIONNAIRE FOR THE FIRST STUDY............89 APPENDIX B. DATA ANALYSIS ...............................................................................97
a. SAS Code..........................................................................................98 b. Limdep Code.....................................................................................99
APPENDIX C. DATA SET FOR THE SECOND STUDY .........................................100 a. A Data Set for Color Values of Coated Fresh-Cut Apples .............101 b. A Data Set for Microbial Growth on Coated Fresh-Cut Apples ....107 c. A Data Set for Firmness Values of Coated Fresh-Cut Apples........111 d. A Data Set for Weight Loss of Coated Fresh-Cut Apples ..............118
APPENDIX D. GRAPHS FOR THE SECOND STUDY ............................................125
a. Effect of Treatments on the L* Values of the Cut Apples..............126 b. Effect of Treatments on the a* Values of the Cut Apples ..............126 c. Effect of Treatments on the b* Values of the Cut Apples ..............127 d. Effect of Treatments on the Chroma Values of the Cut Apples .....127 e. Effect of Treatments on the Hue Angle Values of the Cut Apples.128 f. Effect of Treatments on the Weight Loss of the Cut Apples ..........128 g. Effect of Treatments on the Firmness Loss of the Cut Apples .......129 h. Effect of Treatments on the Total Plate Count of the Cut Apples ..129 i. Effect of Treatments on the E.coli/ Coliform Counts of the Cut
Apples .............................................................................................130 APPENDIX E. EXPERIMENTAL DESIGN ...............................................................131 VITA .............................................................................................................................133

vi
LIST OF TABLES
Table 1. Socio-economic and demographic data of the respondents (n = 611) ......... 35 Table 2. Chi-square values for preference of FCFV to canned, frozen-cut and whole FV by age ................................................................................... 37 Table 3. Variables coded for Probit analysis ............................................................. 42 Table 4. Coefficients, standard errors and probability values of the demographic variables for the question “Do you eat/use whole/raw/unprocessed fruits and vegetables?”..................................................................................44 Table 5. Coefficients, standard errors and probability values of the demographic variables for the question “Do you eat/use frozen-cut fruits and vegetables?” ...........................................................................................44 Table 6. Coefficients, standard errors and probability values of the demographic variables for the question “Do you eat/use canned fruits and vegetables?” ...........................................................................................45 Table 7. Coefficients, standard errors and probability values of the demographic variables for the question “Do you eat/use fresh-cut fruits and vegetables?”..................................................................................................46
Table 8. Coefficients, standard errors and probability values of the demographic variables for the question “Do you generally prefer FCFV to canned FV?”..............................................................................................................47 Table 9. Coefficients, standard errors and probability values of the demographic variables for the question “What price would you be willing to pay for FCFV compared to canned FV (on a per pound basis)? ...............................47 Table 10. Coefficients, standard errors and probability values of the demographic
variables for the question “Do you generally prefer FCFV to frozen-cut FV?”..............................................................................................................48
Table 11. Coefficients, standard errors and probability values of the demographic variables for the question “What price would you be willing to pay for FCFV compared to frozen-cut FV (on a per pound basis)? ..........................49
Table 12. Coefficients, standard errors and probability values of the demographic
variables for the question “Do you generally prefer FCFV to whole/ raw/ unprocessed FV?”.........................................................................................49
vii
Table 13. Coefficients, standard errors and probability values of the demographic variables for the question “What price would you be willing to pay for FCFV compared to whole/unprocessed FV (on a per pound basis)?”..........50
Table 14. Coefficients, standard errors and probability values of the demographic variables for the question “Have you heard about edible coatings and films?”...........................................................................................................51
Table 15. Coefficients, standard errors and probability values of the demographic variables for the question “Would you be willing to pay a higher price for FCFV than whole/raw/unprocessed FV if they were more convenient?” ...51
Table 16. Coefficients, standard errors and probability values of the demographic variables for the question “Would you buy FCFV coated with an edible film that is safe for consumption?”...............................................................52 Table 17. Coefficients, standard errors and probability values of the demographic variables for the question “After knowing the what edible coatings and films are, would you buy FCFV coated with an edible film that is safe for consumption?” ..............................................................................................53 Table 18. Coefficients, standard errors and probability values of the demographic
variables for the question “What price would you be willing to pay for coated FCFV compared with whole/raw/unprocessed FV on a per pound basis?”.......................................................................................54
Table 19. Effect of coating treatments on weight loss (%) of coated fresh-cut apples.65 Table 20. Effect of coating treatments on firmness loss (reported as shear force in kg) of coated fresh-cut apples..................................................................................66 Table 21. Effect of coating treatments on total plate count (log CFU/g) of coated fresh- cut apples.......................................................................................................67 Table 22. Effect of coating treatments on L* values of coated fresh-cut apples ..........68 Table 23. Effect of coating treatments on a* values of coated fresh-cut apples ...........69 Table 24. Effect of coating treatments on chroma values of coated fresh-cut apples...70 Table 25. Effect of coating treatments on hue angle values of coated fresh-cut apples71 Table 26. Effect of coating treatments on b* values of coated fresh-cut apples...........72

viii
LIST OF FIGURES
Figure 1. Preference of FCFV to frozen-cut FV by age ...............................................38
Figure 2. Frequent use of FCFV based on age group ...................................................39
Figure 3. Frequency of use of FCFV by different age groups of females....................39
Figure 4. Frequency of use of FCFV by different age groups of males .......................40
Figure 5. Frequency of use of FCFV based on family size ..........................................40
ix
ABSTRACT
Plasticized whey protein coatings have been shown to extend the shelf life of
fresh produce. This thesis research was designed to determine consumer acceptance and
perception of fresh-cut fruits and vegetables (FCFV) and edible coatings (EC) and to
determine effects of plasticized whey protein coatings on quality of fresh-cut apples. Two
studies were conducted. In the first study, a questionnaire on FCFV and EC was prepared
and completed by 611 consumers. The data were analyzed using Probit analysis. In the
second study, physical and microbial quality of fresh-cut (FC) apples coated with three
whey proteins (30% glycerol added) each at 5% and/or 10% concentrations and water (as
control), were determined during 13-day storage at 2°C. Consumers (30%) preferred
commercially available FCFV to whole FV due to less preparation time and serving
portions. Females were more likely to consume/use FCFV than males. Hispanic/Spanish
consumers were less likely to consume/use FCFV compared to Caucasians. As an income
level decreased the probability of eating/using FCFV decreased and preference for
canned FV to FCFV increased. Compared to Caucasians, Asians were more and
Hispanic/Spanish were less aware of EC. Some consumers would not buy coated FCFV
if coating materials were of animal origins. A 7% increase in purchase intent was
observed after advantages of EC had been described to consumers. The 10%WPC
coating was most effective in minimizing weight loss. There were no changes in color
lightness of apples coated with WPC/WPI, whereas significantly decreased lightness was
observed for control and PHWPC coated samples by the fourth day of storage. Firmness
of coated samples did not change after 13-day storage compared to that of the control,
which was undesirably soft. Overall, the total plate count ranged from 0-0.54logCFU/g

x
for 10-days storage and no E.coli/Coliforms were detected. This study demonstrates
potential of WPC as an EC for FC apples and helps the food industry meet consumer and
market demand regarding FCFV.

1
CHAPTER 1. INTRODUCTION
Fresh-cut produce sales are estimated to be $10 billion, which is 10% of the total
produce sales (Bett et al., 2001). Today’s consumer is demanding for foods that require
minimal process, for example, fresh-cut fruits and vegetables (FCFV). This is mainly
because of busy lifestyles, an increase in health consciousness and increased purchasing
power of the consumer (Siew et al., 1999; Baldwin et al., 1995). This was not the case a
few years back. The food service industry and restaurants were the major users of
minimally processed fruits and vegetables (Watada et al., 1996). The reason for their use
was to reduce the manpower and control the waste generated.
Minimally processed foods are highly nutritious but highly perishable. Removing
the skin from the surface or altering the size leads to leakage of nutrients, accelerated
enzymatic reactions, rapid microbial growth, color change, texture change and weight
losses, resulting in deteriorated quality of the product.
Many techniques have been studied in order to overcome these problems and
extend the shelf life of fresh produce, for example, low temperature and high relative
humidity, controlled and modified atmosphere packaging, etc. But each has advantages
and disadvantages, with later the predominating. The maintenance of the quality of fresh
produce is still a major challenge for the food industry.
Edible coatings have many advantages over other techniques, but only when the
coated produces are stored at proper temperatures, which depends on the commodity.
They can act as moisture and gas barriers, control microbial growth, preserve the color,
texture and moisture of the product, and can effectively extend the shelf life of the
product. These coatings have their disadvantages too. But these can be avoided by adding

2
food grade additives to change their composition and improve properties of coatings or
films, which when applied on produce improve its quality.
Whey proteins have been extensively studied, and are known to be good gas and
solute barriers, but have poor moisture barrier properties. Adding plasticizers such as
sorbitol or glycerol makes the protein-based film more resistant to moisture transfer.
Research has been conducted on these films and their application on fresh whole produce,
but little has been known about their application on fresh-cut fruits and vegetables and
consumer acceptance of fresh-cut fruits and vegetables either uncoated or coated with an
edible coating.
Two studies were performed. The first study involved a survey to understand the
consumer acceptance and preference of fresh-cut fruits and vegetables with or without an
edible coating. The second study involved quality evaluation of fresh-cut apples coated
with three different types of whey protein solutions (whey protein concentrate, whey
protein isolate and partially hydrolyzed whey protein concentrate).
In the first study, a questionnaire was prepared and completed by students, faculty
and a few citizens of Louisiana and Georgia (n=611). The responses were analyzed using
Probit analysis. In the second study, plasticized whey protein solutions were prepared at
5% and/or 10% concentrations, and applied to freshly cut Fuji apples, and the quality and
shelf life were studied during 13 days of storage at 2°C.
This thesis is divided into 7 chapters. Chapter one provides a brief introduction
and the research justification. Chapter two presents the literature review related to the
study. Chapter three is a consumer study reporting the consumer responses towards fresh-
cut fruits and vegetables with or without an edible coating. Chapter four presents the

3
physical and microbial quality of fresh-cut apples coated with an edible coating during a
13-day storage at 2°C. Chapter five presents the conclusions of this research and chapter
suggests the opportunities for future research. The last section includes a list of references
cited for this thesis, followed by the appendices.

4
CHAPTER 2. LITERATURE REVIEW
2.1 Fresh-cut Produce
“Fresh-cut (FC)” produce is defined as, any fresh fruit or vegetable or any
combination thereof that has been physically altered from its original form, but has not
been processed by treatments such as heat or chemical preservative and remains in a fresh
state (Garrett, 1997; King and Bolin, 1989). Fresh-cut produce includes peeled, trimmed,
washed, cored, sliced/cut but still uncooked fruits and vegetables (Baldwin et al., 1996;
Lindsay et al., 1999). Fresh-cut vegetables are known as ready-to-use, lightly processed,
partially processed, fresh processed or minimally processed products (Carlin et al., 1990;
Watada et al., 1996; Cantwell, 2002).
2.2 Problems with Whole and Fresh-cut Produce
Minimal processing results in a convenience product, but it reduces the shelf life.
As a result, the maintenance of quality is a challenge to the rapidly expanding minimal
processing sector (Jiang and Joyce, 2002).
Fresh-cut products are highly perishable, the main reasons being the removal of
skin (the natural protective layer) from their surface area and the physical stress they
undergo, while peeling, cutting, slicing, shredding, trimming, coring, etc. (Watada et al.,
1996; Rolle and Chism, 1987). Wounding results in increased production of ethylene,
surface water activity, weight loss and respiration rates (Baldwin et al., 1995; Watada et
al., 1996). It also results in cell wall breakdown (which leads to undesirable enzymatic
reactions), leakage of ions and other cellular components, loss of moisture (Baldwin et
al., 1995) and finally results in decreased shelf life (Baldwin et al., 1996; Avena-
Bustillos et al., 1994; Baldwin et al., 1995; Jiang and Joyce, 2002; Watada et al., 1996;

5
Lindsay et al., 1999). If not controlled these changes can lead to rapid senescence and
deterioration of the product (Baldwin et al., 1995). Consequently fresh-cut produce
should be maintained at lower temperatures than that recommended for whole fruits and
vegetables (Watada et al., 1996). But even during refrigerated storage the fresh fruits and
vegetables are characterized by active metabolism (Guilbert et al., 1996).
Brecht (1995) indicated that some of the factors affecting the intensity of
wounding are species, variety, maturity index, temperature, oxygen and carbon dioxide
concentrations and water vapor pressure. Research in all of these areas is needed to
ensure that wholesome, high quality FC products are marketed to consumers (Watada et
al., 1996).
2.2.1. Problems with Some Whole Fruits and Vegetables
Banana: i) Rapid quality deterioration of the fruit and ii) Enzymatic browning
(Ben-Yehoshua, 1966).
Bell pepper: i) Decay and textural changes (Miller et al., 1983); ii) Shriveling,
Flaccidity (due to water loss), and wilting (Miller et al., 1983;
Lerdthanangkul and Krochta, 1996); iii) High humidity increases bacterial
soft rot and iv) Low temperatures cause chilling injury and increase in
alternaria rot (Miller et al., 1983).
Broccoli: i) Moisture loss and ii) Opening of yellow flowers (Hardenburg, 1949).
Citrus fruit: i) Water vapor loss, resulting in peel shrinkage, reduction of turgidity and
decrease in resistance to gas diffusion, with negative consequences on the
flavor and taste (D’Aquino et al., 2001); ii) Decay; iii) Transpiration and
iv) Respiration (Purvis, 1983).

6
Lime: i) Weight loss; ii) Degreening and iii) Fungal attack (Motlagh and
Quantick, 1998).
Litchi: i) Desiccation; ii) Browning; iii) Decays and iv) Loss of flavor (Zhang
and Quantick, 1997).
Tomatoes: i) Limited shelf life; ii) Weight loss (Tasdelen and Bayindirli, 1998); iii)
Physiological disorders and iv) Physical injuries (El Ghaouth et
al.,1992b).
2.2.2. Problems With Fresh-cuts
Minimally Processed Carrots: i) Formation of a whitish, dried appearance
on the surface of peeled carrots; ii) Storage rot and quality deterioration;
iii) decreased degradation of carbohydrates and lipids and development of
off- flavors due to increased respiration; iv) development of bitter flavor
and v) carotene loss (Li and Barth, 1998; Cheah et al., 1997; Ghaouth et
al., 1991; Howard and Dewi, 1995; Avena-Bustillos et al., 1994; Krochta,
et al., 1993; Chen et al., 1996).
Fresh-cut Apples: i) Enzymatic browning; ii) Undesirable changes in flavor and texture
and iii) Loss of nutrients and moisture (McHugh and Senesi, 2000).
Minimally Processed Onions: i) Odor volatiles and ii) Development of pink
discoloration (Howard et al., 1994).
Fresh-cut Pears: i) Tissue softening and ii) Surface browning (Gorny and Kader, 1997).
Fresh-cut Lettuce: i) Browning; ii) Microbial growth (Watada and Qi, 1999) and iii)
High respiration rates (Watada et al ., 1996).
Fresh-cut Cabbage: i) Browning and ii) Microbial growth (Watada and Qi, 1999).
7
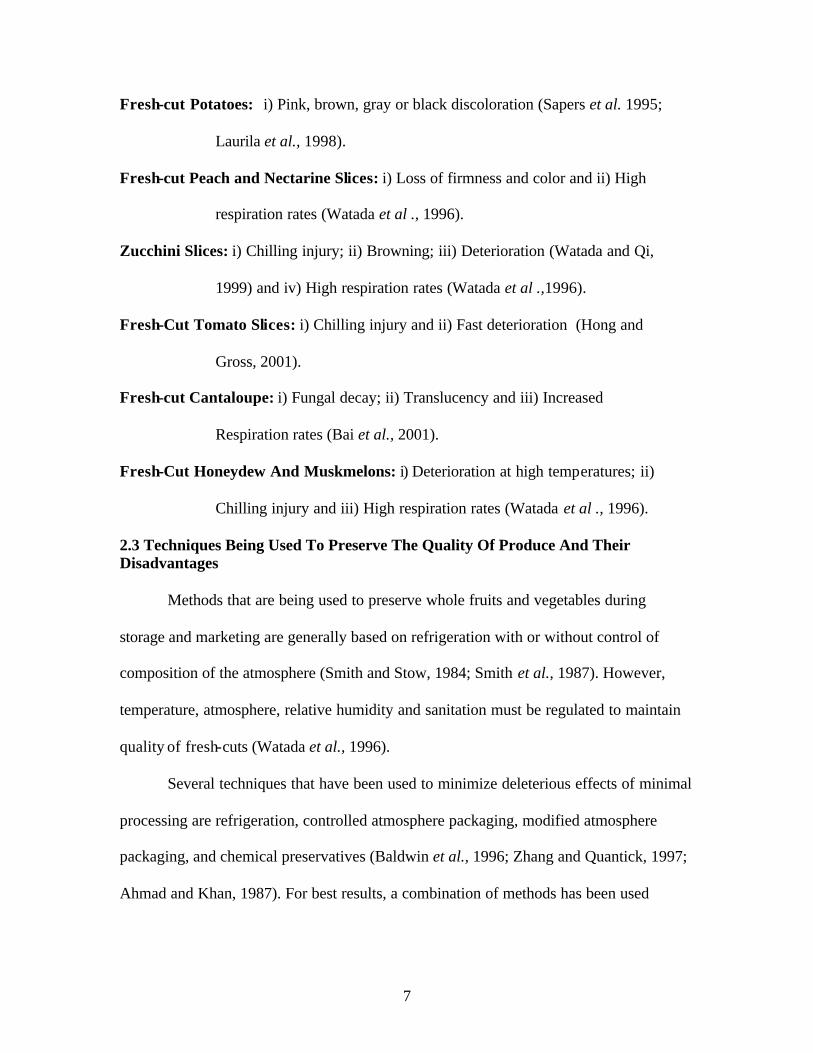
Fresh-cut Potatoes: i) Pink, brown, gray or black discoloration (Sapers et al. 1995;
Laurila et al., 1998).
Fresh-cut Peach and Nectarine Slices: i) Loss of firmness and color and ii) High
respiration rates (Watada et al ., 1996).
Zucchini Slices: i) Chilling injury; ii) Browning; iii) Deterioration (Watada and Qi,
1999) and iv) High respiration rates (Watada et al .,1996).
Fresh-Cut Tomato Slices: i) Chilling injury and ii) Fast deterioration (Hong and
Gross, 2001).
Fresh-cut Cantaloupe: i) Fungal decay; ii) Translucency and iii) Increased
Respiration rates (Bai et al., 2001).
Fresh-Cut Honeydew And Muskmelons: i) Deterioration at high temperatures; ii)
Chilling injury and iii) High respiration rates (Watada et al ., 1996).
2.3 Techniques Being Used To Preserve The Quality Of Produce And Their Disadvantages
Methods that are being used to preserve whole fruits and vegetables during
storage and marketing are generally based on refrigeration with or without control of
composition of the atmosphere (Smith and Stow, 1984; Smith et al., 1987). However,
temperature, atmosphere, relative humidity and sanitation must be regulated to maintain
quality of fresh-cuts (Watada et al., 1996).
Several techniques that have been used to minimize deleterious effects of minimal
processing are refrigeration, controlled atmosphere packaging, modified atmosphere
packaging, and chemical preservatives (Baldwin et al., 1996; Zhang and Quantick, 1997;
Ahmad and Khan, 1987). For best results, a combination of methods has been used

8
(Drake et al., 1987). But there have been some disadvantages with these techniques,
which are listed below:
2.3.1. Low Temperature, High Relative Humidity
The most prevalent method in maintaining quality or controlling decay in fruits
and vegetables is rapid cooling at a low temperature with high relative humidity
(Ghaouth et al., 1991). Since it causes chilling injury in fruits and vegetables (El Ghaouth
et al., 1992b; Krochta and Mulder-Johnston, 1997) and effective control of temperature is
difficult, other means of preservation have been sought, for example, modified
atmosphere packaging (MAP), controlled atmosphere packaging (CAP), fungicidal
treatment, etc. (Ghaouth et al., 1991). Also, low temperature storage is not economically
feasible in most developing countries (Li and Yu, 2000; Smith et al., 1987).
2.3.2. Modified Atmosphere Packaging (MAP) & Controlled Atmosphere Packaging (CAP)
MAP has been used to extend the postharvest shelf life of fruits by reducing
respiration rate and delaying senescence (Drake et al., 1987). However, it causes
anaerobiosis, and the fruit fails to ripen properly (El Ghaouth et al., 1992b). Research has
been conducted on the optimum storage atmosphere for fresh whole produce, but limited
information is available on optimum atmosphere for fresh-cut produce (Gunes et al.,
2001).
CAP is helpful in extending shelf life of several whole fruits and vegetables but
cannot be used with FC products because of the short handling period (Ahmad and Khan,
1987; Watada et al., 1996). Respiration of the product becomes anaerobic when oxygen
levels decline (McHugh and Senesi, 2000; El Ghaouth et al., 1992a; Howard and Dewi,
1995; Li and Barth, 1998; Nisperos-Carriedo et al., 1992). Therefore, restriction of

9
oxygen leads to accumulation of ethyl alcohol or anaerobic metabolism that leads to off –
flavors (Purvis 1983).
CAP and MAP are not economically feasible in most developing countries (Li
and Yu 2000), and they require the attention of skilled operators (Park et al., 1994). Since
these techniques often involve high capital and maintenance costs (Krochta and Mulder-
Johnston, 1997) and require relatively skilled operators, it may be uneconomical to store
small quantities of fruit in such stores; furthermore, regular inspection of fruit is difficult
(Smith and Stow, 1984; Smith et al., 1987). Once the fruit is removed, it is again
subjected to air and ambient temperature, which can result in a rapid loss of quality.
2.3.3. Fungicides
Fungicides control postharvest decay of whole fruits, but they leave residues and
a number of tolerant pathogens can grow. As they are not safe for consumption they
cannot be used on fresh-cuts. They leave residues that are potential risks to humans and
the environment (Li and Yu 2000). Thus, natural products that could replace fungicides
are being explored (Zhang and Quantick, 1998).
2.3.4. Chemical Preservatives
Many consumers are suspicious of chemicals in their foods, especially in fresh-cut
fruits and vegetables (Baldwin et al., 1996). Sulfites were effective chemical preservative
as they were both inhibitors of enzymatic browning and antimicrobial. But their use has
been banned due to adverse reaction in consumers (Baldwin et al., 1996, Kim et al.,
1993). Moreover, chemical preservatives affect the flavor of fresh-cut fruits (Rocha et al.,
1998).

10
2.3.5. Plastic Films
Plastic films are effective in reducing desiccation (moisture loss), but are sub ject
to microbial growth and disposal problems (Zhang and Quantick, 1997; Lerdthanangkul
and Krochta, 1996).
2.4. Other Possible Techniques
The disadvantages of the techniques being used to preserve fresh-cuts and
increasing environmental concerns (Guilbert et al., 1996; Arvanitoyannis and Gorris,
1999) have created an urgency for the invention of alternative packaging techniques such
edible coatings. Many years of research are conducted to develop a material that would
coat fruit so that an internal modified atmosphere would develop (Park et al., 1994).
Studies have shown that ripening can be retarded, color changes can be delayed, water
loss and decay can be reduced, and appearance can be improved by using a simple and
environmentally friendly technology, edible coating (Park et al., 1994; Baldwin, 2001).
The concept of edible films as protective films has been used since the 1800s
(Guilbert et al., 1996). The first edible coating used was wax in China (Park, 1999).
Extensive research in this area has paved the way for different effective edible films and
coatings.
The use of edible films and coatings is extended for a wide range of food products
including fresh & minimally processed fruits and vegetables. The reasons for their use
are: they extend product shelf life (Park et al., 1994), control degradative oxidation and
respiration reactions (McHugh and Krochta, 1994), add to texture and sensory
characteristics and are environmentally friendly (Guilbert et al., 1996). Krochta (2001)
indicated that the present commercial edible coatings are solvent based (ethanol) and the

11
food industry should replace these solvent-based coatings with water-based coatings to
ensure worker and environmental safety.
2.4.1. Edible Coatings and Films
Coatings are applied and formed directly on the surface of the food product,
whereas films are structures, which are applied after being formed separately (Guilbert et
al., 1996). Because they may be consumed, the material used for the preparation of edible
films and coatings should be regarded as GRAS (Park et al., 1994; Krochta and Mulder-
Johnston, 1997) approved by FDA and must conform to the regulations that apply to the
food product concerned (Guilbert et al., 1996). The purpose of edible films or coatings is
to inhibit migration of moisture, oxygen, carbon dioxide, or any other solute materials,
serve as a carrier for food additives like antioxidants or antimicrobials and reduce the
decay without affecting quality of the food.
Specific requirements for edible films and coatings are (Arvanitoyannis and Gorris,
1999):
1. The coating should be water-resistant so as to remain intact and to cover all parts
of a product adequately when applied;
2. It should not deplete oxygen or build up excessive carbon dioxide. A minimum of
1-3% oxygen is required around a commodity to avoid a shift from aerobic to
anaerobic respiration;
3. It should reduce water vapor permeability;
4. It should improve appearance, maintain structural integrity, improve mechanical
handling properties, carry active agents (antioxidants, etc.,), and retain volatile
flavor compounds.
12
2.4.1.1. Edible Coatings
Edible coatings are thin layers of edible material applied to the product surface in
addition to or as a replacement for natural protective waxy coatings and provide a barrier
to moisture, oxygen and solute movement for the food (McHugh and Senesi, 2000;
Nisperos-Carriedo et al., 1992; Lerdthanangkul and Krochta, 1996; Avena-Bustillos et
al., 1997; Guilbert et al., 1996; Smith et al., 1987). They are applied directly on the food
surface by dipping, spraying or brushing to create a modified atmosphere (McHugh and
Senesi, 2000; Krochta and Mulder-Johnston, 1997; Guilbert et al., 1996).
An ideal coating is defined as one that can extend storage life of fresh fruit
without causing anaerobiosis and reduces decay without affecting the quality of the fruit
(El Ghaouth et al., 1992b). Previously, edible coatings have been used to reduce water
loss, but recent developments of formulated edible coatings with a wider range of
permeability characteristics has extended the potential for fresh produce application
(Avena-Bustillos et al., 1994).
The effect of coatings on fruits and vegetables depends greatly on temperature,
alkalinity, thickness and type of coating, and the variety of and condition of fruits (Park
et al., 1994). The functional characteristics required for the coating depend on the product
matrix (low to high moisture content) and deterioration process to which the product is
subject (Guilbert et al., 1996).
2.4.1.2. Edible Films
Edible polymer film is defined as a thin layer of edible material formed on a
product surface as a coating or placed (pre-formed) on or between food components
(Krochta and Mulder-Johnston, 1997). Several types of edible films have been applied

13
successfully for preservation of fresh products (Park et al., 1994). Fruit based films
provide enhanced nutrition for food products, while increasing their marketing allure
(McHugh and Senesi, 2000).
Edible and biodegradable films must meet a number of special functional
requirements, for example, moisture barrier, solute or gas barrier, water/lipid solubility,
color and appearance, mechanical and rheological characteristics, non-toxicity, etc. These
properties depend on the type of material used, its formation and application (Guilbert et
al., 1996).
The benefit of using selective films seems to be the reduction of water loss, which
is one of the most important factors in the deterioration of highly perishables (Bussel and
Kenigsberger, 1975). The films provide protection against moisture loss and maintain an
attractive appearance of the product. Films may consist of single or multiple components
(Guilbert et al., 1996).
2.5 Types of Edible Coatings and Films
Edible coatings may be composed of polysaccharides, proteins, lipids or a blend
of these compounds (Li and Barth, 1998; Park et al., 1994; Guilbert et al., 1996;
Mahmoud and Savello, 1992; Arvanitoyannis and Gorris, 1999). Their presence and
abundance determine the barrier properties of material with regard to water vapor,
oxygen, carbon dioxide and lipid transfer in food systems (Guilbert et al., 1996).
However, none of the three constituents can provide the needed protection by themselves
and so are usually used in a combination for best results (Guilbert et al., 1996; McHugh
and Krochta, 1994).

14
2.5.1. Polysaccharide Based Coatings and Films
Some of the polysaccharides that have been used in coating formulations are
starch and pectin (Baldwin, 2001), cellulose (Tien et al., 2001; Li and Barth, 1998;
Baldwin, 2001), chitosan (Zhang and Quantick, 1998; Zhang and Quantick, 1997; El
Ghaouth et al., 1992a; Ghaouth et al., 1991; Jiang and Li, 2001; Cheah et al., 1997; Li
and Yu 2000; Baldwin, 2001) and alginate (Tien et al., 2001; Baldwin, 2001). These
films are excellent oxygen, aroma, and oil barriers and provide strength and structural
integrity; but are not effective moisture barriers due to their hydrophilic nature (Krochta,
2001; Kester and Fennema, 1986). The oxygen barrier properties are due to their tightly
packed, ordered hydrogen bonded network structure and low solubility (Banker, 1966).
These coatings may retard ripening and increase shelf life of coated produce, without
creating severe anaerobic conditions (Baldwin et al., 1995; Arvanitoyannis and Gorris,
1999).
2.5.2. Protein Based Coatings and Films
Some of the proteins that are used in coating formulations for fruits and
vegetables are soy protein, whey protein, casein and corn-zein, maize, egg albumen,
collagen and wheat (Baldwin et al., 1995). Like polysaccharide based films, the protein
films are also excellent oxygen, aroma, and oil barriers and provide strength and
structural integrity; but are not effective moisture barriers (Krochta and Mulder-Johnston,
1997; Baldwin et al., 1995; Krochta, 2001; McHugh and Krochta, 1994; Mahmoud and
Savello, 1992). Their oxygen barrier properties are due to their tightly packed, ordered
hydrogen bonded network structure, low solubility (Banker, 1966) and the presence of
several side residues of amino acids (cysteine, in particular) which can inhibit

15
polyphenoloxidase (Tien et al., 2001). Research has shown that the presence of fatty
acids in whey protein also significantly improves moisture barrier properties.
Proteins make good film formers and are produced from renewable resources and
degrade more readily than other types of polymeric material (Baldwin et al., 1995). Use
of milk protein based coatings could control enzymatic browning of cut FV (Tien et al.,
2001). Whey protein has fatty acids that significantly improve moisture barrier
properties.
2.5.3 Lipid based Coatings and Films
Some of the lipids that have been used effectively in coating formulations are
beeswax, mineral oil, vegetable oil, surfactants, acetylated monoglycerides, carnauba wax
and paraffin wax (Kester and Fennema, 1986). Lipids offer limited oxygen barrier
properties, due to the presence of microscopic pores and elevated solubility and
diffusivity (Banker, 1966). Lipid films have good water vapor barrier properties, due to
their low polarity (Kester and Fennema, 1986), but are usually opaque and relatively
inflexible (Guilbert et al., 1996).
2.5.4. Composite Coatings and Films
The three different forms of coatings mentioned above are not effective in
preserving the quality of the fruits and vegetables by themselves. They are more effective
when used in a combination. For example, plasticized protein films possess good
mechanical properties and improved film systems can be developed (McHugh and
Krochta, 1994). A film formed by milk protein (casein) and lipid (acetylated
monoglyceride) for lightly processed apples and potatoes was reported to provide

16
protection from moisture loss and oxidative browning for up to 3 days (Baldwin et al.,
1995).
2.6 Advantages of Edible Coatings and Films
Advantages of edible coatings (Nisperos-Carriedo et al., 1992; Park et al., 1994;
Sothornvit and Krochta, 2000) include:
1. Improved retention of color, acids, sugars, and flavor components
2. Reduced weight loss
3. Maintenance of quality during shipping and storage
4. Reduction of storage disorders
5. Improved consumer appeal
6. Extended shelf life
7. Addition of the value of the natural polymer material
8. Reduction of synthetic packaging
Generally, the potential benefits of EC and films for lightly processed produce are
to stabilize the product and thereby extend product shelf life (Ben-Yehoshua, 1966;
Baldwin et al., 1995). More specifically, coatings have the potential to reduce moisture
loss (Davis and Hofmann, 1973; Avena-Bustillos et al., 1994; Avena-Bustillos et al.,
1997; Ben-Yehoshua, 1966; Risse and Miller, 1983; Baldwin et al., 1995), and firmness
loss, provide moisture and oxygen barrier properties (Li and Barth, 1998, Avena-
Bustillos et al., 1994), retard respiration rates (Banks, 1984), hinder solute movement (Li
and Barth, 1998), retard loss of chlorophyll (Banks, 1984), retard ethylene production
(Banks, 1984; Baldwin et al., 1995), reduce metabolism and oxidation rates (Li and
Barth, 1998), seal in flavor volatiles, carry additives that could reduce discoloration and

17
microbial growth (Ben-Yehoshua, 1966; Baldwin et al., 1995), and improve the
appearance (Davis and Hofmann, 1973; Ben-Yehoshua, 1966). Edible coatings would be
very helpful in attaining relative humidity close to 100% (Watada et al., 1996).
The major benefit of EC is that they can be consumed along with food, can provide
additional nutrients, may enhance sensory characteristics and may include quality-
enhancing antimicrobials (Guilbert et al., 1996).
2.7 Disadvantages of Edible Coatings and Films
While coatings have very desirable effects in reducing color changes, firmness
loss, and decay, there are some disadvantages. These disadvantages could be overcome
by suitable selection of the type and thickness of the coating and by avoiding treatment of
immature, flavorless fruit and storage of coated fruits at high temperature (Park et al.,
1994). However, since consumers are concerned with additives, including wax,
acceptability of edible coatings must be recognized (Watada et al., 1996).
Thick coatings could restrict the respiratory gas exchange, causing the product to
accumulate high levels of ethanol and to develop off- flavors (El Ghaouth et al., 1992a;
Howard and Dewi, 1995; Miller et al., 1983; Davis and Hofmann, 1973). Poor water
vapor barrier properties of the coatings could result in weight or moisture loss of the
product, but it could prevent water vapor condensation, which could be a potential source
of microbial spoilage for fruit and vegetable packaging (Ben-Yehoshua, 1985).
Films that have good gas barrier properties could cause anaerobic respiration and
interferes with normal ripening (Meheriuk and Lau, 1988). The film should allow a
certain amount of oxygen permeation through the coating or film in order to avoid
anaerobic conditions.

18
The spoilage could be rapid for coatings such as whey protein in moist
environments, which serves as nutrient for microbial growth (Avena-Bustillos et al.,
1997). Addition of antimicrobials like potassium sorbate to the coatings will be able to
eliminate this problem.
Basic information on film-coating formulation, properties, methods of application
to food surfaces and demonstration of effectiveness are lacking. Tremendous research is
required in the area of applications of edible coatings of foods, especially fresh-cut fruits
and vegetables.
2. 8. Effect of Edible Coatings and Films on Physical, Chemical, Sensory, Physiological Quality and Shelf-life of Fruits and Vegetables 2.8.1. Apple Wraps
Apple based wraps are made from apple puree with various concentrations of
fatty acids, fatty alcohols, beeswax and vegetable oil and have a color of apple sauce.
These wraps are excellent oxygen barriers, particularly at low to moderate relative
humidity, but are not very good moisture barriers unless lipids were added (McHugh and
Senesi, 2000).
Wrapping apple based films formed around apple pieces significantly reduced
moisture loss and browning in cut apples, increased the intensity of apple flavor, and
maintained the texture during a 12-day storage period at 5°C (McHugh and Senesi,
2000).
2.8.2. Cellulose-based Coatings
Cellulose is a polysaccharide, composed of D-glucose units. It is highly
permeable to water vapor (Kester and Fennema, 1986).

19
By the end of 3 week storage, both 2.7 pH (EC1) and 4.6 pH (EC2) cellulose-
based edib le coatings treated carrots maintained fresh appearance and had 15% greater
carotene retention compared to controls which developed whiteness on the surface (Li
and Barth, 1998). EC1 treatment had a significantly higher ethylene production, CO2
level and phenoloxidase activity than both EC2 and control treatments (Li and Barth,
1998).
2.8.3. Nature Seal® (NS)
NS, a cellulose-based edible coating, has been used (in combination with
antimicrobials, plasticizers, antioxidants, etc.) to coat fresh-cut apples and potatoes. The
coating significantly reduced weight loss of apples and potatoes more than those treated
with water solutions and were not objectionable in taste during several weeks of storage
(Baldwin et al., 1996). The coating has also been used to effectively reduce the
discoloration of mini-peeled carrots without affecting microbial and chemical quality
(Ghaouth et al., 1991; Howard and Dewi, 1995), but had minor effects on levels of
oxygen, carbon dioxide and ethanol in package headspace.
NS treatment provides low pH and water cellulose film on carrot surfaces, which
holds more water for a longer period and drops the pH on the surface. The water layer is
important for retarding discoloration and carotene loss and is a barrier for O2 diffusion
(Chen et al., 1996).
2.8.4. Chitosan Coatings
Chitosan, a by-product from crustacean shell wastes, is a high molecular weight
cationic polysaccharide, normally obtained by the alkaline deacetylation of chitin and
refers to as a range of polymers that, unlike chitin, are soluble in dilute organic acids

20
(Zhang and Quantick, 1998; Zhang and Quantick, 1997; Cheah et al., 1997; El Ghaouth
et al., 1991; Jiang and Li, 2001; El Ghaouth et al., 1992b).
Chitosan-based coatings are effective in prolonging the shelf life and improving
quality of fruits, by delaying ripening (El Ghaouth et al., 1992a), reducing respiration rate
(Ghaouth et al., 1991), reducing desiccation (Zhang and Quantick, 1997), regulating gas
exchange, decreasing transpiration losses (Zhang and Quantick, 1998; Jiang and Li,
2001), modifying the internal atmosphere (El Ghaouth et al., 1992b; Jiang and Li, 2001),
maintaining the quality of harvested fruits, retaining fruit firmness (Ghaouth et al., 1991),
freshness, weight loss, titratable acidity (El Ghaouth et al., 1991), soluble carbohydrates
and vitamin C (Jiang and Li, 2001, Li and Yu, 2000), and reducing mold growth.
Chitosan inhibits growth of several fungi (Jiang and Li, 2001; Li and Yu, 2000) by
inducing chitinase, a defense enzyme (Zhang and Quantick, 1998; El Ghaouth et al.,
1992a; Cheah et al., 1997).
Chitosan is best when it is in close contact with the tissue. Therefore, it may be
good for fresh-cut fruits and vegetables (El Ghaouth et al., 1992a). Chitosan could be an
ideal preservative coating because of its film forming properties, biochemical properties,
inherent antifungal properties, enzyme activity (chitinase), and elicitation of phytoalexins
(Zhang and Quantick, 1998; Zhang and Quantick, 1997; El Ghaouth et al., 1991; Li and
Barth, 1998; Jiang and Li, 2001; Li and Yu, 2000; Cheah et al., 1997).
Feed trials have recently demonstrated that chitosan is non-toxic and biologically
safe (Zhang and Quantick, 1998; Jiang and Li, 2001; Cheah et al., 1997). Though it has
been approved in Japan and Canada for various food applications, FDA has not yet
approved chitosan for edible use in the USA.

21
Chitosan has beneficial effects on titratable acidity, ripening and vitamin C
content, firmness and reduced decay (inhibited spore germination, germ tube elongation,
and radial growth of B.cinerea and Rhizopus species in the culture) of strawberries (El
Ghaouth et al., 1992a), raspberries (Zhang and Quantick, 1998; Ghaouth et al., 1991) and
firmness and color changes in tomatoes (El Ghaouth et al., 1992b).
Sensory evaluation confirmed that chitosan coated berries (Zhang and Quantick,
1998), longan fruit (Jiang and Li, 2001), and peaches (Li and Yu, 2000) were better in
quality when compared to controls. They also showed that the increase in concentration
of the coating or film has resulted in better quality.
The application of chitosan coating delayed changes in contents of anthocyanin,
flavonoid, and total phenolics, reduced weight loss and browning of litchi fruit, improved
storability, and delayed the increase in polyphenolase activity in litchi fruit (Zhang and
Quantick, 1997). Chitosan also reduced decay and improved appearance of carrots (Li
and Barth, 1998, Cheah et al., 1997).
Coating tomatoes with chitosan reduced respiration rate, internal O2 levels, and
ethylene production (with a greater effect at 2% than 1% chitosan) and increased
titratable acidity (El Ghaouth et al., 1992).
Chitosan treated longan fruit had reduced firmness loss, ascorbic acid content
(due to low respiration), titratable acidity, total soluble solids, decay, respiration rates and
polyphenolase activity compared to control treated fruits. The coating partially inhibited
increase in PPO activity of longan fruit, which is associated with peel discoloration (Jiang
and Li, 2001).

22
Chitosan increased vitamin C content, reduced ethylene production and delayed
rate of ripening in peach fruit as indicated by the high content of titratable acidity with a
greater effect at higher concentration (Li and Yu, 2000).
2.8.5. Corn-zein Coatings
Zein is a natural corn protein produced from corn gluten meal and is insoluble in
water, but soluble in aqueous alcohol, glycols and glycol esters (Martin-Polo, 1995). It
has good film-forming, binding and adhesive properties. Corn-zein coating is a good
barrier to oxygen. It delays color change, loss of firmness and weight, and extends shelf
life of tomatoes. Its water vapor permeability, however, is about 800 times higher than a
typical shrink-wrapping film (Park et al., 1994).
Park et al., (1994), indicated that corn-zein film delayed color changes, reduced
weight loss, inhibited ethanol production, delayed ripening, and reduced firmness loss of
tomatoes. The degree of color change was mainly dependent on the thickness of coating.
Increased thickness was associated with an increased carbon dioxide level and a
decreased oxygen level.
The coating was removed from the tomatoes when preparing samples for sensory
tests. Acidity, overall flavor and off- flavor attributes were not affected by coating.
Increased perceptions of sweetness, delayed softening and color development were
observed later in the coated tomatoes more than those not coated. The non-coated
tomatoes were not evaluated after 9 days storage at 21°C due to spoilage (Park et al.,
1994).

23
High O2 and CO2 barrier and low WV (water vapor) barrier properties of corn-
zein film are favorable characteristics for application to coating fruits and vegetables to
prevent condensation of WV (Park et al., 1994).
2.8.6. Mineral Oil Based Coatings
The mineral oil based coating was a desirable edible coating for commercial
application for bell pepper fruit (Lerdthanangkul and Krochta, 1996). Its excellent
moisture barrier property resulted in reduced moisture loss, maintained fruit firmness and
freshness. The coating significantly reduces water loss from fruit and prevents wilting
and shriveling and maintains the freshness of the fruit (Lerdthanangkul and Krochta,
1996).
2.8.7. Wax Coatings
Wax, the first edible coating known (Park 1999), is the most effective coating to
block moisture migration (Kester and Fennema, 1986). There are a number of waxes used
but the most effective one is paraffin wax, followed by beeswax. The resistance is related
to their compositions. Paraffin wax consists of a mixture of long-chain saturated
hydrocarbons while beeswax comprises a mixture of hydrophobic, long chain ester
compounds, long chain hydrocarbons and long chain fatty acids. The absence of polar
groups in paraffin and low levels in beeswax account for their resistance to moisture
transport.
An increase in ethanol, acetaldehyde, total soluble solids content and a decrease in
total solids and titratable acidity was observed for waxed mandarins during storage
relative to unwaxed fruits stored in film lined boxes (Ahmad and Khan, 1987). Storing

24
waxed mandarins at room temperature can lead to anaerobic respiration with higher
levels of ethanol and acetaldehyde.
Oranges coated with commercial solvent type wax had less weight loss than those
with comparable amounts of water wax or polyethylene coatings (Davis and Hofmann,
1973).
There was an increase in storage life and a decrease in weight loss when mangoes
were coated with a wax emulsion in water compared to mineral oil coated and control
samples (Mathur and Shrivastava, 1955).
Minimum amounts of solvent type wax/water wax that impart sufficient gloss
should be used in order to avoid off- flavors and should not exceed 0.2-0.3 mg/cm2
(Davis and Hofmann, 1973).
2.8.8. Milk Protein Coatings
Milk contains two primary proteins: casein and whey protein. Milk proteins are
nutritious and have numerous functional properties that are essential for the formation of
edible films. Furthermore, considerable interest exists in finding new uses for milk
proteins due to their surplus in the US (McHugh and Krochta, 1994).
2.8.8.1. Whey Protein Coatings
Whey proteins (WP) represent 20% of the total milk protein (Brunner, 1977). It is
an extremely high-quality protein that is derived from milk. It contains five protein types:
Beta-Lacto globulin (62% of whey protein fraction, molecular weight 18,362 form A and
18,276 form B), Alpha- lactalbumin (25% of WP, MW 14,000), Immunoglobulins,
Bovine serum albumin (MW 66,000) and protease-peptones (McHugh and Krochta,
1994).

25
The mechanical properties of whey protein films adequately provide durability
when used as coatings on food products or films separating layers of homogeneous foods
(Anonymous, 2002b). Adding glycerol and sorbitol reduces internal hydrogen bonding in
films, thereby increasing film flexibility while increasing WVP. Incorporating whey
protein edible films in food product development can results in reduction of food losses
due to spoilage and extension of shelf life.
2.8.8.2. Casein Coatings
Casein, a milk protein, contains four protein types: alpha-casein, beta-casein,
delta-casein, and gamma-casein. Research conducted showed that casein- lipid coatings
provide protection for fruits and vegetables from moisture loss and oxidative browning
(Baldwin et al., 1995).
Calcium caseinate and whey protein solutions efficiently delayed browning of
apple and potato slices by acting as oxygen barriers (Tien et al., 2001). They were
effective gas barriers to internal carbon dioxide and oxygen, inhibited color changes and
reduced decay when coated on bell peppers (Lerdthanangkul and Krochta, 1996).
Caseinate coating was able to increase water vapor resistance of baby carrots by
65% by using the formulation, sodium caseinate 0.75% and stearic acid 0.25% (Krochta,
et al., 1993). Respiration rates (RR) of Red Delicious apples increased for both caseinate
coated and uncoated apples (Avena-Bustillos et al., 1997). This indicated that EC
formulations did not modify fruit RR.
Carrots coated with sodium caseinate and stearic acid had lower whitish index and
could help moisturize the carrot surface (Avena-Bustillos et al., 1994; Krochta, et al.,
1993).

26
2.8.9. Mineral Oil and Wax Coatings
Both wax and oil treatments were found to increase the storage life of 3 varieties
of mangoes. Application of mineral oil to the whole surface of mangoes resulted in the
production of an oil injury on the skin of the fruits. Mangoes in which only top one third
was treated with mineral oil remained free from oil injury and storage life was increased
by over 50% (Mathur and Shrivastava, 1955).
Results showed that treatment with mineral oil depresses respiratory activity to a
greater degree than does the wax treatment. Wax controls moisture loss and respiration
rate (to some extent), whereas oil treatment controls mainly the respiration rate. Wax and
mineral oil treatment resulted in a decrease in ascorbic acid content and acidity and an
increase in total soluble solids and reducing sugars (Mathur and Shrivastava, 1955).
2.8.10. Carbohydrate – Lipid Coatings
Pro-long with Durkex, a vegetable oil blend, when coated on tomato fruit,
reduced ripening, oxygen uptake and CO2 and ethylene production significantly,
compared to controls (Nisperos and Baldwin, 1988).
2.8.11. Sucrose Ester Coating
Pro-long and Semperfresh are two forms of sucrose esters, which have been
studied for effective preservation of the quality of fresh produce.
2.8.11.1. Pro-long
Pro-long is a mixture of sucrose fatty acid esters, sodium CMC and mono-and
diglycerides (Park et al., 1994). The mode of action of Pro- long involves the creation of a
selectively permeable barrier creating internal atmospheres which preserve the fruit by
reducing water loss and chilling injury characteristics, which might be utilized both in the

27
storage of fruit and for the maintenance of quality dur ing the marketing period (Smith
and Stow 1984).
Treatment with 0.75% Pro- long significantly increased the storage life of
mangoes, retarded ripening and reduced weight loss and chlorophyll loss, without
adversely affecting the sensory quality of the limes (Motlagh and Quantick, 1998).
Pro-long was also beneficial in the retention of firmness, green skin color and
titratable acidity in Barlett and d’Anjou pears. However, uneven ripening, loss of
ripening capacity and a blotchy appearance in many of the coated fruit remain serious
problems in the commercial use of these coating compounds (Meheriuk and Lau, 1988).
A post storage application of Pro- long reduced the softening of low oxygen stored
McIntosh and CA stored ‘Delicious’ apples during a 21-day shelf life period at 15°C and
90-95% RH. Treatment did not affect fruit firmness of CA-stored ‘McIntosh’ or ‘Empire’
apples but did retard the loss of ground color in ‘McIntosh’. No physiological disorder
was found in any treated fruit (Park et al., 1994).
Apples treated with 1.25% sucrose ester formulation were stored in air at 3.5°C
for up to 5 months. When applied after storage the coating reduced yellowing, loss of
firmness and markedly increased internal carbon dioxide levels during a 21-day
simulated marketing period. The treatment did not markedly reduce weight loss in fruit,
nor cause accumulation of alcohol or induce any physiological disorders (Smith and
Stow, 1984).
Coating bananas with Pro- long reduced weight loss, oxygen uptake, and ethylene
release and chlorophyll loss and modified their internal atmosphere by reducing the
permeability of the fruit skin to gases. Data suggested that the reduced internal oxygen

28
levels induced by Pro- long coating did not result in anaerobic respiration in the fruit
(Banks, 1984).
2.8.11.2. Semperfresh
Semperfresh, a food-grade coating used to retard moisture loss, ripening and
spoilage of fruit is a mix of sucrose esters with high proportion of short chain unsaturated
fatty acid esters, sodium salts of CMC and mixed mono and diglycerides (Tasdelen and
Bayindirli, 1998; Drake et al., 1987). Semperfresh is an improved formulation of earlier
SPE (sucrose polyester) (Drake et al., 1987). The major difference is improved dispersion
due to incorporation of higher proportion of short chain USFA esters.
These fruit coatings were found to be significantly effective (at both 12°C and
23±2°C) in retention of reducing sugars, delaying changes in firmness, titratable acidity,
pH, soluble solids, sugars, ascorbic acid and lycopene synthesis (Tasdelen and Bayindirli,
1998).
Semperfresh significantly reduced water loss and internal carbon dioxide of
zucchini fruit (Avena-Bustillos et al., 1994) and reduced color changes, retained acid,
increased shelf life and maintained the keeping quality of apples (Drake et al., 1987) and
tomatoes (Tasdelen and Bayindirli, 1998).
The coating increased titratable acidity, firmness and green color and decreased
weight loss, total soluble solids and pH in mangoes when compared with the non-coated
fruit. Ascorbic acid decreased in all stored fruit, but the decrease was slower in coated
fruit. There were no significant differences in ascorbic acid contents between the
different Semperfresh concentrations (Carrillo-Lopez et al., 2000).

29
2.9. Thickness of Films or Coatings
Studies have shown that repeated dipping of products in the coatings give
generally better results than single dipping, but lead to some physiological disadvantages
(Ben-Yehoshua, 1966). Increase in thickness of the coating or the film cannot only cause
detrimental effects by reducing internal oxygen and increasing carbon dioxide
concentration leading to anaerobic fermentation, but also affect the original taste and
flavor of the product (Park et al., 1994; Park 1999). For example, treatment with 1.0%
Pro-long caused anaerobiosis and significant loss of sensory quality in mangoes (Dhalla
and Hanson, 1998). An optimum amount of coating should provide sufficient gloss and
minimize weight loss without producing off- flavors (Davis and Hofmann, 1973).
2.10. Additives and Their Applications
Edible coatings can be furnished with compounds such as plasticizers,
emulsifiers, antimicrobials or antioxidants to obtain additional desired effects (Nisperos-
Carriedo et al., 1992; Guilbert et al., 1996). Such coatings may protect the product
against spoilage, resulting in prolonged shelf- life without destroying the quality of the
product. Use of a few additives in coatings and films and results of studies are:
Soy protein: The addition of soy protein increased moisture and gas barrier properties
of Nature Seal® (Baldwin et al., 1996).
Carboxy methyl cellulose (CMC): Addition of CMC improved antioxidative
potential of casein and whey protein based films. In certain conditions, CMC acts
as a chelating agent, interacts with copper binding site of oxygen and reduces
polyphenolase activity (Tien et al., 2001).
Ascorbic acid: The addition of ascorbic acid in NS solution delayed browning
30
effectively (Baldwin et al., 1996).
Sodium Benzoate and Potassium Sorbate: These preservatives when added to
edible coatings or films are effective in controlling microbial populations
(Baldwin et al., 1996).
Acidulants: They give optimal control of browning and microbial populations when
added to the edible coatings or films (Baldwin et al., 1996).
Beeswax: Addition of beeswax to the edible films or coatings helps decreasing
respiration rates (Lerdthanangkul and Krochta, 1996).
Plasticizers : Glycerol and sorbitol are widely used plasticizers. The addition of
glycerol to whey protein isolate and sodium caseinate coatings probably
influenced respiration elevations and decreased weight loss (Lerdthanangkul
and Krochta, 1996; Siew et al., 1999). The addition of stearic acid improves
moisture barrier properties and reduces the rate of white blush formation in
carrots (Avena-Bustillos et al., 1994).
Emulsifiers: The inferior performance of a film in retarding ripening can be traced
to its inability to form a complete, uniform coating around the surface
(Krochta and Mulder-Johnston, 1997). The addition of a surfactant or an
emulsifier may greatly increase the ability of the film to suppress ripening
(Nisperos and Baldwin, 1988). Glacial acetic acid is added to
dissolve chitosan (Jiang and Li, 2001). The addition of an emulsifier to
Durkex coating markedly improved permeability, resulting in better color
development and reduction of pathogen invasion in coated fruits (Krochta and
Mulder-Johnston, 1997).

31
CHAPTER 3. A SURVEY ON CONSUMER ACCEPTANCE AND PREFERENCE OF FRESH-CUT FRUITS AND VEGETABLES WITH OR WITHOUT EDIBLE COATINGS 3.1 Introduction
Ghosh (1989) indicated, “Instead of filling up shopping trolleys with their usual
frozen assortment, people may soon be able to buy fresh food that has already been
washed, sliced and pitted.” The markets demand for minimally processed fruits and
vegetables has undergone rapid expansion, mainly due to busy lifestyles, increased
purchasing power and health conscious consumers (McHugh and Senesi, 2000; Howard
et al., 1994; Baldwin et al., 1995; Jiang and Joyce, 2002; Acuff, 1993).
Previous research has shown that food consumption patterns change constantly,
depending on the availability of certain food and the consumer’s purchasing power and
habits (Greenwood, 1998). With the busy lifestyles, consumer tends to use less time for
preparing meals. Some health conscious consumers prefer eating fruits and vegetables
(FV) and prefer a ready-to-eat salad than preparing it themselves. As a result, the
maintenance of the quality of fresh-cut produce has become more challenging to the food
industry.
There are many techniques that have been explored for maintaining the quality of
produces, for example, low temperature, high relative humidity, controlled atmospheric
and modified atmospheric packaging, plastic film packaging, etc. These techniques have
both advantages and disadvantages and continue to be used.
Other techniques like edible coatings and chemical treatments are being studied to
develop a better technique for maintaining the quality of both whole and fresh-cut
produce.

32
Edible coating or film is a thin layer of edible material applied to the fruit surface
as an addition or a replacement for the natural protective waxy coating. They have shown
potential for controlling transfer of moisture, oxygen, lipids, aroma and flavor
compounds in food systems, without affecting the quality of the food (Krochta and De
Mulder-Johnston, 1977). Coatings are applied on the food product by dipping, brushing
or spraying. Films are applied by wrapping them on the sample surface after being
formed.
Research has been conducted to show that edible coatings not only increase the
market opportunity for fruits and vegetables, but also are very effective in extending their
shelf life. Little research has examined consumer acceptance of these products, especially
when applied on fresh-cut fruits and vegetables (Bett et al., 2001) either coated or
uncoated. Surveys have been conducted on consumer perception of whole fruits and
vegetables, but none has been conducted on the consumer perception of fresh-cut produce
or edible films and coatings.
Knowing the consumer perception towards fresh-cut fruits and vegetables and
edible coatings would help the food industry understand consumer attitudes and meet the
market demand.
3.2 Objectives
The objectives of this survey were (1) to compare consumer preferences among
fresh-cut, canned, frozen-cut and whole/raw/unprocessed fruits and vegetables; (2) to
evaluate consumer perception and preference of 16 fresh-cut fruits (FCF) and 16 fresh-
cut vegetables (FCV); (3) to educate consumers on edible coating applications on fresh-

33
cut fruits and vegetables (FCFV), and (4) to determine the effect of demographic
characteristics on the consumer perception of fruits and vegetables and edible coatings.
3.3. The Survey Procedure
A seven-page questionnaire was prepared, reviewed by several faculty members
from the Departments of Food Science, Horticulture and Agricultural Economics, and
revised accordingly. A number of questions were asked to estimate consumer attitudes
toward FCFV, and to determine whether the consumers understand the applications and
advantages of edible coatings and films.
One thousand questionnaires (See Appendix A) were distributed across the
Louisiana State University (LSU) and University of Georgia (UGA) campuses. At UGA,
the survey was conducted by calling consumers randomly via phone directory. At LSU,
the survey was handed to the students personally. The questionnaires were also sent to
the secretary of each of the Departments in College of Agriculture’ which were
distributed to the faculty and staff. When completed they were returned within a week to
the Department of Food Science. People above 45 years of age were recruited from the
churches (The Chapel on the Campus and Hosanna First Assembly) on Sundays in Baton
Rouge. This was done to obtain good distribution of all age groups for this study.
Data were collected on grocery shopper’s frequency of use, preference for
coatings, attributes affecting their preferences, and purchase intent of whole, canned,
frozen and fresh-cut FV (coated and uncoated FV), their knowledge of edible coatings or
films and their socio-economic characteristics (gender, age, race, education level,
employment status, household income, family size and geographic location). Each
questionnaire was coded accordingly for data analysis.

34
3.3.1. Econometric Analysis
Probit and ordered probit analyses were used to determine the effects of gender,
age, race, education level, income, and family size on the consumer’s perception and
preference of fruits and vegetables and their knowledge about edible coatings and films.
Probit analysis is used for studying data with a binomial distribution (yes/no response)
and ordered probit is used for studying data with multinomial response variables that are
inherently ordered in nature: yes, sometimes or no response for preference and lower,
same or higher response for price (Liao, 1994; Greene, 1994).
The probit model is given by: Prob(Y=1) = ?-8
ß'x
F(t) dt = F(ß'x )
where x is a vector of independent variables and ß is coefficient of x. The function F(.) is
a commonly used notation for standard normal distribution.
When yes, no and sometimes responses are coded as 0, 1, and 2, then the linear
regression would treat the difference between 2 and 1, the same as that between 1 and 0,
whereas in fact they are only a ranking. The ordered probit models have a threshold µ
(Mu) that allows us to find the difference between responses. Using the thresho ld
parameter the three probabilities are calculated as:
Prob(y=0) = 1 – F (ß'x )
Prob(y=1) = F (µ - ß'x) – F (-ß'x)
Prob(y=2) = 1 – F(µ - ß'x)
The likelihood ratio index (LRI) is a measure of fit for the model. It ranges
between 1 and 0. As LRI value approaches 1, it indicates that the model has a good fit.
The likelihood ratio index was calculated as LRI = 1- [ln L / ln L0];

35
Where L0 – Restricted log likelihood function
L – Log likelihood function
3.4. Results
3.4.1. Consumer Characteristics
The demographic and socioeconomic characteristics of respondents are given in Table 1.
Table 1. Socio-economic and demographic data of the respondents (n = 611) Category Frequency Percent Gender:
Male 352 57 Female 257 43
Age: Under 18 years 2 0 18-25 years 159 27 26-35 years 152 25 36-45 years 116 19 46-55 years 109 18 56-65 years 57 9 66-75 years 9 1 Over 75 years 4 1
Race: African-American 53 9 Asian 87 14 Hispanic/Spanish 26 4 White (Caucasian) 416 69 Other 24 4
Education: Less than high school 9 1 High school graduate 50 8 Some college 141 23 Completed college 126 21 Graduate degree 280 47
Household income: Over $120,000 30 5 $110,000– 119,999 14 2 $100,000– 109,999 17 3 $90,000 – 99,999 25 4 $80,000 – 89,999 29 5 $70,000 – 79,999 43 7 $60,000 – 69,999 44 8
(Table continued)

36
$50,000 – 59,999 41 7 $40,000 – 49,999 39 7 $30,000 – 39,999 65 11 $20,000 – 29,999 39 9 $10,000 – 19,999 121 21 Under $10,000 57 10
Employment status: Employed full- time 324 53 Employed part-time 33 5 Unemployed 6 1 Homemaker 13 2 Student 214 36 Retired 19 3
Family size: Single adult 241 40 Single parent with children in the home 20 3 Couple without children in the home 153 25 Couple with children in-home 192 32
Out of 1,000 questionnaires distributed, 611 were usable. Three hundred and forty
two of the respondents were female and 257 were male. The majority of the respondents
were from the age group of 18-25 years (27%) and 26-35 years (25%). There were only 2
respondents under the age of 18 years, 9 from the age group of 66-75 years and 4
respondents above the age of 75 years. There were 19% of the respondents from the age
group of 36-45 years, 18% from the age group of 46-55 years and 9% from the age group
of 56-65 years.
The majority of respondents were White/Caucasian (69%), followed by 14%
Asian, 9% African-American, 4% Hispanic/Spanish and 4% other races. About 47% of
respondents had a graduate degree, followed by 23% with some college, 21% had
completed college degree, 8% were high school graduates, and 1% had less than a high
school diploma. The majority of respondents were from the income group of $10,000-
19,999 (21%), followed by 11% from $30,000-$39,999. About 53% of respondents were
employed full-time, followed by 36% students, 5% employed part-time, 3% retired, 2%

37
homemaker and 1% unemployed. About 40% of the respondents were single adults, 32%
were part of couple with children in the home, 25% were part of a couple without
children in the home and 3% were single parents with children in the home.
3.4.2. Comparison of Consumer Preferences of Different Forms of Fruits and Vegetables
Data analysis showed that about 70% of the respondents preferred FCFV to
canned FV and about 61% of them preferred FCFV to frozen-cut FV, the main reasons
being freshness and natural taste/flavor. The others did not prefer FCFV to canned and
frozen-cut FV mainly due to short shelf life, cost and convenience. About 30% of the
consumers preferred FCFV to whole/unprocessed FV, the main reasons being less
preparation time and desirable serving portion. The others did not prefer FCFV to whole
FV, the main reasons being cost, not being fresh enough, shelf life and the preference for
preparing FCFV themselves.
The chi-square values (Table 2) for the preference of FCFV to canned and whole
FV by age were not significant (p>0.05). But the chi-square value for the preference of
FCFV to frozen-cut FV by age were significant (p>0.05). As age increased the preference
for FCFV relative to frozen-cut FV decreased (Figure 1).
Table 2. Chi-square values for preference of FCFV to canned, frozen-cut and whole FV by age. FCFV to Chi-square values Canned FV 0.468 Frozen-cut FV 0.0236 Whole raw/unprocessed FV 0.4962

38
01020304050607080
18-25 26-35 36-45 46-55
Age
%P
eop
le
YesLinear (Yes)
Figure 1. Preference of FCFV to frozen-cut FV by age
3.4.3. Frequency of Use of FCFV Based on Age and Gender Characteristics
Figure 2 shows that majority of the respondents from each age group consumed
FCFV at least once a week. Looking at the effect of age and gender (Figure 3) on the
frequency of use of FCFV, we can see that for females, as the age increased from 18-45
years, the use of FCFV increased. However, the frequent use decreased for respondents
aged between 46-55. But still, in all age groups, the majority of the female respondents
purchased FCFV at least once a week. As the age group increased, the purchase of FCFV
by males decreased. However, the majority of the males from 18-45 years did purchase
FCFV at least once a week.
From Figure 5, it could be said that as the family size increased, the purchase of
FCFV at least once a week also increased.

39
0
10
20
30
40
50
18 -25
26 -35
36 -45
46 -55
Age
%P
eop
le>once a weekonce a weektwice a monthonce a monthvery rarelynever
Figure 2. Frequent use of FCFV based on age group
0
10
20
30
40
50
60
18 - 25 26 - 35 36 - 45 46 - 55
Age (Females)
%P
eop
le
>once a weekonce a weektwice a monthonce a monthvery rarelynever
Figure 3. Frequency of use of FCFV by different age groups of females

40
05
10152025303540
18 - 25 26 - 35 36 - 45 46 - 55
Age (Males)
%P
eop
le>once a weekonce a weektwice a monthonce a monthvery rarelynever
Figure 4. Frequency of use of FCFV by different age groups of males
0
10
20
30
40
50
Single adult Couple w/ochildren-home
Couple w/children-home
Family size
%P
eop
le
>once a weekonce a weektwice a monthonce a monthvery rarelynever
Figure 5. Frequency of use of FCFV based on family size

41
About 47 to 68.4% of the respondents said they had purchased apple, cantaloupe,
honeydew, strawberry, watermelon and pineapple as fresh-cut. Similarly, 50 to 76.6% of
the respondents said they had purchased bell pepper, broccoli, cabbage, cauliflower,
celery, cucumber, lettuce, spinach, tomato and turnip greens as fresh-cut.
3.4.4. Consumer Perception of Edible Coatings
Up to 93.5% of the respondents said they knew apple was coated with EC and
74.9% said they knew that cucumber was coated with edible material. However, when
asked if they had heard about edible coatings, only 54.6% of the respondents answered
yes. Some of the respondents indicated that they have heard about edible coatings and
films but they were not sure of what they were made of and their applications. Most of
them did not know what an edible coating actually was. They knew that edible wax was
being used to coat some FV (such as cucumber), but did not know what its functions
were and why it was being used, except that it gives a shiny or glossy appearance to the
fruits and vegetables. Some of them thought the advantages of edible coatings were that
they give a shiny or glossy appearance to the fruits, prevent dehydration, add nutrition
and can reduce the use of plastics.
However, four of the respondents said they would peel/wash off the EC before
consumption, and a few said they would not purchase coated fruits or vegetables if the
coating were of an animal source. About 79.3% of the respondents said they would buy
FCFV coated with EC if the FDA approved the coating and there was a 7% increase in
purchase intent after the advantages of the EC were described to the consumers.

42
3.4.5. Probit Analysis for Demographic Variables
For a more completed understanding of the effects of demographic characteristics
on the consumer’s responses, probit analysis was used to analyze the data. The
independent variables were coded as shown in Table 3. The variable abbreviations shown
in Table 3 were used in Table 4-18.
Table 3. Variables coded for Probit analysis.
Variables Geographic area (Geo) Louisiana=1; Georgia=0 Gender (Gen) Female=1; Male=0 Age (Age) < 25 years=1; 26-35 years=2; 36-45 years=3; 46-55 years=4; 56-65 years=5; >66 years =6; Race African-American (Aframer)=1; Otherwise=0; Asian (Asian)=1; Otherwise=0; Hispanic/Spanish (Hisp)=1; Otherwise=0; Education Level (Hsch) High school or less=1; some college/college/graduate degree=0; Household income (Inc)
Over $120,000=13; $110,000– 119,999=12; $100,000– 109,999=11; $90,000 – 99,999=10; $80,000 – 89,999=9; $70,000 – 79,999=8; $60,000 – 69,999=7; $50,000 – 59,999=6; $40,000 – 49,999=5; $30,000 – 39,999=4; $20,000 – 29,999=3; $10,000 – 19,999=2; Under $10,000=1;
(Table continued)

43
Family size Married (Marry)=1; Unmarried=0; Have children in the home (Child)=1; otherwise=0;
A few points to consider before interpreting the results shown in the Tables 4-18:
1. As the variables we are testing do not start from zero, we use a constant so that we are
not forcing the curve to start from zero.
2. If the coefficient of the gender variable is positive, it means that the probability of
females (gender=1) saying yes to the question is more than males (gender=0).
3. The p values with one, two and three asterisk(s) indicate significance at 10%, 5% and
1% levels, respectively.
When asked if they eat/use whole/raw/unprocessed FV, 96.71% of the
respondents answered yes and 3.29% answered no. The data was analyzed using a Probit
model (Table 4). The likelihood ratio index was 0.0645. The low LRI index shows that
the model does not have a good fit. This could be due to unequal distribution of the data.
However, 97% of the cases were correctly predicted “yes” and there were few “no”
answers. The demographic variable that was significant at a=0.10 with an expected
positive sign was age. As age increased, people were more likely to eat/use
whole/raw/unprocessed FV. None of the variables were significant at the a level of 0.05
and, therefore, were not further discussed.
When asked if they eat/use frozen-cut FV, 86.35% of the respondents answered
yes and 13.65% answered no. The data was analyzed using a Probit model (Table 5). The
likelihood ratio index was 0.0376. About 87% of the cases were correctly predicted. The
demographic variables that were significant at a=0.05 were African Americans and

44
Asians. African Americans were more likely and Asians were less likely to eat/use
frozen-cut FV than Caucasians and others.
Table 4. Coefficients, standard errors and probability values of the demographic variables for the question “Do you eat/use whole/raw/unprocessed fruits and vegetables?” Variable Coefficient Standard error P [|Z|>z] Constant 2.21166899 .24643099 .0000 GEN .4166683212E-01 .16635059 .8022 AGE .1908389777E-02 .10989024E-02 .0825* AFRAMER .5834347141 .36694794 .1118 ASIAN -.1807768291 .24415257 .4590 HISP -.4019901766 .32422260 .2150 HSCH -.5330666742 .33328388 .1097 INC .1300796270E-03 .47272136E-03 .7832 CHILD .2346367533 .23723387 .3226 MARRY -.2776775301 .23745691 .2423 GEO -.3048459546 .24845874 .2198 Note: Description of the variable abbreviation is shown in Table 3. Table 5. Coefficients, standard errors and probability values of the demographic variables for the question “Do you eat/use frozen-cut fruits and vegetables?” Variable Coefficient Standard Error P [|Z|>z] Constant 1.179828499 .11935015 . 0000 GEN .1498456326 .10179776 .1410 AGE -.1633330516E-02 .31175245E-02 .6003 AFRAMER .4837472675 .22568632 .0321** ASIAN -.4755018435 .14853137 .0014** HISP -.7537810225E-02 .22772959 .9736 HSCH .6102676974E-03 .69902296E-03 .3826 INC .2614787381E-03 .32504814E-03 .4211 CHILD -.6836542771E-01 .15841881 .6661 MARRY -.8296323990E-01 .15966398 .6033 GEO -.5552259659E-01 .13949439 .6906
When asked if they eat/use canned FV, 93.23% of the respondents answered yes
and 6.77% answered no. The data was analyzed using a Probit model (Table 6). The
likelihood ratio index was 0.08316. About 94% of the cases were correctly predicted. The
demographic variables that were significant at a=0.05 were Hispanic/Spanish, Asians and

45
Geographic location. Asians were less likely and Hispanic/Spanish were more likely to
eat/use canned FV than Caucasians and others. Respondents from Louisiana were less
likely to eat or use canned FV than those from Georgia; more consumer responses are
needed to confirm this observation.
Table 6. Coefficients, standard errors and probability values of the demographic variables for the question “Do you eat/use canned fruits and vegetables?” Variable Coefficient Standard Error P [|Z|>z] Constant 2.185029907 . 28858203 .0000 GEN .8334160330E-03 .15397846E-01 .9568 AGE -.4365079029E-01 .68423461E-01 .5235 AFRAMER -.2190186723 .27607146 .4276 ASIAN -.6142969737 .18975672 .0012** HISP .8307906870 .34386787 .0157** HSCH -.1791748025E-02 .96157523E-02 .8522 INC -.2599488627E-03 .35776016E-03 .4675 CHILD .2197602683E-01 .19524464 .9104 MARRY -.2413139490E-01 .19520056 .9016 GEO -.6000904072 .21021280 .0043**
When asked if they eat/use FCFV, 94.35% of the respondents answered yes and
5.65% answered no. The data was analyzed using a Probit model (Table 7). The
likelihood ratio index was 0.06626. About 94% of the cases were correctly predicted. The
demographic variables that were significant at a=0.10, with an expected positive sign
were gender and income. Females were more likely to eat/use FCFV than males. As
income level increased, respondents were more likely to eat/use FCFV. The p value for
Hispanic/Spanish was also significant at a=0.10. They were less likely to eat/use FCFV
than Caucasians and others.
When asked if they generally prefer fresh-cut over canned F/V, 69.55% of the
respondents answered yes, 22.63% answered sometimes and 7.82% answered no. The
data was analyzed using an Ordered probit model (Table 8). The likelihood ratio index
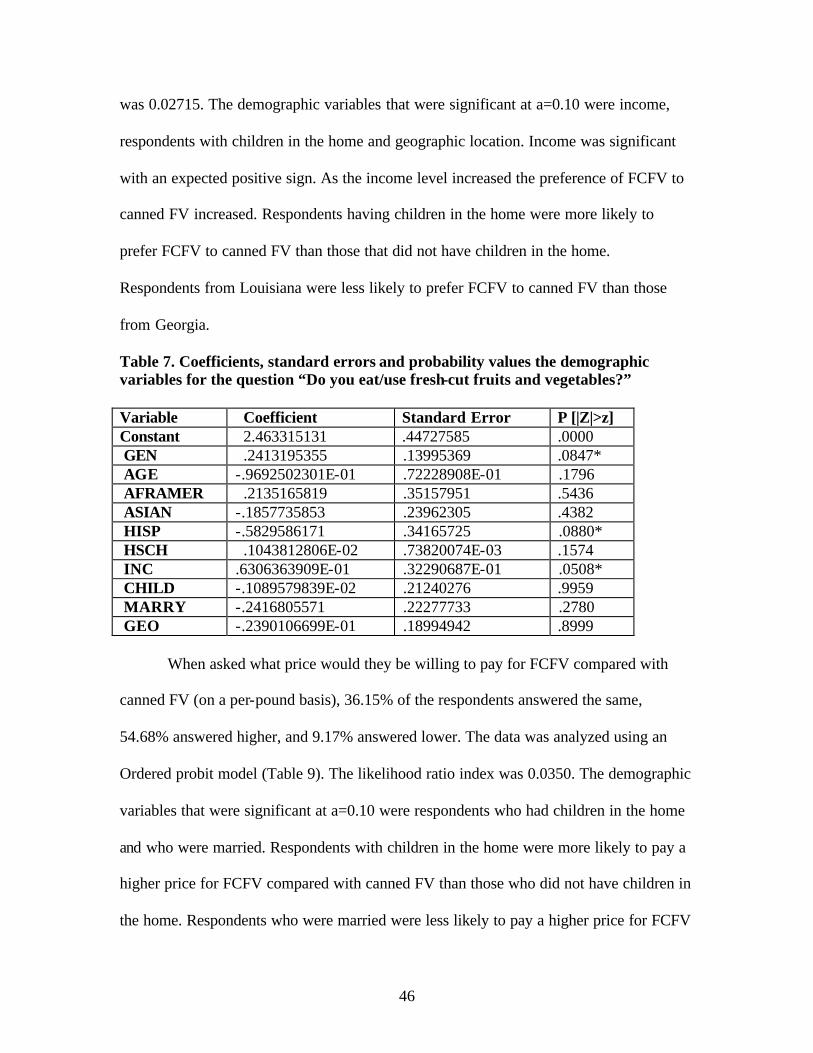
46
was 0.02715. The demographic variables that were significant at a=0.10 were income,
respondents with children in the home and geographic location. Income was significant
with an expected positive sign. As the income level increased the preference of FCFV to
canned FV increased. Respondents having children in the home were more likely to
prefer FCFV to canned FV than those that did not have children in the home.
Respondents from Louisiana were less likely to prefer FCFV to canned FV than those
from Georgia.
Table 7. Coefficients, standard errors and probability values the demographic variables for the question “Do you eat/use fresh-cut fruits and vegetables?” Variable Coefficient Standard Error P [|Z|>z] Constant 2.463315131 .44727585 .0000 GEN .2413195355 .13995369 .0847* AGE -.9692502301E-01 .72228908E-01 .1796 AFRAMER .2135165819 .35157951 .5436 ASIAN -.1857735853 .23962305 .4382 HISP -.5829586171 .34165725 .0880* HSCH .1043812806E-02 .73820074E-03 .1574 INC .6306363909E-01 .32290687E-01 .0508* CHILD -.1089579839E-02 .21240276 .9959 MARRY -.2416805571 .22277733 .2780 GEO -.2390106699E-01 .18994942 .8999
When asked what price would they be willing to pay for FCFV compared with
canned FV (on a per-pound basis), 36.15% of the respondents answered the same,
54.68% answered higher, and 9.17% answered lower. The data was analyzed using an
Ordered probit model (Table 9). The likelihood ratio index was 0.0350. The demographic
variables that were significant at a=0.10 were respondents who had children in the home
and who were married. Respondents with children in the home were more likely to pay a
higher price for FCFV compared with canned FV than those who did not have children in
the home. Respondents who were married were less likely to pay a higher price for FCFV

47
compared with canned FV than those who were not married. Asians were significant at
an alpha level of 0.01. Asians were more likely to pay a higher price for FCFV compared
with canned FV than Caucasians and others.
Table 8. Coefficients, standard errors and probability values of the demographic variables for the question “Do you generally prefer FCFV to canned FV?” Variable Coefficient Standard error P [|Z|>z] Constant -.4549940377 .19252646 .0181 GEN -.3947217710E-01 .10823253 .7153 AGE .1603692830E-01 .42646655E-01 .7069 AFRAMER .8841274413E-01 .19006208 .6418 ASIAN .2309714077 .14689133 .1159 HISP .1848780466 .24530204 .4510 HSCH -.6215201695E-03 .12153507E-02 .6091 INC .7084707475E-03 .35018063E-03 .0431** CHILD .2503125326 .14630543 .0871* MARRY -.7255331814E-01 .15152502 .6321 GEO -.2373550275 .11717319 .0428** Mu 1.258600233 .80027690E-01 .0000 Table 9. Coefficients, standard errors and probability values of the demographic variables for the question “What price would you be willing to pay for FCFV compared to canned FV (on a per pound basis)? Variable Coefficient Standard errors P [|Z|>z] Constant -.3959486060E-01 .17145761 .8174 GEN -.6887785870E-01 .10344548 .5055 AGE .2471675342E-02 .39222081E-01 .9498 AFRAMER .2828092524 .19183736 .1404 ASIAN .5575503927 .13969506 .0001*** HISP .3290679716 .23497472 .1614 HSCH -.2280771572E-03 .83749878E-03 .7854 INC .1255814042E-03 .24001915E-03 .6008 CHILD .2396546420 .12893766 .0631* MARRY -.2365328147 .13432925 .0783* GEO -.1359387231 .11340458 .2306 Mu .9355117691 .74495825E-01 .0000
When asked if they would generally prefer FCFV to frozen-cut FV, 60.82% of the
respondents answered yes, 27.43% answered sometimes and 11.75% answered no. The

48
data was analyzed using an Ordered probit model (Table 10). The likelihood ratio index
was 0.00752. None of the demographic variables were significant at a=0.05 or 0.10, and
therefore, were not further discussed.
When asked what price would they be willing to pay for FCFV compared with
frozen-cut FV (on a per-pound basis), 48.78% of the respondents answered the same,
42.37% answered higher, and 8.85% answered lower. The data was analyzed using an
Ordered probit model (Table 11). The likelihood ratio index was 0.0090. None of the
demographic variables were significant at a=0.05 or 0.10, and therefore were not further
discussed.
Table 10. Coefficients, standard errors and probability values of the demographic variables for the question “Do you generally prefer FCFV to frozen-cut FV?” Variable Coefficient Standard errors P [|Z|>z] Constant -.1303350468 .11441137 .2546 GEN .5999552768E-02 .10197442 .9531 AGE -.1865356681E-03 .12670384E-02 .8830 AFRAMER .2200781052E-01 .14223303 .8770 ASIAN -.8428540312E-01 .11566163 .4662 HISP .6275127445E-01 .15802346 .6913 HSCH .5390848111E-03 .77721142E-03 .4879 INC -.2007410820E-03 .28192673E-03 .4764 CHILD .1143403021 .11865381 .3352 MARRY -.1140122745 .11862552 .3365 GEO -.1584648379 .10442533 .1291 Mu .9191187315 .65587415E-01 .0000
When asked if they would generally prefer FCFV to whole/raw/unprocessed FV,
30.41% of the respondents answered yes, 35.81% answered sometimes and 33.78%
answered no. The data was analyzed using an Ordered probit model (Table 12). The
likelihood ratio index was 0.01017. None of the demographic variables were significant
at a=0.05. However, Geographic location was significant at an a level of 0.10.

49
Respondents from Louisiana were less likely to prefer FCFV to whole/raw/unprocessed
FV. Again, more consumer responses are needed to confirm this observation.
Table 11. Coefficients, standard errors and probability values of the demographic variables for the question “What price would you be willing to pay for FCFV compared to frozen-cut FV (on a per pound basis)? Variable Coefficient Standard errors P [|Z|>z] Constant .2859987025 .11919367 .0164 GEN -.2692763354E-01 .10153082 .7908 AGE -.5891284665E-03 .70361624E-02 .9333 AFRAMER -.3114621162E-01 .13642723 .8194 ASIAN .7158021180E-01 .11107322 .5193 HISP -.4047916854E-01 .15725946 .7969 HSCH -.2087772101E-03 .76213604E-03 .7841 INC -.2471863879E-03 .27339954E-03 .3659 CHILD .5993884191E-01 .11756864 .6102 MARRY -.5925000096E-01 .11754261 .6142 GEO -.7933616849E-01 .11130960 .4760 Mu 1.567168966 .85111847E-01 .0000
Table 12. Coefficients, standard errors and probability values of the demographic variables for the question “Do you generally prefer FCFV to whole/raw/unprocessed FV?” Variable Coefficient Standard errors P [|Z|>z] Constant .6391673309 .92075514E-01 .0000 GEN .1633200191E-02 .15946048E-02 .3057 AGE -.1070375777E-02 .11669213E-02 .3590 AFRAMER -.2221783183 .13788313 .1071 ASIAN .1084303928 .11634633 .3514 HISP .1151476845 .15967589 .4708 HSCH -.2453189840E-03 .16513229E-02 .8819 INC -.1596788433E-03 .24874867E-03 .5209 CHILD -.2757363378E-01 .10730990 .7972 MARRY .2647391857E-01 .10728700 .8051 GEO -.1767962887 .99253018E-01 .0749* Mu .9440339988 .56082029E-01 .0000
When asked what price they would be willing to pay for FCFV compared with
whole/raw/unprocessed FV (on a per-pound basis), 48.01% of the respondents answered
the same, 46.02% answered higher, and 5.97% answered lower. The data was analyzed

50
using an Ordered probit model (Table 13). The likelihood ratio index was 0.02698.The
demographic variable that was significant at a=0.10 is Hispanic/Spanish. They were less
likely to pay a higher price for FCFV compared with whole/raw/unprocessed FV than
Caucasians and others.
Table 13. Coefficients, standard errors and probability values of the demographic variables for the question “What price would you be willing to pay for FCFV compared to whole/raw/unprocessed FV (on a per pound basis)?” Variable Coefficient Standard errors P [|Z|>z] Constant .2895023113 .16806178 .0850 GEN -.7765208699E-01 .12210929 .5248 AGE -.5925277837E-03 .62641531E-02 .9246 AFRAMER .2206247618 .18364292 .2296 ASIAN .1200164552 .14495619 .4077 HISP -.3407811654 .19375415 .0786* HSCH .1431443337E-03 .76826113E-03 .8522 INC -.4942091927E-04 .26353150E-03 .8512 CHILD .3348786040E-01 .15937134 .8336 MARRY -.1875234943 .15547956 .2278 GEO -.1008030798 .13732564 .4629 Mu 1.712394281 .11026538 .0000
When asked if they had heard about edible coatings and films, 54.85% of the
respondents answered yes and 45.15% answered no. The data was analyzed using a
Probit model (Table 14). The likelihood ratio index was 0.0534. About 62% of the cases
were correctly predicted. The demographic variables that were significant at a=0.05 were
Asians, Hispanic/Spanish and geographic location. Asians were more likely and
Hispanic/Spanish less likely to have heard about edible coatings and films compared to
Caucasians and others. Respondents from Louisiana were less likely to have heard about
edible coatings and films than those from Georgia. Again, more data are needed to
support this observation.

51
When asked if they would be willing to pay a higher price for fresh-cut FV than
whole (raw/ unprocessed) FV (on a per-pound basis), if they were more convenient,
59.52% of the respondents answered yes and 40.38% answered no. The data was
analyzed using a Probit model (Table 15). The likelihood ratio index was 0.0187. About
60.27% of the cases were correctly predicted. None of the demographic variables were
significant at a = 0.05 or 0.10, and therefore, were not further discussed.
Table 14. Coefficients, standard errors and probability values of the demographic variables for the question “Have you heard about edible coatings and films?” Variable Coefficient Standard errors P [|Z|>z] Constant .4190683716 .10122055 .0000 GEN -.3918294121E-02 .24330075E-01 .8721 AGE -.2550965732E-02 .52230098E-02 .6253 AFRAMER .2155251554 .16894074 .2020 ASIAN .3196918818 .13725986 .0199** HISP -.5354623081 .18823481 .0044*** HSCH -.7468370970E-03 .71127355E-03 .2937 INC -.2073534725E-03 .24832484E-03 .4037 CHILD -.6500662467E-01 .12579858 .6053 MARRY .6847515281E-01 .12577423 .5861 GEO -.5541078484 .11524969 .0000*** Table 15. Coefficients, standard errors and probability values of the demographic variables for the question “Would you be willing to pay a higher price for FCFV than whole/raw/unprocessed FV if they were more convenient?” Variable Coefficient Standard errors P [|Z|>z] Constant .4476947326 .16218338 .0058 GEN -.2649577199E-02 .37701827E-02 .4822 AGE -.6818505385E-01 .42627664E-01 .1097 AFRAMER -.3075763934E-01 .20060775 .8781 ASIAN -.1049285771 .15627368 .5019 HISP -.4230648156 .26237402 .1069 HSCH -.2770401208E-03 .75695872E-03 .7144 INC .6241662518E-04 .25493359E-03 .8066 CHILD -.1911953971 .12829243 .1361 MARRY .1918317660 .12826532 .1348 GEO -.7027042888E-01 .11568585 .5436

52
When asked if they would buy FCFV (that they normally consume) coated with
an edible film that is safe for consumption, 79.63% of the respondents answered yes and
20.37% answered no. The data was analyzed using a Probit model (Table 16). The
likelihood ratio index was 0.0199. About 80% of the cases are predicted yes. None of the
demographic variables were significant at a=0.05 or 0.10, and therefore, were not further
discussed.
Table 16. Coefficients, standard errors and probability values of the demographic variables for the question “Would you buy FCFV coated with an edible film that is safe for consumption?” Variable Coefficient Standard errors P [|Z|>z] Constant 1.056610988 .19238867 .0000 GEN -.2209490078E-01 .11945680 .8533 AGE -.1881132797E-01 .46566828E-01 .6862 AFRAMER .1571306783 .17879347 .3795 ASIAN -.2248890641 .14161852 .1123 HISP .6817528074E-01 .19621869 .7283 HSCH -.3086844985E-02 .22598577E-01 .8914 INC .1977109139E-03 .28822182E-03 .4927 CHILD .1262481620 .13751506 .3586 MARRY -.1285863635 .13749141 .3497 GEO -.2097712316 .13068936 .1085
When asked if they would buy FCFV that are coated with edible coating
considered to be safe by FDA, after informing them of the facts about edible film,
84.63% of the respondents answered yes and 15.37% answered no. The data was
analyzed using a Probit model (Table 17). The likelihood ratio index was 0.0349. About
85% of the cases are predicted as “yes”. The demographic variable that was significant at
a = 0.05 was Geographic location. Respondents from Louisiana were less likely than
those from Georgia to buy FCFV that were coated with edible coating considered to be
safe by FDA, after informing them the facts about edible film. The demographic
variables that were significant at a=0.10 were respondents who were married and

53
respondents with children. Respondents with children were more likely to buy FCFV that
are coated with edible coating considered to be safe by FDA. Married respondents were
less likely to buy them even after informing them of the facts about edible film. More
data is required to confirm this observation.
Table 17. Coefficients, standard errors and probability values of the demographic variables for the question “After knowing the what edible coatings and films are, would you buy FCFV coated with an edible film that is safe for consumption?” Variable Coefficient Standard errors P [|Z|>z] Constant 1.532737234 .19642611 .0000 GEN -.5347869370E-03 .23801676E-01 .9821 AGE -.7680251854E-01 .49405305E-01 .1201 AFRAMER -.7716607423E-01 .20074969 .7007 ASIAN -.1696146010 .15881614 .2855 HISP .2472926186 .23131694 .2850 HSCH -.2160149138E-02 .65220028E-02 .7405 INC -.3628640061E-03 .26184291E-03 .1658 CHILD .2558941751 .14343797 .0744* MARRY -.2579400215 .14341694 .0721* GEO -.3060248660 .14146717 .0305**
When asked what price would they be willing to pay for coated FCFV compared
with whole/unprocessed FV on a per-pound basis, 70.97% of the respondents answered
the same, 16.78% answered higher and 12.25% answered lower. The data was analyzed
using an Ordered probit model (Table 18). The likelihood ratio index was 0.0080. None
of the demographic variables were significant at an alpha level of 0.05 or 0.10.
3.5. Discussions
Previous research has shown that the intake of fruits and vegetables is more in
females than in males (Laforge et al., 1994; Trudeau et al., 1998; Johansson et al., 1999).
In our study though gender was not significant for all the questions, the coefficient values
showed that females were more likely to prefer the different forms of FV compared to
males.

54
The results of the survey conducted by Johansson and others in 1999 showed that
older age groups had a higher intake of fruits and vegetables. In our study we had similar
results. As age increased, there was an increase in consumption of whole or unprocessed
FV.
Table 18. Coefficients, standard errors and probability values of the demographic variables for the question “What price would you be willing to pay for coated FCFV compared with whole/raw/unprocessed FV on a per pound basis?”
Variable Coefficient Standard errors P [|Z|>z] Constant .8874365762 .10150208 .0000 GEN -.6282835916E-03 .10556191E-01 .9525 AGE .1005673924E-02 .10449322E-02 .3358 AFRAMER .8978320628E-01 .17456783 .6070 ASIAN -.1549749681 .11684923 .1847 HISP .6472745808E-01 .19094165 .7346 HSCH .9161283855E-03 .64950736E-03 .1584 INC .2061865253E-03 .26342596E-03 .4338 CHILD -.4818951639E-01 .11165637 .6660 MARRY .4812065870E-01 .11153476 .6661 GEO .1107114497 .10969711 .3129 Mu 2.138337061 .83663472E-01 .0000
Respondents with children in the home preferred FCFV to canned FV when
compared to respondents without children in the home. The reason could also be health
related or the concern for additives added. Previous research showed that families with
caretaking responsibility for young children place a higher preference for fruits and
vegetables (Devine and Olson, 1992; Wandel, 1995; Laforge et al., 1994). Children
inhibit the consumption of more fruits and vegetables, because of preference for other
foods (Laforge et al., 1994). So it is possible that the adults in the family tend to include
more fruits and vegetables in their child’s diet as the dietary habits of childhood appear to
be retained into adulthood.

55
Asians were less likely to eat/use canned and frozen-cut FV compared to
Caucasians and others. Hispanic/Spanish were less likely to use FCFV compared to
Caucasians and others. This could be because they prefer to prepare the FC themselves
and tend to prepare meals at home rather than eating foods already prepared or in a
restaurant/fast food stores. This study showed that the different ethnicity did affect the
consumption behavior of different forms of fruits and vegetables and knowledge about
edible coatings and films. The results were similar to previous studies conducted on fruits
and vegetables consumption (Devine et al., 1999). However, it should be noted that the
percentages of African Americans, Asians and Hispanic/Spanish are small compared to
Caucasians, and therefore, more data are needed to confirm our observations.
Respondents from Georgia were more likely to have heard about edible coatings
and films. This could be due to the reason that more research is conducted on edible
coatings and films in Georgia.
3.6. Limitations
This study has a few limitations. The validity of the results depends on the
survey method. This survey was conducted in the university campuses as a result of
which there was not an equal distribution of age and education level in the data collected
(i.e., sampling was not random). Although the university has students from different
cultures, our survey could not have enough consumers from different races. People over
55 years were only a few. So they were not included in the data analysis. There were
majority of Caucasians therefore results cannot be generalized to minority respondents.
People with lower education level could not be recruited. The questionnaire was focused
on both fruits and vegetables, which was too general. It is important to study the

56
consumer acceptance of fruits and vegetables separately, mainly because the use is
different for both of them. Fruits are usually sweet and eaten raw, but vegetables are
usually bitter and mostly cooked before consumption (Trudeau et al., 1998, Devine et al.,
1999). All these resulted in large variations in the responses, low likelihood ratio index
and low significance of the demographic variables.
Many people do not know much about edible coatings. The only edible coating
they are aware of is edible wax. Consumers must be educated about the composition,
advantages and applications of edible coatings in order to help them choose a better
product.
57
CHAPTER 4. PHYSICAL AND MICROBIAL QUALITY OF FRESH-CUT APPLES COATED WITH WHEY PROTEIN 4.1. Introduction
Fresh-cut fruits and vegetables (FCFV) are convenient, nutritious foods with
additional benefit of reduced wastage for consumers (Watada et al., 1996). The
consumption of fresh-cut fruits and vegetables is increasing tremendously, due the
changes in consumer lifestyle, increasing health consciousness and purchasing power. As
a result, the maintenance of the quality of FCFV is becoming more challenging. Rapid
quality deterioration is mainly due to the high metabolic rates as a result of cutting,
trimming, and peeling.
Processing of the fruits or vegetables results in loss of color, texture and moisture,
and microbial growth. If not controlled, these changes can lead to rapid senescence and
quality deterioration of the product. The techniques that are being used to preserve the
quality of whole fruits are not effective for fresh-cut produce. This is because of the
physical stress and strain the fresh-cuts undergone during minimal processing, which, in
turn, increases respiration rates, ethylene production, color loss, firmness loss, weight
loss and other physical, chemical, physiological and microbial changes.
Techniques such as a combined low temperature and high relative humidity,
modified atmosphere packaging (MAP) and controlled atmosphere packaging (CAP) are
being used for maintaining the quality of fresh produce. Low temperature storage could
cause chilling injury and CAP and MAP could cause anaerobic respiration that leads to
decay of the produce. The disadvantages of these techniques prompt the development of
other improved techniques, like edible coatings and films.

58
Edible coatings, when used in proper combination can be used effectively to
preserve the quality of fresh-cut fruits and vegetables, by acting as oxygen and moisture
barriers. Milk protein coatings have been studied for many years. They are very good gas
barriers but are poor moisture barriers because of their hydrophilic nature. By adding the
plasticizers like sorbitol or glycerol to whey proteins, they have shown to reduce the
water vapor permeability of the films. The plasticized films had greater mechanical
strength and the water barrier properties (Banker, 1966).
Whey protein and glycerol films have good oxygen and barrier properties.
Research has been done to determine the mechanical, oxygen and moisture barrier
properties of these films. However, little information is available on the applications of
whey protein coatings on FCFV.
Apple is a climacteric fruit, which is a popular and commercially important fresh-
cut item (Jiang and Joyce 2002). Fresh-cut apples turn brown rapidly, sometimes in a few
seconds. The other problems with them are loss of firmness, weight loss and microbial
growth. Milk proteins could be beneficial for maintaining the quality of fresh-cut apples
without affecting the sensory properties (Tien et al., 2001).
4.2. Objective
The objective of this study was to determine the effects of three different whey
protein coatings: whey protein concentrate, whey protein isolate, and hydrolyzed whey
protein concentrate, on the physical and microbial qualities of freshly cut Fuji apple
pieces.

59
4.3. Materials and Methods
4.3.1 Preparation of Coating Solutions
Whey protein concentrate (Proliant™ 8000) and partially hydrolyzed whey protein
concentrate (Proliant™ 8600) were supplied by Proliant, Inc., Iowa and the whey protein
isolate (Provon 190) was supplied by Glanbia Ingredients, Wisconsin. Two
concentrations (5% and 10% w/v) for each whey protein solutions were prepared.
The food grade glycerol (Fischer Scientific, New Jersey) was added at 30% of the
whey protein powder. It has been shown that the glycerol content should be between 25-
35% of the whey protein to obtain better films (Sothornvit and Krochta, 2000).
Distilled water was sterilized (121C for 16 minutes)and used as a control
treatment. For a 10% coating solution, 150 grams of the whey protein powder was
dissolved in 1305 ml of sterile water for 10 minutes using a stir plate and a magnetic
stirrer. Then, 45 grams (which is 30% of the whey protein powder) of food-grade
glycerol was added to the solutions and again stirred for another 10 minutes. The solution
was filtered using cheesecloth (Lilly Industries, Inc., Michigan).
Similarly, 5% whey protein solutions were prepared using 75 grams of the whey
protein powder, 1402.5 ml of sterile water and 22.5 grams of food-grade glycerol.
About 350 ml of each of the six coating solutions and the sterile water was
transferred into 4 sterile plastic boxes and wrapped with an aluminum foil and
refrigerated until used. The remaining solution was saved for pH measurement.
A total of 6-whey protein coating solutions and a control (water) were prepared.
The pH of the control (sterile water) was 7.1, WPC solutions were 6.45, WPI solutions
were 6.3 and PHWPC solutions were 6.8.

60
4.3.2. Preparation of Apple Pieces
Fuji apples were appropriate for fresh-cut processing, mainly because of their
firmness (Hall, 1995). Thus, Fuji apples were selected for use in this study.
Fuji apples were purchased from a local grocery store (Albertson’s) in Baton
Rouge, Louisiana. The apples with similar size, shape, color and lack of defects were
selected. All apples used were from the same orchard.
The apples were stored in a refrigerator at 2°C, before dipping in coating
solutions. Apples were rinsed thoroughly with tap water to remove any surface
impurities. They were then dipped in a 3% hydrogen peroxide solution for 2 minutes.
Finally, the apples were rinsed with sterile water.
A cutting board was marked to aid in equal slicing of apples. An apple wedger
(Good Grips, China) was used to core and slice each whole apple into 8 wedges. An
additional 2-3 mm slice was removed from the core side of each wedge to minimize
browning and decay. A sterile knife was then used to cut each wedge into pieces of 1.5
cm length, discarding the corners of the wedge. The apple pieces were dipped in the
refrigerated (2°C) coating solution as soon as they were cut, for about 10 minutes. They
were then removed and placed on a wire tray for another 10 minutes. A fan was used to
blow air to aid in draining.
For this study, it would be difficult to prepare all cut apple pieces at one time
sufficient for all coating treatments. The cut apple pieces would turn brown prior to
coating treatments. To minimize this problem, each whole apple was used for each
quality parameter test and each coating treatment (See Appendix E). A total of 28 apples
were used for 7 coating treatments (including the control) and 4 quality parameters
61
(weight loss, firmness, color and microbial growth). Three apple pieces from each apple
were placed in a sterile plastic container and marked according to the treatments and the
storage day (1, 4, 7, 10, and 13) of analysis.
Three pieces from each apple were stored in each container, and a total of 5
containers were used for microbial analysis (15 pieces total). Similarly, three pieces were
stored in 5 containers for color analysis. For texture analysis, four pieces from each apple
were stored in each of the 5 containers (20 pieces total). For moisture analysis, only 5
pieces from each apple were stored in five individual containers (25 pieces total). The
containers were labeled according to the treatment and the storage day of analysis. The
experimental design is shown in the appendix E in a table form for better understanding.
The samples were drawn from the refrigerator, at day 1, 4, 7, 10 and 13. Four
containers for analysis of color, texture, microbial count and weight loss. The whole
experiment was repeated twice (two true experimental replications).
4.3.3. Color Analysis
The color measurements were performed with a spectrophotometer (Minolta CR 200,
Minolta Co., Osaka, Japan). The calibration was done against a standard white plate
provided by the manufacturer. The light source for the spectrophotometer was a pulsed
xenon arc lamp and the observer angle used was 10°. The CIE L*, a*, b* and
colorimetric color (chrome, c and hue angle, h) were recorded on 3 pieces (both sides and
averaging five color measurements on the surface of each side) from each treatment
every 3 days of storage. The chroma is calculated as (a*2 + b*2) 1/2 and the hue angle as
tan-1 (b*/a*).

62
4.3.4. Texture Analysis
The firmness of apple pieces was analyzed using a TA-XT2 plus texture analyzer
(Texture Technologies Corp., New York). The test used was a shear or cut test on the
apple pieces with TA-42 45°- chisel knife blade. The variations in apple size, and
geometry were minimized by testing the replicates of pieces of same thickness from the
same apple.
The test mode used for the texture analysis was “Force in Compression” with an
option of “Repeat until count”. A 5 kg load cell, test speed of 5 mm/s and post-test speed
of 10 mm/s were used. The “Trigger type” was set to “Button” and distance to be traveled
was set to 38mm.
The following macro function was used to analyze the graph:
Macro
Clear Graph Results
Redraw
Search Forwards
Go To Min Time
Set Force Thresholds 600g
Go to Peak +ve Value Force
Mark Value Force
Go to Peak +ve Value Force
Mark Value Force
Go to Peak +ve Value Force
Mark Value Force

63
Go to Peak +ve Value Force
Mark Value Force
Calibration
The texture analyzer was calibrated for force and height before every test. The
force was calibrated using 2 kg weight provided by the manufacturer. The height was
calibrated to 40 mm.
The test cuts the apple pieces to the bottom, leaving a gap of exactly 2 mm over
the base of the texture analyzer. Once the blade had sheared the first piece, the cut piece
was quickly removed and the base was wiped with a wet paper towel, to remove the juice
expelled so that it did not interfere with the cutting of the next piece (slipping). Then, the
next apple piece was immediately placed under the knife blade. This was repeated until
all the four pieces for each coating treatment had been tested.
Once the tests were performed, the force (kg) values for sample analysis are
automatically obtained by the MACRO. A curve was produced from shearing four apple
pieces and the peak values of the force (kg) obtained from a Result file. The greater the
maximum force, the greater is the firmness.
4.3.5. Microbial Analysis
Phosphate Buffer Solution (PBS) Preparation: Sodium monophosphate (2.4g), sodium
diphosphate (2.85g), and sodium chloride (8.4g) were dissolved in 1 liter of distilled
water and stirred until the salts were dissolved using a magnetic stirrer on a stir plate.
Then the solutions were transferred into bottles and sterilized in an autoclave (121°C, 15
PSI for 16 min).
64
A sharp knife, test tubes, test tube caps, 1 ml pipette tips and a PBS solution were
sterilized in an autoclave before used for analysis. Dilutions were prepared using the PBS
solution, transferred into test tubes covered with the test tube caps, and kept under the
hood until used. The stomacher bags and the TPC and Ecoli/Coliform plates were
labeled.
About 5g of each apple piece was diluted with 5ml of sterile PBS solution in a
sterile stomacher bag and blended using a stomacher (Unique Scientific Aparatus, Ohio)
for 2 minutes. The homogenate was diluted in the sterile solutions to achieve 10-fold
(w/v) dilution (10-1) of the sample. The microbial counts included total plate counts and
E.coli/Coliform plate counts. The petrifilms (3M Microbiological Products, Minneapolis)
were incubated at 37°C for 24 hours. Microbial analysis was performed in triplicates and
the results were the average of the three determinants. Results were presented as
logarithm of colony forming units per gram (log CFU/g) of the product.
4.3.6. Weight Loss Analysis
Apple pieces from each coating treatment and from each container were removed
using a pair of tongs and weighed on a balance (Mettler Toledo, Switzerland). Each apple
piece was weighed on the first day and then every three days (i.e., 1, 4, 7, 10, and 13).
For each treatment, percentage weight loss was calculated based on the corresponding
weight of the apple pieces at day 1.
4.3.7. Statistical Analysis
Data were analyzed by analysis of variance using PROC GLM of the Statistical
Analysis System (SAS). Specific differences in color, texture, microbial counts and
weight loss within each treatment during days of storage were determined by least

65
significant difference (LSD). All comparisons were made at a 5% level of significance.
We did not attempt to statistically compare across coating treatments; however, the trends
will be reported.
4.4. Results and Discussions
There was a significant difference in weight loss (Table 19) for the control sample
after the 13-day storage, and still the weight loss was higher compared to other treatments
(2.519%). A significant weight loss in the PHWPC coated apples was observed after 7
days of storage. The 5%WPC, 10%WPC and 5%WPI prevented significant weight loss of
apple pieces for at least 10 days of refrigerated storage.
Table 19. Effect of coating treatments on weight loss (%) of coated fresh-cut apples Treatments/Days 4 7 10 13
control 1.16 a 1.49 ab 2.18 ab 2.51 b 0.76 1.11 1.52 1.49
5%WPC 1.08 a 1.12 a 1.68 ab 2.26 b 0.70 0.75 0.85 1.11
10%WPC 1.23 a 1.17 a 1.31 a 1.82 a 0.66 0.74 0.97 1.39
5%WPI 1.02 a 1.12 a 1.58 ab 2.15 b 0.49 0.61 0.87 1.22
10%WPI 0.59 a 1.18 ab 1.51 bc 2.12 c 0.44 0.50 0.88 1.40
5%PHWPC 0.25 a 1.34 b 1.38 b 2.01 c 0.49 0.82 0.81 0.86
10%PHWPC 0.08 a 0.91 b 1.07 b 2.06 c 0.30 0.75 0.76 1.09
*For each treatment values in the second row are standard deviations and the mean values (the first row) with different superscripts are significantly different (p<0.05).
There was no significant difference in weight loss after 13 days of refrigerated
storage of 10%WPC (1.826% or 0.12g) coated apple pieces and the weight loss was less
than all the other treated apples. This could be due to the composition of WPC (fat 4.3%,

66
Calcium 556mg/100g, Lactose 4.3% and cysteine 2.8g/100g of the product). This shows
that 10%WPC was significantly effective in reducing weight loss of fresh-cut apples.
This is advantageous when fresh-cut apples are being transported for further processing
or utilization.
There was no significant difference in firmness between day 1 and day 13 in all
the treated apple pieces, except for control (Table 20). The control samples were
undesirably soft after 13 days.
Table 20. Effect of coating treatments on firmness loss (reported as shear force in kg) of coated fresh-cut apples Treatments/Days 1 4 7 10 13
control 3.57 a 2.62 b 2.96 ab 2.99 ab 2.08 b 0.31 0.75 0.59 0.90 0.29
5%WPC 3.20 a 3.64 3.03 a 2.86 a 3.02 a 0.56 0.42 0.61 0.51 1.33
10%WPC 2.48 a 3.33 a 3.10 a 3.12 a 3.16 a 0.33 0.57 0.59 0.91 0.61
5%WPI 3.20 a 2.79 a 2.81 a 3.14 a 2.92 a 0.66 1.09 0.53 0.49 0.35
10%WPI 3.25 a 3.12 a 3.02 a 3.24 a 3.73 a 0.66 0.51 0.62 0.60 0.76
5%PHWPC 2.85 a 3.10 a 2.92 a 2.61 a 2.96 a 0.56 0.60 0.58 0.69 0.91
10%PHWPC 2.40 b 3.55 a 2.83 ab 2.96 ab 3.16 ab 0.30 0.55 0.73 0.70 0.66
*For each treatment values in the second row are standard deviations and the mean values (the first row) with different superscripts are significantly different (p<0.05).
The loss of firmness during storage in apples could be due to the action of
endogenous enzymes related to cell wall degradation and growth of microorganisms
(Rolle and Chism, 1987; Kim et al., 1993). In our experiment, the softening could be due
to action of endogenous enzymes related to cell wall degradation, as we did not find any

67
microbial growth during the storage. The apple pieces coated with 10% whey protein
solutions were firmer than the ones coated with 5% whey protein solutions after 13 days.
The values for total plate count (Table 21) for all the treatments ranged from Non-
detectable (ND) to 0.54 log CFU/g, except for the 10%WPC and 10%PHWPC on the
13th day, which had 3.03 and 1.58 log CFU/g, respectively, for the first batch. This could
be due to cross-contamination.
Table 21. Effect of coating treatments on total plate count (log CFU/g) of coated fresh-cut apples
Treatments/Days 1 4 7 10 13
control ND a 0.37 a 0.19 a 0.44 a ND a 5%WPC 0.05 a 0.54a 0.48 a 0.35 a ND a 10%WPC ND a 0.10 a 0.17 a 0.05 a 1.44a 5%WPI 0.05 a 0.12a 0.19 a 0.17 a ND a 10%WPI ND a 0.28 a 0.30 a 0.10 a ND a
5%PHWPC 0.33 a 0.25 a 0.05 a 0.20a ND a 10%PHWPC ND a 0.36 a ND a 0.10 a 0.34 a
*For each treatment values the mean values with different superscripts are significantly different (p<0.05).
The E.coli/Coliform counts were non-detectable for all the treated apple pieces,
except for the controls. In the first batch, there was some growth in the 10%WPC (2.8 log
CFU/g) and 10%PHWPC (1.66 log CFU/g) (similar to total plate count) on the 13th day.
The colonies were reddish brown without air bubbles around them, so we could not
confirm whether they were E.coli or Coliform. In the second batch, one of the control
samples tested on the 4th day had one colony of E.coli. The apples were disinfected
before cutting, by dipping in 3% hydrogen peroxide. This E.coli/Coliform could be due to
cross-contamination.

68
Both the visual observations and L* values (Table 22) showed that the control,
5%PHWPC and 10%PHWPC coated apple pieces turned brown on the first day. There
were no significant changes in the L* values for the WPC (5% and 10%) and WPI
(5%and 10%) coated apple pieces during the 13-day storage, showing that these coatings
may have effectively protected the apple pieces from oxygen and retarded enzymatic
browning. For apple pieces coated with 10%WPI, 10%WPC, 10%PHWPC solutions,
there were slight increases in L* values. In 5%PHWPC coated apple pieces the L* value
significantly increased from 70.79% to 75.365%. The increase in L* values during the
storage is probably due to the exudation of natural liquid present in the apple or the
coating solution that contribute to increase L* values (Tien et al., 2001).
Table 22. Effect of coating treatments on L* values of coated fresh-cut apples
Treatments/Days 1 4 7 10 13 control 73.23 a 70.02 b 71.7 ab 70.98 ab 71.59 ab
1.97 1.93 2.05 2.69 2.74 5%WPC 76.24 a 76.14 a 75.90 a 74.89 a 75.78 a
2.10 2.40 1.96 1.75 1.02 10%WPC 74.94 a 75.08 a 76.51 a 74.86 a 75.66 a
2.25 1.67 0.79 1.05 2.47 5%WPI 74.68 a 72.25 a 74.1 a 72.84 a 74.08 a
2.15 2.78 2.33 1.89 3.69 10%WPI 74.53 a 74.12 a 75.32 a 74.30 a 75.94 a
2.23 2.12 3.67 2.21 1.75 5%PHWPC 70.79 a 72.51 ab 75.15 b 73.47 ab 75.36 b
2.50 2.59 3.13 3.42 3.08 10%PHWPC 72.48 a 73.41 a 74.94 a 73.02 a 73.99 a
2.27 2.77 2.16 2.60 2.63 *For each treatment values in the second row are standard deviations and the mean values (the first row) with different superscripts are significantly different (p<0.05).

69
The increased colorimetric a* values (Table 23) after 13 days of storage were
indicative of increased reddish brown color in the cut apples. The visual observation and
a* values showed that in the control, 5%PHWPC and 10% PHWPC coated apples
browning took place on the first day. There were significant differences in a* values
during the 13 day storage for fruits coated with both 5%WPI and 10%WPI solutions.
Comparing 5%WPC and 10%WPC, it can be seen that there is a significant increase in
redness after the 7th day. Even though there was a significant difference during the 13-
day storage for 10% WPC coating, the visual observation could not differentiate the color
changes. The sensory evaluation should also be considered in order to judge the color
changes of food samples.
Table 23. Effect of coating treatments on a* values of coated fresh-cut apples Treatments/Days 1 4 7 10 13
control 3.54 a 4.04 ab 4.52 ab 4.50 ab 4.89 b 1.02 0.85 1.24 0.86 0.86
5%WPC 1.96 a 2.85 a 4.45 b 4.682 b 5.11 b 1.28 1.35 0.90 0.38 0.56
10%WPC 1.01 a 1.84 a 2.36 b 3.13 b 3.15 b 0.95 0.60 0.68 0.95 1.30
5%WPI 1.88 a 2.46 ab 3.57 b 3.11 ab 3.42 b 0.77 0.54 1.79 0.90 1.31
10%WPI 1.27 a 2.28 a 2.66 a 3.00 b 3.06 b 0.84 0.56 1.76 1.64 1.51
5%PHWPC 3.44 a 2.90 a 3.85 a 3.94 a 3.92 a 1.62 0.56 2.06 2.24 1.88
10%PHWPC 3.15 a 3.23 a 4.21 ab 4.41 b 5.11 b 0.70 0.65 1.20 1.43 1.16
*For each treatment values in the second row are standard deviations and the mean values (the first row) with different superscripts are significantly different (p<0.05).

70
The chroma © values (Table 24) depend on a* and b* values [c= v (a*2 + b*2)].
The c value indicates the color intensity (saturation) of the sample. There was no
significant difference in chroma seen in control, 5%WPC, 10%WPC and/or 5%WPI
coated apple pieces between day 1 to day 13. But there was a significant decrease in
chroma values of 10%WPI, 5%PHWPC and 10%PHWPC coated apple pieces, during the
storage period of 13 days. This could be due to the significant lower b* values in
10%WPI (20.935-18.636), 5%PHWPC (from 24.42 to 19.09) and 10%PHWPC (from
22.21 to 19.504) coated fruits.
Table 24. Effect of coating treatments on chroma values of coated fresh-cut apples
Treatments/Days 1 4 7 10 13 control 24.67 a 24.42 a 25.46 a 25.77 a 24.32 a
3.49 1.97 2.73 1.57 1.60 5%WPC 19.64 a 20.02 a 18.80 a 19.84 a 20.18 a
2.45 2.34 1.28 0.65 0.59 10%WPC 20.35 a 20.26 a 19.62 a 19.42 a 19.30 a
2.33 1.52 1.92 1.39 1.35 5%WPI 21.13 ab 21.02 ab 22.06 a 20.09 b 21.02 ab
1.31 1.91 2.06 1.80 1.88 10%WPI 20.98 ab 21.15 b 19.91 abc 19.43 ac 18.93 c
1.67 1.94 2.14 1.42 1.49 5%PHWPC 24.67 a 21.06 b 20.40 b 20.73 b 19.54 b
6.03 2.07 1.81 2.39 1.66 10%PHWPC 22.43 a 21.33 ab 20.68 c 21.02 bc 20.19 bc
1.56 1.51 1.38 1.17 0.79 *For each treatment values in the second row are standard deviations and the mean values (the first row) with different superscripts are significantly different (p<0.05).
The hue angle is calculated as tan-1(b*/a*). As the hue angle decreases the red
pigment increases. During the storage period, hue angle values (Table 25) for all apple
pieces decreased significantly from day 1 to day 13. The 5%PHWPC and 10%PHWPC

71
coated fruits and the control fruits were brown the first day and had similar hue angle
values (approximately 82). Comparing 5%WPI and 10%WPI, it can be seen that the
fruits turned brown by the 7th day. 5%WPC coated fruits turned brown on the 7th day
and 10%WPC coated fruits turned brown on the 10th day.
Table 25. Effect of coating treatments on hue angle values of coated fresh-cut apples Treatments/Days 1 4 7 10 13
control 81.70 a 80.48 a 79.77 ab 79.89 ab 78.4 b 2.13 1.72 2.60 2.11 1.65
5%WPC 84.04 a 81.46 a 76.30 b 76.31 b 75.29 b 4.20 4.68 2.37 1.53 1.99
10%WPC 87.12 a 84.78 a 82.92 ab 80.60 b 80.58 b 2.51 1.64 2.50 3.04 3.84
5%WPI 84.82 a 83.17 ab 80.79 b 81.00 b 80.64 b 2.27 1.57 4.03 2.87 3.37
10%WPI 86.49 a 83.79 ab 82.49 b 81.28 b 80.69 b 2.20 1.36 4.42 4.31 4.49
5%PHWPC 82.25 ab 83.15 a 79.80 ab 79.42 ab 78.66 b 1.87 4.17 5.54 5.14 4.67
10%PHWPC 81.93 a 81.34 a 78.38 ab 78.01 b 75.37 b 1.86 1.34 5.30 3.38 8.25
*For each treatment values in the second row are standard deviations and the mean values (the first row) with different superscripts are significantly different (p<0.05).
As b* values decreases, yellow color decreases. There was no significant
difference in b* values (Table 26) for the 5%WPC and 10%WPC coated fruits during the
13 day storage period. But the control, 5%PHWPC and 10% PHWPC were brown by the
first day based on the visual observations.

72
Table 26. Effect of coating treatments on b* values of coated fresh-cut apples Treatments/Days 1 4 7 10 13
control 24.4 a 24.07 a 25.03 a 25.36 a 23.84 a 3.46 1.93 2.68 1.63 1.518
5%WPC 19.5 a 19.77 a 18.25 a 19.28 a 19.52 a 2.53 2.51 1.20 0.75 0.72
10%WPC 20.31 a 20.17 a 19.46 a 19.14 a 19.08 a 2.32 1.51 1.98 1.46 1.36
5%WPI 21.04 ab 21.03 ab 21.72 a 19.83 ab 20.73 b 1.35 1.84 1.89 1.84 1.87
10%WPI 20.93 ab 21.03 b 19.67 abc 19.14 ac 18.63 c 1.66 1.93 1.98 1.23 1.47
5%PHWPC 24.42 a 20.85 b 19.95 b 20.28 b 19.09 b 5.86 2.06 1.40 2.04 1.36
10%PHWPC 22.21 a 21.08 ab 19.57 c 20.52 bc 19.50 c 1.58 1.45 1.58 0.93 0.64
* For each treatment values in the second row are standard deviations and the mean values (the first row) with different superscripts are significantly different (p<0.05).
WPI is the purest form of whey protein and contains between 90-95% of protein
(Anonymous, 2001b). It contains little fat or lactose. WPC is ava ilable in different types
based upon the protein content of the product, which ranges between 25-89%. It contains
some lactose, fat and minerals. As the protein level increases in the whey protein, the
amount of lactose decreases. Whey protein concentrate with 80% protein content is the
form most readily available as a protein powder supplement. The process of hydrolysis
breaks the protein chains (in WPC) down to smaller segments called peptides.
Hydrolyzed whey protein is more easily digested and has a reduced potential for allergic
reactions versus non-hydrolyzed WP. The quality of the protein, however, remains very
high.

73
Milk proteins delay color changes due to their oxygen barrier properties. But
previous studies showed that these coatings are not completely impervious to oxygen
(McHugh and Krochta, 1994). They allow enough penetration of oxygen so that it lowers
the risks of anaerobic conditions and retards enzymatic browning.
Tien and others (2001) indicated that other agents could also inhibit enzymatic
browning. The presence of amino acids (particularly cysteine) in the milk proteins
inhibits the polyphenol oxidases via its SH groups. It acts as an agent coupling quinones
and forms stable colorless compounds. Research also showed that histidine, tyrosine,
phenylalanine, and tryptophan also inhibited enzymatic browning. Furthermore, the
prevention of browning was also shown due to the presence of fatty acids (5.4% in whey
protein concentrate). The fatty acids helped in moisture barrier properties and
significantly reduced browning in fresh-cut apples (McHugh and Senesi, 2000).
This study demonstrated that WPC, which has a bland taste and can form flexible
films, is effective in extending the shelf- life by acting as a barrier to moisture and
oxygen. It should be further studied and commercialized as an edible coating for fresh-cut
apples.

74
CHAPTER 5. CONCLUSIONS
This research was designed to understand the consumer perception of fresh-cut
fruits and vegetables (FCFV) with or without edible coatings and to determine the effect
of three different whey protein coatings on the quality of fresh-cut Fuji apples.
The majority of the respondents preferred FCFV to canned and frozen-cut FV but
minority preferred FCFV to whole raw/unprocessed FV.
The majority of the female respondents used FCFV at least once a week. But
among males, the majority of the respondents used FCFV once a week.
Up to 75% and 93.5% of the respondents, respectively, knew that cucumber and
apple were coated with an edible material. However, many of them were not aware of the
advantages and applications of edible coatings or films. Some of the respondents wished
to peel or wash off the edible coating before use and some did not wish to consume
edible coatings from animal sources. Some indicated that they would purchase fresh-cut
fruits and vegetables coated with an edible coating that is approved by FDA. The
purchase intent increased by 7% after the advantages of edible coatings had been
described to the consumers.
The large population study allowed for comparisons of different age, income and
ethnic/racial groups. Our results showed that changes in the consumption of FCFV, either
coated or uncoated, depends on gender, age, income level, race, and family size of the
consumers.
In this study the consumers attitudes and perception of fruits and vegetables and
edible coatings and films have been explored and the factors affecting the consumption of
FCFV have been identified. However, there is a need to educate the consumers on edible

75
coatings and films and their applications and advantages in order to help the industry
satisfy the consumers’ needs. This study suggests that the industry should place greater
emphasis on lower income group, males, and people who do not have children in the
home when tailoring educational messages to these groups.
The second part of this study showed that 10%WPC coating was the most effective
and desirable edible coating for commercial application for fresh-cut Fuji apples. Its
excellent moisture barrier property reduced moisture loss, maintained color, fruit
firmness and freshness.
WPI coatings were effective in maintaining L* values but were not effective in
preventing weight loss. Compared to WPC, WPI has low fat and lactose content. Even
after adding 30% glycerol, WPI was not as effective as WPC in preserving the quality of
fresh-cut apple pieces. PHWPC coatings were not effective in either reducing weight loss
or preserving the color of the apples. Compared to WPC, PHWPC had lower amino acid
content, low lactose content and low calcium. PHWPC was also not effective in
preserving the quality of fresh-cut apple pieces, even after addition of 30% glycerol.
Firmness of the coated samples did not significantly change after 13-day storage
compared to that of the control, which was undesirably soft. The 10% coating solutions
were better than the 5% solutions in maintaining the firmness. The 5% coated samples
had no microbial growth during the 13-day storage. No E.coli or Coliform was found in
the coated samples.
Use of Whey protein concentrate as an edible coating for fresh-cut apples is
beneficial to the food industry in controlling enzymatic browning, moisture loss and
firmness loss.

76
This study provides information that may help in filling a few voids in the area of
edible coatings and fresh-cut fruits and vegetables.

77
CHAPTER 6. RECOMMENDED FUTURE WORK
1. More research should be conducted on sensory and consumer acceptance of fresh-
cut fruits and fresh-cut vegetables separately, coated with edible coatings.
2. Tests should be conducted to determine the consumer attitude towards the sensory
quality of coated fresh-cut apples.
3. Research should be conducted to understand the mechanism of the effect of whey
protein coatings on preserving the quality of fresh-cut apples, in order to develop
methods for handling and storage of fresh-cuts without loss of quality and to
understand the full potential of whey protein coatings.

78
REFERENCES
Acuff, G. 1993. Fresh-cut: New market for fruit? Fruit Grower. December. 16-17. Ahmad, M. and Khan, I. 1987. Effects of waxing and cellophane lining on chemical quality indices of citrus fruits. Plant foods for Human Nutrition. 37: 47-57.
Anker, M. 2000. Edible and biodegradable whey protein films as barriers in foods and food packaging. http://www2.lib.chalmers.se/cth/diss/doc/0001/AnkerMartin.html 10/21/2002.
Anonymous. 1998a. apple wax. Wax on apples. http://www.geocities.com/perfectapple/apple_wax.html 10/16/2002.
Anonymous. 1998b. Sugar, carbohydrates and acid in apples. http://www.geocities.com/perfectapple/suga_carbohydrates_acid.html 10/16/2002.
Anonymous. 1998d. Why fresh cut apples turn brown. http://www.geocities.com/perfectapple/brown.html 10/16/2002.
Anonymous. 1998c.The science of apples and how they are grown. Science of apples. Http://www.geocities.com/perfectapple/science.html 10/16/2002.
Anonymous. 2000a. Apples. Http://www.sierragoldtrees.com/apples.html 10/8/2002.
Anonymous. 2000b. Fresh-cut apples: A new convenience food. Agricultural Research. 48(10): 2280.
Anonymous. 2001a. Bodybuilding supplements and reviews. http://www.bodybuildingforyou.com/protein/whey-protein- isolate-concentrate.htm 10/8/2002.
Anonymous. 2001b. Whey protein facts. Whey Protein Institute. http://www.wheyoflife.org/facts.html 10/21/2002. Anonymous. 2002a. All about protein. Supplements 101. http://www.supplements101.com/supplements/allprotein.htm 10/8/2002.
Anonymous. 2002b. Uses for whey protein edible films/coatings. http://www.extraordinarydairy.com/archive/fs_edible_film.pdf 5/1/2002.
Anonymous. 2002c. Whey Protein http://www.pacific -nutrition.com/wheyprotein.html 5/1/200275.

79
Arvanitoyannis, I., and Gorris, L.G.M. 1999. Edible and biodegradable polymeric materials for food packaging or coating in Processing foods: Quality optimization and process assessment. CRC Press, Boca Raton, Fla, page 357-371. Avena-Bustillos, R.J., Cisneros-Zevallos, L.A., Krochta, J.M., and Saltveit, M.E. 1994. Application of casein- lipid edible film emulsions to reduce white blush on minimally processed carrots. Postharvest Biology and Technology 4: 319-329.
Avena-Bustillos, R.J., Krochta, J.M., and Saltveit, M.E. 1997. Water vapor resistance of red delicious apples and celery sticks coated with edible caseinate-acetylated monoglyceride films. Journal of Food Science. 62(2): 351-354.
Avena-Bustillos, R.J., Krochta, J.M., Saltveit, M.E., Rojas-Villegas, R.J., and Sauceda-Perez, J.A. 1994. Optimization of edible coating formulations on zucchini to reduce water loss. Journal of Food Engineering. 21(2): 197-214.
Bai, J.H., Saftner, R.A., Watada, A.E., and Lee, S.Y. 2001. Modified atmosphere maintains quality of fresh-cut cantaloupe (Cucumis melo L.). Journal of Food Science. 66(8): 1207-1211.
Baldwin, E.A, Nisperos-Carriedo, M.O., and Baker, R.A.1995. Use of edible coatings to preserve quality of lightly (and slightly) processed products. Critical Reviews in Food Science and Nutrition. 35(6): 509-52.
Baldwin, E.A., Nisperos, M.O., Chen, X., Hagenmaier, R.D. 1996. Improving storage life of cut apple and potato with edible coating. Postharvest Biology and Technology 9(2): 151-163.
Banker, G.S. 1966. Film coating theory and practice. Journal of Pharmaceutical Science. 55:81-89.
Banks, N.H. 1984. Some effects of TAL Pro- long coating on ripening bananas. Journal of Experimental Botany. 35(150): 127-137.
Ben-Yehoshua, S. 1985. Individual seal-packaging of fruit and vegetables in plastic film- A new postharvest technique. Horticultural Science. 20(1): 32-36.
Ben-Yehoshua, S., Kobiler, I., and Shapiro, B. 1979. Some physiological effects of delaying deterioration of citrus fruits by individual seal packaging in high density polyethylene film. Journal of American Society for Horticultural Science. 104(6): 868-872.
Ben-Yehoshua, S., Shapiro, B., Chen, Z.E., and Lurie, S. 1983. Mode of action of plastic film in extending life of lemon and bell pepper fruits by alleviation of water stress. Plant Physiology. 73: 87-93.

80
Ben-Yeshoshua, S. 1966. Some effects of plastic skin coatings on banana fruit. Tropical Agriculture Trinidad. 43(3): 219-232.
Bett, K. L., Ingram, D. A., Grimm, C. C., Lloyd, S. W., Spanier, A. M., Miller, J.M., Gross, K.C., Baldwin, E.A., and Vinyard, B.T. 2001. Flavor of fresh-cut gala apples in barrier film packaging as affected by storage time. Journal of Food Quality. 24(2): 141-156.
Brecht, J.K. 1995. Physiology of lightly processed fruits and vegetables. Horticultural Science. 30(1): 18-22.
Bussel, J., and Kenigsberger, Z. 1975. Packaging green bell peppers in selected permeability films. Journal of Food Science. 40: 1300-1303.
Cantwell, M. 2002. Postharvest handling systems: minimally processed fruits and vegetables. Vegetable Research & Information Center. University of California Cooperative Extension. http://vric.ucdavis.edu/selectnewtopic.minproc.htm 10/8/2002.
Carlin, F., Nguyen-The, C., Hilbert, G and Chambroy, Y. 1990. Modified atmosphere packaging of fresh, “ready-to-use” grated carrots in polymeric films. Journal of Food Science. 55(4): 1033-1038.
Carrillo-Lopez, A.; Ramirez-Bustamante, F.; Valdez-Torres, J.B., Rojas-Villegas, R., and Yahia, E.M. 2000. Ripening and quality changes in mango fruit as affected by coating with an Edible Film. Journal of Food Quality. 23(5): 479-486.
Cheah, L.H., Page, B.B.C., and Shepherd, R. 1997. Chitosan coating for inhibition of sclerotinia rot of carrots. New Zealand Journal of Crop and Horticultural Science. 25: 89-92.
Chen, X.H., Campbell, C.A., Grant, L.A., and Li, Pieyin., and Barth, M. 1996. Effect of Nature Seal® on maintaining carotene in fresh-cut carrots. Proceedings of Florida State Horticultural Society. 109: 258-259.
Chu, C.L. 1986. Post-storage application of TAL Pro- long on apples from controlled atmosphere storage. Horticultural Science. 21(2): 267-268.
D’Aquino, S., Molinu, M.G., Piga, A. and Agabbio, M. 2001. Influence of film wrapping on quality maintenance of “Salustiana” oranges under shelf- life conditions. Italian Journal of Food Science. 1(13): 87-100.
D’Aquino. S., Piga, A., Agabbio, M., and McCollum, T.G. 1998. Film wrapping delays of “Minneola” tangelos under shelf life conditions. Postharvest Biology and Technology. 14:107-116.

81
Davis, P.L., and Hofmann, R.C. 1973. Effects of coatings on weight loss and ethanol buildup in juice of oranges. Journal of Agricultural and Food Chemistry. 21: 455-458.
Devine, C.M., and Olson, C.M. 1992. Women’s perceptions about the way social roles promote or constrain personal nutrition care. Women Health. 19: 79-95.
Devine, C.M., Wolfe, W.S., Frongillo, E.A., and Bisogni, C.A. 1999. Life-course events and experiences: Association with fruit and vegetable consumption in 3 ethnic groups. Journal of the American Dietetic Association. 99(3): 309-314.
Dhalla, R., and Hanson, S.W. 1998. Effect of permeable coatings on the storage life of fruits. II. Pro- long treatment of mangoes (Mangifera indica L. cv. Julie). International Journal of Food Science and Technology. 23: 107-112.
Drake, SR., Fellman, J.K. and Nelson, J.W. 1987. Postharvest use of sucrose polyesters for extending the shelf- life of stored ‘Golden Delicious’ apples. Journal of Food Science. 52(5): 1283-1285
Durr, P., and Schobinger, U. 1981. The contribution of some volatiles to the sensory quality of apple and orange juice odor. In Flavor. P.Schreir (ed.), Walter de Gruyter, Berlin, pp. 179-193.
El Ghaouth, A., Arul, J., Grenier, J., and Asselin, A. 1992a. Antifungal activity of chitosan on two postharvest pathogens of strawberry fruits. Phytopathology. 82(4): 398-402. El Ghaouth A, Arul J., Ponnampalam, R., and Boulet, M. 1992b. Chitosan coating to extend the storage life of tomatoes. Horticulture Science. 27(9): 1016-1018.
Elizabeth Baldwin. 2001. New coating formulations for the conservation of tropical fruits. http://technofruits2001.cirad.fr 10/8/2002.
Garrett, E. 1997. fresh-cut produce and food safety. Journal of the Association of Food and Drug Officials. 61(1): 26-29.
Ghaouth, A.E., Arul, J., Ponnampalam, R. and Boulet, M. 1991. Chitosan coating effect on storability and quality of fresh strawberries. Journal of Food Science. 56(6): 1618-1620.
Ghosh, P. 1989. Milk coating could push frozen foods into the cold. New Scientist. June. Page 44. Gorny, J.A., and Kader, A.A. 1997. Postharvest physiology and quality maintenance of fresh-cut pears. http://www.calpear.com/ind/research/postharv/ph1997/post_phys/post_phys_97.htm 7/16/01.

82
Gorny, J.R . 2001. A summary of CA and MA recommendations for selected fresh-cut fruits and vegetables. Postharvest Horticulture Series. University of California, Davis. 22: 95-145.
Gorny, J.R., Hess-Pierce, B., and Kader, A.A. 1998. Effect of fruit ripeness and storage temperature on the deterioration rate of fresh-cut peach and nectarine slices. Horticultural Science. 33(1): 110-113.
Greene, W.H. 1997. Econometric Analysis (3rd ed.). Prentice Hall. Upper Saddle River, N.J, pp. 810-876.
Greenwood, S. 1998. Consumer trends for the new millennium impact fresh-cut produce. IFPA. http://cook.ucdavis.edu/links/freshcut.pdf 10/8/2002.
Guilbert, S., Gontard, N., and Gorris, L.G.M. 1996. Prolongation of the shelf- life of perishable food products using biodegradable films and coatings. Lebensmittel-Wissenschaft und-Technologie. 29(1):10-17.
Gunes, G., Watkins, C.B., and Hotchkiss, J.H. 2001. Physiological responses of fresh-cut apples slices under high CO2 and low O2 partial pressures. Postharvest Biology and Technology. 22: 197-204.
Hagenmaier, R.D. and Baker, R.A. 1994. Wax micro emulsions and emulsions as citrus coatings. Journal of Agricultural and Food Chemistry. 42(4): 899-902.
Hale, P.W., Davis, P. L., Marousky, J.F., and Bongers, A.J. 1982. Evaluation of a heat shrinkable polymer film to maintain quality of Florida grapefruit during export. Citrus and Vegetable Magazine. 46: 39-43, 45-47.
Hall, R.D. 1995. Fresh-cut apples in the works. Western Fruit Grower. 115(11): 20-21.
Hansen, M. 2001. Practices of fresh-cut apple slices under study. The Fruit Grower. 52(9): 24-25.
Hardenburg, R.E. 1949. Moisture losses of vegetables packaged in transparent films and their effect on shelf life. Proceedings at the American Society of Horticultural Science. 53: 426-430.
Hong, J.H., and Gross, K.C. 2001. Maintaining quality of fresh-cut tomato slices through modified atmosphere packaging and low temperature storage. Journal of Food Science. 66(7): 960-965.

83
Howard, L.R., and Dewi, T. 1995. Sensory, microbiological and chemical quality of mini-peeled carrots as affected by edible coating treatment. Journal of Food Science. 60(1): 142-144.
Howard, L.R., Yoo, K.S., Pike, L.M. and Miller Jr, G.H. 1994. Quality changes in diced onions stored in film packages. Journal of Food Science. 59(1): 110-112, 117.
Jiang, Y., and Joyce, D.C. 2002. 1-Methylcyclopropene treatment effects on intact and fresh-cut apple. Journa l of Horticultural Science and Biotechnology. 77(1): 19-21.
Jiang, Y., and Li, Y. 2001. Effects of chitosan on postharvest life and quality of longan fruit. Food Chemistry. 73: 139-143.
Johansson, L., Thelle, D.S., Solvoll, K., Bjørneboe, G.A., and Drevon, C.A. 1999. Healthy dietary habits in relation to social determinants and lifestyle factors. British Journal of Nutrition. 81: 211-220. Johnston J.W., Hewett, E.W., Banks N.H., Harker F.R., and Hertog, M.L.A.T.M. 2001. Physical change in apple texture with fruit temperature: effects of cultivar and time in storage. Postharvest Biology and Technology. 23(1): 13-21.
Karlsen, A. M., Aaby, K., Siversten, H., Baardseth, P., & Ellejkaer, M. R. 1999. Instrumental and sensory analysis of fresh Norwegian and imported apples. Food quality and Preference. 10(4): 305-314.
Kester, J.J and Fennema, O.R.1986. Edible films and coatings. A review. Food Technology. 40(12): 47-59.
Kim, D.M., Smith, N.L., and Lee, C.Y. 1993. Quality of minimally processed apple slices from selected cultivars. Journal of Food Science. 58(5): 1115-1117,1175.
King Jr, A.D., and Bolin, H.R. 1989. Physiological and microbiological storage stability of minimally processed fruits and vegetables. Food Technology. 43: 132-135, 139.
Krochta, J.M. 2001. FAQ about edible films and coatings http://www.dairybiz.com/feature.htm 5/7/02.
Krochta, J.M. and Mulder-Johnston, C.D. 1997. Edible and biodegradable polymer films: Challenges and Opportunities. Food Technology. 51(2): 61-74.
Krochta, J.M., Avena-Bustillos, R.J., Cisneros-Zevallos, L.A. and Saltveit, M.E. 1993. Optimization of edible coatings on minimally processed carrots using response surface methodology. Trans American Society of Agricultural Engineers. 36(3): 801-805.

84
Laforge, R.C., Greene, W.G., and Prochaska, JO. 1994. Physiological factors influencing low fruit and vegetable consumption. Journal of Behavioral Medicine. 17(4): 361-374. Laurila, E., Kervinen, R., and Ahvenainen, R. 1998. The inhibition of enzymatic browning in minimally processed vegetables and fruits. Postharvest News and Information. 9(4): 53-66.
Lerdthanangkul, S., and Krochta, J.M. 1996. Edible coating effects on post harvest quality of green bell peppers. Journal of Food Science. 61(1): 176-179.
Li, H., and Yu, T. 2000. Effect of chitosan on incidence of brown rot, quality and physiological attributes of postharvest peach fruit. Journal of the Science of Food and Agriculture. 81: 269-274.
Li, P., and Barth, M.M. 1998. Impact of edible coatings on nutritional and physiological changes in lightly processed carrots. Postharvest Biology and Technology. 14: 51-60.
Liao, T.F. 1994. Interpreting probability models Logit, Probit, and other generalized linear models. Sage Publications. New Delhi. Page1-47.
Lindsay, J.A., Gross, K.C., Thayer, D.W., and Hicks, K.B. 1999. Minimizing microbes on fresh-cut foods. ARS News and Information. http://www.ars.usda.gov/is/AR/archive/jun99/food0699.htm 10/8/2002.
Mahmoud, R. and Savello, P.A. 1992. Mechanical properties of and water vapor transferability through whey protein films. Journal of Dairy Science. 75: 942-946.
Martin-Polo, M.O. 1995. Biopolymers in the fabrication of edible and biodegradable materials for food preservation. In Food preservation by Moisture Control. V. Barbosa-Canovas and J. Welti-Chanes, Technomic Publishing Co., Lancaster, PA. pp. 849-868.
Mathur, P.B., and Shrivastava, H.C. 1955. Effect of skin coatings on the storage of behavior of mangoes. Food Research. 20: 559-566.
McHugh, T.H. and Krochta, J.M. 1994. Sorbitol vs glycerol plasticized whey protein edible films: Integrated oxygen permeability and tensile property evaluation. Journal of Agricultural and Food Chemistry. 42(4): 41-45. McHugh, T.H., and Krochta, J.M. 1994. Milk protein based edible films and coatings. Food Technology. 48(1): 97-103.

85
McHugh, T.H., and Senesi, E. 2000. Apple wraps: A novel method to improve the quality and extend the shelf life of fresh-cut apples. Journal of Food Science 65(3): 480-485.
Meheriuk, M., and Lau, O.L. 1988.Effect of two polymeric coatings on fruits quality of ‘Barlett’ and ‘d’Anjou’ pears. Journal of American Society of Horticultural Science. 113(2): 222-226.
Miller, W.R., Risse, L.A., and McDonald, R.E. 1986. Deterioration of individually wrapped and non-wrapped bell peppers during long-term storage. Tropical Science. 26:1-8.
Miller, W.R., Spalding, D.H., Risse, L.A., and Chew, V. 1984. The effects of imazalil- impregnated film with chlorine and imazalil to control decay of bell peppers. Proceedings of the annual meeting at Florida State Horticultural Society. 97: 108-111.
Miller, W.R., Spalding, D.L., and Risse, L.A. 1983. Decay firmness and color development of Florida bell peppers dipped in chlorine and imazalil and film wrapped. Proceedings at the annual meeting of Florida State Horticultural Society. 96: 347-350.
Mitcham, E.J., Crisosto, C.H., and Kader. A.A. 2002. Apple: Fuji. Recommendations for maintaining postharvest quality. Postharvest technology. Research and information center. Http://rics.ucdavis.edu/postharvest2/Produce/ProduceFacts/Fruit/fuji.shtml 10/8/2002.
Motlagh, H.F., and Quantick, P.C. 1998. Effect of permeable coatings on the storage life of fruits. I. Pro-long treatment of limes (Citrus aurantifolia cv. Persian). International Journal of Food Science and Technology. 23: 99-105.
Newmark-Sztainer, D., Story, M., Resnick, M.D., and Blum, R.W. 1996. Preventive Medicine. 25: 497-505.
Nisperos, M.O., and Baldwin, E.A. 1988. Effect of two types of edible films on tomato fruit ripening. Proceedings at Florida State Horticultural Society. 101: 217-220.
Nisperos-Carriedo, M.O., Baldwin, E.A., and Shaw, P.E. 1992. Development of an edible coating for extending postharvest life of selected fruits and vegetables. Proceedings at the annual meeting of Florida State Horticultural Society. 104: 122-125.
Otma, E.C. 1989. Controlled atmosphere storage and film wrapping of red bell peppers. Acta Horticulturae. 258: 515- 521.

86
Park, H.J. 1999 Development of advanced edible coatings for fruits. Trends in Food Science and Technology. 10: 254-260.
Park, H.J., Chinnan, M.S., and Shewfelt, R. 1994a. Edible corn-zein film coatings to extend storage life of tomatoes. Journal of Food Processing and Preservation. 18: 317-331.
Park, H.J., Chinnan, M.S., and Shewfelt, R.L. 1994b. Edible coating effects on storage life and quality of tomatoes. Journal of Food Science. 59(3): 568-570.
Paull, R.E., and Chen, N.J. 1989. Waxing and plastic wraps influence water loss from papaya fruit during storage and ripening. Journal of American Society of Horticultural Science. 114(6): 937-942.
Purvis, A.C. 1983. Effects of film thickness and storage temperature on water loss and internal quality of seal-packaged grapefruit. Journal of American Society of Horticultural Science. 108(4): 562-566.
Risse, L.A., and Miller, W.R. 1983. Film wrapping and decay of eggplant. Proceedings of Florida State Horticultural Society. 96: 350-352.
Risse, L.A., Miller, W.R., and McDonald, R.E. 1984. Effects of film wrapping on mature-green tomatoes before and after ethylene treatment. Proceedings at the annual meeting of Florida State Horticultural Society. 97: 112-114.
Rocha, A. M. C. N., Brochado, C. M., Morais, A. M. M. B. 1998. Influence of chemical treatment on quality of cut apple (cv. Jonagored). Journal of Food Quality. 21(1): 13-28.
Rolle, S.R., and Chism, G.W. 1987. Physiological consequences of minimally processed fruits and vegetables. Journal of food Quality. 10: 157-177.
Sapers, G.M., Miller, R.L., and Choi, S.W. 1995. Prevention of enzymatic browning in pre-peeled potatoes and minimally processed mushrooms. Enzymatic browning and its prevention. ACS Symposium Series 600, Washington, D.C., pp. 223-239.
Siew, D.C.W., Heilmann, C., Easteal, A.J., and Cooney, R.P. 1999. Solution and film properties of sodium caseinate/glycerol and sodium caseinate/polyethylene glycol edible coating systems. Journal of Agricultural and Food Chemistry. 47: 3432-3440.
Smith, S., Geeson, J., and Stow, J. 1987. Production of modified atmospheres in deciduous fruits by the use of films ad coatings. Horticultural Science. 22(5): 772-776.

87
Smith, S.M., and Stow, J.R. 1984. The potential of a sucrose ester coating material for improving the storage and shelf- life qualities of Cox’s Orange Pippin apples. Annals of Applied Biology. 104: 383-391.
Sothornvit, R., and Krochta, J. M. 2000. Whey protein molecular weight effect on film oxygen permeability and mechanical properties. http://trc.ucdavis.edu/pftf2000/w2/sothornvit/syllabus.htm 10/21/2002.
Tasdelen, O., and Bayindirli, L. 1998. Controlled atmosphere storage and edible coating effects on storage life and quality of tomatoes. Journal of Food Processing and Preservation. 22 (4): 303-320.
Tien, C.L., Letendre, M., Ispas-Szabo, P., Mateescu, M.A., Patterson, G.D., Yu, H.L., and Lacroix, M. 2000. Development of biodegradable films from whey proteins by cross- linking and entrapment in cellulose. Journal of Agricultural and Food Chemistry. 48(11): 5566-5575.
Tien, C.L., Vachon, C., Mateescu, M.A. and Lacroix. 2001. Milk protein coatings prevent oxidative browning of apples and potatoes. Journal of Food Science. 66(4): 512. Trout, S.A., Hall, E.G., and Sukes, S.M. 1952. Effects of skin coatings on the behavior of apples in storage. Australian Journal of Agricultural Research. 4: 57-81.
Trudeau, E., Kristal, A.R., Li, S., and Patterson, R.E. 1998. Demographic and psychosocial predictors of fruit and vegetables intakes differ: Implication for dietary interventions. Journal of the American Dietetic Association. 12: 1412-1417.
Vosen, D., and Wagener, J. 1999. Whey protein isolates: Production, Composition & Nutritional Facts. Century Food International. http://www.centuryfoods.com/our_view.htm 10/8/2002. Wandel, M. 1995. Dietary intake of fruits and vegetables in Norway: influence of life phase and socio-economic factors. International Journal of the Food Science Nutrition. 46: 291-301.
Walzem, R.L. 1999. Health enhancing properties of whey protein and whey fractions. www.extraordinarydairy.com/archive/mono_health.pdf 10/8/2002.
Watada, A.E., and Qi, L. 1999. Quality of fresh-cut produce. Postharvest Biology and Technology. 15(3): 201-205.
Watada, A.E.; Ko, N.P.; Minott, D.A. 1996. Factors affecting quality of fresh-cut horticultural products. Postharvest Biology and Technology. 9:115-125.

88
Yang, C.C., Brennan, P., Chinnan, M.S., and Shewfelt, R.L. 1987. Characterization of tomato ripening process as influenced by individual seal-packaging and temperature. Journal of Food Quality. 10:21-33.
Zhang, D., and Quantick, P.C. 1998. Antifungal effects of chitosan coating on fresh strawberries and raspberries during storage. Journal of Horticultural Science & Biotechnology. 73(6): 763-767.
Zhang, D., and Quantick. P.C. 1997. Effects of chitosan coating on enzymatic browning and decay during postharvest storage of litchi (Litchi chinensis Sonn.) fruit. Postharvest Biology and Technology. 12: 195-202.

89
APPENDIX A. CONSUMER QUESTIONNAIRE FOR THE FIRST STUDY

90
SURVEY ON FRESH-CUT FRUITS & VEGETABLES
1. Please check Yes / No for the following questions.
a. Do you eat/use raw (unprocessed) fruits or vegetables? q Yes q No b. Do you eat/use frozen-cut fruits or vegetables? q Yes q No c. Do you eat/use canned fruits or vegetables? q Yes q No d. Do you eat/use fresh-cut fruits or vegetables? q Yes q No
2. Which of the following do you consume most frequently? (Please rank from 1 – 4; 1 = most frequently to 4 = least frequently and 0 if you do not consume) ____ Fresh raw/unprocessed F/V ( needs preparation) ____ Frozen-cut F/V ____ Canned F/V ____ Fresh-cut F/V (ready-to-eat) 3. How often do you buy fresh-cut F/V from a grocery store, salad bar or restaurant? (Please check one)
q More than once a week q Once a week q Twice a month
q Once a month q Very rarely q Never
4. Do you generally prefer fresh-cut over canned F/V? If “Yes” or “Sometimes,” go to 4.1. If “No,” go to 4.3. (Please check one)
q Yes q Sometimes q No 4.1.Why do you prefer fresh-cut over canned F/V? (Check all that apply)
q Freshness q Natural taste / flavor q More nutritious q No additives/preservatives added q More convenient
q Better utility (can be used for various purposes)
q Better texture q Better appearance/color q Other (Please specify)
________________
Definition: Fresh-cut Fruits and Vegetables (F/V) are convenient products prepared from whole F/V, after having been washed to remove dirt and other undesirable materials, and cut into smaller portions depending on their usage. Fresh-cut F/V are ready-to-cook or ready-for-consumption. They are normally prepared without any pre-treatments (like heating/freezing), without added additives/preservatives, and are kept in a fresh state (refrigerated).

91
4.2. What price would you be willing to pay for fresh-cut F/V compared with canned F/V (on a per-pound basis)? (Please check one)q Same q Higher q Lower
4.3. Why do you NOT prefer fresh-cut F/V over canned F/V? (Please specify) ___________________________________________________________________ 5. Do you generally prefer fresh-cut over frozen-cut F/V? If “Yes” or “Sometimes,” go to
5.1. If “No,” go to 5.3. (Please check one) q Yes q Sometimes q No
5.1. Why do you prefer fresh-cut over frozen-cut F/V? (Check all that apply)
q Freshness q Natural taste / flavor q More nutritious q No additives/preservatives added q More convenient
q Better utility (can be used for various purposes)
q Better texture q Better appearance/color q Other (Please specify)
____________________ 5.2. What price would you be willing to pay for fresh-cut F/V compared with frozen-cut
F/V(on a per-pound basis)? (Please check one) q Same q Higher q Lower
5.3. Why do you NOT prefer fresh-cut F/V over frozen-cut F/V? (Please specify) ______________________________________________________________________ 6. Do you generally prefer fresh-cut F/V over whole (raw unprocessed) F/V? If “Yes” or
“Sometimes,” go to 6.1. If “No ,” go to 6.3. (Please check one) q Yes q Sometimes q No
6.1. Why do you prefer fresh-cut F/V over whole (raw unprocessed) F/V? (Check all that
apply) q Safer q Less waste and undesirable cuts generated q Better utility / versatility (can be used for various purposes) q Serving portion or quantity (if you need less quantity instead of the whole F/V) q Less preparation time / less clean-up / ready-to-consume q Defects easily detected through transparent packaging (e.g., cut watermelon) q Visual quality q Other (Please specify) _________________________
6.2. What price would you be willing to pay for fresh-cut F/V compared with whole (raw
unprocessed) F/V (on a per-pound basis)? (Please check one)q Same q Higher q Lower
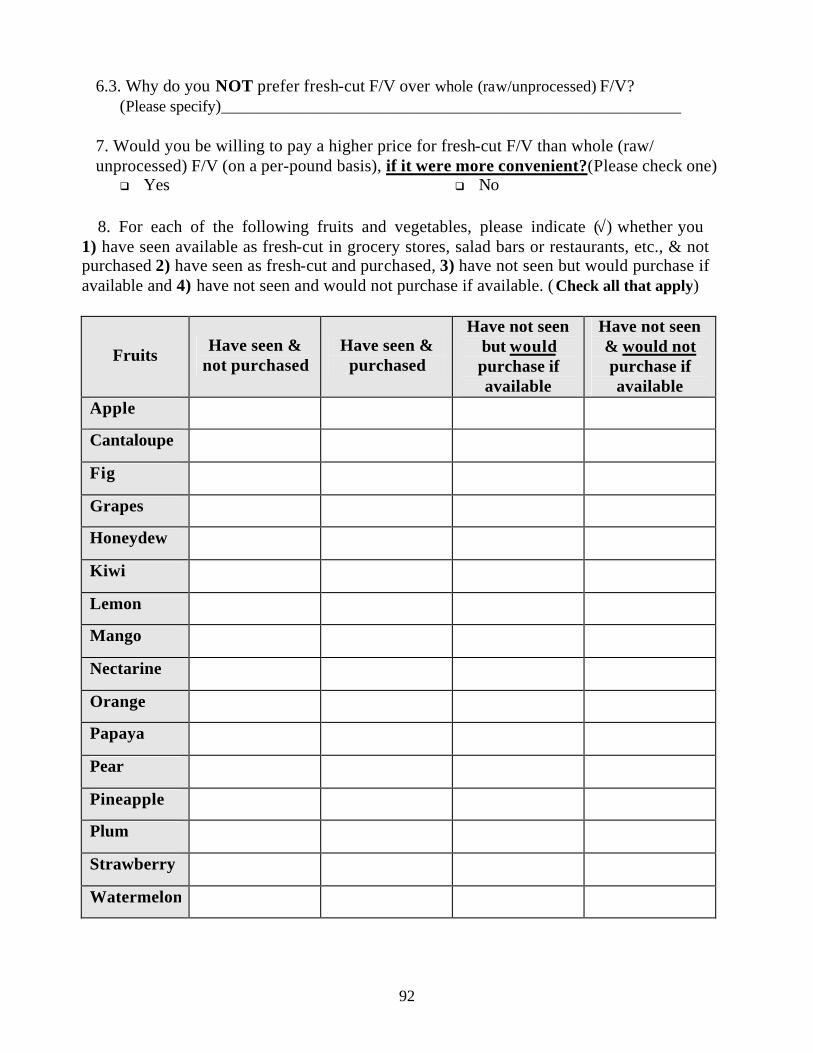
92
6.3. Why do you NOT prefer fresh-cut F/V over whole (raw/unprocessed) F/V? (Please specify)_____________________________________________________
7. Would you be willing to pay a higher price for fresh-cut F/V than whole (raw/ unprocessed) F/V (on a per-pound basis), if it were more convenient?(Please check one)
q Yes q No 8. For each of the following fruits and vegetables, please indicate (√) whether you
1) have seen available as fresh-cut in grocery stores, salad bars or restaurants, etc., & not purchased 2) have seen as fresh-cut and purchased, 3) have not seen but would purchase if available and 4) have not seen and would not purchase if available. ( Check all that apply)
Fruits Have seen & not purchased
Have seen & purchased
Have not seen but would purchase if available
Have not seen & would not purchase if available
Apple
Cantaloupe
Fig
Grapes
Honeydew
Kiwi
Lemon
Mango
Nectarine
Orange
Papaya
Pear
Pineapple
Plum
Strawberry
Watermelon
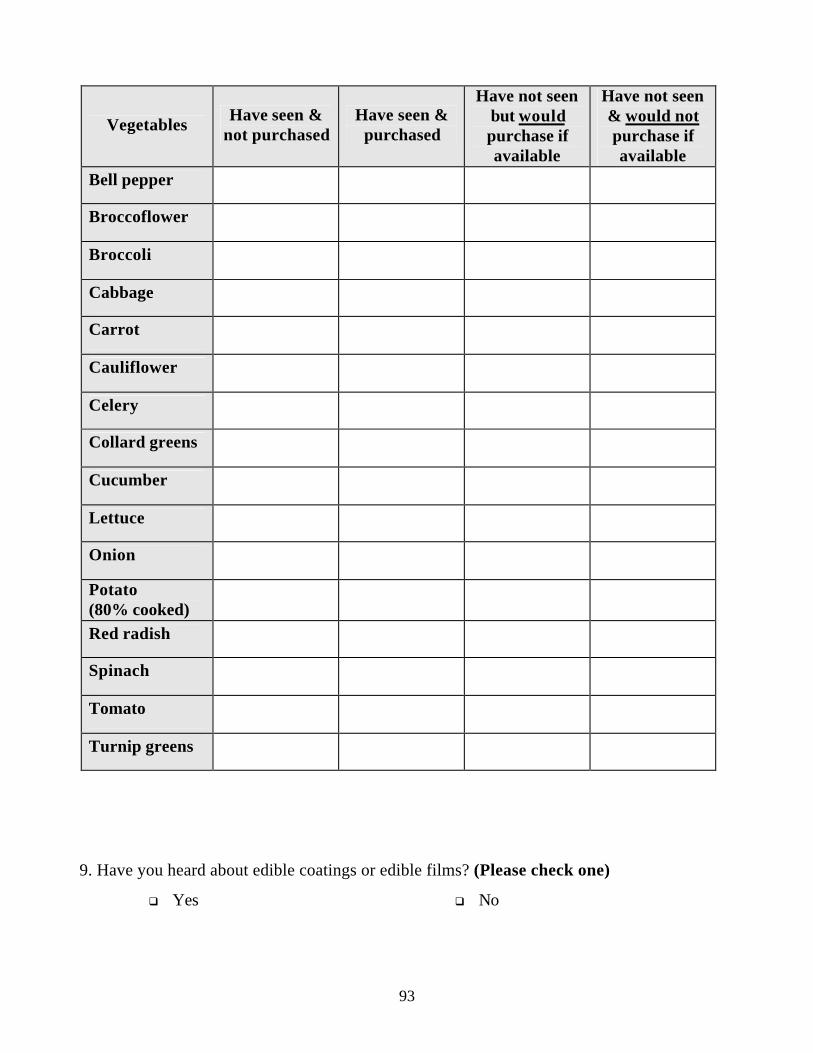
93
Vegetables Have seen & not purchased
Have seen & purchased
Have not seen but would purchase if available
Have not seen & would not purchase if available
Bell pepper
Broccoflower
Broccoli
Cabbage
Carrot
Cauliflower
Celery
Collard greens
Cucumber
Lettuce
Onion
Potato (80% cooked)
Red radish
Spinach
Tomato
Turnip greens
9. Have you heard about edible coatings or edible films? (Please check one)
q Yes q No

94
FACT!!!
10. Which of the following fruits and vegetables do you think have been coated with edible
coating, film or wax? (Check all that apply)
FRUITS
q Apple q Honeydew q Nectarine q Pineapple
q Cantaloupe q Kiwi q Orange q Plum
q Fig q Lemon q Papaya q Strawberry
q Grapes q Mango q Pear q Watermelon
VEGETABLES
q Bell pepper q Carrot q Cucumber q Red radish
q Broccoflower q Cauliflower q Lettuce q Spinach
q Broccoli q Celery q Onion q Tomato
q Cabbage q Collard greens
q Potato
q Turnip
greens
An edible film is a thin, transparent layer of edible material coated on foods. The film can be derived from plant (soy protein, corn, etc.) and animal sources (milk protein, chitosan from shrimp, etc.). Examples of coated whole fruits and vegetables are apples and cucumbers; they are coated with edible wax.

95
11. What do you think the benefits of such edible coatings or films are? (Check all
that apply)
q Safety
q F&Vs last longer with delayed
spoilage
q Better appearance
q Better quality
q Better nutrition
q Other (Please specify)
____________________
12. Would you buy fresh-cut fruits and vegetables (that you normally consume) coated
with an edible film that is safe for consumption? (Please check one)
q Yes q No
FACT!!!
13. After knowing the fact about edible film, would you buy fresh-cut fruits and
vegetables that are coated with edible coating considered to be safe by FDA (Food
and Drug Administration)?(Please check one)
q Yes q No
14. What price would you be willing to pay for coated fresh-cut F/V compared with
whole (raw/unprocessed) F/V on a per-pound basis? (Please check one)
q Same q Higher q Lower
Fruits and vegetables coated with edible materials normally last longer.

96
DEMOGRAPHIC & SOCIO-ECONOMIC SURVEY
1.Gender q Female q Male
2.What is your age? (Please check one) q Under 18 years q 18-25 q 26-35
q 36-45 q 46-55 q 56-65
q 66-75 q Over 75 years
3. Which do you consider yourself to be? (Please check one)
q African-American q Asian
q Hispanic/Spanish q White (Caucasian)
q Other (Please specify) ______________________ 4. What is your education level? (Please check one)
q Less than high school q High school graduate q Some college
q Completed college q Graduate degree (M.S., M.A.,
Ph.D., etc.) 5. What is your average household income? (Please check one) q Over $120,000 q $110,000– 119,999 q $100,000– 109,999 q $90,000 – 99,999 q $80,000 – 89,999
q $70,000 – 79,999 q $60,000 – 69,999 q $50,000 – 59,999 q $40,000 – 49,999
q $30,000 – 39,999 q $20,000 – 29,999 q $10,000 – 19,999 q Under $10,000
6. Which of the following best describes your employment status? (Please check one)
q Employed full-time q Employed part-time q Unemployed
q Homemaker q Student q Retired
7. Which of the following best describes your household? (Please check one)
q Single adult q Single parent with children in home q Couple without children in home q Couple with children in home
OPTIONAL: Please provide the last 4 digits of your Social Security Number. This will be used for data tracking purpose ONLY. ___________________
THANK YOU VERY MUCH

97
APPENDIX B. DATA ANALYSIS

98
A. SAS CODE DATA ONE; INPUT BATCH TRT $ DAY REP A; DATALINES; ; PROC SORT;BY TRT; PROC GLM;BY TRT;CLASS DAY; MODEL A=DAY; MEANS DAY /TUKEY;RUN;

99
B. LIMDEP CODE DSTAT; RHS=* ;OUTPUT=2$ REJECT; Q1A=-999$ PROBIT;LHS=Q1A; RHS=ONE,GEN,AGE,AFRAMER,ASIAN,HISP,HSCH,INC,CHILD,MARRY,GEO$
Note 1: Limdep is an integrated program that is used for estimation and analysis of linear
and nonlinear models with cross section, time series and panel data. This software is
mainly used for estimation of regression models and nonlinear models for limited
dependent variables, survival data, qualitative choices, count data, and samples subject to
nonrandom selection.
Note 2: The variables in RHS (ONE, GEN, etc.) are defined in the Table 3.

100
APPENDIX C. DATA SET FOR THE SECOND STUDY

101
a. A Data Set for Color Values of Coated Fresh-Cut Apples
Batch Trt Day Rep L* a* b* chroma hue
1 control 1 1 74.5 2.13 24.05 24.14 84.931 control 1 2 70.61 4.96 30.15 30.55 80.651 control 1 3 76.02 2.99 26.4 26.57 83.531 control 4 1 69.96 4.56 26.19 26.58 80.111 control 4 2 72.07 2.69 25.41 25.56 83.951 control 4 3 67.09 5.21 26.04 26.56 78.691 control 7 1 73.84 4.07 28.52 28.81 81.871 control 7 2 71.58 6.49 29.31 30.02 77.521 control 7 3 73.2 4.81 27.72 28.13 80.151 control 10 1 73.07 4.69 24.98 25.42 79.361 control 10 2 74.25 5.96 25.47 26.16 76.821 control 10 3 73.77 5.07 23.91 24.44 78.031 control 13 1 73.25 5.98 23.45 23.99 75.561 control 13 2 76.11 4.84 24.89 25.37 78.781 control 13 3 72.2 5.84 26.21 26.85 77.451 WPC5 1 1 75.93 1.31 20.58 20.62 86.351 WPC5 1 2 76.13 0.95 23.48 23.49 87.681 WPC5 1 3 76.28 0.83 17.32 17.34 87.241 WPC5 4 1 72.98 1.57 21.13 21.19 85.751 WPC5 4 2 74.84 2.19 18.34 18.47 83.21 WPC5 4 3 76.27 1.86 23.53 23.6 85.491 WPC5 7 1 77.02 3.65 18.76 19.12 78.981 WPC5 7 2 73.37 4.66 18.74 19.31 76.021 WPC5 7 3 77.62 3.71 17.98 18.36 78.331 WPC5 10 1 75.17 4.18 19.91 20.34 78.141 WPC5 10 2 76.17 4.41 20.18 20.66 77.671 WPC5 10 3 71.87 4.82 18.62 19.23 75.481 WPC5 13 1 74.67 4.33 20.18 20.64 77.91 WPC5 13 2 75.77 4.97 19.83 20.44 75.941 WPC5 13 3 74.87 4.97 20.02 20.63 76.051 WPC10 1 1 77.63 -0.53 22.46 22.46 91.351 WPC10 1 2 73.07 1 19.24 19.27 87.021 WPC10 1 3 75.21 0.52 16.5 16.51 88.21 WPC10 4 1 77.01 1.29 17.26 17.31 85.741 WPC10 4 2 72.31 1.65 20.14 20.21 85.311 WPC10 4 3 76.96 1.07 20.56 20.58 87.021 WPC10 7 1 77.6 3.03 17.01 17.28 79.911 WPC10 7 2 76.21 3.15 19.67 19.92 80.91 WPC10 7 3 76.23 3.25 16.87 17.18 79.091 WPC10 10 1 72.5 4.9 19.84 20.44 76.131 WPC10 10 2 75.06 3.65 17.21 17.59 78.041 WPC10 10 3 75.92 3.9 18.35 18.76 78.011 WPC10 13 1 75.64 4.66 18.62 19.2 75.96

102
1 WPC10 13 2 76.68 3.83 16.76 17.19 77.121 WPC10 13 3 75.81 4.76 19.88 19.76 76.061 WPI5 1 1 72.29 2.94 19.93 20.14 81.621 WPI5 1 2 72.84 1.27 23.68 23.7 86.921 WPI5 1 3 73.1 2.08 21.02 21.12 84.351 WPI5 4 1 70.79 2.75 20.85 19.64 81.391 WPI5 4 2 72.34 1.86 23.44 23.51 85.471 WPI5 4 3 68.54 2.61 22.74 22.89 83.451 WPI5 7 1 74.52 4.16 19.47 19.91 77.941 WPI5 7 2 70.28 6.97 23.06 24.09 73.181 WPI5 7 3 76.31 6.08 25.11 25.84 76.41 WPI5 10 1 71.05 4.89 17.54 18.21 74.431 WPI5 10 2 70.02 3.81 20.53 20.88 79.471 WPI5 10 3 71.3 3.94 22.14 22.49 79.921 WPI5 13 1 73.43 4.61 19.88 20.41 76.951 WPI5 13 2 71.84 5.14 19.66 20.32 75.351 WPI5 13 3 66.22 5.51 23.55 24 76.721 WPI10 1 1 77.65 1.58 19.98 20.04 85.481 WPI10 1 2 71.25 2.57 23.08 23.19 83.631 WPI10 1 3 73.45 0.43 21.26 21.26 88.851 WPI10 4 1 71.42 3.2 23.26 23.48 82.161 WPI10 4 2 74.68 2.38 18.95 19.1 82.831 WPI10 4 3 71.39 3.21 21.68 21.91 81.591 WPI10 7 1 69.43 5.72 24.19 24.86 76.691 WPI10 7 2 79.13 3.63 18.08 18.44 78.661 WPI10 7 3 73.95 4.54 20.02 20.53 77.211 WPI10 10 1 73.74 4.5 20.29 20.78 77.491 WPI10 10 2 71.66 6.35 20.09 21.07 72.451 WPI10 10 3 70.67 4.27 19.99 20.44 77.951 WPI10 13 1 76.09 4.78 21.34 21.87 77.381 WPI10 13 2 75.86 5.33 18.12 18.88 73.611 WPI10 13 3 76.03 4.63 17.49 18.09 75.181 PHWPC5 1 1 67.67 6.26 34.6 35.16 79.751 PHWPC5 1 2 67.98 4.53 26.12 26.51 80.171 PHWPC5 1 3 70.4 2.9 26.07 26.23 83.661 PHWPC5 4 1 74.26 2.62 23.93 24.08 93.761 PHWPC5 4 2 73 3.29 22.55 22.79 81.71 PHWPC5 4 3 68.19 4.16 22.61 22.99 79.571 PHWPC5 7 1 74.93 4.54 20.02 20.86 74.961 PHWPC5 7 2 69.78 5.41 22.23 23.64 70.111 PHWPC5 7 3 70.77 8.05 21.88 22.78 73.81 PHWPC5 10 1 71.49 6.86 22.89 23.89 73.311 PHWPC5 10 2 67.26 7.04 23.74 24.76 73.471 PHWPC5 10 3 73.48 6.02 20.93 21.78 73.951 PHWPC5 13 1 73.74 5.18 21 21.63 76.151 PHWPC5 13 2 69.44 7.39 20.02 21.34 69.731 PHWPC5 13 3 72.06 5.97 20.85 21.69 74.021 PHWPC10 1 1 72.84 4.43 21.55 22 78.38

103
1 PHWPC10 1 2 70.32 2.75 23.2 23.27 83.251 PHWPC10 1 3 72.85 3.14 21.13 21.36 81.531 PHWPC10 4 1 69.37 3.85 24.09 24.39 80.921 PHWPC10 4 2 72.55 3.82 22.02 22.35 80.161 PHWPC10 4 3 72.46 3.38 20.76 21.03 80.751 PHWPC10 7 1 75.34 6.3 16.92 18.06 69.591 PHWPC10 7 2 74.87 5.77 17.52 18.44 71.781 PHWPC10 7 3 70.57 4.25 20.36 20.8 78.221 PHWPC10 10 1 70.1 5.09 19.89 20.53 75.651 PHWPC10 10 2 71.64 6.64 22.08 23.06 73.261 PHWPC10 10 3 68.1 6.04 21.16 22.01 74.061 PHWPC10 13 1 72 5.45 18.6 19.39 73.661 PHWPC10 13 2 69.91 6.43 20.19 21.19 72.331 PHWPC10 13 3 70.39 7.16 19.7 20.96 70.012 control 1 1 72.6 4.43 23.69 24.1 79.42 control 1 2 73.94 3.12 21.29 21.52 81.652 control 1 3 71.71 3.65 20.82 21.14 80.072 control 4 1 68.85 4.45 23.44 23.86 79.262 control 4 2 73.12 2.97 21.65 21.85 82.192 control 4 3 69.91 3.77 21.69 22.01 80.152 control 4 4 69.95 3.57 23.83 24.1 81.472 control 4 5 71.36 4.3 22.28 22.69 79.082 control 4 6 67.93 4.85 26.18 26.62 79.492 control 7 1 68.43 5.41 23.86 24.46 77.232 control 7 2 73.6 2.94 22.57 22.76 82.582 control 7 3 72.82 2.83 23.19 23.36 83.042 control 7 4 72.2 3.73 24.23 24.52 81.242 control 7 5 68.38 5.75 22.68 23.4 75.792 control 7 6 71.27 4.72 23.25 23.72 78.532 control 10 1 65.44 5.1 23.96 24.5 77.992 control 10 2 71.5 3.22 23.61 23.82 82.232 control 10 3 69.21 4.81 25.46 25.91 79.312 control 10 4 70.14 4.14 26.3 26.62 81.062 control 10 5 70.46 3.5 28.97 29.18 83.122 control 10 6 71.02 4.01 25.58 25.89 81.092 control 13 1 71.1 4.72 22.11 22.61 77.942 control 13 2 71.31 3.71 21.66 21.98 80.292 control 13 3 68.29 5.27 25.36 25.9 78.252 control 13 4 74.59 3.57 22.83 23.11 81.122 control 13 5 68.51 5.54 24.49 25.11 77.262 control 13 6 68.96 4.57 23.56 24 79.022 WPC5 1 1 73.49 3.29 18.08 18.38 79.682 WPC5 1 2 79.41 3.43 18.08 18.4 79.262 WPC5 4 1 79.28 4.16 17.46 17.95 76.582 WPC5 4 2 77.36 4.47 18.39 18.93 76.322 WPC5 7 1 77.32 4.37 16.32 16.89 75.012 WPC5 7 2 74.21 5.89 19.49 20.36 73.22 WPC5 10 1 75.22 5.13 18.49 19.19 74.5

104
2 WPC5 10 2 76.04 4.87 19.21 19.82 75.772 WPC5 13 1 76.83 5.81 19.14 20 73.112 WPC5 13 2 76.8 5.47 18.43 19.22 73.462 WPC10 1 1 77.28 1.14 21.11 21.14 86.912 WPC10 1 2 71.93 2 22.73 22.82 84.972 WPC10 1 3 74.55 1.97 19.82 19.92 84.312 WPC10 4 1 75.59 1.69 19.09 19.16 84.932 WPC10 4 2 72.98 2.44 21.89 22.02 83.652 WPC10 4 3 74.69 2.57 19.61 19.77 82.532 WPC10 4 4 74.13 1.9 22.43 22.51 85.162 WPC10 4 5 76.21 2.72 20.08 20.26 82.292 WPC10 4 6 75.85 1.28 20.49 20.53 86.422 WPC10 7 1 77.34 1.32 20.32 20.37 86.282 WPC10 7 2 75.9 2.65 19.64 19.81 82.322 WPC10 7 3 75.26 2.16 19.08 19.2 83.532 WPC10 7 4 76.01 2.16 23.57 23.67 84.762 WPC10 7 5 76.72 1.86 18.85 18.94 84.362 WPC10 7 6 77.4 1.71 20.16 20.23 85.152 WPC10 10 1 74.87 3.38 17.2 17.53 78.872 WPC10 10 2 75.84 3.01 18.77 19.01 80.92 WPC10 10 3 74.35 2.79 18.72 18.93 81.532 WPC10 10 4 75.78 1.7 20.14 20.21 85.192 WPC10 10 5 74.57 2.3 20.98 21.11 83.752 WPC10 10 6 74.9 2.58 21.08 21.24 83.012 WPC10 13 1 76.11 2.57 18.86 19.03 82.232 WPC10 13 2 78.21 1.49 20.32 20.37 85.792 WPC10 13 3 70.86 4.39 21.18 21.63 78.282 WPC10 13 4 77.65 1.86 18.75 18.84 84.332 WPC10 13 5 72.41 3.13 19.78 20.03 81.012 WPC10 13 6 77.62 1.71 17.63 17.71 84.452 WPI5 1 1 76.25 0.78 20.48 20.5 87.812 WPI5 1 2 76.54 2.41 20.91 21.04 83.412 WPI5 1 3 77.08 1.82 20.23 20.31 84.862 WPI5 4 1 76.87 1.97 17.89 18 83.712 WPI5 4 2 74.59 1.54 20.02 20.08 85.592 WPI5 4 3 70.66 2.65 22.52 22.67 83.292 WPI5 4 4 75.05 2.67 19.24 19.43 82.112 WPI5 4 5 72.25 3.02 20.26 20.49 81.532 WPI5 4 6 69.23 3.13 22.34 22.55 82.032 WPI5 7 1 71.2 2.27 24.02 24.12 84.592 WPI5 7 2 75.09 2.69 20.88 21.05 82.662 WPI5 7 3 71.9 2.87 20.17 20.37 81.912 WPI5 7 4 75.41 2.32 21.08 21.2 83.712 WPI5 7 5 76.38 1.92 20.76 20.85 84.712 WPI5 7 6 75.81 2.93 20.96 21.17 82.042 WPI5 10 1 75.74 2.43 16.98 17.16 81.872 WPI5 10 2 72.81 3.01 19.35 19.58 81.162 WPI5 10 3 74.54 2.19 21.78 21.89 84.26

105
2 WPI5 10 4 71.95 2.81 21.44 21.62 82.532 WPI5 10 5 74.09 2.46 18.63 18.8 82.482 WPI5 10 6 74.13 2.49 20.08 20.23 82.932 WPI5 13 1 76.42 2.62 19.24 19.41 82.252 WPI5 13 2 76.28 3.2 20.28 20.53 81.042 WPI5 13 3 76.75 2.67 20.8 20.97 82.682 WPI5 13 4 76.64 2.16 18.38 18.5 83.292 WPI5 13 5 71.65 2.94 23.94 24.12 82.992 WPI5 13 6 77.57 2.01 20.86 20.95 84.52 WPI10 1 1 76.02 1.34 21.02 21.06 86.342 WPI10 1 2 75.17 0.25 22.01 22.01 89.342 WPI10 1 3 73.65 1.49 18.26 18.32 85.342 WPI10 4 1 75.04 1.8 18.21 18.3 84.352 WPI10 4 2 73.19 2.37 21.31 21.44 83.652 WPI10 4 3 74.6 2.03 20.08 20.18 84.222 WPI10 4 4 77.91 1.78 24.28 24.34 85.812 WPI10 4 5 72.92 1.96 21.33 21.41 84.752 WPI10 4 6 75.93 1.84 20.18 20.26 84.82 WPI10 7 1 77.21 0.94 18.35 18.38 87.062 WPI10 7 2 75.91 1.29 18.77 18.81 86.062 WPI10 7 3 79.85 1.08 21.21 21.24 87.082 WPI10 7 4 76.97 1.86 18.55 18.64 84.292 WPI10 7 5 69.86 3.71 19.74 20.09 79.352 WPI10 7 6 75.6 1.24 18.18 18.22 86.092 WPI10 10 1 74.87 2.13 18.3 18.42 83.372 WPI10 10 2 75.31 2.11 19.76 19.87 83.912 WPI10 10 3 76.51 2.03 17.71 17.83 83.462 WPI10 10 4 73.11 2.23 20.64 20.76 83.852 WPI10 10 5 75.44 1.45 18.03 18.09 85.422 WPI10 10 6 77.41 1.94 17.51 17.61 83.692 WPI10 13 1 77.24 1.54 17.04 17.1 84.942 WPI10 13 2 75.65 2.51 17.19 17.38 81.692 WPI10 13 3 76.86 2.26 18.45 18.59 83.012 WPI10 13 4 76.48 2.19 19.47 19.59 83.582 WPI10 13 5 71.61 3.2 18.28 18.56 80.062 WPI10 13 6 77.69 1.15 20.35 20.38 86.782 PHWPC5 1 1 72.9 2.48 18.89 19.05 82.522 PHWPC5 1 2 73.32 2.38 19.83 19.97 83.152 PHWPC5 1 3 72.48 2.12 21.05 21.15 84.262 PHWPC5 4 1 74.5 2.37 18.4 18.55 82.662 PHWPC5 4 2 74.11 2.75 20.49 20.68 82.372 PHWPC5 4 3 67.88 3.07 18.06 18.32 80.372 PHWPC5 4 4 73.71 2.59 19.11 19.29 82.282 PHWPC5 4 5 73.97 2.97 20.48 20.7 81.752 PHWPC5 4 6 73 2.36 22.09 22.22 83.912 PHWPC5 7 1 79.74 1.81 19.26 19.34 84.632 PHWPC5 7 2 76.44 2.9 20.28 20.49 81.862 PHWPC5 7 3 74.77 1.46 18.55 18.61 85.5

106
2 PHWPC5 7 4 77.28 4.76 20.39 20.47 85.082 PHWPC5 7 5 75.79 3.08 18.54 18.8 80.582 PHWPC5 7 6 76.85 2.68 18.45 18.65 81.742 PHWPC5 10 1 76.87 2.14 18.32 18.44 83.322 PHWPC5 10 2 72.63 4 21.06 21.44 79.242 PHWPC5 10 3 75.4 2.33 19.02 19.16 83.012 PHWPC5 10 4 73.43 2.75 19.9 20.09 82.132 PHWPC5 10 5 79.11 0.68 18.78 18.8 87.932 PHWPC5 10 6 71.63 3.64 17.88 18.25 78.482 PHWPC5 13 1 75.15 3.94 19.06 19.46 78.312 PHWPC5 13 2 77.67 2.28 16.69 16.84 82.222 PHWPC5 13 3 76.39 2.9 18.48 18.71 81.12 PHWPC5 13 4 77.22 3.36 18.12 18.42 79.52 PHWPC5 13 5 78.66 1.88 18.93 19.02 84.322 PHWPC5 13 6 77.96 2.41 18.67 18.82 82.632 PHWPC10 1 1 70.08 2.98 24.26 24.44 83.012 PHWPC10 1 2 72.44 3.28 23.16 23.39 81.942 PHWPC10 1 3 76.37 2.37 20.01 20.15 83.252 PHWPC10 4 1 77.16 2.84 19.65 19.85 81.782 PHWPC10 4 2 76.2 2.2 19.84 19.96 83.692 PHWPC10 4 3 71.43 3.98 21.31 21.68 79.412 PHWPC10 4 4 70.58 3.69 22.05 22.35 80.512 PHWPC10 4 5 76.22 2.74 20.39 20.57 82.342 PHWPC10 4 6 74.79 2.58 19.69 19.86 82.542 PHWPC10 7 1 76.31 2.86 19.96 20.16 87.862 PHWPC10 7 2 76.15 4.07 20.08 20.49 78.542 PHWPC10 7 3 72.35 4.75 22.21 22.71 77.932 PHWPC10 7 4 76.3 3.23 20.3 20.55 80.972 PHWPC10 7 5 77.43 3.1 19.03 19.28 80.762 PHWPC10 7 6 75.21 3.56 19.81 20.13 79.82 PHWPC10 10 1 74.88 4.49 20.82 21.3 77.842 PHWPC10 10 2 72.64 5.22 21.26 21.89 76.212 PHWPC10 10 3 75.82 2.88 20.29 20.49 81.932 PHWPC10 10 4 74.77 3.2 19.24 19.5 80.562 PHWPC10 10 5 74.5 3.46 20.62 20.9 80.492 PHWPC10 10 6 74.79 2.68 19.32 19.51 82.122 PHWPC10 13 1 74.35 5.27 19.39 20.09 74.792 PHWPC10 13 2 76.74 3.53 18.32 18.66 79.112 PHWPC10 13 3 77.14 5.37 20.03 20.74 74.992 PHWPC10 13 4 75.1 4.17 19.9 20.33 78.172 PHWPC10 13 5 75.45 4.25 19.49 19.95 77.692 PHWPC10 13 6 74.88 4.38 19.92 20.4 77.6

107
b. A Data Set for Microbial Growth on Coated Fresh-Cut Apples
Batch Trt Day Rep Ecoli TPC 1 control 1 1 0 01 control 1 2 0 01 control 1 3 0 01 control 4 1 0 01 control 4 2 0 181 control 4 3 0 101 control 7 1 0 141 control 7 2 0 01 control 7 3 0 01 control 10 1 0 41 control 10 2 0 61 control 10 3 0 201 control 13 1 0 01 control 13 2 0 01 control 13 3 0 01 WPC5 1 1 0 01 WPC5 1 2 0 01 WPC5 1 3 0 01 WPC5 4 1 0 141 WPC5 4 2 0 221 WPC5 4 3 0 61 WPC5 7 1 0 101 WPC5 7 2 0 141 WPC5 7 3 0 61 WPC5 10 1 0 21 WPC5 10 2 0 81 WPC5 10 3 0 81 WPC5 13 1 0 01 WPC5 13 2 0 01 WPC5 13 3 0 01 WPC10 1 1 0 01 WPC10 1 2 0 01 WPC10 1 3 0 01 WPC10 4 1 0 01 WPC10 4 2 0 01 WPC10 4 3 0 41 WPC10 7 1 0 01 WPC10 7 2 0 21 WPC10 7 3 0 61 WPC10 10 1 0 01 WPC10 10 2 0 21 WPC10 10 3 0 01 WPC10 13 1 20 18201 WPC10 13 2 1140 200

108
1 WPC10 13 3 780 12401 WPI5 1 1 0 01 WPI5 1 2 0 01 WPI5 1 3 0 01 WPI5 4 1 0 01 WPI5 4 2 0 01 WPI5 4 3 0 61 WPI5 7 1 0 01 WPI5 7 2 0 141 WPI5 7 3 0 01 WPI5 10 1 0 121 WPI5 10 2 0 01 WPI5 10 3 0 01 WPI5 13 1 0 01 WPI5 13 2 0 01 WPI5 13 3 0 01 WPI10 1 1 0 01 WPI10 1 2 0 01 WPI10 1 3 0 01 WPI10 4 1 0 01 WPI10 4 2 0 121 WPI10 4 3 0 41 WPI10 7 1 0 81 WPI10 7 2 0 81 WPI10 7 3 0 01 WPI10 10 1 0 41 WPI10 10 2 0 01 WPI10 10 3 0 01 WPI10 13 1 0 01 WPI10 13 2 0 01 WPI10 13 3 0 01 PHWPC5 1 1 0 01 PHWPC5 1 2 0 01 PHWPC5 1 3 0 01 PHWPC5 4 1 0 81 PHWPC5 4 2 0 21 PHWPC5 4 3 0 21 PHWPC5 7 1 0 01 PHWPC5 7 2 0 01 PHWPC5 7 3 0 01 PHWPC5 10 1 0 41 PHWPC5 10 2 0 41 PHWPC5 10 3 0 01 PHWPC5 13 1 0 01 PHWPC5 13 2 0 01 PHWPC5 13 3 0 01 PHWPC10 1 1 0 01 PHWPC10 1 2 0 0

109
1 PHWPC10 1 3 0 01 PHWPC10 4 1 0 01 PHWPC10 4 2 0 121 PHWPC10 4 3 0 21 PHWPC10 7 1 0 01 PHWPC10 7 2 0 01 PHWPC10 7 3 0 01 PHWPC10 10 1 0 41 PHWPC10 10 2 0 01 PHWPC10 10 3 0 01 PHWPC10 13 1 0 01 PHWPC10 13 2 0 01 PHWPC10 13 3 140 1162 control 1 1 0 02 control 1 2 0 02 control 1 3 0 02 control 4 1 0 02 control 4 2 2 02 control 4 3 0 02 control 7 1 0 02 control 7 2 0 02 control 7 3 0 02 control 10 1 0 02 control 10 2 0 02 control 10 3 0 02 control 13 1 0 02 control 13 2 0 02 control 13 3 0 02 WPC5 1 1 0 02 WPC5 1 2 0 22 WPC5 1 3 0 02 WPC5 4 1 0 02 WPC5 4 2 0 02 WPC5 4 3 0 02 WPC5 7 1 0 02 WPC5 7 2 0 02 WPC5 7 3 0 02 WPC5 10 1 0 02 WPC5 10 2 0 02 WPC5 10 3 0 02 WPC5 13 1 0 02 WPC5 13 2 0 02 WPC5 13 3 0 02 WPC10 1 1 0 02 WPC10 1 2 0 02 WPC10 1 3 0 02 WPC10 4 1 0 02 WPC10 4 2 0 0

110
2 WPC10 4 3 0 02 WPC10 7 1 0 02 WPC10 7 2 0 02 WPC10 7 3 0 02 WPC10 10 1 0 02 WPC10 10 2 0 02 WPC10 10 3 0 02 WPC10 13 1 0 02 WPC10 13 2 0 02 WPC10 13 3 0 02 WPI5 1 1 0 02 WPI5 1 2 0 22 WPI5 1 3 0 02 WPI5 4 1 0 02 WPI5 4 2 0 02 WPI5 4 3 0 02 WPI5 7 1 0 02 WPI5 7 2 0 02 WPI5 7 3 0 02 WPI5 10 1 0 02 WPI5 10 2 0 02 WPI5 10 3 0 02 WPI5 13 1 0 02 WPI5 13 2 0 02 WPI5 13 3 0 02 WPI10 1 1 0 02 WPI10 1 2 0 02 WPI10 1 3 0 02 WPI10 4 1 0 02 WPI10 4 2 0 02 WPI10 4 3 0 02 WPI10 7 1 0 02 WPI10 7 2 0 02 WPI10 7 3 0 02 WPI10 10 1 0 02 WPI10 10 2 0 02 WPI10 10 3 0 02 WPI10 13 1 0 02 WPI10 13 2 0 02 WPI10 13 3 0 02 PHWPC5 1 1 0 42 PHWPC5 1 2 0 62 PHWPC5 1 3 0 42 PHWPC5 4 1 0 02 PHWPC5 4 2 0 02 PHWPC5 4 3 0 02 PHWPC5 7 1 0 02 PHWPC5 7 2 0 0

111
2 PHWPC5 7 3 0 22 PHWPC5 10 1 0 02 PHWPC5 10 2 0 02 PHWPC5 10 3 0 02 PHWPC5 13 1 0 02 PHWPC5 13 2 0 02 PHWPC5 13 3 0 02 PHWPC10 1 1 0 02 PHWPC10 1 2 0 02 PHWPC10 1 3 0 02 PHWPC10 4 1 0 02 PHWPC10 4 2 0 02 PHWPC10 4 3 0 02 PHWPC10 7 1 0 02 PHWPC10 7 2 0 02 PHWPC10 7 3 0 02 PHWPC10 10 1 0 02 PHWPC10 10 2 0 02 PHWPC10 10 3 0 02 PHWPC10 13 1 0 02 PHWPC10 13 2 0 02 PHWPC10 13 3 0 0

112
c. A Data Set for Firmness Values of Coated Fresh-Cut Apples
Batch Trt Day Rep Force 1 control 1 1 4.2311 control 1 2 3.5091 control 1 3 3.7231 control 1 4 3.5731 control 4 1 2.5921 control 4 2 2.0411 control 4 3 1.8911 control 4 4 1.7151 control 7 1 2.3141 control 7 2 4.0291 control 7 3 3.2921 control 7 4 2.9291 control 10 1 4.8971 control 10 2 2.3461 control 10 3 3.0991 control 10 4 2.331 control 13 1 2.1781 control 13 2 2.1751 control 13 3 1.8891 control 13 4 1.8351 WPC5 1 1 2.3011 WPC5 1 2 2.5531 WPC5 1 3 3.6351 WPC5 1 4 3.2481 WPC5 4 1 3.2261 WPC5 4 2 3.9071 WPC5 4 3 4.1541 WPC5 4 4 2.9881 WPC5 7 1 2.5661 WPC5 7 2 2.9541 WPC5 7 3 2.9121 WPC5 7 4 2.3421 WPC5 10 1 3.4341 WPC5 10 2 2.491 WPC5 10 3 2.3451 WPC5 10 4 2.9981 WPC5 13 1 2.1781 WPC5 13 2 2.1751 WPC5 13 3 1.8891 WPC5 13 4 1.8351 WPC10 1 1 2.4821 WPC10 1 2 2.9381 WPC10 1 3 2.0151 WPC10 1 4 2.235

113
1 WPC10 4 1 3.1891 WPC10 4 2 2.8811 WPC10 4 3 3.6621 WPC10 4 4 3.7891 WPC10 7 1 2.7811 WPC10 7 2 4.2051 WPC10 7 3 2.9271 WPC10 7 4 3.3281 WPC10 10 1 4.6581 WPC10 10 2 2.7141 WPC10 10 3 2.7611 WPC10 10 4 2.2181 WPC10 13 1 3.0281 WPC10 13 2 3.6221 WPC10 13 3 2.5961 WPC10 13 4 4.2481 WPI5 1 1 3.7321 WPI5 1 2 2.8311 WPI5 1 3 2.0071 WPI5 1 4 2.6281 WPI5 4 1 2.231 WPI5 4 2 1.5741 WPI5 4 3 1.8891 WPI5 4 4 3.351 WPI5 7 1 3.1811 WPI5 7 2 3.621 WPI5 7 3 2.6341 WPI5 7 4 1.9531 WPI5 10 1 2.6811 WPI5 10 2 3.1221 WPI5 10 3 3.4521 WPI5 10 4 4.0831 WPI5 13 1 2.9771 WPI5 13 2 2.651 WPI5 13 3 2.5221 WPI5 13 4 2.5771 WPI10 1 1 3.7971 WPI10 1 2 3.3721 WPI10 1 3 4.0771 WPI10 1 4 2.4481 WPI10 4 1 2.9381 WPI10 4 2 2.9941 WPI10 4 3 2.3441 WPI10 4 4 3.0771 WPI10 7 1 2.7771 WPI10 7 2 2.2391 WPI10 7 3 2.9511 WPI10 10 1 3.278

114
1 WPI10 10 2 3.1621 WPI10 10 3 3.5191 WPI10 10 4 4.3371 WPI10 13 1 3.9091 WPI10 13 2 2.7741 WPI10 13 3 3.5021 WPI10 13 4 5.0721 PHWPC5 1 1 2.6191 PHWPC5 1 2 2.1891 PHWPC5 1 3 2.6041 PHWPC5 1 4 2.7581 PHWPC5 4 1 4.3631 PHWPC5 4 2 2.911 PHWPC5 4 3 2.41 PHWPC5 4 4 2.8461 PHWPC5 7 1 3.8461 PHWPC5 7 2 2.5521 PHWPC5 7 3 2.4971 PHWPC5 7 4 2.5731 PHWPC5 10 1 3.0661 PHWPC5 10 2 2.8071 PHWPC5 10 3 3.6671 PHWPC5 10 4 2.4711 PHWPC5 13 1 4.0771 PHWPC5 13 2 2.4931 PHWPC5 13 3 4.3221 PHWPC5 13 4 2.0021 PHWPC10 1 1 2.2151 PHWPC10 1 2 2.411 PHWPC10 1 3 1.9811 PHWPC10 1 4 2.2051 PHWPC10 4 1 3.2651 PHWPC10 4 2 4.6591 PHWPC10 4 3 3.3081 PHWPC10 4 4 3.5011 PHWPC10 7 1 2.7961 PHWPC10 7 2 2.481 PHWPC10 7 3 2.8011 PHWPC10 7 4 2.2321 PHWPC10 10 1 3.2241 PHWPC10 10 2 3.3231 PHWPC10 10 3 3.3821 PHWPC10 10 4 2.1231 PHWPC10 13 1 3.0311 PHWPC10 13 2 2.8341 PHWPC10 13 3 3.7011 PHWPC10 13 4 2.712 control 1 1 3.554
115
2 control 1 2 3.1772 control 1 3 3.2932 control 1 4 3.5742 control 4 1 3.2162 control 4 2 3.5512 control 4 3 3.3582 control 7 1 2.4032 control 7 2 3.1022 control 7 3 2.6642 control 10 1 3.1412 control 10 2 2.4772 control 10 3 2.662 control 13 1 2.1742 control 13 2 2.6012 control 13 3 1.7222 WPC5 1 1 3.2032 WPC5 1 2 3.0582 WPC5 1 3 3.9952 WPC5 1 4 3.6352 WPC5 4 1 3.8672 WPC5 4 2 3.4842 WPC5 4 3 3.8972 WPC5 7 1 2.7682 WPC5 7 2 4.1492 WPC5 7 3 3.5562 WPC5 10 1 3.3432 WPC5 10 2 2.2022 WPC5 10 3 3.2562 WPC5 13 1 4.7172 WPC5 13 2 3.5422 WPC5 13 3 4.8562 WPC10 1 1 2.612 WPC10 1 2 2.9592 WPC10 1 3 2.3652 WPC10 1 4 2.2432 WPC10 4 1 4.2272 WPC10 4 2 3.0012 WPC10 4 3 2.6022 WPC10 7 1 3.3542 WPC10 7 2 2.7742 WPC10 7 3 2.3532 WPC10 10 1 4.0832 WPC10 10 2 2.32 WPC10 10 3 3.1712 WPC10 13 1 3.3252 WPC10 13 2 2.6272 WPC10 13 3 2.6972 WPI5 1 1 4.044

116
2 WPI5 1 2 3.4282 WPI5 1 3 3.4572 WPI5 1 4 3.5342 WPI5 4 1 4.7852 WPI5 4 2 2.5332 WPI5 4 3 3.2372 WPI5 7 1 3.0192 WPI5 7 2 2.8122 WPI5 7 3 2.522 WPI5 10 1 2.8732 WPI5 10 2 2.6652 WPI5 10 3 3.1122 WPI5 13 1 3.3072 WPI5 13 2 3.022 WPI5 13 3 3.4112 WPI10 1 1 3.0042 WPI10 1 2 2.2982 WPI10 1 3 3.0812 WPI10 1 4 3.9322 WPI10 4 1 3.9782 WPI10 4 2 3.5762 WPI10 4 3 2.9872 WPI10 7 1 4.1552 WPI10 7 2 2.9452 WPI10 7 3 3.0932 WPI10 10 1 3.0642 WPI10 10 2 2.3142 WPI10 10 3 3.0392 WPI10 13 1 4.1322 WPI10 13 2 3.7312 WPI10 13 3 2.9982 PHWPC5 1 1 3.9732 PHWPC5 1 2 3.0992 PHWPC5 1 3 2.3962 PHWPC5 1 4 3.2192 PHWPC5 4 1 2.9132 PHWPC5 4 2 3.1462 PHWPC5 4 3 3.1812 PHWPC5 7 1 2.362 PHWPC5 7 2 3.1052 PHWPC5 7 3 3.5422 PHWPC5 10 1 1.8172 PHWPC5 10 2 2.7842 PHWPC5 10 3 1.6882 PHWPC5 13 1 3.0752 PHWPC5 13 2 2.5612 PHWPC5 13 3 2.1922 PHWPC10 1 1 2.322

117
2 PHWPC10 1 2 2.412 PHWPC10 1 3 2.8842 PHWPC10 1 4 2.7972 PHWPC10 4 1 2.9872 PHWPC10 4 2 3.2632 PHWPC10 4 3 3.3432 PHWPC10 4 4 4.1262 PHWPC10 7 1 2.1322 PHWPC10 7 2 2.4752 PHWPC10 7 3 4.3772 PHWPC10 7 4 3.3762 PHWPC10 10 1 4.0312 PHWPC10 10 2 3.0852 PHWPC10 10 3 1.9082 PHWPC10 10 4 2.6482 PHWPC10 13 1 3.8222 PHWPC10 13 2 2.3342 PHWPC10 13 3 4.2112 PHWPC10 13 4 2.644

118
d. A Data Set for Weight Loss of Coated Fresh-Cut Apples
Batch Trt Day Rep %wt loss 1 control 4 1 0.11111 control 4 2 -0.2521 control 4 3 1.21451 control 4 4 1.74711 control 4 5 0.66871 control 4 6 1.81351 control 7 1 -0.2521 control 7 2 0.25211 control 7 3 1.52591 control 7 4 3.11981 control 7 5 1.07421 control 7 6 3.55131 control 10 1 0.25211 control 10 2 0.68941 control 10 3 1.25341 control 10 4 4.96271 control 10 5 1.6711 control 10 6 4.90591 control 13 1 0.68941 control 13 2 1.25341 control 13 3 4.96271 control 13 4 1.6711 control 13 5 4.90591 control 13 6 1.36121 WPC5 4 1 0.65241 WPC5 4 2 0.25871 WPC5 4 3 1.09671 WPC5 4 4 0.18471 WPC5 4 5 0.76471 WPC5 4 6 2.40661 WPC5 7 1 0.71831 WPC5 7 2 0.28461 WPC5 7 3 1.87081 WPC5 7 4 0.10761 WPC5 7 5 0.3571 WPC5 7 6 1.95281 WPC5 10 1 1.17311 WPC5 10 2 1.07041 WPC5 10 3 3.27431 WPC5 10 4 0.44171 WPC5 10 5 0.7321 WPC5 10 6 1.92421 WPC5 13 1 1.63271 WPC5 13 2 1.6622

119
1 WPC5 13 3 4.78481 WPC5 13 4 0.90111 WPC5 13 5 1.09221 WPC5 13 6 1.91351 WPC10 4 1 1.3731 WPC10 4 2 0.9841 WPC10 4 3 0.21241 WPC10 4 4 0.29721 WPC10 4 5 2.17571 WPC10 4 6 2.07521 WPC10 7 1 0.92531 WPC10 7 2 1.04741 WPC10 7 3 -0.0361 WPC10 7 4 0.42161 WPC10 7 5 1.26391 WPC10 7 6 1.4891 WPC10 10 1 0.40031 WPC10 10 2 1.41761 WPC10 10 3 -0.2771 WPC10 10 4 1.22611 WPC10 10 5 0.8761 WPC10 10 6 1.56561 WPC10 13 1 0.31251 WPC10 13 2 1.83571 WPC10 13 3 -0.161 WPC10 13 4 2.70661 WPC10 13 5 0.9391 WPC10 13 6 1.88231 WPI5 4 1 0.95431 WPI5 4 2 0.54871 WPI5 4 3 0.46651 WPI5 4 4 1.91741 WPI5 4 5 1.36431 WPI5 7 1 0.86651 WPI5 7 2 0.42051 WPI5 7 3 0.23911 WPI5 7 4 1.62241 WPI5 7 5 0.621 WPI5 10 1 2.0111 WPI5 10 2 0.65381 WPI5 10 3 0.54421 WPI5 10 4 2.76851 WPI5 10 5 0.54991 WPI5 13 1 2.92631 WPI5 13 2 1.05131 WPI5 13 3 0.9711 WPI5 13 4 3.82121 WPI5 13 5 0.7714

120
1 WPI10 4 1 1.00221 WPI10 4 2 0.25811 WPI10 4 3 0.06951 WPI10 4 4 -0.0281 WPI10 4 5 0.23771 WPI10 4 6 0.52351 WPI10 7 1 1.50121 WPI10 7 2 0.54761 WPI10 7 3 0.58071 WPI10 7 4 0.3821 WPI10 7 5 1.24391 WPI10 7 6 1.67751 WPI10 10 1 1.33321 WPI10 10 2 0.78731 WPI10 10 3 0.46941 WPI10 10 4 0.17181 WPI10 10 5 2.55771 WPI10 10 6 2.54621 WPI10 13 1 1.62181 WPI10 13 2 2.40581 WPI10 13 3 0.96981 WPI10 13 4 0.36961 WPI10 13 5 3.94591 WPI10 13 6 3.44431 PHWPC5 4 1 1.00221 PHWPC5 4 2 -0.251 PHWPC5 4 3 0.30711 PHWPC5 4 4 -0.3921 PHWPC5 4 5 -0.3151 PHWPC5 4 6 0.02021 PHWPC5 7 1 0.97641 PHWPC5 7 2 0.19841 PHWPC5 7 3 0.93831 PHWPC5 7 4 1.43411 PHWPC5 7 5 0.8391 PHWPC5 7 6 0.15611 PHWPC5 10 1 1.00221 PHWPC5 10 2 0.19171 PHWPC5 10 3 2.1171 PHWPC5 10 4 1.02321 PHWPC5 10 5 0.64691 PHWPC5 10 6 0.17451 PHWPC5 13 1 1.24561 PHWPC5 13 2 1.30921 PHWPC5 13 3 3.14311 PHWPC5 13 4 1.95411 PHWPC5 13 5 1.24951 PHWPC5 13 6 0.9145

121
1 PHWPC10 4 1 0.08421 PHWPC10 4 2 -0.2081 PHWPC10 4 3 -0.1451 PHWPC10 4 4 0.47381 PHWPC10 4 5 -0.1821 PHWPC10 7 1 0.27181 PHWPC10 7 2 0.18791 PHWPC10 7 3 0.281 PHWPC10 7 4 2.32261 PHWPC10 7 5 0.90851 PHWPC10 10 1 0.59331 PHWPC10 10 2 0.48371 PHWPC10 10 3 0.56491 PHWPC10 10 4 2.1111 PHWPC10 10 5 0.97291 PHWPC10 13 1 0.70511 PHWPC10 13 2 2.67131 PHWPC10 13 3 2.0161 PHWPC10 13 4 3.73791 PHWPC10 13 5 1.91522 control 4 1 1.32562 control 4 2 1.57522 control 4 3 1.82672 control 4 4 2.07542 control 4 5 0.70432 control 7 1 0.87672 control 7 2 1.40872 control 7 3 1.78792 control 7 4 2.00112 control 7 5 1.14832 control 10 1 1.54552 control 10 2 1.76152 control 10 3 2.85682 control 10 4 2.14962 control 10 5 1.95222 control 13 1 1.50182 control 13 2 1.75892 control 13 3 3.84092 control 13 4 3.0842 control 13 5 2.68842 WPC5 4 1 1.42492 WPC5 4 2 1.75982 WPC5 4 3 0.63952 WPC5 4 4 0.88242 WPC5 4 5 1.86982 WPC5 7 1 2.19752 WPC5 7 2 1.66372 WPC5 7 3 0.5598

122
2 WPC5 7 4 1.10992 WPC5 7 5 1.4982 WPC5 10 1 2.86352 WPC5 10 2 2.12 WPC5 10 3 1.48482 WPC5 10 4 1.70522 WPC5 10 5 1.81612 WPC5 13 1 3.49552 WPC5 13 2 2.74622 WPC5 13 3 1.97132 WPC5 13 4 2.65222 WPC5 13 5 2.08042 WPC10 4 1 1.24612 WPC10 4 2 1.63622 WPC10 4 3 0.57242 WPC10 4 4 1.68752 WPC10 4 5 1.36062 WPC10 7 1 1.9952 WPC10 7 2 1.8242 WPC10 7 3 0.40162 WPC10 7 4 2.4632 WPC10 7 5 1.13412 WPC10 10 1 1.79112 WPC10 10 2 2.78712 WPC10 10 3 0.18772 WPC10 10 4 2.732 WPC10 10 5 1.71292 WPC10 13 1 1.8662 WPC10 13 2 4.61262 WPC10 13 3 0.6572 WPC10 13 4 3.37952 WPC10 13 5 2.05512 WPI5 4 1 0.6222 WPI5 4 2 1.65192 WPI5 4 3 0.72912 WPI5 4 4 0.74112 WPI5 4 5 1.22472 WPI5 7 1 1.4092 WPI5 7 2 1.66142 WPI5 7 3 2.1622 WPI5 7 4 0.94562 WPI5 7 5 1.31782 WPI5 10 1 2.34122 WPI5 10 2 1.9882 WPI5 10 3 2.11472 WPI5 10 4 0.6782 WPI5 10 5 2.21222 WPI5 13 1 3.7702

123
2 WPI5 13 2 2.01972 WPI5 13 3 3.0492 WPI5 13 4 0.7182 WPI5 13 5 2.43412 WPI10 4 1 0.65372 WPI10 4 2 0.83992 WPI10 4 3 0.50782 WPI10 4 4 1.06562 WPI10 4 5 1.36132 WPI10 7 1 1.09012 WPI10 7 2 1.62252 WPI10 7 3 1.142 WPI10 7 4 1.26752 WPI10 7 5 1.97592 WPI10 10 1 0.88442 WPI10 10 2 2.4082 WPI10 10 3 1.182 WPI10 10 4 1.88612 WPI10 10 5 2.44442 PHWPC5 13 1 0.95072 PHWPC5 13 2 3.32732 PHWPC5 13 3 1.18592 PHWPC5 13 4 1.7542 PHWPC5 13 5 3.42342 PHWPC5 4 1 0.28392 PHWPC5 4 2 0.83992 PHWPC5 4 3 0.11262 PHWPC5 4 4 0.22022 PHWPC5 4 5 0.92532 PHWPC5 7 1 1.6152 PHWPC5 7 2 2.32982 PHWPC5 7 3 2.02172 PHWPC5 7 4 1.54162 PHWPC5 7 5 2.77582 PHWPC5 10 1 1.58542 PHWPC5 10 2 2.14892 PHWPC5 10 3 1.91232 PHWPC5 10 4 2.14122 PHWPC5 10 5 2.3142 PHWPC5 13 1 1.98262 PHWPC5 13 2 2.85812 PHWPC5 13 3 2.04362 PHWPC5 13 4 2.03832 PHWPC5 13 5 2.8092 PHWPC10 4 1 0.38042 PHWPC10 4 2 -0.392 PHWPC10 4 3 0.13692 PHWPC10 4 4 0.2698

124
2 PHWPC10 4 5 0.45822 PHWPC10 7 1 0.81892 PHWPC10 7 2 -0.012 PHWPC10 7 3 1.37392 PHWPC10 7 4 1.53362 PHWPC10 7 5 1.4862 PHWPC10 10 1 0.76452 PHWPC10 10 2 -0.0442 PHWPC10 10 3 1.57532 PHWPC10 10 4 1.41892 PHWPC10 10 5 2.32352 PHWPC10 13 1 1.51782 PHWPC10 13 2 0.23482 PHWPC10 13 3 2.63032 PHWPC10 13 4 1.852 PHWPC10 13 5 3.3606

125
APPENDIX. D. GRAPHS FOR THE SECOND STUDY

126
a. Effect of Treatments on the L* Values of the Fresh-cut Apples
66
68
70
72
74
76
78
1 4 7 10 13
Storage Time (Days)
Co
lori
met
ric
Val
ues
(L
*)
control5%WPC10%WPC5%WPI10%WPI5%HWP10%HWP
b. Effect of Treatments on the a* Values of the Fresh-cut Apples
0
1
2
3
4
5
6
1 4 7 10 13
Storage Time (Days)
Co
lori
met
ric
Val
ue
(a*)
control5%WPC10%WPC5%WPI10%WPI5%HWP10%HWP

127
c. Effect of Treatments on the b* Values of the Fresh-cut Apples
0
5
10
15
20
25
30
1 4 7 10 13
Storage Time (Days)
Co
lori
met
ric
Val
ues
(b
*)
control5%WPC10%WPC5%WPI10%WPI5%HWP10%HWP
d. Effect of Treatments on the Chroma Values of the Fresh-cut Apples
0
5
10
15
20
25
30
1 4 7 10 13
Storage Time (Days)
Co
lori
met
ric
Val
ue
(Ch
rom
a)
control5%WPC10%WPC5%WPI10%WPI5%HWP10%HWP

128
e. Effect of Treatments on the Hue Angle Values of the Fresh-cut Apples
65
70
75
80
85
90
1 4 7 10 13
Storage Time (Days)
Co
lori
met
ric
Val
ue
(Hu
e)
control5%WPC10%WPC5%WPI10%WPI5%HWP10%HWP
f. Effect of Treatments on the Weight Loss of the Fresh-cut Apples
00.5
11.5
2
2.53
3.54
1 4 7 10 13
Storage Time (Days)
Sh
ear
forc
e (k
g) control
5%WPC10%WPC5%WPI10%WPI5%HWP10%HWP

129
g. Effect of Treatments on the Firmness Loss of the Fresh-cut Apples
0
0.5
1
1.5
2
2.5
3
4 7 10 13
Storage Time (Days)
Mo
istu
re L
oss
(%
) control5%WPC10%WPC5%WPI10%WPI5%HWP10%HWP
h. Effect of Treatments on the Total Plate Count of the Fresh-cut Apples
00.20.40.60.8
11.21.41.6
1 4 7 10 13
Days
log
CFU
/g (
TPC
)
control5%WPC10%WPC5%WPI10%WPI5%PHWPC10%PHWPC

130
i. Effect of Treatments on the E.coli/ Coliform Counts of the Fresh-cut Apples
0
0.00002
0.00004
0.00006
0.00008
0.0001
0.00012
1 4 7 10 13
Days
log
CF
U/g
(E
.co
li/C
olif
orm
)
control5%WPC10%WPC5%WPI10%WPI5%PHWPC10%PHWPC

131
APPENDIX E. EXPERIMENTAL DESIGN

132
Control 5%WPC 10%WPC 5%WPI 10%WPI 5%PHWPC 10%PHWPC
A1 A2 A3 A4 A5 A6 A7 A8 A9 A10 A11 A12 A13 A14 A15 A16 A17 A18 A19 A20 A21 A22 A23 A24 A25 A26 A27 A28
Mo T C Mi Mo T C Mi Mo T C Mi Mo T C Mi Mo T C Mi Mo T C Mi Mo T C Mi
1 5* 4 3 3 5 4 3 3 5 4 3 3 5 4 3 3 5 4 3 3 5 4 3 3 5 4 3 3
4 5 4 3 3 5 4 3 3 5 4 3 3 5 4 3 3 5 4 3 3 5 4 3 3 5 4 3 3
7 5 4 3 3 5 4 3 3 5 4 3 3 5 4 3 3 5 4 3 3 5 4 3 3 5 4 3 3
10 5 4 3 3 5 4 3 3 5 4 3 3 5 4 3 3 5 4 3 3 5 4 3 3 5 4 3 3
13 5 4 3 3 5 4 3 3 5 4 3 3 5 4 3 3 5 4 3 3 5 4 3 3 5 4 3 3
WPC - Whey Protein Concentrate WPI - Whey Protein Isolate PHWPC - Partially Hydrolyzed Whey Protein Concentrate A1-A28 - Apple (A total of 28 apples were used for each experimental batch; two batches were conducted) Mo - Moisture analysis T - Texture analysis C - Color analysis Mi - Microbial analysis * The numbers (3, 4 and 5) indicate replications for each analysis.

133
VITA
Sirisha Sonti was born on July 20, 1979, in Hyderabad, Andhra Pradesh, India. She
graduated from Osmania University College of Technology, Hyderabad, with a Bachelor of
Science degree in food processing and preservation technology. Upon receiving her bachelor’s
degree she joined the graduate school at Louisiana State University Agricultural and Mechanical
College in the Department of Food Science in Fall 2000. She is a candidate for the degree of
Master of Science in food science in Spring 2003. After receiving that degree she will continue
doctoral study in food science at the University of Illinois.