Embed Size (px)
Citation preview
FOOD QUALITY AND PREFEFfENCE2 (1990) 217-221
CONSIJMER PERCEPTIONS OF BANANAS TREATED WITH ETHYLENE OR ALLOWED TO
RIPEN NATURALLY
Frances Striven & Lindy Seaman Department of Food Science and Technology, University of New South Wales, PO
Box 1, Kensington 2033, Australia
(Received 17 August 1990; accepted 18 April 1991)
ABSTRACT
Consumers evaluated the eating quality and
appearance of commercially available (ethylene
treated) bananas and bananas which were allowed
to ripen naturally (without ethylene). Quantitative
measures of sweetness, liking when eaten, ripe
taste, softness, flesh yellowness, liking of skin
colour and skin yellowness were collected for
bananas at three ditferent stages of ripeness as
judged by skin colou,r. Whole and peeled bananas
were provided separately. Multivariate analysis of
the combined data Irevealed that consumers dis-
criminate between fruit using liking of skin colour
and softness. Consumers like the taste of ripe fruit,
but like the appearance of unripe fruit. Consumers
were also able to detect that at a certain stage of skin
colour ripeness, etlzylene treatment results in bananas withJerk ripeness out of phase with skin
colour ripeness.
0 1991 Elsevier Science Publishers Ltd
0950-3293/91/$03.50
Key words : Consumer, sensory analysis,
discrimination, banana, ethylene ripening, multi-
variate analysis.
INTRODUCTION
In many developed countries bananas are
transported green and treated with ethylene
gas to achieve controlled, uniform ripening
(Wills et al., 1989). Consumer choice is
therefore limited when a controlled marketing
practice such as this is in place and all bananas
in the market place are gassed (which is the
term used to describe ethylene treatment).
Ethylene is produced naturally by bananas
during ripening and reaches maximum pro-
duction as the fruit becomes edible. Ap-
plication of ethylene accelerates ripening,
which can be easily followed by changes in
skin colour, and this is generally what is used
as the index for ripeness by marketing authori-
217

218 FRANCES SCRIVEN, LINDY SEAMAN
ties. A review of the physiology of banana ripening is given by Marriott (1980) and she highlights the fact that little work has been done to determine the effects on eating quality of applied post-harvest practices.
Media reports in Australia suggest that consumers are not satisfied with bananas currently available in the market place (Macken, 1980). They claim that present-day bananas are paler, firmer, less sweet, more rubbery and floury than bananas that were available a generation ago. This type of information appears to be available from memory standards. There is no experimental evidence available to determine whether the introduction of gassing allowed this type of opinion to be generated. Striven et nl. (1989) summarize the inadequacies of the minimal number of previous sensory studies on bananas (i.e. Peacock, 1980; Thompson & Seymour, 1982). Striven et al. also report work using a trained sensory panel which found that for bananas at the same skin colour ripeness (stage 6), fruit ripened naturally were more fruity, had less green flavour and were softer than ethylene-treated fruit. The questions which arise from this work and form the objectives of this paper are whether consumers can discriminate between gassed and naturally ripened bananas and what attributes are used. What is the relative liking for gassed and naturally ripened bananas and is there a marketing opportunity for naturally ripened bananas ?
MATERIALS AND METHODS
Bananas
Bananas were selected at different stages of skin colour ripeness by comparison with a commercial banana ripening guide (CSIRO, 1971). Peel colour changes are defined by eight stages, following the progression from hard to green to overripe. The colour stages chosen for this study were: 5-yellow with green tips; &full yellow; 7-yellow with the first signs of brown flecks.
Ungassed bananas were purchased from Flemington Markets, Sydney (Banana Growers Distributors Ltd), on the morning of their arrival, by train, from growers in northern Queensland. Bananas were extra large in size and of the cultivar Cavendish and were stored at ambient temperature and relative humidity (18 “C, 75 % RH). The time of purchase was such that a certain portion of the bananas would be at colour stages 5, 6 and 7 on the days of the consumer panel. The bananas for the panel were selected from about 600 bananas.
Ethylene-treated bananas were purchased from the same distributor as the naturally ripened bananas, and were of the same cultivar and size. Bananas were purchased at either f, k or g colour, which corresponds approximately to colour stages 2 (green with a trace of yellow), 3 (more green area than yellow) and 4 (more yellow area than green). The time for the bananas to ripen to colour stages 5, 6 and 7 was equivalent to the time of purchase before the panel. Bananas were stored under the same conditions as the naturally ripened bananas, but in different rooms. The bananas for the panels were selected from approxi- mately 500 bananas.
Consumer sample Sample preparation and presentation
Male (19) and female (19) consumers were selected from middle-class suburbs in Sydney, Australia with ages ranging from 21 to 60 years. Selection criteria also included con- sumption of bananas at least once per week and residence in Australia of at least 10 years.
On the day of the panel, approximately 45 bananas from gassed and naturally ripened bananas were selected. Fifteen bananas from each of the two groups were each of stages 5, 6 and 7. Approximately 10 min before testing
CONSUMER PERCEPTIONS OF BANANAS 219
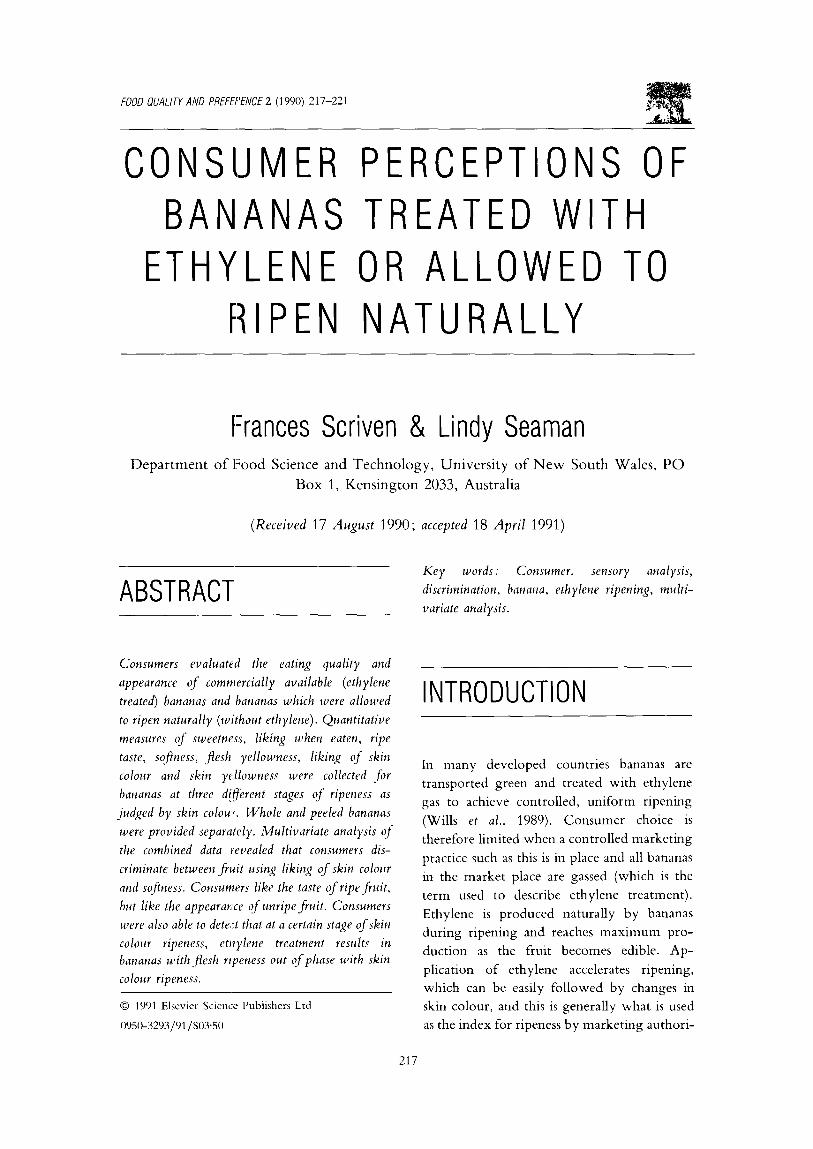
TABLE 1. Mean Scores for Sensory Attributes of Gassed and Naturally Ripened Bananas at Various Skin Colour
Ripeness Stages (Values in Parentheses are Standard Errors)
Ungassed
Attribute Stage 5 Stage 6 Stage I
Sweetness 35.0 (3.6) 448 (3%) 52.4 (4.4) Ripe taste 364 (3.8) 53.1 (46) 57.7 (49) Softness 25.8 (3.4) 39.1 (3.7) 49.9 (4.3) Liking when eaten 45.5 (45) 50.1 (3.4) 51.6 (4.7) Flesh yellowness 27.2 (2.4) 39.7 (3.9) 48.9 (4.1)
Yellowness of skin 40.0 (3.4) 50.0 (3.3) 543 (4.1) Liking of skin colour 51.2 (3.7) 48.2 (3.5) 28.6 (3.6)
Gassed
Attribute Stage 5 Stage 6 Stage I
Sweetness 38.7 (4.1) 36.8 (3.8) 51.1 (3.9) Ripe taste 36.4 (4.0) 33.1 (3.7) 57.8 (4.1) Softness 27.8 (3.3) 25.2 (2.8) 47.8 (3.7) Liking .+vhen eaten 42.5 (4.2) 440 (42) 61.7 (3.7) Flesh yellowness 31.3 (3.2) 27.4 (3.1) 36.2 (3.7) Yellowness of skin 56.1 (4.5) 49.5 (3.7) 62.0 (3.6) Liking Iof skin colour 61.0 (4.2) 65.4 (3.7) 37.6 (41)
-
TABLE 2. Loadings of Banana Attributes on the First
Two Principal Components and First Two Discriminant Functions (a Dash Indicates a Loading of Less Than 0.5)
Attribute Principal component
1 2
Sweetness 0.790 6
Ripe taste 0.820 6
Softness 0.766 2
Liking when eaten 0.638 9 -
Flesh yellowness 0650 4
Skin yellowness 0.682 3 Liking of skin colour 0.827 0 % Variance explained 39.9 17.6
Attribute Discriminant function
1 2
Sweetness Ripe taste
Softness 0545 9 Liking when eaten
Flesh yellowness
Skin yellowness 0.730 4 Liking of skin colour - 0627 3 o/o Variance explained 82.2 9.4
was about to start, bananas were peeled and cut into cylindrical pieces of uniform shape and length (3 cm) so that each consumer received one piece of each of the six banana
0.6 -- r
0.2 A P P e a 0 r a n c e
-0.2
1
-0.4 : ~-~- -~~
I.1 G /
_ 0.6 m.IpJ.d.~ d
-0.6 -0.4 -0.2 0 0.2 0.4 0.6 0.8 Taste & texture
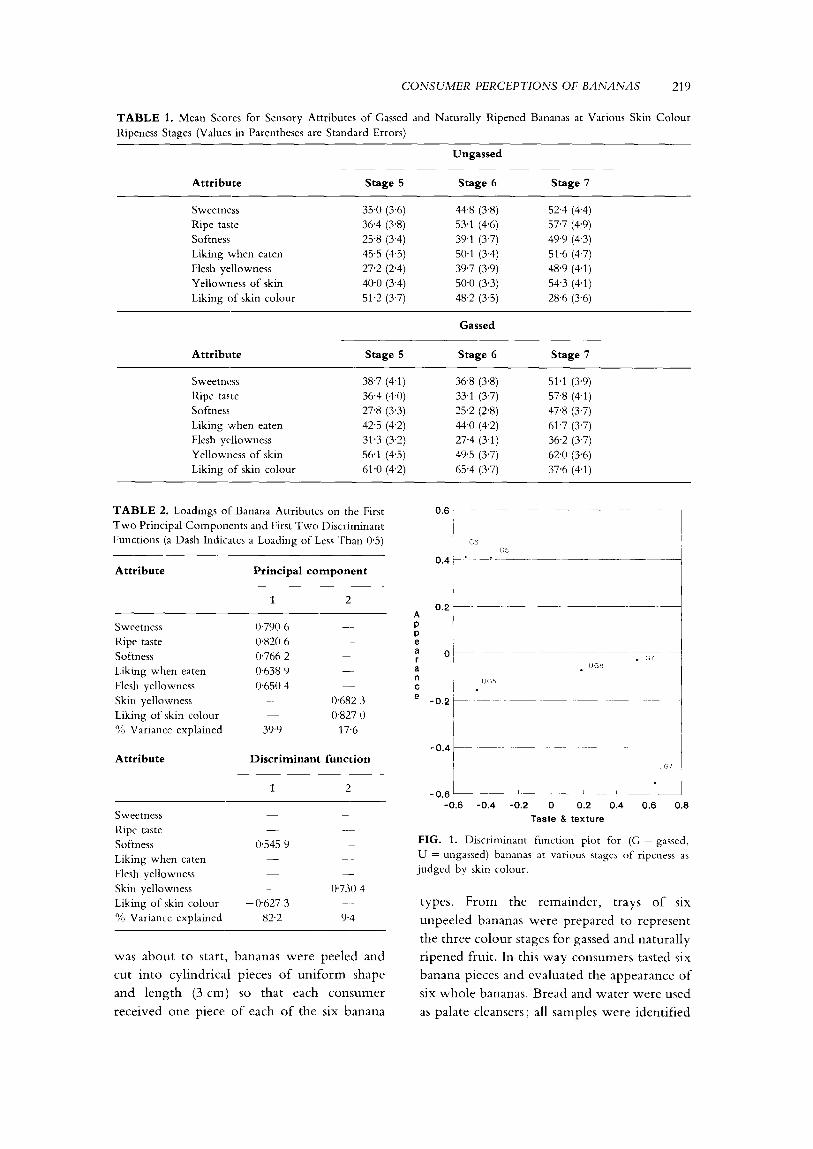
FIG. 1. Discriminant function plot for (G = gassed,
U = ungassed) bananas at various stages of ripeness as
judged by skin colour.
types. From the remainder, trays of six unpeeled bananas were prepared to represent the three colour stages for gassed and naturally ripened fruit. In this way consumers tasted six banana pieces and evaluated the appearance of six whole bananas. Bread and water were used as palate cleansers ; all samples were identified

220 FRANCES SCRIVEN, LINDY SEAMAN
by three-digit codes only, and presentation was adjusted to avoid positional bias.
Questionnaire
The questionnaire comprised a series of 100- mm graphic line scales, anchored at either end with the following descriptors : sweetness (not sweet to very sweet), ripe taste (very unripe to very ripe), softness (firm to soft), liking (dislike to like), flesh yellowness (pale yellow to strong yellow), yellowness of skin (pale yellow to strong yellow), liking of skin colour (dislike to like).
Collection of data and analysis
Responses were collected as line lengths (mm) from the left hand side of the scale to where the respondent placed a mark to indicate their opinion. The data obtained from each subject were prepared in the form of a separate product by attribute matrix. These data sets were then submitted to a number of multi- variate analyses including principal component analysis, discriminant function and multiple regression using SPSSx (SPSSx, 1988). In- terpretation was based on identifying the attributes most highly correlated (+ or -) with the computed principal components, discriminant functions or multiple regression under consideration.
Results and Discussion
Mean line-scale scores are presented in Table 1 and the results of principal component and discriminant function analyses in Table 2. The variance explained by the multivariate analyses is sufficient to allow interpretation. Consumer studies generally require at least 100 consumers to participate. In this case the logistics and cost was prohibitive of obtaining sufficient bananas at the appropriate stage of ripeness when required for 100 consumers. The results in Table 2 suggest that instead of seven attributes
0.6 ,
” 0.2
Y e I I 0 w 0 ” e s s
-0.2
0.4
S k I
2
-1 -0.5 0 0.5 1 1.5
Softness - liking of skin colour
FIG. 2. Principal component plot of the first two major
dimensions for gassed (G) and ungassed (U) bananas at
different stages of ripeness as judged by skin colour.
to define bananas as in Table 1, two is probably sufficient. The first principal component is a combination of ripe taste, sweetness, softness, flesh yellowness and liking when eaten. These are given in decreasing order of contribution. We can call this dimension a taste/texture dimension. The second principal component is a combination of liking of skin colour and skin yellowness. We can call this dimension an appearance dimension. Similarly we can label the two discriminant functions as a com- bination of softness and lack of skin colour liking and skin yellowness. Instead of looking at the scores that were achieved by each banana type on each of the seven attribute scales, it is now possible (and more simple) to look at the score each banana type achieved on each dimension. This is shown in Figs 1 and 2.
The discriminant function allows interpret- ation of how consumers discriminate. A very large amount (almost all) of the variance is explained, showing that consumers can readily distinguish between bananas. Only the first discriminant function is significant (P < O.OOOOS), which means that decreasing liking of skin colour (i.e. loaded negatively in Table 2) and softness were essentially the only

CONSUMER PERCEPTIONS OF BANANAS 221
attributes consumers could use to distinguish
between bananas. The mean scores in Table 1
show that althoug:h bananas are perceived to
become softer, there is a greater change in
liking for skin co.lour, which decreases par-
ticularly at stage 7. Discriminant analysis
shows that both cf these attributes are used,
albeit to different degrees. A discriminant
function plot (Fig. 1) shows that bananas
allowed to ripen naturally are separated on the
first discriminant function as ripening pro-
gresses. The pattern for ungassed bananas is
stage 5, stage 6, stage 7. However, gassed
bananas do not show this progression. Stages 5
and 6 are interchanged and very close together.
The discriminant plot allows us to see the
pattern more easily than trying to evaluate
individual mean scores. Once we see the
pattern it is possible to focus on individual
scores. In fact, the bananas at stage 6 ripeness
reflect, exactly, the results reported by Striven
et nl. (1989) from a trained panel, i.e. that
gassed bananas at stage 6 are perceived to be
less soft than bananas ripened naturally to stage
6. The discriminant plot allows us to see the pattern, and the univariate results can then be
inspected. A principal component plot (Fig. 2)
shows the same anomaly in ripening be-
haviour. This confirms the previously reported
conclusion that ethylene appears to accelerate colour changes in the skin without
synchronized changes in the flesh. However, it
also appears from these results that metabolic
events are again ‘synchronized in the eyes of
the consumer at stage 7 because of the relative
positions of gassed and naturally ripened
bananas in Figs 1 and 2.
It is interesting to note that liking of skin
colour is for the less ripe fruit while liking
when eaten is for more ripe fruit. Given that
this was a blind tasting, it would seem that
post-harvest techniques to stimulate flesh
ripening and retard skin ripening are required.
In terms of marketing opportunities, once the
decision to purchase is made, liking of skin
colour would logically be the next decision
step, and naturally ripened bananas offer no
advantage over gassed bananas. It appears that
for stage 6 bananas, only, consumer complaints
that gassed bananas are firmer and less sweet
are true. However, in this study these attributes
do not translate into significantly different
scores for liking when eaten and it is possible
that we should have screened consumers for
their attitude, to create two segments for
study, i.e. complainers and non-complainers.
This does not discount the possibility that a
new segment in the market could be created
by appealing to the health-conscious with
naturally ripened bananas. Given the infor-
mation provided in this paper, claims about
taste advantages would need to be limited,
unless subsequent work on sensory segmen-
tation in the population identified a specific
target audience.
REFERENCES
CSIRO (1971). Banana Ripening Guide. Banana Res. Advisory Committee, Tech. Bull. 3. Com- monwealth Scientific and Industrial Research Organisation, Melbourne, Australia. Macken, D. (1980). Great looks, shame about the
taste. Sydney Morning Herald Good Weekend Maga- zine, September, 53-8.
Marriott, J. (1980). Bananas-physiology and
biochemistry of storage and ripening for optimum
quality. CRC Crit. Rev. Food Sci. & Nutr., 13, 41-80. Peacock, B. C. (1980). Banana ripening-effect of
temperature on fruit quality. Queensland 1. Agr. him. S-i., 37, 39945.
Striven, F. M., Gek Choo Ong 81 Willis, R. B. H.
(1989). Sensory differences between bananas
ripened without and with ethylene. HortScience, 24, 983-4. SPSSx (1988). User’r Guide. 3rd edn, SPSS,
Chicago Inc.
Thompson, A. K. & Seymour, G. B. (1982).
Comparative effects of acetylene and ethylene on
initiation of banana ripening. Ann. Appl. Biol., 101, 407-10. Wills, R. B. H., McGlasson, W. B., Graham, D. &
Lee, T. H. (1989). Postharvest: An Introduction to the Physiology and Handling of Fruit and Vegetables, 3rd
edn, UNSW Press, Kensington.