Embed Size (px)
Citation preview
MOUNTAIN-PLAINS INFORMATION OFFICE: Kansas City, Mo.Technical information: (816) 285-7000 [email protected] www.bls.gov/regions/mountain-plainsMedia contact: (816) 285-7000
Consumer Price Index, Midwest Region – December 2018Prices in the Midwest down 0.4 percent in December and 1.3 percent higher over the year
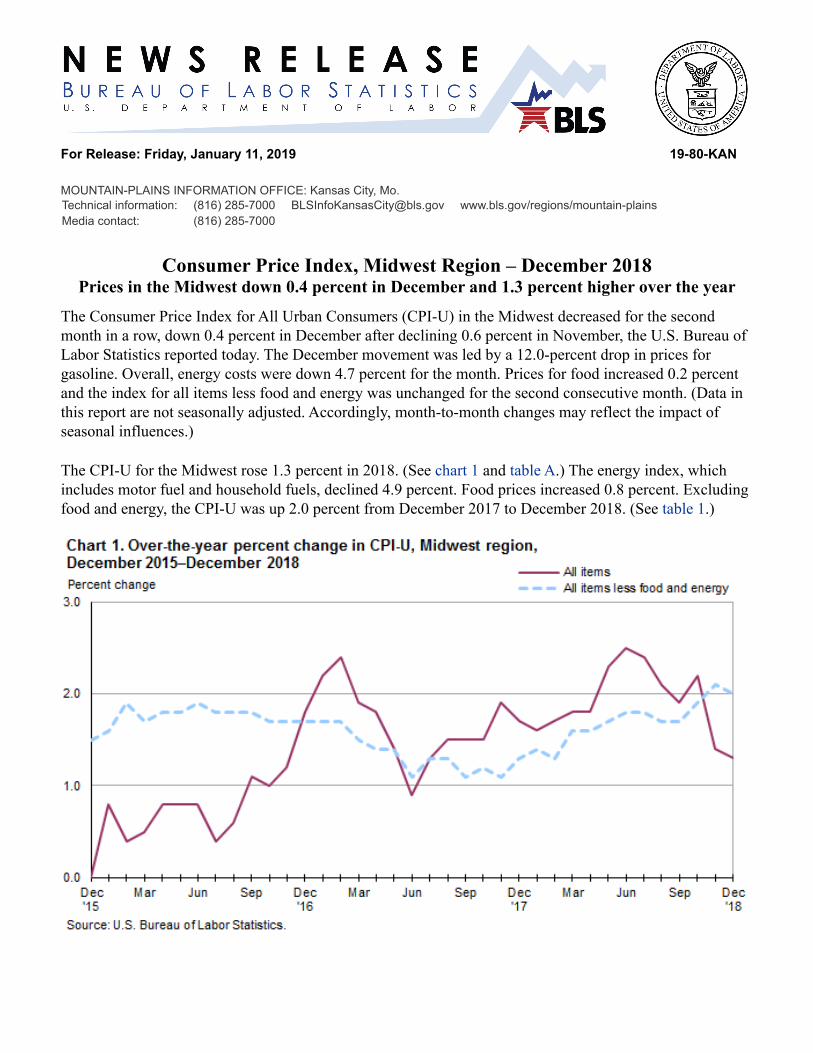
The Consumer Price Index for All Urban Consumers (CPI-U) in the Midwest decreased for the second month in a row, down 0.4 percent in December after declining 0.6 percent in November, the U.S. Bureau of Labor Statistics reported today. The December movement was led by a 12.0-percent drop in prices for gasoline. Overall, energy costs were down 4.7 percent for the month. Prices for food increased 0.2 percent and the index for all items less food and energy was unchanged for the second consecutive month. (Data in this report are not seasonally adjusted. Accordingly, month-to-month changes may reflect the impact of seasonal influences.)
The CPI-U for the Midwest rose 1.3 percent in 2018. (See chart 1 and table A.) The energy index, which includes motor fuel and household fuels, declined 4.9 percent. Food prices increased 0.8 percent. Excluding food and energy, the CPI-U was up 2.0 percent from December 2017 to December 2018. (See table 1.)
For Release: Friday, January 11, 2019 19-80-KAN
2
FoodFood prices in the Midwest were up 0.2 percent in December led by higher prices for food away from home (0.3 percent). Prices for food at home were little changed (0.1 percent).
From December 2017 to December 2018, the index for food rose 0.8 percent. Prices for food away from home were up 2.5 percent and were responsible for the increase. Prices for food at home were 0.4 percent lower over the year.
EnergyThe energy index was down 4.7 percent in December after declining 7.0 percent in the prior month. A 12.0-percent drop in prices for gasoline led the December decline. In November, gasoline prices fell 10.5 percent. Utility (piped) gas service costs registered their largest increase since March 2014, jumping 11.3 percent in December 2018. Electricity prices turned up 0.2 percent after decreasing in each of the three prior months.
Energy costs were down 4.9 percent in 2018. Prices for gasoline declined 10.2 percent from December 2017 to December 2018. Electricity prices were down 0.9 percent, but costs for utility (piped) gas service were 4.0 percent higher than a year ago.
All items less food and energyThe index for all items less food and energy for the Midwest was unchanged for the second month in a row. Among the expenditure categories registering higher costs were new and used motor vehicles (0.9 percent) and recreation (0.6 percent), while prices for apparel (-3.7 percent) were among those that declined over the month.
The index for all items less food and energy was up 2.0 percent from December 2017 to December 2018. Higher costs for shelter (3.4 percent) contributed to the increase.
The Midwest Consumer Price Index for All Urban Consumers (CPI-U) stood at 233.458 in December 2018. A typical market basket of goods and services that cost $100.00 in the 1982-84 base period cost $233.46 in December 2018.
CPI-WIn December, the Midwest Consumer Price Index for Urban Wage Earners and Clerical Workers (CPI-W) was 227.025. The CPI-W declined 0.6 percent in December and rose 1.1 percent over the year.
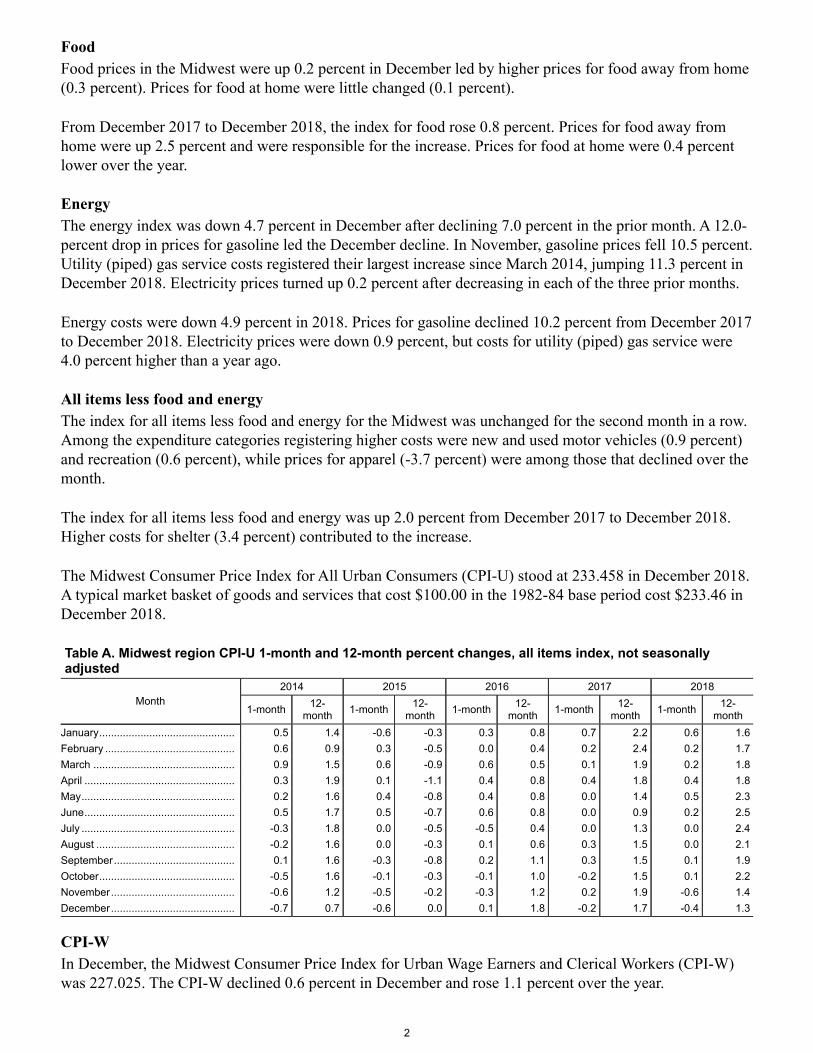
Table A. Midwest region CPI-U 1-month and 12-month percent changes, all items index, not seasonally adjusted
Month2014 2015 2016 2017 2018
1-month 12-month 1-month 12-
month 1-month 12-month 1-month 12-
month 1-month 12-month
January.............................................. 0.5 1.4 -0.6 -0.3 0.3 0.8 0.7 2.2 0.6 1.6February ............................................ 0.6 0.9 0.3 -0.5 0.0 0.4 0.2 2.4 0.2 1.7March ................................................ 0.9 1.5 0.6 -0.9 0.6 0.5 0.1 1.9 0.2 1.8April ................................................... 0.3 1.9 0.1 -1.1 0.4 0.8 0.4 1.8 0.4 1.8May.................................................... 0.2 1.6 0.4 -0.8 0.4 0.8 0.0 1.4 0.5 2.3June................................................... 0.5 1.7 0.5 -0.7 0.6 0.8 0.0 0.9 0.2 2.5July .................................................... -0.3 1.8 0.0 -0.5 -0.5 0.4 0.0 1.3 0.0 2.4August ............................................... -0.2 1.6 0.0 -0.3 0.1 0.6 0.3 1.5 0.0 2.1September......................................... 0.1 1.6 -0.3 -0.8 0.2 1.1 0.3 1.5 0.1 1.9October.............................................. -0.5 1.6 -0.1 -0.3 -0.1 1.0 -0.2 1.5 0.1 2.2November.......................................... -0.6 1.2 -0.5 -0.2 -0.3 1.2 0.2 1.9 -0.6 1.4December.......................................... -0.7 0.7 -0.6 0.0 0.1 1.8 -0.2 1.7 -0.4 1.3

3
The January 2019 Consumer Price Index for the Midwest region is scheduled to be released on Wednesday, February 13, 2019.
Technical Note
The Consumer Price Index (CPI) is a measure of the average change in prices over time in a fixed market basket of goods and services. The Bureau of Labor Statistics publishes CPIs for two population groups: (1) a CPI for All Urban Consumers (CPI-U) which covers approximately 93 percent of the total population and (2) a CPI for Urban Wage Earners and Clerical Workers (CPI-W) which covers approximately 29 percent of the total population. The CPI-U includes, in addition to wage earners and clerical workers, groups such as professional, managerial, and technical workers, the self-employed, short-term workers, the unemployed, and retirees and others not in the labor force.
The CPI is based on prices of food, clothing, shelter, and fuels, transportation fares, charges for doctors' and dentists' services, drugs, and the other goods and services that people buy for day-to-day living. Each month, prices are collected in 75 urban areas across the country from about 5,000 housing units and approximately 22,000 retail establishments–department stores, supermarkets, hospitals, filling stations, and other types of stores and service establishments. All taxes directly associated with the purchase and use of items are included in the index.
The index measures price changes from a designated reference date (1982-84) that equals 100.0. An increase of 16.5 percent, for example, is shown as 116.5. This change can also be expressed in dollars as follows: the price of a base period "market basket" of goods and services in the CPI has risen from $10 in 1982-84 to $11.65. For further details see the CPI home page on the Internet at www.bls.gov/cpi and the BLS Handbook of Methods, Chapter 17, The Consumer Price Index, available on the Internet at www.bls.gov/opub/hom/pdf/homch17.pdf.
In calculating the index, price changes for the various items in each location are averaged together with weights that represent their importance in the spending of the appropriate population group. Local data are then combined to obtain a U.S. city average. Because the sample size of a local area is smaller, the local area index is subject to substantially more sampling and other measurement error than the national index. In addition, local indexes are not adjusted for seasonal influences. As a result, local area indexes show greater volatility than the national index, although their long-term trends are quite similar. NOTE: Area indexes do not measure differences in the level of prices between cities; they only measure the average change in prices for each area since the base period.
The Midwest region is comprised of Illinois, Indiana, Iowa, Kansas, Michigan, Minnesota, Missouri, Nebraska, North Dakota, Ohio, South Dakota, and Wisconsin.
Information in this release will be made available to sensory impaired individuals upon request. Voice phone: (202) 691-5200; Federal Relay Service: (800) 877-8339.
4
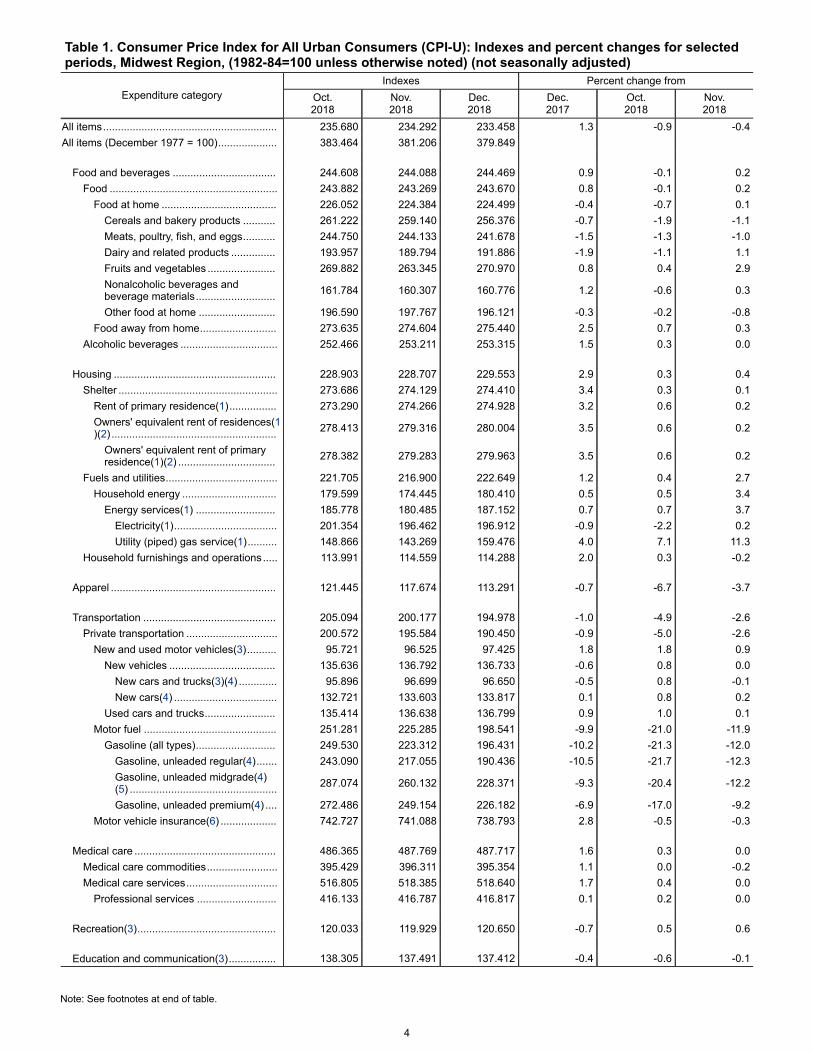
Table 1. Consumer Price Index for All Urban Consumers (CPI-U): Indexes and percent changes for selected periods, Midwest Region, (1982-84=100 unless otherwise noted) (not seasonally adjusted)
Expenditure categoryIndexes Percent change from
Oct.2018
Nov.2018
Dec.2018
Dec.2017
Oct.2018
Nov.2018
All items........................................................... 235.680 234.292 233.458 1.3 -0.9 -0.4All items (December 1977 = 100).................... 383.464 381.206 379.849
Food and beverages ................................... 244.608 244.088 244.469 0.9 -0.1 0.2Food ......................................................... 243.882 243.269 243.670 0.8 -0.1 0.2
Food at home ....................................... 226.052 224.384 224.499 -0.4 -0.7 0.1Cereals and bakery products ........... 261.222 259.140 256.376 -0.7 -1.9 -1.1Meats, poultry, fish, and eggs........... 244.750 244.133 241.678 -1.5 -1.3 -1.0Dairy and related products ............... 193.957 189.794 191.886 -1.9 -1.1 1.1Fruits and vegetables ....................... 269.882 263.345 270.970 0.8 0.4 2.9Nonalcoholic beverages and beverage materials........................... 161.784 160.307 160.776 1.2 -0.6 0.3
Other food at home .......................... 196.590 197.767 196.121 -0.3 -0.2 -0.8Food away from home.......................... 273.635 274.604 275.440 2.5 0.7 0.3
Alcoholic beverages ................................. 252.466 253.211 253.315 1.5 0.3 0.0
Housing ....................................................... 228.903 228.707 229.553 2.9 0.3 0.4Shelter ...................................................... 273.686 274.129 274.410 3.4 0.3 0.1
Rent of primary residence(1)................ 273.290 274.266 274.928 3.2 0.6 0.2Owners' equivalent rent of residences(1)(2) ........................................................ 278.413 279.316 280.004 3.5 0.6 0.2
Owners' equivalent rent of primary residence(1)(2) ................................. 278.382 279.283 279.963 3.5 0.6 0.2
Fuels and utilities...................................... 221.705 216.900 222.649 1.2 0.4 2.7Household energy ................................ 179.599 174.445 180.410 0.5 0.5 3.4
Energy services(1) ........................... 185.778 180.485 187.152 0.7 0.7 3.7Electricity(1)................................... 201.354 196.462 196.912 -0.9 -2.2 0.2Utility (piped) gas service(1).......... 148.866 143.269 159.476 4.0 7.1 11.3
Household furnishings and operations ..... 113.991 114.559 114.288 2.0 0.3 -0.2
Apparel ........................................................ 121.445 117.674 113.291 -0.7 -6.7 -3.7
Transportation ............................................. 205.094 200.177 194.978 -1.0 -4.9 -2.6Private transportation ............................... 200.572 195.584 190.450 -0.9 -5.0 -2.6
New and used motor vehicles(3).......... 95.721 96.525 97.425 1.8 1.8 0.9New vehicles .................................... 135.636 136.792 136.733 -0.6 0.8 0.0
New cars and trucks(3)(4) ............. 95.896 96.699 96.650 -0.5 0.8 -0.1New cars(4) ................................... 132.721 133.603 133.817 0.1 0.8 0.2
Used cars and trucks........................ 135.414 136.638 136.799 0.9 1.0 0.1Motor fuel ............................................. 251.281 225.285 198.541 -9.9 -21.0 -11.9
Gasoline (all types)........................... 249.530 223.312 196.431 -10.2 -21.3 -12.0Gasoline, unleaded regular(4)....... 243.090 217.055 190.436 -10.5 -21.7 -12.3Gasoline, unleaded midgrade(4)(5) .................................................. 287.074 260.132 228.371 -9.3 -20.4 -12.2
Gasoline, unleaded premium(4) .... 272.486 249.154 226.182 -6.9 -17.0 -9.2Motor vehicle insurance(6) ................... 742.727 741.088 738.793 2.8 -0.5 -0.3
Medical care ................................................ 486.365 487.769 487.717 1.6 0.3 0.0Medical care commodities........................ 395.429 396.311 395.354 1.1 0.0 -0.2Medical care services............................... 516.805 518.385 518.640 1.7 0.4 0.0
Professional services ........................... 416.133 416.787 416.817 0.1 0.2 0.0
Recreation(3)............................................... 120.033 119.929 120.650 -0.7 0.5 0.6
Education and communication(3)................ 138.305 137.491 137.412 -0.4 -0.6 -0.1
Note: See footnotes at end of table.
5
Footnotes(1) This index series was calculated using a Laspeyres estimator. All other item stratum index series were calculated using a geometric means estimator.(2) Indexes on a December 1982=100 base.(3) Indexes on a December 1997=100 base.(4) Special index based on a substantially smaller sample.(5) Indexes on a December 1993=100 base.(6) Indexes on a December 1977=100 base.Note: Index applies to a month as a whole, not to any specific date.
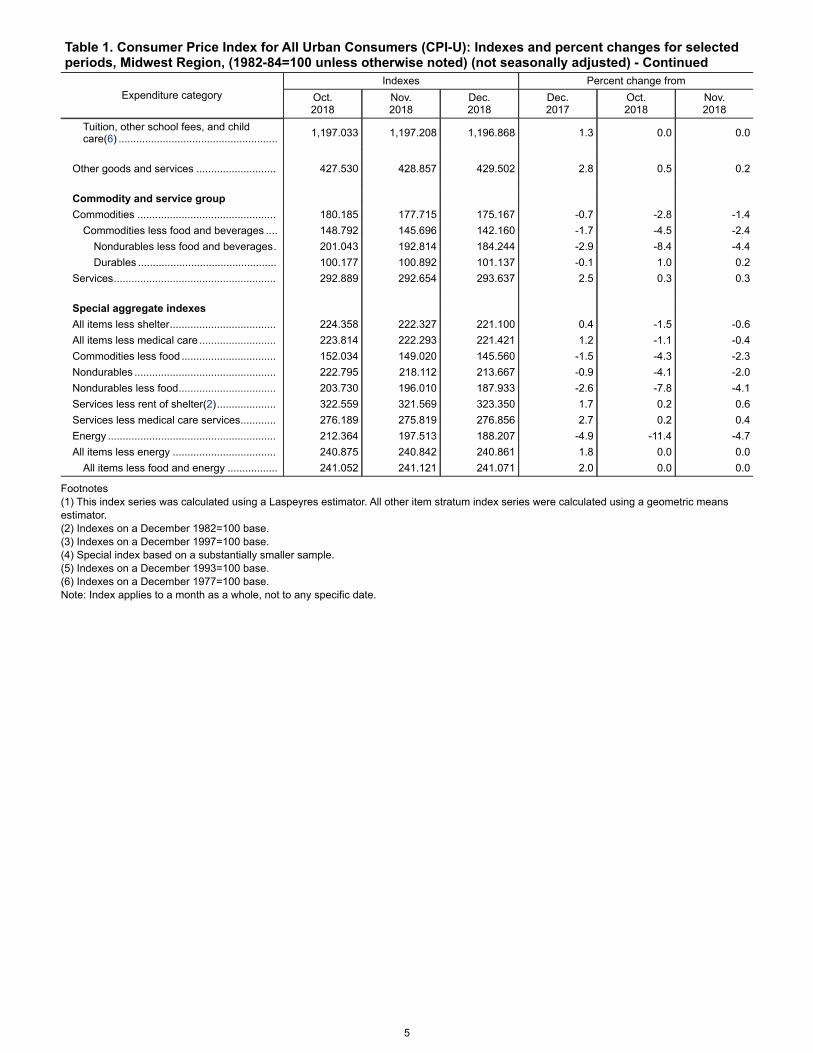
Table 1. Consumer Price Index for All Urban Consumers (CPI-U): Indexes and percent changes for selected periods, Midwest Region, (1982-84=100 unless otherwise noted) (not seasonally adjusted) - Continued
Expenditure categoryIndexes Percent change from
Oct.2018
Nov.2018
Dec.2018
Dec.2017
Oct.2018
Nov.2018
Tuition, other school fees, and child care(6) ...................................................... 1,197.033 1,197.208 1,196.868 1.3 0.0 0.0
Other goods and services ........................... 427.530 428.857 429.502 2.8 0.5 0.2
Commodity and service groupCommodities ............................................... 180.185 177.715 175.167 -0.7 -2.8 -1.4
Commodities less food and beverages .... 148.792 145.696 142.160 -1.7 -4.5 -2.4Nondurables less food and beverages. 201.043 192.814 184.244 -2.9 -8.4 -4.4Durables ............................................... 100.177 100.892 101.137 -0.1 1.0 0.2
Services....................................................... 292.889 292.654 293.637 2.5 0.3 0.3
Special aggregate indexesAll items less shelter.................................... 224.358 222.327 221.100 0.4 -1.5 -0.6All items less medical care .......................... 223.814 222.293 221.421 1.2 -1.1 -0.4Commodities less food ................................ 152.034 149.020 145.560 -1.5 -4.3 -2.3Nondurables ................................................ 222.795 218.112 213.667 -0.9 -4.1 -2.0Nondurables less food................................. 203.730 196.010 187.933 -2.6 -7.8 -4.1Services less rent of shelter(2).................... 322.559 321.569 323.350 1.7 0.2 0.6Services less medical care services............ 276.189 275.819 276.856 2.7 0.2 0.4Energy ......................................................... 212.364 197.513 188.207 -4.9 -11.4 -4.7All items less energy ................................... 240.875 240.842 240.861 1.8 0.0 0.0
All items less food and energy ................. 241.052 241.121 241.071 2.0 0.0 0.0