Embed Size (px)
Citation preview
Consumer Research to Support a Consumer Research to Support a Standardized Grading System forStandardized Grading System for
PurePure Maple SyrupMaple Syrup
Presented to:IMSI Annual Business Meeting
Amherst, MassachusettsOctober 26, 2008
2
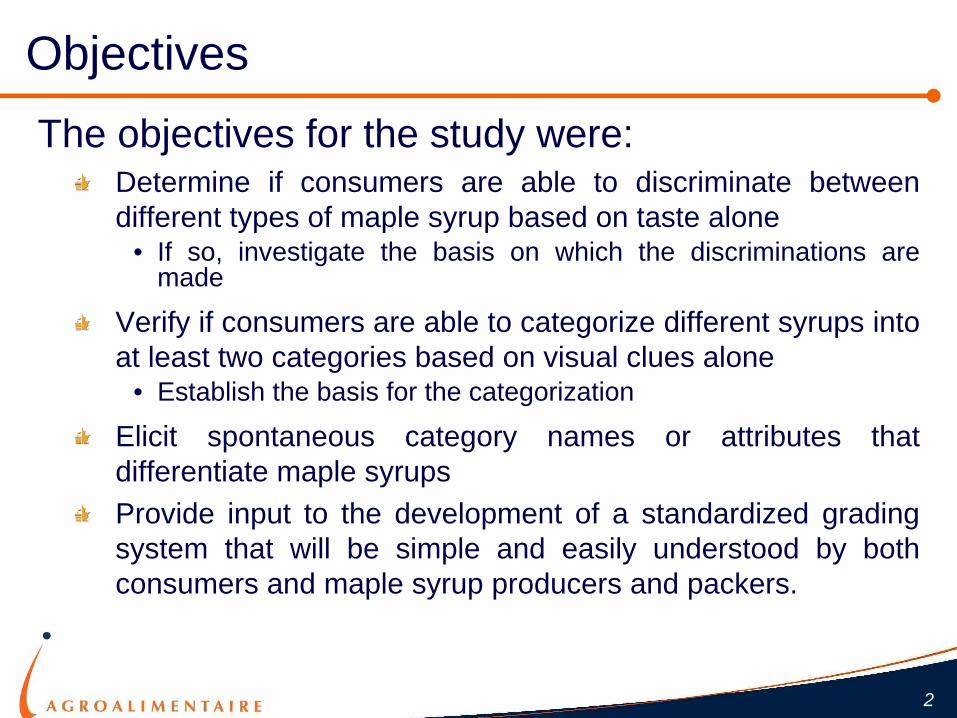
ObjectivesThe objectives for the study were:
Determine if consumers are able to discriminate between different types of maple syrup based on taste alone
• If so, investigate the basis on which the discriminations are made
Verify if consumers are able to categorize different syrups into at least two categories based on visual clues alone
• Establish the basis for the categorization
Elicit spontaneous category names or attributes that differentiate maple syrupsProvide input to the development of a standardized grading system that will be simple and easily understood by both consumers and maple syrup producers and packers.
3
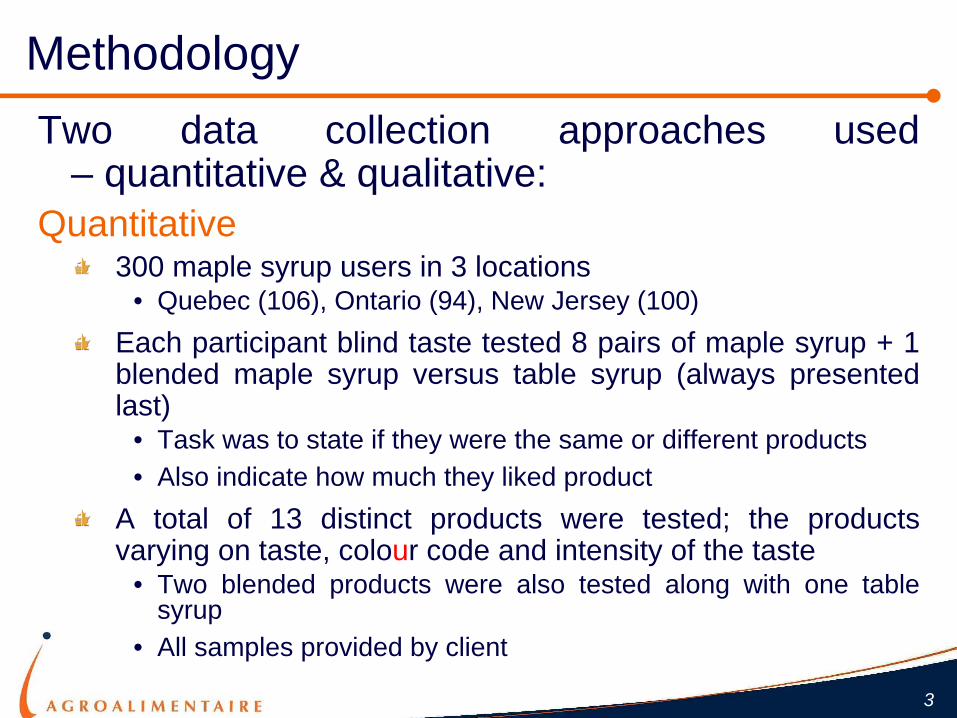
MethodologyTwo data collection approaches used
– quantitative & qualitative:Quantitative
300 maple syrup users in 3 locations• Quebec (106), Ontario (94), New Jersey (100)
Each participant blind taste tested 8 pairs of maple syrup + 1 blended maple syrup versus table syrup (always presented last)
• Task was to state if they were the same or different products• Also indicate how much they liked product
A total of 13 distinct products were tested; the products varying on taste, colour code and intensity of the taste
• Two blended products were also tested along with one table syrup
• All samples provided by client

4
Quantitative - continuedThe incomplete design with respect to flavour, colour code and intensity as well as the total number of participants resulted in the following design for the pairing of products:
Methodology – continued
5
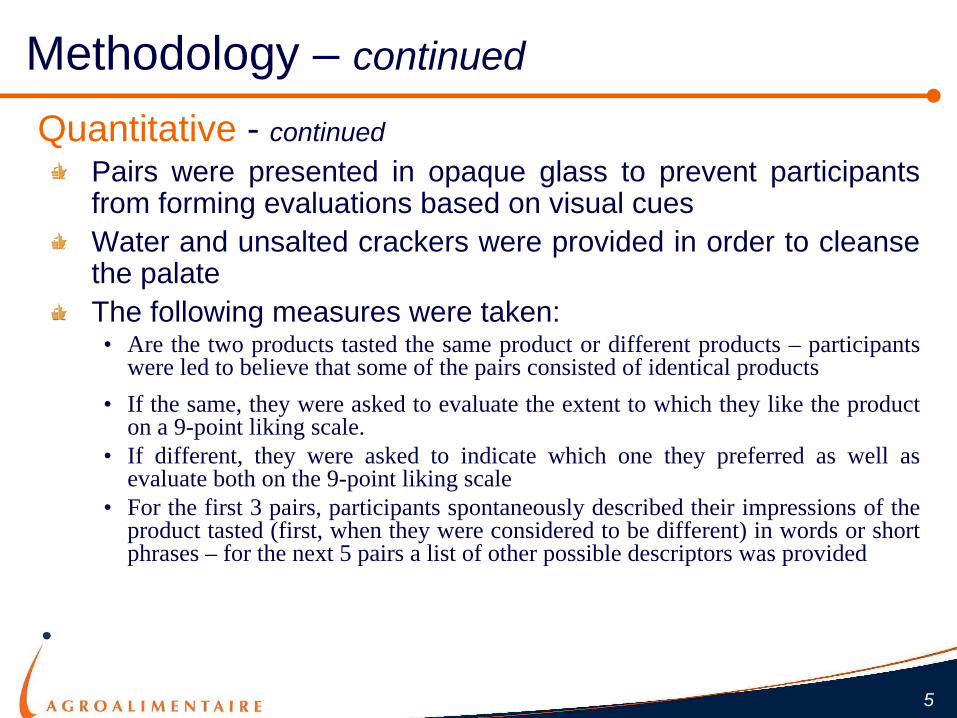
Quantitative - continuedPairs were presented in opaque glass to prevent participants from forming evaluations based on visual cuesWater and unsalted crackers were provided in order to cleanse the palateThe following measures were taken:• Are the two products tasted the same product or different products – participants
were led to believe that some of the pairs consisted of identical products• If the same, they were asked to evaluate the extent to which they like the product
on a 9-point liking scale.• If different, they were asked to indicate which one they preferred as well as
evaluate both on the 9-point liking scale • For the first 3 pairs, participants spontaneously described their impressions of the
product tasted (first, when they were considered to be different) in words or short phrases – for the next 5 pairs a list of other possible descriptors was provided
Methodology – continued
6
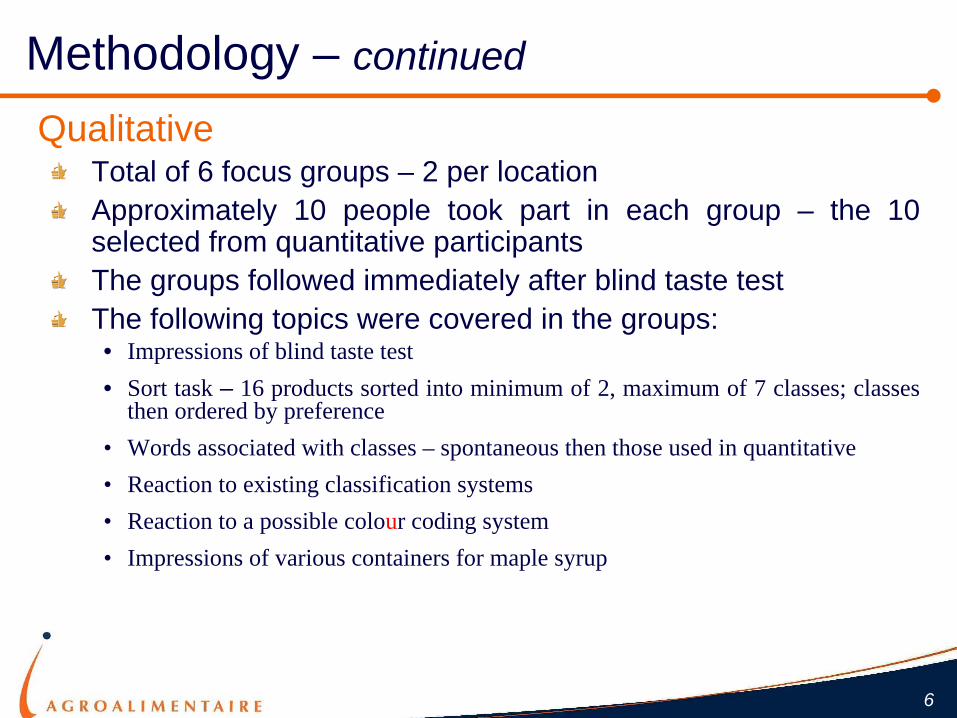
QualitativeTotal of 6 focus groups – 2 per locationApproximately 10 people took part in each group – the 10 selected from quantitative participantsThe groups followed immediately after blind taste testThe following topics were covered in the groups:• Impressions of blind taste test• Sort task – 16 products sorted into minimum of 2, maximum of 7 classes; classes
then ordered by preference• Words associated with classes – spontaneous then those used in quantitative• Reaction to existing classification systems• Reaction to a possible colour coding system• Impressions of various containers for maple syrup
Methodology – continued
7
What have we learned?What have we learned?
8
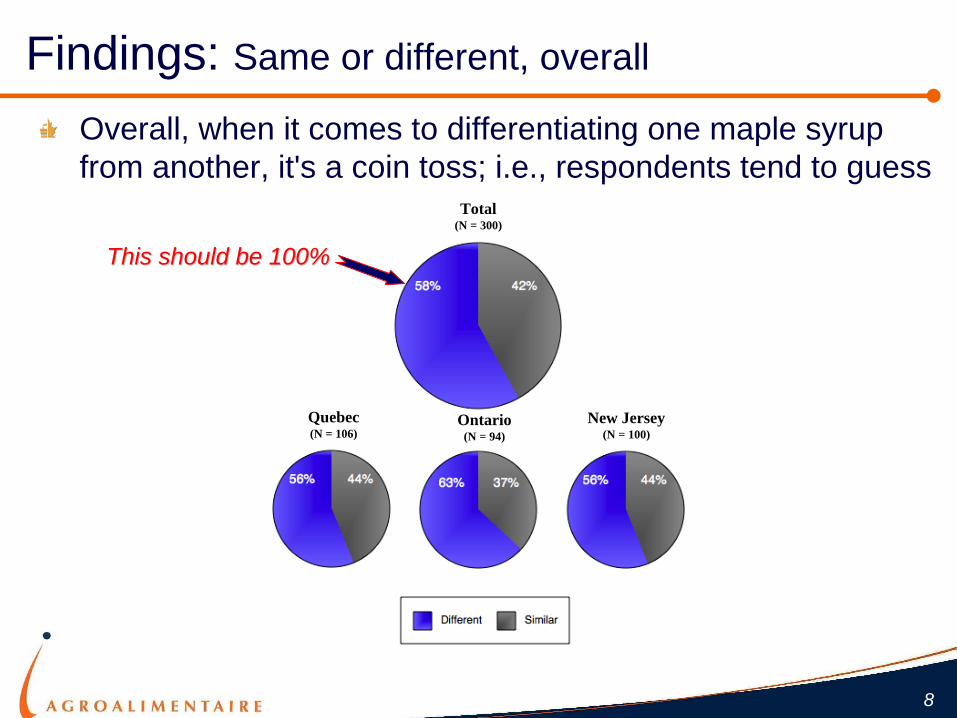
Overall, when it comes to differentiating one maple syrup from another, it's a coin toss; i.e., respondents tend to guess
Findings: Same or different, overall
Ontario(N = 94)
Total(N = 300)
New Jersey(N = 100)
Quebec(N = 106)
This should be 100%This should be 100%
9
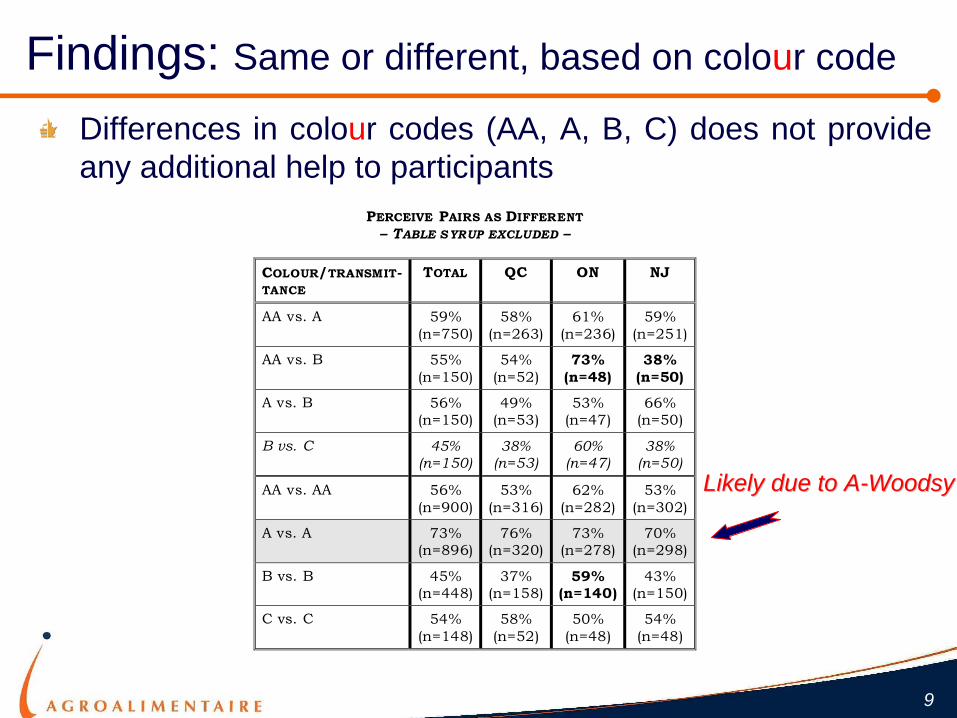
PERCEIVE PAIRS AS DIFFERENT – TABLE SYRUP EXCLUDED –
COLOUR/TRANSMIT-TANCE
TOTAL QC ON NJ
AA vs. A 59% (n=750)
58% (n=263)
61% (n=236)
59% (n=251)
AA vs. B 55% (n=150)
54% (n=52)
73% (n=48)
38% (n=50)
A vs. B 56% (n=150)
49% (n=53)
53% (n=47)
66% (n=50)
B vs. C 45% (n=150)
38% (n=53)
60% (n=47)
38% (n=50)
AA vs. AA 56% (n=900)
53% (n=316)
62% (n=282)
53% (n=302)
A vs. A 73% (n=896)
76% (n=320)
73% (n=278)
70% (n=298)
B vs. B 45% (n=448)
37% (n=158)
59% (n=140)
43% (n=150)
C vs. C 54% (n=148)
58% (n=52)
50% (n=48)
54% (n=48)
Differences in colour codes (AA, A, B, C) does not provide any additional help to participants
Findings: Same or different, based on colour code
Likely due to ALikely due to A--WoodsyWoodsy
10
PERCEIVE PAIRS AS DIFFERENT – TABLE SYRUP EXCLUDED –
INTENSITY TOTAL QC ON NJ
Maple vs. Vanilla
55% (n=299)
45% (n=104)
65% (n=94)
54% (n=101)
Maple. vs. Conf
58% (n=373)
58% (n=132)
59% (n=118)
56% (n=123)
Maple vs. Woodsy
71% (n=150)
70% (n=53)
72% (n=47)
62% (n=50)
Maple vs. Empyr.
49% (n=76)
46% (n=26)
61% (n=23)
41% (n=27)
Vanilla vs. Conf.
56% (n=300)
56% (n=108)
54% (n=92)
58% (n=100)
Vanilla vs. Woodsy
73% (n=150)
77% (n=53)
72% (n=47)
68% (n=50)
Conf. vs. Empyr.
39% (n=74)
27% (n=26)
58% (n=24)
33% (n=24)
Conf. vs. Woodsy
68% (n=151)
62% (n=53)
64% (n=47)
67% (n=51)
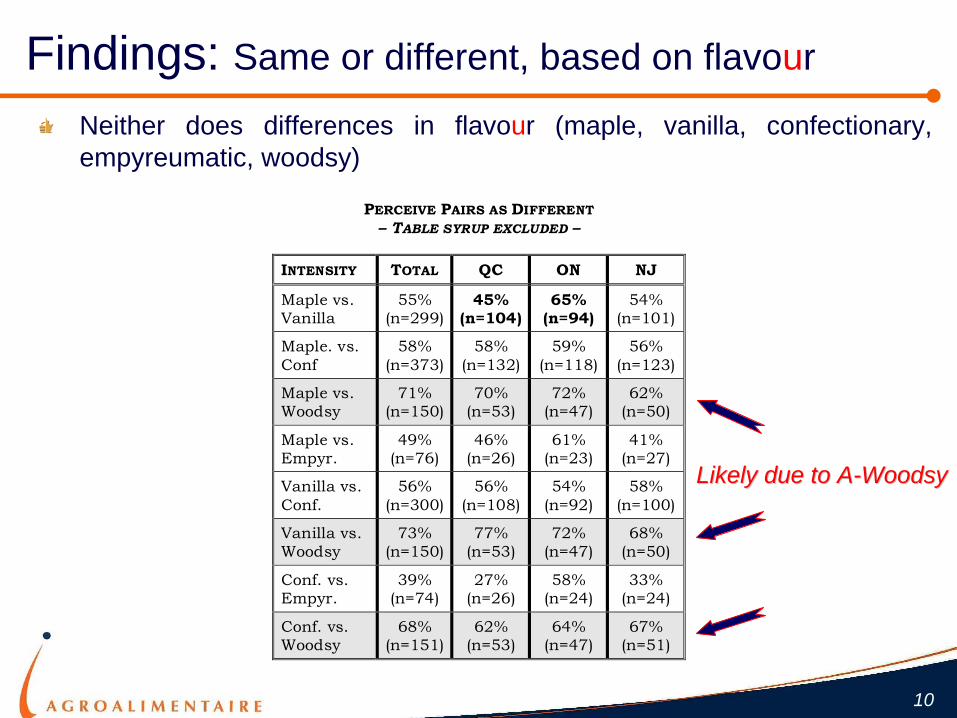
Neither does differences in flavour (maple, vanilla, confectionary, empyreumatic, woodsy)
Findings: Same or different, based on flavour
Likely due to ALikely due to A--WoodsyWoodsy
11
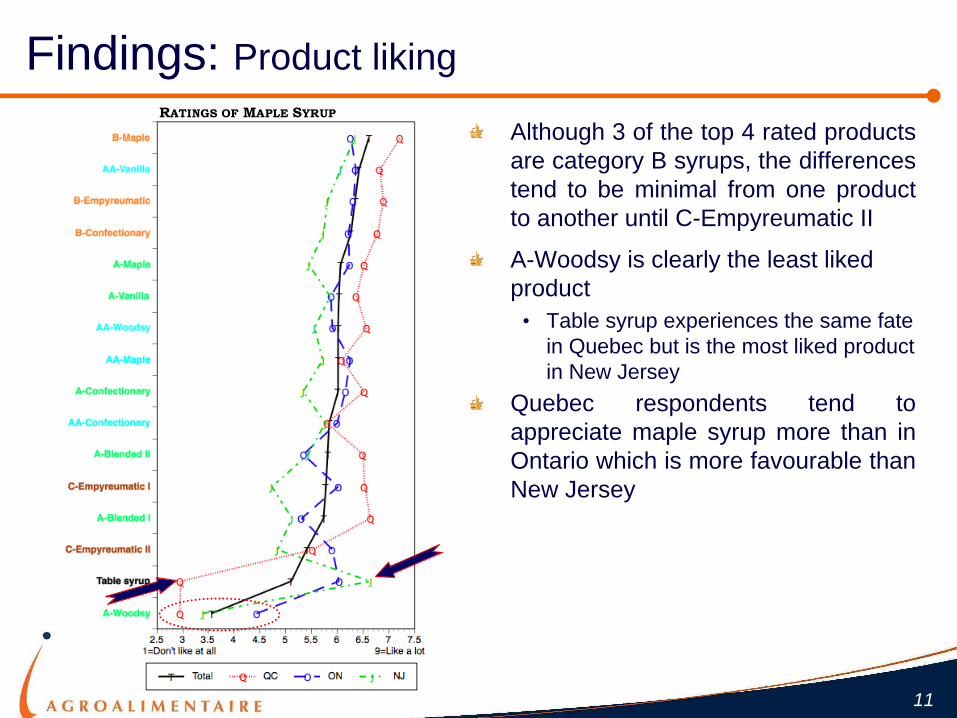
RATINGS OF MAPLE SYRUP
Although 3 of the top 4 rated products are category B syrups, the differences tend to be minimal from one product to another until C-Empyreumatic II
Findings: Product liking
A-Woodsy is clearly the least liked product
• Table syrup experiences the same fate in Quebec but is the most liked product in New Jersey
Quebec respondents tend to appreciate maple syrup more than in Ontario which is more favourable than New Jersey
12
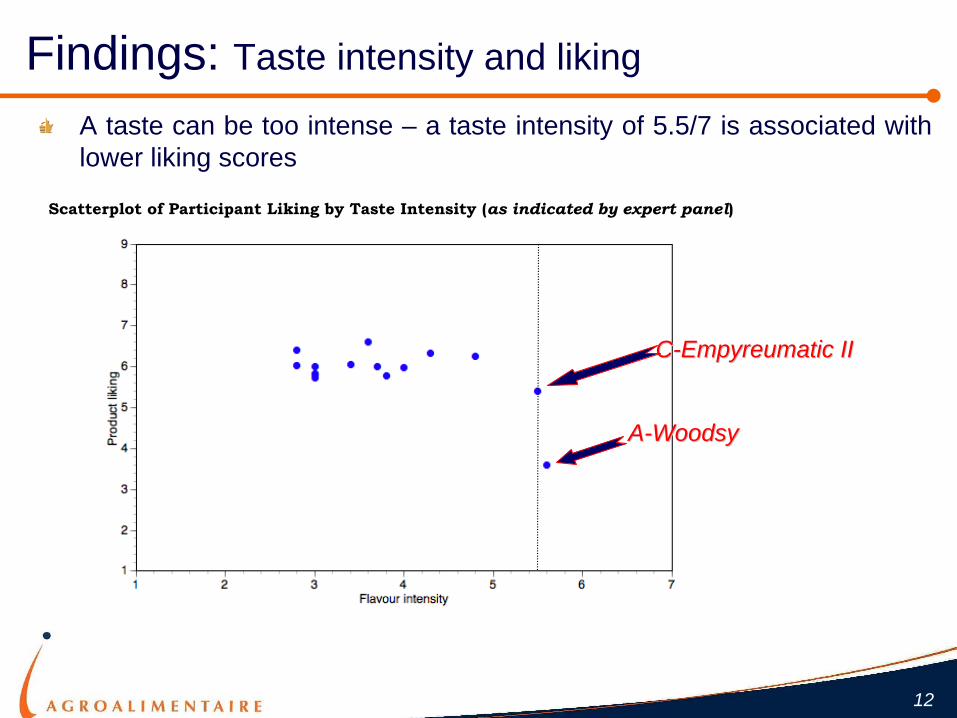
Scatterplot of Participant Liking by Taste Intensity (as indicated by expert panel)
A taste can be too intense – a taste intensity of 5.5/7 is associated with lower liking scores
Findings: Taste intensity and liking
CC--EmpyreumaticEmpyreumatic IIII
AA--WoodsyWoodsy
13
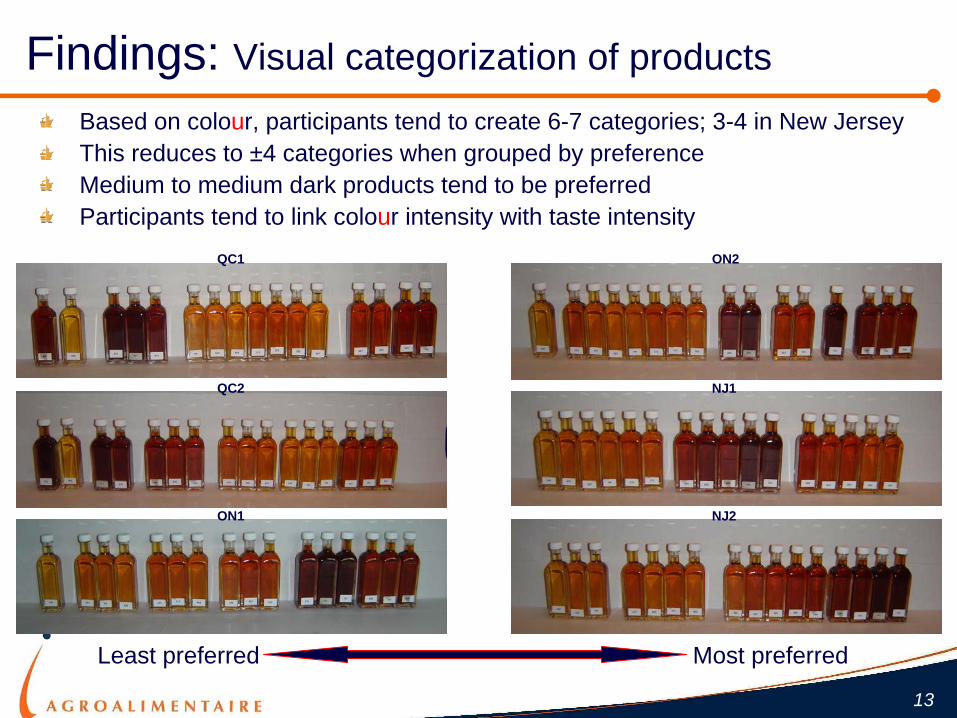
Based on colour, participants tend to create 6-7 categories; 3-4 in New JerseyThis reduces to ±4 categories when grouped by preferenceMedium to medium dark products tend to be preferredParticipants tend to link colour intensity with taste intensity
Findings: Visual categorization of products
QC1
NJ2
NJ1
ON2
ON1
QC2
Least preferred Most preferred
14
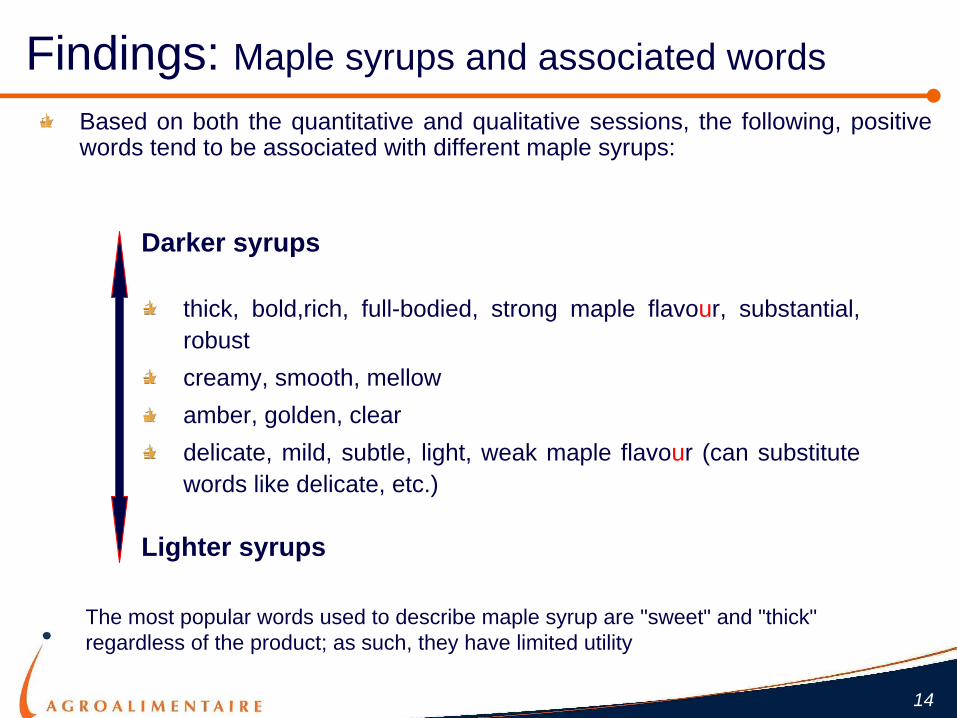
Based on both the quantitative and qualitative sessions, the following, positive words tend to be associated with different maple syrups:
Findings: Maple syrups and associated words
Darker syrups
thick, bold,rich, full-bodied, strong maple flavour, substantial, robustcreamy, smooth, mellowamber, golden, cleardelicate, mild, subtle, light, weak maple flavour (can substitute words like delicate, etc.)
Lighter syrups
The most popular words used to describe maple syrup are "sweet" and "thick" regardless of the product; as such, they have limited utility
15
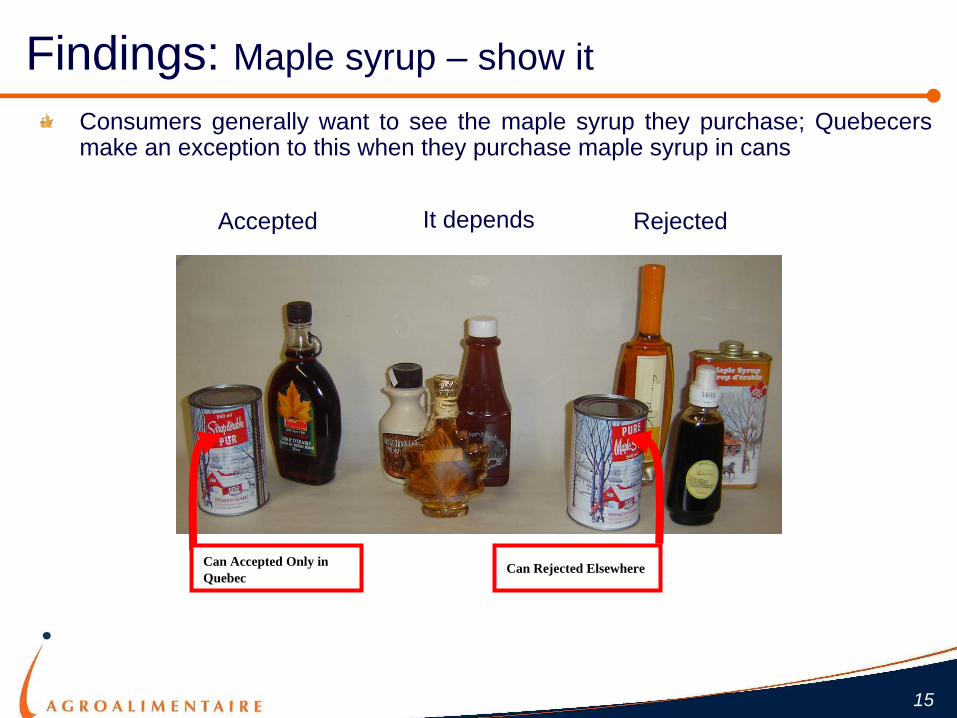
Consumers generally want to see the maple syrup they purchase; Quebecers make an exception to this when they purchase maple syrup in cans
Findings: Maple syrup – show it
Can Accepted Only in Quebec
Can Rejected Elsewhere
Accepted RejectedIt depends
16
When asked what they would like the "ideal" classification system to communicate to them, participants indicated the following elements:
It's pure maple syrup – nothing added, nothing taken away, no additivesThe colour category of the syrup, especially if not in transparent containersAs appropriate, the intensity of the maple flavour
Flavours other than maple are seen as being a category apart – there is the suspicion that the flavour has been added to the maple syrup, not inherent in it
The country of origin as well as the province/state – some would like to have the producer listed
Elements that were rejected include:Terminology such as: AA, etc; #1, #2, etc.; Grade A; "amber" for all colours
Findings: Information requirements
17
SummarySummary
18
Consumers have difficulty discriminating one maple syrup from another based on taste aloneColour is very important to themConsumers are able to produce a minimum of 4 categories of maple syrup based on its colour
They tend to assume that there is a one-to-one relationship between the colour of a syrup and the intensity of its taste – darker colours have more full-bodied, intense tastes
Words used to describe different visual grouping of syrup tend to reflect this assumption; i.e., darker = robust, bold, full-bodied, etc., lighter = delicate, mild, subtle, etc.They want maple syrup to taste like maple; other tastes, if too pronounced, may be greeted with some suspicion
We know that!
19
Investigate what approaches other industries, faced with a situation similar to that of the maple syrup industry, have adopted to classify their products in a way that is both easily understood by their customers as well as serving to promote it effectivelyDevelop X number of categories (likely to be 3-5) for maple syrup based on the most probable dimension used by consumers to classify maple syrup, taking into account producers and transformers ability to meaningfully vary syrup on that dimension - colour cannot be ignored in the development of the categoriesDevelop a sufficient number of concepts (2-5) reflecting the new classification system; validate on consumers as well as producers and transformersEstimate the impact of the new classification system on sales potential
Possible next steps
20
Thank You
Merci
21


![v v }vod }( vPo] ZW }. ] v ÇTOEFL Jr Standard graded by ETS preferred network offices. as well as individual section scores, based on a standardized Computerized grading for Reading](https://img.pdfslide.net/doc/110x75/5eb9b5eadba03413401481d1/v-v-vod-vpo-zw-v-toefl-jr-standard-graded-by-ets-preferred-network.jpg)