Embed Size (px)
Citation preview
1
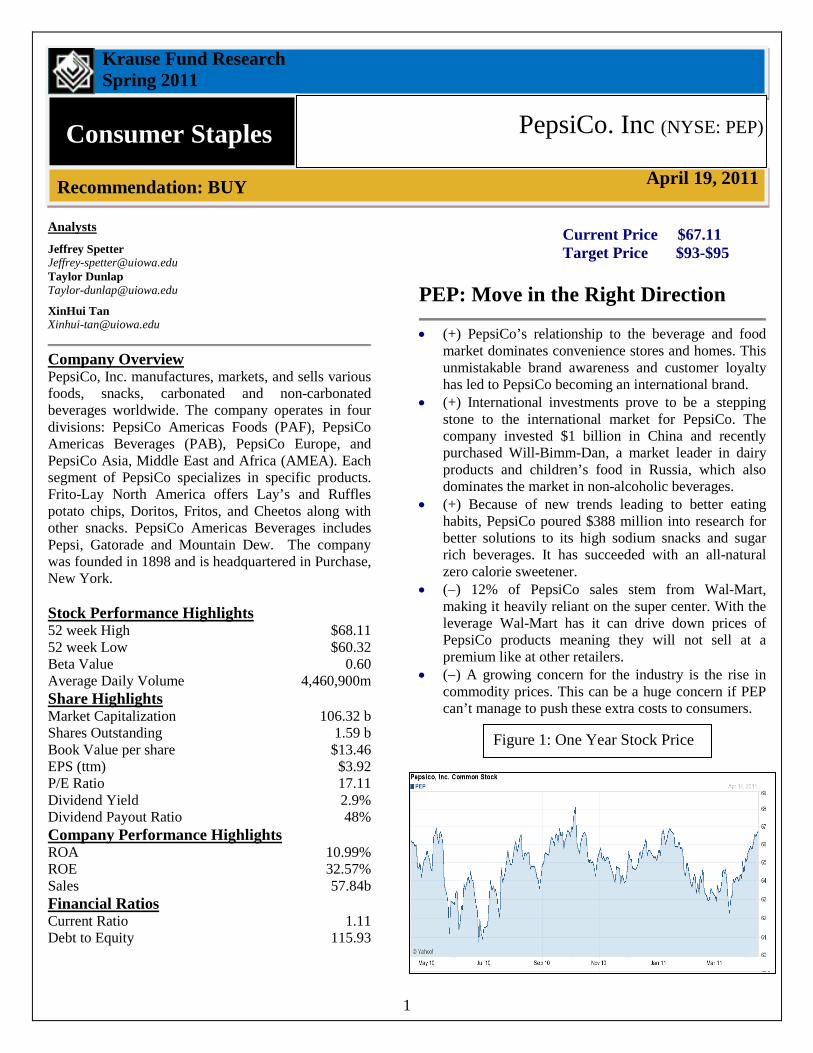
Krause Fund Research Spring 2011 Consumer Staples Recommendation: BUY Analysts Jeffrey Spetter [email protected] Taylor Dunlap [email protected]
XinHui Tan [email protected]
Company Overview PepsiCo, Inc. manufactures, markets, and sells various foods, snacks, carbonated and non-carbonated beverages worldwide. The company operates in four divisions: PepsiCo Americas Foods (PAF), PepsiCo Americas Beverages (PAB), PepsiCo Europe, and PepsiCo Asia, Middle East and Africa (AMEA). Each segment of PepsiCo specializes in specific products. Frito-Lay North America offers Lay’s and Ruffles potato chips, Doritos, Fritos, and Cheetos along with other snacks. PepsiCo Americas Beverages includes Pepsi, Gatorade and Mountain Dew. The company was founded in 1898 and is headquartered in Purchase, New York. Stock Performance Highlights 52 week High $68.11 52 week Low $60.32 Beta Value 0.60 Average Daily Volume 4,460,900m Share Highlights Market Capitalization 106.32 b Shares Outstanding 1.59 b Book Value per share $13.46 EPS (ttm) $3.92 P/E Ratio 17.11 Dividend Yield 2.9% Dividend Payout Ratio 48% Company Performance Highlights ROA 10.99% ROE 32.57% Sales 57.84b Financial Ratios Current Ratio 1.11 Debt to Equity 115.93
PepsiCo. Inc (NYSE: PEP)
April 19, 2011
Current Price $67.11 Target Price $93-$95
PEP: Move in the Right Direction
• (+) PepsiCo’s relationship to the beverage and food
market dominates convenience stores and homes. This unmistakable brand awareness and customer loyalty has led to PepsiCo becoming an international brand.
• (+) International investments prove to be a stepping stone to the international market for PepsiCo. The company invested $1 billion in China and recently purchased Will-Bimm-Dan, a market leader in dairy products and children’s food in Russia, which also dominates the market in non-alcoholic beverages.
• (+) Because of new trends leading to better eating habits, PepsiCo poured $388 million into research for better solutions to its high sodium snacks and sugar rich beverages. It has succeeded with an all-natural zero calorie sweetener.
• (−) 12% of PepsiCo sales stem from Wal-Mart, making it heavily reliant on the super center. With the leverage Wal-Mart has it can drive down prices of PepsiCo products meaning they will not sell at a premium like at other retailers.
• (−) A growing concern for the industry is the rise in commodity prices. This can be a huge concern if PEP can’t manage to push these extra costs to consumers.
Figure 1: One Year Stock Price
2
We analyzed micro and macroeconomics variables to forecast the earnings growth of PepsiCo. Taking into account rising oil prices, volatility in employment and the discrepancy between the Consumer Price Index and Producer Price Index to conclude PepsiCo is undervalued and a BUY recommendation. The company’s future plans to expand internationally and explore healthier food options put it on a growing and expanding track.
Producer Price Index The Producer Price Index is rising due to the costs of shipping, packaging and rising commodity prices. The intermediate foods and feeds index jumped to its highest level ever at 189.8 in March of 2011. PepsiCo products include corn syrup, an intermediate food, and continue to Pepsi Cola, to produce a finished consumer product. A rise in both the Intermediate and Finished goods indexes is an indication of rising commodity prices. Prices in corn have risen from Nov. - 208.5 to Dec. -221.3i
Consumer Price Index
. The price of plastic bottle manufacturing has remained constant and the price of cane sugar has remained steady over the past three months.
The Consumer Price Index will rise in the 2011 due to growing food prices. Between the time period of Nov. 2010 and Dec. 2010 the Bureau of Labor Statistics saw an increase in cookies, most fruits and vegetables, sugar, and potato chips. Raw material prices continue to rise, causing PepsiCo to pass the prices on to the consumer. Corn was at an index level of 220.241 in November and rose to 226.467 in Marchii
Relationship between CPI and PPI
. Corn is used in the production of corn syrup, a main ingredient in most of PepsiCo’s products. The Consumer Price Index has increased 2.7% in the past 12 months.
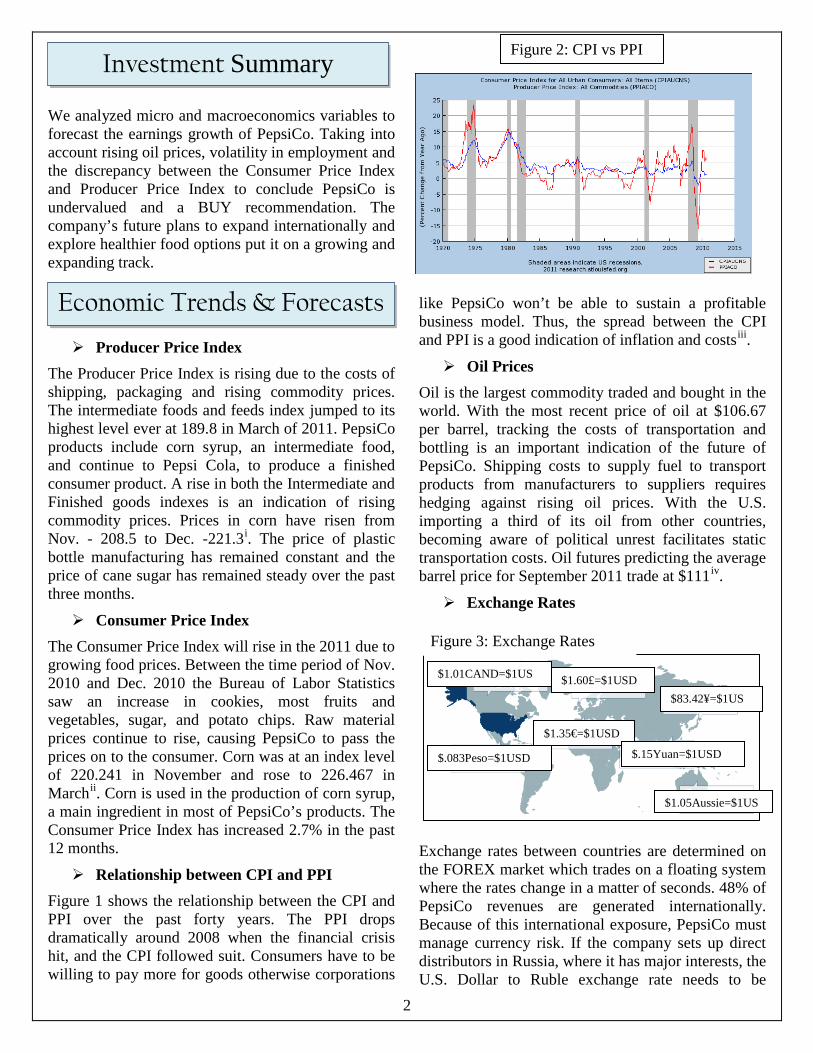
Figure 1 shows the relationship between the CPI and PPI over the past forty years. The PPI drops dramatically around 2008 when the financial crisis hit, and the CPI followed suit. Consumers have to be willing to pay more for goods otherwise corporations
like PepsiCo won’t be able to sustain a profitable business model. Thus, the spread between the CPI and PPI is a good indication of inflation and costsiii
Oil Prices
.
Oil is the largest commodity traded and bought in the world. With the most recent price of oil at $106.67 per barrel, tracking the costs of transportation and bottling is an important indication of the future of PepsiCo. Shipping costs to supply fuel to transport products from manufacturers to suppliers requires hedging against rising oil prices. With the U.S. importing a third of its oil from other countries, becoming aware of political unrest facilitates static transportation costs. Oil futures predicting the average barrel price for September 2011 trade at $111iv
Exchange Rates
.
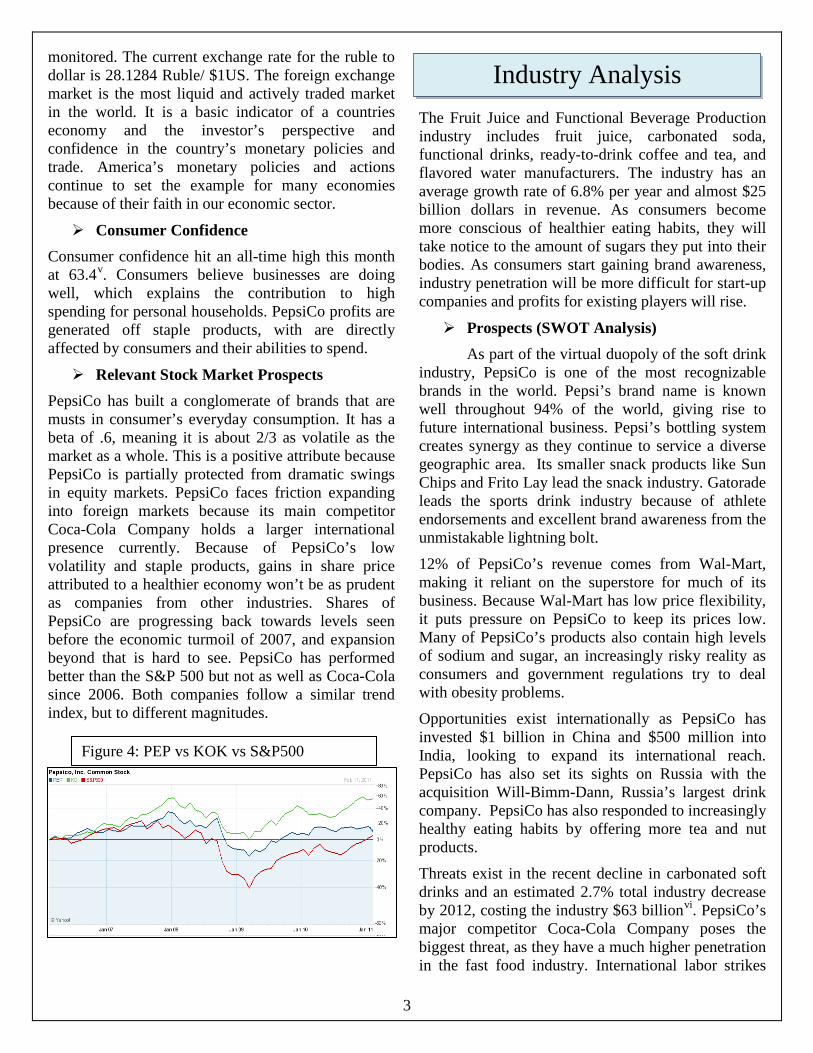
Exchange rates between countries are determined on the FOREX market which trades on a floating system where the rates change in a matter of seconds. 48% of PepsiCo revenues are generated internationally. Because of this international exposure, PepsiCo must manage currency risk. If the company sets up direct distributors in Russia, where it has major interests, the U.S. Dollar to Ruble exchange rate needs to be
$1.01CAND=$1US $1.60£=$1USD
$1.35€=$1USD
$.083Peso=$1USD $.15Yuan=$1USD
$83.42¥=$1US
$1.05Aussie=$1US
Investment Summary
Economic Trends & Forecasts
Figure 2: CPI vs PPI
Figure 3: Exchange Rates
3
monitored. The current exchange rate for the ruble to dollar is 28.1284 Ruble/ $1US. The foreign exchange market is the most liquid and actively traded market in the world. It is a basic indicator of a countries economy and the investor’s perspective and confidence in the country’s monetary policies and trade. America’s monetary policies and actions continue to set the example for many economies because of their faith in our economic sector.
Consumer Confidence Consumer confidence hit an all-time high this month at 63.4v
Relevant Stock Market Prospects
. Consumers believe businesses are doing well, which explains the contribution to high spending for personal households. PepsiCo profits are generated off staple products, with are directly affected by consumers and their abilities to spend.
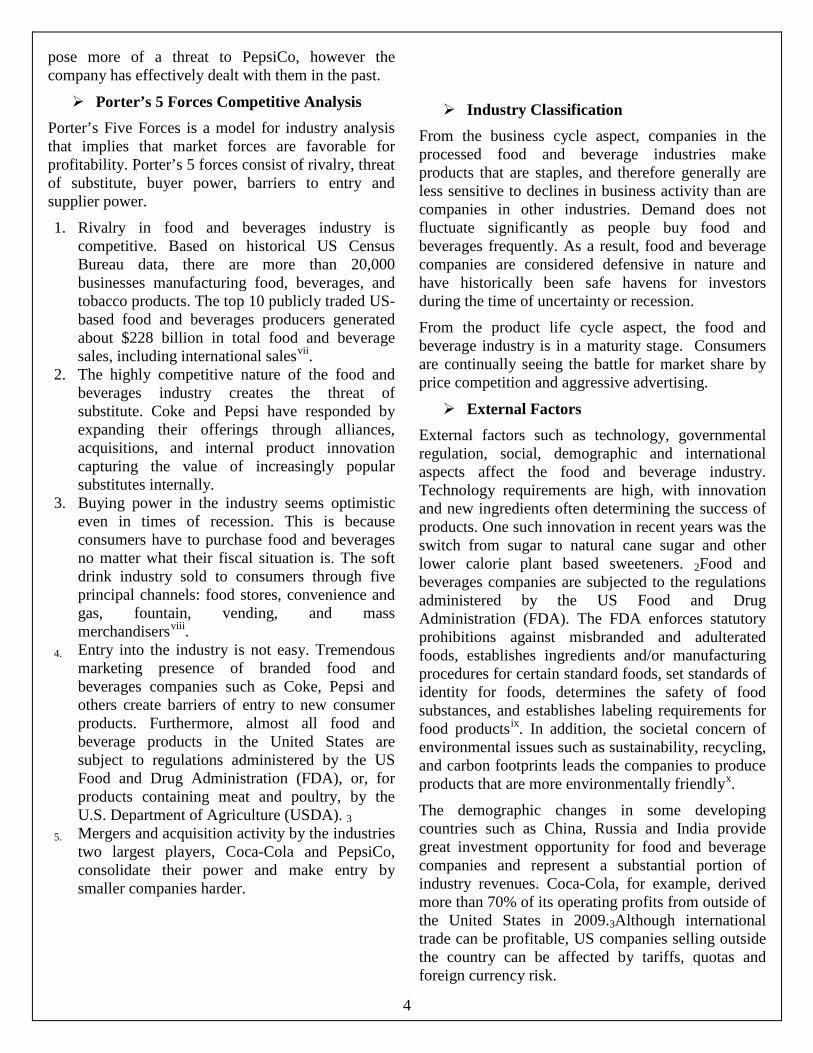
PepsiCo has built a conglomerate of brands that are musts in consumer’s everyday consumption. It has a beta of .6, meaning it is about 2/3 as volatile as the market as a whole. This is a positive attribute because PepsiCo is partially protected from dramatic swings in equity markets. PepsiCo faces friction expanding into foreign markets because its main competitor Coca-Cola Company holds a larger international presence currently. Because of PepsiCo’s low volatility and staple products, gains in share price attributed to a healthier economy won’t be as prudent as companies from other industries. Shares of PepsiCo are progressing back towards levels seen before the economic turmoil of 2007, and expansion beyond that is hard to see. PepsiCo has performed better than the S&P 500 but not as well as Coca-Cola since 2006. Both companies follow a similar trend index, but to different magnitudes.
The Fruit Juice and Functional Beverage Production industry includes fruit juice, carbonated soda, functional drinks, ready-to-drink coffee and tea, and flavored water manufacturers. The industry has an average growth rate of 6.8% per year and almost $25 billion dollars in revenue. As consumers become more conscious of healthier eating habits, they will take notice to the amount of sugars they put into their bodies. As consumers start gaining brand awareness, industry penetration will be more difficult for start-up companies and profits for existing players will rise.
Prospects (SWOT Analysis) As part of the virtual duopoly of the soft drink
industry, PepsiCo is one of the most recognizable brands in the world. Pepsi’s brand name is known well throughout 94% of the world, giving rise to future international business. Pepsi’s bottling system creates synergy as they continue to service a diverse geographic area. Its smaller snack products like Sun Chips and Frito Lay lead the snack industry. Gatorade leads the sports drink industry because of athlete endorsements and excellent brand awareness from the unmistakable lightning bolt.
12% of PepsiCo’s revenue comes from Wal-Mart, making it reliant on the superstore for much of its business. Because Wal-Mart has low price flexibility, it puts pressure on PepsiCo to keep its prices low. Many of PepsiCo’s products also contain high levels of sodium and sugar, an increasingly risky reality as consumers and government regulations try to deal with obesity problems.
Opportunities exist internationally as PepsiCo has invested $1 billion in China and $500 million into India, looking to expand its international reach. PepsiCo has also set its sights on Russia with the acquisition Will-Bimm-Dann, Russia’s largest drink company. PepsiCo has also responded to increasingly healthy eating habits by offering more tea and nut products.
Threats exist in the recent decline in carbonated soft drinks and an estimated 2.7% total industry decrease by 2012, costing the industry $63 billionvi. PepsiCo’s major competitor Coca-Cola Company poses the biggest threat, as they have a much higher penetration in the fast food industry. International labor strikes
Figure 4: PEP vs KOK vs S&P500
Industry Analysis
4
pose more of a threat to PepsiCo, however the company has effectively dealt with them in the past.
Porter’s 5 Forces Competitive Analysis Porter’s Five Forces is a model for industry analysis that implies that market forces are favorable for profitability. Porter’s 5 forces consist of rivalry, threat of substitute, buyer power, barriers to entry and supplier power.
1. Rivalry in food and beverages industry is competitive. Based on historical US Census Bureau data, there are more than 20,000 businesses manufacturing food, beverages, and tobacco products. The top 10 publicly traded US-based food and beverages producers generated about $228 billion in total food and beverage sales, including international salesvii
2. The highly competitive nature of the food and beverages industry creates the threat of substitute. Coke and Pepsi have responded by expanding their offerings through alliances, acquisitions, and internal product innovation capturing the value of increasingly popular substitutes internally.
.
3. Buying power in the industry seems optimistic even in times of recession. This is because consumers have to purchase food and beverages no matter what their fiscal situation is. The soft drink industry sold to consumers through five principal channels: food stores, convenience and gas, fountain, vending, and mass merchandisersviii
4. Entry into the industry is not easy. Tremendous marketing presence of branded food and beverages companies such as Coke, Pepsi and others create barriers of entry to new consumer products. Furthermore, almost all food and beverage products in the United States are subject to regulations administered by the US Food and Drug Administration (FDA), or, for products containing meat and poultry, by the U.S. Department of Agriculture (USDA). 3
.
5. Mergers and acquisition activity by the industries two largest players, Coca-Cola and PepsiCo, consolidate their power and make entry by smaller companies harder.
Industry Classification From the business cycle aspect, companies in the processed food and beverage industries make products that are staples, and therefore generally are less sensitive to declines in business activity than are companies in other industries. Demand does not fluctuate significantly as people buy food and beverages frequently. As a result, food and beverage companies are considered defensive in nature and have historically been safe havens for investors during the time of uncertainty or recession.
From the product life cycle aspect, the food and beverage industry is in a maturity stage. Consumers are continually seeing the battle for market share by price competition and aggressive advertising.
External Factors External factors such as technology, governmental regulation, social, demographic and international aspects affect the food and beverage industry. Technology requirements are high, with innovation and new ingredients often determining the success of products. One such innovation in recent years was the switch from sugar to natural cane sugar and other lower calorie plant based sweeteners. 2Food and beverages companies are subjected to the regulations administered by the US Food and Drug Administration (FDA). The FDA enforces statutory prohibitions against misbranded and adulterated foods, establishes ingredients and/or manufacturing procedures for certain standard foods, set standards of identity for foods, determines the safety of food substances, and establishes labeling requirements for food productsix. In addition, the societal concern of environmental issues such as sustainability, recycling, and carbon footprints leads the companies to produce products that are more environmentally friendlyx
The demographic changes in some developing countries such as China, Russia and India provide great investment opportunity for food and beverage companies and represent a substantial portion of industry revenues. Coca-Cola, for example, derived more than 70% of its operating profits from outside of the United States in 2009.3Although international trade can be profitable, US companies selling outside the country can be affected by tariffs, quotas and foreign currency risk.
.
5
Demand Analysis Consumers will continue to be interested in what they consider to be health-enhancing foods. In response, we see major food companies refocusing their best product lines and acquiring brands in encouraging new areas. For instance, in the snack food area, PepsiCo’s Frito-Lay North America unit introduced two new lightly salted varieties of chips in June 2010, Frito Lightly Salted corn chips and Ruffles Lightly Salted potato chips. The company hopes that these reduced salt products will help meet its goal to reduce sodium per serving by 25%. PepsiCo had already successfully reduced sodium by 25% in its seasoned Walker crisps in the UK in 2006 by replacing some of the salt with other seasonings and using smaller salt particlesxi
Profitability
.
Commodity prices increased significantly in the second half of 2010. Higher input costs are hard for snack food producers to pass on to consumers and stress the implementation of technology to streamline production. Coca-Cola Co. and PepsiCo Inc. have recently acquired their bottling operations to help with lowering profit margins.3
PepsiCo Incorporated is a Fortune 500, U.S. based global corporation formed in 1965 with the merger of the Pepsi-Cola Company and Frito-Lay, Inc. PepsiCo World Headquarters is located in Purchase, New York. PepsiCo is organized into four business units: PepsiCo Americas Foods (PAF), Quaker Foods North America (QFNA); PepsiCo Americas Beverages (PAB), PepsiCo Europe, and PepsiCo Asia, Middle East and Africa (AMEA). PepsiCo has 18 global brands which include Doritos, Quaker oats, Mountain Dew, Tropicana and others which are available in nearly 200 countries and territories.
PepsiCo (symbol: PEP) shares are traded principally on the New York Stock Exchange with a market capitalization exceeding $100 billion. The company is also listed on the Amsterdam, Chicago, Swiss and Tokyo stock exchanges and has consistently paid cash dividends since the corporation was founded.
Products and markets PepsiCo promotes itself as the choice of the “New Generation”, “Generation Next”, or just as the “Pepsi Generation”. These terms used in Pepsi’s advertising campaigns are meant to reach their target market between the ages of 18 to 29.2 Pepsi also targets the 12 to 18 year old age group to try to create loyal customers from a young age.
Pepsi’s product mix has recently changed with the adoption of healthier offerings. The company received $10 billion of its annual revenue, or 18%, from healthier than average products such as Quaker Oats, Dole and Tazo teas in 2010.1 PepsiCo has been putting a lot of research and development into developing more “good for you” products that taste great and offer health benefits. PepsiCo’s CEO Indra Nooyi has set a target for revenue from healthy foods of $30 billion by 2020. To that end, Nooyi hired a Chief Scientific Officer and several members of the World Health Organization to figure out how to take sugar and fat out of PepsiCo products and develop new food processesxii.The return on investment of these hires has already come to fruition with the invention of a micro-crystallized salt that could reduce sodium in Lays chips by as much as 25%xiii
Distribution Review
.
PepsiCo uses direct distribution strategy. PepsiCo works intensively with retail outlets, restaurants,
Company Analysis
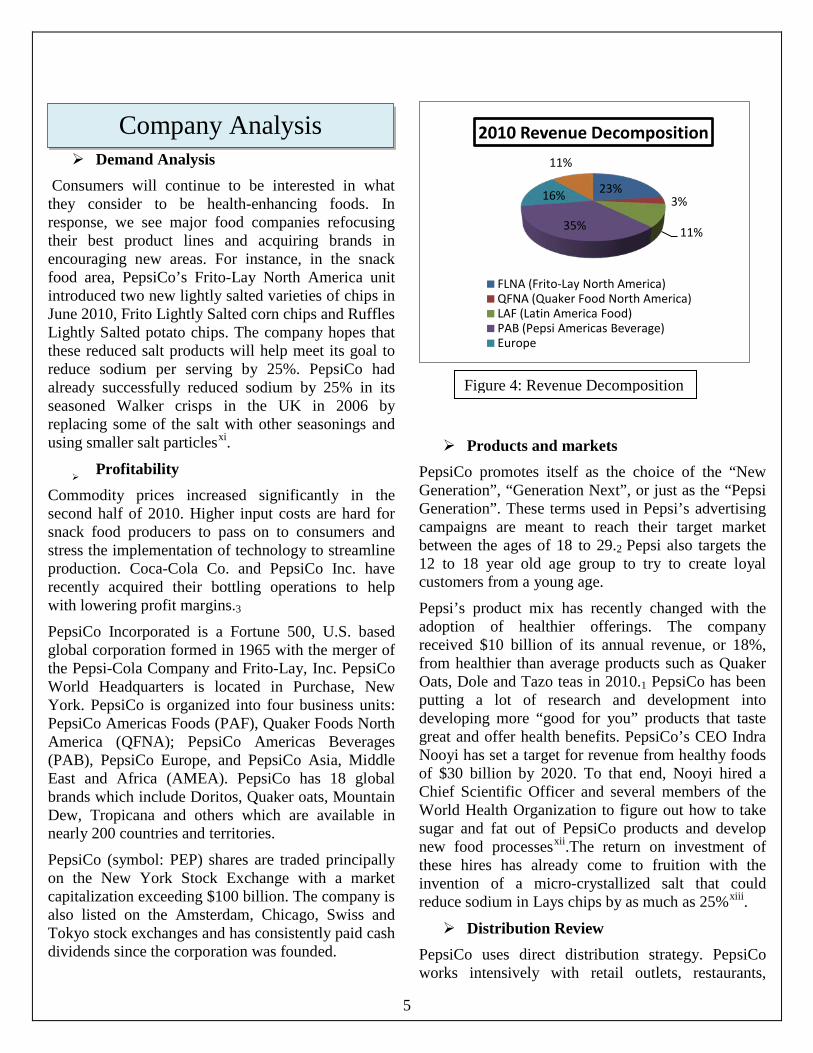
23%3%
11%35%
16%
11%
2010 Revenue Decomposition
FLNA (Frito-Lay North America)QFNA (Quaker Food North America)LAF (Latin America Food)PAB (Pepsi Americas Beverage)Europe
Figure 4: Revenue Decomposition
6
street vendors, convenience stores, airlines, schools, movie theaters, petrol stations and others to execute localized strategies. PepsiCo also cooperates with different wholesalers, restaurants and hotels like Pizza Hut, Metro, and KFC which serve as a hotbed for sales.2
Competition Review The competitors to the products of PepsiCo mainly lie in the processed and packaged goods industry. These competitors include The Coca-Cola Company, Dr Pepper Snapple Group, Inc. and Kellogg U.S. Snacks Division. These companies sell to businesses like Wal-Mart and Safeway, who label the product with their own brands and sell the products at a lower price.
(+) PepsiCo’s relationship to the beverage and food market dominates convenience stores and homes. The unmistakable brand awareness and customer loyalty has led to PepsiCo becoming an international brand. (+) International investments prove to be a stepping stone to the international market for PepsiCo. It invested $1 Billion in China and recently purchased Will-Bimm-Dan, a market leader in dairy products and children’s food in Russia while also dominating the market in non-alcoholic beverages. (+) Because of the new trends leading to better eating habits, PepsiCo poured $388 Million into research for better solutions to its high sodium snacks and sugar rich beverages. It has succeeded with an all-natural zero calorie sweeteners. (−) 12% of PepsiCo sales stem from Wal-Mart, making it heavily reliant on the super center. With the leverage Wal-Mart has it can drive down prices of PepsiCo products meaning they will not sell at a premium like at other retailers. (−) A growing concern for the industry is the rise in commodity prices. This can be a huge concern if they can’t manage to push these extra costs to the consumers.
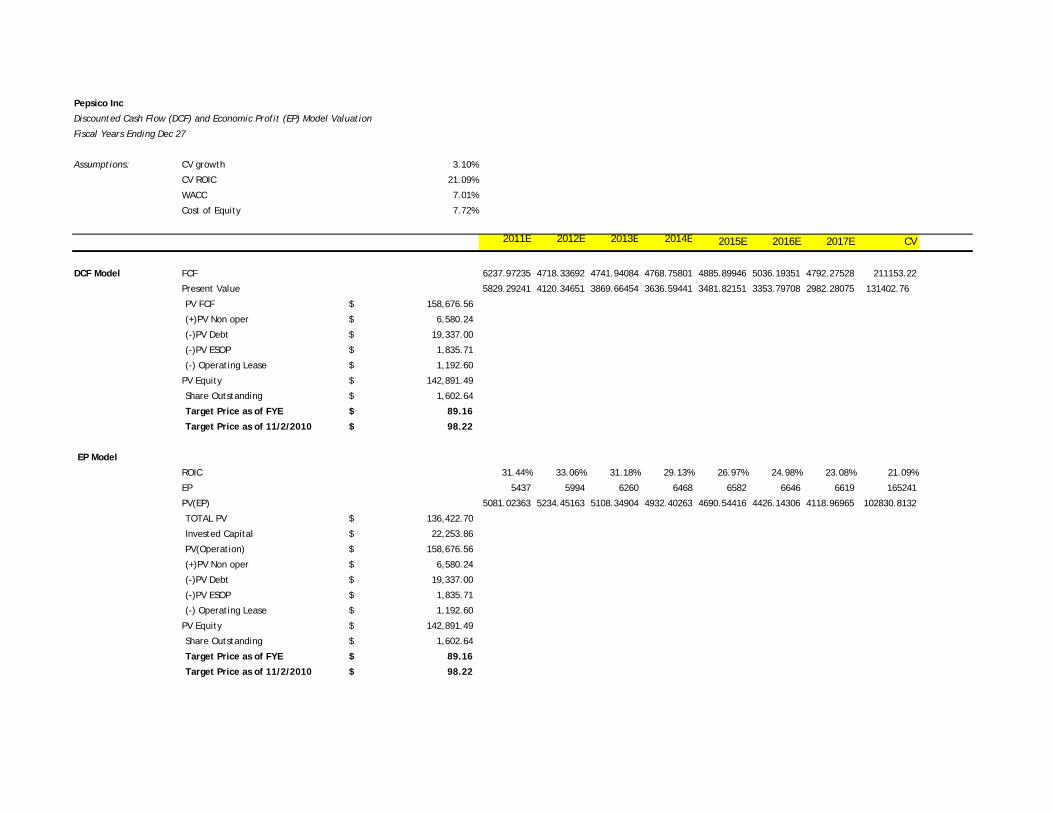
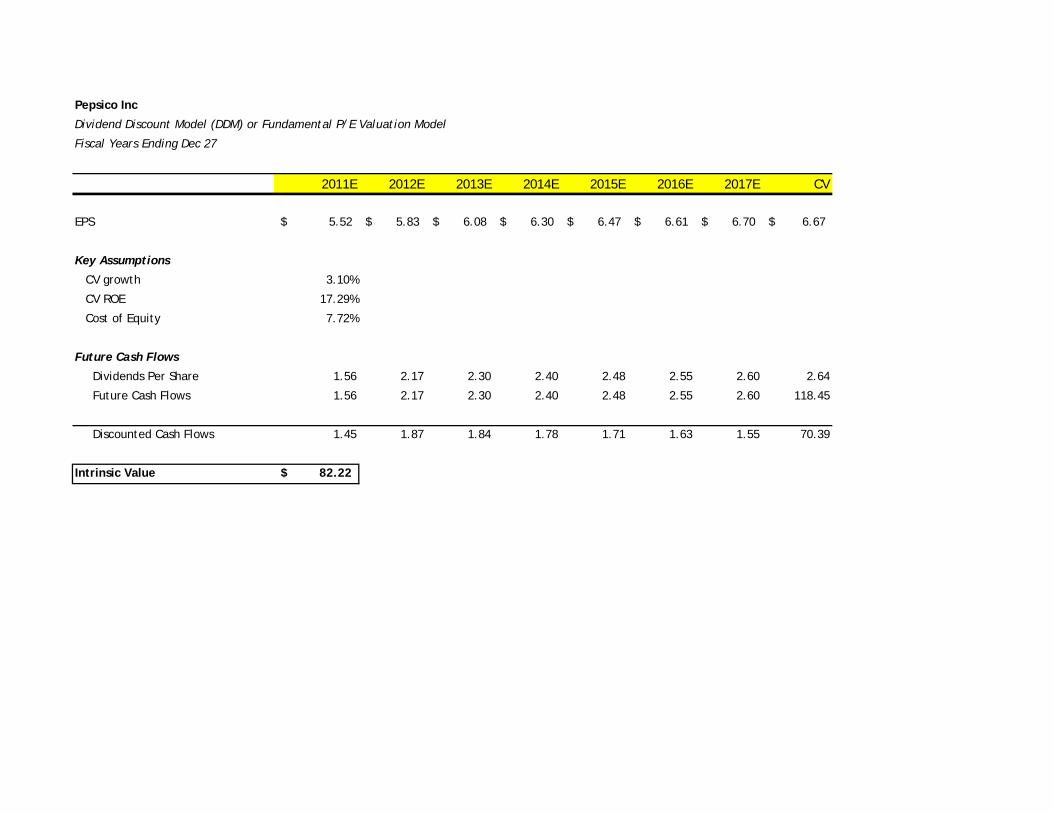
Overview The Discounted Cash Flow (DCF) model and the Economic Profit (EP) model resulted in a price of $94.00. The Relative P/E analysis resulted in a valuation of $81.91 The Dividend Discount Model resulted in a price of $79.83. The current trading price is $67.11 indicating our models see high growth for PepsiCo and a good investment opportunity.
Revenue Decomposition We forecasted 2011 revenue using revenues from past data and revenue percentages derived from each of PepsiCo’s divisions. By totaling the revenue from each division we forecasted top line revenue to increase 7.5% and 8% in 2011 and 2012, respectively. We forecasted sales revenue to gradually decrease and converge to the level of expected GDP growth of 2.5%. We increased the emerging markets ending growth rate to reflect the anticipated increasing sales and heavy investment by PEP.
Operating Margin We see a slight decrease in the operating margin in 2011 due to rising commodity prices. Because we anticipate inflation rising and covering some of the costs, we don’t believe PepsiCo can pass along costs to the customer without disruption. A 2% rise in the next 6 years will cover the anticipated rising prices of commodities.
Capital Expenditure We anticipate PepsiCo to fund major research and development projects in the future. It’s stance on healthier foods makes for costly projects in areas like sugar and sodium replacements. We anticipate the company to purchase food manufacturers and distributors in emerging markets like Russia and China.
DCF and EP Valuation The Discounted Cash Flow and Economic Profit model valued PEP at $94.00.The current trading price is $67.11. The target price is going at 40% premium. To secure a target price, we discounted the future cash flows from each year ending with 2017 when we assume steady growth. We made assumptions and calculated key drivers to estimate the Weighted
Valuation Analysis
Investment Thesis
7
Average Cost of Capital. Costs of equity and debt were calculated along with the weights of each to perform the correct analysis to get a target price.
We chose a continuing value growth of 2.97% in accordance with long term GDP growth. 21.09% was our calculated ROIC. Our projected numbers for the previous 6 years were higher but because of our assumption of steady state growth, the ROIC will fall to a level found reasonable.
Weighted Average Cost of Capital We estimate PepsiCo’s weighted average cost of capital at 7.07%. In order to calculate the WACC we had to assume properties of the cost equity and debt. For the cost of equity we applied the Capital Asset Pricing Model (CAPM). We started by capturing the risk premium rate at 5.5%. This can be assumed as the return of investing in a well-diversified, broad range of securities. In order for the model to work we chose a risk free rate of 4.49%, the current return on the 30-yr U.S. Treasury Bond. The T-bond is a safe bet for a risk free return because it’s backed by the U.S. government. We collected an average beta from 10 years of data on a yearly basis to get .6. The beta shows the relationship of risk to the overall market. Using the Capital Asset Pricing Model we determined the cost of equity to be 7.79%. We also calculated the weight of equity at 80.60% of PEP’s capital structure.
In order to calculate the cost of debt we used the current yield of PepsiCo’s 30-Year non-callable bond which was 5.5%. The weight of debt was calculated at 80.60%to be used in the after tax calculation with the cost of debt in the WACC formula. We assumed a 26 % tax rate because of the enormous overseas market PepsiCo sells to. The tax rates are lower overseas and PEP doesn’t have to repatriate all earnings. PepsiCo’s preferred stock and lease obligations are insignificant and are therefore dismissed in calculating the WACC. We calculated the Weighted Average Cost of Capital at 7.07% after tax. This was calculated using after tax cost of debt, cost of equity and weights of each according to the capital structure.
Relative P/E We performed a Relative P/E Ratio analysis to understand other firms similar in industry, size and beta. The six companies chosen for comparison are Coca Cola (KO), Dr. Pepper Snapple (DPS), Kraft (KFT), General Mills (GIS), Kellog, Co (K), and
Campbell Soup (CPB). The average price to earnings ratio in 2001 for the six companies was 14.8 and PEP was at 11.9. The average PEG ratio for 2011was 1.9 while PEP was at 2.4. There were some major differences in the average estimation of 5 year growth. The 5 year average for all 6 other companies was 8.46% while we kept a 5% 5 year estimation growth. This causes the price indicator to be lower than the DCF and EP target price.
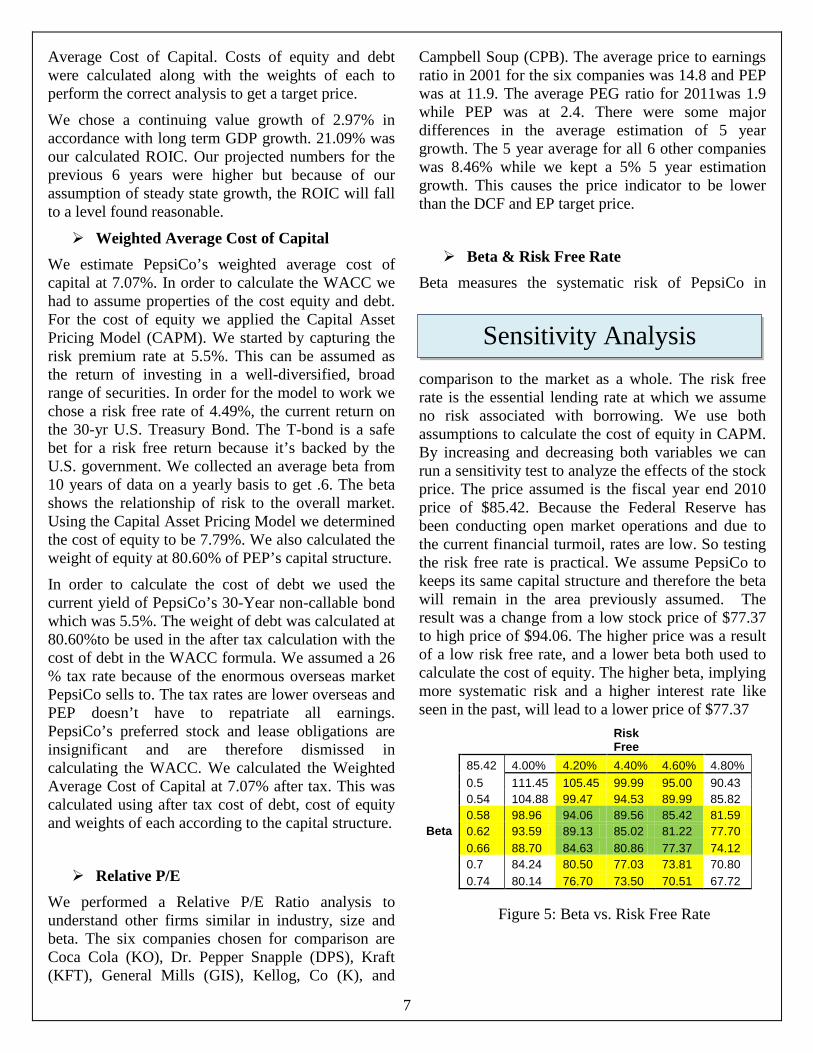
Beta & Risk Free Rate Beta measures the systematic risk of PepsiCo in
comparison to the market as a whole. The risk free rate is the essential lending rate at which we assume no risk associated with borrowing. We use both assumptions to calculate the cost of equity in CAPM. By increasing and decreasing both variables we can run a sensitivity test to analyze the effects of the stock price. The price assumed is the fiscal year end 2010 price of $85.42. Because the Federal Reserve has been conducting open market operations and due to the current financial turmoil, rates are low. So testing the risk free rate is practical. We assume PepsiCo to keeps its same capital structure and therefore the beta will remain in the area previously assumed. The result was a change from a low stock price of $77.37 to high price of $94.06. The higher price was a result of a low risk free rate, and a lower beta both used to calculate the cost of equity. The higher beta, implying more systematic risk and a higher interest rate like seen in the past, will lead to a lower price of $77.37
Risk Free
85.42 4.00% 4.20% 4.40% 4.60% 4.80%
0.5 111.45 105.45 99.99 95.00 90.43
0.54 104.88 99.47 94.53 89.99 85.82
0.58 98.96 94.06 89.56 85.42 81.59
Beta 0.62 93.59 89.13 85.02 81.22 77.70
0.66 88.70 84.63 80.86 77.37 74.12
0.7 84.24 80.50 77.03 73.81 70.80
0.74 80.14 76.70 73.50 70.51 67.72
Sensitivity Analysis
Figure 5: Beta vs. Risk Free Rate
8
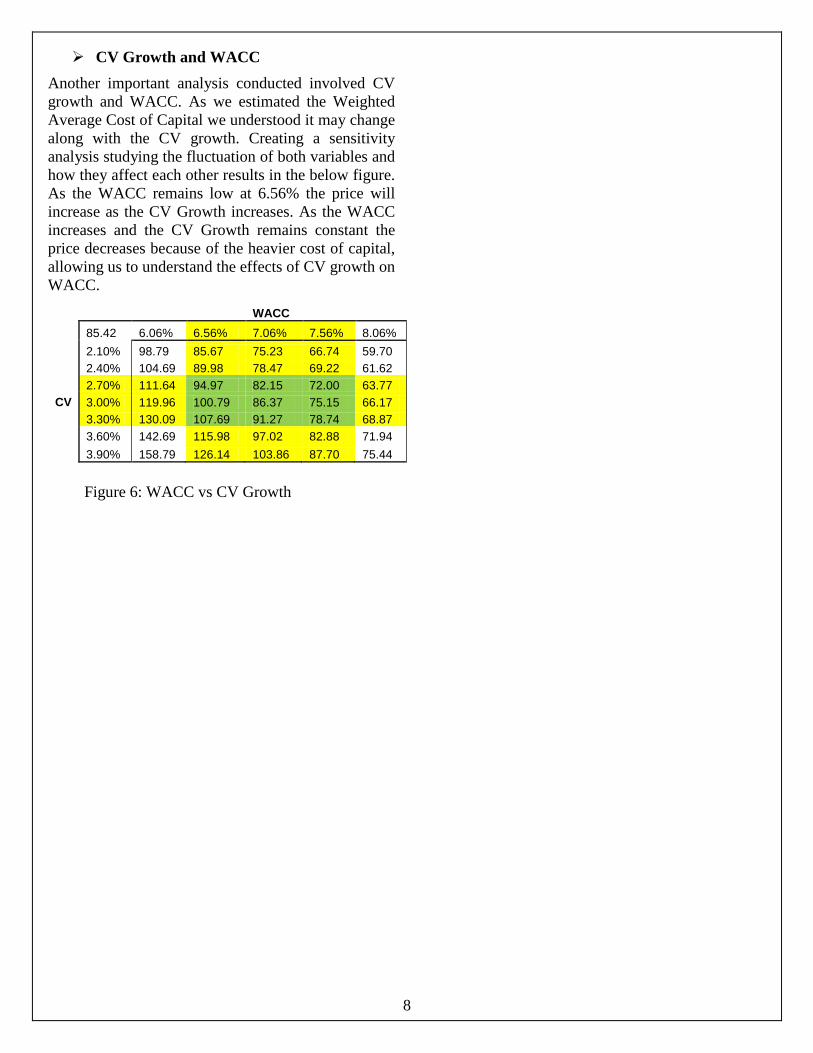
CV Growth and WACC Another important analysis conducted involved CV growth and WACC. As we estimated the Weighted Average Cost of Capital we understood it may change along with the CV growth. Creating a sensitivity analysis studying the fluctuation of both variables and how they affect each other results in the below figure. As the WACC remains low at 6.56% the price will increase as the CV Growth increases. As the WACC increases and the CV Growth remains constant the price decreases because of the heavier cost of capital, allowing us to understand the effects of CV growth on WACC.
WACC
85.42 6.06% 6.56% 7.06% 7.56% 8.06%
2.10% 98.79 85.67 75.23 66.74 59.70
2.40% 104.69 89.98 78.47 69.22 61.62
2.70% 111.64 94.97 82.15 72.00 63.77
CV 3.00% 119.96 100.79 86.37 75.15 66.17
3.30% 130.09 107.69 91.27 78.74 68.87
3.60% 142.69 115.98 97.02 82.88 71.94
3.90% 158.79 126.14 103.86 87.70 75.44
Figure 6: WACC vs CV Growth
9
Important Disclaimer This report was created by students enrolled in the Security Analysis (6F:112) class at the University of Iowa. The report was originally created to offer an internal investment recommendation for the University of Iowa Krause Fund and its advisory board. The report also provides potential employers and other interested parties an example of the students’ skills, knowledge and abilities. Members of the Krause Fund are not registered investment advisors, brokers or officially licensed financial professionals. The investment advice contained in this report does not represent an offer or solicitation to buy or sell any of the securities mentioned. Unless otherwise noted, facts and figures included in this report are from publicly available sources. This report is not a complete compilation of data, and its accuracy is not guaranteed. From time to time, the University of Iowa, its faculty, staff, students, or the Krause Fund may hold a financial interest in the companies mentioned in this report. Sources: i http://www.bls.gov/news.release/ppi.nr0.htm ii http://www.bls.gov/cpi/cpid1012.pdf iii www.Research.stlouis.fed.org ivhttp://www.eia.doe.gov/emeu/steo/pub/contents.html v http://www.conference-board.org/data/consumerconfidence.cfm vihttp://www.industryweek.com/articles/pepsico_b
uys_russian_drink_company_23337.aspx vii “Industry Surveys Food and Nonalcoholic Beverages” Tom Graves, CFA, Packaged Foods Analyst Esther Y. Kwon, CFA, Beverages Analyst. 9 December 2010. NetAdvantage. 7 February 2011.
http://www.netadvantage.standardandpoors.com.proxy.lib.uiowa.edu/NASApp/NetAdvantage/cp/companyIndustrySurvey.do?task=showPDFIndustrySurveyByTicker vii “Pepsi Marketing Report.” Muhammad Unair Sheikh and Nida Azhar. Documents for Small Business and Professionals. 10 February 2011.
http://www.docstoc.com/docs/10545397/Pepsi-Marketing-Report viii “Pepsi Marketing Report.” Muhammad Unair Sheikh and Nida Azhar. Documents for Small Business and Professionals. 10 February 2011. http://www.docstoc.com/docs/10545397/Pepsi-Marketing-Report ix “Pepsi Marketing Report.” Muhammad Unair Sheikh and Nida Azhar. Documents for Small Business and Professionals. 10 February 2011. http://www.docstoc.com/docs/10545397/Pepsi-Marketing-Report xi “Pepsi Marketing Report.” Muhammad Unair Sheikh and Nida Azhar. Documents for Small Business and Professionals. 10 February 2011. http://www.docstoc.com/docs/10545397/Pepsi-Marketing-Report xii “PepsiCo CEO: 'If all consumers exercised...obesity wouldn't exist'.” JP Mangalinda. 27 April 2010. Fortune 500. 7 February 2011.
http://money.cnn.com/2010/04/27/news/companies/indra_nooyi_pepsico.fortune/index.htm xiii “PepsiCo CEO: 'If all consumers exercised...obesity wouldn't exist'.” JP Mangalinda. 27 April 2010. Fortune 500. 7 February 2011.
http://money.cnn.com/2010/04/27/news/companies/indra_nooyi_pepsico.fortune/index.htm
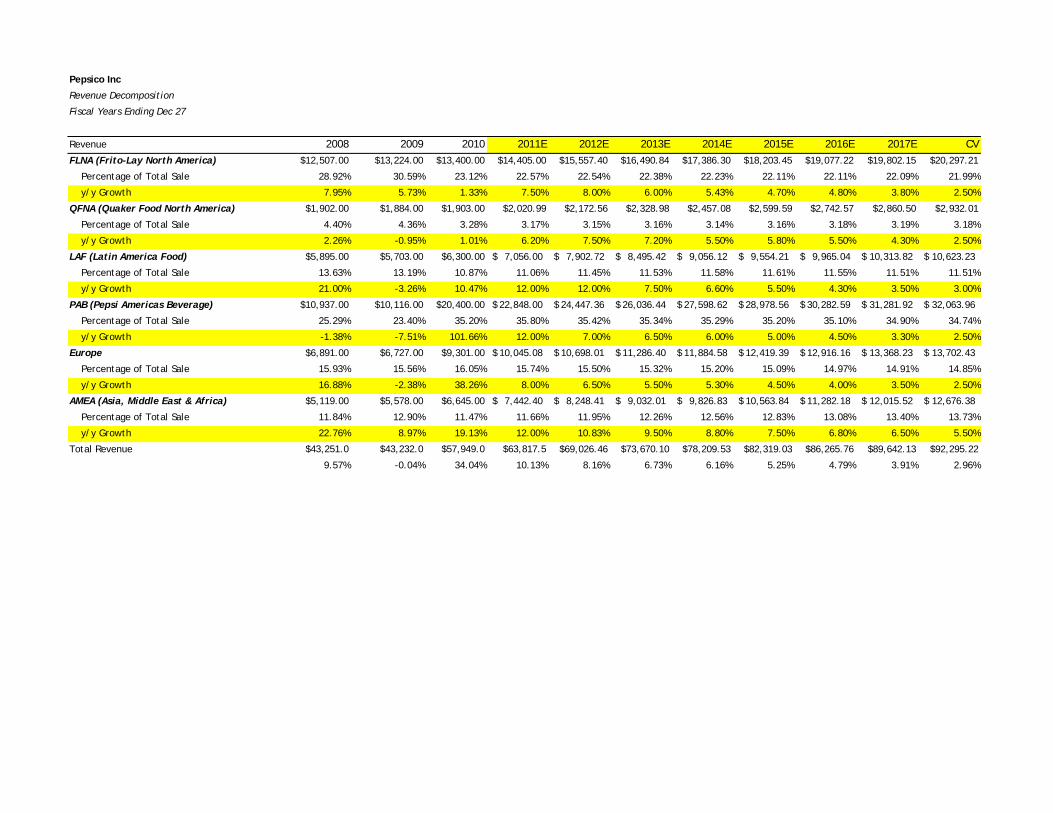
Pepsico Inc
Revenue Decomposition
Fiscal Years Ending Dec 27
Revenue 2008 2009 2010 2011E 2012E 2013E 2014E 2015E 2016E 2017E CVFLNA (Frito-Lay North America) $12,507.00 $13,224.00 $13,400.00 $14,405.00 $15,557.40 $16,490.84 $17,386.30 $18,203.45 $19,077.22 $19,802.15 $20,297.21
Percentage of Total Sale 28.92% 30.59% 23.12% 22.57% 22.54% 22.38% 22.23% 22.11% 22.11% 22.09% 21.99%
y/y Growth 7.95% 5.73% 1.33% 7.50% 8.00% 6.00% 5.43% 4.70% 4.80% 3.80% 2.50%
QFNA (Quaker Food North America) $1,902.00 $1,884.00 $1,903.00 $2,020.99 $2,172.56 $2,328.98 $2,457.08 $2,599.59 $2,742.57 $2,860.50 $2,932.01
Percentage of Total Sale 4.40% 4.36% 3.28% 3.17% 3.15% 3.16% 3.14% 3.16% 3.18% 3.19% 3.18%
y/y Growth 2.26% -0.95% 1.01% 6.20% 7.50% 7.20% 5.50% 5.80% 5.50% 4.30% 2.50%
LAF (Latin America Food) $5,895.00 $5,703.00 $6,300.00 7,056.00$ 7,902.72$ 8,495.42$ 9,056.12$ 9,554.21$ 9,965.04$ 10,313.82$ 10,623.23$
Percentage of Total Sale 13.63% 13.19% 10.87% 11.06% 11.45% 11.53% 11.58% 11.61% 11.55% 11.51% 11.51%
y/y Growth 21.00% -3.26% 10.47% 12.00% 12.00% 7.50% 6.60% 5.50% 4.30% 3.50% 3.00%
PAB (Pepsi Americas Beverage) $10,937.00 $10,116.00 $20,400.00 22,848.00$ 24,447.36$ 26,036.44$ 27,598.62$ 28,978.56$ 30,282.59$ 31,281.92$ 32,063.96$
Percentage of Total Sale 25.29% 23.40% 35.20% 35.80% 35.42% 35.34% 35.29% 35.20% 35.10% 34.90% 34.74%
y/y Growth -1.38% -7.51% 101.66% 12.00% 7.00% 6.50% 6.00% 5.00% 4.50% 3.30% 2.50%
Europe $6,891.00 $6,727.00 $9,301.00 10,045.08$ 10,698.01$ 11,286.40$ 11,884.58$ 12,419.39$ 12,916.16$ 13,368.23$ 13,702.43$
Percentage of Total Sale 15.93% 15.56% 16.05% 15.74% 15.50% 15.32% 15.20% 15.09% 14.97% 14.91% 14.85%
y/y Growth 16.88% -2.38% 38.26% 8.00% 6.50% 5.50% 5.30% 4.50% 4.00% 3.50% 2.50%
AMEA (Asia, Middle East & Africa) $5,119.00 $5,578.00 $6,645.00 7,442.40$ 8,248.41$ 9,032.01$ 9,826.83$ 10,563.84$ 11,282.18$ 12,015.52$ 12,676.38$
Percentage of Total Sale 11.84% 12.90% 11.47% 11.66% 11.95% 12.26% 12.56% 12.83% 13.08% 13.40% 13.73%
y/y Growth 22.76% 8.97% 19.13% 12.00% 10.83% 9.50% 8.80% 7.50% 6.80% 6.50% 5.50%
Total Revenue $43,251.0 $43,232.0 $57,949.0 $63,817.5 $69,026.46 $73,670.10 $78,209.53 $82,319.03 $86,265.76 $89,642.13 $92,295.22
9.57% -0.04% 34.04% 10.13% 8.16% 6.73% 6.16% 5.25% 4.79% 3.91% 2.96%
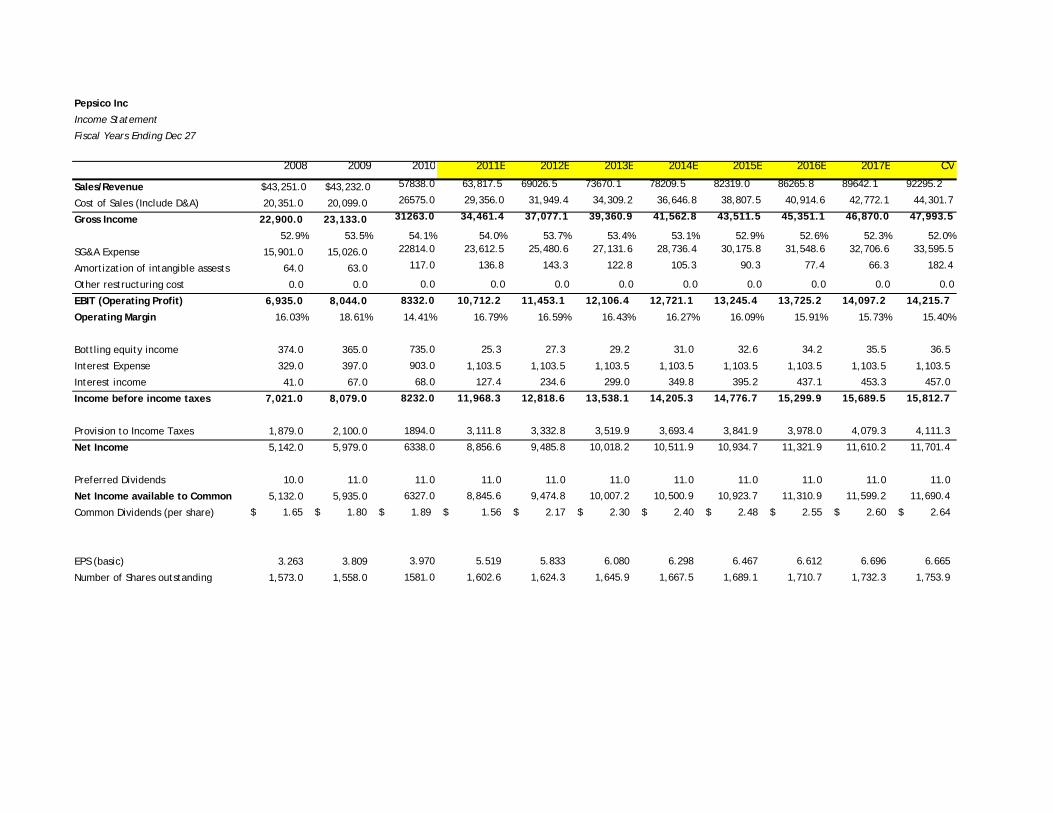
Pepsico Inc
Income Statement
Fiscal Years Ending Dec 27
2008 2009 2010 2011E 2012E 2013E 2014E 2015E 2016E 2017E CV
Sales/Revenue $43,251.0 $43,232.0 57838.0 63,817.5 69026.5 73670.1 78209.5 82319.0 86265.8 89642.1 92295.2
Cost of Sales (Include D&A) 20,351.0 20,099.0 26575.0 29,356.0 31,949.4 34,309.2 36,646.8 38,807.5 40,914.6 42,772.1 44,301.7
Gross Income 22,900.0 23,133.0 31263.0 34,461.4 37,077.1 39,360.9 41,562.8 43,511.5 45,351.1 46,870.0 47,993.5
52.9% 53.5% 54.1% 54.0% 53.7% 53.4% 53.1% 52.9% 52.6% 52.3% 52.0%
SG&A Expense 15,901.0 15,026.0 22814.0 23,612.5 25,480.6 27,131.6 28,736.4 30,175.8 31,548.6 32,706.6 33,595.5
Amortization of intangible assests 64.0 63.0 117.0 136.8 143.3 122.8 105.3 90.3 77.4 66.3 182.4
Other restructuring cost 0.0 0.0 0.0 0.0 0.0 0.0 0.0 0.0 0.0 0.0 0.0
EBIT (Operating Profit) 6,935.0 8,044.0 8332.0 10,712.2 11,453.1 12,106.4 12,721.1 13,245.4 13,725.2 14,097.2 14,215.7
Operating Margin 16.03% 18.61% 14.41% 16.79% 16.59% 16.43% 16.27% 16.09% 15.91% 15.73% 15.40%
Bottling equity income 374.0 365.0 735.0 25.3 27.3 29.2 31.0 32.6 34.2 35.5 36.5
Interest Expense 329.0 397.0 903.0 1,103.5 1,103.5 1,103.5 1,103.5 1,103.5 1,103.5 1,103.5 1,103.5
Interest income 41.0 67.0 68.0 127.4 234.6 299.0 349.8 395.2 437.1 453.3 457.0
Income before income taxes 7,021.0 8,079.0 8232.0 11,968.3 12,818.6 13,538.1 14,205.3 14,776.7 15,299.9 15,689.5 15,812.7
Provision to Income Taxes 1,879.0 2,100.0 1894.0 3,111.8 3,332.8 3,519.9 3,693.4 3,841.9 3,978.0 4,079.3 4,111.3
Net Income 5,142.0 5,979.0 6338.0 8,856.6 9,485.8 10,018.2 10,511.9 10,934.7 11,321.9 11,610.2 11,701.4
Preferred Dividends 10.0 11.0 11.0 11.0 11.0 11.0 11.0 11.0 11.0 11.0 11.0
Net Income available to Common 5,132.0 5,935.0 6327.0 8,845.6 9,474.8 10,007.2 10,500.9 10,923.7 11,310.9 11,599.2 11,690.4
Common Dividends (per share) 1.65$ 1.80$ 1.89$ 1.56$ 2.17$ 2.30$ 2.40$ 2.48$ 2.55$ 2.60$ 2.64$
EPS (basic) 3.263 3.809 3.970 5.519 5.833 6.080 6.298 6.467 6.612 6.696 6.665
Number of Shares outstanding 1,573.0 1,558.0 1581.0 1,602.6 1,624.3 1,645.9 1,667.5 1,689.1 1,710.7 1,732.3 1,753.9
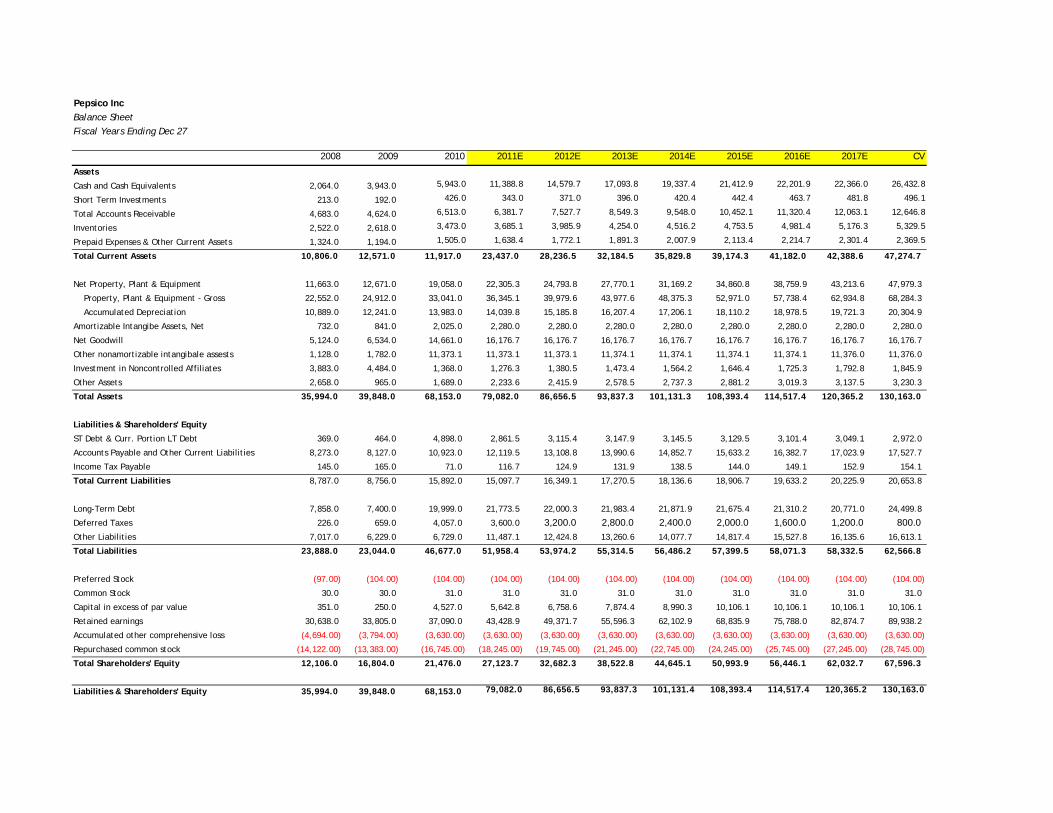
Pepsico Inc Balance SheetFiscal Years Ending Dec 27
2008 2009 2010 2011E 2012E 2013E 2014E 2015E 2016E 2017E CV
Assets
Cash and Cash Equivalents 2,064.0 3,943.0 5,943.0 11,388.8 14,579.7 17,093.8 19,337.4 21,412.9 22,201.9 22,366.0 26,432.8
Short Term Investments 213.0 192.0 426.0 343.0 371.0 396.0 420.4 442.4 463.7 481.8 496.1
Total Accounts Receivable 4,683.0 4,624.0 6,513.0 6,381.7 7,527.7 8,549.3 9,548.0 10,452.1 11,320.4 12,063.1 12,646.8
Inventories 2,522.0 2,618.0 3,473.0 3,685.1 3,985.9 4,254.0 4,516.2 4,753.5 4,981.4 5,176.3 5,329.5
Prepaid Expenses & Other Current Assets 1,324.0 1,194.0 1,505.0 1,638.4 1,772.1 1,891.3 2,007.9 2,113.4 2,214.7 2,301.4 2,369.5
Total Current Assets 10,806.0 12,571.0 11,917.0 23,437.0 28,236.5 32,184.5 35,829.8 39,174.3 41,182.0 42,388.6 47,274.7
Net Property, Plant & Equipment 11,663.0 12,671.0 19,058.0 22,305.3 24,793.8 27,770.1 31,169.2 34,860.8 38,759.9 43,213.6 47,979.3
Property, Plant & Equipment - Gross 22,552.0 24,912.0 33,041.0 36,345.1 39,979.6 43,977.6 48,375.3 52,971.0 57,738.4 62,934.8 68,284.3
Accumulated Depreciation 10,889.0 12,241.0 13,983.0 14,039.8 15,185.8 16,207.4 17,206.1 18,110.2 18,978.5 19,721.3 20,304.9
Amortizable Intangibe Assets, Net 732.0 841.0 2,025.0 2,280.0 2,280.0 2,280.0 2,280.0 2,280.0 2,280.0 2,280.0 2,280.0
Net Goodwill 5,124.0 6,534.0 14,661.0 16,176.7 16,176.7 16,176.7 16,176.7 16,176.7 16,176.7 16,176.7 16,176.7
Other nonamortizable intangibale assests 1,128.0 1,782.0 11,373.1 11,373.1 11,373.1 11,374.1 11,374.1 11,374.1 11,374.1 11,376.0 11,376.0
Investment in Noncontrolled Affiliates 3,883.0 4,484.0 1,368.0 1,276.3 1,380.5 1,473.4 1,564.2 1,646.4 1,725.3 1,792.8 1,845.9
Other Assets 2,658.0 965.0 1,689.0 2,233.6 2,415.9 2,578.5 2,737.3 2,881.2 3,019.3 3,137.5 3,230.3
Total Assets 35,994.0 39,848.0 68,153.0 79,082.0 86,656.5 93,837.3 101,131.3 108,393.4 114,517.4 120,365.2 130,163.0
Liabilities & Shareholders' Equity
ST Debt & Curr. Portion LT Debt 369.0 464.0 4,898.0 2,861.5 3,115.4 3,147.9 3,145.5 3,129.5 3,101.4 3,049.1 2,972.0
Accounts Payable and Other Current Liabilities 8,273.0 8,127.0 10,923.0 12,119.5 13,108.8 13,990.6 14,852.7 15,633.2 16,382.7 17,023.9 17,527.7
Income Tax Payable 145.0 165.0 71.0 116.7 124.9 131.9 138.5 144.0 149.1 152.9 154.1
Total Current Liabilities 8,787.0 8,756.0 15,892.0 15,097.7 16,349.1 17,270.5 18,136.6 18,906.7 19,633.2 20,225.9 20,653.8
Long-Term Debt 7,858.0 7,400.0 19,999.0 21,773.5 22,000.3 21,983.4 21,871.9 21,675.4 21,310.2 20,771.0 24,499.8
Deferred Taxes 226.0 659.0 4,057.0 3,600.0 3,200.0 2,800.0 2,400.0 2,000.0 1,600.0 1,200.0 800.0 Other Liabilities 7,017.0 6,229.0 6,729.0 11,487.1 12,424.8 13,260.6 14,077.7 14,817.4 15,527.8 16,135.6 16,613.1
Total Liabilities 23,888.0 23,044.0 46,677.0 51,958.4 53,974.2 55,314.5 56,486.2 57,399.5 58,071.3 58,332.5 62,566.8
Preferred Stock (97.00) (104.00) (104.00) (104.00) (104.00) (104.00) (104.00) (104.00) (104.00) (104.00) (104.00)
Common Stock 30.0 30.0 31.0 31.0 31.0 31.0 31.0 31.0 31.0 31.0 31.0
Capital in excess of par value 351.0 250.0 4,527.0 5,642.8 6,758.6 7,874.4 8,990.3 10,106.1 10,106.1 10,106.1 10,106.1
Retained earnings 30,638.0 33,805.0 37,090.0 43,428.9 49,371.7 55,596.3 62,102.9 68,835.9 75,788.0 82,874.7 89,938.2
Accumulated other comprehensive loss (4,694.00) (3,794.00) (3,630.00) (3,630.00) (3,630.00) (3,630.00) (3,630.00) (3,630.00) (3,630.00) (3,630.00) (3,630.00)
Repurchased common stock (14,122.00) (13,383.00) (16,745.00) (18,245.00) (19,745.00) (21,245.00) (22,745.00) (24,245.00) (25,745.00) (27,245.00) (28,745.00)
Total Shareholders' Equity 12,106.0 16,804.0 21,476.0 27,123.7 32,682.3 38,522.8 44,645.1 50,993.9 56,446.1 62,032.7 67,596.3
Liabilities & Shareholders' Equity 35,994.0 39,848.0 68,153.0 79,082.0 86,656.5 93,837.3 101,131.4 108,393.4 114,517.4 120,365.2 130,163.0
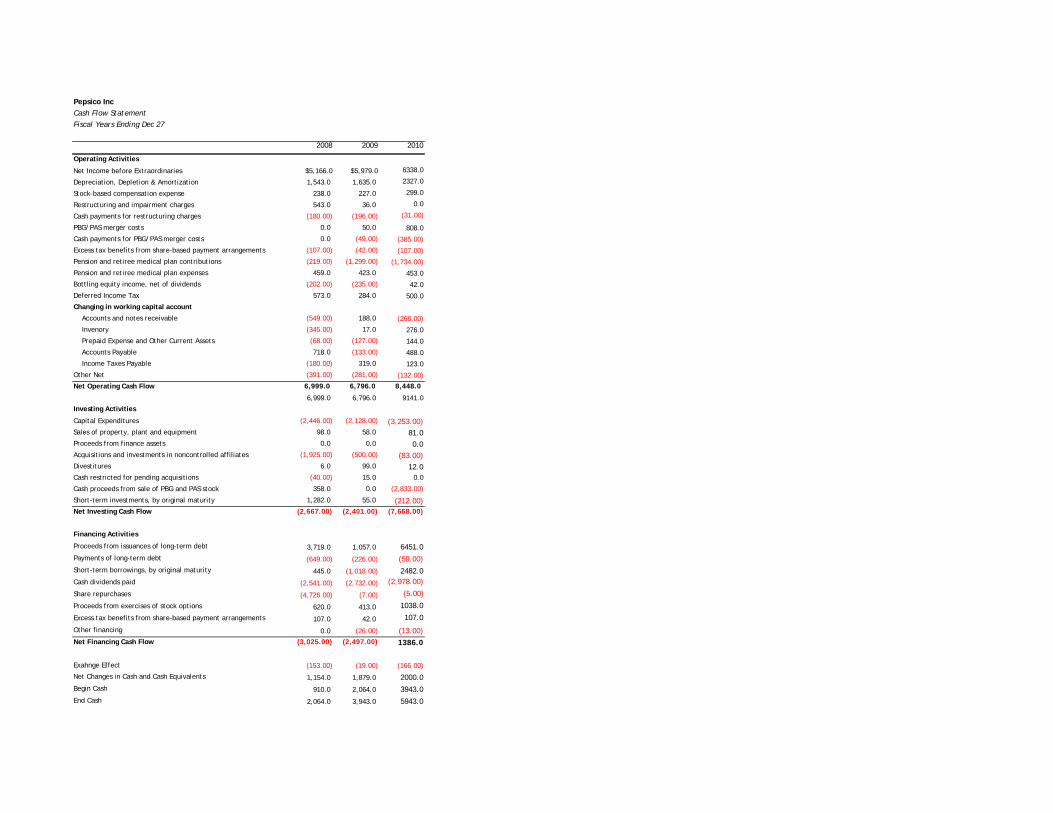
Pepsico Inc Cash Flow StatementFiscal Years Ending Dec 27
2008 2009 2010
Operating Activities
Net Income before Extraordinaries $5,166.0 $5,979.0 6338.0
Depreciation, Depletion & Amortization 1,543.0 1,635.0 2327.0
Stock-based compensation expense 238.0 227.0 299.0
Restructuring and impairment charges 543.0 36.0 0.0
Cash payments for restructuring charges (180.00) (196.00) (31.00)
PBG/PAS merger costs 0.0 50.0 808.0
Cash payments for PBG/PAS merger costs 0.0 (49.00) (385.00)
Excess tax benefits from share-based payment arrangements (107.00) (42.00) (107.00)
Pension and retiree medical plan contributions (219.00) (1,299.00) (1,734.00)
Pension and retiree medical plan expenses 459.0 423.0 453.0
Bottling equity income, net of dividends (202.00) (235.00) 42.0
Deferred Income Tax 573.0 284.0 500.0
Changing in working capital account
Accounts and notes receivable (549.00) 188.0 (268.00)
Invenory (345.00) 17.0 276.0
Prepaid Expense and Other Current Assets (68.00) (127.00) 144.0
Accounts Payable 718.0 (133.00) 488.0
Income Taxes Payable (180.00) 319.0 123.0
Other Net (391.00) (281.00) (132.00)
Net Operating Cash Flow 6,999.0 6,796.0 8,448.0
6,999.0 6,796.0 9141.0
Investing Activities
Capital Expenditures (2,446.00) (2,128.00) (3,253.00) Sales of property, plant and equipment 98.0 58.0 81.0Proceeds from finance assets 0.0 0.0 0.0Acquisitions and investments in noncontrolled affiliates (1,925.00) (500.00) (83.00) Divestitures 6.0 99.0 12.0Cash restricted for pending acquisitions (40.00) 15.0 0.0
Cash proceeds from sale of PBG and PAS stock 358.0 0.0 (2,833.00)
Short-term investments, by original maturity 1,282.0 55.0 (212.00) Net Investing Cash Flow (2,667.00) (2,401.00) (7,668.00)
Financing Activities
Proceeds from issuances of long-term debt 3,719.0 1,057.0 6451.0Payments of long-term debt (649.00) (226.00) (59.00) Short-term borrowings, by original maturity 445.0 (1,018.00) 2482.0Cash dividends paid (2,541.00) (2,732.00) (2,978.00)
Share repurchases (4,726.00) (7.00) (5.00)
Proceeds from exercises of stock options 620.0 413.0 1038.0
Excess tax benefits from share-based payment arrangements 107.0 42.0 107.0
Other financing 0.0 (26.00) (13.00) Net Financing Cash Flow (3,025.00) (2,497.00) 1386.0
Exahnge Effect (153.00) (19.00) (166.00)
Net Changes in Cash and Cash Equivalents 1,154.0 1,879.0 2000.0Begin Cash 910.0 2,064.0 3943.0End Cash 2,064.0 3,943.0 5943.0
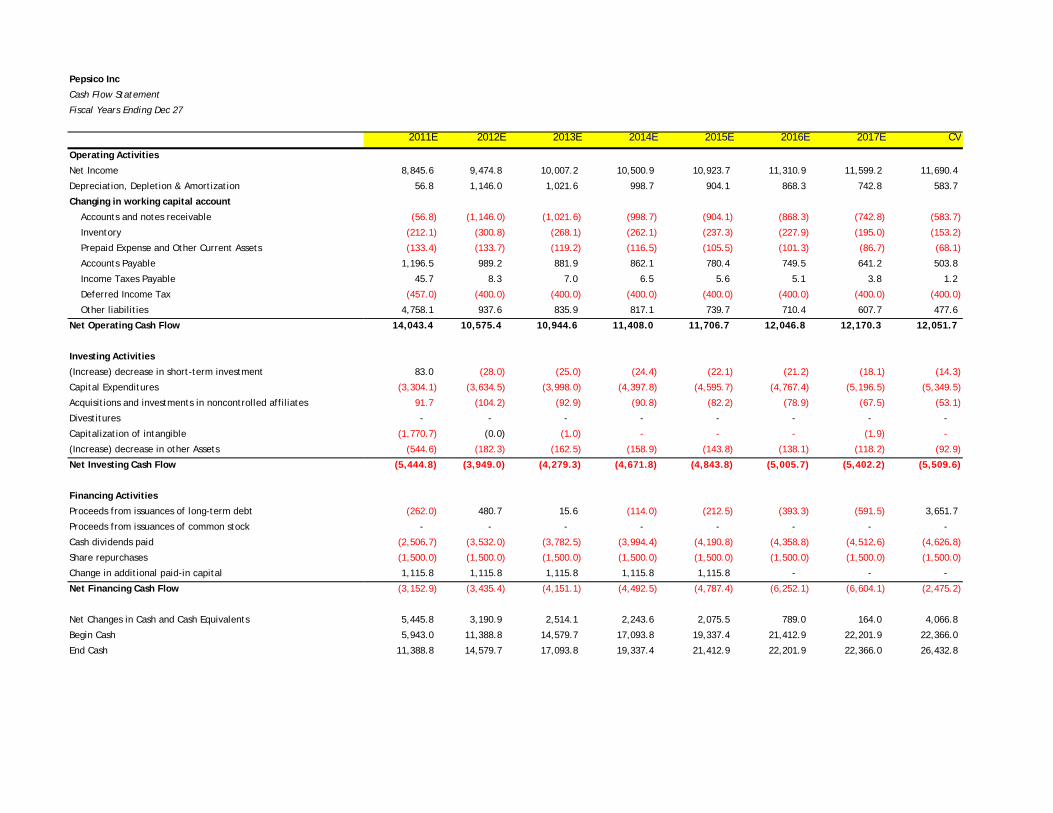
Pepsico Inc
Cash Flow Statement
Fiscal Years Ending Dec 27
2011E 2012E 2013E 2014E 2015E 2016E 2017E CV
Operating Activities
Net Income 8,845.6 9,474.8 10,007.2 10,500.9 10,923.7 11,310.9 11,599.2 11,690.4
Depreciation, Depletion & Amortization 56.8 1,146.0 1,021.6 998.7 904.1 868.3 742.8 583.7
Changing in working capital account
Accounts and notes receivable (56.8) (1,146.0) (1,021.6) (998.7) (904.1) (868.3) (742.8) (583.7)
Inventory (212.1) (300.8) (268.1) (262.1) (237.3) (227.9) (195.0) (153.2)
Prepaid Expense and Other Current Assets (133.4) (133.7) (119.2) (116.5) (105.5) (101.3) (86.7) (68.1)
Accounts Payable 1,196.5 989.2 881.9 862.1 780.4 749.5 641.2 503.8
Income Taxes Payable 45.7 8.3 7.0 6.5 5.6 5.1 3.8 1.2
Deferred Income Tax (457.0) (400.0) (400.0) (400.0) (400.0) (400.0) (400.0) (400.0)
Other liabilities 4,758.1 937.6 835.9 817.1 739.7 710.4 607.7 477.6
Net Operating Cash Flow 14,043.4 10,575.4 10,944.6 11,408.0 11,706.7 12,046.8 12,170.3 12,051.7
Investing Activities
(Increase) decrease in short-term investment 83.0 (28.0) (25.0) (24.4) (22.1) (21.2) (18.1) (14.3)
Capital Expenditures (3,304.1) (3,634.5) (3,998.0) (4,397.8) (4,595.7) (4,767.4) (5,196.5) (5,349.5)
Acquisitions and investments in noncontrolled affiliates 91.7 (104.2) (92.9) (90.8) (82.2) (78.9) (67.5) (53.1)
Divestitures - - - - - - - -
Capitalization of intangible (1,770.7) (0.0) (1.0) - - - (1.9) -
(Increase) decrease in other Assets (544.6) (182.3) (162.5) (158.9) (143.8) (138.1) (118.2) (92.9)
Net Investing Cash Flow (5,444.8) (3,949.0) (4,279.3) (4,671.8) (4,843.8) (5,005.7) (5,402.2) (5,509.6)
Financing Activities
Proceeds from issuances of long-term debt (262.0) 480.7 15.6 (114.0) (212.5) (393.3) (591.5) 3,651.7
Proceeds from issuances of common stock - - - - - - - -
Cash dividends paid (2,506.7) (3,532.0) (3,782.5) (3,994.4) (4,190.8) (4,358.8) (4,512.6) (4,626.8)
Share repurchases (1,500.0) (1,500.0) (1,500.0) (1,500.0) (1,500.0) (1,500.0) (1,500.0) (1,500.0)
Change in additional paid-in capital 1,115.8 1,115.8 1,115.8 1,115.8 1,115.8 - - -
Net Financing Cash Flow (3,152.9) (3,435.4) (4,151.1) (4,492.5) (4,787.4) (6,252.1) (6,604.1) (2,475.2)
Net Changes in Cash and Cash Equivalents 5,445.8 3,190.9 2,514.1 2,243.6 2,075.5 789.0 164.0 4,066.8
Begin Cash 5,943.0 11,388.8 14,579.7 17,093.8 19,337.4 21,412.9 22,201.9 22,366.0
End Cash 11,388.8 14,579.7 17,093.8 19,337.4 21,412.9 22,201.9 22,366.0 26,432.8
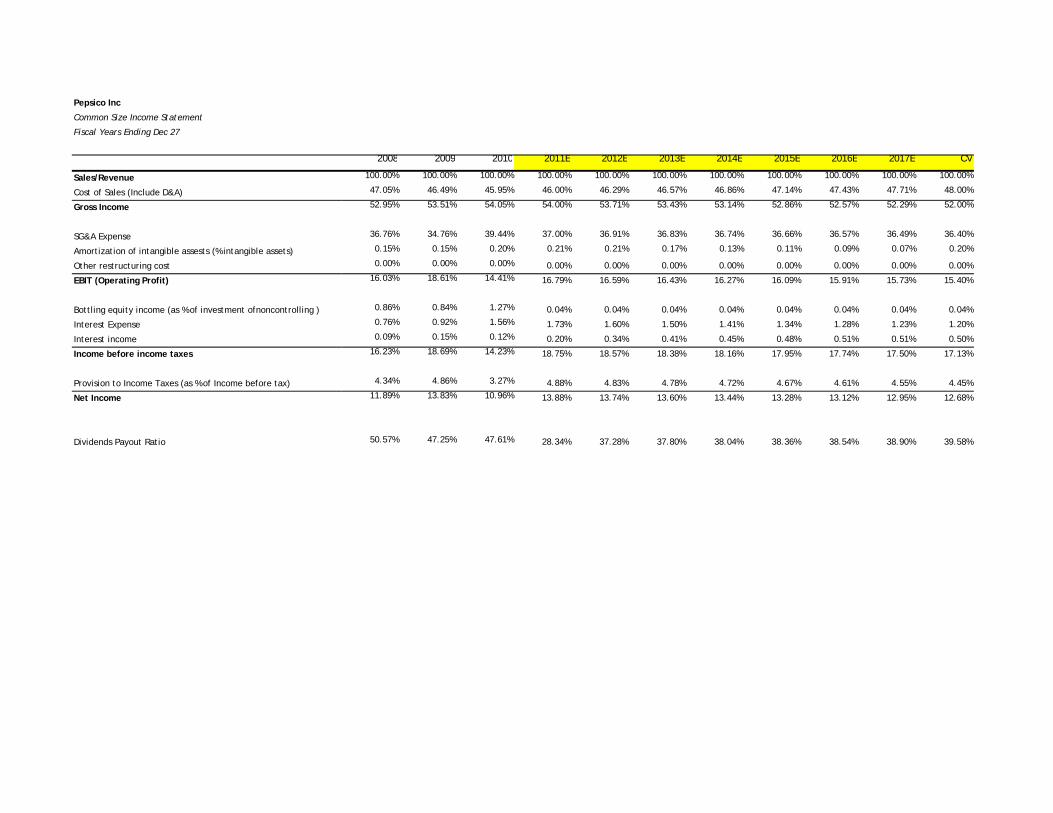
Pepsico Inc
Common Size Income Statement
Fiscal Years Ending Dec 27
2008 2009 2010 2011E 2012E 2013E 2014E 2015E 2016E 2017E CV
Sales/Revenue 100.00% 100.00% 100.00% 100.00% 100.00% 100.00% 100.00% 100.00% 100.00% 100.00% 100.00%
Cost of Sales (Include D&A) 47.05% 46.49% 45.95% 46.00% 46.29% 46.57% 46.86% 47.14% 47.43% 47.71% 48.00%
Gross Income 52.95% 53.51% 54.05% 54.00% 53.71% 53.43% 53.14% 52.86% 52.57% 52.29% 52.00%
SG&A Expense 36.76% 34.76% 39.44% 37.00% 36.91% 36.83% 36.74% 36.66% 36.57% 36.49% 36.40%
Amortization of intangible assests (% intangible assets) 0.15% 0.15% 0.20% 0.21% 0.21% 0.17% 0.13% 0.11% 0.09% 0.07% 0.20%
Other restructuring cost 0.00% 0.00% 0.00% 0.00% 0.00% 0.00% 0.00% 0.00% 0.00% 0.00% 0.00%
EBIT (Operating Profit) 16.03% 18.61% 14.41% 16.79% 16.59% 16.43% 16.27% 16.09% 15.91% 15.73% 15.40%
Bottling equity income (as % of investment ofnoncontrolling ) 0.86% 0.84% 1.27% 0.04% 0.04% 0.04% 0.04% 0.04% 0.04% 0.04% 0.04%
Interest Expense 0.76% 0.92% 1.56% 1.73% 1.60% 1.50% 1.41% 1.34% 1.28% 1.23% 1.20%
Interest income 0.09% 0.15% 0.12% 0.20% 0.34% 0.41% 0.45% 0.48% 0.51% 0.51% 0.50%
Income before income taxes 16.23% 18.69% 14.23% 18.75% 18.57% 18.38% 18.16% 17.95% 17.74% 17.50% 17.13%
Provision to Income Taxes (as % of Income before tax) 4.34% 4.86% 3.27% 4.88% 4.83% 4.78% 4.72% 4.67% 4.61% 4.55% 4.45%
Net Income 11.89% 13.83% 10.96% 13.88% 13.74% 13.60% 13.44% 13.28% 13.12% 12.95% 12.68%
Dividends Payout Ratio 50.57% 47.25% 47.61% 28.34% 37.28% 37.80% 38.04% 38.36% 38.54% 38.90% 39.58%
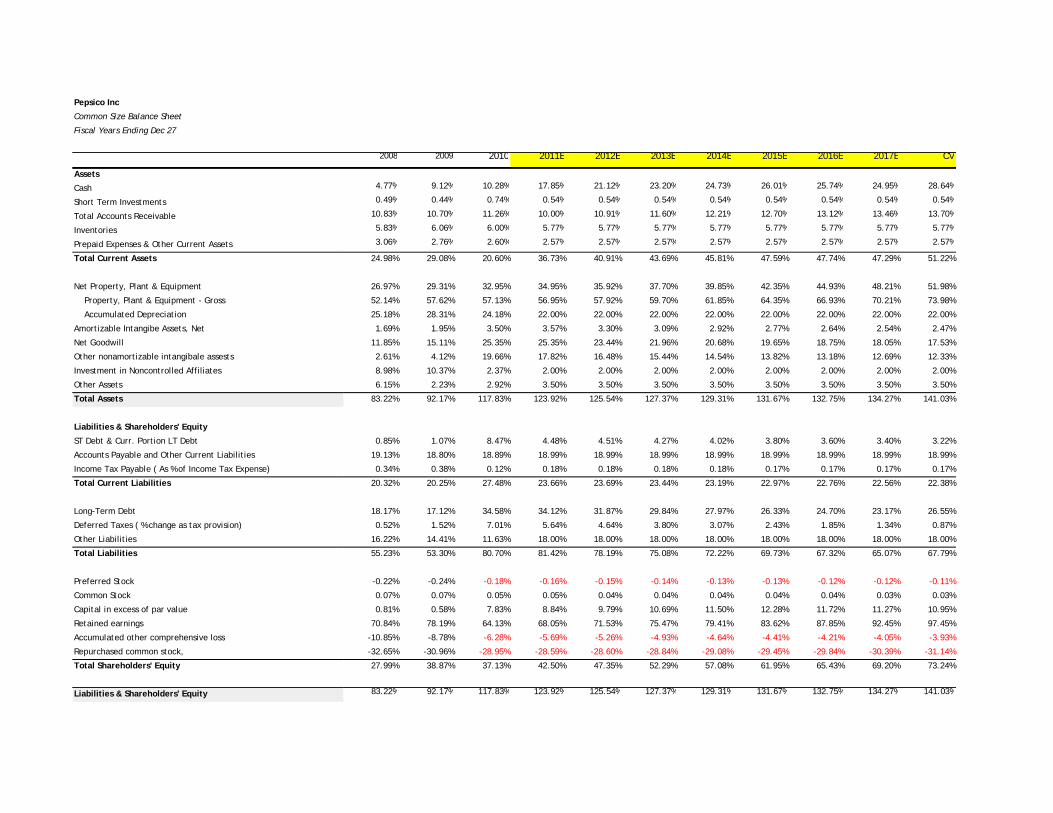
Pepsico Inc
Common Size Balance Sheet
Fiscal Years Ending Dec 27
2008 2009 2010 2011E 2012E 2013E 2014E 2015E 2016E 2017E CV
Assets
Cash 4.77% 9.12% 10.28% 17.85% 21.12% 23.20% 24.73% 26.01% 25.74% 24.95% 28.64%
Short Term Investments 0.49% 0.44% 0.74% 0.54% 0.54% 0.54% 0.54% 0.54% 0.54% 0.54% 0.54%
Total Accounts Receivable 10.83% 10.70% 11.26% 10.00% 10.91% 11.60% 12.21% 12.70% 13.12% 13.46% 13.70%
Inventories 5.83% 6.06% 6.00% 5.77% 5.77% 5.77% 5.77% 5.77% 5.77% 5.77% 5.77%
Prepaid Expenses & Other Current Assets 3.06% 2.76% 2.60% 2.57% 2.57% 2.57% 2.57% 2.57% 2.57% 2.57% 2.57%
Total Current Assets 24.98% 29.08% 20.60% 36.73% 40.91% 43.69% 45.81% 47.59% 47.74% 47.29% 51.22%
Net Property, Plant & Equipment 26.97% 29.31% 32.95% 34.95% 35.92% 37.70% 39.85% 42.35% 44.93% 48.21% 51.98%
Property, Plant & Equipment - Gross 52.14% 57.62% 57.13% 56.95% 57.92% 59.70% 61.85% 64.35% 66.93% 70.21% 73.98%
Accumulated Depreciation 25.18% 28.31% 24.18% 22.00% 22.00% 22.00% 22.00% 22.00% 22.00% 22.00% 22.00%
Amortizable Intangibe Assets, Net 1.69% 1.95% 3.50% 3.57% 3.30% 3.09% 2.92% 2.77% 2.64% 2.54% 2.47%
Net Goodwill 11.85% 15.11% 25.35% 25.35% 23.44% 21.96% 20.68% 19.65% 18.75% 18.05% 17.53%
Other nonamortizable intangibale assests 2.61% 4.12% 19.66% 17.82% 16.48% 15.44% 14.54% 13.82% 13.18% 12.69% 12.33%
Investment in Noncontrolled Affiliates 8.98% 10.37% 2.37% 2.00% 2.00% 2.00% 2.00% 2.00% 2.00% 2.00% 2.00%
Other Assets 6.15% 2.23% 2.92% 3.50% 3.50% 3.50% 3.50% 3.50% 3.50% 3.50% 3.50%
Total Assets 83.22% 92.17% 117.83% 123.92% 125.54% 127.37% 129.31% 131.67% 132.75% 134.27% 141.03%
Liabilities & Shareholders' Equity
ST Debt & Curr. Portion LT Debt 0.85% 1.07% 8.47% 4.48% 4.51% 4.27% 4.02% 3.80% 3.60% 3.40% 3.22%
Accounts Payable and Other Current Liabilities 19.13% 18.80% 18.89% 18.99% 18.99% 18.99% 18.99% 18.99% 18.99% 18.99% 18.99%
Income Tax Payable ( As % of Income Tax Expense) 0.34% 0.38% 0.12% 0.18% 0.18% 0.18% 0.18% 0.17% 0.17% 0.17% 0.17%
Total Current Liabilities 20.32% 20.25% 27.48% 23.66% 23.69% 23.44% 23.19% 22.97% 22.76% 22.56% 22.38%
Long-Term Debt 18.17% 17.12% 34.58% 34.12% 31.87% 29.84% 27.97% 26.33% 24.70% 23.17% 26.55%
Deferred Taxes ( % change as tax provision) 0.52% 1.52% 7.01% 5.64% 4.64% 3.80% 3.07% 2.43% 1.85% 1.34% 0.87%
Other Liabilities 16.22% 14.41% 11.63% 18.00% 18.00% 18.00% 18.00% 18.00% 18.00% 18.00% 18.00%
Total Liabilities 55.23% 53.30% 80.70% 81.42% 78.19% 75.08% 72.22% 69.73% 67.32% 65.07% 67.79%
Preferred Stock -0.22% -0.24% -0.18% -0.16% -0.15% -0.14% -0.13% -0.13% -0.12% -0.12% -0.11%
Common Stock 0.07% 0.07% 0.05% 0.05% 0.04% 0.04% 0.04% 0.04% 0.04% 0.03% 0.03%
Capital in excess of par value 0.81% 0.58% 7.83% 8.84% 9.79% 10.69% 11.50% 12.28% 11.72% 11.27% 10.95%
Retained earnings 70.84% 78.19% 64.13% 68.05% 71.53% 75.47% 79.41% 83.62% 87.85% 92.45% 97.45%
Accumulated other comprehensive loss -10.85% -8.78% -6.28% -5.69% -5.26% -4.93% -4.64% -4.41% -4.21% -4.05% -3.93%
Repurchased common stock, -32.65% -30.96% -28.95% -28.59% -28.60% -28.84% -29.08% -29.45% -29.84% -30.39% -31.14%
Total Shareholders' Equity 27.99% 38.87% 37.13% 42.50% 47.35% 52.29% 57.08% 61.95% 65.43% 69.20% 73.24%
Liabilities & Shareholders' Equity 83.22% 92.17% 117.83% 123.92% 125.54% 127.37% 129.31% 131.67% 132.75% 134.27% 141.03%
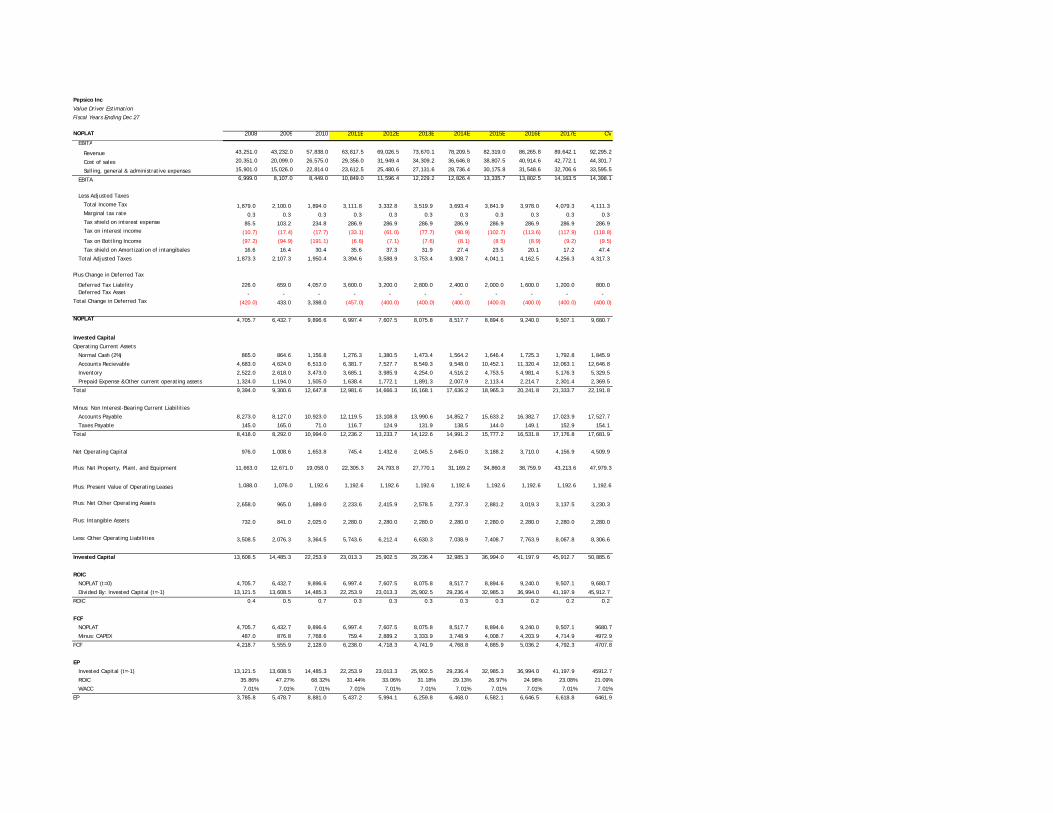
Pepsico Inc
Value Driver Estimation
Fiscal Years Ending Dec 27
NOPLAT 2008 2009 2010 2011E 2012E 2013E 2014E 2015E 2016E 2017E CV
EBITA
Revenue 43,251.0 43,232.0 57,838.0 63,817.5 69,026.5 73,670.1 78,209.5 82,319.0 86,265.8 89,642.1 92,295.2
Cost of sales 20,351.0 20,099.0 26,575.0 29,356.0 31,949.4 34,309.2 36,646.8 38,807.5 40,914.6 42,772.1 44,301.7
Selling, general & administrative expenses 15,901.0 15,026.0 22,814.0 23,612.5 25,480.6 27,131.6 28,736.4 30,175.8 31,548.6 32,706.6 33,595.5
EBITA 6,999.0 8,107.0 8,449.0 10,849.0 11,596.4 12,229.2 12,826.4 13,335.7 13,802.5 14,163.5 14,398.1
Less Adjusted Taxes
Total Income Tax 1,879.0 2,100.0 1,894.0 3,111.8 3,332.8 3,519.9 3,693.4 3,841.9 3,978.0 4,079.3 4,111.3 Marginal tax rate 0.3 0.3 0.3 0.3 0.3 0.3 0.3 0.3 0.3 0.3 0.3 Tax shield on interest expense 85.5 103.2 234.8 286.9 286.9 286.9 286.9 286.9 286.9 286.9 286.9 Tax on interest income (10.7) (17.4) (17.7) (33.1) (61.0) (77.7) (90.9) (102.7) (113.6) (117.9) (118.8)
Tax on Bottling Income (97.2) (94.9) (191.1) (6.6) (7.1) (7.6) (8.1) (8.5) (8.9) (9.2) (9.5)
Tax shield on Amortization of intangibales 16.6 16.4 30.4 35.6 37.3 31.9 27.4 23.5 20.1 17.2 47.4
Total Adjusted Taxes 1,873.3 2,107.3 1,950.4 3,394.6 3,588.9 3,753.4 3,908.7 4,041.1 4,162.5 4,256.3 4,317.3
Plus Change in Deferred Tax
Deferred Tax Liability 226.0 659.0 4,057.0 3,600.0 3,200.0 2,800.0 2,400.0 2,000.0 1,600.0 1,200.0 800.0 Deferred Tax Asset - - - - - - - - - - -
Total Change in Deferred Tax (420.0) 433.0 3,398.0 (457.0) (400.0) (400.0) (400.0) (400.0) (400.0) (400.0) (400.0)
NOPLAT 4,705.7 6,432.7 9,896.6 6,997.4 7,607.5 8,075.8 8,517.7 8,894.6 9,240.0 9,507.1 9,680.7
Invested Capital
Operating Current Assets
Normal Cash (2%) 865.0 864.6 1,156.8 1,276.3 1,380.5 1,473.4 1,564.2 1,646.4 1,725.3 1,792.8 1,845.9
Accounts Recievable 4,683.0 4,624.0 6,513.0 6,381.7 7,527.7 8,549.3 9,548.0 10,452.1 11,320.4 12,063.1 12,646.8
Inventory 2,522.0 2,618.0 3,473.0 3,685.1 3,985.9 4,254.0 4,516.2 4,753.5 4,981.4 5,176.3 5,329.5
Prepaid Expense &Other current operating assets 1,324.0 1,194.0 1,505.0 1,638.4 1,772.1 1,891.3 2,007.9 2,113.4 2,214.7 2,301.4 2,369.5
Total 9,394.0 9,300.6 12,647.8 12,981.6 14,666.3 16,168.1 17,636.2 18,965.3 20,241.8 21,333.7 22,191.8
Minus: Non Interest-Bearing Current Liabilities
Accounts Payable 8,273.0 8,127.0 10,923.0 12,119.5 13,108.8 13,990.6 14,852.7 15,633.2 16,382.7 17,023.9 17,527.7
Taxes Payable 145.0 165.0 71.0 116.7 124.9 131.9 138.5 144.0 149.1 152.9 154.1
Total 8,418.0 8,292.0 10,994.0 12,236.2 13,233.7 14,122.6 14,991.2 15,777.2 16,531.8 17,176.8 17,681.9
Net Operating Capital 976.0 1,008.6 1,653.8 745.4 1,432.6 2,045.5 2,645.0 3,188.2 3,710.0 4,156.9 4,509.9
Plus: Net Property, Plant, and Equipment 11,663.0 12,671.0 19,058.0 22,305.3 24,793.8 27,770.1 31,169.2 34,860.8 38,759.9 43,213.6 47,979.3
Plus: Present Value of Operating Leases 1,088.0 1,076.0 1,192.6 1,192.6 1,192.6 1,192.6 1,192.6 1,192.6 1,192.6 1,192.6 1,192.6
Plus: Net Other Operating Assets 2,658.0 965.0 1,689.0 2,233.6 2,415.9 2,578.5 2,737.3 2,881.2 3,019.3 3,137.5 3,230.3
Plus: Intangible Assets 732.0 841.0 2,025.0 2,280.0 2,280.0 2,280.0 2,280.0 2,280.0 2,280.0 2,280.0 2,280.0
Less: Other Operating Liabilities 3,508.5 2,076.3 3,364.5 5,743.6 6,212.4 6,630.3 7,038.9 7,408.7 7,763.9 8,067.8 8,306.6
Invested Capital 13,608.5 14,485.3 22,253.9 23,013.3 25,902.5 29,236.4 32,985.3 36,994.0 41,197.9 45,912.7 50,885.6
ROIC
NOPLAT (t=0) 4,705.7 6,432.7 9,896.6 6,997.4 7,607.5 8,075.8 8,517.7 8,894.6 9,240.0 9,507.1 9,680.7
Divided By: Invested Capital (t=-1) 13,121.5 13,608.5 14,485.3 22,253.9 23,013.3 25,902.5 29,236.4 32,985.3 36,994.0 41,197.9 45,912.7
ROIC 0.4 0.5 0.7 0.3 0.3 0.3 0.3 0.3 0.2 0.2 0.2
FCF
NOPLAT 4,705.7 6,432.7 9,896.6 6,997.4 7,607.5 8,075.8 8,517.7 8,894.6 9,240.0 9,507.1 9680.7
Minus: CAPEX 487.0 876.8 7,768.6 759.4 2,889.2 3,333.9 3,748.9 4,008.7 4,203.9 4,714.9 4972.9
FCF 4,218.7 5,555.9 2,128.0 6,238.0 4,718.3 4,741.9 4,768.8 4,885.9 5,036.2 4,792.3 4707.8
EP
Invested Capital (t=-1) 13,121.5 13,608.5 14,485.3 22,253.9 23,013.3 25,902.5 29,236.4 32,985.3 36,994.0 41,197.9 45912.7
ROIC 35.86% 47.27% 68.32% 31.44% 33.06% 31.18% 29.13% 26.97% 24.98% 23.08% 21.09%
WACC 7.01% 7.01% 7.01% 7.01% 7.01% 7.01% 7.01% 7.01% 7.01% 7.01% 7.01%
EP 3,785.8 5,478.7 8,881.0 5,437.2 5,994.1 6,259.8 6,468.0 6,582.1 6,646.5 6,618.8 6461.9
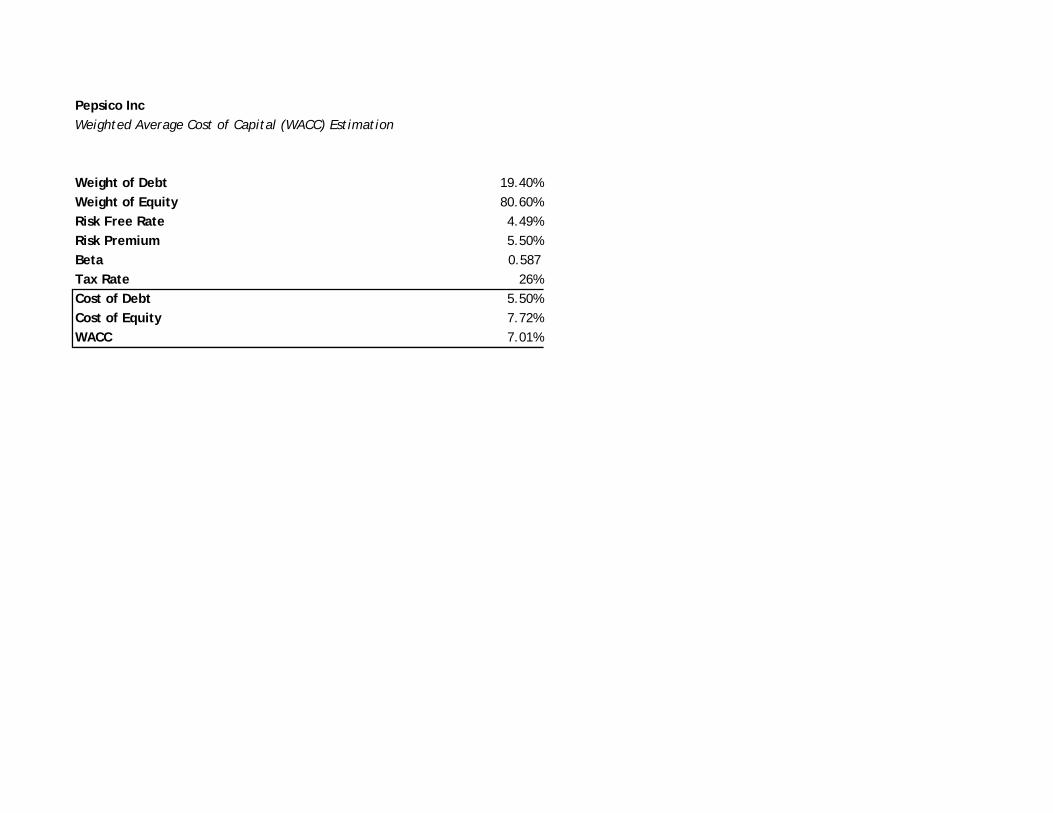
Pepsico Inc Weighted Average Cost of Capital (WACC) Estimation
Weight of Debt 19.40%Weight of Equity 80.60%Risk Free Rate 4.49%Risk Premium 5.50%Beta 0.587Tax Rate 26%Cost of Debt 5.50%Cost of Equity 7.72%WACC 7.01%
Pepsico Inc
Discounted Cash Flow (DCF) and Economic Profit (EP) Model Valuation
Fiscal Years Ending Dec 27
Assumptions: CV growth 3.10%
CV ROIC 21.09%
WACC 7.01%
Cost of Equity 7.72%
2011E 2012E 2013E 2014E 2015E 2016E 2017E CV
DCF Model FCF 6237.97235 4718.33692 4741.94084 4768.75801 4885.89946 5036.19351 4792.27528 211153.22
Present Value 5829.29241 4120.34651 3869.66454 3636.59441 3481.82151 3353.79708 2982.28075 131402.76
PV FCF 158,676.56$
(+)PV Non oper 6,580.24$
(-)PV Debt 19,337.00$
(-)PV ESOP 1,835.71$
(-) Operating Lease 1,192.60$
PV Equity 142,891.49$
Share Outstanding 1,602.64$
Target Price as of FYE 89.16$
Target Price as of 11/2/2010 98.22$
EP Model
ROIC 31.44% 33.06% 31.18% 29.13% 26.97% 24.98% 23.08% 21.09%
EP 5437 5994 6260 6468 6582 6646 6619 165241
PV(EP) 5081.02363 5234.45163 5108.34904 4932.40263 4690.54416 4426.14306 4118.96965 102830.8132
TOTAL PV 136,422.70$
Invested Capital 22,253.86$
PV(Operation) 158,676.56$
(+)PV Non oper 6,580.24$
(-)PV Debt 19,337.00$
(-)PV ESOP 1,835.71$
(-) Operating Lease 1,192.60$
PV Equity 142,891.49$
Share Outstanding 1,602.64$
Target Price as of FYE 89.16$
Target Price as of 11/2/2010 98.22$
Pepsico Inc
Dividend Discount Model (DDM) or Fundamental P/E Valuation Model
Fiscal Years Ending Dec 27
2011E 2012E 2013E 2014E 2015E 2016E 2017E CV
EPS 5.52$ 5.83$ 6.08$ 6.30$ 6.47$ 6.61$ 6.70$ 6.67$
Key Assumptions
CV growth 3.10%
CV ROE 17.29%
Cost of Equity 7.72%
Future Cash Flows
Dividends Per Share 1.56 2.17 2.30 2.40 2.48 2.55 2.60 2.64
Future Cash Flows 1.56 2.17 2.30 2.40 2.48 2.55 2.60 118.45
Discounted Cash Flows 1.45 1.87 1.84 1.78 1.71 1.63 1.55 70.39
Intrinsic Value 82.22$
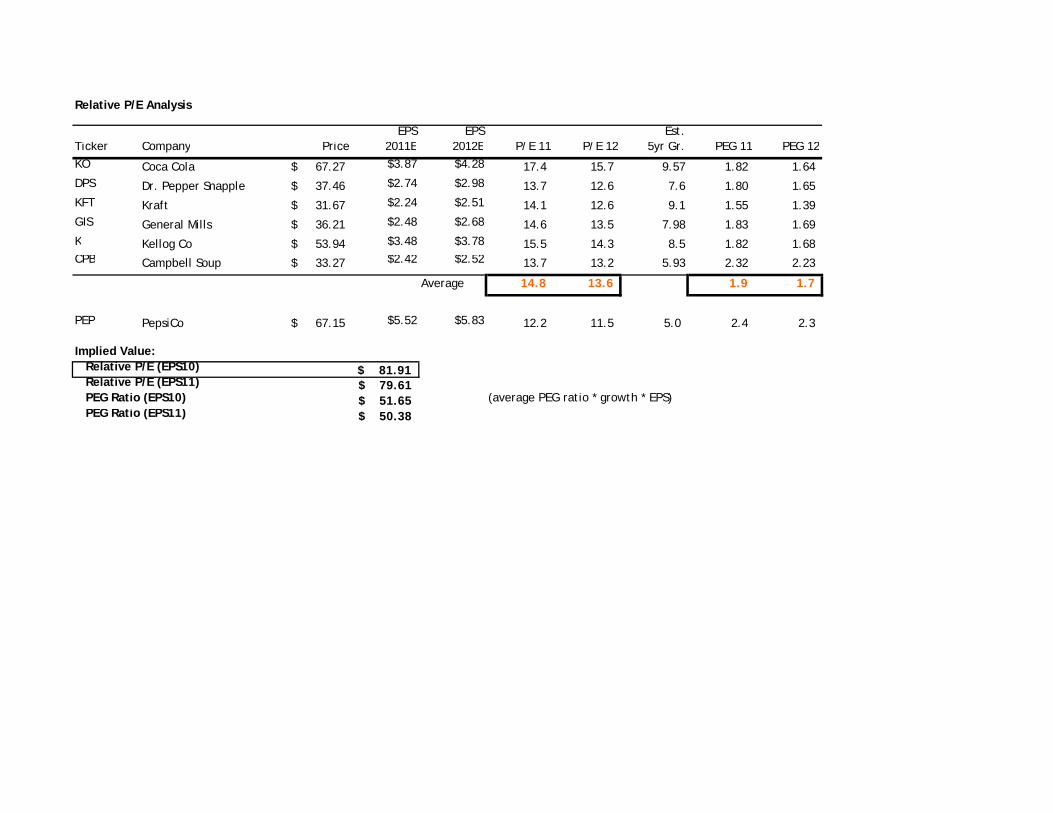
Relative P/E Analysis
EPS EPS Est.Ticker Company Price 2011E 2012E P/E 11 P/E 12 5yr Gr. PEG 11 PEG 12KO Coca Cola 67.27$ $3.87 $4.28 17.4 15.7 9.57 1.82 1.64 DPS Dr. Pepper Snapple 37.46$ $2.74 $2.98 13.7 12.6 7.6 1.80 1.65 KFT Kraft 31.67$ $2.24 $2.51 14.1 12.6 9.1 1.55 1.39 GIS General Mills 36.21$ $2.48 $2.68 14.6 13.5 7.98 1.83 1.69 K Kellog Co 53.94$ $3.48 $3.78 15.5 14.3 8.5 1.82 1.68 CPB Campbell Soup 33.27$ $2.42 $2.52 13.7 13.2 5.93 2.32 2.23
Average 14.8 13.6 1.9 1.7
PEP PepsiCo 67.15$ $5.52 $5.83 12.2 11.5 5.0 2.4 2.3
Implied Value: Relative P/E (EPS10) $ 81.91 Relative P/E (EPS11) 79.61$ PEG Ratio (EPS10) 51.65$ (average PEG ratio * growth * EPS) PEG Ratio (EPS11) 50.38$
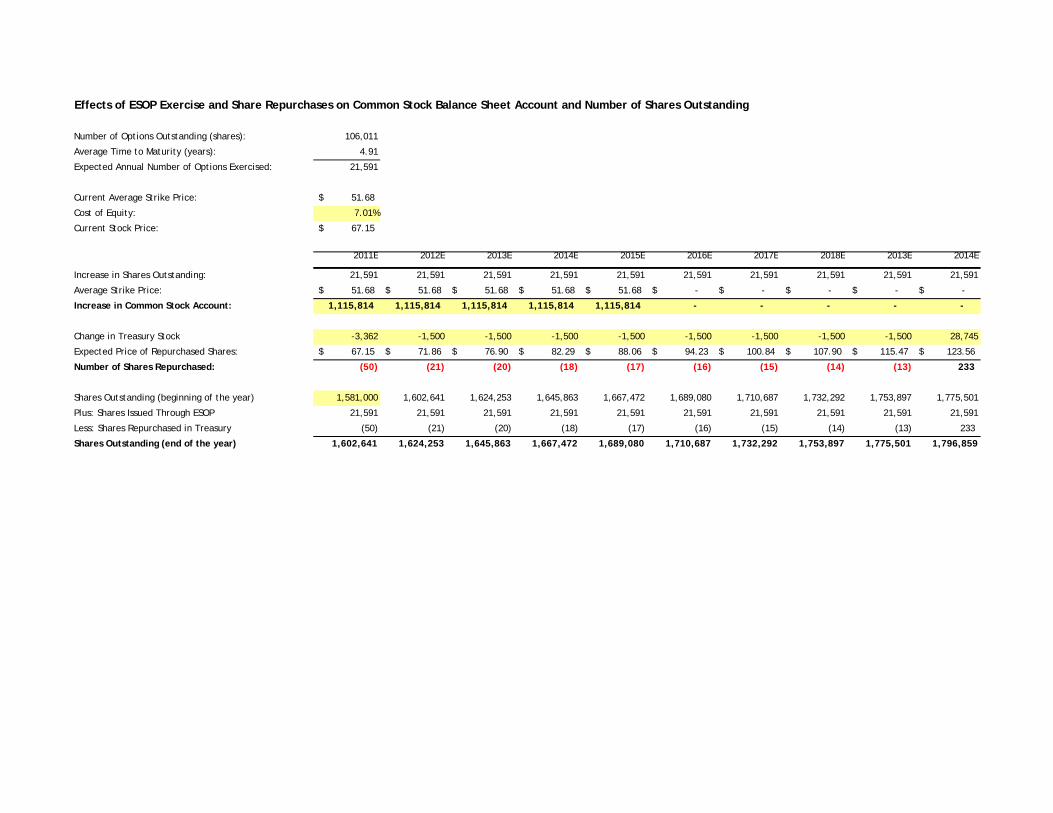
Effects of ESOP Exercise and Share Repurchases on Common Stock Balance Sheet Account and Number of Shares Outstanding
Number of Options Outstanding (shares): 106,011
Average Time to Maturity (years): 4.91
Expected Annual Number of Options Exercised: 21,591
Current Average Strike Price: 51.68$
Cost of Equity: 7.01%
Current Stock Price: 67.15$
2011E 2012E 2013E 2014E 2015E 2016E 2017E 2018E 2013E 2014E
Increase in Shares Outstanding: 21,591 21,591 21,591 21,591 21,591 21,591 21,591 21,591 21,591 21,591
Average Strike Price: 51.68$ 51.68$ 51.68$ 51.68$ 51.68$ -$ -$ -$ -$ -$
Increase in Common Stock Account: 1,115,814 1,115,814 1,115,814 1,115,814 1,115,814 - - - - -
Change in Treasury Stock -3,362 -1,500 -1,500 -1,500 -1,500 -1,500 -1,500 -1,500 -1,500 28,745
Expected Price of Repurchased Shares: 67.15$ 71.86$ 76.90$ 82.29$ 88.06$ 94.23$ 100.84$ 107.90$ 115.47$ 123.56$
Number of Shares Repurchased: (50) (21) (20) (18) (17) (16) (15) (14) (13) 233
Shares Outstanding (beginning of the year) 1,581,000 1,602,641 1,624,253 1,645,863 1,667,472 1,689,080 1,710,687 1,732,292 1,753,897 1,775,501
Plus: Shares Issued Through ESOP 21,591 21,591 21,591 21,591 21,591 21,591 21,591 21,591 21,591 21,591
Less: Shares Repurchased in Treasury (50) (21) (20) (18) (17) (16) (15) (14) (13) 233
Shares Outstanding (end of the year) 1,602,641 1,624,253 1,645,863 1,667,472 1,689,080 1,710,687 1,732,292 1,753,897 1,775,501 1,796,859
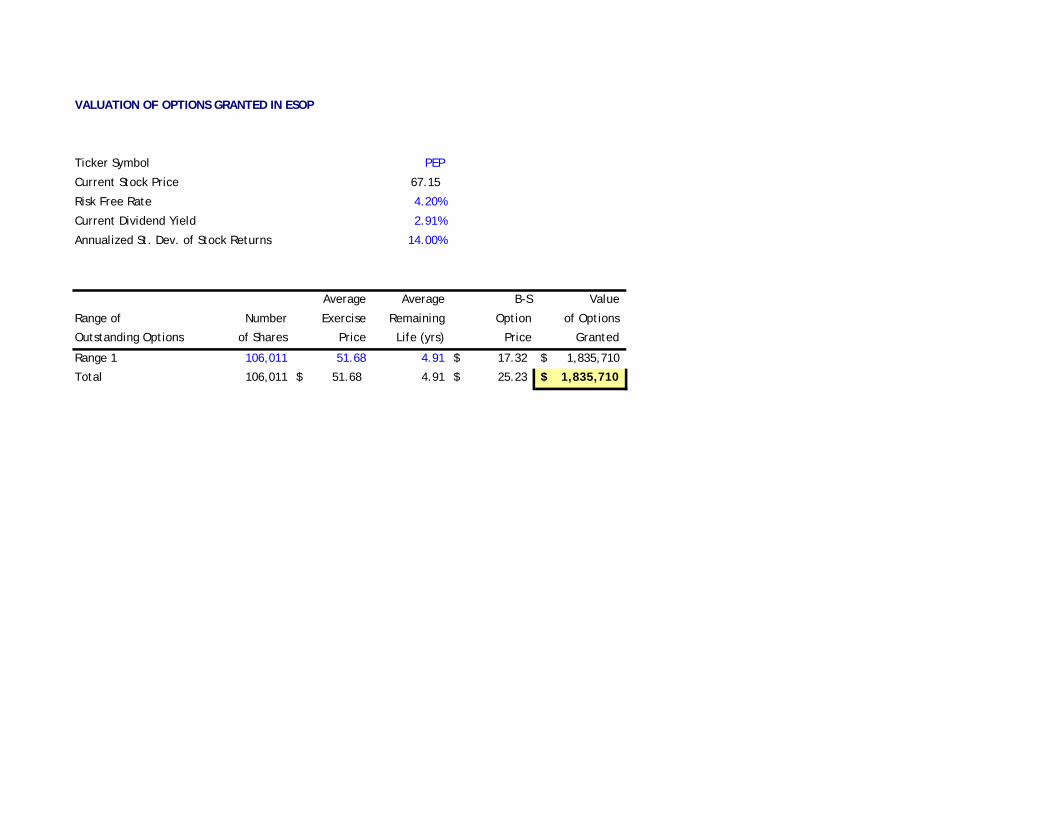
VALUATION OF OPTIONS GRANTED IN ESOP
Ticker Symbol PEP
Current Stock Price 67.15
Risk Free Rate 4.20%
Current Dividend Yield 2.91%
Annualized St. Dev. of Stock Returns 14.00%
Average Average B-S Value
Range of Number Exercise Remaining Option of Options
Outstanding Options of Shares Price Life (yrs) Price Granted
Range 1 106,011 51.68 4.91 17.32$ 1,835,710$
Total 106,011 51.68$ 4.91 25.23$ 1,835,710$
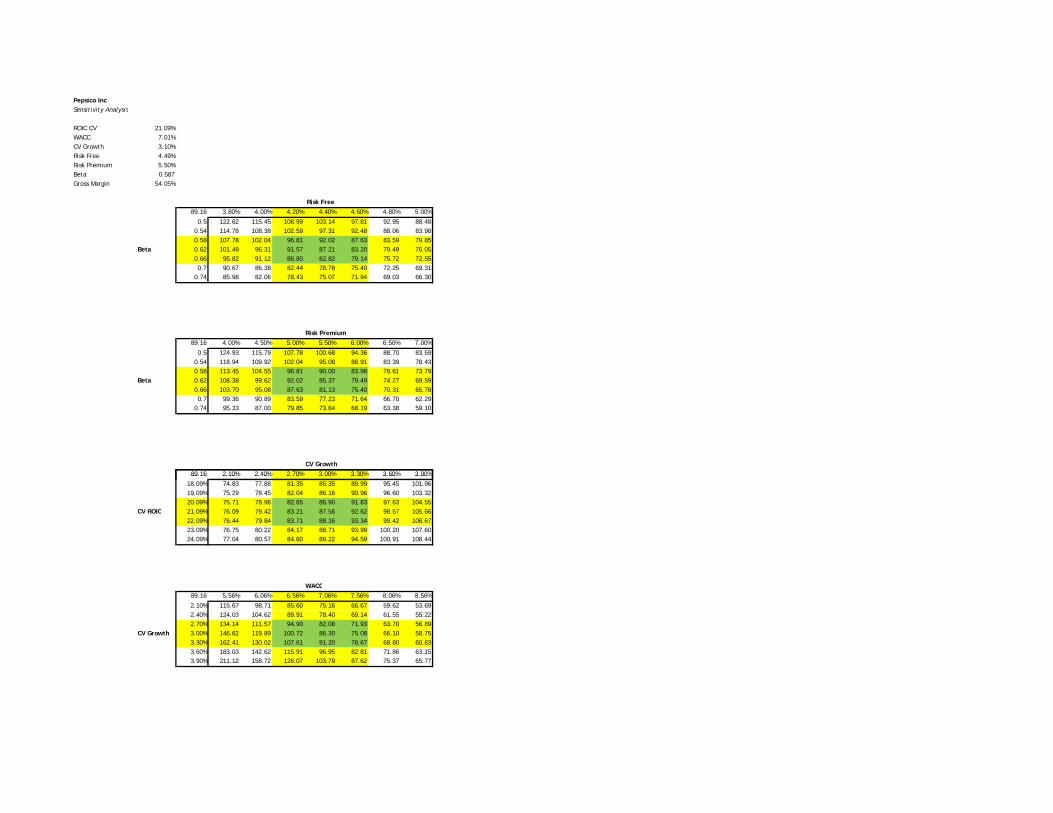
Pepsico Inc Sensitivity Analysis
ROIC CV 21.09%WACC 7.01%CV Growth 3.10%Risk Free 4.49%Risk Premium 5.50%Beta 0.587Gross Margin 54.05%
Risk Free89.16 3.80% 4.00% 4.20% 4.40% 4.60% 4.80% 5.00%
0.5 122.62 115.45 108.99 103.14 97.81 92.95 88.480.54 114.78 108.38 102.59 97.31 92.48 88.06 83.980.58 107.78 102.04 96.81 92.02 87.63 83.59 79.85
Beta 0.62 101.49 96.31 91.57 87.21 83.20 79.49 76.050.66 95.82 91.12 86.80 82.82 79.14 75.72 72.550.7 90.67 86.38 82.44 78.78 75.40 72.25 69.31
0.74 85.98 82.06 78.43 75.07 71.94 69.03 66.30
Risk Premium89.16 4.00% 4.50% 5.00% 5.50% 6.00% 6.50% 7.00%
0.5 124.93 115.79 107.78 100.68 94.36 88.70 83.590.54 118.94 109.92 102.04 95.08 88.91 83.39 78.430.58 113.45 104.55 96.81 90.00 83.98 78.61 73.79
Beta 0.62 108.38 99.62 92.02 85.37 79.49 74.27 69.590.66 103.70 95.08 87.63 81.13 75.40 70.31 65.780.7 99.36 90.89 83.59 77.23 71.64 66.70 62.29
0.74 95.33 87.00 79.85 73.64 68.19 63.38 59.10
CV Growth89.16 2.10% 2.40% 2.70% 3.00% 3.30% 3.60% 3.90%89.16 2.10% 2.40% 2.70% 3.00% 3.30% 3.60% 3.90%
18.09% 74.83 77.88 81.35 85.35 89.99 95.45 101.9619.09% 75.29 78.45 82.04 86.16 90.96 96.60 103.3220.09% 75.71 78.96 82.65 86.90 91.83 97.63 104.55
CV ROIC 21.09% 76.09 79.42 83.21 87.56 92.62 98.57 105.6622.09% 76.44 79.84 83.71 88.16 93.34 99.42 106.6723.09% 76.75 80.22 84.17 88.71 93.99 100.20 107.6024.09% 77.04 80.57 84.60 89.22 94.59 100.91 108.44
WACC89.16 5.56% 6.06% 6.56% 7.06% 7.56% 8.06% 8.56%
2.10% 115.67 98.71 85.60 75.16 66.67 59.62 53.692.40% 124.03 104.62 89.91 78.40 69.14 61.55 55.222.70% 134.14 111.57 94.90 82.08 71.93 63.70 56.89
CV Growth 3.00% 146.62 119.89 100.72 86.30 75.08 66.10 58.753.30% 162.41 130.02 107.61 91.20 78.67 68.80 60.833.60% 183.03 142.62 115.91 96.95 82.81 71.86 63.153.90% 211.12 158.72 126.07 103.79 87.62 75.37 65.77
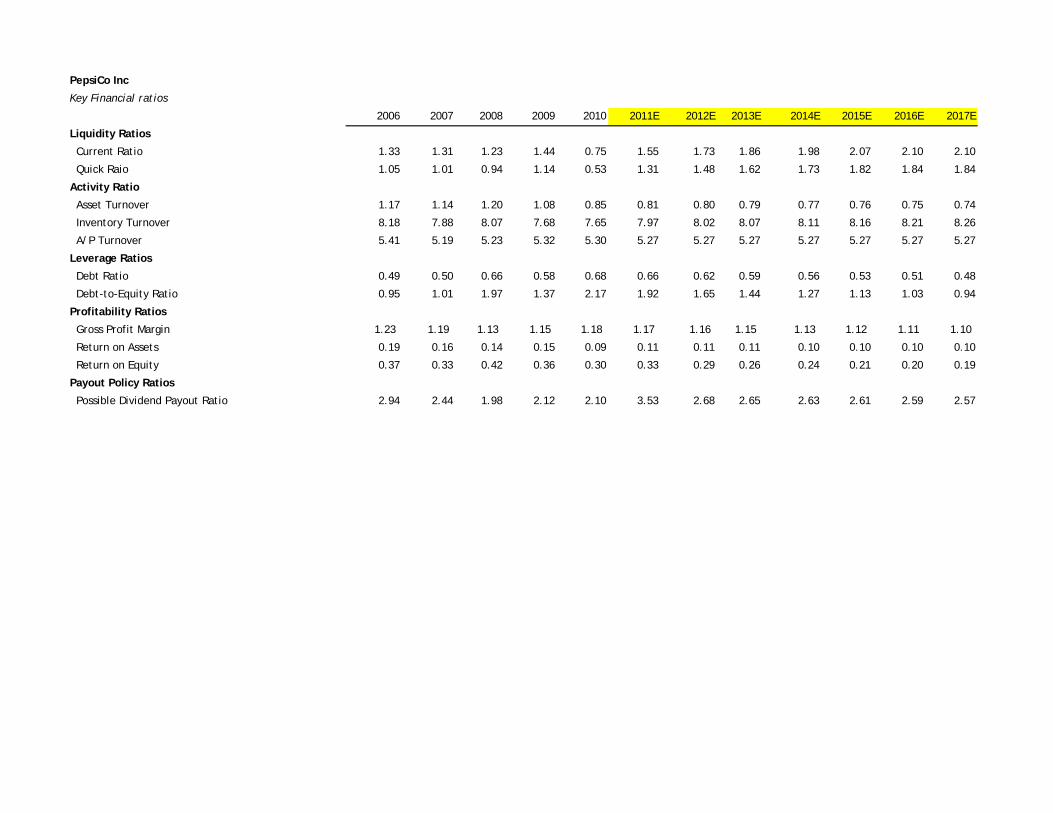
PepsiCo Inc
Key Financial ratios
2006 2007 2008 2009 2010 2011E 2012E 2013E 2014E 2015E 2016E 2017E
Liquidity Ratios
Current Ratio 1.33 1.31 1.23 1.44 0.75 1.55 1.73 1.86 1.98 2.07 2.10 2.10
Quick Raio 1.05 1.01 0.94 1.14 0.53 1.31 1.48 1.62 1.73 1.82 1.84 1.84
Activity Ratio
Asset Turnover 1.17 1.14 1.20 1.08 0.85 0.81 0.80 0.79 0.77 0.76 0.75 0.74
Inventory Turnover 8.18 7.88 8.07 7.68 7.65 7.97 8.02 8.07 8.11 8.16 8.21 8.26
A/P Turnover 5.41 5.19 5.23 5.32 5.30 5.27 5.27 5.27 5.27 5.27 5.27 5.27
Leverage Ratios
Debt Ratio 0.49 0.50 0.66 0.58 0.68 0.66 0.62 0.59 0.56 0.53 0.51 0.48
Debt-to-Equity Ratio 0.95 1.01 1.97 1.37 2.17 1.92 1.65 1.44 1.27 1.13 1.03 0.94
Profitability Ratios
Gross Profit Margin 1.23 1.19 1.13 1.15 1.18 1.17 1.16 1.15 1.13 1.12 1.11 1.10
Return on Assets 0.19 0.16 0.14 0.15 0.09 0.11 0.11 0.11 0.10 0.10 0.10 0.10
Return on Equity 0.37 0.33 0.42 0.36 0.30 0.33 0.29 0.26 0.24 0.21 0.20 0.19
Payout Policy Ratios
Possible Dividend Payout Ratio 2.94 2.44 1.98 2.12 2.10 3.53 2.68 2.65 2.63 2.61 2.59 2.57


![Joseph and Akhenaten: The Case for Reinterpreting Amarnas3.amazonaws.com/zanran_storage/mysite.verizon.net/ContentPages/... · [2] “blessing” which granted them “the breath](https://img.pdfslide.net/doc/110x75/5a9e1a097f8b9ad2298d49d0/joseph-and-akhenaten-the-case-for-reinterpreting-2-blessing-which-granted.jpg)