Embed Size (px)
Citation preview
SouthAfrica
Lesotho
Swaziland
Madagascar
Mauritius
RwandaBurundi
Uganda
Mozambique
Tanzania
Kenya
Ethiopia
Cameroon
Nigeria
GhanaCote d’Ivoire
TogoBenin
BurkinaFaso
Tunisia
EgyptPakistan
India
Nepal
Myanmar Laos
Thailand
Cambodia
DRC
Zimbabwe
Botswana
Namibia
Zambia
Repeat cycleFirst cycle
Potential first cycleUnderway
XAF
FinScope
Cameroon 2017
Consumer Survey
Highlights
MAKING ACCESSPOSSIBLE
Partnering for a common purpose
Making Access Possible (MAP) is a diagnostic and programmatic framework to support expanding access to financial services for individuals and micro- and small- businesses. The MAP methodology and process has been developed jointly by UNCDF and FinMark Trust (FMT) to foster inclusive financial sector growth. At country level, the core MAP partners collaborate with Government, other key stakeholders and donors to ensure an inclusive, holistic process. UNCDF and UNDP, in collaboration with FMT, are assisting the Government of Cameroon on broader Financial Inclusion Strategy and Implementation.
FinScope Cameroon represents a partnership between UNCDF, FinMark Trust and the following Steering Committee members:MINFIMINADER
The cover symbol
Through the MAP programme, we hope to effect real change at country level and see the impact of financial inclusion on broader national growth and development. The cover graphic features a flower that symbolises growth and development while the circle represents inclusive growth. Each flower is an example of the successful growth in a unique environment. By combining the flower with the currency symbol of Cameroon we represent the characteristics of the country, linking financial inclusion with successful growth.
MINPOSTELMINEPATMINMEESAMINPROFFMINEPIAAPECCAMASACANEMCAMCAMPOSTSociety of Mobile TelephonesAFDKWFGIZ
The FinScope survey is dynamic and the content is evaluated by a number of stakeholders including the private sector, development agencies and Government to ensure that the most relevant consumer data is collected.
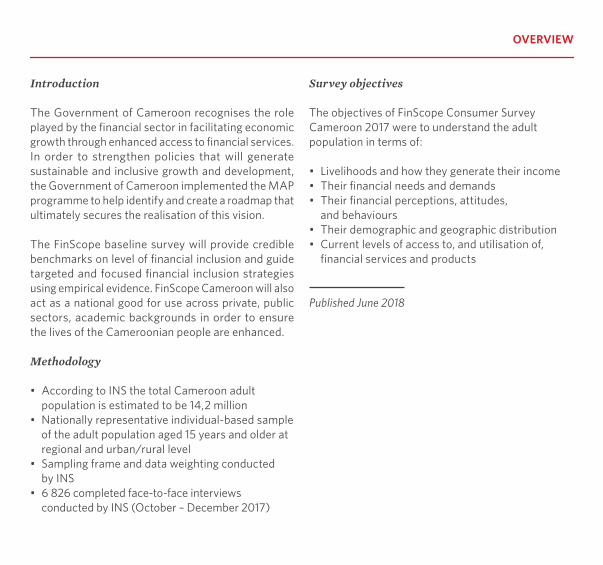
Introduction
The Government of Cameroon recognises the role played by the financial sector in facilitating economic growth through enhanced access to financial services. In order to strengthen policies that will generate sustainable and inclusive growth and development, the Government of Cameroon implemented the MAP programme to help identify and create a roadmap that ultimately secures the realisation of this vision.
The FinScope baseline survey will provide credible benchmarks on level of financial inclusion and guide targeted and focused financial inclusion strategies using empirical evidence. FinScope Cameroon will also act as a national good for use across private, public sectors, academic backgrounds in order to ensure the lives of the Cameroonian people are enhanced.
Methodology
• According to INS the total Cameroon adult population is estimated to be 14,2 million
• Nationally representative individual-based sample of the adult population aged 15 years and older at regional and urban/rural level
• Sampling frame and data weighting conducted by INS
• 6 826 completed face-to-face interviews conducted by INS (October – December 2017)
OVERVIEW
Survey objectives
The objectives of FinScope Consumer Survey Cameroon 2017 were to understand the adult population in terms of:
• Livelihoods and how they generate their income• Their financial needs and demands• Their financial perceptions, attitudes,
and behaviours• Their demographic and geographic distribution• Current levels of access to, and utilisation of,
financial services and products
Published June 2018
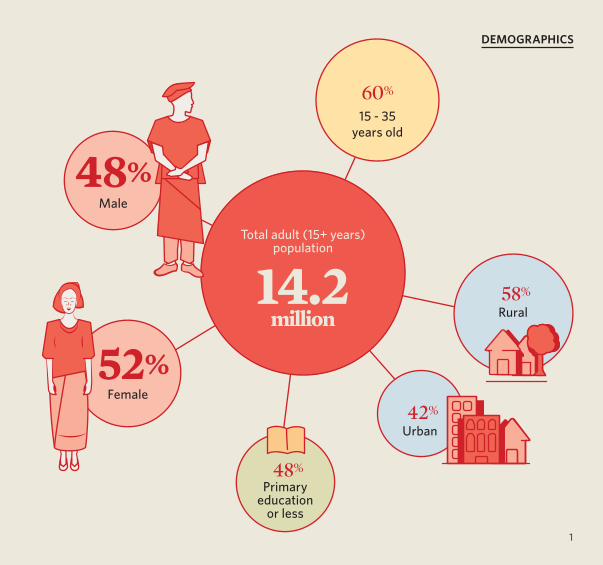
Female52%
Nigeria
Niger
Chad
Central African Republic
Equatorial Guinea
Democratic Republic of the
Congo Republic of the Congo
Rural58%
Urban42%
15 - 35years old
60%
Primaryeducation
or less
48%
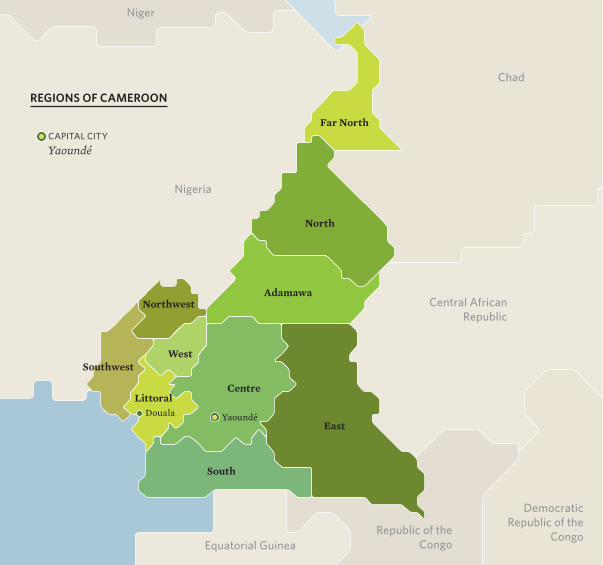
YaoundéCAPITAL CITY
Male48%
Total adult (15+ years)population
14.2million
South
East
CentreLittoral
West
Northwest
Southwest
Adamawa
North
Far North
YaoundéDouala
REGIONS OF CAMEROON
Female52%
Nigeria
Niger
Chad
Central African Republic
Equatorial Guinea
Democratic Republic of the
Congo Republic of the Congo
Rural58%
Urban42%
15 - 35years old
60%
Primaryeducation
or less
48%
YaoundéCAPITAL CITY
Male48%
Total adult (15+ years)population
14.2million
South
East
CentreLittoral
West
Northwest
Southwest
Adamawa
North
Far North
YaoundéDouala
DEMOGRAPHICS
1
COMMUNICATIONTOOLS/CHANNELS (%)
Mobile phone
Internet
Desktop /laptop or tablet
Land line
Fax
92%
39%
27%
21%
14%
8%
8%
4%
7%
12%
7%
77%
54%
35%
27%
25%
15%
10%
18%
43%
28%
Bed/mattress
Mobile phone/CT mobile phone
Television
RadioElectrical appliances (blender,
water heater, iron, co�ee maker, etc.)Wardrobes
VCR/CD/DVD player
Fan
Gas plate
Fridge/refrigerator
Motorcycle/moped
Wheelbarrow/rickshaw
Satellite dish/decoder
Fixed or portable computer
Bicycle/bike
Music equipment
Personal car
Gas cookers
Sewing machine
Jewelry
Generator/solar panel
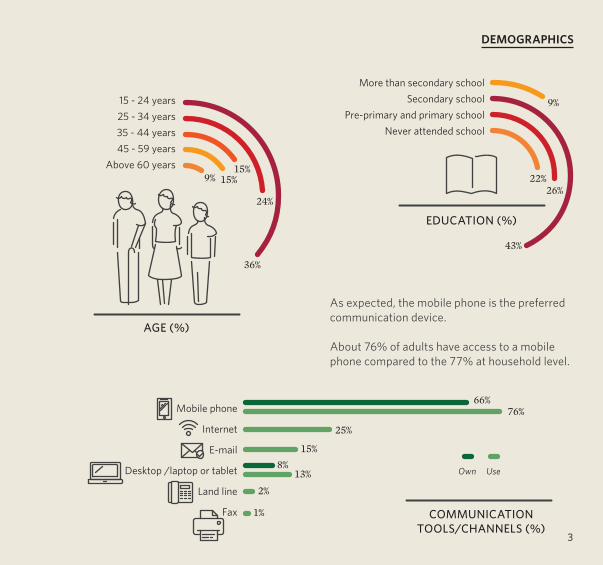
AGE (%)
15 - 24 years25 - 34 years35 - 44 years45 - 59 years
Above 60 years15%
15%
36%
24%
9%
More than secondary schoolSecondary school
Pre-primary and primary schoolNever attended school
EDUCATION (%)
9%
22%26%
43%
Own Use
66%76%
25%
15%
8%13%
2%
1%
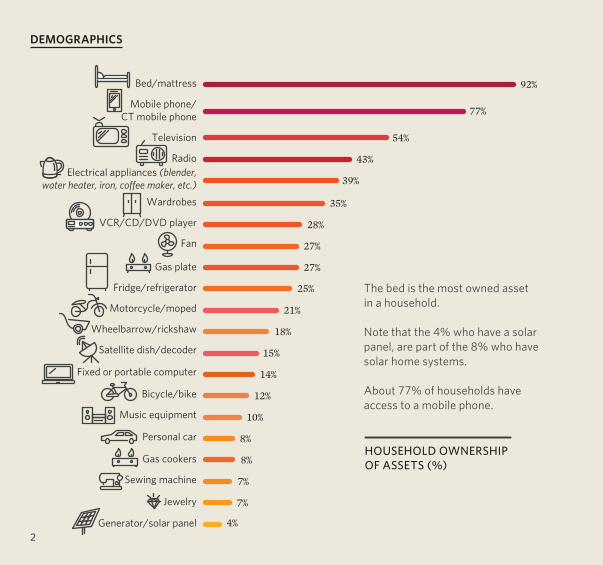
HOUSEHOLD OWNERSHIP OF ASSETS (%)
DEMOGRAPHICS
The bed is the most owned asset in a household.
Note that the 4% who have a solar panel, are part of the 8% who have solar home systems.
About 77% of households have access to a mobile phone.
2
COMMUNICATIONTOOLS/CHANNELS (%)
Mobile phone
Internet
Desktop /laptop or tablet
Land line
Fax
92%
39%
27%
21%
14%
8%
8%
4%
7%
12%
7%
77%
54%
35%
27%
25%
15%
10%
18%
43%
28%
Bed/mattress
Mobile phone/CT mobile phone
Television
RadioElectrical appliances (blender,
water heater, iron, co�ee maker, etc.)Wardrobes
VCR/CD/DVD player
Fan
Gas plate
Fridge/refrigerator
Motorcycle/moped
Wheelbarrow/rickshaw
Satellite dish/decoder
Fixed or portable computer
Bicycle/bike
Music equipment
Personal car
Gas cookers
Sewing machine
Jewelry
Generator/solar panel
AGE (%)
15 - 24 years25 - 34 years35 - 44 years45 - 59 years
Above 60 years15%
15%
36%
24%
9%
More than secondary schoolSecondary school
Pre-primary and primary schoolNever attended school
EDUCATION (%)
9%
22%26%
43%
Own Use
66%76%
25%
15%
8%13%
2%
1%
HOUSEHOLD OWNERSHIP OF ASSETS (%)
DEMOGRAPHICS
As expected, the mobile phone is the preferred communication device.
About 76% of adults have access to a mobile phone compared to the 77% at household level.
3
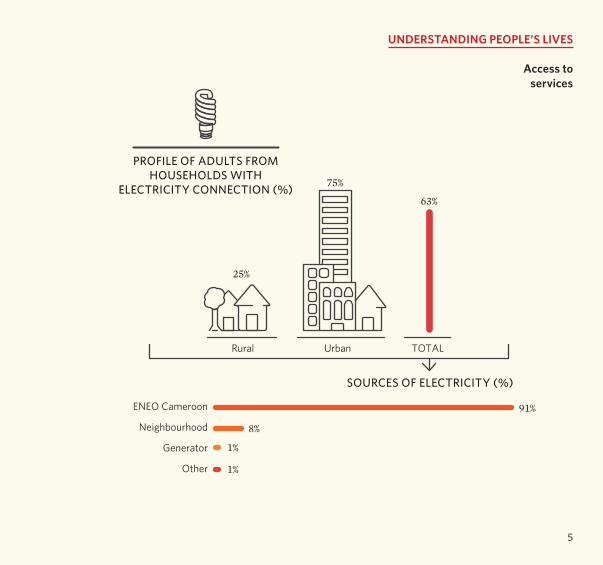
Rural TOTAL
25%
Urban
75%
63%
ENEO Cameroon
Neighbourhood
Generator
Other
SOURCES OF ELECTRICITY (%)
91%
8%
1%
1%
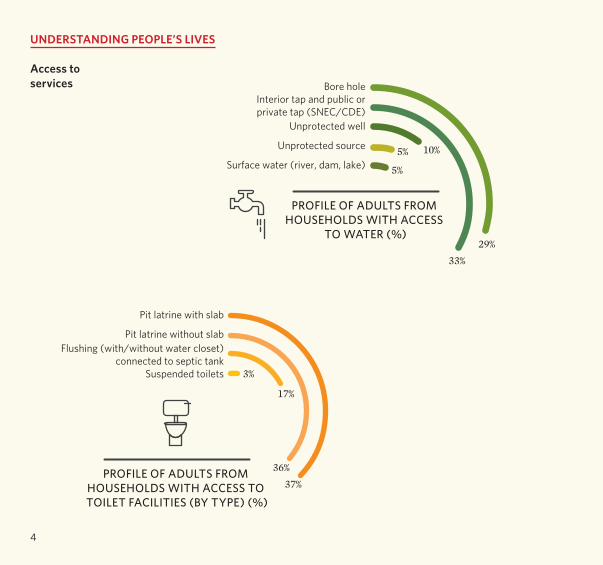
Pit latrine with slab
Pit latrine without slabFlushing (with/without water closet)
connected to septic tankSuspended toilets
37%
36%
17%
3%
Bore holeInterior tap and public orprivate tap (SNEC/CDE)
Unprotected well
Unprotected source
Surface water (river, dam, lake)
29%
33%
10%5%
5%
PROFILE OF ADULTS FROM HOUSEHOLDS WITH ACCESS
TO WATER (%)
PROFILE OF ADULTS FROM HOUSEHOLDS WITH ACCESS TO TOILET FACILITIES (BY TYPE) (%)
PROFILE OF ADULTS FROM HOUSEHOLDS WITH
ELECTRICITY CONNECTION (%)
UNDERSTANDING PEOPLE’S LIVES
Access to services
4
Rural TOTAL
25%
Urban
75%
63%
ENEO Cameroon
Neighbourhood
Generator
Other
SOURCES OF ELECTRICITY (%)
91%
8%
1%
1%
Pit latrine with slab
Pit latrine without slabFlushing (with/without water closet)
connected to septic tankSuspended toilets
37%
36%
17%
3%
Bore holeInterior tap and public orprivate tap (SNEC/CDE)
Unprotected well
Unprotected source
Surface water (river, dam, lake)
29%
33%
10%5%
5%
PROFILE OF ADULTS FROM HOUSEHOLDS WITH ACCESS
TO WATER (%)
PROFILE OF ADULTS FROM HOUSEHOLDS WITH ACCESS TO TOILET FACILITIES (BY TYPE) (%)
PROFILE OF ADULTS FROM HOUSEHOLDS WITH
ELECTRICITY CONNECTION (%)
UNDERSTANDING PEOPLE’S LIVES
Access to services
5

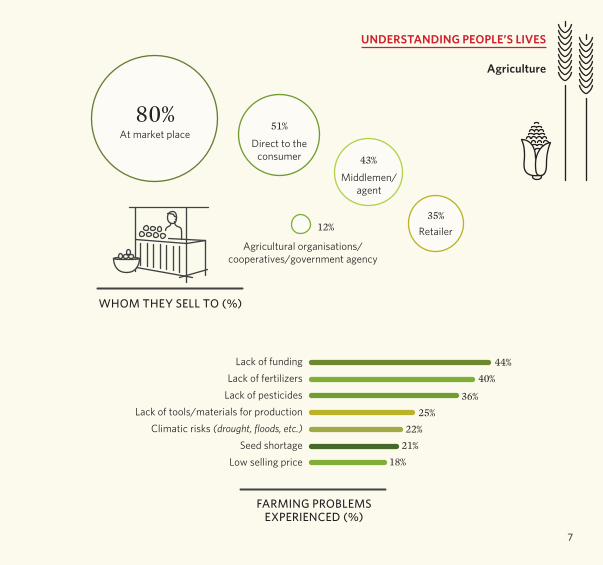
WHOM THEY SELL TO (%)
FARMING PROBLEMSEXPERIENCED (%)
Lack of fundingLack of fertilizers
Lack of pesticidesLack of tools/materials for production
Climatic risks (drought, floods, etc.)Seed shortage
Low selling price
Agricultural organisations/cooperatives/government agency
Subsistence Consume and sell
23%
75%
66%OF HOUSEHOLDS
INVOLVED IN FARMING
80%51%
43%
35%12%
44%
40%
25%
21%
36%
22%
18%
At market placeDirect to the
consumer
Middlemen/agent
Retailer
88%
86%
85%
84%
91%
NORTH-WEST
CENTRE
WEST
EAST
RURAL
42%OF ADULTS
INVOLVED IN FARMING
Agriculture
UNDERSTANDING PEOPLE’S LIVES
Farming in Cameroon is important with 66% of households involved in farming – split by region shows as North-West (88%), Centre (86%), West (85%) and East (84%) – rural (91%)
About 23% of farmer households are subsistence and 75% both consume and sell their produce
6
WHOM THEY SELL TO (%)
FARMING PROBLEMSEXPERIENCED (%)
Lack of fundingLack of fertilizers
Lack of pesticidesLack of tools/materials for production
Climatic risks (drought, floods, etc.)Seed shortage
Low selling price
Agricultural organisations/cooperatives/government agency
Subsistence Consume and sell
23%
75%
66%OF HOUSEHOLDS
INVOLVED IN FARMING
80%51%
43%
35%12%
44%
40%
25%
21%
36%
22%
18%
At market placeDirect to the
consumer
Middlemen/agent
Retailer
88%
86%
85%
84%
91%
NORTH-WEST
CENTRE
WEST
EAST
RURAL
42%OF ADULTS
INVOLVED IN FARMING
Agriculture
UNDERSTANDING PEOPLE’S LIVES
7
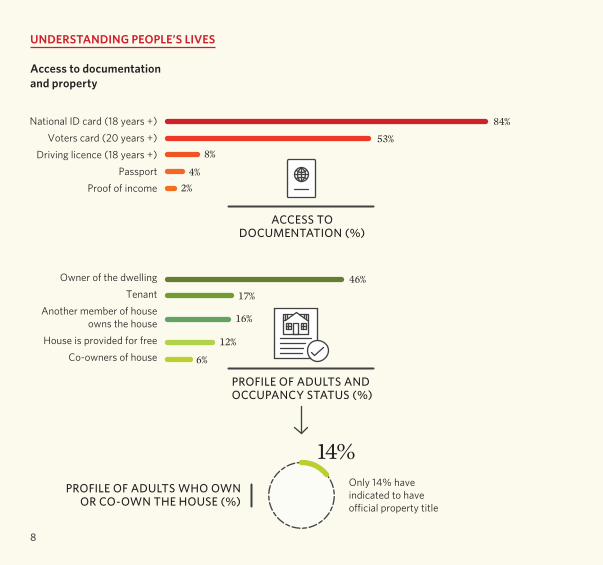
Only 14% have indicated to have o�cial property title
ACCESS TODOCUMENTATION (%)
PROFILE OF ADULTS AND OCCUPANCY STATUS (%)
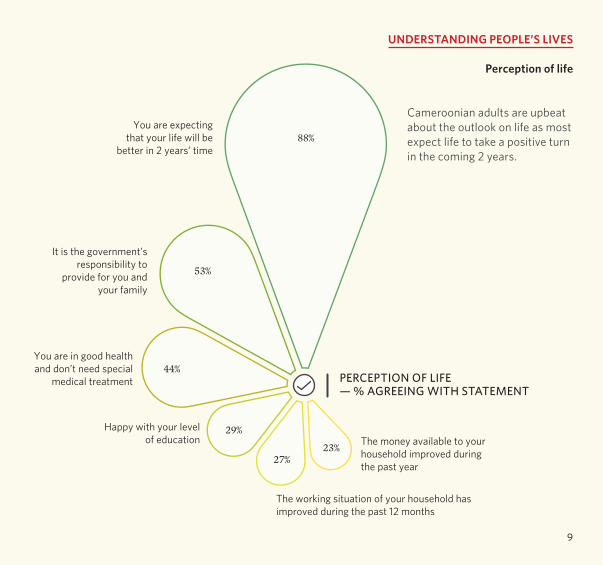
PERCEPTION OF LIFE — % AGREEING WITH STATEMENT
National ID card (18 years +)Voters card (20 years +)
Driving licence (18 years +)Passport
Proof of income
84%
53%
8%
4%
2%
Owner of the dwellingTenant
Another member of houseowns the house
House is provided for freeCo-owners of house
46%
17%
16%
12%
6%
23%
88%
53%
44%
29%
27%
PROFILE OF ADULTS WHO OWN OR CO-OWN THE HOUSE (%)
14%
You are expecting that your life will be
better in 2 years’ time
It is the government’s responsibility to
provide for you and your family
The money available to your household improved during the past year
The working situation of your household has improved during the past 12 months
Happy with your level of education
You are in good health and don’t need special
medical treatment
UNDERSTANDING PEOPLE’S LIVES
Access to documentation and property
8
Only 14% have indicated to have o�cial property title
ACCESS TODOCUMENTATION (%)
PROFILE OF ADULTS AND OCCUPANCY STATUS (%)
PERCEPTION OF LIFE — % AGREEING WITH STATEMENT
National ID card (18 years +)Voters card (20 years +)
Driving licence (18 years +)Passport
Proof of income
84%
53%
8%
4%
2%
Owner of the dwellingTenant
Another member of houseowns the house
House is provided for freeCo-owners of house
46%
17%
16%
12%
6%
23%
88%
53%
44%
29%
27%
PROFILE OF ADULTS WHO OWN OR CO-OWN THE HOUSE (%)
14%
You are expecting that your life will be
better in 2 years’ time
It is the government’s responsibility to
provide for you and your family
The money available to your household improved during the past year
The working situation of your household has improved during the past 12 months
Happy with your level of education
You are in good health and don’t need special
medical treatment
Cameroonian adults are upbeat about the outlook on life as most expect life to take a positive turn in the coming 2 years.
UNDERSTANDING PEOPLE’S LIVES
Perception of life
9

Always
26%
Never
31%Not often
33%Mosttimes
10%
REASONS FOR RUNNING OUT OF MONEY (%)
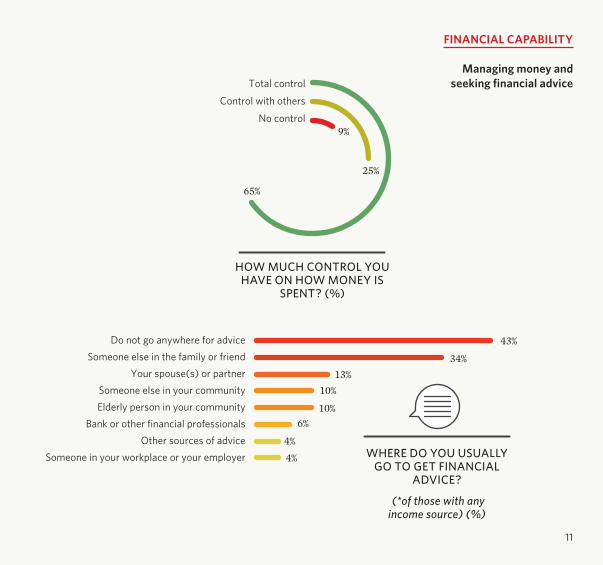
HOW MUCH CONTROL YOU HAVE ON HOW MONEY IS
SPENT? (%)
WHERE DO YOU USUALLY GO TO GET FINANCIAL
ADVICE?
PLANNINGAND
TRACKING
How often do you run out of money for food and
other important things? (%)
Neighbours can count on you for help in times of di�culty
You can rely on your friends or neighbours
to help you out in di�cult times
You can count on your church/mosque or
religious group for help in times of di�culty
Your ties with your neighbours are not as strong
as they used to be
(*of those with any income source) (%)
75%26%
Total control
Control with others
No control9%
25%
65%
52%
50%
36%
15%
14%
13%
73%
Do not go anywhere for adviceSomeone else in the family or friend
Your spouse(s) or partnerSomeone else in your communityElderly person in your community
Bank or other financial professionalsOther sources of advice
Someone in your workplace or your employer
43%
6%
13%
4%
34%
4%
10%
10%
74%
Not enough income
Irregular or unreliable income
Buying medicines/health care
Unexpected events or paying for necessities
Has to pay school fees
DIFFICULTY WITH KEEPING UPWITH FINANCIAL COMMITMENTS (%)Managing money
FINANCIAL CAPABILITY
10
Always
26%
Never
31%Not often
33%Mosttimes
10%
REASONS FOR RUNNING OUT OF MONEY (%)
HOW MUCH CONTROL YOU HAVE ON HOW MONEY IS
SPENT? (%)
WHERE DO YOU USUALLY GO TO GET FINANCIAL
ADVICE?
PLANNINGAND
TRACKING
How often do you run out of money for food and
other important things? (%)
Neighbours can count on you for help in times of di�culty
You can rely on your friends or neighbours
to help you out in di�cult times
You can count on your church/mosque or
religious group for help in times of di�culty
Your ties with your neighbours are not as strong
as they used to be
(*of those with any income source) (%)
75%26%
Total control
Control with others
No control9%
25%
65%
52%
50%
36%
15%
14%
13%
73%
Do not go anywhere for adviceSomeone else in the family or friend
Your spouse(s) or partnerSomeone else in your communityElderly person in your community
Bank or other financial professionalsOther sources of advice
Someone in your workplace or your employer
43%
6%
13%
4%
34%
4%
10%
10%
74%
Not enough income
Irregular or unreliable income
Buying medicines/health care
Unexpected events or paying for necessities
Has to pay school fees
DIFFICULTY WITH KEEPING UPWITH FINANCIAL COMMITMENTS (%) Managing money and
seeking financial advice
FINANCIAL CAPABILITY
11
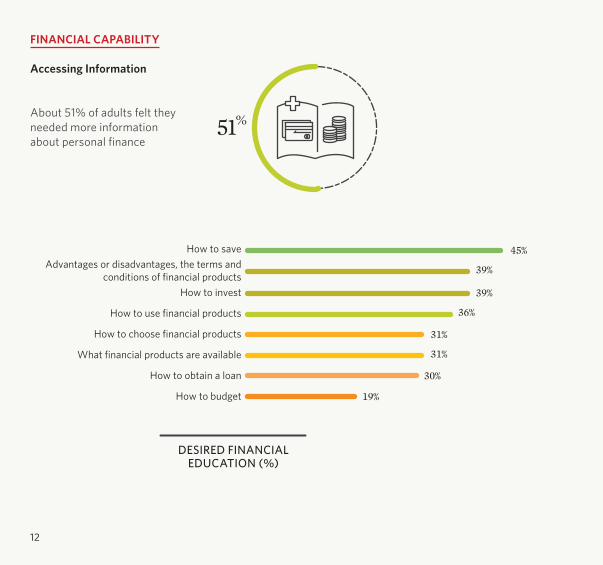
DESIRED FINANCIALEDUCATION (%)
How to saveAdvantages or disadvantages, the terms and
conditions of financial productsHow to invest
How to use financial products
How to choose financial products
What financial products are available
How to obtain a loan
How to budget
Total adult population = 15 years and older in Cameroon
FINANCIALLY EXCLUDED
do not have/use any financial products and/or services – formal and/or informal
FINANCIALLY INCLUDED
have/use financial products and/or services – formal and/or informal
FORMALLY SERVED
have/use formal financial products and/or services provided by a financial institution (bank and/or non-bank)
INFORMALLY SERVED
have/use financial products and/or services which are not regulated
BANKED
have/use financial products/services provided by a bank regulated by the BCEAO
SERVED BY OTHER FORMAL FINANCIAL INSTITUTIONS
have/use financial products/services provided by regulated non-bank financial institutions
45%
19%
30%
31%
36%
39%
39%
31%
51%About 51% of adults felt they needed more information about personal finance
Accessing Information
FINANCIAL CAPABILITY
12

DESIRED FINANCIALEDUCATION (%)
How to saveAdvantages or disadvantages, the terms and
conditions of financial productsHow to invest
How to use financial products
How to choose financial products
What financial products are available
How to obtain a loan
How to budget
Total adult population = 15 years and older in Cameroon
FINANCIALLY EXCLUDED
do not have/use any financial products and/or services – formal and/or informal
FINANCIALLY INCLUDED
have/use financial products and/or services – formal and/or informal
FORMALLY SERVED
have/use formal financial products and/or services provided by a financial institution (bank and/or non-bank)
INFORMALLY SERVED
have/use financial products and/or services which are not regulated
BANKED
have/use financial products/services provided by a bank regulated by the BCEAO
SERVED BY OTHER FORMAL FINANCIAL INSTITUTIONS
have/use financial products/services provided by regulated non-bank financial institutions
45%
19%
30%
31%
36%
39%
39%
31%
51%
DEFINING FINANCIAL INCLUSION
Defining financial inclusion by category
13
16.7%
4.3%
4.4%
0.3%
0.5%Banked 22.5%
Other formal
14.6%
Informal
Excluded36.8%
BankedInformal only
Other formal(non-bank)
Excluded
36%15%39%10%
Formally served
Banked
Other formal (non-bank)
Informal
Excluded
49%
10%
48%
36%
36%
DEFINING FINANCIAL INCLUSION
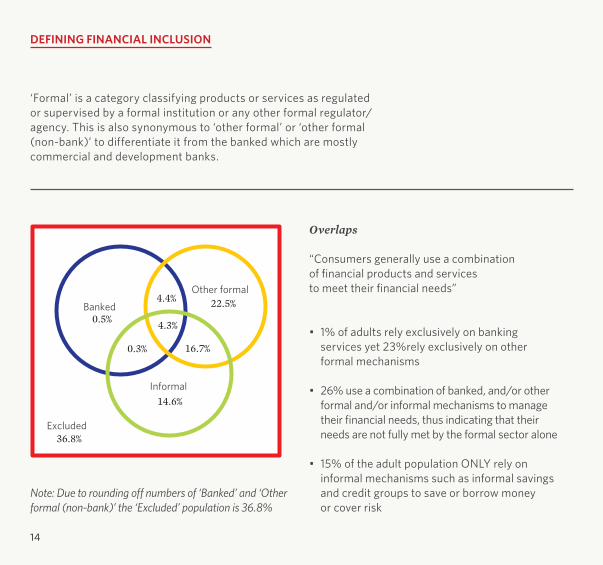
‘Formal’ is a category classifying products or services as regulated or supervised by a formal institution or any other formal regulator/agency. This is also synonymous to ‘other formal’ or ‘other formal (non-bank)’ to differentiate it from the banked which are mostly commercial and development banks.
Overlaps
“Consumers generally use a combination of financial products and services to meet their financial needs”
• 1% of adults rely exclusively on banking services yet 23%rely exclusively on other formal mechanisms
• 26% use a combination of banked, and/or other formal and/or informal mechanisms to manage their financial needs, thus indicating that their needs are not fully met by the formal sector alone
• 15% of the adult population ONLY rely on informal mechanisms such as informal savings and credit groups to save or borrow money or cover risk
Note: Due to rounding off numbers of ‘Banked’ and ‘Other formal (non-bank)’ the ‘Excluded’ population is 36.8%
14
16.7%
4.3%
4.4%
0.3%
0.5%Banked 22.5%
Other formal
14.6%
Informal
Excluded36.8%
BankedInformal only
Other formal(non-bank)
Excluded
36%15%39%10%
Formally served
Banked
Other formal (non-bank)
Informal
Excluded
49%
10%
48%
36%
36%
FINANCIAL INCLUSION
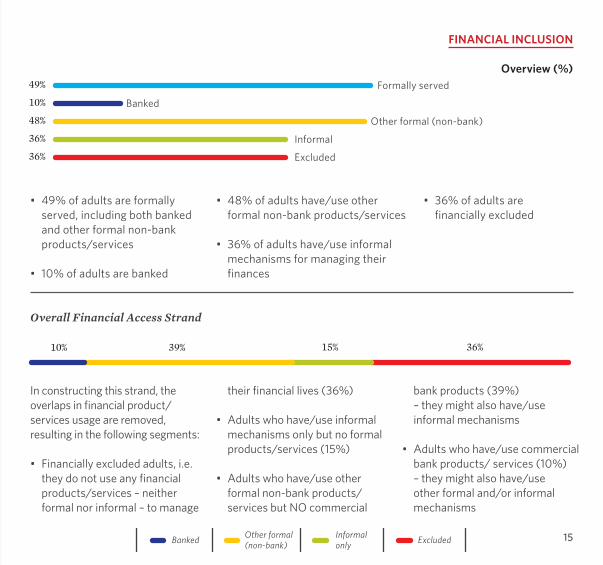
In constructing this strand, the overlaps in financial product/services usage are removed, resulting in the following segments:
• Financially excluded adults, i.e. they do not use any financial products/services – neither formal nor informal – to manage
their financial lives (36%)
• Adults who have/use informal mechanisms only but no formal products/services (15%)
• Adults who have/use other formal non-bank products/ services but NO commercial
bank products (39%) – they might also have/use informal mechanisms
• Adults who have/use commercial bank products/ services (10%) – they might also have/use other formal and/or informal mechanisms
Overall Financial Access Strand
• 49% of adults are formally served, including both banked and other formal non-bank products/services
• 10% of adults are banked
• 48% of adults have/use other formal non-bank products/services
• 36% of adults have/use informal mechanisms for managing their finances
• 36% of adults are financially excluded
Overview (%)
15
BankedInformal only
Other formal(non-bank)
Excluded
BurkinaFaso
36%15%39%10%
39%21%22%18%
42%10%10%38%
40%15%27%18%
44%15%7%34%
11%21%42%26%
15%31%34%20%
17%7%33%42%
27%7%49%17%
41%30%17%12%
52%12%24%12%
Cameroon 2017
Burkina Faso 2016
Togo 2016
Nigeria 2016
Ghana 2010
Rwanda 2016
Uganda 2013
Kenya 2016
Tanzania 2017
Madagascar 2016
DRC 2014
Rwanda
UgandaKenya
Tanzania
Madagascar
DRC
Cameroon
Nigeria
Togo
Ghana
16
BankedInformal only
Other formal(non-bank)
Excluded
BurkinaFaso
36%15%39%10%
39%21%22%18%
42%10%10%38%
40%15%27%18%
44%15%7%34%
11%21%42%26%
15%31%34%20%
17%7%33%42%
27%7%49%17%
41%30%17%12%
52%12%24%12%
Cameroon 2017
Burkina Faso 2016
Togo 2016
Nigeria 2016
Ghana 2010
Rwanda 2016
Uganda 2013
Kenya 2016
Tanzania 2017
Madagascar 2016
DRC 2014
Rwanda
UgandaKenya
Tanzania
Madagascar
DRC
Cameroon
Nigeria
Togo
Ghana
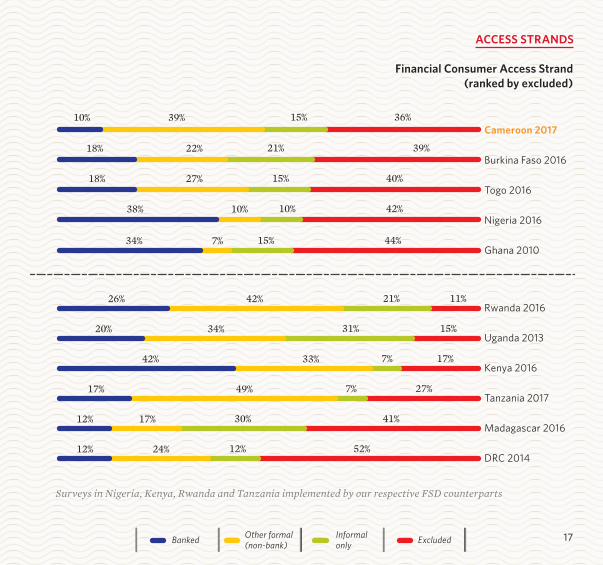
ACCESS STRANDS
Financial Consumer Access Strand (ranked by excluded)
Surveys in Nigeria, Kenya, Rwanda and Tanzania implemented by our respective FSD counterparts
17
BankedInformal only
Other formal(non-bank)
Excluded BankedOther formal(non-bank)
ExcludedInformal only
29%21%36%14%
41%11%41%7%
Male
Female
15 - 34 years
35 yearsand older
34%13%42%11%
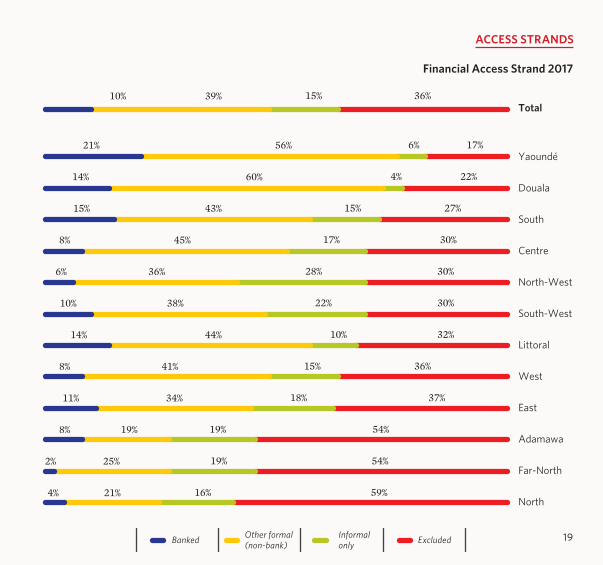
37%16%37%10%
36%15%39%10%
17%6%56%21%
22%4%60%14%
27%15%43%15%
30%17%45%8%
30%28%36%6%
30%22%38%10%
32%10%44%14%
36%15%41%8%
37%18%34%11%
54%19%19%8%
54%19%25%2%
59%16%21%4%
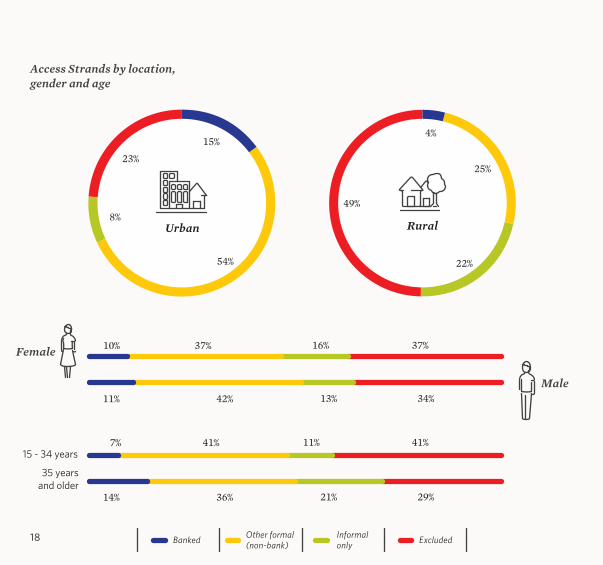
4%
49%
22%
25%
15%
23%
8%
54%
RuralUrban
Total
Yaoundé
Douala
South
Centre
North-West
South-West
Littoral
West
East
Adamawa
Far-North
North
Access Strands by location, gender and age
18
BankedInformal only
Other formal(non-bank)
Excluded BankedOther formal(non-bank)
ExcludedInformal only
29%21%36%14%
41%11%41%7%
Male
Female
15 - 34 years
35 yearsand older
34%13%42%11%
37%16%37%10%
36%15%39%10%
17%6%56%21%
22%4%60%14%
27%15%43%15%
30%17%45%8%
30%28%36%6%
30%22%38%10%
32%10%44%14%
36%15%41%8%
37%18%34%11%
54%19%19%8%
54%19%25%2%
59%16%21%4%
4%
49%
22%
25%
15%
23%
8%
54%
RuralUrban
Total
Yaoundé
Douala
South
Centre
North-West
South-West
Littoral
West
East
Adamawa
Far-North
North
ACCESS STRANDS
Financial Access Strand 2017
19

Current/checking account
Debit card/ATM
Livrets of savings/savings at sight
Cellphone banking
School loan
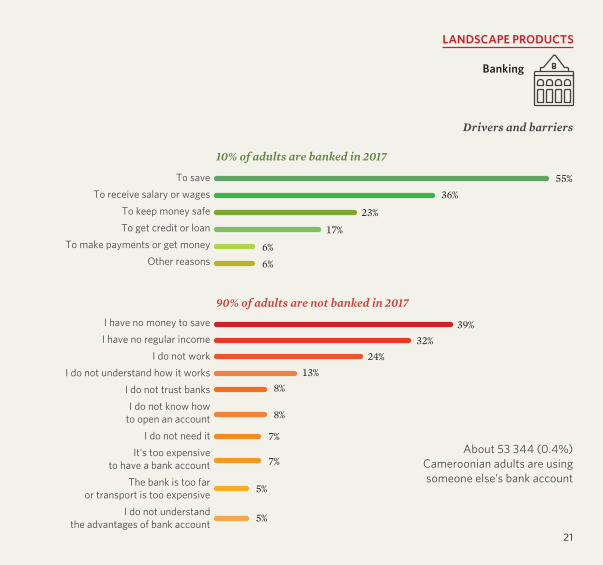
To saveTo receive salary or wages
To keep money safeTo get credit or loan
To make payments or get moneyOther reasons
I have no money to saveI have no regular income
I do not workI do not understand how it works
I do not trust banksI do not know how
to open an accountI do not need it
It's too expensive to have a bank account
The bank is too far or transport is too expensive
I do not understand the advantages of bank account
BANKING PRODUCTS/USAGE (OF THOSE CURRENTLY
BANKED) (%)
45%
28%
18%
5%
4%
55%
39%
32%
24%
13%
8%
8%
7%
7%
5%
5%
36%
23%
17%
6%
6%
10%What products/services are driving the banked?
About 10% of Cameroonian adults have a bank account
20
Banking
Current/checking account
Debit card/ATM
Livrets of savings/savings at sight
Cellphone banking
School loan
To saveTo receive salary or wages
To keep money safeTo get credit or loan
To make payments or get moneyOther reasons
I have no money to saveI have no regular income
I do not workI do not understand how it works
I do not trust banksI do not know how
to open an accountI do not need it
It's too expensive to have a bank account
The bank is too far or transport is too expensive
I do not understand the advantages of bank account
BANKING PRODUCTS/USAGE (OF THOSE CURRENTLY
BANKED) (%)
45%
28%
18%
5%
4%
55%
39%
32%
24%
13%
8%
8%
7%
7%
5%
5%
36%
23%
17%
6%
6%
10% Drivers and barriers
10% of adults are banked in 2017
90% of adults are not banked in 2017
LANDSCAPE PRODUCTS
About 53 344 (0.4%) Cameroonian adults are using someone else’s bank account
21
Banking
Formal savings
Banked
Other formal (non-bank)
Informal
At home or secret place
Not saving
19%
5%
17%
29%
19%
48%6%
7%9%
2% 1%3%
10%
4%
12%
4%
REGIONS (%)
Yaoundé Douala North-West West South-West Centre
South Littoral North East Adamawa Far-North
MaleFemale
GENDER (%)42%
58%
LOCATION (%)
72%
Rural
Urban
28%
12% 48%21%14%5%
25% 18%
7%
Banked Informal Other formal(non-bank)
Notsaving
At home/secretplace only
15 - 24 years25 - 34 years35 - 44 years45 - 59 years
Above 60 years
14%
23%
33%
24%6%
AGE (%)
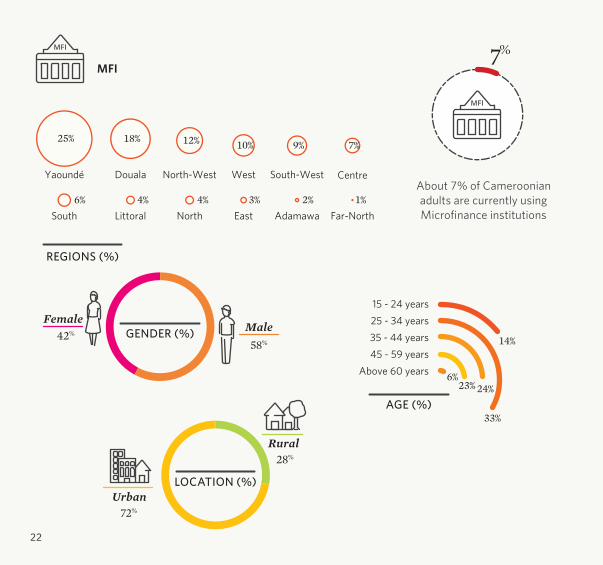
MFI
About 7% of Cameroonian adults are currently using Microfinance institutions
22
Formal savings
Banked
Other formal (non-bank)
Informal
At home or secret place
Not saving
19%
5%
17%
29%
19%
48%6%
7%9%
2% 1%3%
10%
4%
12%
4%
REGIONS (%)
Yaoundé Douala North-West West South-West Centre
South Littoral North East Adamawa Far-North
MaleFemale
GENDER (%)42%
58%
LOCATION (%)
72%
Rural
Urban
28%
12% 48%21%14%5%
25% 18%
7%
Banked Informal Other formal(non-bank)
Notsaving
At home/secretplace only
15 - 24 years25 - 34 years35 - 44 years45 - 59 years
Above 60 years
14%
23%
33%
24%6%
AGE (%)
LANDSCAPE PRODUCTS
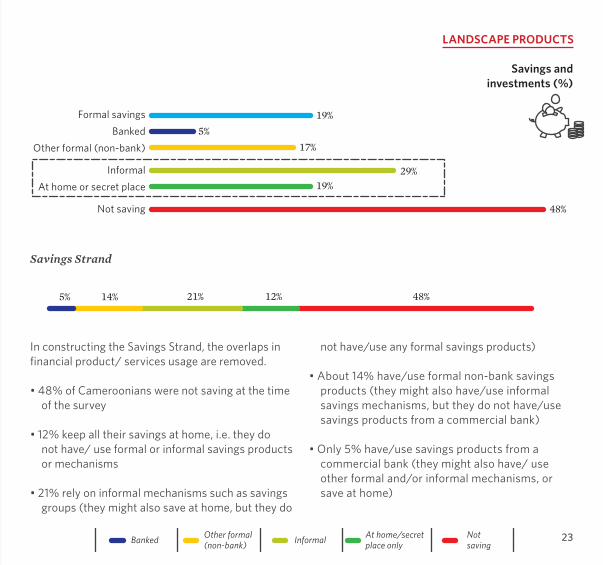
Savings and investments (%)
In constructing the Savings Strand, the overlaps in financial product/ services usage are removed.
• 48% of Cameroonians were not saving at the time of the survey
• 12% keep all their savings at home, i.e. they do not have/ use formal or informal savings products or mechanisms
• 21% rely on informal mechanisms such as savings groups (they might also save at home, but they do
not have/use any formal savings products)
• About 14% have/use formal non-bank savings products (they might also have/use informal savings mechanisms, but they do not have/use savings products from a commercial bank)
• Only 5% have/use savings products from a commercial bank (they might also have/ use other formal and/or informal mechanisms, or save at home)
Savings Strand
23
Banked Informal Other formal(non-bank)
At home/secretplace only
Not saving Banked Informal Other formal(non-bank)
Notsaving
At home/secretplace only
Yaoundé
South-West
North-West
South
Douala
Centre
West
Far-North
Adamawa
East
Littoral
North
13%15%33%13%
15%32%17%5%
6%38%15%2%
16%26%13%5%
9%20%22%9%
10%31%11%5%
6%18%13%5%
1%18%16%6%
12%
26%
31%
39%
40%
40%
43%
57%
17%22%2%1%
14%19%7%3%
10%18%11%4%
58%
58%
58%
59%
68%12%7%1%10% 40%30%12%8%
13% 51%16%16%4%
Male
Female
15 - 34 years
35 yearsand older
12% 44%20%18%6%
11% 51%23%11%4%
2%
53%
13%
26%
6%
Rural
9%
10%
41%
17%
23%
Urban
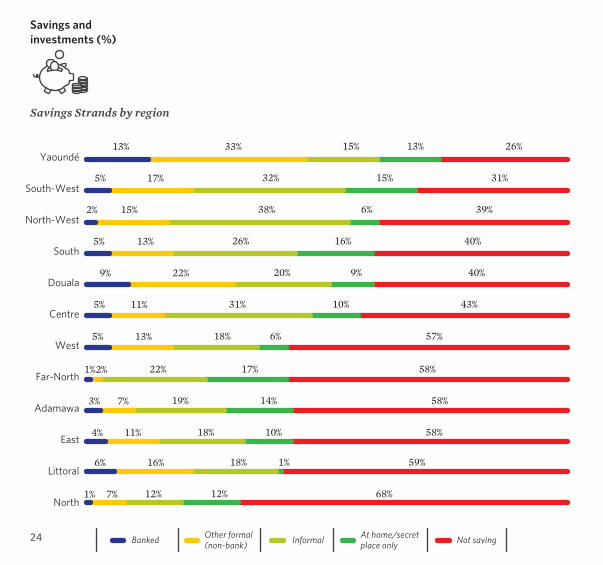
Savings Strands by region
Savings and investments (%)
24
Banked Informal Other formal(non-bank)
At home/secretplace only
Not saving Banked Informal Other formal(non-bank)
Notsaving
At home/secretplace only
Yaoundé
South-West
North-West
South
Douala
Centre
West
Far-North
Adamawa
East
Littoral
North
13%15%33%13%
15%32%17%5%
6%38%15%2%
16%26%13%5%
9%20%22%9%
10%31%11%5%
6%18%13%5%
1%18%16%6%
12%
26%
31%
39%
40%
40%
43%
57%
17%22%2%1%
14%19%7%3%
10%18%11%4%
58%
58%
58%
59%
68%12%7%1%10% 40%30%12%8%
13% 51%16%16%4%
Male
Female
15 - 34 years
35 yearsand older
12% 44%20%18%6%
11% 51%23%11%4%
2%
53%
13%
26%
6%
Rural
9%
10%
41%
17%
23%
Urban
LANDSCAPE PRODUCTS
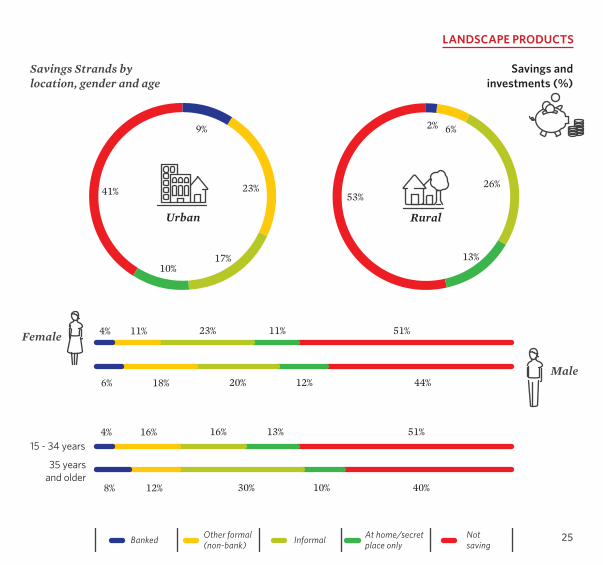
Savings Strands by location, gender and age
Savings and investments (%)
25

78%8%11%2% 1%
Formal credit
Banked
Other formal (non-bank)
Informal
Family/friends
Not borrowing
Banked Informal Other formal(non-bank)
Notborrowing
Family/friends only
Banked Informal Other formal(non-bank)
Family/friends only
Notborrowing
7% 73%15%1%4%
83%8%8%1%
Male
Female
15 - 34 years
35 yearsand older
9% 75%12%1%3%
82%6%10%2%
1%
80%
7%
11%1%
Rural
3%
7%
79%
10%1%
Urban
3%
2%
1%
11%
10%
78%
Credit Strand
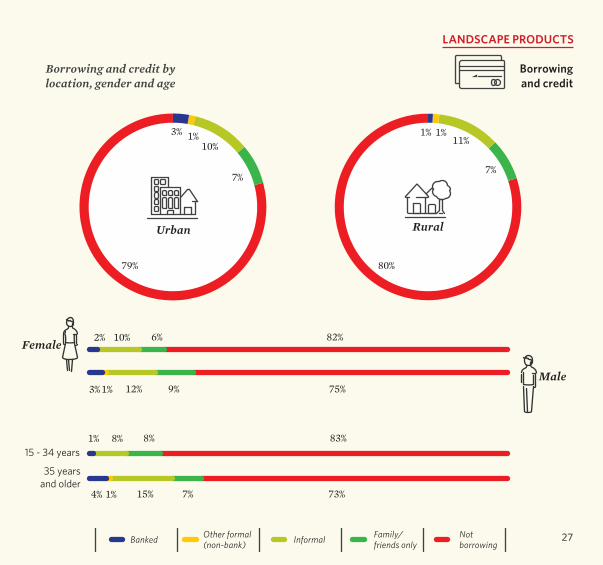
In constructing this strand, the overlaps in financial product/ services usage are removed.
• 78% claimed not to borrow at the time of the survey, neither from friends/family nor from formal/informal financial services providers
• 11% rely on informal mechanisms such as informal money- lenders (they do not
have any formal financial credit/loan products, but they might also borrow from friends and family)
• 8% rely on credit from family and friends
• 1% have/use credit/loan products from other formal (non- bank) institutions, but do not have credit/loan products from a bank (they could also
use informal credit/loan products and/or borrow from friends and family)
• 2% of adults have/use credit/ loan products from a commercial bank (however, they could also have other credit/loan products and/or borrow from friends and family but the defining characteristics are that they borrow from a bank)
Borrowing and credit
26
78%8%11%2% 1%
Formal credit
Banked
Other formal (non-bank)
Informal
Family/friends
Not borrowing
Banked Informal Other formal(non-bank)
Notborrowing
Family/friends only
Banked Informal Other formal(non-bank)
Family/friends only
Notborrowing
7% 73%15%1%4%
83%8%8%1%
Male
Female
15 - 34 years
35 yearsand older
9% 75%12%1%3%
82%6%10%2%
1%
80%
7%
11%1%
Rural
3%
7%
79%
10%1%
Urban
3%
2%
1%
11%
10%
78%
LANDSCAPE PRODUCTS
Borrowing and credit by location, gender and age
Borrowing and credit
27

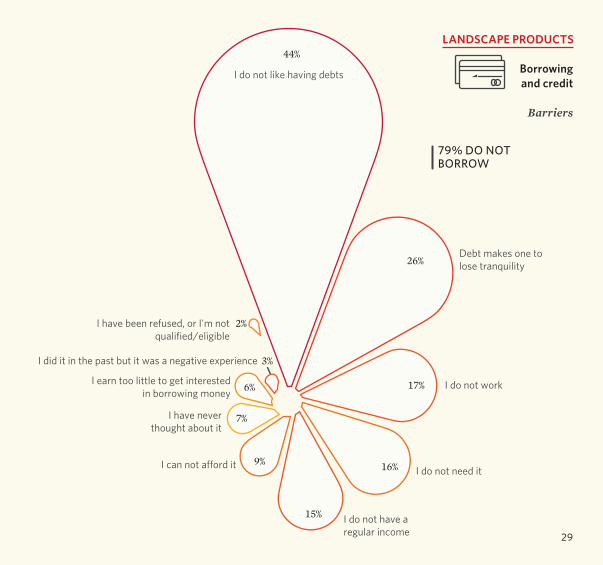
79% DO NOT BORROW
I do not like having debts
Debt makes one to lose tranquility
I do not work
I do not need it
I do not have a regular income
I can not a�ord it
I have never thought about it
I earn too little to get interested in borrowing money
I did it in the past but it was a negative experience
I have been refused, or I'm not qualified/eligible
Medical expenses either planned or emergency
Living expenses when you do not have
money at that time
An emergency other than medical
Purchase of agricultural products for trade
Starting or expanding my business or business activities of my household
Purchase or construction housing for habitation
18%
26%
16%9%
44%
15%
17%
2%
3%
6%
7%
2%
9%
23%
13%
7%
21% HAVE BORROWING/CREDIT PRODUCTS
Borrowing and credit
Drivers
28
79% DO NOT BORROW
I do not like having debts
Debt makes one to lose tranquility
I do not work
I do not need it
I do not have a regular income
I can not a�ord it
I have never thought about it
I earn too little to get interested in borrowing money
I did it in the past but it was a negative experience
I have been refused, or I'm not qualified/eligible
Medical expenses either planned or emergency
Living expenses when you do not have
money at that time
An emergency other than medical
Purchase of agricultural products for trade
Starting or expanding my business or business activities of my household
Purchase or construction housing for habitation
18%
26%
16%9%
44%
15%
17%
2%
3%
6%
7%
2%
9%
23%
13%
7%
21% HAVE BORROWING/CREDIT PRODUCTS
Borrowing and credit
LANDSCAPE PRODUCTS
Barriers
29
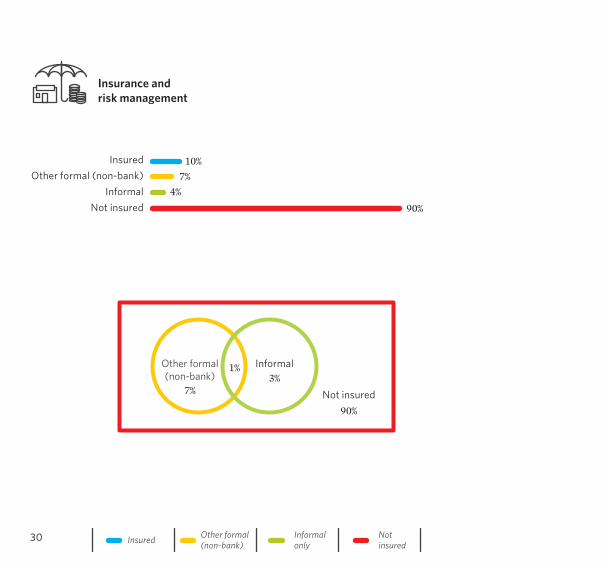
Of those without insurance (90%):
Insured
Other formal (non-bank)
Informal
Not insured
Total vehicle/ motorcycle insuranceLife assurance
Pension insuranceHealth or medical insurance
Partial vehicle/motorcycle insuranceGeneral liability insurance
10%
7%
4%
90%
InsuredInformalonly
Notinsured
Other formal(non-bank)
of adultshave insurance
of adults do not have any kind of financial product covering risk
Of those insured uptake of insurance products is driven by:
Main barriers to the uptake of insurance:
10% 90%
40%45%
14%18%19%
28%22%
17%
10%13%
33%
65%83%92%93%
33%
I have no income or regular jobDo not understand how insurance works
I earn too little to make it worthwhileDo not have enough knowledgeHave not heard about insurance
I have not thought of it yet
Have not heard of life insurance
Have not heard of education insurance
Are not aware of property damage
insurance
Have not heard of agricultural risk
insurance
Not insured
InformalOther formal (non-bank)
90%
3%7%
1%
Insurance and risk management
30

Of those without insurance (90%):
Insured
Other formal (non-bank)
Informal
Not insured
Total vehicle/ motorcycle insuranceLife assurance
Pension insuranceHealth or medical insurance
Partial vehicle/motorcycle insuranceGeneral liability insurance
10%
7%
4%
90%
InsuredInformalonly
Notinsured
Other formal(non-bank)
of adultshave insurance
of adults do not have any kind of financial product covering risk
Of those insured uptake of insurance products is driven by:
Main barriers to the uptake of insurance:
10% 90%
40%45%
14%18%19%
28%22%
17%
10%13%
33%
65%83%92%93%
33%
I have no income or regular jobDo not understand how insurance works
I earn too little to make it worthwhileDo not have enough knowledgeHave not heard about insurance
I have not thought of it yet
Have not heard of life insurance
Have not heard of education insurance
Are not aware of property damage
insurance
Have not heard of agricultural risk
insurance
Not insured
InformalOther formal (non-bank)
90%
3%7%
1%
Insurance and risk management
LANDSCAPE PRODUCTS
31

56%4%2%38%
Banked Informalonly
Other formal(non-bank)
Remitting via family/friends
Notremitting
Formal remittances
Banked
Other formal (non-bank)
Informal
Family/friends
Not remitting
0.2%
38%
38%
3%
5%
56%
Banked Informalonly
Other formal(non-bank)
Remitting via family/friends
Notremitting
Douala
Yaoundé
South
Centre
East
South-West
Littoral
West
North-West
Far-North
North
Adamawa
37%3%2%58%
38%2%1%59%
42%2%5%51%
44%7%2%47%
46%5%8%41%
54%6%1%39%
56%2%1%41%
59%7%1%33%
78%3%2%17%
77%4%2%17%
77%4%1%18%
58%3%4%35%
Remittances
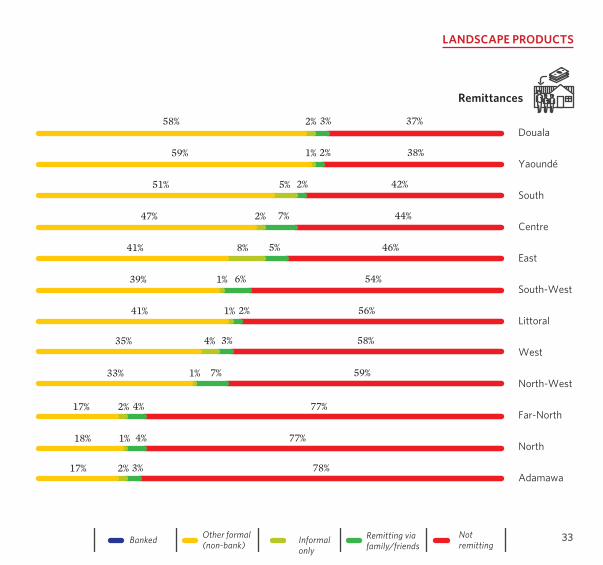
Remittances Strand
32
56%4%2%38%
Banked Informalonly
Other formal(non-bank)
Remitting via family/friends
Notremitting
Formal remittances
Banked
Other formal (non-bank)
Informal
Family/friends
Not remitting
0.2%
38%
38%
3%
5%
56%
Banked Informalonly
Other formal(non-bank)
Remitting via family/friends
Notremitting
Douala
Yaoundé
South
Centre
East
South-West
Littoral
West
North-West
Far-North
North
Adamawa
37%3%2%58%
38%2%1%59%
42%2%5%51%
44%7%2%47%
46%5%8%41%
54%6%1%39%
56%2%1%41%
59%7%1%33%
78%3%2%17%
77%4%2%17%
77%4%1%18%
58%3%4%35%
Remittances
LANDSCAPE PRODUCTS
33

Banked Informalonly
Other formal(non-bank)
Remitting via family/friends
Notremitting
22%
71%
5%
2%
53%42%
3% 2%
54%5%3%38%
58%3%2%37%
Male55%4%2%39%
58%4%2%36%
RuralUrban
Female
15 - 34 years
35 yearsand older
29% 26% 5%7%
3%3%3%3% 3% 3%
8%10%
YaoundéDouala
North-West
West
South-West
Centre
South Littoral
North
East Adamawa
Far-North
REGIONS (%)
MaleFemale
GENDER (%)46%
54%
LOCATION (%)
84%
Rural
Urban
16%
15 - 24 years25 - 34 years35 - 44 years45 - 59 years
60 years and above
39%
30%
15%13%3%
AGE (%)
Remittances
Remittance Strands by location, gender and age
34
Banked Informalonly
Other formal(non-bank)
Remitting via family/friends
Notremitting
22%
71%
5%
2%
53%42%
3% 2%
54%5%3%38%
58%3%2%37%
Male55%4%2%39%
58%4%2%36%
RuralUrban
Female
15 - 34 years
35 yearsand older
29% 26% 5%7%
3%3%3%3% 3% 3%
8%10%
YaoundéDouala
North-West
West
South-West
Centre
South Littoral
North
East Adamawa
Far-North
REGIONS (%)
MaleFemale
GENDER (%)46%
54%
LOCATION (%)
84%
Rural
Urban
16%
15 - 24 years25 - 34 years35 - 44 years45 - 59 years
60 years and above
39%
30%
15%13%3%
AGE (%)
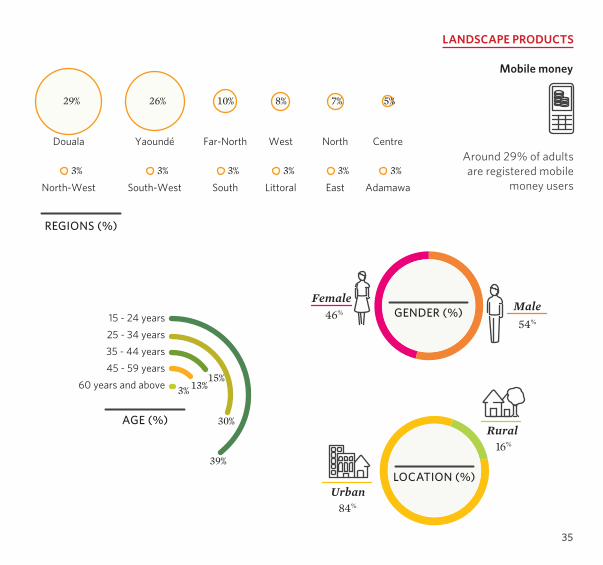
Mobile money
LANDSCAPE PRODUCTS
Around 29% of adults are registered mobile
money users
35

This is the most convenient(takes less time)
It is not expensiveI trust this means
It helps me to keep moneyPractical to pay bills
This is the only accessibleone in my community
I don’t have enoughinformation about it
Do not have a cell/mobile phoneI don’t have money to
send or receiveDo not have a sim card
I am not educated (I can’t use it)I have not thought about it
I don’t have access to a mobile phone/no network coverage
I am not interested in mobile money
There are no mobile moneyservice providers in my area
It is complicated
68%
48%
34%
31%
13%
13%
33%
6%
27%
6%
20%
7%
7%
13%
16%
13%
22
64
21
Transactional
63Remittances
Savings
Credit
47Mobile money
16Insurance
29% USE MOBILE MONEY SERVICES
71% DO NOT USE MOBILE MONEY SERVICES
3%
Mobile money
Drivers
Barriers
36
This is the most convenient(takes less time)
It is not expensiveI trust this means
It helps me to keep moneyPractical to pay bills
This is the only accessibleone in my community
I don’t have enoughinformation about it
Do not have a cell/mobile phoneI don’t have money to
send or receiveDo not have a sim card
I am not educated (I can’t use it)I have not thought about it
I don’t have access to a mobile phone/no network coverage
I am not interested in mobile money
There are no mobile moneyservice providers in my area
It is complicated
68%
48%
34%
31%
13%
13%
33%
6%
27%
6%
20%
7%
7%
13%
16%
13%
22
64
21
Transactional
63Remittances
Savings
Credit
47Mobile money
16Insurance
29% USE MOBILE MONEY SERVICES
71% DO NOT USE MOBILE MONEY SERVICES
3%
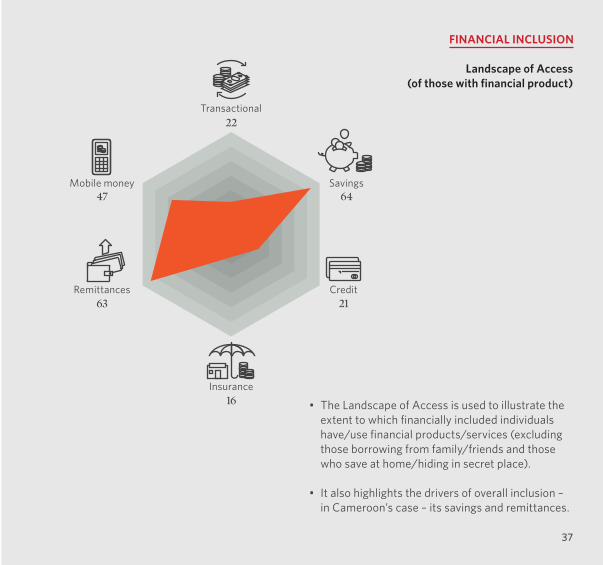
FINANCIAL INCLUSION
Landscape of Access(of those with financial product)
• The Landscape of Access is used to illustrate the extent to which financially included individuals have/use financial products/services (excluding those borrowing from family/friends and those who save at home/hiding in secret place).
• It also highlights the drivers of overall inclusion – in Cameroon’s case – its savings and remittances.
37
KEY FINDINGS
The FinScope Cameroon 2017 Study, revealed how the Cameroonians (15 years and older) manage their finances and elements that influence their access to financial services. The study also identified the role of formal and informal financial sectors in the financial environment of Cameroon. From this study, the following conclusions are drawn:
1. Almost 64% of the population (15 years and older) have access to financial services, both formal and informal. However there are disparities and levers that should act to enable a broader inclusion of the population. It therefore appears that:• 49% are served formally including banks and
other non-bank formal products and services;• 10% are served by banks;• 48% use other non-bank formal products and
services;• 36% use of non-formal mechanisms to manage
their finances; and• 36% are financially excluded.
2. Formal credit (3%) is not widely used in Cameroon, but seems to be a preference for informal credit (11%). Furthermore, about 8% are accessing credit from their family and friends.
3. The consumer education and financial literacy are real issues in Cameroon - mainly in the area of insurance, where most adults are not financially knowledgeable. In addition,• About 51% of adults indicated a need for financial
education, mainly seeking information on how to save and advantages of financial products;
• An additional 45% of adults do not seek financial advice anywhere and are trapped by lack of financial information;
• About 73% of adults seem to rely on their neighbours for assistance when facing financial difficulties.
4. Currently, only 29% are registered as mobile money users making it another financial inclusion lever. This is important as Mobile Money is a fairly new financial product.
5. Subscription of insurance is low at 10%. The main barriers to subscribe to insurance are issues related to the provision of information (for those without insurance):• 93% have not heard of the agricultural risk
insurance;• 92% are not aware of property damage insurance;
and• 65% are not aware of life insurance.
6. A total of 7% are using microfinance (MFI) products. Note that of the 7%, about 58% are men and 28% live in rural areas.
7. Approximately 44% make use of money transfer mechanisms - mainly through other formal (non-bank). Of all the financial products, the driver for financial inclusion is remittances and saving.
38
RECOMMENDATIONS
The priorities of financial inclusion in Cameroon should therefore ensure that the lives of the Cameroonian people are improved. To this end it should:
1. Mobile Money in Cameroon shows glimpse of hope as a mechanism to deliver financial services to the people. Build on the mobile money lessons learned in the countries of East Africa where M-Pesa was a successful product in enhancing financial inclusion.
2. Acting on the levers identified and work on the barriers for a more complete inclusion serving the grassroots.
3. Need for a National Financial Literacy strategy and programme to address issues related to consumer empowerment, consumer protection, financial knowledge and encourage good financial behaviour and practices. Financial capability is an enabler for adults to meaningfully engage with financial institutions.
4. Savings and credit can be used as financial solutions to help adults with their development goals –development goals such as starting a business, financing education expenses, etc. that has potential to deliver people out of poverty. Promoting access to credit (and savings) to provide opportunities to finance the means of production or opportunities to start a business or to buy agricultural equipment.
5. Formal financial inclusion is low in Cameroon, the survey results could be used to find innovative products tailored to the needs of those who are excluded.
Beyond financial inclusion, financial solutions should make people’s lives more easier and comfortable. The following are recommended of those with financial products/services :
1. Beyond access, the quality of inclusion should be considered – that is – are people really benefitting?
2. Account usage is yet another example to consider. Having an account on your own name does not mean they are using the account. More research is needed to further unpack the issues of dormancy and overall lack of usage of accounts.
3. Broadly, Cameroon ranks low on financial inclusion, if possible, ‘financial inclusion’ ought to be part of the national agenda.
39
SouthAfrica
Lesotho
Swaziland
Madagascar
Mauritius
RwandaBurundi
Uganda
Mozambique
Tanzania
Kenya
Ethiopia
Cameroon
Nigeria
GhanaCote d’Ivoire
TogoBenin
BurkinaFaso
Tunisia
EgyptPakistan
India
Nepal
Myanmar Laos
Thailand
Cambodia
DRC
Zimbabwe
Botswana
Namibia
Zambia
Repeat cycleFirst cycle
Potential first cycleUnderway
XAFFinScope footprint
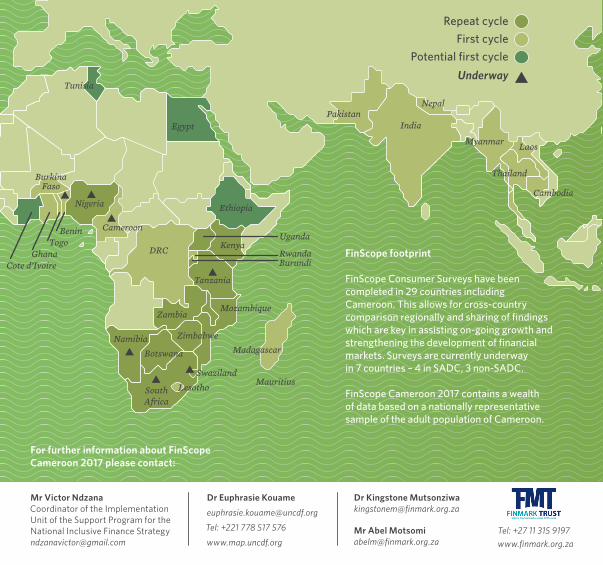
FinScope Consumer Surveys have been completed in 29 countries including Cameroon. This allows for cross-country comparison regionally and sharing of findings which are key in assisting on-going growth and strengthening the development of financial markets. Surveys are currently underway in 7 countries – 4 in SADC, 3 non-SADC.
FinScope Cameroon 2017 contains a wealth of data based on a nationally representative sample of the adult population of Cameroon.
Mr Abel [email protected]
Dr Kingstone [email protected]
Dr Euphrasie Kouame
Tel: +221 778 517 576
www.map.uncdf.orgTel: +27 11 315 9197
www.finmark.org.za
For further information about FinScope Cameroon 2017 please contact:
Mr Victor NdzanaCoordinator of the Implementation Unit of the Support Program for the National Inclusive Finance [email protected]