Embed Size (px)
Citation preview
Consumer Valuations of Beef Steak Food SafetyEnhancement in Canada, Japan, Mexico,
and the United States
Glynn T. Tonsor,1 Ted C. Schroeder,2 Joost M. E. Pennings3
and James Mintert4
1Assistant Professor, Department of Agricultural, Food, and Resource Economics, MichiganState University, 317-B Agriculture Hall, East Lansing, MI 48824 (corresponding author:
phone: 517-353-9848; fax: 517-432-1800; e-mail: [email protected]).2Professor, Department of Agricultural Economics, Kansas State University, 219 Waters
Hall, Manhattan, KS 66506 (phone: 785-532-4488; fax: 785-532-6925; e-mail: [email protected]).3Associate Professor, Department of Agricultural and Consumer Economics, University ofIllinois at Urbana-Champaign, and the AST Professor of Marketing & Decision Sciences at
Wageningen University, Tongersestraat 53, Room B1.13, 6211 LM Maastricht,The Netherlands (phone: +31-43-388-3934; fax: +31-43-388-4875;
e-mail: [email protected], [email protected]).4Professor, Department of Agricultural Economics, Kansas State University, 218 Waters
Hall, Manhattan, KS 66506 (phone: 785-532-1518; fax: 785-532-6925;e-mail: [email protected]).
Food safety concerns have had dramatic impacts on food and livestock markets in recent years. Weexamine consumer preferences for beef steak food safety assurances. We evaluate the extent to whichpreferences are heterogeneous within and across country-of-residence defined groups and examine thedistributional nature of preferences with respect to marginal improvements in food safety. Using mixedlogit models, we find that consumers in Canada, Japan, Mexico, and the United States have willingnessto pay preferences that are nonlinear in the level of food safety risk reduction. In particular, consumersin Japan and Mexico have preferences that are convex and consumers in Canada and the United Stateshave preferences concave in the level of food safety enhancement.
Les inquietudes entourant la securite alimentaire ont eu des repercussions considerables sur le marchedu betail et le marche des aliments au cours des dernieres annees. Nous avons examine les preferencesdes consommateurs concernant l’assurance de la securite alimentaire de la viande de bœuf. Nous avonsevalue dans quelle mesure les preferences des consommateurs etaient heterogenes au sein de groupesetablis selon le pays de residence et entre ces groupes, et avons examine la nature distributionnelle despreferences a l’egard des ameliorations marginales de la securite alimentaire. L’utilisation de modeleslogit mixtes nous a permis d’etablir que la volonte de payer des consommateurs du Canada, du Japon,du Mexique et des Etats-Unis etaient non lineaires lorsqu’il etait question de diminuer le degre derisque concernant la securite alimentaire. Les preferences des consommateurs du Japon et du Mexiqueetaient convexes, tandis que celles des consommateurs du Canada et des Etats-Unis etaient concaveslorsqu’il etait question d’accroıtre le niveau de securite alimentaire.
INTRODUCTION
Food safety is a growing global concern. Maintaining and gaining market access increas-ingly requires food safety assurances by food production and processing industries. Food
Canadian Journal of Agricultural Economics 57 (2009) 395–416
395
396 CANADIAN JOURNAL OF AGRICULTURAL ECONOMICS
safety management and regulation is receiving more direct involvement by governmentregulatory and inspection agencies and has gained considerable attention of policy mak-ers. Consumers are demanding increased food safety assurances as even isolated foodsafety events have caused major market disruptions. Beef markets have been particularlyadversely affected by food safety concerns in recent years. For example, discovery ofa beef cow in Canada and later in the United States infected with bovine spongiformencephalopathy (BSE) in 2003 caused immediate and long-lasting closure of many ma-jor North American beef export markets. Regaining global market access has requiredchanges in animal age verification, costly alterations to beef processing, product losses,and careful segregation of meat products (Coffey et al 2005). Intensive inspections coupledwith zero tolerance for a variety of food safety-related concerns, have made it challengingto maintain market access, even with a host of added food safety protocols, regulations,and frequent audits.
Enhancing food safety requires increased food production, processing, and handlingcosts (Muth et al 2003). Therefore, before large investments in food safety protocols,policies, and inspections are made, more information is needed regarding probable returnfrom these investments. That is, in order to determine appropriate investments in foodsafety management and monitoring, decision makers need to know, among many otherthings, how concerned consumers are about beef food safety, how much they will pay foradditional food safety assurances, and the size of concerned consumer segments. More-over, public policy formation can be improved by comprehension of consumer preferencesand corresponding willingness to pay (WTP) for food safety improvements. Accordingly,the primary objective of this study is to estimate consumer valuation of food safetyenhancements in beef steak. We focus on a single cut, beef strip steak, in our study forseveral reasons: (1) strip steak is a well-defined relatively homogeneous product consumedin each of the countries we study and thus needs little description to be recognized byconsumers and it is easy for consumers to assign a value to the product, (2) it is a productoften associated with North American grain fed beef, the focus of our study, and (3) theproduct can be more easily traced than comingled ground product from multiple animaland slaughter facility sources, making it easier to link to individual animals in food safetymanagement.
This research focuses on increasing our understanding of similarities and differ-ences in consumer perceptions and valuations for beef steak attributes in Canada, Japan,Mexico, and the United States. These four countries were, historically, the largest mar-kets for North American beef. Food safety-related policies of these countries have im-pacts on consumers in each of the countries. Given markedly different reactions in thesecountries to beef food safety events, they warrant investigation regarding differencesin preferences. The approach taken here provides an empirical measure of consumerheterogeneity in preferences within and across countries. The model relaxes commonassumptions of homogeneous preferences and marginal utility of income. Furthermore,this project evaluates trade-offs of nonmonetary attributes with food safety, examinesif food safety preferences are nonlinear in the level of risk reduction, and estimates thesize of consumer markets likely to buy enhanced beef steak products having variouspremiums.
CONSUMER VALUATIONS OF BEEF STEAK FOOD SAFETY 397
PREVIOUS RESEARCH AND OBJECTIVES
Research has documented a range of differences across counties in the challenges andapproaches governments face in regulating food safety. Brewster and Goldsmith (2007)outline different approaches to food safety regulation of the United States and UnitedKingdom. They note that while resulting food systems may be equally safe, food safetyregulations differ fundamentally. Batres-Marquez et al (2007) note that the Mexican gov-ernment has encouraged livestock producers to use federally inspected slaughter plantsthrough direct subsidies to producers. Dong and Jensen (2007) reveal China has struggledimplementing sanitary and phytosanitary measures that meet demands of more devel-oped countries. Zivin (2006) examined benefits of governments applying multiple foodsafety quality standards and found optimal standards to critically hinge on consumerperceptions of food safety risk. Ultimately a country’s food safety regulatory environ-ment reflects the sentiments of the countries consumers. Our work focuses on betterunderstanding heterogeneous consumer demand for food safety reflective of diverse per-ceptions among consumers.
Several studies have investigated what consumers are willing to pay to avoid orobtain various food attributes (Misra et al 1991, 1997; Burton et al 2001; Grannis andThilmany 2002; Lusk et al 2003; McCluskey et al 2003; Roosen 2003; Roosen et al2003; Alfnes 2004; Tonsor et al 2005; Loureiro and Umberger 2007). Some of thesestudies considered consumers in multiple countries (Lusk et al 2003; Tonsor et al 2005).Moreover, a few studies have focused on consumer WTP for food safety assurances orrisk reductions (Brown et al 2005; McCluskey et al 2005; Goldberg and Roosen 2007;Loureiro and Umberger 2007). Brown et al (2005) employed an experimental auction tovalue Canadian consumers’ WTP for reductions in risk of becoming ill from exposureto Campylobacter from a chicken sandwich. Using Vickrey second price auctions, theauthors found consumer WTP for lower Campylobacter risk to be decreasing functionsof the individual’s risk tolerance. Loureiro and Umberger (2007) used choice experimentsto examine U.S. consumer preferences for beef steak attributes. The authors found U.S.Department of Agriculture food safety inspection to be valued more than country-of-origin, traceability, or tenderness assurances.
In a study among German consumers, Goldberg and Roosen (2007) used bothcontingent valuation and choice experiment methods to examine consumer WTP forreductions in Salmonellosis and Campylobacter risk. WTP estimates based upon choiceexperiment methods were highly convex in the level of each risk reduction. That is,WTP increased more than proportionally with risk reductions. In contrast, WTP valuesobtained from contingent valuation questions were subadditive. McCluskey et al (2005)examined Japanese consumer reluctance to exchange money for BSE-tested beef. Usingchoice contingent valuation methods, the authors’ findings suggested that representativeJapanese consumers were willing to pay a 56% price premium for BSE-tested beef.
Each of these studies contributes to our understanding of consumer perceptionsof food safety risk in the meat industry. Our study extends previous work by allow-ing heterogeneous preferences across consumers, comparing consumers from differentcountries-of-residence, and utilizing a data collection method that allows consumers toreveal trade-offs between nonmonetary product attributes and food safety. In particular,heterogeneous preferences are evaluated (utilizing mixed logit models), in a multinational

398 CANADIAN JOURNAL OF AGRICULTURAL ECONOMICS
study that allows for cross-country comparisons important in understanding the interna-tional meat market complex. The employed choice experiment facilitates an evaluation ofconsumer willingness to trade food safety attributes for both monetary and nonmonetarytraits. In addition, the derived model relaxes the common assumption of homogeneousmarginal utility of income, allows empirical examination of nonlinearity in food safetypreferences in the level of risk reduction, and is used to estimate the size of consumermarkets likely to buy enhanced beef steak products priced with various premiums.
RESEARCH DESIGN: DATA COLLECTION AND CHOICE EXPERIMENT
This study uses a choice experiment to estimate WTP for beef steak attributes. Our sam-ple, drawn from consumers in Canada, Japan, Mexico, and the United States, representsa broad sample of consumers. To collect information about consumer perceptions andpreferences we conducted an online computer survey of consumers from households lo-cated in Canada (N = 1,002), Japan (N = 1,001), and the United States (N = 1,009). Thesame survey was conducted via in-person interviews in Mexico (N = 993). The Mexicosurveys were completed in-person because of limited computer access and/or use amongthe general population in Mexico. The fact that the Mexican surveys were conductedin-person as compared to electronically, could introduce bias into these responses relativeto the other three countries and this should be kept in mind as results for Mexico areinterpreted. The survey was translated into French (primarily for use in Quebec), Span-ish (for Mexico), and Japanese to accommodate different respondent languages acrosscountries.
The surveys were conducted through TNS NFO, a global market research company.TNS NFO has a vast consumer panel, with more than 5 million individuals worldwide intheir data bank. For our surveys, TNS NFO targeted the adult in each household mostfamiliar with household food shopping habits. Target respondents were older than 18 yearsof age and overall came from a representative distribution of household income levels.Ranking and choice questions were presented in randomized order across respondents toreduce question ordering biases. All surveys were completed between late February andearly March 2006.
In addition to sociodemographic information about each respondent, meat con-sumption habits, perceptions of food safety risk present when consuming beef, and amultitude of other factors were collected. Each respondent also completed a choice ex-periment designed to determine the amount consumers were willing to pay for variousbeef steak production, food safety, and product quality attributes. Combined, this infor-mation provides a comprehensive assessment of views and preferences of consumers fromfour different countries about beef steak attributes.
Choice experiments simulate real-life purchasing situations and permit multiple at-tributes to be evaluated, thus allowing researchers to estimate trade-offs among differentalternatives (Lusk et al 2003). In our study, consumers were presented with a set of 21simulated shopping scenarios, each of which involved choosing a preferred alternativefrom two beef strip loin steaks and a no purchase option.
Steaks were offered at four different price levels selected to be consistent with localretail prices. Representative retail strip loin prices for North American grain fed beef (i.e.,not dairy beef, not grass fed, and not Wagyu) at the time the survey was conducted in each

CONSUMER VALUATIONS OF BEEF STEAK FOOD SAFETY 399
Table 1. Steak product attributes and attribute levels evaluated in choice experiments
Product attribute Attribute label
Country-of-origin CanadaJapanMexicoUnited States
Production practice Approved standardsNatural
Tenderness UncertainAssured tender
Food safety assurance TypicalEnhanced 40%Enhanced 80%
Canada Japan Mexico United States(CAN $/lb) (Yen/100 grams) (Pesos/kg) ($U.S./lb)
Pricea 5.50 300.00 120.00 5.009.00 600.00 190.00 8.00
12.50 900.00 260.00 11.0016.00 1200.00 330.00 14.00
Note: aPrices differed by country to be consistent with local retail price ranges. Prior to derivingWTP estimates all prices were translated (using February/March 2006 exchange rates) to $US/lbequivalent units.
country were provided to us by Canadian Beef Export Federation marketing staff locatedin each country and confirmed by United States Meat Export Federation (Clayton 2006;Harada 2006; Pearson 2006; Ruiz 2006; Sakemoto 2006; Takemichi 2006). In additionto price, the steaks varied by country-of-origin, production practice, tenderness assur-ance, and food safety assurance (see Table 1). An orthogonal fractional design (Kuhfeldet al 1994) was used to select scenarios in which steak prices are uncorrelated, and whichallows for identification of own-price, cross-price, and alternative-specific effects. Thisprocess also allows the choice experiment to be of reasonable size for survey participants.An example choice scenario included in the choice experiment is
Steak attribute Option A Option B Option C
Price ($/lb) $14.00 $11.00 Neither A nor B is preferredCountry-of-origin United States CanadaProduction practice Natural NaturalTenderness Assured tender UncertainFood safety assurance Enhanced 80% Enhanced 40%I choose . . .
Though the choice experiments were hypothetical in that they did not include actualmoney or actual steak products, our instructions specifically stated “It is important that

400 CANADIAN JOURNAL OF AGRICULTURAL ECONOMICS
you make your selections like you would if you were actually facing these choices inyour retail purchase decisions.” This statement was included as part of a “cheap-talk”strategy at reducing hypothetical bias by informing survey participants of the conceptprior to conducting the choice experiment (Cummings and Taylor 1999; Lusk 2003).Furthermore, given that our principal interest is differences in marginal WTP amounts,we are less concerned with the hypothetical nature of our survey (Lusk and Schroeder2004). Descriptions included in the choice experiments of the specific product attributeswere:
Country-of-Origin refers to the country in which the cow was raised and includes Canada,Japan, Mexico, or the United States.
Production Practice is the method used to produce the cow where Approved Standardsmeans the cow was raised using scientifically determined safe and government-approved use of synthetic growth hormones and antibiotics (typical of cattle produc-tion methods used in United States and Canada); Natural is the same as typical exceptthe cow was raised without the use of synthetic growth hormones or antibiotics.
Tenderness refers to how tender the steak is to eat and includes Assured Tender that meansthe steak is guaranteed tender by testing the steak using a tenderness measuringinstrument and Uncertain means there are no guarantees on tenderness level ofthe steak and the chances of being tender are the same as typical steaks you havepurchased in the past.
Food Safety Assurance refers to the level of food safety assurance with the steak.Typical food safety means the steak meets current minimum government standards for
food safety. Enhanced 40% means measures have been taken to reduce risks of illnessassociated with food safety from consuming the product by 40% relative to typical.Enhanced 80% means measures have been taken to reduce risks of illness associatedwith food safety from consuming the product by 80% relative to typical.
While most existing food safety studies focus on one specific concern (e.g., Campy-lobacter by Brown et al (2005); BSE by McCluskey et al (2005)) our experimental designpurposely focuses more generally on general food safety risk associated with beef steakbecause consumers face an array of potential hazards every time they consume a product.We cast a wide net over food safety risk because we were interested generally in actionsthe beef industry supply chain or policy makers might take to improve food safety andusually such actions affect a broad set of potential hazards (e.g., federal inspection, trim-ming, steam pasteurization, hazard analysis critical control point plans in production andprocessing, animal production techniques, and food preparation and handling methods)and may be implemented as mandatory regulation or voluntary industry practices.
We did not provide specific details to participants on the “measures taken” to ensure40% and 80% reductions in food safety risks relative to standard practices because valuingparticular techniques (e.g., federal inspection) was not our interest. This research designis consistent with our principal focus of evaluating how consumers respond to beef steaklabeled to have 40% and 80% reductions in risks of illness from beef steak consumption.That is, we are more concerned with consumer valuations of steaks possessing theselabels than in risk reduction techniques that might be used to assure particular labels.1 Asnoted by a reviewer, direct food safety labels may not be appealing to some consumers.However, the most straightforward way to determine consumer WTP for food safety
CONSUMER VALUATIONS OF BEEF STEAK FOOD SAFETY 401
enhancement was to pose the question directly. If consumers reveal WTP for food safetyenhancements as presented directly in our study, then a valuable area for future research isto determine what types of product labels might be most desirable to provide food safetyenhancement perceptions to consumers. If consumers are not willing to pay for foodsafety enhancements as we presented them in our choice experiments, then consumerseither are not concerned about food safety enhancements or the enhanced food safetyassurance raised concerns in consumers’ minds.
A total of 4,005 respondents completed the survey across all four countries. Summarydata of selected demographic attributes of survey respondents are provided in Table 2.In Canada and Japan, male and female respondents were about equally split, whereas, inthe United States and Mexico, females represent about 80% of respondents. Respondentsin Canada, the United States, and Japan had an average age ranging from 42 to 49 yearsold whereas Mexican respondents were younger, averaging 31 years of age. Althoughrespondents in Mexico are younger than in the other three countries, this is consistentwith Census data on age distributions across these four countries (United States CensusBureau 2006).
Mexican respondents tend to have lower education and income levels than respon-dents from the other three countries, consistent with their younger age distribution. Morethan 20% of Canadian and U.S. respondents are categorized in the upper income level,whereas about 12% of Japanese and 11% of Mexican respondents are from their respectivehighest income categories.
Nearly all respondents are at least occasional beef consumers, but there is a lot ofvariability in the frequency of consumption. For example, more than 60% of respondentsin Canada, Mexico, and the United States consume beef at least two to three times perweek. This compares to just 30% of Japanese respondents consuming beef this often.
Developing effective supply chain management strategies and policies that deal withfood safety requires sound understanding of what consumers know (or perceive) aboutfood safety. Therefore, we asked a set of questions to inquire about the level of under-standing of the presence, probable impacts of, and sources of information that consumersuse as they assess beef food safety concerns. Table 2 includes a breakdown of responses tothe question How safe do you think beef steak is for your personal consumption? Canadianand American respondents generally believe beef steak products are safe with nearly 90%indicating steak to be Very Safe or Somewhat Safe for personal consumption. Japaneseand Mexican respondents perceive relatively higher-risk levels. For instance, over 10% ofeach population considers beef steak as Somewhat Unsafe or Not at all Safe compared to3% for Canadian and American consumers.
RESEARCH METHOD: RANDOM PARAMETERS LOGITAND WTP ANALYSIS
A random parameters logit (RPL) model (also known as a mixed logit) was used to deter-mine consumer WTP for the various steaks attributes of interest. The RPL model is welldocumented in the literature and allows for random taste variation within the surveyedpopulation, is free of the independence of irrelevant alternatives (IIA) assumption, andallows correlation in unobserved factors over time, thus eliminating three limitations ofstandard logit models (Revelt and Train 1998; Hensher and Greene 2003; Train 2003;

402 CANADIAN JOURNAL OF AGRICULTURAL ECONOMICS
Table 2. Demographic variables and summary statistics of choice experiment participants
Canadian Japanese Mexican U.S.Variable Definition consumers consumers consumers consumers
Gender 1 = Female; 0 = Male 0.52 0.49 0.80 0.83Total participants 1,002 1,001 993 1,009
Age Average age in years 47.7 41.8 31.1 48.9Education (Highest level completed)
1 = Less than high school graduate 1.70% 2.60% 31.01% 2.30%2 = High school graduate 30.40% 32.70% 16.72% 19.50%3 = Some college or technical 40.20% 25.40% 17.92% 38.80%
(no bachelor’s)4 = College bachelor’s graduate 17.00% 33.70% 25.98% 25.40%5 = Post-college graduate 7.30% 2.90% 8.26% 13.80%No response 3.40% 2.60% 0.10% 0.30%
Household income1 = Lower 10.20% 33.10% 35.70% 18.40%2 = Lower–middle 23.10% 21.10% 39.00% 17.90%3 = Middle 25.50% 21.20% 14.10% 14.60%4 = Middle–upper 19.20% 12.20% 11.30% 22.20%5 = Upper 22.10% 12.50% 0.00% 26.90%
Beef consumption frequency1 = 4 or more times per week 12.38% 3.10% 21.55% 17.74%2 = 2–3 times per week 47.80% 26.97% 45.62% 45.39%3 = Once per week 18.46% 29.37% 21.75% 20.32%4 = 2–3 times per month 9.98% 22.28% 7.45% 8.72%5 = Once per month or less 6.99% 16.08% 2.42% 5.35%6 = Never 4.39% 2.20% 1.21% 2.48%
Beef consumption frequency and income combinationsAt least weekly consumption & 24.48% 28.88% 65.42% 29.92%
lower–middle incomeAt least weekly consumption & 54.03% 30.22% 23.49% 53.68%
middle to upper incomeLess than weekly consumption & 8.68% 25.80% 9.17% 6.46%
low or lower–middle incomeLess than weekly consumption & 12.81% 15.11% 1.92% 9.94%
middle to upper incomePerceived safety of beef steak for personal consumption (Steak_Risk)
Very safe 45.60% 3.60% 16.30% 45.80%Somewhat safe 44.20% 46.40% 50.50% 42.00%Neither safe nor unsafe 7.10% 36.90% 22.90% 8.60%Somewhat unsafe 1.80% 10.60% 8.20% 2.40%Not at all safe 1.30% 2.60% 2.20% 1.20%
Notes: The income groups have country-specific ranges: Canada (Canadian Dollars): 1: ≤ $15,000,2: $15,000–$34,999, 3: $35,000–$59,999, 4: $60,000–$79,999, 5: ≥$80,000; Japan (Japanese Yen): 1:≤2,000,000, 2: 2,000,000–3,999,999, 3: 4,000,000–5,999,999, 4: 6,000,000–7,999,999, 5: ≥8,000,000;Mexico (Mexican Peso): 1: ≤4,000–6,000, 2: 7,000–21,000, 3: 22,000–54,000, 4: ≥55,000; UnitedStates (U.S. Dollars): 1: ≤$22,500, 2: $22,500–$39,999, 3: $40,000–$59,999, 4: $60,000–$89,999, 5:≥$90,000.

CONSUMER VALUATIONS OF BEEF STEAK FOOD SAFETY 403
Hensher et al 2006). In the context of our study, the RPL is appealing for a numberof reasons. First, some of the steak alternatives presented in our choice experimentare similar, possibly making the IIA assumption overly restrictive. Second, a growingamount of research suggests consumers possess heterogeneous preferences, so employinga model that allows for and evaluates preference heterogeneity is appropriate (Alfnesand Rickertsen 2003; Lusk et al 2003; Alfnes 2004; Tonsor et al 2005). Finally, the RPLmodel facilitates correlation in random parameters and hence a through evaluation ofrelationships in preferences across steak attributes.
Underlying the RPL model is the consumer’s random utility (U), in which the utilityof option j for individual i in choice situation t is described by
Ui jt = λ′i xi j t + εi j t (1)
where xijt is a vector of observed variables, λi is unobserved for each individual andvaries within the population with density f (λi | θ∗) where θ∗ are the true parameters ofthis distribution, and ε ijt is the stochastic error component independent and identicallydistributed over all individuals, alternatives, and choice situations (Revelt and Train 1998).As noted by Alfnes (2004), this describes a panel data model where the cross-sectionalelement is individual i and the time-series component is the t choice situations. TheRPL model is estimated by simulated maximum likelihood, requiring specification of theprobability of each individual’s selections. Let j(i,t) denote the alternative that individuali choose in period t. The unconditional probability of subject i’s selections is given by(Revelt and Train 1998)
Pi (θ∗) =∫ ∏
t
eλ′i xi j (i ,t)t∑
j
eλ′i xi j t
f (λi | θ∗) dλi (2)
The model estimated specifies the systematic portion of the utility function (Vijt) as
Vi jt = α′Pi j t + (β i + γ ′Zi)x j t ∀ j = A, B (3)
Vi jt = 0 j = C (4)
where Pijt is a 4 × 1 price vector; Zi is a 3 × 1 vector of individual i’s characteristics(Femalei, Educationi, and Steak Riski as defined in Table 2); x j t is a 8 × 1 vector of steak at-tributes (x j t = [Canada jt, U.S. j t, Japanjt, Mexicojt, Natural jt, Tender jt, FoodSafety40 j t,
FoodSafety80 j t], where Canadajt, U.S. j t, Japan jt, and Mexicojt are dummy variablesequal to one if the beef steak is labeled as originating from Canada, the United States,Japan, or Mexico, respectively (0 otherwise), Naturaljt, Tenderjt, FoodSafety40 j t, andFoodSafety80 j t are dummy variables equal to one if the alternative is labeled as being nat-urally produced, assured to be tender, has 40% enhanced food safety relative to standardpractices, and has 80% enhanced food safety, respectively (0 otherwise)); and α, β i, andγ are vectors containing 4, 8, and 24 parameters to be estimated, respectively.

404 CANADIAN JOURNAL OF AGRICULTURAL ECONOMICS
The inclusion of four price parameters follows the example of Train and Atherton(1995) and relaxes assumptions of homogeneous marginal utility of income while main-taining fixed price parameters. More specifically, we identified four combinations (seeTable 2) of consumers based upon binary segmentation of income and beef consump-tion frequency.2 Therefore, one element of Pijt in Equation (3) equals the price faced byindividual i in choice situation t for option j corresponding to the combination of theirincome and beef consumption frequency.
Inclusion of additional consumer information is facilitated by interaction of Zi
with x j t. This allows us to determine if preference heterogeneity persists beyond typicallyobserved factors (Revelt and Train 1998; Nahuelhual et al 2004). Furthermore, interactionwith steak attribute variables results in derived WTP estimates being functions of theincluded individual characteristics, an approach more consistent with economic theorythan many WTP approaches (e.g., Lusk et al 2003).
Given the objectives of this research, and to keep the model feasible for estimation, wespecify all price and interaction variables to be fixed within each resident-based populationand focus on heterogeneity in preferences for each of the eight steak attributes. That is,we allow β i in Equation (3) to vary within each population. It is important to note thatthese random coefficients could be correlated (Train 1998; Scarpa and DelGiudice 2004).For instance, consumers who are especially concerned with food safety might also beconcerned with country-of-origin. To investigate these important possibilities, we let β
represent the vector of steak attribute coefficients and specify β ∼ N(β,�). The resultingcoefficient vector is expressed as β = β + LM where L is a lower-triangular Choleskyfactor of � such that LL′ = �, and M is a vector of independent standard normal deviates(Revelt and Train 1998; Hensher and Greene 2003). Upon estimation, evaluation of theindividual elements in L allows for a better understanding of correlations in preferencesacross the steak attributes evaluated.
Coefficients themselves have little interpretive value in RPL models. However, rel-ative combinations of select coefficients provide economically meaningful insights onconsumer preferences. In particular, WTP for steak attributes can easily be calculated.Frequently (e.g., Nahuelhual et al 2004; Rigby and Burton 2005) mean WTP for re-spondents are calculated at mean valuations of model covariates (e.g., Z). However, thisapproach ignores the distribution of preferences around the mean of random parameters(i.e., elements of L). To relax this strong assumption, as well as consider statistical vari-ability in parameter estimates, we utilize simulation techniques consistent with Rigby andBurton (2005), Hensher and Greene (2003), and Hensher et al (2006). In particular, wespecifically follow (see p. 620) Hensher et al (2006) to consider both the entire distributionof WTP (rather than just mean and standard deviation) and statistical variability in pa-rameter estimates. While additional details are available from Hensher et al (2006, p. 620),our application of this procedure essentially requires making 1,000 draws of the modelparameters followed by 1,000 drawings, from each parameter vector draw, to captureheterogeneous preferences. Stated differently, the first 1,000 draws reflect statistical vari-ability and the second 1,000 draws captures preference variability. Desired statistics (e.g.,mean, proportion greater than a particular $premium/lb) and corresponding confidenceintervals are easily identified.
The simulated WTP statistics are utilized to empirically test for differences in WTPpreferences. First, mean WTP estimates and 95% confidence intervals are identified that
CONSUMER VALUATIONS OF BEEF STEAK FOOD SAFETY 405
incorporate both statistical and preference variability. Second, a combinational techniquesuggested by Poe et al (2005) is used to provide a simple nonparametric evaluation ofdifferences in WTP distributions. The difference between two simulated WTP series isevaluated with this difference being calculated for all possible combinations of the twoseries. In other words, 1,000,000 (1,000 × 1,000) differences (e.g., WTPa − WTPb ∀a, b;where a = 1, . . . , 1,000 and b = 1, . . . , 1,000) are calculated for each test. The proportionof simulated differences less than zero represents the probability that WTPa < WTPb.This combinational approach is more precise than simply evaluating if the 95% confidenceintervals previously mentioned overlap (Poe et al 2005).
Industry participants and regulators need information beyond knowledge of prefer-ences of the “average” consumer. Decision making can be notably enhanced with soundunderstanding of the proportion of a consumer population likely to purchase a givensteak product at different price premiums. For instance, if the cost of reducing food safetyrisk by 40% falls from $5.00/lb to $2.50/lb and there are no changes in markup overcosts, how many more consumers would be willing to purchase steak labeled to have a40% reduction in food safety risks? The simulation procedures provide us with a simpleway to answer this, and related questions. In particular, we estimate the proportion (andaccompanying 95% confidence intervals) of respondents having WTP premiums of atleast $0.00, $2.50, $5.00, $7.50, and $10.00. More specifically, the simulation procedureproduces a series of 1,000 estimates for the portion of the population willing to pay eachpremium. From this series, we identify the mean proportion and use the 2.5 percentileand 97.5 percentile values to construct 95% confidence intervals.
RESULTS
Prior to settling on the random utility model as specified in Equations (3)–(4), an arrayof alternative model specifications were considered. While the multitude of model speci-fication tests is not presented here for brevity; log likelihood tests consistently reject thehypothesis that preferences are jointly homogeneous or uncorrelated and the hypothesisthat the consumer characteristic interaction terms are jointly insignificant. Overall, modelfit of the utilized models (Table 3) was strong and consistent with other applications ofRPLs (e.g., Lusk et al 2003).3
Estimated models result in negative estimates for all the fixed price coefficients,except for infrequent beef consumers with high incomes in Mexico. For this group, whichcomprises less than 2% of our Mexican sample (Table 2), the price coefficient is notstatistically different from zero implying this consumer segment is price insensitive. Themost price sensitive consumers in Canada, Mexico, and the United States consume beefat least once per week and have relatively high household incomes. In contrast, the mostprice sensitive consumers in Japan are those who consume beef less than once a weekand have low income. The least price sensitive group in all four countries is the segmentof consumers who eat beef less regularly and have higher incomes. Approximately, 60%(Japan) to 88% (Mexico) of the consumers in each country indicated they consume beefat least once per week (Table 2).
A majority (23/32) of the estimated means for the random steak attribute parametersacross the four models were statistically significant (Table 3). By including interactionterms between steak attributes and individual characteristics we were able to account

406 CANADIAN JOURNAL OF AGRICULTURAL ECONOMICS
Table 3. Random parameters logit model estimates
Canadian Japanese Mexican U.S.Variable/Description consumers consumers consumers consumers
Random Parameters (Means):CANADA 3.7925∗ 1.3449∗ 0.9808∗ 3.2135∗
U.S. 1.9025∗ 0.3524 0.7550∗ 5.2469∗
JAPAN −0.6173∗ 2.7592∗ −0.0280 0.2864MEXICO −1.0688∗ 0.0472 1.7650∗ −2.0900∗
NATURAL −0.3637∗ 0.0228 0.0432 −1.0268∗
TENDER 1.4838∗ 1.1606∗ 0.9287∗ 1.7684∗
FOOD SAFETY 40 0.1892 0.3840∗ 0.2304 0.0733FOOD SAFETY 80 1.1069∗ 0.9950∗ 0.7113∗ 0.6338∗
Nonrandom Price Parameters for:Frequent Consumers, Low Income −0.1568∗ −0.0512∗ −0.0959∗ −0.2047∗
Frequent Consumers, High Income −0.1681∗ −0.0382∗ −0.0998∗ −0.2535∗
Infrequent Consumers, Low Income −0.1187∗ −0.0647∗ −0.0512∗ −0.1744∗
Infrequent Consumers, High Income −0.0788∗ −0.0172∗ −0.0063 −0.1733∗
Nonrandom Attribute∗Demographic Interaction Parameters:CANADA ∗ FEMALE −0.4541∗ −0.8322∗ −0.0897 −1.0502∗
CANADA ∗ EDUCATION 0.4668∗ 0.1325∗ 0.0747∗ 0.4488∗
CANADA ∗ STEAK_RISK −0.9104∗ −0.7154∗ −0.2614∗ −1.7766∗
U.S. ∗ FEMALE −0.7517∗ −1.5312∗ −0.2658∗ −0.7228∗
U.S. ∗ EDUCATION 0.4957∗ 0.1172 0.0328 0.3177∗
U.S. ∗ STEAK_RISK −0.9612∗ −1.3615∗ −0.3016∗ −1.6618∗
JAPAN ∗ FEMALE −1.3450∗ −0.5127∗ −0.2062 −1.3085∗
JAPAN ∗ EDUCATION 0.8651∗ 0.1523∗ 0.0327 0.7100∗
JAPAN ∗ STEAK_RISK −1.3662∗ −0.2924∗ −0.3021∗ −1.6406∗
MEXICO ∗ FEMALE −0.8585∗ −1.0860∗ −0.3120∗ −1.0190∗
MEXICO ∗ EDUCATION 0.5820∗ 0.1969∗ 0.1373∗ 0.5340∗
MEXICO ∗ STEAK_RISK −1.1966∗ −0.7466∗ −0.1004 −1.5415∗
NATURAL ∗ FEMALE 0.0442 −0.1948∗ 0.1535∗ 0.4705∗
NATURAL ∗ EDUCATION 0.0581 0.0016 −0.0087 0.0615∗
NATURAL ∗ STEAK_RISK 0.0538 0.0420 −0.0632∗ 0.3128∗
TENDER ∗ FEMALE 0.0588 −0.0924 −0.3679∗ 0.0232TENDER ∗ EDUCATION −0.1606∗ −0.0434 0.0568∗ −0.2130∗
TENDER ∗ STEAK_RISK −0.1580∗ −0.1180∗ 0.0519 −0.1217∗
FOOD SAFETY 40 ∗ FEMALE 0.4754∗ −0.0098 −0.2607∗ 0.5756∗
FOOD SAFETY 40 ∗ EDUCATION 0.0121 −0.0091 0.0999∗ −0.0903∗
FOOD SAFETY 40 ∗ STEAK_RISK −0.0106 −0.0971∗ −0.0329 0.0270FOOD SAFETY 80 ∗ FEMALE 0.6195∗ 0.0341 −0.3983∗ 0.6464∗
FOOD SAFETY 80 ∗ EDUCATION −0.0295 −0.1047∗ 0.1601∗ −0.1991∗
FOOD SAFETY 80 ∗ STEAK_RISK −0.2350∗ 0.1157∗ −0.0674 −0.0055Log likelihood −12,832.40 −12,759.90 −18,323.10 −13,934.80Pseudo R2 0.4254 0.4316 0.1994 0.3996
Notes: One asterisk indicates statistical significance at the 0.10 level. Models were estimatedusing NLOGIT 4.0, with Halton draws, and 250 replications for simulated probability. Appendixpresents Cholesky and correlation matrices for the model’s random parameters.
CONSUMER VALUATIONS OF BEEF STEAK FOOD SAFETY 407
for consumers with different sociodemographic status and perceptions on risk inherentin beef steak consumption, having different marginal utilities with respect to the steakattributes being analyzed. Most (ranging from 54% in the Mexican model to 88% in theU.S. model) of the interaction terms are statistically significantly different from zero (0.10level).
Interpretation of individual coefficients must be made with caution and is generallydiscouraged in random utility models (Scarpa and DelGiudice 2004). Caution is partic-ularly warranted in our models given differences in scales and the number of interactionterms between consumer characteristics and steak attributes. That is, while ceteris paribusinterpretation of the interaction effects is feasible (e.g., Alfnes 2004), it is not advisable inour model. For instance, making statements about the impact of gender (Female) on thepreferences for a steak attribute is based upon an unrealistic assumption of no correlationbetween other factors (e.g., Education and Steak_Risk).
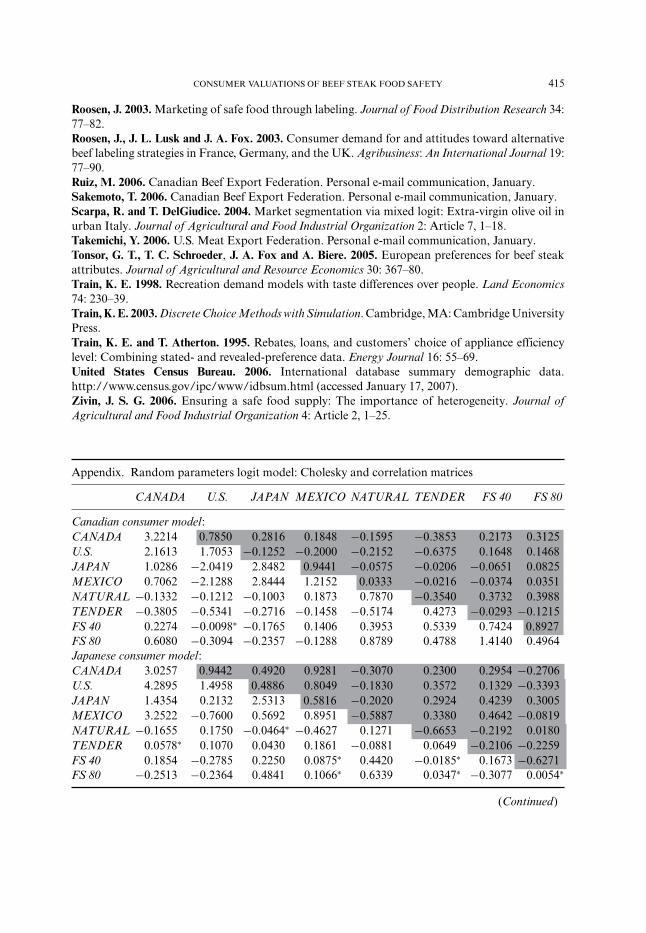
To further evaluate preference heterogeneity in our model that allows for corre-lation in random steak attribute parameters we examine estimated Cholesky matrices(Appendix). The diagonal values of each Cholesky matrix represent the true level of vari-ance for each random parameter once the cross-correlated parameters terms have beenunconfounded (Hensher et al 2006). This is an important distinction in our models. Forinstance, all eight random parameters were estimated to have statistically significant stan-dard deviation parameter estimates in each of the four models.4 However, the diagonalCholesky elements for Food Safety 80 in our Japanese consumer model and for bothTender and Food Safety 80 in our U.S. consumer model are not statistically significant(0.10 level). This implies that the statistically significant standard deviation parametersfor these variables are attributable to cross-correlations with other random parametersand not heterogeneity around the mean of each random parameter (Hensher et al 2006).That is, heterogeneity of these preferences (i.e., Japanese preferences for Food Safety80) manifest through relationships with other steak attributes and the interaction shiftvariables (Zi × xjt) incorporated in our model.
In contrast, a majority (29/32) of the diagonal Cholesky elements are statisticallysignificant (0.10 level). This is evidence of preference heterogeneity persisting for eachsteak attribute, even after incorporating consumer characteristics (via different price termsas well as interaction parameters) and allowing cross-correlations to exist across steakattribute parameters. For example, this suggests that preferences for a 40% enhancementin food safety (Food Safety 40) vary significantly within each population and that thisheterogeneity originates from factors beyond those incorporated in our model.
Examination of the off-diagonal elements of each Cholesky matrix overwhelminglyreveals statistically significant (0.10 level) estimates (Appendix). This suggests significantcross-correlations among the random parameter estimates would have been inappropri-ately confused within standard deviation estimates of each random parameter withoutCholesky matrix decomposition and evaluation.
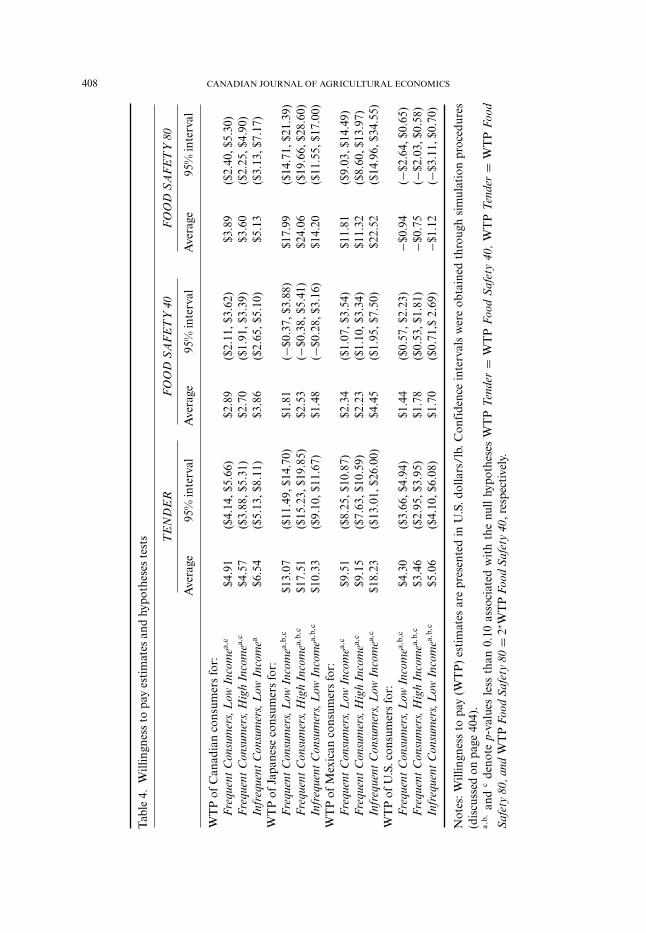
Of particular interest are estimates of consumer WTP and estimates of consumermarket size expected to pay various price premiums. We used simulation techniques toidentify 95% confidence intervals on WTP estimates. Resulting measures are presentedin Table 4 for beef guaranteed to be tender, and possessing food safety risk reductionassurances of 40% and 80%. Strong preferences for steak tenderness were revealed forconsumers in all four countries with 95% confidence intervals consistently being positive.5
408 CANADIAN JOURNAL OF AGRICULTURAL ECONOMICS
Tab
le4.
Will
ingn
ess
topa
yes
tim
ates
and
hypo
thes
este
sts T
EN
DE
RF
OO
DS
AF
ET
Y40
FO
OD
SA
FE
TY
80
Ave
rage
95%
inte
rval
Ave
rage
95%
inte
rval
Ave
rage
95%
inte
rval
WT
Pof
Can
adia
nco
nsum
ers
for:
Fre
quen
tCon
sum
ers,
Low
Inco
mea,
c$4
.91
($4.
14,$
5.66
)$2
.89
($2.
11,$
3.62
)$3
.89
($2.
40,$
5.30
)F
requ
entC
onsu
mer
s,H
igh
Inco
mea,
c$4
.57
($3.
88,$
5.31
)$2
.70
($1.
91,$
3.39
)$3
.60
($2.
25,$
4.90
)In
freq
uent
Con
sum
ers,
Low
Inco
mea
$6.5
4($
5.13
,$8.
11)
$3.8
6($
2.65
,$5.
10)
$5.1
3($
3.13
,$7.
17)
WT
Pof
Japa
nese
cons
umer
sfo
r:F
requ
entC
onsu
mer
s,L
owIn
com
ea,b,
c$1
3.07
($11
.49,
$14.
70)
$1.8
1(−
$0.3
7,$3
.88)
$17.
99($
14.7
1,$2
1.39
)F
requ
entC
onsu
mer
s,H
igh
Inco
mea,
b,c
$17.
51($
15.2
3,$1
9.85
)$2
.53
(−$0
.38,
$5.4
1)$2
4.06
($19
.66,
$28.
60)
Infr
eque
ntC
onsu
mer
s,L
owIn
com
ea,b,
c$1
0.33
($9.
10,$
11.6
7)$1
.48
(−$0
.28,
$3.1
6)$1
4.20
($11
.55,
$17.
00)
WT
Pof
Mex
ican
cons
umer
sfo
r:F
requ
entC
onsu
mer
s,L
owIn
com
ea,c
$9.5
1($
8.25
,$10
.87)
$2.3
4($
1.07
,$3.
54)
$11.
81($
9.03
,$14
.49)
Fre
quen
tCon
sum
ers,
Hig
hIn
com
ea,c
$9.1
5($
7.63
,$10
.59)
$2.2
3($
1.10
,$3.
34)
$11.
32($
8.60
,$13
.97)
Infr
eque
ntC
onsu
mer
s,L
owIn
com
ea,c
$18.
23($
13.0
1,$2
6.00
)$4
.45
($1.
95,$
7.50
)$2
2.52
($14
.96,
$34.
55)
WT
Pof
U.S
.con
sum
ers
for:
Fre
quen
tCon
sum
ers,
Low
Inco
mea,
b,c
$4.3
0($
3.66
,$4.
94)
$1.4
4($
0.57
,$2.
23)
−$0.
94(−
$2.6
4,$0
.65)
Fre
quen
tCon
sum
ers,
Hig
hIn
com
ea,b,
c$3
.46
($2.
95,$
3.95
)$1
.78
($0.
53,$
1.81
)−$
0.75
(−$2
.03,
$0.5
8)In
freq
uent
Con
sum
ers,
Low
Inco
mea,
b,c
$5.0
6($
4.10
,$6.
08)
$1.7
0($
0.71
,$2.
69)
−$1.
12(−
$3.1
1,$0
.70)
Not
es:W
illin
gnes
sto
pay
(WT
P)
esti
mat
esar
epr
esen
ted
inU
.S.d
olla
rs/l
b.C
onfi
denc
ein
terv
als
wer
eob
tain
edth
roug
hsi
mul
atio
npr
oced
ures
(dis
cuss
edon
page
404)
.a,b
,an
dc
deno
tep-
valu
esle
ssth
an0.
10as
soci
ated
wit
hth
enu
llhy
poth
eses
WT
PTe
nder
=W
TP
Food
Saf
ety
40,
WT
PTe
nder
=W
TP
Food
Saf
ety
80,a
ndW
TP
Food
Saf
ety
80=
2∗ WT
PFo
odS
afet
y40
,res
pect
ivel
y.

CONSUMER VALUATIONS OF BEEF STEAK FOOD SAFETY 409
Estimates of mean WTP for tenderness assurance varied for frequent (at least weekly)beef consumers from $3.46/lb for U.S. consumers with high income to $17.51/lb forJapanese consumers with high income. The average WTP of $17.51/lb may seem highrelative to those of consumers in the other three countries. However, this WTP estimateapplies to approximately 30% of Japanese consumers (Table 2) and grain fed beef striploin steak price in Japan is two to three times that of similar U.S. steak prices (Clayton2006; Sakemoto 2006). Therefore, the estimated premium for assured tender steak inJapan is similar in percentage to that of the other three countries. For less frequent (lessthan once per week) beef consumers of low income, mean WTP for tenderness assurancevaried from $5.06/lb for U.S. consumers to $10.33/lb for Japanese consumers.
Table 4 also presents estimates of consumer WTP for beef steaks that have differentlevels of food safety enhancements. Average WTP for 40% enhancements in food safetyrelative to standard practices is statistically positive for Canadian, Mexican, and U.S. con-sumers and not different from zero for Japanese consumers. Estimates for average WTPfor a 40% enhancement in food safety ranged for frequent beef consumers from $1.81/lbfor low-income Japanese consumers to $2.89/lb for low-income Canadian consumers.For less frequent, low-income beef consumers, average estimates ranged from $1.48/lbfor Japanese consumers to $4.45/lb for Mexican consumers.
In comparison, average WTP for 80% enhancements in food safety are statisticallypositive for Canadian, Japanese, and Mexican consumers and not different from zerofor U.S. consumers. Average WTP for an 80% food safety enhancement by frequentbeef consumers ranged from –$0.75/lb for high-income U.S. consumers to $24.06/lb forhigh-income Japanese consumers. Preferences of less frequent beef consumers for 80%enhancements in food safety range in mean WTP from –$1.12/lb for low-income U.S.consumers to $22.52/lb for low-income Mexican consumers.6
To further investigate consumer preferences regarding nonmonetary trade-offs, wecompare consumer WTP for tenderness with each level of food safety enhancementassurance and also evaluate the distribution of marginal preferences for incrementaladjustments in food safety risk reduction. Table 4 includes superscripts denoting resultsof corresponding nonparametric tests. Consumers in all four countries are willing to paysignificantly more for assured tender steak than for a 40% enhancement in food safety.However, as food safety is enhanced further to 80%, consumers in Japan are statisticallywilling to pay more for the enhanced food safety than for tenderness assurance, U.S.consumers are willing to pay more for tenderness assurance, while Canadian and Mexicanconsumers are willing to pay similar amounts for the two assurances.
Table 4 also provides insight into the distribution of marginal utilities for the typicalconsumer in each country for food safety enhancements. In particular, we tested whetherconsumer WTP for an 80% enhancement in food safety was greater than twice thepremium consumers would pay for a 40% enhancement. This test reveals whether WTP forfood safety enhancements are convex, linear, or concave in the level of safety enhancement.
Japanese and Mexican consumers are willing to pay significantly more than twice for80% food safety enhancement relative to what they would pay for a 40% enhancement.That is, their preferences are convex in the level of beef steak food safety enhance-ment. Conversely, Canadian and U.S. consumers are willing to pay significantly less thantwice the premium for 80% relative to 40% food safety enhancements, suggesting a con-cave WTP beef steak food safety enhancement relationship. Collectively, this suggests
410 CANADIAN JOURNAL OF AGRICULTURAL ECONOMICS
that if constraints (e.g., state of technology, capital, etc.) are restricting such that onlya 40% food safety enhancement is feasible, then investments targeting Canadian andthen U.S. consumers are advisable. Conversely, if 80% enhancements in food safety arepossible, investments targeting Japanese and then Mexican consumers provide the mostopportunity.
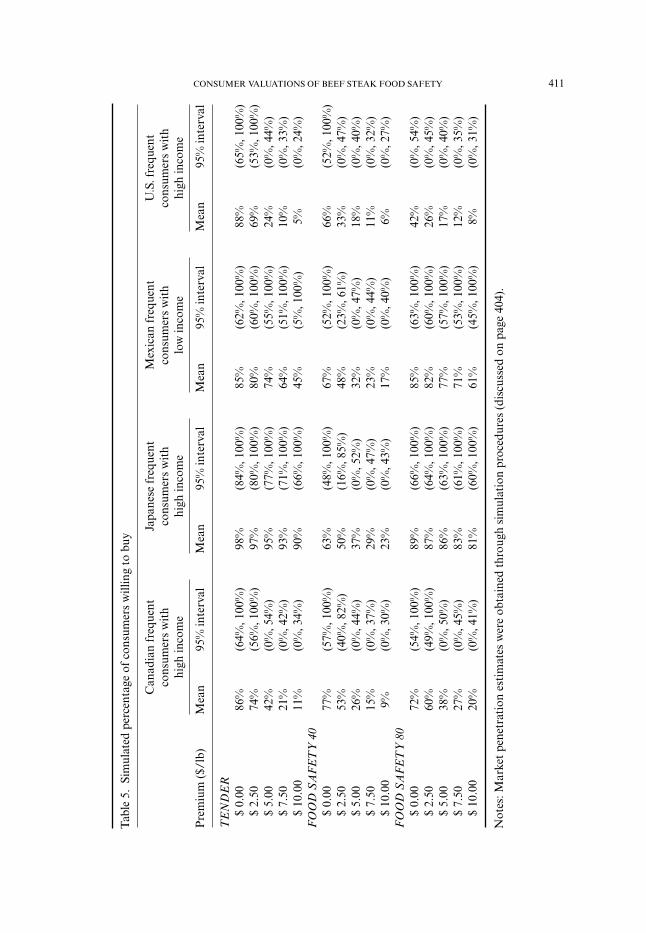
Our analysis concludes by deriving estimates of the size of consumer markets likelyto buy enhanced beef steak products priced with varying premiums. In particular, Table 5presents estimates of the proportion (and accompanying 95% confidence intervals) ofeach consumer population WTP premiums of at least $0.00 to $10.00 per pound (in $2.50increments) for each attribute of interest. Table 5 only presents results for the largestsegment (Table 2) of each country group. Based upon 95% confidence intervals, we expectat least 53% (lower tail of distribution) of each consumer segment to be willing to paya $2.50/lb premium for tenderness assurance. However, market size estimates fall topossibly zero for Canadian and U.S. consumer segments if the premium rises to $5.00/lb.
Market size predictions for product labeled to have 40% less food safety risks revealthat, even if free, Japanese market share may be the smallest. Furthermore, if a premiumof $5.00/lb is required, there may not be a viable consumer market in any of the four coun-tries. Likely market sizes for steak labeled to have 80% less food safety risks are notablystronger for Japanese and Mexican consumers. For instance, even at a $5.00/lb premium,our model predicts at least 63% and 57% of Japanese and Mexican consumers, respec-tively, are willing to purchase the product. Conversely, at a $5.00/premium Canadian andU.S. markets may be nonexistent.
POLICY IMPLICATIONS
Our analysis indicates Canadian and U.S. consumers have concave preferences for foodsafety enhancements and Japanese and Mexican consumers have convex preferences.These differences, especially when operating with incomplete information regarding thecost structure associated with food safety enhancement, are vital to note in policy decisionsregarding beef food safety. Differences in preference structures of targeted consumergroups is a contributing factor in why the optimal provision of food safety enhancementlikely varies both across and within each country. Moreover, preference differences areconsistent with the range of alternative responses (i.e., border closures and trade conflicts)to beef food safety events implemented by the four countries in our study.
Estimates of “food safety enhancement” costs are difficult to obtain as one wouldneed, at the minimum, a thorough understanding of the procedures enacted to enhancefood safety vertically throughout the supply chain and how effective targeted consumerswould perceive such procedural changes. Future advancements on these and relatedissues will further enhance the contributions of this study. An overriding point of thisstudy is that the value of investing in additional food safety assurances rests heavily onthe preference structures of heterogeneous consumers being targeted, the relative amountand effectiveness of food safety enhancement consumers perceive by the investment, andthe cost structure associated with implementing the proposed food safety enhancementprocedures. Accordingly, decision makers in each country need to prudently recognizethese differences in deriving policies that influence food safety.
CONSUMER VALUATIONS OF BEEF STEAK FOOD SAFETY 411
Tab
le5.
Sim
ulat
edpe
rcen
tage
ofco
nsum
ers
will
ing
tobu
y
Can
adia
nfr
eque
ntJa
pane
sefr
eque
ntM
exic
anfr
eque
ntU
.S.f
requ
ent
cons
umer
sw
ith
cons
umer
sw
ith
cons
umer
sw
ith
cons
umer
sw
ith
high
inco
me
high
inco
me
low
inco
me
high
inco
me
Pre
miu
m($
/lb)
Mea
n95
%in
terv
alM
ean
95%
inte
rval
Mea
n95
%in
terv
alM
ean
95%
inte
rval
TE
ND
ER
$0.
0086
%(6
4%,1
00%
)98
%(8
4%,1
00%
)85
%(6
2%,1
00%
)88
%(6
5%,1
00%
)$
2.50
74%
(56%
,100
%)
97%
(80%
,100
%)
80%
(60%
,100
%)
69%
(53%
,100
%)
$5.
0042
%(0
%,5
4%)
95%
(77%
,100
%)
74%
(55%
,100
%)
24%
(0%
,44%
)$
7.50
21%
(0%
,42%
)93
%(7
1%,1
00%
)64
%(5
1%,1
00%
)10
%(0
%,3
3%)
$10
.00
11%
(0%
,34%
)90
%(6
6%,1
00%
)45
%(5
%,1
00%
)5%
(0%
,24%
)F
OO
DS
AF
ET
Y40
$0.
0077
%(5
7%,1
00%
)63
%(4
8%,1
00%
)67
%(5
2%,1
00%
)66
%(5
2%,1
00%
)$
2.50
53%
(40%
,82%
)50
%(1
6%,8
5%)
48%
(23%
,61%
)33
%(0
%,4
7%)
$5.
0026
%(0
%,4
4%)
37%
(0%
,52%
)32
%(0
%,4
7%)
18%
(0%
,40%
)$
7.50
15%
(0%
,37%
)29
%(0
%,4
7%)
23%
(0%
,44%
)11
%(0
%,3
2%)
$10
.00
9%(0
%,3
0%)
23%
(0%
,43%
)17
%(0
%,4
0%)
6%(0
%,2
7%)
FO
OD
SA
FE
TY
80$
0.00
72%
(54%
,100
%)
89%
(66%
,100
%)
85%
(63%
,100
%)
42%
(0%
,54%
)$
2.50
60%
(49%
,100
%)
87%
(64%
,100
%)
82%
(60%
,100
%)
26%
(0%
,45%
)$
5.00
38%
(0%
,50%
)86
%(6
3%,1
00%
)77
%(5
7%,1
00%
)17
%(0
%,4
0%)
$7.
5027
%(0
%,4
5%)
83%
(61%
,100
%)
71%
(53%
,100
%)
12%
(0%
,35%
)$
10.0
020
%(0
%,4
1%)
81%
(60%
,100
%)
61%
(45%
,100
%)
8%(0
%,3
1%)
Not
es:M
arke
tpe
netr
atio
nes
tim
ates
wer
eob
tain
edth
roug
hsi
mul
atio
npr
oced
ures
(dis
cuss
edon
page
404)
.
412 CANADIAN JOURNAL OF AGRICULTURAL ECONOMICS
CONCLUSION
Food safety concerns have had dramatic impacts on food and livestock markets in recentyears. Furthermore, food safety assurances deemed to stabilize these markets and satisfyconsumer demand are costly endeavors to implement. Despite this, relatively little researchhas examined consumer preferences for various beef steak food safety assurances. Inparticular, the literature is sparse in evaluating the extent to which such preferences areheterogeneous within and across country-of-residence defined groups and in examiningthe distributional nature of these preferences with respect to marginal improvements infood safety.
This article addresses these issues by examining an array of beef steak preferencesamong consumers in Canada, Japan, Mexico, and the United States. Particular attentionis devoted to evaluating how much and how many representative consumers in eachcountry are willing to pay for marginal improvements in beef steak food safety while alsoexamining the extent of preference heterogeneity and allowing for nonmonetary trade-offswith food safety.
Japanese and Mexican consumers have preferences that are convex in the level ofbeef steak food safety enhancement while U.S. and Canadian consumers have concavepreferences. Optimal investment strategies hinge critically upon both consumer percep-tion of actual food safety improvements and the distributional relationship describingthe targeted consumer segment’s trade-off function between WTP premiums and riskreduction levels. Moreover, the effectiveness of food safety policies in each country pivotson recognition of these differences among consumers within and across countries.
If consumers view proposed investments as only marginally improving food safety(and investment costs are similar), the beef industry may be better off investing in producteating characteristics, such as improved tenderness. Conversely, if the targeted consumergroup perceives food safety investments as significantly reducing the level of food safetyrisk, such investments become more viable options, particularly if targeting Canadian,Japanese, or Mexican consumers. These investment inferences also have implications forpublic policy in these four countries. For instance, this work suggests that policies thatCanadian, Japanese, or Mexican consumers view as only marginally improving foodsafety may not be as acceptable as equivalent policies would be to U.S. consumers.
Results showed that within a country there is significant heterogeneity in consumerpreferences regarding food safety assurance attributes. Further research may help identifyother factors driving this heterogeneity. Improved knowledge of factors motivating con-sumer behavior with respect to food safety would help policy makers identify segment-specific food safety activities that would be far more effective than a one size fits allstrategy.
Improved knowledge of costs that will be incurred by the beef industry to provide ad-ditional food safety assurances could set the stage for valuable extensions of this research.An array of challenges exist in obtaining such information, which are further compoundedby the fact that diverse consumer segments perceive alternative food safety risk to be ofvarying importance. Nonetheless, future work could seek to enhance understanding offactors influencing the supply of additional food safety assurances utilizing the resultspresented here pertaining to consumer demand for these attributes. Moreover, future re-search could examine other beef products (i.e., ground beef), other meats, and nonmeatfood to determine whether our findings generalize beyond beef steak preferences.

CONSUMER VALUATIONS OF BEEF STEAK FOOD SAFETY 413
NOTES1Survey respondents were presented with a set of questions inquiring about their understandingand perceptions regarding microbiological beef food safety hazards prior to them completing thechoice experiments, so they were likely conditioned with this topic on their minds as they completedthe choice experiments. Moreover, future work could evaluate the sensitivity of product labelingeffects to the specific measures used in providing food safety assurances.2The lowest two income groups (Table 2) were identified as “low income” consumers while thelowest three beef consumption frequency groups were characterized as “frequent consumers.”3Models were estimated using NLOGIT 4.0 (Greene 2008), with Halton draws, and 250 replicationsfor simulated probability. Each estimated model was robust to adjustments in starting values andthe number of replications once at least 100 were being used.4These standard deviations, while provided by NLOGIT, are not presented. In the context of corre-lated random parameters, these standard deviation parameters are not independent and Choleskydecomposition should be used to identify proper standard deviation terms (Hensher et al 2006).5This comment, and those hereinafter, is made in omission of preferences by Mexican, infrequentbeef consumers with high incomes. As noted previously, this group is price insensitive and henceinterpretation of WTP statistics is not deemed useful.6To further examine WTP distributions, a normal kernel density estimator (Hensher and Greene2003) was used to generate density plots of each attribute in each income/consumption segmentof each country. While not presented here for brevity, these plots are available upon request. Insummary, the density plots for 80% food safety risk reduction WTPs are notably more dispersed inall four consumer segments than that of assured tenderness or 40% food safety risk reductions.
ACKNOWLEDGMENTS
Funding support from the National Beef Industry Development Fund managed by CanFax Re-search Services is greatly appreciated. We also acknowledge helpful comments from the editor andtwo anonymous reviewers. Any errors are the responsibility of the authors.
REFERENCES
Alfnes, F. 2004. Stated preferences for imported and hormone-treated beef: Application of a mixedlogit model. European Review of Agricultural Economics 31: 19–37.Alfnes, F. and K. Rickertsen. 2003. European consumers’ willingness to pay for U.S. beef in experi-mental auction markets. American Journal of Agricultural Economics 85: 396–405.Batres-Marquez, S. P., R. L. Clemens and H. H. Jensen. 2007. Mexico’s changing pork industry:The forces of domestic and international market demand. Choices 22: 7–12.Brewster, N. A. T. and P. D. Goldsmith. 2007. Legal systems, institutional environment, and foodsafety. Agricultural Economics 36: 23–38.Brown, J., J. A. L. Cranfield and S. Henson. 2005. Relating consumer willingness-to-pay for foodsafety to risk tolerance: An experimental approach. Canadian Journal of Agricultural Economics53: 249–63.Burton, M., D. Rigby, T. Young and S. James. 2001. Consumer attitudes to genetically modifiedorganisms in food in the U.K. European Review of Agricultural Economics 28: 479–98.Clayton, P. 2006. U.S. Meat Export Federation. Personal e-mail communication, January.Coffey, B., J. Mintert, J. Fox, T. Schroeder and L. Valentin. 2005. The Economic Impact of BSE onthe U.S. Beef Industry: Product Value Losses, Regulatory Costs, and Consumer Reactions (ExtensionBulletin MF-2678). Manhattan, KS: Kansas State University Agricultural Experiment Station andCooperative Extension Service.

414 CANADIAN JOURNAL OF AGRICULTURAL ECONOMICS
Cummings, R. G. and L. O. Taylor. 1999. Unbiased value estimates for environmental goods:A cheap talk design for the contingent valuation method. American Economic Review 89: 649–65.Dong, F. and H. H. Jensen. 2007. Challenges for China’s agricultural exports: Compliance withsanitary and phytosanitary measures. Choices 22: 19–24.Goldberg, I. and J. Roosen. 2007. Scope insensitivity in health risk reduction studies: A comparisonof choice experiments and the contingent valuation method for valuing safer food. Journal of Riskand Uncertainty 34: 123–44.Grannis, J. and D. Thilmany. 2002. Marketing natural pork: An empirical analysis of consumers inthe mountain region. Agribusiness: An International Journal 18: 475–89.Greene, W. 2008. NLOGIT Version 4.0 Reference Guide. Plainview, NY: Econometric Software, Inc.Harada, S. 2006. U.S. Meat Export Federation. Personal e-mail communication, January.Hensher, D. A. and W. H. Greene. 2003. The mixed logit model: The state of practice. Transportation30: 133–76.Hensher, D. A., J. M. Rose and W. H. Greene. 2006. Applied Choice Analysis. Cambridge, UK:Cambridge University Press.Kuhfeld, W. F., R. D. Tobias and M. Garratt. 1994. Efficient experimental design with marketingresearch applications. Journal of Marketing Research 31: 545–57.Loureiro, M. L. and W. J. Umberger. 2007. A choice experiment model for beef: What US con-sumer responses tell us about relative preferences for food safety, country-of-origin labeling, andtraceability. Food Policy 32: 496–514.Lusk, J. 2003. Effects of cheap talk on consumer willingness-to-pay for golden rice. AmericanJournal of Agricultural Economics 85: 840–56.Lusk, J., J. Roosen and J. Fox. 2003. Demand for beef from cattle administered growth hormonesor fed genetically modified corn: A comparison of consumers in France, Germany, the UnitedKingdom, and the United States. American Journal of Agricultural Economics 85: 16–29.Lusk, J. L. and T. C. Schroeder. 2004. Are choice experiments incentive compatible? A test withquality differentiated beef steaks. American Journal of Agricultural Economics 86: 467–82.McCluskey, J. J., K. M. Grimsrud, H. Ouchi and T. I. Wahl. 2003. Consumer response to geneticallymodified food products in Japan. Agricultural and Resource Economics Review 32: 222–31.McCluskey, J. J., K. M. Grimsrud, H. Ouchi and T. I. Wahl. 2005. Bovine spongiform encephalopathyin Japan: Consumers’ food safety perceptions and willingness to pay for tested beef. AustralianJournal of Agricultural and Resource Economics 49: 197–209.Misra, S., D. Grotegut and K. Clem. 1997. Consumer attitude toward recombinant porcine soma-totropin. Agribusiness 13: 11–20.Misra, S. K., C. L. Huang and S. L. Ott. 1991. Consumer willingness to pay for pesticide-free freshproduce. Western Journal of Agricultural Economics 16: 218–27.Muth, M. K., M. K. Wohlgenant, S. A. Karns and D. W. Anderson. 2003. Explaining plant exit inthe U.S. meat and poultry industries. Journal of Agricultural and Food Industrial Organization 1:Article 7, 1–21.Nahuelhual, L., M. L. Loureiro and J. Loomis. 2004. Using random parameters to account forheterogeneous preferences in contingent valuation of public open space. Journal of Agricultural andResource Economics 29: 537–52.Pearson, M. 2006. Canadian Beef Export Federation. Personal e-mail communication, January.Poe, G. L., K. L. Giraud and J. B. Loomis. 2005. Computational methods for measuring thedifference of empirical distributions. American Journal of Agricultural Economics 87: 353–65.Revelt, D. and K. Train. 1998. Mixed logit with repeated choices: Households’ choices of applianceefficiency level. Review of Economics and Statistics 80: 647–57.Rigby, D. and M. Burton. 2005. Preference heterogeneity and GM food in the UK. European Reviewof Agricultural Economics 32: 269–88.
CONSUMER VALUATIONS OF BEEF STEAK FOOD SAFETY 415
Roosen, J. 2003. Marketing of safe food through labeling. Journal of Food Distribution Research 34:77–82.Roosen, J., J. L. Lusk and J. A. Fox. 2003. Consumer demand for and attitudes toward alternativebeef labeling strategies in France, Germany, and the UK. Agribusiness: An International Journal 19:77–90.Ruiz, M. 2006. Canadian Beef Export Federation. Personal e-mail communication, January.Sakemoto, T. 2006. Canadian Beef Export Federation. Personal e-mail communication, January.Scarpa, R. and T. DelGiudice. 2004. Market segmentation via mixed logit: Extra-virgin olive oil inurban Italy. Journal of Agricultural and Food Industrial Organization 2: Article 7, 1–18.Takemichi, Y. 2006. U.S. Meat Export Federation. Personal e-mail communication, January.Tonsor, G. T., T. C. Schroeder, J. A. Fox and A. Biere. 2005. European preferences for beef steakattributes. Journal of Agricultural and Resource Economics 30: 367–80.Train, K. E. 1998. Recreation demand models with taste differences over people. Land Economics74: 230–39.Train, K. E. 2003. Discrete Choice Methods with Simulation. Cambridge, MA: Cambridge UniversityPress.Train, K. E. and T. Atherton. 1995. Rebates, loans, and customers’ choice of appliance efficiencylevel: Combining stated- and revealed-preference data. Energy Journal 16: 55–69.United States Census Bureau. 2006. International database summary demographic data.http://www.census.gov/ipc/www/idbsum.html (accessed January 17, 2007).Zivin, J. S. G. 2006. Ensuring a safe food supply: The importance of heterogeneity. Journal ofAgricultural and Food Industrial Organization 4: Article 2, 1–25.
Appendix. Random parameters logit model: Cholesky and correlation matrices
CANADA U.S. JAPAN MEXICO NATURAL TENDER FS 40 FS 80
Canadian consumer model:CANADA 3.2214 0.7850 0.2816 0.1848 −0.1595 −0.3853 0.2173 0.3125U.S. 2.1613 1.7053 −0.1252 −0.2000 −0.2152 −0.6375 0.1648 0.1468JAPAN 1.0286 −2.0419 2.8482 0.9441 −0.0575 −0.0206 −0.0651 0.0825MEXICO 0.7062 −2.1288 2.8444 1.2152 0.0333 −0.0216 −0.0374 0.0351NATURAL −0.1332 −0.1212 −0.1003 0.1873 0.7870 −0.3540 0.3732 0.3988TENDER −0.3805 −0.5341 −0.2716 −0.1458 −0.5174 0.4273 −0.0293 −0.1215FS 40 0.2274 −0.0098∗ −0.1765 0.1406 0.3953 0.5339 0.7424 0.8927FS 80 0.6080 −0.3094 −0.2357 −0.1288 0.8789 0.4788 1.4140 0.4964Japanese consumer model:CANADA 3.0257 0.9442 0.4920 0.9281 −0.3070 0.2300 0.2954 −0.2706U.S. 4.2895 1.4958 0.4886 0.8049 −0.1830 0.3572 0.1329 −0.3393JAPAN 1.4354 0.2132 2.5313 0.5816 −0.2020 0.2924 0.4239 0.3005MEXICO 3.2522 −0.7600 0.5692 0.8951 −0.5887 0.3380 0.4642 −0.0819NATURAL −0.1655 0.1750 −0.0464∗ −0.4627 0.1271 −0.6653 −0.2192 0.0180TENDER 0.0578∗ 0.1070 0.0430 0.1861 −0.0881 0.0649 −0.2106 −0.2259FS 40 0.1854 −0.2785 0.2250 0.0875∗ 0.4420 −0.0185∗ 0.1673 −0.6271FS 80 −0.2513 −0.2364 0.4841 0.1066∗ 0.6339 0.0347∗ −0.3077 0.0054∗
(Continued)

416 CANADIAN JOURNAL OF AGRICULTURAL ECONOMICS
Appendix. Continued
CANADA U.S. JAPAN MEXICO NATURAL TENDER FS 40 FS 80
Mexican consumer model:CANADA 1.8335 0.5354 0.5312 0.6190 0.6987 −0.5282 −0.0980 −0.1488U.S. 1.3938 2.1987 0.8301 0.4035 0.6661 0.1033 0.6315 0.4478JAPAN 1.4135 1.7193 1.4583 0.2494 0.8467 −0.1125 0.4740 0.3450MEXICO 1.3641 0.1881 −0.5410 1.6335 0.3196 −0.2506 0.2139 0.1470NATURAL 0.1906 0.0943 0.1255 −0.0109∗ 0.1154 −0.1821 0.3829 0.3259TENDER −0.6557 0.5675 −0.2883 −0.0330∗ 0.3953 0.7406 0.6482 0.6607FS 40 −0.1153 0.9532 0.0060∗ 0.3281 0.5013 0.1958 0.2575 0.7530FS 80 −0.2160 0.9065 0.0544∗ 0.3820 0.7108 0.3803 −0.6169 0.2427
U.S. consumer model:CANADA 3.1106 −0.7228 −0.8534 −0.6765 0.3326 0.3485 0.2308 0.0938U.S. −2.0906 1.9986 0.8374 0.7798 −0.3276 −0.2616 −0.3441 −0.0672JAPAN −3.1945 1.1949 1.5428 0.9591 −0.2950 −0.1842 −0.2141 −0.0212MEXICO −3.8876 2.4184 3.4507 0.3943 −0.2045 −0.0135 −0.1315 0.0525NATURAL 0.4266 −0.1619 0.0905 0.5828 1.0435 0.2442 0.5992 0.4615TENDER 0.3467 −0.0140∗ 0.2842 0.8222 −0.3291 0.0664∗ 0.4614 0.2980FS 40 0.3649 −0.4055 0.2482 0.8834 0.4374 −0.8942 0.6076 0.6727FS 80 0.2131 0.0021∗ 0.3227 1.0046 0.6130 −1.7482 −0.7561 0.0121∗
Notes: The lower, left-hand and diagonal elements present Cholesky matrix components; theupper, right-hand corner (shaded) elements are correlation statistics.U.S., FS 40, and FS 80 represent United States, Food Safety 40, and Food Safety 80, respectively.One asterisk indicates estimates are NOT statistically significant at the 0.10 level.