Embed Size (px)
Citation preview
UNIVERSITA’ CATTOLICA DEL SACRO CUORE PIACENZA
Scuola di Dottorato per il Sistema Agro-alimentare
Doctoral School on the Agro-Food System
cycle XXII
S.S.D: AGR 15, AGR 13
Consumers’ exposure assessment of pesticide residues in food: current status and future
perspectives in Lombardy
Candidate: Alessandro Marino CHIODINI Matr. n.: 3580176
Academic Year 2008/2009
UNIVERSITA’ CATTOLICA DEL SACRO CUORE
PIACENZA
Scuola di Dottorato per il Sistema Agro-alimentare
Doctoral School on the Agro-Food System
cycle XXII
S.S.D: AGR 15, AGR 13
Consumers’ exposure assessment of pesticide residues in food: current status and future
perspectives in Lombardy
Candidate: Alessandro Marino CHIODINI Matr. n.: 3580176
Coordinator: Ch.mo Prof. Gianfranco PIVA _______________________________________
Tutor: Prof. Marco Trevisan
Navigare necesse

R
3
TABLE OF CONTENTS
ABSTRACT ......................................................................................................................................... 4
INTRODUCTION ............................................................................................................................... 5
EUROPEAN PESTICIDE LE GISLATION ................................................................................. 7REGULATION (EC) 91/414 ..... .................................................................................................................. 8
REGULATION (EC) 396/2005 .................................................................................................................. 8
SETTINGS OF MRL................................ .....................................................................................................10
SUSTAINABLE USE OF PESTICIDES...... ...............................................................................................11
EUROPEAN OFFICIAL CONTROL P LAN ...............................................................................................12
ITALIAN OFFICIAL CONTROL P LAN .......................................................................................................17
CURRENT SCENARIO IN ITALY ...............................................................................................................18
MONITORING OLOMBARDY (ITA
F PESTICIDE RESIDUES IN PRODUCTS OF PLANT ORIGIN IN LY) .....................................................................................................................20
INTRODUCTION ....................... .....................................................................................................................21
MATERIAL S AND METHODS .....................................................................................................................22
RESULTS ........... .............................................................................................................................................24
CONCLUSIONS .............................................................................................................................................34
MONITORIN IN LOMBAR
G OF PESTICIDE RESIDUES IN ORGANIC FOOD OF PLANT ORIGINDY (ITALY) ...............................................................................................................35
ABSTRACT ......... ............................................................................................................................................35
INTRODUCTION ....................... .....................................................................................................................36
MATERIAL S AND METHODS.....................................................................................................................38
RESULTS ........... .............................................................................................................................................40
CONCLUSIONS ............. ................................................................................................................................45
ACKNOWLEDGMENTS ................................................................................................................................46
DETERMINISTIC RISK ASSESSMENT ..................................................................................47INTRODUCTION ....................... .....................................................................................................................48
MATERIAL S AND METHODS.....................................................................................................................55
RESULTS ........... .............................................................................................................................................60
CONCLUSIONS .............................................................................................................................................71
PROBABILISTIC RISK ASSESSMENT ..................................................................................73INTRODUCTION ....................... .....................................................................................................................73
MATERIALS AND METHODS..... ................................................................................................................84
RESULTS AND CONCLUSIONS ................................................................................................................87
OVERALL CONCLUSIONS ........................................................................................................99
EFERENCES ..............................................................................................................................104
4
Abstract
The presented thesis describes the results of the pesticide monitoring
programme in Lombardy Region from 1996 to 2008 and analyses the data
gathered to calculate consumer exposure assessment with different
approaches. A total of 9387 samples were analysed and the number of
irregular samples was equal to 1%. The number of samples without residues
was 69% and the number of samples with residues within the MRL was 30%.
A further step to understand the exposure of consumers to residue of
pesticides was obtained with the use of a deterministic approach developed
by EFSA (PRIMo Model). It was found that among the detected irregular
samples, only 31 might cause harm to the health of the consumer. An
additional step was constituted by the use of one probabilistic method (Creme
Software) to calculate the cumulative exposure of pesticides for the
consumers. As a first step, residues of Chlorprofam were plotted in the
software on samples of potato. In addition, samples containing residues of
Organophosphates were also plotted along with the Italian consumption data.
In both the case studies, the probabilistic acute cumulative assessment
indicated that the intake, for adults and toddlers was below the set
toxicological endpoint.

5
Introduction
Pesticides are designed to control biological organisms. The same
chemical properties that control pests may also harm humans thus there may
be a risk to human health if people are exposed to pesticides. For pesticides
there are three main routes of exposure into the human body – dermal
exposure, inhalation and ingestion.
The aim of this thesis is: to review the legislation framework adopted
by the European Union to evaluate the risk from dietary pesticide exposure
before and after the placing of plan protection products in the market
(chapters 1 and 2). In addition, the monitoring of pesticide residues in plants
of organic origin is described in chapter 3. In order to focus on the dietary
exposure assessment, current methods highlighting their pros and cons in
terms of transparency and communication to consumers and risk managers
were analysed. Finally two series of case studies are reported in chapters 4
and 5 to illustrate the application of those methods using data of the
monitoring programme of pesticides performed in Lombardy Region from
1996 to 2008.
In particular, the first chapter of this thesis will introduce the Directive
91/414/EEC concerning the placing of plant protection products in the market
and Regulation 396/2005/EEC with reference to maximum residue levels of
pesticides in or on food and feed of plant and animal origin, amending Council
Directive 91/414/EEC. In order to give a more comprehensive overview the
European Monitoring of Pesticide Residues in Products of Plant Origin is
reported in a dedicated section with particular reference to the Italian Control
Plan of Residues of Plant Protection Product in foods of Plant Origin regulated
by the Decree of the Ministry of Health of 23 December 1992.
The second chapter provides a summary of the data gathered by the
12 local health units where the food samples were collected and analysed in
the past years in Lombardy.
A sub-section of the database regards samples of foodstuffs coming
from biological agriculture, which are analysed in the third chapter of the
6
thesis. In particular, this work was previously published in the Journal of
Environmental Science and reported here for the sake of completeness.
In the fourth chapter of the thesis, the EFSA PRIMO Model was used
to obtain acute and chronic dietary exposure assessment for the Italian
population who had consumed foodstuffs analyzed for pesticide
contamination in Lombardy from 1996-2008.
The fifth chapter refined the exposure assessment process by using
the probabilistic software (Creme Software) considering three data sets. The
first case study was conducted on one active substance (Chlorpropham) with
one commodity (potato). The second case study consisted of an assessment
of the impact, on the health of consumers, of the single active substance
(Chlorpyrifos) combined with all the food commodities (where it was
detected). A third level of aggregation was assessed considering the
cumulative effects of Organophosphates looking at a common mechanism of
action (inhibition of Acetylcholine esterase).
Results from the previous chapters were merged in a concluding
section where the different aspects of monitoring programme of pesticides in
Lombardy and the assessments of the exposure on the consumers were
illustrated. In addition, some recommendations were given on how to
implement the strategy of sampling and how to interpret the results obtained
from the various models of exposure.

7
E
uropean Pesticide Legislation
Pesticides are used to protect crops before and after harvest from
infestation by pests and plant diseases. A possible consequence of their use
may be the presence of pesticide residues in the treated products.
It is necessary to ensure that such residues should not be found in food
or feed at levels presenting unacceptable risks to humans. Maximum Residue
Levels (MRLs) were therefore set by the European Commission to protect
consumers from exposure to unacceptable levels of pesticides residues in
food and feed (91/414/EEC).
In the European Union (EU), as from 1st September 2008, a new
legislative framework Regulation (EC) No 396/2005 of the European
Parliament on pesticide residues is applicable. This Regulation completes the
harmonisation and simplification of pesticide MRLs, whilst ensuring better
consumer protection throughout the EU. With the new rules, MRLs undergo a
common EU assessment to make sure that all classes of consumers,
including the vulnerable ones, like babies and children, are sufficiently
protected (396/2005/EEC).
Until 1st September 2008, the legislation for pesticide residues was a
shared responsibility of the Commission and the Member States. Since 1976,
more than 45.000 Community MRLs have been set for various commodities
for 245 pesticides on cereals (Directive 86/362/EEC), foodstuff of animal
origin (Directive 86/363/EEC), fruit and vegetables and other plant products
(Directive 76/895/EEC and Directive 90/642/EEC). For the tens of thousands
of pesticide/commodity combinations for which no Community MRLs existed,
Member States could set MRLs at national level to facilitate trade and to
protect the health of their consumers.
However, safety of consumers in one country does not necessarily mean
that all consumers in the EU are protected because food consumption
patterns differ from one Member State to another. Nowadays food and feed
circulate freely in the EU internal market, and therefore it is indispensable to
assure that all EU consumers are equally protected from the exposure to
unacceptable levels of pesticides in their food.

8
Regulation (EC) 91/414
The evaluation, marketing and use of pesticides (herbicides,
insecticides, fungicides etc.) in plant protection in the Community are
regulated under Council Directive 91/414/EEC. This Directive lays out a
comprehensive risk assessment and authorisation procedure for active
substances and products containing these substances. Each active substance
has to be proven safe in terms of human health, including residues in the food
chain, animal health and the environment, in order to be allowed to be
marketed. It is the responsibility of industry to provide the data showing that a
substance can be used safely with respect to human health and the
environment.
The first step of the evaluation process involves a Rapporteur Member
State, which transmits its preliminary conclusions on the substance to the
European Food Safety Authority. A scientific risk assessment involving the
European Food Safety Authority is then carried out, followed by risk
management steps carried out by the Commission with the assistance of the
Member States within the Standing Committee on the Food Chain and Animal
Health.
If the evaluation shows that the substance has no harmful effect on
human or animal health and that it has no unacceptable influence on the
environment, the substance can be approved.
A EU list of approved active substances (Annex I to Directive
91/414/EEC) is established, and Member States may authorise only plant
protection products containing active substances included in this list.
Regulation (EC) 396/2005
Regulation (EC) 396/2005 envisages a full harmonization for all
pesticide MRLs and replaces the previous legislation concerning MRLs.
Based on this legislation; the European Commission is taking forward a food
standards programme, which strives to achieve the harmonization of the
9
existing pesticides on the market, which could potentially be present as
residues on food. According to this Regulation the harmonized Maximum
residue Level (MRLs) should be based on existing national provisions in place
in EU Member States.
The European Commission compiled a list of the national MRLs for non-
harmonized substances. As many of these pesticides are no longer used in
agriculture either within or outside the EU, the Commission considered it
appropriate to set MRLs for these essentially obsolete compounds at the
lowest possible level. The Commission will therefore propose to set MRLs for
around 660 obsolete pesticides at the limit of determination, which is the
lowest level surveillance laboratories can achieve in monitoring analysis.
For around 240 remaining compounds, which are still in use either in or
outside the EU, Member States have established specific national MRLs.
These are now subject to the European harmonisation programme, which in
the first instance involves establishing temporary European level MRLs for
these substances. The temporary MRLs will be subject to a detailed scientific
assessment leading to the establishment of final EU MRLs following a
comprehensive assessment of the active substances.
As from 1st September 2008, Regulation (EC) 396/2005 of the European
Parliament and of the Council on Maximum Residue Levels (MRLs) of
pesticides in products of plant and animal origin defines a new fully
harmonised set of rules for pesticide residues. This regulation simplifies the
existing legislation by harmonising pesticide MRLs and making them directly
applicable (396/2005/EEC) and progressively would amend the Council
Directive 91/414/EEC.
The Regulation (EC) 396/2005 is composed by the main text, where
definitions and scope are set; in addition four technical annexes specify the
MRLs and the products to which they apply.
Annex I is the list of products to which the MRLs apply, it has been
established by Commission Regulation (EC) No 178/2006. It contains 315
products, including fruits, vegetables, spices, cereals, animal products
(178/2006/EEC).
Annex II is the list of EU definitive MRLs and it consolidates the existing
EU legislation before 1 September 2008. It specifies MRLs for 245 pesticides.

10
Annex III is the list of the so-called EU temporary MRLs. It is the result of
the harmonisation process as it lists pesticides for which, before 1 September
2008, MRLs were only set at national level.
Annex IV is the list of pesticides for which no MRLs are needed because
of their low risk.
Annex V will contain the list of pesticides for which a default limit other
than 0,01 mg/kg will apply. This Annex has not been published yet.
Annex VI will contain the list of conversion factors of MRLs for
processed commodities. This Annex has not been published yet.
Annex VII contains a list of pesticides used as fumigants for which the
Member States are allowed to apply special derogations before the products
are placed on the market.
If a pesticide is not included in any of the above mentioned Annexes the
default MRL of 0,01 mg/kg applies, as stated in the article 18(1b) of
Regulation (EC) 396/2005.
Settings of MRL
All decision-making in this area has to be science-based and a
consumer intake assessment has to be carried out by the European Food
Safety Authority before concluding on the safety of an MRL.
European MRLs for pesticide residues are set to protect the consumers
and to make trade possible in products containing residues. MRLs are set
based on authorised uses of plan protection products pursuant to Directive
91/414/EEC (91/414/EEC).
Applicants for an MRL have to submit data on the level of residues
resulting from the specified agricultural use and on the toxicology of the
pesticide.
The level of the MRL is determined by 'supervised trials'. From the
toxicological information an Acceptable Daily Intake (ADI) and an Acute
Reference Dose (ARfD) are derived.
The acceptable daily intake (ADI) reflects the chronic toxicity. It is the
estimate of the amount of a substance in food, expressed on a body-weight
11
basis that can be ingested daily over a lifetime without appreciable health risk
to the consumer.
The acute reference dose (ARfD) reflects the acute toxicity. It is the
estimate of the amount of a substance in food, expressed on a body-weight
basis that can be ingested over a short period of time, usually during one
meal or one day, without appreciable health risk to the consumer.
To determine whether an MRL is acceptable, the intake of residues
through all food that may be treated with that pesticide is calculated and
compared with the ADI and the ARfD, for long and short term intake and for
all available models of European consumer groups.
In case that the MRL requested is not safe, the lowest limit of analytical
determination (LOD) is set as the MRL. The LOD is also set for crops on
which there are no uses of the pesticide and when uses do not leave any
detectable residues. The default LOD in the EU legislation is 0,01 mg/kg.
The European Food Safety Authority (EFSA) is responsible for the risk
assessment and evaluates each intended new MRL.
Based on the EFSA's opinion, the Commission can issue a Regulation to
establish a new MRL or to amend or remove an existing MRL.
Sustainable Use Of Pesticides
The existing European policies and legislation on pesticides scarcely
address the actual use phase of the pesticides life-cycle, e.g. the temporary
storage of pesticides at farm level, the management/calibration of application
equipment, the protection of operators, the preparation of the spraying
solution and the application itself. As a result of the misuse of pesticides
including overuses, the percentage of food and feed samples in which
residues of pesticides exceed maximum regulatory limits has not decreased
over the last ten years (EFSA 2008).
A proposal for a framework directive would make it mandatory for all
Member States to establish national action plans involving all the relevant
stakeholders in the process. They would also have to create a system of
awareness raising and training of all professional users. Compulsory
inspection of existing application equipment would be introduced and aerial

12
spraying would be prohibited (derogations would be granted in situations
where there are no viable alternatives or where it has clear advantages in
terms of reduced impacts on health and the environment in comparison to
land-based application).
Member States would designate areas of significantly reduced or zero
pesticide use. Safe conditions would be established for storage and handling
of pesticides and their packaging and remnants.
Member States would also have to create the necessary conditions for
implementing Integrated Pest Management (IPM), which would become
mandatory as of 2014. In the context of IPM, the EU would draw up crop-
specific standards, the implementation of which would be voluntary. Finally, a
set of harmonised indicators and substitution of pesticides with alternative
products would be developed to measure progress in implementing the
Strategy (SSLRC 1997).
European Official Control Plan
The concept of the EU Reference Laboratories (EURLs) and National
Reference Laboratories (NRLs) was laid down in the EC Regulation 882/2004
of the European Parliament and of the Council. The overall objective of the
EURLs and NRLs is to improve the quality, accuracy and comparability of the
results at official control laboratories (882/2004/EEC).
According to Article 32 of EC Regulation 882/2004 the EURLs are
responsible for:
• providing NRLs with details of analytical methods, including
reference methods
• organisation of Proficiency Tests
• development and validation of new analytical methods
• organisation of workshops & training of laboratories in the
Members States
• providing scientific and technical assistance to the Commission,
e.g. for the establishment of co-ordinated programmes
• collaborating with laboratories responsible for analysing feed and
food in third countries
13
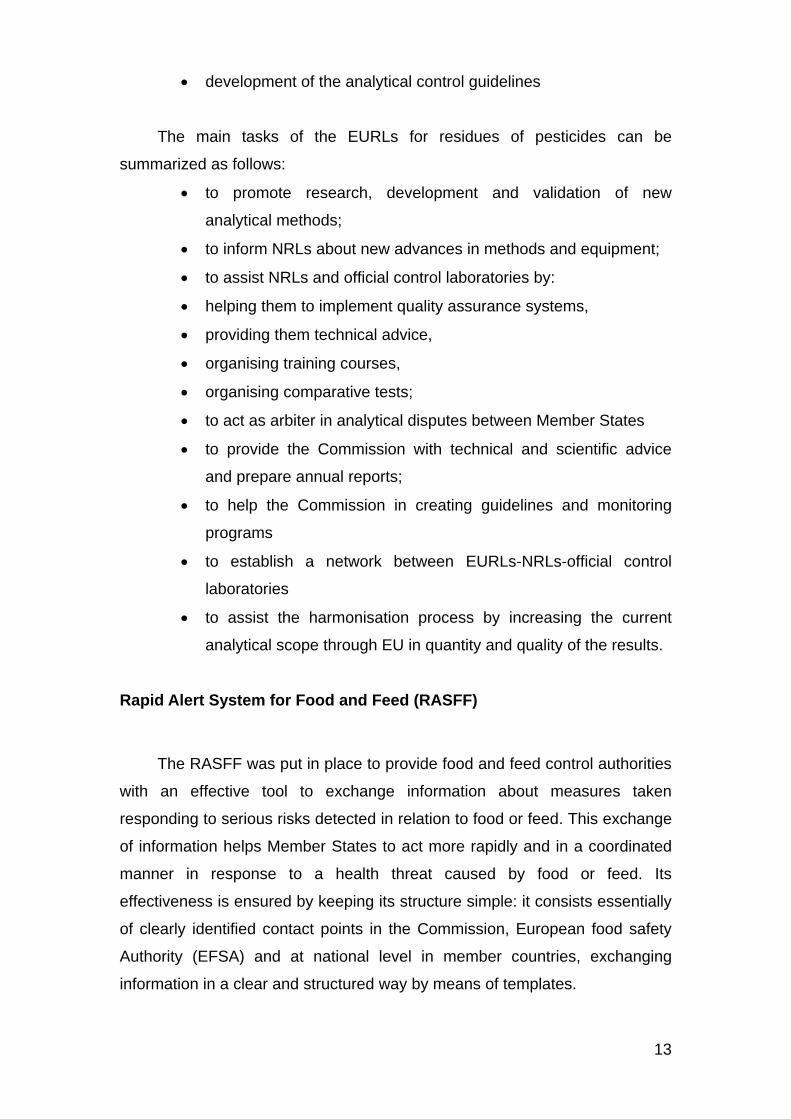
• development of the analytical control guidelines
The main tasks of the EURLs for residues of pesticides can be
summarized as follows:
• to promote research, development and validation of new
analytical methods;
• to inform NRLs about new advances in methods and equipment;
• to assist NRLs and official control laboratories by:
• helping them to implement quality assurance systems,
• providing them technical advice,
• organising training courses,
• organising comparative tests;
• to act as arbiter in analytical disputes between Member States
• to provide the Commission with technical and scientific advice
and prepare annual reports;
• to help the Commission in creating guidelines and monitoring
programs
• to establish a network between EURLs-NRLs-official control
laboratories
• to assist the harmonisation process by increasing the current
analytical scope through EU in quantity and quality of the results.
R
apid Alert System for Food and Feed (RASFF)
The RASFF was put in place to provide food and feed control authorities
with an effective tool to exchange information about measures taken
responding to serious risks detected in relation to food or feed. This exchange
of information helps Member States to act more rapidly and in a coordinated
manner in response to a health threat caused by food or feed. Its
effectiveness is ensured by keeping its structure simple: it consists essentially
of clearly identified contact points in the Commission, European food safety
Authority (EFSA) and at national level in member countries, exchanging
information in a clear and structured way by means of templates.

14
The legal basis of the RASFF is Regulation (EC) 178/2002. Article 50 of
this Regulation establishes the rapid alert system for food and feed as a
network involving the Member States, the Commission as member and
manager of the system and the EFSA (178/2002/EEC). Also the European
Economic Area (EEA) countries: Norway, Liechtenstein and Iceland, are
longstanding members of the RASFF.
Whenever a member of the network has any information relating to the
existence of a serious direct or indirect risk to human health deriving from
food or feed, this information is immediately notified to the Commission under
the RASFF. The Commission immediately transmits this information to the
members of the network. Article 50.3 of the Regulation lays down additional
criteria for when a RASFF notification is required.
Without prejudice to other Community legislation, the Member States
shall immediately notify the Commission under the rapid alert system of:
• any measure they adopt which is aimed at restricting the placing
on the market or forcing the withdrawal from the market or the
recall of food or feed in order to protect human health and
requiring rapid action
• any recommendation or agreement with professional operators
which is aimed, on a voluntary or obligatory basis, at preventing,
limiting or imposing specific conditions on the placing on the
market or the eventual use of food or feed on account of a serious
risk to human health requiring rapid action
• any rejection, related to a direct or indirect risk to human health,
of a batch, container or cargo of food or feed by a competent
authority at a border post within the European Union.
The system differentiates between ‘market’ notifications and ‘border
rejections’. Market notifications are about products found on the Community
territory for which a health risk was reported. Products that are subject of a
border rejection never entered the Community and were sent back to the
country of origin, destroyed or give another destination.
These notifications report on health risks identified in products that are
placed on the market in the notifying country. The notifying country reports on
the risks it has identified, the product and its traceability and the measures it
has taken. According to the seriousness of the risks identified and the

15
distribution of the product on the market, the market notification is classified
after evaluation by the Commission Services as alert notification or
information notification before the Commission transmits it to all network
members.
An ‘alert notification‘ or ‘alert‘ is sent when a food or a feed presenting a
serious risk is on the market or when rapid action is required. Alerts are
triggered by the member of the network that detects the problem and has
initiated the relevant measures, such as withdrawal/recall. The notification
aims at giving all the members of the network the information to verify whether
the concerned product is on their market, so that they can take the necessary
measures.
Products subject to an alert notification have been withdrawn or are in
the process of being withdrawn from the market. The Member States have
their own mechanisms to carry out such actions, including the provision of
detailed information through the media if necessary.
An ‘information notification‘ concerns a food or a feed on the market of
the notifying country for which a risk has been identified that does not require
rapid action, e.g. because the food or feed has not reached the market or is
no longer on the market (of other member countries than the notifying
country). A ‘border rejection notification’ concerns a food or a feed that was
refused entry into the Community for reason of a health risk.
A ‘news notification’ concerns any type of information related to the
safety of food or feed which has not been communicated as an alert,
information or border rejection notification, but which is judged interesting for
the food and feed control authorities in the Member States.
News notifications are often made based on information picked up in the
media or forwarded by colleagues in food or feed authorities in Member
States, third countries, EC delegations or international organisations, after
having been verified with the Member States concerned.
As far as market and border rejection notifications are concerned, two
types of notifications are identified:
• an ‘original notification’ is a notification • referring to one or more
consignments of a food or a feed that were not previously notified
to the RASFF

• a ‘follow-up notification’ is a notification, which is transmitted as a
follow-up to an original notification.
An original notification sent by a member of the RASFF system can be
rejected from transmission through the RASFF system, after evaluation by the
Commission, if the criteria for notification are not met or if the information
transmitted is insufficient. The notifying country is informed of the intention not
to transmit the information through the RASFF system and is invited to
provide additional information allowing the Commission to reconsider the
intended rejection. In the other event the notifying country agrees with the
rejection. A notification that was transmitted through the RASFF system can
be withdrawn by the Commission at the request of the notifying country if the
information, upon which the measures taken are based, turns out to be
unfounded or if the transmission of the notification was made erroneously.
Figure 1: Schematic representation of the information flows of the Rapid Alert System for Food and Feed (http://ec.europa.eu/food/food/rapidalert/about_rasff_en.htm).
16

17
Italian Official Control Plan
The Decree of the Italian Ministry of Health of 23 December 1992
transposing Directive 90/642/EEC on the maximum residue limits for active
substances in medical devices and food permissible, provided the minimum
requirements to the Regions and Autonomous Provinces of Trento and
Bolzano to program the controls on residues of active substances by the local
health units (90/642/EEC).
The decree contains tables showing the number of samples in each
Region and Autonomous Province matrix for the following foods: vegetables,
fruits, cereals, wine, oil, meat, dairy and eggs. They are divided into separate
tables samples to be collected for food products within the region or province
and those for food from outside the Region or Autonomous Province of
reference. The Departments of States / Provinces shall use the Prevention
Departments of ASL (Local Health Department) for collecting food samples,
which are analyzed by laboratories (ARPA, IZS). The latter shall send the
results on residues of plant protection products, directly and via the Web, the
Ministry - Directorate General of Food Security and Nutrition.
Regional planning is made taking into account the minimum value
indicated by the Directive 90/642/EEC and the data production and
consumption of fruits and vegetables (90/642/EEC). In particular, it contained
the details of the number of samples expected in the Region or Autonomous
Province, and the number of laboratories that sent data over the Web
data analysis for the detection of pesticide residues, the minimal total number
of samples Fruit set by the National Plan for Pesticides Residues is equal to
4370, including 2361 and 2009 fruit and vegetable.
The recommended sampling points are for crop production: the
corporate and cooperative collection centres for products coming within the
Region or Autonomous Province, the general markets specialised, non-
specialised wholesale stores, hypermarkets and supermarkets for products
from the outside the Region or Autonomous Province.
For products of animal origin: the slaughter plants, the company
collection centres, shopping centres for products from within the Region or

18
Autonomous Province, the general markets specialized, non-specialized
wholesale deposits, the hypermarkets, supermarkets and merchants for
various products from outside the region or autonomous province.
Following the entry into force of Regulation 396/2005 on harmonized
maximum residue limits in food the European Food Safety Authority (EFSA)
has introduced new procedures for data collection.
New modes of transmission are described in the note of 16 June 2010
(Note 16 June 2010) of the Italian Ministry of Health, where data collection
have to be sent by the reference laboratories to the Ministry of Health in
eXtensible Markup Language (XML) format; integrated in the new flows of
health information system (NSIS).
Current Scenario in Italy
The official controls on pesticide residues in food is one of the most
important public health priority in food safety and has the aim of ensuring a
high level of consumer protection.
The Italian Ministry of Health - Department of Veterinary Public Health,
Nutrition and Food Safety coordinates and establishes programs of official
controls on foodstuff.
These are part of a coordinated program of official control provided by
the European Union on domestic food production and import activities, to
investigate the presence of food matrices where the maximum permitted
levels is eventually overcome.
In order to implement this program refers to the Ministerial Decree of 23
December 1992 (90/642/EEC) laying down the annual plans of control on
residues of plant protection products, and Regulation 882/2004/EEC on
official controls (882/2004/EEC). For the method of sampling refers to the
Ministerial Decree dated 23 July 2003 (2004/44/EEC).
The aforementioned Ministerial Decree (1992) includes a detailed
program of implementation of controls within the region and autonomous
provinces, indicating the minimum number and type of samples for analysis.
The distribution of samples for each Region and Autonomous Province is
calculated from data on consumption and production of food involved
19
(90/642/EEC).
Regulation 882/2004/EEC lays down general principles instead of
performing official controls to verify compliance with the law, establishing the
characteristics required of the official control laboratories, procedures,
activities, methods and techniques to make controls. The analyses for the
detection of residues of plant protection products are performed by the
laboratories, Regional Agencies for Environmental Protection/Prevention
(ARPA) and Zooprophylactic Institutes (IZS) (882/2004/EEC).
Laboratories should be accredited and the analytical methods they use
must be validated. Furthermore, these laboratories need to report the results
of analysis to the Ministry. The data are also used for official testing by the
Institute of Health to obtain an estimate dietary intake of pesticide residues in
the diet in Italy.

20
Monitoring of Pesticide Residues in Products of Plant Origin in Lombardy (Italy)
The official controls on pesticide residues in food are one of most
important health priorities in food safety, in Italy, and it has the aim of ensuring
a high level of consumer protection. The Italian Ministry of Health –
Department for Health Veterinary Public, Nutrition and Food Safety – DG
Food Safety and Nutrition (D.G.S.A.N), coordinates and defines programs in
Italy official control on food, including for the annual plans on pesticide
residues in food. These latter are part of a coordinated program of official
control provided by the European Union on food production domestic and
import activities, see the actual presence of maximum permitted residues in
foodstuffs.
To implement this program refers to the Decree of the Italian Ministry
of Health of 23 December 1992 (23 December 1992), which defines the
annual plans of control on residues of plant protection product, and
Regulation 882/2004/EEC (882/2004/EEC) provides a detailed program of
implementation of controls within the Regions and Provinces autonomous,
with an indication of the other the minimum number and type of samples to be
analysed. In this respect it is useful to mention that the minimum number of
samples, to be analysed, is 434 (plant origin) exclusively for Lombardy. In
addition, the distribution of samples for each Region and Autonomous
Province is calculated from data on consumption and on the production of
food concerned.
The EC Regulation 882/2004/EEC (882/2004/EEC) lays down general
criteria for hand the checks formal verification of compliance by establishing
the characteristics that must own laboratories for the official control,
procedures, activities, methods and techniques to carry out checks.
The analyses for the detection of pesticide residues are carried out by
official control laboratories (Regional Agency for Environmental Protection /
Local Prevention laboratories and Zooprophylactic Experimental Institutes).
Under Regulation 882/20047EEC (882/2004/EEC) have been set up National
Reference Laboratories, which are coordinated by the EU Community
Reference Laboratory.

21
Laboratories should be accredited and analysis methods they used
are validated. Also they shall report the results of analysis to the Ministry of
Health (63/2002/EEC). In addition, the Italian Institute of Health (ISS) also
uses the data of the official control plan for an estimation of the dietary intake
of pesticide residues of plant in comparison with the Italian diet.
The data described and analysed in this section refers to the official
monitoring plan of pesticide residues, for samples from Lombardy form 1996
to 2008; this plan has to the main objectives of:
• Assess the risk to public health arising the degree of contamination
of food
• Distinguish the performance of controls on residues plant protection
products in food of vegetable origin carried out in Italy by all
Departments central and territorial health
The nature of this summary report provides a framework both general
and detailed on the results and provides guidance on future actions to
undertake to improve and further strengthen the Italian control system of
residues of plant protection products, to ensure adequate levels of food
safety.
Introduction
The Decree of the Minister of Health of 23 December 1992,
transposing Council Directive 90/642 (90/642/EEC), relating to maximum
residue limits for active substances in medical devices tolerated in and on
foodstuffs, provided the minimum requirements to the all Italian Regions,
including Lombardy to program the controls on residues of active substances
by ASL.
The decree contains tables showing the number of samples in each
region for the following matrices foods: vegetables, fruits, cereals, wine, oil,
meat, dairy products and eggs. In the following sections of the thesis, food
products of plant origin would be exclusively considered.
Local Health Units, in Lombardy, are in charge for collecting food
samples, which are analysed by official laboratories. These shall send the

22
results of residue plant protection products, directly via web, to the Italian
Ministry of Health.
Regional planning takes account of the minimum value indicated by
the Council Directive 90/642/EEC (90/642/EEC) and the data production and
consumption of fruit and vegetables.
In addition, for foodstuffs of plant origin sampling points are
recommended as like collection centres and cooperative company for
products from within the region, the general markets specialised, non-
specialised stores wholesale hypermarkets and supermarkets for products
coming from outside the region.
For the sampling method it refers to the Ministerial Decree dated 23
July 2003 (23 July 2003) implementation of Council Directive 2002/63/EEC
(2002/63/EEC).
The maximum residue levels of active substances of plant protection
products, with its conventional classification and ranges security, which must
elapse between the last treatment and harvest for food or stored home use,
are reported in staff in the Decree of the Italian Minister of Health of 27 August
2004 (24 August 2004) and its subsequent amendments.
Further efforts were intensified by regional government to bring the
laboratories, carrying out analysis for the official control of food products, to
the general criteria of testing laboratories, of Lombardy, which will all be
credited from 1st January 2010.
Materials and methods
The data were reported by Local Health Unit of Lombardy (ASL) in
appropriate paper forms provided by the Prevention Unit, Department of
Health of the Lombardy Region, which were sent for processing.
The collection form of analytical results indicated:
• Outcome of the analysis (regular, irregular)
• Origin of the sample (Lombardy, Italy (excluding Lombardy, European
State, Non-European States and Unknown).
Regular samples are defined as those with residue of pesticide below
the legislative limit (MRL) and they were accompanied by the name of the
23
active ingredient found and the relative amount expressed in mg/kg, while
irregular ones were characterised by the name of the active ingredient with
the value found above the MRL.
The data from monitoring campaigns conducted by the Lombardy
Region since 1996, were collected by the International Centre of Pesticide
Safety and Health Risk Prevention (ICPS) in an Access database. The data
are available, by year and food matrix, in one section of the web sites of ICPS
in collaboration with the General Health Directorate of Lombardy Region
(http://www.icps.it/residui.asp).
The data was extracted from access database in order to show the
cluster elaboration and summary statistics for Region, as such, and
disaggregated by ASL. In addition the number of samples analysed, the
number of active inquiry, the number of samples overcoming of the MRL,
name of the active ingredients found also divided by functional class and
chemical class.
The distribution of the active ingredients found in food matrices for
functional class and chemistry class was designed to allow comparison with
similar tables drawn from the database Fitoweb
(http://www.icps.it/fitoweb290/) on the centralised collection of sales data as
stated in the Lombardy Regional Council of 25 November 2002 No. 11225.
The allocation of functional class and the class of chemicals was
carried out using the database built for "Pestidoc" currently available on the
website (http://www.icps.it/ITALIANO/Pestidoc/index.htm).
For active substances that were found with a level of residual greater
than the maximum allowed, by law, was performed an investigation into the
status of their assessment in European or international level. For this the
database built by the European Commission, D.G. SANCO with the purpose
of providing a useful search tool for all the MRLs, as set in the European
Directive 396/2005/EEC (396/2005/EEC), was consulted. It is freely available
at http://ec.europa.eu/sanco_pesticides/public/index.cfm and contains
information on active substances and their placing on the market according to
the Council Directive 91/414/EEC (91/414/EEC) and MRL according to the
Commission Regulation 396/2005 (396/2005/EEC), with updates on
05/08/2010.
24
In addition, it should be noted that the excess of an MRL does not
pose itself a risk in terms of chronic exposure, if the excess is sporadic. The
situation is different from the risk assessment acute exposure (food consumed
in a meal or within 24 hours). In this case, the occurrence of an overrun could
potentially cause damage to health when the intake calculation would results
in an overrun of the reference value of concern.
Results
The Italian Decree 23 December 1992 (23 December 1992) in Annex
1, Section 6 anticipates sending the results of analysis performed by the
official laboratories of each Italian region, by a web-based tool to Ministry of
Health, in the manner prescribed by the Decree of the Minister of Health 22
April 1991 (22 April 1991).
The transmission of analytical results for each year must be
completed by 31 March of the following, in order to transmit the EFSA within
the deadline 31 August the following year.
In accordance with Regulation (EC) No 396/2005, the task of
preparing the Annual Report on Pesticide Residues has been transferred to
the European Food Safety Authority (EFSA), therefore please see the EFSA
website http://www.efsa.europa.eu/en/prapertopics/topic/pesticides.htm for
reports subsequent to 2006. Annual Reports prior to 2006 are available at the
website of the European Commission, DG SANCO, at
http://ec.europa.eu/food/fvo/specialreports/pesticides_index_en.htm.
European Overview As mentioned in the first chapter of the thesis each European country
has to produce an annual report on pesticide residues detected in food
commodities. Therefore, comparing the total number of analysed samples, as
mentioned in the Annual Report on Pesticide Residues prepared by EFSA;
the total number of samples taken in the context of the national programmes
in 2008 was 70.143. Italy had analysed 6788 samples, which are the second
highest results, Germany and France, first and third in the ranking, had
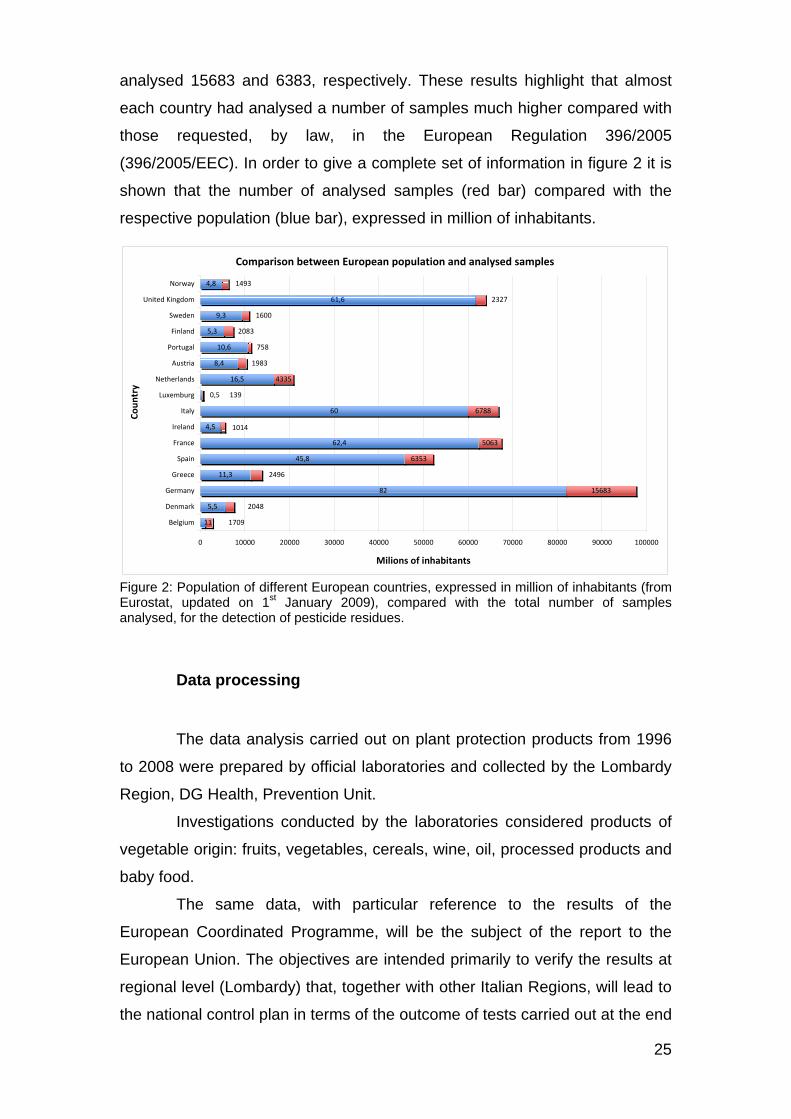
analysed 15683 and 6383, respectively. These results highlight that almost
each country had analysed a number of samples much higher compared with
those requested, by law, in the European Regulation 396/2005
(396/2005/EEC). In order to give a complete set of information in figure 2 it is
shown that the number of analysed samples (red bar) compared with the
respective population (blue bar), expressed in million of inhabitants.
Comparison between European population and analysed samples
15683
6353
5063
6788
4335
11
5,5
82
11,3
45,8
62,4
4,5
60
0,5
16,5
8,4
10,6
5,3
9,3
61,6
4,8
1709
2048
2496
1014
139
1983
758
2083
1600
2327
1493
0 10000 20000 30000 40000 50000 60000 70000 80000 90000 100000
Belgium
Denmark
Germany
Greece
Spain
France
Ireland
Italy
Luxemburg
Netherlands
Austria
Portugal
Finland
Sweden
United Kingdom
Norway
Coun
try
Milions of inhabitants
Figure 2: Population of different European countries, expressed in million of inhabitants (from Eurostat, updated on 1st January 2009), compared with the total number of samples nalysed, for the detection of pesticide residues. a
Data processing
The data analysis carried out on plant protection products from 1996
to 2008 were prepared by official laboratories and collected by the Lombardy
Region, DG Health, Prevention Unit.
Investigations conducted by the laboratories considered products of
vegetable origin: fruits, vegetables, cereals, wine, oil, processed products and
baby food.
25
The same data, with particular reference to the results of the
European Coordinated Programme, will be the subject of the report to the
European Union. The objectives are intended primarily to verify the results at
regional level (Lombardy) that, together with other Italian Regions, will lead to
the national control plan in terms of the outcome of tests carried out at the end
of an accurate assessment of risk to public health arising from the degree of
contamination of foodstuffs. In particular, the development focused on the
following aspects:
• size of the sampling
• food matrices analysed
• summary of results
• incidence of residual
• irregularities
• active substances used
During the years taken into consideration 15 official control
laboratories, under the supervision of the Prevention Units of the Lombardy
Region collected and analysed the food sample. Due to the implementation of
the official control plan of the Lombardy Region, during the period from 1996
to 2001 the official laboratories were only 12; therefore new laboratories were
created and some of the remaining were renamed. The details are shown in
the Table 1.
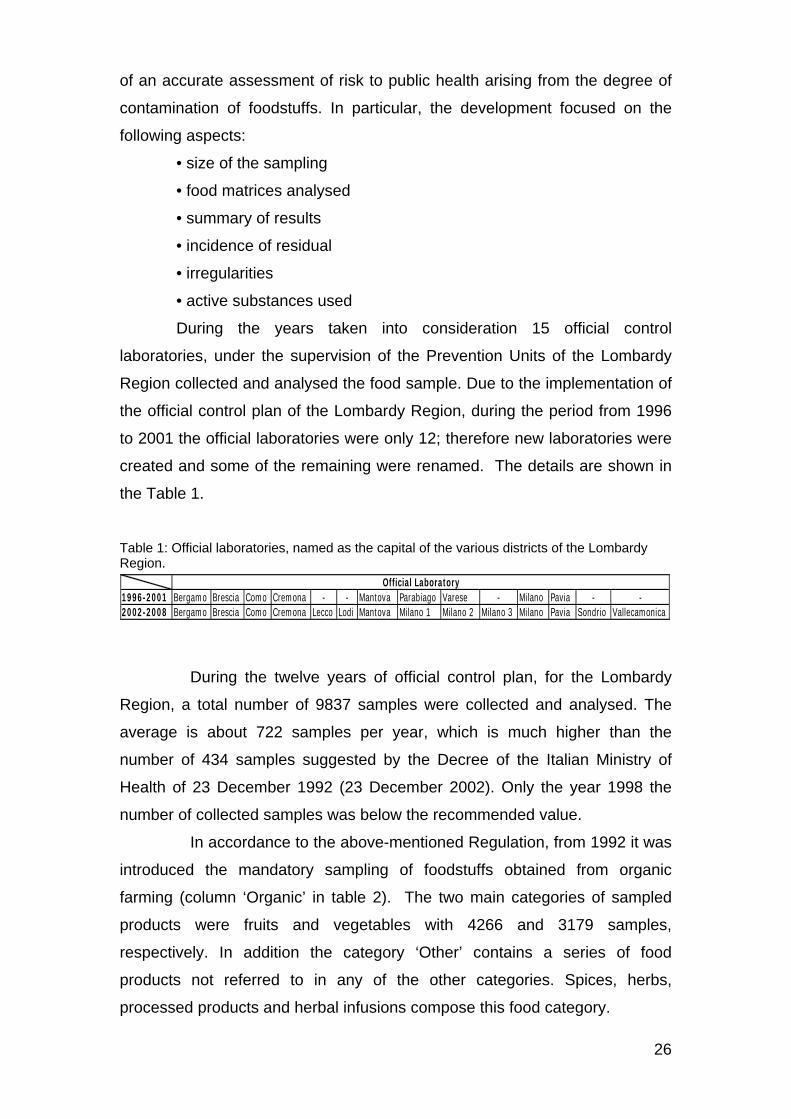
Table 1: Official laboratories, named as the capital of the various districts of the Lombardy Region.
199
6-2001 Bergamo Brescia Como Cremona - - Mantova Parabiago Varese - Milano Pavia - -
2002-2008 Bergamo Brescia Como Cremona Lecco Lodi Mantova Milano 1 Milano 2 Milano 3 Milano Pavia Sondrio Vallecamonica
Official Laboratory
During the twelve years of official control plan, for the Lombardy
Region, a total number of 9837 samples were collected and analysed. The
average is about 722 samples per year, which is much higher than the
number of 434 samples suggested by the Decree of the Italian Ministry of
Health of 23 December 1992 (23 December 2002). Only the year 1998 the
number of collected samples was below the recommended value.
26
In accordance to the above-mentioned Regulation, from 1992 it was
introduced the mandatory sampling of foodstuffs obtained from organic
farming (column ‘Organic’ in table 2). The two main categories of sampled
products were fruits and vegetables with 4266 and 3179 samples,
respectively. In addition the category ‘Other’ contains a series of food
products not referred to in any of the other categories. Spices, herbs,
processed products and herbal infusions compose this food category.

Table 2: General results of the official control plan of the Lombardy Region of pesticide residues in food from 1996 to 2008.
N. Tot. Sample Organic Fruit Vegetable Cereal
Animal Origin Other
1996 1001 - 550 243 96 44 681997 714 - 283 277 68 39 471998 284 - 86 115 45 21 171999 488 - 175 210 36 28 392000 502 - 222 181 61 23 152001 683 - 297 221 82 17 662002 756 36 311 291 79 2 1092003 587 14 274 197 52 - 782004 773 75 355 298 47 - 1482005 1051 83 428 377 53 - 2762006 951 72 432 302 40 - 2492007 880 71 513 240 14 - 1842008 717 100 340 227 18 - 232Tot 9387 451 4266 3179 691 174 1528
In order to go more in dept in the analysis of the food matrices used
for the official plan of monitoring of pesticide residues in food, all the collected
samples were sub-divided in food classes, as described in the European
Pesticides Database, from the DG SANCO website
(http://ec.europa.eu/sanco_pesticides/public/index.cfm).
As shown in Table 3 the class of fruits, vegetables and processed
products are those food clusters with the majority of collected samples.
Table 3: Official control plan of the Lombardy Region of pesticide residues in food, the results are disaggregated by food matrices.
1996 1997 1998 1999 2000 2001 2002 2003 2004 2005 2006 2007 2008Animal Origin 44 39 21 28 23 17 2 - - - - - -Berry and Small Fruit 52 54 12 11 26 66 42 44 52 69 50 61 33Brassica Vegetable 4 12 1 9 3 10 10 9 14 15 10 42 14Bulb Vegetable 1 12 - 3 7 1 8 2 6 9 6 - 10Cereal 96 68 45 36 61 82 79 52 47 53 40 14 18Citrus Fruit 91 48 - 25 56 45 62 52 69 114 124 79 106Fruiting Vegetable 82 107 44 75 37 84 79 54 88 121 75 98 78Fungi - 1 - 1 - 2 - - 4 3 3 2 -Herb - - - - - - - - - 1 3 - -Herbal Infusion 2 15 - 12 - 1 - 1 2 5 4 1 -Leaf Vegetable 62 83 38 65 52 39 81 18 75 75 78 108 33Legume Vegetable 19 8 6 4 7 7 12 12 8 15 16 74 12Miscellaneous Fruit 34 36 9 31 22 47 51 30 49 30 61 53 39Oilseed - - - - - - 6 1 3 - - 3 -Pome Fruit 323 65 17 61 64 89 84 92 119 137 141 137 111Processed Product 59 31 17 26 14 60 96 77 143 261 203 154 227Root and Tuber Vegetable 59 48 25 48 72 71 94 96 86 124 101 73Spice 7 - - - 1 3 13 - 3 6 36 24 5Stem Vegetable 7 7 1 6 3 9 7 6 21 18 16 16 7Stone Vegetable 59 78 48 47 53 49 66 54 57 76 54 83 51Tree nut - 2 - - 1 1 - 1 2 2 2 2 -TOT. 1001 714 284 488 502 683 792 601 848 1134 1023 951 817
27
28
In particular, analysing the results more in depth it is shown that the
food categories with the major number of samples are as follows:
• Pome fruit
(which includes: apples, pears, quince, …)
• Processed product
(which includes: juice, homogenised, wine, tomato sauce, …)
• Fruiting vegetable
(which includes: tomato, pepper, aubergine, …)
• Root and tuber vegetable
(which includes: potato, carrot, cassava, beetroot, …)
• Citrus fruit
(which includes: grapefruit, orange, lemon, mandarin, …)
• Leaf vegetable
(which includes: lettuce, scarole, cress, …)
• Stone fruit
(which includes: apricot, cherry, peach, plum, …)
• Cereal
(which includes: barley, maize, rice, millet, …)
• Berry and small fruit
(which includes: grapes, blackberry, strawberry, …)
• Miscellaneous fruit
(which includes: date, fig, table olive, …)
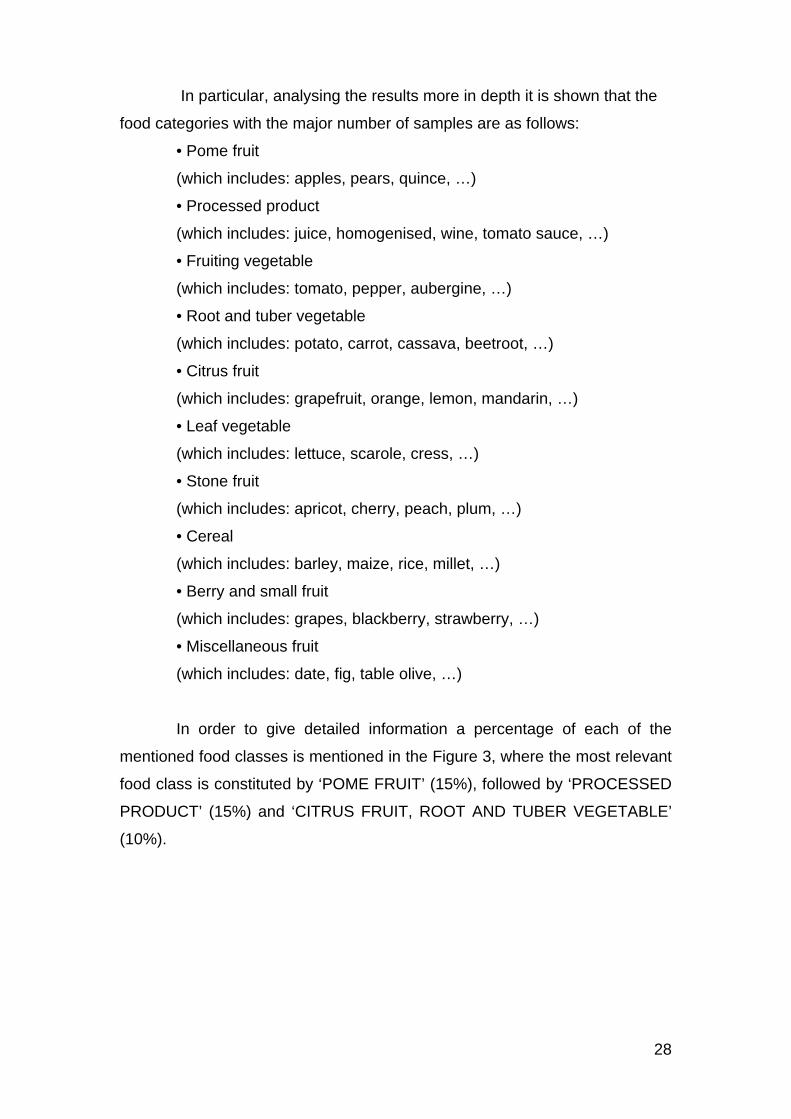
In order to give detailed information a percentage of each of the
mentioned food classes is mentioned in the Figure 3, where the most relevant
food class is constituted by ‘POME FRUIT’ (15%), followed by ‘PROCESSED
PRODUCT’ (15%) and ‘CITRUS FRUIT, ROOT AND TUBER VEGETABLE’
(10%).

Distribution of Food Classes
17%
15%
11%
10%10%
9%
9%
8%
6%5%
POME FRUIT
PROCESSED PRODUCT
FRUITING VEGETABLE
ROOT and TUBERVEGETABLECITRUS FRUIT
LEAF VEGETABLE
STONE FRUIT
CEREAL
BERRIES and SMALL FRUIT
MISCELLANEOUS FRUIT
Figure 3: Commodities sampled during the official control plan of the Lombardy Region of pesticide residues in food, the data are disaggregated by food classes.
The analysed samples contained information related to the origin of
the foodstuff divided in Lombardy, Italy (excluding Lombardy), European
Union (EU), Extra- EU and unknown, as shown in Table 4.
Table 4: Origin of the food matrices, sampled during the official control plan of the Lombardy Region of pesticide residues in food, the results are disaggregated by country of origin and year of sampling.
Lombardy Italy, excluding Lombardy EU, excluding Italy Extra EU Unknown1996 510 280 6 1 2041997 210 296 50 42 1161998 107 100 15 5 571999 185 224 16 22 412000 147 215 35 48 572001 158 288 41 72 1242002 234 311 41 104 1022003 163 335 26 41 362004 306 405 44 57 362005 471 512 50 66 352006 302 487 44 170 202007 325 449 45 125 72008 381 335 36 50 15TOT 3499 4237 449 804 850
The majority of the food matrices analysed are produced within the
Italian border (4327) and from the Lombardy Region (3499), this is due to the
fact that the sampling plan should reflect the dietary habits and production
system of the district where the samples are collected.
29
30
Taking as example the district of Pavia, linked to one of the 15 official
laboratories in charge of detecting residue of pesticides in food is a well
known area for rice production. As a consequence, similar results could be
shown for other districts of Lombardy with high production of local and typical
food products.
It is also useful to mention that matrices coming from countries
outside Europe are analysed by the Inspection Borders and in case a bench
of foodstuffs are found with residue of pesticides above the legislative
permitted level, they are immediately withdrawn from the country. Therefore,
they do not pose an unacceptable risk, per se, for the consumers.
Residue distributions
During the monitoring plan of pesticide residues in food, from 1996 to
2008, a total of 9837 samples were analysed and in 70% of a pesticide
residue below the limit of determination was found. In 19% of the total
samples only one residue of pesticide was found and in the remaining 11%
sample with more than two residues were found, up to nine pesticides
residues detected in a sample of pear, analysed in the district of Milan, during
the sampling plan of the year 2000.
In addition, it is worth to mention that especially in the fruit, a greater
presence of samples with single and multi-residues were found, as compared
in vegetables.
This is probably explained by the fact that tree fruit are treated more
actively (fruit growing seasons are more long) and they are subject to multiple
treatments in their vegetation cycle, both during the flowering, the fruiting and
post-harvest.
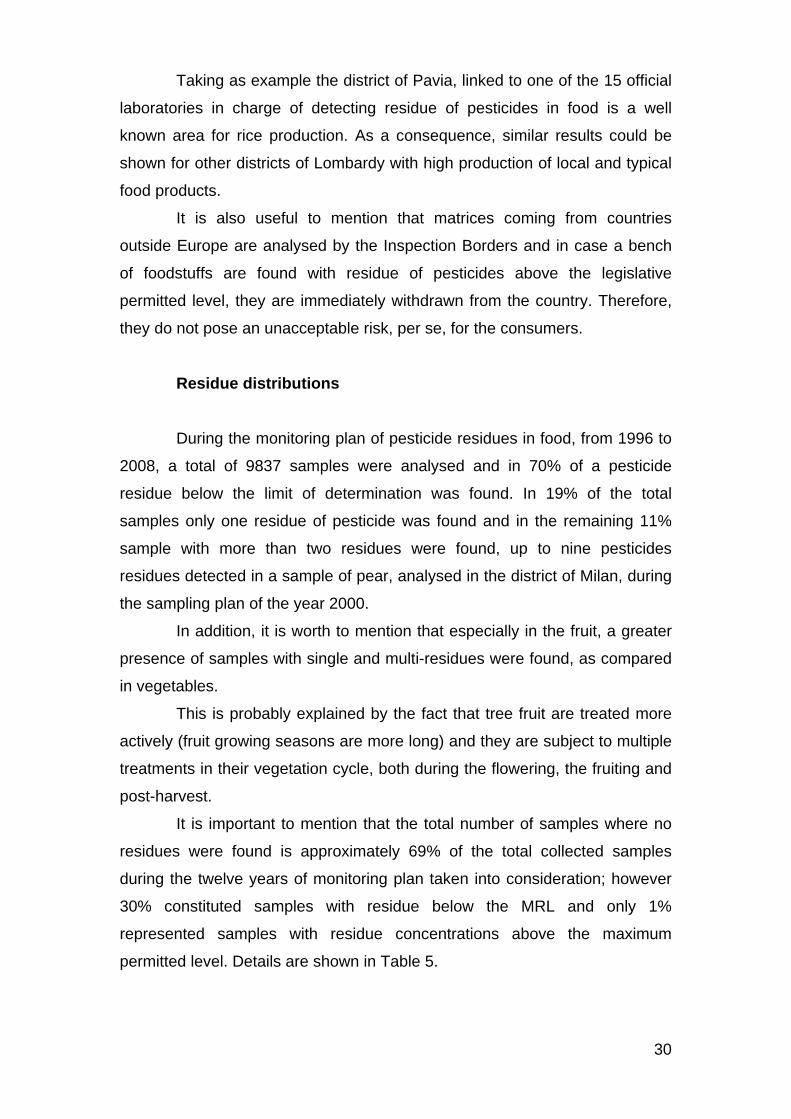
It is important to mention that the total number of samples where no
residues were found is approximately 69% of the total collected samples
during the twelve years of monitoring plan taken into consideration; however
30% constituted samples with residue below the MRL and only 1%
represented samples with residue concentrations above the maximum
permitted level. Details are shown in Table 5.
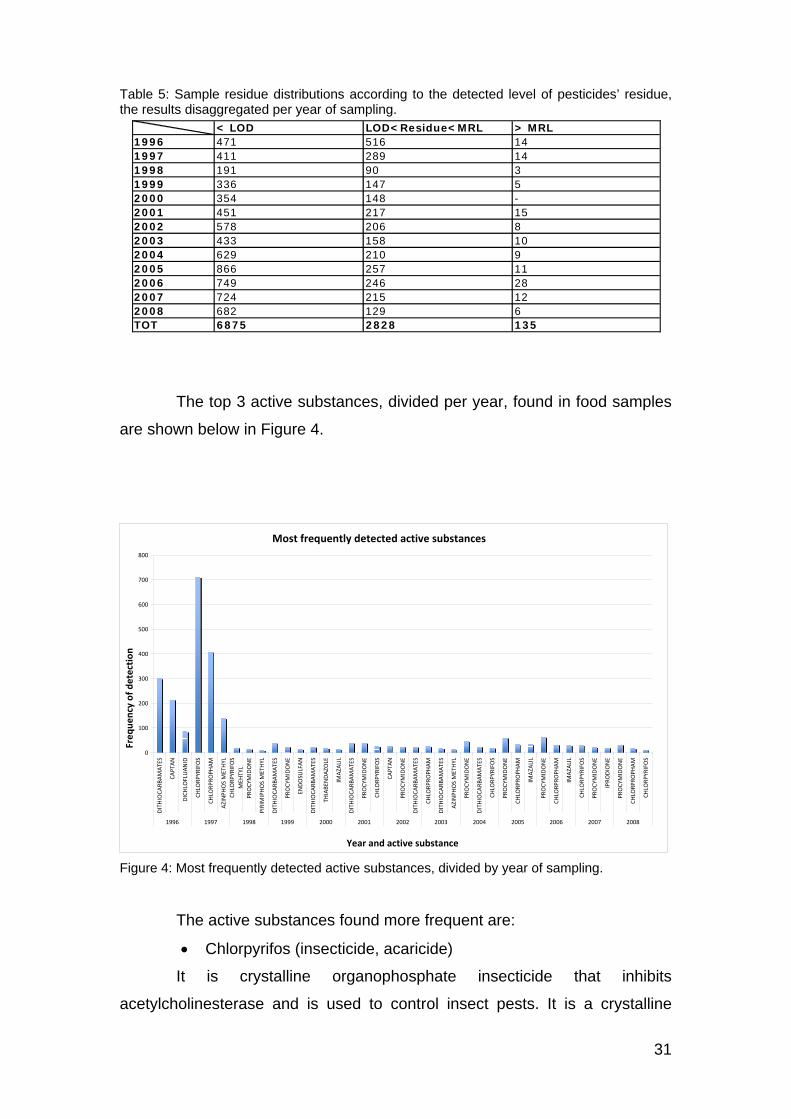
Table 5: Sample residue distributions according to the detected level of pesticides’ residue, the results disaggregated per year of sampling. < LOD LOD<Residue<MRL > MRL
1996 471 516 141997 411 289 141998 191 90 31999 336 147 52000 354 148 -2001 451 217 152002 578 206 82003 433 158 102004 629 210 92005 866 257 112006 749 246 282007 724 215 122008 682 129 6TOT 6875 2828 135
The top 3 active substances, divided per year, found in food samples
are shown below in Figure 4.
Most frequently detected active substances
0
100
200
300
400
500
600
700
800
DITHIOCA
RBAMATES
CAPTAN
DICHLO
FLUANID
CHLO
RPYR
IFOS
CHLO
RPRO
PHAM
AZINPH
OS METHYL
CHLO
RPYR
IFOS
MEH
TYL
PROCYMIDONE
PIRIMIPHOS METHYL
DITHIOCA
RBAMATES
PROCYMIDONE
ENDOSU
LFAN
DITHIOCA
RBAMATES
THIABE
NDAZO
LE
IMAZA
LIL
DITHIOCA
RBAMATES
PROCYMIDONE
CHLO
RPYR
IFOS
CAPTAN
PROCYMIDONE
DITHIOCA
RBAMATES
CHLO
RPRO
PHAM
DITHIOCA
RBAMATES
AZINPH
OS METHYL
PROCYMIDONE
DITHIOCA
RBAMATES
CHLO
RPYR
IFOS
PROCYMIDONE
CHLO
RPRO
PHAM
IMAZA
LIL
PROCYMIDONE
CHLO
RPRO
PHAM
IMAZA
LIL
CHLO
RPYR
IFOS
PROCYMIDONE
IPRO
DIONE
PROCYMIDONE
CHLO
RPRO
PHAM
CHLO
RPYR
IFOS
1996 1997 1998 1999 2000 2001 2002 2003 2004 2005 2006 2007 2008
Year and active substance
Freq
uency of detection
Figure 4: Most frequently detected active substances, divided by year of sampling.
The active substances found more frequent are:
• Chlorpyrifos (insecticide, acaricide)
31
It is crystalline organophosphate insecticide that inhibits
acetylcholinesterase and is used to control insect pests. It is a crystalline
32
organophosphate insecticide that inhibits acetylcholinesterase and is used to
control insect pests (Ruth, V.A. et al. 2006).
• Chlorpropham (plant growth regulator)
It is a plant growth regulator used for pre-emergence control of grass
weeds in alfalfa, lima and snap beans, blueberries, cane berries, carrots,
cranberries, ladino clover, garlic, seed grass, onions, spinach, sugar beets,
tomatoes, safflower, soybeans, gladioli and woody nursery stock. It is also
used to inhibit potato sprouting and for sucker control in tobacco (Meister,
R.T. 1992).
Chlorpropham is moderately toxic by ingestion. It may cause irritation
of the eyes or skin (Occupational Health Services 1992). Symptoms of
poisoning in laboratory animals have included listlessness, in co-ordination,
nose bleeds, protruding eyes, bloody tears, difficulty in breathing, prostration,
inability to urinate, high fevers, and death. Autopsies of animals have shown
inflammation of the stomach and intestinal lining, congestion of the brain,
lungs and other organs, and degenerative changes in the kidneys and liver
(Occupational Health Services 1992).
• Dithiocarbamates (fungicide)
Introduced 40–70 years ago, Dithiocarbamate fungicides still
represent an important class widely used in agriculture. They are
characterised by a broad spectrum of activity against various plant pathogens,
low acute mammal toxicity, and low production costs. In combination with
modern systemic fungicides, they are also used to manage resistances and to
broaden the spectrum of activity. In Figure 3 they are mentioned as
‘Dithiocarbamates’ and they comprehend fungicide as Zineb, Maneb,
Mancozeb, Propineb and Metiram. In addition, they were some of the most
frequently detected pesticides in the European Union, Norway, Iceland, and
Liechtenstein, and that this group also had the highest frequency in exceeding
maximum residue limits (Crnogorac, G. and Schwack, W. 2009), which refers
to total Dithiocarbamates, determined as Carbon Di-sulphite (CS2) evolved
during acid digestion and expressed as mg CS2/kg.

33
A
ctive substances not included in Annex 1
According to the Council Regulation 91/414/EEC (91/414/EEC), the
active substance authorised on the market are included in the Annex 1
(positive list) of the mentioned Regulation. Taking into consideration
exclusively those food samples where the residue of pesticides was found
above the legislative limit, it was investigated the possibly wherever some of
those substances where not authorised under the Italian legislation. These
information were deducted from the Pestidoc database
(http://www.icps.it/pestidoc/).
In this case, firstly these food matrices could represent an acceptable
risk to the health of the consumer, by overcoming the legislative limit and
secondly the offence of food fraud, would be reported.
It was then found that in 39 food matrices, with irregular concentration
of active substances, the presence of non-authorised pesticides was found.
Out of the 39 samples only 6 showed a multi residue concentration with
another active substances, included in Annex 1, for the remaining 33 a single
residue was detected. The active substances present in most of the samples
were Carbon Disulphide, banned in 1991, DDT, banned in 1978 and Dieldrin,
banned in 1973.
Food matrices were identified as 16 samples of fruits with major
contribution from pome fruits (apple, pear) and 20 samples were constituted
by vegetables with high number of fruiting vegetable (Solanacee), the
remaining samples were spices and herbs.
Baby food
During the years 2004-2008, 16 samples of baby food were also
analysed; the concentration of pesticide residues were found below the MRL.
Samples of baby food covered food and milk for infants milk formulas, soy
milk, biscuits for weaning, creams for weaning, nectars and fruit juices for
weaning, homogenized, mixed weaning foods, cakes and pastries for
weaning, products for children for special diets and other products for
weaning foods for early childhood.

34
C
onclusions
The data of the official control plan on pesticide residues in food of
plant origin showed for the years 1996-2008, that the number of samples
analysed by the official laboratories of the Lombardy Region, is equal to 9387
the overall number of samples is higher than the minimal number set by
Ministerial Decree of 23 December, 1992 (23 December 1992).
The number of irregular samples was equal to 135 with a percentage
of irregularity equal to 1%.
Samples exceeding maximum residue limits (MRL) are considered
irregular as established by Council Regulation 396/2005/EEC (639/2005/EEC)
which has harmonised across all EU countries such limits. These limits are
set taking into account all categories of consumers including vulnerable
groups such as children and vegetarian and include all the European diets.
The values of MRLs were established in accordance with an assessment
made by ' EFSA risk assessment using models of acute and chronic, and for
each active substance were considered toxicological parameters most critical
to an assessment more conservative risk for the consumer.
The number of samples without residues was equal to 6882 (69%),
the number of samples with residues within the legal limit was 2968 (30%).
Taking into consideration the number of irregular samples through the
years in consideration, it remained unchanged (1%) in relationship to a
continuing raising number of analysed samples in each year. This success is
attributable in part to the activities of regional structures permanently engaged
in official control plant protection products in Lombardy and in part to constant
revision strictly made by the Italian Ministry of Health and a growing
awareness of operators in the use of agricultural pesticides.
Special attention is devoted to investigating samples of fruit and
vegetables contain more active, which were 1078, the 11% of the total
analysed samples.
It must be emphasised that the occasional overcoming of legal limit
(MRL) does not entail any danger to consumer health, when compared with to
the appropriate reference value (ADI or ARfD). The trend in irregularity
showed a progressive improvement in terms of food safety.

35
Monitoring of Pesticide Residues in Organic Food of Plant Origin in Lombardy (Italy)
The following chapter of the thesis is represented by a scientific article
written in collaboration with co-workers and published in Journal of
Environmental Science and Health, Part B (Pesticides, Food Contaminants,
and Agricultural Wastes) in 2007 (Tasiopoulou, S. et al. 2007).
Abstract
Organic agriculture, with its restrictions on the use of synthetic
chemical inputs, seems to offer a low-residue alternative to conventional
methods. In Europe, the Council Regulation n. 2092/91/EEC regulates the
production and trade of organic products and foodstuffs; national and regional
legislation in Italy gives specific guidance on the surveillance of organic
agriculture. However, monitoring of specific chemical residues in organic
foodstuffs is part of the regular controls on food, aiming to safeguard
consumer’s health.
Monitoring programs are coordinated at the national level by the
Ministry of Health and at local level by Regional authorities. In Lombardy, in
accordance with the provisions of the General Directorate of Health of the
Region and under the supervision of the 15 Local Health Units, a monitoring
program of pesticide residues in food of plant origin is undertaken every year.
The International Centre for Pesticides and Health Risk Prevention (ICPS), on
behalf of the General Directorate of Health of the Region of Lombardy, has
been collecting and elaborating the data resulting from the analysis of food
samples, carried out by the local laboratories. During the period 2002–2005, a
total of 3508 samples food of plant origin were analyzed for pesticide
residues, among which were 266 samples of organic farming products.
Commodities were classified into groups (citrus fruits, legumes, vegetables,
potatoes, processed products, cereals, and fruit other than citrus) and the

36
outcomes of the analyses were reported by year, origin of the sample and
presence/absence of pesticide residues. Results showed that the vast
majority of organic farming products were in conformity with the relevant
legislation and did not contain detectable pesticide residues. A limited amount
of samples had residues at concentration below the Maximum Residue Limit
(MRL). Only in one sample the residue level was above the MRL, however it
did not pose a concern for public health, as demonstrated by the outcomes of
dietary risk assessment. Organic fruits and vegetables can be expected to
contain fewer agrochemical residues than conventionally grown alternatives.
There is a widespread belief that organic agriculture products are
safer and healthier than conventional foods. It is difficult to come to
conclusions, but what should be made clear to the consumer is that “organic”
does not automatically equal “safe”. In the absence of adequate comparative
data, additional studies in this area of research are required.
Key Words: organic food, pesticide residues, monitoring, fruits and
vegetables, consumer risk assessment.
Introduction
Over the last years, increased awareness of food safety issues and
environmental concerns has contributed to the growth of organic farming as
an ecological production management system that sustains the health of
ecosystems from the smallest organisms to human beings and enhances
biodiversity and ecological harmony. Organic agriculture, with its restrictions
on the use of synthetic chemical inputs such as synthetic pesticides and
fertilizers, seems to offer a low-residue alternative to conventional methods
and interest of consumers in organic food products is rapidly growing (Sahota,
A. 2004 and Richter, T. 2005)
The preference of consumers for organic food has been associated
with multiple factors, such as personal health, animal welfare, and
environmental protection. However, health-related issues seem to assume
greater importance than other concerns (Saba, A. 2003). In a recently
published Eurobarometer survey (Eurobarometer 2006) measuring people’s
37
concerns associated with food, 42% of the Europeans consider it likely that
the food they eat will damage their health. The presence of pesticides in food
is clearly regarded as a potential risk for human health and 70% of EU
citizens declare that they are “worried” about pesticide residues in fruit,
vegetables or cereals (28% “very worried” and 42% “fairly worried”).
Consumers’ belief that organic agriculture products are safer and
healthier than conventional foods was also reflected in an Italian study on
perceptions and motivation in purchasing organic products, in which
consumers associated organic products with health and healthy eating.
Although these products were regarded as rather expensive, most of
the consumers judged them positively (Zanoli, R. 2002). This perception is
mainly due to the principles associated with organic food production.
In Europe, the Council Regulation EEC n. 2092/91 (91/2092/EEC),
concerning production and trade of organic products and foodstuffs, regulates
the organic production of unprocessed and processed agricultural crop and
livestock products. According to the principles laid down by this Regulation,
pest management should be based on a combination of mechanical and
agronomical practices; only in case of immediate threat to the crop, recourse
to plant protection products is permitted. The substances allowed as plant
protection products are listed in Annex II of the Regulation. The list includes
substances of plant or animal origin (e.g. pyrethrins, quassia, lecithin,
hydrolyzed proteins), substances for use in traps and/or dispensers
(pheromones, metaldehyde, pyrethroids), biocontrol microorganisms (e.g.
Bacillus thuringiensis), preparations to be surface-spread, and other
substances traditionally used in organic farming (copper hydroxide, potassium
permanganate, sulphur, paraffin and mineral oils). Moreover, the Regulation
describes the principles of the inspection system to be implemented by
Member States for controlling all stages in the organic production process.
In Italy, the inspection system is operated by private bodies, with the
task to check the consistency of the production methods with the organic
farming principles. Private bodies are authorized and supervised at the
national level by the Ministry of Agricultural Policy and Forestry under the
Legislative Decree (L.D.) n.220/95 (17 March 1995). Besides
inspections regarding the production method, organic foods are also
submitted to regular controls, with the purpose of safeguarding consumers’

38
health. In this respect, a national control program is implemented each year
under the coordination of the Ministry of Health–Directorate General for
Veterinary Health and Food, with the cooperation of the Regions (23
December 1992 and 30 July 1993). The monitoring programs are coordinated
at the local level by the Regional Authorities.
In Lombardy, the General Directorate of Health (Prevention Unit)
supervises the regional activities, whereas the operational implementation of
controls is handled by the Local Health Units (LHU). The International Centre
for Pesticide Safety and Health Risk Prevention (ICPS), under the mandate of
the regional General Directorate of Health, collects the pesticide analyses
results in order to perform dietary risk assessment for pesticide residues in
foods of plant origin.
The objective of this paper is to report the results obtained from the
analysis of the pesticide residues in organic food samples in Lombardy during
the period 2002–2005. The findings will be analyzed in the light of the general
frame of the regional monitoring program of pesticide residues in foodstuff of
plant origin. Moreover, it is intended to address the question of safety of
organic products for the consumer, by performing a dietary risk assessment
when, based on the results, this is considered necessary.
Materials and Methods
In accordance with the provisions of the General Directorate of Health
of the Region of Lombardy, a defined number of samples were analyzed
within the frame of the monitoring program of pesticide residues in food of
plant origin. The local laboratories examined both conventional and organic
farming products, and delivered their findings to the 15 Local Health Units of
the Region: Bergamo (BG), Brescia (BS), Como (CO), Cremona (CR), Lecco
(LC), Lodi (LO), Milan (MI1, MI2, MI3, MI Città), Pavia (PV), Sondrio (SO),
Valle Camonica-Sebino (VCS) and Varese (VA). Each year, the laboratories
were required to provide the list of the active substances analysed, together
with the results of the analyses performed. The findings were reported in an
apposite form in which the following information was included for each
sample: commodity analyzed, sample origin (Lombardy, rest of Italy, rest of

39
Europe, non-EU countries), result of the analysis. The samples with pesticide
residues above the limit of detection (LOD) were characterised by the name/s
of the active substance/s detected and respective concentration in mg/kg;
samples with pesticide residues above the national MRL (19 May 200 and 27
August 2004) were identified as irregular.
The International Centre for Pesticide Safety and Health Risk
Prevention (ICPS), on behalf of the regional General Directorate of Health,
has been collecting the pesticide analyses results provided by the Local
Health Units. Since 1996, results have been stored in a Microsoft ACCESS
database, which was created for this purpose. The Centre elaborates and
subsequently communicates aggregate statistics to the general public through
its web site (http://www.icps.it).
During the period 2002–2005, a total of 3508 samples were analyzed
for pesticide residues, among which were 266 samples of organic farming
products. It should be mentioned that the control of pesticide residues in
organic food was launched in 2002.
For the purpose of this study, the data on samples of organic
foodstuffs were extracted from the Microsoft Access database into an EXCEL
spreadsheet in order to carry out a statistical analysis. The raw commodities
were classified into groups (citrus fruits, legumes, vegetables, potatoes,
processed products, cereals, and fruit other than citrus). The outcomes of the
statistical analysis were reported by food group, year, and origin of the sample
and presence/absence of pesticide residues.
An exposure assessment was performed in the case where the
concentration of the pesticide was above the MRL. The estimation of long-
term exposure was performed for two different groups of the Italian population
(adults, children and toddlers), based on the average consumption data
(Turrini, A. et al. 2001) and average body weight values reported previously
(66, 51 kg for adults and 41, 61 kg for children/toddlers, respectively). The
chronic dietary intake of pesticide residues was calculated as follows:
Residue Intake (mg/kg bw/day) = Residue Concentration (mg/kg) ×
Food Intake (kg/day)/Body Weight (kg).
An acute exposure assessment was performed taking into account
the National Estimated Short-term Intake (NESTI) (WHO 1997) as calculated
on the basis of the consumption data for the 97.5th percentile of the Italian

eaters’ population (adults and children/toddlers) (WHO 1998). The unit weight
used in the calculation was derived from the GEMS/FOOD database (WHO
1998) while a variability factor of 7 was applied.
The calculated dietary intake values were compared to the relevant
toxicological endpoints (acceptable daily intake, ADI and acute reference
dose, ARfD), established for the pesticide of interest. The estimated dietary
intake should be less than the established toxicological value (or less than
100%, when expressed as a percent of the toxicological value).
Results During the period 2002–2005, within the frame of the pesticides
monitoring program implemented by the 15 Local Health Units in the region of
Lombardy, 3.508 samples of food of plant origin have been analyzed. Among
them, 266 (7.6%) were of organic origin (4.6% in 2002, 9.3% in 2003, 9.2% in
2004 and 7.4% in 2005). A summary of the overall results of the program
(total number of samples with residues above the MRL), regarding both
conventional and organic food samples, is provided in Table 6.
Table 6: Results of the monitoring program of pesticide residues in Lombardy (2002–2005): total number of samples, samples with detectable pesticide residues [single and multiple residue, residue above the maximum residue limit (MRL)]. Ye
2002 2003
2004
2005
T
* Multi-residue samples
o
ar Conventional Organic Conventional Organic Conventional Organic Conventional Organic
755 36 210 (62)* 3 545 33 8 -
666 68 178 (58)* 2 (1)* 488 66 8 1
771 78 220 (96)* - 551 78 9 -
1050 84 266 (70)* 2 (1)* 784 82 11 -
tal 3242 266 874 (286)* 7 (2)* 2368 259 36 1
Number of samplesSamples with pesticide
residues Residues < LOD Residues > MRL
40
The number of conventional and organic samples analysed and
reported per year in every Local Health Unit by the analytical laboratories
involved in the program, is shown in Table 7. It should be remarked that in
general, higher numbers of food samples analysed correspond to more
densely populated areas.

Table 7: Number of samples analysed and reported during 2002–2005 per Local Health Unit in the region of Lombardy and percentage of the population.
Conventional (Organic) Total
Conventional (Organic) Total
Conventional (Organic) Total
Conventional (Organic) Total
BG 150 (22) 172 111 (26) 137 110 (29) 139 242 (38) 280 10,6BS 7 (2) 9 29 29 113 (1) 114 104 (2) 106 11
CO 66 66 61 61 62 62 64 64 5,9CR 37 37 36 (3) 39 37 (2) 39 43 (3) 46 3,7LC 21 21 18 (1) 19 24 24 24 24 3,4LO 8 8 19 (1) 20 17 (3) 20 26 (3) 29 2,2MILANO Città 140 140 91 (15) 106 114 (26) 140 108 (22) 130 14,5MI 1 53 53 49 49 67 67 85 85 10,2MI 2 2 2 42 (3) 45 33 (1) 34 56 (3) 59 5,7MI 3 9 9 - - 29 29 34 (2) 36 11,1MN 77 77 42 42 - - 62 62 4,1PV 86 (10) 96 58 (16) 74 61 (16) 77 69 (11) 80 5,5SO 44 44 42 42 42 42 26 26 2VA 36 (1) 37 65 (3) 68 58 58 98 98 1,1VCS 19 (1) 20 3 3 4 4 9 9 9TOTAL 755 (36) 791 666 (68) 734 771 (78) 849 1050 (84) 1134 100
2002 2003 2004 2005
% Tot Population
The number of active substances analysed by the laboratories during
the same period is reported in Table 8. Unfortunately, although all laboratories
were requested to supply the list of active substances for which analysis was
performed, in some cases this information has not been provided. In total,
taking into consideration the overlapping analytical capabilities, the number of
different active substances analyzed in Lombardy was 194 in 2002, 191 in
2003, 203 in 2004 and 209 in 2005.
Table 8: Number of active substances analyzed per year in Lombardy laboratories (2002–2005).
41
BG BS CO CR LC LO MILANO Città MI 1 MI 2 MI 3 MN PV SO VA VCS
2002 79 - 112 74 61 124 125 21 - - 54 25 9 39 -
2003 70 - 114 71 78 125 125 30 118 - - - - 43 33
2004 69 - 114 61 32 141 150 - 136 - - 28 - - -
2005 68 - 112 70 28 142 127 32 142 - - 34 68 23 71
The different types of organic commodities sampled were classified
into seven groups, as shown in Table 9: citrus fruits (20), legumes (4),
vegetables (40), potatoes (27), processed products (90), cereals (36), and
fruit other than citrus (49). The most frequently sampled foodstuffs were
processed products such as pasta, biscuits, fruit and vegetable juices,
cornflakes and flour (34%). Rice samples represented the majority of cereals
sampled (32), and 12% of the total samples.

Table 9: Number and percentages of organic food commodities sampled in the period 2002–2005 in Lombardy, divided in seven classes.
2002 2003 2004 2005 Total % Total
Citrus Fruit 1 6 6 7 20 7,5
Fruits (other than citrus) 1 14 15 19 49 18,4
Legume - 3 1 - 4 1,5
Vegetable 3 8 16 13 40 15
Potato 3 3 11 10 27 10,2
Processed Product 18 24 19 29 90 33,9
Cereal 10 10 10 6 36 13,5
Total 36 68 78 84 266 100
Approximately 29% of the collected samples originated from
Lombardy, 62% from Italy excluding the area of Lombardy, and only a limited
number from EU countries (except Italy) and non-EU countries (2,6% and 3%
respectively) (Figure 5).
Figure 5: Origin of organic foodstuffs sampled (total number of samples = 266) during the period 2002–2005, in percentage.
Origin of organic foodstuffs samples
62%
3%
28,90%
2,6%3,4%
Lombardy
Italy
EU
Extra‐EU
Unknown
42
Only seven out of 266 organic farming samples contained pesticide
residues above the LOD; the active substances detected belong mainly to
organophosphorus compounds (Table 10). In two cases multi-residue
samples were identified; in one sample of potato four different pesticides were
detected (permethrine, tetradifon, dicofol, bromopropylate), whereas one

apple sample was found to contain residues of two active substances
(Azinfos-methyl and Carbaryl). In all cases, the concentrations were below the
MRL, with the exception of the potato sample were the concentration of one
active substance (dicofol) was above the MRL.
Table 10: Lombardy, 2002–2005: samples with detectable pesticide residues, by year, origin, name of active substance detected and chemical class, MRL, residue concentration (expressed in mg/kg of food) and Limit of Detection (LOD).
Commodity OriginActive Substance Chemical Class
MRL Italy (mg/kg)
Residue (mg/kg)
LOD (mg/kg)
Mandarin Unknown Primiphos Methyl Organophosphorus 2 0,2 0,01
Rice Italy Primiphos Methyl Organophosphorus 5 0,02 0,01
Rice Italy Primiphos Methyl Organophosphorus 5 0,02 0,01
Kiwi Extra EU Permethrin Synthetic pyetroids 0,05 0,03 0,01
Permethrin Synthetic pyetroids 0,05 0,006 0,05
Tetradifon Organophosphorus 1,5 0,044 0,01
Dicofol Organochlorine 0,02 0,06 0,01
Bromopropylate Benzylate 0,05 0,012 0,01Lemon Italy Methidathion Organophosphorus 2 0,22 0,01
Azinphos Methyl Organophosphorus 0,5 0,06 0,02Carbaryl Carbamate 3 0,98 0,05
2002
2003
2005Apple Lombardy
Potato Italy
The active substances detected in the samples are not included in
Annex II of the Council Regulation 91/2092/EEC (91/2092/EEC) and therefore
not allowed in organic agriculture. Furthermore, regardless of the fact that
their use is only allowed in conventional agriculture, it is reminded that as all
plant protection products utilised inside the European Union, these should be
authorized under the principles laid down by the Council Directive
91/414/EEC (91/414/EEC). The Directive lays down uniform rules on the
evaluation, authorisation, placing on the market and control, within the EU, of
plant protection products and the active substances they contain; only
products whose active substances are listed in Annex I of the Directive are
authorised.
43
In the case of dicofol, where during the monitoring period 2003, the
concentration of residues found in organic potatoes was above the MRL (0.06
mg/kg), a consumer risk assessment was performed. It should be mentioned
that the European evaluation for dicofol for inclusion in Annex I of Council
Directive 91/414/EEC is still pending (SANCO 2006), and an Acute Reference
Dose (ARfD) has not been set. The Acceptable Daily Intake (ADI) was
reported at 0.002 mg/kg bw/day (FAO 1992).

Chronic dietary risk assessment (Table 11) performed on the basis of
the average consumption data for potatoes for two groups of the Italian
population (adults, children and toddlers) (Turrini, A. 2001) shows negligible
risk for consumers’ health, since dicofol intake is far below the ADI, both for
adults (3.5% ADI), and children and toddlers (5%).
Table 11: Chronic dietary exposure of Italian population (adult, children and toddlers) to dicofol found in organic potatoes (monitoring period 2003; residue concentration: 0,06 mg/kg). A Chil
Body Weight (kg)
Potato Consumption (g/day)
Dicofol Intake (µg/kg bw/day)
% ADI
dult (18-64 years old) 66,51 78,7 0,071 3,5
dren and Toddler (1-17 years old) 41,61 72,1 0,104 5
Regarding acute exposure to dicofol residues, in absence of an
established ARfD, a “worst-case scenario” was considered, in which the ADI
value was used as the ARfD. Results in Table 12 show that the calculated
acute consumption, expressed as a percent of the toxicological endpoint, was
below 100%. Table 12: Acute dietary exposure of Italian population (adult, children and toddlers) to dicofol found in organic potatoes during the monitoring period 2003 (residue concentration 0.06 mg/kg, variability factor 7).
Body Weight (kg)
Large Portion (g*)
Unit Weight (g**)
NESTI (mg/kg bw/day)
% ARfD
Adult (18-64 years old) 66,51 457 0,071 0,00128 63,9
Children and Toddler (1-17 years old) 41,61 394 0,104 0,00195 97,6
*Italian population consumption data
*
* French data
44
45
C
onclusions
In spite of being properly grown and processed, organic foods are not
necessarily free from pesticides and other synthetic chemicals of conventional
farming (Magkos, F. et al. 2006). Contamination may be due to cultivation on
previously contaminated soil, percolation of chemicals through soil,
unauthorized use of pesticides, cross-contamination by wind drift, spray drift
from neighbouring conventional farms, contaminated groundwater or irrigation
water, or even occur during transport, processing and storage. Presence of
synthetic chemicals, however, does not necessarily preclude that the food can
be described as organic, providing all requirements related to the production
process have been fulfilled. Organic fruits and vegetables can be expected to
contain fewer agrochemical residues than conventionally grown alternatives.
In our study, the comparison of the monitoring results obtained from
conventional and organic food samples showed a 10-fold greater
contamination in conventional products (27%) compared to organic food
samples (2.6%). Results were similar regarding the presence of multiple
residues, present in 0.8% of organic and 8.8% of conventional food samples
and in agreement with the findings from other studies (Baker, B.P. et al.
2002). In the region of Lombardy, the concentrations of pesticides detected in
organic commodities were in their greatest part below the MRL set for
conventional products. Only in one sample (organic potatoes), the detected
residues were above the MRL; yet the intake of the active substance (dicofol),
as calculated for two groups of the Italian population, was far below the ADI
(adults 3,5% ADI, children and toddlers 5%). During the same monitoring
period, dicofol residues were detected in 20 samples of conventional food
products, including potatoes. Dicofol concentrations were below the MRL, with
the exception of two samples (pears and strawberries). Therefore, in an
attempt to compare organic and conventional foodstuffs in terms of potential
risks for human health due to dietary exposure to pesticide residues,
conclusions cannot be drawn easily, since in both cases the presence of
residues above the set MRL is very low.
The outcomes of the monitoring program of pesticide residues
implemented by the Region of Lombardy under the mandate of the Ministry of
46
Health and with the cooperation of the Local Prevention Units and local
laboratories, demonstrate that public health has been safeguarded with
success in the recent years. There is a need for more detailed information on
analytical methodologies that were used in some of the laboratories .
Moreover, given the fact that the complete dataset resulting from the
monitoring program is collected and available for elaboration only after the
end of each annual monitoring period, improvements in the flow of information
are regarded as a prerequisite for checking the completeness of the
information provided. It maybe be mentioned that presently actions are being
taken in the Region of Lombardy in order to improve the current practices.
Furthermore, future efforts will be continued in this direction in order to
maintain consumers’ trust.
Acknowledgments
The authors wish to express their gratitude to Ms. Romilde Balsa
(ICPS) for her help in data analysis, to Dr. Maurizio Ronchin for helpful advice
and to Maurizio Salamana and Luigi Macchi (Region of Lombardy, General
Directorate of Health, Prevention Unit) for supporting ICPS participation in the
regional monitoring programme of pesticide residues in foodstuffs.

47
Deterministic Risk Assessment
In the field of food safety the risk assessment process is established
as a means of providing an estimate of the probability and severity of the
occurrence of an adverse effect attributable to a particular agent. It should be
noted that risks can be prevented and not hazards; the latter being an intrinsic
property of an agent. Moreover, the knowledge acquired may be also useful in
deciding on the most effective intervention strategies.
Risk assessment is defined as a scientifically based process
consisting of the following four steps: i) hazard identification; ii) hazard
characterisation; iii) exposure assessment; and iv) risk characterisation.
Hazard identification is the identification of the nature of adverse
effects that an agent has as inherent capacity to cause in an organism,
system or (sub) population. The step of hazard identification involves a series
of in vitro and in vivo studies to define the potential adverse effects of the
chemical substance.
The step of hazard characterisation is concerned to define the
dose/concentration - response relationship, in order to establish an
acceptable intake level, which would be without significant health effect. For
dietary intake, hazard characterisation can lead to the definition of references
values: the Acceptable Daily Intake (ADI) for chronic effects and the Acute
Reference Dose (ARfD) for acute effects. The ADI expresses the amount of
chemical that can be consumed every day for a lifetime without harmful effect,
whereas ARfD is the amount of a chemical that can be consumed in a short
period of time (one meal or one day) without harmful effects. The critical effect
is to be considered in the appropriate study from which the intake dose level
that may be consumed without effects from the experiment animals is derived.
This level is called the No-Observed Effect Level (NOEL). For humans, the
ADI and ARfD values are extrapolated by dividing the NOEL from the
appropriate chronic or short-term studies by a safety factor, which accounts
for the inter- and intra-species (human variability) differences. Most frequently,
a default safety factor of 100 (10 x 10) is applied (Graham, J.D. 1995).

48
Exposure assessment is the evaluation of the exposure of an
organism, system or (sub) population to an agent (and its derivatives). For
assessing exposure, it is necessary to specify the amount or concentration of
the particular agent that reaches a target organism, system or (sub)
population in a specific frequency for a defined duration. In this case,
exposure assessment concerns the intake of the substance through diet,
which should be defined in terms of concentration of the substance in food
and both of food consumption.
Finally, the risk characterisation step involves the determination,
including uncertainties, of the probability of occurrence of known and potential
adverse effects under defined exposure conditions. Risk characterisation is
performed by comparing the estimate of exposure to the safe exposure limit,
in this case the ADI or ARfD, for chronic and short term risk respectively.
Introduction
To assess dietary exposure to pesticides it is essential to characterise
two main components, food consumption and residue levels of pesticides in
food. By combining the two, it is possible to construct intake models that will
provide valid exposure estimates. The exposure assessment to pesticide
residues through diet significantly differs from the assessment made for other
chemical substances such as food additives. This is due to the fact that for
pesticides the exposure estimates might be health based and these should be
compared to exposure estimates to draw conclusions on risks for health.
Estimating Food Consumption
Estimates of food consumption can be summarised by different
parameters, for instance average daily consumption, portion sizes, percentile
consumption value related to the total population and “eaters-only” (persons
that actually eat the commodity). For predicting long-term exposure, long-term
consumption habits and not daily variations must be reflected, thus average
daily consumption is commonly used. Examples of food consumption
databases used for dietary assessment of chronic pesticide intake are the

49
World Health Organisation /Global Environment Monitoring System
(WHO/GEMS) GEMS/Food Consumption Cluster Diets (WHO, revised
August 2006), the German diet database (Banasiak, U. et al. 2005 - revised
July 2009) and the UK Food consumption databases used within the UK
Consumer model (Pesticide Safety Directorate, version 1.1, 2006).
Characteristics of these food consumption databases regarding age strata
and body weights of the population groups under study are shown in Table
13.
Table 13: Food consumption databases used for dietary assessment of chronic pesticide intake for authorization of pesticides at European level.
Guideline and Diet Population group
(age and body weight)
WHO Guidelines (1997)
WHO Cluster Diet
(WHO, 2009)
Adult (60 kg bw)
WHO Guidelines (1997)
German diet (July, 1992)
Children, 2 - 5 years
(16. 5 kg bw)
UK Consumer Model
(PSD, 2006)
UK Diet
10 population groups: Adult, Child
(4 classes), Infant
Toddler, Elderly (2 classes)
As regards to the assessment of the acute hazard of pesticide intake,
the large amount likely to be consumed in one occasion or in one day (24
hours) is taken into account, based on consumption survey data for
individuals for a certain percentile, usually the 97.5th percentile of eaters only.
Consumption databases more broadly used for the assessment of acute
intake are the GEMS/ Food data sets used by the Joint FAO/WHO Meeting on
Pesticide Residue (JMPR) to assess short-term dietary intake of certain

50
pesticide residues (http://www.who.int/foodsafety/chem/acute_data/en/) and
the UK diet (PSD 2006) for adults and toddlers.
National food consumption databases exist in other European
countries (Denmark, Finland, France, Germany, Italy, Sweden, the
Netherlands, Czech Republic) and world-wide (US, South Africa, New
Zealand, Australia) (Boon, E. and van Klaveren J. 2005).
Methods used for data collection and construction of food consumption databases
Sources of food consumption data used for the dietary assessment of
contaminants in general and of pesticides more specifically, include food
supply data, data from household consumption surveys (household budget
method), data collected from individuals and duplicate diets.
- Food supply data, Food Balance Sheets (FBS) is provided at
national level and records annual production of food, changes in stocks,
imports and exports resulting to an estimate of the average value
consumption per capita. FBS give a crude indication where average
consumption is slightly over estimated, since waste at the household or
individual level is not considered. For example, in the worst cases e.g. for
fruits and vegetables it was noted that FBS data are 15% higher than actual
consumption compared to detailed national surveys. Moreover, total values
for some food groups may be sometimes listed as duplicate entries.
International FBS are provided by the FAO (FAOSTAT database), the
Organisation for Economic cooperation and Development (OECD) and the
Statistical office of the Commission of the European Union-ECE Statistical
Division (EUROSTAT). Even though these FBS are compiled in a similar
manner, they may be different in food grouping, foodstuffs covered and level
of processing of commodities. National FBS compiled by some countries are
usually less up-to-date and differ from the international ones.
Using the data from selected FAO Food Balance Sheets, the
GEMS/Food Programme (Global Environment Monitoring System - Food
Contamination Monitoring and Assessment Programme) implemented by the
WHO has developed 13 cluster diets
(http://www.who.int/foodsafety/chem/countries.pdf) comprised of raw and

51
semi-processed food commodities. These diets are used at international level
for assessing long-term dietary intake of contaminants and other agents in
food (WHO, 2006). Household budget surveys provide information regarding
food availability at the household level, by measuring the purchases of food in
terms of expenditure, without further information on the distribution of foods
among individual members of the household. Household data may help to
refine estimates of the FBS (Kroes, R. et al. 2002).
- Individual dietary surveys
Methods that provide information at individual level are more realistic
and can be used to increase sensitivity of the crude estimates. Several
methods can be used to collect individual dietary data, either by recalling or
recording food consumption. Record methods collect information on food
intake over one or more days (usually 1-7). Recall methods provide past
consumption over the previous day (24 hours recall) or usual food intake
(dietary history or food frequency). In food records or food diaries the amounts
are recorded by weight after calculating the weights of all ingredients used in
the preparation of meals, inedible waste, and cooked weight of the individual
portions. In the 24 hours recall method the interviewed subject is asked to
recall and describe all food consumed in the previous days, and quantities are
usually assessed compared to household measures (e.g. tablespoons etc),
food models or photographs. Food frequency questionnaire (FFQ) is a
method for assessing food intake over a specified period (daily, weekly,
monthly, yearly), consists of a structured questionnaire containing lists of
individual foodstuffs or food groups and can be qualitative, semi-quantitative
or completely quantitative. Duplicate diet studies, where a duplicate of the
foodstuffs consumed is analysed in the laboratory for determining the level of
a chemical of interest, have been performed less often. These studies, being
more accurate, are used in some cases for the validation of the outcomes of
other dietary assessment methods (Kroes, R. et al. 2002).
52
Considerations on food consumption databases
The different methods for estimating dietary intake provide different
refinement levels of outputs, spanning from crude per person consumption to
detailed individual information. Therefore, they can be used in different
circumstances depending on the final aim.
One issue of concern is the fact that existing databases usually
considered for dietary risk assessment of pesticide residues are constructed
for performing studies on nutritional status of individuals. Thus, they have
different aims and consequently their design and points of interest may not be
identical. For instance, nutritional studies require data on consumption of total
energy, macro and micronutrients, types of lipids etc. whereas other aspects
may not be addresses. In contrary, other data would provide useful
information for pesticide dietary assessment. This could be for example
specific type of fruit or vegetables consumed (e.g. data from apples may differ
from peaches etc.), consuming practices (peeled, raw, cooked), up to more
detailed data on specific food brands and origin of foods. Moreover,
databases developed for risk assessment of pesticide residues require the
conversion of food consumed into raw agricultural products. As a result,
cooking or other types of food processing are to be taken into account while
further translation of meals involves the creation of recipe databases. This last
point should be addressed at national level, since the dietary habits may
significantly differ between different countries. Also differences in
consumption of certain food groups may be due to seasonal fluctuations (e.g.
types of fruits and vegetables).
Importance should be given also to specific population groups that are
likely to have different consumption patterns but also can be considered more
sensitive in respect to the general population as infants and children. For
example, it has been noted that the diet of infants and children is composed
from a higher percentage of fruits and vegetables compared to adolescents.
Food consumption patterns are possible to differ also in some groups of the
population due to other reasons (religious practices, location, socio-economic
characteristics, beliefs etc.).

53
Estimating Pesticide Residue Levels
Depending on the purpose of the dietary intake assessment, residue
data from supervised trials and surveillance programs may be used. Prior to
pesticide authorization, the estimation of intake is based on the results of
supervised residue trials performed for this purpose. In the post-marketing
ssessment of dietary intake monitoring data can be used. a
Supervised residue trials
Supervised residue trials are performed in accordance to specific
guidelines, in order to assure results to be representative of specific Good
Agricultural Practices (GAP). Prior to approval, the potential intake of a
pesticide is considered in order to ensure that the exposure levels would not
exceed the ADI or ARfD values, and Maximum Residue Limits (MRLs) are
proposed accordingly. MRLs represent the maximum concentration of a
pesticide residue (expressed as mg/kg) legally permitted if detected in food
commodities. MRLs are not proposed according to ADI or ARfD and do not
represent toxicological limits but are set on the basis of good agricultural
practices that is to say, they represent the safe level when good agricultural
practices are followed. Nevertheless, when setting MRLs, justification is
required based on estimations of chronic and acute exposure through diet by
applying appropriate dietary intake models. Thus, toxicological concerns are
also taken into account in order to safeguard consumers’ health.
M
onitoring data
Monitoring data refers to data gathered from monitoring programs,
which are intended to control compliance to the correct use of pesticides and
safeguard consumer’s health. These programs may have different
characteristics and outcomes depending on their final aim. For instance, the
U.S. FDA monitoring programme includes regulatory monitoring for
surveillance purposes, and incidence/level monitoring to obtain knowledge
54
about pesticide/commodity combinations of particular interest (U.S. FDA,
Centre for Food Safety and Applied Nutrition, Pesticide Program for Residue
Monitoring, 1995-2002). Monitoring data are expected to give less
conservative and more realistic estimates, since the values recorded are
usually lower than the values from supervised field trials.
Several considerations can arise on monitoring data. For instance,
when data is available from more than one year there is the question of the
data to be selected for assessing dietary exposure e.g. data for how many
years should be used, how to treat differences between years or high values
due to elevated pressure from disease occurrence, which crops monitoring
results to include (e.g. all crops where the pesticide was found or crops where
the pesticide was applied) and the sampling scheme followed.
F
urther considerations on refinement of residue levels estimates
Further refinement while estimating the pesticide residues may be
achieved if the following points are considered:
• Residue values after processing
Residues in processed food are usually lower compared to the
original raw food commodity due to processing, commercial cooking and
preparation. In some cases the processes can result in higher concentrations
in specific fractions, for instance when converting fruit to pomace or extracting
oil from oil seeds. A number of pesticides are destroyed during heating or
boiling, but toxic degradation products may be formed in some cases.
Processing factors exist from the JMPR Evaluations of Pesticide Residues
and the monographs submitted for registration purposes, nevertheless the
latter being under confidentiality. In the coming years this information will be
available as foreseen in the recent EC regulation 396/2005.
• Limit of Detection
Another question applying in the case of monitoring data is the
evaluation of residue levels under the Limit of Detection. This do not
necessary means the absence of pesticide residues but the fact that
pesticides may be present at levels which could not be detected or reliably
quantified. For the estimates of dietary exposure it can be assumed that all
values under the limit of detection are equal to the LOD (worst-case

55
assumption) rather than zero, which would be the least conservative
approach. According to EPA consultations the middle way lies into applying
the ½ LOD value, however, a sensitivity analysis is suggested in order to
demonstrate the impact of using the different assumptions (EPA 1998).
Where residues are detected above the limit of detection, but below
the limit of quantification, a commonly used approach is to assign these
results a value of one half of the limit of quantification. If this is done, it is
recommended that a sensitivity analysis be performed to evaluate the effect of
this assumption.
It should be noted that in monitoring programmes, reporting levels are
often established at relatively high concentrations, as historically these
programmes have been used to monitor compliance with MRLs. A
consequence of dealing with censored data with high reporting levels for
several substances in several commodities may be significant uncertainty in
the intake estimates (EFSA 2008).
M
aterials and Methods
Deterministic models used for assessing chronic and acute exposure
to pesticides are based on point estimates of the amount of commodities
consumed per day and of the level of pesticide residues that can be
potentially detected in the commodities. Food consumption data is
represented by summary consumption statistics of regional and national
databases, while the choice of the residue statistics and the availability of
transfer factors determine the degree of refinement of the exposure estimates.
The point estimates of exposures are then compared with the toxicological
endpoints of interest (ADI or ARfD). In general, if the exposure estimate does
not exceed the acceptable intake, the substance is said to be of no concern
for consumers.

56
C
hronic intake models
Chronic intake models estimate long-term exposure to pesticide
residues through the diet. The most conservative model is the Theoretical
Maximum Daily Intake (TMDI), since it is assumed that all the amounts of the
commodity eaten have been treated and that residues were found at the
MRLs. Intakes are computed for every commodity in the diet treated with the
pesticide under evaluation. The sum of those intakes gives the overall
estimate of the TMDI (expressed as mg/kg bw/day). If the TMDI does not
exceed the acceptable daily intake set for that substance, the chronic intake
of that substance in the diet does not pose any concern to human health. On
the contrary, when the TMDI exceeds the acceptable toxicological endpoint, a
refinement of the chronic dietary exposure estimate is recommended.
The International Estimated Daily Intake (IEDI) and the National
Estimated Daily Intake (NEDI) provide a more realistic intake model, being
based on the assumptions of average daily food consumption per person and
median residues from supervised trials. Hence, the residue level in foodstuffs
is represented by a much lower value than the MRL. In addition, the
IEDI/NEDI calculation allows for the inclusion of other refinement factors such
as the transfer factors due to preparation, cooking or other types of food
processing. If the chronic refined estimate still exceeds the acceptable
toxicological endpoint the substance is said to pose concern to human health
ith regard to chronic intake of that substance through the diet (WHO 1997). w
A
cute intake models
Assessing acute dietary exposure is meaningful for substances that
have acute toxicity effects and an ARfD value has been established. The
International Estimated Short-term Intake values (IESTI) and the National
Estimated Short Term Intake (NESTI) are based on a large portion of a
commodity that is consumed on a single occasion or in one day. The large
portions are defined as the 97.5th percentile of the consumers of the
commodity and are obtained from food consumption survey data for
individuals. The acute intake model is intended to reflect the peak exposures

57
to pesticides through diet in one occurrence or in one day, in the events
where high residue levels in a food commodity occurs simultaneously with
high-level consumption of the certain food commodity. By definition the acute
exposure is computed for every commodity separately. Therefore, there might
be an overcoming of the established pertinent toxicological endpoint only for
some of the commodities in the diet, while for others the acute exposure is
considered acceptable. The algorithm of the model differs depending on the
type of the commodity consumed. It should also be noted that, when
considering single individual food items such as a single piece of fruit or
vegetable, the amounts of a residue might vary between the single units
composing a sample. On this basis, default variability factors are included in
IESTI/NESTI as a way of reflecting these variations (WHO 1997).
Depending on the data on consumption, the IESTI for each
commodity is calculated from the equation defined for each case, as
described below. The following definitions apply to all equations:
• LP: highest large portion provided (97.5th percentile of eaters), in kg
of food per day
• HR: highest residue in composite sample of edible portion found in
data from supervised trials data from which the MRL or STMR
was derived, in mg/kg
• HR-P: highest residue in the processed commodity, in mg/kg,
calculated by multiplying the HR in the raw commodity by the
processing factor
• bw: body weight, in kg, provided by the country for which the large
portion, LP, was used
• U: unit weight, in kg, provided by the country in the region where
the trials which gave the highest residue were carried out;
calculated allowing for the per cent edible portion
• v: variability factor represents the ratio of the 97.5th percentile
residue to the mean residue in single units. Default factors for
various commodities are listed below
• STMR: supervised trials median residue, in mg/kg
• STMR-P: supervised trials median residue in processed
commodity, in mg/kg
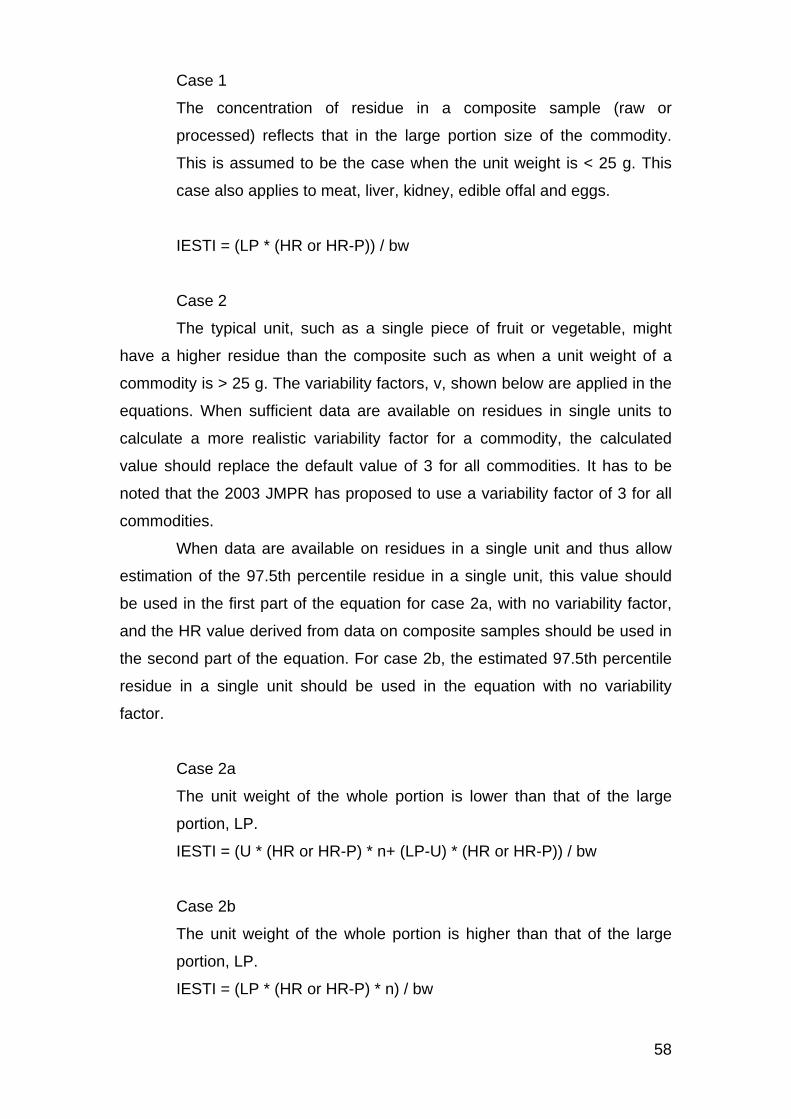
58
Case 1
The concentration of residue in a composite sample (raw or
processed) reflects that in the large portion size of the commodity.
This is assumed to be the case when the unit weight is < 25 g. This
case also applies to meat, liver, kidney, edible offal and eggs.
IESTI = (LP * (HR or HR-P)) / bw
Case 2
The typical unit, such as a single piece of fruit or vegetable, might
have a higher residue than the composite such as when a unit weight of a
commodity is > 25 g. The variability factors, v, shown below are applied in the
equations. When sufficient data are available on residues in single units to
calculate a more realistic variability factor for a commodity, the calculated
value should replace the default value of 3 for all commodities. It has to be
noted that the 2003 JMPR has proposed to use a variability factor of 3 for all
commodities.
When data are available on residues in a single unit and thus allow
estimation of the 97.5th percentile residue in a single unit, this value should
be used in the first part of the equation for case 2a, with no variability factor,
and the HR value derived from data on composite samples should be used in
the second part of the equation. For case 2b, the estimated 97.5th percentile
residue in a single unit should be used in the equation with no variability
factor.
Case 2a
The unit weight of the whole portion is lower than that of the large
portion, LP.
IESTI = (U * (HR or HR-P) * n+ (LP-U) * (HR or HR-P)) / bw
Case 2b
The unit weight of the whole portion is higher than that of the large
portion, LP.
IESTI = (LP * (HR or HR-P) * n) / bw

59
Case 3
When a processed commodity is bulked or blended, the STMR-P
value represents the probable highest concentration of residue. This case
also applies to milk.
IESTI = (LP * STMR-P) / bw
The application of variability factors is recommended when the typical
unit, such as a single piece of fruit or vegetable, might have a higher residue
than the composite sample (such as when a unit weight of a commodity is >
25g). Based on the Codex sampling design, default variability factors (v) were
recommended as listed in the table below (WHO 1997).
However, in 2003 JMPR has proposed to use a variability factor of 3
for all commodities. Moreover, recently, the European Food Safety Authority
has published an opinion on the use of variability factors based on studies on
supervised trial and market residue data. The analysis of the available data on
unit-to-unit variation in pesticide residues estimates the average variability
factor as 2.8 for supervised trials and about 3.6 for market surveys. EFSA
recommends that consideration should be given to using a default variability
factor based on supervised trials for IESTI and NESTI assessments (which
use supervised trial data), and a different default variability factor based on
market surveys (Opinion of the Scientific Panel on Plant health, Plant
protection products and their Residues on a request from Commission related
to the appropriate variability factor(s) to be used for acute dietary exposure
assessment of pesticide residues in fruit and vegetables (EFSA 2005). It is
noted that when sufficient data on residues in single units are available for the
calculation of a more realistic variability factor for a commodity, the calculated
value should replace the default value.
For the calculation of IESTI, the consumption data reported in the
latest version of WHO/GEMS database were applied, whereas for NESTI the
relative data were retrieved from the UK diet (WHO 2003). The risk
assessment for acute dietary intake was conducted by expressing the
IESTI/NESTI as a percentage of the established ARfD values.

Results
According to the database, only the samples with a concentration of
pesticide residues were taken into consideration, in this section of the thesis.
A total of 135 samples, from 1996 to 2008 were therefore found irregular;
among those the majority of food commodities (n=111) contained only one
detected active substance. However, in addition, 18 samples were found with
multiple residues of pesticides, ranging from 2 to 5, (n=18). However, no food
samples from organic farming were found with a pesticide concentration
above the legislative limit.
Within the food class with the highest number of irregular samples
were detected in vegetables, with a considerable amount of in leaf vegetable,
including various cultivar of lettuces, cabbages and spinaches. The details of
the irregular samples divided by food class are shown in Figure 6.
Food commodities containing irregular concentration of pesticides
34 12
11
19
88
11
11
14
3
2
4
BERRIES AND SMALL FRUIT
BRASSICA VEGETABLE
CEREAL
CITRUS FRUIT
FRUITING VEGETABLE
LEAF VEGETABLE
LEGUME VEGETABLE
ROOT AND TUBER VEGETABLE
STEM VEGETABLE
HERB AND SPICE
MISCELLANEUS FRUIT
POME FRUIT
STONE FRUIT
PROCESSED PRODUCT
Figure 6: Food commodities with a concentration of pesticides above the legislative limit; the results are expressed as percentage (%) and disaggregated by food classes.
60
In addition the irregular samples were also analysed according to their
origin, where resulted that the majority were from Italy, followed by samples
from extra European countries; the complete set of results are shown in
Figure 7.

Origin of food samples containing irregular concentration of pesticides
Lombardy 14
Italy (Excluding Lombardy)
43EU (Excluding Italy)
9
Extra EU 26
Unknown 8
Figure 7: Origin of irregular samples, the results are expressed as percentage (%).
Among these set of ‘irregular’ samples the most detected active
principles belonged to the functional classes of insecticides and fungicide, in
particular they were Dimethoate and Procymidone, respectively.
It is also relevant to mention that some of the irregular samples
contained active substances not included in Annex 1 of the EU Regulation
91/414, at the time of the sampling. For example, the fungicide Dichlofluanid
were found in 4 samples, from 2005 to 2008, whereas the decision of non-
inclusion in Annex 1 was taken in 2003. Therefore in these cases, in addition
to the possible risk for the health of the consumers, an offence of fraud could
be notified. A similar approach could be done for food samples containing
concentration of Bromopropylate and Parathion Methyl, found in 2003 and
2004. However the decision of non-inclusion, for those active substances was
taken in 2002 and 2003, respectively; therefore a certain amount of time is
given to the users to finish their stock of pesticides, before going out of trade.
A revised version of the model for calculating the acute and chronic
consumer exposure (revision 2), which includes additional features for refined
intake calculations, was used. The revised model, named PRIMO (Pesticide
RIsk assessment MOdel), merging information on 17 European Diets. It can
be downloaded at the EFSA website in the section related to MRL settings
(EFSA 2007) (http://www.efsa.europa.eu/en/mrls/mrlteam.htm).
61
In order to assess the consumers exposure (chronic and acute)
assessment of residue of pesticides in food matrices all the irregular samples

taken form the monitoring programme of the Lombard region were used. The
toxicological endpoints and the correspondent MRL coupling food matrix and
pesticide were collected from the EU Pesticide Database at:
http://ec.europa.eu/sanco_pesticides/public/index.cfm
The EFSA model can be used in two modes:
The first is to use it as a first "screening tool" based on conservative
assumptions. In this case the calculations for chronic and acute risk
assessment will be based on the MRL values.
The second mode is to perform "refined calculations" where the MRLs
are replaced by other values in the chronic and/or acute calculation
spreadsheet (e.g. STMRs, HR-values).
Therefore, a first series of run were performed using the current EU
MRL, coupling active principle and food commodities, to see if there is a
possible risk for the consumer, see Table 14, below.
Table 14: Exposure assessment of food commodities, using the EFSA PRIMo model and current MRLs (food commodity/active substances) as highest residue, expressed as mg/kg. Comparison with the toxicological endpoints for acute and chronic exposure (ADI of ARfD) is indicated.
Matrix Origin Active Substance MRLADI (mg/kg bw/day) Source
ARfD (mg/kg bw) Source %ADI Diet %ARfD
CHLOROTHALONIL 0,01 0,03 JMPR 1994 0,6 COM 2006 0 IT Adult 0
DITHIOCARBAMATE 5 0,006 COM 2004 0,08 COM 2004 31,4 IT Adult 168,2CHLOROTHALONIL 3 0,03 JMPR 1994 0,6 COM 2006 0,7 IT Adult 33
DITHIOCARBAMATE 1 0,006 COM 2004 0,08 COM 2004 1,2 IT Adult 82,6
CHLOROTHALONIL 0,01 0,03 JMPR 1994 0,6 COM 2006 0 IT Adult 0
DITHIOCARBAMATE 5 0,006 COM 2004 0,08 COM 2004 31,4 IT Adult 168,2Pear Lombardy DITHIOCARBAMATE 5 0,006 COM 2004 0,08 COM 2004 28,8 IT Kids/Toddler 569,2Courgette Italy DIELDRIN 0,02 0,0001 JMPR 1994 - - 3,6 IT Kids/Toddler -Wheat Lombardy DITHIOCARBAMATE 1 0,006 COM 2004 0,08 COM 2004 110,8 IT Kids/Toddler 18,1Lettuce Italy DITHIOCARBAMATE 5 0,006 COM 2004 0,08 COM 2004 31,4 IT Adult 168,2Grape Italy ENDOSULFAN 0,5 0,06 JMPR 2006 0,02 JMPR 2006 0,1 IT Adult 163,5Pear Italy DITHIOCARBAMATE 5 0,006 COM 2004 0,08 COM 2004 28,8 It Kids/Toddler 569,2Lemon Extra-EU IMAZALIL 5 0,025 EFSA 2010 0,05 EFSA 2010 0,6 IT Adult 344,5
IMAZALIL 5 0,025 EFSA 2010 0,05 EFSA 2010 9,6 IT Kids/Toddler 1326,2THIABENDAZOLE 5 0,1 JMPR 2006 0,3 JMPR 2006 2,4 IT Kids/Toddler 221IMAZALIL 5 0,025 EFSA 2010 0,05 EFSA 2010 9,6 IT Kids/Toddler 1326,2THIABENDAZOLE 5 0,1 JMPR 2006 0,3 JMPR 2006 2,4 IT Kids/Toddler 221
Lemon Unknown IMAZALIL 5 0,025 EFSA 2010 0,05 EFSA 2010 0,6 IT Adult 344,5Potato Italy CHLORPROPHAM 10 0,05 JMPR 2005 0,5 COM 2003 17,9 IT Kids/Toddler 307,5Potato EU CHLORPROPHAM 10 0,05 JMPR 2005 0,5 COM 2003 17,9 IT Kids/Toddler 307,5Mandarin EU IMAZALIL 5 0,025 EFSA 2010 0,05 EFSA 2010 4,2 IT Adult 556
IMAZALIL 5 0,025 EFSA 2010 0,05 EFSA 2010 0,6 IT Adult 344,5THIABENDAZOLE 5 0,1 JMPR 2006 0,3 JMPR 2006 0,2 IT Kids/Toddler 57,4
Apple Extra-EU THIABENDAZOLE 5 0,1 JMPR 2006 0,3 JMPR 2006 4,4 IT Kids/Toddler 163,3
Pear Italy CHLORPYRIFOS EHTYL 0,5 0,01 JMPR 2001 0,1 COM 2005 0,2 IT Kids/Toddler 455,4Lemon Unknown IMAZALIL 5 0,025 EFSA 2010 0,05 EFSA 2010 0,6 IT Adult 344,5
BIFENTHRIN 0,3 0,015 EFSA 2008 0,03 EFSA 2008 1,8 IT Kids/Toddler 98CYPERMETHRIN 1 0,02 JMPR 2006 0,04 COM 2004 4 IT Adult 244,9CHLORPYRIFOS 0,5 0,01 JMPR 2004 0,1 COM 2005 4,3 IT Adult 49DIPHENYLAMINE 5 0,075 EFSA 2008 - EFSA 2008 5,9 IT Kids/Toddler -PROPYZAMIDE 0,02 0,02 DIR 03/39 NOT APPL DIR 03/39 0,1 IT Adult -
Mandarin EU CHLORPYRIFOS EHTYL 2 0,01 JMPR 2001 0,1 COM 2005 4,2 IT Kids/Toddler 111,3Potato Italy CHLORPROPHAM 10 0,05 JMPR 2005 0,5 COM 2003 17,9 IT Kids/Toddler 307,5Potato EU CHLORPROPHAM 10 0,05 JMPR 2005 0,5 COM 2003 17,9 IT Kids/Toddler 307,5
Lettuce Lombardy
Flowering Brassica Lombardy
Orange Italy
Lettuce Lombardy
Orange Extra-EU
Lemon EU
Apple Italy
62

This table shows the correlation between European MRLs and the
toxicological endpoints for chronic (ADI) and acute (ARfD) exposure; the net results
are expressed as percentage of the mentioned endpoints. In this case only results
that may cause a risk for the consumers are highlighted (>100%). Therefore, it is
important to highlight that even using the current MRLs, which should constitute a
safe level for the consumer; a total of 34 cases may pose an unacceptable risk for
the population. In most of the cases the risk is linked to the acute exposure of
pesticides, only one case shows an unacceptable risk for chronic exposure.
However, two are the main parameters of this assessment: the first one is,
as mentioned before, the MRL, the second important parameter is represented by
the consumption of each commodity, according to the various available European
diets. Therefore, for a more accurate assessment, the Italian diet should be used
with the monitoring data of pesticides residues in food, from Lombardy region.
Unfortunately the Italian diet, especially for acute exposure, is not available for all the
assessed commodities; therefore the diet correspondent to the worst-case scenario
was used. This provides a certain grade of uncertainties for whole assessment.
The quality of the food consumption data is relevant for exposure
assessments in the same way as it is for nutrient assessments, and will be
influenced by measurement errors, including under-reporting. Measurement errors in
dietary surveys include errors in reporting of food intake, estimation of portion size,
food coding and data entry. It is then conceivable that food chemical exposure
estimates based on the food consumption data will be underestimated (Lambe, J.
2002).
In addition, for the calculation related to the exposure assessment of
pesticide residues, the highest value (HR) found during the monitoring programme
was used. Therefore the model was primarily used for “refined calculations”.
As described in the previous chapter of the thesis, 0,1% of the samples were
found with pesticide residues higher that the legislative limit. The number of active
substances was equal to the highest residue was then compared with the related
toxicological endpoints (ADI and ARfD) for calculating the related consumer
exposure. In order to have a more conservative assumption, for chronic exposure
the highest calculated TMDI was taken into consideration even though if it was
related to a diet different than the Italian one, the results were then expressed as
percentage of ADI. For the acute exposure, for each commodity, the calculation is

based on the highest reported consumption expressed as kg bw. If no data on the
unit weight was available from diet used, an average European unit weight was used
for the IESTI calculation.
In case of harm for the consumer; when the comparison with the related
toxicological endpoint (ADI of ARfD) the highest value was reported and, when
available, the data correspondent to the Italian diet; the details are shown in Table
15.
Table 15: Exposure assessment of food commodities, using the EFSA PRIMo model and highest detected residue of active substance, expressed as mg/kg. Comparison with the toxicological endpoints for acute and chronic exposure (ADI of ARfD) is indicated.
Matrix Food Class Active Substance HR Annex 1 ADI (mg/kg bw) SourceARfD (mg/kg bw/day) Source % ADI
Wheat Cereal DIAZINON 1,4 NO 2007 0,0002 EFSA 2006 0,025 EFSA 2006 4652,5Wheat Cereal DITHIOCARBAMATE 17 NO 1991 0,006 COM 2004 0,08 COM 2004 1883,2Mint Spice DIMETHOATE 232,25 YES 0,002 JMPR 2003 0,01 EFSA 2006 386,1Mint Spice DIMETHOATE 140 YES 0,002 JMPR 2003 0,01 EFSA 2006 232,7Lettuce Leaf Vegetable DITHIOCARBAMATE 20 NO 1991 0,006 COM 2004 0,08 COM 2004 125,8Mint Spice DIMETHOATE 56,12 YES 0,002 JMPR 2003 0,01 EFSA 2006 93,3Mint Spice DIMETHOATE 55,54 YES 0,002 JMPR 2003 0,01 EFSA 2006 92,3Lettuce Leaf Vegetable DITHIOCARBAMATE 12,5 NO 1991 0,006 COM 2004 0,08 COM 2004 78,6Lettuce Leaf Vegetable DITHIOCARBAMATE 9,2 NO 1991 0,006 COM 2004 0,08 COM 2004 57,1Mint Spice DIMETHOATE 28,72 YES 0,002 JMPR 2003 0,01 EFSA 2006 47,7Pear Pome Fruit DITHIOCARBAMATE 4,8 NO 1991 0,006 COM 2004 0,08 COM 2004 27,7Orange Cutrus Fruit IMAZALIL 10 YES 0,025 EFSA 2010 0,05 EFSA 2010 19,2
CabbageBrassica Vegetable DITHIOCARBAMATE 15,5 NO 1991 0,006 COM 2004 0,08 COM 2004 18,4
Pear Pome Fruit DITHIOCARBAMATE 3 NO 1991 0,006 COM 2004 0,08 COM 2004 17,3Lemon Citrus Fruit IMAZALIL 9 YES 0,025 EFSA 2010 0,05 EFSA 2010 17,3Orange Citrus Fruit THIABENDAZOLE 22 YES 0,1 JMPR 2006 0,3 JMPR 2006 10,6
Orange Citrus Fruit PARATHION METHYL 0,65 NO 2003 0,003 JMPR 2003 0,03 JMPR 2003 10,4Orange Citrus Fruit IMAZALIL 5 YES 0,025 EFSA 2010 0,05 EFSA 2010 9,6Apple Pome Fruit THIABENDAZOLE 11,5 YES 0,1 JMPR 2006 0,3 JMPR 2006 9,1
GrapeBerry and Small Fruit ENDOSULFAN 1,3 NO 2006 0,06 JMPR 2006 0,02 JMPR 2006 8,9
Apricot Stone Fruit OMETHOATE 0,19 NO 2002 0,0003 EFSA 2006 0,002 EFSA 2006 6,9Lemon Citrus Fruit IMAZALIL 11,9 YES 0,025 EFSA 2010 0,05 EFSA 2010 5,9Mandarin Citrus Fruit IMAZALIL 7,06 YES 0,025 EFSA 2010 0,05 EFSA 2010 5,9
GrapeBerry and Small Fruit FENITROTHION 1,5 NO 2007 0,005 EFSA 2006 0,013 EFSA 2006 3,9
GrapeBerry and Small Fruit FENITROTHION 0,85 NO 2007 0,005 EFSA 2006 0,013 EFSA 2006 2,2
Mandarin Citrus Fruit THIABENDAZOLE 8,96 YES 0,1 JMPR 2006 0,3 JMPR 2006 1,9Lemon Citrus Fruit IMAZALIL 8,05 YES 0,025 EFSA 2010 0,05 EFSA 2010 1,1Lemon Citrus Fruit CARBARYL 2 NO 2007 0,0075 EFSA 2006 0,01 EFSA 2006 0,9Peach Stone Fruit METHAMIDOPHOS 0,1 NO 2008 0,004 JMPR 2004 0,003 COM 2007 0,9Lemon Citrus Fruit IMAZALIL 5,3 YES 0,025 EFSA 2010 0,05 EFSA 2010 0,7
GrapeBerry and Small Fruit PROCYMIDONE 1,1 NO 2008 0,028 DAR/COM 2007 0,012 DAR/COM 2007 0,5
64

65
HAPERITIF Indicator
To provide a harmonised European approach for pesticide risk indicators,
the Sixth EU Framework Programme recently financed the HAIR (HArmonised
environmental Indicators for pesticide Risk) project. This paper illustrates the
methodology underlying a new indicator-HAPERITIF (HArmonised PEsticide RIsk
Trend Indicator for Food), developed in HAIR, for tracking acute and chronic
pesticide risk trends for consumers (Calliera, M. et al. 2006).
HAPERITIF can be applied to provide information on acute and chronic risk
of consumers (HAPERITIFac and HAPERITIFchr respectively). The acute indicator,
HAPERITIFac, is based on the ratio between an Estimated Short Term Intake (ESTI)
and the Acute Reference Dose (ARfD) while the chronic indicator HAPERITIFchr is
based on the ratio between the Estimated Daily Intake (EDI) and the Acceptable
Daily Intake (ADI). Both ARfD and ADI, for a specific pesticide, are established at
international level (WHO 1997).
HAPERITIF, follows a stepwise approach as reported in Figure 16.
Step 1: quantification of pesticide residues on crops;
Step 2: prediction of pesticide residues on foods;
Step 3: exposure estimate;
Step 4: calculation of the indicator.
The different steps are characterised by a decision tree procedure
depending on the availability of input data.
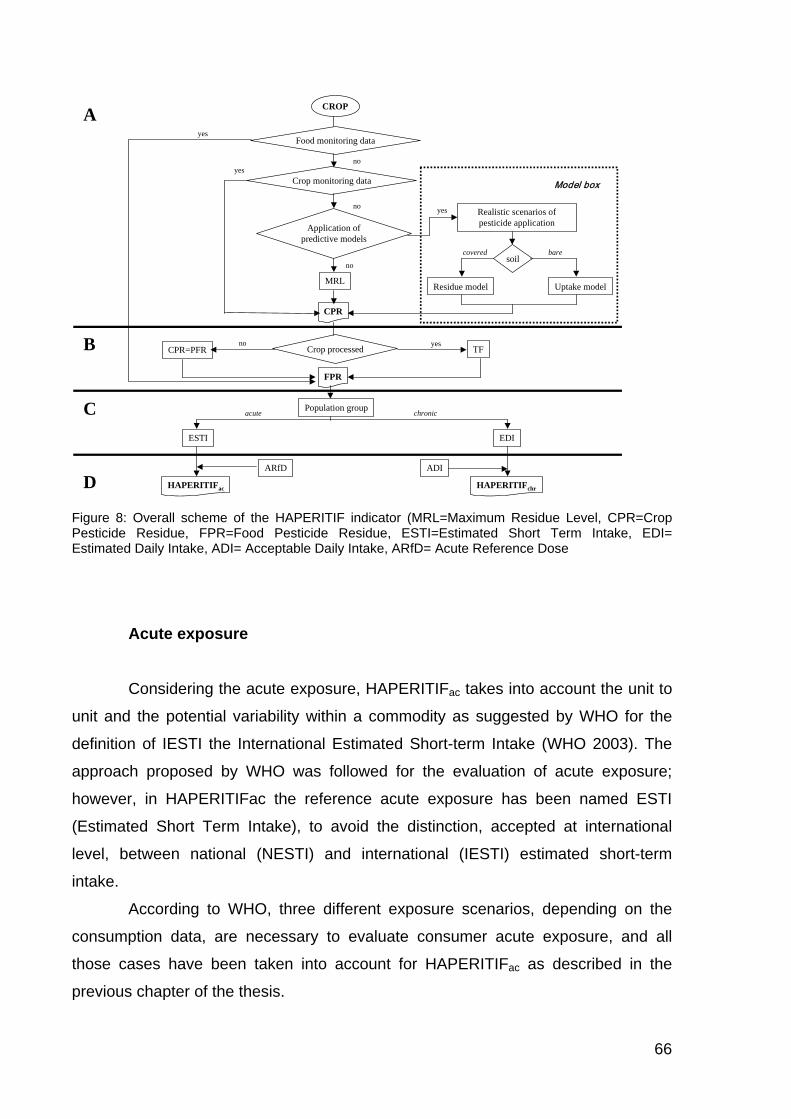
CROP
Application ofpredictive models
Crop monitoring data
MRL
CPR
yes
Realistic scenarios ofpesticide application
soil
Uptake modelResidue model
barecovered
Model box
no yes
no
Crop processedno
CPR=PFR TF
FPR
B
ESTI
C
D
A
yes
Food monitoring datayes
no
EDI
HAPERITIFac HAPERITIFchr
chronicacute
ARfD ADI
Population group
Figure 8: Overall scheme of the HAPERITIF indicator (MRL=Maximum Residue Level, CPR=Crop Pesticide Residue, FPR=Food Pesticide Residue, ESTI=Estimated Short Term Intake, EDI= Estimated Daily Intake, ADI= Acceptable Daily Intake, ARfD= Acute Reference Dose
Acute exposure
Considering the acute exposure, HAPERITIFac takes into account the unit to
unit and the potential variability within a commodity as suggested by WHO for the
definition of IESTI the International Estimated Short-term Intake (WHO 2003). The
approach proposed by WHO was followed for the evaluation of acute exposure;
however, in HAPERITIFac the reference acute exposure has been named ESTI
(Estimated Short Term Intake), to avoid the distinction, accepted at international
level, between national (NESTI) and international (IESTI) estimated short-term
intake.
According to WHO, three different exposure scenarios, depending on the
consumption data, are necessary to evaluate consumer acute exposure, and all
those cases have been taken into account for HAPERITIFac as described in the
previous chapter of the thesis.
66

C
hronic exposure
For the chronic exposure, HAPERITIFchr is based on the Estimated Daily
Intake (EDI), which provides a realistic estimate of long-term intakes of pesticide
residues (WHO 1997). The mean residue or MR(FPR) is the most likely level that
would result from the use of the pesticide at the maximum approved doses and
timing under Good Agricultural Practice.
EDI is expressed as follows:
bw
FPRMRDEDI v )(×
=
EDI: Estimated Daily Intake (mg/kg bw/day)
MR(FPR): median residue detected (mg/kg) level in the edible portion
when available or median residue from models.
Dv: mean dietary intake (mg/person/day)
A
ggregation
The indicator can be applied both to evaluate the acute (HAPERITIFac) or the
chronic (HAPERITIFchr) pesticide risk for consumer associated to the consumption of
one commodity (crop) or to a particular typology of diet. The proposed methodology
can also be applied at different levels of aggregation. The different level of
aggregation are briefly described below:
1) One a.i. residue in a single commodity. This is the simplest level of
aggregation. It calculates the Exposure/Toxicological Ratio between ESTI and ARfD
for the acute indicator (HAPERITIFac) or EDI and ADI for the chronic indicator
(HAPERITIFchr) for each active ingredient applied on a particular crop or commodity.
This approach can lead to compare the risk of different a.i. residues that are present
in a particular commodity and then to identify the most hazardous substances to the
consumer health.
67

2) Several a.i. residues in a single commodity. This level of application take
into account the possibility of multi residues exposure of consumers as consequence
of the simultaneous presence of more pesticide in a single commodity. In this case
HAPERITIF can be calculated considering both the acute and chronic exposure,
according to the following equation:
HAPERITIF(ac or chr.) = ..
..95ia
iath
TOXEXP
percentile
where:
EXPa.i.: Estimated Intake Chronic or Acute, calculated for each a.i. in a
single commodity
TOXa.i.: ADI or ArfD, depending on acute or chronic indicator, of the
different a.i. considered
As a conservative approach, the 95th percentile of all the exposure/toxicity
ratios is taken into account. At this level of application the indicator can be used to
monitor the time trend risk associated to the food consumption of a particular
commodity (crop). In fact, the evaluation could be repeated for several years, using
the first one as benchmark against which the success of new strategies can be
evaluated. The indicator can be calculated for a particular country, region, or
territory, or at EU level.
3) One a.i. residue in several commodities. The third level of aggregation
considers the case where one a.i. is utilized on several crops. This case should
cause only higher levels of chronic exposure for consumers, due to compound
residues in more commodities. The chronic indicator will be calculated considering
the overall exposure deriving from consumers’ diets according to the following
equation:
∑=
=n
crop ia
iacropchr ADI
EDIHAPERITIF
1 ..
..,
68
where:
EDIcrop,a.i.: Estimated Daily Intake calculated for all crops with residues of a
single a.i.
ADIa.i.: ADI of the specific a.i.
4) Several a.i. residues in several commodities. This level of aggregation can
be used as a risk trend analysis system for different categories of consumers who
use a particular diet. In this case too, the 95th percentile of the aggregation of the
exposure/toxicity ratio is considered, and 1 is the threshold value identified.
∑=
=n
crop ia
iacropthchr TOX
EXPpercentileHAPERITIF
1 ..
..,95
All the levels of aggregation described previously can be computed for a
particular region, country, or at EU level
HAPERITIF application in a post harvest treatment
The active ingredient Chlorprofam is used as an example of the application
of the indicator for post harvest treatments in potatoes.
The values of HR and MP for the application comes from 12 years
monitoring data (1996-2008).
The indicator can be applied both to evaluate the acute (HAPERITIFac) or the
chronic (HAPERITIFchr) pesticide risk for consumer associated to the consumption of
potatoes comes from the areas on which the monitoring data are made. This is an
example of the simplest level of aggregation. The Exposure/Toxicological Ratio
between ESTI and ARfD for the acute indicator (HAPERITIFac) or EDI and ADI for
the chronic indicator (HAPERITIFchr) are calculated. The results have been
presented in the Figure 9.
69

Application of the HAPERITIF indicator to Chlorprofam on potato
0
100
200
300
400
500
600
700
800
900
1996 1998 2000 2002 2004 2006 2008
Year
Value
HEPERITIF CHR (B) HEPERITIF CHR (E) HEPERITIF AC (E)
Figure 9: Example of the application of HAPERITIF acute and chronic for Chlorprofam used in post harvest treatments. On X axis calendar years are reported, on Y axis the values of HAPERITIF indicator for chronic (blue and red line) and acute (green line) are reported.
In the figure above, the same level of aggregation for the HAPERITIF
indicator is shown taking into consideration the following:
1) HAPERITIFCHR (B): long term exposure for pesticide residues, using
the WHO Cluster Diet B, as model of intake and the median residue detected in the
edible (EDI)
2) HAPERITIFCHR (E): long term exposure for pesticide residues, using
the WHO Cluster Diet E, as model of intake and the median residue detected in the
edible (EDI)
3) HAPERITIFAC (E): short term exposure for pesticide residues, using the
WHO Diet, as model of intake and the ESTI calculation in case the unit weight of the
whole portion is lower than that of the large portion, F, as indicated in the equations
2a, described in the previous chapter.
The first two indicators differed from the potato’s intake across the
population. In fact, a higher consumption is linked to the cluster diet E rather than B.
However, the difference in consumption was not significantly relevant, therefore the
two lines (red and blue) resulted overlapped.
70

71
C
onclusions
The most commonly detected pesticides in irregular samples are Dimethoate
(n=16), Procymidone (n=15), Ethion and Chlorotalonyl (n=10), Dithiocarbamate
(n=9); which mainly belongs to the functional classes of fungicide and insecticide.
Using the EFSA model for exposure assessment, it has to be noted that in
case of overcoming of the acute toxicological endpoint, expressed in percentage of
ARfD, the diet associated with the results are mainly from Northern Europe
(Germany and UK), in case of absence of the Italian data. Therefore these results
could be taken, with a high degree of uncertainties, when associated with residues of
pesticides found in Lombardy coupled with the Italian diet. On the other hand, the
results shown for chronic exposure, expressed as percentage of ADI, are more
accurate, being able to retrieve the Italian consumption data for the selected
commodity.
However, it has to be noted that for the irregular samples coming from extra
European countries; they were immediately withdrawn form the Italy once arrived at
the inspections borders are. Even though these commodities had entered the Italian
market, once analysed by the inspection bodies, they are withdrawn from the market,
according to the RASFF.
In addition, some of the actives substances found in irregular samples were
already withdrawn at the time of sampling (e.g. DDT, Esachlorobenzene). Therefore,
more over the health of the consumers is noticed a convict of fraud.
In relation to the use of the HEPERITIF indicator, for acute and chronic
exposure, the two times trend risk was compared and it was possible to note the
constant trend for the chronic risk while for the acute one, despite a general increase
during the overall period, show peak over the unit (ESTI/ARfD >1) than the chronic
exposure in consideration. These trends are calculated using only monitoring data
that represent a realistic exposure scenario. In this example is clear that for
consumer eating potatoes comes from the area of monitoring data, the acute
exposure should be considered relevant for health implication.

72
One of the aspects that the deterministic approach, used in this section of
the thesis, could not solve is the cumulative exposure for multi-residue samples. The
principal reasons for this are that the level of protection provided by the deterministic
approach is uncertain and that some details of the probabilistic methodology require
further work (EFSA 2009).

73
Probabilistic risk assessment
The probabilistic approach has been applied quite recently in the field of
pesticide exposure assessment for estimating the acute intake of several pesticides
in the diet. This technique allows the simulation of real live occurrence of actual food
consumption together with the whole range of observed levels of pesticide residues
in food. On the contrary, in point estimate analysis only a single number can be used
to characterize each input and, therefore, many possible values of that input are
ignored. One other advantage of the probabilistic approach versus the deterministic
model is that it is possible to evaluate the acute exposure to pesticides in more than
one commodity at the same time. Moreover, the output shows a full range of
exposures instead of a single value, giving the possibility to explore the coverage of
the population exposed on the basis of the established toxicological endpoint.
It should also be pointed out the necessity for transparency to be
maintained, by indicating the sources and software used, as well as the way results
are presented. Last but not least, it should be noted that while the point estimates
cover the 97.5% of the population of eaters only, the probabilistic approach provides
a whole range of percentiles of exposures as well as the percentages of exposures
that may lay over the ARfD.
I
ntroduction
As regards the dietary assessment of pesticides, the probabilistic model
includes two main sets of input data linked to each other by the software code: a)
food intake dataset of the consumers, from which an individual is selected and all
eating occasions are searched for items that may contain the target chemical, b) a
dataset providing information of the probability of the target chemical to be present in
the food items.
Currently, simulations of possible combinations of dietary intakes and
residue values can be carried out by several computer software packages developed
74
for this purpose. Most broadly known are the @Risk software (Palisade Corporation),
the Crystal Ball® software (Decisioneering, Inc.), and the specifically developed for
dietary exposure assessment programs Monte Carlo Risk Analysis (MCRA,
Stochastic modelling of chemical intake from food, developed in collaboration
between RIKILT and Biometris in the context of the Dutch Programme for the Quality
of Agricultural Products-KAP), and the Creme software, for probabilistic modelling.
However it has to be mentioned that the first three models were developed not
specifically for pesticide risk exposure, while Creme Food is a tool, which provides
accurate and reliable information on the population's exposure to chemicals from
many different sources. Creme Food utilises published and peer reviewed science to
calculate these values by combining input data sets from product usage habits,
amount of product used per occasion, chemical monitoring laboratories,
demographic data sets, market information, industry and other data. Therefore this
latter software was the most appropriate within the remit of the thesis.
Estimating intake from one commodity for one person on one day requires
multiplying the amount of commodity they consume by the concentration of pesticide
it contains, and then dividing by body weight. However, risk managers need to know
how often intakes exceed the ARfD, when considered for multiple persons and
multiple days. The probabilistic approach estimates this by taking consumption and
body weights for multiple persons and multiple days and combining it with different
concentrations, selected at random. Consumption and body weight data are derived
from national dietary surveys, and the concentrations are derived from monitoring or
field trial data. This process is illustrated below:
1. Select one “person-day” record from the dietary survey, comprising
consumption and body weight.
2. Sample a single concentration at random from a distribution estimated
from the residue data.
3. Calculate the modelled intake for this person-day by multiplying
consumption with concentration and dividing by body weight.
4. Repeat steps 1-3 for a large number of person-days, calculating a
modelled intake for each.
5. Determine the percentage of modelled intakes for all the person-days that
are below the ARfD for the pesticide.

75
The frequency distribution of the exposure estimates is examined in regards
to the percentage of exposures being above the toxicological endpoint. The
algorithm used for computing the exposure estimates may also include the modelling
of the unit-to-unit variability following different options, depending on the actual data
available (Boon, E. et al. 2003).
The results in Sections 3-5 were generated by one probabilistic model
developed in Ireland (Creme). This model modelled variability in consumption using
dietary surveys, from various countries in Europe (McNamara, C. et al. 2003);
however since the monitoring data used for the assessment are from the Lombardy
region the Italian consumption data was used (Turrini, A. et al. 1996).
F
ood consumption data
Since the input data on food consumption is required to be in the form a
range of individual consumptions, it is expected that the methods used should allow
for collecting information on every individual's dietary habits. In addition, these data
should be as more accurate as possible, therefore quantitative data is needed. In
consequence, the most appropriate methods for data collection would be the 24-
hours recall data or dietary records. Quantitative Food frequency questionnaires may
also be of use.
Models estimating the intake of pesticides use data referring to raw
agricultural commodities therefore it is necessary to translate the actual food eaten
to agricultural products. This is can be possible by the use of recipe databases that
are sometimes available at national level. This type of database provides quantitative
information on the ingredients of the composite foods consumed, (for instance the
amount of flour used for making a pizza). Other points of interest could be
information on specific brand marks, market share, special population features (for
instance infants) etc. Relevant information would be the proportion and the parts of a
raw commodity being actually consumed, since the original product may include a
non-edible part, for instance peels etc. This may have a considerable effect on the
total level of residues present on the commodity. Information from food consumption
surveys about every day consumption practices could be useful in this respect.
For probabilistic assessment of acute dietary exposure to pesticides, it is
important to see the correlation of food items that can be included in the model.
76
Unless only one commodity is included in the model, the use of actual individual
consumption data is preferred, since the whole dataset allows for correlations to be
investigated.
Residue datasets
As discussed previously, the estimation of the residue values can be derived
either from supervised field trials or from monitoring programs. When applying
probabilistic models it is possible to enter as input data all the raw data available,
instead of using only the median and highest Residue values. The residue values
datasets should address the following considerations: a) what is the range of values
of residue concentrations (levels of residue concentration) and b) what is the
probability that these residues will be present in the food (frequency).
Supervised field trial data might be regarded as of better quality since trials
are performed under experimental conditions. Nevertheless, it must not be forgotten
the fact that their final aim is to be utilised for registration purposes and thus their
outcomes often overestimate the real values. Moreover, given the fact that only a
small number of trials is requested, the number of resulting residue values is limited.
On the other hand, data being of better quality is not necessary more realistic,
whereas monitoring data can be more representative of the reality.
On this basis, the U.S. Environmental Protection Agency suggested
performing "bridging" (or "reduced use") studies, seeking to compare or "bridge" the
residue data resulting from the maximum application rates used to determine
tolerances and the more typical ranges actually applied. These studies can be used
to establish a relationship among residues from field trials conducted at the
maximum application scenario (maximum application rate, highest application
frequency and shortest PHI) and residues expected at the range of more typical
ranges. In this way a broader and more complete range of values will be generated.
In general, bridging studies consist of one or more field trials using several
different application rates. The applications should occur at the same location and at
the same time because of the potential impact of environmental conditions and
variability in study conducts on the result. Therefore only controlled field trials
specifically designed can be used and data are then used to establish the
relationship between application rate and resulting residue level. One application
77
rate in each field trial should be at the maximum rate and at least two other lower
rates should be selected so that the relation between application rate and residue
level can be calculated. In some cases it might be preferable to use exaggerated
rates, particularly if residues under the limit of quantification are expected, so
quantifiable residues will result. Once a determination is made that it is appropriate
to adjust residue levels from maximum rate/minimum PHI field trials with information
obtained from reduced-rate field trials, it becomes necessary to incorporate these
data into a Monte Carlo analysis. The first step of this incorporation is to adjust the
field trial data that would have been developed earlier for tolerance setting purposes
to residues that would have been found had lower application rates been used (EPA
2000).
As mentioned above, monitoring data can be more representative of the
reality, depending on the sampling methods. As an example, when data is collected
for the U.S. Market Basket surveys the sampling is made on a single serving basis
(i.e. single apple etc.) from commercial retail establishments (supermarkets etc.)
applying a rigorous statistical design, often according to OPP (Office of Pesticides
Program) reviewed protocols. In contrast, monitoring data collected by the FDA is
intended for tolerance enforcement therefore sampling is not intended to be
statistically representative. On the other hand, United States Department of
Agriculture/ Pesticide Data Program (USDA/PDP) sampling which is performed as
closely as possible to the point of consumption is statistically designed for use in
dietary risk assessment in order to be representative of residue concentration in US,
and samples are prepared as for consumption.
When probabilistic risk assessment models are intended to be used for
comparison between country statuses, harmonisation of data collection should be
previously performed. This applies particularly to systemisation of data collection,
sampling and analytical methods in use. As an example, where analysis of foodstuffs
is performed by accredited laboratories, the results can be comparable since
methods used are standardised and validated.
For instance, in the Europe Union the competent authorities of the Member
States are asked to perform regular inspections of foodstuffs at national level and to
report the results from national monitoring programs to the Commission. These
results may vary significantly between countries also due to several factors e.g.
sampling strategies, methods of analysis used, and differences in national MRLs.
78
Under this light, EU has recommended since 1996 the participation of MS in a
coordinated monitoring program entitled "Monitoring of pesticide Residues in
Products of Plant Origin in the European Union" which also includes information from
Norway, Iceland and Liechtenstein (European Commission, Health & Consumer
Protection Directorate-General, 1996 - 2004). This program was designed as a
rolling program in a series of 3-year cycles and covers major pesticide-commodity
combinations as selected from the WHO/GEMS European Diet. The sampling design
is based on a statistical method proposed by Codex Alimentarius and the minimum
numbers of samples of each commodity are fixed at a different level for each
country, according to the population and consumer numbers.
Sources of variability
Separating variability and uncertainty is useful for identifying parameters for
which additional data are needed. It is reminded that uncertainty is linked to lack of
information, whereas variability to observed differences attributable the true diversity
in a population or exposure parameter and results from natural random processes.
Unit variability
Unit variability of food samples needs to be considered when the typical
consumption portion, for example one fruit, is different from the sample taken for
analysis, for example a sample of ten fruits. For the determination of pesticide
residues, measurements are usually performed in composite samples where the
distribution of residues among individual items may be different, with some items
containing more pesticide than others. In a batch of food items previously treated
with a pesticide, the residue of the pesticide remaining on/in single food items at the
time of consumption differs, due to a variety of factors.
It is important to take account of this variation when assessing acute dietary
exposure to pesticides in medium and large-sized food items (for instance apples or
melons).
79
According to the FAO guidelines, variability should be considered for food
commodities, which have, unit weight more than 25 g, whereas for weights under 25
g it is assumed the residue data reflect the residue levels of the commodity
consumed. When residue data on individual items is available, this can be used
directly.
Information on variability is relatively limited. Moreover, existing variability
studies from analysis of retail samples are not standardized and are performed on
batches taken from various sampling locations. Besides, in order to obtain
satisfactory conclusions, findings should reflect more closely real life conditions, as
happens for instance with variability studies performed with samples from locations
at the end of the distribution flow. Variability studies may also be generated from field
trials. In this case the within batch variability is expected to be lower and the
measured values more uniform (Earl, M. et al. 2000). In fact, after examination the
range of variability factors from existing studies where residues were measured
separately in individual food items, it was concluded that on average, variability
factors estimated from samples collected in the marketplace were higher than those
from samples obtained in supervised trials (EFSA 2005).
In the deterministic model, variability is addressed through the “variability
factors” which are based on the 97.5th percentile of the distribution of residues; i.e.
the level that is exceeded by 2.5% of residues in food items. Variability factors are
defined as the ratio between the 97.5th percentile value and the mean composite
sample value. In the probabilistic approach however, one single value for variability
is not appropriate for applying in single simulations of a probabilistic exposure
analysis. On the contrary, variation in residue levels between units of one composite
sample can also be described as following a distribution. Currently there is a lack of
guidelines on how to apply variability within the probabilistic approach, though
diverse ways have been proposed, for instance the use of different distributions
(Boon, E. 2004)
The U.S. EPA, in order to address the problem of residue data on single
units, has developed a technique known as “the decomposition method”, resulting in
a new set of data of residues on individual items (EPA 1999). This methodology
consists of extrapolating from data on pesticide residues in composite samples of
fruits and vegetables to residue levels in single units of fruits and vegetables. Given
the composite sample mean, the composite sample variance, and the number of

80
units in each composite sample, it is possible to estimate the mean and variance of
the pesticide residues present on single units of fruits and vegetables. These
parameters can then be applied to generate information on the level of residue in
fruits and vegetables. This information can then be incorporated into a probabilistic
exposure estimation model, such as the Creme software, in order to estimate
exposure to pesticide residues in foods and the risk attendant to that exposure. This
methodology has a higher degree of accuracy when more than 30 composite
samples have detectable residues.
Other organizations have developed similar methodologies for extrapolating
from residue levels in composite samples to residue levels in single units, however
and the results are similar to those of OPP. This is expected since the methods
developed originate from the same fundamental assumption that residues on
individual serving sizes of fruits and vegetables follow a lognormal distribution, as
established from earlier goodness-of-fit studies (EPA 1999).
Processing
As discussed, processing raw commodities results usually into lower levels
of residues compared to the processed foods due to different ways of preparation,
cooking etc. The effects of processing depend on the pesticide characteristics and
the product processed. However, in order to have an estimate of the changes due to
processing, processing factors are calculated. These factors usually result as a part
of the pesticide registration studies and in spite of the fact that conditions of their
calculation vary from every day life habits they can provide some information.
In the point estimate approach only one food (group) - processing type
combination can be addressed at a time, which can result in worst-case estimations
of exposure (no effect of processing). Sometimes, in food consumption surveys,
there may be information available on the percentage of people consuming a specific
food item peeled or not peeled, for instance apples. When no information on
processing is available from the food consumption survey, general assumptions on
processing habits may be derived from other sources (e.g. literature).
When information on processing practices is incorporated in the analyses
using the probabilistic approach, a more realistic estimation of exposure is possible
compared to the worst-case assumption that nobody peels their apple or the too
81
optimistic situation that everybody does. For example, in a study on the Dutch
general population the exposure decreased with more than 20% compared to the
worst-case assumption. Moreover with the probabilistic approach different types of
processing per food (peeling, not peeling, juicing) can be addressed in one analysis.
When doing this each food (group) - processing type combination should be linked to
the correct variability factor (e.g. apples eaten whole are subjected to variability,
while those mixed in juices are not) (Boon, E. 2004).
Other sources of variability
Other causes of variability within the exposure model may be present;
nevertheless they are not usually taken into account. For instance, residue values
reported may vary also due to lab-to-lab variations owing to analytical methods or
sampling errors. Variations of body weight values within a population, as well as food
portions consumed may also be another source of variability.
Sources of uncertainty
In the case of monitoring data, lack of information on residues values under
the LOD presents a significant source of uncertainty. This obstacle is usually
addressed by assigning a fixed value, most often the value equal to the LOD or ½ of
LOD. Useful information regarding the probability to encounter the substance under
examination in the treated commodity could be derived from the percent of crop
treated (PCT) and the percentage of imported versus domestic crop, when this are
available. When the percent of crop treated is known, it is possible to assign a
probability that a residue level at LOD could be near to zero rather than near the
LOD value, resulting to more accurate estimations. PCT adjustments should only be
applied to distributional residues (e.g., in acute probabilistic acute analysis), but not
to single residues values (e.g. in deterministic point estimate analysis). Information
on the PCT in the U.S. could be obtained from USDA (Biological and Economical
Analysis Division, (BEAD) and National Agricultural Statistical Service/ Agricultural
Chemical Usage Reports) and from the DPR Pesticide Use Report Data (DPR MT-3,
2004).

82
Residue levels reported may be affected also as a result of the decline and
degradation. Decline effects are due to the Pre Harvest Intervals maintained
between pesticide applications, whereas storage, transportation, shelf-life periods
account for the degradation of residues. However, these factors are difficult to be
assessed and thus they are not considered.
As sources of uncertainty may also be considered the ones that result from
the lack of information regarding food consumption, such as differences between
categories of consumers, use patterns of food and underreporting.
Sensitivity analysis
Sensitivity analysis may be used to rank the model’s input assumptions with
respect to their contribution to the outcome variability and uncertainty. In this way we
can be aware of the manner in which alternative selections will affect the final
conclusions. Models may be expanded to include additional components that may be
of importance by using sensitivity analysis to get closer to true value exposures.
Sensitivity analysis can be done for a limited set of inputs. If more inputs are
investigated in a sensitivity analysis in an experimental design, statistical methods
like analysis of variance can be used to quantify the main effects and possible
interactions when simultaneously changing more than one input. By assessing the
results of sensitivity analysis it is possible to evaluate whether the sensitivity of the
model might be a matter of concern or of relatively small importance.
Validation of probabilistic models
In general, validation of the probabilistic models regarding dietary exposure
to toxic substances it is intended to demonstrate that the model applied does not
overestimate the “true” exposure and at the same time that it provides a more
realistic picture compared to the conservative calculation methods. Validating a
model presupposes the examination of the following: the validity of distributions used
to represent the input values, the adjustments made for potential correlations, the
number of iterations applied, the methodology used to sample from input values, the
number of observations needed to obtain reliable estimates of consumption and
residue distributions, the representativeness of data and the percentiles considered.

83
For toxic substances as pesticides, where the main focus is the possibility of
exceeding a certain toxicological limit, validations should be concentrated to the
upper percentiles of exposure distributions, for instance 99 or 99.9 percentiles,
whereas comparing mean and median exposures are beyond interest. The validation
can be statistically strengthened by calculating confidence intervals to quantify the
uncertainty of the Monte Carlo estimate (Lopez, A. et al. 2003).
Several validation studies have been performed for assessing the "fitness of
purpose" of probabilistic models. As "true" intake values are considered the values
originating from the analysis of duplicate diets, although these data also include a
level of uncertainty, for instance sample values under the limit of detection.
A validation study of the Monte Carlo Risk Assessment (MCRA) model was
carried out by Lopez et al. taking as a reference population 282 infants aged 8-12
months in the Basque Country (Lopez, A. et al. 2003). The residue data were based
on the Pesticide Monitoring Programs carried out by the Autonomous Communities
in Spain, and when these not available, the Spanish MRLs were applied. Food
consumption inputs were derived from 1-day food diaries and recipe study carried
out as a part of the Monte Carlo project. Three approaches were used: a) a visual
comparison of the graphs representing the cumulative probabilistic distributions of
the modelled, conservative and duplicate diet studies, b) a statistical test of a high
percentile and c) the comparison for each infant of the duplicate diet, conservative
and model intake values, analysing 19 pesticides and validated for 6. It was found
that the probabilistic model reduces the bias of conservative methods and does not
underestimated intakes.
Boon et al. conducted a similar validation exercise of the MCRA model in a
population of Dutch infants using a duplicate diet study, addressing six pesticides in
total (1). Food consumption data was derived from a food diary where participants
were asked to record the food consumed on the same day and translated to raw
agricultural commodities using the conversion model Primary Agricultural Products
(CPAP) developed by the RIKILT Institute (Institute of Food Safety, Wageningen, the
Netherlands) and pesticide residue measurements from the Dutch monitoring
programmes in 2000 and 2001 were used. The model was considered validated
when the outcome was higher than the "true" intake and at the same time lower than
the point estimate. It was shown that the intake exposures estimated by the model
were closer to the real ones, compared to the point estimates.

84
Materials and Methods
The aim of the current analysis is to provide an example of assessment of
acute dietary exposure to pesticide residues using probabilistic approach with the
help of Creme software.
Chlorpropham was selected as a reference substance for this example,
since it is already included in the Annex I of the Council Directive 91/414 and there
were adequate monitoring data available as well as a final evaluation document of
the substance prepared by Joint FAO/WHO Meeting for Pesticide Residues (JMPR).
Chlorpropham is mainly used as a post harvest treatment on potatoes for
anti-sprouting purposes. In E.U. and U.S. the accepted applications for this
substance on edible commodities regard potatoes only, while it can be further used
for weed control as a pre- or post emergence herbicide for flower bulbs and
ornamental plants. The authorized treatment on potatoes is spraying by means of
hot fogging equipment directly on the stores, whereas no PHI was judged to be
necessary as concluded in the review report of the Standing Committee on the Food
Chain and Animal Health. In the U.S., Chlorpropham is registered for post-harvest
treatment on potato as an emulsifiable concentrate used by direct spraying of a 1%
aqueous emulsion on potato tubers moving along a conveyor line or as an aerosol
fog at a standard application rate of 0.015 kg a.i./t whereas no withholding period is
identified.
The Maximum Residue Limit set for Chlorpropham by the JMPR
Commission is 30 mg/kg for ware potatoes. However in the EU legislation, the MRLs
for this substance are currently under review, since the existing MRLs were set on
1982 by the Directive 82/528/EEC (Official Journal L 234 of 09.08.1982) for trading
purposes (0,05 mg/kg).
In terms of toxicological endpoints the ADI and ARfD in the final European
review report is set to 0,05 mg/kg bw/day and 0,5 mg/kg bw/day respectively by the
JMPR (FAO Pesticide Management, JMPR Evaluations for Pesticide Residues,
2001).
85
Modelling exposure using the Creme software programme
Creme Software Ltd (Creme) was formed in 2005 following five years of
research resulting in the development of the most advanced methods of food safety
exposure assessment. This research was conducted at Trinity College Dublin Ireland
in collaboration with European partners. The Creme model was originally developed
and scientifically validated in this EU FP5 framework project (Monte Carlo), the
principal investigator was Prof. Mike Gibney (University College Dublin).
Today Creme Food is on release version 3 of its software, which provides
the most user-friendly, accurate and detailed dietary exposure assessment solution
in the market. The scientifically advanced models allow users to understand the
impact of a range of items including food ingredients, chemicals, contaminants,
additives, flavourings, pesticides, veterinary residues, nutrients, nanotechnology and
functional food ingredients on consumers in different market sectors across Europe
and the rest of the world.
The Creme Food statistical models combine population's food consumption
patterns with data on chemical concentrations in foods, ingredients or raw
agricultural commodities to determine dietary exposure to the chemicals of interest.
Exposure results are expressed in statistics across the population, for example the
mean exposure for the population and the 97.5th percentile representing the high-
end exposure results. All of this data is pre-installed and ready to go, providing the
options of running both deterministic and probabilistic scenarios. Any new or
additional data required by the user can be installed in Creme directly by the user.
F
ood consumption data
The food consumption data were collected through seven days dietary
recalls for each respondent and include 314114 individuals of all ages (Turrini, A. et
al. 2001). Furthermore, population is divided in 2 different age strata (adult and child)
of the Italian population. The average daily intake rates were divided by each
individual’s reported body weight to generate the intake rates (g of potatoes
consumed /kg of bw per day). The data extracted in this exercise, regarding potato
consumption, considered the consumption of potatoes (including baked, boiled,

86
chips, fried and other various types of potato dishes in one group) for the total
population (consumers and non consumers), as well as data for consumers-only.
S
ubjects data
The Subjects table records each survey participant's unique Subject ID,
along with various demographic and characteristic information, such as:
1. Day Count: the number of days that the subject completed the survey.
2. Gender: the subject's gender.
3. Bodyweight
Other fields may also be available, depending on the survey, such as:
Region, Socio-Economic Group, Socio-Class Group, Age in months, Household
composition, Taking Vitamins or Minerals, Area Code, Vegetarian/Vegan
information, Institutionalised.
The default fields provided when a new Subjects table is created are:
Subject Code, Day Count, Bodyweight (kg), Height (m).
As with any table type, the user may add extra fields and data as required.
This extra information may be used to filter for different subsets of the population
when performing exposure assessments.
Residue data
Monitoring data were derived from the pesticide residues database of the
Lombardy Region, available on the Internet site of ICPS at www.icps.it. The
monitoring data used were derived from the database resulting from the monitoring
programme undertaken in the region of Lombardy (North Italy), from 1996 until 2008.
Analyses were performed in six different laboratories. The monitoring residue
dataset includes in total 233 residue samples, from which 212 were above the Limit
of Determination and 21 below. The range of monitored values includes residues
from 0.01 mg/kg (LOD) to 6.30 mg/kg (HR). The majority of the samples were
produced in Italy (145), 38 were from European Countries, 27 were from Lombardy
(excluding Italy) and for 23 the country of origin was not mentioned.

87
Iterations When any uncertainty is present in an assessment, be it due to distributions
or variability models, then it is not sufficient to gather a single set of statistics for daily
average intake of a product or chemical.
There are two approaches to this issue, and the choice depends on the
exact form of the uncertainty or variability. For example, it may be the case that the
concentration is known to be variable from one food commodity to another with a
known standard deviation. On the other hand, it may be the case that the
concentration is the same across all food commodities of the same type, but with
unknown concentration.
This was the case chosen for monitoring data of Chlorprofam, where most of
the residue concentrations were expressed and only few samples were below the
LOD. Therefore it was run an assessment with one uncertainty iteration and the
Creme Food software analysed every individual in subset of the survey you are
interested in, and then calculate the statistics using subject weights.
For the case study on Chlorprofam, 1 uncertainty iteration was used, with 10
variability iterations equivalent to simulating 19780 subjects for the total population,
3220 for toddlers (age <= 18) and 16560 for adults (age > 18).
R
esults and Conclusions
All the relevant information mentioned in the previous chapters of the thesis
were plotted in the Creme Food Software. Three different data set were prepared for
each year of sampling (1996-2008), the main differences were related to the age of
the population present in the survey, considering total population, adult (age >=18)
and child (age <=18). Therefore, for each year of sampling three assessments were
run, taking into consideration the highest possible percentile (P99.9) allowed by the
software and the acute exposure. This is because the aim of the study was to cover
the majority of the population with particular attention to the most sensitive classes
(child). In addition, the deterministic approach computation that was, developed in

the previous chapter of the thesis highlighted that most of the risks to consumers
were derived by acute exposure. Therefore, only the above-mentioned type of
exposure was considered in the probabilistic approach.
For general population (Figure 10), the acute exposure calculated as 99,9th
percentile of the intake of Chlorprofam in association with the consumption of potato,
which is relatively low compared with the toxicological endpoint for acute exposure
(ARfD=0,5).
General Population ‐ 99,9 percentile of the acute intake of Chlorprofam (mg/kg bw)
0
0,01
0,02
0,03
0,04
0,05
0,06
0,07
1996 1998 2000 2002 2004 2006 2008
Year
Intake
(mg kg bw/day)
Figure 10: Acute probabilistic exposure comparing consumption of potato with residue data of Chlorpropham through the years from 1996 to 2008, for general population. X axis: Calendar years and Y axis: 99,9th percentile of the intake on Chlorprofam (mg/kg bw)
It has to be noted that the slope of the curve is relatively stable through all
years of sampling. However the high peaks found in 2005, 2007 and 2008 could
depend from the high number of samples detected and the relative high
concentration of Chlorpropham found in some samples.
88

A similar shape could be found comparing the probabilistic exposure
assessment of Chlorpropham in child and adult (Figure 11). It is highlighted that the
exposure for children is higher than the adult exposure during all years; this was
especially more evident in 2005, 2007 and 2008. However, it has to be considered
that, even the exposure of child and adults is high in some years. This did not
represent an unacceptable risk for both categories of consumers because the value
of the toxicological endpoint, for acute exposure (ARfD) was not overtaken.
Adult and child ‐ 99,9 percentile of the acute intake of Chlorprofam (mg/kg bw)
0
0,01
0,02
0,03
0,04
0,05
0,06
0,07
0,08
0,09
1996 1998 2000 2002 2004 2006 2008
Year
Intake
(mg kg bw/day)
Child Adult
Figure 11: Acute probabilistic exposure (adult and children) comparing consumption of potato with residue data of Chlorpropham through the years from 1996 to 2008. X axis: Calendar years and Y axis: 99.9th percentile of the intake of Chlorprofam (mg/kg bw)
In addition, analysing the data in Figure 12, taking into consideration the
95% confidence interval of the 99,9th percentile, median, minimum and maximum of
the exposure to Chlorpropham, for the general population; it has to be noted the
shape of the curve followed more the fluctuation of the detected residue of pesticide
rather than the consumption potato pattern across all population.
It is clearly visible that especially in the years 2007 and 2008, the error
boxes showed a huge variation in the data. This could be explained by the large
89

amount of food sampled and analysed in those years and by the variation in the
detected concentrations.
In addition, it has to be mentioned that a similar tendency was already
discovered and discussed in the previous chapter on the thesis, in the section
related to the use the Haperitif Indicator; that highlighted an increase in residue
concentration during the last years monitoring (2007 and 2008) and a relative high
peak in 2005.
General population ‐ 95% confidence interval of the 99,9 percentile of the acute intake of Chlorporfam
0
0,01
0,02
0,03
0,04
0,05
0,06
0,07
0,08
0,09
0,1
1996 1997 1998 1999 2000 2001 2002 2003 2004 2005 2006 2007 2008
Year
95% con
fiden
ce interval of chlorprofam
(mg/kg)
Figure 12: Bar chart showing the fluctuation of Chlorpropham acute exposure during 1996 to 2008 in general population. X axis: Calendar years and Y axis: 95% confidence interval of the 99,9th
percentile, maximum and minimum of Chlorprofam (mg/kg)
A second level of application of the probabilistic approach would consist to
assess the impact on the health of the consumer on a pesticide over all the
commodities where it was detected. For this work example the insecticide
Chlorpyrifos was used.
Chlorpyrifos is a crystalline organophosphate insecticide that inhibits
acetylcholinesterase and is used to control insect pests. It is used on a variety of
food and feed crops, golf courses, as a non-structural wood treatment, and as an
90
91
adult mosquitocide. According to the evaluation of JMPR 2004, the toxicological
endpoints for acute and chronic exposure are 0,1 and 0,01 mg/kg.
Most of the parameters used in the previous assessment of Chlorprofam
were also used in the present work example; therefore the Italian food consumption
data were collected through dietary recalls and included 314114 individuals of all
ages. Furthermore, population is divided in 2 different age strata (adult and child),
the residue data were form the monitoring assessment of pesticide in Lombardy
(1996-2008). In addition, in order to have comparable results, the number of
iterations remained unchanged.
Chlorpyrifos was detected in 206 food commodities; most of them belonged
to the category of pome fruit (n=102) and citrus fruit (n=45), from which apples
represented the highest contribution to the exposure of Chlorpyrifos.
As described in the previous example of Chlorprofam, the acute exposure
was exclusively taken into consideration; the results are expressed in details in
Figures 13 and 14. The acute exposure was calculated considering the 99,9th
percentile for the total population divided into two sub-groups (adult and children)
filtered by age. Comparing the exposure, it was noted, that there was no overtaking
of the correspondent toxicological endpoint (ARfD= 0,1 mg/kg), that is an order of
degree higher than the highest detected residue. However it was noted a high
exposure during the year 2007 of monitoring (see Figures 13 and 14, red lines); in
this case the thorough analysis of the original dataset was required. It was then
noted that in the mentioned year, a food sample of herb contained a concentration of
Chlorpyrifos above the legislative permitted level, was found. Therefore it could be
assumed that it was withdrawn by the national market, as soon as the official control
of pesticide residues was performed. Therefore, for this example, it was then
excluded from a refined assessment. In order to give a complete set if information it
has to be noted that the red line, in both figures, represented the first assessment,
with the complete set of data, including the illegal sample.

Adult ‐ 99,9 percentiles of the acute intake of Chlorpyrifos (mg/kg bw)
0
0,005
0,01
0,015
0,02
0,025
0,03
1996 1998 2000 2002 2004 2006 2008
Year
Intake
of chlorpirifos (m
g/kg bw)
Adult Adult adjusted
Figure 13: Acute probabilistic exposure, for adult, comparing residue of Chlorpyrifos through the years from 1996 to 2008, in all food commodities. X axis: Calendar years and Y axis: 99,9th percentile of the intake of Chlorpyrifos (mg/kg bw)
Child ‐ 99,9 percentiles of the acute intake of Chlorpyrifos (mg/kg bw)
0
0,005
0,01
0,015
0,02
0,025
0,03
0,035
0,04
0,045
1996 1998 2000 2002 2004 2006 2008
Year
Intake
of chlorpirifos (m
g/kg bw)
Child Child adjusted
Figure 14: Acute probabilistic exposure, for child, comparing residue of Chlorpyrifos through the years from 1996 to 2008, in all food commodities. X axis: Calendar years and Y axis: 99,9th percentile of the intake of Chlorpyrifos (mg/kg bw)
92
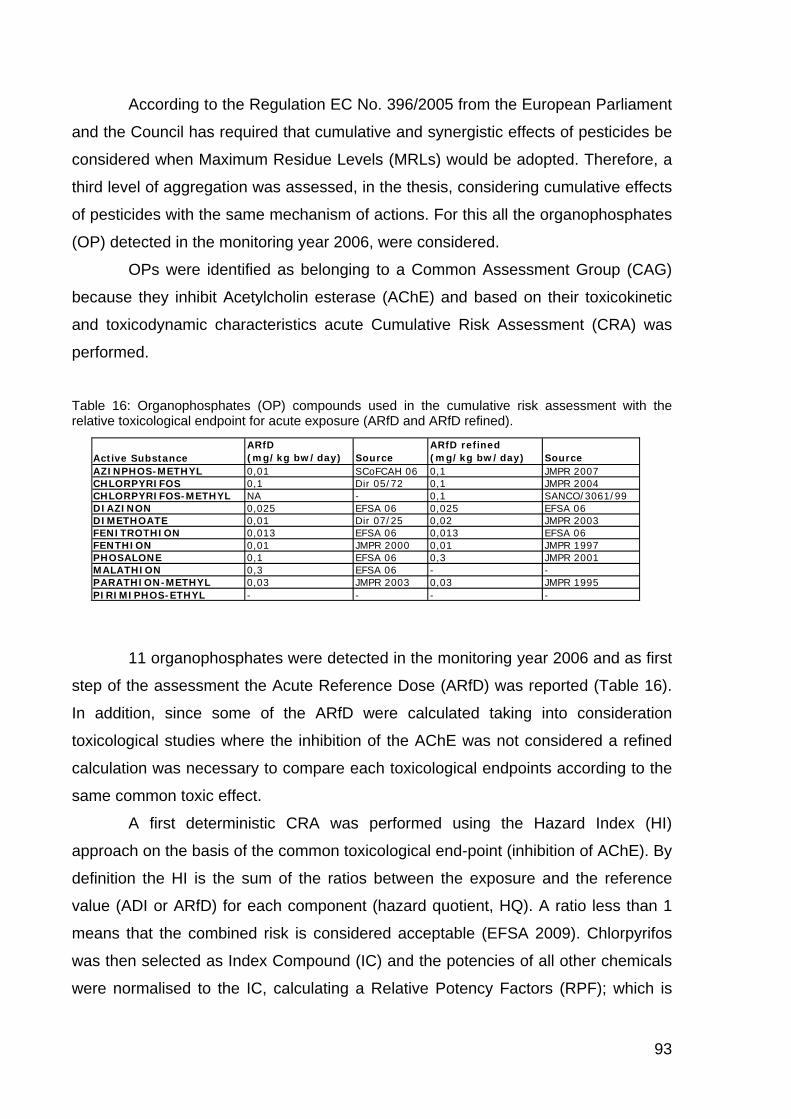
According to the Regulation EC No. 396/2005 from the European Parliament
and the Council has required that cumulative and synergistic effects of pesticides be
considered when Maximum Residue Levels (MRLs) would be adopted. Therefore, a
third level of aggregation was assessed, in the thesis, considering cumulative effects
of pesticides with the same mechanism of actions. For this all the organophosphates
(OP) detected in the monitoring year 2006, were considered.
OPs were identified as belonging to a Common Assessment Group (CAG)
because they inhibit Acetylcholin esterase (AChE) and based on their toxicokinetic
and toxicodynamic characteristics acute Cumulative Risk Assessment (CRA) was
performed.
Table 16: Organophosphates (OP) compounds used in the cumulative risk assessment with the relative toxicological endpoint for acute exposure (ARfD and ARfD refined).
Active SubstanceARfD(mg/kg bw/day) Source
ARfD refined(mg/kg bw/day) Source
AZINPHOS-METHYL 0,01 SCoFCAH 06 0,1 JMPR 2007CHLORPYRIFOS 0,1 Dir 05/72 0,1 JMPR 2004CHLORPYRIFOS-METHYL NA - 0,1 SANCO/3061/99 DIAZINON 0,025 EFSA 06 0,025 EFSA 06DIMETHOATE 0,01 Dir 07/25 0,02 JMPR 2003FENITROTHION 0,013 EFSA 06 0,013 EFSA 06FENTHION 0,01 JMPR 2000 0,01 JMPR 1997PHOSALONE 0,1 EFSA 06 0,3 JMPR 2001MALATHION 0,3 EFSA 06 - -PARATHION-METHYL 0,03 JMPR 2003 0,03 JMPR 1995PIRIMIPHOS-ETHYL - - - -
11 organophosphates were detected in the monitoring year 2006 and as first
step of the assessment the Acute Reference Dose (ARfD) was reported (Table 16).
In addition, since some of the ARfD were calculated taking into consideration
toxicological studies where the inhibition of the AChE was not considered a refined
calculation was necessary to compare each toxicological endpoints according to the
same common toxic effect.
A first deterministic CRA was performed using the Hazard Index (HI)
approach on the basis of the common toxicological end-point (inhibition of AChE). By
definition the HI is the sum of the ratios between the exposure and the reference
value (ADI or ARfD) for each component (hazard quotient, HQ). A ratio less than 1
means that the combined risk is considered acceptable (EFSA 2009). Chlorpyrifos
was then selected as Index Compound (IC) and the potencies of all other chemicals
were normalised to the IC, calculating a Relative Potency Factors (RPF); which is
93
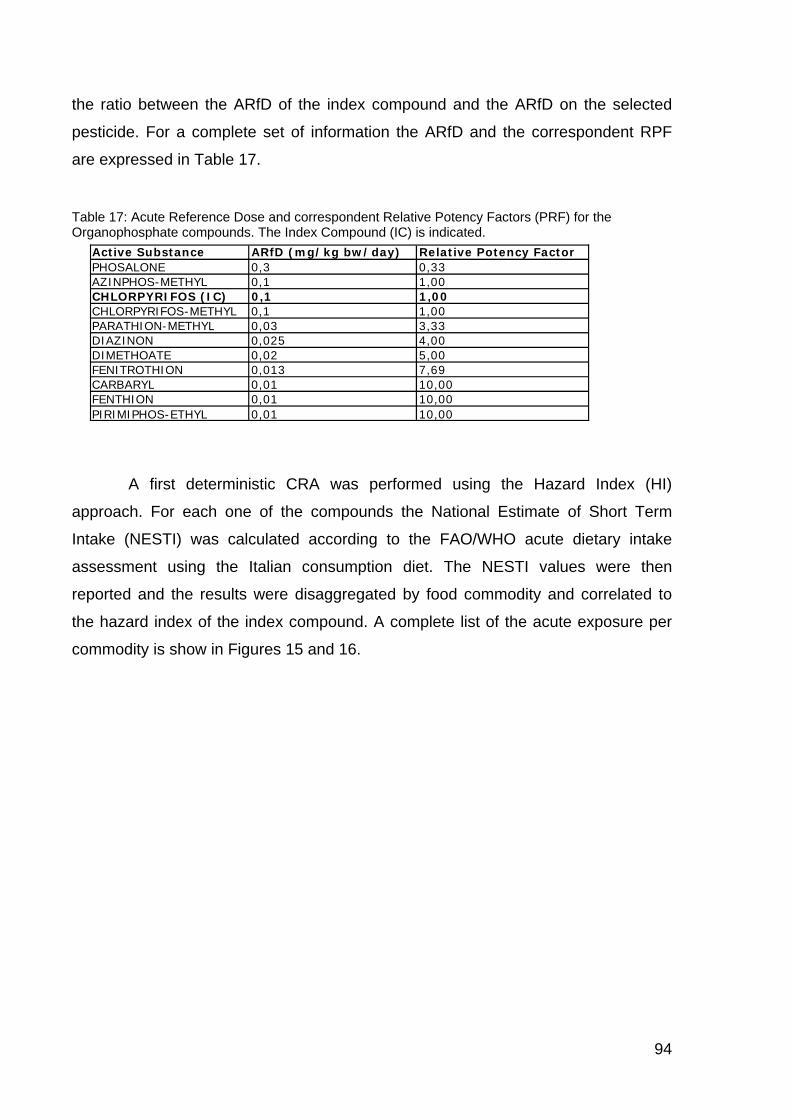
the ratio between the ARfD of the index compound and the ARfD on the selected
pesticide. For a complete set of information the ARfD and the correspondent RPF
are expressed in Table 17.
Table 17: Acute Reference Dose and correspondent Relative Potency Factors (PRF) for the Organophosphate compounds. The Index Compound (IC) is indicated.
Active Substance ARfD (mg/kg bw/day) Relative Potency FactorPHOSALONE 0,3 0,33AZINPHOS-METHYL 0,1 1,00CHLORPYRIFOS (IC) 0,1 1,00CHLORPYRIFOS-METHYL 0,1 1,00PARATHION-METHYL 0,03 3,33DIAZINON 0,025 4,00DIMETHOATE 0,02 5,00FENITROTHION 0,013 7,69CARBARYL 0,01 10,00FENTHION 0,01 10,00PIRIMIPHOS-ETHYL 0,01 10,00
A first deterministic CRA was performed using the Hazard Index (HI)
approach. For each one of the compounds the National Estimate of Short Term
Intake (NESTI) was calculated according to the FAO/WHO acute dietary intake
assessment using the Italian consumption diet. The NESTI values were then
reported and the results were disaggregated by food commodity and correlated to
the hazard index of the index compound. A complete list of the acute exposure per
commodity is show in Figures 15 and 16.
94

Acute exposure for adult: Hazard Index
0 0,5 1 1,5 2APPLE
PEAR
PEACH
CELERYM
ANDARIN
ORANGEGR
APEFRUIT
CABBAGE
PEPPER, CHILLIOL
IVE OIL
GRAPE
Commod
ity
Hazard Index (HI)2,5
HI adjusted
HI not adjusted
Figure 15: Acute exposure, for adult, using the hazard index approach. The results are disaggregated by food commodities.
Acute exposure for child: Hazard Index
0 1 2 3 4
APPLE
PEAR
PEACH
CELERY
MANDARIN
ORANGE
GRAPEFRUIT
CABBAGE
PEPPER, CHILLI
OLIVE OIL
GRAPE
Commod
ity
Hazard Index (HI)
HI adjusted
HI not adjusted
Figure 16: Acute exposure, for children, using the hazard index approach. The results are disaggregated by food commodities.
95
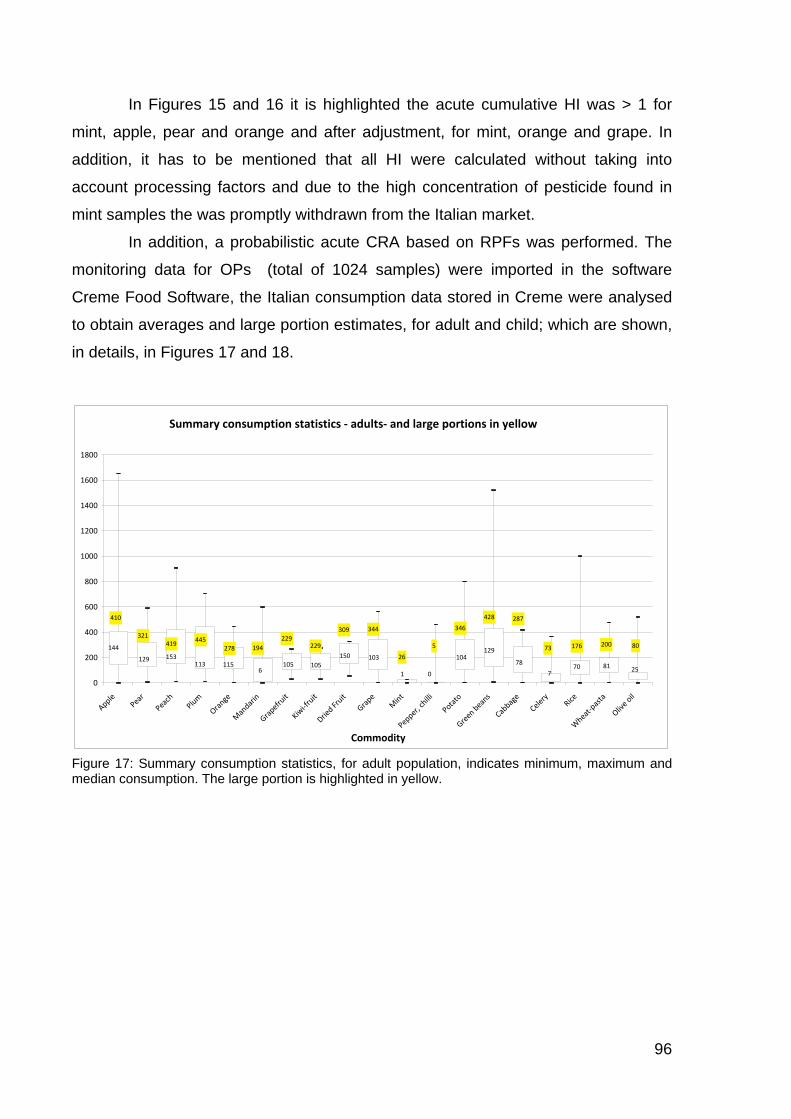
In Figures 15 and 16 it is highlighted the acute cumulative HI was > 1 for
mint, apple, pear and orange and after adjustment, for mint, orange and grape. In
addition, it has to be mentioned that all HI were calculated without taking into
account processing factors and due to the high concentration of pesticide found in
mint samples the was promptly withdrawn from the Italian market.
In addition, a probabilistic acute CRA based on RPFs was performed. The
monitoring data for OPs (total of 1024 samples) were imported in the software
Creme Food Software, the Italian consumption data stored in Creme were analysed
to obtain averages and large portion estimates, for adult and child; which are shown,
in details, in Figures 17 and 18.
Summary consumption statistics ‐ adults‐ and large portions in yellow
1
103150
6 0
104129
78
770 81 25
105105115113153129
144
344309
229229
194278445
419321
410
346
428 287
20017673 805
26
0
200
400
600
800
1000
1200
1400
1600
1800
Apple
Pear
Peach
Plum
Orange
Mandarin
Grapefruit
Kiwi‐fruit
Dried Fruit
Grape
Mint
Pepper, chilli
Potato
Green beans
Cabbage
Celery
Rice
Wheat‐pasta
Olive oil
Commodity
Figure 17: Summary consumption statistics, for adult population, indicates minimum, maximum and median consumption. The large portion is highlighted in yellow.
96

Summary consumption statistics ‐ child‐ and large portions in yellow
109 98140
94 108
6
105
35
82 80 7543
60
354
289
342
395
259
134 151
194
357327
238
374
181
1255
20
66
12 0
149
50
161
71
223
0
100
200
300
400
500
600
700
800
900
1000
Apple
Pear
Peach
Plum
Orange
Mandarin
Grapefruit
Kiwi‐fruit
Dried Fruit
Grape
Mint
Pepper, chilli
Potato
Green beans
Cabbage
Celery
Rice
Wheat‐pasta
Olive oil
Commodity
Figure 18: Summary consumption statistics, for child, indicating minimum, maximum and median consumption. The large portion is highlighted in yellow.
The data in the above two figures showed that a high contribution of
consumption is not always linked to a high exposure to a chemicals. For example,
apples and grape represented a high degree of consumption, according to the Italian
diet. However they did not significantly contributed to the total acute exposure of
OPs. Whereas mint, that showed a low consumption, was relevant for calculating
acute exposure, due mainly to the high concentration of chemicals detected in these
types of food samples. However, due to the high concentration of Chlorpyrifos in
mint samples the correspondent data were excluded from the cumulative
assessment. Therefore, Figure 17 and 18 do not contain this information.
Residue levels in Creme were adjusted according to the RPF and a
probabilistic risk assessment was obtained, using the aforementioned Italian
consumption diet and the data residue of pesticides from the monitoring year 2006.
Probabilistic acute cumulative assessment indicates that the intake of the 99.99th
percentile of adults and toddlers was below the set ARfD of the Index Compound.
The results are show in details in Figures 19 and 20.
97

Adult ‐ higher percentiles of the acute intake of Chlorpyrifos (mg/kg bw)
0
0,01
0,02
0,03
0,04
0,05
0,06
0,07
0,08
0,09
0,1
P 99 P 99,5 P 99,9 P 99,99
Percentile
Intake
(mg/kg bw/day)
General population Consumer only
Figure 19: High percentile of the acute intake, for adult, of Chlorpyrifos.
Child ‐ higher percentiles of the acute intake of chlorpyrifos (mg/kg bw)
0
0,01
0,02
0,03
0,04
0,05
0,06
0,07
0,08
0,09
0,1
P 99 P 99,5 P 99,9 P 99,99
Pecentile
Intake
(mg/kg bw/day)
General population Consumer only
Figure 20: High percentile of the acute intake, for toddler, of Chlorpyrifos.
98

99
Overall Conclusions
The first aim of the thesis was to describe and analyse the results of the
pesticide monitoring programme in Lombardy Region, from 1996 to 2008. The data
of the official control plan on pesticide residues in food of plant origin showed that
the number of samples analysed by the official laboratories of the Lombardy Region
was equal to 9387 indicating that the overall number of samples was higher than the
minimal number set by Ministerial Decree of 23 December, 1992. It is also relevant
to mention that the number of irregular samples was equal to 135 with a percentage
of irregularity equal to 1%.
Samples exceeding Maximum Residue Limits (MRL) are considered
irregular as established by Council Regulation 396/2005/EEC (396/2005/EEC) which
has harmonised across all EU countries such limits. These limits were set taking into
account all categories of consumers including vulnerable groups such as children
and vegetarian and include all the European diets. The values of MRLs were
established in accordance with an assessment made by ' EFSA risk assessment
using models of acute and chronic, and for each active substance were considered
toxicological parameters most critical to an assessment more conservative risk for
the consumer.
The number of samples without residues was equal to 6882 (69%); the
number of samples with residues within the legal limit was 2968 (30%).
Taking into consideration the number of irregular samples through the years
in consideration, it remained substantially unchanged (1%) despite the annual
increase of the number of analysed samples. This is attributable in part to the
activities of regional structures permanently engaged in official control plant
protection products in Lombardy and in part to the constant revision strictly made by
the Italian Ministry of Health and a growing awareness of operators in the use of
agricultural pesticides.
Special attention was devoted in investigating samples of fruit and
vegetables contain more than one active substance, which were 11% of the total
analysed samples.
100
It must be emphasised that the MRL is not a toxicological limit and a
violation is not necessarily a cause of concern for public or animal health. For
pesticides authorized for agricultural use, the MRLs are set at the maximum safe
level that one would expect if the pesticide is used according to the rules and
restrictions specified in the authorisation.
A section of the thesis was especially dedicated to the analysis of pesticide
residues in foods from organic markets. It was then found that in spite of being
properly grown and processed, organic foods are not necessarily free from
pesticides used in conventional farming. Contamination may be due to cultivation on
previously contaminated soil, percolation of chemicals through soil, unauthorized use
of pesticides, cross-contamination with wind drift, spray drift from neighbouring
conventional farms, contaminated groundwater or irrigation water, or even occurred
during transport, processing and storage. Presence of synthetic chemicals, however,
does not necessarily preclude that the food can be described as organic, provided
that all the requirements related to the production process have been fulfilled.
Organic fruits and vegetables can be expected to contain fewer agrochemical
residues than conventionally grown alternatives.
In our study, the comparison of the monitoring results obtained from
conventional and organic food samples showed a 10-fold greater contamination in
conventional products (27%) compared to organic food samples (2.6%). Results
were similar regarding the presence of multiple residues, present in 0.8% of organic
and 8.8% of conventional food samples and in agreement with the findings from
other studies (Baker, B.P: et al. 2002). In the region of Lombardy, the
concentrations of pesticides detected in organic commodities were in their greatest
part below the MRL set for conventional products. Only in one sample (organic
potatoes), the residues found were above the MRL; yet the intake of the active
substance (Dicofol), as calculated for two groups of the Italian population, was far
below the ADI (adults 3,5% ADI, children and toddlers 5%). During the same
monitoring period, Dicofol residues were detected in 20 samples of conventional
food products, including potatoes. Dicofol concentrations were below the MRL, with
the exception of two samples (pears and strawberries). Therefore, in an attempt to
compare organic and conventional foodstuffs in terms of potential risks for human
health due to dietary exposure to pesticide residues, conclusions cannot be drawn
easily, since in both cases the presence of residues above the set MRL is very low.

101
The outcomes of the monitoring program of pesticide residues implemented
by the Region of Lombardy under the mandate of the Ministry of Health and with the
cooperation of the Local Prevention Units and local laboratories, demonstrated that
public health has been safeguarded with success in the last years. Moreover, given
the fact that the complete dataset resulting from the monitoring program is collected
and available after the end of each annual monitoring period; improvements in the
flow of information are regarded as a prerequisite for checking the completeness of
the information provided. It should be mentioned that presently the Region of
Lombardy is taking action in order to improve the current practices and future efforts
would continue in this direction in order to maintain consumers’ trust.
A further step to understand the exposure of consumers to residue of
pesticides in food was obtained by using the deterministic approach developed by
EFSA in the recent past (PRIMo Model). It was found that among the detected 135
irregular samples, only 31 might cause harm to the health of the consumer. The
most commonly found pesticides in irregular samples were Dimethoate,
Procymidone, Ethion and Chlorotalonyl and Dithiocarbamate; which mainly belong to
the functional classes of fungicide and insecticide.
Using the EFSA model for exposure assessment, it has to be noted that in
case of overcoming of the acute toxicological endpoint, expressed in percentage of
ARfD, the diet associated with the results are mainly from Northern Europe
(Germany and UK), in case of absence of the Italian data. Therefore these results
could be taken, with a high degree of uncertainties, as associated with residues of
pesticides found in Lombardy coupled with the Italian diet. On the other hand, the
results for chronic exposure, expressed as percentage of ADI, were found to be
more accurate, being able to retrieve the Italian consumption data for the selected
commodity.
However, it has to be noted that for the irregular samples coming from extra
European countries; they were immediately withdrawn from Italy on arrival at the
inspections borders. Even though these commodities had entered the Italian market,
once analysed by the inspection bodies, they are withdrawn from the market,
according to the RASFF.
One of the aspects that the deterministic approach, used in this section of
the thesis, that could not be solved was the cumulative exposure for multi-residue
samples.

102
In addition, some of the actives substances found in irregular samples
resulted already withdrawn at the time of sampling (e.g. DDT, Esachlorobenzene).
Therefore, the health of the consumers was noticed a convict of fraud, in case the
active substance was withdrawn from the market more than 3 years before the date
of sampling.
An additional step was constituted by the use of the probabilistic method
(Creme Software) to calculate the cumulative exposure of pesticides for the
consumers. In this case three levels of aggregation were tested taking into account
residues of Chlorprofam on one crop (potato), residues of the insecticide
Chlorpyrifos in all food commodities and residues of the chemical group of
Organophosphate. All three sets were plotted in the software along with the Italian
consumption data (Turrini, A. et al. 2001), where the probabilistic acute cumulative
assessment indicated that the intake of the 99.9th percentile of adults and children
was below the set toxicological reference value for acute exposure.
Therefore, it maybe concluded that, even though, in this thesis only a relative
small amount of data was treated, the actual European legislation and its
implementation by the Region of Lombardy under the mandate of the Ministry of
Health were highlighted wherein, of the safety to consumer health was assured to
some degree. However, further implementation could be envisaged: for example, it
was stated that each year the number of collected samples was higher than the
minimal number set by Italian Ministry of Health, whereas, the number of irregular
samples remained substantially unchanged through all years. This could represent a
tool for better implementation of monitoring control, to reduce the number of
analytical determination by focusing more on particular food commodities that are
more prone to chemical contamination or focusing on certain classes of pesticides
with high potential risk to the consumers.
It has to be noted that the purpose of the monitoring programme of
pesticides at National level, from 2010 onwards, is not only to identify samples above
the limit of quantification but also to assess the consumer exposure. For this it could
be relevant to establish a database on the authorised GAPs and pesticide uses at
national level. In addition, it could be envisaged the implementation of the new
format, developed by EFSA, for reporting the pesticides monitoring results, to put
efforts in recording and reporting the production method (conventional vs. organic) of
the analysed samples, to report possible reasons for the MRL overrun and to clearly
103
indicate if, as a consequences of a sample exceeding the MRLs, the lot was not put
on the market and therefore was not available for consumption.
It has to be acknowledged that, during the recent years, a lot of progress
was made to calculate and reduce the risk of consumers, derived by pesticides’
exposure. However, as part of the Risk Assessment Paradigm, the communication of
risk plays an important role. Reading newspapers, we are often in contact with
reported food scares, which might distort the risk perception of the general
consumers. Therefore, there might be the need to reinforce the long-term
investment, at European and National level, in promotion to inform consumers and
educational campaigns on food-borne risks; this would help to build an individual
awareness towards the risks from pesticide residues in food commodities.

104
R
eferences
Baker, B.P. Benbrook, C.M. Groth III, E., Lutz Benbrook, K. Pesticide residues in
conventional, integrated pest management (IPM)-grown and organic foods: Insights
from three US data sets, Food Addit. Contam, 2002, 19, 427–446.
Banasiak U, Heseker H, Sieke C, Sommerfeld C, Vohmann C. Abschätzung der
Aufnahme von Pflanzenschutzmittel-Rückständen in der Nahrung mit neuen Ver-
zehrsmengen für Kinder. Bundesgesundheitsblatt – Gesundheitsforschung – Ge-
sundheitsschutz, 2005, 48: 84-98
Boon E., Tjoe Nij E.I.M, van Donkersgoed G., van Klaveren J.D. Probabilistic intake
calculations performed for the Codex Committee on Pesticide Residues. RIKILT -
Institute of Food Safety, Wageningen, the Netherlands, Report 2004-2005.
Boon E., van der Voet H., van Klaveren J.D. Validation of a probabilistic model of
dietary exposure to selected pesticides in Dutch infants. Food Additives and
Contaminants, 2003, Supplement 1, 20, S36-S49.
Boon E., van Klaveren J.D. Food consumption data for use in the evaluation of
residue data of plant protection products. Draft document 2005, RIKILT-Institute of
Food Safety, Wageningen, the Netherlands.
Calliera M., Finizio A., Azimonti G., Benfenati E., Trevisan M. Harmonised pesticide
risk trend indicator for food (HAPERITIF): The methodological approach. Pest
Management Science, 2006, 62, 12, 1168-76.
Chronic consumer risk assessment. UK Pesticides Safety Directorate (PSD), 2006
http://www.pesticides.gov.uk/approvals.asp?id=1687
Commission Directive 2002/63/EC of 11 July 2002 establishing Community methods
of sampling for the official control of pesticide residues in and on products of plant
and animal origin and repealing Directive 79/700/EEC. Official Journal L 187/30, 1-
24.

105
Commission Directive 2004/44/EC of 13 April 2004 amending Directive 2002/69/EC
laying down the sampling methods and the methods of analysis for the official control
of dioxins and the determination of dioxin-like PCBs in foodstuffs. Official Journal L
113 , 20/04/2004, 0017–0018.
Commission Regulation (EC) No 178/2006 of 1 February 2006 amending Regulation
(EC) No 396/2005 of the European Parliament and of the Council to establish Annex
I listing the food and feed products to which maximum levels for pesticide residues
apply. Official Journal L 29, 2.2.2006, 3–25.
Council Directive 76/895/EEC of 23 November 1976 relating to the fixing of
maximum levels for pesticide residues in and on fruit and vegetables. Official Journal
L 340, 9.12.1976, 26–31.
Council Directive 82/528/EEC of 19 July 1982 amending Annex II to Directive
76/895/EEC relating to the fixing of maximum levels for pesticide residues in and on
fruit and vegetables. OJ L 234, 9.8.1982, 1–4.
Council Directive 86/362/EEC of 24 July 1986 on the fixing of maximum levels for
pesticide residues in and on cereals. Official Journal L 221, 7.8.1986, 37–42.
Council Directive 90/642/EEC of 27 November 1990 on the fixing of maximum levels
for pesticide residues in and on certain products of plant origin, including fruit and
vegetables. Official Journal L 350, 14.12.1990, 71–79.
Council Directive 90/642/EEC of 27 November 1990 on the fixing of maximum levels
for pesticide residues in and on certain products of plant origin, including fruit and
vegetables. Official Journal L 350, 14.12.1990, p. 71–79.
Council Directive 90/642/EEC of 27 November 1990 relating to the fixing of
maximum levels for pesticide residues in and on food of plant origin. Official Journal
L 83, 13.4.1995, 52.
Council Directive 91/414/EEC of 15 July 1991 concerning the placing of plant
protection products on the market. Official Journal L 230, 19.8.1991, 1–32.

106
Decreto del Ministero della Salute 27 Agosto 2004 (G.U. n. 292 del 14.12.2004).
“Prodotti fitosanitari: limiti massimi di residui delle sostanze attive nei prodotti
destinati all’alimentazione”.
Decreto del Ministero della Sanità del 23 dicembre 1992 (G.U. n 305 del
30.12.1992). “Recepimento della direttiva n. 90/642/CEE relativa ai limiti massimi di
residui di sostanze attive dei presidi sanitari tollerate su ed in prodotti “ modificato dal
decreto del Ministro della Sanità del 30 luglio 1993 (G.U. n 182 del 05.08.1993)
“Integrazioni al decreto ministeriale 23 dicembre 1992 recante il recepimento della
direttiva n. 90/642/CEE relativa ai limiti massimi di residui di sostanze attive dei
presidi sanitari tollerate su ed in prodotti”.
Decreto del Ministro della sanità del 22 aprile 1991 (G.U. n. 139 del 15 giugno 1991).
Disposizioni in materia di trasmissione periodica dei risultati delle analisi dei
campioni per il controllo degli alimenti e delle bevande condotte dalle regioni e dalle
Unita' Sanitarie Locali, in attuazione del decreto del Presidente del Consiglio dei
Ministri 20 maggio 1988.
Decreto Legislativo del 17 marzo 1995, n. 220. Attuazione degli articoli 8 e 9 del
regolamento CEE n. 2092/91 in materia di produzione agricola ed agroalimentare
con metodo biologico. Gazzetta Ufficiale, Serie Generale n. 129, Suppl. Ordinario n.
69.
Decreto Ministeriale del 19 maggio 2000 del Ministero della Sanità. Limiti massimi di
residui di sostanze attive dei prodotti fitosanitari tollerati nei prodotti destinati
all’alimentazione. Gazzetta Ufficiale, Serie Generale n. 207 del 5-9-2000, Suppl.
Ordinario n. 144.
Decreto Ministeriale del 23 dicembre 1992 del Ministero della Sanità.Recepimento
della direttiva n. 90/642/CEE relativa ai limiti massimi di residui di sostanze attive dei
presidi sanitari tollerate su ed in prodotti. Gazzetta Ufficiale, Serie Generale n. 305
del 30-12-1992.
Decreto Ministeriale del 23 Luglio 2003 (GU n. 221 del 23-9-2003). “Attuazione della
direttiva 2002/63/CEE dell’ 11 luglio 2002 relativa ai metodi di campionamento ai fini
107
del controllo ufficiale dei residui di antiparassitari nei prodotti alimentari di origine
vegetale e animale”.
Decreto Ministeriale del 27 agosto 2004 del Ministero della Sanità. Prodotti
fitosanitari: limiti massimi di residui delle sostanze attive nei prodotti destinati
all’alimentazione. Gazzetta Ufficiale, Serie Generale n. 292 del 14-12-2004, Suppl.
Ordinario n.179.
Decreto Ministeriale del 30 luglio 1993 del Ministero della Sanità. Integrazioni al
decreto ministeriale 23 dicembre 1992 recante il recepimento della direttiva n.
90/642/CEE relativa ai limiti massimi di residui di sostanze attive dei presidi sanitari
tollerate su ed in prodotti. Gazzetta Ufficiale, Serie Generale n. 182 del 5-8-1993.
Department of Pesticide Regulation, DPR MT-3. Guidance for Dietary Exposure
Assessment, Medical Toxicology Branch, California Environmental Protection
Agency, 2004.
Directive 2009/128/EC of the European Parliament and of the Council of 21 October
2009 establishing a framework for Community action to achieve the sustainable use
of pesticides. Official Journal L 309, 24.11.2009, p. 71–86.
Earl M., Kaethner M., Uihlein M. Unit to unit variation of pesticide residues-options
for acute dietary risk assessment. Food Additives and Contaminants, 2000, 17, 7,
583-589.
European Food Safety Authority (EFSA) 2005. Opinion of the Scientific Panel on
Plant health, Plant protection products and their Residues on a request from
Commission related to the appropriate variability factor(s) to be used for acute
dietary exposure assessment of pesticide residues in fruit and vegetables (Question
N° EFSA-Q-2004-124) adopted on 16 February 2005. The EFSA Journal 177, 1-61.
European Food Safety Authority (EFSA) 2007. Reasoned opinion on the potential
chronic and acute risk to consumers’ health arising from proposed temporary EU
MRLs, 15 March 2007.

108
European Food Safety Authority (EFSA) 2008. Annual Report on Pesticide Residues
according to Article 32 of Regulation (EC) No 396/2005. EFSA Journal 2010, 8, 6,
1646.
European Food Safety Authority (EFSA) 2008. Opinion of the Scientific Panel on
Plant Protection products and their Residues to evaluate the suitability of existing
methodologies and, if appropriate, the identification of new approaches to assess
cumulative and synergistic risks from pesticides to human health with a view to set
MRLs for those pesticides in the frame of Regulation (EC) 396/2005. EFSA Journal
2008, 704, 1-84.
European Food Safety Authority (EFSA) 2009. Scientific Opinion on Risk
Assessment for a Selected Group of Pesticides from the Triazole Group to Test
Possible Methodology to Assess Cumulative Effects from Exposure through Food
from these Pesticides on Human Health. EFSA Journal 2009, 7, 9, 1167.
Environmental Protection Agency (EPA). Assigning values to non -detected / non-
quantified pesticide residues in human health dietary exposure assessments. Draft
Science Policy Paper, 1998.
Environmental Protection Agency (EPA). Guidance for Refining Anticipated Residue
Estimates for Use in Acute Dietary Probabilistic Risk Assessment, Office of Pesticide
Programs, 2000.
Environmental Protection Agency (EPA). Meeting of the FIFRA (Federal Insecticide,
Fungicide and Rodenticide Act) Scientific Advisory Panel, A Background Document
for the Session: Statistical Methods for Use of Composite Data in Acute Dietary
Exposure Assessment, 1999.
European Commission, DG Health and Consumer Protection (DG SANCO). Status
of the active substances under EU Review (Doc. 3010 Rev. 17/10/2006).
http://ec.europa.eu/food/plant/ protection/evaluation/stat active subs 3010 en.xls
(accessed October 2006).

109
European Commission, DG Health & Consumer Protection. Monitoring of pesticide
residues in products of plant origin in the European Union, Norway, Iceland and
Liechtenstein, 2002 Report.
European Food Safety Authority (EFSA). Opinion of the Scientific Panel on Plant
health, Plant protection products and their Residues on a request from Commission
related to the appropriate variability factor(s) to be used for acute dietary exposure
assessment of pesticide residues in fruit and vegetables (Question N° EFSA-Q-
2004-124) adopted on 16 February 2005. The EFSA Journal 177, 1-61).
European Union Council Directive 91/414/EEC of 15 July 1991 concerning the
placing of plant protection products on the market. Official Journal of the European
Union L 230, 19.8.1991.
European Union Council Regulation n. 2092/91/EEC of 24 June 1991 on organic
production of agricultural products and indications referring thereto on agricultural
products and foodstuffs. Official Journal of the European Union L 198, 22/07/1991.
EUROSTAT, Statistical office of the Commission of the European Union, ECE
Statistical Division. Agricultural, Forestrry and Fisheries database; Food
Consumption, 2005.
FAOSTAT database, 2005. Food Balance Sheets. http://faostat.fao.org/.
Food and Agriculture Oraganization of the United Nations (FAO)/World Health
Oraganization (WHO). Pesticide residues in food: 1992 evaluations, Part II–
Toxicology. WHO/PCS/92.52, 1992.
Food and Drug Administration (FDA), Center for Food Safety and Applied Nutrition,
Pesticide Program for Residue Monitoring, 1995-2002.
General Press and Communications. Risk Issues, February 2006, Special
Eurobarometer 238/Wave64.1–TNS Opinion & Social.
German Chronic and Acute Consumption Data and Model, Bundensgesundheitsbl-
Gesundheitforsch-Gesundheitsschtz, 2005. http://www.bfr.bund.de/cd/579

110
Goranka C., Schwack W. Residue analysis of dithiocarbamate fungicides, Trends in
Analytical Chemistry, 2009, 28, 1.
Graham J.D. Historical perspective on risk assessment in the federal government.
Toxicology, 1995, 102, 29-52.
Hans R., and Hubner H. Fixing of limit values for pesticide residues in/on foods.
Estimation of pesticide residue intake via food. Federal Health Gazette, May 5,
Special Edition 1992, Federal Health Office.
Joint Meeting of the FAO Panel of Experts on Pesticides Residues in Food and the
Environment and the WHO Core Assessment Pesticide residues in food.
Toxicological evaluations / Joint Meeting of the FAO Panel of Experts on Pesticides
Residues in Food and the Environment and the WHO Core Assessment Group,
Geneva, 17-26 September 2001. ISBN 92 4 166517 3. (NLM Classification: WA
240).
Kroes R., Muller D., Lambe J., Lowik M.R.H., van Klaveren J., Kleiner J., Massey R.,
Mayer S., Urieta I., Verger P., Visconti A. Assessment of intake from the diet, Food
and Chemical Toxicology, 2002, 40, 327 -385.
Lambe J. Proceedings of the Nutrition Society. The use of food consumption data in
assessments of exposure to food chemicals including the application of probabilistic
modeling, Proceedings of the Nutrition Society, 2002, 61: 11-18 Cambridge
University Press.
Lopez A., Rueda C., Armentia A., Rodriguez M., Cuervo L., Ocio J.A. Validation and
sensitivity analysis of a probabilistic model for dietary exposure assessment to
pesticide residues with a Basque Country duplicate diet study. Food Additives and
Contaminants, 2003, Supplement 1, 20, S87-S101.
Magkos, F. Arvaniti, F. Zampelas, A. Organic food: buying more safety or just peace
of mind? A critical review of the literature. Critical Reviews in Food Science and
Nutrition, 2006, 46, 23–56.

111
McNamara, C., Naddy. B., Rohan, D., Sexton, J. Design, development and validation
of software for modelling dietary intake to food chemicals and nutrients. Food
Additives and Contaminants, 2003, Supplement 1, 20.
Meister, R.T. Farm Chemicals Handbook 1992. Meister Publishing Company,
Willoughby, OH.
Note 16 June 2010. Italian Ministry of Health, Department of Health Public
Veterinary, Nutrition and Food Safety.
http://www.salute.gov.it/imgs/C_17_pagineAree_1765_listaFile_itemName_0_file.pdf
Occupational Health Services, Inc. 1992 (Nov. 11). MSDS for Chlorpropham. OHS
Inc., Secaucus, NJ.
Pesticides Safety Directorate, Ministry of Agriculture, Fisheries and Food, 1999.
Consumer exposure model, Guidance on the estimation of dietary intakes of
pesticide residues.
Rauh, V.A., Garfinkel, R., Perera, F.P., Andrews, H.F., Hoepner, L., Barr, D.B.,
Whitehead, R., Tang D., Whyatt R.W. Impact of Prenatal Chlorpyrifos Exposure on
Neurodevelopment in the First 3 Years of Life Among Inner-City Children, Pediatrics,
2006, 118, 6, e1845-e1859.
Regulation (EC) No 178/2002 of the European Parliament and of the Council of 28
January 2002 laying down the general principles and requirements of food law,
establishing the European Food Safety Authority and laying down procedures in
matters of food safety. Official Journal L 31, 1.2.2002, 1–24.
Regulation (EC) No 396/2005 of the European Parliament and of the Council of 23
February 2005 on maximum residue levels of pesticides in or on food and feed of
plant and animal origin and amending Council Directive 91/414/EEC Text with EEA
relevance. Official Journal L 70, 16.3.2005, 1–16.
Regulation (EC) No 882/2004 of the European Parliament and of the Council of 29
April 2004 on official controls performed to ensure the verification of compliance with

112
feed and food law, animal health and animal welfare rules. Officila Journal L 165,
30.4.2004, 1–141.
Richter, T., Padel, S. Overview of the European market for organic foods. In The
World of Organic Agriculture-Statistics and Emerging Trends; Willer, H.; Yussefi, M.,
Eds.; International Federation of Organic AgricultureMovements (IFOAM): Bonn,
Germany, 2005, 107–115.
Saba, A., Messina, F. Attitudes towards organic foods andrisk/benefit perception
associated with pesticides, Food Qual. Pref. 2003, 14, 637–645.
Sahota, A. Overview of the global market for organic food and drink. In TheWorld of
Organic Agriculture-Statistics and Emerging Trends; Willer, H, Yussefi, M., Eds.;
International Federation of Organic Agriculture Movements (IFOAM): Bonn,
Germany, 2004, 21–26.
Soil Survey and Land Research Center (SSLRC) and its project collaborators 1997.
Further Analysis of presence of residues and impact of plant protection products in
the EU. Final Report 1997. http://ec.europa.eu/environment/ppps/pdf/ssrlc.pdf
Tasiopoulou, S., Chiodini, A.M, Vellere, F., Visentin, S. Results of the monitoring
program of pesticide residues in organic food of plant origin in Lombardy (Italy),
Journal of Environmental Science & Health, Part B, 2007, 42, 835-841.
Turrini, A., Saba, A., Perrone, D., Cialfa E., D’Amicis, A. Food consumption patterns
in Italy: the INN-CA Study 1994-96, European Journal of Clinical Nutrition, 2001, 55,
7, 571-588.
Turrini, A. Saba, A. Perrone, D. Cialfa, E. D’ Amicis, A. Food consumption patterns in
Italy: the INN-CA Study 1994-1996, Eur J Clin Nutr. 2001, 55, 7, 571–588.
World Health Organization (WHO) 1997. Food consumption and exposure
assessment of chemicals. Report of a FAO/WHO Consultation. Geneva,
Switzerland, 10 - 14 February 1997, Geneva, Document WHO/FSF/FOS/97.5,
Geneva.

113
World Health Organization (WHO) 2003. GEMS/FOOD Regional diets: Regional per
Capita Consumption of Raw and Semi-processed Agricultural Commodities.
Prepared by the Global Environment Monitoring System/Food Contamination
Monitoring and Assessment Programme, Food Safety Department.
World Health Organization (WHO) 2006. GEMS/FOOD cluster diets. The Global
Environment Monitoring System/Food Contamination Monitoring and Assessment.
Programme (GEMS/Food);
http://www.who.int/foodsafety/chem/gems/en/index1.html.
World Health Organization (WHO) GEMS/FOOD Regional Diets; Food Safety Issues
WHO/FSF/98.3. Geneva, 1998.
World Health Organization (WHO). Guidelines for predicting dietary intake of
pesticide residues (revised), WHO/FSF/FOS/97.7 World Health Organization,
Geneva, 1997.
Zanoli, R., Naspetti, S. Consumer motivations in the purchase of organic food; a
means-end approach, British Food Journal 2002, 104, 8, 643–653.

UNIVERSITA’ CATTOLICA DEL SACRO CUORE PIACENZA Scuola di Dottorato per il Sistema Agro-alimentare Doctoral School on the Agro-Food System