Embed Size (px)
Citation preview
Consumers’ perception of a warranty as a signal of quality:
An Empirical study on the automobile industry
BUSIK CHOI
University of California, Irvine
Department of Economics
e-mail: [email protected]
November 16, 2006
1
1 Introduction
In recent years, several automobile companies have changed the warranties on their
cars, and, after the change, have seen their market share change significantly. For example,
in 1999 Hyundai Motors extended their power train warranty from 5 years and 60,000 miles
to 10 years and 100,000 miles. In subsequent years, Hyundai’s U.S. market share increased
from 1.1% to 4%. In another example, Dodge saw a 5% increase in sales after changing their
warranty in the time period between November 2001 and July 2002. These are just a few
examples of firms that have introduced longer warranties in recent years. Yet, there are also
firms that have reduced the length of warranties. In 2002, Volkswagen reduced the power
train warranty on their vehicles from 10 years/ 100,000 miles to 5 years/ 60,000 miles. In
the 3 years after the warranty change, sales of Volkswagen cars in the U.S. declined 30%.
These examples suggest a high level importance of warranty coverage in the demand for
automobiles. This naturally raises the question: do consumers consider a warranty as a
signal of product quality, as theorized in the economic literature?
Although there are many theoretical papers that consider warranties and signaling,
only a few papers empirically examine warranties as a form of signaling.1 Several reasons
may explain why there are relatively few empirical studies in this field. One reason might
be the lack of a data set that contains various types of product characteristics and man-
ufacturer information along with consumer information. Another reason might be due to
the difficulty in measuring intangible concepts, such as signaling, risk aversion, moral haz-
ard, and adverse selection. Measuring these concepts in information economics requires a
detailed empirical model of consumer behavior.
The automobile industry is a natural candidate for an empirical study in information
economics not only because of recent changes in warranty terms, but also because of read-
ily available data for this type of research. Another benefit of analyzing the automobile1Riley (2001)says “Despite the plethora of theories arguing that introductory prices, advertising, and
warranties can signal high quality, there is remarkably little applied work seeking empirical support”.
2

industry is the existence of well developed econometric specifications that directly model
consumer utility.2 In this paper, a conditional logit model is used to describe consumer be-
havior with consumer level data from the Consumer Expenditure Survey. Several data sets
from Automotive News, Consumer Report and Warranty Direct, are used to to measure the
degree to which warranties affect choice as a signal. The major contribution of this paper
to the existing literature is the use of a discrete choice model and consumer level data set
to study information economics.
The results of this paper indicate that a warranty increases the likelihood of a product
being chosen. This paper also tries to distinguish between the two possible explanations
for the increased likelihood, signaling and risk aversion. Estimation results show tha weak
support of risk aversion motive for warranty but do support the signaling motive.
2 Signaling and warranty
Among the theories about the role of information in economics, adverse selection and
moral hazard show how asymmetric information can complicate market operation.3 Signal-
ing theory argues that some informed agents may try to reduce asymmetric information by
sending signals to uninformed agents.4 Warranties are considered a common type of signal
sent by “high quality” firms to reduce the consumers’ informational gap on the quality of
their products. With the assumption that offering a warranty is more costly for firms pro-
ducing “low quality” products, a warranty can be a credible signal of product quality. In
the automobile industry, such an assumption clearly holds. Product failures are correlated
to the quality of products. Therefore, the cost of offering a longer warranty for a low quality2See Goldberg(1995), Berry(1994), Berry, Levisohn, and Pakes(1995), Brownstone and Train(1999), and
Train and Winston(2004)3Akerlof(1970)[3] shows that lack of information might hinder a function of markets.4Spence(1977)[11] argues that signaling will facilitate the function of market when there is lack of infor-
mation under the assumption that market is perfectly competitive, and Grossman(1981)[8] find the similar
result with more relaxed assumption on the market (single supplier). Gal-Or(1989)[12] focuses on duopoly
market and argues possibility of multiple equilibriums.
3
car will be high. This makes the automobile industry a suitable industry for empirically
testing the use of warranties as a signal.
However, based on both a firm’s warranty and the consumers’ response to the war-
ranty, several different types of equilibrium may exist. First, a separating equilibrium exists
when firms have different types of warranties based on the quality of their products, and
consumers interpret the warranty as a signal. Consumers perceive and update their prior
beliefs of product quality with the presence of a warranty. Another equilibrium is a pooling
equilibrium, where firms offer the same warranty regardless of their product quality and
consumers can not distinguish the quality of products. Based on producers’ and consumers’
behavior either types of equilibria can exist.
A warranty is only effective as a signal in a separating equilibrium. There are sev-
eral necessary conditions for a separating equilibrium. First, all firms know that a longer
warranty is expensive for firms which produce “lower quality” products and all firms offer
different levels of warranties based on product quality (durability). The second condition
is that consumers should consider a longer warranty as a signal of higher product quality.
The first condition holds in the automobile industry as the cost to firms of offering longer
warranties depends on product quality. In the empirical information economics literature,
research has focused on firm behavior.5 Consumer perception of warranty, however, has not
been as well studied. This paper mainly focuses on how consumers perceive a warranty.
There are two distinct reasons consumers may prefer a longer warranty. First, con-
sumers may consider warranty as a signal of quality because they know warranties are
costly to offer. In the case of durable goods where consumers do not have full information
on quality, consumers may rely on the offer of warranties to make more informed decisions.
Second, consumers might prefer to buy a product with a longer warranty because they are
risk averse. In this case, a warranty is insurance against product failure. With an assump-5For example, Jin and Leisle(2003)[9] study how posting hygiene quality grade cards in a restaurant
changes consumers behavior by using restaurant revenue data rather than consumer side data.
4

tion that consumers are heterogenous in risk aversion, more risk averse consumers prefer
a longer warranty as it reduces the risk of product failure. These two reasons show that
a warranty may be effective not only because a warranty reduces the informational gap
between producers and consumers, but also because a warranty acts as an insurance policy
against product failure.
Producers also have analogous reasons for offering a warranty. First a firm producing
“high quality” products has an incentive to send a signal to distinguish their products from
other “medium or low quality” products. Since the firms producing high quality products
know that it is expensive for firms producing “low quality” products to offer such a war-
ranty, only firms producing high quality products might be able to distinguish themselves
by offering a longer warranty. This is especially true in a durable goods market such as
automobiles, since product failure is a probabilistic function of durability. Second, firms
might consider a warranty as a type of profitable insurance. A firm can hedge the risk that
consumers are not willing to take over all the products that they sell. Since a firm can not
determine the risk tolerance of a consumer, such a hedge allows them to offer a warranty
that will capture the demand of consumers that are extremely risk averse.
In an empirical study, directly controlling for consumer risk aversion is not practical
due to the lack of suitable data. Suitable data would include expected utilities from both
cases, when products fail and when products work well, and the associated risk premiums.
However, showing whether or not consumers reveal a strong risk aversion against product
failure is possible with a stringent assumption that all consumers are consistent in respond-
ing to all types of risks. With such an assumption, one way of observing consumer risk
averseness is to use consumer insurance expenditures on other matters such as car liability,
life, or property. Such insurance expenditure variables might act as a proxy for consumer
risk aversion. If consumers reveal the same risk aversion against product failure and finan-
cial loss, consumers who spend more on other types of insurance are relatively more risk
averse, and therefore would prefer to have a longer product warranty relative to consumers
with less risk aversion.
5

With the assumption that product failure is a function of product quality (durability),
consumers have limited information about quality when they buy a certain product. While
making a purchase decision, consumers use their prior information of product quality, as it
can not be directly observed before purchase. In this sense observing possible information
that could affect a consumer’s prior information is critical in analyzing the effect of war-
ranty as a signal. Prior information might come from several sources, including their own
past experience, information from friends or relatives, magazine, and news. Thus, sources
of information can be separated into two categories, private and public sources. Private
sources are sources that not generally available to the public, for example their past ex-
periences and information obtained from friends and relatives. Public sources are sources
generally available to the public, for example magazines, news, and advertisement. Among
those, magazines and news share common features in the sense that third parties are dis-
tributing the information, while advertisements convey information directly from producers.
Information from both private and public sources affects consumers’ perceptions of product
quality and product choice. The information accumulated aids a consumer in forming prior
beliefs of product quality.
In an empirical study, it is almost impossible to directly observe prior beliefs that affect
consumer decisions on purchasing a certain product. Although individual consumers might
have totally different prior beliefs about the quality of available products, there might be
some common belief about quality of certain brands, for example, the durability of Toyota.
Some of those common prior beliefs of products may be controllable by brand fixed effects.
In addition, this paper tries to control for the information that consumer can obtain. Fol-
lowing Train and Winston (2004), car brands currently owned by consumers are used in
order to control for consumer information from direct experience. Such a variable might
be able to control how their own past experience affects a consumers’ product choice, in a
sense, brand loyalty. As Train and Winston point out, if unobserved consumer preference
is correlated with the products they have chosen in the past and their current choice, the
coefficient of brand loyalty variable might capture the unobserved consumers’ preference
6
along with how consumers’ product choice is influenced by past experience. Therefore, the
coefficient of the brand loyalty variable captures both effects: unobserved consumer prefer-
ence and information from past experiences. In this paper, brand fixed effect is also used
to control for unobserved consumer preference for a certain brand along with brand loyalty
variables.
Car ratings from Consumer Reports are used to control for information that consumers
can obtain from public sources. The rating of cars can also be considered common percep-
tion since the rating is a result of consumer surveys. Consumer Reports compute their
ratings based on surveys of consumers who have purchased and used certain products, and
therefore generally exclude new products. Since Consumer Reports ratings are based on
surveys, they can be considered a proxy for general perception of product quality. The fact
that Consumer Report does not report all car models might be used to determine whether
warranties increase information available to consumers. Consumers might value on informa-
tion about lesser known products more than the information about a well known product.
For example, if consumers know the durability of Toyota Camry well enough and do not
have much information about the durability of the newly introduced Toyota Matrix, the
value of information for the Matrix might be higher than for the Camry. In this sense, the
value of a signal sent by warranty might be more for less known products than well known
products
3 Data and Empirical Specification
3.1 Data
The Consumer Expenditure Survey (CES) [1] from 1998 to 2002 is used to model
demand. The CES is made up of quarterly surveys which retain 75 percent of the original
respondents in the next wave, while replacing 25 percent of the sample with new individuals.
In each quarter of 1998, approximately 4500 households were surveyed, with the sample size
7
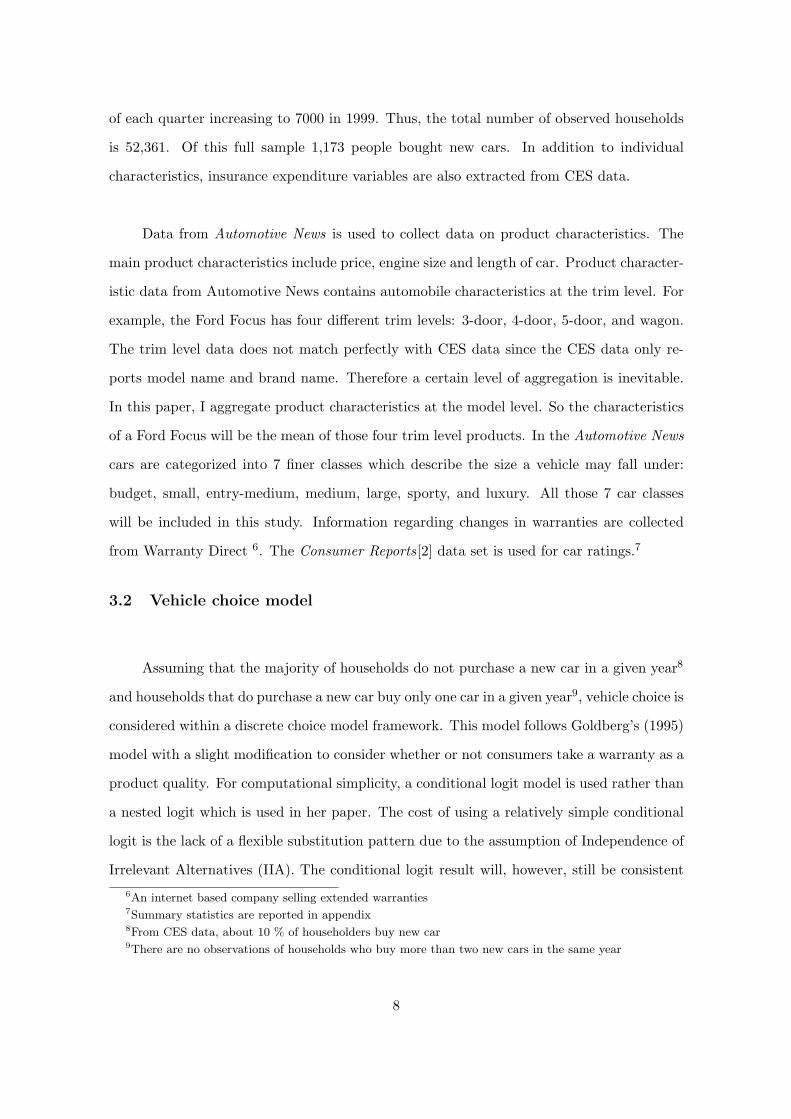
of each quarter increasing to 7000 in 1999. Thus, the total number of observed households
is 52,361. Of this full sample 1,173 people bought new cars. In addition to individual
characteristics, insurance expenditure variables are also extracted from CES data.
Data from Automotive News is used to collect data on product characteristics. The
main product characteristics include price, engine size and length of car. Product character-
istic data from Automotive News contains automobile characteristics at the trim level. For
example, the Ford Focus has four different trim levels: 3-door, 4-door, 5-door, and wagon.
The trim level data does not match perfectly with CES data since the CES data only re-
ports model name and brand name. Therefore a certain level of aggregation is inevitable.
In this paper, I aggregate product characteristics at the model level. So the characteristics
of a Ford Focus will be the mean of those four trim level products. In the Automotive News
cars are categorized into 7 finer classes which describe the size a vehicle may fall under:
budget, small, entry-medium, medium, large, sporty, and luxury. All those 7 car classes
will be included in this study. Information regarding changes in warranties are collected
from Warranty Direct 6. The Consumer Reports[2] data set is used for car ratings.7
3.2 Vehicle choice model
Assuming that the majority of households do not purchase a new car in a given year8
and households that do purchase a new car buy only one car in a given year9, vehicle choice is
considered within a discrete choice model framework. This model follows Goldberg’s (1995)
model with a slight modification to consider whether or not consumers take a warranty as a
product quality. For computational simplicity, a conditional logit model is used rather than
a nested logit which is used in her paper. The cost of using a relatively simple conditional
logit is the lack of a flexible substitution pattern due to the assumption of Independence of
Irrelevant Alternatives (IIA). The conditional logit result will, however, still be consistent6An internet based company selling extended warranties7Summary statistics are reported in appendix8From CES data, about 10 % of householders buy new car9There are no observations of households who buy more than two new cars in the same year
8

when appropriate fixed effects are used.10 In this paper, car class fixed effects are used.
Although these two fixed effects are used as nesting structures in Goldberg (1995), in this
model the fixed effect capture consumers’ unobserved utility from choosing a certain car
class. I assume that consumers maximize utility given some information, so that the indirect
utility function of a consumer who buys a new car can be written as
Uij = Vij + εij (1)
where i indicate a householder i = 1, 2, ..., I, j indicates choice of product j = 0, 1, ..., J11,
Uij indicates a consumer i’s indirect utility from a product j, and εij indicates the con-
sumer’s unobserved utility from products. The deterministic component of the utility func-
tion can be expressed as product characteristics excluding price (Zj), consumers’ informa-
tion about a certain product (Xij), and warranty variables and a price variable interacted
with income (Wij).
The deterministic part of the utility function can be written as
Vij = α′Zij + β′Xij + γ′Wij (2)
where α, β, and γ are sets of parameters to be estimated. The product characteristics are
similar to previous vehicle choice models.12 In this paper, three different product charac-
teristics are used: displacement (DISP), length (LENGTH), and warranty (WT) interacted
with car class dummy variables. The variables for consumers’ information (Xij) include con-
sumers past experience about certain products and possible information sets that consumers
might have. The variables of information that might affect consumers utility are ratings
(RATE) from Consumer Reports. The matrix (Wij) includes a set of variables that indicate
consumers’ preference for warranty and price variables. A new variable price variable is10This paper focuses on finding the impact of the warranty as a signal rather than finding detail consump-
tion patterns such as elasticity. Therefore, a conditional logit will be sufficient for testing the existence of a
signal by warranty, as the estimates would be consistent.11when j = 0, the consumer chooses to not to buy a new car. In this case the utility of not buying a new
car is assumed to be zero.12See Goldberg(1995)[7], Berry(1994)[5], Berry, Levison, and Pakes(1995)[4], Brownstone and
Train(1999)[6], and Train and Winston(2004)[13]
9

constructed by subtracting the price of a vehicle (Pj) from the income of consumers (Yi).
Using this variable rather than just the price allows me to take into account differences in
consumers’ income. The warranty variables consist of interaction terms between a warranty
(WT) and other variables, a dummy variable (NORATE) that indicates nonexistence of a
car ratings on Consumer Reports and a set of dummy variables that indicate consumers’
different level of risk averseness.
The indirect utility function, equation (1), can be rewritten as
Uij = α1LENGTHj + α2DISPj +∑
class
αclassWTj ∗Dclass + β1EXP1ij + β2EXP2ij
+ β3RATEj + β4NORATEj + γ1NORATEj ∗WTj + γ2(Yi − Pj)
+∑ra
γraWTj ∗Dra + ξclass + εij (3)
where α, β, γ and ξ indicate coefficients for product characteristics, information sets, war-
ranty variables and fixed effects, respectively. In order to control for information sets that
might affect the consumer’s choice on vehicle, consumers’ past experience variables, and
ratings from Consumers Reports. With the assumption that consumers’ past experience
in the use of a certain car affects their utility, two different types of experience variables
(EXP1, EXP2) are used.13 EXP1 is a dummy variable indicating whether or not con-
sumers have previously purchased cars belonging to the same brand. EXP2 is a variable
that indicates the number of same-branded vehicles in the consumers car ownership history
when the household reports owning more than one vehicle.
3.3 Risk Aversion and Signaling
In this section, I explain the empirical strategy that might be able to separate warranty
effects caused by two different motives, signaling and risk aversion. In order to separate
those two possible reasons, the warranty variable is interacted with two sets of dummy
variables, a set of dummy variables that indicates the level of consumers’ risk aversion and13Consumers prefer to repeat their purchase decisions and buy from specific firms when they have had
positive experiences with a specific firm’s products.
10

a dummy variable that indicates products that has no rating on Consumer Reports.
In order to create a set of dummy variables that indicates consumers’ level of risk
aversion, insurance expenditure for vehicles is used as a proxy that indicates the level of
consumers’ risk aversion.14 Using the insurance expenditure variable as a direct measure of
the level of consumers’ risk aversion brings several problems. First, vehicle insurance expen-
diture is highly correlated with a consumer’s income. Consumers who have higher income
more likely to buy expensive cars, so that insurance expenditure will be higher. Second,
insurance expenditure is also correlated with the number of cars owned by the consumer.
In order to normalize insurance expenditure comparable over all consumers, insurance ex-
penditure is divided by the number of cars owned and then that value is again divided
by the consumers’ income. This variable indicates the income share of vehicle insurance
expenditure per car.
The variable is used to distinguish how consumers are risk averse. However, there
might be some regional differences on insurance expenditures. The income share of auto
insurance expenditure might be higher in some region not because of householders’ risk
averseness but because of insurance premium difference based on the region. In order to
control the regional difference, 4 different regions are considered, Northeast, Midwest, South,
and West.15 For this matter, the variable, income share of auto insurance expenditure per
car, is used to make four different quartile based on each regions. So in this way, the regional
differences on insurance expenditure might be considered. For example, a householder who
spends 2% of their income on auto insurance and resides in the Northeast region belongs14CES contains detail questions on insurance expenditures by each categories such as vehicle insurance,
and other property insurances such as house and life insurance. The vehicle insurance expenditure is used
because consumers are more likely to own a car than other properties. So, using other type of insurance will
lead a significant loss of observation and the other type of insurance might more dependent on the income
rather than consumers risk averseness.15It is possible to consider the insurance premium difference for each states. Indeed, CES data from ICPSR
report the state where the householders reside but there are some problems of using the state variable. First,
20 % of sample lack this information. Second, the number of observation for small states are considerably
small. For example, CES contains less than 80 householders in Delaware and New Hampshire.
11

to 3rd quartile, but a householder who spend the same percentage and resides in the South
region belongs to the 4th quartile. In this way, the problem of regional insurance premium
difference is addressed.16
Another interaction term of warranty is used in order to see how a warranty as a sig-
nal affects the consumer’s choice based on the degree of information that consumers have.
When consumers are well aware of product quality(durability), the value of a signal will
be relatively low compared to the value of a signal for products that are less known to
consumers. With the assumption of decreasing marginal utility of information, the increase
in consumer utility from additional information for less known products will be higher than
the utility gains of the information for well known products. In other words, the addi-
tional information for well known products is relatively less valuable than the additional
information on less known products. Thus, the warranty variable is interacted with NO-
RATE and the interaction term is used to determine whether or not warranties provide
more valuable information for less known products. The interaction term might indicate
whether the warranty carries additional information about the product quality(durability).
If the warranty carries additional information on the quality of new products (or less known
products), then consumers will have a higher preference for longer warranties product for
new products or less known products and the coefficient of this interaction term will be pos-
itive and significant. When consumers do not consider a warranty as valuable information
(or signal of durability), then the coefficient of this variable will not be significant. There-
fore, the coefficient of this interaction term will indicate the pure signaling effect of warranty.
3.4 Estimation
The empirical model explained in the previous section is estimated using two different
methods, conditional logit and mixed logit. The benefit of conditional logit is that the
computational burden is lighter, but the cost of using it is that the conditional logit does16In appendix, CDF of this variable,income share of vehicle insurance expenditure per car, is reported and
a table of cutting points for each quartile based on different region is also reported
12
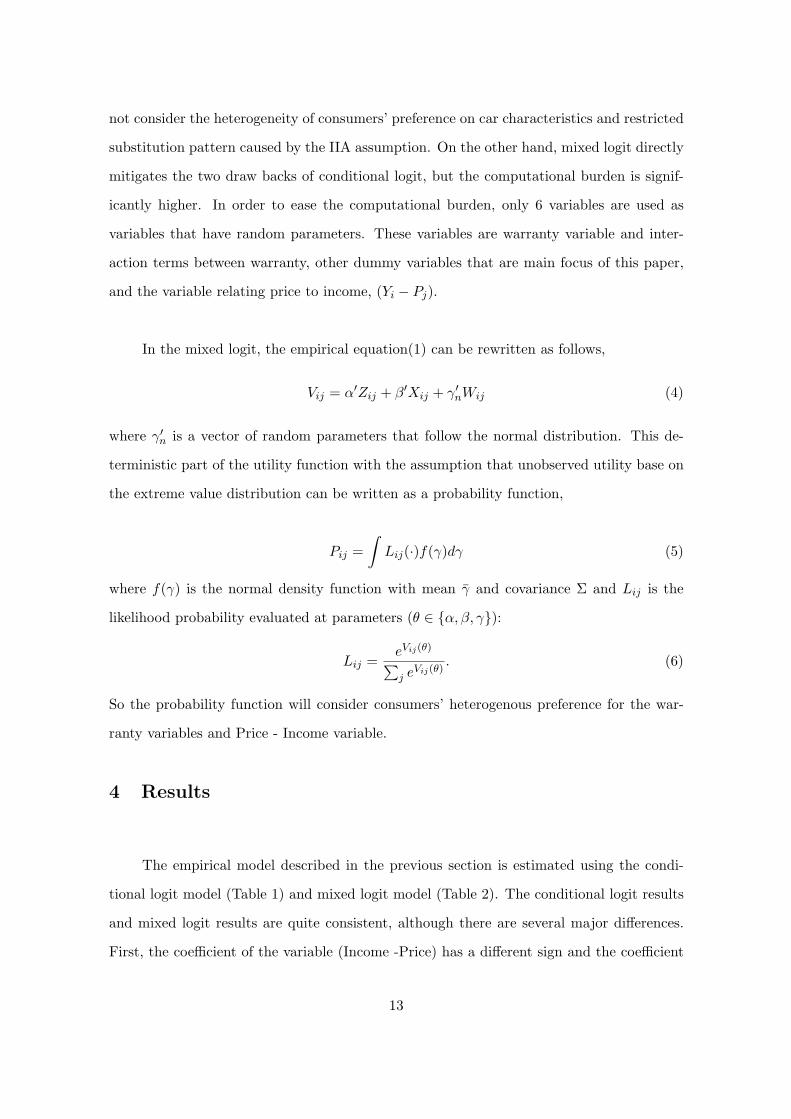
not consider the heterogeneity of consumers’ preference on car characteristics and restricted
substitution pattern caused by the IIA assumption. On the other hand, mixed logit directly
mitigates the two draw backs of conditional logit, but the computational burden is signif-
icantly higher. In order to ease the computational burden, only 6 variables are used as
variables that have random parameters. These variables are warranty variable and inter-
action terms between warranty, other dummy variables that are main focus of this paper,
and the variable relating price to income, (Yi − Pj).
In the mixed logit, the empirical equation(1) can be rewritten as follows,
Vij = α′Zij + β′Xij + γ′nWij (4)
where γ′n is a vector of random parameters that follow the normal distribution. This de-
terministic part of the utility function with the assumption that unobserved utility base on
the extreme value distribution can be written as a probability function,
Pij =∫
Lij(·)f(γ)dγ (5)
where f(γ) is the normal density function with mean γ and covariance Σ and Lij is the
likelihood probability evaluated at parameters (θ ∈ {α, β, γ}):
Lij =eVij(θ)
∑j eVij(θ)
. (6)
So the probability function will consider consumers’ heterogenous preference for the war-
ranty variables and Price - Income variable.
4 Results
The empirical model described in the previous section is estimated using the condi-
tional logit model (Table 1) and mixed logit model (Table 2). The conditional logit results
and mixed logit results are quite consistent, although there are several major differences.
First, the coefficient of the variable (Income -Price) has a different sign and the coefficient
13

Table 1: Estimation results : Conditional logit Result
Variable Coefficient (Std. Err.)
length 0.004∗ (0.002)
Displacement 0.128∗ (0.060)
Consumer Reports rating -0.002 (0.003)
No rating on Consumer Reports -1.130∗∗ (0.270)
Number of previously owned car for a certain brand 0.608∗ (0.245)
Consumer’s previous experience of a certain brand 6.280∗∗ (0.427)
Warranty * (budget) 0.065 (0.087)
Warranty * (small) 0.235∗∗ (0.070)
Warranty * (entry-medium) 0.154∗ (0.075)
Warranty * (medium) 0.143† (0.081)
Warranty * (large) 0.098 (0.091)
Warranty * (sporty) 0.181 (0.113)
Warranty * (luxury) 0.132 (0.115)
class (small) -0.552† (0.334)
class (entry-medium) -0.402 (0.354)
class (medium) -0.398 (0.360)
class (large) -0.979∗ (0.423)
class (sporty) -1.493∗∗ (0.508)
class (luxury) -1.953∗∗ (0.555)
Income -price -0.087 (0.063)
Warranty * Risk aversion (2nd quartile) 0.114 (0.083)
Warranty * Risk aversion (3th quartile) 0.023 (0.088)
Warranty * Risk aversion (4th quartile) -0.010 (0.096)
Warranty * NORATE 0.043 (0.038)
log likelihood -3065.2693†: significant at 10 %
∗: significant at 5 %
∗∗: significant at 1 %
14

Table 2: Estimation results : Mixed logit Result
Variable Coefficient (Std. Err.)
length 0.597∗∗ 0.213Displacement 0.149∗ 0.064No rating on Consumer Reports -1.297∗∗ 0.274Number of previously owned car for a certain brand 0.157 0.242Consumer’s previous experience of a certain brand 7.655∗∗ 0.547Consumer Reports rating -0.001 0.003Warranty * (budget) 0.005 0.092Warranty * (small) 0.168∗ 0.077Warranty * (entry-medium) 0.070 0.081Warranty * (medium) 0.067 0.087Warranty * (large) -0.099 0.098Warranty * (sporty) 0.073 1.188Warranty * (luxury) 0.151 0.123
class (small) -0.410 0.340class (entry-medium) -0.099 0.363class (medium) -0.006 0.379class (large) -0.338 0.449class (sporty) -0.892† 0.536class (luxury) -1.801∗∗ 0.606
Random Parameters
Income -price .024∗∗ .013Standard Deviation 4.964∗∗ 1.081Warranty * Risk aversion (2nd quartile) 0.210∗ 0.090Standard Deviation 0.069 0.103Warranty * Risk aversion (3th quartile) 0.126 0.096Standard Deviation 0.016 0.188Warranty * Risk aversion (4th quartile) 0.068 0.106Standard Deviation 0.068 0.130Warranty * NORATE 0.075† 0.039Standard Deviation 0.027 0.066
log likelihood -3065.2693†: significant at 10 %∗: significant at 5 %∗∗: significant at 1 %
15

is significant for the mixed logit results. The positive coefficient on the variable is more in-
tuitive than a negative coefficient, since income should have a positive effect on consumers’
utility and price should have negative a effect. This result indicates using mixed logit will
lead a more intuitive result since the mixed logit model consider consumer heterogeneity
with respect to disposable income. Moreover, the standard deviation of the coefficient is
also significant and shows that consumers heterogeneity with respect to disposable income
exists with statistical significance. So the mixed logit model will lead to better estimates
since it considers consumer heterogeneity.
The conditional logit results do not clearly show that more risk averse persons prefer
products with longer warranties. However, the mixed logit results show that there exist
different preferences for warranty length exist based on consumers risk aversion. Compared
to least risk averse group of consumers, the second quartile group prefer longer warranties.
Although the third quartile group and fourth quartile group do are not significantly differ-
ence. This result might be the problem of proxy variables used to classify consumers’ level
of risk aversion. The proxy might not be capturing the level of consumers’ risk averseion.
The conditional logit results indicate that the effects of a longer warranty is positive
but not significant. However, from the Mixed logit results, a longer warranty affects con-
sumers’ car choice when they have less information about the products. The coefficient of
the signaling variable, an interaction term between the variables NORATE and warranty,
is significant for the mixed logit model.
A consumer’s past experience with vehicles is an important factor when consumers
purchase new vehicles. The coefficients for most of the product characteristics have the
expected signs. All those results about the product characteristics are consistent with the
results of previous studies. The coefficient of the information variables have the expected
signs and three of them are significant. The results clearly show that controlling for the
information set is important and the consumer’s previous experience has a significant im-
pact on vehicle choice. However, the fact that the Consumer Report rating has a negative
16

effect on consumers’ utility is unexpected. This might be caused by the rating scheme
of the Consumer Report. The rating does not distinguish between types of cars and do
not consider car classes. So, luxurious cars tend to have higher scores than normal cars.
But the market share of luxurious cars make up a relatively small portion in the car market.
Warranty variables that are interacted with each car class show how a warranty will
affect the consumer’s choice on buying a new car. All of the warranty effects are positive
and three of them are significant. As expected, relatively competitive car classes (small,
entry-medium, medium and luxury) have strong positive coefficients in the conditional logit
model, although the significance weakened in the mixed logit model. The market share
of these car classes is about 85% among the car classes17. In the model, each car class is
interacted with warranty and car class dummies control for unobserved utility from charac-
teristics in each car class. So the coefficient on the interaction term between car class and
warranty might show how warranty affects consumers when they face products within the
same car class. The impact of warranty on consumers’ indirect utility is relatively signifi-
cant and positive. This result is also consistent with the variation in the market shares of
the firms which changed warranties in recent years. Firms which produce relatively small
cars and changed their warranties saw higher market share gains than firms that produce
mostly large cars and changed their warranties.
5 Conclusion and further research
In this paper, I tried to show how consumer utility is affected by a warranty as a signal
of product quality. The most important finding of this paper is that a longer warranty in-
creases consumers utility and consumers are more likely to buy cars with longer warranties.
As expected, I find that consumers’ preference for warranty is relatively more pronounced
in smaller car classes than in bigger car classes, and I also find weak evidence that different
preferences for warranties exist depending on the level of risk aversion.17Automotive News market data book 2002
17
Although this paper finds evidence that consumers view warranties as a signal of
product quality, there are several issues that should be addressed in further researched.
Two possible issues are finding a better measuring of risk aversion and evaluating welfare
gains from product warranties. Another interesting question might be how competition in
the warranty dimension increases the efficiency of the market based on the fact that many
firms have changed their warranty in recent years. In order to answer those questions, the
magnitude of the effect and elasticity with respect to length of warranty should be correctly
calculated. In addition, some counterfactual estimation might help answer these questions.
18
References
[1] Consumer Expenditure Survey. Bureau of Labor Statistics: ICPSR-Inter-university
Consortium for Political and Social Research, distributor, 1998–2002.
[2] car ratings. Consumer Report, 1998-2002.
[3] G. A. Akerlof. The market for ”lemons”: Quality uncertainty and the market mecha-
nism. The Quarterly Journal of Economics, 84(3):488–500, Aug 1970.
[4] S. Berry, J. Levinsohn, and A. Pakes. Automobile prices in market equilibrium. Econo-
metrica, 63(4):841, 890 1995.
[5] S. T. Berry. Estimating discrete-choice model of product differentiation. The RAND
Journal of Economics, 25(2):242–262, Summer 1994.
[6] D. Brownstone and K. Train. forecasting new product penetration with flexible sub-
stitution patterns. Journal of Econometrics, 89:109–129, Nov 1998.
[7] P. K. Goldberg. Product differentiation and oligopoly in international markets: the
case of the u.s. automobile industry. Econometrica, 63(4):891–951, Jul 1995.
[8] S. Grossman. Informational role of warrnaty and private disclosure of about product
quality. Journal of Law and Economics, 24(3):461–483, Dec 1981.
[9] G. Jin and P. Leslie. The effect of information on product quality: Evidence from
restaurant hygiene grade cards. The Quarterly Journal of Economics, 118(2):409–451,
May 2003.
[10] J. G. Riley. Silver signals: twenty five years of screening and signaling. Journal of
Economics Literature, 39:432–478, Jun 2001.
[11] M. Spence. Consumer misperception, product failure and product liability. Review of
Economic studies, 44(3):561–572, Oct 1977.
[12] M. Spence. Warranty as a signal of quality. The Canadian Journal of Economics,
22(1):50–61, Feb 1989.
19

[13] K. E. Train and C. Winston. Vehicle choice behavior and the declining market share
of u.s. automakers. International Economic Review, forthcoming.
[14] WarrantyDirect. Warranty Direct: Manufacturer Warranties.
http://www.warrantydirect.com/warrantydirect/info mfg warranty.asp, 2005.
APPENDIX
Table 3: Summary statistics
Variable Mean Std. Dev.
Vehicle Characteristics
LENGTH 185.775 13.406DISPLACEMENT 2.873 0.952PRICE 27036.034 14015.904WT 4.336 1.877classD1 0.065classD2 0.14classD3 0.103classD4 0.168classD5 0.15classD6 0.093classD7 0.28
Consumers’ Characteristics
INCOME 61287.537 52354.801AUTO INS perC 0.019 0.0581st Quartile Risk aversion 0.2112nd Quartile Risk aversion 0.3293rd Quartile Risk aversion 0.2574th Quartile Risk aversion 0.202
Variables for Information of Vehicle
rating 43.468 34.923 125511norate 0.364 0.481 125511
20

0.2
.4.6
.81
Nort
heast/M
idw
est/S
outh
/West
0 .01 .02 .03 .04 .05temp
Northeast Midwest
South West
Figure 1: CDF of income share of Auto Insurance expenditure per adult
Table 4: Percentile scores: Cutting points to make variable that indicates level of Con-sumers’ Risk Aversion based on the Region
REGION Auto 25 Auto 50 Auto 75
Northeast .0023 .0083 .02132Midwest .0020 .0069 .0168South .0018 .0076 .0189West .0022 .0072 .0173
21