Embed Size (px)
Citation preview

Walden University Walden University
ScholarWorks ScholarWorks
Walden Dissertations and Doctoral Studies Walden Dissertations and Doctoral Studies Collection
2021
Consumers Perspectives on Using Biometric Technology With Consumers Perspectives on Using Biometric Technology With
Mobile Banking Mobile Banking
Rodney Alston Clark Walden University
Follow this and additional works at: https://scholarworks.waldenu.edu/dissertations
Part of the Databases and Information Systems Commons, and the Finance and Financial
Management Commons
This Dissertation is brought to you for free and open access by the Walden Dissertations and Doctoral Studies Collection at ScholarWorks. It has been accepted for inclusion in Walden Dissertations and Doctoral Studies by an authorized administrator of ScholarWorks. For more information, please contact [email protected].

Walden University
College of Management and Technology
This is to certify that the doctoral dissertation by
Rodney Alston Clark
has been found to be complete and satisfactory in all respects,
and that any and all revisions required by
the review committee have been made.
Review Committee
Dr. Mohammad Sharifzadeh, Committee Chairperson, Management Faculty
Dr. Bharat Thakkar, Committee Member, Management Faculty
Dr. Anton Camarota, University Reviewer, Management Faculty
Chief Academic Officer and Provost
Sue Subocz, Ph.D.
Walden University
2021

Abstract
Consumers Perspectives on Using Biometric Technology With Mobile Banking
by
Rodney Alston Clark
MIM, University of Maryland University College, 2012
MBA, University of Maryland University College, 2010
BS, Coppin State University, 2004
Dissertation Submitted in Partial Fulfillment
of the Requirements for the Degree of
Doctor of Philosophy
Management
Walden University
February 2021

Abstract
The need for applying biometric technology in mobile banking is increasing due to
emerging security issues, and many banks’ chief executive officers have integrated
biometric solutions into their mobile application protocols to address these evolving
security risks. This quantitative study was performed to evaluate how the opinions and
beliefs of banking customers in the Mid-Atlantic region of the United States might
influence their adoption of mobile banking applications that included biometric
technology. The research question was designed to explore how performance expectancy
(PE), effort expectancy (EE), social influence (SI), facilitating conditions (FC), perceived
credibility (PC), and task-technology fit (TTF) affected customer adoption of biometric
technology with mobile banking. The conceptual framework extended the unified theory
of acceptance and use of technology by including PC and TTF. The responses to a web-
based questionnaire that was distributed to 228 mobile banking customers were analyzed
using SPSS AMOS (Version 23) to create structural equation models, a multiple linear
regression model, and an analysis of variance (ANOVA) model. The results showed that
PE, EE, TTF, and FC were the significant factors affecting customer acceptance of
biometric technology with mobile banking. SI and PC were nonsignificant factors and
had low positive correlations. The results of this study suggest that biometric technology
can mitigate the risks associated with security attacks by identifying the customer during
the bank transaction. The results also support positive social change by demonstrating
how biometric technology can secure banks from fraud, prevent crime, and improve
liveness detection.

Consumers Perspectives on Using Biometric Technology with Mobile Banking
by
Rodney Alston Clark
MIM, University of Maryland University College, 2012
MBA, University of Maryland University College, 2010
BS, Coppin State University, 2004
Dissertation Submitted in Partial Fulfillment
of the Requirements for the Degree of
Doctor of Philosophy
Management
Walden University
February 2021

Dedication
I devote this research to my mother, who has guided me through life with
inspirational words of wisdom and spirituality. Also, I would like to devote this paper to
my wife and daughter for their steadfast support. Last, I dedicated this work to the
African people living in the diaspora of the world, and may this study contribute to
emerging the world into a unified place.

Acknowledgments
My first intent is to recognize the supreme being of the universe, let the spirit
continue to flow in me. Second, I express thanks to my chairperson, Dr. Mohammad
Sharifzadeh, whose leadership guided me through the dissertation and assisted me in
accomplishing my dream of obtaining a doctoral degree. I extend gratitude to my
committee member Dr. Bharat Thakkar, for contributing divine insight and competence
that significantly impacted the quality of my study.
I also extend appreciated to my friends and immediate family, who encourage and
supported me throughout the doctoral process. To the Management Program Director, Dr.
Sandy Kolberg, I expressed appreciation for the great words of encouragement and
support; I am indebted! To the Institutional Review Board (IRB) for their dedication and
hard work. Also, I thank the University Research Reviewer (URR) staff for all their
support and special gratitude for Dr. Anton Camarota for his critique and thorough
evaluation. Finally, I thank Walden University College of Management and Technology
students, faculty, staff with a special appreciation for Walden University Library staff for
their insights, and professional work etiquette.
i
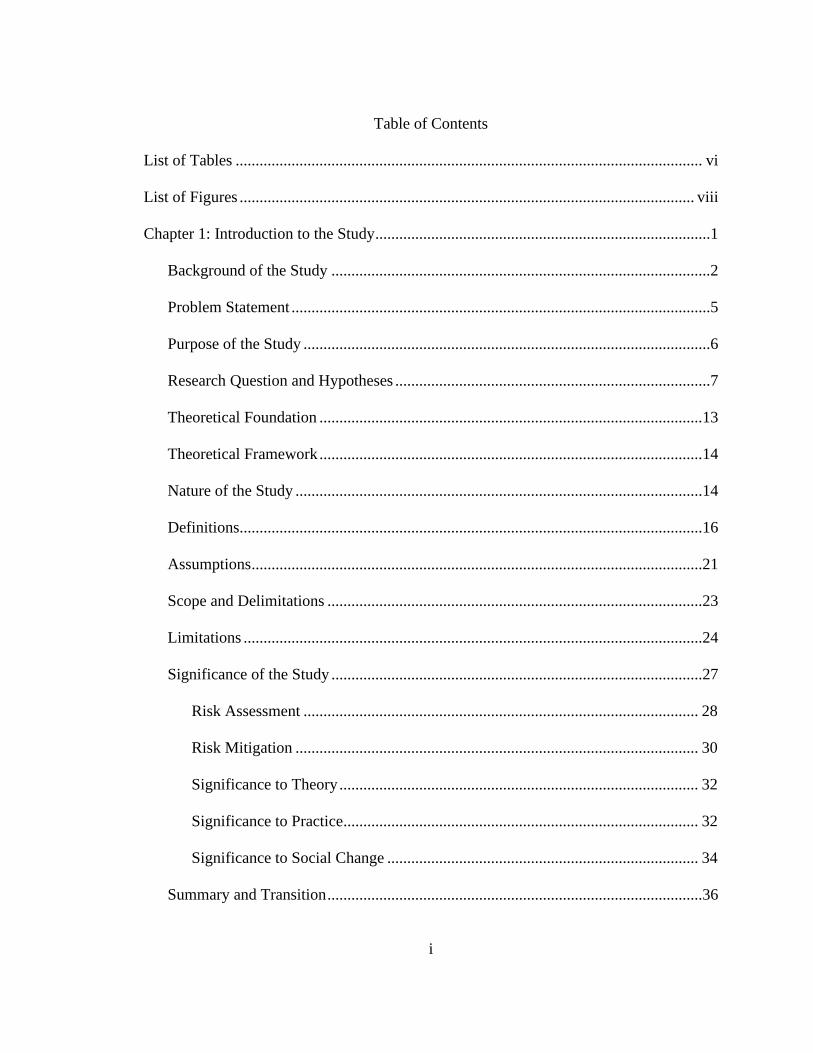
Table of Contents
List of Tables ..................................................................................................................... vi
List of Figures .................................................................................................................. viii
Chapter 1: Introduction to the Study ....................................................................................1
Background of the Study ...............................................................................................2
Problem Statement .........................................................................................................5
Purpose of the Study ......................................................................................................6
Research Question and Hypotheses ...............................................................................7
Theoretical Foundation ................................................................................................13
Theoretical Framework ................................................................................................14
Nature of the Study ......................................................................................................14
Definitions....................................................................................................................16
Assumptions .................................................................................................................21
Scope and Delimitations ..............................................................................................23
Limitations ...................................................................................................................24
Significance of the Study .............................................................................................27
Risk Assessment ................................................................................................... 28
Risk Mitigation ..................................................................................................... 30
Significance to Theory .......................................................................................... 32
Significance to Practice......................................................................................... 32
Significance to Social Change .............................................................................. 34
Summary and Transition ..............................................................................................36

ii
Chapter 2: Literature Review .............................................................................................38
Literature Search Strategy............................................................................................38
Review of Theoretical Approaches ..............................................................................40
Theoretical Framework ................................................................................................44
Literature Review.........................................................................................................47
UTAUT ................................................................................................................. 48
Extending the Unified Theory of Acceptance and Use of Technology ................ 50
Four Key Constructs of the UTAUT .................................................................... 55
Biometric Technology .......................................................................................... 59
Multi-Modal Authentication ................................................................................. 59
Online Banking Systems ....................................................................................... 61
Online Trust with Customers ................................................................................ 63
Biometric Technology Identification Methods ..................................................... 63
Mobile Banking Gaps ........................................................................................... 66
Summary and Conclusions ..........................................................................................68
Chapter 3: Research Method ..............................................................................................69
Research Design and Rationale ...................................................................................69
Methodology ................................................................................................................73
Population ............................................................................................................. 77
Sampling and Sampling Procedures ..................................................................... 78
Procedures for Recruitment, Participation, and Data Collection (Primary
Data) .......................................................................................................... 80

iii
Pilot Study ............................................................................................................. 81
Instrumentation and Operationalization of Constructs ......................................... 83
Data Analysis Plan .......................................................................................................88
Threats to Validity .......................................................................................................90
External Validity ................................................................................................... 90
Internal Validity .................................................................................................... 92
Construct Validity ................................................................................................. 92
Ethical Procedures ................................................................................................ 94
Summary ......................................................................................................................95
Chapter 4: Results ..............................................................................................................99
Pilot Study ....................................................................................................................99
Data Collection ..........................................................................................................103
Data Collection Process ...................................................................................... 104
Reliability of the Instrument ............................................................................... 105
Study Results .............................................................................................................108
Descriptive Statistics ........................................................................................... 109
Survey Returns .................................................................................................... 111
Comparison of Demographics Between Population and Sample ....................... 111
Gender Report ..................................................................................................... 112
Age Distribution Report ...................................................................................... 112
Marital Status Report .......................................................................................... 113
Educational Level ............................................................................................... 114

iv
Income Levels Statistics ..................................................................................... 114
Bank Statistics ..................................................................................................... 115
Test of Normality ................................................................................................ 116
Principal Factor Axis Factoring Test .................................................................. 119
Kaiser-Meyer-Olkin (KMO) Measure and Bartlett’s Test.................................. 121
Correlation Matrix .............................................................................................. 121
Goodness-of-Fit Test .......................................................................................... 122
Communalities of Variables ............................................................................... 123
Factor Analysis ................................................................................................... 123
Descriptive Statistics for the Independent and Dependent Variables ................. 124
SEM Fit and Modification .................................................................................. 125
Path Analysis ...................................................................................................... 127
Regression Analysis ............................................................................................ 130
ANOVA .............................................................................................................. 133
Data Analysis and Results .........................................................................................135
Research Question 1 and Hypotheses 1 - 6 ................................................................135
Summary ....................................................................................................................138
Chapter 5: Discussion, Conclusions, and Recommendations ..........................................140
Interpretation of Findings ..........................................................................................141
Limitations of the Study.............................................................................................146
Recommendations ......................................................................................................147
Implications................................................................................................................150
v
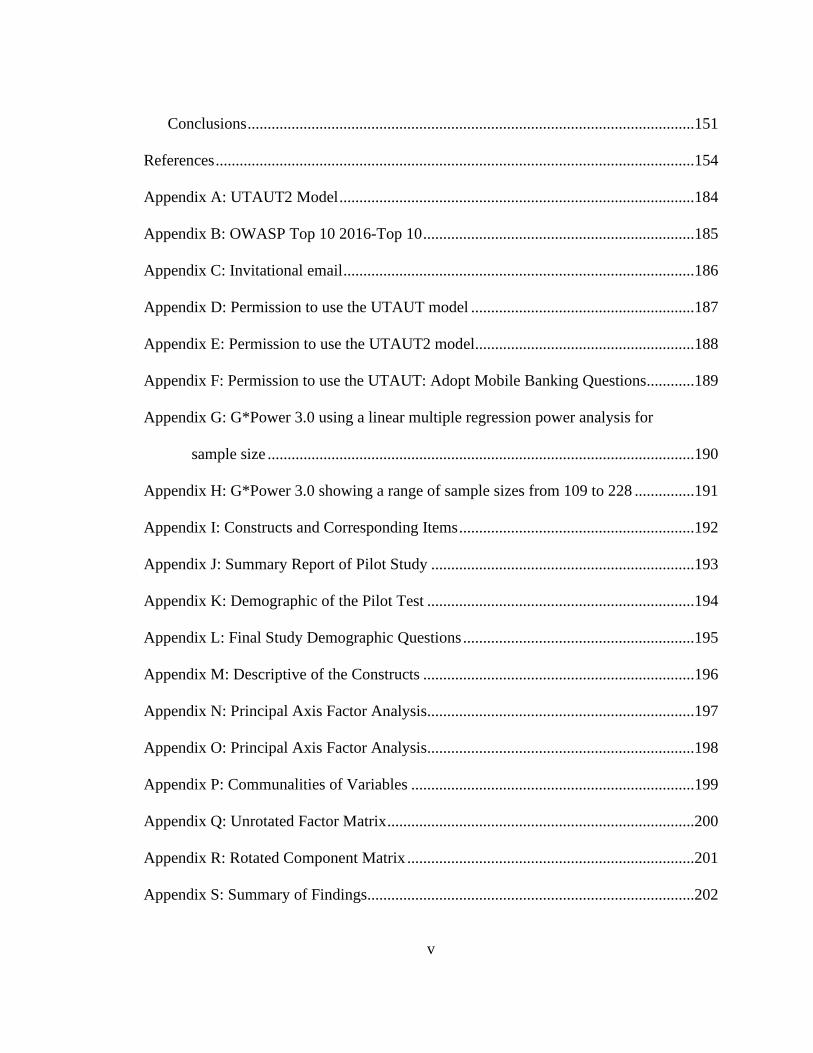
Conclusions ................................................................................................................151
References ........................................................................................................................154
Appendix A: UTAUT2 Model .........................................................................................184
Appendix B: OWASP Top 10 2016-Top 10 ....................................................................185
Appendix C: Invitational email ........................................................................................186
Appendix D: Permission to use the UTAUT model ........................................................187
Appendix E: Permission to use the UTAUT2 model.......................................................188
Appendix F: Permission to use the UTAUT: Adopt Mobile Banking Questions............189
Appendix G: G*Power 3.0 using a linear multiple regression power analysis for
sample size ...........................................................................................................190
Appendix H: G*Power 3.0 showing a range of sample sizes from 109 to 228 ...............191
Appendix I: Constructs and Corresponding Items ...........................................................192
Appendix J: Summary Report of Pilot Study ..................................................................193
Appendix K: Demographic of the Pilot Test ...................................................................194
Appendix L: Final Study Demographic Questions ..........................................................195
Appendix M: Descriptive of the Constructs ....................................................................196
Appendix N: Principal Axis Factor Analysis...................................................................197
Appendix O: Principal Axis Factor Analysis...................................................................198
Appendix P: Communalities of Variables .......................................................................199
Appendix Q: Unrotated Factor Matrix .............................................................................200
Appendix R: Rotated Component Matrix ........................................................................201
Appendix S: Summary of Findings..................................................................................202

vi
List of Tables
Table 1. Independent and Dependent Constructs ............................................................... 7
Table 2. Constructs and Their Roles ................................................................................... 8
Table 3. Hypotheses, their Directionality, and the Construct they Represent .................. 11
Table 4. Reliability Statistics .......................................................................................... 106
Table 5. Descriptive Statistics of the Constructs ............................................................ 107
Table 6. Demographics ................................................................................................... 111
Table 7. Comparison of Demographics Between Population and Sample ..................... 112
Table 8. Gender Statistics ............................................................................................... 112
Table 9. Age Distribution ............................................................................................... 113
Table 10. Martial Status .................................................................................................. 113
Table 11. Educational Level ........................................................................................... 114
Table 12. Income Level .................................................................................................. 115
Table 13. Bank Statistics................................................................................................. 115
Table 14. Skewness and Kurtosis Statistics .................................................................... 116
Table 15. Tests of Normality .......................................................................................... 117
Table 16. Kaiser-Meyer-Olkin (KMO) Measure and Bartlett’s Test ............................. 121
Table 17. Correlation Matrix .......................................................................................... 122
Table 18. Goodness-of-fit Test ....................................................................................... 122
Table 19. Independent and Dependent Descriptive Statistics (N=228) .......................... 125
Table 20. SEM Fit Statistics ........................................................................................... 126
Table 21. Standardized Regression Weights from SEM Path Analysis ......................... 130

vii
Table 22. Regression Weights from SEM Path Analysis ............................................... 131
Table 23. Multiple Regression Analysis ......................................................................... 132
Table 24. Model Summary ............................................................................................. 133
Table 25. ANOVA and Eta Analysis .............................................................................. 134
Table 26. Hypotheses Results ......................................................................................... 142

viii
List of Figures
Figure 1. Proposed Theoretical Model.............................................................................. 13
Figure 2. Unified Theory of Acceptance and Use of Technology (UTAUT) ................... 49
Figure 3. Extending the Unified Theory of Acceptance and Use of Technology
(UTAUT2) ................................................................................................................ 52
Figure 4. Research Model ................................................................................................. 87
Figure 5. Histogram of Regression Standardized Residual ............................................ 117
Figure 6. Normal Probability Plot ................................................................................... 118
Figure 7. SEM Model Fit based on Composite Variables .............................................. 127
Figure 8. Conceptual Model with Standardized Regression Estimates .......................... 129

1
Chapter 1: Introduction to the Study
Mobile banking is a part of social interaction, and customers use mobile devices
for electronic bank transactions with many different mobile apps. Because customers are
using banks’ apps more often, biometric technology has become a new mobile banking
method. Because of the increase of bank security issues and identity fraud, customers
welcome the use of their physiological traits with mobile apps. Banks use different
security features and solutions for their security protocols to help customers against
phishing attacks, identity theft, and bank fraud, and biometric technology is considered
the most secure (Svilar & Zupančič, 2016). Biometric technology will provide multiple
layers of security for customers during mobile bank transactions. Also, biometric
technology is intended to ensure the correct person is trying to access their account, so no
ambiguous tries during the bank transactions (Rui & Yan, 2019).
More than 87% of customers use online or mobile banking, and customers feel
their bank accounts are vulnerable to cybercriminals (Sharma, 2017). Therefore,
customers are demanding solutions to feel safer during their mobile bank transactions.
Biometric technology gives customers strengthened security during bank transactions
with mobile devices because of the multilayer security versus the traditional
authentication method. Mobile device safety is essential because data on mobile devices
get compromised, so more protection is necessary because of the rise in customers’ usage
(Chung-Hua et al., 2017). In 2014, over 40% of U.S. customers used mobile banking, and
a recent report by Juniper Research showed that mobile banking customers reached one
billion in 2016 (Aggarwal & Varghese, 2014; Smith, 2016). Customers use their mobile

2
devices to store information like text messages, contacts, passwords, pictures, bank
information, and other personal data types they do not want to be compromised by
cybercriminals or other unauthorized people. The sensitivity and amount of data that get
stored on mobile devices create concerns for efficient and flexible management of mobile
devices (Crawford & Renaud, 2014).
To help with potential threats on smartphones, graphic passwords, personal
identification numbers, and passwords are used for security measures. Because of
customers’ unsafe practices or how easily the traditional security methods can crack, the
need to examine other solutions is necessary. Using biometric technology will help
recognize the unique individual during the bank transaction, and the data remain the same
over the entire lifetime of the person's use. The current problem is the customers’ lack of
biometric technology use while using a mobile device. Using secure bank transactions is
critical for the bank's online mobile authentication to verify customers' identity while
using mobile devices. Community bank decision-makers highlight strengthening mobile
banking applications with biometric technology because of customers security-related
concerns with using their biological characteristics (MengHui et al., 2015).
Background of the Study
Mobile banking has changed the way customers check their bank accounts and
has moved from a face-to-face platform to a mobile market. Mobile banking apps offer
the bank customers more convenience and services without face-to-face with the physical
bank. During the 1980s, internet banking joined the World Wide Web to set up online
banking for customers to access their accounts on personal computers. Internet banking

3
leads to bank customers making bank transactions anytime and anywhere (Milić et al.,
2017). However, since the advent of internet banking, customers have changed, and
mobile banking now dominates internet banking (Milić et al., 2017). The bank apps used
on mobile devices allow customers to access their bank accounts and make transactions
remotely (Baabdullah et al., 2019). The online presence for mobile banking has risen
throughout the years because of customers' demands to have access anytime. Also, the
internet has change how customers look at banking services and mobile banking
technology has become the primary choice for customers (Kiheung et al., 2016).
Internet technology has changed the way customers access their personal
information because of their bank's convenience services (Al-Sharhan et al., 2019).
However, today's community banks are lagging because of the lack of information
technology and the effort they are putting into the simplicity of customers’ day-to-day
business of new technology (Milić et al., 2017). Because of customers' increasing use of
online services, security-related issues have risen, and customers’ personal and private
data being accessible by intruders are community banks’ main issues (Kiheung et al.,
2016). For mobile banking apps to work, customers must trust in the product before they
start using it; therefore, security features need to be in place to help secure customer's
data (Kiheung et al., 2016).
The banking industry reported over 35 million online banking frauds during
2010–2011, and hackers continue to find loopholes in modern banking application
(Tassabehji & Kamala, 2012). In Addition, security issues were reported by customers
during 2005–2014 because they were using new technology (Tarhini et al., 2016).

4
Therefore, avoiding cyberattacks is a primary concern for community banks (Kiheung et
al., 2016). The System Usability Scale (SUS) is used to test biometric technology for e-
banking and collect information on customers' views of the new service (Tassabehji &
Kamala, 2012). Customers navigate e-banking services through internet-driven devices,
such as laptops, desktops, automated teller machines (ATM), or smart devices (Milić et
al., 2017). The services offered through a mobile application give customers convenient
access to financial information about the banks' services, and customers have the choice
to perform financial transactions (Milić et al., 2017). To expand e-commerce and e-
banking is essential for the services through a bank's mobile application, and banks have
inferred that online banking provides many benefits which make customers banks
transaction safer and more convenient.
A study conducted at a Nevada Credit Union with over 80,000 members showed
that 70% of customers use remote channels (mobile and online), and about 30,000
switched to mobile devices only (Gamble, 2018). The evolution of e-commerce in the
United States has risen since the mid-1990s and has cause internet banking to facilitate
customers' daily banking needs (Susanto et al., 2013). Prior research has supported the
importance of trust, security and privacy, customer satisfaction, and loyalty for Internet
banking implementation, including more security layers (Susanto et al., 2013). Since
customers use mobile devices to access their information, data needs to be secure so
potential intruders may not gain the customer's data. In the online mobile application, the
primary way to prevent information from being lost is to have an individual confirm their
identity. The banking industry uses modern technology to push biometric technology to

5
improve login authentication for customers when using mobile banking apps (Gamble,
2018).
Problem Statement
Mobile users in the United States reached 95 million, and with the adoption of
mobile banking, mobile users rose to 40% in 2013 and reached over 1 billion globally in
2017 (Aggarwal & Varghese, 2014; Smith, 2016). In the United States, despite
customers’ lack of acceptance of mobile banking security, over 63% of smartphone users
prefer mobile banking over any other business channel (Aggarwal & Varghese, 2014).
The Federal Trade Commission (2019) reported more security and privacy issues have
arisen because of mobile technology increase. Researchers found that using biometric
technology will enhance the banks' security protocols while addressing the common
issues by customers (Malaquias & Hwang, 2019). In this study, the general problem is
that community banks have no general idea about customers' behavioral intentions (BI)
with their acceptance and use of biometric technology with mobile banking (Shareef et
al., 2018). Specifically, biometric technology is new to research, and bank customers are
not aware of the benefit's biometric offers.
Due to reports of persistent login attempts and security violations, customers have
found biometric technology with mobile banking more secure than traditional login tries
(Cook, 2017; Hess & Van Der Stad, 2016; Vanian, 2015; Zalud, 2016). The specific
problem is customers’ lack of adoption of biometric technology, and bank managers do
not understand the reasons that influence mobile banking adoption in the Mid-Atlantic
region of the United States. By the year 2020, mobile banking users will continue to grow

6
to 1.4 trillion because of the millennial demographic buying power (Evon & Leby Lau,
2016).
Purpose of the Study
The purpose of this quantitative study was to develop a conceptual model with a
conceivably more eminent explanatory power about mobile banking technology adoption.
A conceptual framework was developed by extending the unified theory of acceptance
and use of technology (UTAUT). The extension of the UTAUT2 incorporating two more
factors: perceived credibility (PC) and task-technology fit (TTF). A quantitative approach
based on a web-based questionnaire survey was used to collect data from 228 mobile
banking customers in the Mid-Atlantic region. The data were analyzed using structural
equation modeling (SEM) based on the analysis of a moment structures (AMOS, Version
23). Understanding customers' adoption of biometric technology can guide decision-
makers of banks to be innovative with security protocols. The participants included
college students and bank users from three independent banks. Participants in the study
were voluntary. The respondents who chose to participate completed a web-based survey
questionnaire providing their opinions and beliefs with the use and acceptance of
biometric technology with mobile banking.
In this quantitative study, the independent variables included (a) performance
expectancy (PE), (b) effort expectancy (EE), (c) social influence (SI), (d) perceived
credibility (PC), (e) task-technology fit (TTF), and (f) facilitating conditions (FC). I used
LimeSurvey (https://www.limesurvey.org/) to host the web-based survey, and Cint
(https://www.cint.com/) was used as a host platform to recruit participants. The web-

7
based survey was used to collect data from 228 bank customers in the Mid-Atlantic
region of the United States.
Research Question and Hypotheses
The question guiding this research was this: To what extent do performance
expectancy, effort expectancy, social influence, perceived credibility, task-technology fit,
and facilitating conditions affect the behavioral intentions of customers to adopt
biometric technology with mobile banking?
Table 1 defined the study's independent and dependent constructs, and Table 2
shows the constructs and their roles by describing the independent, dependent, and
moderate relationships of each construct.
Table 1
Independent and Dependent Constructs
Constructs Items Measures
Behavioral Intention BI BI is the behavioral intention to use or reject a system.
Performance Expectancy PE PE the belief of customers using a system will determine more security.
Effort Expectancy EE EE is how the effort of ease of a system.
Social Influence SI SI is the opinion of customers and how others feel the system works
Perceived Credibility PC PC is how easy the system works.
Task-Technology Fit TTF TTF is the degree of whereby the technology will fit the customer’s needs.
Facilitating Conditions FC FC is how customers feel the organization will support the system
Actual Usage AU AU is the actual use of the product or services by the customer’s

8
Table 2
Constructs and Their Roles
Constructs name Independent variables Moderator variables Dependent variables
Behavioral Intention X
Performance Expectancy X
Effort Expectancy X
Social Influence X
Perceived Credibility X
Task-Technology Fit X
Facilitating Conditions X
Actual Usage X
Hypothesis 1: Performance expectancy (PE) is defined as extracting utilities for
timesaving, convenience, money, less effort, and faster service during banking activities
(Venkatesh et al., 2003). PE is where an individual thinks the system will help them
perform the work of their jobs better (Oye et al., 2014). Thus, the following hypothesis is
postulate:
H10: Performance expectancy will not affect customers’ behavioral intention to
use biometric technology with mobile banking.
H11: Performance expectancy will affect customers’ behavioral intention to use
biometric technology with mobile banking.
The independent variable is PE, and the dependent variable is the BI. Factor analysis and
multiple regression analysis was used to test the hypothesis.
9
Hypothesis 2: Effort expectancy (EE) is related to how comfortably an individual
believes in the systems and how easily they can use the system (Oye et al., 2014). Thus,
the following hypothesis is postulate:
H20: Effort expectancy will not affect customers’ behavioral intention to use
biometric technology with mobile banking.
H21: Effort expectancy will affect customers’ behavioral intention to use
biometric technology with mobile banking.
The independent variable is EE, and the dependent variable is the BI. Factor analysis and
multiple regression analysis was used to test the hypothesis.
Hypothesis 3: Social influence (SI) is the person's opinion of whether they should
perform the behavior in question (Tarhini et al., 2016). Thus, the following hypothesis is
postulate:
H30: Social influence will not influence customers’ behavioral intention to use
biometric technology with mobile banking.
H31: Social influence will influence customers’ behavioral intention to use
biometric technology with mobile banking.
The independent variable is SI, and the dependent variable is the BI. Factor analysis and
multiple regression analysis was used to test the hypothesis.
Hypothesis 4: Research by Tarhini et al. (2016) argued that integrating perceived
credibility (PC)C into UTAUT will better predict customers’ BI toward using mobile
banking. Thus, the following hypothesis is postulate:
10
H40: Perceived credibility will not affect customers' behavioral intention to use
biometric technology with mobile banking.
H41: Perceived credibility will affect customers' behavioral intention to use
biometric technology with mobile banking.
The independent variable is PC, and the dependent variable is the BI. Factor analysis and
multiple regression analysis was used to test the hypothesis.
Hypothesis 5: The theory is by applying a proper task-technology fit (TTF); this
will increase customers' behaviors to use the technology (Tarhini et al., 2016). Thus, the
following hypothesis is postulate:
H50: Task-technology fit will not influence customers’ behavioral intention to use
biometric technology with mobile banking.
H51: Task-technology fit will influence customers’ behavioral intention to use
biometric technology with mobile banking.
The independent variable is TTF, and the dependent variable is the BI. Factor analysis
and multiple regression analysis was used to test the hypothesis.
Hypothesis 6: The facilitating conditions (FC) are defined as where customers
feel the organization and security will support the system (Venkatesh et al. (2003). Thus,
the following hypothesis is postulate:
H60: Facilitating conditions will not influence the actual usage of biometric
technology with mobile banking.
H61: Facilitating conditions will influence the actual usage of biometric
technology with mobile banking.

11
The independent variable is FC and BI, and the dependent variable is the actual usage.
Factor analysis and multiple regression analysis was used to test the hypothesis.
Table 3 describes the hypothesis constructs, directionality and the constructs they
represent in the study.
Table 3
Hypotheses, their Directionality, and the Construct they Represent
Hypothesis Construct #1 Construct #2 Directional
H11 Performance Expectancy Behavioral Intention (+)
H21 Effort Expectancy Behavioral Intention (+)
H31 Social Influence Behavioral Intention (+)
H41 Perceived Credibility Behavioral Intention (+)
H51 Task-Technology Fit Behavioral Intention (+)
H61 Facilitating Conditions Actual Usage (+)
In this study's connection, it is expected that if customers find mobile banking
with biometric technology easy to use, they will more likely use and adopt it. In contrast,
if the customers consider mobile banking with biometric technology challenging to use,
they are less likely to embrace it. PE has been used to understand customers' BI of
adopting mobile banking (Lee et al., 2019; Tarhini et al., 2016). EE positively affects PE
when customers feel mobile banking is easy to use, and not much effort is required (Rahi
et al., 2018). SI affects customers' intention to adopt mobile banking services. The
individual who believes a new product or service is vital to others will be more inclined
to use new technology (Rahi et al., 2018).

12
Hypotheses 1 through 6 were tested by running the following multiple regression
model: BI = β0 + β1PE + β2EE + β3SI + β4PC + β5TTF + β6FC + €. See Table 1 for
independent and dependent constructs and see Table 2 for the constructs’ roles. No single
case has proclaimed the relationship between BI and online mobile banking adoption in
the Mid-Atlantic region of the United States. According to Tarhini et al. (2016), there
was no critical relationships between PE, SI, FC, TTF and PC that was shown in previous
investigations (Tarhini et al., 2016). Previous literature identified a significant difference
in the moderating effect of experience in using mobile apps between FC and intentions to
use (Palau-Saumell et al., 2019). Other researchers also examined the moderating effects
of gender and age using the UTAUT model, and they did not find any significant results
among mobile banking customers (Palau-Saumell et al., 2019). The study filled the gap
by extending the UTAUT by using PC and TTF. Also, the specific variables like age,
gender, and experience, which are part of the original UTAUT, had two theoretical
constructs (PC and TTF) to moderate various UTAUT relationships. Figure 1 shows a
research model for the described constructs.

13
Figure 1
Proposed Theoretical Model
Note. From “Extending the UTAUT model to understand the customers’ acceptance and
use of Internet banking in Lebanon: A structural equation modeling approach,” by A.
Tarhini, M. El-Masri, M. Ali, and A. Serrano, 2016, 29(4), 834. Copyright 2016 by
Tarhini, El-Masri, Ali, Serrano. Reprinted with permission (see Appendix E).
Theoretical Foundation
The theoretical base for this study was Venkatesh et al.’s (2003) UTAUT. This
theory is used to determine user acceptance and use behavior (Onywoki & Opiyo, 2016).
Tarhini et al. (2016) used the UTAUT model and found it to be a valuable and valid
research tool for predicting the adoption behavior and BI with an emphasis on PE, EE,
SI, and FC. A theoretical framework was used by extending the UTAUT by incorporating
two more factors; the PC and TTF (UTAUT2) model (Tarhini et al., 2016). The adoption

14
of biometric technology by customers' when using mobile banking will help with security
and risk associated with their mobile application transactions. By extending the UTAUT
to incorporate PC and TTF, a more comprehensive theoretical perspective of user
technology acceptance was provided (Tarhini et al., 2016).
Theoretical Framework
A theoretical framework was used by extending the UTAUT with PC and TTF
model the UTAUT2 (Tarhini et al., 2016). The adoption of biometric technology when
using banking through mobile devices by customers will strengthen security and risk
associated with their online transaction and how technology will fit the customer's TTF.
By extending the UTAUT to incorporate PC and TTF, a more comprehensive theoretical
perspective of user technology acceptance was provided (Tarhini et al., 2016). Extending
the UTAUT improves mobile devices' safety by exploring the time to authenticate mobile
devices by narrowing down the application's sensitivity level (Alotaibi et al., 2015).
Security is considered a priority for many mobile banking customers. Previous research
showed 31% of customers would buy added protections for security features, 63% would
switch accounts for greater security, and 71% would change accounts to banks that
provide more protection to their accounts (He et al., 2015).
Nature of the Study
The nature of this study was a quantitative method using a survey research design.
In quantitative research, survey results are quantifiable to a known degree of accuracy
because of the representation (Rea & Parker, 2014). In this study, the survey was used to
collect quantitative information from mobile users in the Mid-Atlantic region of the

15
United States, where the data were analyzed using SEM, which is a tool for specific
confirmatory factor analysis models, regression models, and sophisticated path models
(Ramkissoon et al., 2013). SEM has been used by many scholars to describe the between-
person structure of human actions (Hunter, 2018). The specific population was from three
colleges and three community banks in the Mid-Atlantic region. Community banks are
creating new strategies for current and future customers, and because of hackers’ abilities
to compromise traditional systems and improve their approach to breakthrough new
security models.
In this study, I looked at customers who use smart devices and examined whether
the FC and BI affect biometric technology's actual use (AU) with mobile banking apps.
This study examined PE, EE, and SI behavior intentions with biometric technology on
mobile devices during mobile banking transactions. I also examined PC and TTF
customer's BI with biometric technology on mobile devices during mobile banking
transactions. A quantitative approach was used based on the web-based questionnaire
survey polls. The data were analyzed using SEM based on Statistical Package for the
Social Sciences (SPSS) AMOS from local colleges and independent community banks in
the Mid-Atlantic region. By using surveys and sample surveys, this method will lead to a
known level of accuracy (Rea and Parker, 2014). The general population was three
independent banks and three colleges in the Mid-Atlantic region. The bank customers
used mobile banking apps with biometric technology as an authentication method.

16
Definitions
The terms below are descriptive to the study, and their operational definitions are
as follows:
Biometric authentication: A security system method that authenticates the traits of
the human body for confirming the actual person (Vanian, 2015).
Biometrics technology: Method to confirm the identity of a person by verifying
the individual’s physical attributes. Biometric features of the individual provide bank
systems a positive declaration of the identity of the unique person (Zalud, 2016).
Continuous authentication: Designed to have customers authenticate themselves
after the initial login and throughout the login for added security (Kroeze & Malan,
2016).
Commercial banks: Banks that offer full-service with a wide range of services for
customers and businesses (McFarland, 2013).
Community banks: Banks that are local in the community and focus on local
business and families and have less than $10 billion in assets according to the Federal
Reserve Board (Gehrke, 2019).
Cybersecurity: The goal is to protect electronic information systems and networks
from being attacked by threats and vulnerabilities (Sosin, 2018).
Direct attacks: Method that gets tried at the sensor level, and it deals with
synthetic biometric samples typical to mobile phones like the iris, face images or voice to
fraudulently access a system (Das et al., 2016).

17
E-banking: Where individuals use a transaction with their bank account, and the
technology does not use internet access (Milić et al., 2017). E-banking is an emerging
subject in banking because of the rapid advancement of technology. E-banking is
timesaving, customer-friendly, and it reduces the cost for banks (Malarvizhi & Geetha,
2017).
E-commerce: Enabled services powered through websites that used interactive
product displays to process online sales transactions and information exchange (Lim &
Ayyagari, 2018).
False acceptance rate (FAR): This ascertains how often an intruder can
successfully bypass biometric authentication. The lower the FAR, the more secure the
system is (i.e., a FAR of 1% declares the chance of fooling the system is 1:100; Gautam
& Dawadi, 2017).
Equal error rate (EER): FAR and FRR, also known as the crossover error rate
(CER) have a converse relationship, but they sometimes do not show linear on a graph.
EER is where the FAR and FRR would be equals, and the best technologies have the
lowest EER rate (Gautam & Dawadi, 2017).
False rejection rate (FRR): This refers to how often a user will not get verified
successfully. A high rate renders into more user retries, affecting the usability of the
system (Gautam & Dawadi, 2017).
Hackers: The terms “hacker” or “hacking” is used to describe someone or activity
with either good or bad intentions, and the universal term is almost with a negative
connotation (Grimes, 2017).
18
Identity theft: Deliberate use of someone else identity to gain some financial gain
or other benefits. The White House reported that identity theft is the fastest growing
crime in America, which has caused losses of $12.7 million to $16 billion of U.S. dollars
(Loker, 2018).
Indirect attacks: Method that gets carried out at the digital level where data flows
get intercepted, which attacks the feature extractor or the weak points in the
communication access (Das et al., 2016).
Information assurance: Measures that protect and defend data and information
systems by ensuring their availability, integrity, authentication, confidentiality, and
nonrepudiation (Sosin, 2018).
Information protection: The Consumer Privacy Bill of Rights adopted by the
Obama Administration in 2012, protects information privacy as the individual control
principle, where customers control what personal information is collected (Baek et al.,
2014).
Information security: Subdomain of information assurance and focuses on the
CIA triad: confidentiality, integrity, and availability (Sosin, 2018).
Information systems: Describes the organization of people and procedures for
collecting, processing, generating, storing, transferring, displaying, information
distribution (Milić et al., 2017), used for collection, management, data analysis, and
distribution of the information needed for effective decision-making within the
organization (Uri, 2014).

19
Information technology: A discipline that focuses on systems management,
computer applications, and end-user services (Bagadia & Bansal, 2016).
Internet banking: Banking service where customers can access their account(s)
and performs financial transactions from anywhere with an internet-connected computer
and from any other device which gets connected to the internet (Milić et al., 2017).
Liveness detection: Used by artificial intelligence (AI) computer systems to detect
the human physical presence and not an inanimate spook artifact (IEEE, 2020).
Mobile applications. Called apps for short, they are software programs developed
for mobile devices, specifically smartphones, but used on other devices like tablets,
smartwatch, and laptops (Flair, 2019).
Mobile banking: The International Data Corporation reported that more
smartphones got sold in 2012 than desktop and laptop computers combined (Crawford &
Renaud, 2014). Mobile banking is an electronic transaction that enables customers to
perform financial transactions and other services through mobile platforms (Sreejesh et
al., 2016).
Mobile users: Smartphone or tablet users. These include users of internet services
like web browsing, games, and other various communication services such as instant
message and telephone (Hong, 2019).
New technology: Technology that gets described as any productive techniques
that will offer significant improvement over the previously proved technology for a given
measured by either increased output or savings in costs (Scott & Marshall, 2015).

20
Personal information: Information related to customer’s physical identities, such
as social security numbers, physical address, health records, and other real-world
identities (Baek et al., 2014).
Phishing attacks: Cybercriminals known as phishers who use social engineering
techniques to follow electronic communications from a trustworthy source and steal
credentials or install malicious software (Jensen et al., 2017).
Relative Operating Characteristic Curve: A characteristic graph of a system
where the x-axis represents the threshold of the system and y-axis represents FAR and
FRR values (Gautam & Dawadi, 2017).
Risks: Risks can be anything that has a measure of worth, be it monetary, time, or
opportunity cost (Jordan, 2016). In connection to biometrics, risks get based on trust and
risk probabilities of each transaction and measured by a probability during each
transaction (Waggett, 2016).
Threats: Used to describe a person, people, event, weakness, or the possibility of
attack, and it can describe viruses and malware and behaviors (Shostack, 2014).
Transparent authentication: Method used to remove barriers caused by security
tasks, and this authenticates over security measures in the background so the customers
can achieve their intended work (Crawford & Renaud, 2014).
Web-based applications (web app): Any program that is accessed over a network
connection using a website as the interface or front end (Fortunato & Bernardino, 2018).

21
Assumptions
Assumptions are defined as unexamined beliefs, judgments, and expectations,
which can impact the self-knowledge to help active learning (Briscoe, 2017). Researchers
use assumptions to join scientific data, and the rule is to understand that assuming can
have some benefits. Still, quality, explication, and non-existence are the issue (Armstrong
& Kepler, 2018). The assumptions govern the overall research process. Therefore, I
conducted this research under the following assumptions:
• Participants answered the questions honestly. If customers are unwilling to
reveal specific information, the surveys may fail to characterize population
preferences (Funk, 2016) accurately. However, in previous research, survey
respondents included internalized norms, and the survey behavior reported
prominence and salience into consonance (Brenner & DeLamater, 2016).
• The participants are mobile bank customers and are representative of the
general population of the Mid-Atlantic region of the United States
• The participants have mobile devices and have biometric technology
implemented with their bank apps. Multilayered protocols are tools uses by
banks to help relived customer's assumptions, and the multilayered approach
reduces attacks (Ivaturi & Janczewski, 2013).
• Community banks will have advanced security protocols, such as biometric
technology, that work with a mobile bank application. Previous studies
showed that enterprise systems had witnessed breaches and malicious

22
intrusions into network systems, so improving information access has created
new challenges against emergent security risks (Yazdanmehr & Wang, 2016).
• Customers who use mobile bank apps will have fewer security risks
associated with biometric technology. D'Arcy et al. (2014) explained how
assumptions are the evidence that backs up the information system. No
support for a theory-driven investigation to help with the effects of
organization security requirements.
• Customers and bank managers understand risks (e.g., identity theft, data loss,
and other security risks) with mobile banking. Shrivastava (2016) explored
how managers and leaders need to understand the hazard during information
systems that enabled the organizations' processes and business functions.
Shrivastava explained how assumptions are where managers and leaders need
to understand their duties and know they are held responsible for handling
information security risks.
• All mobile bank customers have some biometric recognition and or some
unique bodily characteristics. Assuming all customers have biometric
identification assumes that all the mobile banking customers are similar, and
every individual will have a clear audible voice, fingerprints, iris, and a
recognizable face.
• All participation responses from the web-based survey were considered.
• The web-based survey was not biased, and the participants answered in a
manner that was purposely intended.

23
• The web-based survey was explicitly limited to mobile bank customers that
used biometric technology.
Scope and Delimitations
The scope of this research involves community banks and bank customers from
the U.S. Mid-Atlantic region whom I recruited using a purposeful random sampling
approach. The participants were bank customers that use biometric technology with
mobile banking apps in the Mid-Atlantic region. The collected data are relative and
helpful to bank managers and customers about implementing biometric technology with
mobile devices. A web-based survey was presented to volunteer bank customers from
three independent banks and three colleges in the Mid-Atlantic region for data collection.
The data results were analyzed by using a SEM based on the quantitative data tools. The
purpose statement lists the intent of the study and explains the overall intentions and
accomplishments.
Delimitations for this study were determined by me and include (a) research
question and hypotheses, (b) variables, (c) population, and (d) framework for the study.
For the study, the population was delimited to only college bank customers and local
independent bank customers who use mobile banking technology.
I only included participants from the community banking industry. Also,
delimitations included using the UTAUT to shape the independent and dependent
variables (see Table 2) and the survey questionnaire. The method of a web-based
questionnaire survey approach was another delimitation; however, I included an
extension of the UTAUT with PC and TTF, but no other research method was selected.

24
The results of the study were generalizable to the millennium generation who (a) use
mobile banking (b) use new technology (c) live in the Mid-Atlantic region of the United
States and (d) have mobile devices.
Limitations
There has been limited research and analysis of behavioral characteristics and
mobile device use for open approve systems in the banking industry (Alotaibi et al.,
2015). Below are limitations of previous literature that addressed the usability of the
millennial demographic, e-banking, continuous authentication, transparent, biometric
technology and community banks.
• Millennial Demographic Limitations. The banking industry has explored the
oncoming wave of the millennial generation and the importance of capturing
that demographic market to ensure the movement viability (Bosch et al.,
2019). Over 81 million millennials in America were born between 1982 and
2000, outnumbering the baby boomer generation, and millennials are expected
to turn the financial services world upside down (Bosch et al., 2019). Previous
research showed that combining TTF and the UTAUT would determine a
customer's attitude (Saputra et al., 2018). Saputra et al. (2018) administered an
online questionnaire for TTF and UTAUT, which asks questions about
customers task, technology, task-technology, expectation, effort, social
influence, and use purposes, and the review could explain 54.9% of the
variance of the customers' behavior toward technology (Saputra et al., 2018).
Therefore, it is critical to research on the millennials generation who are the

25
future bank account holders, and this generation will help guide the next
generation into new technology. In this study, the millennial generation was
included in the research model as a control variable.
• E-Banking Limitations. Security professionals are recommended to do risk
and cost-benefit analyses of their e-banking ecosystem, so the best decision is
made for mobile device implementation (Vila et al., 2014). E-banking
transactions used in mobile devices require an interface to communicate with
bank customers (Goyal et al., 2016). Ivaturi and Janczewski (2013) noted the
bank's limitations only provided social engineering attacks (e.g., phishing)
attacks, and they did not include other forms of aggression. Only focusing on
one attack is less helpful because of all the additional information about new
and emerging attacks on online bank systems.
• Continuous Authentication Limitations. Mobile devices have become
susceptible to many privacy issues, and if the data on the devices are
compromised, legal actions can get used against the bank (Handa et al., 2018).
The use of one-step authentication (i.e., username and password) on mobile
devices does not take into consideration fraudulent activities after the initial
login has taken place (Handa et al., 2018). Therefore, to deal with the one-step
login, continuous authentication technology is becoming more popular
because it can monitor the customers after the initial login process is complete
(Handa et al., 2018). Zhou et al. (2010) examined how post-log-in continuous
authentication has brought new attention from researchers. However, none of

26
the previous studies examined mobile user authentication at entry
authentication and post-log authentication stages simultaneously. Also,
existing authentication systems get described as the usual trade-off between
security and usability. Therefore, Zhou et al. proposed Harmonized
Authentication based on Thumb Stroke dynamics (HATS) that assists both
entry-point and post-log-in user authentication with mobile devices to address
the limitations. HATS integrate password, gesture, keystroke, and touch
dynamics-based authentication methods to address the vulnerabilities of
individual processes to specific security attacks (Zho et al., 2016).
• Transparent Authentication Limitations. The device-centric process uses
independent functions, and continuous authentication is not recognized when
data get used with different applications. This process does not identify
critical components of the software applications getting used, which causes
frequent authentication overhead (Alotaibi et al., 2015). Also, the customers
could have more than one device, which can confuse the system when
customers are accessing the applications from different devices.
• Biometric Technology Limitations. Previous literature found using biometric
technology systems is only reliable if the performance rates are acceptable; for
example, two conventional metrics used to evaluate biometrics’ performance
are (a) false acceptance rates and (b) false rejection rate (Vila et al., 2014).
Also, the security professionals introduced the mobile application to deliver it
with the e-banking systems (Vila et al., 2014).

27
• Community Banks Limitations. In this study, the sample used was evenly
distributed and adequate for the data analysis but was small (N = 228),
compared to the population of the Mid-Atlantic region of the United States.
The study did not include large commercial banks with assets over the U.S.
$10 billion. As stated, community banks have less than the U.S. $10 billion in
assets (Gehrke, 2019). The larger banks have fewer total banks but hold
significantly more assets, product offerings, geographic areas, and size
advantage than smaller community banks. These limitations restrict the range
of mobile banking accounts compared with services provided by large
commercial banks. Consequently, larger banks' modus operandi involves
different business models than those used by community banks. Even though
the results confirmed the study's value, it is an exploratory factor in biometric
technology implementation during mobile banking transactions. This study
was conducted on community banks and needed to be related to a broader
range of banks.
Significance of the Study
The findings of my study may explain the gaps to determine customers' intention
to use biometric technology with mobile banking. The result could help bank chief
executive officers (CEOs) recognize the challenges and barriers to implementing mobile
bank apps that use biometric technology during the adoption and planning phases.
Understanding the challenges and barriers could guide bank CEOs with a more efficient
and effective implementation of mobile banking apps using biometric technology. This

28
study may provide further knowledge for managers and other decision-makers in the
banking industry on implications that may encourage the adoption of mobile banking.
Risk Assessment
Software development companies have developed and popularized mobile
devices, and the banking industry has included mobile apps for customers' mobile
banking needs. Community banks have responded to mobile devices' constant threats and
how this affects customer's privacy concerns (Chen & Liu, 2015). Therefore, community
banks implementing mobile banking risk management and mitigation strategies will help
with cybercrimes. This paper used the SEM to investigate and review the top 10 risks that
could arise from mobile apps. The Open Web Application Security Project (OWASP,
2019), a worldwide nonprofit organization focused on improving web application
software security, did a survey to determine the top 10 mobile application risks (see
Appendix B). According to the Community Bank Connection, four main risks are
relevant for community banks (Combs, 2014). Listed below are the four main risks for
mobile apps.
• Insecure data storage. The loss of customers' mobile devices and the
possibility of malware where intruders can gain access to the device.
• Weak server-side controls (WSSC). WSSC pertains to weak back-end mobile
devices that the mobile banking process will need to use.
• Insufficient transport layer protection (ITLP). ITLP pertains to the insecure
data that get transported over public networks.

29
• Poor authorization and authentication. Weak data encryption on mobile
devices and potential identification data left on devices even after data wipes
or resets.
When the banking industry introduced mobile banking, it presented new security
risks, threats, and challenges (Combs, 2014). Mobile banking became ubiquitous for
community banks after the portable internet, electronic bank (e-banking), and smart-chip-
embedded handsets appeared. Mobile banking (MB) enables customers to access their
bank account to conduct financial transactions or use other banks' services. Still, the
possibility of loss, theft, malware, and exposure of stored personal financial information
presents obvious risk on the other side (Bagadia & Bansal, 2016). Even though no
mitigation scheme can eliminate risk, community banks should develop practices to
adequately secure the mobile banking process. Mobile technology for mobile services
offers low costs and provide ease of use to customers, and mobile banking apps are still
in their early development stages (Bagadia & Bansal, 2016). By understanding the
security risks and developing effective ways mobile banking can service customers, a
community bank can minimize and manage their legal and reputational risks (Combs,
2014). Also, community banks must study suitable and adaptable conditions for banking
customers (Bagadia & Bansal, 2016). Understanding customer's wants will help decision-
makers with designing mobile banking services.

30
Risk Mitigation
The banking industry witnessed a new era of technological advancement in
information technology, specifically smartphones. For community banks, mobile banking
has created a breakthrough in remote banking services; however, many customers have
doubts about the new technology's security (Muñoz-Leiva et al., 2017). In this study, I
used the UTAUT model and integrated the extension of the UTAUT with PC and TTF.
The two theories help with what factors determine user acceptance of mobile banking
apps. As a mitigation strategy, bank managers will advise community banks to adopt a
new approach to build customer satisfaction. As a mitigation strategy, offering better
products while reducing bank operation costs to overcome significant changes in
delivering financial services will help all stakeholders (Bagadia & Bansal, 2016).
Because of rising numbers of online customers, the traditional bank's importance has
declined, which has decreased the cost for community banks and customers (Bagadia &
Bansal, 2016).
Community banks join the global network to offer better conditions to customers
who decide to use mobile banking apps (Muñoz-Leiva et al., 2017). The most effective
channel for offering bank services was the internet and mobile apps, but banks had to
respond to customers' demands and provide safer solutions (Muñoz-Leiva et al., 2017).
Since electronic banking first appeared, it gave customers limited remote access to their
bank account. Then, web applications gained rapid popularity and created more
advantages like comfort and ease (Muñoz-Leiva et al., 2017). Online banking provides
more features and services at a lower cost than traditional banking activities (Muñoz-

31
Leiva et al., 2017). Previous studies have shown that mobile banking is the top-rated
electronic delivery channels provided by community banks for a branchless distribution
of services to customers (Bagadia & Bansal, 2016).
Mobile banking services provide many benefits, but there is a lack of use because
of customers' belief for potential financial harm and sensitivity to the features' security
(Bagadia & Bansal, 2016). The power to access your bank account anytime and
anywhere is a natural draw for customers. Also, mobile banking apps provide customers
with many advantages, but mobile banking apps have not increased because of the
system's lack of trust (Muñoz-Leiva et al., 2017). A previous survey by Price Waterhouse
reported 157 managers in America, Europe, Asia-Pacific explained how mobile banking
would increase by 64% in the future because of information systems for financial
institutions (Muñoz-Leiva et al., 2017). If customers do not find any safe or beneficial
reason to use mobile banking, they will not use it. If a customer feels mobile banking is
useful, easy to use, and secure, they will adopt it. However, if mobile banking gets
perceived as risky, customers will not choose it (Bagadia & Bansal, 2016).
A survey conducted by community banks is embracing mobile banking to
capitalize on the benefits it provides to customers' services (Chavali & Kumar, 2018).
Online banking offers more features and services at a lower cost than traditional banking
activities (Muñoz-Leiva et al., 2017). The banks that use better technology will have a
competitive edge over the other banks that do not provide the new customer market
services. Biometric technology integrated with a mobile banking security system can

32
make a positive social change by aiding in securing banks from fraud and crime
prevention and proving liveness detection.
Significance to Theory
In this study, I explored the variables that influence bank customers’ intentions to
adopt biometric technology with mobile banking in the Mid-Atlantic region of the United
States. The study promoted community banks development of biometric technology with
mobile banking to mitigate the risk associated with bank fraud and financial loss
prevention. This study filled the gap in the present literature about customers' adoption of
biometric technology with mobile banking. Given that this topic has limited research on
it, I used theories such as PC, TTF, and the UTAUT to understand customers' opinions
and beliefs about biometric technology with mobile banking.
In this study, I added proven theories (UTAUT model with PC and TTF) to get
more clarification and detailed answers on the topic. The goal of the study was to raise
awareness among bank CEOs in the banking industry, particularly about the challenges
and obstacles that may arise when implementing a secure banking application that uses
biometric technology to mitigate bank fraud risk. Also, I want to give bank customers
more information on the benefits of using biometric technology with mobile banking.
Significance to Practice
Community banks CEOs may use this study's findings to improve the security
features of mobile banking. The results could lead to a positive social change and help
bank CEOs’ make appropriate decisions on how to measure and implement a successful
mobile banking application using biometric technology.

33
• Mobile application layer. Mobile banking apps allow customers to access
their accounts from any location and at any time, and this creates an advantage
over traditional banking (Muñoz-Leiva et al., 2017). Any new technology will
offer benefits and risks to customers, and mobile banking will not be an
exception to this rule. Participants revealed that lack of privacy, time,
financial risk, and performance risk were the most predominant risk factors in
adopting a mobile banking application (Chavali & Kumar, 2018). Ease of
transacting is the main focal point for the banking industry (Chavali & Kumar,
2018).
• Security layer. Security architecture recommends securing mobile banking
platforms during a mobile transaction. Biometric technology is used to
strengthen the traditional methods of information security by providing more
protection for customer information. Using biometric technology, customers
can benefit and have more secure identification, which can reduce credit card
fraud and identity theft. Biometrics can improve the security authentication
performance of banking in mobile devices by minimizing error rates and
reducing the risk of successful intrusion (Wójtowicz & Joachimiak, 2016).
Biometric technology is a critical tool for confirming customer's identification
at will offer several advantages over traditional authentication methods to
access the bank's mobile application.
• Customer trust. Introducing mobile banking made customers feel hesitant
about adopting this new technology (Malaquias & Hwang, 2016). Therefore,

34
trust is a critical element that reduces customers’ concerns, and it is one aspect
that increases their intention to use mobile banking (Malaquias & Hwang,
2016). Previous researchers discussed the importance of risk in operating new
technology and services (Bagadia & Bansal, 2016). Once the customers feel
risks to the system, they may opt-out of the technology (Bagadia & Bansal,
2016). Customers want to access their accounts through the safest method. In
turn, bank fraud is at an all-time high, and intruders are getting more
sophisticated and implacable at compromising bank accounts (Heun, 2015).
Therefore, spending money on a good data security system is vital for banks
to sustain in the industry. Also, having a proper security system can help
prevent data breaches that could inflict the bank's brand and the careers of top
executives (Heun, 2015).
Significance to Social Change
In this study, I discussed the positive changes biometric technology will bring to
mobile banks' apps by reducing security violations by unauthorized users. Biometric
technology can help prevent unauthorized users' unauthorized attempts while providing
solutions to confirm trust and convenience in people's lives. This study affirms the
Walden University mission of making a positive change. As a scholar-practitioner, my
goal is to help bridge the gap between academia and a real-life situation. The banking
industry has developed new strategies to prevent intruders from comprising their online
or mobile apps because of evolving security attacks. Security systems are something

35
community banks will invest in to sustain their place in the banking industry, which can
help banks spend less money in case of a security breach (Heun, 2015).
Mobile banking by customers has grown more than any other delivery channel,
and community banks are expanding their services in the mobile channel because of both
parties' security issues (Bagadia & Bansal, 2016). Biometric technology has also affected
community banks' services, particularly in authentication (Hess & Van Der Stad, 2016).
Replacing passwords with biometric technology can offer more security for customers
during the login process and continuous use with their mobile banking apps (Hess & Van
Der Stad, 2016). Due to increased fraud threats and data breaches, biometric technology
can enhance security and reduce risks associated with the traditional username, password,
and other conventional security systems (Hess & Van Der Stad, 2016). Security measures
allow a customer to exclude many types of banking fraud; for example, biometric used
with mobile banking services provide customers with acquisition and managing liquidity
(Abdullaev et al., 2019). Most online banking services use the traditional login system of
single-factor authentication, which solely consists of the customer's username and
password, personal identification number, and text-based login process (Putra et al.,
2017). Risk mitigation techniques for mobile banking apps include customers using
biometric technology, which offers a chance to secure transactions for customers to help
prevent fraudulent activities.
Using biometric technology allows community banks to enforce internal security
measures and create an audit trail to work with other technology to detect fraud (Hess &
Van Der Stad, 2016). Community banks understand the need to use a mobile application

36
to reach their customers (Akoramurthy & Arthi, 2016). Biometric technology plays a
significant role in supplementing mobile banking apps during the authentication process
by positively identifying the person (s) participating in the operation. Social and ethical
concerns related to biometric technology deployment are significant for any bank to
protect their copyrighted information (Tiits et al., 2014). However, due to the widespread
of the Internet and the expansion of smart devices, information technology (IT) security
attacks have risen. The primary concerns for community banks are identity theft,
customer privacy, and lack of secure authentication. The study promoted the
development of biometric technology with mobile banking to mitigate the risk associated
with bank fraud and financial loss prevention. The goal of the study was to increase both
public and stakeholders understanding of security with mobile banking application and
enable bank CEOs’ to better prepare for cybercrimes.
Summary and Transition
Chapter 1 introduced how biometrics technology is considered a reliable process
for the community bank's authentication process with mobile devices. I discussed how
biometric technology is research by many companies, and banks are starting to
implement the technology architecture in their security system. To apply new security
protocols, banks will have to develop a process and follow the guidelines to enhance the
bank security system. Every year, security issues are reported, which has caused
customers to lose trust in mobile banking apps. Business-to-business (B2B), business-to-
consumer (B2C), and consumers-to-consumers (C2C) transactions can develop a trusting
relationship by using biometrics technology with their mobile devices. Using biometric

37
technology with mobile banking apps can offer customers more reliable and secure bank
transactions. Biometrics provides a safe environment for banking transactions and
customer's banking experience. I discussed mobile device users' problems in the United
States and how securing the bank application within mobile devices is a top priority for
customers, especially with the rise of new cybercrimes committed daily.
The study's purpose was to explore the relationship between customer acceptance
and the use of biometric technology with mobile banking apps in the Mid-Atlantic region.
The research question asked about PE, EE, SI, PC, TTF, and how it affects customers' BI
of customers to adopt biometric technology with mobile banking. The study sought to
evaluate whether FC and BI affect customers' AU to use biometric technology with
mobile banking. The theoretical foundation for this study was the UTAUT model and
was used to predict user acceptance and user behavior. A theoretical framework was used
from the UTAUT and extending it with two additional factors: the PC and TTF model.
The study's nature was a survey design utilizing quantitative research methods, and I used
the SEM to analyze the data. Chapter 1 included essential definitions, assumptions,
scope, limitations, the main points of the study, theory, and social change. In Chapter 2, I
provide the position of the UTAUT framework and an analysis of current and relevant
literature.

38
Chapter 2: Literature Review
In this chapter, I reviewed current and relevant research on biometric technology
with mobile banking using the framework of the UTAUT and by extending the UTAUT
with PC and TTF. In this quantitative study, I identified how customers adopt biometric
technology with mobile banking security. The behavior plans affect the acceptance and
use of biometric technology with mobile banking transactions. The study detected factor
analysis and multiple regression using a quantitative research method (Rea & Parker,
2014) by studying BI at three local colleges and three local banks in the United States'
Mid-Atlantic region. The research design includes bank customers who use a mobile
banking application with biometric technology.
Literature Search Strategy
For this literature review, I sought current, peer-reviewed research studies about
the UTAUT theory. The literature review also includes peer-reviewed studies that address
limitations, weaknesses, and potential for future research in each category. Other sources
include statistical reports and scholarly books. The Walden Library databases were the
primary resource to obtain the sources. Search routines included full-text, scholarly, and
peer-reviewed articles. Keywords in the search criteria included biometric technology,
mobile banking security, frauds prevent, crime prevention, liveness detection, UTAUT,
and extending the UTAUT, with two more factors: the perceived credibility and task-
technology fit model. The literature review focuses on peer-reviewed studies that were
less than 5 years old. The materials I used are related to biometric technology and how
39
this can positively impact the environment by providing solutions to security concerns by
bank customers.
The goal of the framework is to create a practical method for liveness detection.
In biometric systems, liveness detection tests for the presence of liveness or vitality signs,
including human pulse, temperature, oximetry, and others (Okereafor et al., 2017). In
biometric authentication, two types of attacks are adopted by intruders: direct and
indirect. The search strategy object was to identify all published articles related to
biometric features with mobile devices. Most of the literature was on mobile banking
systems with liveness detection features. For the literature review, I used standard search
strategies from the Thoreau search feature that went through all databases in Walden’s
library using keywords limit to full text, peer-reviewed scholarly journals, and books with
publication dates from 2013 to 2018. The databases used were from IEEE Explore,
ProQuest, Science Direct, Business Source, Research Library, Emerald Management,
Psychology Database, Arts & Humanities, Library Science, and ABI/INFORM. The
publication type was a search by academic journals, conference materials, magazines,
news, trade publications, reviews, reports, books, eBooks, electronic, audio, videos,
standards, primary source documents, and biographies. Once the search results populated,
I evaluated the publications by relevant articles and publication types. Also, the Google
Scholar search engine was used for querying all websites and articles related to biometric
technology and mobile banking security.

40
Review of Theoretical Approaches
Security is considered a priority for many mobile banking customers. In a
previous study, 31% of clients stated they would pay for increased security features, 63%
were ready to switch accounts for better security features, and 71% were eager to change
accounts to a bank that guaranteed losses and reimbursed (He et al., 2015). In the United
States, 65% of adults who use the Internet have had cybercrime, computer scams, fraud,
virus, and malware attacks against them (He et al., 2015). A previous study by Crawford
and Renaud (2014) explained that 30% of participants had no security process for
accessing their mobile devices. Even though over 73% of participants felt that biometric
technology was more secure than traditional methods (Crawford & Renaud, 2014). There
are 4 billion mobile cellular subscriptions throughout the world, and mobile networks can
offer mobile banking to over 61% of the world population (Yadav, 2016).
As technology develops, mobile devices are being used for more than just placing
calls and texting people. Because of the mobile device's capability, customers use their
smartphones as a tool for many banking needs. Customers' ability to use a mobile device
has gained popularity with the adoption of smartphones, and community banks focus on
connecting mobile users to their mobile technology (Bagadia & Bansal, 2016). Mobile
banking apps allow customers to access their accounts from any location and at any time,
and this creates an advantage over traditional banking (Muñoz-Leiva et al., 2017). The
banking industry offers many services with mobile banking like account balance, money
transfers, and other services where the customers can easily access their mobile phones.
A report by Tassabehji and Kamala (2012) showed the United Kingdom had over 25
41
million mobile banking customers who produce over 70% of the country's online
community.
The study of behavioral profiling and application use for open authentication
systems with mobile banking needs to be explored and researched to help with BI
(Alotaibi et al., 2015). E-banking transaction used in mobile devices requires an interface
to communicate with bank customers just like all other electronic transactions performed
through some interface (Goyal et al., 2016). Using a theoretical framework incorporates
critical elements of research and helps with understanding the theory of a research study.
Online banking is one of the most requested tools by customers, and this feature allows
banks to increase their profitability and increase their profitability client base (Abdullaev
et al., 2019). Also, the International Telecommunication Union reported that more than 7
billion mobile customers and over 1 billion mobile customers use mobile banking
(Abdullaev et al., 2019; Smith, 2016). For community banks, mobile banking has created
a breakthrough for remote banking services; however, many customers have doubts about
the new technology's security (Muñoz-Leiva et al., 2017). This study reviewed mobile
banking literature through the lenses of customers adopting and accepting mobile
banking risks because of the adoption of biometric technology with mobile banking. This
theory helped develop the various factors that are revealed as antecedents to behaviors in
previous research on the adoption of mobile banking application services.
In my investigation, I used the UTAUT and the extension of the UTAUT to
examine the relationship between customer acceptance and the use of biometric
technology with mobile banking apps in the Mid-Atlantic region. The UTAUT is an

42
information technology acceptance research with many competing models that focus on
diverse acceptance determinants (Venkatesh et al., 2003). The UTAUT model was
adopted because of the acceptance of research with new technology, which meets this
study's objectives. Also, in the study, other intrinsic factors such as PC and TTF were
added. In the security world, cyber-crime investigators talks about cyber-crimes and how
to prevent them, and they even want a solution to minimize network penetration.
Therefore, I added more relevant information to the massive security issues that have
caused personal information from individuals and organizations. Security violations
reported by the bank will change over time because of hackers' ability to find loopholes
in the systems. Therefore, providing more research, data analysis helped with ways to
strengthen security features to prevent security threats.
According to the UTAUT, PE, EE, SI, and FC were discovered to influence
behaviors to use new technology, and behaviors and FC determine technology use (Al-
Harby et al., 2010). UTAUT explained 77% of the variance in BI to use new technology
and 52% of the workplace's technology (Al-Harby et al., 2010). To further support the
UTAUT, Venkatesh et al. (2003) gathered information from two different organizations
and add external validity to the preliminary test. Venkatesh et al. (2003) developed the
UTAUT model as a comprehensive synthesis to determine user acceptance and use
behavior of prior technology acceptance research. The UTAUT is a review and synthesis
of eight theories of technology that predicted the critical factors and contingencies related
to BI to use technology acceptance (Venkatesh et al., 2016). The UTAUT model is from
four internal and external organizations. The model provides a creative tool for managers

43
needing to assess new technology and understand how to design interventions for
customers. Venkatesh et al. (2003) explained how combining eight models were initially
used to determine employee's technology acceptance and use. The eight models are the
following:
• theory of reasoned action (TRA)
• technology acceptance model (TAM)
• motivational model (MM)
• theory of planned behavior (TPB)
• combined TAM and theory of planned behavior (CTAMTPB)
• model of personal computer utilization (MPCU)
• innovation diffusion theory (IDT)
• social cognitive theory (SCT)
The UTAUT has four key constructs that were valuable and valid research
predictor tools of adoption behavior and BI. The UTAUT focuses on PE, EE, SI, and FC
are direct determinants of user intent and behavior, and FC are a direct determinant of
user behavior (Venkatesh et al., 2003). The research hypotheses measured reliability and
validity with a theoretical framework based on the extended UTAUT with three
moderating variables: age, gender, and education level. The UTAUT and extension of the
UTAUT served as a comprehensive framework used to examine the components that
contribute to the use and acceptance of biometric technology with mobile banking.

44
Theoretical Framework
The theoretical framework is the brains of the research study, and it gives
structure to a theory (Dziak, 2018). The conceptual framework incorporates a working
hypothesis to explored and theorizing with the theory evaluation framework (Venkatesh
et al., 2016). Green (2014) explained how the conceptual framework draws on the
concepts from different theories and findings, and the theoretical framework draws on
research underpinned by one approach. Tarhini et al. (2016) created a conceptual
framework by extending the UTAUT by assimilating two additional factors: PC and TTF
theory. The theoretical framework for this study deals with biometric technology related
to mobile banking for secure authentication. This study contributed to the research on
biometric technology by looking at mobile banking adoption and how customers' BI
affect their use and acceptance of mobile banking in the Mid-Atlantic region. Banks'
many security violations increase because of hackers' ability to find loopholes in their
systems. Therefore, providing more research data will help the decision-maker provide
customers with preventive measures during bank transactions.
E-banking services for customers boosted the roles and significance of how banks
impose e-business and e-services. Customers get more benefits from mobile banking
because it provides more services, convenience, and 24-hour access for customers.
Community bank reports show that an increase in mobile bank application security, and
confidentiality is significant concerns for stakeholders. As previous studies have shown,
PC and TTF offer a comprehensive theoretical perspective that further highlights the
importance of security and privacy to customer's use of mobile bank apps. E-commerce is

45
the leading customer's service for banks to manage, and bank managers have
implemented security protocols to strengthen mobile banking apps (Tassabehji &
Kamala, 2012). Customers have increased their online mobile services for bank
transactions, and e-banking has played a significant role in evolving e-business and e-
services. Community banks have found that online mobile banking gives customers many
options that offer cost savings and efficiency (Tassabehji & Kamala, 2012).
Mobile apps give customers more access to their bank accounts anywhere and
anytime. Customers who use mobile bank apps can benefit from the way they provide
them with more convenience and account access. However, because of the increasing
security attacks and bank fraud, more customers accept and use mobile apps for
convenience. Also, security issues are a concern for customers because of mobile banking
security incidents. These security issues have caused customers to express their fears
about using mobile bank apps when accessing their bank account. Since the evolution of
online banking and mobile banking apps, online fraud has increased, causing banks to
offer customers more strengthen security (Tassabehji & Kamala, 2012). Because of
identity fraud and other security issues, customers have shown interest in using biometric
technology to authenticate themselves during mobile bank transactions (Tassabehji &
Kamala, 2012). When a customer chooses a bank, they rely on the bank to provide secure
transactions when accessing their bank information or using other bank services.
Biometric technology is new to research, and bank customers are not aware of the
benefit's biometric offers. Biometric technology offer enhances security to mobile bank
apps, and it helps customers and stakeholder feel safer when accessing their accounts

46
(Tassabehji & Kamala, 2012). Management in the community banking industry is
looking at a new process to help protect customers from different security breaches. Also,
the government has offered their services to help with bank security issues. The
government's primary goals were to use biometric technology with border control and
national ID programs, in which the results showed they were satisfactory (Tassabehji &
Kamala, 2012). Biometrics technology used with mobile bank apps can be a useful tool to
authenticate customers and address concerns of customers. The System Usability Scale is
the current system that measured community banks' security systems. During the SUS, a
case study explains the natural and cost-efficient policy with more in-depth explanations
of the bank's security system (Tassabehji & Kamala, 2012).
Mobile devices are becoming customer's first choice for mobile e-banking and
banks are using multifactor identification methods to protect customers during
transactions (Kaman et al., 2013). The community bank's management team's objective is
to create services for customers to have safe and secure bank transactions. Customers are
engaging in mobile banking because of the expansion of smart devices, and this has cause
bank managers to understand the need for more enhance security protocols with their
mobile apps. Previous research by Tarhini et al. (2016) examined the adoption and
acceptance of Internet banking and how security and risk associated with PC and how
well the technology will fit the customer's needs. Previous research findings suggest that
PC is a strong determinant of customer satisfaction and behaviors to adopt mobile
banking apps (Priya et al., 2018). In the adoption of mobile banking, this enables the

47
customers to have more control over their transactions, and security and trust issues
(Tarhini et al., 2016) will dictate the decision.
Security and trust are the most critical factors motivating customers to implement
any new technology (Priya et al., 2018). Previous studies show that customers have
confidence in their banks, but their trust in technology is weak because of security issues
resulting from using new technology (Tarhini et al., 2016). Therefore, adding PC will
contribute to the factors of UTAUT and can improve the prediction of customer's
acceptance of biometric technology with mobile banking. Integrating PC in the UTAUT
is designed to help bank CEOs’ look at the critical challenges of mobile bank’s
application security. Also, the previous study suggested the most critical need for new
technology is to address customers' BI and their adoption of new technology (Tarhini et
al., 2016). Also, there are not many studies that focus on the behaviors of how customers
accept biometric technology with mobile banking apps in the Mid-Atlantic region with
community banks. Therefore, by extending the UTAUT with the PC and TTF, a more
comprehensive theoretical perspective of user technology acceptance in mobile banking
was provided (Tarhini et al., 2016). In this study, gap was filled by expanding the
UTAUT with PC and TTF.
Literature Review
An examination of the literature review reveals a comprehensive understanding of
the UTAUT and the extension of the UTAUT model. Tarhini et al. (2016) explored how
PE, SI, FC, PC, and TTF was significant predictors in influencing customer’s BI to use

48
mobile banking. The literature review analyzed current research on UTAUT and the
extension of UTAUT, mainly PC and TTF.
UTAUT
The UTAUT is a comprehensive technology model and has four key constructs;
PE, EE, SI, and FC that influence behaviors to use technology (Venkatesh et al., 2016).
The UTAUT was adopted because of the four key constructs and how prior research used
customer technology acceptance and context. Venkatesh et al. (2016) explained how the
UTAUT constructs influence technology and behaviors, and FC determine how
customers use technology. The UTAUT model identifies user intentions and operates as
the key-dependent variable, age, gender, experience, and voluntariness of use (Rajapakse
(2011). At first, the UTAUT was developed to explain employee technology acceptance
and use (Venkatesh et al., 2016). Figure 2 shows a diagram of the unified theory of
acceptance and use of the technology model.

49
Figure 2
Unified Theory of Acceptance and Use of Technology (UTAUT)
Note. From Consumer Acceptance and Use of Information Technology: Extending the
Unified Theory of Acceptance and Use of Technology, by V.L. Venkatesh, J.Y., Thong,
and X. Xu, 2012, 36(1), 157-178. Copyright 2012 by Venkatesh, Thong, Xu. Reprinted
with permission (see Appendix D).
This study used the theory from Venkatesh et al. (2012) to use two pivot
constructs to understand customer adoption and technology use. Once the constructs were
identified, the original UTAUT will have new relationships. Previous research found that
customers’ behavior and information system found various constructs enabled a hedonic
motivation, which is essential for customers’ during new technology use (Venkatesh et
al., 2012). The UTAUT is a base-model of technologies for various organizations and
non-organizations (Tarhini et al., 2016). Since the original publications, many software
applications and replications of the UTAUT model or part of the model in various

50
settings were used (Tarhini et al., 2016). Previous research using the UTAUT reported
that 70% of the variance in intention and behavior explains individual acceptance and use
decisions in organizations (Venkatesh et al., 2003). Previous theories and models have
tried to describe the relationship between the user(s) beliefs, attitudes, and behaviors to
use new technology (Tarhini et al., 2016).
Venkatesh et al. (2012) debated how the UTAUT constructs could be inadequate
for showing a voluntary context for user acceptance of new technology. The original
UTAUT study focuses on large organizations limiting the constructs' explanatory power
(Tarhini et al., 2016). There are three types of UTAUT extensions and integrations: (1)
extensions, and integration examined UTAUT in new contexts mainly, technology (2) the
addition of new constructs to expand the theoretical mechanisms outlined in UTAUT (3)
finally, exogenous predictors of the UTAUT variables are valuable in developing
research of technology adoption and extending the boundaries of the theory (Tarhini et
al., 2016). In this research, extending the UTAUT with two additional constructs, TTF
and PC, is used to help understand the key factors that affect the customers' BI to use and
adopt biometric technology with mobile banking in the Mid-Atlantic region.
Extending the Unified Theory of Acceptance and Use of Technology
This paper will explore the UTAUT2 by focusing on critical additional constructs
and relationships implemented into the UTAUT by tailoring it to the customer's use
context. Tarhini et al. (2016) noted how the UTAUT is a proven valid research
instrument and tool to predict the adoption behavior. Despite the proven research that has
led many researchers to understand technology adoption. Tarhini et al. (2016) explained

51
how a systematic investigation is needed and theorizes the salient factors of customers'
use of technology. Therefore, studying the adoption and acceptance of mobile banking
and other factors can be considered because of bank apps' security and risk. Adding PC
and TTF will show how the technology fits the customers' daily needs (Tarhini et al.,
2016). By extending the UTAUT to including two more factors, PC and TTF, are a
comprehensive theoretical perspective of customer" technology acceptance of mobile
banking was provided (Tarhini et al., 2016). Figure 3 shows a diagram of the extended
theory of acceptance and use of technology. The UTAUT2 model includes the UTAUT
and the two more factors, PC, and TTF.
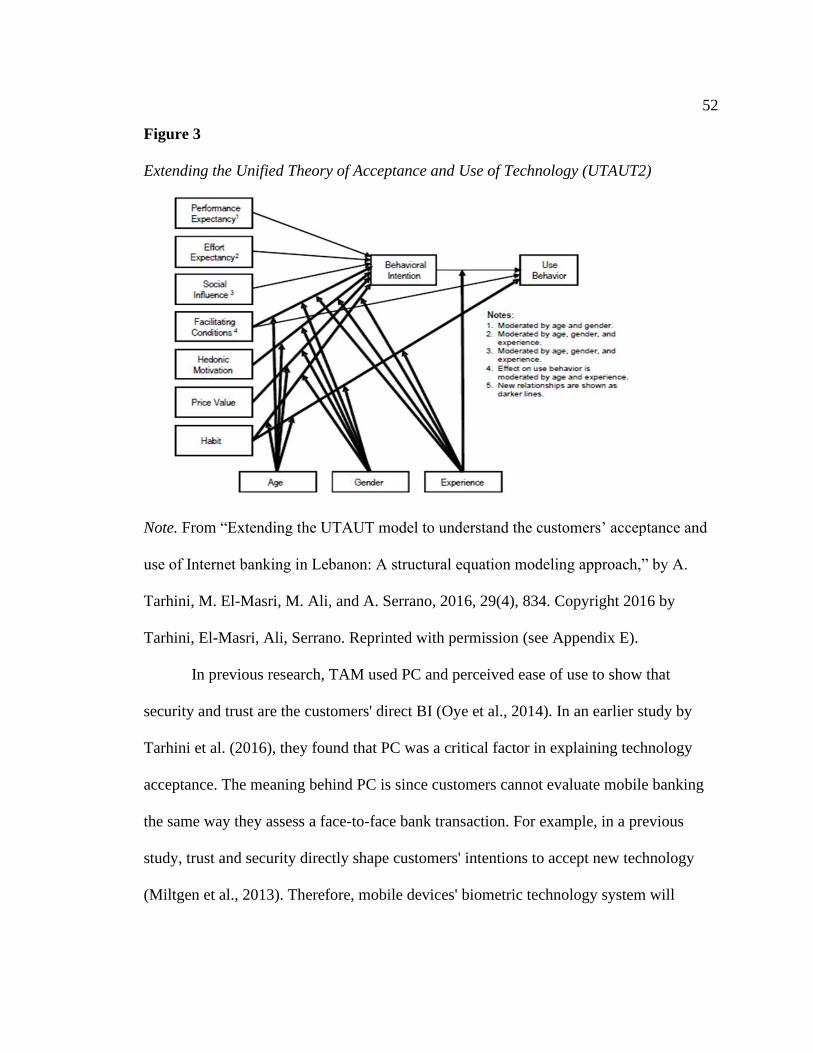
52
Figure 3
Extending the Unified Theory of Acceptance and Use of Technology (UTAUT2)
Note. From “Extending the UTAUT model to understand the customers’ acceptance and
use of Internet banking in Lebanon: A structural equation modeling approach,” by A.
Tarhini, M. El-Masri, M. Ali, and A. Serrano, 2016, 29(4), 834. Copyright 2016 by
Tarhini, El-Masri, Ali, Serrano. Reprinted with permission (see Appendix E).
In previous research, TAM used PC and perceived ease of use to show that
security and trust are the customers' direct BI (Oye et al., 2014). In an earlier study by
Tarhini et al. (2016), they found that PC was a critical factor in explaining technology
acceptance. The meaning behind PC is since customers cannot evaluate mobile banking
the same way they assess a face-to-face bank transaction. For example, in a previous
study, trust and security directly shape customers' intentions to accept new technology
(Miltgen et al., 2013). Therefore, mobile devices' biometric technology system will

53
increase customers' disposition to take this technology, which trusts should influence BI
directly (Miltgen et al., 2013). This study used PC constructs to measure customers'
preferences to use mobile banking. The reason is that all customers fear losing data and
especially money, using mobile banking transactions. Therefore, PC can be one of the
most influential factors in customers' acceptance and adoption of biometric technology
with mobile banking in the Mid-Atlantic region of the United States.
Banking research has shown that users who use services significantly positively
affect traditional services (Tarhini et al., 2016). For example, TTF used within the
UTAUT is beneficial to determine customers' BI from mobile banking. Evidence shows
that users will not accept and use technology if it does not fit their needs and performance
(Tarhini et al., 2016). In this study, the TTF model was used to propose a mobile banking
user adoption model (Tarhini et al., 2016). TTF is a proven model that shows customers
will adopt a technology to perform their daily tasks (Saputra et al., 2018). Therefore, the
adoption of new technology significantly depends on the day-to-day functions of the
customer. Previous studies revealed that providing customers with a good TTF would
dramatically enhance the customer's experience (Tarhini et al., 2016). Banking research
has shown that banks that support and promote security features for customers have
positive impacts on use and adoption (Tarhini et al., 2016). Therefore, the TTF theory
assisted and influence customers' behaviors to use biometric technology (Tarhini et al.,
2016). Also, Suki and Suki (2017) found that behaviors are a significant and valid
predictor of the behavior of new technology.

54
Chao (2019) revealed that BI is significantly and positively influenced by
customers' satisfaction, trust, PE, and EE. In this study, the TTF was integrated with the
UTAUT to understand customers' learned behavior. The TTF goal determined how
customers will not accept and use technology if it does not fit their needs or improve their
performance (Tarhini et al., 2016). Previous research suggested that TTF is a factor used
to decide whether information technology systems and services by companies meet
customer's needs (Al-Khafaji et al., 2018). Also, previous research showed that TTF is a
theoretical model used to assess how information technology improves performance and
use by customers (Al-Khafaji et al., 2018). According to Al-Khafaji et al. (2018), task
characteristics and technology characteristics affect TTF, which is the determinant of
customers' performance and utilization. The adoption of mobile banking was determined
by customers' opinions toward technology and how the TTF their need.
The BI indicate how customers will act or respond to new products, which is an
indicator of the customer's readiness to act on a specific behavior (Tarhini et al., 2016).
The actual usage is the customer's behavior patterns and response to the organizations'
target market (Tarhini et al., 2016). Venkatesh et al. (2003) explained how previous
studies explained the effect of BI on actual usage in technology acceptance. PC as it deals
with mobile device technology is where an individual believes that mobile technology
will not precipitate any security or privacy threats (Palau-Saumell et al., 2019). In
previous research, the PC construct was used to measure customers' security, privacy, and
trust concerns that affected the customer's behaviors to use bank apps (Goyal et al.,
2016). In the mobile environment, PC gets measured with two dimensions: security and

55
confidentiality (Palau-Saumell et al., 2019). Along with PC, the adoption of new
technology will depend on the customers' daily activities (Saputra et al., 2018).
Therefore, PE, EE, SI, PC, and TTF played critical roles in customer's behavior in
accepting or rejecting MB apps in the Mid-Atlantic region.
Previous literature based on SEM analysis showed that PC has a significant
relationship with trust and satisfaction (Masrek et al., 2018). In previous studies, the PC
model was research to show the relationship between customer" beliefs, attitudes, and
behaviors to use new technology (Tarhini et al., 2016). Also, Tarhini et al. (2016) argued
that integrating PC into UTAUT will predict customer's BI towards using MB. In
previous research, the PC construct was used to measure customers' security, privacy, and
trust concerns that affected the customer's behaviors to use bank apps (Goyal et al.,
2016). The rationale is since customers are afraid to lose money with mobile transactions
because of the perceived subjective of MB. PC was an influential factor in deciding if
customers will accept and adopt mobile banking in the Mid-Atlantic region. The TTF
affected PE, initial trust, and customer adoption intention (Venkatesh et al., 2016).
Four Key Constructs of the UTAUT
The UTAUT is a proven valid research tool used as a predictor of behaviors and
emphasizes PE (Tarhini et al., 2016). Voluntariness is the most salient driver of
acceptance of new technology (Tarhini et al., 2016). Venkatesh et al. (2016) defined PE
as using technology to benefit customers when performing certain services. PE is the
extent to which an individual believes the system will help customers perform their
activities better, whether business or personal (Oye et al., 2014). The predictive effect of
56
PE is mediated by age, gender, and experience. Venkatesh et al. (2016) defined PE as
using technology to benefit customers when performing certain services. (Venkatesh et
al., 2016).
• Performance expectancy is where the predictive effect gets mediated by age,
gender, and experience. Previous literature found that PE significantly
influenced the customers' BI to use a system (Tarhini et al., 2016). A similar
study by Lee et al. (2019) revealed that PE and SI are the most significant new
technology determinants. Also, PE, SI, Innovativeness, and perceived risk
showed a significant effect on customers' acceptance of new technology (Lee
et al., 2019). Tarhini et al. (2016) studied that perceived ease of use of the e-
learning system was a significant predictor of customers' intention to adopt the
system. Therefore, PE uses performed critical roles in customer's behavior in
accepting or rejecting mobile banking apps in the Mid-Atlantic region.
• Effort expectancy is related to how comfortably a customer believes in the
systems and how easily they can use them with ease (Oye et al., 2014).
Venkatesh et al. (2016) defined EE as the measure of effort that customers
deal with technology use. EE is how easy the customers can use the
technology. In previous research by Tarhini et al. (2016), customers found
banking with mobile devices a beneficial task, and it does not require much
effort to use. Previous studies found that a significant relationship between EE
and user intention confirmed customers' effort to adopt mobile banking
(Buabeng-Andoh & Baah, 2019; Rahi et al., 2019). Evidence found that EE

57
has the full attention and awareness of FC and was a predictor of intention
(Venkatesh et al., 2003). In connection with this study, if the customers find
mobile banking services easy to use, they are more likely to use and adopt it.
In contrast, if the customers find mobile banking services to be challenging,
then they are less likely to embrace it.
• Social influence is defined as the extent where customers will perceive what is
distinguished from other people, like family and friends, and think they should
use a similar technology feature or device (Venkatesh et al., 2016). SI has an
active behavioral element and adoption of new technology but may lack
conviction or may occur after someone develops an intention to act without
limitation (Oye et al., 2014). Venkatesh et al. (2016) defined SI as the extent
to which customers will perceive what distinguished from other people, like
family and friends, and think they should use a similar technology feature or
device. Therefore, SI focuses on social pressure from an external environment
where an individual's opinions and behaviors can get affected by engaging in
specific actions by the views of friends and family (Tarhini et al., 2016).
Previous research explained how groups are ready to adopt certain behaviors
to impress a group because of SI on individual behavior (Tarhini et al. (2016).
In previous studies, SI played a factor in influencing and supporting people
who use new technology (Buabeng-Andoh & Baah, 2019; Rahi et al., 2019;
Suki & Suki, 2017). The rationale is customers will get influenced by the
doubt created by biometric technology with mobile banking; they will need

58
customers to interact with their trusted network of people to consult on their
adoption decisions.
• Facilitating conditions is defined as something that refers to customers'
perceptions of the resources and services available to perform a behavior
(Venkatesh et al. (2016). Previous evidence by Venkatesh et al. (2003)
showed that relationships between perceived behavioral, FC, and intentions.
Perceived behavior is the customer's perception of internal and external
constraints on behavior and includes self-efficacy, FC, and technology
acceptance (Venkatesh et al., 2003). In previous research, PE, EE, and SI are
three constructs that discovered the intention to use and FC determine the
customers' usage behavior (Venkatesh et al., 2003). Venkatesh et al. (2016)
explained how the UTAUT constructs, PE, EE, SI, and FC are theorized to
influence behaviors for using technology and behaviors, and FC discover how
customers use technology. The banks' support of systems FC that allow
customers to accept and use the latest systems. Perceived usefulness and
perceived ease of use was found to be a positive influence of FC within
organizations (Peñarroja et al., 2019).
Previous literature also confirmed that FC had a variance in predicting customers'
intention to adopt mobile banking (Rahi et al., 2018). In this study, FC were measured by
the customer's perception of how they can use the systems and whether the banks support
mobile banking services (Tarhini et al., 2016). Earlier studies by Venkatesh et al. (2012)
revealed that FC refer to customers' perception of the resources and support provided to

59
perform a behavior. For performance to happen, mobile banking customers will need
specific skills such as configuring and operating mobile devices and connecting to the
Internet (Rahi et al., 2018).
Biometric Technology
Biometric technology is the result of security risks to e-commerce sites and
information getting stolen on mobile devices. Biometrics authenticates individuals by
discovering the personal characteristics of individuals giving some biological or
behavioral traits. The physiological or behavioral symptoms can be one or more of the
following: face, voice recognition, fingerprints, iris eye, hand-vein, signature, and other
unique features (Vanian, 2015). Lasky (2014) explored the self-regulation of human
physiological or behavioral characteristics during biometric authentication to confirm
individuals. Previous literature by He et al. (2015) explained how security was a priority
for many mobile banking customers. Previous studies found biometric technology
reliable only if the performance rates are acceptable (Vila et al., 2014). For example, two
conventional metrics used to evaluate biometrics’ performance are i) false acceptance
rates and ii) false rejection rates (Vila et al., 2014).
Multi-Modal Authentication
The multi-modal authentication process for community banks will need to include
security policies, awareness, training, and knowledge transfer to have a secure protocol.
Ivaturi and Janczewski (2013) noted that most security best practices include preventive
measures for the users, but limited information is given, resulting in an ineffective way of
presenting the information. Previous research from Gartner (2002) explored by Ivaturi

60
and Janczewski (2013) showed that community banks would need to examine their
security policies, learn how customers access their accounts, and provide technical
countermeasures to protect the bank's internal and external security protocols. Ivaturi and
Janczewski explained that most of the research presented is invalid and only gives the
banks general information, and the results need information. Ivaturi and Janczewski
explored the gaps in their literature and found a framework to allow banks to assess
reports and show the best security practices existing and emerging social engineering
attacks.
Opara and Etnyre (2010) discussed the network enterprise systems and how they
need to be reliable, flexible, and secure, so public and private information to users is
secured and trusted. Identity thief affected 90 million Americans and cost roughly $173
billion in 2005, reported by the Federal Trade Commission (Opara & Etnyre, 2010).
Opara and Etnyre (2010) surveyed access users' perception and understanding of the
importance of a reliable authentication system. The survey was distributed randomly to
Business Intelligence professionals at a symposium in Atlanta, Georgia. Out of 644
questionnaires distributed, 201 reviews were completed, and 17 rejected for lack of
completion. The authors noted that participants did not get offered any incentives to
complete the survey. The Australian Banks investigated 16 banks in the area and found
deficiencies in Internet banking security (Subsorn & Limwiriyakul, 2012). The Australian
banks' theory revealed the system was comprised because of affected customer's
information getting stolen. Vanathi, Shanmugam, and Uthairaj (2016) discussed the
advanced mobile security system for e-commerce and how users provide high-level

61
secure, friendly m-commerce transactions. Vanathi et al. analyzed different genders using
the Neural Network that uses the m-commerce applications and forecasts the demand
accordingly. Vanathi et al. used a quantitative method to analyze the multilayer
backpropagation neural network for gender classification analysis.
Online Banking Systems
There is a strong need for secure systems, especially since banks have e-banking
systems for clients and customers. The bank's online system needs to be protected during
the initial login process and after the customers have login because e-banking systems
depend on the overall opinion of the customer's perspective of their bank's system. Even
though risks are involved with online banking, banks will need to grasp how the customer
looks at the security and safety of the services they use from the bank. E-banking systems
are not controllable and have less validity during bank transaction errors, especially when
customers log in to bank transactions (Tassabehji & Kamala, 2012). A report by Experian
explained how 88% of customers use mobile banking apps to perform banking
transactions, and they believe banks are protecting their data (Gonzalez-Cotto, 2018).
Strategies such as geolocation, Internet Protocol (IP) masking, biometric technology for
authentication are just some of the mechanisms that are recommended to banks for
security (Gonzalez-Cotto, 2018).
The 2016 Data Breaches and Customer Loyalty report revealed that customers
focus on the organizations holding their data and not themselves (Sharma, 2017). A
previous study showed that in many countries, 70% of customers felted that it was the
companies' job to secure customer's data from cybersecurity threats (Sharma, 2017).

62
Previous research showed that over 51% of customers reuse the same password across
different websites (Alhothaily et al., 2017). More than 77% of the customers either
slightly changed or reuse the same existing passwords (Alhothaily et al., 2017). This
common practice is a serious issue and can lead to security risks such as insider attacks.
ThreatMetrix, a global cybersecurity company used by banks for the authenticity of
digital transactions explained how 210 million attempted attacks were made on banks'
networks during the first quarter of 2018 (Yurcan, 2018). There has been an increase of
211% of fake account attempts in 2017 through mobile device use (Yurcan, 2018).
The average U.S. customers choose to use biometric options over passwords, and
over 79% stated they would only use biometrics to access their bank account (Biometric
Technology Today, 2017). Also, 42% of customers said they would not use a bank or
payment application that does not support biometric technology (Biometric Technology
Today, 2017). According to Juniper Research, mobile payment using biometric
technology will continue to rise by over 2 billion in 2017 compared to 600 million from
the previous year (Biometric Technology Today, 2017). Over 4.8 billion data records
were exposed since 2013, with identity theft being the top data breach situation, which
accounted for 64% of the data breaches. A previous study showed fraudulent use of
financial data that affected 21% of customers (Sharma, 2017). In contrast, 15% of
customers has personal details taken, 14% had identity theft, and more than 36% was a
victim of malicious attacks via online services, 34% experience clicking on a bad link,
and 33% were phishing incidents (Sharma, 2017).

63
Online Trust with Customers
Mobile devices are becoming the first choice for customers to check their bank
accounts. Since customers are using mobile apps to perform transactions, community
banks work with mobile devices providers to provide biometric authentication as an
option for account access. D'Arcy et al. (2014) used an online survey of 539 employees'
users to learn about the SRS coping theory. To measure the responses, the authors used a
series of questions designed to measure moral disengagement, perceived sanctions, and
intention related to the Internet service provider issues depicted in the framework. For
data analysis, the authors used SMARPLS as the primary statistical tool for measurement
and structural models. Previous research showed the excellent withdrawal of customers
mediates the relationship between customer's differences and improper behavior. D'Arcy
et al. (2014) suggested they recognized potential connections between the customer's
security-related stress (SRS) measurements and the multidisciplinary teams (MDT)
categories. Security policies were researched by Ivaturi and Janczewski (2013), and they
explored the best practices of online mobile banking by testing the security information
on their software. Hackers use phishing attacks and social engineering methods to gain
knowledge from people so they can potentially steal personal data and use their data to
gain access to other people's accounts.
Biometric Technology Identification Methods
Since many customers are using mobile services, promoting biometric technology
is essentials for community banks to compete with other banks to retain customers. In the
early 2000s, banks had some issues with the first models of fingerprint technology

64
because of the separate hardware pieces with mobile devices. However, today's mobile
devices have more reliable platforms where all data, including biometric features, can be
integrated and accessible by applications (Crosman, 2014). Developers pointed out the
agile approach of security features with mobile devices and biometrics was the main
topic because of each transaction's trust and risk probabilities (Waggett, 2016). The
customer's bank transactions determine how biometric data was used for risk purposes
(Waggett, 2016). The U.S. National Science and Technology Council Subcommittee
(NSTC) has classified biometric and two types: physiological and behavioral biometrics
traits (Handa et al., 2018). Authentication gets classified into two types, which are static
authentication, and continuous authentication, and they are essential for any trustworthy
computing system of many security protocols (Handa et al., 2018). Continuous
authentication is where the customers are continuously authenticated even after the login
process is complete (Handa et al., 2018). It removes the requirement of frequent logout
and logs in during transactions (Handa et al., 2018).
Information security services have five main processes that identify, authenticate,
ensure confidentiality, and are nonrepudiation (Tait, 2019). After getting feedback from
customers, MasterCard presented a new multi-factor authentication for customers using
facial recognition and fingerprints to get into their accounts (Waggett, 2016). Because of
competition, banks are provided benefits to their customers by offering online services,
and this allows the bank to give the customers more convenience and assurance of their
account (Yoon & Steege, 2013). Online use by customers expand because of online
shopping, and customers wanted to check their accounts and apply for services online

65
(Yoon & Steege, 2013). Understanding customers' mindset is a critical part of achieving
online and mobile safety of banks' apps. Internet crimes estimated that over 480 million
dollars were lost, and the Crime Complaint Center (IC3) reported that in 2011, there was
a 3.4% increase in security complaints. Despite security complaints, customers continue
to use online and bank transactions regardless of security issues.
Kaman et al. (2013) explored the two-factor authentication (Two-FA) system with
machines and devices (tokens and ATM), and this process has reduced customer's
credentials. During mobile bank apps, the biometric scanning tools rely on three
authentication features: things you know, stuff you have, and who you are. Kaman et al.
discussed how banks use different measures so customers could access their systems.
Kaman et al. used a literature survey to show how many efforts were put in place for
security measures. Still, the authors proposed the Two-FA systems for banks to use a
combination of security methods, like something you know and something you are.
Kaman et al. showed that the authentication system is secure, and customers do not have
to carry separate information like tokens and ATM cards for authentication. Crawford
and Renaud (2014) used a quantitative research method, and the independent variable for
the study is the extent of transparent authentication the user sees, whether high, moderate,
or low-level. A survey by Crawford and Renaud's showed that 30% of participants used
no security method on their mobile devices and over 90% of participants stated use
transparent authentication methods.
Alotaibi et al. (2015) measured performance by the False Acceptance Rate (FAR),
False Rejection Rate (FRR), and Equal Error Rate (EER) to show accurate and better
66
performing system's needs. Alotaibi et al. discussed previous literature and explained
how some studies investigated the practicability of using behavioral characteristics as a
transparent authentication method for mobile device security. Alotaibi et al. (2015) use a
qualitative approach, and it was more of an informative research paper. The studies
showed that behavioral characteristic is a practicable construct for customers' behavioral
profiles during transparent and continuous authentication while the customer uses the
mobile device. Alotaibi et al. discussed how research only finds suitable behavior
patterns for the appropriate transparent authentication method. Alotaibi et al. explained a
lack of investigation and study of behavioral profiling and application use for open
authentication systems on mobile devices. Authentication is critical for online
authentication and validating customer's identification through mobile devices. With
constants, failures, and security breaches, biometrics and traditional authentication offer
several benefits over the current authentication method.
Mobile Banking Gaps
Mobile banking is an emerging topic, but the understanding of mobile banking
characteristics, such as information content and the impacts on customers’ attitudes and
transactions, are limited (Sreejesh et al., 2016). The acceptance rates between smaller
banks and larger banks are major gaps in mobile banking (Thusi & Maduku, 2020). There
is limited research on customer’s evaluation of mobile banking perceived privacy
concerns of how their attitude towards transaction intentions of mobile banking (Sreejesh
et al., 2016). Because of the limited literature on mobile-banking, this poses challenges
for bank managers who are trying to understand the intention of the transaction and

67
repeat use of mobile-banking (Sreejesh et al., 2016). Previous research examined the high
demand mobile-banking solution and its advantages over other electronic mediums
(Sreejesh et al., 2016). Over 92% of the top 25 banks are offering mobile banking, so
smaller banks and credit unions risk losing customers, especially the customers who use
mobile devices (Javelin Strategy & Research, 2012).
Previous research included technology acceptance, time of adoption, adopter
categories, and innovation diffusion rate, which explained that mobile-banking represents
the new-innovation of service delivery (Sreejesh et al., 2016). Providing mobile banking
solutions offers many services for customers. Previous literature showed how innovations
fall short in research areas: (a) like research in technology adoption and acceptance, (b)
prior innovation overlooked service innovations, (c) previous literature disregards
demographic roles in customer decisions relating to service innovation, and (d) prior
studies stated that service type offered plays an important role in customers adoption
decisions (Laukkanen, 2016). Attracting the right demographics is a crucial challenge for
smaller community banks. The typical mobile banking customer is young, between the
ages of 18 through 44, with an ethnic background of usually Asian, Latino, or African-
American, and with over $75K in earnings (Javelin Strategy & Research, 2012).
However, the regional and community banks and credit unions have different
demographics with older, less wealthy, Caucasian, and less tech-savvy (Javelin Strategy
& Research, 2012). Community banks must expand their services to appeal to a broader
range of demographics to attract new customers if they want to compete and succeed in
today’s mobile banking market (Javelin Strategy & Research, 2012).

68
Summary and Conclusions
Throughout the literature review, I analyzed the UTAUT model, which was used
to determine technology acceptance and use and is a valid research tool. Furthermore, I
reviewed the UTAUT four constructs PE, EE, SI, and FC. I checked the UTAUT
constructs' extension, PC, and TTF, highlighting the critical security and privacy of
customers and stakeholders' assets. During my research, many previous works of
literature work under the UTAUT, PC, TTF, survey approaches, Information assurance
security theory, and biometric technology with mobile devices. Providing scholarly
research to address biometric technology use and acceptance is necessary for community
banks to provide a more secure transaction during mobile banking.
The method of biometric technology addressed many security issues occurring
during e-banking security. Because of the rise of cyber-crimes electronic banking is
changing, and bank managers decide to help prevent or stop hackers. Bank managers are
trying to address the security issues by enhancing the bank's security system because of
credit card or other security-related issues. Little information is known on customers' use
and acceptance of biometric technology, so the baking industry is looking into new ways
intruders attack their system. However, even though banks have integrated their banks'
apps with other manufacturers' biometric scanning tools, some banks still do not have
mobile apps to encrypt customers' information. The study used a research question based
on the survey method, the UTAUT theoretical framework, and the extension of the
UTAUT. The goal is to justify the benefit of biometric technology, the use and
acceptance of customers, and the gaps in the related literature.

69
Chapter 3: Research Method
This quantitative questionnaire survey developed an understanding of the
relationship between customers' acceptance and use of biometric technology with mobile
banking. The specific problem is the lack of adoption of biometric technology by
customers and bank managers do not understand the factors that influence mobile
banking apps in the Mid-Atlantic region. Chapter 3 addresses the research question and
present an overview of the research design, methodology, population, sampling
procedures, measures, data collection process, and the research that I have completed.
Research Design and Rationale
The research design demonstrates how research incorporates different scientific
goals and data collection and analysis (Ridder, 2017). Previous research explained how
research designs primarily focus on the aims, uses, purposes, intentions, and plans of the
researcher (Almalki, 2016). Rea and Parker (2014) explained how researchers must
identify participants' critical characteristics by using focus groups to establish potential
participants in research designs. Research designs deal with the approach, purposes, and
methods of how researchers' knowledge and theoretical perspectives will reveal questions
and collect and analyze data (Almalki, 2016). Having a research design helps researchers
be cognizant of the bias they bring to the research and choose the tools they use to collect
data (Almalki, 2016). There are three distinct approaches to presenting research:
quantitative, qualitative, and mixed methods. Makrakis and Kostoulas-Makrakis (2016)
explained how positivist and objectivist philosophies drive quantitative studies.
Qualitative studies are conducted using phenomenological, social-constructivist, inter-

70
subjectivist, and interpretivism philosophy (Makrakis & Kostoulas-Makrakis, 2016). The
combination of quantitative and qualitative methods addresses sustainability, and a wide
range of data must be collected using mixed-method research methods (Makrakis &
Kostoulas-Makrakis, 2016).
In quantitative research, researchers use a hypothesis statement to show
independent and dependent relationships between two characteristics call variables that
represent exhaustively and corresponding data (Frankfort-Nachmias & Leon-Guerrero,
2015). In the quantitative methods, hypotheses are tested, and statistical information is
analyzed in the usual methodological foundation (Ridder, 2017). The research question
guides the topic in a quantitative method, and when all the tangibles are selected, the
stage is to figure out how to measure the variables and data collection (Guo & Yang,
2018). Statistics is the information used in many disciplines to interpret and learn the info
gathers (call data), which is used as a statistical method to understand and learn from
people's research. Statistics is a procedure used by social scientists to organize,
summarize, and communicate data (Guo & Yang, 2018). While looking at statistical data,
the visual presentation of quantitative evidence is an informative way to show data in a
more readable and logical form: researchers' use statistical information in charts to teach
organization, quick summary, and visual communication for data interpretation (Guo &
Yang, 2018).
Quantitative methods use scientific samples as research surveys, and the sample
survey results reveal more reliable results (Rea & Parker, 2014). However, qualitative
focus group research is known to have an unknown degree of accuracy (Rea & Parker,

71
2014). When deciding on quantitative research, the researcher must understand the logic,
rationale, and actions, which guide both study designs and how data are analyzed (Norris
et al., 2015). In qualitative methods, the researcher is the instrument, and this is an
advantage for some research projects because the information can be explained with more
valid points. In qualitative approaches, the goal is to get a subjective meaning and
multiple viewpoints (Hesse-Biber, 2016). Qualitative research uses interviews,
observations from fieldwork, and documents in the data recording process. Qualitative
research methods are use when researchers want to explore problems or issues and
provide more meaning by directly involving the participants in data collection.
The distinction between quantitative and qualitative research is that qualitative
methods are less confirmable, meaning they do not use or test a hypothesis but instead
explore and discover participants' viewpoints (Hesse-Biber, 2016). Mixed methods
designs are a combination of quantitative (numbers) and qualitative (nonnumerical)
methods, where each is usually of equal status (Hesse-Biber, 2016). When using mixed
methods, the researcher often aims to triangulate their findings by giving priority to both
quantitative and qualitative data while collecting both types of data simultaneously but
separately (Hesse-Biber, 2016). The primary goal of mixed-methods is to validate the
findings by combining the discovery of quantitative and qualitative information to
determine if the two different methods yield agreeable or disagreed results (Hesse-Biber,
2016). This study used a quantitative research approach to test the proposed research
model so the research can be replicated and analyzed and compared with similar studies.

72
As risk mitigation for banks, training customers on biometric technology, like
multimodal, continuous, two-factor, and additional encrypted authentication solutions,
will help customers trust and use new technology. The goal is to make sure customers are
comfortable using biometric technology to adjust to new security features. The first
development for community banks is to roll out bank apps that have biometric
technology capability. Early biometric technology events had some issues because the
devices were purpose-built, cumbersome, and expensive to buy and operate (Waggett,
2016). However, current mobile devices have expanded with more high-quality biometric
devices for customers (Waggett, 2016). The second development for biometrics is for
banks to set up security protocols to detect and defeat spoofing attacks (Waggett, 2016).
The third step is improving the capability to keep sensitive data, such as biometric data,
safe and private, and the fourth is the big data solution for authentication approaches
(Waggett, 2016).
Community banks learn from business analytics to improve operations and
introduce new risk-based security approaches to help customers have frictionless login
attempts. This study's research plan was quantitative research using a survey research
design to measure before and after occurrences. The approach used a web-based
questionnaire survey for examining community bank's customers' use of biometric
technology with its bank application. The research question asked how customers view
biometric technology with mobile devices, specifically mobile banking apps. In this
study, I looked at several community banks and colleges to examine how participants use
and accept biometric technology with mobile banking apps, as well as how community
73
banks used biometric technology to prevent unauthorized users from gaining access to a
customer's bank account. I also explored the challenges, security, and difficulties and
measure how banks use biometric scanning tools with their bank application. The
demographic data were collected from locations that use mobile devices and biometric
scanning tools.
The purpose of biometrics scanning tools (used with the traditional login process)
is to create multilayer security through physical or behavioral characteristics, minimizing
security violations by unauthorized attackers. Therefore, banks making security systems
require the highest safety, which are the traits of the individual accessing the account,
which could reduce illegal attacks.
Methodology
I used similar research for the theoretical model in technology acceptance and
behavior intentions (Tarhini et al., 2016) by deploying a quantitative research approach to
test the proposed research model. A theoretical framework was developed by extending
the UTAUT by incorporating two additional factors: PC and TTF. A web-based
questionnaire containing 38 questions (see Appendix I) was used to collect a purposeful
random sample from the current mobile banking customers in the Mid-Atlantic area. I
collected data from bank customers from three colleges and three community banks in
the Mid-Atlantic region from October through December 2020. The participants selected
for the study were analyzed because they (a) are bank customers who use mobile banking
at a community bank and (b) use biometric technology as an authentication method with
their bank's application. In this study, collecting data from random sources (like

74
participants in coffee shops, malls, and grocery stores) was not plausible because it is
logical to expect the experiences of the participants represent what most mobile banking
customers would experience.
In web-based technology, some researchers proved that web-based applications
are ready to adopt certain behaviors if they are easy to use (Maharani et al., 2017).
Tarhini et al. (2016) found that PE, EE, SI, and FC to be a valuable and valid research
tool that is a predictor of adoption behavior and BI. In a previous study, PE, EE, SI, and
FC were discovered to influence behaviors to use new technology, and BI and FC
determine technology use (Al-Harby et al., 2010). Other researchers prove that PE, SI,
FC, PC, and TTF are significant predictors in influencing customers' BI to use technology
(Tarhini et al., 2016); Venkatesh et al., 2016). Venkatesh et al.'s (2003) research proved
that PE, EE, SI, and FC are useful predictor tools of adoption behavior and BI. Also, PE,
EE, SI, and FC are direct determinants of use intention and behavior, and FC are direct
determinants of user behavior (Venkatesh et al., 2003). A self-report questionnaire will
measure the AU because it was not feasible to capture the system's AU through the
customers' logfile.
A questionnaire survey was suitable for this study to collect a sample of bank
customers who use or intend to use biometric technology with mobile banking.
Therefore, a questionnaire survey was appropriate because it was used for a portion of the
total population. The web-based questionnaire survey had open-ended and closed-ended
questions for the study. The web-based survey used a Likert scale format, with some
open-ended questions where the participant could supply their answers. Closed-ended

75
questions can be presented in multiple forms, like true or false, yes or no, or multiple-
choice formats (Hahn, 2018). Open-ended questions want the participants to provide their
answers by filling in a blank section or writing a statement (Hahn, 2018). The
information collected from the questionnaire can be multiple-choice, fill-in-the-blank,
rating scales, or open-ended questions combined and analyzed by researchers to create a
better understanding of a large group or population (Hahn, 2018).
I used analysis of variance (ANOVA) to test the significance and the correlation
ratio E² and the measure of association Eta to measure the associations of the independent
variable on the nominal scale and the dependent variable on the interval scale. The Eta is
a correct measure of association when the independent variable is on the nominal scale,
and the dependent variable is on the interval scale (Rea & Parker, 2014). ANOVA,
developed by Ronald Fisher in the 1950s, is a method for testing the statistical
significance of different means in three or more groups (Webster & Lark, 2018). The
association's measure reflects the strength of the relationship; between two or more
variables and is very descriptive to indicate the power of a relationship (Rea & Parker,
2014). Therefore, showing UTAUT constructs' connection helped understand if a
relationship may or may not exist. Thus, a questionnaire survey was suitable for
exploring the independent and dependent variables (see Table 2) associated with adopting
biometric technology with the bank's mobile application. I used multiple linear regression
analysis to understand the relationship between the variables by fitting them in a linear
equation to observe the data. The use of multiple regression analysis evaluates the
76
consequences of two or more other variables against the variance that exists in the data
(Rea & Parker, 2014).
No control group was used in this study, so an experimental or quasi-experimental
design is not suitable. As explained by Pattison et al. (2019), experimental and quasi-
experimental designs are used with studies that focused on cause-and-effect relationships
rather than how or why some effect occurs in a relationship. An experimental or quasi-
experimental design aims to control the potential causes in an environment to reduce or
remove alternative explanations for an observed result (Pattison et al., 2019). A control
mechanism for the independent variable significant threats to validity is alternate in
experimental and quasi-experimental designs (Osborn, 2019). Researchers use a quasi-
experimental design to examine the effects of social phenomena that experiments cannot
investigate (Osborn, 2019). Therefore, a quasi-experimental was not appropriate because
the investigation did not use control and experimental groups.
A correlation design was not appropriate due to some validity weakness when
controlling plausible rival alternative hypotheses (Osborn, 2019). A true experiment is
where random assignments are made in the project, and participants get put into a group,
so no systematic bias in assigning individuals (Abidah et al., 2017). Since a true
experiment is randomly assigned, it’s was not appropriate because the participants are not
assigned to a control group. However, while exploring the research problem, I looked at
millennium college students to help the investigation give the best results. Also, critical
thinking played a significant role in the approach to the research strategy. The audience

77
of this study was community bank customers with mobile banking accounts who use
biometric technology.
Population
The United States has nearly 5,000 community banks with active charters across
all 50 states (Bostic & Johnson, 2020). The participants were customers from over 500
local community banks within the Mid-Atlantic area of the United States (Bank
Strategist, 2020). The general population was from community banks in the Mid-Atlantic
region that use biometric technology with their mobile bank apps. The population used
biometric technology to access many technologies related devices to access community
bank's apps key to customers and stakeholders who need access to daily information.
Incorporating feedback from customers and stakeholders throughout the design process
ensures that biometric technologies have the best chance of achieving success (Lappi &
Mole, 2018). The population that used biometric technology is from community banks
that use biometric technology to access their banking information. The target population
of this study included bank customers of different genders, ages, marital status, education
level, employment status, and income. Also, the goal was to give bank customers more
information on the benefits of using biometric technology with mobile banking.
I explored community banks for this study due to customers requiring less
physical interaction with bank branches, payment methods, and point-of-sale (POS)
terminals. Community banks face more challenges in growing deposits compared to
larger banks (Schuld, 2020). By combining with strong technology partners, community
banks can simplify support and operations to narrow the deposit gap while expanding

78
their customer relationships (Schuld, 2020). The evolution of mobile banking is
perceived as slow but is estimated to continue to grow due to the vast revenue
opportunities of this fast-growing segment (Evon & Leby Lau, 2016). In this study, my
goal was to help community banks expand their mobile network and collaboration with
customers virtually. Also, I wanted to give bank customers more information on the
benefits of using biometric technology with mobile banking.
Sampling and Sampling Procedures
I used a purposeful random sample of participants who meet the following
criteria: (a) over the age of 18, (b) have a banking account, (c) use a bank with a mobile
application, (d) the bank has biometric technology set up with their application, (e)
participant must use mobile devices, and (f) participants must use biometric technology.
A purposeful sample is designed to help the researcher understand the problem, the
research question and reduced judgment (Benoot, Hannes, & Bilsen, 2016). In
quantitative methods, the objective is to protect information obtained from a delineation
population from which the sample was drawn to avoid Type I and Type II errors
(Palinkas et al., 2015). Purposeful random sampling methods are intended to increase
efficiency and increase validity (Palinkas et al., 2015). Reaching many participants can
be challenging during the sampling, so purposeful sampling makes reaching participants
easier with technology. Gathering data from every member of a population is
challenging; therefore, using samples of individuals from a population of interest will
help with research studies (Zhang et al., 2019). A link was sent to the participants using
an anonymous self-administered online survey.

79
In this study, I used a purposeful random strategy to increase the results'
credibility (Palinkas et al., 2015). In previous research, purposeful sampling attempts to
reduce judgment within a purposeful category (Benoot et al., 2016). A key argument with
purposeful sampling approach is how it screens all potential participants' responses and
examines the complexity of different conceptualizations and not just the correct answer
(Benoot et al., 2016). Previous studies have shown that demographic trends show young
adults increased differentiation from older adults, and they are more adaptive to the
changing environment and urban settings (BouMjahed & Mahmassani, 2018). Purposeful
random sampling was an excellent strategy for this exploratory investigation on biometric
technology with mobile banks. Purposeful random sampling is a good strategy for this
investigation because of millennium adults buying power, security demands, and their
technology adoption (Enam & Konduri, 2018). Additional sampling methods were
considered but were not selected were convenience sampling and stratified sampling.
The convenience sampling strategy gets used to collect information from
participants who provided easy access to the researcher (Palinkas et al., 2015). Stratified
sampling gets used to capture a major of participants rather than identify a more
influential group (Palinkas et al., 2015). Convenience or stratified sampling was not
appropriate because the investigation needs to have selected groups to validate the study.
The samples were drawn from mobile banking customers through a web-based survey
questionnaire. Using a vast and diverse data collection investigating biometrics enables
the advancement of technology and the science of biometrics authentication. The results
provided a guide for decision-makers on how to use biometric systems in the field (Yang

80
et al., 2018). I used the G*Power software version 3.0.10 to calculate sample size using a
priori power analysis using alpha, statistical power, and effect size. The G*Power is an
open-source power analysis program for a variety of statistical tests. A priori analysis is
used for sample sizes computed as a function of user-specified values for the required
sample level alpha, the statistical power 1- B, and the predicted population effect size
(Faul, Erdfelder, Buchner, & Lang, 2009). The test family was an f-tests, and the
statistical test was a linear multiple regression fixed model r2 increase correlation point
biserial model. A priori analysis with this effect size revealed that we needed a sample
size of N = 228 to achieve a power of .95 in a test based on alpha = .05. See Appendix G
and H for the G*Power illustrations of sample sizes using the power analyses process.
Procedures for Recruitment, Participation, and Data Collection (Primary Data)
I collected data using a survey questionnaire created in a web-based format. I will
use closed questions for the Likert scale to measure how customers feel about the
technology, services, or experiences with biometric technology with mobile banking. For
closed questions, I used the 5-point Likert scale in which 1means “strongly agree, 2
means “agree,” 3 means “neutral’, 4 means “disagree,” and 5 means “strongly disagree.”
Using software tools like LimeSurvey, SPSS, and other similar software types were used
for data analysis and organization of data. Demographic data were collected through the
local colleges and the Independent Community Bankers of America (ICBA) website to
evaluate the bank’s mobile banking application security features in the Mid-Atlantic
region.
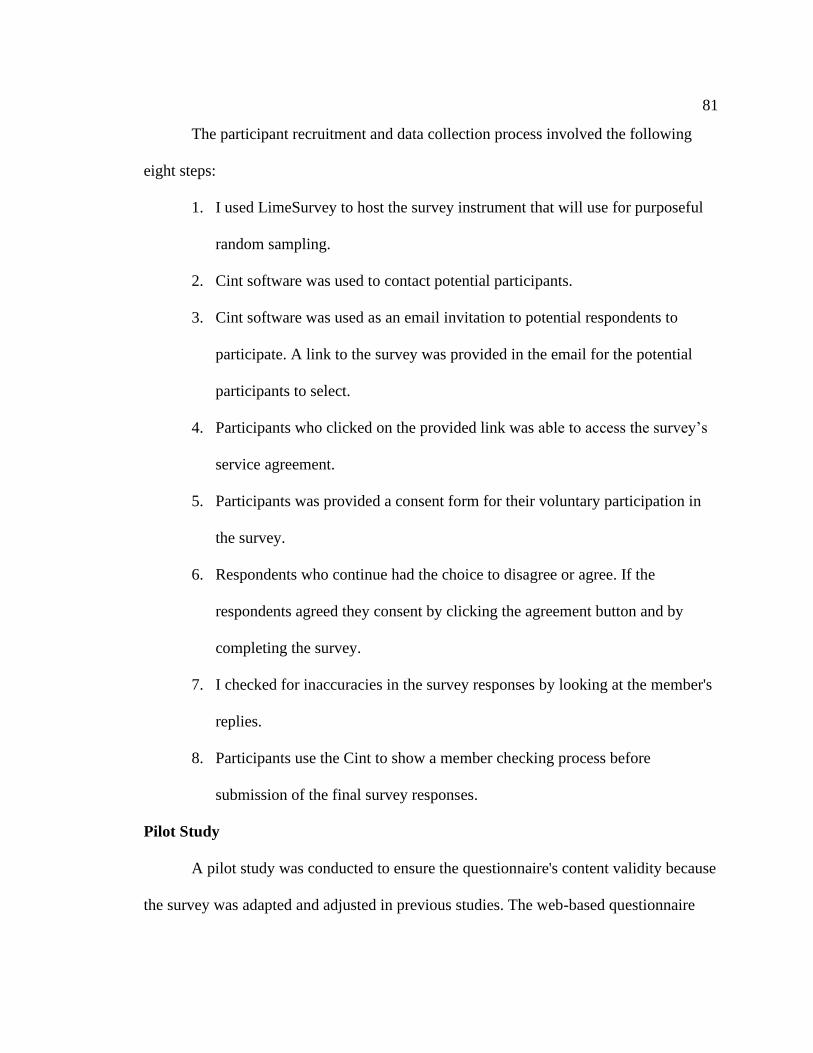
81
The participant recruitment and data collection process involved the following
eight steps:
1. I used LimeSurvey to host the survey instrument that will use for purposeful
random sampling.
2. Cint software was used to contact potential participants.
3. Cint software was used as an email invitation to potential respondents to
participate. A link to the survey was provided in the email for the potential
participants to select.
4. Participants who clicked on the provided link was able to access the survey’s
service agreement.
5. Participants was provided a consent form for their voluntary participation in
the survey.
6. Respondents who continue had the choice to disagree or agree. If the
respondents agreed they consent by clicking the agreement button and by
completing the survey.
7. I checked for inaccuracies in the survey responses by looking at the member's
replies.
8. Participants use the Cint to show a member checking process before
submission of the final survey responses.
Pilot Study
A pilot study was conducted to ensure the questionnaire's content validity because
the survey was adapted and adjusted in previous studies. The web-based questionnaire

82
was created in English and reviewed for content validity. The questionnaire was adopted
from previous research for validity and reliability from the well-developed UTAUT
model with two more constructs, the PC, and the TTF questions (see Appendix I). The
Walden University Institutional Review Board (IRB) approval number for this study is
07-28-20-0409920, approved on July 28th, 2020, and valid for one year from the
approval date. The Walden's IRB approval process was critical to ensure the university's
ethical standards and U.S. Federal regulations are being upheld to protect human research
participants and their data. The items were tested for validity and reliability, and the
questions were modified to fit my specific study (see Appendix D, E, and F for author
permission to use models).
Referring to Tarhini et al (2016), Oye et al. (2014), Venkatesh et al. (2016) this
research in operationalized performance as the extent to which an individual believes that
adopting mobile banking using biometric technology will benefits them when performing
bank services, operationalized effort expectance as the measure of effort that customers
deal with technology use, operationalized SI as the extent where customers will perceive
what is distinguished from other people who think they should use similar technology,
and think they should use a similar technology feature or device, operationalized FC as
the extent to where customers' perceptions of the resources and services available to
perform a service, operationalized PC as the extent to where a person believe that
security and trust are the measures a person behavior to use mobile banking, and TTF as
the extent to where a person believes how the technology fits their daily needs.

83
To ensure the content validity of the web-based survey questionnaire used in this
study to assess each construct (see Appendix I). All items regarding the constructs'
measurement were adapted from the well-developed UTAUT model and two more
constructs, the PC and the TTF questions. The questions were carefully selected and
reworded to fit mobile banking adoption using biometric technology in the U.S Mid-
Atlantic region. The questions were adopted from the UTAUT model, and two additional
constructs PC and TTF (see Appendix I). A pre-test was conducted, and three
modifications of the survey were created because of visual errors, grammar, and content
validity. A pilot test was conducted with five customers randomly chosen, so revisions
and modifications of the questionnaire content could be established for validity and
reliability. Therefore, some of the adopted question items were reviewed and modified
based on the pilot-test results. See Appendix J for a summary report of the pilot study
questions for evaluation.
Instrumentation and Operationalization of Constructs
In the study, I used a self-administered web-based questionnaire containing 38
questions (see Appendix I) for a purposely random sample from customers who use
mobile banking in the Mid-Atlantic region of the United States for data collection. All
scales from this study were adopted from the existing studies related to the UTAUT and
previous empirical studies related to the TTF and PC to preserve those items' validity and
reliability. Specifically, PE, EE, SI, FC, and BI were measured using four items. PE, EE,
SI, FC, and BI corresponding items were adapted from Venkatesh et al. (2003) and
related work (Tarhini et al., 2016; Venkatesh et al., 2012). Also, five items for the AU

84
were adapted to show customers' use (Venkatesh et al., 2003, 2012). Also, the TTF was
measured using six items, and the scale was adapted from the work of Tarhini et al.
(2016). Finally, seven items were adapted from Tarhini et al. (2016) to measure the PC.
A pilot study was conducted using a web-based questionnaire of 42 bank customers;
however, they were not included in the final survey.
A five-point Likert scale was used, ranging from strongly disagree to strongly
agree, and measured the items that represent each construct within the proposed research
model. A web-based questionnaire containing 38 questions (see Appendix I) was used to
collect a purposeful random sample from the mobile banking customers in the Mid-
Atlantic region of the United States. In previous studies by Tarhini et al. (2016) and Chao
(2019), a pilot study was done, and it took the participant 10-15 minutes to complete the
38 question survey questionnaire. The second section of the survey contained
demographic information presented on a nominal scale. The questionnaire collected
necessary information about the respondent's characteristics, including age, gender,
education, employment and experience with mobile banking with biometric technology.
The UTAUT model Venkatesh et al. (2003) instrument was used to determine the
strength of predictors for mobile bank customer's intention to accept and use biometric
technology with mobile banking apps for security. Also, Tarhini et al. (2016), extending
the UTAUT instrument, was used to understand the customer's acceptance and use of
biometric technology with mobile banking (see Appendix A). In previous research,
Venkatesh et al. used the same UTAUT instrument to collect data in their study on
information technology acceptance models. Also, Tarhini et al. used the same instrument

85
by extending the UTAUT to collect data in Lebanon's Internet banking research. Earlier
studies showed acceptance determinants for information technology (Venkatesh et al.,
2003). Venkatesh et al. used eight prominent models (TRA, TAM, MM, TPB, PC, IDT,
Combined TAM, and TPB and the SCT) to explore over four organizations, and the eight
models explained 17% and 53% of the variance of user intentions to use information
technology. Even with the success of the eight models, Venkatesh et al. established the
UTAUT, focusing on intention and use, and the UTAUT outperform the eight individual
models of r2 of 69%. The UTAUT model confirmed again with two other organizations
with similar results of r2 of 70% (Venkatesh et al., 2003).
I explored the relationship between the acceptance and use of biometric
technology within the mobile banking application and PE, EE, SI, FC, PC, and TTF. The
variable was measured separately with a specific hypothesis.
Research Question: To what extent do performance expectancy, effort
expectancy, social influence, perceived credibility, task-technology fit, and
facilitating conditions affect the BI of customers to adopt biometric technology
with mobile banking?
H10: Performance expectancy will not affect customers’ behavioral intention to
use biometric technology with mobile banking.
H11: Performance expectancy will affect customers’ behavioral intention to use
biometric technology with mobile banking.
H20: Effort expectancy will not affect customers’ behavioral intention to use
biometric technology with mobile banking.

86
H21: Effort expectancy will affect customers’ behavioral intention to use
biometric technology with mobile banking.
H30: Social influence will not influence customers’ behavioral intention to use
biometric technology with mobile banking.
H31: Social influence will influence customers’ behavioral intention to use
biometric technology with mobile banking.
H40: Perceived credibility will not affect customers' behavioral intention to use
biometric technology with mobile banking.
H41: Perceived credibility will affect customers' behavioral intention to use
biometric technology with mobile banking.
H50: Task-technology fit will not influence customers’ behavioral intention to use
biometric technology with mobile banking.
H51: Task-technology fit will influence customers’ behavioral intention to use
biometric technology with mobile banking.
H60: Facilitating conditions will not influence the actual usage of biometric
technology with mobile banking.
H61: Facilitating conditions will influence the actual usage of biometric
technology with mobile banking.
Hypotheses 1 through 6 will get tested by running the following multiple regression
model:
BI = β0 + β1PE + β2EE + β3SI + β4PC + β5TTF + β6FC + €. (1)
Where:

87
- BI is the dependent variable
- β₀, β₁, β₂, β₃, β₄, β₅, β6 are the regression coefficients
- PE, EE, SI, PC, TTF, and FC are the independent or predictor variables
- € is the error term
- See Table 1 for independent and dependent constructs.
- See Table 2 for the constructs’ roles
- See Table 3 for the constructs’ hypotheses and directionality of the constructs
Figure 4
Research Model
Note. From Consumer Acceptance and Use of Information Technology: Extending the
Unified Theory of Acceptance and Use of Technology, by V.L. Venkatesh, J.Y., Thong,
and X. Xu, 2012, 36(1), 157-178. Copyright 2012 by Venkatesh, Thong, Xu. Reprinted
with permission.

88
I outlined the UTAUT and extension of the UTAUT instrument in Appendix A.
Also, I presented the invitational email in Appendix C. I will use the UTAUT and
expansion of the UTAUT instrument to assess the following aspects of biometric
technology with mobile banking.
• Barriers and obstacles to biometric technology adoption
• Potential benefits of biometric technology adoption
• Prevalence and status of biometric technology in commercial banks
• Conditions that facilitate biometric technology adoption.
I asked bank customers to respond to items in each of the above areas by using a
5-point Likert scale that recommends acceptance of the statements.
Data Analysis Plan
Using different biometric scanning tools on how the data gets collected can reveal
needed information to advance technology and science (Yang et al., 2018). The data
collected results provided a road map for decision-makers on how to proceed with
implementing biometric scanning tools (Yang et al., 2018). Using a sample database for
large and unbalanced samples is recommended for a research study (Mehrotra et al.,
2016). Collecting biometric scanning tool samples in the United States was approved by
the IRB for human subjects’ agreements (Yang et al., 2018). Sampling a population can
be valuable to community banks and other financial institutions because it can provide
up-to-date information on issues and help banks make financial decisions on security
technology (Adapa & Roy, 2017). The banking industry goal is to share data and

89
consolidate while bank managers must give details on new trends and provide accurate
and valid data to stakeholders (Adapa & Roy, 2017).
The bank customer was 18 or over who use mobile banking conversant with
biometric technology from the Mid-Atlantic region. The general population consisted of
two-hundred twenty-eight to two-hundred-fifty participants, and this was a reasonable
number of participants to make my research reach saturation. Data Collection was from
mobile banking customers in the Mid-Atlantic region of the United States, and the data
were collected using the web-based survey questionnaires. Obtaining data for an
investigation is a critical component to the success of a study. I used the electronic
questionnaire to implement the survey with the volunteer participants. The electronic
questionnaire survey was used to support the research's finding by focusing on specific
information collected from participants. This study's goal was to achieved success by
crucial observation of the participants, sources of data, and the type of data collected.
The data collection approach helped me achieved a valid and reliable finding to
produce a quality study. I used the electronic questionnaire to implement the survey and
data collection approach. I used the self-administered electronic survey to collect data
from 228 participants. The survey was sent to over 1,000 customers to reach its sample
goal of 228 participants. Data Collection was from mobile banking customers and the
collected data through the electronic survey questionnaires created by a web-based
survey. Software tools like SPSS, AMOS, LimeSurvey, Power BI, and Excel was used
for data analysis and data organization of data.

90
Threats to Validity
External Validity
External validity explores whether the study findings can be generalized to other
contexts (Andrade, 2018). Random samples used distinct populations in previous
investigations to overcome facility-based experiments' apparent validity limitations
(Barnighausen et al., 2017). The validity of the information collected from bank
customers is dependent on the quality of the questions presented in the survey instrument.
The questionnaire was modified to be more relevant to mobile bank customers'
experiences and biometric technology for this study. See Appendix J for a summary
report of the pilot study questions for evaluation. Modifying the survey questions to fit
the study helps answer how customers adopt mobile banking using biometric technology.
The modifications of the survey questions related to the real-world instances of how
customers access their mobile bank application.
Many researchers studied the relationship between customers' age and their
probability of using new technology, but no consensus on the mobile devices’
phenomenon (Mosquera et al., 2018). Accessibility is advantageous for mobile banking
customers; being susceptible to security risks may inhibit success (Shareef et al., 2018).
Mobile banking lacks confidentiality between banks and customers for privacy, integrity,
trust, reliable identification, and service availability because of external interruption
during mobile bank transactions (Shareef et al., 2018). When framing a question, the
random allocation of alternative approaches can show whether the age, sexuality, or race

91
of a person presents a specific behavior, which will dictate the participant evaluation of
that behavior (Barnighausen et al., 2017).
I used the member checking feature to present survey responses to the accuracy
checking participants in the replies. Member checking is where the researcher compares
their interpretations and understanding obtained from the data analysis with participants'
viewpoints to increase the accuracy and consistency of results (Santos et al., 2017). The
participant uses the online survey questionnaire to answer the member checking process
before submitting their results. Population-based experiments were commonly used to
eliminate threats to external validity that facility-based study' usually suffer
(Barnighausen et al., 2017). Previous research explicated that member checking was
useful for validating important information not observed in the data analysis process,
especially with different participants (Santos et al., 2017). The survey delivery
mechanism can change the context in which the intervention effect is measurable
(Barnighausen et al., 2017). By reducing the strength of the belief that the intervention
will have the same impact in real life that established in the experiment (Barnighausen et
al., 2017). In this study, community bank customers from the U.S Mid-Atlantic region
who use mobile banking apps with biometric technology were chosen as the target
population. Community banks offer fewer services and technology than larger banks, but
the process of using mobile banking with biometric is the same. Therefore, no internal or
external validity was affected because of the target group. Community banks face the
same issues as large banks, like cyber-attacks, bank frauds, which is why all types of
small and large banks are moving to biometric technology for more secure transactions.

92
Internal Validity
Internal validity examines whether the manner of a study designed, conduct, and
analyzed without systematic bias is present (Andrade, 2018). For example, improper data
collection from specific groups in the survey can undermine the results' fidelity and
conclusion of proper randomization. An advantage of this study is the ability to collect
data from mobile bank customers because of their frequent use and acceptance of the
technology. Using internal validity is based on judgment and not computed statistics, just
like external validity, and can improve by modifying the analysis plan (Andrade, 2018).
Previous research showed that researchers who have one theory make more inadequate
predictions, and those who have many methods find the one that can be applied the best
to the situation (Profeta & Turvey, 2018). Researchers identified four types of questions
for developing a theory (a) what works, (b) what it is and what does it look like, (c)
visions of the possible, and (d) the theory-building questions (Profeta & Turvey, 2018).
I looked at visions of the possible and the theory-building questions. Biometric
technology with mobile devices is growing with customers, and the idea of banks is to
build trust with customers (Adapa & Roy, 2017). The theory-building questions and
specific groups helped developed more clarity and validity in the study.
Construct Validity
Construct validity tells how well a test or experiment measures up to its claims
and refers to whether the operational variable reflects the true theoretical meaning of a
concept (Shuttleworth, 2009). Construct validity established in a study shows the relevant
and consistent relationship with multiple measures in a large and diverse study population

93
(Loftfield et al., 2015). Testing the construct's validity is to gather evidence about how far
the measurement results give the measured variables' constructs (Sumarni et al., 2018).
For example, a test designed to measure biometric technology use with mobile banking
must only measure the construct, not closely related ideas such as traditional password
and username authentication. The Likert scale is an important instrument used to avoid
redundancy and assessment fatigue to obtain quality data, which produces significant
reliability (Sumarni et al., 2018). It may reduce the acquiesce bias when measuring
positive psychological constructs (Sumarni et al., 2018). The validity of the construct’s is
to find out how the extent to which the measurement scores can illustrate the theoretical
constructs underlying the measuring instrument (Sumarni et al., 2018). Validity is defined
as a composite indicator of the extent to which an instrument measures the attribute it
was designed to measure and the extent to their inferences and interpretations were made
from participants' scores (Thapa & Cohen, 2017).
The advantages and disadvantages of using mobile banking can get viewed from
the bank's standpoint and the customer's point of view as the primary stakeholders of the
business (Milić et al., 2017). Mobile banking from the bank's side improves reputation,
reduced transaction costs, faster and continuous service, greater market penetration, and
e-banking to offer new financial products (Milić et al., 2017). Also, using e-banking
helps banks manage customer relations better since they provide a wide range of services
24 hours a day. The banks can offer more services at a lower cost, which is an advantage
to customers. However, a disadvantage for banks would be they would not have any
personal contact (face-to-face) with customers who have different or more demanding

94
needs. Also, another disadvantage could be through bank transactions; there could be
mistakes in the software. Thus, the loss of data could occur, and the bank may not
provide 100% guarantee security for the e-banking transaction (Milić et al., 2017).
Two types of construct validity are convergent validity and divergent validity
(also known as discriminant). Convergent validity tests construct expected to be related
and determine no questions about the construct (Shuttleworth, 2009). Whereas divergent
validity tests construct, that has no relationship and make sure the relationship does not
exist (Shuttleworth, 2009). A purposeful random survey using bank customers can help
achieve high internal validity for mobile device use with biometric technology for
security. In construct validity, items on a questionnaire can cover the construct studied,
and whereas internal validity measures the real-world events they are intended to
measure. The purposeful random sample must make intuitive sense to the research;
otherwise, the questionnaire has low factorial validity (Palinkas et al., 2015).
Ethical Procedures
The data associated with this study may be sensitive to community banks
managing mobile banking apps. The privacy-related to biometric technology deployment
is a critical factor for banks to protect their copyrighted information (Sanjith, 2017).
Therefore, according to Walden University’s Institutional Review Board guidelines, this
study was conducted in an ethical standard. This study included only participants who
voluntarily agreed to take the survey. Participants taking the survey were volunteering,
and every participant was provided a consent form for their voluntary participation in the
survey. Respondents who continue to take the survey had the choice to disagree or agree.

95
If the respondents agreed, they consent by clicking the agreement button and by
completing the survey. The participants were provided with the Research Participant
Advocate (RPA) phone number and email address at Walden University.
Furthermore, I informed the participants that the survey was voluntary, and no
compensation was provided for taking the survey. Also, the participants were informed
that no negative consequences were involved if they decided not to take or finish the
survey. The participants were informed they could change their minds and stop the
survey at any time. I ensured that the participants' responses were completely
anonymous, and no personal identifying information (PII) or Internet Protocol (IP)
addresses were collected. Also, I informed the participants that any data collected will not
be used outside of the research project. I only published and reported general findings
based on the analysis of the data. To ensure the anonymity of the commercial banks
represented in this study, I employed a robust coding framework so no entity could use
the reported results to identify any participant and their data collected. I ensured that the
survey data was kept secure and stored on a password-protected external hard drive, only
accessible to the researcher. The data will be kept for at least five years, as required by
the University.
Summary
Chapter 3 discussed the quantitative methodology used to investigate the key
research question of the current investigation. Bank customers from community banks in
the Mid-Atlantic region are the primary target population of the research study. In the
study, I targeted mobile banking customers to obtain a sample. For a survey and

96
questionnaire, I used LimeSurvey for a centralized organization. The participants who
responded were selected based on purposive random sampling. The study was designed
to gather valuable information from an online survey questionnaire from a minimum of
228 respondents. The primary instrumentation for the research was biometric technology
with mobile devices during the bank transactions survey.
Approval was granted by Walden's IRB for human subjects. I used the approved
UTAUT instrument by Venkatesh et al. (2003). The UTAUT model was used to
determine the strength of predictors for mobile bank customers' intention to accept and
use biometric technology with mobile banking apps for security. I used the approved
instrument by Tarhini et al. (2016), who extends the UTAUT instrument to understand
the customer's acceptance and use of biometric technology with mobile banking. My
study looked at participants from the Mid-Atlantic region to examine how biometric
scanning tools work with the bank's mobile security systems. The study discussed the
challenges, security, difficulties and measure how banks that use biometric scanning tools
with their bank's application security system. This study evaluated the integration of PC
and TTF with UTAUT and determine if it is a useful theoretical model for examining the
adoption of biometric technology within mobile banking. The general population was
from community bank customers conversant with biometric scanning tools from the Mid-
Atlantic region. I used a self-administered web-based questionnaire instrument for data
collection. Data collection was from mobile banking customers through a web-based
survey to analyze the data results.

97
The participants were provided information about the study and sent an invitation
utilizing email through Cint, where they clicked on a link that took them to a secure
website. If the participants did not want to continue the survey, they could opt-out before
the survey was started. The secure webpage allowed participants to view the online
survey questionnaire's consent documentation, and they could opt-out at any time during
the survey. If the participant chose not to continue the survey, there would be no penalty
or violation. I also informed the participants that a summary of the study was provided to
them on ResearchGate. I used the following software tools for data analysis and
organization of data:
• SPSS version 23
• Multiple linear regressions
• Factor analysis
• Analysis of Variance (ANOVA)
• SPSS AMOS version 23
• Structural Equation Model (SEM)
• Web-based Survey
• Microsoft Forms
• LimeSurvey
• Microsoft Excel
• G*Power software
• Microsoft Power BI
98
The research question was used to analyze a sample population of bank customers
in the Mid-Atlantic region of the United States to establish an association between
variables. During the purposeful random sample, I informed potential participants about
the voluntary nature of the investigation. Also, I told the potential participants about all
pertinent information concerning access to the survey instruments. The participants who
volunteer choose of their free will and no penalties happen if they did not want to do the
survey or back out of the survey.
In this chapter, I analyzed and developed the research design in the investigation.
In Chapter 4, I present study results and analysis for the research question. Chapter 5
includes the (a) results interpretations, (b) limitations of the study, (c) scope and
delimitations, (d) implication of social change, (e) future recommendations, and (f) and a
conclusion of the study.
99
Chapter 4: Results
The purpose of this quantitative study was to develop a conceptual model that
would have a conceivably more eminent explanatory power about the adoption of
biometric technology with mobile banking. A conceptual framework was developed by
extending the UTAUT by incorporating two more factors: PC and TTF. A quantitative
approach based on a web-based questionnaire survey was used to collect data from 228
mobile banking customers in the U.S. Mid-Atlantic region. The specific problem is
customers’ lack of adoption of biometric technology, and bank managers do not
understand the reasons that influence mobile banking adoption in the Mid-Atlantic
region. Chapter 4 includes a detailed description of how I conducted the study, collected
data, and analyzed the data. Chapter 4 also provides the data analysis results and a
discussion of how I used the finding to test the hypotheses and answer the research
question.
Pilot Study
The questions in Appendix I were used by the well-developed UTAUT model and
two more constructs, the PC and the TTF questions. The questions were tested by
previous research for validity and reliability. However, the questions were modified to fit
my specific study. A pilot study was conducted after the Walden University IRB
approval.
Based on the collected responses, I made several minor modifications in the
survey, such as the survey introduction, consent information, the wording of questions,
and sequence of items. Also, I asked for additional demographic information, such as

100
age, gender, race, income, marital status, employment status, and nationality. The
demographic information (see Appendix L) was used for the study's inclusion criteria.
The questions were tested by previous research for validity and reliability (Tarhini et al.,
2016; Venkatesh et al., 2012; Yu, 2012). However, the questions were modified to fit my
specific study. See Appendix J for a summary report of the pilot study questions for
evaluation.
The pilot study used a random sample for the pretest and posttest design. See
Appendix J for the summary report of the pilot study. Once the pilot study was set up and
complete, I used the pilot study format for the final study. The only change from the pilot
study to the final study was the data collection instrument. The pilot study used Microsoft
Forms, and the final study used LimeSurvey to collect data. I asked participants to
complete a preassessment of their mobile banking application use and biometric
technology using a web-based survey using Microsoft Forms. Participants were recruited
through social media sites, like Facebook, Instagram, Twitter, and LinkedIn. The
Participants had 1 week to complete the pilot study survey. I emailed the survey link to
participants, instead of directing them to a web-based survey, to ensure anonymity. Once
the participants clicked on the link, they were directed to the survey by Microsoft Forms,
which consisted of eight demographic questions (see Appendix L). The Microsoft Forms
survey design was made to be taken on a personal computer, laptop, tablet, or smartphone
to make sure participants could take the survey anytime and anyplace during the pilot
test. No identifying information was collected. An email reminder was sent to all
participants (even if they completed the survey) to complete the survey on Day 3 of the
101
survey's 1-week deadline. After Day 3, an email blast was sent to all participants every
day to encourage new participants to take the survey.
The web-based survey was published 1 day before the survey was released to
potential participants. The web-based survey included an implied consent form to all
participants before proceeding with the survey. I also included an introduction and
opinion statement in the survey for instructional purposes. Of the 42 possible participants,
all 42 (100%) completed the pretest survey. The survey was titled “Biometric
Authentication Usage and Acceptance with Mobile Banking Survey Pilot Study.”
Measured on the 5-point Likert scale in which 1 means strongly disagree, 2 means
disagree, 3 means neutral, 4 means agree, and 5 means strongly agree. Higher scores
indicated that the participants were more engaged, and lower scores meant the
participants were less engaged in biometric technology with mobile banking. The
participants received follow-up emails reminding them about the survey every 2 days
from the initial email. The data collection lasted 1 week, and one response was set per
person. After 1 month of the actual survey timeline, the participants received an email
with a link to the survey post assessment of their mobile banking and biometric
technology use and acceptance level. Participants who did not take the test within the
allotted time frame could not attempt the test because the survey had a start and finish
date. The survey was made unavailable on Microsoft Forms after a week of initiation.
The web-based survey was anonymous, and no personally identifiable
information was asked during the pilot test. A brief introduction to the web-based survey
was used to help participants understand the topic and get an emotional attachment to the

102
study, so the best possible answer would be given. A content agreement was added to
ensure that participants knew they were volunteers, there was no compensation, and they
could opt-out of the survey. A brief explanation of how the questions would be measured
and definitions of key words were explained for the participants. Also, after the web-
based survey was completed, participants were redirected to a note thanking them for
participating. The modified questionnaire items were adjusted to ensure no bias,
irrelevant or missing questions, and duplicate responses were removed. The web-based
questionnaire was pilot tested among 42 bank customers, who were not included in the
primary survey. The data were analyzed with Microsoft forms question-wise analysis and
Microsoft Power BI. Also, data were extracted to Microsoft Excel and ran in SPSS 23 for
data analysis. I found preliminary evidence that the scales were reliable and valid
(Tarhini et al., 2016; Venkatesh et al., 2012; Yu, 2012).
The data were elicited from 42 people who were randomly selected from social
medial sites. The participants live in the Mid-Atlantic region of the United States, and
they use mobile banking and had biometric technology tools capabilities. The participants
receive an e-mail welcoming and thanking them for their participation in the survey.
Participants used a hyperlink to gain access to the web-based survey between August 3,
2020, through August 9, 2020. The survey was set so all the participants would answer
every item. On the introduction page of the survey, the participants were told the survey
was anonymous. The introduction explained that participants would take part in a
research study about biometric technology use and acceptance for customers' security
during mobile banking transactions. No incentives were given to the participants for their

103
responses, and all 42 participants responded and finished the survey; 42 participants have
usable data sets for analysis, yielding a response rate of 100%. Nonparticipants resulted
in invalid e-mail addresses, time constraints, or noncompletion of survey.
Data Collection
For the final study, I used a random sample technique, which is used when a
diverse sample is necessary or the opinion of people who used a mobile device. When
researchers use the data collection process, it is for gathering and measuring information
on variables of interest, using an established systematic format that enables researchers to
answer stated research questions, test hypotheses, and evaluate outcomes (Palacios
Martínez, 2020). The target population of the final study was the Mid-Atlantic region of
the United States, which is estimated at 41 million, according to the 2019 U.S. Census.
According to the Global System for Mobile Communications, more than 5 billion people
have mobile devices in the world (Wolfe, 2017). Sample sizes are defined as a finite part
or subset of participants drawn from the target population (Martínez-Mesa et al., 2016).
The final study's appropriate sample size with a confidence level of .95% and a margin of
error of .5% was 228 participants. In the final study, I used purposeful random sampling
to collect data on a web-based survey through the LimeSurvey website. The data obtained
for this study were from a sample representative of the target population. The final study
target population included adults living in the Mid-Atlantic region of the United States of
different genders, age groups, ethnic backgrounds, marital status, education levels,
income levels, and bank used.

104
In the final study, the participants included bank customers who use biometric
technology when using their mobile bank apps. The survey link was posted to social
media sites to direct a web-based survey to ensure anonymity. Once the participants
clicked on the link, they were directed to the survey utilizing LimeSurvey. Participants
were recruited through social media sites such as Facebook, Instagram, Twitter, and
LinkedIn. The participants had 2 months to complete the web-based survey. LimeSurvey,
which consisted of eight demographic questions (see Appendix L). The LimeSurvey
design was made to be taken on a personal computer, laptop, tablet, or smartphone to
make sure participants could take the survey anytime and anyplace during the survey. No
identifying information was collected. An updated post on social media sites was done
once a week as a reminder and to encourage new participants to take the survey.
Data Collection Process
The instrument in the final study consisted of nine groups in the questionnaire.
The first group contained eight questions on demographics. The other group had 38 items
used to measure the independent variables for using and accepting biometric technology
with mobile banking in the U.S. Mid-Atlantic region. Tarhini et al.’s (2016) instrument
had a 5-point Likert-type scale with Cronbach's alpha scores, and they were over 0.8
except FC and AU, which were over .75 respectfully. The item used to measure the
independent variables derived from Tarhini et al.’s validated survey instrument used in a
previous peer-reviewed study. The web-based survey was available for participants to
complete for two months. The participants in this study included adults over the age of 18
from any (a) gender, (b) age, (c) marital status, (d) educational level, (e) race or ethnicity

105
background, (f) employment status, (g) income level, (h) technology level, and (i) mobile
device owned. All participants used community banks or credit unions. Participants did
not have to be affiliated with LimeSurvey to take the survey, but the participants did live
in the Mid-Atlantic region of the United States.
Reliability of the Instrument
The Cronbach’s alpha is used to determine whether the items of a scale measure
the same underlying dimension. Therefore, Cronbach alpha is used when the construct
comprises multiple items measured on an interval scale to see if the construct is reliable
and consistent. The Cronbach’s alpha ranges from 0 to 1, so if alpha is greater than .90,
there is a great internal consistency. If Cronbach’s alpha is between .80 and .90, there is a
very good internal consistency and, if it’s between .70 and .80, there is a good internal
consistency. Cronbach’s scores between .60 and .70 are acceptable, and values between
.50 and .60 are poor, and anything below .50 is unacceptable. Therefore, the Cronbach’s
alpha should be over .70 and ideally over .80 or .90 for best internal consistency. The
items used in this study were based on a validated instrument. However, a pilot study was
needed to test for validity and reliability, and the questions were modified to fit my
specific study.
In this study, a Cronbach's alpha for the instrument was analyzed to confirm the
instrument's validity and reliability. The Cronbach's alpha showed a value of .949 (α ≥
0.90). Cronbach's alpha is the most common statistic used to display items' internal
consistency reliability. See Table 4 for reliability statistics for the whole instrument.

106
Table 4
Reliability Statistics
Cronbach’s alpha Cronbach’s alpha based on standardized items N of items
.949 .952 31
The measurement model (see Appendix M for descriptive of constructs) was first
used to analyze and assess the instrument's reliability and validity before testing the
study's research hypotheses. Cronbach's alpha for the scales was calculated (see Table 5)
and showed a high level of internal consistency for the instrument used in this study. The
first column (Mean) shows most of the items are over 4.36, meaning that most
participants expressed positive responses to the constructs measured in the study. The
second column (Standard Deviation) of the sample shows a high standard deviation
meaning the values are spread out over a wider range. The third column (Corrected Item
Total Correlation) is the correlation between an item and the sum of the rest of the items
and how well they go with each other. The highest item-total correlation is BI[BIB] (r =
.755) and the item with the lowest item-total correlation is FCD (r = .285). If the item-
total correlation is close to zero, removing the item from the scale is recommended
because it does not measure the same thing as the rest of the items. The fourth column
(Cronbach's Alpha if Item Deleted) is a critical column because it estimates the
Cronbach's alpha if you remove an item. For example, PE[PEA] (Cronbach's Alpha if
Item Deleted) is .947, so that means the scale would drop from .949 to .947. Therefore, as
shown in Table 5, removing any item would not change the instrument's best internal
consistency. Therefore, the constructs were shown to have great reliability for the next
step of the analysis.

107
Table 5
Descriptive Statistics of the Constructs
Construct Mean Std. deviation Corrected item total
correlation
Cronbach’s alpha if item
deleted
PE[PEA] 4.53 .542 .618 .947
PE[PEB] 4.71 .462 .527 .948
PE[PEC] 4.69 .526 .615 .947
PE[PED] 4.69 .473 .648 .947
EEA 4.58 .537 .602 .947
EEB 4.60 .518 .662 .947
EEC 4.55 .557 .588 .947
EED 4.58 .569 .622 .947
SIA 3.88 .773 .589 .947
SIB 3.85 .765 .614 .947
SIC 3.89 .843 .643 .947
SIDA 4.06 .821 .546 .948
FCC 4.52 .612 .520 .948
FCD 3.62 .714 .285 .950
PCA[PCAA] 3.96 .614 .553 .948
PCA[PCAB] 4.21 .631 .580 .947
PCA[PCAC] 3.66 .731 .468 .949
PCA[PCAD] 4.04 .592 .580 .947
PCA[PCAE] 4.36 .617 .686 .946
PCA[PCAF] 4.36 .603 .662 .947
PCA[PCAG] 4.07 .526 .541 .948
TTF[TTFA] 4.68 .585 .606 .947
TTF[TTFB] 4.72 .563 .563 .947
TTF[TTFC] 4.18 .640 .621 .947
TTF[TTFD] 4.55 .722 .674 .946
TTF[TTFE] 4.61 .665 .639 .947
TTF[TTFF] 4.33 .716 .689 .946
BI[BIA] 4.54 .747 .667 .946
BI[BIB] 4.69 .501 .755 .946
BI[BIC] 4.70 .479 .747 .946
BI[BID] 4.69 .551 .729 .946
Note. The last column of Table 5 shows the value of Cronbach’s alpha if an item was
deleted from the scale. If an item is removed it would not affect the reliability of the
instrument.

108
Study Results
I used SEM based on SPSS AMOS for data analysis. SEM was used as a general
multivariate framework for identifying and examining a system of linear models that
involve observed and latent variables (Sarstedt & Hwang, 2020). I conducted an
exploratory factor analysis to reduce the variable to a manageable and relevant set of
variables that could affect biometric technology implementation during mobile banking
transactions.
The SPSS descriptive and SEM were used to measure statistical procedures for
data analysis and test the hypotheses. The data were analyzed by using SPSS version 23
and presented in four stages (a) descriptive statistics report, (b) Principal axis factoring,
(c) Chi-square for the goodness of fit, and (d) Principal component analysis. To test the
research questions and hypothesis, I analyzed the data using AMOS version 23 to run a
confirmatory factor analysis SEM fit model and path analysis to investigate the
appropriate model. Also, I used SPSS (Version 23) to run multiple linear regressions and
ANOVA to identify factors to determine the extent of influence of the factors on
intentions to adopt biometric technology with mobile banking.
I used a web-based questionnaire survey as the data collection instrument, which
focused on examining the adoption and operation of biometric technology with mobile
banking. Based on the research model and extension of the research model, I grouped the
factors into the following six categories: (a) conducting banking affairs, (b) learning to
use (c) influence (d) environment (e) using mobile banking and (f) using biometric
technology.

109
• Conducting Banking Affairs [PE] – benefits (2 variables) and service (2
variables).
• Learning to Use [EE] – ease of system (2 variables), ease of technology (1
variable) and beneficial tasks (1 variable).
• Influence [SI] – influence and support (3 variables) and trusted network (1
variable).
• Environment [FC] – behavior internal and external constraints (3 variables)
and resources and support (1 variable).
• Using mobile banking (MB) [PC] – security and trust (7 variables)
• Using biometric technology [TTF] - needs and performance (2 variables),
security features (1 variable), performance and utilization (3 variables).
The web-based questionnaire data was exported from LimeSurvey in a Microsoft
Excel spreadsheet format. Once the data was extracted, I uploaded the Excel spreadsheet
file into SPSS version 23 for analysis. The variables were grouped into factors and
measured using the 5-point Likert-scale (extending from 1 = strongly disagree, to 5 =
strongly agree). I reported the analysis in the following order (a) descriptive statistics
report (b) principal factor axis factor (c) Chi-Square goodness-of-fit test, (d) principal
component analysis, (e) exploratory factor analysis, (f) data analysis and results (g)
research question, and (h) Hypotheses’.
Descriptive Statistics
Descriptive statistics summarize the data in a study by providing the basic
features of the data, such as the standard deviation (SD) and the mean (Mishra et al.,

110
2019). Descriptive statistics were used in this study to interpret every quantitative
analysis of data in a more meaningful way. The collected data was exported from
LimeSurvey.com as a Microsoft Excel file to SPSS 23 for further data analyses.
The survey was titled “Biometric Authentication Usage and Acceptance with
Mobile Banking Survey,” and the responses used in SPSS were entered as 1 = strongly
disagree, 2 = disagree, 3 = neutral, 4 = agree, and 5 = strongly agree for the biometric
technology use with mobile banking. The higher the score meant, the more engaged, and
the lower the score meant, the participants were less involved in biometric technology
with mobile banking. I used closed questions for the Likert scale to measure how
customers feel about the technology, services, or experiences with biometric technology
with mobile banking.
The web-based survey was published one day before the survey was released to
potential participants. A consent form, an introduction, and an opinion statement were
included in introducing the survey for instructional purposes to the participants. Of the
234 possible participants, 228 participants (97.4%) completed the survey. From the 234
responses, six surveys were not fully completed and could not be included in the analysis.
The survey was active from August 2020 to October 2020, and I collected data until I
reach saturation of 228 participants. According to G*Power calculation, a sample size of
N = 228 would achieve a power of .95 in a test based on alpha = .05. If the full sample
were not received, the G*Power calculated a sample size of N = 184 would achieve a
power of .90% in a test based on alpha = .05%. However, the full sample was received,
so the .90% sample size was not needed.

111
Survey Returns
The data collections generated 234 responses, including six incomplete survey
responses. Only surveys that were fully completed were used in the data analysis. After
going through the survey summary, six incomplete responses were not included in the
data analysis. Therefore, 228 complete responses were used for this study. Table 6
describes the descriptive statistics of the demographic data of the participants.
Table 6
Demographics
No. Frequency Male or
Female
Age Marital
status
Education
level
Employment
status
Total
income
Bank use
N Valid
Missing
228
0
228
0
228
0
228
0
228
0
228
0
228
0
Comparison of Demographics Between Population and Sample
The characteristics of the target Mid-Atlantic region of the United States and its
sample were like each other. The comparison was conducted between the last U.S.
Census (2019) data and the data collected for this study. According to the U.S. Census
report (2019), among the 41 million Mid-Atlantic region populations, 52.8% were
females, and 47.2% were men. In the sample used in this study, 54.4% were women, and
45.6% were men that participant in the study.
One large gap in the target population and the sample population was 18 - 39 -
year represented groups. The target population gap was due to the millennial
demographic buying power and how millennials are the future bank account holders.
Therefore, the millennial generation will help guide the next generation of bank

112
customers into new technology. The comparison of demographics between the sample
size and population size are listed in Table 7.
Table 7
Comparison of Demographics Between Population and Sample
Demographics % of Mid-Atlantic Population % of Sample
Male 47.2 45.6
Female 52.8 54.4
18 – 21 5.57% 17.5
22 – 39 23.8% 48.2
40 – 64 33.8% 19.7
65+ 15.3% 14.9
Employed 40+ hours 58.8 64.9
Unemployed 4.8 6.6
Gender Report
The data were collected using a web-based survey randomly sent to participants
living in the Mid-Atlantic region of the United States. Data were collected from 228
participants, which included 54.4% of females and 45.6% of men. Table 8 lists the gender
statistics of the sample population. In this study, the sample population and demographics
population were similar.
Table 8
Gender Statistics
Frequency Sex Frequency Percent Valid Percent Cumulative Percent
Valid Female 124 54.4 54.4 54.4
Male 104 45.6 45.6 100
Total 228 100.0 100.0
Age Distribution Report
The sample in this study used all age groups. However, out of the 228
participants, the majority were between the ages of 21 and 29 (48.2%). The next age
group with the highest participants was 18 – 20 (17.5%). The third majority group was

113
the age group of 40 – 49 (14.9%). However, the age group of 50 – 60 plus was under 8%.
The age distribution of the participants in the study is presented in Table 9.
Table 9
Age Distribution
Frequency Ages Frequency Percent Valid
Percent
Cumulative
Percent
Valid 18-20 40 17.5 17.5 17.5
21-29 110 48.2 48.2 65.8
30-39 27 11.8 11.8 77.6
40-49 34 14.9 14.9 92.5
50-59 11 4.8 4.8 97.4
60 or older 6 2.6 2.6 100.0
Total 228 100.0 100.0
Marital Status Report
The participants in this study were married, separated, divorced, widowed, and
single, and represented the Mid-Atlantic region of the United States. As listed in Table 9,
most participants were single or married. Among the 228 participants of this study,
32.9% were married, 61.8% single, 3.1% divorced, 4% separated, and 1.8% widowed
(see Table 10).
Table 10
Martial Status
Frequency Marital
Status
Frequency Percent Valid
Percent
Cumulative
Percent
Valid Divorced 7 3.1 3.1 3.1
Married 75 32.9 32.9 36.0
Separated 1 .4 .4 36.4
Single 141 61.8 61.8 98.2
Widowed 4 1.8 1.8 100.0
Total 228 100.0 100.0

114
Educational Level
The sample of this study included participants of all educational backgrounds.
Many of the participants had some college (24.1%) background. Among them, 23.2% had
a bachelor’s degree, 21.1% had an associate degree, 20.6% had a high school diploma,
and 11% were college graduates. The educational level statistics of the participants in the
study are presented in Table 11.
Table 11
Educational Level
Frequency Degree Frequency Percent Valid Percent Cumulative Percent
Valid Associate degree 48 21.1 21.1 21.1
Bachelor’s degree 53 23.2 23.2 44.3
Graduate degree 25 11.0 11.0 55.3
High School
Degree
47 20.6 20.6 75.9
Some College 55 24.1 24.1 100.0
Total 228 100.0 100.0
Income Levels Statistics
The income level report showed participants with many different total family
income values. Most participants were in the $25,000 - $49,000 with 29.8%. Other high
participants income level ranges were $50,000 - $74,000 with 27.2%, and $10,000 -
$24,000 with 16.2%. The other income level groups in this study were under 10% (see
table 11). The lowest income level group was the $150,000 - $1999,000, with 3.1% and a
4% group, which preferred not to comment on this area. See Table 12 for the complete
list of total family income levels for this study.
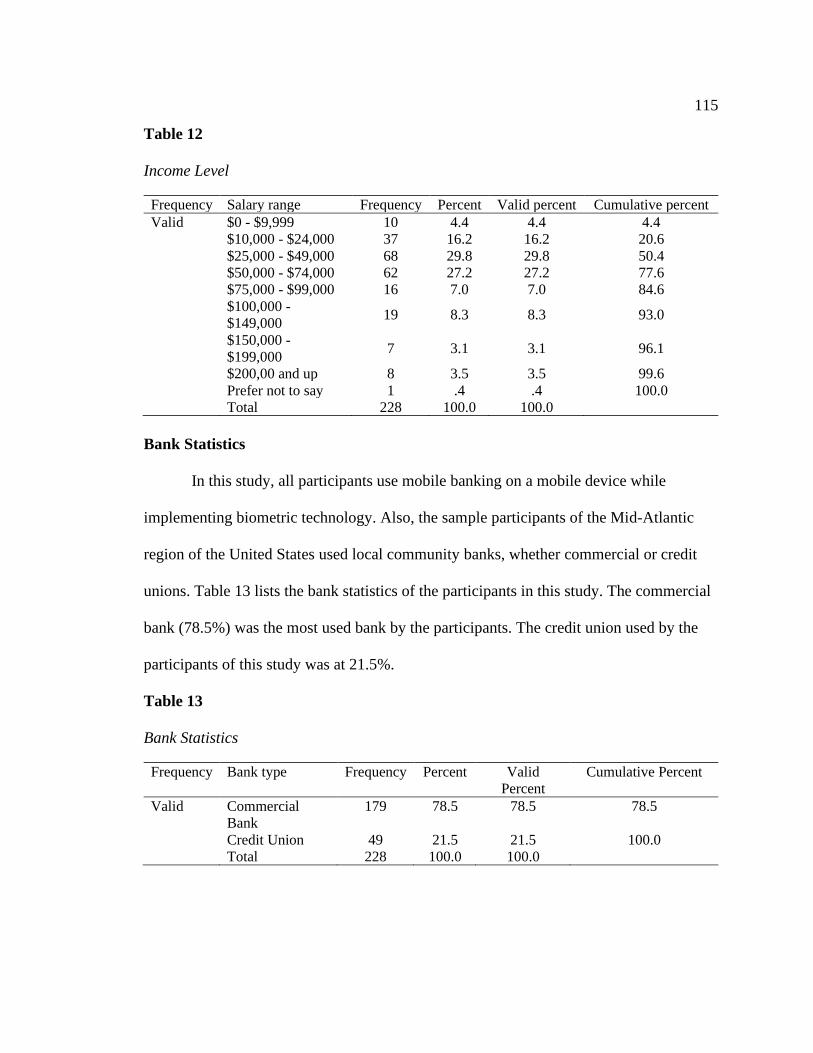
115
Table 12
Income Level
Frequency Salary range Frequency Percent Valid percent Cumulative percent
Valid $0 - $9,999 10 4.4 4.4 4.4
$10,000 - $24,000 37 16.2 16.2 20.6
$25,000 - $49,000 68 29.8 29.8 50.4
$50,000 - $74,000 62 27.2 27.2 77.6
$75,000 - $99,000 16 7.0 7.0 84.6
$100,000 -
$149,000 19 8.3 8.3 93.0
$150,000 -
$199,000 7 3.1 3.1 96.1
$200,00 and up 8 3.5 3.5 99.6
Prefer not to say 1 .4 .4 100.0
Total 228 100.0 100.0
Bank Statistics
In this study, all participants use mobile banking on a mobile device while
implementing biometric technology. Also, the sample participants of the Mid-Atlantic
region of the United States used local community banks, whether commercial or credit
unions. Table 13 lists the bank statistics of the participants in this study. The commercial
bank (78.5%) was the most used bank by the participants. The credit union used by the
participants of this study was at 21.5%.
Table 13
Bank Statistics
Frequency Bank type Frequency Percent Valid
Percent
Cumulative Percent
Valid Commercial
Bank
179 78.5 78.5 78.5
Credit Union 49 21.5 21.5 100.0
Total 228 100.0 100.0

116
Test of Normality
Most statistical procedures want research to verify at least two assumptions, the
normality assumption and the absence of outliers. There are two categories of methods
used to check the normality assumption: numerical methods and graphical methods. The
numerical way is safer because it shows the number for verification. The most used
numerical methods are the Skewness and Kurtosis indicators, the Shapiro-Wilk normality
test, and the Kolmogorov-Smirnov test. The graphical techniques that are used to test
normality are the histogram and the Q-Q plot. Table 14 shows the distribution of the
Skewness and Kurtosis test.
Table 14
Skewness and Kurtosis Statistics
Variable N Skewness Kurtosis
Statistic Statistic Std. Error Statistic Std. Error
MBActualUse2 228 -1.505 .845 2.387 1.741
Valid N (listwise) 228
To compute the values of the Skewness and Kurtosis test I used the following
equations:
z = Skewness/Std. error = -1.78
z = Kurtosis/Std. error = 1.37
The scores show the values lie between the interval (-2.58, 258), and the variable
is normally distributed with a 99% confidence level. The tests of normality show data for
the Kolmogorov-Smirnov test and the Shapiro-Wilk test. The results can be shown in
Table 15, and both the p-value of each test is greater than .05, so we conclude that the
variable weight is normally distributed.
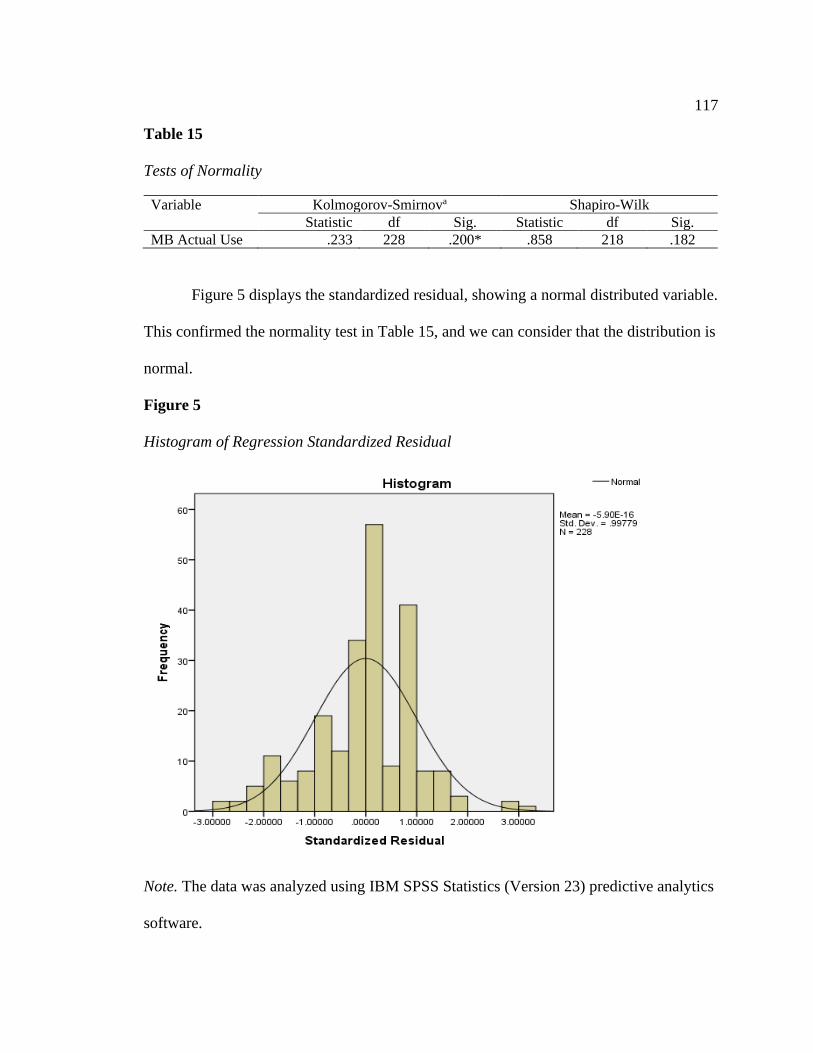
117
Table 15
Tests of Normality
Variable Kolmogorov-Smirnova Shapiro-Wilk
Statistic df Sig. Statistic df Sig.
MB Actual Use .233 228 .200* .858 218 .182
Figure 5 displays the standardized residual, showing a normal distributed variable.
This confirmed the normality test in Table 15, and we can consider that the distribution is
normal.
Figure 5
Histogram of Regression Standardized Residual
Note. The data was analyzed using IBM SPSS Statistics (Version 23) predictive analytics
software.

118
The second graphical method for normality checking is the quantile-quantile (Q-
Q) plot. The Q-Q plot diagram is included with the normality plots with the test in SPSS.
Figure 6 shows the q size of all distribution (dots) and the q size of normal distribution
(straight line). If the dots are close or follow the line, the distribution is normal, and
according to Figure 6, the dots follow the line, so we can state the weight variable is
normally distributed.
Figure 6
Normal Probability Plot
Note. The data was analyzed using IBM SPSS Statistics (Version 23) predictive analytics
software.
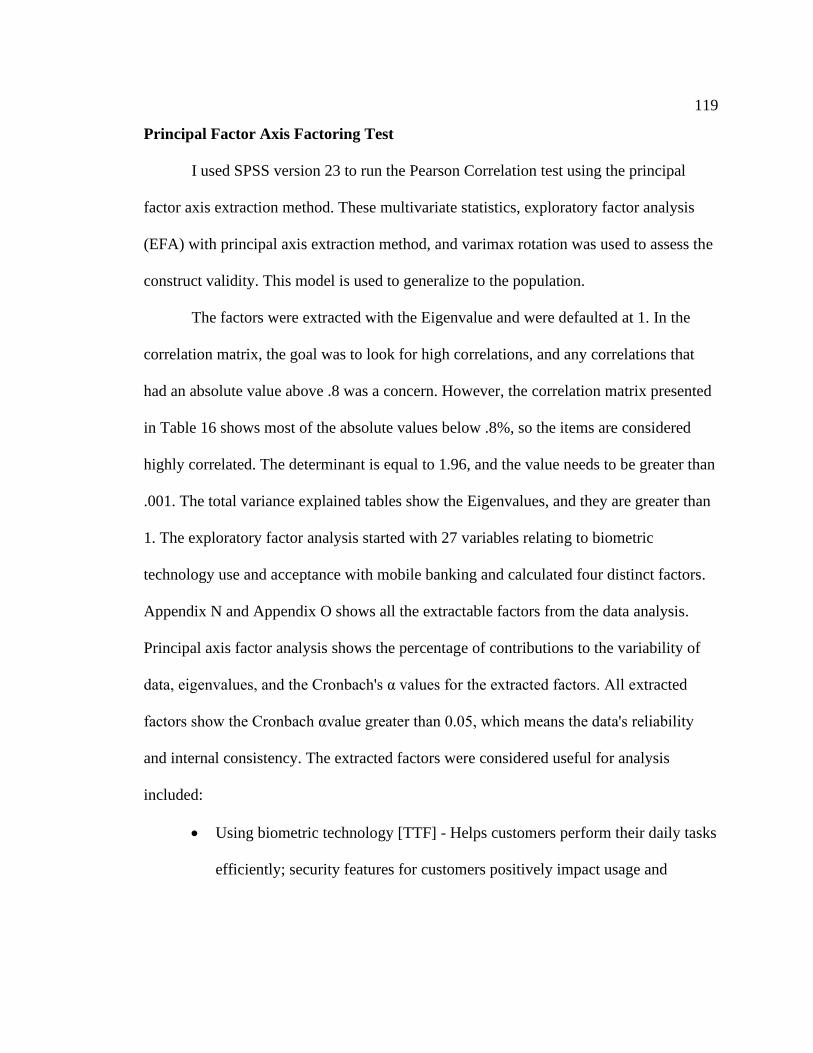
119
Principal Factor Axis Factoring Test
I used SPSS version 23 to run the Pearson Correlation test using the principal
factor axis extraction method. These multivariate statistics, exploratory factor analysis
(EFA) with principal axis extraction method, and varimax rotation was used to assess the
construct validity. This model is used to generalize to the population.
The factors were extracted with the Eigenvalue and were defaulted at 1. In the
correlation matrix, the goal was to look for high correlations, and any correlations that
had an absolute value above .8 was a concern. However, the correlation matrix presented
in Table 16 shows most of the absolute values below .8%, so the items are considered
highly correlated. The determinant is equal to 1.96, and the value needs to be greater than
.001. The total variance explained tables show the Eigenvalues, and they are greater than
1. The exploratory factor analysis started with 27 variables relating to biometric
technology use and acceptance with mobile banking and calculated four distinct factors.
Appendix N and Appendix O shows all the extractable factors from the data analysis.
Principal axis factor analysis shows the percentage of contributions to the variability of
data, eigenvalues, and the Cronbach's α values for the extracted factors. All extracted
factors show the Cronbach αvalue greater than 0.05, which means the data's reliability
and internal consistency. The extracted factors were considered useful for analysis
included:
• Using biometric technology [TTF] - Helps customers perform their daily tasks
efficiently; security features for customers positively impact usage and

120
adoption. Six variables were extracted on this factor, which contributed 39.2%
to data variability, internal consistency of 0.809.
• Learning to Use [EE] – Measure the customers' beliefs in the systems and how
easily they can use it. Also, how easy the customers can use the technology.
Four variables were extracted on this factor, which contributed 9.45% to data
variability, internal consistency of 0.813.
• Using mobile banking (MB) [PC] – Measure customers' security, privacy, and
trust concerns that affected the customer's behaviors to use bank apps. Six
variables were extracted on this factor, which contributed 8.46% to data
variability, internal consistency of 0.804.
• Conducting Banking Affairs [PE] – Mediated by age, gender, and experience.
The use of technology provides benefits to customers when using services.
Four variables were extracted on this factor, which contributed 5.6% to data
variability, internal consistency of 0.813.
• Influence [SI] – Perceived what is distinguished from other people, like family
and friends, and think they should use a similar technology feature or device.
Four variables were extracted on this factor, which contributed 4.9% to data
variability, internal consistency of 0.805.
• Environment [FC] – Perceptions of the resources and services are available to
perform a behavior and include self-efficacy. Three variables were extracted
on this factor, which contributed 4.06% to data variability, internal
consistency of 0.811.
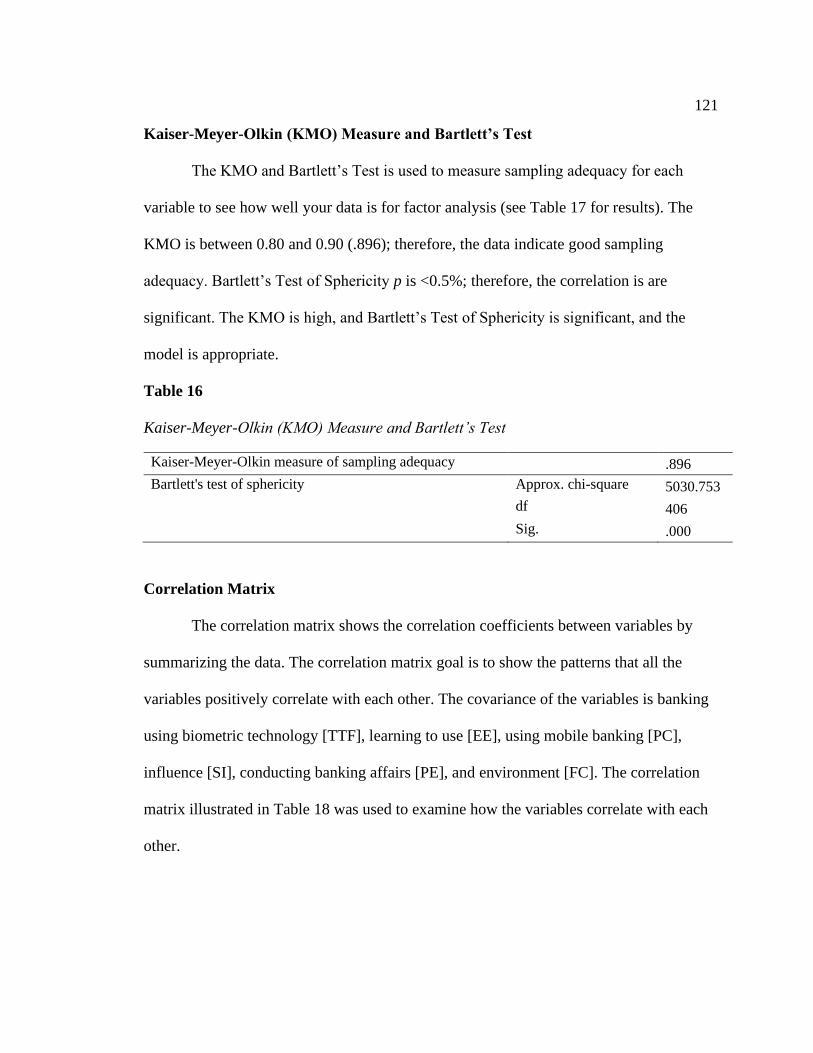
121
Kaiser-Meyer-Olkin (KMO) Measure and Bartlett’s Test
The KMO and Bartlett’s Test is used to measure sampling adequacy for each
variable to see how well your data is for factor analysis (see Table 17 for results). The
KMO is between 0.80 and 0.90 (.896); therefore, the data indicate good sampling
adequacy. Bartlett’s Test of Sphericity p is <0.5%; therefore, the correlation is are
significant. The KMO is high, and Bartlett’s Test of Sphericity is significant, and the
model is appropriate.
Table 16
Kaiser-Meyer-Olkin (KMO) Measure and Bartlett’s Test
Kaiser-Meyer-Olkin measure of sampling adequacy .896
Bartlett's test of sphericity Approx. chi-square 5030.753
df 406
Sig. .000
Correlation Matrix
The correlation matrix shows the correlation coefficients between variables by
summarizing the data. The correlation matrix goal is to show the patterns that all the
variables positively correlate with each other. The covariance of the variables is banking
using biometric technology [TTF], learning to use [EE], using mobile banking [PC],
influence [SI], conducting banking affairs [PE], and environment [FC]. The correlation
matrix illustrated in Table 18 was used to examine how the variables correlate with each
other.

122
Table 17
Correlation Matrix
Factor 1 2 3 4 5 6
1 .518 .427 .428 .375 .359 .311
2 .187 -.616 .553 -.465 .250 .046
3 -.713 .163 .067 -.122 .474 .470
4 -.298 .424 .657 -.159 -.426 -.305
5 -.285 -.482 .274 .747 -.208 .099
6 .136 -.005 -.022 -.211 -.600 .760
Goodness-of-Fit Test
The Chi-square test for goodness-of-fit is used when the variable is nominal with
at least three categories. The goal is to compare an observed distribution with a
theoretical distribution. The value of the Chi-Square with 14 degrees of freedom (df) is
225, and the p is < .005; therefore, the data (see Table 19) shows there is a significant
difference between the observed and the theoretical distribution and the model is a good
fit for the data.
Table 18
Goodness-of-fit Test
Chi-square 225.816 a
df 14
Asymp. Sig. .000
a 0 cells (0.0%) have expected frequencies less than 5. The minimum expected cell
frequency is 15.2.

123
Communalities of Variables
The principal component analysis (PCA) is used to reduce a broad set of variables
into a smaller set of principal components (or factors). The initial variable is grouped
based on the correlations between them. The principal components synthesize the
information contained in those variables. It’s a data reduction technique like factor
analysis. The goal is to identify several essential factors and then give an analytical
interpretation of the relevant factors. The communalities of variables (see Appendix P)
was extracted using the principal axis factoring analysis.
Factor Analysis
The parameters used in the component matrix included all 29 factors from the
individual variables, which were group together to form groups. PE (4 variables), EE (4
variables), SI (4 variables), FC (4 variables), PC (7 variables), and TTF (6 variables)
were the 29 parameters used to measure the factors affecting biometric technology with
mobile banking in the Mid-Atlantic region of the United States. Appendix Q (unrotated
factor matrix) shows the Principal Axis Factoring extraction method were six factors
extracted and seven interactions required in the factor matrix before further data
reduction is needed to clarify the factor solution. In the unrotated factor matrix (see
Appendix Q), PCA and FCD was removed because the absolute value extraction with
scores was above 0.4%.
The unrotated factor matrix (see Appendix Q) had many parameters belonging to
more than one factor or several belonging to the same factor. Therefore, further data
reduction was needed to show the specific rotation needed to be applied to this study

124
factor solution. Using the Principal Axis factoring extraction method and the Varimax
with Kaiser Normalization rotation method (see Appendix R), displayed six factors that
belong to one group and the items that remain after data extraction. All 29 parameters
were included and grouped in the six different factors.
Descriptive Statistics for the Independent and Dependent Variables
Descriptive statistics are shown in Table 19 for the variables conducting banking
affairs (PE), learning to use (EE), influence (SI), environment (FC), using mobile
banking (PC), using biometric technology (TTF), banking affairs (BI), and mobile
banking usage (AU). The variables conducting banking affairs (M = 4.6, SD = .438),
learning to use (M = 4.5, SD = .504), using biometric technology (M = 4.5, SD = .531),
and banking affairs (M = 4.6, SD = 4.6) observations ranged from 3.00 to 5.00. The
variables environment (M = 4.1, SD = .547), using mobile banking (M = 4.09, SD = .473)
observations ranged from 2.25 to 5.75. The variable influence observations ranged from
1.25 to 5.0, with a mean observation of 3.9 and a standard deviation of .687. Table 19
presents the means and standard deviations for continuous variables.
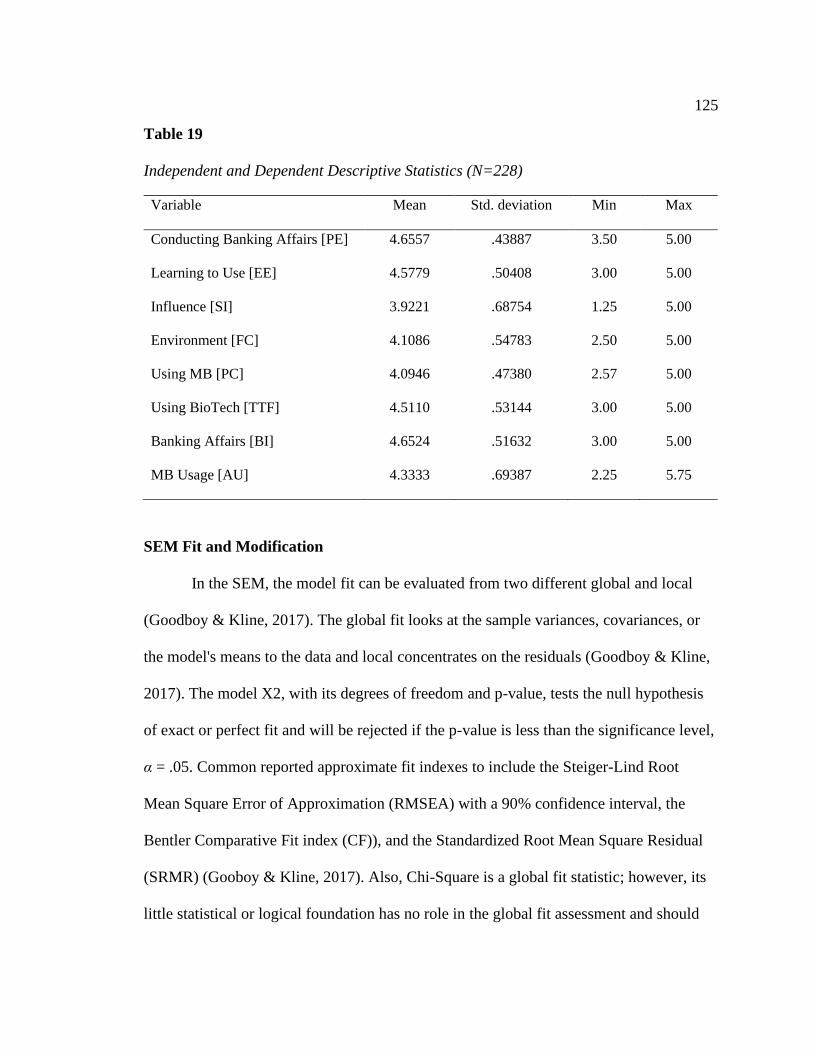
125
Table 19
Independent and Dependent Descriptive Statistics (N=228)
Variable Mean Std. deviation Min Max
Conducting Banking Affairs [PE] 4.6557 .43887 3.50 5.00
Learning to Use [EE] 4.5779 .50408 3.00 5.00
Influence [SI] 3.9221 .68754 1.25 5.00
Environment [FC] 4.1086 .54783 2.50 5.00
Using MB [PC] 4.0946 .47380 2.57 5.00
Using BioTech [TTF] 4.5110 .53144 3.00 5.00
Banking Affairs [BI] 4.6524 .51632 3.00 5.00
MB Usage [AU] 4.3333 .69387 2.25 5.75
SEM Fit and Modification
In the SEM, the model fit can be evaluated from two different global and local
(Goodboy & Kline, 2017). The global fit looks at the sample variances, covariances, or
the model's means to the data and local concentrates on the residuals (Goodboy & Kline,
2017). The model X2, with its degrees of freedom and p-value, tests the null hypothesis
of exact or perfect fit and will be rejected if the p-value is less than the significance level,
α = .05. Common reported approximate fit indexes to include the Steiger-Lind Root
Mean Square Error of Approximation (RMSEA) with a 90% confidence interval, the
Bentler Comparative Fit index (CF)), and the Standardized Root Mean Square Residual
(SRMR) (Gooboy & Kline, 2017). Also, Chi-Square is a global fit statistic; however, its
little statistical or logical foundation has no role in the global fit assessment and should

126
not be reported (Goodboy & Kline, 2017). According to Kline (2016), the minimal set of
global fit statistics sufficient to report are the X2, RMSEA with 90% CI, CFI, and the
SRMR (Kline, 2016). Table 20 shows the SEM Fit statistics for the study model.
Table 20
SEM Fit Statistics
X2 Degrees
of
freedom
# of distinct
sample
moments
# of distinct
parameters to
be estimated
RMSEA CFI SRMR GFI AGFI
473.76 156 210 54 .061 .906 .023 .951 .903
The confirmatory factor analysis SEM fit model (see Figure 7) was used with
SPSS AMOS (Version 23). In the SEM fit model, I used 20 constructs of indicator
variables, and six latent factors were presumed to account for variations in a set of
measured variables. The regression weights showed that the indicators were loading
significantly. The SEM fit statistics for the study (see Table 20) showed that the X2 (Chi-
Square) had a value of 473.76, the RMSEA had a value of 0.061, the CFI had a value of
.906, and the SRMR had a value of .023. Also, the Goodness-of-Fit Index (GFI) had a
value of .951, and the Adjusted Goodness-of-Fit Index (AGFI) had a value of .903. The
evidence suggest the model is a good fit.
The measurement model fit is shown in Figure 7, showing the parameters after
deletion, and a model fit was generated. Only composite variables were used to estimate
the model fit. TTFF, PCAA, PCAC, PCAG, PCAE, and FCD were removed and not
included in the SEM. Standardized estimate for the SEM model are shown in Table 20
and offers the degrees of freedom at 156, number of distinct sample moments at 210,
number of distinct parameters to be estimated at 54, and the probability level at .000.

127
Figure 7
SEM Model Fit based on Composite Variables
Note. The data was analyzed using IBM SPSS AMOS (Version 23) structural equation
model (SEM) software.
Path Analysis
The SEM analysis and statistics results were used to help answer the research
question and this study's hypotheses. To test the SEM; theoretically, the path analysis is

128
used to investigate the appropriate model and combine the measurement error in both
latent and observed variables (Uslu, 2018). SEM is a regression-based multivariable
method that is combined with path analysis to determine the validity of the research and
analyze the linkage of different sets of factors (Elhajjar & Ouaida, 2020). In the SEM
path analysis, the observed endogenous variables were banking affairs (behavioral
intentions) and mobile banking (actual usage). The observed exogenous variables were
conducting banking affairs (PE), learning to use (EE), influence (SI), environment (FC),
using mobile banking (PC), and using biometric technology (TTF). The results of path
analysis involving regression coefficients and their significances are listed in Figure 8.

129
Figure 8
Conceptual Model with Standardized Regression Estimates
Note. The data was analyzed using IBM SPSS AMOS (Version 23) structural equation
model (SEM) software.

130
The SEM path analysis findings showed that conducting banking affairs, learning
to use, influence, influence, using mobile banking, and using biometric technology had a
positive correlation with biometric technology use and acceptance with mobile banking
in the Mid-Atlantic region. The SEM path analysis showed that TTF and PE with
biometric technology use and acceptance were significant. Also, BI and FC with mobile
banking actual usage had a positive correlation, and they were significant. The results in
Figure 8 displays a visual of the SEM path analysis of biometric technology use and
acceptance with mobile banking in the Mid-Atlantic region based on the six constructs.
Regression Analysis
The standardized regression weights in Table 21 displayed the coefficient
estimates of the constructs. The SI had a coefficient estimate of .030, EE with .144, PC
with .083, TTF with .431, PE (.297), BI (.329), and FC (.328) had a positive correlation
with biometric technology use and acceptance with mobile banking in the Mid-Atlantic
region of the United States.
Table 21
Standardized Regression Weights from SEM Path Analysis
Dependent
variable LISREL Independent variable Estimate
BehaviorInt <--- Social Influence .030
BehaviorInt <--- EffortExp .144
BehaviorInt <--- PerceivedCred .083
BehaviorInt <--- TaskTechFit .431
BehaviorInt <--- PerformanceExp .297
ActualUse <--- BehaviorInt .329
ActualUse <--- FacilitatingCon .328
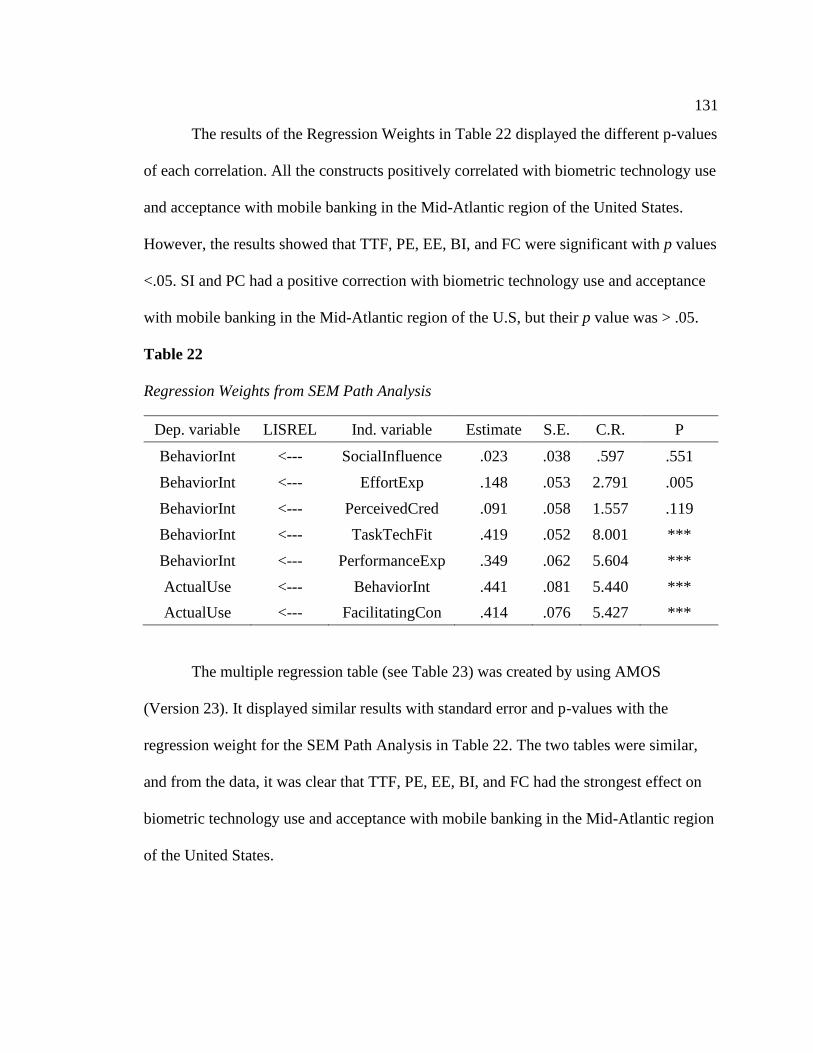
131
The results of the Regression Weights in Table 22 displayed the different p-values
of each correlation. All the constructs positively correlated with biometric technology use
and acceptance with mobile banking in the Mid-Atlantic region of the United States.
However, the results showed that TTF, PE, EE, BI, and FC were significant with p values
<.05. SI and PC had a positive correction with biometric technology use and acceptance
with mobile banking in the Mid-Atlantic region of the U.S, but their p value was > .05.
Table 22
Regression Weights from SEM Path Analysis
Dep. variable LISREL Ind. variable Estimate S.E. C.R. P
BehaviorInt <--- SocialInfluence .023 .038 .597 .551
BehaviorInt <--- EffortExp .148 .053 2.791 .005
BehaviorInt <--- PerceivedCred .091 .058 1.557 .119
BehaviorInt <--- TaskTechFit .419 .052 8.001 ***
BehaviorInt <--- PerformanceExp .349 .062 5.604 ***
ActualUse <--- BehaviorInt .441 .081 5.440 ***
ActualUse <--- FacilitatingCon .414 .076 5.427 ***
The multiple regression table (see Table 23) was created by using AMOS
(Version 23). It displayed similar results with standard error and p-values with the
regression weight for the SEM Path Analysis in Table 22. The two tables were similar,
and from the data, it was clear that TTF, PE, EE, BI, and FC had the strongest effect on
biometric technology use and acceptance with mobile banking in the Mid-Atlantic region
of the United States.

132
Table 23
Multiple Regression Analysis
Variable Unstandardized
coefficients
Standardized
coefficients
Collinearity
statistics
Model B Std. Error Beta T Sig. Tolerance VIF
1 (Constant) -.002 .253 -.008 .994
Conducting Banking
Affairs [PE] .349 .063 .297 5.542 .000 .573 1.746
Learning to Use [EE] .148 .054 .144 2.760 .005 .599 1.669
Influence [SI] .023 .038 .030 .590 .556 .626 1.598
Using MB [PC] .091 .059 .083 1.540 .125 .562 1.778
Using BioTech [TTF] .419 .053 .431 7.912 .000 .552 1.811
Environment [FC] .414 .078 .327 5.342 .000 .823 1.214
Banking Affairs [BI] .441 .082 .328 5.354 .000 .823 1.214
The relationship was linear for all independent variables according to the partial
regression plot; therefore, the linear assumption is met for all independent variables. The
dependent variable and independent variables were linear according to the scatterplot
figure; therefore, the linear assumptions are met overall. Also, homoscedasticity was met
due to the scatterplot dots were uniformly spread on the chart. The Durbin-Watson test in
the model summary (see Table 24) is 1.733, so it is between 1.50 and 2.50; therefore, the
model's errors are independent. To examine the outliners in the data series, I used the
casewise diagnostics, which had 209 case numbers. The standardized residual was 3.2,
just above the standard deviations of 3.0; therefore, the data is considered a moderate
outliner. I used the coefficients table to measure multicollinearity assumptions, which
should not be strongly correlated. In the coefficients table, there adicators, the tolerance
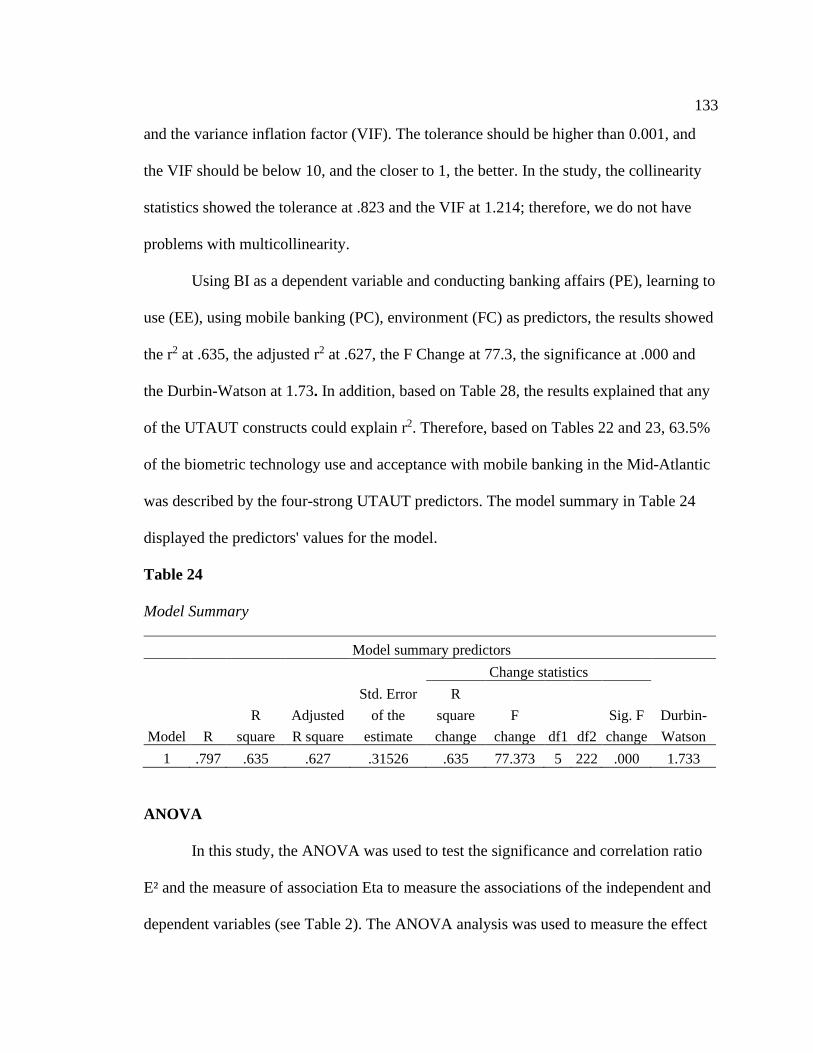
133
and the variance inflation factor (VIF). The tolerance should be higher than 0.001, and
the VIF should be below 10, and the closer to 1, the better. In the study, the collinearity
statistics showed the tolerance at .823 and the VIF at 1.214; therefore, we do not have
problems with multicollinearity.
Using BI as a dependent variable and conducting banking affairs (PE), learning to
use (EE), using mobile banking (PC), environment (FC) as predictors, the results showed
the r2 at .635, the adjusted r2 at .627, the F Change at 77.3, the significance at .000 and
the Durbin-Watson at 1.73. In addition, based on Table 28, the results explained that any
of the UTAUT constructs could explain r2. Therefore, based on Tables 22 and 23, 63.5%
of the biometric technology use and acceptance with mobile banking in the Mid-Atlantic
was described by the four-strong UTAUT predictors. The model summary in Table 24
displayed the predictors' values for the model.
Table 24
Model Summary
Model summary predictors
Model R
R
square
Adjusted
R square
Std. Error
of the
estimate
Change statistics
Durbin-
Watson
R
square
change
F
change df1 df2
Sig. F
change
1 .797 .635 .627 .31526 .635 77.373 5 222 .000 1.733
ANOVA
In this study, the ANOVA was used to test the significance and correlation ratio
E² and the measure of association Eta to measure the associations of the independent and
dependent variables (see Table 2). The ANOVA analysis was used to measure the effect

134
size of the statistical test. Even though the study already showed significant and
nonsignificant data (see Table 23). The E2 was used to show the strength of the
association. Eta Squared (η2) is the percentage of variance in the dependent variable
accounted for by the independent variable and was interpreted the same way as r2.
However, since E2 can be biased and overestimates the true effect size, partial E2 should
be reported. Therefore, the strength of the most reported association in an ANOVA is a
Partial Eta Squared. Partial Eta Squared (η2) was interpreted the same as r2, and the
percentage of variance is the dependent variable accounted for by the independent
variable.
The results in Table 25 showed that PE partial η2 = 45%, EE partial η2 = 37%, SI
partial η2 = 29%, PC partial η2 = 36%, TTF partial η2 = 56%, and FC partial η2 = 24%
showed a respective percentage of the variability of BI of customers biometric
technology use with mobile banking in the Mid-Atlantic region of the United States.
Table 25
ANOVA and Eta Analysis
Variable Eta Eta squared Partial eta squared
Banking Affairs [BI] * Conducting Banking
Affairs [PE] .667 .445 .445
Banking Affairs [BI] * Learning to Use [EE] .604 .365 .365
Banking Affairs [BI] * Influence [SI] .535 .287 .287
Banking Affairs [BI] * Using MB [PC] .603 .363 .363
Banking Affairs [BI] * Using BioTech [TTF] .749 .560 .560
MB Usage [AU] * Environment [FC] .493 .243 .243

135
Data Analysis and Results
The research question and hypotheses were tested with the SEM path analysis and
regression analysis statistics results using SPSS AMOS (Version 23) and SPSS (Version
23). The p-value is used in a test of significance to report the incompatibility between a
set of data and a proposed model for the data constructed under the set of assumptions
with a null hypothesis (Peskun, 2020). Therefore, the p-value measures how much
evidence you have against the null hypothesis. If the value calculated is small, there is
more evidence against the null hypothesis, and if the value is larger, there is less evidence
against the null hypothesis. If the p value or significance value is < .05, I rejected the null
hypothesis. However, if the p value is >.05, I accepted that the constructs will not
significantly affect customers’ BI to use biometric technology with mobile banking. The
next sections are the results of the research questions and hypothesis explained by r2 and
based on the SEM path analysis using SPSS AMOS version 23.
Research Question 1 and Hypotheses 1 - 6
Research Question 1: To what extent do performance expectancy, effort
expectancy, social influence, perceived credibility, task-technology fit, and facilitating
conditions affect the behavioral intentions of customers to adopt biometric technology
with mobile banking?
Hypothesis 1:
H10: Performance expectancy will not affect customers’ behavioral intention to
use biometric technology with mobile banking.

136
H11: Performance expectancy will affect customers’ behavioral intention to use
biometric technology with mobile banking.
Results: PE was positively related to biometric technology with mobile banking in the
Mid-Atlantic region of the United States based on the standardized regression coefficient
estimate β = .30 and explained by r2 = .635. The correlation was significant with the p =
0.00 < .05. Therefore, H10 was rejected in consideration of the alternate hypothesis, H11.
Hypothesis 2:
H20: Effort expectancy will not affect customers’ behavioral intention to use
biometric technology with mobile banking.
H21: Effort expectancy will affect customers’ behavioral intention to use
biometric technology with mobile banking.
Results: EE was positively related to biometric technology with mobile banking in the
Mid-Atlantic region of the United States based on the standardized regression coefficient
estimate β = .144 and explained by r2 = .635. The correlation was significant with the p =
0.005 < .05. Therefore, H20 was rejected in consideration of the alternate hypothesis,
H21.
Hypothesis 3:
H30: Social influence will not influence customers’ behavioral intention to use
biometric technology with mobile banking.
H31: Social influence will influence customers’ behavioral intention to use
biometric technology with mobile banking.
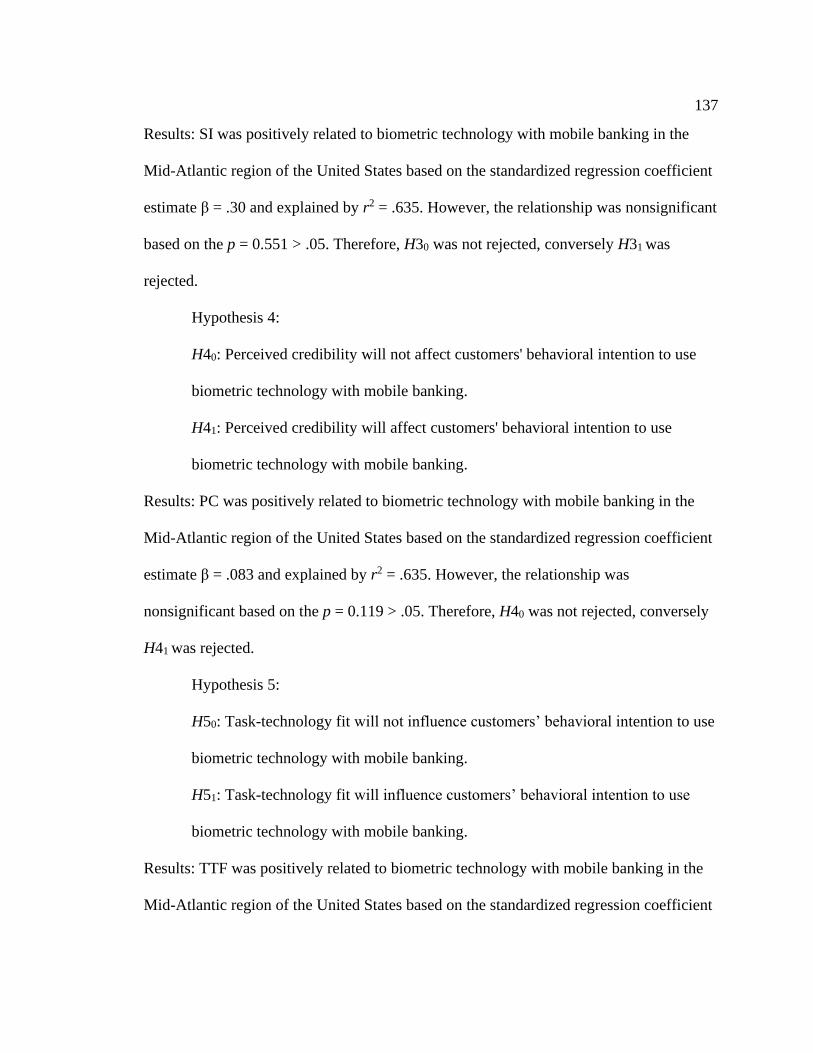
137
Results: SI was positively related to biometric technology with mobile banking in the
Mid-Atlantic region of the United States based on the standardized regression coefficient
estimate β = .30 and explained by r2 = .635. However, the relationship was nonsignificant
based on the p = 0.551 > .05. Therefore, H30 was not rejected, conversely H31 was
rejected.
Hypothesis 4:
H40: Perceived credibility will not affect customers' behavioral intention to use
biometric technology with mobile banking.
H41: Perceived credibility will affect customers' behavioral intention to use
biometric technology with mobile banking.
Results: PC was positively related to biometric technology with mobile banking in the
Mid-Atlantic region of the United States based on the standardized regression coefficient
estimate β = .083 and explained by r2 = .635. However, the relationship was
nonsignificant based on the p = 0.119 > .05. Therefore, H40 was not rejected, conversely
H41 was rejected.
Hypothesis 5:
H50: Task-technology fit will not influence customers’ behavioral intention to use
biometric technology with mobile banking.
H51: Task-technology fit will influence customers’ behavioral intention to use
biometric technology with mobile banking.
Results: TTF was positively related to biometric technology with mobile banking in the
Mid-Atlantic region of the United States based on the standardized regression coefficient

138
estimate β = .431 and explained by r2 = .635. The correlation was significant with the p =
0.00 < .05. Therefore, H50 was rejected in consideration of the alternate hypothesis, H51.
Hypothesis 6:
H60: Facilitating conditions will not influence the actual usage of biometric
technology with mobile banking.
H61: Facilitating conditions will influence the actual usage of biometric
technology with mobile banking.
Results: FC was positively related to biometric technology with mobile banking in the
Mid-Atlantic region of the United States based on the standardized regression coefficient
estimate β = .327 and explained by r2 = .635. The correlation was significant with the p =
0.00 < .05. Therefore, H60 was rejected in consideration of the alternate hypothesis, H61.
Summary
In Chapter 4, I discussed the results of the data collected for this study. Data was
collected from mobile banking customers living in the Mid-Atlantic region of the United
States through a web-based survey through LimeSurvey. I used a purposeful random
sample of participants who will meet the following criteria: (a) participants over the age
of 18 (b) have a banking account (c) use a bank with a mobile application (d) the bank
has biometric technology implemented with their application (e) participant must use
mobile devices (f) participants must use biometric technology. A total of 234 responses
were collected; however, six (6) responses were invalid and discarded, and the remaining
valid 238 survey responses were used for data analysis. SPSS version 23 and SPSS

139
AMOS version 23 was the software used to conduct an empirical analysis of the data in
this study.
The results showed that PE compatibility (β = .30), EE (β = .144), SI (β = .30),
PC (β = .083), TTF (β = .431), and FC (β = .327) variables were all positively related to
biometric technology with mobile banking in the Mid-Atlantic region of the United
States. The data analysis revealed that PE compatibility (β = .30, p < .05), EE (β = .144, p
< .05), TTF (β = .431, p < .05), and FC (β = .327, p < .05) were the significant factors to
positively affect biometric technology with mobile banking in the Mid-Atlantic region of
the United States. Conversely, SI (β = .30) and PC (β = .083) were not significant factors;
they were positively related to biometric technology with mobile banking in the Mid-
Atlantic region of the United States. Comparing the correlations’ strengths of all the
UTAUT constructs to biometric technology use and acceptance with mobile banking in
the Mid-Atlantic region of the United States, TTF and FC were the strongest predictors,
followed by PE and EE. Overall, the four predictors explain 63.5% of the variance of
biometric technology use and acceptance with mobile banking in the Mid-Atlantic region
of the United States. The interpretation and findings of Chapter 4 are further discussed in
Chapter 5. In Chapter 5, I provided recommendations and conclusions of the study,
understanding of the significant results, limitations of the study, and future
recommendations of the study.

140
Chapter 5: Discussion, Conclusions, and Recommendations
The aim of this study was to understand the factors that affect customers'
biometric technology use and acceptance of mobile banking in the Mid-Atlantic region of
the United States, as well as to understand customers' perceptions of using biometric
technology with mobile banking. I explored the relationships between the UTAUT
constructs, PE, EE, SI, FC, and two additional constructs: PC and TTF based on a web-
based survey of bank customers. Data were collected through a purposeful random web-
based survey from customers in the Mid-Atlantic region of the United States through
LimeSurvey. The appropriate sampling size of the study with a confidence level of 95%
and a margin of error of 5% was 228 participants.
The data collected generated 234 responses, including six incomplete survey
responses. After discrediting the vague responses, 228 participants completed responses
(N = 228) used in the data analysis. The study's demographic showed that about 47% of
the participants were men, and 52% were women. Among the participants, 66% were
between the ages of 18 and 29 years of age, 32% were between the ages of 30 and 59
years of age, and 3% were over 60 years old. The sample showed that 62% were single,
33% were married, 3% were divorced, 2% were widowed, and less than 1% were
separated. The participants' educational levels from this study were represented from all
backgrounds. The majority was at 68% with some college experience or held an
undergraduate degree, 11% had a graduate degree, and 21% had a high school diploma.
The study sample also showed different ranges of income levels. Among them, 20% had
an income between $0 and $24 999, 57% had an income between $25,000 and $74,499,

141
18% had an income between $75,000 and 199,000, 4% had an income over $200,000,
and less than 1% preferred not to say give their salary information.
The aim of this quantitative study was to develop a conceptual model that would
have a conceivably more eminent explanatory power concerning the adoption of mobile
banking technology. I created a conceptual framework by extending the UTAUT by
incorporating two additional factors: PC and TTF. A quantitative approach based on a
web-based questionnaire survey collected data from 228 mobile banking customers in the
Mid-Atlantic region. The specific problem is the lack of adoption of biometric
technology by customers and bank managers do not understand the factors influencing
mobile banking application adoption in the Mid-Atlantic region. Chapter 4 discussed how
the study was conducted and how data were collected and analyzed. Chapter 4 shows the
data analysis results, how I tested the hypotheses, and a review of the research questions.
The data collected were analyzed using the SPSS AMOS (Version 23) and SPSS
(Version 23).
Interpretation of Findings
Participants in the study included bank customers from the Mid-Atlantic region
(N = 228), where data were collected through a web-based survey using Lime Survey. I
tested the research question and all the hypotheses of this study using the SEM analysis
and multiple regression statistics results. Based on the hypotheses testing results, H30, (β
= .30, p = .551 > .05), and H40, (β = .083, p = .119 > .05) were nonsignificant and not
rejected. However, based on the testing results, H10, (β = .30, p = < .05), and H20, (β =
.144, p < .05), H50, (β = .431, p < .05), and H60, (β = .327, p < .05) were rejected in

142
consideration of the alternate hypotheses, H11, H21, H51, and H61. See Table 26 for all
the hypotheses results.
Table 26
Hypotheses Results
Null hypothesis Test results
H10: Performance expectancy will not affect customers’ behavioral
intention to use biometric technology with mobile banking.
Rejected
H20: Effort expectancy will not affect customers’ behavioral intention
to use biometric technology with mobile banking.
Rejected
H30: Social influence will not influence customers’ behavioral
intention to use biometric technology with mobile banking.
Not Rejected
H40: Perceived credibility will not affect customers' behavioral
intention to use biometric technology with mobile banking.
Not Rejected
H50: Task-technology fit will not influence customers’ behavioral
intention to use biometric technology with mobile banking.
Rejected
H60: Facilitating conditions will not influence the actual usage of
biometric technology with mobile banking.
Rejected
The results showed that PE (β = .30, p = < .05), EE (β = .144, p < .05), SI (β =
.30, p = .551 > .05), PC (β = .083, p = .119 > .05), TTF (β = .431, p < .05), and FC (β =
.327, p < .05) variables were all positively related to customer acceptance and use of
biometric technology with mobile banking apps in the Mid-Atlantic region of the United
States. In the study, PE (β = .30, p = < .05), EE (β = .144, p < .05), TTF (β = .431, p <
.05), and FC (β = .327, p < .05) were the significant factors to positively affect customer
acceptance and use of biometric technology with mobile banking apps in the Mid-
Atlantic region of the United States. TTF and FC were the strongest predictors, followed
by EE and PE to customers biometric technology use and acceptance with mobile

143
banking apps in the Mid-Atlantic region of the United States. The two nonsignificant
constructs, SI (β = .30, p = .551 > .05), and PC (β = .083, p = .119 > .05) were low
positive correlations for customers biometric technology use and acceptance with mobile
banking apps in the Mid-Atlantic region of the United States. Overall, 63.5% of variance
in customers’ biometric technology use and acceptance with mobile banking apps in the
Mid-Atlantic region of the United States was explained by four of the strongest
predictors. See Appendix S for the hypotheses’ summary of findings.
The data results indicated that PE, EE, TTF, and FC significantly affected
customers' biometric technology use and acceptance with mobile banking apps in the
Mid-Atlantic region of the United States. PE is defined as the extent to which an
individual believes the system will help them perform their activities better, whether
business or personal (Oye et al., 2014). Venkatesh et al. (2016) defined EE as the
measure of effort that customers deal with and use technology. TTF is defined as the
degree whereby the technology will fit the customer's needs and how it affects their PE,
initial trust, and customer adoption intention (Venkatesh et al., 2016). FC is defined as
something that refers to customer's perceptions of the resources and services available to
perform a behavior and how the organization will support using the system (Venkatesh et
al. (2016).
Unlike in previous research by (Buabeng-Andoh & Baah, 2019; Rahi et al., 2019;
Suki & Suki, 2017), in this study, SI was not a significant factor to customers’ biometric
technology use and acceptance of mobile banking apps in the Mid-Atlantic region of the
United States. However, a direct positive relationship of SI on customers’ intention to use

144
the system was consistent with previous peer-reviewed studies on behavior intentions and
mobile banking use (Tarhini et al., 2016). According to the research, the rationale is that
since customers will get influenced by the skepticism created by biometric technology
with mobile banking, trusted interaction with people they trust is critical to their adoption
decisions. In contrast to other previous studies based on the SEM analysis, in this study,
PC was not a significant factor with trust and satisfaction for customers biometric
technology use and acceptance with mobile banking apps in the Mid-Atlantic region of
the United States (Masrek et al., 2018). Also, in difference to previous studies by (Priya
et al., 2018; Tarhini et al., 2016), in this study, PC did not further highlight the
importance of security and privacy, nor was it a strong determinant of customer
satisfaction and behaviors to adopt mobile banking apps. However, PC was consistent
with previous research that found experience influenced PC utilization directly, and
indirect influences were less evident (Thompson et al., 1994). According to the previous
study, PC gets measured with two dimensions; security and confidentiality and having
prior knowledge with information technology is a critical factor when developing,
testing, or applying new information technology adoption and use (Palau-Saumell et al.,
2019; Thompson et al., 1994).
The results of this study were consistent with previous peer-reviewed studies on
mobile banking adoption (e.g., Al-Harby et al., 2010; He et al., 2015; Oye et al., 2014;
Palau-Saumell et al., 2019; Rahi et al., 2018; Saputra et al., 2018; Tarhini et al., 2016;
Tassabehji & Kamala, 2012; Thompson et al., 1994; Venkatesh et al., 2003; Zhou et al.,
2010). Al-Harby et al. (2010) found that UTAUT constructs, PE, EE, SI, and FC were

145
discovered to influence BI to use new technology, and FC determine technology use. In
contrast, out of the four primary constructs (PE, EE, SI, and FC), in my study, SI had no
significant influence on customers' biometric technology adoption with mobile banking
in the Mid-Atlantic region of the United States. Al-Harby et al. (2010) also found that
UTAUT explained 77% of the variance in BI to use new technology and 52% of the
workplace's technology. In my study, the UTAUT demonstrated 63% of the variance in
BI to use new technology by mobile banking customers.
Venkatesh et al. (2003) found that EE has the full attention and awareness of FC
and was a predictor of mobile banking adoption's BI. Rahi et al. (2018), Tarhini et al.
(2016), Zhou et al. (2010) studied customers' intentions to adopt mobile banking in
Pakistan, Lebanon, and China. Tarhini et al., Zhou et al. found that FC had a significant
amount of variance in predicting Pakistan, Lebanese, and Chinese customers' intention to
adopt mobile banking. Similarly, the results of this study showed that FC determine
technology use. Saputra et al. researched customers' adoption of mobile banking
technology and showed that TTF is a proven model that shows customers will adopt a
technology to perform their daily tasks. Saputra et al. also showed that combining TTF
and the UTAUT would determine a customer's perspective. TTF showed that banks who
support and promote security features for customers would positively impact the use and
adoption of biometric technology with mobile banking (Saputra et al., 2018). A previous
study by Chao (2019) revealed that BI was significantly influenced by customers'
satisfaction, trust, PE, and EE. Similarly, in this study, PE and EE were positive
influences on customers trust, security, and customer satisfaction.

146
Limitations of the Study
The study alleviated limitations stated in Chapter 1: the millennial demographic's
usability, e-banking, continuous authentication, transparent, and biometric technology.
Looking at the generations, ranging from the traditionalists, baby boomers, Generation X
(Gen X), millennials (Gen Y), and Generation Z (iGen), there could be differences in
values, beliefs, and opinions from their respective generation. This study does not
investigate the values and attitudes of the millennial generations or other generations.
Another limitation of the study was the method of gathering participants randomly
through an online web-based survey questionnaire. Even though a platform was put in
place to target millennials and other generations, there is no guarantee that the
respondents in this study covered the Mid-Atlantic region of the United States. Another
limitation of the study was that the participants were experienced using biometric
technology with mobile banking, which could cause a selection bias. Another limitation
was the reports of security professional risk and cost-benefit analyses of their e-banking
systems. Security professionals at banks only provided social engineering attacks and did
not include other forms of attacks, and this could cause selection bias (Vila et al., 2014).
A limitation of the study is the focus on transparent and continuous authentication
methods for mobile device security. This study highlights how transparent and
continuous authentication help secure mobile devices for customers. Alotaibi et al. (2015)
discussed how current research only finds suitable behavior patterns for the appropriate
transparent authentication method. Alotaibi et al. and Crawford and Renaud's (2014)
argued a lack of investigation and study of behavioral profiling and application use for

147
open authentication systems on mobile devices. Also, Alotaibi et al., Crawford and
Renaud's, and (Handa et al., 2018) argued that current research only concentrates on
finding suitable behavior patterns for the appropriate continuous and transparent
authentication method. Consequently, banks focus more on the bank's application
services using mobile banking versus the total mobile user authentication at entry
authentication and post-log authentication stages simultaneously.
Lastly, another limitation is biometric technology with mobile banking. Many
factors can affect biometric systems, like technology use, performance, and inadequate
biometric technology devices. Also, biometric technology is not accepted by all
customers as a universal fit for authentication. In this study, biometric technology was
discussed as a complement to the traditional login method of username and password.
There is no guarantee that all participant in the target population will have a minimum
quality of biometric technology devices.
Recommendations
This study will help develop the various factors that were revealed as antecedents
to behaviors in previous research on the adoption of mobile banking application services.
In my investigation, I used the UTAUT and the extension of the UTAUT to examine the
relationship between customer acceptance and use of biometric technology with mobile
banking apps in the Mid-Atlantic region of the United States. Also, in the study, other
intrinsic factors such as PC and TTF were added. In the security world, everyone talks
about cyber-crimes and how to prevent them, and they even want a solution to minimize
network penetration. Therefore, this study is an added step to add more pertinent

148
information to the massive phenomenon of security issues that have caused personal
information from customers using mobile banking apps. In the Mid-Atlantic region,
further study is needed in mobile banking services to understand customer's adoption
behaviors and risk opinion with biometric technology adoption models. Therefore, it is
critical to research on the millennials generation who are the future bank account holders,
and this generation will help guide the next generation into new technology.
In a previous study, it showed that showed 31% of clients would pay for
improved security features, 63% are ready to switch accounts for better security features,
and 71% are eager to change bank accounts to a bank that guaranteed losses and
reimbursed (He et al., 2015). In the United States, 65% of adults who use the internet
have had cybercrime, computer scams, fraud, virus, and malware attacks against them
(He et al., 2015). Crawford and Renaud (2014) explained that 30% of participants had no
security process for accessing their mobile devices even though over 73% of participants
felt that biometric technology was more secure than traditional methods. There are 4
billion mobile cellular subscriptions throughout the world, and mobile networks can offer
mobile banking to over 61% of the world population (Yadav, 2016). As technology
grows and develops, mobile devices are becoming more than just placing calls and
texting people. This study aims to review mobile banking literature through the lenses of
customers adopting and accepting mobile banking risks because of the adoption of
biometric technology with mobile banking.
Previous studies from researchers have used several theoretical frameworks to
study customers' use and acceptance of mobile banking apps. Among all the theories and

149
research models, the UTAUT was a more appropriate method due to the proven research
instrument. The UAUT found to be a predictor of adoption and BI with a focus on PE,
and EE can positively influence the BI of customers to use technology (Tarhini et al.,
2016; Venkatesh et al. (2003). However, past research model has shown and identified
distinct factors that significantly affected customers attitudes, behaviors and adoption of
technology customers' perception and how they feel about a new service has shown the
model like the (Boslaugh, 2013; Chang et al., 2015; Dziak, 2017; Marques et al., 2011;
Petre, 2017; Procter et al., 2019; Tavallaee et al., 2017; Venkatesh et al., 2003). Using
more than one theoretical framework can be useful to conduct a study on customers
biometric technology use and acceptance with mobile banking apps.
In this study, I examined the factors affecting biometric technology with mobile
banking in the Mid-Atlantic region of the United States using the UTAUT theoretical
framework and two more constructs, PC, and task-technology. Therefore, future research
could focus on other constructs and relationships implemented into the UTAUT by
tailoring it to the customer's use context. Further research is suggested by examining how
to categorize data classification of mobile apps at sensitive levels. Transparent
authentication offers behind-the-scenes authentication and threat detection capabilities to
protect against fraud attacks while improving the customers' experience. Continuous
authentication comes into play because anyone can access your information after point-
of-entry on mobile devices if they gain access. Also, future research should examine the
use of different theoretical frameworks to conduct a similar study. Theories and models
such as:
150
• TRA
• TAM
• C-TAM-TPB
• MM
• TPB
• MPCU
• IDT
• SCT can conduct a similar study on biometric technology adoption with
mobile bank apps.
Finally, this study was based on a quantitative research approach. The research
objectives and goals were met; however, this study would have more substantial findings
if a mix-method approach were implemented.
Implications
The data from this study affect social change by providing bank CEOs’ with
critical information so decisions can be made on how to measure and implement a
successful mobile banking application using biometric technology. Bank intuitions
leaders can use the finding of this study to improve the security features of mobile
banking. The core level of security features of mobile banking, bank CEOs’, will have to
look at are (a) mobile application layer, (b) security layer, and (c) customers' trust, which
will help provide solutions and confirm trust with customers. This study's findings
showed that PE was significantly positively correlated with biometric technology use
with mobile banking in the Mid-Atlantic region of the United States. EE was significantly

151
positively correlated with biometric technology use with mobile banking in the Mid-
Atlantic region of the United States. TTF was significantly positively correlated with
biometric technology use with mobile banking in the U.S. Mid-Atlantic region. FC was
significantly positively correlated with biometric technology use with mobile banking in
the Mid-Atlantic region of the United States.
This study contributes to the banking industry by providing bank CEOs’, leaders,
and customers with the security measures it takes to create and work with other
technologies about biometric technology with mobile banking apps. Having a mobile
banking system is essential for banks to operate and sustain customer satisfaction.
Therefore, creating a secure mobile application is necessary to keep mobile banking
customers. The results of this study may help bank leaders understand the perception of
bank customers, and therefore reach their customers by identifying the social and ethical
concerns related to biometric technology deployment and the mitigating of risk
associated with security attacks by identifying the person(s) participating in the operation.
Conclusions
This study was conducted to explore the factors affecting customers' biometric
technology use and acceptance of mobile banking in the Mid-Atlantic region of the
United States. The target population of this study was in the Mid-Atlantic region of the
United States, which was estimated at 41 million according to the 2019 U.S. Census
report. The appropriate sample size of this study was 228 participants to represent the
target population. Using a purposeful random sample, the participants included adults
who met the following criteria: (a) over the age of 18, (b) have a banking account, (c) use

152
a bank with a mobile application, (d) the bank has biometric technology implemented
with their application, (e) participant use mobile devices, and (f) participants use
biometric technology. The participants were contacted through social media sites, like
Facebook, Instagram, Twitter, and LinkedIn. This study's theoretical base was the
UTAUT. A conceptual framework was developed by extending the UTAUT by
incorporating two additional factors: PC and TTF.
The web-based survey analysis revealed that three factors of the UTAUT and one
factor of the theoretical framework by extending the UTAUT, TTF was significant
factors influencing customer acceptance and use of biometric technology with mobile
banking apps in the Mid-Atlantic region of the United States. TTF and FC were the
strongest predictors, followed by PE and EE. The study results revealed that PE, EE, SI,
and FC positively correlated with BI to use new technology, and FC determine
technology use. However, SI and PC had no significant influence on customers biometric
technology adoption with mobile banking in the Mid-Atlantic region of the United States.
There are many types of mobile devices like tablets, smartphones, tablet
computers that customers use daily. Developing safe practices will help customers keep
their information safe. This study explained how customers accept and use biometric
technology with mobile banking in the Mid-Atlantic region of the United States. This
study provided bank CEOs’ with knowledge of customers' opinions of biometric
technology with mobile bank apps so decisions can improve mobile banking's security
features. The finding of this study can be used to develop strategies to expand biometric

153
technology by mitigating the risk associated with security attacks by identifying the
person(s) participating in the operation of the mobile bank application.

154
References
Abdullaev, A., Al-Absi, M. A., Al-Absi, A., Sain, M., Lee, Y. S., & Lee, H. J. (2019).
Security challenge and issue of mobile banking in Republic of Uzbekistan: A state
of art survey. 2019 21st International Conference on Advanced Communication
Technology (ICACT), 249. https://doi.org/10.23919/ICACT.2019.8701952
Abidah, S. N., Runjati, S. H., Hidayat, S. T., Suwondo, S. T., & Mulyantoro, D. K.
(2017). Effect of carica papaya L leaf on menstrual pain and prostaglandin level
in adolescent with primary dysmenorrhea: A true experiment. Belitung Nursing
Journal, 3(3), 198. https://doi.org/10.33546/bnj.96
Adapa, S., & Roy, S. K. (2017) Consumers’ post-adoption behavior towards Internet
banking: empirical evidence from Australia. Behavior & Information Technology,
36(9), 97-983. http://doi.org./10.1080/0144929X.2017.1319498
Aggarwal, S., & Varghese, I. (2014). The new mobile banking password – Your voice.
Global Finance, 28(9), 14-17. https://www.gfmag.com/magazine/october-
2014/new-mobile-banking-password-your-voice
Akoramurthy, B., & Arthi, J. (2016). GeoMoB - A geo-location-based browser for
secured mobile banking. 2016 Eighth International Conference on Advanced
Computing (ICoAC), Advanced Computing (ICoAC), 83-88.
https://doi.org/10.1109/ICoAC.2017.7951750

155
Al-Harby F., Qahwaji R., & Kamala M. (2010). Users’ acceptance of secure biometrics
authentication system: Reliability and validate of an extended UTAUT model.
Communications in Computer and Information Science, 254-258.
https://doi.org/10.1007/978-3-642-14292-5_27
Alhothaily, A., Hu, C., Alrawais, A., Song, T., Cheng, X., & Chen, D. (2017). A secure
and practical authentication scheme using personal devices. IEEE Access, 5,
11677. https://doi.org/10.1109/ACCESS.2017.2717862
Al-Khafaji, N. J., Abdullah, R. M., & Kashmoola, M. A. (2018). Application of the task
technology fit model to evaluate the implementation of electronic file tracking
prototype. 2018 IEEE 5th International Conference on Smart Instrumentation,
Measurement, and Application (ICSIMA), 1-9.
https://doi.org/10.1109/ICSIMA.2018.8688772
Almalki, S. (2016). Integrating quantitative and qualitative data in mixed methods
research—Challenges and benefits. Journal of Education and Learning, 5(3),
288–296. https://doi.org/10.5539/jel.v5n3p288
Alotaibi, S., Furnell, S., & Clarke, N. (2015). Transparent authentication systems for
mobile device security: A review. 2015 10th International Conference for
Internet Technology & Secured Transactions (ICITST), 47, 406-413.
https://doi.org/10.1109/ICITST.2015.7412131

156
Al-Sharhan, S., Omran, E., & Lari, K. (2019). An integrated holistic model for an
eHealth system: A national implementation approach and a new cloud-based
security model. International Journal of Information Management, 47, 121–130.
https://doi.org/10.1016/j.ijinfomgt.2018.12.009
Andrade, C. (2018). Internal, external, and ecological validity in research design,
conduct, and evaluation. Indian Journal of Psychological Medicine, 40(5), 498-
499. https://doi.org/10.4103/IJPSYM.IJPSYM_334_18
Armstrong, C. S., & Kepler, J. D. (2018). Theory, research design assumptions, and
causal inferences. Journal of Accounting & Economics, 66(2–3), 366–373.
https://doi.org/10.1016/j.jacceco.2018.08.012
Baabdullah, A. M., Alalwan, A. A., Rana, N. P., Kizgin, H., & Patil, P. (2019). Consumer
use of mobile banking (M-Banking) in Saudi Arabia: Towards an integrated
model. International Journal of Information Management. 44, 38-52.
https://doi.org/10.1016/j.ijinfomgt.2018.09.002
Baek, Y. M., Bae, Y., Jeong, I., Kim, E., & Rhee, J. W. (2014). Changing the default
setting for information privacy protection: What and whose personal information
can be better protected? The Social Science Journal, 51, 523–533.
https://doi.org/10.1016/j.soscij.2014.07.002
Bagadia, P., & Bansal, A. (2016). Risk perception and adoption of mobile banking
services: A review. IUP Journal of Information Technology, 12(1), 52–71.
https://ssrn.com/abstract=2837666

157
Bandura, A. (2001). Social cognitive theory: An agentic perspective. Annual Review Of
Psychology, 52, 1–26. https://doi.org/10.1146/annurev.psych.52.1.1
Bank Strategist. (2020). Community banks: Number by state and asset size.
https://www.bankingstrategist.com/community-banks-number-by-state-and-asset-
size
Bärnighausen, T., Tugwell, P., Røttingen, J. A., Shemilt, I., Rockers, P., Geldsetzer, P.,
Lavis, J., Grimshaw, J., Daniels, K., Brown, A., Bor, J., Tanner, J., Rashidian, A.,
Barreto, M., Vollmer, S., & Atun, R. (2017). Quasi-experimental study designs
series—paper 4: uses and value. Journal of Clinical Epidemiology. 89, 21-29.
https://doi.org/10.1016/j.jclinepi.2017.03.012
Benoot, C., Hannes, K., & Bilsen, J. (2016). The use of purposeful sampling in a
qualitative evidence synthesis: A worked example on sexual adjustment to a
Cancer trajectory. BMC Medical Research Methodology, 16(1), 1-12.
https://doi.org/10.1186/s12874-016-0114-6
Bicen, H., & Arnavut, A. (2015). Determining the effects of technological tool use habits
on social lives. Computers in Human Behavior, 48, 457-462.
https://doi.org/10.1016/j.chb.2015.02.012
Biometric Technology Today. (2017). US adults want more biometrics options for
mobile banking. Biometric Technology Today. 2017(6), 12.
https://doi.org/10.1016/S0969-4765(17)30118-2

158
Bosch, O. J., Revilla, M., & Paura, E. (2019). Do millennials differ in terms of survey
participation? International Journal of Market Research, 61(4), 359–365.
https://doi.org/10.1177/1470785318815567
Boslaugh, S. E. (2013). Theory of planned behavior. In Salem Press encyclopedia. Parker
University. https://library.parker.edu/eds/detail?db=ers&an=113931228
Bostic, R., & Johnson, M. (2020, February 25). How to keep community banks thriving.
https://www.americanbanker.com/opinion/how-to-keep-community-banks-
thriving
BouMjahed, L., & Mahmassani, H. S. (2018). Wired at birth: Childhood, technology
engagement and travel behavior. Transportation Research Record, 2672(50), 66–
78. https://doi.org/10.1177/0361198118798460
Brenner, P. S., & DeLamater, J. (2016). Lies, damned lies, and survey self-reports?
Identity as a cause of measurement bias. Social Psychology Quarterly, 79(4), 333.
https://doi.org/10.1177/0190272516628298
Briscoe, P. (2017). Using a critical reflection framework and collaborative inquiry to
improve teaching practice: An action research project. Canadian Journal of
Action Research, 18(2), 43–61. https://eric.ed.gov/?id=EJ1169296
Brooks, M., Aragon, C. R., & Komogortsev, O. V. (2013). Perceptions of interfaces for
eye movement biometrics. Biometrics (ICB), 2013 International Conference. 1-8.
https://doi.org/10.1109/ICB.2013.6613018

159
Buabeng-Andoh, C., & Baah, C. (2019). Investigating the actual usage of learning
management system: From perspectives of university students. 2019 International
Conference on Computing, Computational Modelling and Applications (ICCMA),
Computing, Computational Modelling and Applications (ICCMA), 1-17.
https://doi.org/10.1109/ICCMA.2019.00008
Caldwell, T. (2017). US adults want more biometrics options for mobile banking.
Biometric Technology Today, 2017(6), 12. https://doi.org/10.1016/S0969-
4765(17)30118-2
Chang, H. H., Fu, C. S., & Jain, H. T. (2015). Modifying UTAUT and innovation
diffusion theory to reveal online shopping behavior: Familiarity and perceived
risk as mediators. Information Development, 32(5), 1757–1773.
https://doi.org/10.1177/0266666915623317
Chao, C. M. (2019). Factors determining the behavioral intention to use mobile learning:
An application and extension of the UTAUT model. Frontiers in Psychology.
https://doi.org/10.3389/fpsyg.2019.01652
Chavali, K., & Kumar, A. (2018). Adoption of mobile banking and perceived risk in
GCC. Banks and Bank Systems, 13(1), 72-79.
https://doi.org/10.21511/bbs.13(1).2018.07
Chen, F. M., & Liu, Y.Q. (2015). Research on the risk factors of mobile business: based
on the sorting Delphi method. International Journal of Engineering Research in
Africa, (21), 215-230. https://doi.org/10.4028/www.scientific.net/JERA.21.215

160
Chung-Hua, C., Hsiao-Ting, S., & Chih-Hua, T. (2017). Study of touch identify for
mobile device security. 2017 IEEE International Symposium on Multimedia
(ISM), Multimedia (ISM), 2017 IEEE International Symposium on, ISM, 475-478.
https://doi.org/10.1109/ISM.2017.94
Combs, J. F. (2014). Mobile banking risk identification and mitigation. Community
Banking Connections.
https://www.communitybankingconnections.org/articles/2014/q1/mobile-banking-
risk-identification-and-mitigation
Cook, S. (2017). Selfie banking: is it a reality? Biometric Technology Today, 2017(3), 9–
11. https://doi.org/10.1016/S0969-4765(17)30056-5
Crawford, H., & Renaud, K. (2014). Understanding user perceptions of transparent
authentication on a mobile device. Journal of Trust Management, 1(1), 1-28.
https://doi.org/10.1186/2196-064X-1-7
Crosman, P. (2014). Banks lay plans to build fingerprint technology into mobile apps.
American Banker, 179(88), 13. https://www.americanbanker.com/news/banks-
lay-plans-to-build-fingerprint-technology-into-mobile-apps
D'Arcy, J., Herath, T., & Shoss, M. K. (2014). Understanding employee responses to
stressful information security requirements: A coping perspective. Journal of
Management Information Systems, 31(2), 285-318.
https://doi.org/10.2753/MIS0742-1222310210

161
Das, A., Blumenstein, M., Pal, U., & Ferrer, M. A. (2016). A framework for liveness
detection for direct attacks in the visible spectrum for multimodal ocular
biometrics. Pattern Recognition Letters, 8(2), 232-241.
https://doi.org/10.1016/j.patrec.2015.11.016
Dziak, M. (2017). Technology acceptance model (TAM). In Salem Press Encyclopedia of
Science. Salem Press.
Dziak, M. (2018). Theoretical framework. In Salem Press Encyclopedia. Salem Press
Enam, A., & Konduri, K. C. (2018). Time allocation behavior of twentieth century
American generations: GI generation, silent generation, baby boomers,
Generation X, and millennials. Transportation Research Record, 2672(49), 69–
80. https://doi.org/10.1177/0361198118794710
Evon, T., & Leby Lau, J. (2016). Behavioral intention to adopt mobile banking among
the millennial generation. Young Consumers, 17(1), 18–31.
https://doi.org/10.1108/YC-07-2015-00537
Faul, F., Erdfelder, E., Buchner, A., & Lang, A. G. (2009). Statistical power analyses
using G*Power 3.1: Tests for correlation and regression analyses. Behavior
Research Methods, 41, 1149-1160. https://doi.org/10.3758/BRM.41.4.1149
Federal Trade Commission. (2019). FTC releases 2018 privacy and data security update.
https://www.ftc.gov/reports/privacy-data-security-update-2018
Flair, I. (2019). Mobile applications. In Salem Press Encyclopedia. Salem Press.

162
Fortunato, D., & Bernardino, J. (2018). Progressive web apps: An alternative to the
native mobile Apps. Conference on Information Systems and Technologies
(CISTI), Information Systems and Technologies (CISTI), 2018 13th Iberian
Conference, 1-6. https://doi.org/10.23919/CISTI.2018.8399228
Frankfort-Nachmias, C., & Leon-Guerrero, A. (2015). Social statistics for a diverse
society (7th ed.). Sage Publications.
Funk, P. (2016). How accurate are surveyed preferences for public policies? Evidence
from a unique institutional setup. Review of Economics and Statistics, 98(3), 442-
454. https://doi.org/10.1162/REST_a_00585
Gamble, R. H. (2018). Mobile loyalty. Credit Union Management, 41(12), 18–22.
https://pubs.royle.com/publication/frame.php?i=544687&p=&pn=&ver=html5&v
iew=articleBrowser&article_id=3242349
Gautam, P., & Dawadi, P. R. (2017). Keystroke biometric system for touch screen text
input on android devices optimization of equal error rate based on medians vector
proximity. (2017). 2017 11th International Conference on Software, Knowledge,
Information Management, and Applications (SKIMA). 1-7.
https://doi.org/10.1109/SKIMA.2017.8294136
Gehrke, C. (2019). CEO succession planning in small community banks: A qualitative
case study of “PNW” Bank. Journal of Accounting & Finance (2158-3625),
19(6), 61–103. https://doi.org/10.33423/jaf.v19i6.2316

163
Gonzalez-Cotto, R. (2018). Crusade against e-banking fraud tackles privacy issues.
Caribbean business, 4(33), 5. https://caribbeanbusiness.com/epapers/?page-
img313233=8#250
Goodboy, A. K., & Kline, R. B. (2017). Statistical and practical concerns with published
communication research featuring structural equation modeling. Communication
Research Reports, 34(1), 68–77. https://doi.org/10.1080/08824096.2016.1214121
Goyal, S., Chawla, D., & Bhatia, A. (2016). Innovation: Key to improve business growth
of banking industry. International Journal of Advances in Engineering &
Technology, 9(3), 331-346.
https://archive.org/details/7I33IJAET0932174V9Iss3Pp331346
Green, H. E. (2014). Use of theoretical and conceptual frameworks in qualitative
research, 21(6), 34-38. https://doi.org/10.7748/nr.21.6.34.e1252
Grimes, R. A. (2017). Hacking the Hacker : Learn From the Experts Who Take Down
Hackers. Wiley.
Guo, J., & Yang, H. (2018). Three-stage optimization method for concurrent
manufacturing energy data collection. International Journal of Computer
Integrated Manufacturing, 31(4-5), 479–489.
https://doi.org/10.1080/0951192X.2017.1305508
He, W., Tian, X., & Shen, J. (2015). Examining security risks of mobile banking
applications through blog mining. MAICS, 103-108. http://ceur-ws.org/Vol-
1353/paper_24.pdf

164
Hahn, A., (2018). Questionnaire (research instrument). In Salem Press Encyclopedia.
Salem Press.
Handa, J., Singh, A., Goyal, A., & Aggarwal, P. (2018). Behavioral biometrics for
continuous authentication. (2018). 2018 Fifth International Conference on
Parallel, Distributed and Grid Computing (PDGC), Parallel, Distributed and
Grid Computing (PDGC), 284-289. https://doi.org/10.1109/PDGC.2018.8745880
Hess, S., & Van Der Stad, C. (2016). The rise of biometric authentication. (2016). Credit
Union Times, 27(12), 10. https://www.cutimes.com/2016/04/10/the-rise-of-
biometric-authentication/?slreturn=20210027014528
Hesse-Biber, S. (2016). Qualitative or mixed methods research inquiry approaches: Some
loose guidelines for publishing in Sex Roles [Editorial]. Sex Roles: A Journal of
Research, 74(1-2), 6–9. https://doi.org/10.1007/s11199-015-0568-8
Heun, D. (2015). Banks need a 'Team America' approach to security: Tim Pawlenty.
American Banker, 180(48), 1. https://www.americanbanker.com/news/banks-
need-a-team-america-approach-to-security-tim-pawlenty
Hoffmann, J., Ivcevic, Z., & Brackett, M. (2016). Creativity in the age of technology:
Measuring the digital creativity of millennials. Creativity Research Journal,
28(2), 149–153. https://doi.org/10.1080/10400419.2016.1162515

165
Hong, R. (2019). Research on mobile user behavior mining model based on big data.
2019 4th International Conference on Mechanical, Control and Computer
Engineering (ICMCCE), Mechanical, Control and Computer Engineering
(ICMCCE), 2019 4th International Conference On, 461–4613.
https://doi.org/10.1109/ICMCCE48743.2019.00110
Hsiao Chun-Hua, & Tang Kai-Yu. (2014). Explaining undergraduates’ behavior intention
of e-textbook adoption: Empirical assessment of five theoretical models. Library
Hi Tech, 32(1), 139–163. https://doi.org/10.1108/LHT-09-2013-0126
Hunter, M. D. (2018). State space modeling in an open source, modular, structural
equation modeling environment. Structural Equation Modeling, 25(2), 307-324.
https://doi.org/10.1080/10705511.2017.1369354
IEEE. (2020). Standard for Biometric Liveness Detection. IEEE Standard 2790-2020, 1–
24. https://doi.org/10.1109/IEEESTD.2020.9080669
Ivaturi, K., & Janczewski, L. (2013). Social engineering preparedness of online banks:
An Asia-Pacific perspective. Journal of Global Information Technology
Management, 21-46. https://doi.org/10.1080/1097198X.2013.10845647
Jammal, M., Hawilo, H., Kanso, A., & Shami, A. (2016). Mitigating the risk of cloud
services downtime using live migration and high availability-aware placement.
2016 IEEE International Conference on Cloud Computing Technology and
Science (CloudCom), Cloud Computing Technology and Science (CloudCom),
578-583. https://doi.org/10.1109/CloudCom.2016.0100

166
Jensen, M. L., Dinger, M., Wright, R. T., & Thatcher, J. B. (2017). Training to mitigate
phishing attacks using mindfulness techniques. Journal of Management
Information Systems, 34(2), 597–626.
https://doi.org/10.1080/07421222.2017.1334499
Jordan, D. R. (2016). Risk (finance). In Salem Press Encyclopedia. Salem Press.
Kaman, S., Swetha, K., Akram, S., & Varaprasad, G. (2013). Remote user authentication
using a voice authentication system. Information Security Journal: A Global
Perspective, 22(3), 117-125. https://doi.org/10.1080/19393555.2013.801539
Kankanhalli, A., Teo, H.-H., Tan, B. C. Y., & Wei, K.-K. (2003). An integrative study of
information systems security effectiveness. International Journal of Information
Management, 23(2), 139–154. https://doi.org/10.1016/S0268-4012(02)00105-6
Kiheung, N., Zoonky, L., & Bong Gyou, L. (2016). How internet has reshaped the user
experience of banking service? KSII Transactions on Internet & Information
Systems, 10(2), 684–702. https://doi.org/10.3837/tiis.2016.02.014
Kline, R. B. (2016). Principles and practice of structural equation modeling (4th ed.).
Guilford.
Kroeze, C. J., & Malan, K. M. (2016). User authentication based on continuous touch
biometrics. South African Computer Journal, 28(2) (2016).
https://doi.org/10.18489/sacj.v28i2.374
Lappi, O., & Mole, C. (2018). Visuomotor control, eye movements, and steering: A
unified approach for incorporating feedback, feedforward, and internal models.
Psychological Bulletin, 144(10), 981–1001. https://doi.org/10.1037/bul0000150

167
Laukkanen, T. (2016). Consumer adoption versus rejection decisions in seemingly
similar service innovations: The case of the internet and mobile banking. Journal
of Business Research, 69(7), 2432–2439.
https://doi.org/10.1016/j.jbusres.2016.01.013
Lasky, J. (2014). Biometrics. In Salem Press Encyclopedia of Health. Salem Press.
Lee, J. M., Lee, B., & Rha, J. Y. (2019). Determinants of mobile payment usage and the
moderating effect of gender: Extending the UTAUT model with privacy risk.
International Journal of Electronic Commerce Studies, 10(1), 43–64.
https://doi.org/10.7903/ijecs.1644
Lim, J., & Ayyagari, R. (2018). Investigating the determinants of telepresence in the e-
commerce setting. Computers in Human Behavior, 85, 360–371.
https://doi.org/10.1016/j.chb.2018.04.024
Liu, B., Tao, T., & Zhang, B. (2014). How to design the e-government information
security legislation. Applied Mechanics & Materials, 556-562, 5367-5370.
https://doi.org/10.4028/www.scientific.net/AMM.556-562.5367
Liu, D., Santhanam, R., & Webster, J. (2017). Toward meaningful engagement: A
framework for design and research of gamified information systems. MIS
Quarterly, 41(4), 1011-1-A4. https://doi.org/10.25300/MISQ/2017/41.4.01
Loftfield, E., Yi, S., Immerwahr, S., & Eisenhower, D. (2015). Construct validity of a
single-item, self-rated question of diet quality. Journal of Nutrition Education and
Behavior, 47(2), 181-187. https://doi.org/10.1016/j.jneb.2014.09.003

168
Loker, M. (2018). Conveniently exposed: How the convenience of the internet Is
exposing you to identity theft. Journal of Internet Law, 22(2), 3–7.
https://www.masader.om/eds/detail?db=lgs&an=131209408&isbn=10942904
Luo, M. M., Chea, S., & Chen, J. S. (2011). Web-based information service adoption: A
comparison of the motivational model and the uses and gratifications theory.
Decision Support Systems, 51(1), 21–30.
https://doi.org/10.1016/j.dss.2010.11.015
Maharani, H., Subroto, B., & Ghofar, A. (2017). Assessing taxpayer behavior in utilizing
e-filling tax system with the perspective of technology acceptance model and the
theory of planned behavior. Russian Journal of Agricultural and Socio-Economic
Sciences, 67(7), 93-101. https://doi.org/10.18551/rjoas.2017-07.10
Makrakis, V., & Kostoulas-Makrakis, N. (2016). Bridging the qualitative-quantitative
divide: Experiences from conducting a mixed methods evaluation in the RUCAS
program. Evaluation and Program Planning, 54, 144–151.
https://doi.org/10.1016/j.evalprogplan.2015.07.008
Malaquias, F. F. O., & Hwang, Y. (2016). Trust in mobile banking under conditions of
information asymmetry: Empirical evidence from Brazil. Information
Development, 32(5), 1600–1612. https://doi.org/10.1177/0266666915616164

169
Malarvizhi, V., & Geetha, K. T. (2017). An empirical investigation on users’ and non-
users’ perceptions about e-banking services in Coimbatore city. International
Journal of Economic Perspectives, 11(2), 160–170.
https://search.proquest.com/openview/4bd5cf88cf8369c56fe9834e4b93c273/1?pq
-origsite=gscholar&cbl=51667
Malaquias, R. F., & Hwang, Y. (2019). Mobile banking use: A comparative study with
Brazilian and U.S. participants. International Journal of Information
Management. 44, 132-140. https://doi.org/10.1016/j.ijinfomgt.2018.10.004
Marques, B. P., Villate, J. E., & Carvalho, C. V. (2011). Applying the UTAUT model in
engineering higher education: Teacher's technology adoption. 6th Iberian
Conference on Information Systems and Technologies (CISTI 2011), 1-6.
https://www.worldcat.org/title/cisti-2011-6th-iberian-conference-on-information-
systems-and-technologies-15-18-june-2011/oclc/1035799037
Martínez-Mesa, J., González-Chica, D.A., Pereira, R.D., Bonamigo, R.R., & Bastos, J. L.
(2016). Sampling: how to select participants in my research study. Anais
Brasileiros de Dermatologia, 91(3), 326-330. https://doi.org/10.1590/abd1806-
4841.20165254
Masrek, M. N., Halim, M. S. A, Khan, A., & Ramli, I. (2018). The impact of perceived
credibility and perceived quality on trust and satisfaction in mobile banking
context. Asian Economic and Financial Review. 8(7). 1013-1025.
https://doi.org/10.18488/journal.aefr.2018.87.1013.1025
McFarland, R. E. (2013). Banking industry. In Salem Press Encyclopedia. Salem Press.

170
MengHui, L., Teoh, A. B. J., & Jaihie, K. (2015). "Biometric feature-type transformation:
Making templates compatible for secret protection," in Signal Processing
Magazine, IEEE, 2(5), 77-87. https://doi.org/10.1109/MSP.2015.2423693
Milić, D. C., Štefanac, K., & Kovačević, D. (2017). Synergy of information
communication technologies and the banking system in the functioning of
successful banking operations. Ekonomski Vjesnik, 30(2), 473.
https://www.ceeol.com/search/article-detail?id=600558
Miltgen, C. L., Popovic, A., & Oliveira, T. (2013). Determinants of end-user acceptance
of biometrics: Integrating the "Big 3" of technology acceptance with privacy
context. Decision Support Systems, 56,103-114.
https://doi.org/10.1016/j.dss.2013.05.010
Mishra, P., Pandey, C. M., Singh, U., Gupta, A., Sahu, C., & Keshri, A. (2019).
Descriptive statistics and normality tests for statistical data. Annals of cardiac
anesthesia, 22(1), 67–72. https://doi.org/10.4103/aca.ACA_157_18
Moldovan, I. Z., & Saplacan, Z. (2018). What makes Romanians to bank on their
smartphones? Determinants of mobile banking adoption. Studia Universitatis
Babes-Bolyai, Negotia, 63(1), 5.
https://ideas.repec.org/a/bbn/journl/2018_1_1_moldovan.html
Mosquera, A., Juaneda-Ayensa, E., Olarte-Pascua, C., & Pelegrin-Borondo, J. (2018).
Key factors for in-store smartphone use in an omnichannel experience:
Millennials vs. nonmillennials. Complexity. 2018, Article ID 1057356, 14.
https://doi.org/10.1155/2018/1057356

171
Muñoz-Leiva, F., Climent-Climent, S., & Liébana-Cabanillas, F. (2017). Determinants of
intention to use the mobile banking apps: An extension of the classic TAM model.
Spanish Journal of Marketing - ESIC, 21(1), 25–38.
https://doi.org/10.1016/j.sjme.2016.12.001
Norris, J. M., Plonsky, L., Ross, S. J., & Schoonen, R. (2015). Guidelines for reporting
quantitative methods and results in primary research. Language Learning: A
Journal of Research in Language Studies. 65(2). 470-476.
https://doi.org/10.1111/lang.12104
Nosrati, L., & Bidgoli, A. M. (2016). A review of mobile banking security. 2016 IEEE
Canadian Conference on Electrical and Computer Engineering (CCECE),
Electrical and Computer Engineering (CCECE), 2016 IEEE Canadian
Conference On, 1-5. https://doi.org/10.1109/CCECE.2016.7726820
Okereafor, K., Onime, C., & Osuagwu, O. (2017). Enhancing biometric liveness
detection using trait randomization technique. 2017 UKSim-AMSS 19th
International Conference on Computer Modelling & Simulation (UKSim),
Computer Modelling & Simulation (UKSim), 28–33.
https://doi.org/10.1109/UKSim.2017.44
Onywoki, B. M., & Opiyo, E. T. (2016). A framework for the adoption of biometric
ATM authentication in the Kenyan banks. Computers and Society.
https://arxiv.org/abs/1602.04620

172
Opara, E. U., & Etnyre, V. (2010). Enterprise systems network: SecurID solutions, the
authentication to global security systems. Journal of International Technology &
Information Management, 19(4), 21-35. https://doi.org/10.4018/IJISP
Osborn, D. R. (2019). Quasi-experimental designs. In Salem Press Encyclopedia of
Health. Salem Press.
OWASP. (2019). Top 10 mobile risks. Open web application security project (OWASP).
OWASP Mobile Security Project. https://owasp.org/www-project-mobile-top-10/
Oye, N. D., Iahad, N. A., & Rahim, N. A. (2014). The history of UTAUT model and its
impact on ICT acceptance and usage by academicians. Education and Information
Technologies, 19(1), 251-270. https://doi.org/10.1007/s10639-012-9189-9
Palacios Martínez, I. M. (2020). Methods of data collection in English empirical
linguistics research: Results of a recent survey. Language Sciences, 78.
https://doi.org/10.1016/j.langsci.2019.101263
Palau-Saumell, R., Forgas-Coll, S., Sánchez-García, J., & Robres, E. (2019). User
acceptance of mobile apps for restaurants: An expanded and extended UTAUT-2.
Sustainability, 11(4), 1210. https://doi.org/10.3390/su11041210
Palinkas, L. A., Horwitz, S. M., Green, C. A., Wisdom, J. P., Duan, N., & Hoagwood, K.
(2015). Purposeful sampling for qualitative data collection and analysis in mixed
method implementation research. Administration and Policy in Mental Health and
Mental Health Services Research, 42(5), 533–544.
https://doi.org/10.1007/s10488-013-0528-y

173
Pattison, S., Gutwill, J., Auster, R., & Cannady, M. (2019). Experimental and quasi-
experimental designs in visitor studies: A critical reflection on three projects.
Visitor Studies, 22(1), 43–66. https://doi.org/10.1080/10645578.2019.1605235
Peñarroja, V., Sánchez, J., Gamero, N., Orengo, V., & Zornoza, A. M. (2019). The
influence of organizational facilitating conditions and technology acceptance
factors on the effectiveness of virtual communities of practice. Behavior
&Information Technology. 38(8), 845-857.
https://doi.org/10.1080/0144929X.2018.1564070
Peskun, P. H. (2020). Two-tailed p-values and coherent measures of evidence. American
Statistician, 74(1), 80–86. https://doi.org/10.1080/00031305.2018.1475304
Petre, A. (2017). The role of constant and continuous feedback on students’ learning
motivation. Scientific Research & Education in the Air Force - AFASES, 2, 161–
166. https://doi.org/10.19062/2247-3173.2017.19.2.23
Priya, R., Gandhi, A. V., & Shaikh, A. (2018). Mobile banking adoption in an emerging
economy. Benchmarking: An International Journal, 25(2), 743–762.
https://doi.org/10.1108/BIJ-01-2016-0009
Procter, L., Angus, D. J., Blaszczynski, A., & Gainsbury, S. M. (2019). Understanding
use of consumer protection tools among Internet gambling customers: Utility of
the theory of Planned Behavior and Theory of Reasoned Action. Addictive
Behaviors, 99. https://doi.org/10.1016/j.addbeh.2019.106050

174
Profeta, V., & Turvey, M. (2018). Bernstein’s levels of movement construction: A
contemporary perspective. Human Movement Science, 57. 111-113.
https://doi.org/10.1016/j.humov.2017.11.013
Puhakainen, P., & Siponen, M. (2010). Improving employees’ compliance through
information systems security training: An action research study. MIS Quarterly,
34(4), 767-A4. https://doi.org/10.2307/25750704
Putra, D. S. K., Sadikin, M. A., & Windarta, S. (2017). S-Mbank: Secure mobile banking
authentication scheme using signcryption, pair-based text authentication, and
contactless smart card. 2017 15th International Conference on Quality in
Research (QiR): International Symposium on Electrical and Computer
Engineering, Quality in Research (QiR), 230-234.
https://doi.org/10.1109/QIR.2017.8168487
Rahi, S., Ghani, M. A., Alnaser, F. M., & Ngah, A. H. (2018). Investigating the role of
unified theory of acceptance and use of technology (UTAUT) in internet banking
adoption context. Management Science Letters, 8(3), 173-186.
https://doi.org/10.5267/j.msl.2018.1.001
Rahi, S., Mansour, M. M. O., Alghizzawi, M., & Alnaser, F. M. (2019). Integration of
UTAUT model in internet banking adoption context: The mediating role of
performance expectancy and effort expectancy. Journal of Research in Interactive
Marketing, 13(3), 411. https://doi.org/10.1108/JRIM-02-2018-0032

175
Rajapakse, J. (2011). Extending the unified theory of acceptance and use of technology
(UTAUT) model. The 4th International Conference on Interaction Sciences, 47-
52. https://www.semanticscholar.org/paper/Extending-the-unified-theory-of-
acceptance-and-use-Rajapakse/829fa02d3ec87d247640928853fe33e4567ae157
Ramkissoon, H., Weiler, B., & Smith, L. G. (2013). Place attachment, place satisfaction
and pro-environmental behavior: a comparative assessment of multiple regression
and structural equation modelling. Journal of Policy Research in Tourism, Leisure
& Events, 5(3), 215. https://doi.org/10.1080/19407963.2013.776371
Rea, L. M., & Parker, R. A. (2014). Designing and Conducting Survey Research: A
Comprehensive Guide (4th ed.). John Wiley and Sons, Inc.
Ridder, H. G. (2017). The theory contribution of case study research designs. Business
Research, 10(2), 281–305. https://doi.org/10.1007/s40685-017-0045-z
Rui, Z., & Yan, Z. (2019). A survey on biometric authentication: Toward secure and
privacy-preserving identification. IEEE Access, Access, IEEE, 7, 5994-6009.
https://doi.org/10.1109/ACCESS.2018.2889996
Santos, R. E. S., Magalhaes, C. V. C., & Da Silva, F. Q. B. (2017). Member checking in
software engineering research: Lessons learned from an industrial case study.
2017 ACM/IEEE International Symposium on Empirical Software Engineering
and Measurement (ESEM), 187–192. https://doi.org/10.1109/ESEM.2017.29
176
Saputra, M. C., Wardani, N. H., Trialih, R., & Hijriyati, A. L. (2018). Analysis of user
acceptance factors for mobile apps browser using unified theory of acceptance
and use of technology (UTAUT) and task technology fit (TTF) on Generation Y.
2018 International Seminar on Intelligent Technology and Its Applications
(ISITIA), 263-268. https://doi.org/10.1109/ISITIA.2018.8711153
Sarstedt, M., Hwang, H. (2020). Advances in composite-based structural equation
modeling. Behaviormetrika, 47, 213–217. https://doi.org/10.1007/s41237-020-
00105-9
Schuld, M. (2020). Helping community banks do what they do best. Independent Banker,
60–61. https://www.fisglobal.com/en/insights/what-we-know/2020/july/helping-
community-banks-do-what-they-do-best
Scott, J., & Marshall, G. (2015). A Dictionary of Sociology (3rd Edition). New York, NY:
Oxford University Press. https://doi.org/10.1093/acref/9780199533008.001.0001
Shareef, M. A., Baabdullah, A., Dutta, S., Kumar, V., & Dwivedi, Y. K. (2018).
Consumer adoption of mobile banking services: An empirical examination of
factors according to adoption stages. Journal of Retailing & Consumer Services,
43, 54-67. https://doi.org/10.1016/j.jretconser.2018.03.003
Sharma, A. (2017). 58 percent of consumers fear an online data breach. PC Quest, 30(2),
38. https://www.pcquest.com/58-consumers-fear-a-cyber-security-threat-gemalto-
study/5/
Shostack, A. (2014). Threat modeling: designing for security. John Wiley and Sons.

177
Shrivastava, A. K. (2016). The impact assessment of IT infrastructure on information
security: A survey report. Procedia Computer Science, 78 (1st International
conference on information security & privacy 2015), 314-322.
https://doi.org/10.1016/j.procs.2016.02.062
Shuttleworth, M. (2009). Construct validity - Does the concept match the specific
measurement? https://explorable.com/construct-validity
Smith, S. (2016). Mobile banking users to reach 2 billion by 2020, representing more
than 1 in 3 of global adult population.
https://www.juniperresearch.com/press/press-releases/mobile-banking-users-to-
reach-2-billion-by-2020
Sosin, A. (2018). How to increase the information assurance in the information age.
Journal of Defense Resources Management, 9(1), 45-57.
http://www.jodrm.eu/issues/volume9_issue1/05_Sosin.pdf
Sreejesh, S., Anusree, M. R., & Mitra, A. (2016). Effect of information content and form
on customers’ attitude and transaction intention in mobile banking Moderating
role of perceived privacy concern. International Journal of Bank Marketing,
34(7), 1092–1113. https://doi.org/10.1108/IJBM-07-2015-0107
Subsorn, P., & Limwiriyakul, S. (2012). A comparative analysis of internet banking
security in Thailand: A customer perspective. Procedia Engineering, 32, 260-272.
https://doi.org/10.1016/j.proeng.2012.01.1266

178
Suki, N. M., & Suki, N. M. (2017). Determining students’ behavioral intention to use
animation and storytelling applying the UTAUT model: The moderating roles of
gender and experience level. International Journal of Management Education,
15(3), 528–538. https://doi.org/10.1016/j.ijme.2017.10.002
Sumarni, W., Supardi, K. I., & Widiarti, N. (2018). Development of assessment
instruments to measure critical thinking skills. IOP Conference Series: Materials
Science & Engineering, 349(1). https://doi.org/10.1088/1757-899X/349/1/012066
Susanto, A., Lee, H., Zo, H., & Ciganek, A. P. (2013). Factors affecting internet banking
success: a comparative investigation between Indonesia and South Korea. Journal
of Global Information Management, 21(2), 72-95.
https://doi.org/10.4018/jgim.2013040104
Svilar, A., & Zupančič, J. (2016). User experience with security elements in internet and
mobile banking. Organizacija, 49(4), 251. https://doi.org/10.1515/orga-2016-
0022
Tait, B. L. (2019). Behavioral biometrics authentication tested using EyeWriter
technology. 2019 IEEE 12th International Conference on Global Security, Safety
and Sustainability (ICGS3), Global Security, Safety, and Sustainability (ICGS3).
1-9. https://doi.org/10.1109/ICGS3.2019.8688257
Tan, P. J. B. (2013). Applying the UTAUT to understand factors affecting the use of
English e-learning websites in Taiwan. SAGE Open, 3(4).
https://doi.org/10.1177/2158244013503837

179
Tarhini, A., El-Masri, M., Ali, M., & Serrano, A. (2016). Extending the UTAUT model
to understand the customers’ acceptance and use of internet banking in Lebanon:
A structural equation modeling approach. Information Technology & People,
29(4), 830-849. https://doi.org/10.1108/ITP-02-2014-0034
Tassabehji, R., & Kamala, M. A. (2012). Evaluating biometrics for online banking: The
case for usability. International Journal of Information Management, 32(5), 489-
494. https://doi.org/10.1016/j.ijinfomgt.2012.07.001
Tavallaee, R., Sajjad, S., & Samadi, F. (2017). The combined theory of planned behavior
and technology acceptance model of mobile learning at Tehran universities.
International Journal of Mobile Learning and Organization (IJMLO), 11(2).
https://doi.org/10.1504/IJMLO.2017.10005262
Thapa, A., & Cohen, J. (2017). School climate community scale: Report on construct
validity and internal consistency. School Community Journal, 7(2), 303–320.
https://files.eric.ed.gov/fulltext/EJ1165646.pdf
Thompson, R. L., Higgins, C. A., & Howell, J. M. (1994). Influence of experience on
personal computer utilization: Testing a conceptual model. Journal of
Management Information Systems, 11(1), 167–187.
https://doi.org/10.1080/07421222.1994.11518035
Thusi, P., & Maduku, D. K. (2020). South African millennials’ acceptance and use of
retail mobile banking apps: An integrated perspective. Computers in Human
Behavior, 111. https://doi.org/10.1016/j.chb.2020.106405

180
Tiits, M., Kalvet, T., & Mikko, K. L. (2014). Social acceptance of ePassports.
International Conference of the Biometrics Special Interest Group (BIOSIG),
1(6), 10-12. https://ieeexplore.ieee.org/document/7029408
Tonder, E., Petzer, D., Vuuren, N., & De Beer, L. (2018). Perceived value, relationship
quality and positive WOM intention in banking. International Journal of Bank
Marketing, 36(7), 1347–1366. https://doi.org/10.1108/IJBM-08-2017-0171
Uri, P. (2014). What are the relationships between teachers’ engagement with
management information systems and their sense of accountability?
Interdisciplinary Journal of E-Skills and Lifelong Learning, 10, 217-227.
https://doi.org/10.28945/2070
U.S. Census Bureau. (2020). Resident population in the Middle Atlantic census division
(CMATPOP). https://alfred.stlouisfed.org/series?seid=CMATPOP
Uslu, O. (2018). Analysis of variables that affect teaching learning approaches and
epistemological beliefs of pre-service teachers by structural equation model.
International Journal of Research in Education and Science, 4(1), 237–251.
https://eric.ed.gov/?id=EJ1170091
Vanathi, B., Shanmugam, K., & Uthairaj, V. R. (2016). A secure m-commerce
architecture for service provider to improvise quantity and quality of the products
using fingerprint authentication and gender classification. Asian Journal of
Information Technology, 15(2), 232-242.
https://medwelljournals.com/abstract/?doi=ajit.2016.232.242

181
Vanian, J. (2015). Wells Fargo plans to scan your face and voice for mobile security.
Fortune.Com, N.PAG. https://fortune.com/2015/06/04/wells-fargo-scan-face-and-
voice-security
Venkatesh, V., Morris, M. G., Davis, G. B., & Davis, F. D. (2003). User acceptance of
information technology: toward a unified view (1). MIS Quarterly, 27(3), 425-
478. https://doi.org/10.2307/30036540
Venkatesh, V., Thong, J. Y. L., & Xin Xu. (2016). Unified theory of acceptance and use
of technology: A synthesis and the road ahead. Journal of the Association for
Information Systems, 17(5), 328–376. https://doi.org/10.17705/1jais.00428
Venkatesh, V. L., Thong, J. Y., & Xu, X. (2012). Consumer acceptance and use of
information technology: Extending the unified theory of acceptance and use of
technology. MIS Quarterly, 36(1), 157–178. https://doi.org/10.2307/41410412
Vila, J. A., Serna, J., Medina, M., & Sfakianakis, A. (2014). An analysis of n-factor
authentication in e-banking environments. Journal of Information Assurance &
Security, 9(2), 104–117. https://www.mirlabs.net/jias/index.html
Waggett, P. (2016). Feature: Risk-based authentication: biometrics’ brave new world.
Biometric Technology Today, 2016(6), 5–7. https://doi.org/10.1016/S0969-
4765(16)30106-0
Webster, R. & Lark, R. M. (2018). Analysis of variance in soil research: let the analysis
fit the design. European Journal of Soil Science. 69, 126- 139.
https://doi.org/10.1111/ejss.12511

182
Wolfe, H. B. (2017). The mobile phone as surveillance device: Progress, perils, and
protective measures. Computer, 50(11), 50-58.
https://doi.org/10.1109/MC.2017.4041351
Wójtowicz, A., & Joachimiak, K. (2016). Model for adaptable context-based biometric
authentication for mobile devices. Personal & Ubiquitous Computing, 20(2),
195–207. https://doi.org/10.1007/s00779-016-0905-0
Yadav, A. (2016). Factors influencing the usage of mobile banking among customers.
IUP Journal of Bank Management, 15(4), 7.
https://papers.ssrn.com/sol3/papers.cfm?abstract_id=3071473
Yang, J., Peek-Asa, C., Noble, J. M., Torner, J., Schmidt, P., Cooper, M. L., & Big ten –
ivy league traumatic brain injury research collaboration data collection working
group. (2018). Common data elements collected among universities for sport-
related concussion studies. Injury Epidemiology, 5(1), 1–10.
https://doi.org/10.1186/s40621-018-0132-4
Yazdanmehr, A., & Wang, J. (2016). Employees’ information security policy
compliance: A norm activation perspective. Decision Support Systems, 92, 36–46.
https://doi.org/10.1016/j.dss.2016.09.009
Yoon, H. S., & Barker Steege, L. M. (2013). Development of a quantitative model of the
impact of customers’ personality and perceptions on Internet banking use.
Computers in Human Behavior, 29(3), 1133–1141.
https://doi.org/10.1016/j.chb.2012.10.005

183
Yu, C. S. (2012), Factors affecting individuals to adopt mobile banking: empirical
evidence from the UTAUT model, Journal of Electronic Commerce Research,
13(2), 104-121. https://www.semanticscholar.org/paper/Factors-Affecting-
Individuals-to-Adopt-Mobile-from-
Yu/2a3e4a3024bfc4df27db07a1d48f77a6f371b0c3
Yurcan, B. (2018). Banks in constant game of catch-up in combating mobile fraud.
American Banker, 183(89), 1. https://www.americanbanker.com/news/banks-in-
constant-game-of-catch-up-in-combating-mobile-fraud
Zalud, B. (2016). Year for biometrics? Security: Solutions for Enterprise Security
Leaders, 53(5), 44–46. https://www.securitymagazine.com/articles/87088-Is-the-
Year-for-Biometrics-at-Last
Zhang, Z., Zhu, Y., Fujiwara, A., & Ohinishi, K. (2019). Population-based search relying
on spatial and/or temporal scale-free behaviors of individuals. 2019 IEEE
Symposium Series on Computational Intelligence (SSCI), Computational
Intelligence (SSCI), 2019 IEEE Symposium Series On, 2327–2334.
https://doi.org/10.1109/SSCI44817.2019.9002848
Zhou, T., Lu, Y., & Wang, B. (2010). Integrating TTF and UTAUT to explain mobile
banking user adoption. Computers in Human Behavior, 26(4), 760–767.
https://doi.org/10.1016/j.chb.2010.01.013
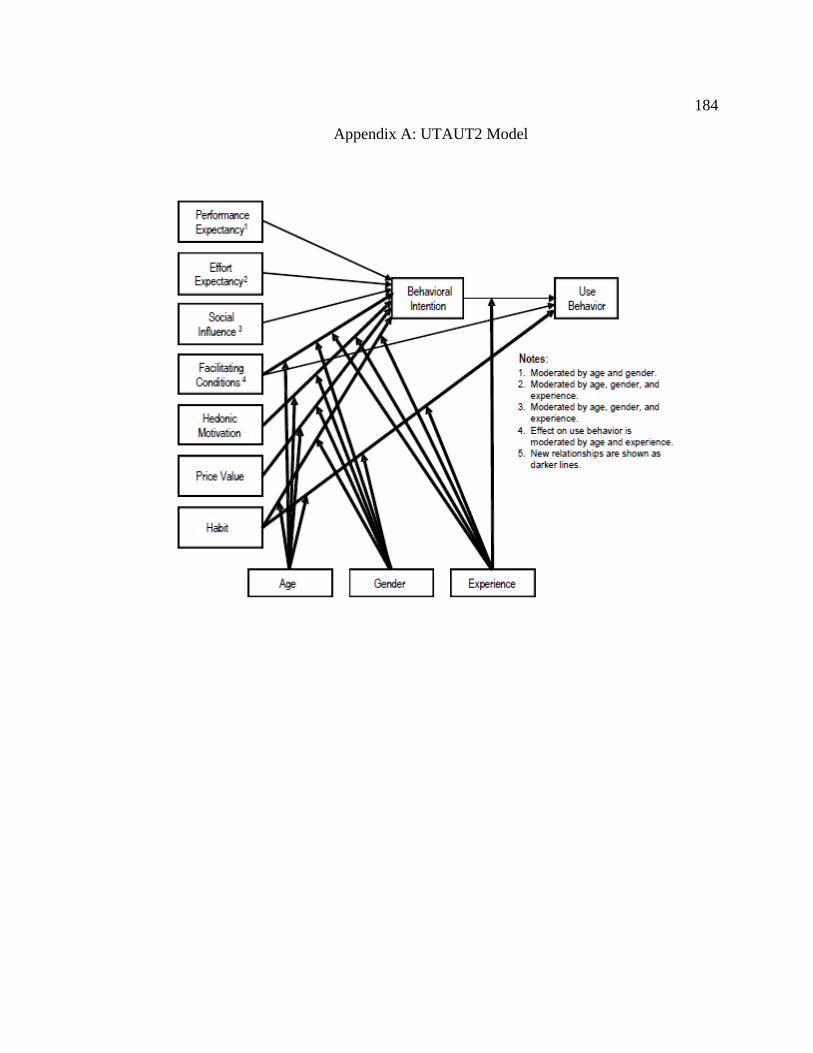
184
Appendix A: UTAUT2 Model

185
Appendix B: OWASP Top 10 2016-Top 10

186
Appendix C: Invitational email
Invitation to participate in the research dissertation titled:
“Examining Consumer’s Perspectives Using Biometric Technology with Mobile
Banking”
Dear Mobile Bank User, Welcome to the Examining Consumer’s Perspectives Using Biometric Technology with Mobile Banking Pilot Study This study is being conducted by a researcher named Rodney A. Clark, MBA, MIM, who is a doctoral candidate in Information System Management at Walden University. You are invited to take part in a research study about biometric authentication usage and acceptance for consumers’ during mobile banking transactions. This voluntary survey asks about your current beliefs, attitudes, and experiences. There are no negative consequences if you don’t want to take it. If you start the survey you can always change your mind and stop at any time. The information that you provide will help evaluate the actual usage of consumers’ and can be used to predicted behavior intentions of consumers to help banks create a safe, and supportive mobile banking experience. The survey will take you between 5 and 12 minutes to complete and is very informal. The goal is to capture your thoughts and perspectives on the benefits of using biometric technology when accessing your bank account with mobile devices. Your responses to the questions will be kept confidential. Each survey will be linked to a number to help ensure that one response is given per participate. There is no compensation for participating in this study. However, your participation will be a valuable addition to my research and the finding could lead to a greater public understanding of biometric technology usage with mobile banking. Best Regards, Rodney A. Clark
Please click the following link to complete the survey.
START
SURVEY
Or copy paste the URL below into your internet browser. [[SurveyLink]]
This is a system generated email, please do not reply to it. The survey link in this email is unique to its recipient. Please do not
forward this email. If you would like to unsubscribe and stop receiving these emails, click unsubscribe..

187
Appendix D: Permission to use the UTAUT model
188
Appendix E: Permission to use the UTAUT2 model

189
Appendix F: Permission to use the UTAUT: Adopt Mobile Banking Questions

190
Appendix G: G*Power 3.0 using a linear multiple regression power analysis for sample
size

191
Appendix H: G*Power 3.0 showing a range of sample sizes from 109 to 228

192
Appendix I: Constructs and Corresponding Items
Construct Corresponding Items Items Sources
Performance Expectance
In conducting banking affairs, (PE1): using mobile banking would improve my performance
(PE2): using mobile banking would save my time
(PE3): I would use mobile banking anyplace (PE4): I would find mobile banking useful
Performance expectancy (PE) - Adopted from Venkatesh et al., 2003;
Tarhini et al., (2016); Yu, (2012)
Effort
Expectancy
(EE1): Learning to use mobile banking is easy for me
(EE2): Becoming skillful at using mobile banking is easy for me (EE3): Interaction with mobile banking is easy for me
(EE4): I would find mobile banking is easy to use
Effort expectancy (EE) - Adopted from
Venkatesh et al., 2003; Tarhini et al., (2016); Yu, (2012)
Social Influence
(SI1): People who are important to me think that I should use mobile banking
(SI2): People who are familiar with me think that I should use mobile
banking
(SI3): People who influence my behavior think that I should use mobile
banking
(SI4): Most people surrounding with me use mobile banking
Social Influence (SI) - Adopted from Venkatesh et al., 2003;
Tarhini et al., (2016); Yu, (2012)
Venkatesh et al. [2003], Venkatesh and
Zhang [2010], Foon and Fah [2011],
Sripalawat et al. [2011] Facilitating
Conditions
(FC1): My living environment supports me to use mobile banking
(FC2): My working environment supports me to use mobile banking
(FC3): Using mobile banking is compatible with my life (FC4): Help is available when I get problem in using mobile banking
Facilitating Conditions (FC) - Adopted
from Venkatesh et al., 2003;
Tarhini et al., (2016); Yu, (2012)
Venkatesh et al. [2003], Venkatesh and Zhang [2010], Sripalawat et al. [2011]
Perceived
Credibility
When using mobile banking,
(PC1): I believe my information is kept confidential (PC2): I believe my transactions are secured
(PC3): I believe my privacy would not be divulged
(PC4): I believe the banking environment is safe (PC5): I believe biometric technology will help protect my data
(PC6): I feel safe when using biometric technology
(PC7): Do you feel mobile banking applications are safe?
Perceived Credibility (PC) - Adopted
from Tarhini et al., (2016); Yu, (2012)
Task
Technology Fit
When using biometric for mobile banking,
(TTF1): Do biometrics make logging into apps easier? (TTF2): Do you feel biometric technology will protect your data from
being stolen more effectively than username and password?
(TTF3): Do you trust biometric technology? (TTF4): Do you use biometric technology to sign into your bank
application?
(TTF5): Do you use banking apps more frequently? (TTF6): Does using biometric technology fully meet your security
needs?
Task Technology Fit (TTF) - Adopted
from Tarhini et al., (2016); Zhou, Lu, & Wang, (2010)
Behavioral Intention
When dealing with banking affairs, (BI1): I prefer to use mobile banking
(BI2): I intend to use mobile banking
(BI3): I would use mobile banking (BI4): I would use biometric (voice, face, fingerprint, etc.…)
technology when using mobile banking
Behavioral Intention (BI) - Adopted from Venkatesh et al., 2003;
Tarhini et al., (2016); Yu, (2012)
Actual Use (AU1): I often use mobile banking to manage my account (AU2): I often use mobile banking to transfer and remit money
(AU3): I often use mobile banking to make payments
(AU4): What method of biometric do you use? Face, fingerprint, Iris,
finger vein, voice, other, I do not use
(AU5): How many months have you use biometric technology with
mobile banking? <6, 6-12 months, 12-24 months, >24 months
Actual Use (AU) - Adopted from Venkatesh et al., 2003; Tarhini et al.,
(2016); Zhou, Lu, & Wang, (2010)

193
Appendix J: Summary Report of Pilot Study
The questions from PE, EE, SI, FC were the original questions with no
modifications. PC and TTF, BI and AU were modified to fit the study (See Appendix I).
PC questions (PC5, PC6 and PC7) were added with the words “biometric technology”
and “mobile baking applications” to fit the study. TTF questions were from the previous
studies; however, they were reworded using “biometric technology” and “banking apps”
to fit the need of the study. The questions from BI were from previous studies except the
question (BI4), which ask the customers what type of biometric technology they used
during mobile banking transactions. Question BI4 was used to determine what method of
biometric scanning tool was used by the customers or offer by the mobile devices.
The questions from actual use were from previous studies except for the question
AU3 and AU4 (see Appendix I), which ask the participant what method of biometric
technology they used when accessing their bank account. Question AU5 asks how many
months the participant used biometric technology. The questions AU4 and AU5 were
used to ensure that the survey participants use mobile banking with biometric technology.
Also, questions AU4 and AU5 were exit questions in the survey. If the participants did
not use any of the services, the survey responses would not be valid. No alternation or
changes were made from the pilot study (Microsoft Forms) to the final analysis
(LimeSurvey), except for the data collections instruments.

194
Appendix K: Demographic of the Pilot Test
Demographic Variable Sample Composition (N = 42)
Gender
Male 22 (52.38%)
Female 20 (47.62%)
Age
18-20 9 (21.43%)
21-29 22 (52.38%)
30-39 3 (7.14%)
40-49 8 (19.05%)
50 or Older n/a
Education
High School Degree 9 (21.43%)
Some College but no Degree 11 (26.19%)
Associate Degree 1 (2.38%)
Bachelor’s degree 13 (30.95%)
Graduate Degree 8 (19.05%)
Employment
Employed 40 or more hours per week 24 (57.14%)
Employed 1-39 hours per week 13 (30.95%)
Not Employed 5 (11.90%)
Mobile Banking Use with Biometric
< 6 Months 13 (30.95%)
6 - 12 Months 16 (38.10%)
12 - 24 Months 5 (11.90%)
24 Months 8 (19.05%)
Method of Biometric Technology
Face 19 (45.24%)
Fingerprint 20 (47.62%)
Voice 3 (7.14%)
Bank
Commercial Bank 34 (80.95%)
Credit Union 9 (21.43%)

195
Appendix L: Final Study Demographic Questions

196
Appendix M: Descriptive of the Constructs
Name Question
PE[PEA] In conducting banking affairs, [Using mobile banking would improve my
performance?]
PE[PEB] In conducting banking affairs, [Using mobile banking would save me time?]
PE[PEC] In conducting banking affairs, [I would use mobile banking anyplace?]
PE[PED] In conducting banking affairs, [I would find mobile banking useful?]
EEA Learning to use mobile banking is easy for me?
EEB Becoming skillful at using mobile banking is easy for me?
EEC Interaction with mobile banking is easy for me?
EED I would find mobile banking is easy to use?
SIA People who are important to me think that I should use mobile banking?
SIB People who are familiar with me think that I should use mobile banking?
SIC People who influence my behavior think that I should use mobile banking?
SIDA Most people surrounding me use mobile banking?
FCA My living environment supports me to use mobile banking?
FCB My working environment supports me to use mobile banking?
FCC Using mobile banking is compatible with my life?
FCD Help is available when I get problem in using mobile banking?
PCA[PCAA] When using mobile banking, [I believe my information is kept confidential?]
PCA[PCAB] When using mobile banking, [I believe my transactions are secured?]
PCA[PCAC] When using mobile banking, [I believe my privacy would not be divulged?]
PCA[PCAD] When using mobile banking, [I believe the banking environment is safe?]
PCA[PCAE] When using mobile banking, [I believe biometric technology will help protect my
data?]
PCA[PCAF] When using mobile banking, [I feel safe when using biometric technology?]
PCA[PCAG] When using mobile banking, [Do you feel mobile banking applications are safe?]
TTF[TTFA] When using biometric for mobile banking, [Do biometrics make logging into apps
easier?]
TTF[TTFB] When using biometric for mobile banking, [Do you feel biometric technology will
protect your data from being stolen more effectively than username and password?]
TTF[TTFC] When using biometric for mobile banking, [Do you trust biometric technology?]
TTF[TTFD] When using biometric for mobile banking, [Do you use biometric technology to sign
into your bank application?]
TTF[TTFE] When using biometric for mobile banking, [Do you use banking apps more frequently?]
TTF[TTFF] When using biometric for mobile banking, [Does using biometric technology fully meet
your security needs?]
BI[BIA] When dealing with banking affairs, [I prefer to use mobile banking? ]
BI[BIB] When dealing with banking affairs, [I intend to use mobile banking?]
BI[BIC] When dealing with banking affairs, [I would use mobile banking?]
BI[BID] When dealing with banking affairs, [I would use biometric (5, 1, 2, etc.…) technology
when using mobile banking?]
AUA I often use mobile banking to manage my account?
AUB I often use mobile banking to transfer and remit money?
AUC I often use mobile banking to make payments?
AUE How many months have you used biometric technology with mobile banking?

197
Appendix N: Principal Axis Factor Analysis
Factors Variables Factor loading
No. of Variables
Cronbach alpha
Eigen value
% of variance
Using
biometric
technology [TTF]
TTFA, TTFB, TTFD, TTFE, TTFF, TTFC 6 .809 11.38 39.2
When using biometric for mobile banking, [Do
biometrics make logging into apps easier?] TTFA
.799
When using biometric for mobile banking, [Do
you feel biometric technology will protect your
data from being stolen more effectively than
username and password?] TTFB
.793
When using biometric for mobile banking, [Do
you use biometric technology to sign into your bank application?] TTFD
.739
When using biometric for mobile banking, [Do you use banking apps more frequently?] TTFE
.660
When using biometric for mobile banking, [Does
using biometric technology fully meet your security needs?] TTFF
.638
When using biometric for mobile banking, [Do you trust biometric technology?]
EEB. Becoming skillful at using mobile banking
is easy for me? TTFC
.561
Learning to Use [EE]
EEB, EEC, EEA, EED 4 .813 2.74 9.45
Becoming skillful at using mobile banking is easy
for me? EEB
.871
Interaction with mobile banking is easy for me?
EEC
.830
Learning to use mobile banking is easy for me?
EEA
.801
I would find mobile banking is easy to use? .762
Using mobile
banking (MB)
[PC]
PCAD, PCAA, PCAC, PCAB, PCAG, PCAE 6 .804 2.45 8.46
When using mobile banking, [I believe the banking
environment is safe?] PCAD
.760
When using mobile banking, [I believe my
information is kept confidential?] PCAA
.709
When using mobile banking, [I believe my privacy would not be divulged?] PCAC
.670
When using mobile banking, [I believe my transactions are secured?] PCAB
.670
When using mobile banking, [Do you feel mobile banking applications are safe?] PCAG
.528
When using mobile banking, [I believe biometric
technology will help protect my data?] PCAE
.507

198
Appendix O: Principal Axis Factor Analysis
Factors Variables Factor
loading
No. of
Variables
Cronbach
alpha
Eigen
value
% of
variance
Conducting
Banking
Affairs [PE]
PED, PEB, PEC, PEA 4 .813 1.64 5.66
When using mobile banking, [I believe the
banking environment is safe?] PED
.774
In conducting banking affairs, [Using
mobile banking would save me time?]
PEB
.770
In conducting banking affairs, [I would
use mobile banking anyplace?] PEC
.760
In conducting banking affairs, [Using
mobile banking would improve my
performance?] PEA
.618
Influence
[SI]
SIB, SIC, SIA 3 .805 1.44 4.96
People who are familiar with me think
that I should use mobile banking? SIB
.791
People who influence my behavior think
that I should use mobile banking? SIC
.752
People who are important to me think that
I should use mobile banking? SIA
.759
Environment
[FC]
FCB, FCA, FCC 3 .811 1.17 4.06
My working environment supports me to
use mobile banking? FCB
.690
My living environment supports me to use
mobile banking?
.683
Using mobile banking is compatible with
my life? FCC
.554

199
Appendix P: Communalities of Variables
Correlation
Initial Extraction
PE[PEA] .620 .587
PE[PEB] .681 .705
PE[PEC] .764 .752
PE[PED] .773 .789
EEA .827 .785
EEB .881 .911
EEC .837 .831
EED .809 .739
SIA .706 .732
SIB .737 .785
SIC .777 .806
SIDA .470 .434
FCA .615 .662
FCB .579 .617
FCC .599 .512
FCD .436 .352
PCA[PCAA] .633 .614
PCA[PCAB] .618 .583
PCA[PCAC] .567 .539
PCA[PCAD] .655 .707
PCA[PCAE] .775 .614
PCA[PCAF] .756 .583
PCA[PCAG] .540 .499
TTF[TTFA] .730 .720
TTF[TTFB] .696 .673
TTF[TTFC]. .524 .471
TTF[TTFD] .745 .686
TTF[TTFE]. .688 .583
TTF[TTFF] .635 .613

200
Appendix Q: Unrotated Factor Matrix

201
Appendix R: Rotated Component Matrix

202
Appendix S: Summary of Findings


![Biometric Standards documents/Standards... · Biometric Profiles Biometric [Application] Profile – a conforming subset or combination of base standards used to effect specific biometric](https://img.pdfslide.net/doc/110x75/5f711372ce578d4ee02aea91/biometric-standards-documentsstandards-biometric-profiles-biometric-application.jpg)