Embed Size (px)
Citation preview

Contact metamorphism of shales and limestones from the Grua area, the Oslo Rift, Norway: a phase-petrological study
HENRIK SVENSEN & BJØRN JAMTVEIT
Svensen, H. & Jamtveit, B. Contact metamorphism of shales and limestones from the Grua area, the Oslo Rift, Norway: a
phase-petrological study. Norsk Geologisk Tidsskrift, Vol. 78, pp. 81-98. Oslo 1998. ISSN 0029-196X.
Permian granitoid intrusives caused extensive contact metamorphism of Lower Palaeozoic sediments in the Grua area, located in
the cent.ral Oslo Rift. Phase relations within metamorphic shales and carbonates have been examined by scanning electron
microscopy for constraining the peak metamorphic conditions during contact metamorphism in this area. Metamorphic effects on
the primary sedimentary mineralogy are observed more than 2400 m from the intrusive contact. Stability calculations accounting
for relevant solid solutions have been used to construct a temperature-distance profile across the contact aureole. Peak
metamorphic temperatures near the contact with the My lia .syenite are estimated to ca. 560°C (at l kbar), based on the coexistence
of olivine, clinopyroxene, amphibole, dolomite and calcite in limestones, and the presence of cordierite, biotite, feldspar and quartz
in shales. Phase-petrological data are consistent with extemal controls on the metamorphic fluid composition in most layered
shale-bearing lithologies. Massive limestones appear to have buffered the pore fluid composition during progressive metamorphism,
even dose to the intrusive contact.
H. Svensen & B. Jamtveit, Departinent of Geology, University of Oslo, PO Box 1047 Blindern, N-0316 Oslo, Norway.
Introduction
Following V. M. Goldschmidt's (1911) classic paper on
contact metamorphism in the Oslo Rift, the conditions
of contact metamorphism in the Oslo Graben were be
lieved to be well known. However, during the late 1980s
and early 1990s, contact-metamorphic rocks were re-ex
amined by modem petrological and geochemical meth
ods (Jamtveit et al. 1992a, b, 1997a, b; Jamtveit & Andersen 1993). Modem studies emphasize the role of
magmatic fluids .in causing metamorphic reactions in the
Lower Palaeozoic meta-sedimentary rocks, even outside
the extensive1y metasomatized skarn zones, which were
a1so recognized as the result of fluid infiltration in
Goldschmidt's work.
Schreinemaker diagrams used for the interpretation of
low temperature ( < 600°C) phase assemblages have often been applied to meta-limestones and associated rocks from shallow-level contact aureoles (Kerrick et al. 1973; Bucher-Nurminen 1982; Jamtveit et al. 1992a; Tracy & Frost 1991). Activity-corrected T-Xc02 diagrams have been widely used for interpreting contact-metamorphic mineral assemblages (Bucher-Nurminen 1990). Metashale or meta-pelite assemblages are, however, usually interpreted using mixed-variable (i.e. T-X) diagrams
(Tracy & Frost 1991), assuming that the coexisting fluid
phase is pure H20. However, activity-corrected diagrams
do not account for chemical variations in phases at different metamorphic grades. A different approach that accounts for non-stochiometric phases was presented by
Connolly (1990), based on forward modelling, including solid solutions. This approach is used for interpreting
phase assemblages from the Grua aureole.
The aim of this study was to carry out a detailed petrographic characterization of meta-sedimentary rocks in the Grua area, in the central Oslo Rift, using a scanning electron microscope, and to investigate phase equilibria and mineral reactions by modem phase-petrological methods. This leads to a hetter understanding of the metamorphic conditions that the Lower Palaeozoic rocks experienced during the contact-metamorphic event.
Geological setting
The Permo-Carboniferous Oslo Rift is situated on the southwestern edge of the Baltic shield (Fig. l ). The Oslo Rift may be divided into the Oslo Graben and the Skagerrak Graben. The Skagerrak Graben is the offshore part of the rift, while the Oslo Graben is the exposed part, comprising two asymmetric graben seg
ments, the Vestfold Graben segment in the south, and the Akershus Graben segment in the north. The term 'Oslo region' refers strictly to the province of Palaeozoic rocks within the Oslo Graben, about 200 km long and 35-65 km wide (Dons 1978). The Oslo Rift formed during the period 305 to 240 Ma (Sundvoll et al. 1990; Sundvoll & Larsen 1993; Neumann et al. 1992) as part of a rift system developed in northwestern Europe from Carboniferous to Cretaceous time (see e.g. Ziegler 1978, 1990). The main graben system of the Oslo Rift extends north-northeast from the Sorgenfrei-Tornquist Zone to Lake Mjøsa, with a total length of about 400 km (Neumann et al. 1992). A variety of monzonitic to granitic rocks cover an area of about 6200 km
2 and about 96% of
the total area of the Oslo Rift magmatic rocks (Ras-

82 H. Svensen & B. Jamtveit
mussen et al. 1988). Apatite fission track data suggests
that the present erosion surface is 2.5 to 5 km below the
Permian surface (Rohrmann et al. 1996).
A variety of sedimentary rocks is preserved in the Oslo
Rift, deposited from pre- to syn- and post-rift settings
(see Olaussen 1981; Olaussen et al. 1994). Approximately
1250 m of Cambro-Silurian pre-rift marine sediments,
and a similar thickness of Late Silurian-Early Devonian
pre-rift red beds, are found in the Oslo Graben
(Bjørlykke 1983). Shales are present over the entire
stratigraphic record (see the stratigraphic column given
by Bjørlykke 1974). Cambrian grey shales (low-carbon
shales) contain quartz, feldspar and illite; Ordovician
and Silurian grey shales also contain chlorite. Black
Permian extrusives
Permian biotite granites
and alkaligranites
Permian monzonites and r--hl syenites �
Permian subvolcanic
porphyries
Lower Paleozoic
sedimentary rocks
Precambrian rocks
Fig. l. Geological map for the Oslo Graben and surrounding areas (modified
from,Oftedahl 1960).
NORSK GEOLOGISK TIDSSKRIFT 78 (1998)
(high-carbon shales) and grey shales have similar mineralogy, except for the content of carbon and sulphur-bearing phases. However, chemical analysis show that the major element composition differs significantly: black shales contain <3 wt% CaO (see Bjørlykke 1974, p. 42). Calcite is the predominant carbonate mineral in limestones. Calcareous shales with less than 20 wt% CaC03 have high dolomitejcalcite ratios (0.5-2.0). Cambrian limestones are dolomite-free, but Ordovician and Silurian limestones can contain some dolomite. Marly shales and limestones usually have low carbon ( <l wt%) and sulphur content ( <0.5 wt%). Common phases in the limestones are calcite, quartz, feldspar, chlorite, illite and dolomite.
Contact metamorphism in the Oslo Graben
Intrusion of felsic plutons of Permian age in to originally unmetamorphosed Lower Palaeozoic sedimentary sequences caused extensive contact metamorphism in the Oslo Gra ben ( Goldschmidt 1911; Grorud 1991; Jam tveit et al. 1992a, b; Jamtveit & Andersen 1993; Svensen 1996). Aqueous fl.uids released during crystallization of silicic intrusions (Olsen & Griffin 1984; Hansteen & Burke 1990; Andersen 1990) resulted in widespread hydrothermal activity leading to skarn formation and local ore deposition in the contact aureoles (lhlen 1986; Jamtveit & Andersen 1993). The release of H20-dominated fl.uids, corresponding to a minimum of l wt% of the magma mass during crystallization of a bo ut 2 x l 0
13
m3 of intrusive rocks (Neumann et al. 1986), would imply that the total volume of magma tie water-rich fl.uids released would exceed 5 x 10¹¹ m3 (Jamtveit et al. 1997a). This corresponds to fl.ow rates of 10-9 to l0-6 ms-1, assuming pervasive fl.ow for l 04-105 years and fl.ow porosities in the range of 0.01-1% (Jamtveit et al. 1997a). Pervasive infiltration of these fl.uids drove decarbonation reactions in the contact aureoles, leading to the formation of contact-metamorphic mineral assemblages
(see e.g. Grorud 1991; Jamtveit et al. 1992b; Svensen 1996).
Contact metamorphism in the Oslo Graben affected the Lower Palaeozoic sedimentary record of regions up to 3 km from the intrusive contacts (Brøgger & Schetelig 1917; Sæther 1962; Antun 1967; Grorud 1991; Jamtveit et al. 1997a; Svensen 1996). In addition to contact-metamorphic Lower Palaeozoic sedimentary rocks, contactmetamorphosed Permian intrusive and extrusive rocks (Sæther 1962) and Precambrian gneisses (Gieditch 1952) are reported.
A Permian erosion level l to 3 km above the present one results in lithostatic pressure estimates ranging from 300 to 900 bar, and ambient temperatures less than 200oc at the depth corresponding to the present surface (Jamtveit et al. 1992a). Pressure and temperature estimates for solidus condition of Nordmarkite from the Sande caldera, based on fluid inclusions by Andersen (1990), gave results in the range 0.8 to 1.2 kbar and

NORSK GEOLOGISK TIDSSKRIFT 78 (1998) Contact metamorphism, Oslo Rift 83
Geology of the Grua Area LEG END
Intrusiye rocks [!l Grua Biotite Granite
� My !Ja Alkali syenite
/ Rhomb porfyry dyke
e Porphyres, diabases, etc.
Sedimentarv rocks Ordoyjcian Si.l.ll.lilm. Bm Unit 4 shale ITIJJ Unit 7ab 111!11 Iimestone limestone p:;:II Unit 5a .Unit 7c, t&!l iimestone
lmJ Unit 5b, 6bc, shale-ss
ss, calc. ss.
/ Fault or fracture ,( Strike/dip
���ii�!�������gj � lnfiltration metasomatic skam
@ Skarn hosted Pb-Zn-Fe deposit @ Skam hosted Fe mineralization
(§) Sampling locality
n.e.: not exposed
Fig. 2. Geological map of the Grua area showing the general geology and sampling locations. The two sampled profiles are marked by stippled lines with arrows.
(Based on maps from Bollingberg 1961, Sæther 1962, Gaut 1974, 1975, Olerud 1977 and Svensen 1996).
700-720°C. According to Olsen & Griffin (1984), late
magmatic fluids in the Drammen granite were at lithostatic pressures of 1300-1500 bar within the granite,
except at the contacts, where hydrostatic conditions and
boiling occurred. Jamtveit et al. (1992a, b) assumed
P fluid= 500 bar for the contact metamorphism in the
Oslo Graben, in the absence of more precise estimates.
Grorud (1991), however, used two different fluid pres
sure estimates, 500 bar and 1000 bar. Metamorphic peak
conditions of about 420°C for layered shale-carbonate
sequences around the Nordmarka syenite were reported by Jamtveit et al. (1992a). However, recently discovered phase assemblages from a large limestone xenolith within the Skrim monzonite complex demonstrate local heating to ca. 850°C (Jamtveit et al. 1997b).
Skarn formation in Lower Palaeozoic meta-sediments can be connected to fluid evolution in the associated intrusions (Jamtveit & Andersen 1993). At distances > 1000 m from the intrusive contact with the Drammen
granite, Grorud (1991) concluded that the fluid composi
tion in layered shale-limestone sequences was internally
buffered by mineral reactions, whereas the progress of the devolatilization reactions doser to the intrusion is driven by the infiltration of H20-rich fluids. The skarn
forming solutions show low co2 concentrations, with Xc02 < 0.05 (Jamtveit at al. 1992a). Data given by
Grorud (1991) from Ordovician shale-limestone se-
quences in the Asker area suggest that no significant infiltration-driven metasomatism, except for limited alkali metasomatism, occurred during pervasive contact metamorphism.
Pattison & Tracy's (1991) review of phase equilibria in contact-metamorphic meta-pelites lists phase assemblages from other low-pressure aureoles comparable with those reported from the Oslo Graben. The presence of cordierite, and absence of andalusite, in muscovite + quartz-bearing rocks, is a characteristic feature of the facies series within the Oslo Graben meta-pelites. Other characteristic features are the stability of andalusite + Kfeldspar, the absence of sillimanite except at high grades, the stability of spinel and hyperstene, and the absence of garnet in high-grade cordierite-bearing assemblages (Pattison & Tracy 1991).
The Grua area
The Grua area is situated about 50 km north of Oslo, in the Akershus Graben segment, where E-W-striking sedimentary sequences are intruded by a variety of Permian rocks (Figs. l, 2). The area was the focus of much attention in the past, due to the presence of Pb-Zn-Fe skarn-bosted mineralizations of economic importance. It is evident that all the ore deposits in the Grua area are located along the sandstone-carbonate contact (Fig. 2),

84 H. Svensen & B. Jamtveit NORSK GEOLOGISK TIDSSKRIFT 78 (1998)
Tab/e l. Mineral abbreviations. Solid solution series are written with the first letter Table Ja. Mineralogical variation in shales towards the intrusive contact. as an upper-case. Endmember phases are written using lower-case characters.
Am ph amphibole Dl illite
an anorthite kfs K-feldspar
and andalusite m magnesite
at antigorite mu muscovite
Bi o bi o tite OI Olivine
CC calcite or orthoclase
C hl chlorite pa paragonite
clin clinochlore phi phlogopite
cor co run dum P lag plagioclase
Cpx clinopyroxene pre prehnite
Crd cordierite PY pyrite
c u mm cummingtonite qtz quartz
cz clinozoisite san sanidine
di diopside sp spinel
do l dolomite sph sphene
fo forsterite ta tale
gph graphite tr tremolite
gr grossular uv uvarovite
Grt garnet wo wollastonite
thus indicating fluid fiow along permeable sandstone
layers.
The sedimentary Lower Palaeozoic rocks of the Grua
area (Fig. 2) belong to stages 4b (Middle Ordovician) to
8 (Upper Silurian), following the stratigraphy given by
Bjørlykke (1974) for the Oslo region. The sequence of
Ordovician to Silurian sedimentary rocks is affected by
contact metamorphism for a distance of about 3 km from
the contact with the Nordmarka syenite complex (Brøgger
& Schetelig 1917; Sæther 1962). The sedimentary rocks in
this area are intruded by a range of intrusive rocks. The
oldest intrusive (see references below) is an alkali syenite
pluton belonging to the Nordmarka complex. In the eastern part of the field area, this syenite is intruded by a biotite granite. Age relations among these were determined from field observations by Sæther (1962).
The My/la Alkali Syenite (Fig. 2) forms the border parts
Table 2. Phase assemblages in selected shales and limestones from the Grua area.
sample dist(m) lithology Stage assemblage G21 2400 shale 4 Bio+Plag+kfs+cc+qtz+gph
G23 1800 Iimestone 4 Chl+Bio+Plag+kfs+cc+qtz
018 1600 shale 4 Amph+Chl+Plag+kfs+qtz+gph
GlO 1200 shale 4 Cpx+Amph+Plag+kfs+qtz
S38 750 limes tone 5a Cpx+Grt+Plag+kfs+cc+qtz
S33 450 limes tone 5a Cpx+Grt+Plag+kfs+cc+qtz
SK19 75 limes tone 5a Cpx+Ol+Amph+dol+Bio+cc
S27 50 shale 8 Cpx+Bio+Plag+kfs+qtz
S14 10 shale 8 Cpx+Amph+Bio+Plag+kfs+qtz
SK23 o shale 7c Crd+Bio+Plag+kfs+qtz
metres 2400 1600 1200 50 10 o sample 021 018 GlO S27 S14 SK23
qtz ,,,.,. .
kfs Plag CC
C hl Bi o Amph Cpx Crd
Tab/e 3b. Mineralogical variation in limestones towards the intrusive contact.
metres 1800 750 450 75
sample 023 S38 S33 SK19 CC '"•>�·'/'
qtz kfs Plag . ',,,
C hl Bi o Cpx .
Grt Am ph OI Do l
of an intrusion, the Øyangen syenite (Sundvoll & Larsen
1990), belonging to the Nordmarka intrusive complex.
The Øyangen syenite was dated by the Rb-Sr whole-rock
method by Sundvoll & Larsen (1990), giving an isochron
age of 266 ± 8 Ma. Mesoperthitic K-feldspar is the dominating phase (about 95 vol.%), with minor amounts of biotite, sodic pyroxene and amphibole (Sæther 1962). Quartz is present sporadically. The boundary between the Alkali Syenite and the sedimentary rocks is irregular, with apophyses of syenite intruding the sediments and sediments also enclosed within the syenite (Sæther 1962).
The Grua Granite (Fig. 2) was classified as a biotite
granite by Barth (1945) and Sæther (1962). The Grua
granite is believed to belong to an intermediate intrusion
event in the Nordmarka intrusion complex (Sundvoll & Larsen 1990). Sundvoll & Larsen (1990) dated the Grua
Granite by the Rb-Sr whole-rock method, giving an
isochron age of 262 ± 3 Ma.
Numerous dykes cut the sedimentary sequence, with a
mean orientation (derived from 102 measurements in the
south Hadeland area) of about 11 °N (Lauritzen 1970).
They vary in both composition and size. Rhomb porfyry
(RP) dykes (occurring in the western part of the field
area), trending about 30°N, with a maximum thickness

NORSK GEOLOGISK TIDSSKRIFT 78 (1998)
of about 80 m, were described by Holtedahl & Schetelig
(1923). Samples of these dykes from Roa were dated by Sundvoll & Larsen (1993) by the Rb-Sr method, giving
an age of 273 ± 7 Ma (see reference for further information). In addition to RP dykes, diabase and syenite dykes are reported west in the area (Bollingberg 1961; Lauritzen 1970; Olerud 1977).
The Caledonian anticline, with an approximately EW fold axis in the western part of the field area and ENE-WSW fold axis in the eastern part of the area, is cut by numerous faults (Bollingberg 1961). The frequency of faulting in these sedimentary rocks seems to increase towards the contact with the Nordmarka intrusive complex (Olerud 1977). Some faults have been traced through the meta-sediments and into the intrusive rock complex, but the relation between Caledonian and Permian fault activity is uncertain (Bollingberg 1961).
Petrography and mineral chemistry
Samples from the Grua area were collected along the Svea profile and the Grua profile (Fig. 2) from the intrusive contact with the Mylla Alkali Syenite, perpendicular to the sedimentary bedding. Samples were also taken at Skjerpemyr.
Analytical methods
A JEOL-840 Scanning Electron Microscope (SEM) with the Link AN 10/55 S analyser, at the Department of Geology, University of Oslo, was used for petrographic examinations of the samples.
All microprobe data were obtained with a CAMECA CAMEBAX electron microprobe at the MineralogicalGeological Museum (MGM) in Oslo, using natura} and synthetic standards. All analyses were run using an accelerating voltage of 15 kV. Halogens were analysed with a beam current of l O nA. All phases except for feldspar
were analysed using a focused beam of ca. l J.lm in diameter. Feldspar was analysed by scanning a grid of 5 x 5 J.lm. Peak and background values were generally counted for 10 s for major elements like Si and Al, and for 20 s for elements with lower concentrations, like Mn and Ti.
Sample descriptions
Petrographic descriptions of samples from the Svea and Grua profiles are given for metamorphic shales and limestones present in the area, except for infiltration metasomatic skarns and skarn-bosted mineralizations. The meta-sedimentary rocks present in the Grua area are usually layered, i.e. the studied samples contain zones with different bulk chemistry and phase assemblages. Samples described are believed to be representative for their respective meta-sedimentary units at that particular
Contact metamorphism, Oslo Rift 85
distance. Phase assemblages formed during veining, and
alteration of possible peak metamorphic assemblages,
will not be described in detail. Mineral abbreviations are
given in Table l, where solid solution phases are written
with an uppercase first letter. Metamorphic shales are
confined to stages 4, 5a, 7ab, 7c, and 8 in the strati
graphic column of south Hadeland (see Svensen 1996). Shales from stages 4, 5a and 7ab are inter-layered with
limestones, and can occur as marly shales. Shales from
stage 8 are inter-layered with both quartz-feldspar-rich
layers and calcareous layers, and are generally < 20 cm
thick. Average grain size in meta-shales from the inner
most contact aureole (doser than 300 m in the Svea
profile) is generally between 30 and 50 J.lm (Svensen
1996). Metamorphic Iimestones are confined to stages 4,
5a, and 7ab. Limestones from stages 4 and 7c are inter
layered with shales, whereas stage 5a rocks are impure
carbonates. Phase assemblages are given the same la
belling as the samples in which they are observed. A
summary of the phase assemblages observed in the sam
ples is given in Table 2 and Table 3a-b. Distances given
are from the shales and limestones to the Mylla Syenite.
All photographs are from backscatter images on the
SEM. Sample G21 (2400 m). - This is a marly shale with
alternating light grey and dark grey hands. In the dark
grey layers, average quartz grain size is ca. 10 J.lm in
diameter; biotite grains are smaller, about 3-4 J.lm in
diameter. Bulk carbon analysis of this layer yielded 0.34 wt% total organic carbon. This suggests that graphite is
an accessory phase. Assemblage G21 contains irregu
larly-shaped sedimentary quartz grains (Fig. 3A). Calcite
is observed as < 5 J.Lm grains.
Sample G23 (1800 m). - This limestone was collected
from a limestone in the stage 4 layered shale-limestone
sequence. Rounded quartz grains ( < 15 J.lm in diameter) and plagioclase grains (usually < 10 J.Lm in diameter)
coexist with small ( < l O J.Lm long) irregular bi o tite grains.
K-feldspar grains are rounded, indicating a possible sedi
mentary origin. Chlorite is observed as tabular grains coexisting with plagioclase and biotite (Fig. 3B). Pyrite and sphene are accessories.
Sample G18 (1600 m). - This shale is collected in the Grua profile, from the stage 4 layered shale-limestone sequence, and has an internal layering consisting of light hands ( l to 3 cm wide) in a darker shale. A chlorite-bearing assemblage is observed in the dark grey areas: An organic carbon content of 0.29 wt% (Svensen 1996) suggests that graphite is an accessory phase. Amphiboles
are irregularly-shaped, often elongated, and 30-40 J.Lm in diameter (Fig. 3C). K-feldspar is present in two different textural settings, both as homogeneous grains, and finely intergrown with plagioclase (see Fig. 3C). Quartz grains are irregularly shaped. Chlorite is present in close prox
imity to quartz and plagioclase. Sphene is an accessory
mineral, but is locally abundant. Pyrite and amphibole
bearing veins cut the rock.

86 H. Svensen & B. Jamtveit
(A)
Fig. 3A-D.
Sample GlO (1200 m). - This shale has the same
internal layering as sample G 18. Light grey and dark grey hands alternate, the difference in colour being due to differences in the modal content of clinopyroxene and quartz. Both zones have about the same volume content of K-feldspar. The assemblage present in the light grey hands consists of almost equal amounts of K-feldspar, clinopyroxene and amphibole. The pyroxene is heterogeneous in composition (on crystal scale), whereas the amphibole shows compositional variations to a lesser degree (Fig. 3D). Plagioclase grains are < 10 11m in diameter and intergrown with K-feldspar (Fig. 3D). Sphene is an accessory phase.
Sample S38 (750 m). - This limestone is collected from impure limestone sequences in the Svea profile. In this sample, pyroxene and garnet are present in an interconnected network (Fig. 3E). Calcite is the most abundant phase (comprising 70-80 vol.%). K-feldspar is observed
both as 5-10 11m grains between calcite grains, and as irregular grains in plagioclase-K-feldspar-calcite aggregates. One of these aggregates is shown in Fig. 3E, where two plagioclases with different compositions can be ob
served. Quartz grains range in size from a bo ut l O to 30
NORSK GEOLOGISK TIDSSKR!Fr 78 (1998)
11m in diameter. The limestone is cut by prehnite veins
which also cut the garnet and pyroxene network. Sphene
and pyrite are accessories. Sample S33 (450 m). - This limestone is collected from
layered shale-limestone sequences containing calcite (about 100 11m mean diameter) as the dominating phase, making up about 90% of the volume. Quartz grains ranging in diameter from 10 to l 00 11m are rimmed by pyroxene, the rim thickness being only a small fraction of the quartz grain diameter. Plagioclase grains are observed as accessories. An interconnected network consisting mostly of garnet, but also of some pyroxene, is present along calcite grain boundaries, sometimes in a
breccia-like pattern through the calcite. Pyroxene shows a third type of textural setting: small ( < l O 11m in diameter) irregularly-shaped grains confined to 'trains' in the limestone. Sphene and rutile are accessories.
Sample SK19 (75 m). - This limestone was collected at
Skjerpemyr, where numerous small skarn mineralizations are hosted in the stage 5a impure carbonate. However, these mineralizations are small, and the limestones adjacent to them are marls unaffected by the infiltration
metasomatism. Biotite is present as euhedral tabular

NORSK GEOLOGISK TIDSSKR!Ff 78 (1998) Contact metamorphism, Oslo Rift 87
(B) Fig. 3. SEM backscatter photographs of the described mineral assemblages. (A) Intergrown biotite and K-feldspar in sample G21 (2400 m). Note the slightly preferred
orientation of biotite and pyrite grains. (B) Biotite and chlorite from sample G23, a limestone collected in the Grua profile, 1800 m from the contact. Note the different
shapes of K-feldspar (probably sedimentary) and plagioclase grains. Scale bar is lO J.!m long. (C) Amphibole and chlorite coexisting with feldspar and quartz in dark
grey area of sample GIS. Plagioclase, which is present in close association with amphibole and chlorite, is intergrown with K-feldspar. (D) Zoned, intergrown
amphibole and clinopyroxene from sample G lO. Scale bar is !O J.!m. (E) Gamet and clinopyroxene networks from sample S38. (F) Sketch of a dolomitic marble with
olivine and clinopyroxene, collected from the Svea profile (sample SKI9, 75 m). Phlogopite is present both as tabular crystals in calcite and in direct contact with other
phases. Olivine has inclusions of calcite. Clinopyroxene is intergrown with olivine, and is observed surrounding amphibole. Scale bar is 100 J.!m. (G) Clinopyroxene
and biotite in a mainly K-feldspar matrix from sample S27 (50 m). (H) Biotite, amphibole and clinopyroxene from sample S l 4 ( lO m). (l) Poikilitic cordierite and
biotite in sample SK23 (O m). pin= pinitization of cordierite.
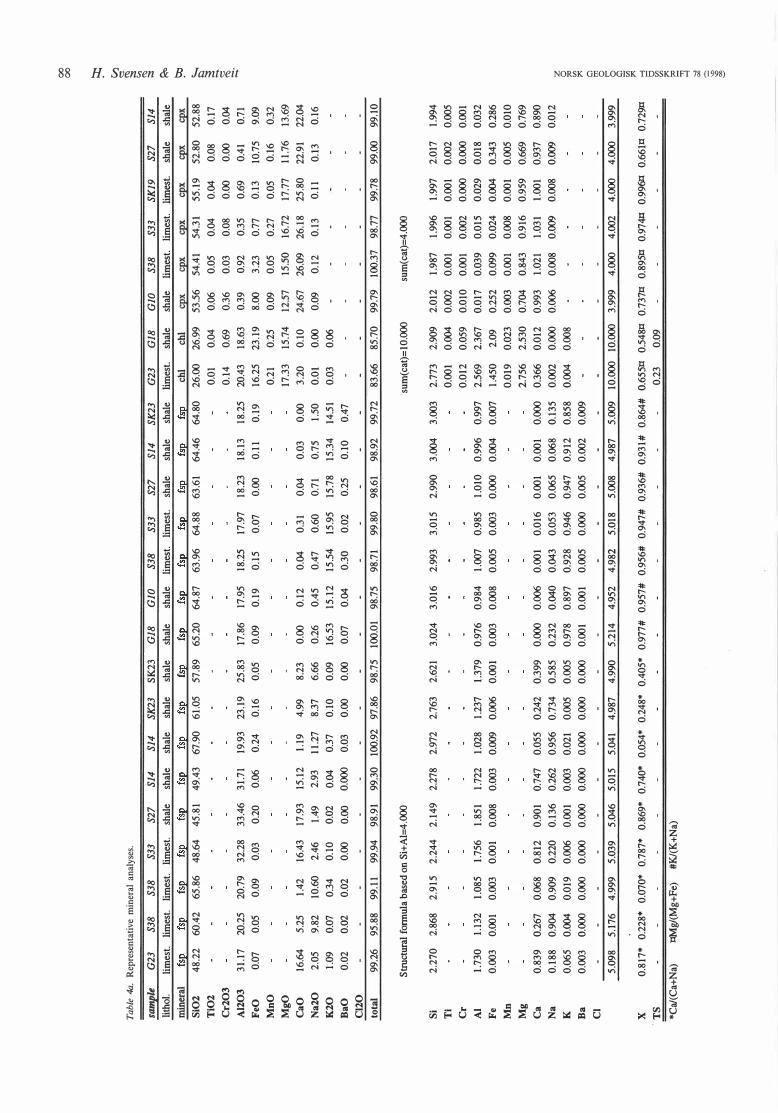
Tab
/e 4a
. R
epre
sen
tati
ve m
iner
al a
nal
yses
.
Salnpk
G
23
S3B
S3B
S33
S27
Sl4
Sl4
SK23
SK
23
GIB
G
lO
S38
S33
S27
Sl4
SK23
G
23
GIB
G
lO
S3B
S33
SK19
S27
Sl
4 lit
hol.
mineral
S
i02
Ti0
2
Cr2
03
Al2
03
FeO
Mn
O
Mg
O
Ca
O
Na
20
K2
0
Ba
O
Cl2
0
limes
t. lim
est.
limes
t. lim
est.
shal
e sh
ale
shal
e sh
ale
shal
e sh
ale
shal
e lim
est.
limes
t. sh
ale
shal
e sh
ale
lim
est.
shal
e sh
ale
limes
t. lim
est.
limest.
shal
e sh
ale
--
--
--
--
--
--
--
--
�
�
�
�
�
�
�
�
48.2
2 60
.42
65.8
6 48
.64
45.8
1 49
.43
67.9
0 61
.05
57.8
9 65
.20
64.8
7 63
.96
64.8
8 63
.61
64.4
6 64
.80
26.00
26
.99
53.5
6 54
.41
54.3
1 55
.19
52.8
0 52
.88
0.01
0.
04
0.06
0.
05
0.04
0.
04
0.08
0.
17
0.14
0.
69
0.36
0.
03
0.08
0.
00
0.00
0.
04
31.1
7 20
.25
20.7
9 32
.28
33.4
6 31
.71
19.9
3 23
.19
25.8
3 17
.86
17.9
5 18
.25
17.9
7 18
.23
18.1
3 18
.25
20.4
3 18
.63
0.39
0.
92
0.35
0.
69
0.41
0.
71
0.07
16.64
2.05
1.
09
0.02
0.05
5.25
9.82
0.
07
O.D2
0.09
0.
03
1.42
16
.43
10.6
0 2.
46
0.34
0.
10
0.02
0.
00
0.20
0.
06
17.9
3 15
.12
1.49
2.
93
0.02
0.
04
0.00
0.
000
0.24
1.19
11
.27
0.37
0.
03
0.16
4.99
8.
37
0.10
0.
00
0.05
8.23
6.
66
0.09
0.
00
0.09
0.00
0.
26
16.5
3 0.
07
0.19
0.12
0.
45
15.1
2
0.04
0.15
0.04
0.
47
15.5
4 0.
30
0.07
0.31
0.
60
15.9
5 0.
02
0.00
0.04
0.
71
15.7
8 0.
25
0.11
0.03
0.75
15
.34
0.10
0.19
0.00
1.
50
14.5
1
0.47
16.2
5 0.
21
17.3
3 3.
20
0.01
0.
03
23.1
9 0.
25
15.7
4 0.
10
0.00
0.
06
8.00
0.
09
12.5
7 24
.67
0.09
3.23
0.
05
15.5
0 26
.09
0.12
0.77
0.
27
16.7
2
26.1
8 0.
13
0.13
10
.75
0.05
0.
16
17.7
7 11
.76
25.8
0 22
.91
0.11
0.
13
9.09
0.
32
13.6
9 22
.04
0.16
tota
l 99
.26
95.8
8 99
.11
99.9
4 98
.91
99.3
0 100
.92
97.8
6 98
.75
100.D
l 98
.75
98.7
1 99
.80
98.6
1 98
.92
99.7
2 83
.66
85.7
0 99
.79
100.3
7 98
.77
99.7
8 99
.00
99.1
0
Struct
ura1
fonn
ula
base
d on
Si+
Al=
4.00
0 su
m(c
at)=
10.00
0 su
m(c
at)=
4.00
0
Si
Tl
Cr
Al
Fe
Mn
Mg
Ca
Na
K
Ba
Cl
2.27
0 2.
868
2.91
5 2.
244
2.14
9 2.
278
2.97
2 2.
763
2.62
1 3.
024
3.01
6 2.
993
3.01
5 2.
990
3.00
4 3.
003
2.77
3 0.
001
0.01
2 1.
730
0.00
3
1.13
2
0.00
1 1.
085
1.75
6 0.
003
0.00
1 1.
851
1.72
2 1.
028
1.23
7 1.
379
0.97
6 0.
984
1.00
7 0.
985
1.01
0 0.
996
0.99
7 0.
008
0.00
3 0.
009
0.006
0.
001
0.00
3 0.
008
0.00
5 0.
003
0.00
0 0.
004
0.00
7 2.
569
1.45
0 0.
019
2.75
6 0.
839
0.26
7 0.
068
0.81
2 0.
901
0.74
7 0.
055
0.24
2 0.
399
0.00
0 0.
006
0.00
1 0.
016
0.00
1 0.
001
0.00
0 0.
366
0.18
8 0.
904
0.90
9 0.
220
0.13
6 0.
262
0.95
6 0.
734
0.58
5 0.
232
0.04
0 0.
043
0.05
3 0.
065
0.06
8 0.
135
0.00
2
0.06
5 0.
004
0.01
9 0.
006
0.00
1 0.
003
0.02
1 0.
005
0.00
5 0.
978
0.89
7 0.
928
0.94
6 0.
947
0.91
2 0.
858
0.00
4 0.
003
0.00
0 0.
000
0.00
0 0.
000
0.00
0 0.
000
0.00
0 0.
000
0.00
1 0.
001
0.00
5 0.
000
0.00
5 0.
002
0.00
9
2.90
9 2.
012
1.98
7 0.
004
0.00
2 0.
001
0.05
9
2.36
7
2.09
0.01
0 0.
001
0.01
7 0.
039
0.25
2 0.
099
0.02
3 0.
003
0.00
1 2.
530
0.70
4 0.
843
0.01
2 0.
993
1.02
1
0.00
0 0.
006
0.00
8
0.00
8
1.99
6 1.
997
0.00
1 0.
001
2.01
7 0.
002
1.99
4 0.
005
0.00
2 0.
015
0.02
4
0.00
0 0.
000
0.00
1 0.
029
0.01
8 0.
032
0.004
0.
343
0.28
6 0.
008
0.00
1 0.
005
0.01
0 0.
916
0.95
9 0.
669
0.76
9
1.03
1 0.
009
1.00
1 0.
008
0.93
7 0.
009
0.89
0 0.
012
5.09
8 5.
176
4.99
9 5.
039
5.04
6 5.
015
5.04
1 4.
987
4.99
0 5.
214
4.95
2 4.
982
5.01
8 5.
008
4.98
7 5.
009
10.00
0 10
.000
3.99
9 4.
000
4.00
2 4.
000
4.00
0 3.
999
X
0.81
7*
0.22
8*
0.07
0*
0.78
7*
0.86
9*
0.74
0*
0.05
4*
0.24
8*
0.40
5*
0.97
7#
0.95
7#
0.95
6#
0.94
7#
0.93
6#
0.93
1#
0.86
4#
0.65
5ll
0.54
8ll
0.73
7ll
0.89
5ll
0.97
4ll
0.99
6ll
0.66
1ll
0.72
9ll
. T
S
--
--
-0.
23
0.09
*Ca/
(Ca+
Na)
llM
g/(M
g+Fe
) #K/
(K+
Na)
00
00
�
� � �
�
�
� ....
� �-
....
z � Vl
"' � 8 til "' � Vl
"'
)Il � Oil � "'
�
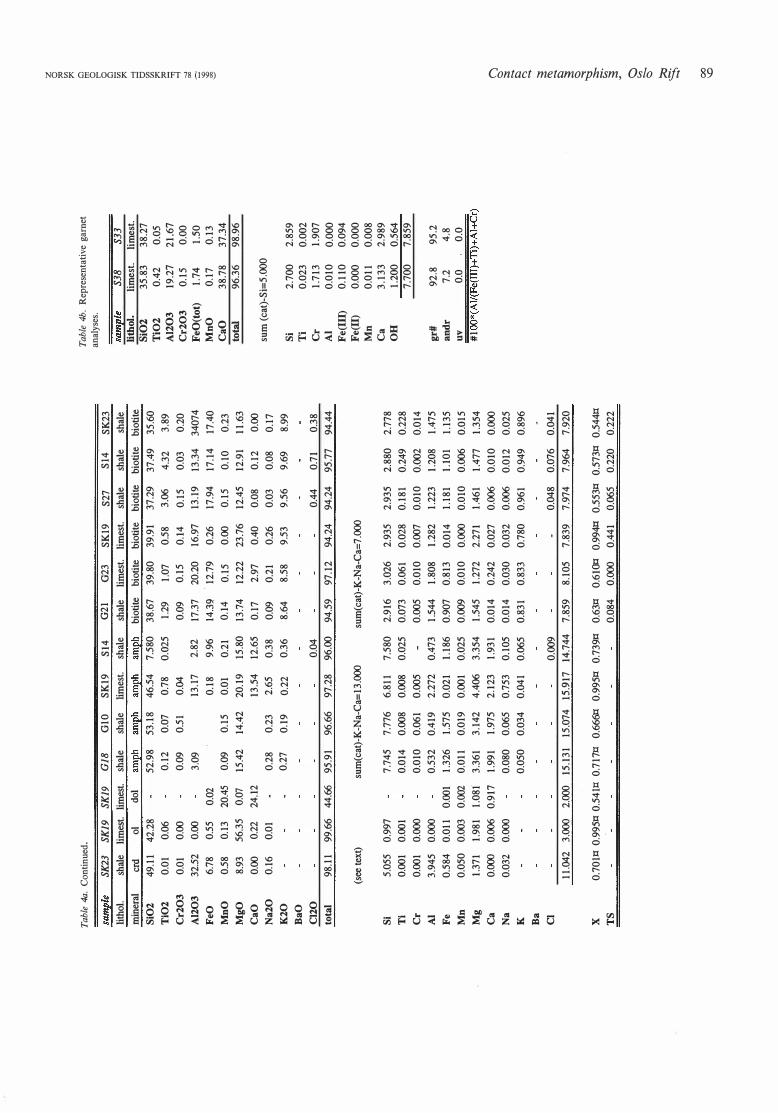
Tab
le 4a
. C
on
tin
ued
.
samp
le
litho
l.
min
eral
Si0
2
Ti0
2
Cr2
03
Al2
03
FeO
Mn
O
Mg
O
Ca
O
Na
20
K2
0
Ba
O
Cl2
0
tota
l
Si
Ti
Cr
Al
Fe
Mn
Mg
Ca
Na
K
Ba
Cl
X
TS
SK23
SK
19
SK19
sh
ale
limes
t. lim
est.
crd
ol
dol
49.1
1 42
.28
0.01
0.
06
0.01
0.
00
32.5
2 0.
00
6.78
0.
55
0.02
0.
58
0.13
20
.45
8.93
56
.35
0.07
0.00
0.
22
24.1
2 0.
16
0.01
GIB
G
lO
SK19
SJ
4 sh
ale
shal
e li
mes
t. sh
ale
rumph
rum
ph
rumph
rum
ph
52.9
8 53
.18
46.5
4 7.
580
0.12
0.
07
0.78
O.
OZ5
0.09
0.
51
0.04
3.09
13
.17
2.82
0.18
9.
96
0.09
0.
15
0.01
0.
21
15.4
2 14
.42
20.1
9 15
.80
13.5
4 12
.65
0.28
0.
23
2.65
0.
27
0.19
0.
22
0.38
0.
36
0.04
98
.ll
99.6
6 44
.66
95.9
1 96
.66
97.2
8 96
.00
(see
text
) su
m(c
at)-
K-N
a-C
a=l3
.000
5.05
5 0.
997
7.74
5 7.
776
6.8l
l 0.
001
0.00
1 0.
014
0.00
8 0.
008
0.00
1 0.
000
0.01
0 0.
061
0.00
5 3.
945
0.00
0 0.
532
0.41
9 2.
272
0.58
4 O.
Qll
0.00
1 1.
326
1.57
5 0.
021
0.05
0 0.
003
0.00
2 O.
Oll
0.01
9 0.
001
1.37
1 1.
981
1.08
1 3.
361
0.00
0 0.
006
0.91
7 1.
991
0.03
2 0.
000
0.08
0 0.
050
3.14
2 4.
406
1.97
5 2.
123
0.06
5 0.
753
0.03
4 0.
041
7.58
0 0.
025
0.47
3 1.
186
0.02
5 3.
354
1.93
1
0.10
5
0.06
5
G21
G
23
SK19
S2
7 Sl
4 SK
23
shal
e lim
est.
limes
t. sh
ale
shal
e sh
ale
biot
ite
biot
ite
biot
ite
bioti
te
bioti
te
bioti
te
38.6
7 1.
29
0.09
17.3
7
39.8
0 39
.91
37.2
9 37
.49
35.6
0 1.
07
0.58
3.
06
4.32
3.
89
0.15
0.
14
0.15
0.
03
0.20
20
.20
16.9
7 13
.19
13.3
4 34
074
14.3
9 . 1
2.79
0.
14
0.15
0.26
0.00
17.9
4
0.15
17
.14
0.10
17.4
0
0.23
13
.74
12.2
2 23
.76
12.4
5 12
.91
11.6
3
0.17
2.
97
0.40
0.
08
0.12
0.
00
0.09
0.
21
0.26
0.
03
0.08
8.
64
8.58
9.
53
9.56
9.
69
0.44
0.
71
94.5
9 97
.12
94.2
4 94
.24
95.7
7
sum
(cat
)-K
-Na-
Ca=
7.00
0
2.91
6 0.
073
0.00
5 1.
544
3.02
6 0.
061
0.01
0 1.
808
0.90
7 0.
813
0.00
9 0.
010
1.54
5
0.01
4 0.
014
0.83
1
1.27
2
0.24
2
0.03
0
0.83
3
2.93
5 O.
OZ8
0.00
7 1.
282
2.93
5 0.
181
0.01
0 1.
223
2.88
0 0.
249
0.00
2 1.
208
0.01
4 1.
181
1.10
1
0.00
0 0.
010
0.00
6 2.
271
1.46
1
0.02
7 0.
006
0.03
2 0.
006
0.78
0 0.
961
1.47
7
0.01
0 0.
012
0.94
9
0.17
8.99
0.38
94
.44
2.77
8 0.
228
0.01
4 1.
475
1.13
5 O.
Ql5
1.35
4
0.00
0 0.
025
0.89
6
0.00
9 -
0.04
8 0.
076
0.04
1
11.04
2 3.
000
2.00
0 15
.131
15
.074
15
.917
14
.744
7.
859
8.10
5 7.
839
7.97
4 7.
964
7.92
0
0.70
lll 0
.995
ll 0.
54lll
0.
7l7lX
0.
666lX
0.
995ll
0.
739ll
0.
63ll
0.61
0ll
0.99
4ll
0.55
3ll
0.57
3ll
0.54
4ll
0.08
4 0.
000
0.44
1 0.
065
0.22
0 0.
222
Tab
le 4b
. R
epre
sen
tati
ve g
arnet
anal
yses
.
samp
le
lithol
.
Si0
2
Ti0
2
Al2
03
Cr2
03
FeO
(to
t)
Mn
O
Ca
O
total
S38
limes
t. 35
.83
0.42
19
.27
0.15
1.
74
0.17
38
.78
96.3
6
sum
(ca
t)-S
i=5.
000
S33
li m
est.
38.2
7 0.
05
21.6
7 0.
00
1.50
0.
13
37.3
4 98
.96
Si
2. 70
0 2.
859
Ti
0.02
3 0.
002
Cr
1.71
3 1.
907
Al
0.01
0 0.
000
Fe(
ID)
0.
110
0.09
4 F
e(II
) 0.
000
0.00
0 M
n
0.01
1 0.
008
Ca
3.
133
2.98
9 O
H
1.20
0 0.
564
7.70
0 7.
859
gr#
92
.8
andr
7.2
uv
0.
0
95.2
4.
8 0.
0
#l OO
*(AI/
(Fe( II
I)+ Ti
)+A
l+C
r)
� � � o ti; :><: -l 6 � ;;; � _,
00 :0 � g
;::: iS" �
.....
� .." � c
�
;:::- ��· �
Cl
�
s
.....
00
\0

90 H. Svensen & B. Jamtveit
CC G21
2400m
l
S33 450m
3, 4
phi CC
CC
G23 1800m
dol tr fo
SK19 75m
5, 6
GIS 1600m
2
S27 SOm
GlO 1200m
di tr S14 lOm
7
NORSK GEOLOGISK TIDSSKRIFT 78 (1998)
3,4
SK23 Om
1: 3clin+3cc+5kfs=5phl+3an+3qtz+ 7H20+C02 5: fo+2cc+3qtz=2di+2C02
2: 2clin+tr+5kfs=5phl+2an+10qtz+4H20 (G21-G18) 6: tr+3cc+2qtz=5di+H20+3C02
3: phl+3cc+6qtz=3di+kfs+H20+3C02 (G23-S38) 7: tr+kfs=2di+phl+4qtz A
cDF 4: an+2cc+qtz=gr+2C02
Fig. 4. ACF relations and reactions for some samples from the Grua area. All phases are projected as theoretical end-members. Black dots show the bulk chemistry
of selected samples (analyses from Svensen 1996) projected onto the ACF triangle. Reactions 2 and 3 originate when comparing assemblages from the samples written
in parentheses.
grains with a highly variable size, ranging from about 10 11m to several hundred 11m in diameter. It occurs both as inclusions in calcite and in direct contact with the other phases (Fig. 3F). Calcite and dolomite are approximately equi-granular. Amphibole is observed as small ( < 20 11m) grains, partly surrounded by clinopyroxene. All phases are in direct contact with, or contain inclusions of, calcite. Iron sulphide is present as an accessory. Olivine contains calcite inclusions and ranges in size from a bo ut l O to 60 11m in diameter. Olivine is observed in direct contact with all other phases in this assemblage. Olivine has not previously
been reported from contact-metamorphic rocks in the Oslo Graben.
Sample S27 (50 m). - This sample represents an inter-layered shale-sandstone sequence. In the shale, biotite grains are arranged with a preferred orientation. Two feldspars from the plagioclase solid solution series are
observed. Minerals show a granoblastic crystal development. The phase assemblage is modally dominated by
K-feldspar, pyroxene and biotite (Fig. 3G). Plagioclase and quartz are present in
.small amounts. K-feldspar grains
are, on average, about 40-50 11m in diameter, with a
relatively high proportion of equi-granularity (Fig. 3G).
Plagioclase grains are confined to zones between quartz grains. Pyroxene grains are heterogeneous in composition. Biotite grains are usually less than 50 11m long, and have a preferred orientation. Sphene is present as an accessory. The rock is cut by scapolite-bearing veins.
Sample S14 (JO m). - This shale is collected from stage 8. In sample S l4, biotite and clinopyroxene coexist with matrix feldspar and quartz (Fig. 3H). The clinopyroxene has a variable composition. Clinopyroxene and biotite grains have a maximum grain size of about 100 jlm. K-feldspar is the volumetrically-dominating feldspar. Plagioclases with two different compositions are observed coexisting in this shale, with a gradual transition between them. Biotite is partly replaced by chlorite (see Fig. 3H). Accessory phases are zircon and pyrite. Pyrite with an irregular, sometimes droplet-shaped form has been observed both as inclusions in pyroxene, biotite, and
feldspar, and along grain boundaries. A scapolite-, clinozoisite- and pyrite-bearing vein cuts the rock.
Sample SK23 (Om). - At Skjerpemyr, this stage 7c shale is present in a roof pendant setting. The shale is foliated

NORSK GEOLOGISK TIDSSKRIFT 78 (1998)
o .. l l l
. i • l
• • u E o ()
400 • • • -'--
o • . ::: 800 l- -"'
g .s 8 1200 -l- • • 8 � !3 a 1600 -r- • • -
2000 L l l l
0.85 0.9 0.95 l K/(K+Na)
Fig. 5. K/(K + Na) ratio in alkali feldspar as a function of distance to the
intrusive contact.
and has a preferred orientation of biotite and a poikilitic development of cordierite (Fig. 31), with inclusions of
biotite, quartz and feldspar. The cordierite is locally partly pinitized. Two members of the plagioclase solid solution series coexist in this setting. Apatite, monazite
and pyrophanite are accessories.
ACF relations
The mineral assemblages listed in Table 2, together with
bulk chemical analyses from Svensen (1996), are presented in ACF diagrams (Fig. 4), where A = Al203 + Fe203, C= CaO and F = MgO + FeO. The bulk
chemical analyses are projected from K-feldspar, albite, sphene, apatite, quartz and a binary H20-C02 fluid. Plotted coordinates for minerals are obtained from stochiometric formulas of theoretical end-members. Sedimentary rocks from the Oslo Graben generally have
chlorite, illite, quartz, feldspar, calcite and dolomite as
their major mineralogical constituents. Thus, these minerals form the basis for mineral reactions during prograde metamorphism.
Table 5. Composition spaces used for solid solution calculations when the
examined sample do not contain any of the listed phases.
mineral XMg TS Biotite 0.4-0.8 0-0.3 Chlorite 0.3-0.8 0-0.3 Cordierite 0.4-0.8
Clinopyroxene 0.4-1
Orthopyroxene 0.4-0.7 Clinoamphibole 0.5-1 Orthoamphibole 0.5-1 Olivine 0.5-1
Contact metamorphism, Oslo Rift 91
Jamtveit et al. (1992a) proposed the following continu
ous AFM reaction to represent the transition between sedimentary and metamorphic shales from the Oslo region:
Chl + Ill= Bio + Chl (Al-richer) + qtz + H20
The presence of biotite in the outermost aureole in the Grua area is probably due to this reaction. However, the coexistence of biotite and plagioclase in sample G21 could be due to reaction l in Fig. 4:
3clin + 3cc + 5kfs = 5phl + 3an + 3qtz + 7H20 + C02 ( l)
Samples G21 and G18 (marly shales) have a rather similar bulk chemistry (Fig. 4); thus reaction 2 accounts for the coexistence of plagioclase and amphibole:
2clin + tr + 5kfs = 5phl + 2an + !Oqtz + 4H20 (2)
Similarly, samples G23 and S38 are both limestones. According to Fig. 4, reaction 3 is the pyroxene-in reaction:
phi + 3cc + 6qtz = 3di + kfs + H20 + 3C02 (3)
The presence of garnet in both sample S38 and S33 is due to reaction 4:
an + 2cc + qtz = gr + 2C02 (4)
Reactions 5 and 6 are two possible reactions involving clinopyroxene (relevant for sample SK19) that are suggested from the ACF relations in Fig. 4:
fo + 2cc + 3qtz = 2di + 2C02 (5)
tr + 3cc + 2qtz = 5di + H20 + 3C02 (6)
The coexistence of clinopyroxene, biotite and amphibole in sample SI4 is due to a solid-solid equilibrium:
tr + kfs = 2di + phi + 4qtz (7)
Mineral chemistry
It is not possible, from the mineral chemistry data presented in Ta bles 4a-b, to define systematic variations in mineral chemistry as a function of distance to the intrusive contact, except in the case of alkali feldspar (see p. 89). This is also true for variations in mineral chemistry
with rock type. The contact-parallel strike of the sedimentary sequences also makes the comparison between bulk compositions as a function of distance to the intrusive difficult.
Amphibole. - According to the amphibole nomenclature given by Leake (1978), all analyses can be classified as actinolites except that of sample SK19, which is classified as an edenite. The edenitic amphibole has an alkali (Na + K) content of 0.79 per formula unit (based on 13 cations).
Biotite. - Biotites were analysed from shales and limestones, and have a variation in Mg/(Mg + Fe) ratio from 0.54 to 0.99. The maximum tschermaks content is 0.44 (sample SK19, TS=Al2Mg_1Si_1, calculated as 3-Si).

92 H. Svensen & B. Jamtveit
X(O) Fig. 6A. Simplified T-X(O) projection for the K-feldspar, quartz, graphite and
fluid saturated system, calculated using solid solution models in the KAJ02-CaO
Mg0-FeO-A120rSi02-G-C-O-H system. The stability field for biotite with a
composition corresponding to the biotite in sample G21 is projected onto the
T-X(O) coordinate frame (shaded area) together with selected equilibria calcu
lated in an iron-free system. X( O) is defined as [0/(0 + H)].
The data are comparable to those of Jam tveit et al. (1992a), who reported a variation in XMg from shales (at a roof pendant in the Nittedal area) between 0.45 and 0.55, and a TS variation between 0.05 and 0.20. Biotite from sample S 14 has the highest Cl content, at 0.71 wt%.
Dolomite. - Dolomite has been observed in one sample (SK19). The dolomite in SK19 is slightly magnesian (XMg = 0.54). The structural formula (Table 4a) is calculated on the basis of 2 cations.
Chlorite. - The observed chlorites are homogeneous in composition, with XMg ratios of 0.55 and 0.66, and low TS contents (0.09 and 0.23), i.e. they are el ose to the clinocloredaphnite binary.
Clinopyroxene. - Pyroxenes from limes tones have generally higher X Mg values than pyroxenes from shales (0.9-1.00 vs. 0.66-0.74 for shales). The manganese content of all clinopyroxenes is low ( <0.01).
Cordierite. - Cordierite is observed in a sample (SK23) from the Svea profile. XMg in cordierites from SK23 varies between 0.701 and 0.706 (based on 5 analyses). The calculated structural formula in Table 4a is based on Si + Al= 9.000.
Alkali feldspar. - The composition of alkali feldspar is calculated as the mole fraction of orthoclase, i.e. K/(K + Na). The analysed samples range from 86 to 98% Or. The
NORSK GEOLOGISK TIDSSKRIFT 78 (1998)
K/(K + Na) ratio of alkali feldspar is slightly decreasing towards the intrusive contact (Fig. 5, based on data from Svensen 1996).
Plagioclase. - Plagioclase in rocks from the Grua area ranges in composition from alm ost pure al bite to anorthite. However, intermediate plagioclases are not present in limes tones. Three samples (SK23, S 14 and S38) contain two feldspars with different compositions. Up to three coexisting plagioclase compositions were reported by Svensen (1996) from the Grua aureole. These feldspars are believed to be coexisting immiscible phases of a highly non-ideal plagioclase solution. Plagioclase is thus treated as pure end-members, anorthite and albite, in the following phase diagram calculations.
Garnet. - Garnets are observed in meta-limestones (samples S33 and S38). End-member calculations only include grossular and andradite because of the low MgO, FeO and MnO contents (Table 4b). The limestone-hosted garnets show a relatively high proportion of hydrogrossular (0.56 and 1.2 OH-groups p.f.u.). These garnets have a high mole fraction of grossular (Xgr = 0.93-0.95) and are observed in an interconnected network. No chemical zoning in the garnets is observed. Garnets from limestones and sandstones in the Grua aureole are occasionally very Cr-rich (up to 20.4 wt% Cr203) (Prestvik 1974; Svensen 1996), and micro-textural observations indicate that the uvarovites nucleated on Cr-spinel.
Olivine. - Olivine analysis from a limestone (SK19) is given m Table 4a. The olivine composition is close to pure
424
408 -() -l-
392
376
1 kb
cz mu:::::an
0.05 0.10 0.15
X(C02) 0.20 0.25
Fig. 6B. Activity-corrected T-Xc02 projection for the KAJ02-Ca0-Mg0-AI203-
Si0,-H20-C02 system using quartz and K-feldspar saturation. Phase assemblage
G23 is stable along the outlined equilibrium.

NORSK GEOLOGISK TIDSSKR!Ff 78 (1998)
forsterite (Xro = 0.995). The structural formula is calculated on the basis of 3 cations.
Phase-petrological analysis Phase equilibria calculations were performed using PeRpLeX software, with VER TEX, a program based on a linear algorithm for evaluating thermodynamic surfaces (Connolly 1990). VER TEX computes multiple component saturation constraints with the use of a saturation hierarchy, i.e. a sequential evaluation of the saturation constraints (Connolly 1990, 1995). The phase diagrams presented here are calculated with a projection from a binary H20-C02 fluid, and graphite when present in the rock. A revised version of the thermodynamic database from Holland & Powell (1990) was used for the calculations. Phase equilibrium calculations involving binary H20-C02 fluids were performed using the CORK equation of state from Holland & Powell (1991). For graphitic rocks, the equation of state from Connolly & Cesare (1993) was used. VER TEX does calculations involving solid solutions through the introduction of pseudo-compounds, i.e. arbitrarily-defined compounds for approximating the continuous G-X surface of a solution (Connolly 1990, 1992). Mixing properties of mineral solutions were taken from Engi & Wersin (grossular-andradite 1987) and Anovitz & Essene (magnesite-calcite 1987). All other mineral solutions (biotite, chlorite, cordierite, clino-ortho amphibole, dolomite, orthopyroxene, clinopyroxene, epidote, olivine, spinel, tale, tremolite) were treated as ideal. The site occupancies suggested by Holland & Powell (1991) were assumed for the ideal solutions, including Tschermaks substitution for chlorite and biotite. Mineral compositions used for the calculations are taken from Tables 4a-b and Table 5. The compositional ranges given in Table 5 are believed to be representative. Reactions are labelled in such a way that the high temperature side is on the right side of the equation. Fig. 7 shows the results from the phase-petrological analysis of rocks from the Grua area.
For systems involving garnet (samples S33 and S38), ferric iron is included as a component. In these cases, solid solution models (using the whole compositional range) for other ferric iron phases are included (e.g. epidote, ordered one-site mixing). The constant activity projections are calculated for K-feldspar, quartz and fluid-saturated K.Al02-Ca0-Mg0-Al2 03-SiOr H2 O-C02 systems.
Fluid pressure
A fluid pressure of l kbar is used for the phase equilibria calculations in this work. A pressure of l kbar is reasonable for the contact metamorphism in the Oslo Graben in general, except during formation of infiltration metasomatic skarns, when fluid pressures may approach hydrostatic (i.e. Jamtveit et al. 1997). A reduction of this
Contact metamorphism, Oslo Rift 93
X(O) Fig. 6C. Simplified T-X(O) projection for a qtz + kfs + gph +fluid saturated
system, calculated using solid solution models in the KAJ02-CaO-MgO-FeO
Al20rSi02-G-C-O-H system. The chlorite (shaded area) and amphibole stability
fields correspond to analyses from sample G 18. The other equilibria shown are
calculated for an iron-free system.
pressure to 500 bar would lower the invariant points by some 20° (Grorud 1991), This pressure effect is minor compared to the uncertainty in phase equilibrium calculations. Thus, no effort has been made to further constrain this pressure estimate.
Solid solution models
A binary H20-C02 or 0-H fluid saturation is assumed for phase diagrams presented in this work. However, graphite-saturated COH fluids (GCOH) are not miscible below ca. 300°C (at l kbar). Thus, phase diagrams are not calculated for low temperatures in order to avoid complexities arising from immiscibility. Halogens are identified in biotites and amphiboles collected in the Grua area. A NaCl content in the fluid of e.g. 6 wt% (relative to H20-NaCl), would extend the region of immiscibility by about 100°C (Bowers & Helgeson 1983). Using the GCOH equation of state (Connolly & Cesare 1993) for calculating T-X(O) diagrams, the binary CH4-H20 fluids present at X(O) < 1/3 are miscible for temperatures > 366°C (consolute points at l kbar and XH2o = 0.82) whereas H20-C02 fluids (X(O) > 1/3) are miscible at T > 310°C (consolute point at XH2o = 0.75). These solvi are, however, not shown on the presented phase diagrams. The T-X(O) projection leads to a binary representation of the fluid in the 0-H system where X(O) [ = 0/(0 + H)] varies from O to l as the fluid composition changes from the C-H join to the C-0 join, and is 1/3 for pure water (Connolly 1995). X(O) is proportional to the oxygen fugacity in GCOH fluids.

94 H. Svensen & B. Jamtveit
600
540
480 -() -1-
420
360
300
1 kb
/ l
l l
l l
cz mu =an
0.2 0.4
8ample G10 D
ccand=an /
0.6 0.8
Fig. 6D. Simplified T-Xc02 projection for the K20-Ca0-Mg0-Fe0-Al203-Si02-
H20-C02 system, calculated using quartz and K-feldspar saturation. The solid
solutions were fitted to analyses from sample G 10. Selected reactions involving
anorthite are calculated in an iron-free system and projected onto the coordinate
frame.
Due to our limited knowledge of plagioclase solid solution behaviour at low temperature (see Carpenter 1994, his Fig. 11), plagioclase solid solution models should be used with care. The presence of several coexist-
1 kb 8ample 838 & 833 607
: )(�;:c;-�92-0.93 (S38) //.- TEll' E 551 L--1-�- ..:--/��0 ·- ·11 L-----� '
l Xgr=0.94-0.96 (S33) J i gr = an wo .Q.97) tr cc _ . l 0 495 \ CP'lt������_:-::::::-.:-:: ::·:.-.:::-_ -_g� 1 - _ _\:.--:::-- -,\ -1
1- / -- - -i F" :
439
383
327
1/ l il !
mu cc =an
'czmu=an 0.2 0.4
and cc= an
0.6 0.8 1.0
Fig. 6E. Simplified T-Xc02 projection for a qtz-kfs-cc-ftuid saturated system,
calculated using solid solution models in the KAI02-Ca0-Mg0-Fe0-Fe20r
Al20rSi02-H20-C02 system. Gamet stability fields (shaded areas) correspond to
analyses from sample S38 and S33, whereas the clinopyroxene composition is
corrected to fit both samples. The other equilibria are calculated for iron free
systems.
1 kb
400
NORSK GEOLOGISK TIDSSKRIFT 78 (1998)
0.2 0.4 0.6
san =phi
0.8
Fig. 6F. T-Xc02 projection for the K20-Ca0-Mg0-AI203-Si02-H20-C02 sys
tem, with calcite and dolomite saturation. The shaded area shows the stability
field for diopside. The limit of projection validity, given by the stability of
dolomite, is shown by the stippled line. The stability field for assemblage SK 19 is
shown by the outlined reaction.
ing plagioclase compositions could indicate both a large positive deviation from ideal mixing behaviour, and that only small activity variations could produce a plagioclase of almost any composition. Thus, only the anorthite component is used in the computed phase diagrams.
The temperatures of formation obtained from using the solid solution model for biotite are sensitive to the TS content (compare Figs. 6G and 6H). The tremoliteferrotremolite solution model is used for calculating the phase diagram for interpreting phase relations in sample SK19, although the analysed amphibole is edenitic. The considerable sodium content in this amphibole (2.65 wt%) will expand its stability field to higher temperatures and Xc02 values (cf. Baker et al. 1994).
Temperature and fluid composition estimates
No attempts have been made to label the phase diagrams presented below with the equilibria obtained from the ACF relations, since these are indirectly included in the phase equilibria calculations.
2400 m (Bio +P lag+ kfs + cc + qtz + gph). - The calculated stability field for biotite from this sample is shown in Fig. 6A. For X(O) >O.l, the temperature stability is between 390 and 565°C. The maximum temperature possible for this assemblage occurs at X(O) = 1/3. The anorthite-in reaction (cc + mu =an) limits the temperature only at X(O) values dose to 0.85; otherwise the biotite stability field is the only constraint on both the

NORSK GEOLOGISK TIDSSKRIFT 78 (1998)
488 -o -1-
432
376
320 0.2 0.4 0.6 0.8
Fig. 6G. Simplified T-Xc02 projection for a qtz + lcfs +fluid saturated system,
calculated using solid solution models in the KA102-Ca0-Mg0-Fe0-Al203-Si02-
H20-C02 system. The stability field for clinopyroxene and biotite (shaded area)
corresponds to analyses from sample S27.
temperature and the X(O). At X(O) = 1/3, the biotite stability is restricted to 480-565°C.
1800 m (Chl +Bio +P/ag +kfs +cc +qtz). - The observed phase relations in a fixed-activity diagram suggest
350
1 kb Sample 814 -··---,-- -.----.----.--�, T� l l l l .
\ i l i �l l i IJ l l l
\ � - - - - ----�\j zs..o.z"1J' __ . ."-- 1 :
\\(tj-�9:�:..---- . ) �,.. � "- ... ____ ...... '�� l _'((': . .l .... ,,, __ ____ t ______________ !__ _ _____ _]
0.2 0.4 0.6 0.8
Fig. 6H. Simplified T-Xc02 projection for a qtz-lcfs-fluid saturated system,
calculated using solid solution models in the KA102-Ca0-Mg0-Fe0-Al203-Si02-
H20-C02 system. The stability fields for clinopyroxene, amphibole and biotite
(shaded area) correspond to analyses from sample S l4.
650
-o -1-
410 l
350
1 kb
Contact metamorphism, Oslo Rift 95
-,- ·---,--,-- -,-··· ..... , Sample SK23
rl !
�
0.2 0.4 0.6 0.8
Fig. 6!. Simplified T-Xc02 projection for a qtz + kfs +fluid saturated system,
calculated using solid solution models in the KA102-Ca0-Mg0-Fe0-Al203-Si0,
H20-C02 system. The stability fields for cordierite and biotite (shaded area)
correspond to analyses from sample SK23.
a stability of this univariant assemblage (when fixing the activities of biotite and chlorite) along the clin + cc = phi + an equilibrium (Fig. 6B), supported by ACF relations (Fig. 4). This equilibrium occurs between ca. 390 and 4l0°C, with a pore fluid composition ranging from Xc02 = 0.03 to 0.18.
1600 m (Amph+Chl +Plag+kfs+qtz+gph). - The stability field for this assemblage (projected onto relevant equilibria in a Fe-free system) is shown in Fig. 6C. For the pure anorthite component, the lower temperature limit of stability is about 320°C, controlled by the cz + mu =an equilibrium at X(O) < 0.35, and cc + mu =an at X(O) between 0.35 and 0.5. The upper temperature stability is limited by the clin = mu +phi equilibrium at about 420°C at X(O) = 0.33. For a fluid composition X(O) > 0.2, the stability field is limited to 370-425°C. The highest possible X(O) value is 0.5.
1200 m (Cpx + Amph +P lag+ kfs + qtz). - The stability of this assemblage is limited to Xc02 < 0.02 by the cz + mu = an equilibrium, suggesting temperatures of formation > 380°C (Fig. 6D). For Xc02 > 0.02, the lower temperature stability is controlled by the presence of clinopyroxene. At high Xc02 values, the assemblage is only stable above ca. 485°C. Maximum temperature of stability is not constrained.
750 m (Cpx + Grt +P lag+ kfs + cc + qtz). - For pure end-member phases, the garnet is stable at T < 520°C and Xc02 < 0.13 (Fig. 6E). The stability field for garnet corresponding in composition to the analysis from sample S38 (Xgr = 0.92-0.93) is shown in Fig. 6E. The

96 H. Svensen & B. Jamtveit
maximum temperature of stability is thus about 550°C, and Xc02 values are < 0.3. The lower temperature stability is defined by the cz + mu = an equilibrium at ca. 380°C.
450 m (Cpx + Grt +P lag+ kfs +c c + qtz). - The upper temperature stability for garnet corresponding in composition to that of sample S33 is about 540°C (Fig. 6E). Thus, a somewhat lower temperature is obtained than for the slightly more grossular-rich garnet in sample S38. The lower temperature limit is 380°C.
75 m (Cpx + OI + Amph +do l + Bio +c c). - Fig. 6F is calculated for the Fe-free system. The univariant assemblage SK19 is stable along the di = fo equilibrium, corresponding to temperatures between 550 and 575°C, and Xc02 values between 0.65 and 0.99. The validity of these calculations is believed to be good, since minerals from sample SK19 are virtually iron-free. It is also supported by calculations induding solid solution models for the observed phases (Svensen 1996).
50 m (Cpx + Bio +P lag+ kfs + qtz). - In the phase diagram projection of Fig. 6G, biotite and diriopyroxene with the indicated compositions coexist between 460 and 575°C, with pore fluid compositions of Xc02 < 0.8. The lower temperature stability at Xc02 values > 0.3 is controlled by the dinopyroxene-in reaction. Fluid compositions dose to pure water restrict the stability field to 485-575°C.
JO m (Cpx + Amph + Bio +P lag+ kfs + qtz). - As for sample SK23, assemblage S14 has a stability field constrained by the stability of biotite and the lower temperature stability of clinopyroxene. The presence of amphibole in this assemblage does not further constrain the stability field (Fig. 6H). According to the equilibrium calculations, the stability field for this assemblage is between 440-620°C and Xco2 < 0.9. Equilibration with a
l kb
6l0
600
Q 550
� 500
1U �= � ::150
300
500 1000 1500 2000
Distance to intrusive contact (m) Fig. 7. Temperature profile for the Grua aureole. The vertical bars indicate
temperature intervals of formation obtained from phase diagram calculations.
The upper curve shows the mean temperature profile obtained from the presented
results. For comp.arison , the lower curve shows the results of a one-dimensional
heat transport model (Grorud 199 1). Limitations: (a) for X(O) >O.l, (b) for
X( O)> 0.2, (c) for Xc02 < 0.05, (d) for Xco2 <O.l .
NORSK GEOLOGISK TIDSSKRIFT 78 (1998)
low-Xc02 pore fluid is likely for this assemblage, as it was sampled dose to the intrusive contact, where infiltration should dominate in shale-rich lithologies. A C02-rich pore fluid raises the temperature stability of this assemblage.
Om (Crd + Bio +P lag+ kfs + qtz). - The stability field for this assemblage (shown in Fig. 61) is between 400 and 620°C, assuming fluid compositions ranging from O to 0.95. The lower temperature boundary is controlled by the cordierite-in reaction, while the upper temperature stability is defined by the stability field for biotite (with the chosen composition). However, for the same reasons as argued for assemblage S14, a low-Xc02 fluid could have interacted with this assemblage. The minimum temperature of formation for cordierite is a bo ut 545°C at low Xc02 values ( <O.l ).
Discussion Buffering and infiltration
Constraints on the composition of COH or GCOH fluids are not easily derived from phase petrology; except for the garnet-bearing assemblages that indicate H20-rich pore fluids, and the calcite-, dolomite- and diopside-bearing assemblage that indicate C02-rich pore fluids. According to the stability calculations, possible externally-buffered phase assemblages (S38 and S33) give Xc02 values <0.3. Jamtveit et al. (1992a) conduded that H20-rich fluids drive metamorphism in layered shale-carbonate sequences, and that limestones are relatively impermeable and thus internally buffered (condusions supported by phase petrology and stable isotope data from sample SK19).
Preliminary results from stable isotope analyses of calcite from layered shale-carbonate sequences in the aureole give J 180 values (relative to SMOW) ranging from .10.63 to 12.45 (samples S38 and S33), compared to 22.56 from sample SK19 (limestone). These data indicate that carbonate from samples S38 and S33 have interacted with fluids with magmatic stable isotope signatures. Carbonate in sample SK19 has J 180 values, suggesting limited interaction with magmatic fluids, despite being collected dose to the intrusive contact. Thus, the assumption of H20-rich fluids interacting with assemblages SK23 and S 14 seems appropriate. Furthermore, this results in a narrower estimated temperature range of formation.
Baumgartner et al. (1997) describe garnet zones ( < l cm wide) in marbles from the Adamello contact aureole, northern Italy, and suggest that the zones were generated during infiltration of water-rich fluids along micro-cracks. Thus, the garnet textures described from samples S33 and S38 could represent relicts of the porosity in the limestones during cracking and infiltration of magmatic fluids. This is also consistent with the preliminary stable isotope data. As stated by Baumgartner et al. (1997), the preservation of metamorphic porosity by formation of rigid

NORSK GEOLOGISK TIDSSKRIFT 78 (I998)
silicates could result from infiltration of silica-rich fluids
from the intrusives.
The thermal profile in the Grua aureo/e
The thermal profile resulting from the phase petrology analyses is presented in Fig. 7. A minimum temperature of about 390°C at distances 2 km from the intrusive, and maximum temperatures of ca. 620°C, gives a temperature difference of 230°C for the first 2 km of the aureole. On average (see Fig. 7), the difference is about 170°C, which gives a relatively low thermal gradient for the area. For comparison, the average temperature difference (estimated from phase petrology) in the Drammen-granite contact aureole in the Oslo Graben is about 140°C (see Fig. 7). Furthermore, the maximum temperature in that aureole was estimated to be ca. 480°C, a bo ut l oooc lower than in the Grua aureole. The temperature profile of Grorud (1991) is paraBel to the one obtained in the Grua area, consistent with a conductive heat transport during contact metamorphism in this area.
The maximum temperature of 565°C from sample G21
collected 2400 m from the contact is most likely a result of the difficulties of using that phase assemblage as a thermometer. However, due to the complex geology of the Grua area, we cannot rule out the possibility that distal parts of the sampling profiles are affected by local heat sources.
Conclusions Phase assemblages studied in contact-metamorphic shales and limestones from the Grua aureole have been modelled by phase-petrological methods to constrain the maximum-temperature conditions in the area. Some of the phase assemblages have not previously been reported from contact-metamorphic rocks in the Oslo Graben. Although some of the studied assemblages are well suited for thermometry, an accurate temperature determination is generally difficult. Valuable information on the stability of phase assemblages is modelled by VERTEX, which allows calculations involving solid solutions. The peak metamorphic temperature in the aureole was 550-575°C,
constrained from the stability of the intemally-buffered di + fo + tr + phi + dol + cc assemblage from a marl collected 75 m from contact with the intrusive, and from the stability of cordierite in shales at high H20 activities. From the resulting average temperature profile in the aureole, a temperature increase of ca. 170°C from 2 km to the intrusive contact is suggested. Gamet-bearing limestones equilibrated with H20-rich (Xc02 < 0.3) pore fluid, indicating an extemal source for the fluids. Preliminary stable isotope data suggest that these extemal fluids were derived from, or at least equilibrated within, the intrusive rocks.
Contact metamorphism, Oslo Rift 97
Acknowledgements. - This project was supported by grant no. 440.95/006 from
the Norwegian Research Council to B. Jamtveit. Reviews by T. Andersen, K.
Bucher, J. A. D. Connolly and I. A. Munz improved this paper. We also thank
H. Austrheim for assistance during microprobe work, J. A. D. Connolly for
solving practical problems during phase diagram calculations, and T. Winje and
B. L. Berg for assistance during SEM work.
Manuscript received December 1996
References Andersen, T. 1990: Melt-mineral-fluid interaction in peralkaline silicic intrusions
in the Oslo Rift, SE Norway, IV: Fluid inclusions in the Sande nordmarkite.
Norsk Geologisk Undersøkelse Bulletin 417, 41-54.
Anovitz, L. M. & Essene, E. J. 1987: Phase equilibria in the system CaCOr
MgC03-FeC03. Journal of Petrology 28, 389-414.
Antun, P. 1967: Sedimentary pyrite and its metamorphism in the Oslo region.
Norsk Geologisk Tidsskrift 47, 211-235.
Baker, J., Holland, T. J. B. & Powell, R. 1994: The effect of Tschermak's
substitution on assemblages in aluminous dolomites. Contributions to Mineral
ogy and Petrology 118, 48-59.
Barth, T. F. W. 1945: Studies on the igneous rock complex of the Oslo Region.
Il. Systematic petrography of the plutonic rocks. Skrifter Norske Vidensaps
Akademi i Oslo, Matematisk-naturvitenskapelig Klasse 1945, No. 8, 13-22.
Baumgartner, L. P., Gerdes, M. L., Person, M. A. & Roselle, G. T. 1997: Porosity
and permeability of carbonate rocks during contact metamorphism. In Jamtveit,
B. & Yardley, B. W. D. (eds.): Fluid Flow and Transport in Rocks: Mechanisms
and Effects, 83-98. Chapman and Hark, London.
Bjørlykke, K. 1974: Depositional history and composition of Lower Paleozoic
epicontinental sediments from the Oslo Region. Norges Geologiske Undersøkelse
305, 1-81.
Bjørlykke, K. 1983: Subsidence and tectonics in Late Precambrian and Paleozoic
sedimentary basins of southern Norway. Norges Geologiske Undersøkelse 380,
159-172.
Bollingberg, H. 1961: Spektrografisk undersøkelse av sporelementer, Grua, Hade
land. Unpublished Cand. Scient. Thesis, University of Oslo.
Bowers, T. S. & Helgeson, H. C. 1983: Calculation of the thermodynamic and
geochemical consequences of non-ideal mixing in the system H20-C02-NaCl on
phase relations in geologic systems: equation of state for H20-C02-NaCl fluids
at high pressures and temperatures. Geochimica et Cosmochimica Acta 547,
1247-1275.
Brøgger, W. C. & Schetelig, J. 19 17: Geological map, Hønefoss, l : 100,000. Norges
Geologiske Undersøkelse.
Bucher-Nurminen, K. 1982: On the mechanism of contact aureole formation in
dolomitic country rock by the Adamello intrusion (northern Italy). American
Mineralogist 67, 1101-1117.
Bucher-Nurminen, K. 1990: Geological phase diagram software. Terra Nova 2,
401-410.
Carpenter, M. A. 1994: Subsolidus phase relations of the plagioclase feldspar solid
solution. In Parson, I. (ed): Feldspars and their Reactions, 221-269. Kluwer
Academic Publishers.
Connolly, J. A. D. & Cesare, B. 1993: C-0-H-S fluid composition and oxygen
fugacity in graphitic meta-pelites. Journal of Metamorphic Geology 11, 379-388.
Connolly, J. A. D. 1990: Multivariable phase diagrams: an algorithm based on
generalized thermodynamics. American Journal of Science 290, 666-718.
Connolly, J. A.D. 1992: Phase diagram principles and computations: a review. In
Pressure and Temperature Evolution of Orogenic Beits. Lectures of the V Summer
School, Geologia e Petrologia dei Basamenti cristallini, 203-220. University of
Siena, ltalian National Research Council, Siena, Italy.
Connolly, J. A. D. 1995: PeRpLeX: A Tutorial. Unpublished.
Dons, J. A. 1978: Terminology and history of investigations. In Dons, J. A. & Larsen, B. T. (eds): The Oslo Paleorift. A Review and Guide to Excursions. Norges
Geologiske Undersøkelse 337, 9-16.
Engi, M. & Wersin, P. 1987: Derivation and application of a solution model for
calcic garnet. Schweizeriche Mineralogische und Petrographische Mitteilungen 67,
53-73.
Gaut, A. 1974: Ekskursjons guide Grua-Nittedal. Intern rapport, Department of
Geology, University of Oslo.
Gaut, A. 1975: Oslofeltets biotittgranitter: Petrografi og posisjon i den magmatiske
historie. Unpublished Cand. Scient. Thesis, University of Oslo.
Gleditsch, C. C. 1952: Oslofjordens prekambriske områder. Norges Geologiske
Undersøkelse 181/182, 1 18-19 1.
Goldschmidt, V. M. 1911: Die Kontaktmetamorphose im Kristianagebeit. Skrifter
Norsk Vitenskapelig Akademi, Oslo Matematisk Naturvitenskapelig Klasse
1911(11), 405 pp.
Grorud, H. F. 199 1: Kontaktmetamorfose i Paleozoiske sedimenter i Oslo-feltet.
Et profil i Asker. Unpublished Cand. Scient. Thesis, University of Oslo.

98 H. Svensen & B. Jamtveit
Hansteen, T. H. & Burke, E. A. J. 1990: Mett-mineral-fluid interaction in
peralkaline silicic intrusions in the Oslo Rift, southeast Norway. Il. High-tem
perature fluid inclusions in the Eikeren-Skrim complex. Norges Geologiske
Undersøkelse Bulletin 417, 15-32.
Holland, T. J. B. & Powell, R. 1990: An enlarged and updated internally
consistent dataset with uncertainties and correlations: the system K20-Na20-
CaO-MgO-MnO-FeO-Fe20rA120rTi02-Si02-C-H2-02. Journal of Metamor
phic Geology 8, 89-124.
Holland, T. J. B. & Powell, R. 199 1: A compensated-Redlich-Kwong (CORK)
equation of state for volumes and fugacities of C02 and H20 in the range l bar
to 50 kbar and l00-1600°C. Contributions to Mmeralogy and Petrology 109,
265-273.
Holtedahl, O. & Schetelig, J. 1923: Kartbladet Gran (1: 100,000). Norges Geolo
giske Undersøkelse 97, 46 p.
Ihlen, P. M. 1986: The geological evolution and metallogeny of the Oslo
Paleorift. In Olerud, S. & Ihlen, P. M. (eds.): Metallogeny Associated with the
Oslo Paleorift. Sveriges Geologiske Undersøkelse, Ser. Ca 59, 6-17.
Jamtveit, B. & Andersen, T. 1993: Contact metamorphism of layered shale-car
bonate sequences in the Oslo Rift. IlL The nature of skam-forming fluids.
Economic Geology 88, 1830-1849.
Jamtveit, B., Bucher-Nurminen, K. & Stijfhoorn, D. E. 1992a: Contact metamor
phism of layered shale-carbonate sequences in the Oslo Rift. I. Buffering,
infiltration and the mechanisms of mass transport. Journal of Petrology 33,
377-422.
Jamtveit, B., Dahlgren, S., Austrheim, H. (1997b): High-grade contact metamor
phism of calcareous rocks from the Oslo Rift, southern Norway. American
Mineralogist 82, 1241-1254.
Jamtveit, B., Grorud, H. F. & Bucher-Nurminen, K. 1992b: Contact metamor
phism of layered carbonate-shale sequences in the Oslo Rift. Il: Migration of
isotopic and reactions fronts around cooling plutons. Earth and Planetary
Science Letters 114, 131-148.
Jamtveit, B., Grorud, H. F. & Ragnarsdottir, K. V. 1997a: Flow and transport
during contact metamorphism and hydrotherrnal activity: examples from the
Oslo Rift. In Jamtveit, B. & Yardley, B. W. D. (eds.): Fluid Flow and Transport
in Rocks: Mechanisms and Effects, 57-82. Chapman and Hark, London.
Kerrick, D. M., Crawford, K. E. & Randazzo, A. F. 1973: Metamorphism of
calcareous rocks in three roof pendants in the Sierra Nevada, California.
Journal of Petrology 14, 303-325.
Lauritzen, Ø. 1970: Hadeland syd: detaljkartlegging og stratigrafisk undersøkelse.
Unpublished Cand. Real. Thesis, University of Oslo.
Leake, B. E. 1978: Nomenclature of amphiboles. American Mineralogist 63,
1023-1052.
Neumann, E. R., Olsen, K. H., BaJdridge, W. S. & Sundvoll, B. 1992: The Oslo
Rift: a review. Tectonophysics 208, 1-18.
Neumann, E. R., PaJlesen, S. & Andresen, P. 1986: Mass estimates of cumulates
and residues after anatexis in the Oslo Graben. Journal of Geophysical Research
91, 11629-11640.
Oftedahl, C. W. 1960: Permian focus and structures of the Oslo region. In
NORSK GEOLOGISK TIDSSKRIFT 78 (1998)
Holtedahl, O. (ed.): Geology of Norway, Norges Geologiske Undersøkelse 208,
298-343.
Olaussen, S. 1981: Marine incursion in Upper Palaeozoic sedimentary rocks in
the Oslo region, southern Norway. Geological Magazine 118, 281-288.
Olaussen, S., Larsen, B. T. & Steel, R. 1994: The upper Carboniferous-Permian
Oslo Rift: basin fill in relation to tectonic development. In Pangea: Global
Environments and Resources, 175-197. Canadian Society of Petroleum Geolo
gists Memoir 17.
Olerud, S. 1977: En malmgeologisk undersøkelse av Zn-Pb-Fe forekomstene i
Gruaornrådet på Hadeland. Unpublished Thesis, NTH.
Olsen, K. I. & Griffin, W. L. 1984: Fluid inclusion studies of the Drammen
granite, Oslo Paleorift, Norway. I. Microtherrnometry. Contributions to Miner
alogy and Petrology 87, l - 14.
Pattison, D. R. M. & Tracy, R. J. 199 1: Phase equilibria and therrnobarometry of
meta-pelites. In Kerrick, D. (ed.): Contact Metamorphism. Reviews in Mineral
ogy 26, 43-104. Mineralogical Society of America, Washington, DC.
Prestvik, T. 1974: Norwegian chromian ugrandite garnets. Contributions to the
Mineralogy of Norway 58. Norsk Geologisk Tidsskrift 54, 177-182.
Rasmussen, E., Neumann, E. R., Andersen, T., Sundvoll, B., Fjerdingstad, V. & Stabel, A. 1988: Petrogenetic processes associated with interrnediate and silicic
magmatism in the Oslo Rift, southeast Norway. Mineralogical Magazine 52,
293-307.
Rohrrnann, M., van der Beek, P., Andriessen, P. & Cloetingh, S. 1996: Meso
Cenozoic morphotectonic evolution of southern Norway: Neo gene domal uplift
inferred from apatite fission track therrnochronology. Tectonics 14, 704-718.
Sundvoll, B. & Larsen, B. T. 1990: Rb-Sr systematics in the magmatic rocks of
the Oslo Rift. Norges Geologiske Undersøkelse Bulletin 418, 27-46.
Sundvoll, B. & Larsen, B. T. 1993: Rb-Sr and Sm-Nd relationships in dyke and
sill intrusions in the Oslo Rift and related areas. Norges Geologiske Un
dersøkelse Bulletin 425, 25-41.
Sundvoll, B., Neumann, E. R., Larsen, B. T. & Tuen, E. 1990: Age relations
among Oslo Rift magmatic rocks: implications for tectonic and magmatic
modelling. Tectonophysics 178, 67-87.
Svensen, H. 1996: A phase-petrological analysis of contact-metamorphic lower
Palaeozoic sedimentary rocks from the Oslo Graben, Norway. Unpublished
Cand. Scient. Thesis, University of Oslo.
Sæther, E. 1962: Studies of the igneous rock complex of the Oslo region. XVIII.
General investigation of the igneous rocks in the area north of Oslo. Skrifter
Norsk Vitenskapelig Akademi, Oslo Matematisk Naturvitenskapelig Klasse, Ny
Serie, Nr. l. Tracy, R. J. & Frost, B. R. 199 1: Phase equilibria and therrnobarometry of
calcareous, ultramafic and mafic rocks, and iron forrnations. In Kerrick, D.
(ed.): Contact Metamorphism. Reviews in Mineralogy 26, 43-104. Mineralogical
Society of America, Washington, DC.
Ziegler, P. A. 1978: Northwestern Europe: tectonics and basin development.
Geologie en Mijnbouw 57, 589-626.
Ziegler, P. A. 1990: Geological Atlas of Western and Central Europe (2nd ed.).
Shell International Petroleum Company Inc., Amsterdam.