Embed Size (px)
Citation preview
REVIEW OF APPLIED ECONOMICSVol. 10, Nos. 1-2, (January-December 2014)
* Department of Banking and Finance, Faculty of Business and Economics, Monash University, PO Box 197 CaulfieldEast, VIC 3145, Australia; E-mail: [email protected]
** Corresponding Author, Department of Banking and Finance, Faculty of Business and Economics, Monash University,PO Box 197 Caulfield East, VIC 3145, Australia; E-mail: [email protected]
*** UWA Business School, The University of Western Australia, 35 Stirling Highway, Crawley, Perth, WA 6009,Australia; E-mail: [email protected]
RAE
Reproduced with permission of the copyright owner. Further reproduction prohibited without permissionfor all the manuscript.
CONTAGION AND FLIGHT-TO-QUALITY:EVIDENCES FROM THE ASIA-PACIFIC ECONOMIC
COOPERATION (APEC) REGION
Yu-Tung Peng*, Hue Hwa Au Yong** and Sirimon Treepongkaruna***
ABSTRACT: This paper investigates the existence and determinants of contagion and flight-to-quality phenomena during crisis periods in the stock and bond markets of APEC countriesbetween 1995 and 2010. The findings show the presence of contagion effects among stock marketsof APEC countries and between the U.S. and Canadian bond markets. There are evidences offlight-to-quality from majority of the stock markets to the U.S. bond market. Market sentimentplays an important role in explaining both contagion and flight-to-quality phenomena. Ourfindings suggest that governments should facilitate bond market development to prevent thepropagation of crises across countries.
JEL Classification: G15, G01, F15, F30, F60, E44
Keywords: Financial crisis, spillover, stock market, bond market, market sentiment
1. INTRODUCTION
Due to extensive globalisation over the past decades, the Global Financial Crisis (GFC hereafter)that originated in the U.S. has propagated to many countries around the world. Bordo et al.(2001) observe that due to increasing capital mobility, the frequency of global crisis after 1973has doubled comparing to that of during the 1920s and 1930s. Indeed, intensified cross-marketlinkages have led to increasing probability of financial contagion. Whereas the benefits ofdiversification are reduced in the presence of contagion, the phenomenon of flight-to-qualityencourages investors to diversify across asset classes. This paper adopts the very restrictivedefinition of contagion from the World Bank where contagion is defined as a significant increasein correlations during crisis periods as compared to ‘tranquil’ periods. Following Baur & Lucey(2009), we define flight-to-quality from stock to bond markets as the scenario where there is a
22 Yu-Tung Peng, Hue Hwa Au Yong and Sirimon Treepongkaruna
negative change in correlation between stock and bond returns and the correlation ended up inthe negative level.
Although studies on contagion effects are abundant, the existing literature has yet to reacha consensus on the presence of contagion during crisis periods. Moreover, most studies oncontagion focus on the stock markets while studies on contagion effect within the bond marketsare relatively limited. In addition, while Asia-Pacific economies have experienced tremendousgrowth throughout the past two decades, its integration with the developed markets mean thatthey are not immune to financial crisis. Accordingly, this paper employs a sample of APECcountries, consisting of both developed and developing countries, over a sample covering eightcrisis periods to comprehensively examine the following research questions: (1) Is there asignificant change in correlation of stock returns among APEC countries during crises? (2) Isthere a significant change in correlation of bond returns among APEC countries during crises?(3) Is there a significant change in correlation of APEC stock returns and US government bondreturns during crises? (4) Is investor sentiment associated with contagion effect, or flight-to-quality phenomenon, among APEC countries during crises?
This study contributes to the literature in three important ways. First, this study investigatescontagion within bond markets in the Asia-Pacific region, which provides insights on howbond markets behave over eight crisis periods between 1995 and 2010. Second, this paperextends the literature on flight-to-quality to the Asia-Pacific markets. Third, this paper makes anovel contribution by investigating possible determinants of flight-to-quality. The findings willhave important implications for policy makers, practitioners and investors. Identification ofcontagion effect is critical for crisis management so that governments can design appropriatepolicy responses during market turmoil. Moreover, identifying factors that contribute to contagionand flight-to-quality are crucial so that these factors can be established as potential crisisindicators.
Besides, the findings of this study have important implications to international diversification.Diversification has long been an objective of international investment to reduce country specificrisk. Investors seeking to diversify might find decreasing benefits of diversification due toincreasing integration among financial markets. Thus, a better understanding of correlationsamong asset markets is critical for investors to build a diversified portfolio of investments inthe emerging and developed markets.
We find the presence of contagion effects in stock market returns among APEC countriesand contagion effect in the bond market returns only between the U.S. and Canada. There isalso evidence of flight-to-quality phenomenon from stock markets to the U.S. government bondmarket during crisis periods. The levels of contagion and flight-to-quality are closely associatedwith the severity of the crisis. After controlling for fundamental economic factors, the ConsumerSentiment Index is found to be an important determinant in explaining both contagion andflight-to-quality phenomena.
The remainder of the paper is organised as follows. Section 2 reviews the relevant literature,followed by descriptions of data and method in Section 3. In Section 4, the findings regardingcontagion, flight-to-quality and their determinants are presented. We summarise and concludethe findings in Section 5.
Contagion and Flight-to-Quality: Evidences from the Asia-Pacific Economic... 23
2. LITERATURE REVIEW
2.1. Contagion in Stock Markets
There is extensive empirical literature that examines the existence of contagion in the stockmarkets. The methods employed in the literature can be summarised into six main categories:cross-market correlation coefficients, GARCH model, dynamic conditional correlation (DCC)model, cointegration test, probit model and Markov-switching (MS) model.
The first method for detecting contagion involves comparing cross-market correlationcoefficients during tranquil and crisis periods. One of the early papers that apply this method isKing and Wadhwani (1990), who found an increase in correlation between stock markets in theU.S., U.K. and Japan during the 1987 U.S. market crash. However, Forbes and Rigobon (2002)criticise this method as being dubious without accounting for interdependence. After takinginterdependence into account, they conclude that contagion is not present.
The second stream of contagion literature adopts the GARCH frameworks to examine cross-market linkages. Bollerslev et al. (1988) extend the standard univariate GARCH to a multivariateGARCH model. They also generalise the GARCH model to allow for the covariance term toinfluence the return process. Dungey et al. (2010) use the GARCH framework to examine the1997 Asian crisis, concluding that the transmission of crisis from Hong Kong to Korea andThailand is through contagion effect.
The third method that is widely adopted in recent times is the Dynamic ConditionalCorrelation (DCC) model. According to Engle (2002), multivariate GARCH model usuallysuffers from dimensionality problem where the number of parameters becomes too large toestimate with prevailing computing technology. Therefore, another form of GARCH model –DCC model is proposed. Since the number of parameters is independent of the number of seriesincluded, large correlation matrices can then be estimated. Since then, DCC has become apopular method to test for contagion. Chiang et al. (2007) apply DCC test to U.S. and nineAsian markets affected by the 1997 Asian financial crisis. They identify two phases of thecrisis. The first phase features increasing correlations, and the second phase displays significantincrease in correlations across Asian countries. Lahrech and Sylwester (2011) similarlyestablished the increase in integration between Latin American equity markets and the USequity market by employing the DCC method.
The fourth approach for analysing market linkages is the estimation of cointegrating vectorbetween markets. Chou et al. (1994) examine six developed countries, namely U.S., Canada,U.K., Germany, France and Japan, and conclude that there are long-run equilibrium relationshipsamong stock market returns. Estimating dynamic cointegration using a three year rolling window,Yu et al. (2010) find significant indication of cointegration in Asian equity markets during theAsian Crisis period which may be attributed to market contagion and volatility spillover, althoughthe long run evidence of integration is weak.
The fifth method employed to examine contagion is the probit model. In their seminalpaper, Eichengreen et al. (1996) adopt the probit model to estimate the probability of a crisisoccurring in the U.S. and other G-7 countries. They find that the probability of an attack on thedomestic currency is expected to rise when a currency crisis exists elsewhere.
24 Yu-Tung Peng, Hue Hwa Au Yong and Sirimon Treepongkaruna
The final method used to investigate contagion during turbulent period is the Markov-switching (MS) model, proposed by Hamilton (1989). The MS model allows for the constructionof models of stock index returns that switch between multiple regimes. Ang and Bekaert (1999)apply several MS models for stock markets in U.S., U.K. and Germany. They find evidence oftwo regimes, where high-volatility corresponds to high-correlation and low-volatility correspondsto low-correlation.
2.2. Contagion in Bond Markets
Similar to stock markets, empirical evidences have shown an increase in integration level amonginternational bond markets throughout the decades (Solnik et al., 1996). Hartmann et al. (2004)employ an external dependence measure for bond markets in the G-5 and show that, given acrash in bond market; the conditional probability of having another bond market crash is higher,thus indicating the existence of contagion. To the contrary, Hunter and Simon (2004) examinebond markets of U.S., U.K., Japan and Germany during the period of January 1992 to September2002, concluding that the return correlations did not increase during periods of heightenedvolatility. Dungey et al. (2006) analyse the effect of the Russian and LTCM crises on severalemerging markets, and have identified significant contagion effects from Russia to developingmarkets during the Russian crisis and to the mature markets during the LTCM near collapse.
2.3. Contagion and Flight-to-Quality from Stock to US Bond Markets
Empirical studies of contagion and flight-to-quality between stock and bond markets with anemphasis on turbulent periods are scarce relative to studies that focus on stock markets. Onlyseveral papers have documented that stock-bond correlation is on average positive over thelong-term, with sub-periods of negative correlations (Fleming et al., 2003; Gulko, 2002;Hartmann et al., 2004). Illmanen (2003) argues that one of the reasons for negative stock-bondcorrelations is high-volatility stock market regimes. Kaminsky and Reinhard (2002) additionallyinvestigate the integration of bonds, equities, foreign exchange and domestic money marketsbetween 1997-1999 and find that bond markets display the highest degree of co-movementswhile the domestic money markets display the lowest degree of co-movements among samplecountries with the exception of G-7 countries.
Baur and Lucey (2009) employ the DCC method to examine stock and bond market returnsfrom the U.S., U.K., Germany and Japan. They find that flight-to-quality occurs frequentlyduring high volatility periods. They also observe that stock markets tend to fall simultaneouslyand bond markets increase simultaneously if flight-to-quality is a common feature in a crisisperiod. However, Asian bond markets, except for Japan, are frequently ignored in the priorliterature. This paper extends the DCC analysis of stock-bond correlation to the APEC region toprovide new insights on the flight-to-quality phenomenon during periods of high market volatility.
2.4. Determinants of Contagion and Flight-to-Quality
Contagion is defined as transmissions of crisis beyond countries’ fundamental economic links(Forbes & Rigobon, 2002; Moser, 2003). Therefore, it is essential to account for otherfundamental economic factors when investigating the role of investor sentiment factors, incontributing to the contagion effect (Khan & Park, 2009).
Contagion and Flight-to-Quality: Evidences from the Asia-Pacific Economic... 25
Investigating daily stock indices from 13 countries from the period of 1988 to 1998, Johnsonand Soenen (2002) conclude that differential in inflation rates, interest rates, and gross domesticproducts (GDP) growth rates have negative impacts on co-movements between stock markets.Using stock market returns of the G-7 countries, Morana (2008) finds that economic integrationexplains co-movements of international stock markets from 1980 to 2005. Key variablesemployed as proxies for economic fundamentals in the study are GDP, inflation and oil price.Apart from the developed countries, Salvatore (1998) investigates emerging economies, andidentifies a set of macroeconomic and financial indicators that determine financial crisis. Amongthe macroeconomic indicators, current account deficit is found to be the most important indicatorof a potential crisis in developing country. Abumustafa (2006) focuses on the Middle Easterncountries, and finds that all individual indicators, including the real exchange rate, providewarning signals two years prior to the crises. Similarities in macroeconomic factors also influencethe probabilities of contagion. Bae et al. (2003) find that exchange rate changes, interest ratelevels and regional conditional volatility explain the joint occurrences of large absolute valuereturns in their sample countries. Similarly, Dasgupta et al. (2011) compares the relativeimportance of trade competition, financial links and institutional similarity to the ‘ground zero”country in explaining contagion and find that institutional similarities in macroeconomic factorsplay an important role in determining the direction of contagion in emerging markets.
In addition to macroeconomic factors, herding and investor sentiment factors have alsobeen found to explain co-movements in asset returns. According to Chiang and Zheng (2010),herding behaviour refers to less sophisticated investors attempting to follow the activities ofsuccessful investors, resulting in a group of investors trading in the same direction over a periodof time. Calvo and Reinhart (1996) find that herding behaviours explained the co-movementsin both bond and stock returns among emerging countries in Latin America during the Mexicancrisis. The Volatility Index (VIX) (Dennis & Mayhew, 2002; Whaley, 2000), ConsumerSentiment Index, TED spread and intra-day trading patterns (Lucey and Sevic, 2010) arecommonly employed in prior literature to measure market sentiment. Using the University ofMichigan Consumer Sentiment Index (CSI), both Fisher and Statman (2003) and Charoenrook(2005) confirm that there is a positive and statistically significant relationship between CSI andcontemporaneous U.S. stock returns, and a negative relationship between CSI and future U.S.stock returns. Lashgari (2000) investigates S&P 500 index from January 1988 to December1998, indicating that there is a negative correlation between TED spread and index return.
3. DATA AND METHOD
3.1. Data
Daily stock and bond indices from APEC countries are collected from Bloomberg and Datastreamto estimate daily stock and bond returns. Stock markets indices from 14 countries from theAPEC region, including Australia (AU), Canada (CA), Chile (CL), Hong Kong (HK), Indonesia(ID), Japan (JP), Korea (KR), Malaysia (MY), Mexico (MX), Peru (PE), Philippine (PH), Taiwan(TW), Thailand (TH) and the U.S. (US), and long term government bond indices from 6 countries,namely Australia (AU), Canada (CA), Japan (JP), New Zealand (NZ), Singapore (SG) and theU.S. (US), are included for analysis. Our sample countries form an interesting sample as itconsists of both developed and developing economies which are tied with economic links. The
26 Yu-Tung Peng, Hue Hwa Au Yong and Sirimon Treepongkaruna
sample periods are from 1/1/1995 to 30/07/2010 covering eight crisis periods with 4067 dailyobservations of stock and bond market indices.
The proxies employed in this study for investor sentiment are VIX, TED spread and CSI.VIX is retrieved from Datastream, while the TED spread is calculated using monthly U.S. 3-month LIBOR minus 3-month Treasury bill rate. Finally, the monthly CSI data is downloadedfrom the FRED® (Federal Reserve Economic Data). The fundamental economic factors includedas control variables are the world oil price, real exchange rate, differentials in interest rate,inflation rate, GDP growth rate, and current account balance as per prior literature (see forexample, Bae et al., 2003). These are collected from the IMF Statistics and Datastream.
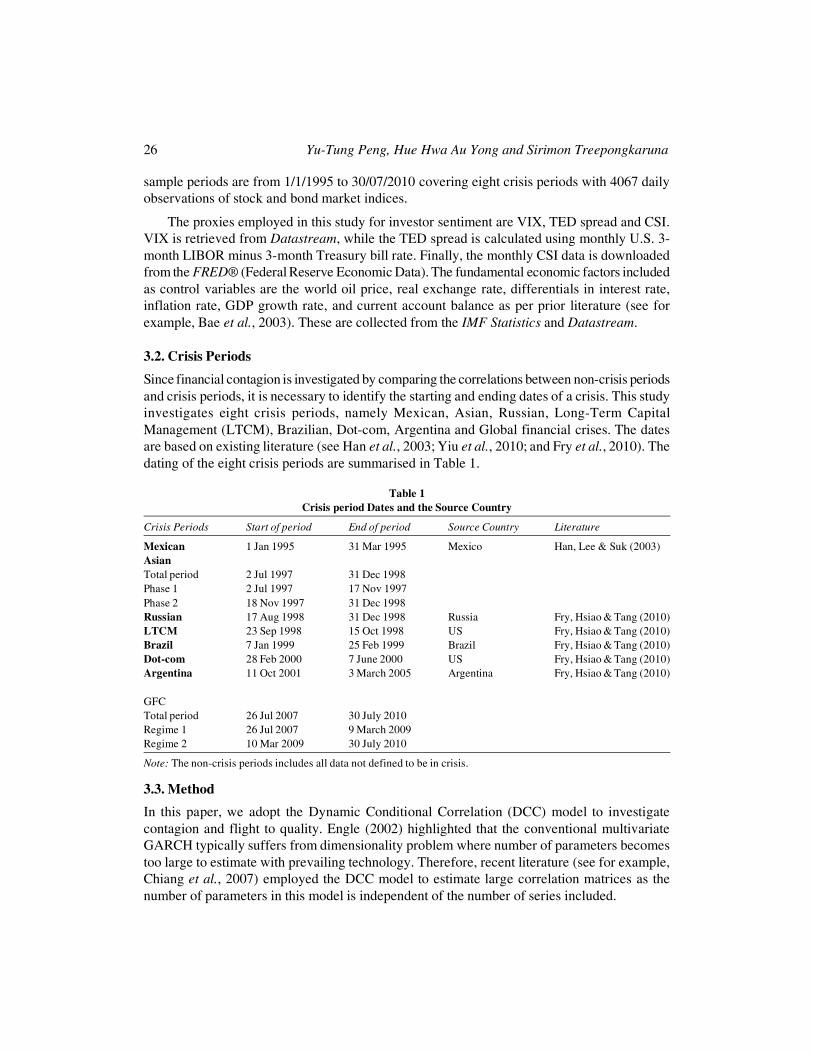
3.2. Crisis Periods
Since financial contagion is investigated by comparing the correlations between non-crisis periodsand crisis periods, it is necessary to identify the starting and ending dates of a crisis. This studyinvestigates eight crisis periods, namely Mexican, Asian, Russian, Long-Term CapitalManagement (LTCM), Brazilian, Dot-com, Argentina and Global financial crises. The datesare based on existing literature (see Han et al., 2003; Yiu et al., 2010; and Fry et al., 2010). Thedating of the eight crisis periods are summarised in Table 1.
Table 1Crisis period Dates and the Source Country
Crisis Periods Start of period End of period Source Country Literature
Mexican 1 Jan 1995 31 Mar 1995 Mexico Han, Lee & Suk (2003)AsianTotal period 2 Jul 1997 31 Dec 1998Phase 1 2 Jul 1997 17 Nov 1997Phase 2 18 Nov 1997 31 Dec 1998Russian 17 Aug 1998 31 Dec 1998 Russia Fry, Hsiao & Tang (2010)LTCM 23 Sep 1998 15 Oct 1998 US Fry, Hsiao & Tang (2010)Brazil 7 Jan 1999 25 Feb 1999 Brazil Fry, Hsiao & Tang (2010)Dot-com 28 Feb 2000 7 June 2000 US Fry, Hsiao & Tang (2010)Argentina 11 Oct 2001 3 March 2005 Argentina Fry, Hsiao & Tang (2010)
GFCTotal period 26 Jul 2007 30 July 2010Regime 1 26 Jul 2007 9 March 2009Regime 2 10 Mar 2009 30 July 2010
Note: The non-crisis periods includes all data not defined to be in crisis.
3.3. Method
In this paper, we adopt the Dynamic Conditional Correlation (DCC) model to investigatecontagion and flight to quality. Engle (2002) highlighted that the conventional multivariateGARCH typically suffers from dimensionality problem where number of parameters becomestoo large to estimate with prevailing technology. Therefore, recent literature (see for example,Chiang et al., 2007) employed the DCC model to estimate large correlation matrices as thenumber of parameters in this model is independent of the number of series included.
Contagion and Flight-to-Quality: Evidences from the Asia-Pacific Economic... 27
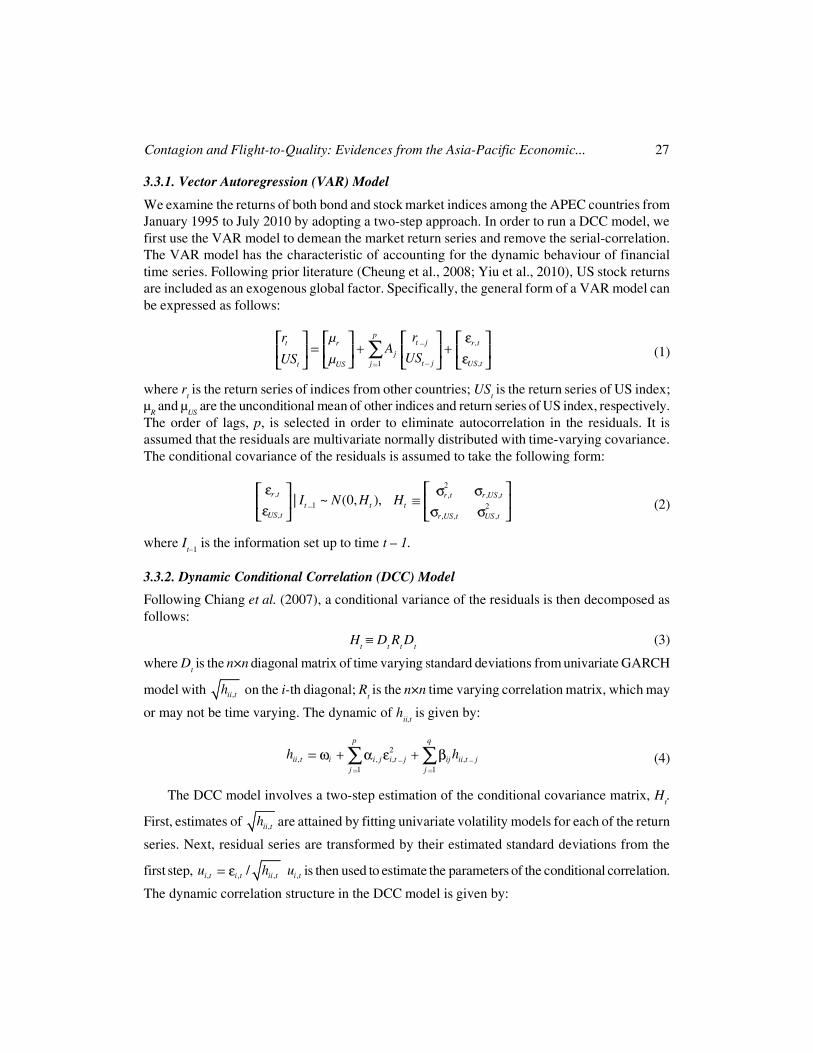
3.3.1. Vector Autoregression (VAR) Model
We examine the returns of both bond and stock market indices among the APEC countries fromJanuary 1995 to July 2010 by adopting a two-step approach. In order to run a DCC model, wefirst use the VAR model to demean the market return series and remove the serial-correlation.The VAR model has the characteristic of accounting for the dynamic behaviour of financialtime series. Following prior literature (Cheung et al., 2008; Yiu et al., 2010), US stock returnsare included as an exogenous global factor. Specifically, the general form of a VAR model canbe expressed as follows:
,
,1
pt j r tt r
jt j US tjUSt
rr µA
USµUS (1)
where rt is the return series of indices from other countries; US
t is the return series of US index;
µR and µ
US are the unconditional mean of other indices and return series of US index, respectively.
The order of lags, p, is selected in order to eliminate autocorrelation in the residuals. It isassumed that the residuals are multivariate normally distributed with time-varying covariance.The conditional covariance of the residuals is assumed to take the following form:
2, , , ,
1 2, , , ,
| ~ (0, ),r t r t r US tt t t
US t r US t US t
I N H H (2)
where It–1
is the information set up to time t – 1.
3.3.2. Dynamic Conditional Correlation (DCC) Model
Following Chiang et al. (2007), a conditional variance of the residuals is then decomposed asfollows:
Ht � D
t R
t D
t(3)
where Dt is the n×n diagonal matrix of time varying standard deviations from univariate GARCH
model with ,ii th on the i-th diagonal; Rt is the n×n time varying correlation matrix, which may
or may not be time varying. The dynamic of hii,t
is given by:
2, , , ,
1 1
p q
ii t i i j i t j ij ii t jj j
h h (4)
The DCC model involves a two-step estimation of the conditional covariance matrix, Ht.
First, estimates of ,ii th are attained by fitting univariate volatility models for each of the return
series. Next, residual series are transformed by their estimated standard deviations from the
first step, , , , ,/i t i t ii t i tu h u is then used to estimate the parameters of the conditional correlation.
The dynamic correlation structure in the DCC model is given by:
28 Yu-Tung Peng, Hue Hwa Au Yong and Sirimon Treepongkaruna
1 1 1(1 )t t t tQ Q u u Q (5)
* 1 * 1t t t tR Q Q Q (6)
where Qt = q
ij,t is the n×n time-varying covariance matrix of ; [ ]t t tu Q E u u is the n×n
unconditional variance matrix of ut; � and � are non-negative scalar parameters which satisfy
the restriction that (��+��) < 1. The typical element of Rt will be of the form:
,,
, ,
, , 1,2,..., ,ij tij t
ii t jj t
qi j n and i j
q q (7)
3.3.3. Determinants of Contagion and Flight-to-Quality
3.3.3.1 Defining Contagion and Flight-to-Quality
From Eq.(7), let , ,ˆ
r source t be the estimated DCC coefficients (off-diagonal element of Rt). , ,
ˆr source t
is then modelled as an AR model with intercept break as follows:
, , 0 , , ,1 1
ˆ ˆp q
r source t i r source t i j j t ti j
DM (8)
where DMR,j,t are dummy variables taking values of 1 during crisis periods and 0 during tranquil
periods. The country pairs are formed based on the source country of crises, namely, Mexico,Thailand, Hong Kong and the U.S.. The dummy variables are used to test the hypothesis thatthe crises have significant impact on the DCC coefficients. If the dummies are statisticallysignificant, this would indicate the existence of contagion within the same asset class (definedas a significant increase in correlations during crisis periods as compared to ‘tranquil’ periods)or flight-to-quality (defined as a negative change in correlation between stock and bond returnsand the correlation ended up in the negative level as per Baur and Lucey (2009)). Accordingly,DCON (DFTQ) is coded as 1 if contagion (flight-to-quality) exists within a crisis period and 0otherwise.
3.3.3.2. Logistic Regressions
The logistic regression is employed to investigate potential determinants of contagion (DCON)and flight-to-quality (DFTQ) phenomena. For the independent variables, we include VIX, CSIand TED as investor sentiment factors; OIL, RER, DIR, DINF, DGDP and DCAB as fundamentaleconomic factors. We then estimate the following multiple logistic regression models:
�0 1 2 3 4
5 6 7 8 0
DCON or DFTQ VIX CSI TED OIL
RER DIR DINF DGDP DCAB (9)
Where VIX = Volatility index
Contagion and Flight-to-Quality: Evidences from the Asia-Pacific Economic... 29
CSI = Consumer sentiment index
TED = TED spread
OIL = World oil price
RER = Real exchange rate
DIR = Differential in interest rates
DINF = Differential in inflation rates
DGDP = Differential in GDP growth rates
DCAB = Differential in current account balance.
The variables definition and expected sign are detailed in Table 2.
Table 2Variable definitions
Variable Expected DefinitionSign
Dependent VariableContagion DCON Value = 1 if contagion is significant during the
crisis, 0 otherwise.Flight-to-quality DFTQ Value = 1 if flight-to-quality phenomenon is
significant during the crisis, 0 otherwise.Independent Variable – Sentimental FactorsVolatility Index VIX (+) Change in daily Chicago Board Options Exchange
Volatility Index of S&P 500Consumer Sentiment Index CSI (–) Change in monthly The University of Michigan
Consumer Sentiment IndexTED spread TED (+) Change in monthly TED spread, which is
calculated using monthly U.S. 3-month LIBORminus 3-month Treasury bill rate
Independent Variable – Fundamental Economic FactorsWorld Oil Price OIL (?) Change in daily crude oil price (US$ per barrel).Real Exchange Rate RER (?) Change in daily real exchange rate. The currencies
in the source countries are used as the base currency.Differential in Interest Rates DIR (–) Absolute difference of change in daily interest rate,
which is calculated by interest rate in source countryminus interest rate in pair country.
Differential in Inflation Rates DINF (–) Absolute difference of change in annual inflationrate, which is calculated by inflation rate in sourcecountry minus inflation rate in pair country.
Differential in GDP DGDP (–) Absolute difference of change in annual GDPGrowth Rates growth rate, which is calculated by GDP growth rate
in source country minus GDP growth rate in paircountry.
Differential in Current DCAB (–) Absolute difference of change in annual CABAccount Balance (as a percentage of GDP), which is calculated by
CAB in source country minus CAB in pair country.
30 Yu-Tung Peng, Hue Hwa Au Yong and Sirimon Treepongkaruna
In terms of the investor sentiment factors, VIX is the ‘investor fear gauge’ (Whaley, 2000).Higher levels of VIX correspond to higher degrees of market turbulences. It is expected thatVIX has a positive association with the probability of contagion and flight-to-quality. CSI, ameasure consumer expectation regarding the overall economy, is expected to be positivelycorrelated with contemporaneous stock returns. Hence, we expect a negative relationship betweenCSI and the probability of contagion and flight-to-quality. Finally, TED spread is employed asan indicator of perceived credit risk in the general economy. According to Lashgari (2000),there is a negative correlation between TED spread and return of the index. Thus, a positiveassociation is expected between TED spread and the probability of contagion and flight-to-quality.
As for the fundamental economic factors, Ewing and Thompson (2007) document thatcrude oil prices are procyclical and oil index are positively associated with market index.Therefore, during economic downturns, it is expected that crude oil prices are lower. An increasein oil price, indicating boom period, decreases the probability of contagion and flight-to-quality.However, prior literature also documents a negative relationship between shocks to oil pricesand market indices (Huang & Masulis, 1996). Therefore, we are unable to form an expectationof the sign of association between oil price (OIL) and contagion or flight-to-quality.
Literature investigating the association between real exchange rate and stock market returnshas also found mixed effects. Some studies conclude that real exchange rates exert no impacton stock markets (Griffin & Stulz, 2001), while others find that exchange rate fluctuationsstrongly affect market indices (Doukas et al., 1999; Patro et al., 2002). Therefore, we are unableto assign an expected sign to real exchange rate (RER). Haile and Pozo (2008) find that crashesare more likely to propagate to other countries that have similar macroeconomic fundamentals(i.e. lower differentials in fundamental economic factors). Thus, differentials in fundamentaleconomic factors (DIR, DINF, DGDP and DCAB) are expected to have a negative associationwith the probability of contagion and flight-to-quality.
4. RESULTS AND DISCUSSIONS
4.1. Dynamic Conditional Correlations of Stock and Bond Markets
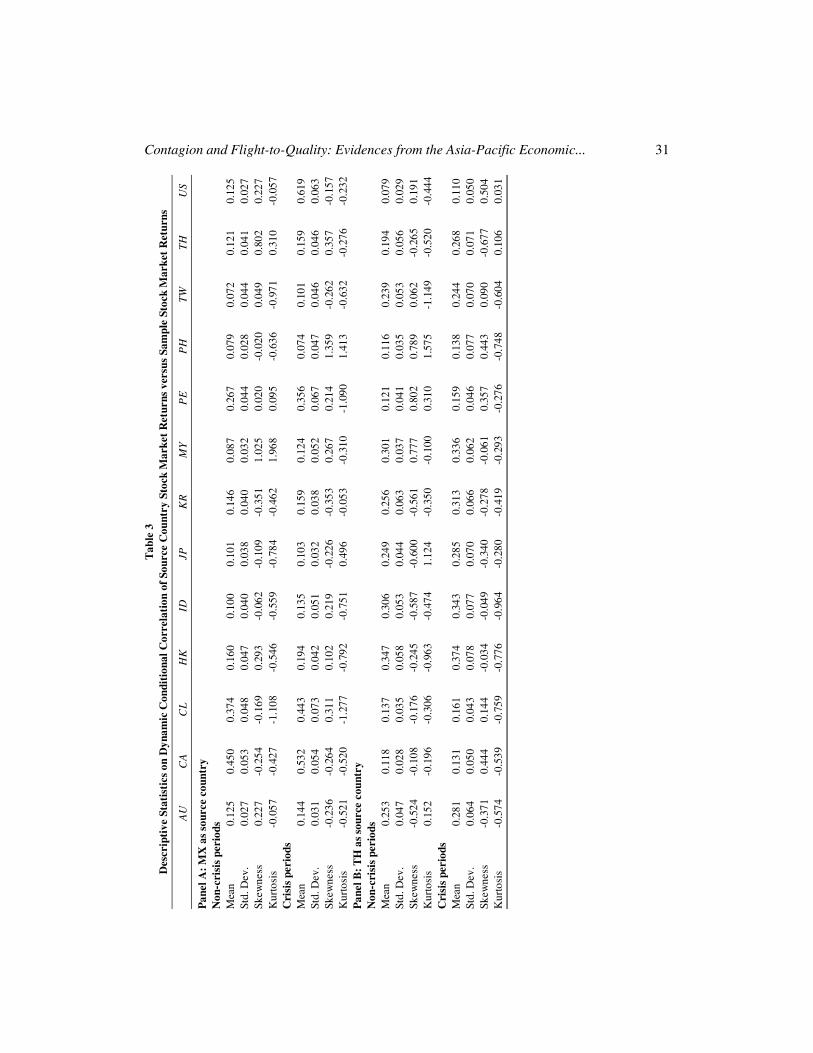
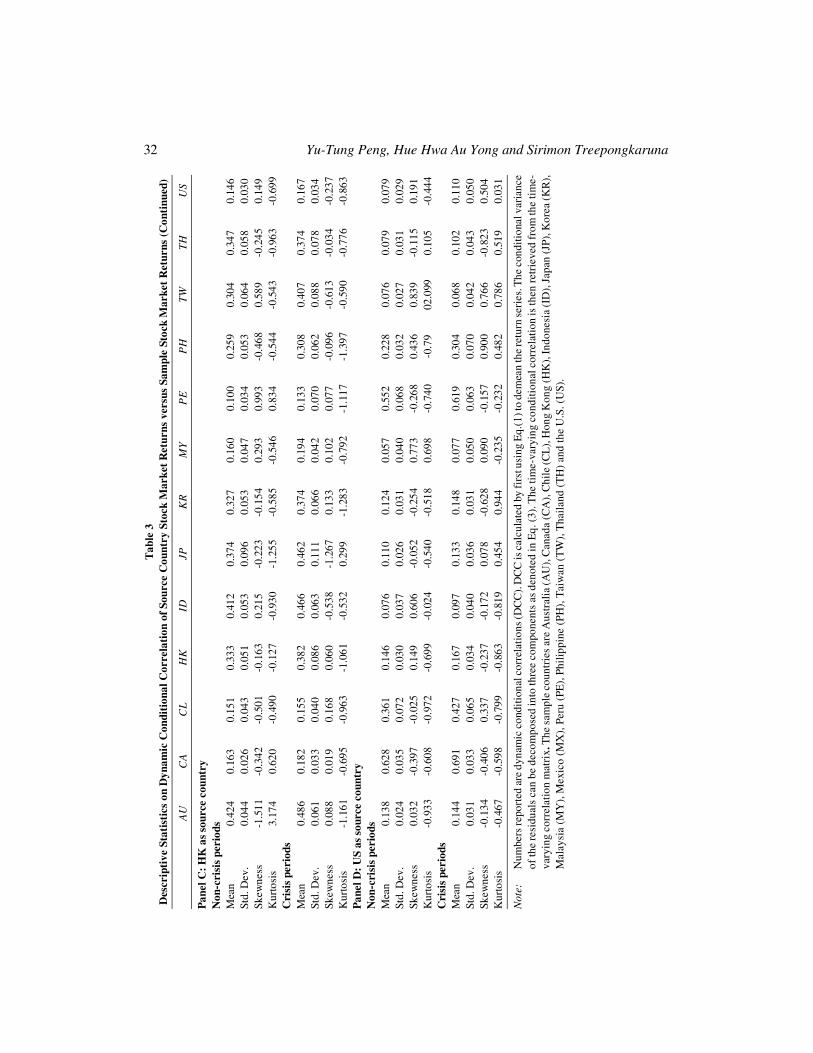
Table 3 summarises the descriptive statistics of the dynamic conditional correlations of stockmarket returns between countries pairs using MX, TH, HK and US as the source country,respectively. These countries have been selected because they are recognised as the sourcecountries for the Mexican Crisis (Mexico), Asian Crisis (Thailand and Hong Kong) and theGlobal Financial Crisis (US). Correlations between the stock returns are positive on averageduring the crisis and non-crisis periods, with higher correlation during crisis periods (except forthe correlations between MX and PH (Panel A) and US and PH (Panel D)). It is observed thatcountries within the same region display higher mean correlations than those of different regions.For example, with MX as the source country in Panel A, CL and PE display greater meancorrelation relative to other countries. With TH and HK as the source country in Panels B andC, respectively, AU, ID, JP, KR, MY, PH and TW exhibit higher mean correlation relative toother countries. Furthermore, the standard deviations of correlations shown are also generallyhigher during the market turmoils.
Contagion and Flight-to-Quality: Evidences from the Asia-Pacific Economic... 31T
able
3D
escr
ipti
ve S
tati
stic
s on
Dyn
amic
Con
diti
onal
Cor
rela
tion
of
Sour
ce C
ount
ry S
tock
Mar
ket
Ret
urns
ver
sus
Sam
ple
Stoc
k M
arke
t R
etur
ns
AU
CA
CL
HK
IDJP
KR
MY
PE
PH
TW
TH
US
Pan
el A
: M
X a
s so
urce
cou
ntry
Non
-cri
sis
peri
ods
Mea
n0.
125
0.45
00.
374
0.16
00.
100
0.10
10.
146
0.08
70.
267
0.07
90.
072
0.12
10.
125
Std.
Dev
.0.
027
0.05
30.
048
0.04
70.
040
0.03
80.
040
0.03
20.
044
0.02
80.
044
0.04
10.
027
Skew
ness
0.22
7-0
.254
-0.1
690.
293
-0.0
62-0
.109
-0.3
511.
025
0.02
0-0
.020
0.04
90.
802
0.22
7K
urto
sis
-0.0
57-0
.427
-1.1
08-0
.546
-0.5
59-0
.784
-0.4
621.
968
0.09
5-0
.636
-0.9
710.
310
-0.0
57C
risi
s pe
riod
sM
ean
0.14
40.
532
0.44
30.
194
0.13
50.
103
0.15
90.
124
0.35
60.
074
0.10
10.
159
0.61
9St
d. D
ev.
0.03
10.
054
0.07
30.
042
0.05
10.
032
0.03
80.
052
0.06
70.
047
0.04
60.
046
0.06
3Sk
ewne
ss-0
.236
-0.2
640.
311
0.10
20.
219
-0.2
26-0
.353
0.26
70.
214
1.35
9-0
.262
0.35
7-0
.157
Kur
tosi
s-0
.521
-0.5
20-1
.277
-0.7
92-0
.751
0.49
6-0
.053
-0.3
10-1
.090
1.41
3-0
.632
-0.2
76-0
.232
Pan
el B
: T
H a
s so
urce
cou
ntry
Non
-cri
sis
peri
ods
Mea
n0.
253
0.11
80.
137
0.34
70.
306
0.24
90.
256
0.30
10.
121
0.11
60.
239
0.19
40.
079
Std.
Dev
.0.
047
0.02
80.
035
0.05
80.
053
0.04
40.
063
0.03
70.
041
0.03
50.
053
0.05
60.
029
Skew
ness
-0.5
24-0
.108
-0.1
76-0
.245
-0.5
87-0
.600
-0.5
610.
777
0.80
20.
789
0.06
2-0
.265
0.19
1K
urto
sis
0.15
2-0
.196
-0.3
06-0
.963
-0.4
741.
124
-0.3
50-0
.100
0.31
01.
575
-1.1
49-0
.520
-0.4
44C
risi
s pe
riod
sM
ean
0.28
10.
131
0.16
10.
374
0.34
30.
285
0.31
30.
336
0.15
90.
138
0.24
40.
268
0.11
0St
d. D
ev.
0.06
40.
050
0.04
30.
078
0.07
70.
070
0.06
60.
062
0.04
60.
077
0.07
00.
071
0.05
0Sk
ewne
ss-0
.371
0.44
40.
144
-0.0
34-0
.049
-0.3
40-0
.278
-0.0
610.
357
0.44
30.
090
-0.6
770.
504
Kur
tosi
s-0
.574
-0.5
39-0
.759
-0.7
76-0
.964
-0.2
80-0
.419
-0.2
93-0
.276
-0.7
48-0
.604
0.10
60.
031
32 Yu-Tung Peng, Hue Hwa Au Yong and Sirimon TreepongkarunaT
able
3D
escr
ipti
ve S
tati
stic
s on
Dyn
amic
Con
diti
onal
Cor
rela
tion
of
Sour
ce C
ount
ry S
tock
Mar
ket
Ret
urns
ver
sus
Sam
ple
Stoc
k M
arke
t R
etur
ns (
Con
tinu
ed)
AU
CA
CL
HK
IDJP
KR
MY
PE
PH
TW
TH
US
Pan
el C
: H
K a
s so
urce
cou
ntry
Non
-cri
sis
peri
ods
Mea
n0.
424
0.16
30.
151
0.33
30.
412
0.37
40.
327
0.16
00.
100
0.25
90.
304
0.34
70.
146
Std.
Dev
.0.
044
0.02
60.
043
0.05
10.
053
0.09
60.
053
0.04
70.
034
0.05
30.
064
0.05
80.
030
Skew
ness
-1.5
11-0
.342
-0.5
01-0
.163
0.21
5-0
.223
-0.1
540.
293
0.99
3-0
.468
0.58
9-0
.245
0.14
9K
urto
sis
3.17
40.
620
-0.4
90-0
.127
-0.9
30-1
.255
-0.5
85-0
.546
0.83
4-0
.544
-0.5
43-0
.963
-0.6
99C
risi
s pe
riod
sM
ean
0.48
60.
182
0.15
50.
382
0.46
60.
462
0.37
40.
194
0.13
30.
308
0.40
70.
374
0.16
7St
d. D
ev.
0.06
10.
033
0.04
00.
086
0.06
30.
111
0.06
60.
042
0.07
00.
062
0.08
80.
078
0.03
4Sk
ewne
ss0.
088
0.01
90.
168
0.06
0-0
.538
-1.2
670.
133
0.10
20.
077
-0.0
96-0
.613
-0.0
34-0
.237
Kur
tosi
s-1
.161
-0.6
95-0
.963
-1.0
61-0
.532
0.29
9-1
.283
-0.7
92-1
.117
-1.3
97-0
.590
-0.7
76-0
.863
Pan
el D
: U
S as
sou
rce
coun
try
Non
-cri
sis
peri
ods
Mea
n0.
138
0.62
80.
361
0.14
60.
076
0.11
00.
124
0.05
70.
552
0.22
80.
076
0.07
90.
079
Std.
Dev
.0.
024
0.03
50.
072
0.03
00.
037
0.02
60.
031
0.04
00.
068
0.03
20.
027
0.03
10.
029
Skew
ness
0.03
2-0
.397
-0.0
250.
149
0.60
6-0
.052
-0.2
540.
773
-0.2
680.
436
0.83
9-0
.115
0.19
1K
urto
sis
-0.9
33-0
.608
-0.9
72-0
.699
-0.0
24-0
.540
-0.5
180.
698
-0.7
40-0
.79
02.0
990.
105
-0.4
44C
risi
s pe
riod
sM
ean
0.14
40.
691
0.42
70.
167
0.09
70.
133
0.14
80.
077
0.61
90.
304
0.06
80.
102
0.11
0St
d. D
ev.
0.03
10.
033
0.06
50.
034
0.04
00.
036
0.03
10.
050
0.06
30.
070
0.04
20.
043
0.05
0Sk
ewne
ss-0
.134
-0.4
060.
337
-0.2
37-0
.172
0.07
8-0
.628
0.09
0-0
.157
0.90
00.
766
-0.8
230.
504
Kur
tosi
s-0
.467
-0.5
98-0
.799
-0.8
63-0
.819
0.45
40.
944
-0.2
35-0
.232
0.48
20.
786
0.51
90.
031
Not
e:N
umbe
rs re
port
ed a
re d
ynam
ic c
ondi
tiona
l cor
rela
tion
s (D
CC
). D
CC
is c
alcu
late
d by
firs
t usi
ng E
q.(1
) to
dem
ean
the
retu
rn se
ries
. The
con
ditio
nal v
aria
nce
of th
e re
sidu
als
can
be d
ecom
pose
d in
to th
ree
com
pone
nts
as d
enot
ed in
Eq.
(3).
The
tim
e-va
ryin
g co
nditi
onal
cor
rela
tion
is th
en re
trie
ved
from
the
tim
e-va
ryin
g co
rrel
atio
n m
atri
x. T
he s
ampl
e co
untr
ies
are
Aus
tral
ia (A
U),
Can
ada
(CA
), C
hile
(CL
), H
ong
Kon
g (H
K),
Indo
nesi
a (I
D),
Jap
an (J
P), K
orea
(KR
),M
alay
sia
(MY
), M
exic
o (M
X),
Per
u (P
E),
Phi
lippi
ne (
PH),
Tai
wan
(T
W),
Tha
iland
(T
H)
and
the
U.S
. (U
S).
Contagion and Flight-to-Quality: Evidences from the Asia-Pacific Economic... 33
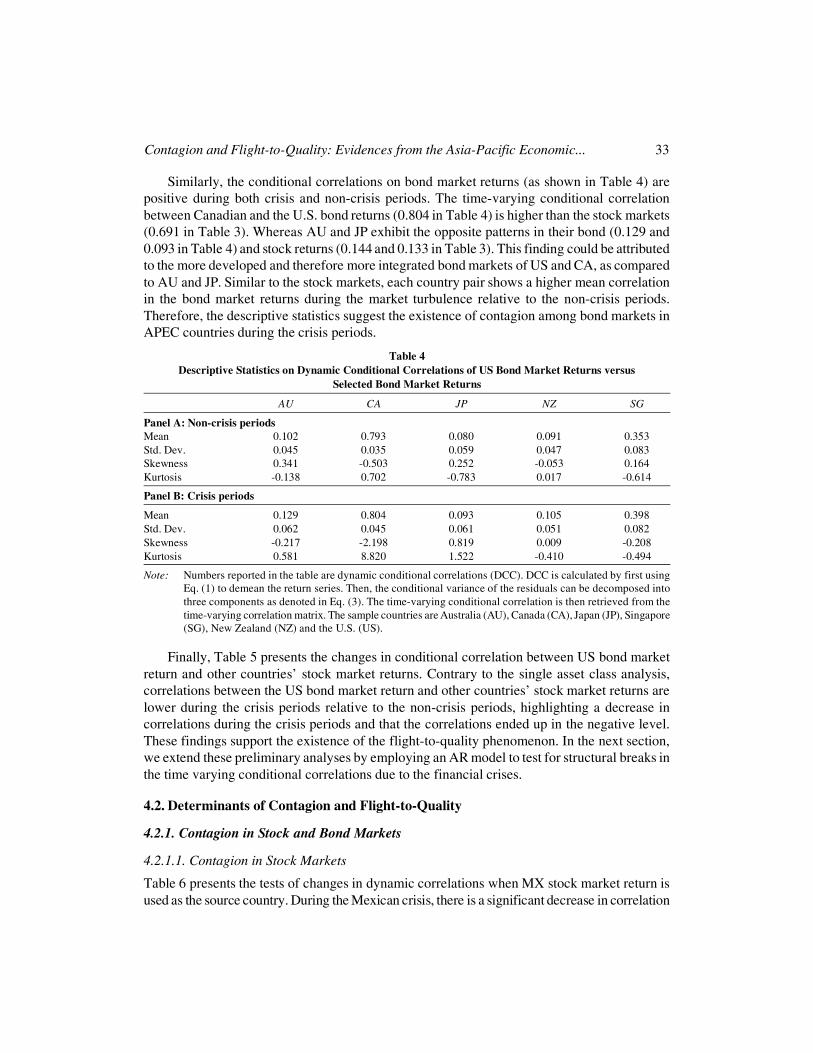
Similarly, the conditional correlations on bond market returns (as shown in Table 4) arepositive during both crisis and non-crisis periods. The time-varying conditional correlationbetween Canadian and the U.S. bond returns (0.804 in Table 4) is higher than the stock markets(0.691 in Table 3). Whereas AU and JP exhibit the opposite patterns in their bond (0.129 and0.093 in Table 4) and stock returns (0.144 and 0.133 in Table 3). This finding could be attributedto the more developed and therefore more integrated bond markets of US and CA, as comparedto AU and JP. Similar to the stock markets, each country pair shows a higher mean correlationin the bond market returns during the market turbulence relative to the non-crisis periods.Therefore, the descriptive statistics suggest the existence of contagion among bond markets inAPEC countries during the crisis periods.
Table 4Descriptive Statistics on Dynamic Conditional Correlations of US Bond Market Returns versus
Selected Bond Market Returns
AU CA JP NZ SG
Panel A: Non-crisis periodsMean 0.102 0.793 0.080 0.091 0.353Std. Dev. 0.045 0.035 0.059 0.047 0.083Skewness 0.341 -0.503 0.252 -0.053 0.164Kurtosis -0.138 0.702 -0.783 0.017 -0.614
Panel B: Crisis periods
Mean 0.129 0.804 0.093 0.105 0.398Std. Dev. 0.062 0.045 0.061 0.051 0.082Skewness -0.217 -2.198 0.819 0.009 -0.208Kurtosis 0.581 8.820 1.522 -0.410 -0.494
Note: Numbers reported in the table are dynamic conditional correlations (DCC). DCC is calculated by first usingEq. (1) to demean the return series. Then, the conditional variance of the residuals can be decomposed intothree components as denoted in Eq. (3). The time-varying conditional correlation is then retrieved from thetime-varying correlation matrix. The sample countries are Australia (AU), Canada (CA), Japan (JP), Singapore(SG), New Zealand (NZ) and the U.S. (US).
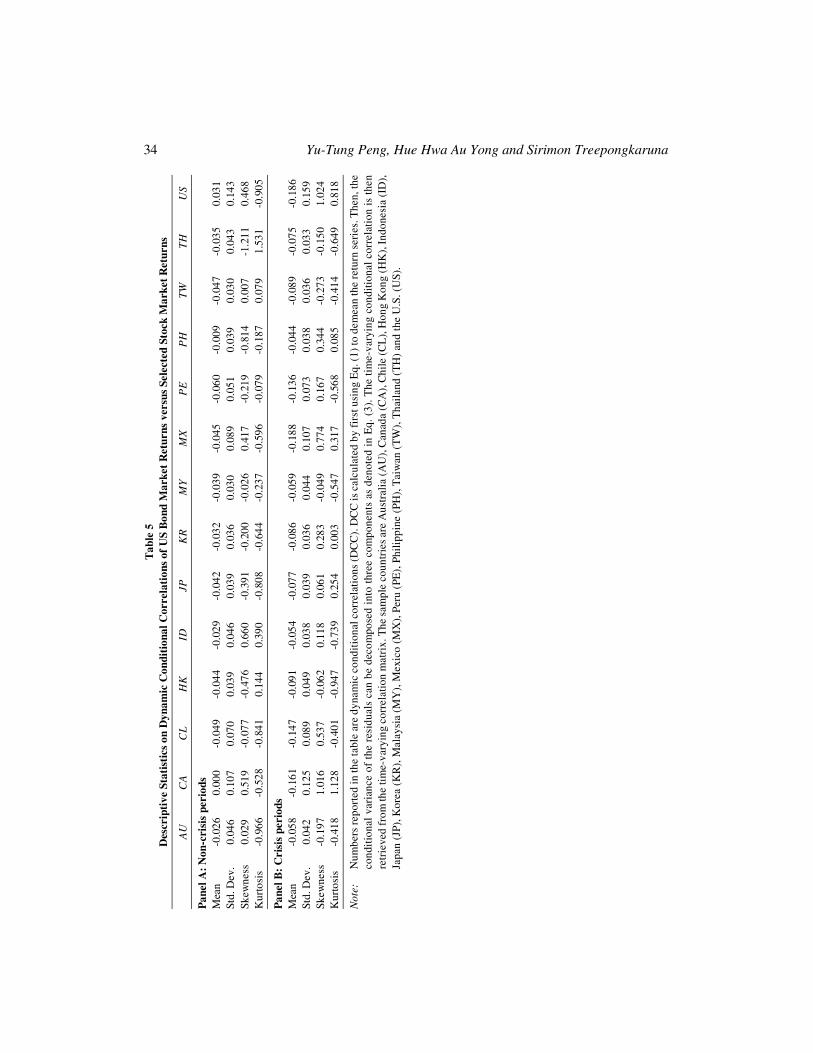
Finally, Table 5 presents the changes in conditional correlation between US bond marketreturn and other countries’ stock market returns. Contrary to the single asset class analysis,correlations between the US bond market return and other countries’ stock market returns arelower during the crisis periods relative to the non-crisis periods, highlighting a decrease incorrelations during the crisis periods and that the correlations ended up in the negative level.These findings support the existence of the flight-to-quality phenomenon. In the next section,we extend these preliminary analyses by employing an AR model to test for structural breaks inthe time varying conditional correlations due to the financial crises.
4.2. Determinants of Contagion and Flight-to-Quality
4.2.1. Contagion in Stock and Bond Markets
4.2.1.1. Contagion in Stock Markets
Table 6 presents the tests of changes in dynamic correlations when MX stock market return isused as the source country. During the Mexican crisis, there is a significant decrease in correlation
34 Yu-Tung Peng, Hue Hwa Au Yong and Sirimon TreepongkarunaT
able
5D
escr
ipti
ve S
tati
stic
s on
Dyn
amic
Con
diti
onal
Cor
rela
tion
s of
US
Bon
d M
arke
t R
etur
ns v
ersu
s Se
lect
ed S
tock
Mar
ket
Ret
urns
AU
CA
CL
HK
IDJP
KR
MY
MX
PE
PH
TW
TH
US
Pan
el A
: N
on-c
risi
s pe
riod
sM
ean
-0.0
260.
000
-0.0
49-0
.044
-0.0
29-0
.042
-0.0
32-0
.039
-0.0
45-0
.060
-0.0
09-0
.047
-0.0
350.
031
Std.
Dev
.0.
046
0.10
70.
070
0.03
90.
046
0.03
90.
036
0.03
00.
089
0.05
10.
039
0.03
00.
043
0.14
3Sk
ewne
ss0.
029
0.51
9-0
.077
-0.4
760.
660
-0.3
91-0
.200
-0.0
260.
417
-0.2
19-0
.814
0.00
7-1
.211
0.46
8K
urto
sis
-0.9
66-0
.528
-0.8
410.
144
0.39
0-0
.808
-0.6
44-0
.237
-0.5
96-0
.079
-0.1
870.
079
1.53
1-0
.905
Pan
el B
: C
risi
s pe
riod
sM
ean
-0.0
58-0
.161
-0.1
47-0
.091
-0.0
54-0
.077
-0.0
86-0
.059
-0.1
88-0
.136
-0.0
44-0
.089
-0.0
75-0
.186
Std.
Dev
.0.
042
0.12
50.
089
0.04
90.
038
0.03
90.
036
0.04
40.
107
0.07
30.
038
0.03
60.
033
0.15
9Sk
ewne
ss-0
.197
1.01
60.
537
-0.0
620.
118
0.06
10.
283
-0.0
490.
774
0.16
70.
344
-0.2
73-0
.150
1.02
4K
urto
sis
-0.4
181.
128
-0.4
01-0
.947
-0.7
390.
254
0.00
3-0
.547
0.31
7-0
.568
0.08
5-0
.414
-0.6
490.
818
Not
e:N
umbe
rs re
port
ed in
the
tabl
e ar
e dy
nam
ic c
ondi
tion
al c
orre
lati
ons
(DC
C).
DC
C is
cal
cula
ted
by fi
rst u
sing
Eq.
(1)
to d
emea
n th
e re
turn
ser
ies.
The
n, th
eco
ndit
iona
l var
ianc
e of
the
res
idua
ls c
an b
e de
com
pose
d in
to t
hree
com
pone
nts
as d
enot
ed i
n E
q. (
3). T
he ti
me-
vary
ing
cond
ition
al c
orre
lati
on is
then
retr
ieve
d fr
om th
e tim
e-va
ryin
g co
rrel
atio
n m
atri
x. T
he s
ampl
e co
untr
ies
are
Aus
tral
ia (A
U),
Can
ada
(CA
), C
hile
(CL
), H
ong
Kon
g (H
K),
Indo
nesi
a (I
D),
Japa
n (J
P), K
orea
(K
R),
Mal
aysi
a (M
Y),
Mex
ico
(MX
), P
eru
(PE
), P
hilip
pine
(PH
), T
aiw
an (
TW
), T
hail
and
(TH
) an
d th
e U
.S. (
US)
.

Contagion and Flight-to-Quality: Evidences from the Asia-Pacific Economic... 35T
able
6T
ests
of
Cha
nges
in D
ynam
ic C
orre
lati
ons
betw
een
MX
Sto
ck M
arke
t R
etur
ns v
ersu
s Se
lect
ed S
tock
Mar
ket
Ret
urns
dur
ing
Dif
fere
nt C
risi
s P
erio
ds
AU
CA
CL
HK
IDJP
KR
MY
PE
PH
TW
TH
US
Con
stan
t0.
187*
**0.
110
0.21
6***
0.07
8***
0.09
6***
0.06
8***
0.11
6***
0.06
9***
0.21
0***
0.08
9***
0.03
5**
0.05
4**
0.02
6� t-
10.
985*
**0.
998*
**0.
994*
**0.
995*
**0.
991*
**0.
992*
**0.
992*
**0.
993*
**0.
992*
**0.
988*
**0.
994*
**0.
995*
**0.
999*
**M
exic
o-0
.080
-0.1
13**
0.04
6-0
.044
-0.0
750.
037
-0.0
890.
012
0.13
30.
016
0.04
7-0
.057
-0.1
08A
sia
10.
080
0.18
50.
136
0.02
80.
004
-0.0
030.
000
-0.0
500.
186
0.02
2-0
.043
-0.0
360.
180*
*A
sia
20.
085*
*-0
.015
0.01
90.
077*
*0.
058*
*0.
038
0.00
80.
066*
*0.
100*
**0.
172*
**0.
000
0.08
1***
-0.0
21R
ussi
a0.
055
0.01
50.
045
-0.0
52-0
.115
0.03
0-0
.091
-0.0
490.
019
-0.0
470.
021
-0.0
780.
027
LT
CM
-0.1
130.
087
0.08
3-0
.019
-0.0
60-0
.113
0.00
60.
010
0.06
9-0
.025
-0.0
99-0
.132
0.08
6B
razi
l0.
061
-0.1
240.
097
-0.1
12-0
.049
0.01
5-0
.064
-0.0
630.
170*
*-0
.022
0.05
80.
001
0.01
8D
ot-C
om0.
073
0.07
60.
094*
**0.
040
-0.0
89-0
.011
0.03
6-0
.104
0.06
20.
034
0.09
40.
057
0.04
3A
rgen
tina
0.02
60.
013
0.00
00.
015
0.00
20.
025
0.02
30.
006
0.03
3-0
.022
0.04
5**
0.01
70.
005
GFC
1-0
.001
0.03
30.
126*
**0.
020
0.07
1***
0.00
10.
025
0.02
80.
137*
**-0
.011
0.03
20.
047*
*0.
024
GFC
20.
076*
**0.
044
0.08
4***
0.04
9**
0.10
3***
0.00
90.
028
0.08
2***
0.19
1***
-0.0
220.
045*
*0.
039
-0.0
02
Not
es:
Thi
s ta
ble
repo
rts
the
regr
essi
on o
utpu
t of E
q.(8
). �
i,j is
the
tim
e-va
ryin
g co
rrel
atio
n be
twee
n th
e st
ock
retu
rns
of M
exic
o an
d th
e st
ock
retu
rns
of s
elec
ted
econ
omie
s. �
t-1 i
s th
e ti
me-
vary
ing
corr
elat
ion
lag
one
peri
od. M
exic
o is
the
dum
my
vari
able
for t
he M
exic
an c
risi
s (1
/1/9
5-31
/3/9
5), A
sia
1 is
the
dum
my
vari
able
for t
he fi
rst p
hase
of A
sian
cri
sis
(2/7
/97-
17/1
1/97
), A
sia
2 is
the
dum
my
vari
able
for t
he s
econ
d ph
ase
of A
sian
cri
sis
(18/
11/9
7-31
/12/
98),
Rus
sia
is t
he d
umm
y va
riab
le f
or th
e R
ussi
an c
risi
s (1
7/08
/98-
31/1
2/98
), L
TCM
is
the
dum
my
vari
able
for
the
LT
CM
cri
sis
(23/
9/98
-15/
10/9
8),
Bra
zil
is t
hedu
mm
y va
riab
le f
or th
e B
razi
lian
cris
is (
7/1/
99-2
5/2/
99),
Dot
-Com
is th
e du
mm
y va
riab
le f
or D
ot-C
om c
risi
s (2
8/2/
00-7
/6/0
0), A
rgen
tina
is th
e du
mm
yva
riab
le f
or A
rgen
tine
an c
risi
s (1
1/10
/01-
3/3/
05),
GF
C 1
is t
he d
umm
y va
riab
le f
or th
e fi
rst p
hase
of
GFC
(26
/7/0
7-9/
3/09
), a
nd G
FC
2 is
the
dum
my
vari
able
for t
he s
econ
d ph
ase
of G
FC (1
0/3/
09-3
0/7/
10).
The
sam
ple
coun
trie
s ar
e A
ustr
alia
(A
U),
Can
ada
(CA
), C
hile
(CL
), H
ong
Kon
g (H
K),
Ind
ones
ia(I
D),
Jap
an (
JP),
Kor
ea (
KR
), M
alay
sia
(MY
), M
exic
o (M
X),
Per
u (P
E),
Phi
lippi
ne (
PH),
Tai
wan
(T
W),
Tha
iland
(T
H)
and
the
U.S
. (U
S). *
** a
nd *
*in
dica
te s
tatis
tical
sig
nifi
canc
e at
1%
and
5%
leve
ls, r
espe
ctiv
ely.
36 Yu-Tung Peng, Hue Hwa Au Yong and Sirimon Treepongkaruna
between MX and CA, which is inconsistent with expectation. However, significant contagioneffects (positive change in correlation) are found during the Asian, Dot-Com and GFC criseswhen Mexico is employed as the source country.
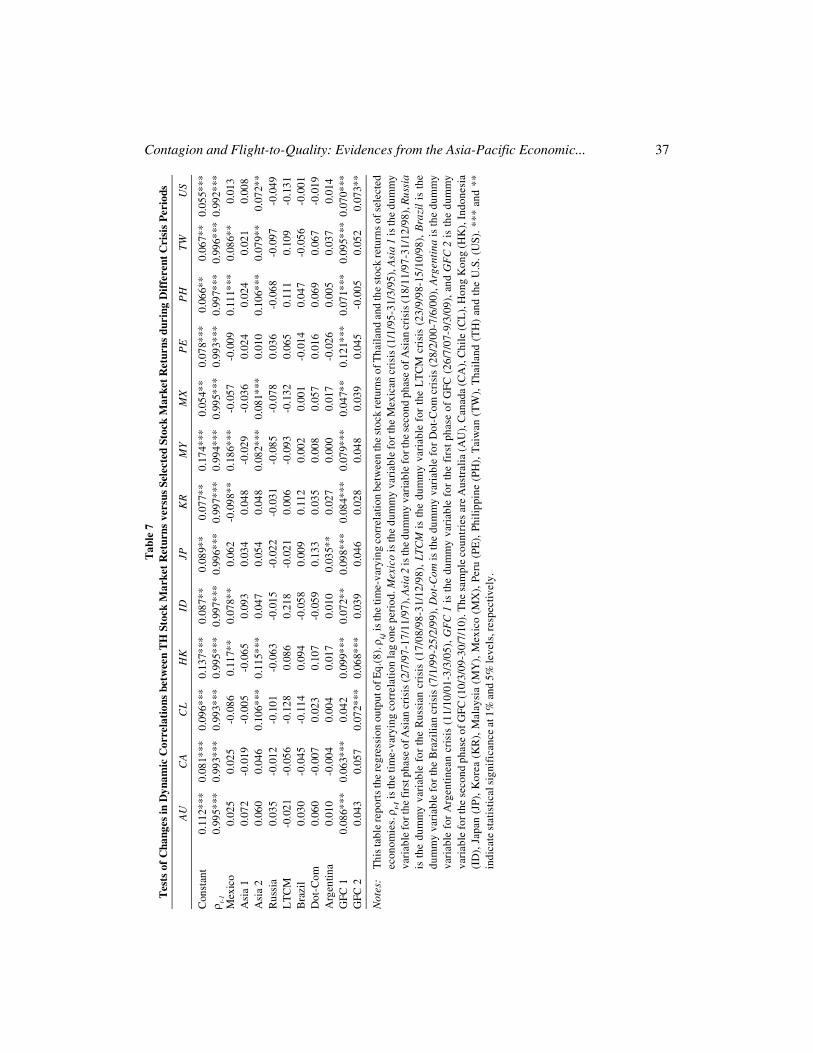
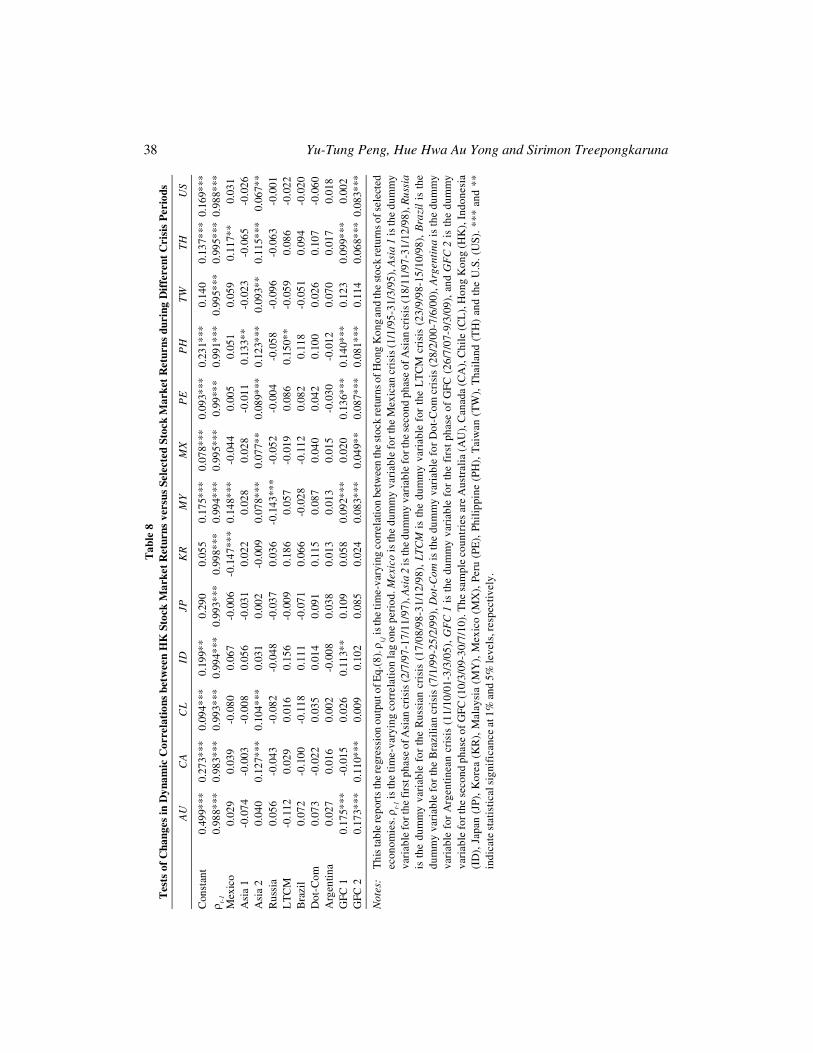
As presented in Table 7 and Table 8, using either TH or HK stock market returns as thesource country, the evidence of an increase in correlation are prominant during the secondphase of the Asian crisis. There is a significant increase in correlation between TH stock marketreturns and the stock market returns of various Asian (namely, HK, MY, PH, TW) and emergingeconomies (namely, MX and CL). When HK is used as the source country, significant increasesin correlation between HK stock market returns with the various Asian (namely, MY, PH, TW,TH) and emerging economies (namely, MX, TL) are also found. Interestingly, we also observedsignificant increase in correlations between TH, HK (as source countries) and developedeconomies such as US.
Consistent with Chiang et al. (2007), this study argues that investors seem to focus on thelocal country factors during the early phase of the Asian crisis. After realising the full impact ofthe crisis on the global economy, they withdrew funds from all Asian economies fearing thatthe crisis may transmit to other Asian countries. This created an overall crash in the Asian stockmarkets, producing a wide spread contagion effect in the region. In addition, correlations increasesignificantly during the GFC, illustrating the existence of contagion effects between the stockmarket returns of APEC countries with HK and TH as the source country, respectively.
Table 9 reports the findings when US stock market return is used as the source country. Wefind that contagion effect exists in most of the APEC countries, but not during every crisisperiod. The evidence reveals that the correlations of most APEC countries increase significantlyduring the GFC period, highlighting the presence of contagion effect and the significant role ofUS as the source country of the crisis.
Overall, the significant increases in correlations between stock markets especially duringthe Asian crisis and the GFC highlighted the presence of contagion effects. This finding isconsistent with the existing literature (Caramazza et al., 2004; Cheung et al., 2010; Dungey etal., 2010). Besides, the results also suggest that diversification benefits in international equitymarkets are reduced when they are needed most during the market turmoils. It should also benoted that the magnitude of a crisis is closely associated with the level of contagion effects.Crises such as the 1997 Asian crisis and GFC are the ones that produce significant increases incorrelations in most country pairs. GFC, which results in the largest recession since the GreatDepression, created a widespread fear among international investors, causing massivewithdrawals of funds in international equity markets. Therefore, every single stock market inthe sample suffered a contagion effect during the GFC.
4.2.1.2. Contagion in Bond Markets
Table 10 reports the change in correlations of U.S. bond returns versus Australia, Canada,Japan, New Zealand and Singapore bond market returns during the crisis periods. In contrast tothe stock markets findings, majority of the country pairs do not exhibit a significant increase incorrelation during market turbulence, except for CA and US during the earlier stage of theAsian crisis and the Argentinean crisis. We argue that since the Canadian and the U.S. bond
Contagion and Flight-to-Quality: Evidences from the Asia-Pacific Economic... 37T
able
7T
ests
of
Cha
nges
in D
ynam
ic C
orre
lati
ons
betw
een
TH
Sto
ck M
arke
t R
etur
ns v
ersu
s Se
lect
ed S
tock
Mar
ket
Ret
urns
dur
ing
Dif
fere
nt C
risi
s P
erio
ds
AU
CA
CL
HK
IDJP
KR
MY
MX
PE
PH
TW
US
Con
stan
t0.
112*
**0.
081*
**0.
096*
**0.
137*
**0.
087*
*0.
089*
*0.
077*
*0.
174*
**0.
054*
*0.
078*
**0.
066*
*0.
067*
*0.
055*
**� t-
10.
995*
**0.
993*
**0.
993*
**0.
995*
**0.
997*
**0.
996*
**0.
997*
**0.
994*
**0.
995*
**0.
993*
**0.
997*
**0.
996*
**0.
992*
**M
exic
o0.
025
0.02
5-0
.086
0.11
7**
0.07
8**
0.06
2-0
.098
**0.
186*
**-0
.057
-0.0
090.
111*
**0.
086*
*0.
013
Asi
a 1
0.07
2-0
.019
-0.0
05-0
.065
0.09
30.
034
0.04
8-0
.029
-0.0
360.
024
0.02
40.
021
0.00
8A
sia
20.
060
0.04
60.
106*
**0.
115*
**0.
047
0.05
40.
048
0.08
2***
0.08
1***
0.01
00.
106*
**0.
079*
*0.
072*
*R
ussi
a0.
035
-0.0
12-0
.101
-0.0
63-0
.015
-0.0
22-0
.031
-0.0
85-0
.078
0.03
6-0
.068
-0.0
97-0
.049
LT
CM
-0.0
21-0
.056
-0.1
280.
086
0.21
8-0
.021
0.00
6-0
.093
-0.1
320.
065
0.11
10.
109
-0.1
31B
razi
l0.
030
-0.0
45-0
.114
0.09
4-0
.058
0.00
90.
112
0.00
20.
001
-0.0
140.
047
-0.0
56-0
.001
Dot
-Com
0.06
0-0
.007
0.02
30.
107
-0.0
590.
133
0.03
50.
008
0.05
70.
016
0.06
90.
067
-0.0
19A
rgen
tina
0.01
0-0
.004
0.00
40.
017
0.01
00.
035*
*0.
027
0.00
00.
017
-0.0
260.
005
0.03
70.
014
GFC
10.
086*
**0.
063*
**0.
042
0.09
9***
0.07
2**
0.09
8***
0.08
4***
0.07
9***
0.04
7**
0.12
1***
0.07
1***
0.09
5***
0.07
0***
GFC
20.
043
0.05
70.
072*
**0.
068*
**0.
039
0.04
60.
028
0.04
80.
039
0.04
5-0
.005
0.05
20.
073*
*
Not
es:
Thi
s ta
ble
repo
rts
the
regr
essi
on o
utpu
t of E
q.(8
). �
i,j is
the
time-
vary
ing
corr
elat
ion
betw
een
the
stoc
k re
turn
s of
Tha
iland
and
the
stoc
k re
turn
s of
sel
ecte
dec
onom
ies.
�t-
1 is
the
tim
e-va
ryin
g co
rrel
atio
n la
g on
e pe
riod
. Mex
ico
is th
e du
mm
y va
riab
le fo
r the
Mex
ican
cri
sis
(1/1
/95-
31/3
/95)
, Asi
a 1
is th
e du
mm
yva
riab
le fo
r the
firs
t pha
se o
f Asi
an c
risi
s (2
/7/9
7-17
/11/
97),
Asi
a 2
is th
e du
mm
y va
riab
le fo
r the
sec
ond
phas
e of
Asi
an c
risi
s (1
8/11
/97-
31/1
2/98
), R
ussi
ais
the
dum
my
vari
able
for
the
Rus
sian
cri
sis
(17/
08/9
8-31
/12/
98),
LTC
M i
s th
e du
mm
y va
riab
le f
or t
he L
TC
M c
risi
s (2
3/9/
98-1
5/10
/98)
, B
razi
l is
the
dum
my
vari
able
for
the
Bra
zilia
n cr
isis
(7/
1/99
-25/
2/99
), D
ot-C
om is
the
dum
my
vari
able
for
Dot
-Com
cri
sis
(28/
2/00
-7/6
/00)
, Arg
enti
na is
the
dum
my
vari
able
for
Arg
enti
nean
cri
sis
(11/
10/0
1-3/
3/05
), G
FC
1 is
the
dum
my
vari
able
for
the
firs
t pha
se o
f G
FC (
26/7
/07-
9/3/
09),
and
GF
C 2
is t
he d
umm
yva
riab
le fo
r the
sec
ond
phas
e of
GFC
(10/
3/09
-30/
7/10
). T
he s
ampl
e co
untr
ies
are
Aus
tral
ia (
AU
), C
anad
a (C
A),
Chi
le (C
L),
Hon
g K
ong
(HK
), I
ndon
esia
(ID
), J
apan
(JP
), K
orea
(K
R),
Mal
aysi
a (M
Y),
Mex
ico
(MX
), P
eru
(PE
), P
hilip
pine
(PH
), T
aiw
an (
TW
), T
haila
nd (
TH
) an
d th
e U
.S. (
US)
. ***
and
**
indi
cate
sta
tistic
al s
igni
fica
nce
at 1
% a
nd 5
% le
vels
, res
pect
ivel
y.
38 Yu-Tung Peng, Hue Hwa Au Yong and Sirimon TreepongkarunaT
able
8T
ests
of
Cha
nges
in D
ynam
ic C
orre
lati
ons
betw
een
HK
Sto
ck M
arke
t R
etur
ns v
ersu
s Se
lect
ed S
tock
Mar
ket
Ret
urns
dur
ing
Dif
fere
nt C
risi
s P
erio
ds
AU
CA
CL
IDJP
KR
MY
MX
PE
PH
TW
TH
US
Con
stan
t0.
499*
**0.
273*
**0.
094*
**0.
199*
*0.
290
0.05
50.
175*
**0.
078*
**0.
093*
**0.
231*
**0.
140
0.13
7***
0.16
9***
� t-1
0.98
8***
0.98
3***
0.99
3***
0.99
4***
0.99
3***
0.99
8***
0.99
4***
0.99
5***
0.99
***
0.99
1***
0.99
5***
0.99
5***
0.98
8***
Mex
ico
0.02
90.
039
-0.0
800.
067
-0.0
06-0
.147
***
0.14
8***
-0.0
440.
005
0.05
10.
059
0.11
7**
0.03
1A
sia
1-0
.074
-0.0
03-0
.008
0.05
6-0
.031
0.02
20.
028
0.02
8-0
.011
0.13
3**
-0.0
23-0
.065
-0.0
26A
sia
20.
040
0.12
7***
0.10
4***
0.03
10.
002
-0.0
090.
078*
**0.
077*
*0.
089*
**0.
123*
**0.
093*
*0.
115*
**0.
067*
*R
ussi
a0.
056
-0.0
43-0
.082
-0.0
48-0
.037
0.03
6-0
.143
***
-0.0
52-0
.004
-0.0
58-0
.096
-0.0
63-0
.001
LT
CM
-0.1
120.
029
0.01
60.
156
-0.0
090.
186
0.05
7-0
.019
0.08
60.
150*
*-0
.059
0.08
6-0
.022
Bra
zil
0.07
2-0
.100
-0.1
180.
111
-0.0
710.
066
-0.0
28-0
.112
0.08
20.
118
-0.0
510.
094
-0.0
20D
ot-C
om0.
073
-0.0
220.
035
0.01
40.
091
0.11
50.
087
0.04
00.
042
0.10
00.
026
0.10
7-0
.060
Arg
entin
a0.
027
0.01
60.
002
-0.0
080.
038
0.01
30.
013
0.01
5-0
.030
-0.0
120.
070
0.01
70.
018
GFC
10.
175*
**-0
.015
0.02
60.
113*
*0.
109
0.05
80.
092*
**0.
020
0.13
6***
0.14
0***
0.12
30.
099*
**0.
002
GFC
20.
173*
**0.
110*
**0.
009
0.10
20.
085
0.02
40.
083*
**0.
049*
*0.
087*
**0.
081*
**0.
114
0.06
8***
0.08
3***
Not
es:
Thi
s ta
ble
repo
rts
the
regr
essi
on o
utpu
t of E
q.(8
). � i,j
is th
e tim
e-va
ryin
g co
rrel
atio
n be
twee
n th
e st
ock
retu
rns o
f Hon
g K
ong
and
the
stoc
k re
turn
s of s
elec
ted
econ
omie
s. �
t-1 i
s th
e ti
me-
vary
ing
corr
elat
ion
lag
one
peri
od. M
exic
o is
the
dum
my
vari
able
for t
he M
exic
an c
risi
s (1
/1/9
5-31
/3/9
5), A
sia
1 is
the
dum
my
vari
able
for t
he fi
rst p
hase
of A
sian
cri
sis
(2/7
/97-
17/1
1/97
), A
sia
2 is
the
dum
my
vari
able
for t
he s
econ
d ph
ase
of A
sian
cri
sis
(18/
11/9
7-31
/12/
98),
Rus
sia
is t
he d
umm
y va
riab
le f
or th
e R
ussi
an c
risi
s (1
7/08
/98-
31/1
2/98
), L
TCM
is
the
dum
my
vari
able
for
the
LT
CM
cri
sis
(23/
9/98
-15/
10/9
8),
Bra
zil
is t
hedu
mm
y va
riab
le f
or th
e B
razi
lian
cris
is (
7/1/
99-2
5/2/
99),
Dot
-Com
is th
e du
mm
y va
riab
le f
or D
ot-C
om c
risi
s (2
8/2/
00-7
/6/0
0), A
rgen
tina
is th
e du
mm
yva
riab
le f
or A
rgen
tine
an c
risi
s (1
1/10
/01-
3/3/
05),
GF
C 1
is t
he d
umm
y va
riab
le f
or th
e fi
rst p
hase
of
GFC
(26
/7/0
7-9/
3/09
), a
nd G
FC
2 is
the
dum
my
vari
able
for t
he s
econ
d ph
ase
of G
FC (1
0/3/
09-3
0/7/
10).
The
sam
ple
coun
trie
s ar
e A
ustr
alia
(A
U),
Can
ada
(CA
), C
hile
(CL
), H
ong
Kon
g (H
K),
Ind
ones
ia(I
D),
Jap
an (
JP),
Kor
ea (
KR
), M
alay
sia
(MY
), M
exic
o (M
X),
Per
u (P
E),
Phi
lippi
ne (
PH),
Tai
wan
(T
W),
Tha
iland
(T
H)
and
the
U.S
. (U
S). *
** a
nd *
*in
dica
te s
tatis
tical
sig
nifi
canc
e at
1%
and
5%
leve
ls, r
espe
ctiv
ely.

Contagion and Flight-to-Quality: Evidences from the Asia-Pacific Economic... 39T
able
9T
ests
of
Cha
nges
in D
ynam
ic C
orre
lati
ons
betw
een
US
Stoc
k M
arke
t R
etur
ns v
ersu
s Se
lect
ed S
tock
Mar
ket
Ret
urns
dur
ing
Dif
fere
nt C
risi
s P
erio
ds
AU
CA
CL
HK
IDJP
KR
MY
PE
PH
TW
TH
US
Con
stan
t0.
193*
**0.
221*
*0.
066
0.16
9***
0.07
3***
0.13
1***
0.16
0***
0.04
6***
0.02
60.
175*
**0.
097*
**0.
075*
**0.
055*
**�
t-1
0.98
6***
0.99
7***
0.99
8***
0.98
8***
0.99
1***
0.98
8***
0.98
7***
0.99
3***
0.99
9***
0.99
2***
0.98
7***
0.98
8***
0.99
2***
Mex
ico
0.03
2-0
.035
-0.0
250.
031
-0.0
09-0
.051
-0.0
47**
0.05
3-0
.108
-0.0
20-0
.019
0.10
2***
0.01
3A
sia
1-0
.033
0.10
80.
135
-0.0
26-0
.067
-0.0
29-0
.008
-0.0
080.
180*
*0.
101
-0.0
34-0
.107
0.00
8A
sia
20.
043
-0.0
030.
004
0.06
7**
0.02
60.
038
0.02
90.
035
-0.0
210.
036
0.12
6***
0.01
40.
072*
*R
ussi
a0.
033
0.04
20.
001
-0.0
01-0
.068
0.03
2-0
.030
-0.0
480.
027
-0.0
19-0
.009
0.03
6-0
.049
LT
CM
-0.0
56-0
.005
0.11
9-0
.022
-0.0
68-0
.040
0.03
80.
012
0.08
60.
117
-0.0
58-0
.131
-0.1
31B
razi
l0.
051
-0.0
92-0
.061
-0.0
200.
029
0.04
70.
037
-0.0
430.
018
0.13
2**
0.20
3**
0.22
2**
-0.0
01D
ot-C
om-0
.016
0.02
30.
053
-0.0
60-0
.051
-0.0
89-0
.044
-0.0
630.
043
-0.0
02-0
.027
0.13
6***
-0.0
19A
rgen
tina
-0.0
080.
017
0.00
80.
018
-0.0
010.
062*
**0.
034*
*-0
.011
0.00
50.
022
-0.0
38**
0.08
7***
0.01
4G
FC 1
-0.0
140.
022
0.04
9**
0.00
20.
053*
*0.
025
0.04
6**
0.01
10.
024
0.08
9***
-0.0
240.
056*
*0.
070*
**G
FC 2
0.06
3**
0.04
4***
0.02
20.
083*
**0.
062*
*0.
037
0.09
1***
0.08
6***
-0.0
020.
196*
**-0
.027
0.09
5***
0.07
3**
Not
es:
Thi
s ta
ble
repo
rts
the
regr
essi
on o
utpu
t of E
q. (8
) �i,j is
the
time-
vary
ing
corr
elat
ion
betw
een
the
stoc
k re
turn
s of
the
U.S
. and
the
stoc
k re
turn
s of
sel
ecte
dec
onom
ies.
�t-
1 is
the
tim
e-va
ryin
g co
rrel
atio
n la
g on
e pe
riod
. Mex
ico
is th
e du
mm
y va
riab
le fo
r the
Mex
ican
cri
sis
(1/1
/95-
31/3
/95)
, Asi
a 1
is th
e du
mm
yva
riab
le fo
r the
firs
t pha
se o
f Asi
an c
risi
s (2
/7/9
7-17
/11/
97),
Asi
a 2
is th
e du
mm
y va
riab
le fo
r the
sec
ond
phas
e of
Asi
an c
risi
s (1
8/11
/97-
31/1
2/98
), R
ussi
ais
the
dum
my
vari
able
for
the
Rus
sian
cri
sis
(17/
08/9
8-31
/12/
98),
LTC
M i
s th
e du
mm
y va
riab
le f
or t
he L
TC
M c
risi
s (2
3/9/
98-1
5/10
/98)
, B
razi
l is
the
dum
my
vari
able
for
the
Bra
zilia
n cr
isis
(7/
1/99
-25/
2/99
), D
ot-C
om is
the
dum
my
vari
able
for
Dot
-Com
cri
sis
(28/
2/00
-7/6
/00)
, Arg
enti
na is
the
dum
my
vari
able
for
Arg
enti
nean
cri
sis
(11/
10/0
1-3/
3/05
), G
FC
1 is
the
dum
my
vari
able
for
the
firs
t pha
se o
f G
FC (
26/7
/07-
9/3/
09),
and
GF
C 2
is t
he d
umm
yva
riab
le fo
r the
sec
ond
phas
e of
GFC
(10/
3/09
-30/
7/10
). T
he s
ampl
e co
untr
ies
are
Aus
tral
ia (
AU
), C
anad
a (C
A),
Chi
le (C
L),
Hon
g K
ong
(HK
), I
ndon
esia
(ID
), J
apan
(JP
), K
orea
(K
R),
Mal
aysi
a (M
Y),
Mex
ico
(MX
), P
eru
(PE
), P
hilip
pine
(PH
), T
aiw
an (
TW
), T
haila
nd (
TH
) an
d th
e U
.S. (
US)
. ***
and
**
indi
cate
sta
tistic
al s
igni
fica
nce
at 1
% a
nd 5
% le
vels
, res
pect
ivel
y.
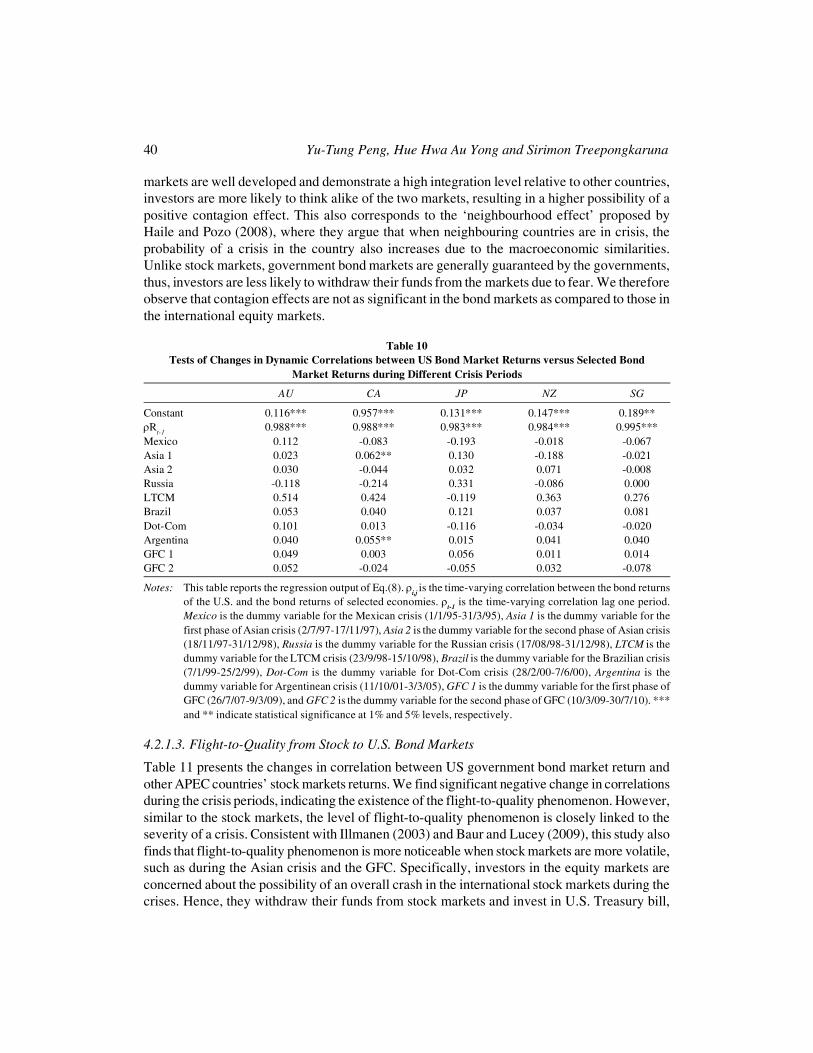
40 Yu-Tung Peng, Hue Hwa Au Yong and Sirimon Treepongkaruna
markets are well developed and demonstrate a high integration level relative to other countries,investors are more likely to think alike of the two markets, resulting in a higher possibility of apositive contagion effect. This also corresponds to the ‘neighbourhood effect’ proposed byHaile and Pozo (2008), where they argue that when neighbouring countries are in crisis, theprobability of a crisis in the country also increases due to the macroeconomic similarities.Unlike stock markets, government bond markets are generally guaranteed by the governments,thus, investors are less likely to withdraw their funds from the markets due to fear. We thereforeobserve that contagion effects are not as significant in the bond markets as compared to those inthe international equity markets.
Table 10Tests of Changes in Dynamic Correlations between US Bond Market Returns versus Selected Bond
Market Returns during Different Crisis Periods
AU CA JP NZ SG
Constant 0.116*** 0.957*** 0.131*** 0.147*** 0.189**�R
t-10.988*** 0.988*** 0.983*** 0.984*** 0.995***
Mexico 0.112 -0.083 -0.193 -0.018 -0.067Asia 1 0.023 0.062** 0.130 -0.188 -0.021Asia 2 0.030 -0.044 0.032 0.071 -0.008Russia -0.118 -0.214 0.331 -0.086 0.000LTCM 0.514 0.424 -0.119 0.363 0.276Brazil 0.053 0.040 0.121 0.037 0.081Dot-Com 0.101 0.013 -0.116 -0.034 -0.020Argentina 0.040 0.055** 0.015 0.041 0.040GFC 1 0.049 0.003 0.056 0.011 0.014GFC 2 0.052 -0.024 -0.055 0.032 -0.078
Notes: This table reports the regression output of Eq.(8). �i,j
is the time-varying correlation between the bond returnsof the U.S. and the bond returns of selected economies. �
t-1 is the time-varying correlation lag one period.
Mexico is the dummy variable for the Mexican crisis (1/1/95-31/3/95), Asia 1 is the dummy variable for thefirst phase of Asian crisis (2/7/97-17/11/97), Asia 2 is the dummy variable for the second phase of Asian crisis(18/11/97-31/12/98), Russia is the dummy variable for the Russian crisis (17/08/98-31/12/98), LTCM is thedummy variable for the LTCM crisis (23/9/98-15/10/98), Brazil is the dummy variable for the Brazilian crisis(7/1/99-25/2/99), Dot-Com is the dummy variable for Dot-Com crisis (28/2/00-7/6/00), Argentina is thedummy variable for Argentinean crisis (11/10/01-3/3/05), GFC 1 is the dummy variable for the first phase ofGFC (26/7/07-9/3/09), and GFC 2 is the dummy variable for the second phase of GFC (10/3/09-30/7/10). ***and ** indicate statistical significance at 1% and 5% levels, respectively.
4.2.1.3. Flight-to-Quality from Stock to U.S. Bond Markets
Table 11 presents the changes in correlation between US government bond market return andother APEC countries’ stock markets returns. We find significant negative change in correlationsduring the crisis periods, indicating the existence of the flight-to-quality phenomenon. However,similar to the stock markets, the level of flight-to-quality phenomenon is closely linked to theseverity of a crisis. Consistent with Illmanen (2003) and Baur and Lucey (2009), this study alsofinds that flight-to-quality phenomenon is more noticeable when stock markets are more volatile,such as during the Asian crisis and the GFC. Specifically, investors in the equity markets areconcerned about the possibility of an overall crash in the international stock markets during thecrises. Hence, they withdraw their funds from stock markets and invest in U.S. Treasury bill,
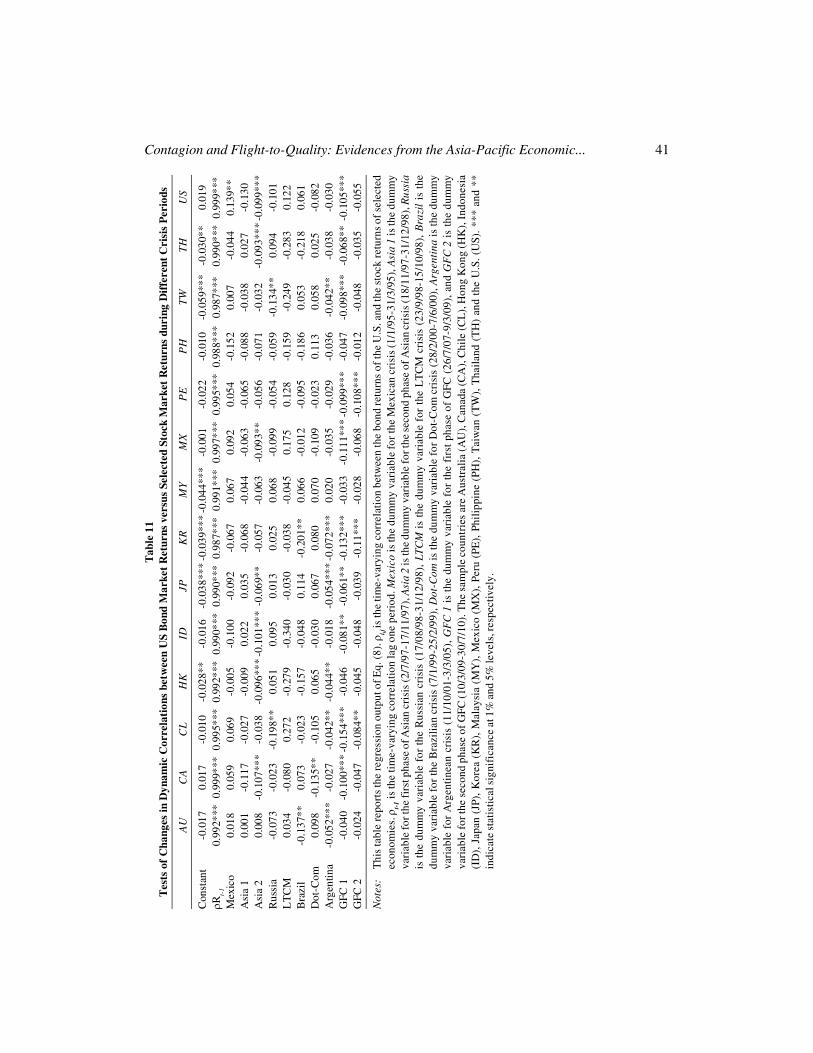
Contagion and Flight-to-Quality: Evidences from the Asia-Pacific Economic... 41T
able
11
Tes
ts o
f C
hang
es in
Dyn
amic
Cor
rela
tion
s be
twee
n U
S B
ond
Mar
ket
Ret
urns
ver
sus
Sele
cted
Sto
ck M
arke
t R
etur
ns d
urin
g D
iffe
rent
Cri
sis
Per
iods
AU
CA
CL
HK
IDJP
KR
MY
MX
PE
PH
TW
TH
US
Con
stan
t-0
.017
0.01
7-0
.010
-0.0
28**
-0.0
16-0
.038
***
-0.0
39**
*-0
.044
***
-0.0
01-0
.022
-0.0
10-0
.059
***
-0.0
30**
0.01
9�R
t-1
0.99
2***
0.99
9***
0.99
5***
0.99
2***
0.99
0***
0.99
0***
0.98
7***
0.99
1***
0.99
7***
0.99
5***
0.98
8***
0.98
7***
0.99
0***
0.99
9***
Mex
ico
0.01
80.
059
0.06
9-0
.005
-0.1
00-0
.092
-0.0
670.
067
0.09
20.
054
-0.1
520.
007
-0.0
440.
139*
*A
sia
10.
001
-0.1
17-0
.027
-0.0
090.
022
0.03
5-0
.068
-0.0
44-0
.063
-0.0
65-0
.088
-0.0
380.
027
-0.1
30A
sia
20.
008
-0.1
07**
*-0
.038
-0.0
96**
*-0
.101
***
-0.0
69**
-0.0
57-0
.063
-0.0
93**
-0.0
56-0
.071
-0.0
32-0
.093
***
-0.0
99**
*R
ussi
a-0
.073
-0.0
23-0
.198
**0.
051
0.09
50.
013
0.02
50.
068
-0.0
99-0
.054
-0.0
59-0
.134
**0.
094
-0.1
01L
TC
M0.
034
-0.0
800.
272
-0.2
79-0
.340
-0.0
30-0
.038
-0.0
450.
175
0.12
8-0
.159
-0.2
49-0
.283
0.12
2B
razi
l-0
.137
**0.
073
-0.0
23-0
.157
-0.0
480.
114
-0.2
01**
0.06
6-0
.012
-0.0
95-0
.186
0.05
3-0
.218
0.06
1D
ot-C
om0.
098
-0.1
35**
-0.1
050.
065
-0.0
300.
067
0.08
00.
070
-0.1
09-0
.023
0.11
30.
058
0.02
5-0
.082
Arg
entin
a-0
.052
***
-0.0
27-0
.042
**-0
.044
**-0
.018
-0.0
54**
*-0
.072
***
0.02
0-0
.035
-0.0
29-0
.036
-0.0
42**
-0.0
38-0
.030
GFC
1-0
.040
-0.1
00**
*-0
.154
***
-0.0
46-0
.081
**-0
.061
**-0
.132
***
-0.0
33-0
.111
***
-0.0
99**
*-0
.047
-0.0
98**
*-0
.068
**-0
.105
***
GFC
2-0
.024
-0.0
47-0
.084
**-0
.045
-0.0
48-0
.039
-0.1
1***
-0.0
28-0
.068
-0.1
08**
*-0
.012
-0.0
48-0
.035
-0.0
55
Not
es:
Thi
s ta
ble
repo
rts
the
regr
essi
on o
utpu
t of E
q. (8
). �
i,j is
the
time-
vary
ing
corr
elat
ion
betw
een
the
bond
retu
rns
of th
e U
.S. a
nd th
e st
ock
retu
rns
of s
elec
ted
econ
omie
s. �
t-1 i
s th
e ti
me-
vary
ing
corr
elat
ion
lag
one
peri
od. M
exic
o is
the
dum
my
vari
able
for t
he M
exic
an c
risi
s (1
/1/9
5-31
/3/9
5), A
sia
1 is
the
dum
my
vari
able
for t
he fi
rst p
hase
of A
sian
cri
sis
(2/7
/97-
17/1
1/97
), A
sia
2 is
the
dum
my
vari
able
for t
he s
econ
d ph
ase
of A
sian
cri
sis
(18/
11/9
7-31
/12/
98),
Rus
sia
is t
he d
umm
y va
riab
le f
or th
e R
ussi
an c
risi
s (1
7/08
/98-
31/1
2/98
), L
TCM
is
the
dum
my
vari
able
for
the
LT
CM
cri
sis
(23/
9/98
-15/
10/9
8),
Bra
zil
is t
hedu
mm
y va
riab
le f
or th
e B
razi
lian
cris
is (
7/1/
99-2
5/2/
99),
Dot
-Com
is th
e du
mm
y va
riab
le f
or D
ot-C
om c
risi
s (2
8/2/
00-7
/6/0
0), A
rgen
tina
is th
e du
mm
yva
riab
le f
or A
rgen
tine
an c
risi
s (1
1/10
/01-
3/3/
05),
GF
C 1
is t
he d
umm
y va
riab
le f
or th
e fi
rst p
hase
of
GFC
(26
/7/0
7-9/
3/09
), a
nd G
FC
2 is
the
dum
my
vari
able
for t
he s
econ
d ph
ase
of G
FC (1
0/3/
09-3
0/7/
10).
The
sam
ple
coun
trie
s ar
e A
ustr
alia
(A
U),
Can
ada
(CA
), C
hile
(CL
), H
ong
Kon
g (H
K),
Ind
ones
ia(I
D),
Jap
an (
JP),
Kor
ea (
KR
), M
alay
sia
(MY
), M
exic
o (M
X),
Per
u (P
E),
Phi
lippi
ne (
PH),
Tai
wan
(T
W),
Tha
iland
(T
H)
and
the
U.S
. (U
S). *
** a
nd *
*in
dica
te s
tatis
tical
sig
nifi
canc
e at
1%
and
5%
leve
ls, r
espe
ctiv
ely.
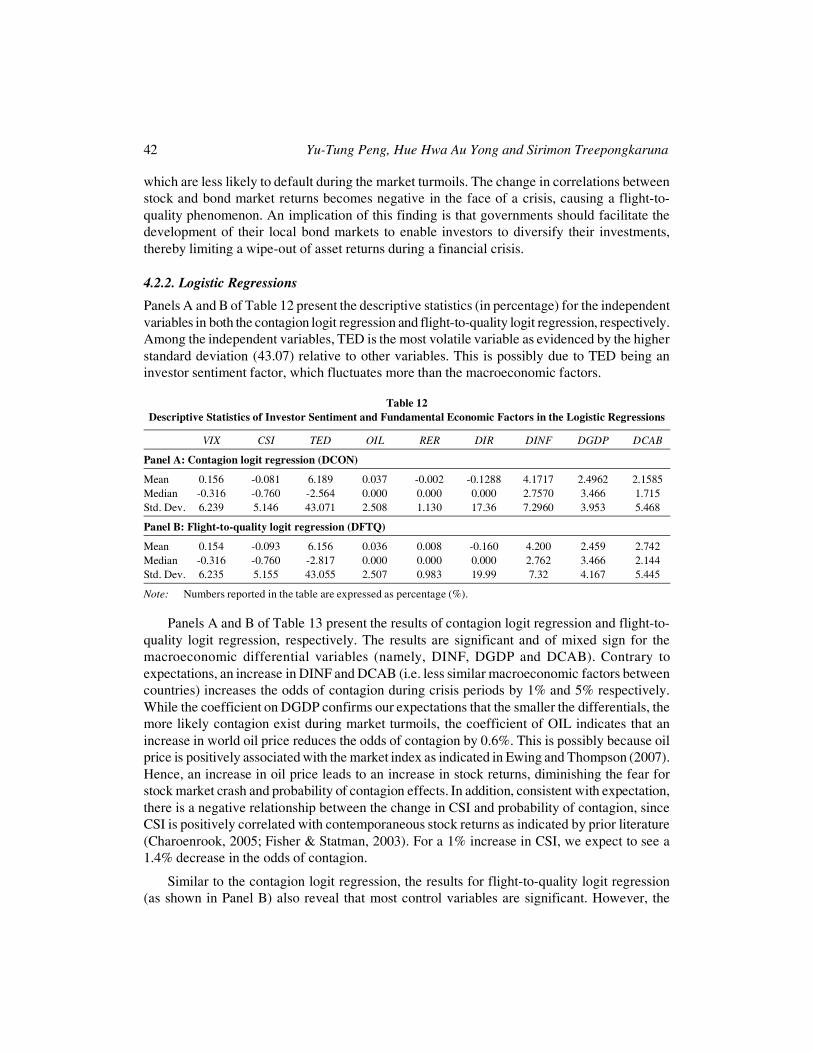
42 Yu-Tung Peng, Hue Hwa Au Yong and Sirimon Treepongkaruna
which are less likely to default during the market turmoils. The change in correlations betweenstock and bond market returns becomes negative in the face of a crisis, causing a flight-to-quality phenomenon. An implication of this finding is that governments should facilitate thedevelopment of their local bond markets to enable investors to diversify their investments,thereby limiting a wipe-out of asset returns during a financial crisis.
4.2.2. Logistic Regressions
Panels A and B of Table 12 present the descriptive statistics (in percentage) for the independentvariables in both the contagion logit regression and flight-to-quality logit regression, respectively.Among the independent variables, TED is the most volatile variable as evidenced by the higherstandard deviation (43.07) relative to other variables. This is possibly due to TED being aninvestor sentiment factor, which fluctuates more than the macroeconomic factors.
Table 12Descriptive Statistics of Investor Sentiment and Fundamental Economic Factors in the Logistic Regressions
VIX CSI TED OIL RER DIR DINF DGDP DCAB
Panel A: Contagion logit regression (DCON)
Mean 0.156 -0.081 6.189 0.037 -0.002 -0.1288 4.1717 2.4962 2.1585Median -0.316 -0.760 -2.564 0.000 0.000 0.000 2.7570 3.466 1.715Std. Dev. 6.239 5.146 43.071 2.508 1.130 17.36 7.2960 3.953 5.468
Panel B: Flight-to-quality logit regression (DFTQ)
Mean 0.154 -0.093 6.156 0.036 0.008 -0.160 4.200 2.459 2.742Median -0.316 -0.760 -2.817 0.000 0.000 0.000 2.762 3.466 2.144Std. Dev. 6.235 5.155 43.055 2.507 0.983 19.99 7.32 4.167 5.445
Note: Numbers reported in the table are expressed as percentage (%).
Panels A and B of Table 13 present the results of contagion logit regression and flight-to-quality logit regression, respectively. The results are significant and of mixed sign for themacroeconomic differential variables (namely, DINF, DGDP and DCAB). Contrary toexpectations, an increase in DINF and DCAB (i.e. less similar macroeconomic factors betweencountries) increases the odds of contagion during crisis periods by 1% and 5% respectively.While the coefficient on DGDP confirms our expectations that the smaller the differentials, themore likely contagion exist during market turmoils, the coefficient of OIL indicates that anincrease in world oil price reduces the odds of contagion by 0.6%. This is possibly because oilprice is positively associated with the market index as indicated in Ewing and Thompson (2007).Hence, an increase in oil price leads to an increase in stock returns, diminishing the fear forstock market crash and probability of contagion effects. In addition, consistent with expectation,there is a negative relationship between the change in CSI and probability of contagion, sinceCSI is positively correlated with contemporaneous stock returns as indicated by prior literature(Charoenrook, 2005; Fisher & Statman, 2003). For a 1% increase in CSI, we expect to see a1.4% decrease in the odds of contagion.
Similar to the contagion logit regression, the results for flight-to-quality logit regression(as shown in Panel B) also reveal that most control variables are significant. However, the
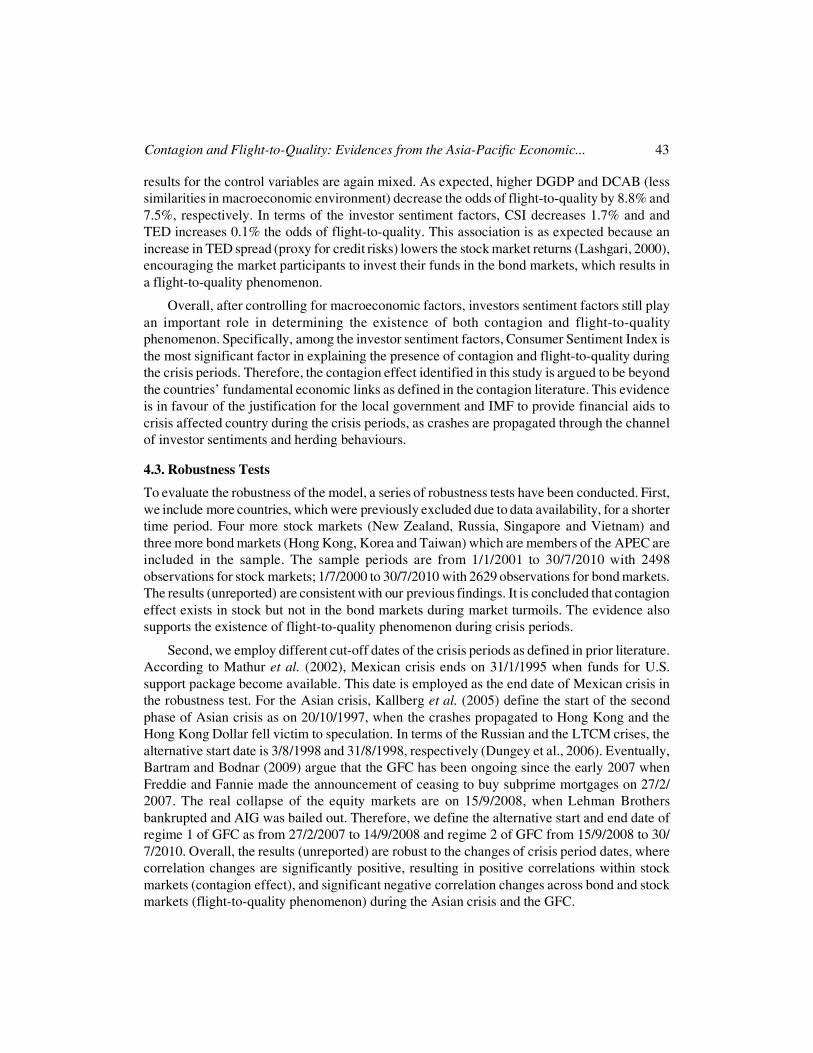
Contagion and Flight-to-Quality: Evidences from the Asia-Pacific Economic... 43
results for the control variables are again mixed. As expected, higher DGDP and DCAB (lesssimilarities in macroeconomic environment) decrease the odds of flight-to-quality by 8.8% and7.5%, respectively. In terms of the investor sentiment factors, CSI decreases 1.7% and andTED increases 0.1% the odds of flight-to-quality. This association is as expected because anincrease in TED spread (proxy for credit risks) lowers the stock market returns (Lashgari, 2000),encouraging the market participants to invest their funds in the bond markets, which results ina flight-to-quality phenomenon.
Overall, after controlling for macroeconomic factors, investors sentiment factors still playan important role in determining the existence of both contagion and flight-to-qualityphenomenon. Specifically, among the investor sentiment factors, Consumer Sentiment Index isthe most significant factor in explaining the presence of contagion and flight-to-quality duringthe crisis periods. Therefore, the contagion effect identified in this study is argued to be beyondthe countries’ fundamental economic links as defined in the contagion literature. This evidenceis in favour of the justification for the local government and IMF to provide financial aids tocrisis affected country during the crisis periods, as crashes are propagated through the channelof investor sentiments and herding behaviours.
4.3. Robustness Tests
To evaluate the robustness of the model, a series of robustness tests have been conducted. First,we include more countries, which were previously excluded due to data availability, for a shortertime period. Four more stock markets (New Zealand, Russia, Singapore and Vietnam) andthree more bond markets (Hong Kong, Korea and Taiwan) which are members of the APEC areincluded in the sample. The sample periods are from 1/1/2001 to 30/7/2010 with 2498observations for stock markets; 1/7/2000 to 30/7/2010 with 2629 observations for bond markets.The results (unreported) are consistent with our previous findings. It is concluded that contagioneffect exists in stock but not in the bond markets during market turmoils. The evidence alsosupports the existence of flight-to-quality phenomenon during crisis periods.
Second, we employ different cut-off dates of the crisis periods as defined in prior literature.According to Mathur et al. (2002), Mexican crisis ends on 31/1/1995 when funds for U.S.support package become available. This date is employed as the end date of Mexican crisis inthe robustness test. For the Asian crisis, Kallberg et al. (2005) define the start of the secondphase of Asian crisis as on 20/10/1997, when the crashes propagated to Hong Kong and theHong Kong Dollar fell victim to speculation. In terms of the Russian and the LTCM crises, thealternative start date is 3/8/1998 and 31/8/1998, respectively (Dungey et al., 2006). Eventually,Bartram and Bodnar (2009) argue that the GFC has been ongoing since the early 2007 whenFreddie and Fannie made the announcement of ceasing to buy subprime mortgages on 27/2/2007. The real collapse of the equity markets are on 15/9/2008, when Lehman Brothersbankrupted and AIG was bailed out. Therefore, we define the alternative start and end date ofregime 1 of GFC as from 27/2/2007 to 14/9/2008 and regime 2 of GFC from 15/9/2008 to 30/7/2010. Overall, the results (unreported) are robust to the changes of crisis period dates, wherecorrelation changes are significantly positive, resulting in positive correlations within stockmarkets (contagion effect), and significant negative correlation changes across bond and stockmarkets (flight-to-quality phenomenon) during the Asian crisis and the GFC.
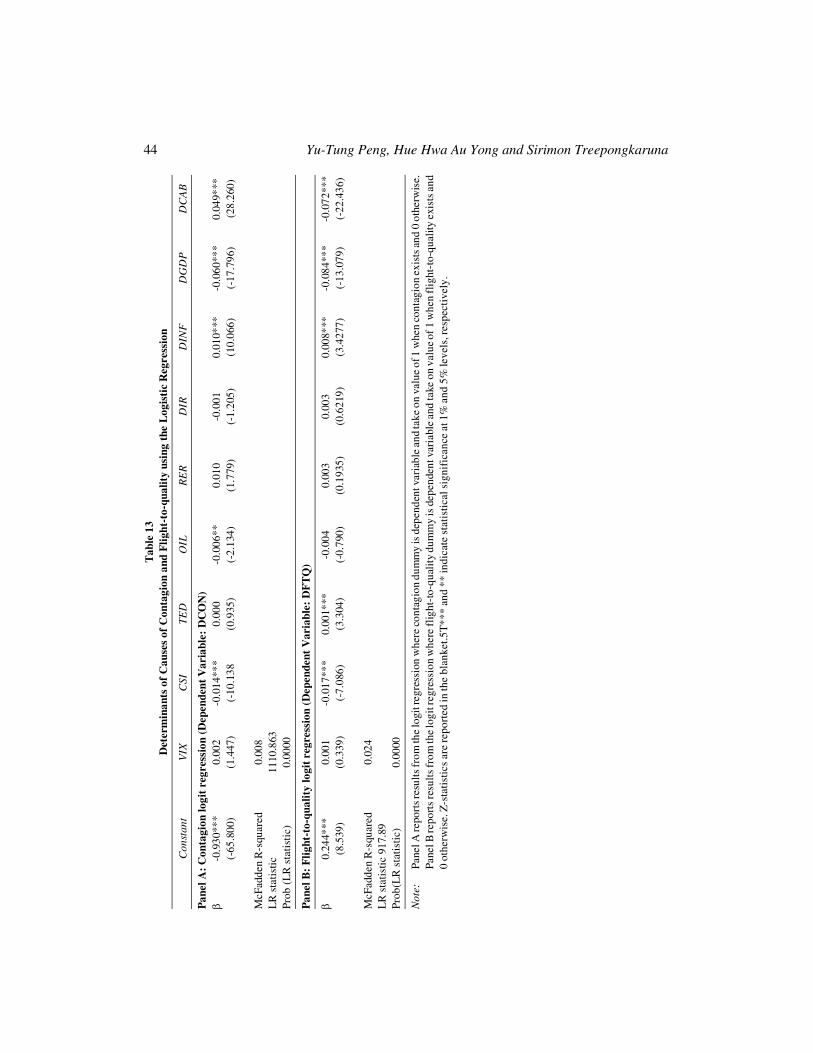
44 Yu-Tung Peng, Hue Hwa Au Yong and Sirimon TreepongkarunaT
able
13
Det
erm
inan
ts o
f C
ause
s of
Con
tagi
on a
nd F
ligh
t-to
-qua
lity
usin
g th
e L
ogis
tic
Reg
ress
ion
Con
stan
tV
IXC
SITE
DO
ILR
ER
DIR
DIN
FD
GD
PD
CA
B
Pan
el A
: C
onta
gion
logi
t re
gres
sion
(D
epen
dent
Var
iabl
e: D
CO
N)
�-0
.930
***
0.00
2-0
.014
***
0.00
0-0
.006
**0.
010
-0.0
010.
010*
**-0
.060
***
0.04
9***
(-65
.800
)(1
.447
)(-
10.1
38(0
.935
)(-
2.13
4)(1
.779
)(-
1.20
5)(1
0.06
6)(-
17.7
96)
(28.
260)
McF
adde
n R
-squ
ared
0.00
8L
R s
tatis
tic11
10.8
63Pr
ob (
LR
sta
tisti
c)0.
0000
Pan
el B
: F
ligh
t-to
-qua
lity
logi
t re
gres
sion
(D
epen
dent
Var
iabl
e: D
FT
Q)
�0.
244*
**0.
001
-0.0
17**
*0.
001*
**-0
.004
0.00
30.
003
0.00
8***
-0.0
84**
*-0
.072
***
(8.5
39)
(0.3
39)
(-7.
086)
(3.3
04)
(-0.
790)
(0.1
935)
(0.6
219)
(3.4
277)
(-13
.079
)(-
22.4
36)
McF
adde
n R
-squ
ared
0.02
4L
R s
tatis
tic91
7.89
Prob
(LR
sta
tist
ic)
0.00
00
Not
e:Pa
nel A
repo
rts r
esul
ts fr
om th
e lo
git r
egre
ssio
n w
here
con
tagi
on d
umm
y is
dep
ende
nt v
aria
ble
and
take
on
valu
e of
1 w
hen
cont
agio
n ex
ists
and
0 o
ther
wis
e.Pa
nel B
repo
rts
resu
lts fr
om th
e lo
git r
egre
ssio
n w
here
flig
ht-t
o-qu
ality
dum
my
is d
epen
dent
var
iabl
e an
d ta
ke o
n va
lue
of 1
whe
n fl
ight
-to-
qual
ity e
xist
s and
0 ot
herw
ise.
Z-s
tatis
tics
are
repo
rted
in th
e bl
anke
t.5T
***
and
** in
dica
te s
tati
stic
al s
igni
fica
nce
at 1
% a
nd 5
% le
vels
, res
pect
ivel
y.
Contagion and Flight-to-Quality: Evidences from the Asia-Pacific Economic... 45
5. SUMMARY AND CONCLUSIONS
The aim of this paper is to examine whether contagion and flight-to-quality phenomena exist instock and bond markets among the APEC countries across eight crises periods between 1995 to2010. In addition, this paper investigates the determinants of both contagion and flight-to-quality phenomena. The results show that contagion effects are present in the stock markets ofAPEC countries but only between the bond markets of US and Canada during crisis periods.Moreover, we also find evidence of flight-to-quality phenomenon from the stock market to theU.S. government bond markets during the crises. The levels of contagion and flight-to-qualityare closely associated with the severity of the crisis since they are more prominent during theAsian crisis and the GFC. During the Asian crisis and the GFC, investors withdrew funds fromstock markets due to the fear of global stock market crashes (contagion effect), and invested inthe bond market in search of a more secured return (flight-to-quality phenomenon). The resultsfrom the logit models further demonstrate that, after controlling for the fundamental economicfactors, the Consumer Sentiment Index still plays an important role in determining both thecontagion and flight-to-quality phenomena. These findings suggest that short-term policies aimedat stabilizing the economy, such as foreign exchange intervention, government guarantee onthe banking sector, can possibly limit the spread of the crisis. Our findings have severalimplications for policy makers, practitioners and investors.
For international practitioners and investors, the ability to forecast market volatility andcorrelations between asset markets is important. Our results demonstrate that during the high-stressed periods, diversification benefits within the stock markets are reduced due to contagioneffect. Our findings suggest that investors need to consider diversifying their investments acrossasset classes such as stock and bond markets, as the presence of flight-to-quality to the bondmarket can limit the losses incurred in the stock markets. For policy makers, the flight-to-quality phenomenon in APEC region reinforces the importance of establishing well-functioninglocal bond markets to limit the negative impact from financial crisis, and to foster the stabilityof capital markets in the APEC region.
REFERENCES
Abumustafa, N. I. (2006), ‘Development of an early warning model for currency crises in emerging economies:An empirical study among Middle Eastern countries’, International Journal of Management, 23(3), 403-411.
Ang, A. & Bekaert, G. (1999), ‘International asset allocation with time-varying correlations’, National Bureauof Economic Research Working Paper, No. 7056.
Bae, K-H, Karolyi, G.A. and Stulz, R.M. (2003), ‘A new approach to measuring financial contagion’, Review ofFinancial Studies, 16(3), 717-763.
Bartram, S. M. & Bodnar, G. M. (2009), ‘No place to hide: The global crisis in equity markets in 2008/2009’,Journal of International Money & Finance, 28(8), 1246-1292.
Baur, D. G. & Lucey, B. M. (2009), ‘Flights and contagion - an empirical analysis of stock-bond correlations’,Journal of Financial Stability, 5(4), 339-352.
Bollerslev, T., Engle, R. F., & Wooldridge, J. M. (1988), ‘A capital asset pricing model with time-varyingcovariances’, Journal of Political Economy, 96(1), 116.
Bordo, M., Eichengreen, B., Klingebiel, D., & Martinez-Peria, M. S. (2001), ‘Is the crisis problem growingmore severe?’, Economic Policy, 16(32), 51.
46 Yu-Tung Peng, Hue Hwa Au Yong and Sirimon Treepongkaruna
Calvo, S. & Reinhart, C. (1996), ‘Capital flows to Latin America: Is there evidence of contagion effect?’, in G.A. Calvo, M. Goldstein, & Eduard Hochreiter (eds), Private capital flows to emerging markets after theMexican crisis. Washington, DC: Institute for International Economics.
Caramazza, F., Ricci, L., & Salgado, R. (2004), ‘International financial contagion in currency crises’, Journalof International Money & Finance, 23(1), 51.
Charoenrook, A. (2005), ‘Change in consumer sentiment and aggregate stock market returns’, The Owen GraduateSchool of Management, Vanderbilt University Working Paper, No. 2002-06.
Cheung, L., Fung, L., & Tam, C. S. (2008), ‘Measuring financial market interdependence and assessing possiblecontagion risk in the EMEAP region’, Hong Kong Monetary Authority Working Paper, No. 0818.
Cheung, W., Fung, S., & Tsai, S.-C. (2010), ‘Global capital market interdependence and spillover effect ofcredit risk: evidence from the 2007-2009 global financial crisis’, Applied Financial Economics, 20(1/2),85-103.
Chiang, T. C., Jeon, B. N., & Li, H. (2007), ‘Dynamic correlation analysis of financial contagion: evidencefrom Asian markets’, Journal of International Money & Finance, 26(7), 1206-1228.
Chiang, T. C. & Zheng, D. (2010), ‘An empirical analysis of herd behavior in global stock markets’, Journal ofBanking & Finance, 34(8), 1911-1921.
Chou, R. Y., Ng, V. K., & Pi, L. (1994), ‘Cointegration of international stock market indices’, InternationalMonetary Funds Working Paper, No. 94/94.
Dasgupta, A., Leon-Gonzalez, R., Shortland, A. (2011), ‘Regionality revisited: An examination of the directionof spread of currency crises’, Journal of International Money and Finance, 30, 831-848.
Dennis, P. & Mayhew, S. (2002), ‘Risk-neutral skewness: evidence from stock options’, Journal of Financial& Quantitative Analysis, 37(3), 471-493.
Doukas, J., Hall, P. H., & Lang, L. H. P. (1999), The pricing of currency risk in Japan. Journal of Banking &Finance, 23(1), 1-20.
Dungey, M., Fry, R., González-Hermosillo, B., & Martin, V. L. (2006), ‘Contagion in global equity markets in1998: The effects of the Russian and LTCM crises’, North American Journal of Economics & Finance,18(2), 155-174.
Dungey, M., Milunovich, G., & Thorp, S. (2010), ‘Unobservable shocks as carriers of contagion’, Journal ofBanking & Finance, 34(5), 1008-1021.
Eichengreen, B., Rose, A., & Wyplosz, C. (1996), ‘Contagious currency crises: First tests’, ScandinavianJournal of Economics, 98(4), 463-484.
Engle, R. (2002), ‘Dynamic conditional correlation: a simple class of multivariate generalized autoregressiveconditional heteroskedasticity models’, Journal of Business & Economic Statistics, 20(3), 339-350.
Ewing, B. T. & Thompson, M. A. (2007), ‘Dynamic cyclical comovements of oil prices with industrial production,consumer prices, unemployment, and stock prices’, Energy Policy, 35(11), 5535-5540.
Fisher, K. L. & Statman, M. (2003), ‘Consumer confidence and stock returns’, Journal of Portfolio Management,30(1), 115.
Fleming, J., Kirby, C., & Ostdiek, B. (2003), ‘The economic value of volatility timing using “realized” volatility’,Journal of Financial Economics, 67(3), 473-509.
Forbes, K. J. & Rigobon, R. (2002), ‘No contagion, only interdependence: measuring stock market comovements’,Journal of Finance, 57(5), 2223-2261.
Fry, R., Hsiao, Y.-L., & Tang, C. (2010), ‘A comparison of seven crises: coskewness contagion testing’, Workingpaper, Australia National University.
Griffin, J. M. & Stulz, R. M. (2001), International competition and exchange rate shocks: a cross-countryindustry analysis of stock returns. Review of Financial Studies, 14(1).
Gulko, L. (2002), ‘Decoupling’, Journal of Portfolio Management, 28(3), 59-66.
Contagion and Flight-to-Quality: Evidences from the Asia-Pacific Economic... 47
Haile, F., & Pozo, S. (2008), ‘Currency crisis contagion and the identification of transmission channels’,International Review of Economics & Finance, 17(4), 572-588.
Hamilton, J. D. (1989), ‘A new approach to the economic analysis of nonstationary time series and the businesscycle’, Econometrica, 57(2), 357-384.
Han, K. C., Lee, S. H., & Suk, D. Y. (2003), ‘Mexican peso crisis and its spillover effects to emerging marketdebt’, Emerging Markets Review, 4, 310-326.
Hartmann, P., Straetmans, S., & de Vries, C. G. (2004), ‘Asset market linkages in crisis periods’, Review ofEconomics & Statistics, 86, 313-326.
Huang, R. D. & Masulis, R. W. (1996), Energy shocks and financial markets. Journal of Futures Markets,16(1), 1-27.
Hunter, D. M. & Simon, D. P. (2004), ‘Benefits of international bond diversification’, Journal of Fixed Income,13, 57-72.
Ilmanen, A. (2003), ‘Stock-bond correlations’, Journal of Fixed Income, 13(2), 55-66.
Johnson, R. & Soenen, L. (2002), ‘Asian economic integration and stock market comovement’, Journal ofFinancial Research, 25(1), 141-157.
Kallberg, J. G., Liu, C. H., & Pasquariello, P. (2005), ‘An examination of the Asian crisis: regime shifts incurrency and equity markets’, Journal of Business, 78(1), 169-211.
Kaminsky, G.L. and Reinhard, C.M. (2002), ‘Financial markets in times of stress’, Journal of DevelopmentEconomics, 69, 451-470.
Khan, S. & Park, K. W. (2009), ‘Contagion in the stock markets: The Asian financial crisis revisited’, Journalof Asian Economics, 20(5), 561-569.
King, M. A. & Wadhwani, S. (1990), ‘Transmission of volatility between stock markets’, Review of FinancialStudies, 3(1), 5-33.
Lahrech, A. and Sylwester, K. (2011), ‘US and Latin American stock market linkages’, Journal of InternationalMoney & Finance, 30, 1341-1357.
Lashgari, M. (2000), ‘The role of TED Spread and Confidence Index in explaining the behavior of stockprices’, American Business Review, 18(2), 9-11.
Lucey, B. and Sevic, A. (2010), ‘Investigating the determinants of banking sector coexceedances in Europe inthe summer of 2008’, Journal of International Financial Markets, Insitutions & Money, 20, 275-283.
Mathur, I., Gleason, K. C., Dibooglu, S., & Singh, M. (2002), ‘Contagion effects from the 1994 Mexican pesocrisis: evidence from Chilean stocks’, Financial Review, 37(1), 17.
Morana, C. (2008), ‘International stock markets comovements: the role of economic and financial integration’,Empirical Economics, 35(2), 333-359.
Moser, T. (2003), ‘What is international financial contagion?’, International Finance, 6(2), 157-178.
Patro, D. K., Wald, J. K., & Wu, Y. (2002), Explaining exchange rate risk in world stock markets: A panelapproach. Journal of Banking & Finance, 26(10), 1951.
Salvatore, D. (1998), ‘Capital flows, current account deficits, and financial crises in emerging market economies’,International Trade Journal, 12(1), 5-22.
Solnik, B., Boucrelle, C., & Fur, Y. L. (1996), ‘International market correlation and volatility’, FinancialAnalysts Journal, 52(5), 17-34.
Whaley, R. E. (2000), ‘The investor fear gauge’, Journal of Portfolio Management, 26(3), 12-17.
Yiu, M. S., Ho, W.-Y. A., & Choi, D. F. (2010), ‘Dynamic correlation analysis of financial contagion in Asianmarkets in global financial turmoil’, Applied Financial Economics, 20(4), 345-354.
Yu, I.-W., Fung, K.-P., Tam, C.-S. (2010),‘Assessing financial market integration in Asia- Equity markets’,Journal of Banking and Finance, 34, 2874-2885.