Embed Size (px)
Citation preview
1
Defra Research Project Final Report
Defra Project Code: SP1001 Project Title: Contaminated Land Remediation
Contractor Organisation: CL:AIRE 7th Floor
1 Great Cumberland Place London W1H 7AL Total Defra Project Costs: £35,100 (agreed fixed price) Project Start Date: 4th January 2010 Project End Date: 29th November 2010
2
EXECUTIVE SUMMARY
Remediation of contaminated land can be an expensive and technically difficult process. There are a range of different remediation techniques to address both the wide variety of potential contaminants and the differing conditions on each site. In the past, the contaminated land sector has tended to rely primarily on heavy engineering solutions which typically offer relatively quick-fix solutions, but can be very expensive and have high environmental and social impacts. In many cases heavy engineering solutions are the only realistic option, but in other cases less impactful ways of dealing with risks may be suitable. For example, some sites are suitable for soil-treating techniques such as bioremediation, and in other cases it is possible to deal with the risks without treating the soil (e.g. using fencing to prevent access to a site). This research aims to summarise the current understanding and utilisation of different contaminated land remediation techniques, to identify current and likely future factors influencing their selection and to set out the relative economic, environmental and social costs and benefits (i.e. the sustainability) of each technique. The contaminated land sector in the UK and elsewhere is looking at ways to improve remediation working practices, including how sustainability is measured and considered during remediation. This thinking includes how to rely less on excavation and removal techniques that involve disposing of large amounts of contaminated soil in landfills and to reuse material wherever possible, thus protecting the use of natural resources and protecting soil which is a valued resource. Much of these improved working practices are tied up with the concept of sustainability and therefore the understanding of what sustainability means in the context of remediation and how it can be measured is extremely important. The UK Sustainable Remediation Forum (SuRF-UK) framework document provides a mechanism for practitioners to undertake sustainability assessments using an agreed methodology. This research complements the work being conducted by SuRF-UK and will be useful for SuRF-UK’s Phase 2 work, which is looking at real case studies measuring sustainability. An assessment of the environmental, social and economic impacts and benefits (i.e. the sustainability) of selected remediation techniques was carried out. This was undertaken by evaluating which sustainability indicators could be used at a technology specific level, and using them to qualitatively assess each selected remediation technique. If required, the assessment could be used to undertake a semi-quantitative assessment using scoring systems and impact weightings. A desk-based study was carried out to compile information on remediation techniques from a number of sources, presented as 21 Technology Profiles. Brief descriptions of each technique are given in addition to describing the effectiveness of each of these methods in addressing different contaminants and when circumstances (e.g. geology, hydrogeology, contaminant form etc) may or may not be suitable to their use. The study also describes the advantages and disadvantages of each technique and the barriers to their use. A study was undertaken to compile information on the typical costs of remediation techniques utilising information that is already available and from the most up-to-date information available from practitioners within the contaminated land sector. A literature search identified that there is limited research which addresses the issue of remediation costs. The main reason for this is because remediation costs are strongly site-specific and dependent upon the details of a number of different aspects such as the geological, hydrogeological and chemical data available from the site investigation at an individual site. The costs are also strongly influenced by how stringent the remedial targets are which in turn affects the duration. From an analysis of the cost data from the industry questionnaire no broad conclusions could be drawn that either in situ or ex situ treatment methods were more costly or had more variable costs. It was observed that costs generally decreased for higher volumes of material treated (>5000 m3) and this effect was displayed strongly for permeable reactive barriers, ex situ thermal desorption and soil washing. This is a trend that may be expected as these technologies generally have considerable mobilisation/initialisation costs making them a more cost-effective option where larger volumes are required.
3
Another notable trend is that for a number of remediation techniques the variance in costs decreased for volumes greater than 5000 m3. This trend is again perhaps to be expected as average costs per m3 should be better constrained for larger volumes where the considerable mobilisation/initialisation costs are averaged across larger volumes. A desk-based study was also conducted using a number of different resources to collect data on the current and historic usage of each remedial technique in the UK, supplemented by the industry questionnaire. The research also investigated emerging and potential remediation techniques in order to identify areas for potential further research and development, which may also attract investment, both of which will be of benefit to UK plc. In the review of techniques that are currently under development, whether they are near-market or had only limited applications in the UK, it was noted that a number of collaborative research and development and applied research projects were still ongoing and had yet to disseminate their results. Therefore, it is difficult to assess the potential benefits that they might bring to the remediation industry at this stage. The work in this project has been reviewed by the CL:AIRE Technology and Research Group, an independent group of experts in contaminated land remediation, and the sustainability aspects have been reviewed by the SuRF-UK Steering Group. This report presents the findings of this work and will be disseminated to the whole contaminated land stakeholder community.
4
ACKNOWLEDGEMENTS CL:AIRE would like to thank the following organisations which took the time and effort to complete the industry questionnaire (in alphabetical order): Technology vendors Bilfinger Berger Environmental Churngold Remediation DEC NV Ecologia Environmental Solutions ERS Provectus Group QDS Remedx RAW VHE Construction WSP Remediation Environmental consultants Arcadis CH2M Hill Entec ERM Parsons Brinckerhoff URS Corporation WorleyParsons CL:AIRE would like to acknowledge the support of Davis Langdon in preparation of the cost assessment part of this work. Finally, CL:AIRE would like the thank the members of the CL:AIRE Technology and Research Group and SuRF-UK Steering Group for reviewing and commenting on the Milestone Reports on which this final report is based. CL:AIRE Technology and Research Group: Mr Mike Pearl – Babcock International Group Mr Mike Summersgill – RSK Ltd Dr Brian Bone – Environment Agency Dr John Campbell – SAC Associates Professor Max Coleman – Caltech Mr Steve Edgar – Vertase FLI Dr Theresa Kearney – Department of the Environment, Northern Ireland Professor David Lerner – University of Sheffield Professor Andy Moffat – Forest Research Professor Phil Morgan – The Sirius Group Dr Mike Rivett – University of Birmingham Professor Jonathan Smith – Shell Global Solutions SuRF-UK Steering Group: Ms Nicola Harries – CL:AIRE Professor Jonathan Smith – Shell Global Solutions through the Soil and Groundwater Technology Association Mr Frank Evans – National Grid through the Soil and Groundwater Technology Association Dr Brian Bone – Environment Agency Professor Paul Bardos – r3 Environmental Technology Ltd Dr Richard Boyle – Homes and Communities Agency Dr David Ellis – DuPont and SURF USA
5
CONTENTS Executive Summary 2 Acknowledgements 4 Contents 5 Introduction
Background and context Aims and objectives
6
1. An overview of the understanding of remediation techniques 1.1 Introduction 1.2 Treatment profiles for in situ techniques 1.3 Treatment profiles for ex situ techniques 1.4 Treatment profile for civil engineering-based methods
7
2. An environmental, social and economic impact assessment of remediation techniques 2.1 Introduction 2.2 Headline indicators, suitability for remediation technology selection and definitions 2.3 In situ remediation technology impact tables 2.4 Ex situ remediation technology impact tables
35
3. A cost assessment of remediation techniques 3.1 Introduction 3.2 Remediation technique questionnaire 3.3 Data analysis and presentation of the results 3.4 Summary and discussion
70
4. Status of the use of remediation techniques in the UK 4.1 Introduction 4.2 Current and historic usage of remediation techniques 4.3 Drivers for technique selection 4.4 Status of sustainability measurement in remediation 4.5 Future remediation practices
86
Discussion and conclusions 106 References 109 Appendices
Appendix 1: List of remediation techniques mentioned in Section 1 of the report Appendix 2: CL:AIRE Remediation Technique Questionnaire Appendix 3: CL:AIRE Technology Demonstrations Projects
6
INTRODUCTION Background and context The UK has a considerable legacy of land contamination. Such land may be remediated in response to various drivers. For example, landowners may wish to remediate voluntarily to raise the value of land or to reduce potential liabilities. Remediation may be required as land is being re/developed under the planning system and therefore changing the land use; or there may be direct regulatory requirement to remediate (e.g. if land has been determined as contaminated land under Part 2A of the Environmental Protection Act 1990). Remediation of contaminated land can be an expensive and technically difficult process. The contaminated land industry, both in the UK and worldwide, has developed a range of different remediation techniques to address both the wide variety of potential contaminants and the differing conditions on each site. In the past, the contaminated land sector has tended to rely primarily on heavy engineering solutions. These techniques usually offer relatively quick-fix solutions which can be very expensive and have high environmental and social impacts. In many cases heavy engineering solutions are the only realistic option, but in other cases less impactful ways of dealing with risks may be suitable. For example, some sites are suitable for soil-treating techniques such as bioremediation, and in other cases it is possible to deal with the risks without treating the soil (e.g. using fencing to prevent access to a site).
The contaminated land sector in the UK and elsewhere is looking at ways to improve remediation working practices, including how sustainability is measured and considered during remediation, how to rely less on excavation and removal techniques that involve disposing of large amounts of contaminated soil in landfills and to reuse material wherever possible, thus protecting the use of natural resources and protecting soil which is a finite resource. Much of these improved working practices are tied up with the concept of sustainability and therefore the understanding of what sustainability means in the context of remediation and how it can be measured is extremely important. The UK Sustainable Remediation Forum (SuRF-UK) framework document (SuRF-UK, 2010) provides a mechanism for practitioners to start to undertake sustainability assessments using an agreed methodology. This research complements the work being conducted by SuRF-UK and will be useful for SuRF-UK’s Stage 2 work, which is looking at real case studies measuring sustainability.
This research seeks to improve the knowledge of the costs and benefits (environmental, social and economic) of the variety of remediation techniques available in the UK, with the aim of working to encourage “smarter” remediation solutions to be used in practice. Aims and objectives The aims of this research are to summarise the current understanding and utilisation of different contaminated land remediation techniques, to identify current and likely future factors influencing their selection and to set out the relative economic, environmental and social costs and benefits (i.e. the sustainability) of each technique. The six objectives of this research are to: 1. Provide an overview of the understanding of remediation techniques 2. Conduct an environmental and social impact assessment of remediation techniques 3. Conduct a cost assessment of remediation techniques 4. Design two questionnaires to survey (i) technology providers and (ii) environmental consultants 5. Assess the status of the use of remediation techniques in England and Wales 6. Provide a written summary report and disseminate the results
7
1. AN OVERVIEW OF THE UNDERSTANDING OF REMEDIATION TECHNIQUES
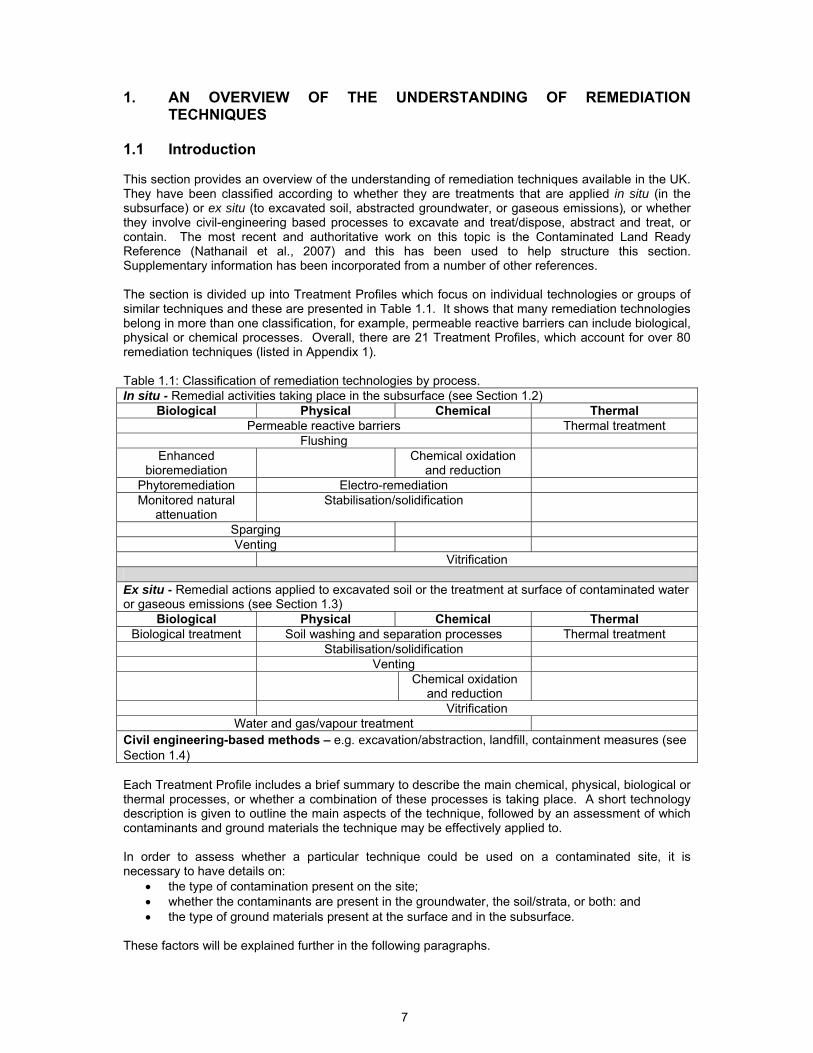
1.1 Introduction This section provides an overview of the understanding of remediation techniques available in the UK. They have been classified according to whether they are treatments that are applied in situ (in the subsurface) or ex situ (to excavated soil, abstracted groundwater, or gaseous emissions), or whether they involve civil-engineering based processes to excavate and treat/dispose, abstract and treat, or contain. The most recent and authoritative work on this topic is the Contaminated Land Ready Reference (Nathanail et al., 2007) and this has been used to help structure this section. Supplementary information has been incorporated from a number of other references. The section is divided up into Treatment Profiles which focus on individual technologies or groups of similar techniques and these are presented in Table 1.1. It shows that many remediation technologies belong in more than one classification, for example, permeable reactive barriers can include biological, physical or chemical processes. Overall, there are 21 Treatment Profiles, which account for over 80 remediation techniques (listed in Appendix 1). Table 1.1: Classification of remediation technologies by process. In situ - Remedial activities taking place in the subsurface (see Section 1.2)
Biological Physical Chemical Thermal Permeable reactive barriers Thermal treatment
Flushing Enhanced
bioremediation Chemical oxidation
and reduction
Phytoremediation Electro-remediation Monitored natural
attenuation Stabilisation/solidification
Sparging Venting
Vitrification
Ex situ - Remedial actions applied to excavated soil or the treatment at surface of contaminated water or gaseous emissions (see Section 1.3)
Biological Physical Chemical Thermal Biological treatment Soil washing and separation processes Thermal treatment
Stabilisation/solidification Venting Chemical oxidation
and reduction
Vitrification Water and gas/vapour treatment
Civil engineering-based methods – e.g. excavation/abstraction, landfill, containment measures (see Section 1.4) Each Treatment Profile includes a brief summary to describe the main chemical, physical, biological or thermal processes, or whether a combination of these processes is taking place. A short technology description is given to outline the main aspects of the technique, followed by an assessment of which contaminants and ground materials the technique may be effectively applied to. In order to assess whether a particular technique could be used on a contaminated site, it is necessary to have details on:
• the type of contamination present on the site; • whether the contaminants are present in the groundwater, the soil/strata, or both: and • the type of ground materials present at the surface and in the subsurface.
These factors will be explained further in the following paragraphs.
8
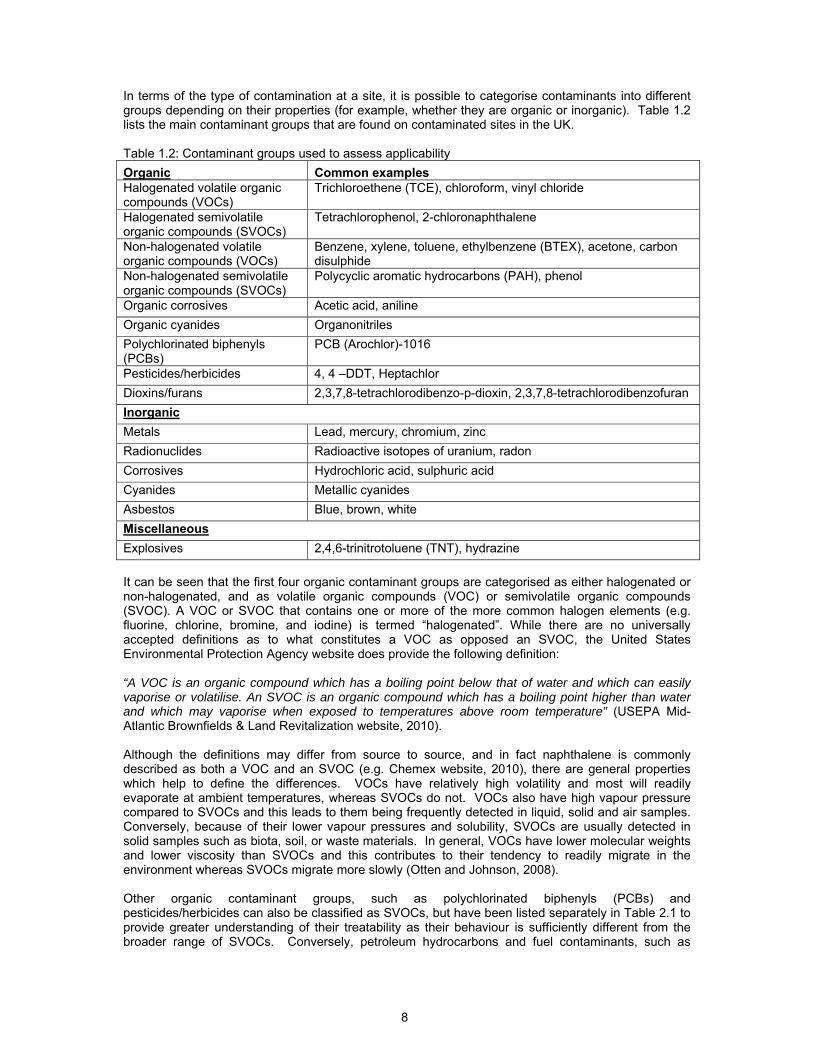
In terms of the type of contamination at a site, it is possible to categorise contaminants into different groups depending on their properties (for example, whether they are organic or inorganic). Table 1.2 lists the main contaminant groups that are found on contaminated sites in the UK. Table 1.2: Contaminant groups used to assess applicability Organic Common examples Halogenated volatile organic compounds (VOCs)
Trichloroethene (TCE), chloroform, vinyl chloride
Halogenated semivolatile organic compounds (SVOCs)
Tetrachlorophenol, 2-chloronaphthalene
Non-halogenated volatile organic compounds (VOCs)
Benzene, xylene, toluene, ethylbenzene (BTEX), acetone, carbon disulphide
Non-halogenated semivolatile organic compounds (SVOCs)
Polycyclic aromatic hydrocarbons (PAH), phenol
Organic corrosives Acetic acid, aniline Organic cyanides Organonitriles Polychlorinated biphenyls (PCBs)
PCB (Arochlor)-1016
Pesticides/herbicides 4, 4 –DDT, Heptachlor Dioxins/furans 2,3,7,8-tetrachlorodibenzo-p-dioxin, 2,3,7,8-tetrachlorodibenzofuran Inorganic Metals Lead, mercury, chromium, zinc Radionuclides Radioactive isotopes of uranium, radon Corrosives Hydrochloric acid, sulphuric acid Cyanides Metallic cyanides Asbestos Blue, brown, white Miscellaneous Explosives 2,4,6-trinitrotoluene (TNT), hydrazine It can be seen that the first four organic contaminant groups are categorised as either halogenated or non-halogenated, and as volatile organic compounds (VOC) or semivolatile organic compounds (SVOC). A VOC or SVOC that contains one or more of the more common halogen elements (e.g. fluorine, chlorine, bromine, and iodine) is termed “halogenated”. While there are no universally accepted definitions as to what constitutes a VOC as opposed an SVOC, the United States Environmental Protection Agency website does provide the following definition: “A VOC is an organic compound which has a boiling point below that of water and which can easily vaporise or volatilise. An SVOC is an organic compound which has a boiling point higher than water and which may vaporise when exposed to temperatures above room temperature” (USEPA Mid-Atlantic Brownfields & Land Revitalization website, 2010). Although the definitions may differ from source to source, and in fact naphthalene is commonly described as both a VOC and an SVOC (e.g. Chemex website, 2010), there are general properties which help to define the differences. VOCs have relatively high volatility and most will readily evaporate at ambient temperatures, whereas SVOCs do not. VOCs also have high vapour pressure compared to SVOCs and this leads to them being frequently detected in liquid, solid and air samples. Conversely, because of their lower vapour pressures and solubility, SVOCs are usually detected in solid samples such as biota, soil, or waste materials. In general, VOCs have lower molecular weights and lower viscosity than SVOCs and this contributes to their tendency to readily migrate in the environment whereas SVOCs migrate more slowly (Otten and Johnson, 2008). Other organic contaminant groups, such as polychlorinated biphenyls (PCBs) and pesticides/herbicides can also be classified as SVOCs, but have been listed separately in Table 2.1 to provide greater understanding of their treatability as their behaviour is sufficiently different from the broader range of SVOCs. Conversely, petroleum hydrocarbons and fuel contaminants, such as
9
benzene and phenol are included in the non-halogenated VOC and SVOC contaminant groupings as they exhibit behaviour typical of these groups. Although using the contaminant categories in Table 2.1 provides a useful starting point for assessing the appropriateness of remediation techniques, it is a simplification of what in reality is likely to be a much more complicated scenario. Determining whether a technique is applicable to a particular contaminant group can rarely be completely accurate and there are several reasons for this which are explored below. Due to this uncertainty, the assessments provided in Sections 1.2 and 1.3 are based on three descriptive categories: whether there is strong potential applicability, whether there may be some applicability under certain conditions, or if the technique is not suitable. Many contaminated sites will contain more than one contaminant category and when this is the case the applicability of a technique should be assessed for each category separately in order to assess which technique might be applicable. However, this does not take into account whether the presence of one type of contaminant will affect the degree to which another may be remediated. Even within the same contaminant group there can be variation in the applicability of a treatment technique. For example, low molecular weight polycyclic aromatic hydrocarbons (PAHs) are more amenable to biodegradation than heavier molecular weight PAHs, yet both are categorised as non-halogenated SVOCs. There are also instances when a treatment technique may be applicable to a contaminant group in theoretical terms or even demonstrated at laboratory-scale, but there are practical reasons why it has not been applied on site, such as health and safety concerns or scaling-up issues in implementing the technique. The Treatment Profiles also assess each technique for its applicability to the ground materials (e.g. soil types) to be treated. Ground materials can be described as coarse, fine or organic depending on the size and type of their constituent components. Coarse materials are those that contain more than 65% sand and gravel sizes, whereas fine materials contain over 35% silt and clay sizes (British Standards Institution, 1999). An example of an organic soil is peat. The Treatment Profiles assess the main potential advantages and limitations to the technique. However, remediation timescale (Tables 1.2 and 1.3) and costs (Section 3) are covered separately in this report. The maturity and availability of each of the techniques is not included in the individual Treatment Profiles. However, according to Nathanail et al., (2007), which comments on the relative availability of techniques in the UK, the following are considered “widely available”: venting, sparging, flushing, pump and treat, in situ bioremediation, and ex situ bioremediation. These techniques are considered “available”: permeable reactive barriers, chemical oxidation and reduction, monitored natural attenuation and soil washing. Thermal treatment is quoted as being available from several suppliers, and stabilisation/solidification is generally available, depending on the binder used. Electro-remediation and phytoremediation are listed as emerging techniques with growing availability. The authors do not define what is meant by the terms “widely available” and “available”, but they can be used as a relative measure of usage from those that are commonly applied to those that have fewer reported instances of success. Although the report of Nathanail et al., (2007) is three years old it is not felt that the availability of remediation techniques has altered considerably. This is corroborated by further discussion of the status of techniques provided in Section 4 of this report. Finally, it is worth mentioning that the information provided in the Treatment Profiles is the first step to understanding the suitability of a particular technique to a particular contaminated site. The applicability of all potential techniques must be further investigated in practice by employing appropriately skilled personnel, performing bench, pilot and treatability testing where appropriate and considering each site on a case-by-case basis. The final assessment will include costs, track record, sustainability (environmental, social, economic) impacts and availability of equipment. 1.2 Treatment Profiles for In Situ Techniques In situ methods are those that take place in the subsurface, without excavation of the contaminated soil or abstraction of groundwater. The main advantages of in situ methods are that they can often
10
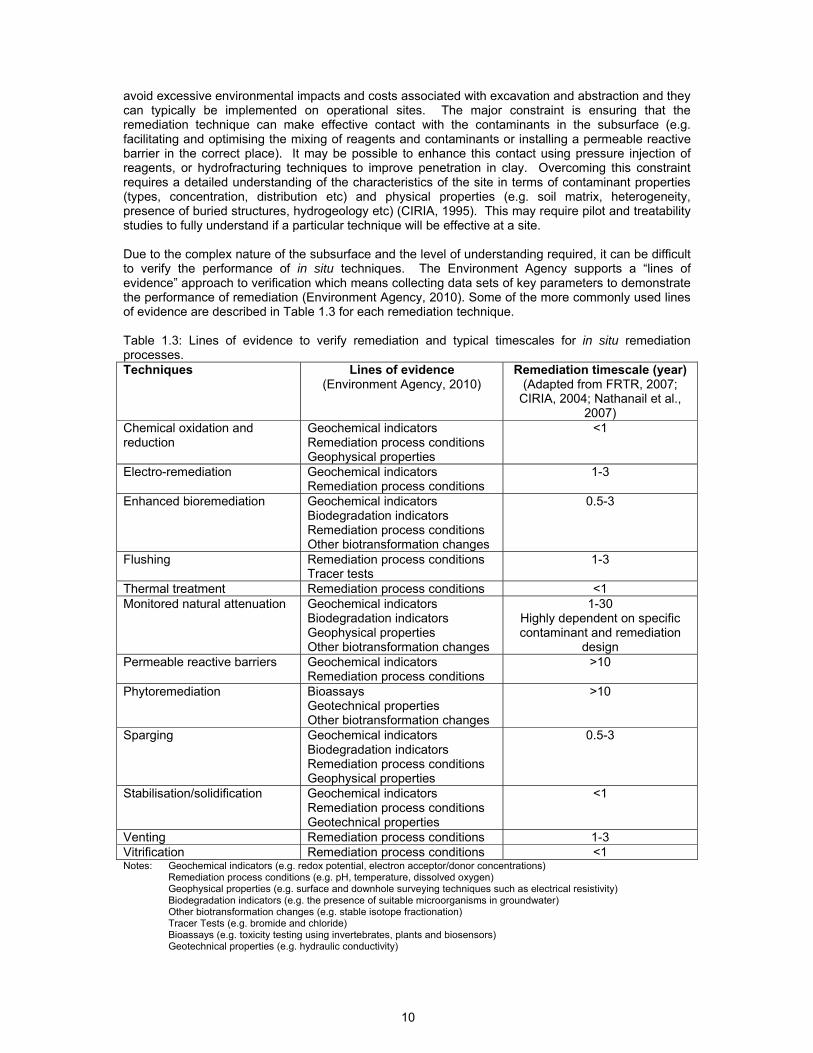
avoid excessive environmental impacts and costs associated with excavation and abstraction and they can typically be implemented on operational sites. The major constraint is ensuring that the remediation technique can make effective contact with the contaminants in the subsurface (e.g. facilitating and optimising the mixing of reagents and contaminants or installing a permeable reactive barrier in the correct place). It may be possible to enhance this contact using pressure injection of reagents, or hydrofracturing techniques to improve penetration in clay. Overcoming this constraint requires a detailed understanding of the characteristics of the site in terms of contaminant properties (types, concentration, distribution etc) and physical properties (e.g. soil matrix, heterogeneity, presence of buried structures, hydrogeology etc) (CIRIA, 1995). This may require pilot and treatability studies to fully understand if a particular technique will be effective at a site. Due to the complex nature of the subsurface and the level of understanding required, it can be difficult to verify the performance of in situ techniques. The Environment Agency supports a “lines of evidence” approach to verification which means collecting data sets of key parameters to demonstrate the performance of remediation (Environment Agency, 2010). Some of the more commonly used lines of evidence are described in Table 1.3 for each remediation technique. Table 1.3: Lines of evidence to verify remediation and typical timescales for in situ remediation processes. Techniques Lines of evidence
(Environment Agency, 2010) Remediation timescale (year)
(Adapted from FRTR, 2007; CIRIA, 2004; Nathanail et al.,
2007) Chemical oxidation and reduction
Geochemical indicators Remediation process conditions Geophysical properties
<1
Electro-remediation Geochemical indicators Remediation process conditions
1-3
Enhanced bioremediation Geochemical indicators Biodegradation indicators Remediation process conditions Other biotransformation changes
0.5-3
Flushing Remediation process conditions Tracer tests
1-3
Thermal treatment Remediation process conditions <1 Monitored natural attenuation Geochemical indicators
Biodegradation indicators Geophysical properties Other biotransformation changes
1-30 Highly dependent on specific contaminant and remediation
design Permeable reactive barriers Geochemical indicators
Remediation process conditions >10
Phytoremediation Bioassays Geotechnical properties Other biotransformation changes
>10
Sparging
Geochemical indicators Biodegradation indicators Remediation process conditions Geophysical properties
0.5-3
Stabilisation/solidification Geochemical indicators Remediation process conditions Geotechnical properties
<1
Venting Remediation process conditions 1-3 Vitrification Remediation process conditions <1 Notes: Geochemical indicators (e.g. redox potential, electron acceptor/donor concentrations)
Remediation process conditions (e.g. pH, temperature, dissolved oxygen) Geophysical properties (e.g. surface and downhole surveying techniques such as electrical resistivity) Biodegradation indicators (e.g. the presence of suitable microorganisms in groundwater) Other biotransformation changes (e.g. stable isotope fractionation) Tracer Tests (e.g. bromide and chloride) Bioassays (e.g. toxicity testing using invertebrates, plants and biosensors) Geotechnical properties (e.g. hydraulic conductivity)
11
Primary evidence will normally be based on a reduction in contaminant concentration, using accredited laboratory data, however, additional lines of evidence are often needed to provide more certainty in the remediation outcome. Furthermore, as monitoring and sampling over extended time periods may be necessary to demonstrate remediation success, the timescales for in situ remediation techniques, also shown in Table 1.3, are generally longer than ex situ techniques (see page 24). Treatment Profiles are presented in the proceeding pages for the following in situ remediation techniques: • Chemical oxidation and reduction • Electro-remediation • Enhanced bioremediation using redox amendments • Flushing • Monitored natural attenuation • Permeable reactive barriers • Phytoremediation • Sparging • Stabilisation/solidification • Thermal Treatment • Venting • Vitrification
12
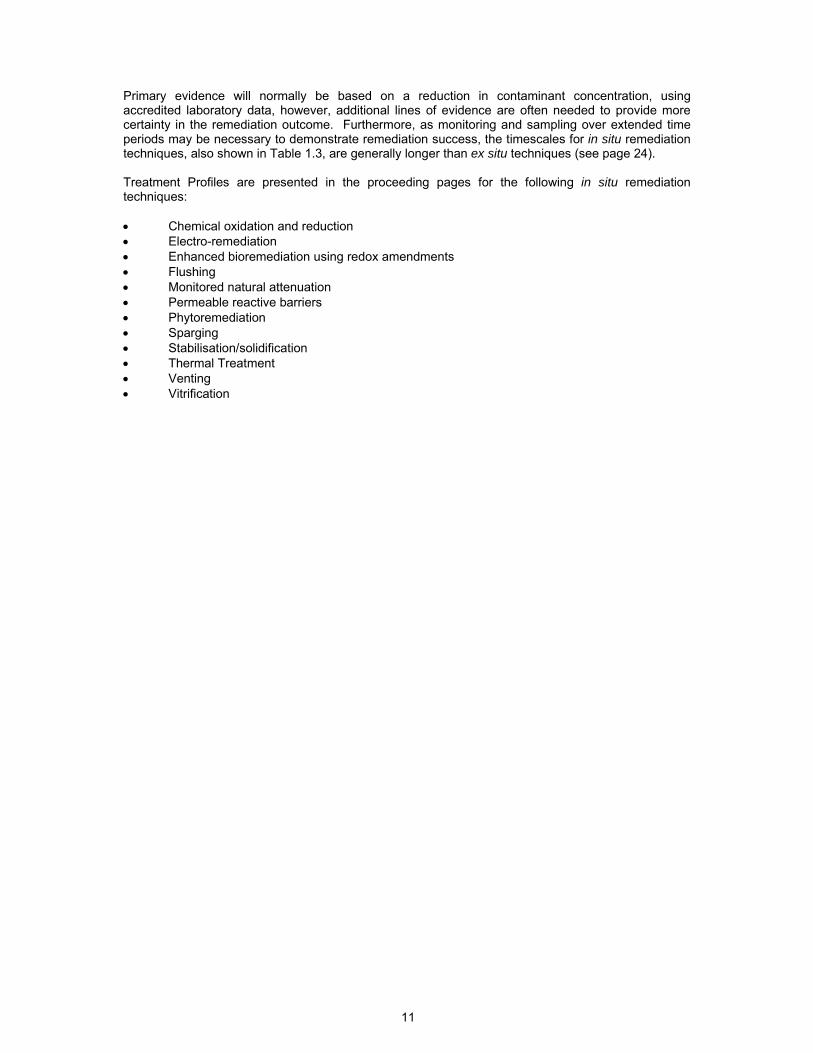
Technology name: Chemical oxidation and reduction
Similar processes, synonyms and process variations
Fenton’s reagent, ozone, permanganate, sodium persulphate, sodium percarbonate, dechlorination, zero-valent iron, in situ chemical oxidation (ISCO)
Brief summary: In situ chemical method involving addition of chemicals to soil or groundwater to oxidise or reduce the contaminants thereby degrading them, reducing their toxicity, changing their solubility, or increasing their susceptibility to other forms of treatment.
Technology description: Chemical oxidation involves the injection of liquid or gaseous oxidising agents (or oxidants) to the subsurface to bring about the rapid degradation of many organic contaminants. Some organic compounds will undergo partial degradation and can then be treated by other methods, such as bioremediation. Arsenic (As) may also be oxidised from As(III) to As(V), however, as the latter is more harmful, additional techniques will be required in order to complete the remediation. Typical oxidants include the following: Fenton’s reagent: hydrogen peroxide with a ferrous iron (Fe 2+) catalyst produces highly reactive free radical species. Permanganate (MnO4
-): can oxidise contaminants by direct electron transfer or via free radial species. Ozone (O3): can oxidise contaminants directly or via free radical species. Sodium persulphate and sodium percarbonate are also used. Chemical reduction involves the addition of reducing agents (reductants) to degrade chlorinated solvents and reduce the toxicity of metals. Typical reductants include the following: Zero valent iron: although commonly used as the reactive material in permeable reactive barriers, zero valent iron can be added to soil by mixing or injected as nanoparticles (still at demonstration stage); Polysulphides: used in the reduction of metals to less lower toxicity forms (e.g. chromium (VI) to chromium (III)).
Applicability to contaminants and ground materials Organic Inorganic Materials Halogenated VOCs Y Metals ? Gravel >2mm Y Halogenated SVOCs Y Radionuclides N Sand 0.06-2mm Y Non-halogenated VOCs Y Corrosives ? Silt 2-60µm Y Non-halogenated SVOCs Y Cyanides ? Clay <2µm ? Organic corrosives N Asbestos N Peat N Organic cyanides N
PCBs Y Miscellaneous Key Pesticides/herbicides ? Explosives ? Usually or potentially applicable Y Dioxins/furans N May be applicable ? Not applicable N
Potential advantages: • reactions are fast and can result in complete
degradation; • applicable to a wide range of organic contaminants; • uses reagents that are considered low cost and easily
delivered to the subsurface.
Limitations: • may require large volumes of reagent; • environmental considerations as using aggressive
reagents; • toxic intermediate breakdown products may be
formed; • groundwater may be coloured by reagents (e.g.
permanganate is purple in solution); • precipitation reactions may be reversible with
changes in redox conditions over time; • may be difficult to facilitate contact between
contaminants and reagents in the treatment zone.
References: Nathanail et al., 2007; EA Remediation Position Statements, 2006; FRTR, 2007; Princeton Chemistry and Environment, 2003.
13
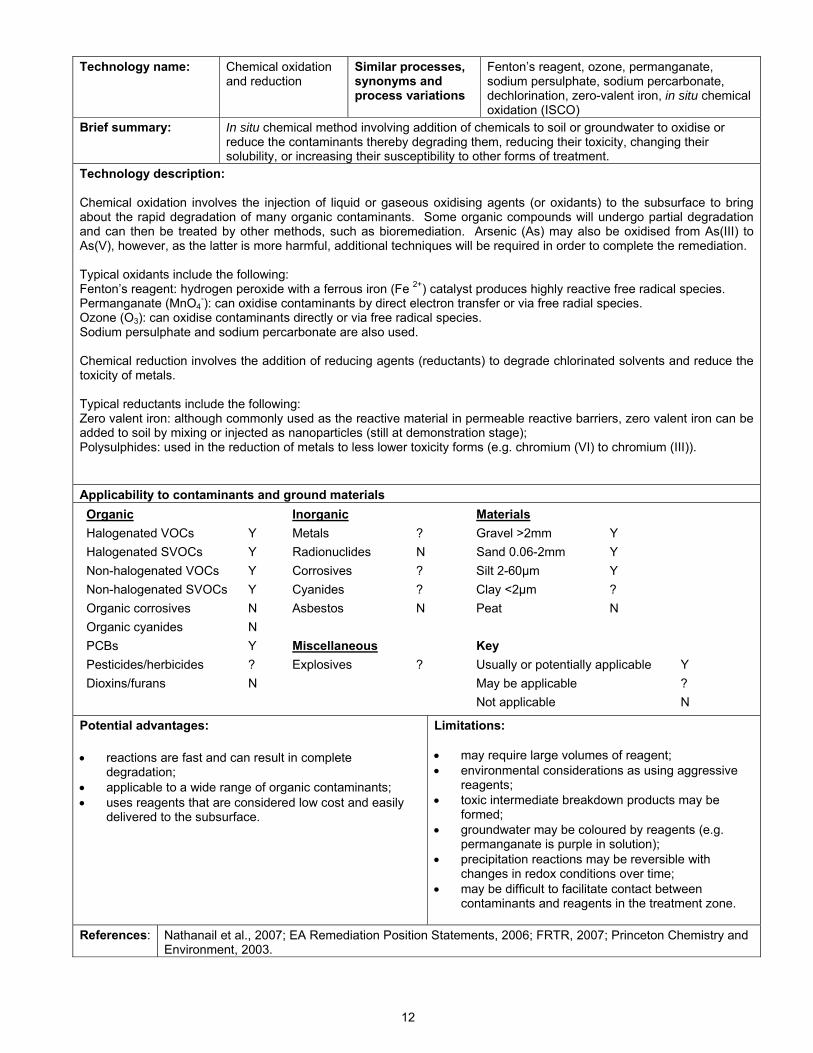
Technology name: Electro-remediation Similar processes, synonyms and process variations
Electro-kinetic techniques, electro-chemical techniques, electric current methods, electro-migration
Brief summary: In situ physical/chemical method involves using an electric field to move contaminants and water and also to bring about chemical reactions at electrodes.
Technology description: Electro-remediation uses electro-chemical and electro-kinetic processes to remove metals, radionuclides and organic contaminants from saturated or unsaturated clay-rich soils, sludges, and sediments. It is principally a separation and removal technique which involves the application of a low intensity direct current across electrode pairs that have been implanted in the ground on each side of a contaminated soil mass. This mobilises charged species, causing ions and water to move toward the electrodes. Metal ions, ammonium ions, and positively charged organic compounds move toward the cathode. Anions such as chloride and negatively charged organic compounds move toward the anode. Three mechanisms transport contaminants through the soil towards one electrode or the other: electromigration, electroosmosis and electrophoresis. In electromigration, ions and ion complexes are transported towards an electrode, in electroosmosis, a liquid (typically water) containing ions is moved relative to a stationary charged surface, and electrophoresis refers to the movement of charged particles. Once contaminants, principally metals, have been transported by electromigration toward the respective electrodes they can be removed and treated. This can occur by electroplating at the electrode; precipitation or co-precipitation at the electrode; pumping of water near the electrode above ground for ex situ treatment, or capture on ion exchange resins which are emplaced in the ground. The direction and rate of movement of an ionic species will depend on its charge, both in magnitude and polarity, as well as the magnitude of the electroosmosis-induced flow velocity. Non-ionic species, both inorganic and organic, will also be transported along with the electroosmosis induced water flow. Electroosmosis can be used to transport organic contaminants backwards and forwards through treatment zones placed between electrodes, so that the contaminants do not need to be removed. The polarity of the electrodes is reversed periodically, which changes the direction of the contaminants movement. Other uses of electro-remediation include promoting chemical reactions such as precipitation of an iron-rich band as a sorptive barrier, an electro-kinetic fence for ongoing capture of contaminants from groundwater, or facilitating other treatment processes by moving reagents and nutrients through the soil (e.g. nutrients used to enhance bioremediation). It can also be applied as an ex situ process on soil piles, or soils within large containers. Applicability to contaminants and ground materials Organic Inorganic Materials Halogenated VOCs ? Metals Y Gravel >2mm N Halogenated SVOCs ? Radionuclides ? Sand 0.06-2mm ? Non-halogenated VOCs ? Corrosives ? Silt 2-60µm Y Non-halogenated SVOCs ? Cyanides ? Clay <2µm Y Organic corrosives N Asbestos N Peat ? Organic cyanides N
PCBs N Miscellaneous Key Pesticides/herbicides N Explosives ? Usually or potentially applicable Y Dioxins/furans N May be applicable ? Not applicable N
Potential advantages: • works best with fine grained materials such
as clays; • applicable to metal contaminants, including
some radionuclides; • may be used to create in situ treatment
zones by controlling water movement.
Limitations: • an emerging technique with few UK case studies; • need a soil water content of soil >10% to be effective; • buried services, metallic objects or ore deposits can cause
problems; • production of hydroxide ions has to be controlled at the cathode
to avoid unpredictable metal hydroxide precipitation; • it is possible for the soil to heat up to temperatures that may
cause damage to soil flora and fauna; • carbonate-rich materials limit application.
References: Nathanail et al., 2007; CIRIA, 1995; CL:AIRE RB2, 2003; CL:AIRE RB9, 2009; FRTR, 2007
14
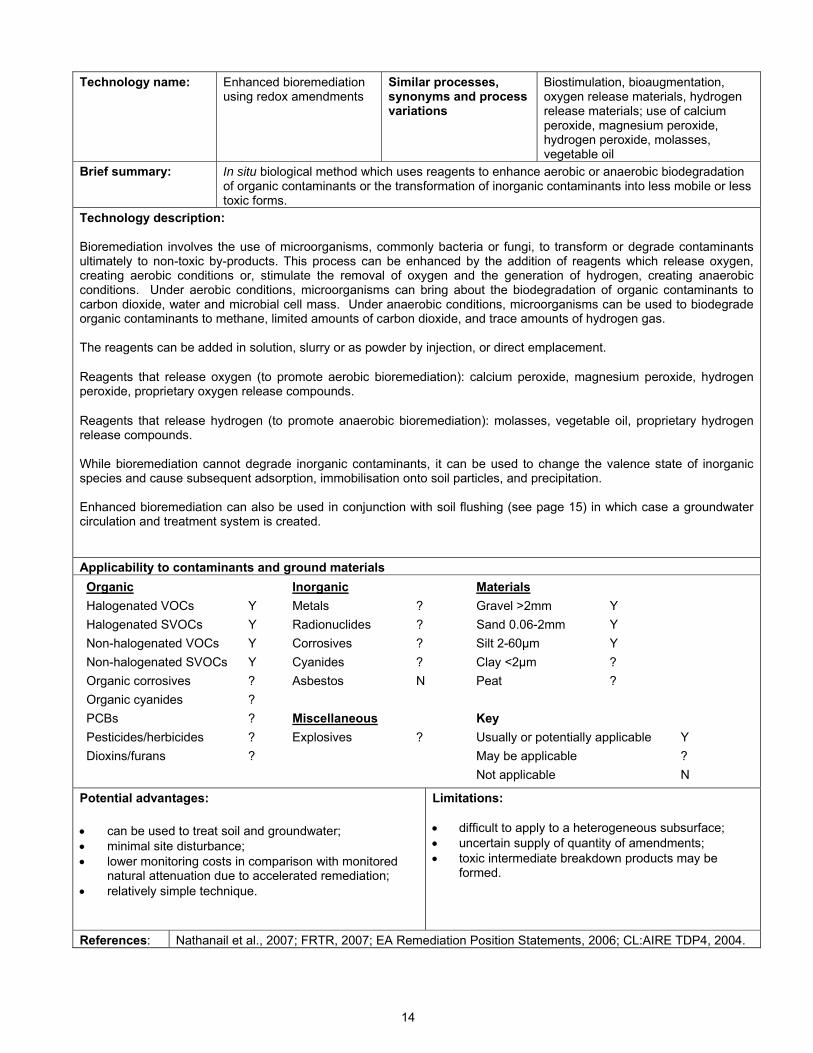
Technology name: Enhanced bioremediation using redox amendments
Similar processes, synonyms and process variations
Biostimulation, bioaugmentation, oxygen release materials, hydrogen release materials; use of calcium peroxide, magnesium peroxide, hydrogen peroxide, molasses, vegetable oil
Brief summary: In situ biological method which uses reagents to enhance aerobic or anaerobic biodegradation of organic contaminants or the transformation of inorganic contaminants into less mobile or less toxic forms.
Technology description: Bioremediation involves the use of microorganisms, commonly bacteria or fungi, to transform or degrade contaminants ultimately to non-toxic by-products. This process can be enhanced by the addition of reagents which release oxygen, creating aerobic conditions or, stimulate the removal of oxygen and the generation of hydrogen, creating anaerobic conditions. Under aerobic conditions, microorganisms can bring about the biodegradation of organic contaminants to carbon dioxide, water and microbial cell mass. Under anaerobic conditions, microorganisms can be used to biodegrade organic contaminants to methane, limited amounts of carbon dioxide, and trace amounts of hydrogen gas. The reagents can be added in solution, slurry or as powder by injection, or direct emplacement.
Reagents that release oxygen (to promote aerobic bioremediation): calcium peroxide, magnesium peroxide, hydrogen peroxide, proprietary oxygen release compounds.
Reagents that release hydrogen (to promote anaerobic bioremediation): molasses, vegetable oil, proprietary hydrogen release compounds. While bioremediation cannot degrade inorganic contaminants, it can be used to change the valence state of inorganic species and cause subsequent adsorption, immobilisation onto soil particles, and precipitation. Enhanced bioremediation can also be used in conjunction with soil flushing (see page 15) in which case a groundwater circulation and treatment system is created. Applicability to contaminants and ground materials Organic Inorganic Materials Halogenated VOCs Y Metals ? Gravel >2mm Y Halogenated SVOCs Y Radionuclides ? Sand 0.06-2mm Y Non-halogenated VOCs Y Corrosives ? Silt 2-60µm Y Non-halogenated SVOCs Y Cyanides ? Clay <2µm ? Organic corrosives ? Asbestos N Peat ? Organic cyanides ?
PCBs ? Miscellaneous Key Pesticides/herbicides ? Explosives ? Usually or potentially applicable Y Dioxins/furans ? May be applicable ? Not applicable N
Potential advantages:
• can be used to treat soil and groundwater; • minimal site disturbance; • lower monitoring costs in comparison with monitored
natural attenuation due to accelerated remediation; • relatively simple technique.
Limitations: • difficult to apply to a heterogeneous subsurface; • uncertain supply of quantity of amendments; • toxic intermediate breakdown products may be
formed.
References: Nathanail et al., 2007; FRTR, 2007; EA Remediation Position Statements, 2006; CL:AIRE TDP4, 2004.
15
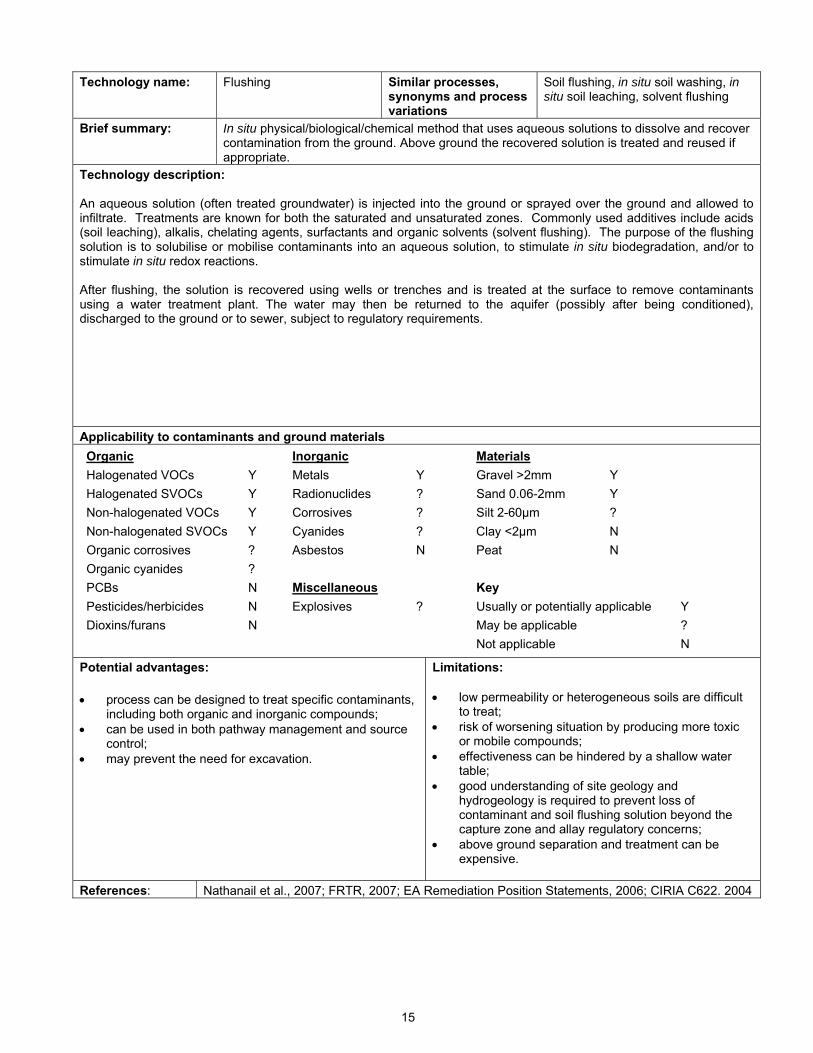
Technology name: Flushing Similar processes, synonyms and process variations
Soil flushing, in situ soil washing, in situ soil leaching, solvent flushing
Brief summary: In situ physical/biological/chemical method that uses aqueous solutions to dissolve and recover contamination from the ground. Above ground the recovered solution is treated and reused if appropriate.
Technology description: An aqueous solution (often treated groundwater) is injected into the ground or sprayed over the ground and allowed to infiltrate. Treatments are known for both the saturated and unsaturated zones. Commonly used additives include acids (soil leaching), alkalis, chelating agents, surfactants and organic solvents (solvent flushing). The purpose of the flushing solution is to solubilise or mobilise contaminants into an aqueous solution, to stimulate in situ biodegradation, and/or to stimulate in situ redox reactions. After flushing, the solution is recovered using wells or trenches and is treated at the surface to remove contaminants using a water treatment plant. The water may then be returned to the aquifer (possibly after being conditioned), discharged to the ground or to sewer, subject to regulatory requirements.
Applicability to contaminants and ground materials Organic Inorganic Materials Halogenated VOCs Y Metals Y Gravel >2mm Y Halogenated SVOCs Y Radionuclides ? Sand 0.06-2mm Y Non-halogenated VOCs Y Corrosives ? Silt 2-60µm ? Non-halogenated SVOCs Y Cyanides ? Clay <2µm N Organic corrosives ? Asbestos N Peat N Organic cyanides ?
PCBs N Miscellaneous Key Pesticides/herbicides N Explosives ? Usually or potentially applicable Y Dioxins/furans N May be applicable ? Not applicable N
Potential advantages: • process can be designed to treat specific contaminants,
including both organic and inorganic compounds; • can be used in both pathway management and source
control; • may prevent the need for excavation.
Limitations: • low permeability or heterogeneous soils are difficult
to treat; • risk of worsening situation by producing more toxic
or mobile compounds; • effectiveness can be hindered by a shallow water
table; • good understanding of site geology and
hydrogeology is required to prevent loss of contaminant and soil flushing solution beyond the capture zone and allay regulatory concerns;
• above ground separation and treatment can be expensive.
References: Nathanail et al., 2007; FRTR, 2007; EA Remediation Position Statements, 2006; CIRIA C622. 2004
16
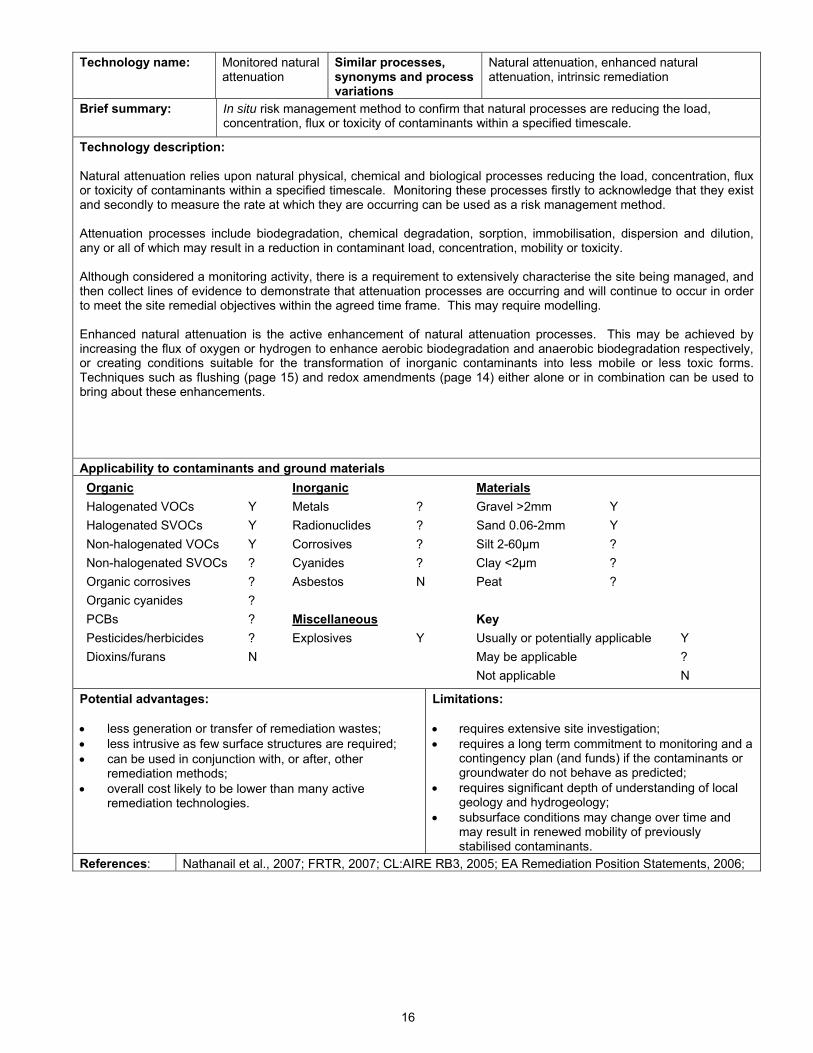
Technology name: Monitored natural attenuation
Similar processes, synonyms and process variations
Natural attenuation, enhanced natural attenuation, intrinsic remediation
Brief summary: In situ risk management method to confirm that natural processes are reducing the load, concentration, flux or toxicity of contaminants within a specified timescale.
Technology description: Natural attenuation relies upon natural physical, chemical and biological processes reducing the load, concentration, flux or toxicity of contaminants within a specified timescale. Monitoring these processes firstly to acknowledge that they exist and secondly to measure the rate at which they are occurring can be used as a risk management method. Attenuation processes include biodegradation, chemical degradation, sorption, immobilisation, dispersion and dilution, any or all of which may result in a reduction in contaminant load, concentration, mobility or toxicity. Although considered a monitoring activity, there is a requirement to extensively characterise the site being managed, and then collect lines of evidence to demonstrate that attenuation processes are occurring and will continue to occur in order to meet the site remedial objectives within the agreed time frame. This may require modelling. Enhanced natural attenuation is the active enhancement of natural attenuation processes. This may be achieved by increasing the flux of oxygen or hydrogen to enhance aerobic biodegradation and anaerobic biodegradation respectively, or creating conditions suitable for the transformation of inorganic contaminants into less mobile or less toxic forms. Techniques such as flushing (page 15) and redox amendments (page 14) either alone or in combination can be used to bring about these enhancements.
Applicability to contaminants and ground materials Organic Inorganic Materials Halogenated VOCs Y Metals ? Gravel >2mm Y Halogenated SVOCs Y Radionuclides ? Sand 0.06-2mm Y Non-halogenated VOCs Y Corrosives ? Silt 2-60µm ? Non-halogenated SVOCs ? Cyanides ? Clay <2µm ? Organic corrosives ? Asbestos N Peat ? Organic cyanides ?
PCBs ? Miscellaneous Key Pesticides/herbicides ? Explosives Y Usually or potentially applicable Y Dioxins/furans N May be applicable ? Not applicable N
Potential advantages: • less generation or transfer of remediation wastes; • less intrusive as few surface structures are required; • can be used in conjunction with, or after, other
remediation methods; • overall cost likely to be lower than many active
remediation technologies.
Limitations: • requires extensive site investigation; • requires a long term commitment to monitoring and a
contingency plan (and funds) if the contaminants or groundwater do not behave as predicted;
• requires significant depth of understanding of local geology and hydrogeology;
• subsurface conditions may change over time and may result in renewed mobility of previously stabilised contaminants.
References: Nathanail et al., 2007; FRTR, 2007; CL:AIRE RB3, 2005; EA Remediation Position Statements, 2006;
17
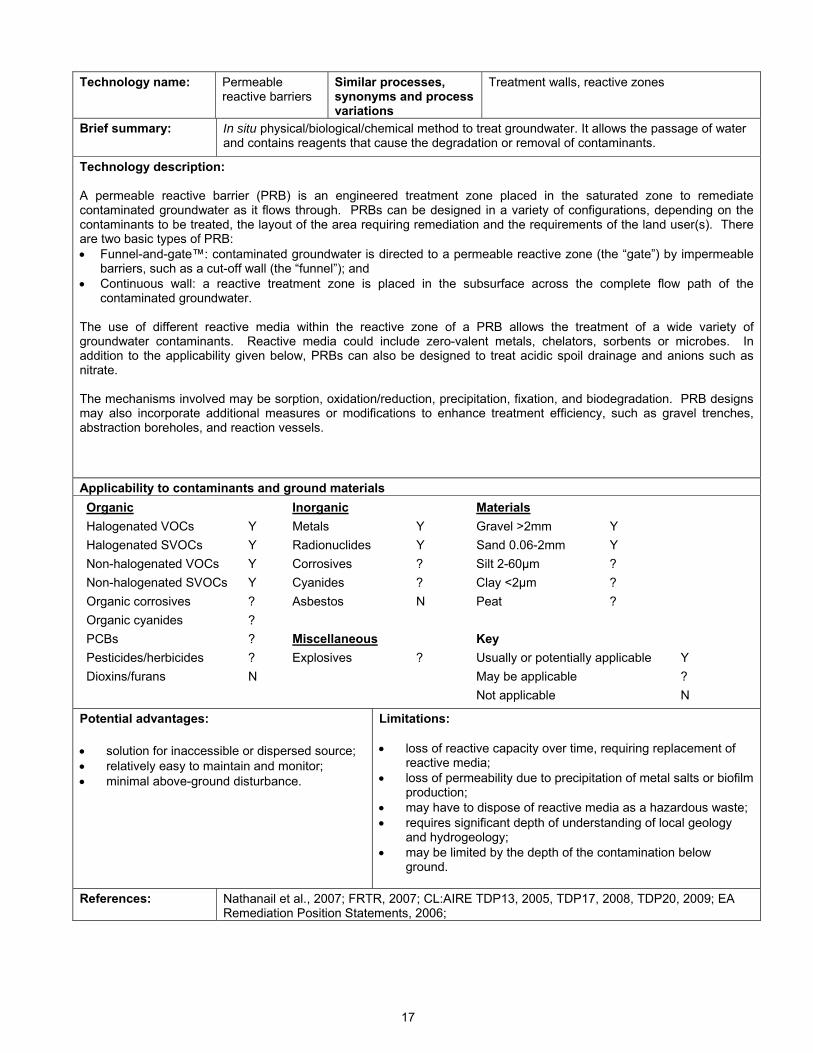
Technology name: Permeable reactive barriers
Similar processes, synonyms and process variations
Treatment walls, reactive zones
Brief summary: In situ physical/biological/chemical method to treat groundwater. It allows the passage of water and contains reagents that cause the degradation or removal of contaminants.
Technology description: A permeable reactive barrier (PRB) is an engineered treatment zone placed in the saturated zone to remediate contaminated groundwater as it flows through. PRBs can be designed in a variety of configurations, depending on the contaminants to be treated, the layout of the area requiring remediation and the requirements of the land user(s). There are two basic types of PRB: • Funnel-and-gate™: contaminated groundwater is directed to a permeable reactive zone (the “gate”) by impermeable
barriers, such as a cut-off wall (the “funnel”); and • Continuous wall: a reactive treatment zone is placed in the subsurface across the complete flow path of the
contaminated groundwater. The use of different reactive media within the reactive zone of a PRB allows the treatment of a wide variety of groundwater contaminants. Reactive media could include zero-valent metals, chelators, sorbents or microbes. In addition to the applicability given below, PRBs can also be designed to treat acidic spoil drainage and anions such as nitrate. The mechanisms involved may be sorption, oxidation/reduction, precipitation, fixation, and biodegradation. PRB designs may also incorporate additional measures or modifications to enhance treatment efficiency, such as gravel trenches, abstraction boreholes, and reaction vessels.
Applicability to contaminants and ground materials Organic Inorganic Materials Halogenated VOCs Y Metals Y Gravel >2mm Y Halogenated SVOCs Y Radionuclides Y Sand 0.06-2mm Y Non-halogenated VOCs Y Corrosives ? Silt 2-60µm ? Non-halogenated SVOCs Y Cyanides ? Clay <2µm ? Organic corrosives ? Asbestos N Peat ? Organic cyanides ?
PCBs ? Miscellaneous Key Pesticides/herbicides ? Explosives ? Usually or potentially applicable Y Dioxins/furans N May be applicable ? Not applicable N
Potential advantages: • solution for inaccessible or dispersed source; • relatively easy to maintain and monitor; • minimal above-ground disturbance.
Limitations: • loss of reactive capacity over time, requiring replacement of
reactive media; • loss of permeability due to precipitation of metal salts or biofilm
production; • may have to dispose of reactive media as a hazardous waste; • requires significant depth of understanding of local geology
and hydrogeology; • may be limited by the depth of the contamination below
ground.
References: Nathanail et al., 2007; FRTR, 2007; CL:AIRE TDP13, 2005, TDP17, 2008, TDP20, 2009; EA Remediation Position Statements, 2006;
18
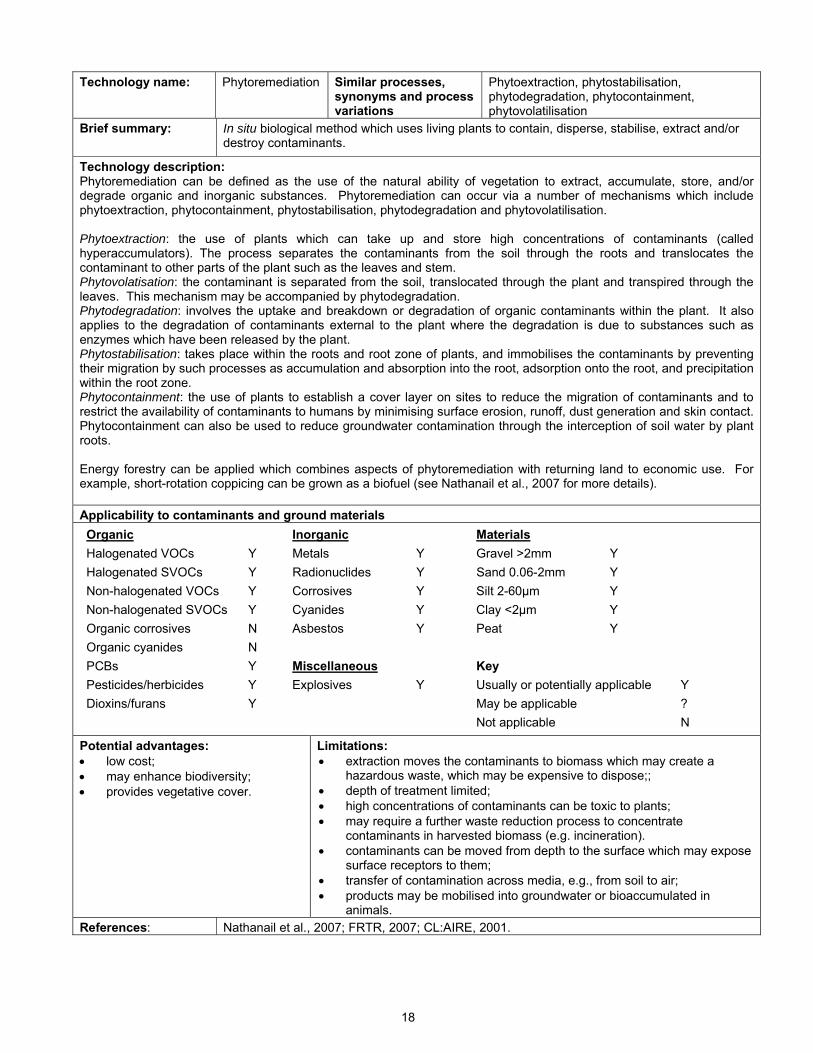
Technology name: Phytoremediation
Similar processes, synonyms and process variations
Phytoextraction, phytostabilisation, phytodegradation, phytocontainment, phytovolatilisation
Brief summary: In situ biological method which uses living plants to contain, disperse, stabilise, extract and/or destroy contaminants.
Technology description: Phytoremediation can be defined as the use of the natural ability of vegetation to extract, accumulate, store, and/or degrade organic and inorganic substances. Phytoremediation can occur via a number of mechanisms which include phytoextraction, phytocontainment, phytostabilisation, phytodegradation and phytovolatilisation. Phytoextraction: the use of plants which can take up and store high concentrations of contaminants (called hyperaccumulators). The process separates the contaminants from the soil through the roots and translocates the contaminant to other parts of the plant such as the leaves and stem. Phytovolatisation: the contaminant is separated from the soil, translocated through the plant and transpired through the leaves. This mechanism may be accompanied by phytodegradation. Phytodegradation: involves the uptake and breakdown or degradation of organic contaminants within the plant. It also applies to the degradation of contaminants external to the plant where the degradation is due to substances such as enzymes which have been released by the plant. Phytostabilisation: takes place within the roots and root zone of plants, and immobilises the contaminants by preventing their migration by such processes as accumulation and absorption into the root, adsorption onto the root, and precipitation within the root zone. Phytocontainment: the use of plants to establish a cover layer on sites to reduce the migration of contaminants and to restrict the availability of contaminants to humans by minimising surface erosion, runoff, dust generation and skin contact. Phytocontainment can also be used to reduce groundwater contamination through the interception of soil water by plant roots. Energy forestry can be applied which combines aspects of phytoremediation with returning land to economic use. For example, short-rotation coppicing can be grown as a biofuel (see Nathanail et al., 2007 for more details).
Applicability to contaminants and ground materials Organic Inorganic Materials Halogenated VOCs Y Metals Y Gravel >2mm Y Halogenated SVOCs Y Radionuclides Y Sand 0.06-2mm Y Non-halogenated VOCs Y Corrosives Y Silt 2-60µm Y Non-halogenated SVOCs Y Cyanides Y Clay <2µm Y Organic corrosives N Asbestos Y Peat Y Organic cyanides N
PCBs Y Miscellaneous Key Pesticides/herbicides Y Explosives Y Usually or potentially applicable Y Dioxins/furans Y May be applicable ? Not applicable N
Potential advantages: • low cost; • may enhance biodiversity; • provides vegetative cover.
Limitations: • extraction moves the contaminants to biomass which may create a
hazardous waste, which may be expensive to dispose;; • depth of treatment limited; • high concentrations of contaminants can be toxic to plants; • may require a further waste reduction process to concentrate
contaminants in harvested biomass (e.g. incineration). • contaminants can be moved from depth to the surface which may expose
surface receptors to them; • transfer of contamination across media, e.g., from soil to air; • products may be mobilised into groundwater or bioaccumulated in
animals. References: Nathanail et al., 2007; FRTR, 2007; CL:AIRE, 2001.
19
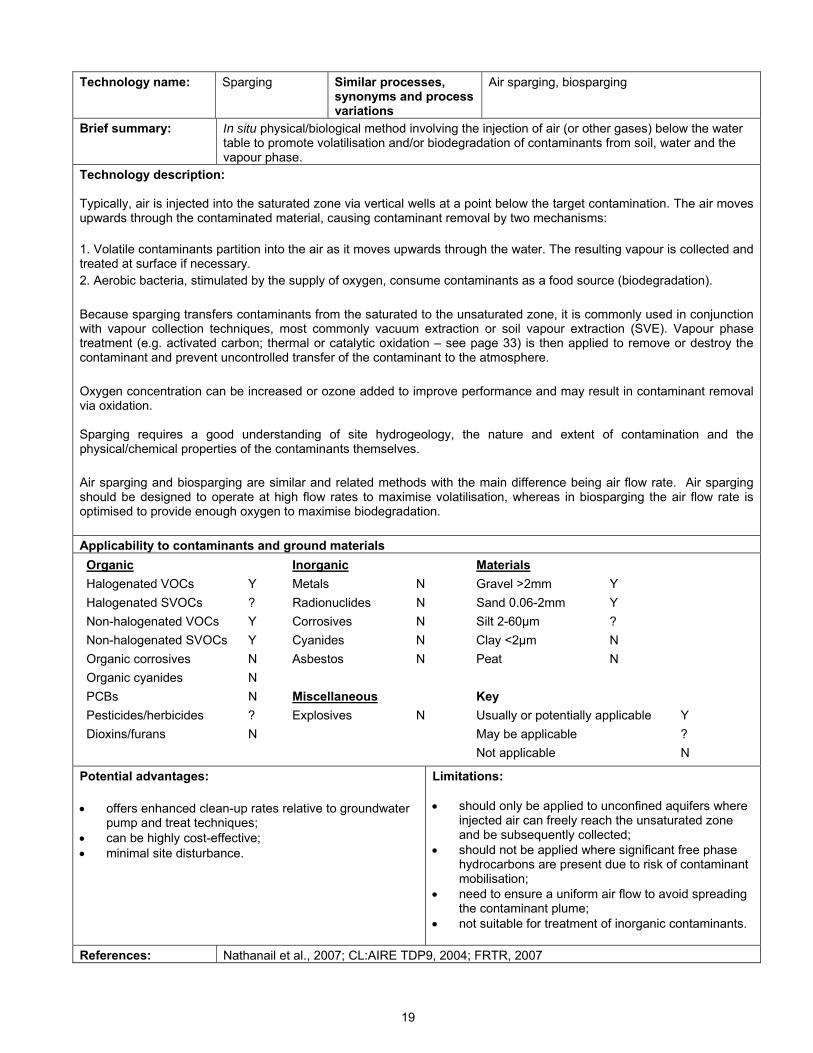
Technology name: Sparging Similar processes, synonyms and process variations
Air sparging, biosparging
Brief summary: In situ physical/biological method involving the injection of air (or other gases) below the water table to promote volatilisation and/or biodegradation of contaminants from soil, water and the vapour phase.
Technology description: Typically, air is injected into the saturated zone via vertical wells at a point below the target contamination. The air moves upwards through the contaminated material, causing contaminant removal by two mechanisms: 1. Volatile contaminants partition into the air as it moves upwards through the water. The resulting vapour is collected and treated at surface if necessary. 2. Aerobic bacteria, stimulated by the supply of oxygen, consume contaminants as a food source (biodegradation). Because sparging transfers contaminants from the saturated to the unsaturated zone, it is commonly used in conjunction with vapour collection techniques, most commonly vacuum extraction or soil vapour extraction (SVE). Vapour phase treatment (e.g. activated carbon; thermal or catalytic oxidation – see page 33) is then applied to remove or destroy the contaminant and prevent uncontrolled transfer of the contaminant to the atmosphere. Oxygen concentration can be increased or ozone added to improve performance and may result in contaminant removal via oxidation. Sparging requires a good understanding of site hydrogeology, the nature and extent of contamination and the physical/chemical properties of the contaminants themselves. Air sparging and biosparging are similar and related methods with the main difference being air flow rate. Air sparging should be designed to operate at high flow rates to maximise volatilisation, whereas in biosparging the air flow rate is optimised to provide enough oxygen to maximise biodegradation. Applicability to contaminants and ground materials Organic Inorganic Materials Halogenated VOCs Y Metals N Gravel >2mm Y Halogenated SVOCs ? Radionuclides N Sand 0.06-2mm Y Non-halogenated VOCs Y Corrosives N Silt 2-60µm ? Non-halogenated SVOCs Y Cyanides N Clay <2µm N Organic corrosives N Asbestos N Peat N Organic cyanides N
PCBs N Miscellaneous Key Pesticides/herbicides ? Explosives N Usually or potentially applicable Y Dioxins/furans N May be applicable ? Not applicable N
Potential advantages: • offers enhanced clean-up rates relative to groundwater
pump and treat techniques; • can be highly cost-effective; • minimal site disturbance.
Limitations: • should only be applied to unconfined aquifers where
injected air can freely reach the unsaturated zone and be subsequently collected;
• should not be applied where significant free phase hydrocarbons are present due to risk of contaminant mobilisation;
• need to ensure a uniform air flow to avoid spreading the contaminant plume;
• not suitable for treatment of inorganic contaminants.
References: Nathanail et al., 2007; CL:AIRE TDP9, 2004; FRTR, 2007
20
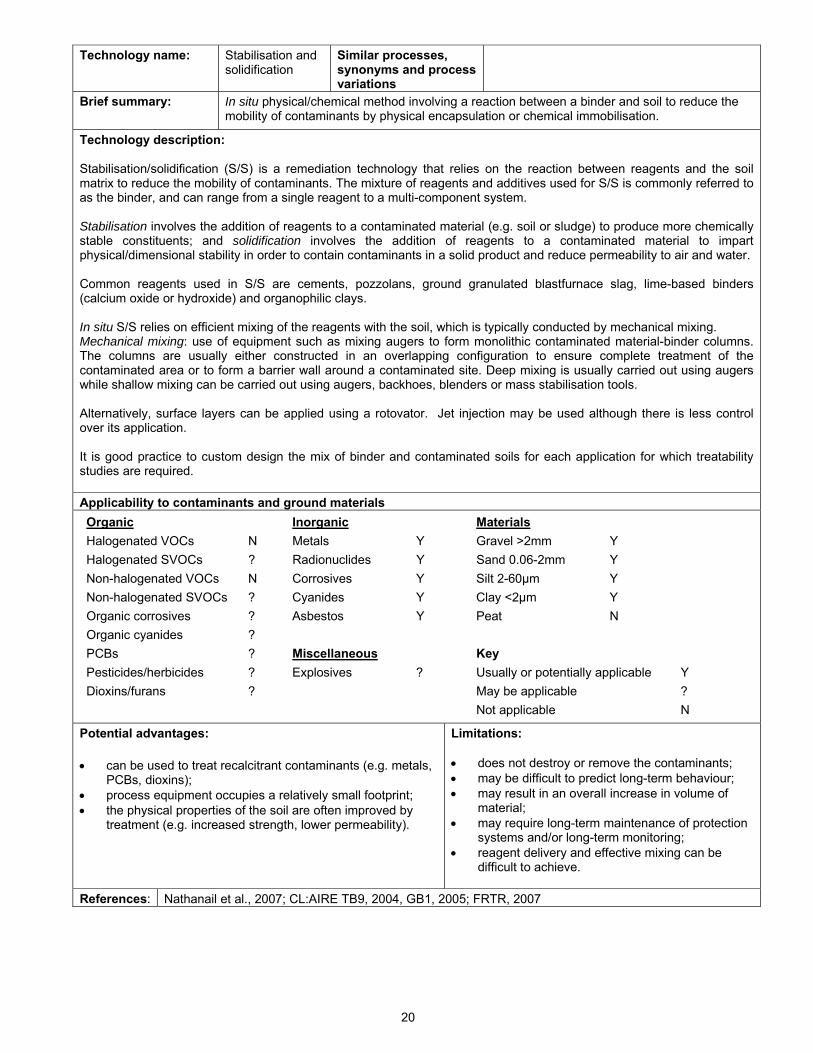
Technology name: Stabilisation and solidification
Similar processes, synonyms and process variations
Brief summary: In situ physical/chemical method involving a reaction between a binder and soil to reduce the mobility of contaminants by physical encapsulation or chemical immobilisation.
Technology description: Stabilisation/solidification (S/S) is a remediation technology that relies on the reaction between reagents and the soil matrix to reduce the mobility of contaminants. The mixture of reagents and additives used for S/S is commonly referred to as the binder, and can range from a single reagent to a multi-component system. Stabilisation involves the addition of reagents to a contaminated material (e.g. soil or sludge) to produce more chemically stable constituents; and solidification involves the addition of reagents to a contaminated material to impart physical/dimensional stability in order to contain contaminants in a solid product and reduce permeability to air and water. Common reagents used in S/S are cements, pozzolans, ground granulated blastfurnace slag, lime-based binders (calcium oxide or hydroxide) and organophilic clays. In situ S/S relies on efficient mixing of the reagents with the soil, which is typically conducted by mechanical mixing. Mechanical mixing: use of equipment such as mixing augers to form monolithic contaminated material-binder columns. The columns are usually either constructed in an overlapping configuration to ensure complete treatment of the contaminated area or to form a barrier wall around a contaminated site. Deep mixing is usually carried out using augers while shallow mixing can be carried out using augers, backhoes, blenders or mass stabilisation tools. Alternatively, surface layers can be applied using a rotovator. Jet injection may be used although there is less control over its application. It is good practice to custom design the mix of binder and contaminated soils for each application for which treatability studies are required. Applicability to contaminants and ground materials Organic Inorganic Materials Halogenated VOCs N Metals Y Gravel >2mm Y Halogenated SVOCs ? Radionuclides Y Sand 0.06-2mm Y Non-halogenated VOCs N Corrosives Y Silt 2-60µm Y Non-halogenated SVOCs ? Cyanides Y Clay <2µm Y Organic corrosives ? Asbestos Y Peat N Organic cyanides ?
PCBs ? Miscellaneous Key Pesticides/herbicides ? Explosives ? Usually or potentially applicable Y Dioxins/furans ? May be applicable ? Not applicable N
Potential advantages: • can be used to treat recalcitrant contaminants (e.g. metals,
PCBs, dioxins); • process equipment occupies a relatively small footprint; • the physical properties of the soil are often improved by
treatment (e.g. increased strength, lower permeability).
Limitations: • does not destroy or remove the contaminants; • may be difficult to predict long-term behaviour; • may result in an overall increase in volume of
material; • may require long-term maintenance of protection
systems and/or long-term monitoring; • reagent delivery and effective mixing can be
difficult to achieve.
References: Nathanail et al., 2007; CL:AIRE TB9, 2004, GB1, 2005; FRTR, 2007
21
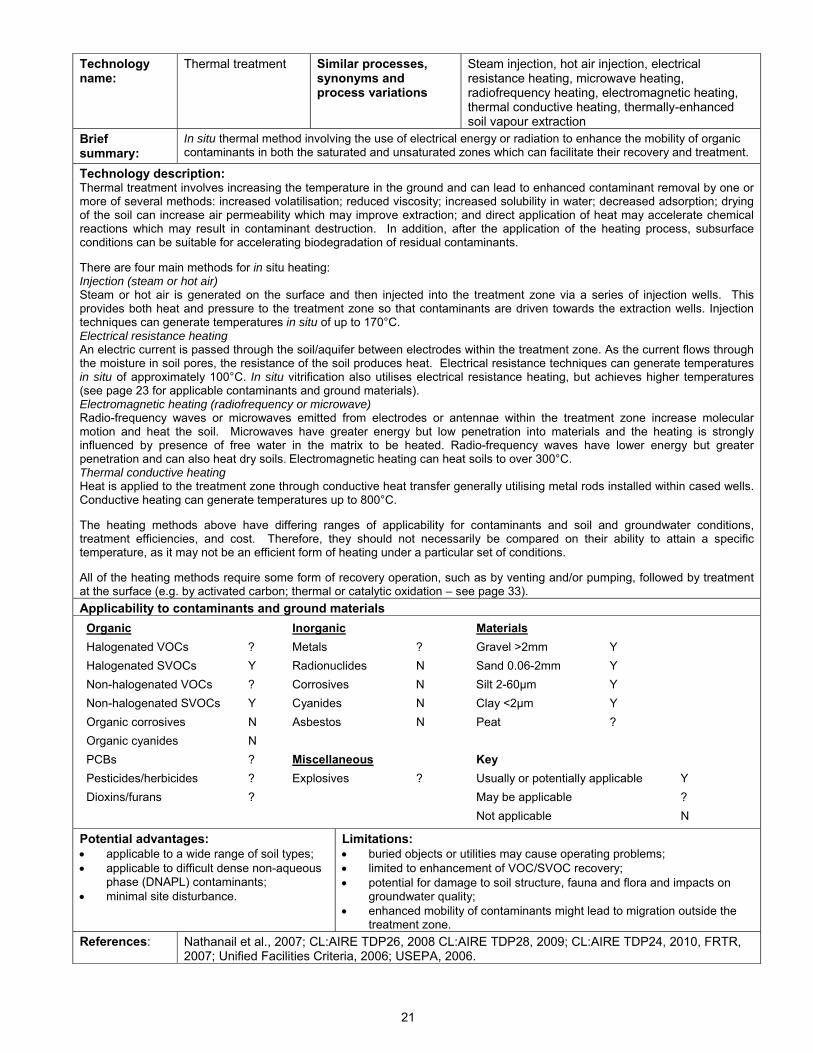
Technology name:
Thermal treatment Similar processes, synonyms and process variations
Steam injection, hot air injection, electrical resistance heating, microwave heating, radiofrequency heating, electromagnetic heating, thermal conductive heating, thermally-enhanced soil vapour extraction
Brief summary:
In situ thermal method involving the use of electrical energy or radiation to enhance the mobility of organic contaminants in both the saturated and unsaturated zones which can facilitate their recovery and treatment.
Technology description: Thermal treatment involves increasing the temperature in the ground and can lead to enhanced contaminant removal by one or more of several methods: increased volatilisation; reduced viscosity; increased solubility in water; decreased adsorption; drying of the soil can increase air permeability which may improve extraction; and direct application of heat may accelerate chemical reactions which may result in contaminant destruction. In addition, after the application of the heating process, subsurface conditions can be suitable for accelerating biodegradation of residual contaminants. There are four main methods for in situ heating: Injection (steam or hot air) Steam or hot air is generated on the surface and then injected into the treatment zone via a series of injection wells. This provides both heat and pressure to the treatment zone so that contaminants are driven towards the extraction wells. Injection techniques can generate temperatures in situ of up to 170°C. Electrical resistance heating An electric current is passed through the soil/aquifer between electrodes within the treatment zone. As the current flows through the moisture in soil pores, the resistance of the soil produces heat. Electrical resistance techniques can generate temperatures in situ of approximately 100°C. In situ vitrification also utilises electrical resistance heating, but achieves higher temperatures (see page 23 for applicable contaminants and ground materials). Electromagnetic heating (radiofrequency or microwave) Radio-frequency waves or microwaves emitted from electrodes or antennae within the treatment zone increase molecular motion and heat the soil. Microwaves have greater energy but low penetration into materials and the heating is strongly influenced by presence of free water in the matrix to be heated. Radio-frequency waves have lower energy but greater penetration and can also heat dry soils. Electromagnetic heating can heat soils to over 300°C. Thermal conductive heating Heat is applied to the treatment zone through conductive heat transfer generally utilising metal rods installed within cased wells. Conductive heating can generate temperatures up to 800°C. The heating methods above have differing ranges of applicability for contaminants and soil and groundwater conditions, treatment efficiencies, and cost. Therefore, they should not necessarily be compared on their ability to attain a specific temperature, as it may not be an efficient form of heating under a particular set of conditions. All of the heating methods require some form of recovery operation, such as by venting and/or pumping, followed by treatment at the surface (e.g. by activated carbon; thermal or catalytic oxidation – see page 33). Applicability to contaminants and ground materials
Organic Inorganic Materials Halogenated VOCs ? Metals ? Gravel >2mm Y Halogenated SVOCs Y Radionuclides N Sand 0.06-2mm Y Non-halogenated VOCs ? Corrosives N Silt 2-60µm Y Non-halogenated SVOCs Y Cyanides N Clay <2µm Y Organic corrosives N Asbestos N Peat ? Organic cyanides N
PCBs ? Miscellaneous Key Pesticides/herbicides ? Explosives ? Usually or potentially applicable Y Dioxins/furans ? May be applicable ? Not applicable N
Potential advantages: • applicable to a wide range of soil types; • applicable to difficult dense non-aqueous
phase (DNAPL) contaminants; • minimal site disturbance.
Limitations: • buried objects or utilities may cause operating problems; • limited to enhancement of VOC/SVOC recovery; • potential for damage to soil structure, fauna and flora and impacts on
groundwater quality; • enhanced mobility of contaminants might lead to migration outside the
treatment zone. References: Nathanail et al., 2007; CL:AIRE TDP26, 2008 CL:AIRE TDP28, 2009; CL:AIRE TDP24, 2010, FRTR,
2007; Unified Facilities Criteria, 2006; USEPA, 2006.
22
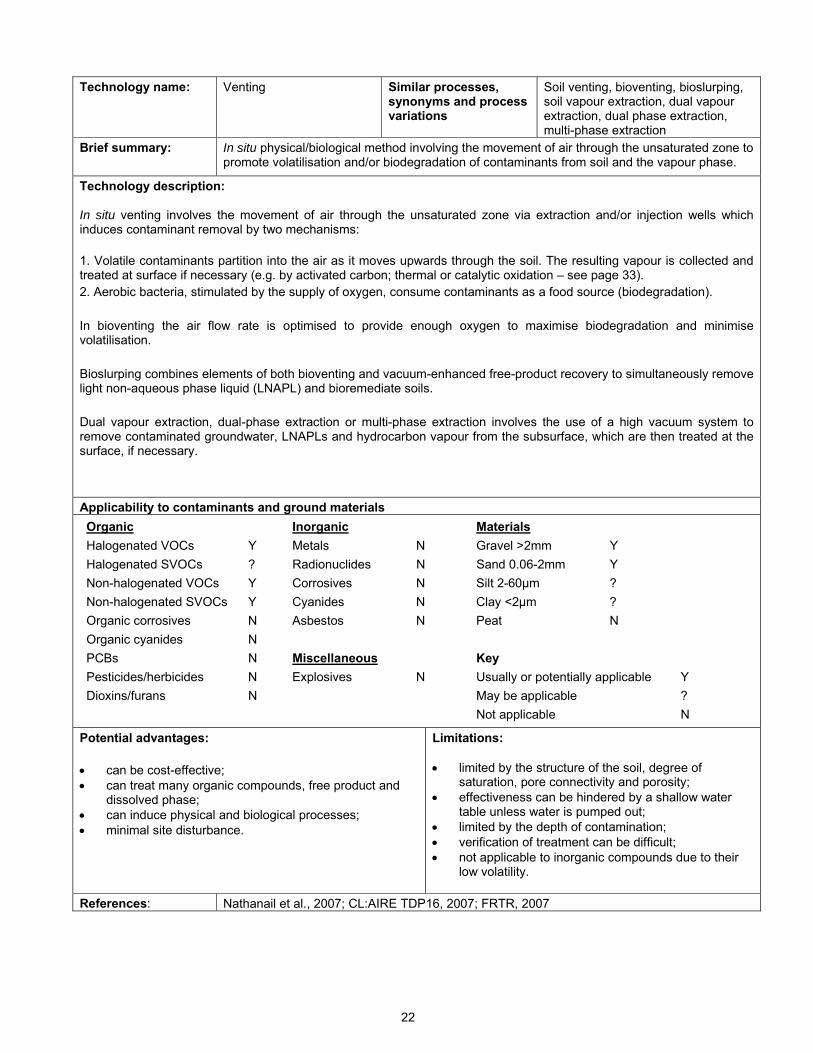
Technology name: Venting Similar processes, synonyms and process variations
Soil venting, bioventing, bioslurping, soil vapour extraction, dual vapour extraction, dual phase extraction, multi-phase extraction
Brief summary: In situ physical/biological method involving the movement of air through the unsaturated zone to promote volatilisation and/or biodegradation of contaminants from soil and the vapour phase.
Technology description: In situ venting involves the movement of air through the unsaturated zone via extraction and/or injection wells which induces contaminant removal by two mechanisms: 1. Volatile contaminants partition into the air as it moves upwards through the soil. The resulting vapour is collected and treated at surface if necessary (e.g. by activated carbon; thermal or catalytic oxidation – see page 33). 2. Aerobic bacteria, stimulated by the supply of oxygen, consume contaminants as a food source (biodegradation). In bioventing the air flow rate is optimised to provide enough oxygen to maximise biodegradation and minimise volatilisation. Bioslurping combines elements of both bioventing and vacuum-enhanced free-product recovery to simultaneously remove light non-aqueous phase liquid (LNAPL) and bioremediate soils. Dual vapour extraction, dual-phase extraction or multi-phase extraction involves the use of a high vacuum system to remove contaminated groundwater, LNAPLs and hydrocarbon vapour from the subsurface, which are then treated at the surface, if necessary.
Applicability to contaminants and ground materials Organic Inorganic Materials Halogenated VOCs Y Metals N Gravel >2mm Y Halogenated SVOCs ? Radionuclides N Sand 0.06-2mm Y Non-halogenated VOCs Y Corrosives N Silt 2-60µm ? Non-halogenated SVOCs Y Cyanides N Clay <2µm ? Organic corrosives N Asbestos N Peat N Organic cyanides N
PCBs N Miscellaneous Key Pesticides/herbicides N Explosives N Usually or potentially applicable Y Dioxins/furans N May be applicable ? Not applicable N
Potential advantages: • can be cost-effective; • can treat many organic compounds, free product and
dissolved phase; • can induce physical and biological processes; • minimal site disturbance.
Limitations: • limited by the structure of the soil, degree of
saturation, pore connectivity and porosity; • effectiveness can be hindered by a shallow water
table unless water is pumped out; • limited by the depth of contamination; • verification of treatment can be difficult; • not applicable to inorganic compounds due to their
low volatility.
References: Nathanail et al., 2007; CL:AIRE TDP16, 2007; FRTR, 2007
23
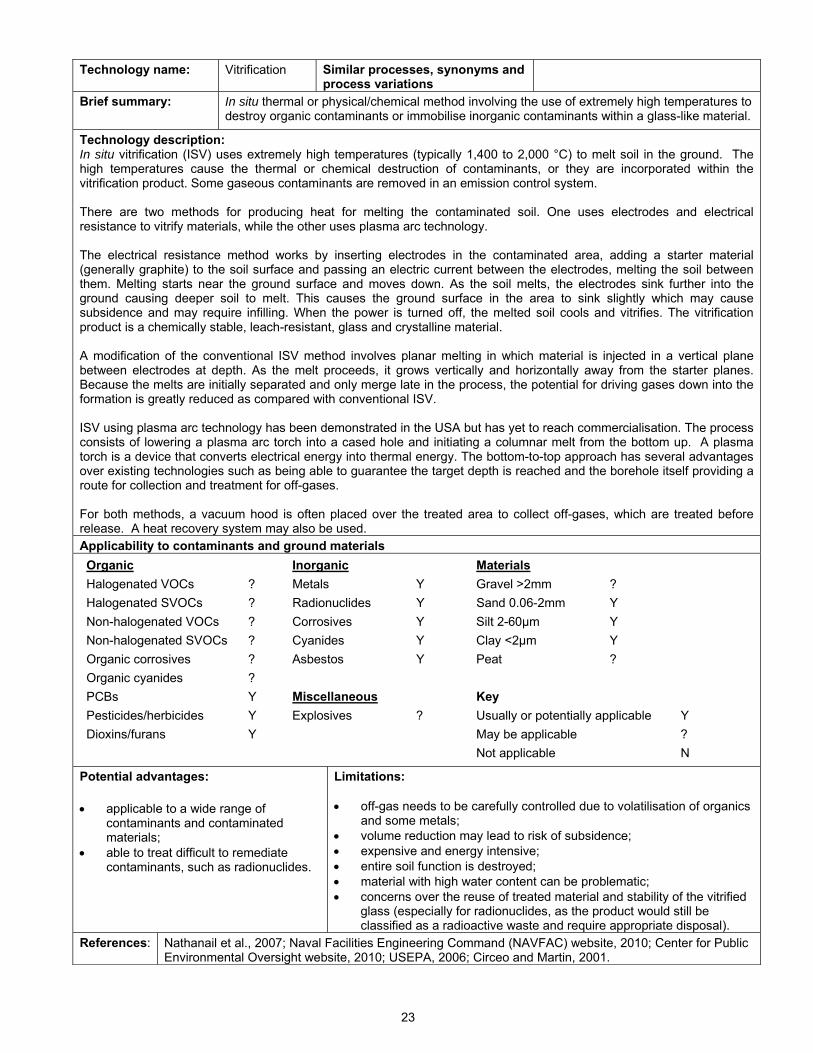
Technology name: Vitrification Similar processes, synonyms and
process variations
Brief summary: In situ thermal or physical/chemical method involving the use of extremely high temperatures to destroy organic contaminants or immobilise inorganic contaminants within a glass-like material.
Technology description: In situ vitrification (ISV) uses extremely high temperatures (typically 1,400 to 2,000 °C) to melt soil in the ground. The high temperatures cause the thermal or chemical destruction of contaminants, or they are incorporated within the vitrification product. Some gaseous contaminants are removed in an emission control system. There are two methods for producing heat for melting the contaminated soil. One uses electrodes and electrical resistance to vitrify materials, while the other uses plasma arc technology. The electrical resistance method works by inserting electrodes in the contaminated area, adding a starter material (generally graphite) to the soil surface and passing an electric current between the electrodes, melting the soil between them. Melting starts near the ground surface and moves down. As the soil melts, the electrodes sink further into the ground causing deeper soil to melt. This causes the ground surface in the area to sink slightly which may cause subsidence and may require infilling. When the power is turned off, the melted soil cools and vitrifies. The vitrification product is a chemically stable, leach-resistant, glass and crystalline material. A modification of the conventional ISV method involves planar melting in which material is injected in a vertical plane between electrodes at depth. As the melt proceeds, it grows vertically and horizontally away from the starter planes. Because the melts are initially separated and only merge late in the process, the potential for driving gases down into the formation is greatly reduced as compared with conventional ISV. ISV using plasma arc technology has been demonstrated in the USA but has yet to reach commercialisation. The process consists of lowering a plasma arc torch into a cased hole and initiating a columnar melt from the bottom up. A plasma torch is a device that converts electrical energy into thermal energy. The bottom-to-top approach has several advantages over existing technologies such as being able to guarantee the target depth is reached and the borehole itself providing a route for collection and treatment for off-gases. For both methods, a vacuum hood is often placed over the treated area to collect off-gases, which are treated before release. A heat recovery system may also be used. Applicability to contaminants and ground materials Organic Inorganic Materials Halogenated VOCs ? Metals Y Gravel >2mm ? Halogenated SVOCs ? Radionuclides Y Sand 0.06-2mm Y Non-halogenated VOCs ? Corrosives Y Silt 2-60µm Y Non-halogenated SVOCs ? Cyanides Y Clay <2µm Y Organic corrosives ? Asbestos Y Peat ? Organic cyanides ?
PCBs Y Miscellaneous Key Pesticides/herbicides Y Explosives ? Usually or potentially applicable Y Dioxins/furans Y May be applicable ? Not applicable N
Potential advantages: • applicable to a wide range of
contaminants and contaminated materials;
• able to treat difficult to remediate contaminants, such as radionuclides.
Limitations: • off-gas needs to be carefully controlled due to volatilisation of organics
and some metals; • volume reduction may lead to risk of subsidence; • expensive and energy intensive; • entire soil function is destroyed; • material with high water content can be problematic; • concerns over the reuse of treated material and stability of the vitrified
glass (especially for radionuclides, as the product would still be classified as a radioactive waste and require appropriate disposal).
References: Nathanail et al., 2007; Naval Facilities Engineering Command (NAVFAC) website, 2010; Center for Public Environmental Oversight website, 2010; USEPA, 2006; Circeo and Martin, 2001.
24
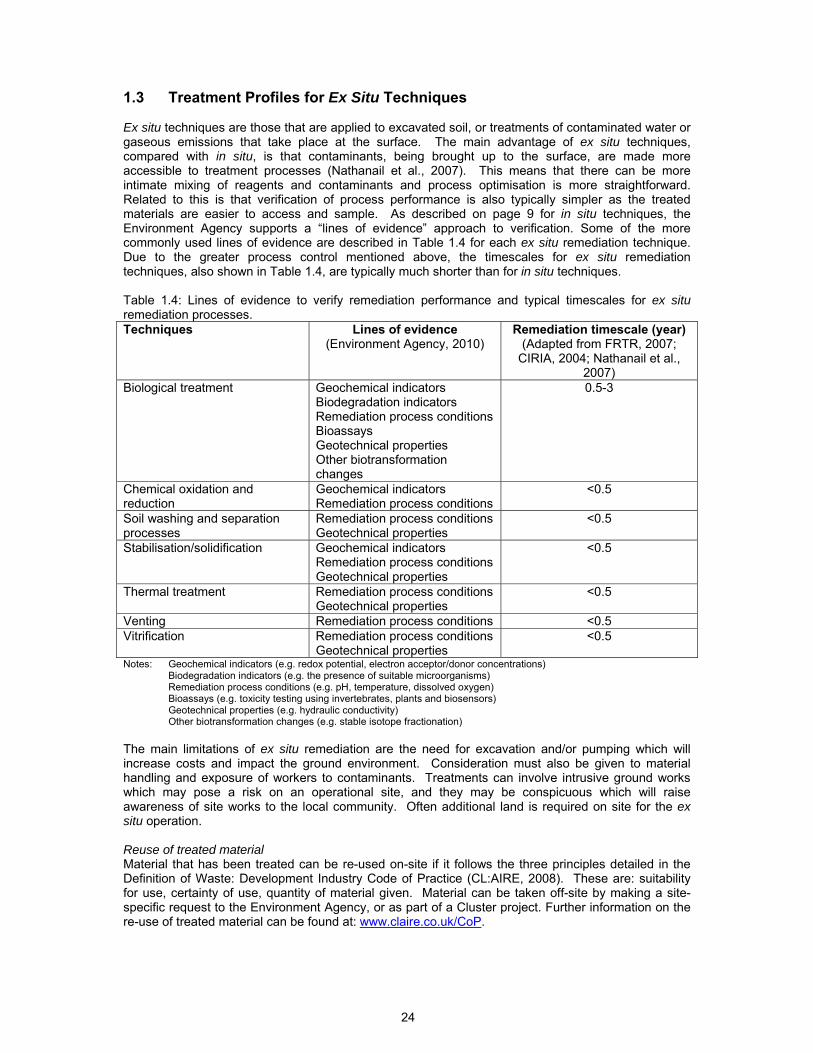
1.3 Treatment Profiles for Ex Situ Techniques Ex situ techniques are those that are applied to excavated soil, or treatments of contaminated water or gaseous emissions that take place at the surface. The main advantage of ex situ techniques, compared with in situ, is that contaminants, being brought up to the surface, are made more accessible to treatment processes (Nathanail et al., 2007). This means that there can be more intimate mixing of reagents and contaminants and process optimisation is more straightforward. Related to this is that verification of process performance is also typically simpler as the treated materials are easier to access and sample. As described on page 9 for in situ techniques, the Environment Agency supports a “lines of evidence” approach to verification. Some of the more commonly used lines of evidence are described in Table 1.4 for each ex situ remediation technique. Due to the greater process control mentioned above, the timescales for ex situ remediation techniques, also shown in Table 1.4, are typically much shorter than for in situ techniques. Table 1.4: Lines of evidence to verify remediation performance and typical timescales for ex situ remediation processes. Techniques Lines of evidence
(Environment Agency, 2010) Remediation timescale (year)
(Adapted from FRTR, 2007; CIRIA, 2004; Nathanail et al.,
2007) Biological treatment Geochemical indicators
Biodegradation indicators Remediation process conditions Bioassays Geotechnical properties Other biotransformation changes
0.5-3
Chemical oxidation and reduction
Geochemical indicators Remediation process conditions
<0.5
Soil washing and separation processes
Remediation process conditions Geotechnical properties
<0.5
Stabilisation/solidification Geochemical indicators Remediation process conditions Geotechnical properties
<0.5
Thermal treatment Remediation process conditions Geotechnical properties
<0.5
Venting Remediation process conditions <0.5 Vitrification Remediation process conditions
Geotechnical properties <0.5
Notes: Geochemical indicators (e.g. redox potential, electron acceptor/donor concentrations) Biodegradation indicators (e.g. the presence of suitable microorganisms) Remediation process conditions (e.g. pH, temperature, dissolved oxygen) Bioassays (e.g. toxicity testing using invertebrates, plants and biosensors) Geotechnical properties (e.g. hydraulic conductivity) Other biotransformation changes (e.g. stable isotope fractionation)
The main limitations of ex situ remediation are the need for excavation and/or pumping which will increase costs and impact the ground environment. Consideration must also be given to material handling and exposure of workers to contaminants. Treatments can involve intrusive ground works which may pose a risk on an operational site, and they may be conspicuous which will raise awareness of site works to the local community. Often additional land is required on site for the ex situ operation. Reuse of treated material Material that has been treated can be re-used on-site if it follows the three principles detailed in the Definition of Waste: Development Industry Code of Practice (CL:AIRE, 2008). These are: suitability for use, certainty of use, quantity of material given. Material can be taken off-site by making a site-specific request to the Environment Agency, or as part of a Cluster project. Further information on the re-use of treated material can be found at: www.claire.co.uk/CoP.
25
Treatment Profiles are presented in the proceeding pages for the following ex situ remediation techniques: • Biological treatment • Chemical oxidation and reduction • Soil washing and separation processes • Stabilisation / Solidification • Thermal treatment • Venting • Vitrification • Water and gas/vapour treatment
26
Technology name: Biological treatment
Similar processes, synonyms and process variations
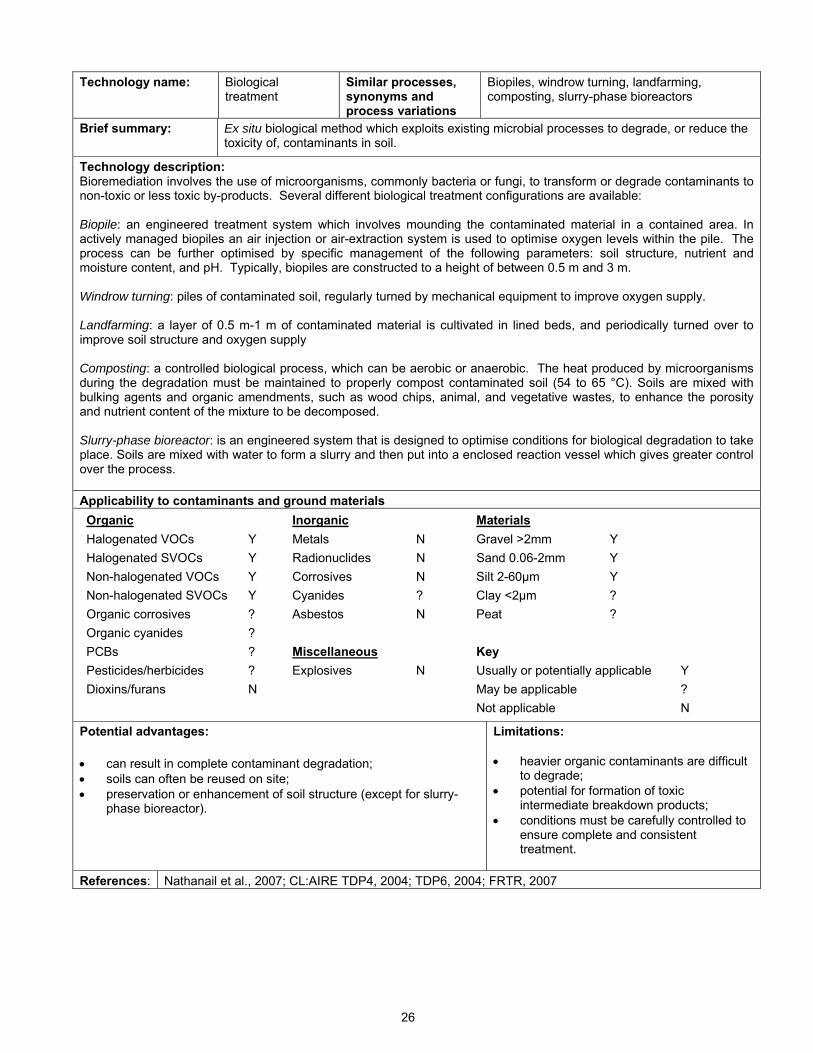
Biopiles, windrow turning, landfarming, composting, slurry-phase bioreactors
Brief summary: Ex situ biological method which exploits existing microbial processes to degrade, or reduce the toxicity of, contaminants in soil.
Technology description: Bioremediation involves the use of microorganisms, commonly bacteria or fungi, to transform or degrade contaminants to non-toxic or less toxic by-products. Several different biological treatment configurations are available: Biopile: an engineered treatment system which involves mounding the contaminated material in a contained area. In actively managed biopiles an air injection or air-extraction system is used to optimise oxygen levels within the pile. The process can be further optimised by specific management of the following parameters: soil structure, nutrient and moisture content, and pH. Typically, biopiles are constructed to a height of between 0.5 m and 3 m. Windrow turning: piles of contaminated soil, regularly turned by mechanical equipment to improve oxygen supply. Landfarming: a layer of 0.5 m-1 m of contaminated material is cultivated in lined beds, and periodically turned over to improve soil structure and oxygen supply Composting: a controlled biological process, which can be aerobic or anaerobic. The heat produced by microorganisms during the degradation must be maintained to properly compost contaminated soil (54 to 65 °C). Soils are mixed with bulking agents and organic amendments, such as wood chips, animal, and vegetative wastes, to enhance the porosity and nutrient content of the mixture to be decomposed. Slurry-phase bioreactor: is an engineered system that is designed to optimise conditions for biological degradation to take place. Soils are mixed with water to form a slurry and then put into a enclosed reaction vessel which gives greater control over the process. Applicability to contaminants and ground materials Organic Inorganic Materials Halogenated VOCs Y Metals N Gravel >2mm Y Halogenated SVOCs Y Radionuclides N Sand 0.06-2mm Y Non-halogenated VOCs Y Corrosives N Silt 2-60µm Y Non-halogenated SVOCs Y Cyanides ? Clay <2µm ? Organic corrosives ? Asbestos N Peat ? Organic cyanides ?
PCBs ? Miscellaneous Key Pesticides/herbicides ? Explosives N Usually or potentially applicable Y Dioxins/furans N May be applicable ? Not applicable N
Potential advantages: • can result in complete contaminant degradation; • soils can often be reused on site; • preservation or enhancement of soil structure (except for slurry-
phase bioreactor).
Limitations: • heavier organic contaminants are difficult
to degrade; • potential for formation of toxic
intermediate breakdown products; • conditions must be carefully controlled to
ensure complete and consistent treatment.
References: Nathanail et al., 2007; CL:AIRE TDP4, 2004; TDP6, 2004; FRTR, 2007
27
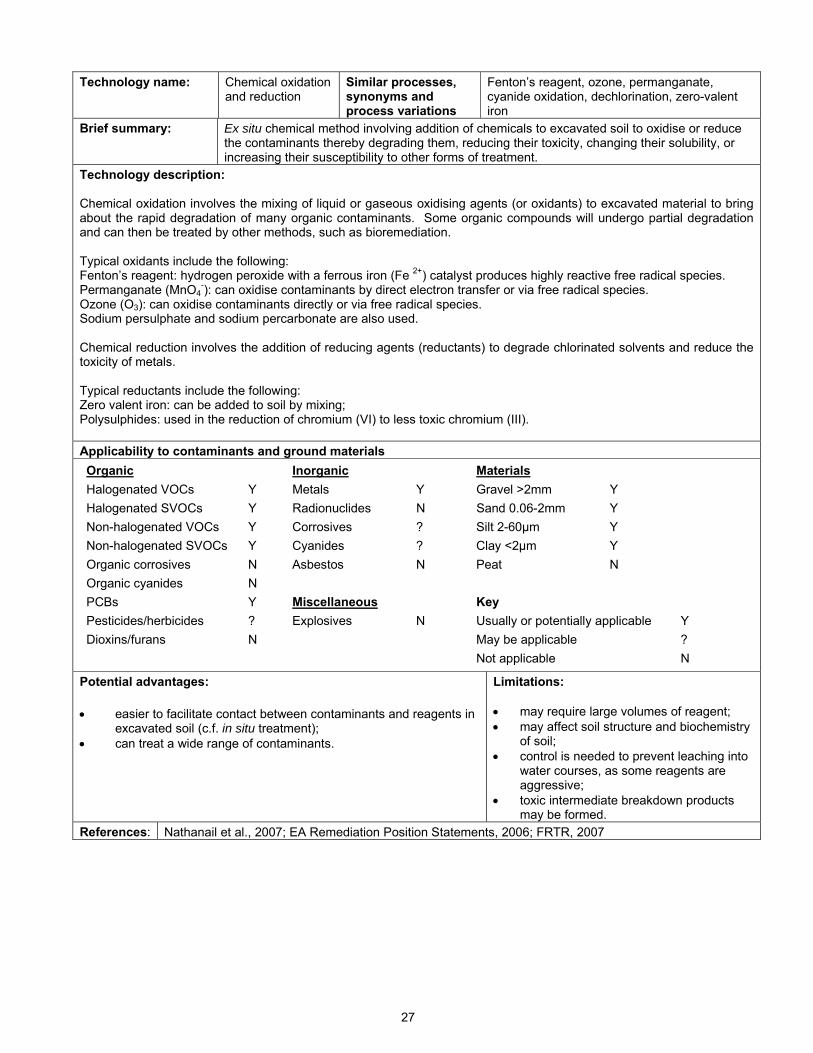
Technology name: Chemical oxidation and reduction
Similar processes, synonyms and process variations
Fenton’s reagent, ozone, permanganate, cyanide oxidation, dechlorination, zero-valent iron
Brief summary: Ex situ chemical method involving addition of chemicals to excavated soil to oxidise or reduce the contaminants thereby degrading them, reducing their toxicity, changing their solubility, or increasing their susceptibility to other forms of treatment.
Technology description: Chemical oxidation involves the mixing of liquid or gaseous oxidising agents (or oxidants) to excavated material to bring about the rapid degradation of many organic contaminants. Some organic compounds will undergo partial degradation and can then be treated by other methods, such as bioremediation. Typical oxidants include the following: Fenton’s reagent: hydrogen peroxide with a ferrous iron (Fe 2+) catalyst produces highly reactive free radical species. Permanganate (MnO4
-): can oxidise contaminants by direct electron transfer or via free radical species. Ozone (O3): can oxidise contaminants directly or via free radical species. Sodium persulphate and sodium percarbonate are also used. Chemical reduction involves the addition of reducing agents (reductants) to degrade chlorinated solvents and reduce the toxicity of metals. Typical reductants include the following: Zero valent iron: can be added to soil by mixing; Polysulphides: used in the reduction of chromium (VI) to less toxic chromium (III). Applicability to contaminants and ground materials Organic Inorganic Materials Halogenated VOCs Y Metals Y Gravel >2mm Y Halogenated SVOCs Y Radionuclides N Sand 0.06-2mm Y Non-halogenated VOCs Y Corrosives ? Silt 2-60µm Y Non-halogenated SVOCs Y Cyanides ? Clay <2µm Y Organic corrosives N Asbestos N Peat N Organic cyanides N
PCBs Y Miscellaneous Key Pesticides/herbicides ? Explosives N Usually or potentially applicable Y Dioxins/furans N May be applicable ? Not applicable N
Potential advantages: • easier to facilitate contact between contaminants and reagents in
excavated soil (c.f. in situ treatment); • can treat a wide range of contaminants.
Limitations: • may require large volumes of reagent; • may affect soil structure and biochemistry
of soil; • control is needed to prevent leaching into
water courses, as some reagents are aggressive;
• toxic intermediate breakdown products may be formed.
References: Nathanail et al., 2007; EA Remediation Position Statements, 2006; FRTR, 2007
28
Technology name: Soil washing and separation processes
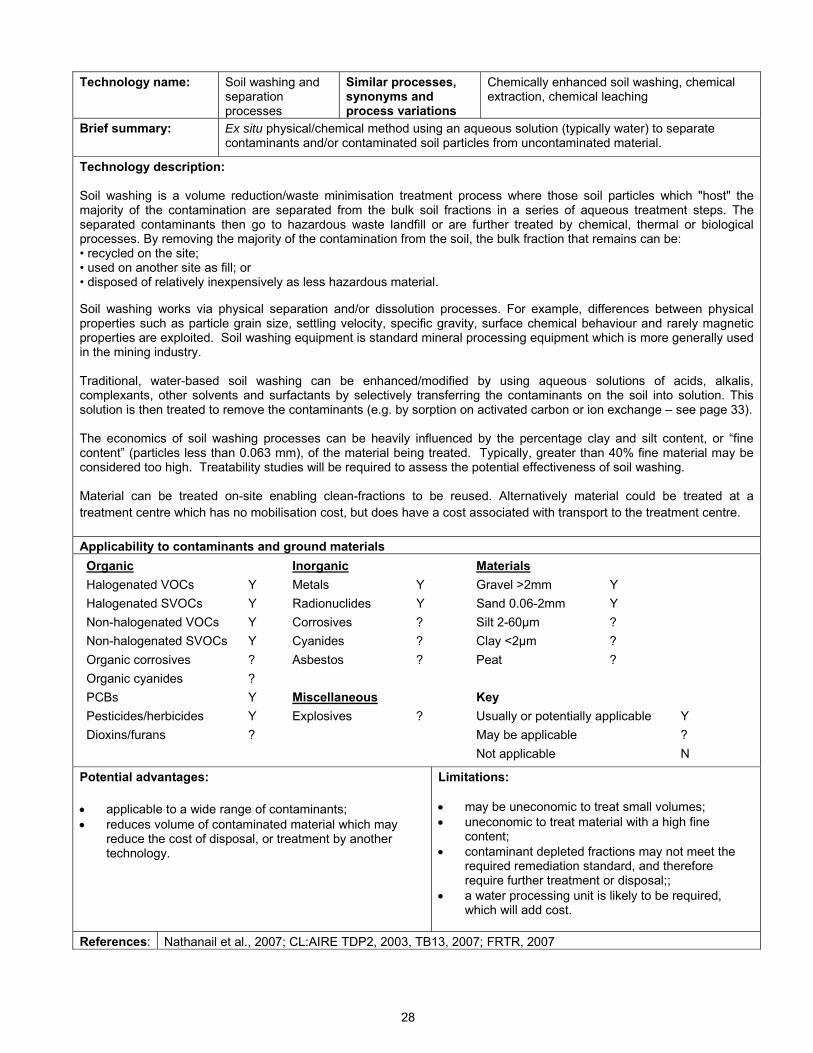
Similar processes, synonyms and process variations
Chemically enhanced soil washing, chemical extraction, chemical leaching
Brief summary: Ex situ physical/chemical method using an aqueous solution (typically water) to separate contaminants and/or contaminated soil particles from uncontaminated material.
Technology description: Soil washing is a volume reduction/waste minimisation treatment process where those soil particles which "host" the majority of the contamination are separated from the bulk soil fractions in a series of aqueous treatment steps. The separated contaminants then go to hazardous waste landfill or are further treated by chemical, thermal or biological processes. By removing the majority of the contamination from the soil, the bulk fraction that remains can be: • recycled on the site; • used on another site as fill; or • disposed of relatively inexpensively as less hazardous material.
Soil washing works via physical separation and/or dissolution processes. For example, differences between physical properties such as particle grain size, settling velocity, specific gravity, surface chemical behaviour and rarely magnetic properties are exploited. Soil washing equipment is standard mineral processing equipment which is more generally used in the mining industry. Traditional, water-based soil washing can be enhanced/modified by using aqueous solutions of acids, alkalis, complexants, other solvents and surfactants by selectively transferring the contaminants on the soil into solution. This solution is then treated to remove the contaminants (e.g. by sorption on activated carbon or ion exchange – see page 33). The economics of soil washing processes can be heavily influenced by the percentage clay and silt content, or “fine content” (particles less than 0.063 mm), of the material being treated. Typically, greater than 40% fine material may be considered too high. Treatability studies will be required to assess the potential effectiveness of soil washing. Material can be treated on-site enabling clean-fractions to be reused. Alternatively material could be treated at a treatment centre which has no mobilisation cost, but does have a cost associated with transport to the treatment centre. Applicability to contaminants and ground materials Organic Inorganic Materials Halogenated VOCs Y Metals Y Gravel >2mm Y Halogenated SVOCs Y Radionuclides Y Sand 0.06-2mm Y Non-halogenated VOCs Y Corrosives ? Silt 2-60µm ? Non-halogenated SVOCs Y Cyanides ? Clay <2µm ? Organic corrosives ? Asbestos ? Peat ? Organic cyanides ?
PCBs Y Miscellaneous Key Pesticides/herbicides Y Explosives ? Usually or potentially applicable Y Dioxins/furans ? May be applicable ? Not applicable N
Potential advantages: • applicable to a wide range of contaminants; • reduces volume of contaminated material which may
reduce the cost of disposal, or treatment by another technology.
Limitations: • may be uneconomic to treat small volumes; • uneconomic to treat material with a high fine
content; • contaminant depleted fractions may not meet the
required remediation standard, and therefore require further treatment or disposal;;
• a water processing unit is likely to be required, which will add cost.
References: Nathanail et al., 2007; CL:AIRE TDP2, 2003, TB13, 2007; FRTR, 2007
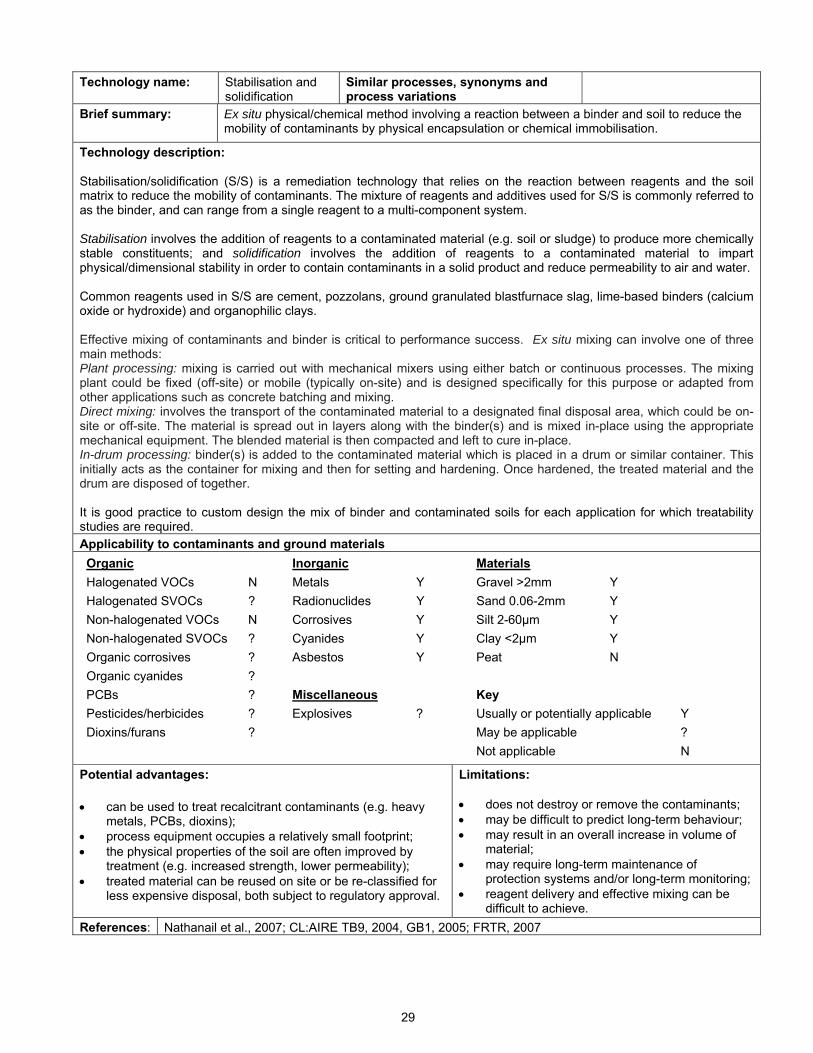
29
Technology name: Stabilisation and solidification
Similar processes, synonyms and process variations
Brief summary: Ex situ physical/chemical method involving a reaction between a binder and soil to reduce the mobility of contaminants by physical encapsulation or chemical immobilisation.
Technology description: Stabilisation/solidification (S/S) is a remediation technology that relies on the reaction between reagents and the soil matrix to reduce the mobility of contaminants. The mixture of reagents and additives used for S/S is commonly referred to as the binder, and can range from a single reagent to a multi-component system. Stabilisation involves the addition of reagents to a contaminated material (e.g. soil or sludge) to produce more chemically stable constituents; and solidification involves the addition of reagents to a contaminated material to impart physical/dimensional stability in order to contain contaminants in a solid product and reduce permeability to air and water. Common reagents used in S/S are cement, pozzolans, ground granulated blastfurnace slag, lime-based binders (calcium oxide or hydroxide) and organophilic clays. Effective mixing of contaminants and binder is critical to performance success. Ex situ mixing can involve one of three main methods: Plant processing: mixing is carried out with mechanical mixers using either batch or continuous processes. The mixing plant could be fixed (off-site) or mobile (typically on-site) and is designed specifically for this purpose or adapted from other applications such as concrete batching and mixing. Direct mixing: involves the transport of the contaminated material to a designated final disposal area, which could be on-site or off-site. The material is spread out in layers along with the binder(s) and is mixed in-place using the appropriate mechanical equipment. The blended material is then compacted and left to cure in-place. In-drum processing: binder(s) is added to the contaminated material which is placed in a drum or similar container. This initially acts as the container for mixing and then for setting and hardening. Once hardened, the treated material and the drum are disposed of together. It is good practice to custom design the mix of binder and contaminated soils for each application for which treatability studies are required. Applicability to contaminants and ground materials Organic Inorganic Materials Halogenated VOCs N Metals Y Gravel >2mm Y Halogenated SVOCs ? Radionuclides Y Sand 0.06-2mm Y Non-halogenated VOCs N Corrosives Y Silt 2-60µm Y Non-halogenated SVOCs ? Cyanides Y Clay <2µm Y Organic corrosives ? Asbestos Y Peat N Organic cyanides ?
PCBs ? Miscellaneous Key Pesticides/herbicides ? Explosives ? Usually or potentially applicable Y Dioxins/furans ? May be applicable ? Not applicable N
Potential advantages: • can be used to treat recalcitrant contaminants (e.g. heavy
metals, PCBs, dioxins); • process equipment occupies a relatively small footprint; • the physical properties of the soil are often improved by
treatment (e.g. increased strength, lower permeability); • treated material can be reused on site or be re-classified for
less expensive disposal, both subject to regulatory approval.
Limitations: • does not destroy or remove the contaminants; • may be difficult to predict long-term behaviour; • may result in an overall increase in volume of
material; • may require long-term maintenance of
protection systems and/or long-term monitoring; • reagent delivery and effective mixing can be
difficult to achieve. References: Nathanail et al., 2007; CL:AIRE TB9, 2004, GB1, 2005; FRTR, 2007
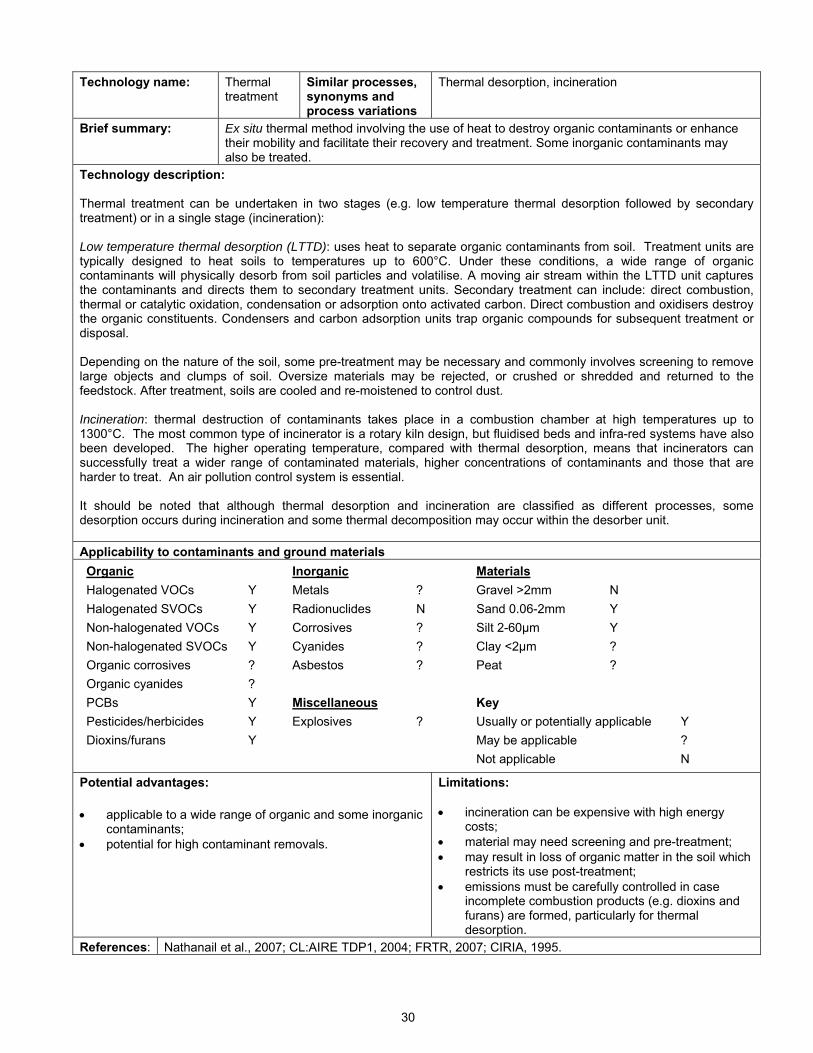
30
Technology name: Thermal treatment
Similar processes, synonyms and process variations
Thermal desorption, incineration
Brief summary: Ex situ thermal method involving the use of heat to destroy organic contaminants or enhance their mobility and facilitate their recovery and treatment. Some inorganic contaminants may also be treated.
Technology description: Thermal treatment can be undertaken in two stages (e.g. low temperature thermal desorption followed by secondary treatment) or in a single stage (incineration): Low temperature thermal desorption (LTTD): uses heat to separate organic contaminants from soil. Treatment units are typically designed to heat soils to temperatures up to 600°C. Under these conditions, a wide range of organic contaminants will physically desorb from soil particles and volatilise. A moving air stream within the LTTD unit captures the contaminants and directs them to secondary treatment units. Secondary treatment can include: direct combustion, thermal or catalytic oxidation, condensation or adsorption onto activated carbon. Direct combustion and oxidisers destroy the organic constituents. Condensers and carbon adsorption units trap organic compounds for subsequent treatment or disposal. Depending on the nature of the soil, some pre-treatment may be necessary and commonly involves screening to remove large objects and clumps of soil. Oversize materials may be rejected, or crushed or shredded and returned to the feedstock. After treatment, soils are cooled and re-moistened to control dust. Incineration: thermal destruction of contaminants takes place in a combustion chamber at high temperatures up to 1300°C. The most common type of incinerator is a rotary kiln design, but fluidised beds and infra-red systems have also been developed. The higher operating temperature, compared with thermal desorption, means that incinerators can successfully treat a wider range of contaminated materials, higher concentrations of contaminants and those that are harder to treat. An air pollution control system is essential. It should be noted that although thermal desorption and incineration are classified as different processes, some desorption occurs during incineration and some thermal decomposition may occur within the desorber unit. Applicability to contaminants and ground materials Organic Inorganic Materials Halogenated VOCs Y Metals ? Gravel >2mm N Halogenated SVOCs Y Radionuclides N Sand 0.06-2mm Y Non-halogenated VOCs Y Corrosives ? Silt 2-60µm Y Non-halogenated SVOCs Y Cyanides ? Clay <2µm ? Organic corrosives ? Asbestos ? Peat ? Organic cyanides ?
PCBs Y Miscellaneous Key Pesticides/herbicides Y Explosives ? Usually or potentially applicable Y Dioxins/furans Y May be applicable ? Not applicable N
Potential advantages: • applicable to a wide range of organic and some inorganic
contaminants; • potential for high contaminant removals.
Limitations: • incineration can be expensive with high energy
costs; • material may need screening and pre-treatment; • may result in loss of organic matter in the soil which
restricts its use post-treatment; • emissions must be carefully controlled in case
incomplete combustion products (e.g. dioxins and furans) are formed, particularly for thermal desorption.
References: Nathanail et al., 2007; CL:AIRE TDP1, 2004; FRTR, 2007; CIRIA, 1995.
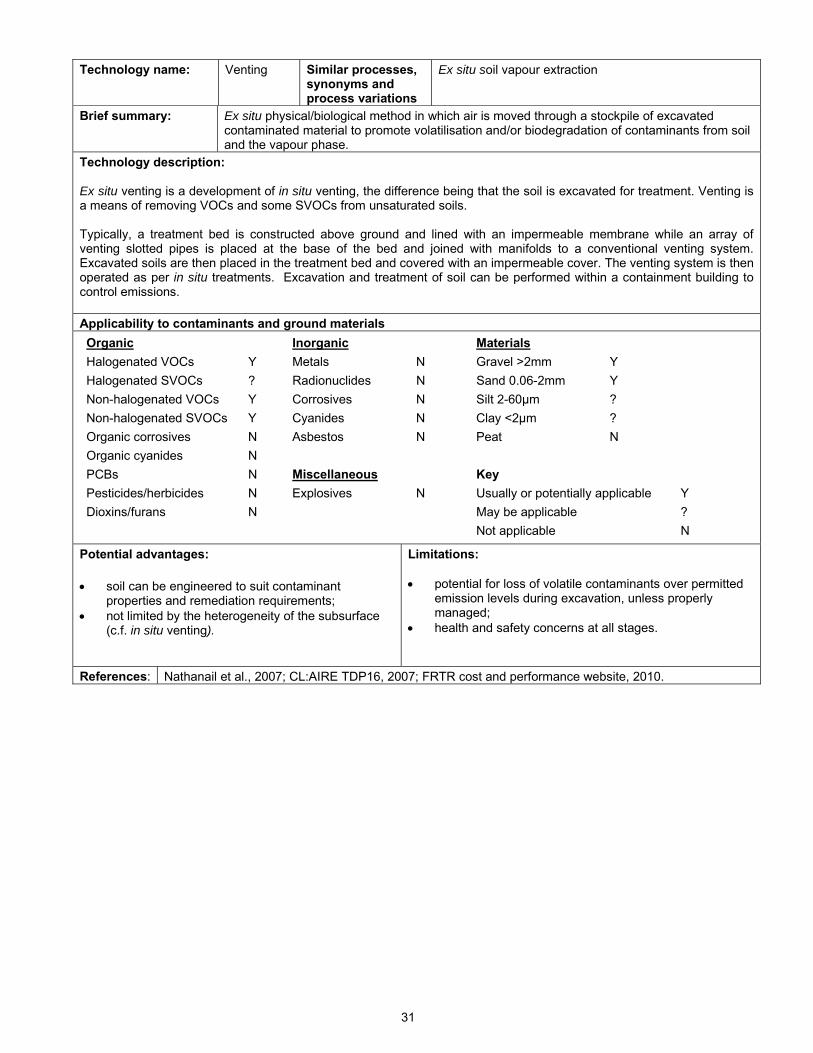
31
Technology name: Venting Similar processes,
synonyms and process variations
Ex situ soil vapour extraction
Brief summary: Ex situ physical/biological method in which air is moved through a stockpile of excavated contaminated material to promote volatilisation and/or biodegradation of contaminants from soil and the vapour phase.
Technology description: Ex situ venting is a development of in situ venting, the difference being that the soil is excavated for treatment. Venting is a means of removing VOCs and some SVOCs from unsaturated soils. Typically, a treatment bed is constructed above ground and lined with an impermeable membrane while an array of venting slotted pipes is placed at the base of the bed and joined with manifolds to a conventional venting system. Excavated soils are then placed in the treatment bed and covered with an impermeable cover. The venting system is then operated as per in situ treatments. Excavation and treatment of soil can be performed within a containment building to control emissions. Applicability to contaminants and ground materials Organic Inorganic Materials Halogenated VOCs Y Metals N Gravel >2mm Y Halogenated SVOCs ? Radionuclides N Sand 0.06-2mm Y Non-halogenated VOCs Y Corrosives N Silt 2-60µm ? Non-halogenated SVOCs Y Cyanides N Clay <2µm ? Organic corrosives N Asbestos N Peat N Organic cyanides N
PCBs N Miscellaneous Key Pesticides/herbicides N Explosives N Usually or potentially applicable Y Dioxins/furans N May be applicable ? Not applicable N
Potential advantages: • soil can be engineered to suit contaminant
properties and remediation requirements; • not limited by the heterogeneity of the subsurface
(c.f. in situ venting).
Limitations: • potential for loss of volatile contaminants over permitted
emission levels during excavation, unless properly managed;
• health and safety concerns at all stages.
References: Nathanail et al., 2007; CL:AIRE TDP16, 2007; FRTR cost and performance website, 2010.
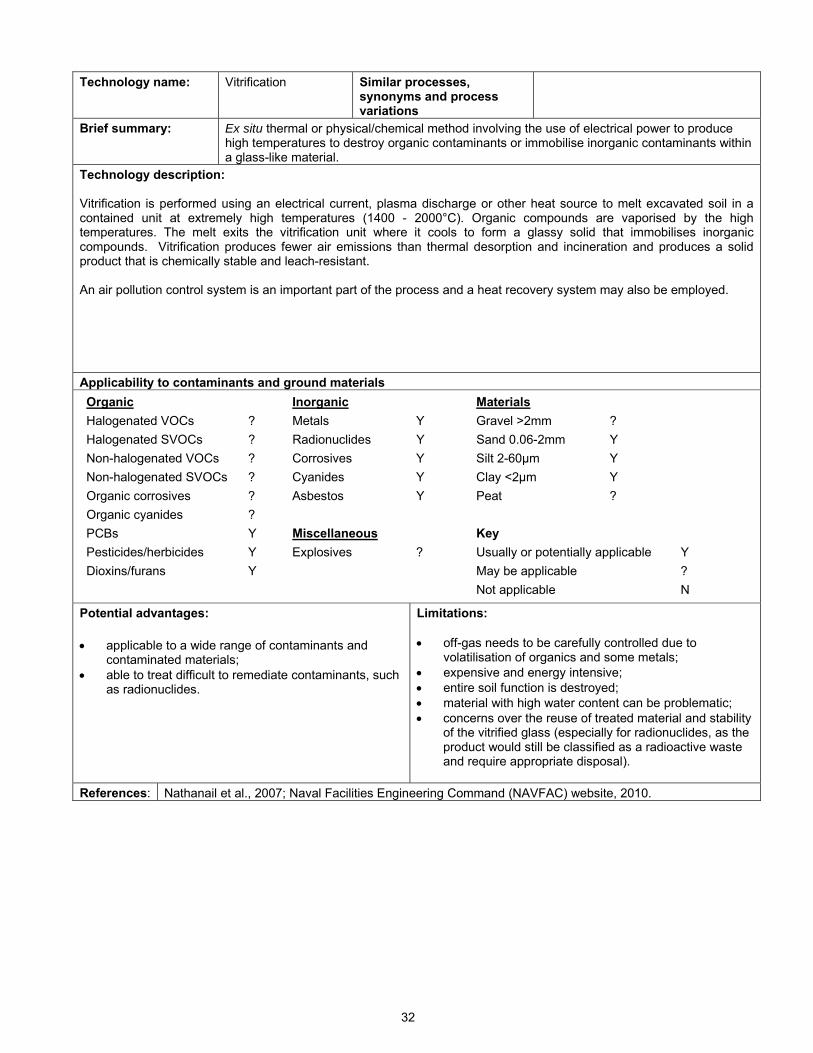
32
Technology name: Vitrification Similar processes, synonyms and process variations
Brief summary: Ex situ thermal or physical/chemical method involving the use of electrical power to produce high temperatures to destroy organic contaminants or immobilise inorganic contaminants within a glass-like material.
Technology description: Vitrification is performed using an electrical current, plasma discharge or other heat source to melt excavated soil in a contained unit at extremely high temperatures (1400 - 2000°C). Organic compounds are vaporised by the high temperatures. The melt exits the vitrification unit where it cools to form a glassy solid that immobilises inorganic compounds. Vitrification produces fewer air emissions than thermal desorption and incineration and produces a solid product that is chemically stable and leach-resistant. An air pollution control system is an important part of the process and a heat recovery system may also be employed.
Applicability to contaminants and ground materials Organic Inorganic Materials Halogenated VOCs ? Metals Y Gravel >2mm ? Halogenated SVOCs ? Radionuclides Y Sand 0.06-2mm Y Non-halogenated VOCs ? Corrosives Y Silt 2-60µm Y Non-halogenated SVOCs ? Cyanides Y Clay <2µm Y Organic corrosives ? Asbestos Y Peat ? Organic cyanides ?
PCBs Y Miscellaneous Key Pesticides/herbicides Y Explosives ? Usually or potentially applicable Y Dioxins/furans Y May be applicable ? Not applicable N
Potential advantages: • applicable to a wide range of contaminants and
contaminated materials; • able to treat difficult to remediate contaminants, such
as radionuclides.
Limitations: • off-gas needs to be carefully controlled due to
volatilisation of organics and some metals; • expensive and energy intensive; • entire soil function is destroyed; • material with high water content can be problematic; • concerns over the reuse of treated material and stability
of the vitrified glass (especially for radionuclides, as the product would still be classified as a radioactive waste and require appropriate disposal).
References: Nathanail et al., 2007; Naval Facilities Engineering Command (NAVFAC) website, 2010.
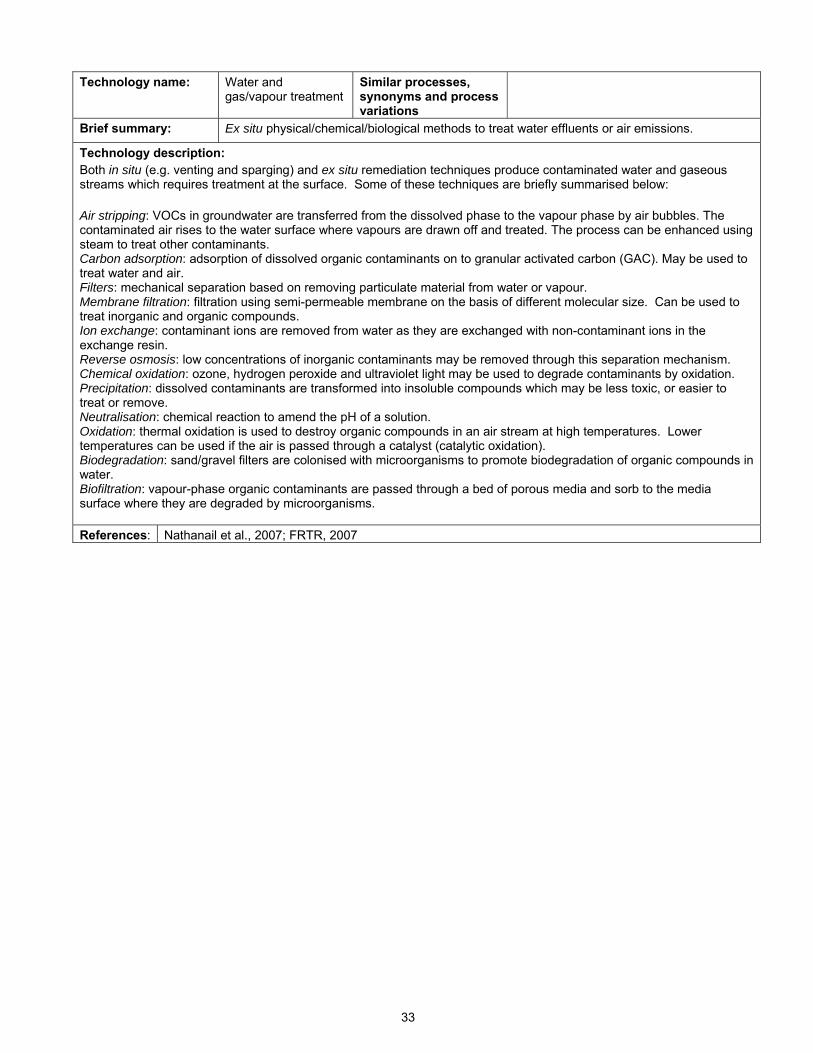
33
Technology name: Water and gas/vapour treatment
Similar processes, synonyms and process variations
Brief summary: Ex situ physical/chemical/biological methods to treat water effluents or air emissions.
Technology description: Both in situ (e.g. venting and sparging) and ex situ remediation techniques produce contaminated water and gaseous streams which requires treatment at the surface. Some of these techniques are briefly summarised below: Air stripping: VOCs in groundwater are transferred from the dissolved phase to the vapour phase by air bubbles. The contaminated air rises to the water surface where vapours are drawn off and treated. The process can be enhanced using steam to treat other contaminants. Carbon adsorption: adsorption of dissolved organic contaminants on to granular activated carbon (GAC). May be used to treat water and air. Filters: mechanical separation based on removing particulate material from water or vapour. Membrane filtration: filtration using semi-permeable membrane on the basis of different molecular size. Can be used to treat inorganic and organic compounds. Ion exchange: contaminant ions are removed from water as they are exchanged with non-contaminant ions in the exchange resin. Reverse osmosis: low concentrations of inorganic contaminants may be removed through this separation mechanism. Chemical oxidation: ozone, hydrogen peroxide and ultraviolet light may be used to degrade contaminants by oxidation. Precipitation: dissolved contaminants are transformed into insoluble compounds which may be less toxic, or easier to treat or remove. Neutralisation: chemical reaction to amend the pH of a solution. Oxidation: thermal oxidation is used to destroy organic compounds in an air stream at high temperatures. Lower temperatures can be used if the air is passed through a catalyst (catalytic oxidation). Biodegradation: sand/gravel filters are colonised with microorganisms to promote biodegradation of organic compounds in water. Biofiltration: vapour-phase organic contaminants are passed through a bed of porous media and sorb to the media surface where they are degraded by microorganisms. References: Nathanail et al., 2007; FRTR, 2007
34
1.4 Treatment Profile for Civil engineering-based methods
Technology name: Civil engineering-based methods
Similar processes, synonyms and process variations
Containment, barriers, cover systems, excavation, landfill disposal, abstraction, pump and treat
Brief summary: Ex situ or in situ methods to manage contaminated soil and groundwater using established engineering approaches.
Technology description: Civil engineering approaches are commonly used and can be grouped into containment measures and excavation/abstraction measures. The potential advantages of these methods are that they are applicable to a range of ground conditions and contaminant types, they can be rapidly deployed and use established and proven engineering techniques. In containment, the contaminated matrix is isolated through the use of barriers or cover systems which prevent exposure of the surrounding environment. Vertical barriers: a physical wall constructed around a contaminant source to isolate contaminants, minimise the spreading of contaminants and restrict further groundwater contamination. Horizontal barriers: injection or placement of a physical impermeable construction above or beneath a contaminated volume. Cover systems: an engineered horizontal layer of “uncontaminated” material placed on the surface or in the sub-surface. The cover may be single or multi-layered and may be used for forming a barrier between contaminated materials and people, animals and plants or for controlling the upward migration of contaminated water or gas. Covers may be soil or soil-like material or synthetics such as geotextiles and membranes. Containment measures may be economic where large volumes of contaminated material prevent the cost-effective use of excavation, although they do not remove contamination or treat groundwater and require long term monitoring. Excavation and abstraction measures rely on the removal of soil or groundwater, which then needs to be disposed of or subjected to treatment. Excavation: a process for removal of solid material, including soil, from the ground prior to treatment or disposal. Material may be temporarily stockpiled to allow screening and segregation, additional sampling or because of limits on the cost of transport or disposal. Pump and treat: groundwater abstraction by wells followed by above-ground surface treatment (see page 33) and return to surface water, the aquifer or to sewer. Pumping alone may also be used as a means of hydraulic containment i.e. lowering the water table to isolate contamination. Landfill: disposal of excavated material to controlled void space, either on-site or off-site. The main advantage of excavation and off-site disposal is that it removes the contaminants (and the risk they pose) from the site. However, their use may be restricted on sites with operational structures or services. High costs associated with handling and transporting large volumes of material, and the noise and nuisance of vehicle movements to local populations, means that alternative remedial solutions may be sought. Pump and treat can be an effective method for remediating dissolved phase contaminants. There is a likelihood of contamination rebound after pumping stops, which means it can be difficult to decide when to cease pumping. References: Nathanail et al., 2007; FRTR, 2007; CIRIA, 1995.
35
2. AN ENVIRONMENTAL, SOCIAL AND ECONOMIC IMPACT ASSESSMENT OF REMEDIATION TECHNIQUES 2.1 Introduction This section presents the results of a desk-based assessment of the environmental, social and economic impacts of each selected soil and groundwater remediation technique. As a basis for this assessment, formulated indicators of sustainability are taken from the United Kingdom’s Sustainable Remediation Forum (SuRF-UK) which has developed 18 ‘Headline Indicator Categories’ for assessing the sustainability of soil and groundwater remediation1. These Headline Indicator Categories are shown in Table 2.1, taken directly from the 2010 SuRF-UK Report ‘A Framework for Assessing the Sustainability of Soil and Groundwater Remediation’. For each Headline Indicator Category, active descriptions have been, and presently are being, collectively developed, tested and refined. This assessment uses the most recent ‘October 2010’ indicator descriptions, as written in Tables 2.2, 2.3 and 2.4. These tables initially assess the appropriateness of using each of the 18 identified Headline Indicator Categories against remediation technology use. This section has also drawn upon the Contaminated Land Ready Reference (Nathanail et al., 2007) as the most recent and comprehensive work on practical implementation of various remediation technologies, and follows the technology separation units as in Section 1. In addition to providing a guide to assessing remediation technologies qualitatively, it could become the base framework for conducting case-specific, or more sophisticated semi-quantitative assessment using sustainability criteria in the selection of remediation technologies. Table 2.1: Environmental, Social and Economic Headline Indicator Categories1
Environmental (Described in Table 2.2)
Social (Described in Table 2.3)
Economic (Described in Table 2.4)
1 Impacts on air (including climate change)
Impacts on human health and safety
Direct economic costs and benefits
2 Impacts on soil and ground conditions
Ethical and equity considerations
Indirect economic costs and benefits
3 Impacts on water Impacts on neighbourhoods or regions Employment and capital gain
4 Impacts on ecology Community involvement and satisfaction Gearing
5 Use of natural resources and generation of waste
Compliance with policy objectives and strategies Life span and ‘project risks’
6 Intrusiveness Uncertainty and evidence Project flexibility A summary of the process and structure of this section is as follows:
1) The 18 SuRF-UK Headline Indicator Categories are listed from October 2010 descriptions, and are discussed as to their suitability for assessment purely against remediation technique type (i.e. independent of the case-specific site and geographical context) (Section 2.2);
2) For those Headline Indicator Categories from which assessment is judged to be suitable at a remedial technique level, this report has derived a selection of principal ‘definition criteria’ (or actual sustainability impact criteria) to represent the Headline Indicator Categories for remedial technique type assessment (Section 2.2);
3) Each selected remediation technology is qualitatively assessed against the derived ‘definition criteria’ to provide insight into how different remedial techniques perform. Also, this provides an example of how qualitative assessment for remedial techniques can be built up once further site and context information becomes available, as introduced in Section 2.3 and shown in Section 2.4 (in situ) and 2.5 (ex situ).
1 As first identified within ‘A Review of Published Sustainability Indicator Sets’ (SuRF-UK, 2009) and developed further in ‘A Framework for Assessing the Sustainability of Soil and Groundwater Remediation’ (SuRF-UK 2010). Future updates to Headline Indicators will be made available at www.claire.co.uk/surfuk.
36
Where Remediation Impacts Begin and End A first key point of studying sustainability indicator categories for land developments, is recognition of the scale at which they may apply, which could be any of the following:
1) capable of assessment at a technology-scale (as demonstrated within this assessment); 2) site related (e.g. contaminant, geology and remedial target dependent); 3) context related (e.g. ‘Fit with planning and policy strategies and initiatives’); or 4) a combination of the above.
Assessment Level Approach Within Section 2 of this report, assessment could have been made by studying headline indicators for the net impacts of both the technology-specific remediation and the entire remediation-redevelopment project (‘site’ and ‘context related’ issues). However, this approach would have resulted in the majority of impacts to be assessed relating to the wider development which is case-specific. Additionally, net impacts surrounding the technology-specific remediation selection may have been outweighed by the larger development-wide advantages and disadvantages. It was decided that the most appropriate and objective approach was through assessing just the impacts relating to the remediation technology-related scale. This approach has the advantage of net impacts for all technologies not being dwarfed by differing site or contextual-issues for each technology. Minor disadvantages of this approach are: i) listed negative impacts may appear to outweigh positive impacts in number (as the overall benefits of the remediation will be incorporated in the more encompassing development-scale); and ii) a number of the Headline Indicator Categories may not be appropriate in assessing impacts at the remediation technology-selection scale. Appropriate and Defined Impact Criteria (for Headline Indicators) Definition criteria which best represent the Headline Indicator Categories appropriate for assessment at a technology-scale are derived and explained in Tables 2.3 (Environmental Headline Indicators), 2.4 (Social Headline Indicators), and 2.4 (Economic Headline Indicators). These assessment ‘definition criteria’ have been selected as they are considered vital to allow practical implementation of the framework for a qualitative review of positive and negative impacts relating to technology selection. Providing clear definitions of the sustainability impact factors allows an awareness of what could be used for assessing impacts and provides accountability for qualitative judgements made. Sections 2.4 and 2.5 showcase impact assessment tables for each principal remediation technology type based on the appropriate definition criteria.
37
2.2 Headline Indicators, Suitability for Remediation Technology Selection and Definitions
This section consists of three tables which represent the ‘Environmental’, ‘Social’ and ‘Economic’ pillars of sustainable development, and sets out to examine in more detail the 18 SuRF-UK Headline Indicator Categories. By each Headline Indicator Category there are three tabulated rows which represent the SuRF-UK descriptions, a discussion as to their suitability for judging remediation technology-specific impacts, and then what criteria have been selected to define these indicators for the purposes of the assessment against the remediation techniques selected in Sections 2.4 and 2.5. This section is provided to show an example of how remediation technologies can be qualitatively assessed against sustainability criteria, and could be adapted further if either:
• different measurable criteria were deemed more important than those provided; or • more information was available relating to the site, or context of the proposed remediation
(i.e. if the assessment were an exercise based on: technology; site; and context-related knowledge).
Headline Indicator Suitability As stated, the Headline Indicators used in this report are taken from the 2009 SuRF-UK Report: ‘A Review of Published Sustainability Indicator Sets’. In the following Tables 2.2, 2.3 and 2.4 the Headline Indicator Categories are evaluated to decide upon their capability of appraisal with the scales of assessment and approach outlined in Section 2.1. It should be noted that once more information is known about the actual site earmarked for remediation and its situation, or local context, then an assessment using wider impact criteria would be possible.
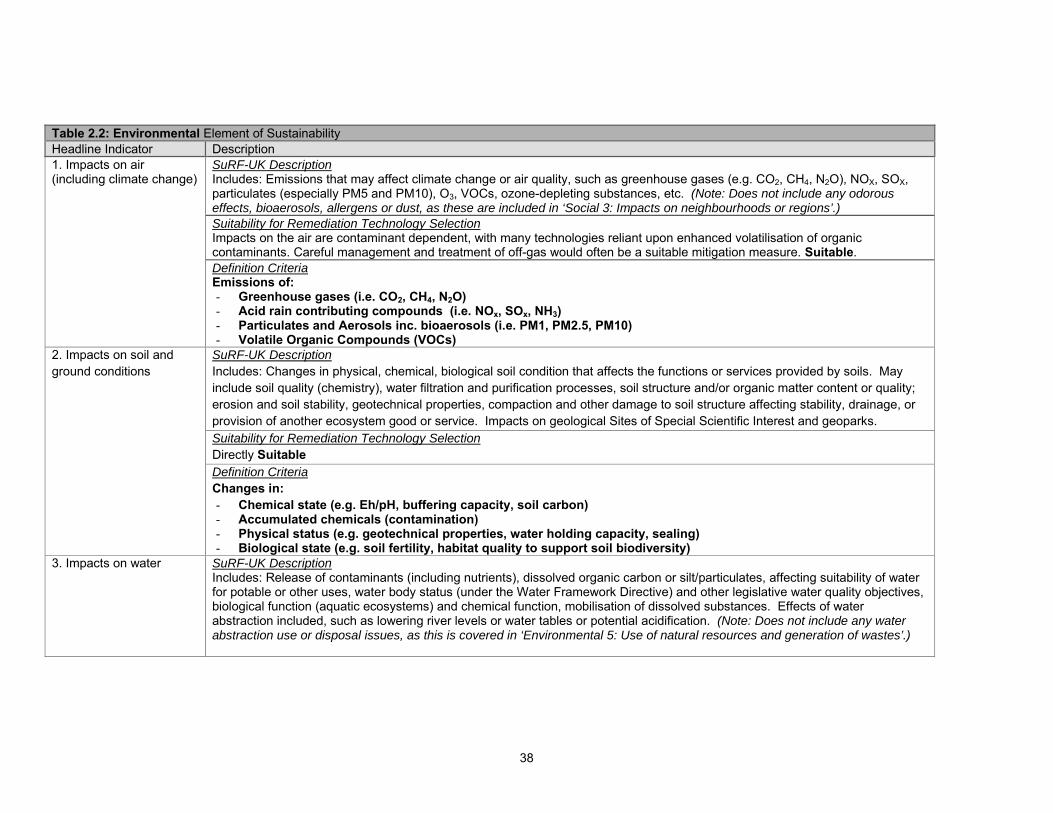
38
Table 2.2: Environmental Element of Sustainability Headline Indicator Description
SuRF-UK Description Includes: Emissions that may affect climate change or air quality, such as greenhouse gases (e.g. CO2, CH4, N2O), NOX, SOX, particulates (especially PM5 and PM10), O3, VOCs, ozone-depleting substances, etc. (Note: Does not include any odorous effects, bioaerosols, allergens or dust, as these are included in ‘Social 3: Impacts on neighbourhoods or regions’.) Suitability for Remediation Technology Selection Impacts on the air are contaminant dependent, with many technologies reliant upon enhanced volatilisation of organic contaminants. Careful management and treatment of off-gas would often be a suitable mitigation measure. Suitable.
1. Impacts on air (including climate change)
Definition Criteria Emissions of: - Greenhouse gases (i.e. CO2, CH4, N2O) - Acid rain contributing compounds (i.e. NOx, SOx, NH3) - Particulates and Aerosols inc. bioaerosols (i.e. PM1, PM2.5, PM10) - Volatile Organic Compounds (VOCs)
SuRF-UK Description Includes: Changes in physical, chemical, biological soil condition that affects the functions or services provided by soils. May include soil quality (chemistry), water filtration and purification processes, soil structure and/or organic matter content or quality; erosion and soil stability, geotechnical properties, compaction and other damage to soil structure affecting stability, drainage, or provision of another ecosystem good or service. Impacts on geological Sites of Special Scientific Interest and geoparks. Suitability for Remediation Technology Selection Directly Suitable
2. Impacts on soil and ground conditions
Definition Criteria Changes in: - Chemical state (e.g. Eh/pH, buffering capacity, soil carbon) - Accumulated chemicals (contamination) - Physical status (e.g. geotechnical properties, water holding capacity, sealing) - Biological state (e.g. soil fertility, habitat quality to support soil biodiversity)
3. Impacts on water SuRF-UK Description Includes: Release of contaminants (including nutrients), dissolved organic carbon or silt/particulates, affecting suitability of water for potable or other uses, water body status (under the Water Framework Directive) and other legislative water quality objectives, biological function (aquatic ecosystems) and chemical function, mobilisation of dissolved substances. Effects of water abstraction included, such as lowering river levels or water tables or potential acidification. (Note: Does not include any water abstraction use or disposal issues, as this is covered in ‘Environmental 5: Use of natural resources and generation of wastes’.)
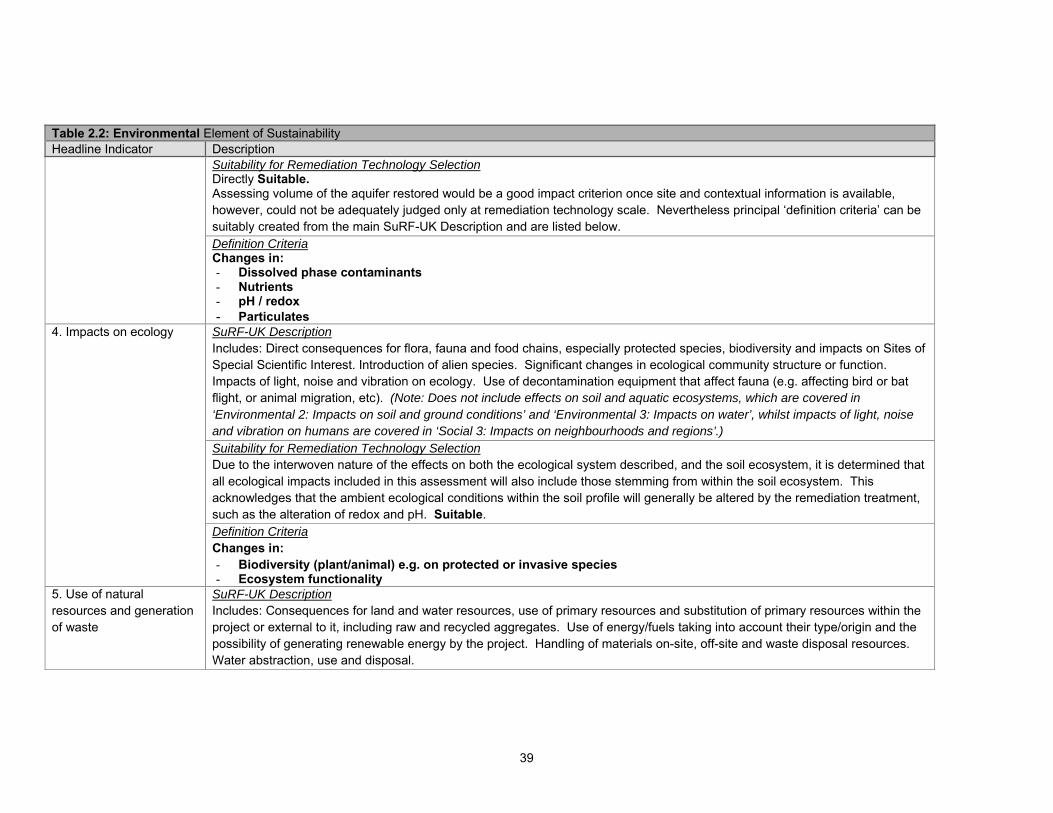
39
Table 2.2: Environmental Element of Sustainability Headline Indicator Description
Suitability for Remediation Technology Selection Directly Suitable. Assessing volume of the aquifer restored would be a good impact criterion once site and contextual information is available, however, could not be adequately judged only at remediation technology scale. Nevertheless principal ‘definition criteria’ can be suitably created from the main SuRF-UK Description and are listed below.
Definition Criteria Changes in: - Dissolved phase contaminants - Nutrients - pH / redox - Particulates
SuRF-UK Description Includes: Direct consequences for flora, fauna and food chains, especially protected species, biodiversity and impacts on Sites of Special Scientific Interest. Introduction of alien species. Significant changes in ecological community structure or function. Impacts of light, noise and vibration on ecology. Use of decontamination equipment that affect fauna (e.g. affecting bird or bat flight, or animal migration, etc). (Note: Does not include effects on soil and aquatic ecosystems, which are covered in ‘Environmental 2: Impacts on soil and ground conditions’ and ‘Environmental 3: Impacts on water’, whilst impacts of light, noise and vibration on humans are covered in ‘Social 3: Impacts on neighbourhoods and regions’.) Suitability for Remediation Technology Selection Due to the interwoven nature of the effects on both the ecological system described, and the soil ecosystem, it is determined that all ecological impacts included in this assessment will also include those stemming from within the soil ecosystem. This acknowledges that the ambient ecological conditions within the soil profile will generally be altered by the remediation treatment, such as the alteration of redox and pH. Suitable.
4. Impacts on ecology
Definition Criteria Changes in: - Biodiversity (plant/animal) e.g. on protected or invasive species - Ecosystem functionality
5. Use of natural resources and generation of waste
SuRF-UK Description Includes: Consequences for land and water resources, use of primary resources and substitution of primary resources within the project or external to it, including raw and recycled aggregates. Use of energy/fuels taking into account their type/origin and the possibility of generating renewable energy by the project. Handling of materials on-site, off-site and waste disposal resources. Water abstraction, use and disposal.
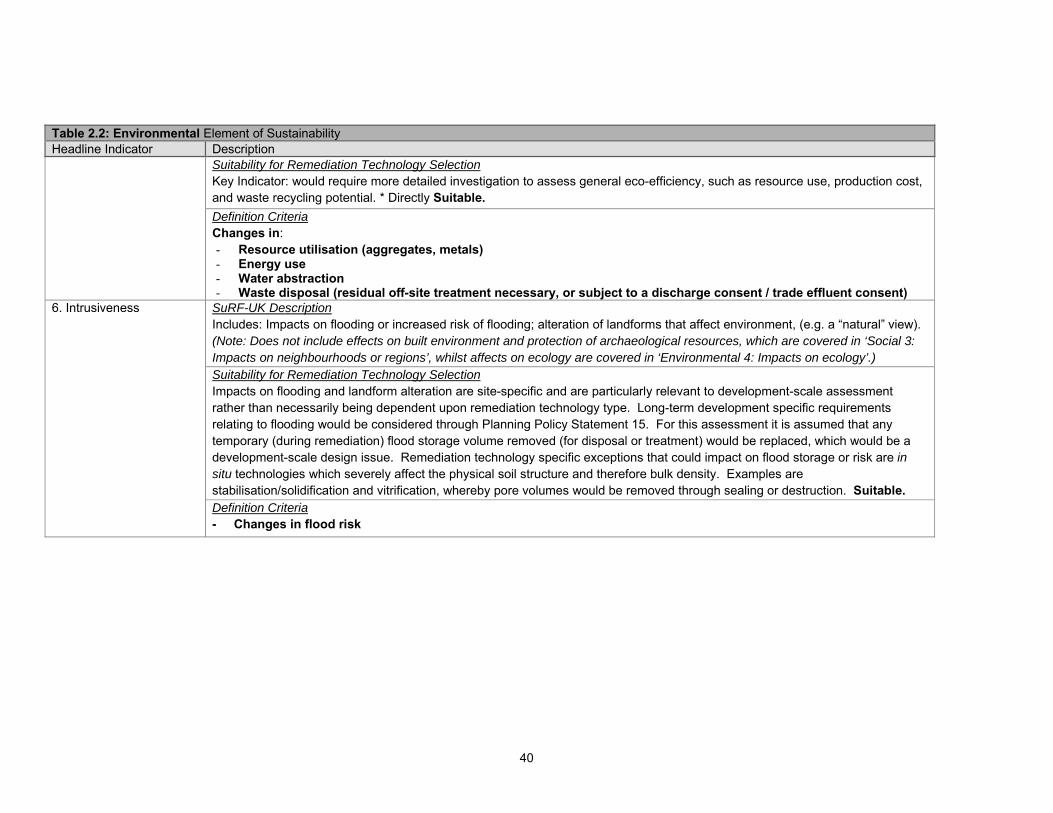
40
Table 2.2: Environmental Element of Sustainability Headline Indicator Description
Suitability for Remediation Technology Selection Key Indicator: would require more detailed investigation to assess general eco-efficiency, such as resource use, production cost, and waste recycling potential. * Directly Suitable.
Definition Criteria Changes in: - Resource utilisation (aggregates, metals) - Energy use - Water abstraction - Waste disposal (residual off-site treatment necessary, or subject to a discharge consent / trade effluent consent)
SuRF-UK Description Includes: Impacts on flooding or increased risk of flooding; alteration of landforms that affect environment, (e.g. a “natural” view). (Note: Does not include effects on built environment and protection of archaeological resources, which are covered in ‘Social 3: Impacts on neighbourhoods or regions’, whilst affects on ecology are covered in ‘Environmental 4: Impacts on ecology’.) Suitability for Remediation Technology Selection Impacts on flooding and landform alteration are site-specific and are particularly relevant to development-scale assessment rather than necessarily being dependent upon remediation technology type. Long-term development specific requirements relating to flooding would be considered through Planning Policy Statement 15. For this assessment it is assumed that any temporary (during remediation) flood storage volume removed (for disposal or treatment) would be replaced, which would be a development-scale design issue. Remediation technology specific exceptions that could impact on flood storage or risk are in situ technologies which severely affect the physical soil structure and therefore bulk density. Examples are stabilisation/solidification and vitrification, whereby pore volumes would be removed through sealing or destruction. Suitable.
6. Intrusiveness
Definition Criteria - Changes in flood risk
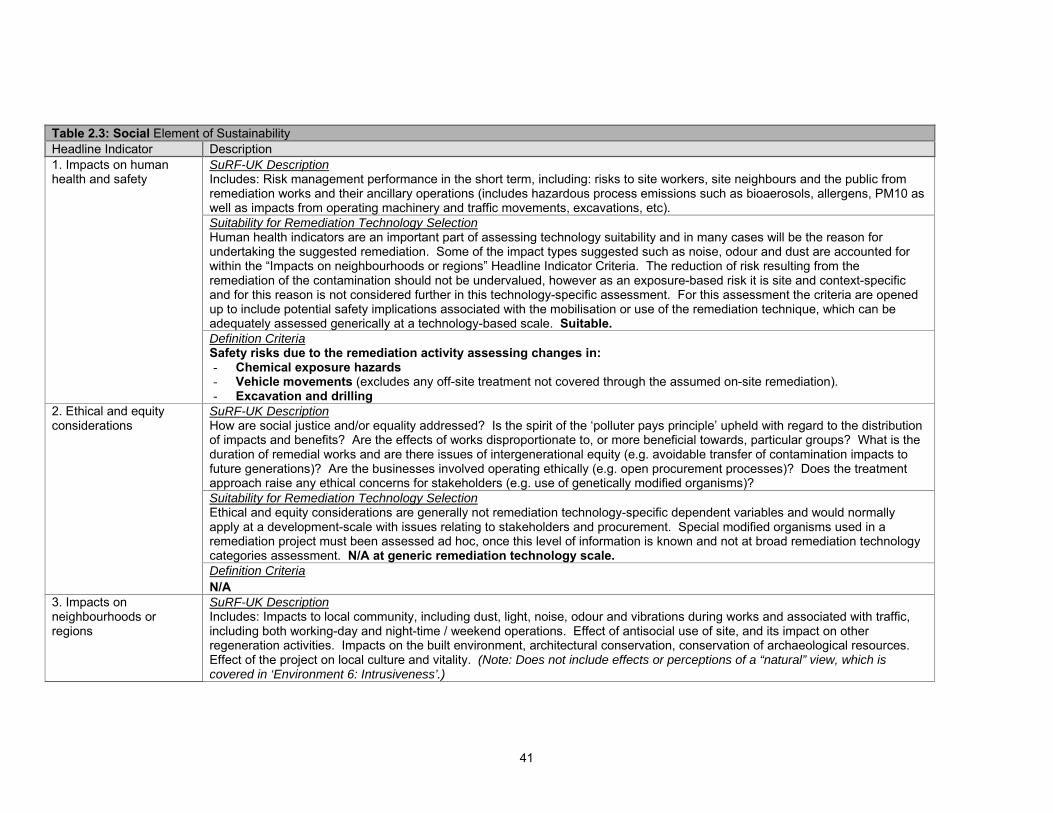
41
Table 2.3: Social Element of Sustainability Headline Indicator Description
SuRF-UK Description Includes: Risk management performance in the short term, including: risks to site workers, site neighbours and the public from remediation works and their ancillary operations (includes hazardous process emissions such as bioaerosols, allergens, PM10 as well as impacts from operating machinery and traffic movements, excavations, etc). Suitability for Remediation Technology Selection Human health indicators are an important part of assessing technology suitability and in many cases will be the reason for undertaking the suggested remediation. Some of the impact types suggested such as noise, odour and dust are accounted for within the “Impacts on neighbourhoods or regions” Headline Indicator Criteria. The reduction of risk resulting from the remediation of the contamination should not be undervalued, however as an exposure-based risk it is site and context-specific and for this reason is not considered further in this technology-specific assessment. For this assessment the criteria are opened up to include potential safety implications associated with the mobilisation or use of the remediation technique, which can be adequately assessed generically at a technology-based scale. Suitable.
1. Impacts on human health and safety
Definition Criteria Safety risks due to the remediation activity assessing changes in: - Chemical exposure hazards - Vehicle movements (excludes any off-site treatment not covered through the assumed on-site remediation). - Excavation and drilling
SuRF-UK Description How are social justice and/or equality addressed? Is the spirit of the ‘polluter pays principle’ upheld with regard to the distribution of impacts and benefits? Are the effects of works disproportionate to, or more beneficial towards, particular groups? What is the duration of remedial works and are there issues of intergenerational equity (e.g. avoidable transfer of contamination impacts to future generations)? Are the businesses involved operating ethically (e.g. open procurement processes)? Does the treatment approach raise any ethical concerns for stakeholders (e.g. use of genetically modified organisms)? Suitability for Remediation Technology Selection Ethical and equity considerations are generally not remediation technology-specific dependent variables and would normally apply at a development-scale with issues relating to stakeholders and procurement. Special modified organisms used in a remediation project must been assessed ad hoc, once this level of information is known and not at broad remediation technology categories assessment. N/A at generic remediation technology scale.
2. Ethical and equity considerations
Definition Criteria N/A
3. Impacts on neighbourhoods or regions
SuRF-UK Description Includes: Impacts to local community, including dust, light, noise, odour and vibrations during works and associated with traffic, including both working-day and night-time / weekend operations. Effect of antisocial use of site, and its impact on other regeneration activities. Impacts on the built environment, architectural conservation, conservation of archaeological resources. Effect of the project on local culture and vitality. (Note: Does not include effects or perceptions of a “natural” view, which is covered in ‘Environment 6: Intrusiveness’.)
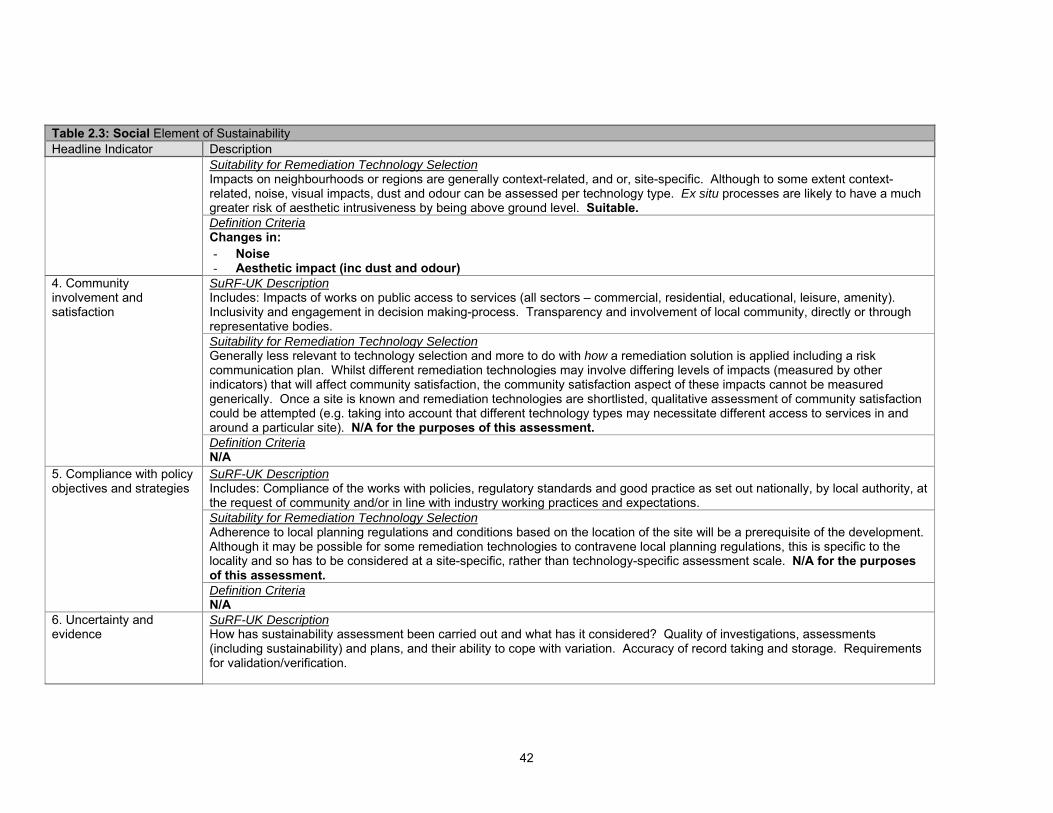
42
Table 2.3: Social Element of Sustainability Headline Indicator Description
Suitability for Remediation Technology Selection Impacts on neighbourhoods or regions are generally context-related, and or, site-specific. Although to some extent context-related, noise, visual impacts, dust and odour can be assessed per technology type. Ex situ processes are likely to have a much greater risk of aesthetic intrusiveness by being above ground level. Suitable.
Definition Criteria Changes in: - Noise - Aesthetic impact (inc dust and odour)
SuRF-UK Description Includes: Impacts of works on public access to services (all sectors – commercial, residential, educational, leisure, amenity). Inclusivity and engagement in decision making-process. Transparency and involvement of local community, directly or through representative bodies. Suitability for Remediation Technology Selection Generally less relevant to technology selection and more to do with how a remediation solution is applied including a risk communication plan. Whilst different remediation technologies may involve differing levels of impacts (measured by other indicators) that will affect community satisfaction, the community satisfaction aspect of these impacts cannot be measured generically. Once a site is known and remediation technologies are shortlisted, qualitative assessment of community satisfaction could be attempted (e.g. taking into account that different technology types may necessitate different access to services in and around a particular site). N/A for the purposes of this assessment.
4. Community involvement and satisfaction
Definition Criteria N/A SuRF-UK Description Includes: Compliance of the works with policies, regulatory standards and good practice as set out nationally, by local authority, at the request of community and/or in line with industry working practices and expectations. Suitability for Remediation Technology Selection Adherence to local planning regulations and conditions based on the location of the site will be a prerequisite of the development. Although it may be possible for some remediation technologies to contravene local planning regulations, this is specific to the locality and so has to be considered at a site-specific, rather than technology-specific assessment scale. N/A for the purposes of this assessment.
5. Compliance with policy objectives and strategies
Definition Criteria N/A
6. Uncertainty and evidence
SuRF-UK Description How has sustainability assessment been carried out and what has it considered? Quality of investigations, assessments (including sustainability) and plans, and their ability to cope with variation. Accuracy of record taking and storage. Requirements for validation/verification.
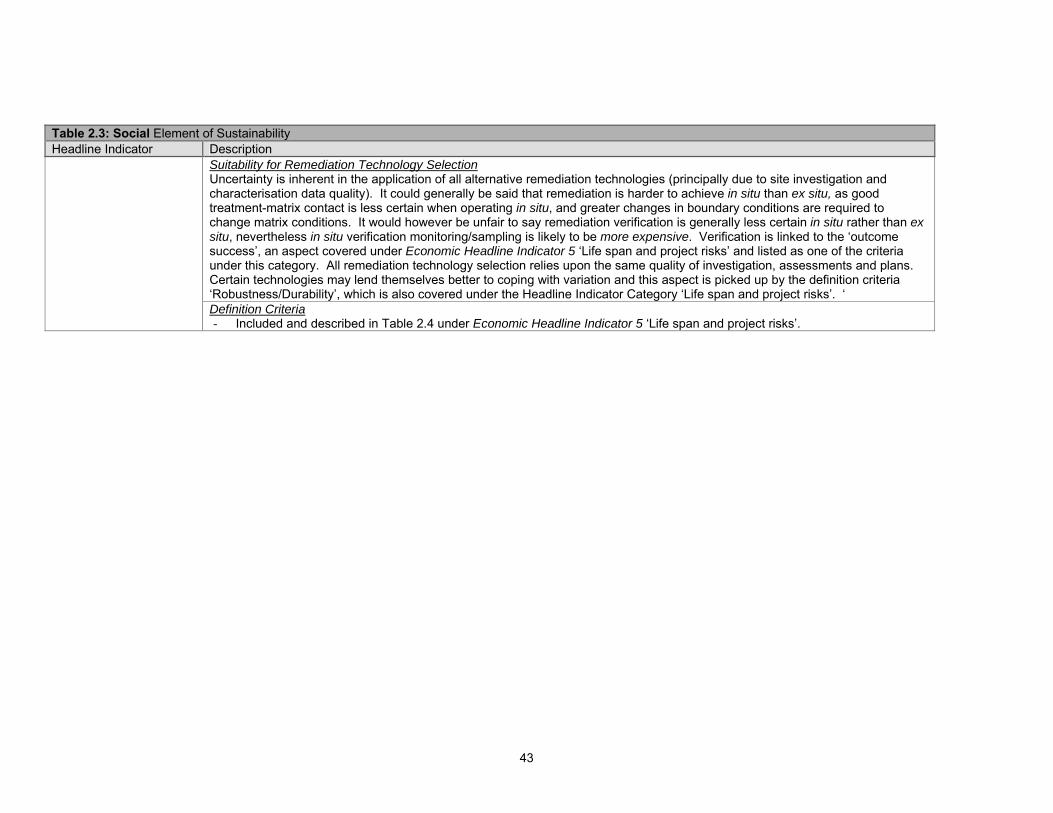
43
Table 2.3: Social Element of Sustainability Headline Indicator Description
Suitability for Remediation Technology Selection Uncertainty is inherent in the application of all alternative remediation technologies (principally due to site investigation and characterisation data quality). It could generally be said that remediation is harder to achieve in situ than ex situ, as good treatment-matrix contact is less certain when operating in situ, and greater changes in boundary conditions are required to change matrix conditions. It would however be unfair to say remediation verification is generally less certain in situ rather than ex situ, nevertheless in situ verification monitoring/sampling is likely to be more expensive. Verification is linked to the ‘outcome success’, an aspect covered under Economic Headline Indicator 5 ‘Life span and project risks’ and listed as one of the criteria under this category. All remediation technology selection relies upon the same quality of investigation, assessments and plans. Certain technologies may lend themselves better to coping with variation and this aspect is picked up by the definition criteria ‘Robustness/Durability’, which is also covered under the Headline Indicator Category ‘Life span and project risks’. ‘
Definition Criteria - Included and described in Table 2.4 under Economic Headline Indicator 5 ‘Life span and project risks’.
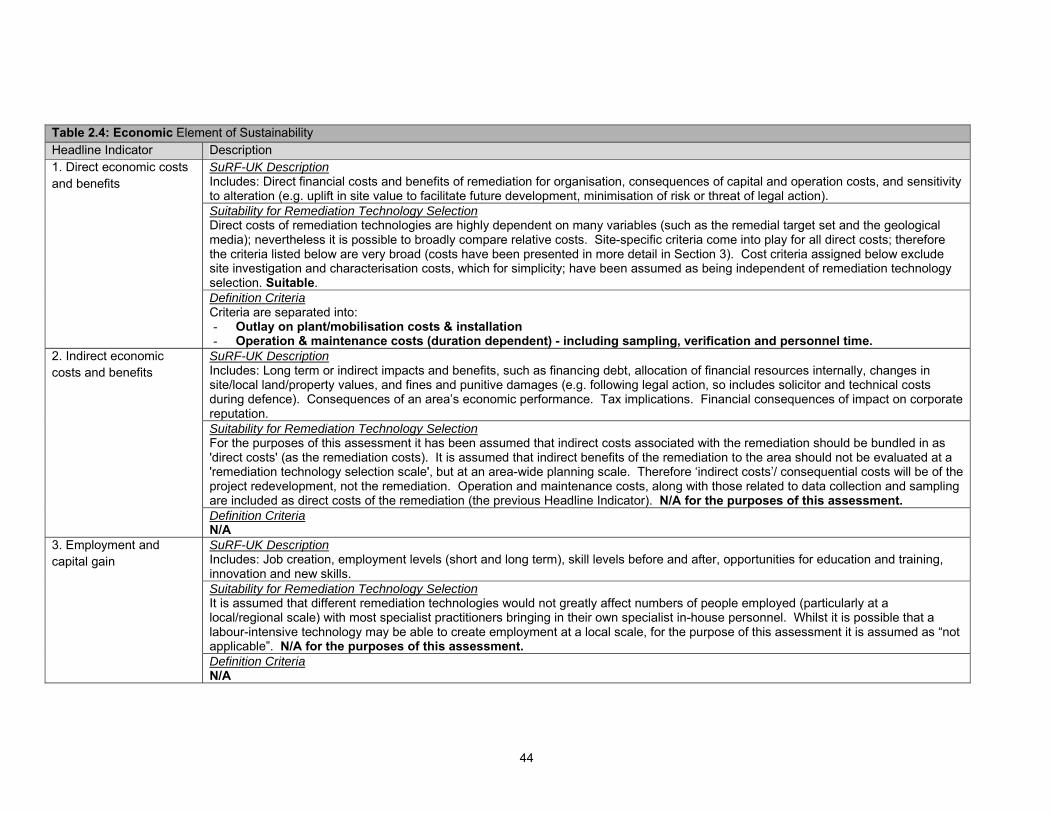
44
Table 2.4: Economic Element of Sustainability Headline Indicator Description
SuRF-UK Description Includes: Direct financial costs and benefits of remediation for organisation, consequences of capital and operation costs, and sensitivity to alteration (e.g. uplift in site value to facilitate future development, minimisation of risk or threat of legal action). Suitability for Remediation Technology Selection Direct costs of remediation technologies are highly dependent on many variables (such as the remedial target set and the geological media); nevertheless it is possible to broadly compare relative costs. Site-specific criteria come into play for all direct costs; therefore the criteria listed below are very broad (costs have been presented in more detail in Section 3). Cost criteria assigned below exclude site investigation and characterisation costs, which for simplicity; have been assumed as being independent of remediation technology selection. Suitable.
1. Direct economic costs and benefits
Definition Criteria Criteria are separated into: - Outlay on plant/mobilisation costs & installation - Operation & maintenance costs (duration dependent) - including sampling, verification and personnel time.
SuRF-UK Description Includes: Long term or indirect impacts and benefits, such as financing debt, allocation of financial resources internally, changes in site/local land/property values, and fines and punitive damages (e.g. following legal action, so includes solicitor and technical costs during defence). Consequences of an area’s economic performance. Tax implications. Financial consequences of impact on corporate reputation. Suitability for Remediation Technology Selection For the purposes of this assessment it has been assumed that indirect costs associated with the remediation should be bundled in as 'direct costs' (as the remediation costs). It is assumed that indirect benefits of the remediation to the area should not be evaluated at a 'remediation technology selection scale', but at an area-wide planning scale. Therefore ‘indirect costs’/ consequential costs will be of the project redevelopment, not the remediation. Operation and maintenance costs, along with those related to data collection and sampling are included as direct costs of the remediation (the previous Headline Indicator). N/A for the purposes of this assessment.
2. Indirect economic costs and benefits
Definition Criteria N/A SuRF-UK Description Includes: Job creation, employment levels (short and long term), skill levels before and after, opportunities for education and training, innovation and new skills. Suitability for Remediation Technology Selection It is assumed that different remediation technologies would not greatly affect numbers of people employed (particularly at a local/regional scale) with most specialist practitioners bringing in their own specialist in-house personnel. Whilst it is possible that a labour-intensive technology may be able to create employment at a local scale, for the purpose of this assessment it is assumed as “not applicable”. N/A for the purposes of this assessment.
3. Employment and capital gain
Definition Criteria N/A
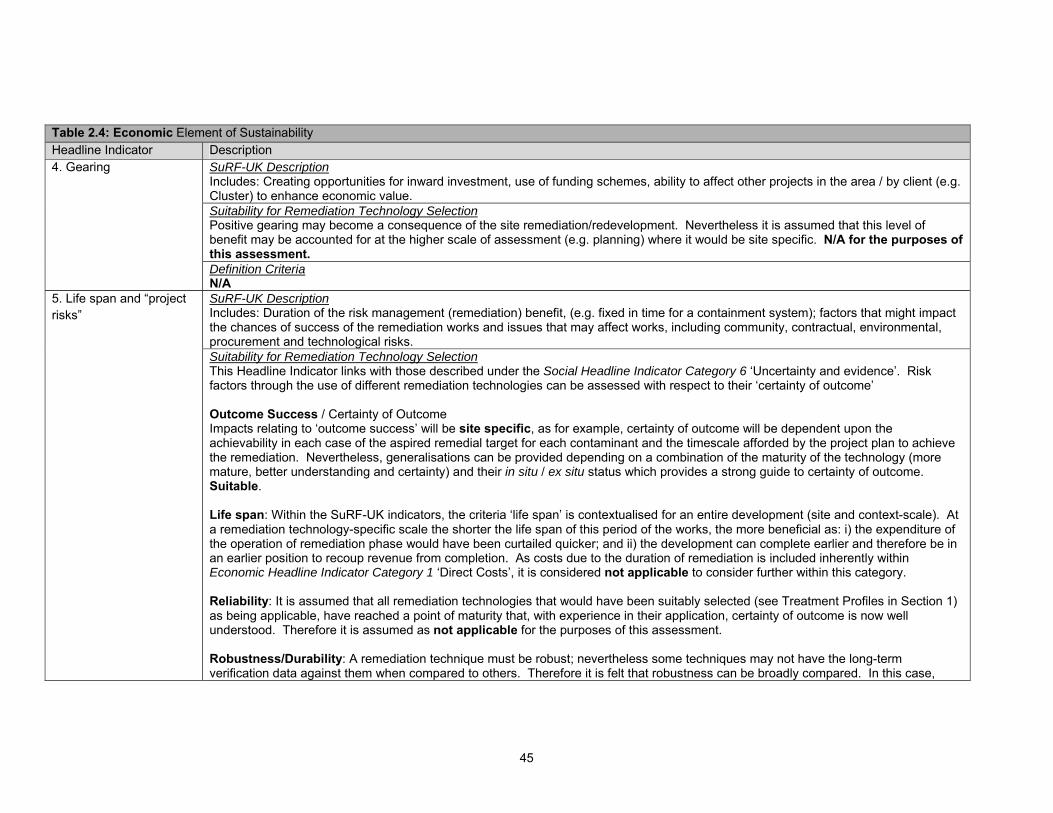
45
Table 2.4: Economic Element of Sustainability Headline Indicator Description
SuRF-UK Description Includes: Creating opportunities for inward investment, use of funding schemes, ability to affect other projects in the area / by client (e.g. Cluster) to enhance economic value. Suitability for Remediation Technology Selection Positive gearing may become a consequence of the site remediation/redevelopment. Nevertheless it is assumed that this level of benefit may be accounted for at the higher scale of assessment (e.g. planning) where it would be site specific. N/A for the purposes of this assessment.
4. Gearing
Definition Criteria N/A SuRF-UK Description Includes: Duration of the risk management (remediation) benefit, (e.g. fixed in time for a containment system); factors that might impact the chances of success of the remediation works and issues that may affect works, including community, contractual, environmental, procurement and technological risks.
5. Life span and “project risks”
Suitability for Remediation Technology Selection This Headline Indicator links with those described under the Social Headline Indicator Category 6 ‘Uncertainty and evidence’. Risk factors through the use of different remediation technologies can be assessed with respect to their ‘certainty of outcome’ Outcome Success / Certainty of Outcome Impacts relating to ‘outcome success’ will be site specific, as for example, certainty of outcome will be dependent upon the achievability in each case of the aspired remedial target for each contaminant and the timescale afforded by the project plan to achieve the remediation. Nevertheless, generalisations can be provided depending on a combination of the maturity of the technology (more mature, better understanding and certainty) and their in situ / ex situ status which provides a strong guide to certainty of outcome. Suitable. Life span: Within the SuRF-UK indicators, the criteria ‘life span’ is contextualised for an entire development (site and context-scale). At a remediation technology-specific scale the shorter the life span of this period of the works, the more beneficial as: i) the expenditure of the operation of remediation phase would have been curtailed quicker; and ii) the development can complete earlier and therefore be in an earlier position to recoup revenue from completion. As costs due to the duration of remediation is included inherently within Economic Headline Indicator Category 1 ‘Direct Costs’, it is considered not applicable to consider further within this category. Reliability: It is assumed that all remediation technologies that would have been suitably selected (see Treatment Profiles in Section 1) as being applicable, have reached a point of maturity that, with experience in their application, certainty of outcome is now well understood. Therefore it is assumed as not applicable for the purposes of this assessment. Robustness/Durability: A remediation technique must be robust; nevertheless some techniques may not have the long-term verification data against them when compared to others. Therefore it is felt that robustness can be broadly compared. In this case,
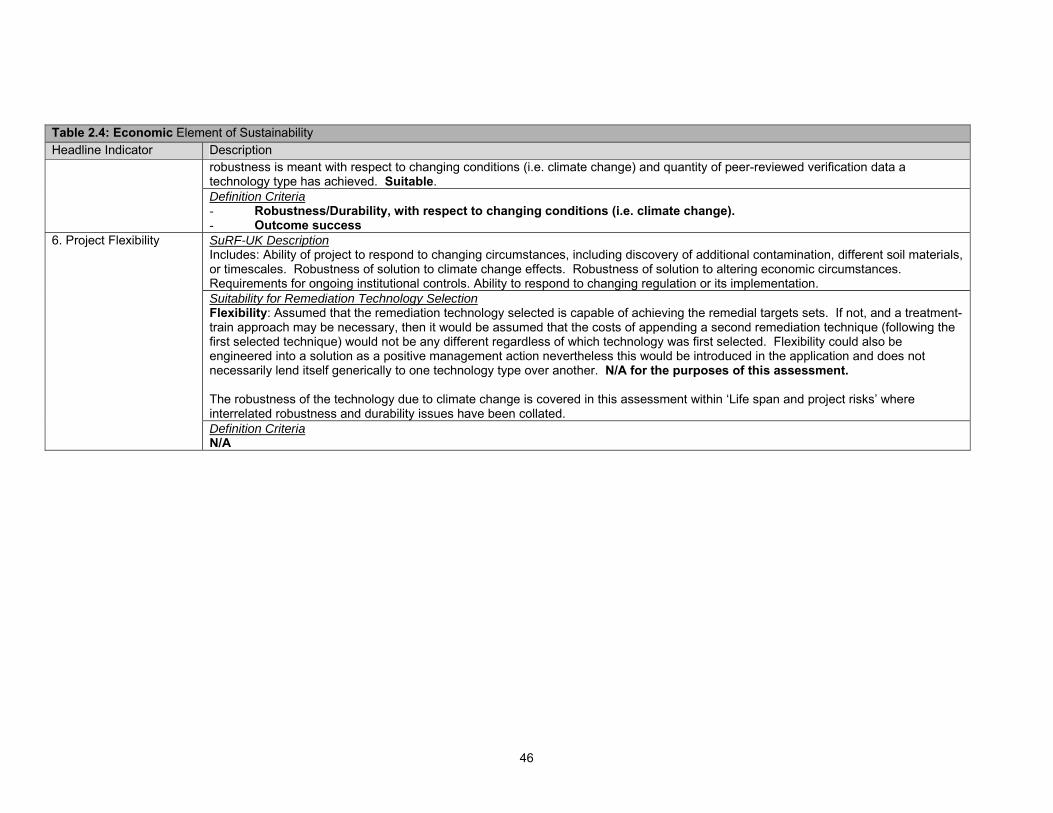
46
Table 2.4: Economic Element of Sustainability Headline Indicator Description
robustness is meant with respect to changing conditions (i.e. climate change) and quantity of peer-reviewed verification data a technology type has achieved. Suitable.
Definition Criteria - Robustness/Durability, with respect to changing conditions (i.e. climate change). - Outcome success SuRF-UK Description Includes: Ability of project to respond to changing circumstances, including discovery of additional contamination, different soil materials, or timescales. Robustness of solution to climate change effects. Robustness of solution to altering economic circumstances. Requirements for ongoing institutional controls. Ability to respond to changing regulation or its implementation. Suitability for Remediation Technology Selection Flexibility: Assumed that the remediation technology selected is capable of achieving the remedial targets sets. If not, and a treatment-train approach may be necessary, then it would be assumed that the costs of appending a second remediation technique (following the first selected technique) would not be any different regardless of which technology was first selected. Flexibility could also be engineered into a solution as a positive management action nevertheless this would be introduced in the application and does not necessarily lend itself generically to one technology type over another. N/A for the purposes of this assessment. The robustness of the technology due to climate change is covered in this assessment within ‘Life span and project risks’ where interrelated robustness and durability issues have been collated.
6. Project Flexibility
Definition Criteria N/A
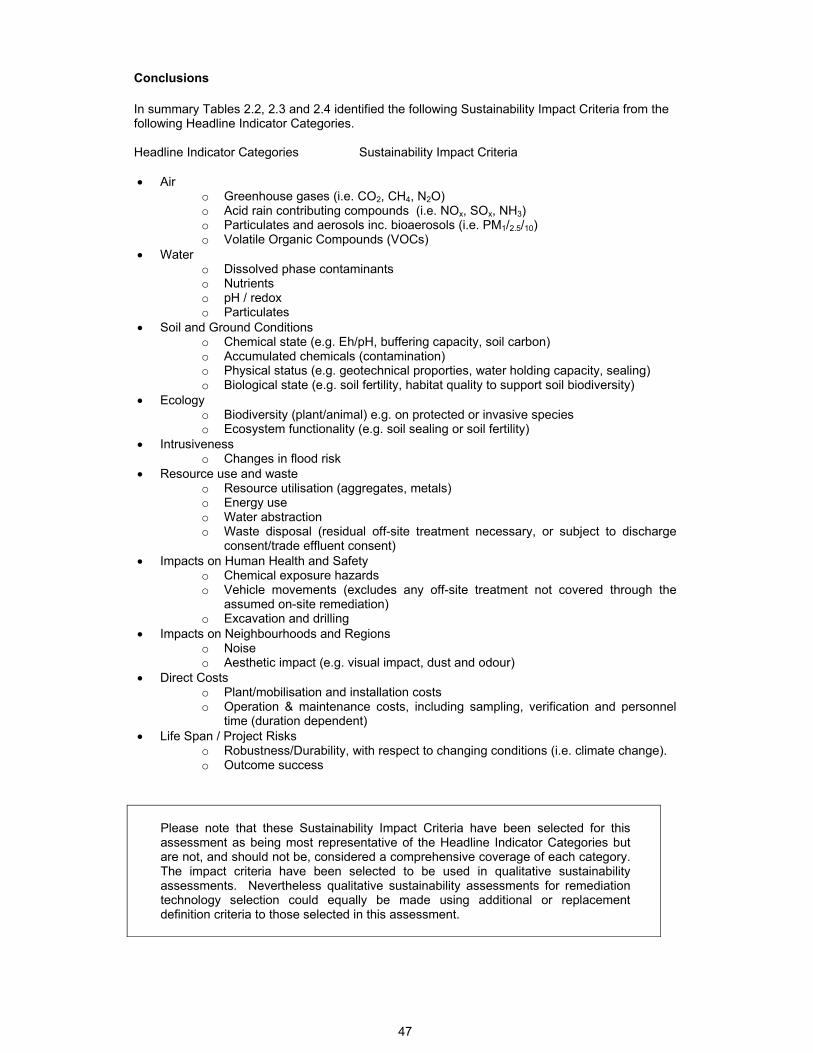
47
Conclusions In summary Tables 2.2, 2.3 and 2.4 identified the following Sustainability Impact Criteria from the following Headline Indicator Categories. Headline Indicator Categories Sustainability Impact Criteria • Air
o Greenhouse gases (i.e. CO2, CH4, N2O) o Acid rain contributing compounds (i.e. NOx, SOx, NH3) o Particulates and aerosols inc. bioaerosols (i.e. PM1/2.5/10) o Volatile Organic Compounds (VOCs)
• Water o Dissolved phase contaminants o Nutrients o pH / redox o Particulates
• Soil and Ground Conditions o Chemical state (e.g. Eh/pH, buffering capacity, soil carbon) o Accumulated chemicals (contamination) o Physical status (e.g. geotechnical proporties, water holding capacity, sealing) o Biological state (e.g. soil fertility, habitat quality to support soil biodiversity)
• Ecology o Biodiversity (plant/animal) e.g. on protected or invasive species o Ecosystem functionality (e.g. soil sealing or soil fertility)
• Intrusiveness o Changes in flood risk
• Resource use and waste o Resource utilisation (aggregates, metals) o Energy use o Water abstraction o Waste disposal (residual off-site treatment necessary, or subject to discharge
consent/trade effluent consent) • Impacts on Human Health and Safety
o Chemical exposure hazards o Vehicle movements (excludes any off-site treatment not covered through the
assumed on-site remediation) o Excavation and drilling
• Impacts on Neighbourhoods and Regions o Noise o Aesthetic impact (e.g. visual impact, dust and odour)
• Direct Costs o Plant/mobilisation and installation costs o Operation & maintenance costs, including sampling, verification and personnel
time (duration dependent) • Life Span / Project Risks
o Robustness/Durability, with respect to changing conditions (i.e. climate change). o Outcome success
Please note that these Sustainability Impact Criteria have been selected for this assessment as being most representative of the Headline Indicator Categories but are not, and should not be, considered a comprehensive coverage of each category. The impact criteria have been selected to be used in qualitative sustainability assessments. Nevertheless qualitative sustainability assessments for remediation technology selection could equally be made using additional or replacement definition criteria to those selected in this assessment.
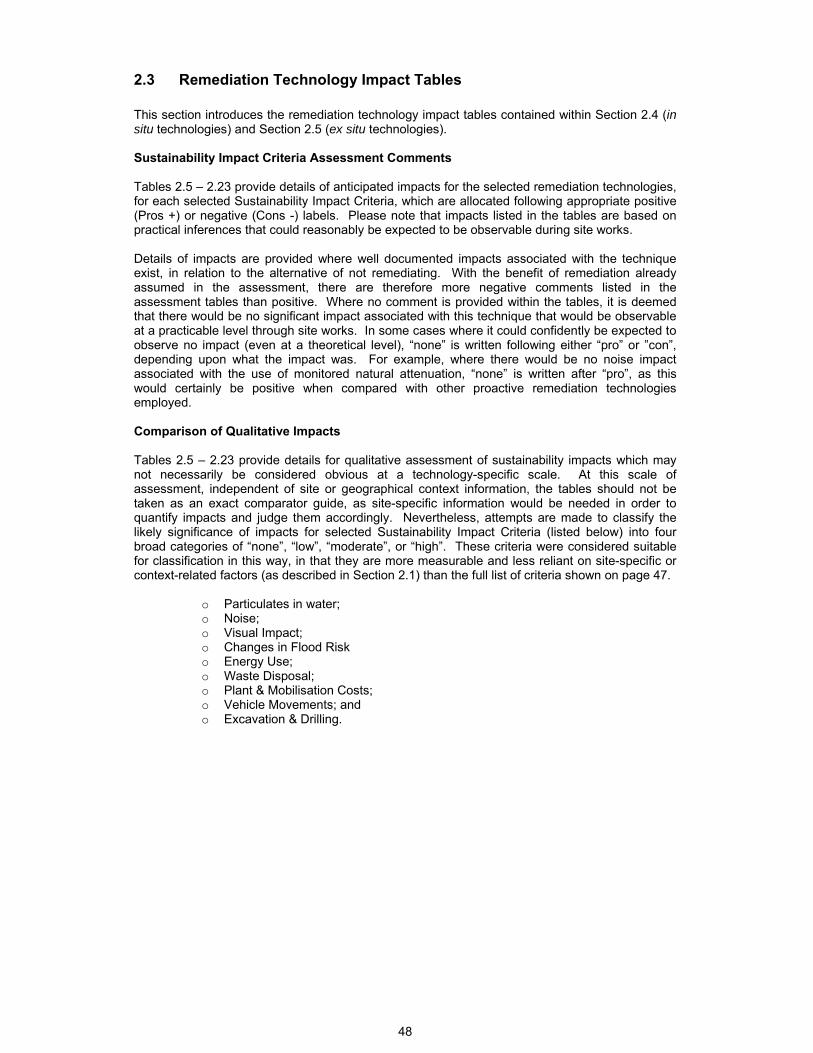
48
2.3 Remediation Technology Impact Tables This section introduces the remediation technology impact tables contained within Section 2.4 (in situ technologies) and Section 2.5 (ex situ technologies). Sustainability Impact Criteria Assessment Comments Tables 2.5 – 2.23 provide details of anticipated impacts for the selected remediation technologies, for each selected Sustainability Impact Criteria, which are allocated following appropriate positive (Pros +) or negative (Cons -) labels. Please note that impacts listed in the tables are based on practical inferences that could reasonably be expected to be observable during site works. Details of impacts are provided where well documented impacts associated with the technique exist, in relation to the alternative of not remediating. With the benefit of remediation already assumed in the assessment, there are therefore more negative comments listed in the assessment tables than positive. Where no comment is provided within the tables, it is deemed that there would be no significant impact associated with this technique that would be observable at a practicable level through site works. In some cases where it could confidently be expected to observe no impact (even at a theoretical level), “none” is written following either “pro” or ”con”, depending upon what the impact was. For example, where there would be no noise impact associated with the use of monitored natural attenuation, “none” is written after “pro”, as this would certainly be positive when compared with other proactive remediation technologies employed. Comparison of Qualitative Impacts Tables 2.5 – 2.23 provide details for qualitative assessment of sustainability impacts which may not necessarily be considered obvious at a technology-specific scale. At this scale of assessment, independent of site or geographical context information, the tables should not be taken as an exact comparator guide, as site-specific information would be needed in order to quantify impacts and judge them accordingly. Nevertheless, attempts are made to classify the likely significance of impacts for selected Sustainability Impact Criteria (listed below) into four broad categories of “none”, “low”, “moderate”, or “high”. These criteria were considered suitable for classification in this way, in that they are more measurable and less reliant on site-specific or context-related factors (as described in Section 2.1) than the full list of criteria shown on page 47.
o Particulates in water; o Noise; o Visual Impact; o Changes in Flood Risk o Energy Use; o Waste Disposal; o Plant & Mobilisation Costs; o Vehicle Movements; and o Excavation & Drilling.
49
2.4 In Situ Remediation Technology Impact Tables This section provides guideline tables assessing in situ remediation technologies against the headline indicators and definition criteria selected from Section 2.2. These tables demonstrate how remediation technologies can be assessed more holistically; and illuminate advantages and disadvantages of those different technologies which may or may not be immediately obvious. The in situ remediation technologies evaluated in this section are:
• Chemical oxidation and reduction (Table 2.5) • Electro-remediation (Table 2.6) • Enhanced bioremediation (Table 2.7) • Flushing (Table 2.8) • Monitored natural attenuation (Table 2.9) • Permeable reactive barriers (Table 2.10) • Phytoremediation (Table 2.11) • Sparging (Table 2.12) • Stabilisation/solidification (Table 2.13) • Thermal Treatment (Table 2.14) • Venting (Table 2.15) • Vitrification (Table 2.16)
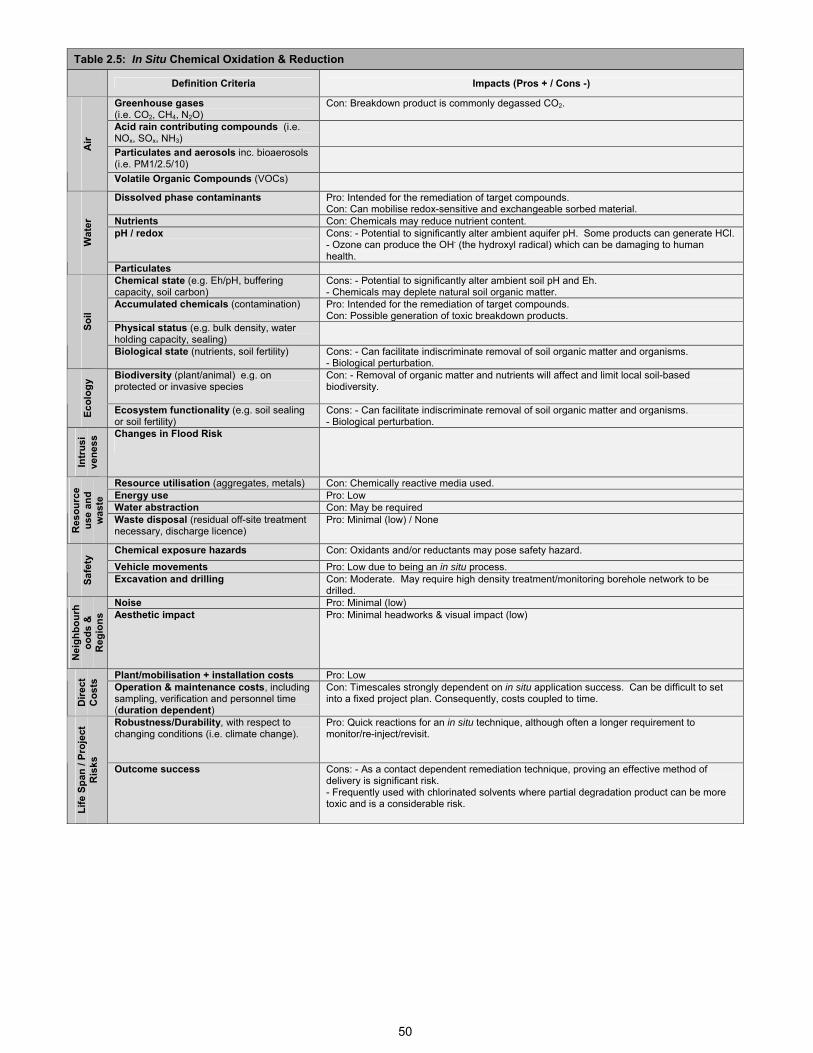
50
Table 2.5: In Situ Chemical Oxidation & Reduction
Definition Criteria Impacts (Pros + / Cons -)
Greenhouse gases (i.e. CO2, CH4, N2O)
Con: Breakdown product is commonly degassed CO2.
Acid rain contributing compounds (i.e. NOx, SOx, NH3)
Particulates and aerosols inc. bioaerosols (i.e. PM1/2.5/10)
Air
Volatile Organic Compounds (VOCs)
Dissolved phase contaminants Pro: Intended for the remediation of target compounds. Con: Can mobilise redox-sensitive and exchangeable sorbed material.
Nutrients Con: Chemicals may reduce nutrient content. pH / redox Cons: - Potential to significantly alter ambient aquifer pH. Some products can generate HCl.
- Ozone can produce the OH. (the hydroxyl radical) which can be damaging to human health.
Wat
er
Particulates Chemical state (e.g. Eh/pH, buffering capacity, soil carbon)
Cons: - Potential to significantly alter ambient soil pH and Eh. - Chemicals may deplete natural soil organic matter.
Accumulated chemicals (contamination) Pro: Intended for the remediation of target compounds. Con: Possible generation of toxic breakdown products.
Physical status (e.g. bulk density, water holding capacity, sealing)
Soil
Biological state (nutrients, soil fertility) Cons: - Can facilitate indiscriminate removal of soil organic matter and organisms. - Biological perturbation.
Biodiversity (plant/animal) e.g. on protected or invasive species
Con: - Removal of organic matter and nutrients will affect and limit local soil-based biodiversity.
Ecol
ogy
Ecosystem functionality (e.g. soil sealing or soil fertility)
Cons: - Can facilitate indiscriminate removal of soil organic matter and organisms. - Biological perturbation.
Intr
usi
vene
ss Changes in Flood Risk
Resource utilisation (aggregates, metals) Con: Chemically reactive media used. Energy use Pro: Low Water abstraction Con: May be required
Res
ourc
e us
e an
d w
aste
Waste disposal (residual off-site treatment necessary, discharge licence)
Pro: Minimal (low) / None
Chemical exposure hazards Con: Oxidants and/or reductants may pose safety hazard.
Vehicle movements Pro: Low due to being an in situ process.
Safe
ty
Excavation and drilling Con: Moderate. May require high density treatment/monitoring borehole network to be drilled.
Noise Pro: Minimal (low)
Nei
ghbo
urh
oods
&
Reg
ions
Aesthetic impact Pro: Minimal headworks & visual impact (low)
Plant/mobilisation + installation costs Pro: Low
Dire
ct
Cos
ts
Operation & maintenance costs, including sampling, verification and personnel time (duration dependent)
Con: Timescales strongly dependent on in situ application success. Can be difficult to set into a fixed project plan. Consequently, costs coupled to time.
Robustness/Durability, with respect to changing conditions (i.e. climate change).
Pro: Quick reactions for an in situ technique, although often a longer requirement to monitor/re-inject/revisit.
Life
Spa
n / P
roje
ct
Ris
ks
Outcome success Cons: - As a contact dependent remediation technique, proving an effective method of delivery is significant risk. - Frequently used with chlorinated solvents where partial degradation product can be more toxic and is a considerable risk.
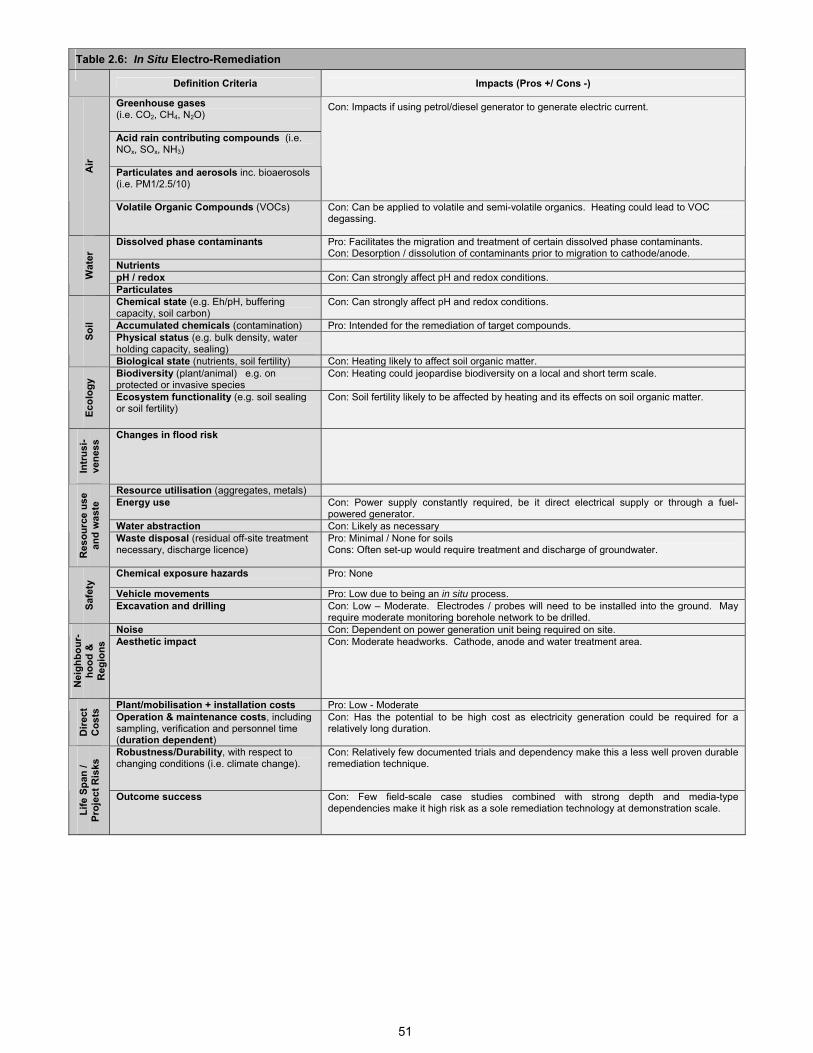
51
Table 2.6: In Situ Electro-Remediation
Definition Criteria Impacts (Pros +/ Cons -)
Greenhouse gases (i.e. CO2, CH4, N2O)
Acid rain contributing compounds (i.e. NOx, SOx, NH3)
Particulates and aerosols inc. bioaerosols (i.e. PM1/2.5/10)
Con: Impacts if using petrol/diesel generator to generate electric current.
Air
Volatile Organic Compounds (VOCs) Con: Can be applied to volatile and semi-volatile organics. Heating could lead to VOC degassing.
Dissolved phase contaminants Pro: Facilitates the migration and treatment of certain dissolved phase contaminants. Con: Desorption / dissolution of contaminants prior to migration to cathode/anode.
Nutrients pH / redox Con: Can strongly affect pH and redox conditions. W
ater
Particulates Chemical state (e.g. Eh/pH, buffering capacity, soil carbon)
Con: Can strongly affect pH and redox conditions.
Accumulated chemicals (contamination) Pro: Intended for the remediation of target compounds. Physical status (e.g. bulk density, water holding capacity, sealing)
Soil
Biological state (nutrients, soil fertility) Con: Heating likely to affect soil organic matter. Biodiversity (plant/animal) e.g. on protected or invasive species
Con: Heating could jeopardise biodiversity on a local and short term scale.
Ecol
ogy
Ecosystem functionality (e.g. soil sealing or soil fertility)
Con: Soil fertility likely to be affected by heating and its effects on soil organic matter.
Intr
usi-
vene
ss Changes in flood risk
Resource utilisation (aggregates, metals) Energy use Con: Power supply constantly required, be it direct electrical supply or through a fuel-
powered generator. Water abstraction Con: Likely as necessary
Res
ourc
e us
e an
d w
aste
Waste disposal (residual off-site treatment necessary, discharge licence)
Pro: Minimal / None for soils Cons: Often set-up would require treatment and discharge of groundwater.
Chemical exposure hazards Pro: None
Vehicle movements Pro: Low due to being an in situ process.
Safe
ty
Excavation and drilling Con: Low – Moderate. Electrodes / probes will need to be installed into the ground. May require moderate monitoring borehole network to be drilled.
Noise Con: Dependent on power generation unit being required on site.
Nei
ghbo
ur-
hood
&
Reg
ions
Aesthetic impact Con: Moderate headworks. Cathode, anode and water treatment area.
Plant/mobilisation + installation costs Pro: Low - Moderate
Dire
ct
Cos
ts
Operation & maintenance costs, including sampling, verification and personnel time (duration dependent)
Con: Has the potential to be high cost as electricity generation could be required for a relatively long duration.
Robustness/Durability, with respect to changing conditions (i.e. climate change).
Con: Relatively few documented trials and dependency make this a less well proven durable remediation technique.
Life
Spa
n /
Proj
ect R
isks
Outcome success Con: Few field-scale case studies combined with strong depth and media-type dependencies make it high risk as a sole remediation technology at demonstration scale.
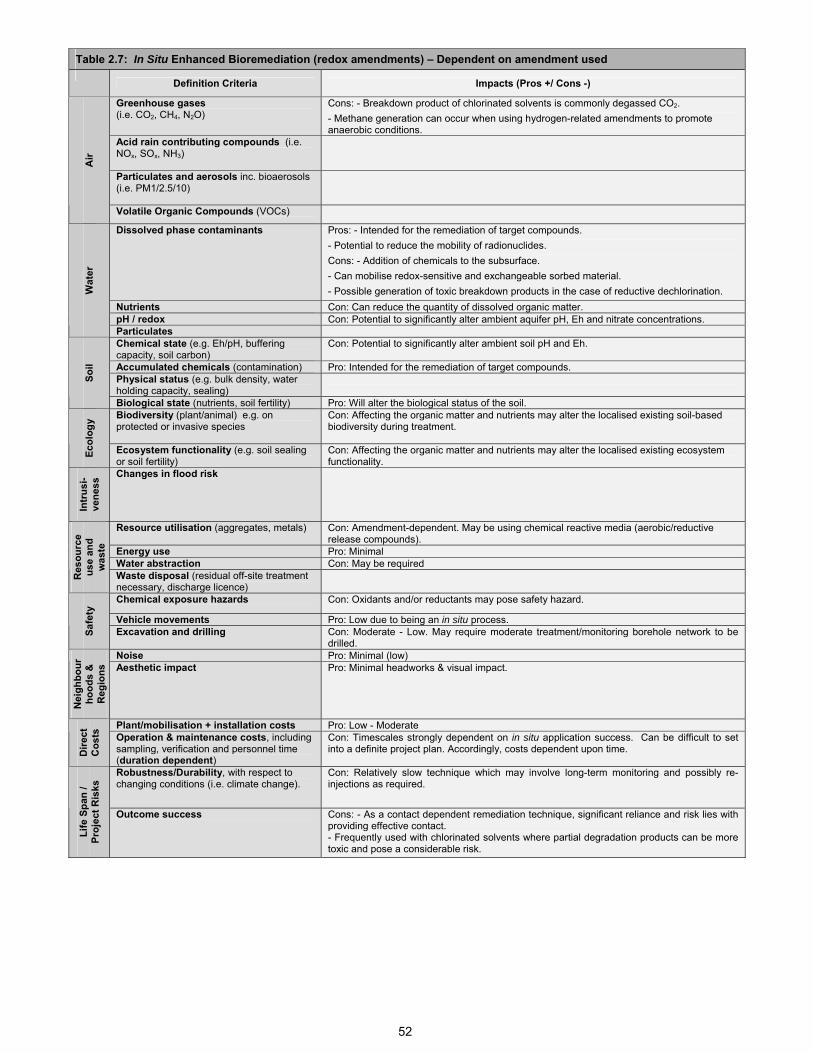
52
Table 2.7: In Situ Enhanced Bioremediation (redox amendments) – Dependent on amendment used
Definition Criteria Impacts (Pros +/ Cons -)
Greenhouse gases (i.e. CO2, CH4, N2O)
Cons: - Breakdown product of chlorinated solvents is commonly degassed CO2. - Methane generation can occur when using hydrogen-related amendments to promote anaerobic conditions.
Acid rain contributing compounds (i.e. NOx, SOx, NH3)
Particulates and aerosols inc. bioaerosols (i.e. PM1/2.5/10)
Air
Volatile Organic Compounds (VOCs)
Dissolved phase contaminants Pros: - Intended for the remediation of target compounds. - Potential to reduce the mobility of radionuclides. Cons: - Addition of chemicals to the subsurface. - Can mobilise redox-sensitive and exchangeable sorbed material. - Possible generation of toxic breakdown products in the case of reductive dechlorination.
Nutrients Con: Can reduce the quantity of dissolved organic matter. pH / redox Con: Potential to significantly alter ambient aquifer pH, Eh and nitrate concentrations.
Wat
er
Particulates Chemical state (e.g. Eh/pH, buffering capacity, soil carbon)
Con: Potential to significantly alter ambient soil pH and Eh.
Accumulated chemicals (contamination) Pro: Intended for the remediation of target compounds. Physical status (e.g. bulk density, water holding capacity, sealing)
Soil
Biological state (nutrients, soil fertility) Pro: Will alter the biological status of the soil. Biodiversity (plant/animal) e.g. on protected or invasive species
Con: Affecting the organic matter and nutrients may alter the localised existing soil-based biodiversity during treatment.
Ecol
ogy
Ecosystem functionality (e.g. soil sealing or soil fertility)
Con: Affecting the organic matter and nutrients may alter the localised existing ecosystem functionality.
Intr
usi-
vene
ss Changes in flood risk
Resource utilisation (aggregates, metals) Con: Amendment-dependent. May be using chemical reactive media (aerobic/reductive release compounds).
Energy use Pro: Minimal Water abstraction Con: May be required
Res
ourc
e us
e an
d w
aste
Waste disposal (residual off-site treatment necessary, discharge licence)
Chemical exposure hazards Con: Oxidants and/or reductants may pose safety hazard.
Vehicle movements Pro: Low due to being an in situ process.
Safe
ty
Excavation and drilling Con: Moderate - Low. May require moderate treatment/monitoring borehole network to be drilled.
Noise Pro: Minimal (low)
Nei
ghbo
urho
ods
&
Reg
ions
Aesthetic impact Pro: Minimal headworks & visual impact.
Plant/mobilisation + installation costs Pro: Low - Moderate
Dire
ct
Cos
ts
Operation & maintenance costs, including sampling, verification and personnel time (duration dependent)
Con: Timescales strongly dependent on in situ application success. Can be difficult to set into a definite project plan. Accordingly, costs dependent upon time.
Robustness/Durability, with respect to changing conditions (i.e. climate change).
Con: Relatively slow technique which may involve long-term monitoring and possibly re-injections as required.
Life
Spa
n /
Proj
ect R
isks
Outcome success Cons: - As a contact dependent remediation technique, significant reliance and risk lies with providing effective contact. - Frequently used with chlorinated solvents where partial degradation products can be more toxic and pose a considerable risk.
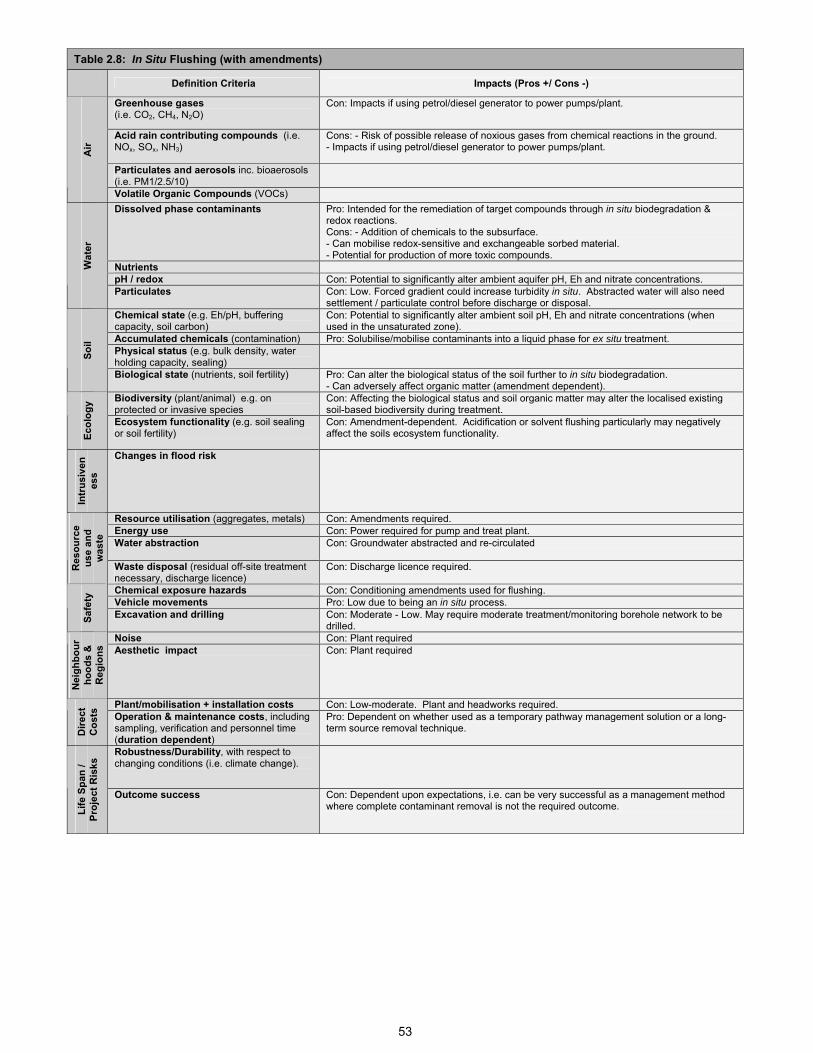
53
Table 2.8: In Situ Flushing (with amendments)
Definition Criteria Impacts (Pros +/ Cons -)
Greenhouse gases (i.e. CO2, CH4, N2O)
Con: Impacts if using petrol/diesel generator to power pumps/plant.
Acid rain contributing compounds (i.e. NOx, SOx, NH3)
Cons: - Risk of possible release of noxious gases from chemical reactions in the ground. - Impacts if using petrol/diesel generator to power pumps/plant.
Particulates and aerosols inc. bioaerosols (i.e. PM1/2.5/10)
Air
Volatile Organic Compounds (VOCs) Dissolved phase contaminants Pro: Intended for the remediation of target compounds through in situ biodegradation &
redox reactions. Cons: - Addition of chemicals to the subsurface. - Can mobilise redox-sensitive and exchangeable sorbed material. - Potential for production of more toxic compounds.
Nutrients pH / redox Con: Potential to significantly alter ambient aquifer pH, Eh and nitrate concentrations.
Wat
er
Particulates Con: Low. Forced gradient could increase turbidity in situ. Abstracted water will also need settlement / particulate control before discharge or disposal.
Chemical state (e.g. Eh/pH, buffering capacity, soil carbon)
Con: Potential to significantly alter ambient soil pH, Eh and nitrate concentrations (when used in the unsaturated zone).
Accumulated chemicals (contamination) Pro: Solubilise/mobilise contaminants into a liquid phase for ex situ treatment. Physical status (e.g. bulk density, water holding capacity, sealing)
Soil
Biological state (nutrients, soil fertility) Pro: Can alter the biological status of the soil further to in situ biodegradation. - Can adversely affect organic matter (amendment dependent).
Biodiversity (plant/animal) e.g. on protected or invasive species
Con: Affecting the biological status and soil organic matter may alter the localised existing soil-based biodiversity during treatment.
Ecol
ogy
Ecosystem functionality (e.g. soil sealing or soil fertility)
Con: Amendment-dependent. Acidification or solvent flushing particularly may negatively affect the soils ecosystem functionality.
Intr
usiv
enes
s
Changes in flood risk
Resource utilisation (aggregates, metals) Con: Amendments required. Energy use Con: Power required for pump and treat plant. Water abstraction Con: Groundwater abstracted and re-circulated
Res
ourc
e us
e an
d w
aste
Waste disposal (residual off-site treatment necessary, discharge licence)
Con: Discharge licence required.
Chemical exposure hazards Con: Conditioning amendments used for flushing. Vehicle movements Pro: Low due to being an in situ process.
Safe
ty
Excavation and drilling Con: Moderate - Low. May require moderate treatment/monitoring borehole network to be drilled.
Noise Con: Plant required
Nei
ghbo
urho
ods
&
Reg
ions
Aesthetic impact Con: Plant required
Plant/mobilisation + installation costs Con: Low-moderate. Plant and headworks required.
Dire
ct
Cos
ts
Operation & maintenance costs, including sampling, verification and personnel time (duration dependent)
Pro: Dependent on whether used as a temporary pathway management solution or a long-term source removal technique.
Robustness/Durability, with respect to changing conditions (i.e. climate change).
Life
Spa
n /
Proj
ect R
isks
Outcome success Con: Dependent upon expectations, i.e. can be very successful as a management method where complete contaminant removal is not the required outcome.
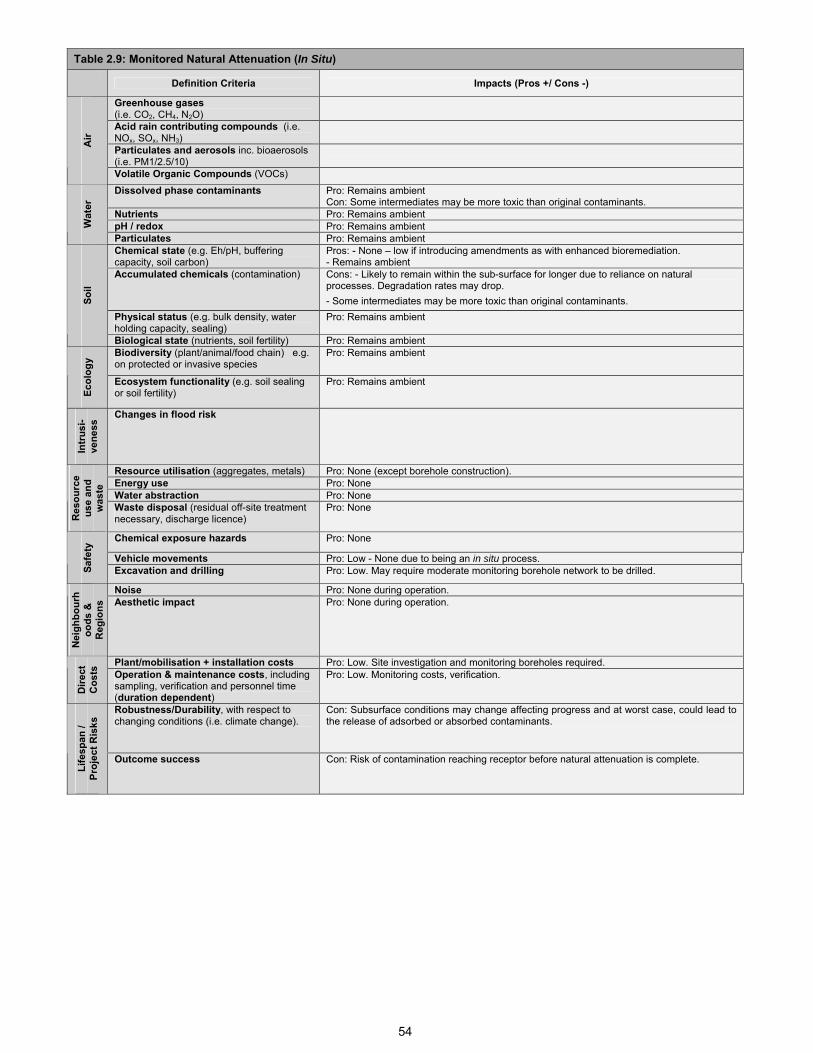
54
Table 2.9: Monitored Natural Attenuation (In Situ)
Definition Criteria Impacts (Pros +/ Cons -)
Greenhouse gases (i.e. CO2, CH4, N2O)
Acid rain contributing compounds (i.e. NOx, SOx, NH3)
Particulates and aerosols inc. bioaerosols (i.e. PM1/2.5/10)
Air
Volatile Organic Compounds (VOCs) Dissolved phase contaminants Pro: Remains ambient
Con: Some intermediates may be more toxic than original contaminants. Nutrients Pro: Remains ambient pH / redox Pro: Remains ambient W
ater
Particulates Pro: Remains ambient Chemical state (e.g. Eh/pH, buffering capacity, soil carbon)
Pros: - None – low if introducing amendments as with enhanced bioremediation. - Remains ambient
Accumulated chemicals (contamination) Cons: - Likely to remain within the sub-surface for longer due to reliance on natural processes. Degradation rates may drop. - Some intermediates may be more toxic than original contaminants.
Physical status (e.g. bulk density, water holding capacity, sealing)
Pro: Remains ambient
Soil
Biological state (nutrients, soil fertility) Pro: Remains ambient Biodiversity (plant/animal/food chain) e.g. on protected or invasive species
Pro: Remains ambient
Ecol
ogy
Ecosystem functionality (e.g. soil sealing or soil fertility)
Pro: Remains ambient
Intr
usi-
vene
ss Changes in flood risk
Resource utilisation (aggregates, metals) Pro: None (except borehole construction). Energy use Pro: None Water abstraction Pro: None
Res
ourc
e us
e an
d w
aste
Waste disposal (residual off-site treatment necessary, discharge licence)
Pro: None
Chemical exposure hazards Pro: None
Vehicle movements Pro: Low - None due to being an in situ process.
Safe
ty
Excavation and drilling Pro: Low. May require moderate monitoring borehole network to be drilled.
Noise Pro: None during operation.
Nei
ghbo
urh
oods
&
Reg
ions
Aesthetic impact Pro: None during operation.
Plant/mobilisation + installation costs Pro: Low. Site investigation and monitoring boreholes required.
Dire
ct
Cos
ts
Operation & maintenance costs, including sampling, verification and personnel time (duration dependent)
Pro: Low. Monitoring costs, verification.
Robustness/Durability, with respect to changing conditions (i.e. climate change).
Con: Subsurface conditions may change affecting progress and at worst case, could lead to the release of adsorbed or absorbed contaminants.
Life
span
/ Pr
ojec
t Ris
ks
Outcome success Con: Risk of contamination reaching receptor before natural attenuation is complete.
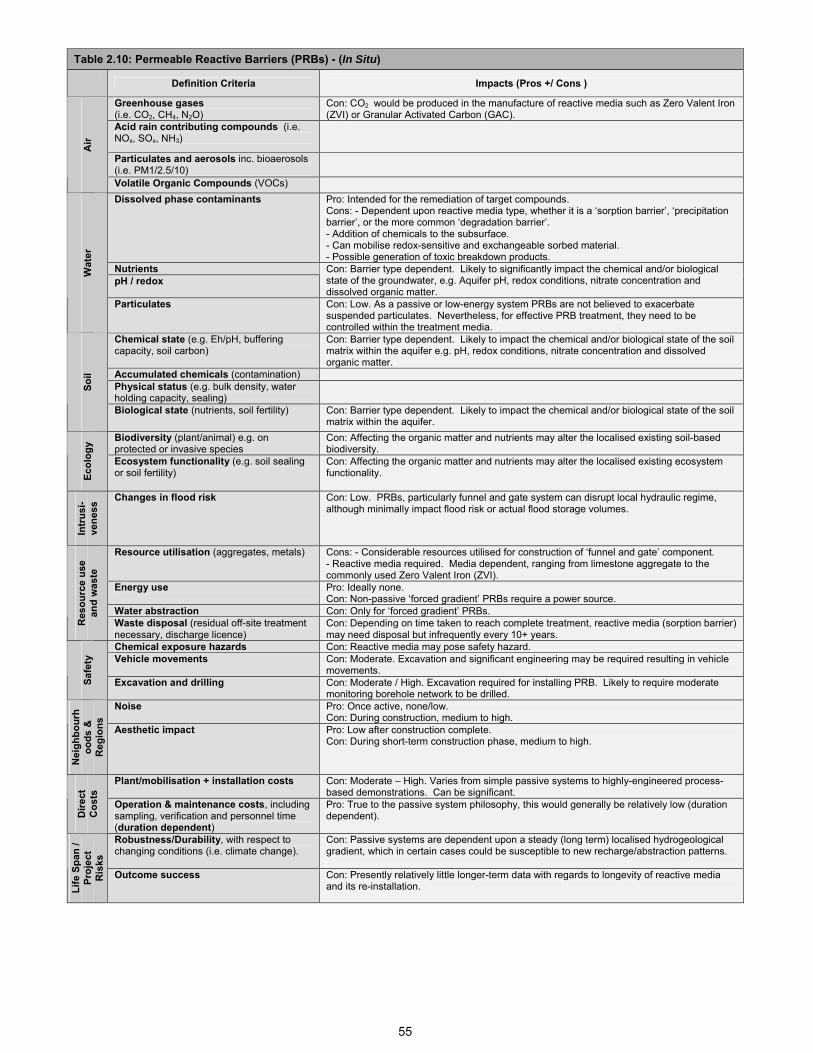
55
Table 2.10: Permeable Reactive Barriers (PRBs) - (In Situ)
Definition Criteria Impacts (Pros +/ Cons )
Greenhouse gases (i.e. CO2, CH4, N2O)
Con: CO2 would be produced in the manufacture of reactive media such as Zero Valent Iron (ZVI) or Granular Activated Carbon (GAC).
Acid rain contributing compounds (i.e. NOx, SOx, NH3)
Particulates and aerosols inc. bioaerosols (i.e. PM1/2.5/10)
Air
Volatile Organic Compounds (VOCs) Dissolved phase contaminants Pro: Intended for the remediation of target compounds.
Cons: - Dependent upon reactive media type, whether it is a ‘sorption barrier’, ‘precipitation barrier’, or the more common ‘degradation barrier’. - Addition of chemicals to the subsurface. - Can mobilise redox-sensitive and exchangeable sorbed material. - Possible generation of toxic breakdown products.
Nutrients pH / redox
Con: Barrier type dependent. Likely to significantly impact the chemical and/or biological state of the groundwater, e.g. Aquifer pH, redox conditions, nitrate concentration and dissolved organic matter.
Wat
er
Particulates Con: Low. As a passive or low-energy system PRBs are not believed to exacerbate suspended particulates. Nevertheless, for effective PRB treatment, they need to be controlled within the treatment media.
Chemical state (e.g. Eh/pH, buffering capacity, soil carbon)
Con: Barrier type dependent. Likely to impact the chemical and/or biological state of the soil matrix within the aquifer e.g. pH, redox conditions, nitrate concentration and dissolved organic matter.
Accumulated chemicals (contamination) Physical status (e.g. bulk density, water holding capacity, sealing)
Soil
Biological state (nutrients, soil fertility) Con: Barrier type dependent. Likely to impact the chemical and/or biological state of the soil matrix within the aquifer.
Biodiversity (plant/animal) e.g. on protected or invasive species
Con: Affecting the organic matter and nutrients may alter the localised existing soil-based biodiversity.
Ecol
ogy
Ecosystem functionality (e.g. soil sealing or soil fertility)
Con: Affecting the organic matter and nutrients may alter the localised existing ecosystem functionality.
Intr
usi-
vene
ss Changes in flood risk Con: Low. PRBs, particularly funnel and gate system can disrupt local hydraulic regime,
although minimally impact flood risk or actual flood storage volumes.
Resource utilisation (aggregates, metals) Cons: - Considerable resources utilised for construction of ‘funnel and gate’ component. - Reactive media required. Media dependent, ranging from limestone aggregate to the commonly used Zero Valent Iron (ZVI).
Energy use Pro: Ideally none. Con: Non-passive ‘forced gradient’ PRBs require a power source.
Water abstraction Con: Only for ‘forced gradient’ PRBs.
Res
ourc
e us
e an
d w
aste
Waste disposal (residual off-site treatment necessary, discharge licence)
Con: Depending on time taken to reach complete treatment, reactive media (sorption barrier) may need disposal but infrequently every 10+ years.
Chemical exposure hazards Con: Reactive media may pose safety hazard. Vehicle movements Con: Moderate. Excavation and significant engineering may be required resulting in vehicle
movements.
Safe
ty
Excavation and drilling Con: Moderate / High. Excavation required for installing PRB. Likely to require moderate monitoring borehole network to be drilled.
Noise Pro: Once active, none/low. Con: During construction, medium to high.
Nei
ghbo
urh
oods
&
Reg
ions
Aesthetic impact Pro: Low after construction complete. Con: During short-term construction phase, medium to high.
Plant/mobilisation + installation costs Con: Moderate – High. Varies from simple passive systems to highly-engineered process-based demonstrations. Can be significant.
Dire
ct
Cos
ts
Operation & maintenance costs, including sampling, verification and personnel time (duration dependent)
Pro: True to the passive system philosophy, this would generally be relatively low (duration dependent).
Robustness/Durability, with respect to changing conditions (i.e. climate change).
Con: Passive systems are dependent upon a steady (long term) localised hydrogeological gradient, which in certain cases could be susceptible to new recharge/abstraction patterns.
Life
Spa
n /
Proj
ect
Ris
ks
Outcome success Con: Presently relatively little longer-term data with regards to longevity of reactive media and its re-installation.
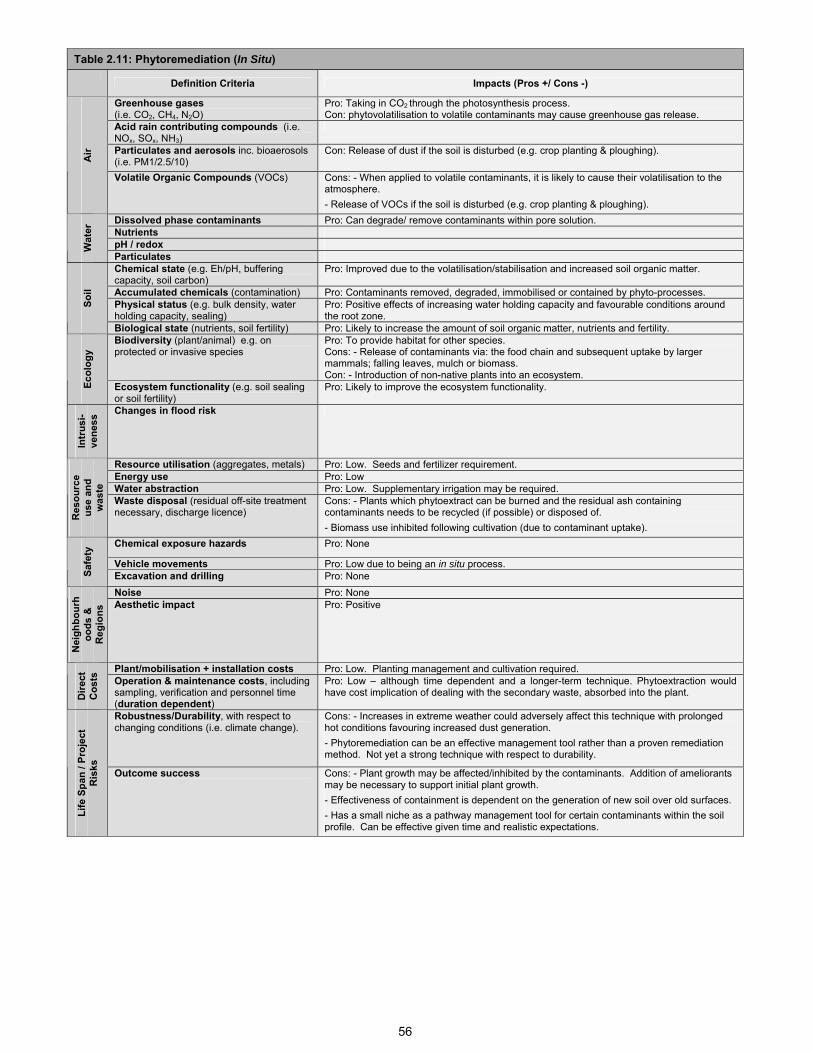
56
Table 2.11: Phytoremediation (In Situ)
Definition Criteria Impacts (Pros +/ Cons -)
Greenhouse gases (i.e. CO2, CH4, N2O)
Pro: Taking in CO2 through the photosynthesis process. Con: phytovolatilisation to volatile contaminants may cause greenhouse gas release.
Acid rain contributing compounds (i.e. NOx, SOx, NH3)
Particulates and aerosols inc. bioaerosols (i.e. PM1/2.5/10)
Con: Release of dust if the soil is disturbed (e.g. crop planting & ploughing).
Air
Volatile Organic Compounds (VOCs) Cons: - When applied to volatile contaminants, it is likely to cause their volatilisation to the atmosphere. - Release of VOCs if the soil is disturbed (e.g. crop planting & ploughing).
Dissolved phase contaminants Pro: Can degrade/ remove contaminants within pore solution. Nutrients pH / redox W
ater
Particulates Chemical state (e.g. Eh/pH, buffering capacity, soil carbon)
Pro: Improved due to the volatilisation/stabilisation and increased soil organic matter.
Accumulated chemicals (contamination) Pro: Contaminants removed, degraded, immobilised or contained by phyto-processes. Physical status (e.g. bulk density, water holding capacity, sealing)
Pro: Positive effects of increasing water holding capacity and favourable conditions around the root zone.
Soil
Biological state (nutrients, soil fertility) Pro: Likely to increase the amount of soil organic matter, nutrients and fertility. Biodiversity (plant/animal) e.g. on protected or invasive species
Pro: To provide habitat for other species. Cons: - Release of contaminants via: the food chain and subsequent uptake by larger mammals; falling leaves, mulch or biomass. Con: - Introduction of non-native plants into an ecosystem.
Ecol
ogy
Ecosystem functionality (e.g. soil sealing or soil fertility)
Pro: Likely to improve the ecosystem functionality.
Intr
usi-
vene
ss Changes in flood risk
Resource utilisation (aggregates, metals) Pro: Low. Seeds and fertilizer requirement. Energy use Pro: Low Water abstraction Pro: Low. Supplementary irrigation may be required.
Res
ourc
e us
e an
d w
aste
Waste disposal (residual off-site treatment necessary, discharge licence)
Cons: - Plants which phytoextract can be burned and the residual ash containing contaminants needs to be recycled (if possible) or disposed of. - Biomass use inhibited following cultivation (due to contaminant uptake).
Chemical exposure hazards Pro: None
Vehicle movements Pro: Low due to being an in situ process.
Safe
ty
Excavation and drilling Pro: None Noise Pro: None
Nei
ghbo
urh
oods
&
Reg
ions
Aesthetic impact Pro: Positive
Plant/mobilisation + installation costs Pro: Low. Planting management and cultivation required.
Dire
ct
Cos
ts
Operation & maintenance costs, including sampling, verification and personnel time (duration dependent)
Pro: Low – although time dependent and a longer-term technique. Phytoextraction would have cost implication of dealing with the secondary waste, absorbed into the plant.
Robustness/Durability, with respect to changing conditions (i.e. climate change).
Cons: - Increases in extreme weather could adversely affect this technique with prolonged hot conditions favouring increased dust generation. - Phytoremediation can be an effective management tool rather than a proven remediation method. Not yet a strong technique with respect to durability.
Life
Spa
n / P
roje
ct
Ris
ks
Outcome success Cons: - Plant growth may be affected/inhibited by the contaminants. Addition of ameliorants may be necessary to support initial plant growth. - Effectiveness of containment is dependent on the generation of new soil over old surfaces. - Has a small niche as a pathway management tool for certain contaminants within the soil profile. Can be effective given time and realistic expectations.
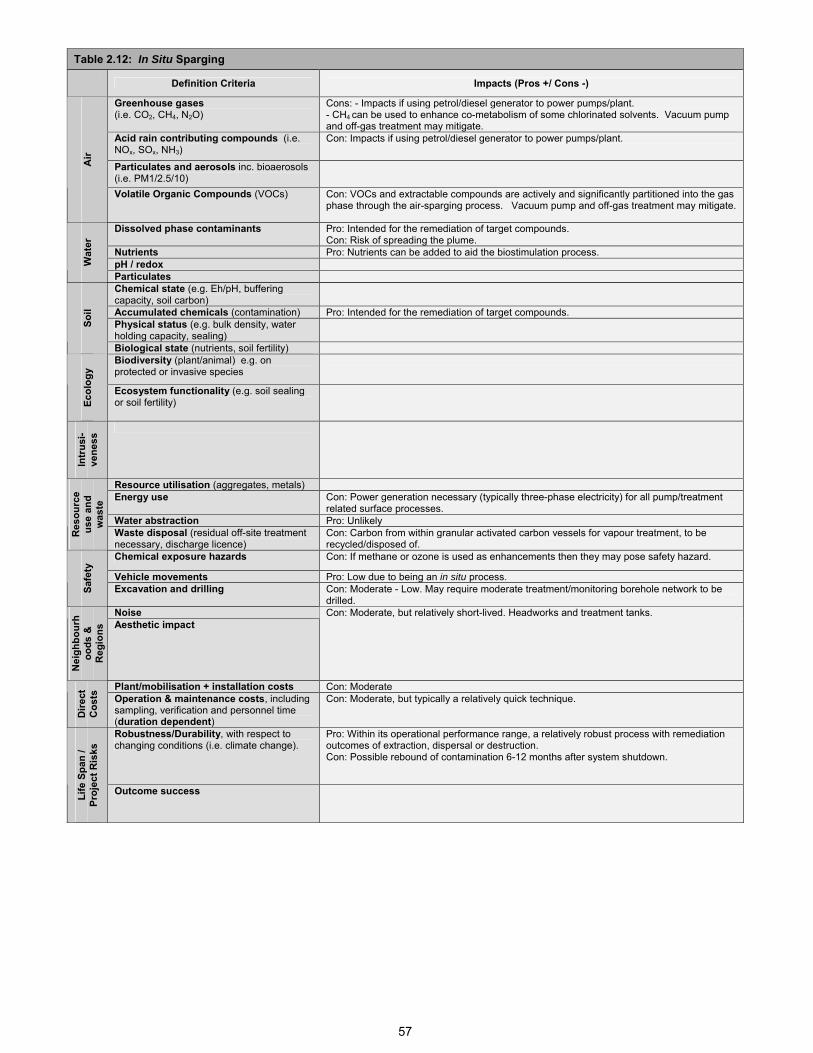
57
Table 2.12: In Situ Sparging
Definition Criteria Impacts (Pros +/ Cons -)
Greenhouse gases (i.e. CO2, CH4, N2O)
Cons: - Impacts if using petrol/diesel generator to power pumps/plant. - CH4 can be used to enhance co-metabolism of some chlorinated solvents. Vacuum pump and off-gas treatment may mitigate.
Acid rain contributing compounds (i.e. NOx, SOx, NH3)
Con: Impacts if using petrol/diesel generator to power pumps/plant.
Particulates and aerosols inc. bioaerosols (i.e. PM1/2.5/10)
Air
Volatile Organic Compounds (VOCs) Con: VOCs and extractable compounds are actively and significantly partitioned into the gas phase through the air-sparging process. Vacuum pump and off-gas treatment may mitigate.
Dissolved phase contaminants Pro: Intended for the remediation of target compounds. Con: Risk of spreading the plume.
Nutrients Pro: Nutrients can be added to aid the biostimulation process. pH / redox W
ater
Particulates Chemical state (e.g. Eh/pH, buffering capacity, soil carbon)
Accumulated chemicals (contamination) Pro: Intended for the remediation of target compounds. Physical status (e.g. bulk density, water holding capacity, sealing)
Soil
Biological state (nutrients, soil fertility) Biodiversity (plant/animal) e.g. on protected or invasive species
Ecol
ogy
Ecosystem functionality (e.g. soil sealing or soil fertility)
Intr
usi-
vene
ss
Resource utilisation (aggregates, metals) Energy use Con: Power generation necessary (typically three-phase electricity) for all pump/treatment
related surface processes. Water abstraction Pro: Unlikely
Res
ourc
e us
e an
d w
aste
Waste disposal (residual off-site treatment necessary, discharge licence)
Con: Carbon from within granular activated carbon vessels for vapour treatment, to be recycled/disposed of.
Chemical exposure hazards Con: If methane or ozone is used as enhancements then they may pose safety hazard.
Vehicle movements Pro: Low due to being an in situ process.
Safe
ty
Excavation and drilling Con: Moderate - Low. May require moderate treatment/monitoring borehole network to be drilled.
Noise
Nei
ghbo
urh
oods
&
Reg
ions
Aesthetic impact Con: Moderate, but relatively short-lived. Headworks and treatment tanks.
Plant/mobilisation + installation costs Con: Moderate
Dire
ct
Cos
ts
Operation & maintenance costs, including sampling, verification and personnel time (duration dependent)
Con: Moderate, but typically a relatively quick technique.
Robustness/Durability, with respect to changing conditions (i.e. climate change).
Pro: Within its operational performance range, a relatively robust process with remediation outcomes of extraction, dispersal or destruction. Con: Possible rebound of contamination 6-12 months after system shutdown.
Life
Spa
n /
Proj
ect R
isks
Outcome success
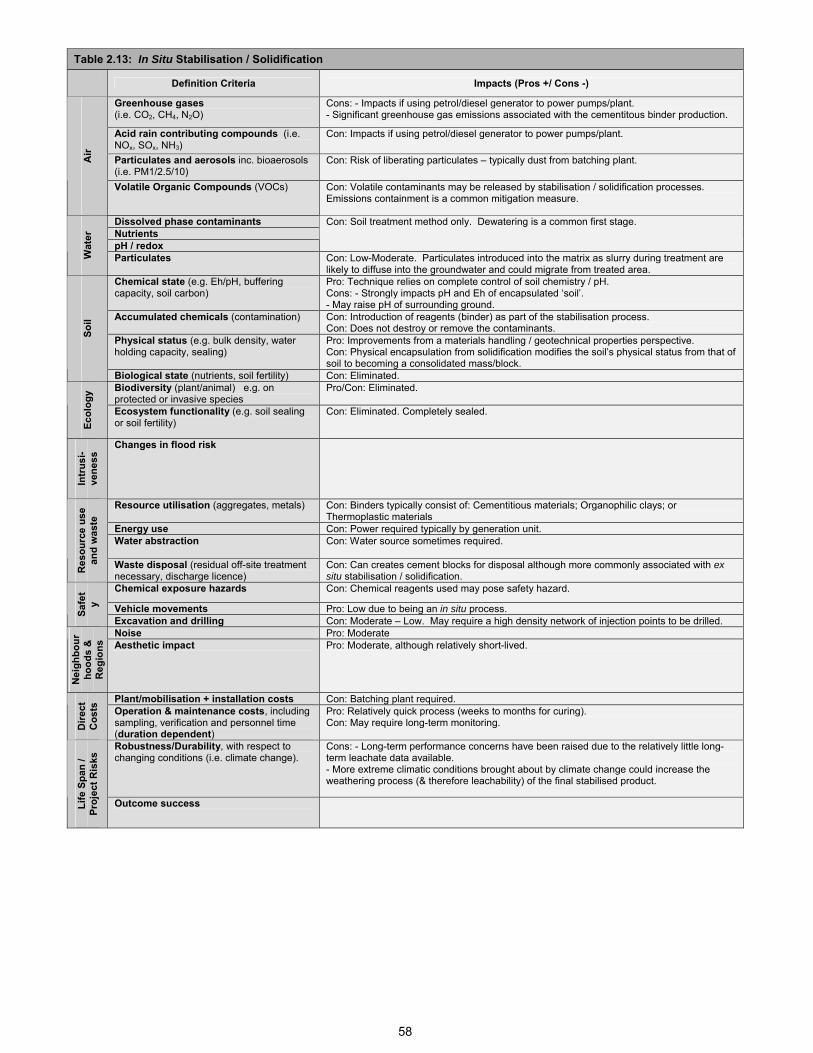
58
Table 2.13: In Situ Stabilisation / Solidification
Definition Criteria Impacts (Pros +/ Cons -)
Greenhouse gases (i.e. CO2, CH4, N2O)
Cons: - Impacts if using petrol/diesel generator to power pumps/plant. - Significant greenhouse gas emissions associated with the cementitous binder production.
Acid rain contributing compounds (i.e. NOx, SOx, NH3)
Con: Impacts if using petrol/diesel generator to power pumps/plant.
Particulates and aerosols inc. bioaerosols (i.e. PM1/2.5/10)
Con: Risk of liberating particulates – typically dust from batching plant. Air
Volatile Organic Compounds (VOCs) Con: Volatile contaminants may be released by stabilisation / solidification processes. Emissions containment is a common mitigation measure.
Dissolved phase contaminants Nutrients pH / redox
Con: Soil treatment method only. Dewatering is a common first stage.
Wat
er
Particulates Con: Low-Moderate. Particulates introduced into the matrix as slurry during treatment are likely to diffuse into the groundwater and could migrate from treated area.
Chemical state (e.g. Eh/pH, buffering capacity, soil carbon)
Pro: Technique relies on complete control of soil chemistry / pH. Cons: - Strongly impacts pH and Eh of encapsulated ‘soil’. - May raise pH of surrounding ground.
Accumulated chemicals (contamination) Con: Introduction of reagents (binder) as part of the stabilisation process. Con: Does not destroy or remove the contaminants.
Physical status (e.g. bulk density, water holding capacity, sealing)
Pro: Improvements from a materials handling / geotechnical properties perspective. Con: Physical encapsulation from solidification modifies the soil’s physical status from that of soil to becoming a consolidated mass/block.
Soil
Biological state (nutrients, soil fertility) Con: Eliminated. Biodiversity (plant/animal) e.g. on protected or invasive species
Pro/Con: Eliminated.
Ecol
ogy
Ecosystem functionality (e.g. soil sealing or soil fertility)
Con: Eliminated. Completely sealed.
Intr
usi-
vene
ss Changes in flood risk
Resource utilisation (aggregates, metals) Con: Binders typically consist of: Cementitious materials; Organophilic clays; or Thermoplastic materials
Energy use Con: Power required typically by generation unit. Water abstraction Con: Water source sometimes required.
Res
ourc
e us
e an
d w
aste
Waste disposal (residual off-site treatment necessary, discharge licence)
Con: Can creates cement blocks for disposal although more commonly associated with ex situ stabilisation / solidification.
Chemical exposure hazards Con: Chemical reagents used may pose safety hazard.
Vehicle movements Pro: Low due to being an in situ process. Safe
ty
Excavation and drilling Con: Moderate – Low. May require a high density network of injection points to be drilled. Noise Pro: Moderate
Nei
ghbo
urho
ods
&
Reg
ions
Aesthetic impact Pro: Moderate, although relatively short-lived.
Plant/mobilisation + installation costs Con: Batching plant required.
Dire
ct
Cos
ts
Operation & maintenance costs, including sampling, verification and personnel time (duration dependent)
Pro: Relatively quick process (weeks to months for curing). Con: May require long-term monitoring.
Robustness/Durability, with respect to changing conditions (i.e. climate change).
Cons: - Long-term performance concerns have been raised due to the relatively little long-term leachate data available. - More extreme climatic conditions brought about by climate change could increase the weathering process (& therefore leachability) of the final stabilised product.
Life
Spa
n /
Proj
ect R
isks
Outcome success
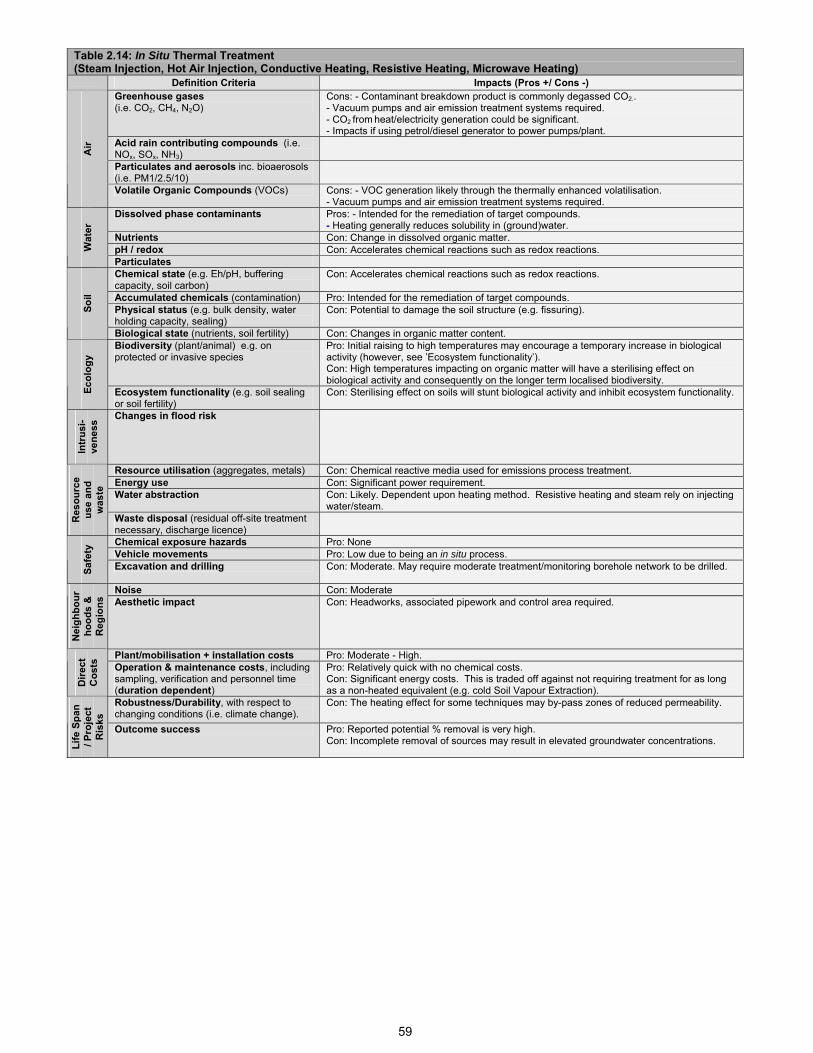
59
Table 2.14: In Situ Thermal Treatment (Steam Injection, Hot Air Injection, Conductive Heating, Resistive Heating, Microwave Heating)
Definition Criteria Impacts (Pros +/ Cons -) Greenhouse gases (i.e. CO2, CH4, N2O)
Cons: - Contaminant breakdown product is commonly degassed CO2.. - Vacuum pumps and air emission treatment systems required. - CO2 from heat/electricity generation could be significant. - Impacts if using petrol/diesel generator to power pumps/plant.
Acid rain contributing compounds (i.e. NOx, SOx, NH3)
Particulates and aerosols inc. bioaerosols (i.e. PM1/2.5/10)
Air
Volatile Organic Compounds (VOCs) Cons: - VOC generation likely through the thermally enhanced volatilisation. - Vacuum pumps and air emission treatment systems required.
Dissolved phase contaminants Pros: - Intended for the remediation of target compounds. - Heating generally reduces solubility in (ground)water.
Nutrients Con: Change in dissolved organic matter. pH / redox Con: Accelerates chemical reactions such as redox reactions. W
ater
Particulates Chemical state (e.g. Eh/pH, buffering capacity, soil carbon)
Con: Accelerates chemical reactions such as redox reactions.
Accumulated chemicals (contamination) Pro: Intended for the remediation of target compounds. Physical status (e.g. bulk density, water holding capacity, sealing)
Con: Potential to damage the soil structure (e.g. fissuring). Soil
Biological state (nutrients, soil fertility) Con: Changes in organic matter content. Biodiversity (plant/animal) e.g. on protected or invasive species
Pro: Initial raising to high temperatures may encourage a temporary increase in biological activity (however, see ’Ecosystem functionality’). Con: High temperatures impacting on organic matter will have a sterilising effect on biological activity and consequently on the longer term localised biodiversity.
Ecol
ogy
Ecosystem functionality (e.g. soil sealing or soil fertility)
Con: Sterilising effect on soils will stunt biological activity and inhibit ecosystem functionality.
Intr
usi-
vene
ss Changes in flood risk
Resource utilisation (aggregates, metals) Con: Chemical reactive media used for emissions process treatment. Energy use Con: Significant power requirement. Water abstraction Con: Likely. Dependent upon heating method. Resistive heating and steam rely on injecting
water/steam.
Res
ourc
e us
e an
d w
aste
Waste disposal (residual off-site treatment necessary, discharge licence)
Chemical exposure hazards Pro: None Vehicle movements Pro: Low due to being an in situ process.
Safe
ty
Excavation and drilling Con: Moderate. May require moderate treatment/monitoring borehole network to be drilled.
Noise Con: Moderate
Nei
ghbo
urho
ods
&
Reg
ions
Aesthetic impact Con: Headworks, associated pipework and control area required.
Plant/mobilisation + installation costs Pro: Moderate - High.
Dire
ct
Cos
ts
Operation & maintenance costs, including sampling, verification and personnel time (duration dependent)
Pro: Relatively quick with no chemical costs. Con: Significant energy costs. This is traded off against not requiring treatment for as long as a non-heated equivalent (e.g. cold Soil Vapour Extraction).
Robustness/Durability, with respect to changing conditions (i.e. climate change).
Con: The heating effect for some techniques may by-pass zones of reduced permeability.
Life
Spa
n / P
roje
ct
Ris
ks
Outcome success Pro: Reported potential % removal is very high. Con: Incomplete removal of sources may result in elevated groundwater concentrations.
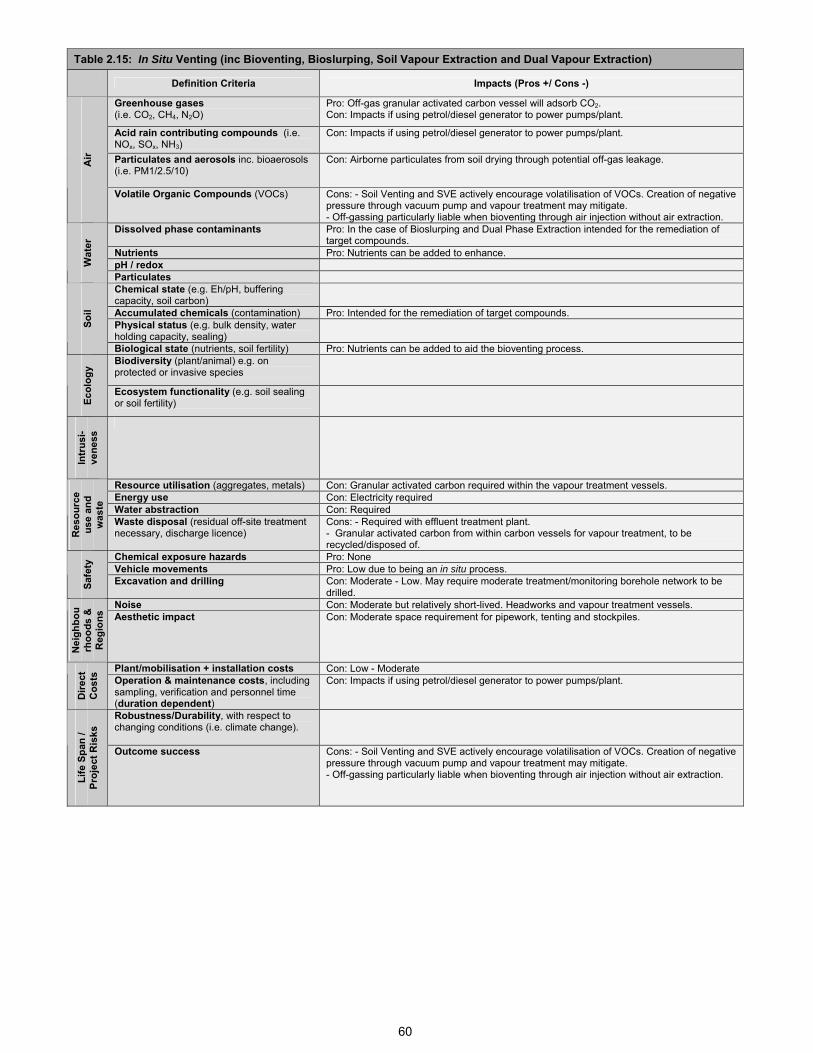
60
Table 2.15: In Situ Venting (inc Bioventing, Bioslurping, Soil Vapour Extraction and Dual Vapour Extraction)
Definition Criteria Impacts (Pros +/ Cons -)
Greenhouse gases (i.e. CO2, CH4, N2O)
Pro: Off-gas granular activated carbon vessel will adsorb CO2. Con: Impacts if using petrol/diesel generator to power pumps/plant.
Acid rain contributing compounds (i.e. NOx, SOx, NH3)
Con: Impacts if using petrol/diesel generator to power pumps/plant.
Particulates and aerosols inc. bioaerosols (i.e. PM1/2.5/10)
Con: Airborne particulates from soil drying through potential off-gas leakage. Air
Volatile Organic Compounds (VOCs) Cons: - Soil Venting and SVE actively encourage volatilisation of VOCs. Creation of negative pressure through vacuum pump and vapour treatment may mitigate. - Off-gassing particularly liable when bioventing through air injection without air extraction.
Dissolved phase contaminants Pro: In the case of Bioslurping and Dual Phase Extraction intended for the remediation of target compounds.
Nutrients Pro: Nutrients can be added to enhance. pH / redox W
ater
Particulates Chemical state (e.g. Eh/pH, buffering capacity, soil carbon)
Accumulated chemicals (contamination) Pro: Intended for the remediation of target compounds. Physical status (e.g. bulk density, water holding capacity, sealing)
Soil
Biological state (nutrients, soil fertility) Pro: Nutrients can be added to aid the bioventing process. Biodiversity (plant/animal) e.g. on protected or invasive species
Ecol
ogy
Ecosystem functionality (e.g. soil sealing or soil fertility)
Intr
usi-
vene
ss
Resource utilisation (aggregates, metals) Con: Granular activated carbon required within the vapour treatment vessels. Energy use Con: Electricity required Water abstraction Con: Required
Res
ourc
e us
e an
d w
aste
Waste disposal (residual off-site treatment necessary, discharge licence)
Cons: - Required with effluent treatment plant. - Granular activated carbon from within carbon vessels for vapour treatment, to be recycled/disposed of.
Chemical exposure hazards Pro: None Vehicle movements Pro: Low due to being an in situ process.
Safe
ty
Excavation and drilling Con: Moderate - Low. May require moderate treatment/monitoring borehole network to be drilled.
Noise Con: Moderate but relatively short-lived. Headworks and vapour treatment vessels.
Nei
ghbo
urh
oods
&
Reg
ions
Aesthetic impact Con: Moderate space requirement for pipework, tenting and stockpiles.
Plant/mobilisation + installation costs Con: Low - Moderate
Dire
ct
Cos
ts
Operation & maintenance costs, including sampling, verification and personnel time (duration dependent)
Con: Impacts if using petrol/diesel generator to power pumps/plant.
Robustness/Durability, with respect to changing conditions (i.e. climate change).
Life
Spa
n /
Proj
ect R
isks
Outcome success Cons: - Soil Venting and SVE actively encourage volatilisation of VOCs. Creation of negative pressure through vacuum pump and vapour treatment may mitigate. - Off-gassing particularly liable when bioventing through air injection without air extraction.
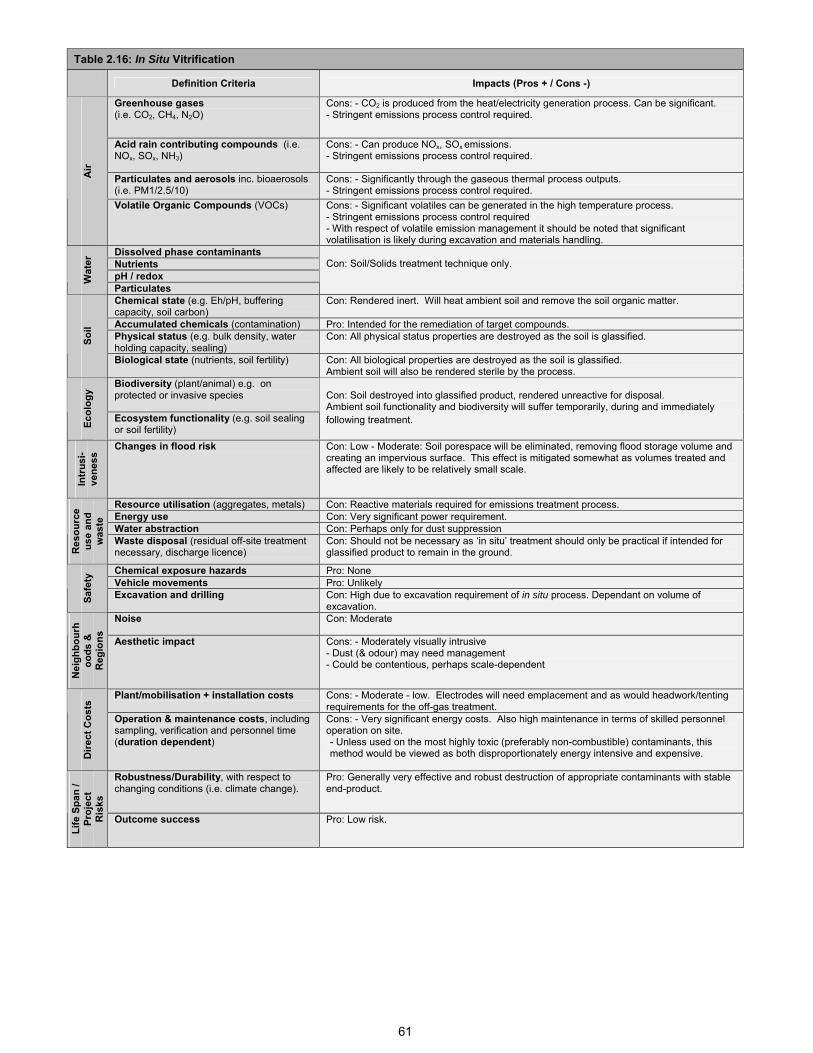
61
Table 2.16: In Situ Vitrification
Definition Criteria Impacts (Pros + / Cons -)
Greenhouse gases (i.e. CO2, CH4, N2O)
Cons: - CO2 is produced from the heat/electricity generation process. Can be significant. - Stringent emissions process control required.
Acid rain contributing compounds (i.e. NOx, SOx, NH3)
Cons: - Can produce NOx, SOx emissions. - Stringent emissions process control required.
Particulates and aerosols inc. bioaerosols (i.e. PM1/2.5/10)
Cons: - Significantly through the gaseous thermal process outputs. - Stringent emissions process control required.
Air
Volatile Organic Compounds (VOCs) Cons: - Significant volatiles can be generated in the high temperature process. - Stringent emissions process control required - With respect of volatile emission management it should be noted that significant volatilisation is likely during excavation and materials handling.
Dissolved phase contaminants Nutrients pH / redox W
ater
Particulates
Con: Soil/Solids treatment technique only.
Chemical state (e.g. Eh/pH, buffering capacity, soil carbon)
Con: Rendered inert. Will heat ambient soil and remove the soil organic matter.
Accumulated chemicals (contamination) Pro: Intended for the remediation of target compounds. Physical status (e.g. bulk density, water holding capacity, sealing)
Con: All physical status properties are destroyed as the soil is glassified. Soil
Biological state (nutrients, soil fertility) Con: All biological properties are destroyed as the soil is glassified. Ambient soil will also be rendered sterile by the process.
Biodiversity (plant/animal) e.g. on protected or invasive species
Ecol
ogy
Ecosystem functionality (e.g. soil sealing or soil fertility)
Con: Soil destroyed into glassified product, rendered unreactive for disposal. Ambient soil functionality and biodiversity will suffer temporarily, during and immediately following treatment.
Intr
usi-
vene
ss Changes in flood risk Con: Low - Moderate: Soil porespace will be eliminated, removing flood storage volume and
creating an impervious surface. This effect is mitigated somewhat as volumes treated and affected are likely to be relatively small scale.
Resource utilisation (aggregates, metals) Con: Reactive materials required for emissions treatment process. Energy use Con: Very significant power requirement. Water abstraction Con: Perhaps only for dust suppression
Res
ourc
e us
e an
d w
aste
Waste disposal (residual off-site treatment necessary, discharge licence)
Con: Should not be necessary as ‘in situ’ treatment should only be practical if intended for glassified product to remain in the ground.
Chemical exposure hazards Pro: None Vehicle movements Pro: Unlikely
Safe
ty
Excavation and drilling Con: High due to excavation requirement of in situ process. Dependant on volume of excavation.
Noise Con: Moderate
Nei
ghbo
urh
oods
&
Reg
ions
Aesthetic impact Cons: - Moderately visually intrusive - Dust (& odour) may need management - Could be contentious, perhaps scale-dependent
Plant/mobilisation + installation costs Cons: - Moderate - low. Electrodes will need emplacement and as would headwork/tenting requirements for the off-gas treatment.
Dire
ct C
osts
Operation & maintenance costs, including sampling, verification and personnel time (duration dependent)
Cons: - Very significant energy costs. Also high maintenance in terms of skilled personnel operation on site. - Unless used on the most highly toxic (preferably non-combustible) contaminants, this method would be viewed as both disproportionately energy intensive and expensive.
Robustness/Durability, with respect to changing conditions (i.e. climate change).
Pro: Generally very effective and robust destruction of appropriate contaminants with stable end-product.
Life
Spa
n /
Proj
ect
Ris
ks
Outcome success Pro: Low risk.
62
2.5 Ex Situ Remediation Technology Impact Tables This section provides guideline tables assessing ex situ remediation technologies against the headline indicators and definition criteria selected from Section 2.2. These tables demonstrate how remediation technologies may be assessed more holistically; and illuminate advantages and disadvantages of those different technologies which may or may not be immediately obvious. The same reasoning set out in Section 2.3 regarding Sustainability Impact Assessment criteria and qualitative impacts equally applies to this section. The ex situ remediation technologies evaluated in this section are:
• Biological treatment (Table 2.17) • Chemical oxidation and reduction (Table 2.18) • Soil washing (Table 2.19) • Stabilisation / Solidification (Table 2.20) • Thermal treatment (Table 2.21) • Venting (Table 2.22) • Vitrification (Table 2.23)
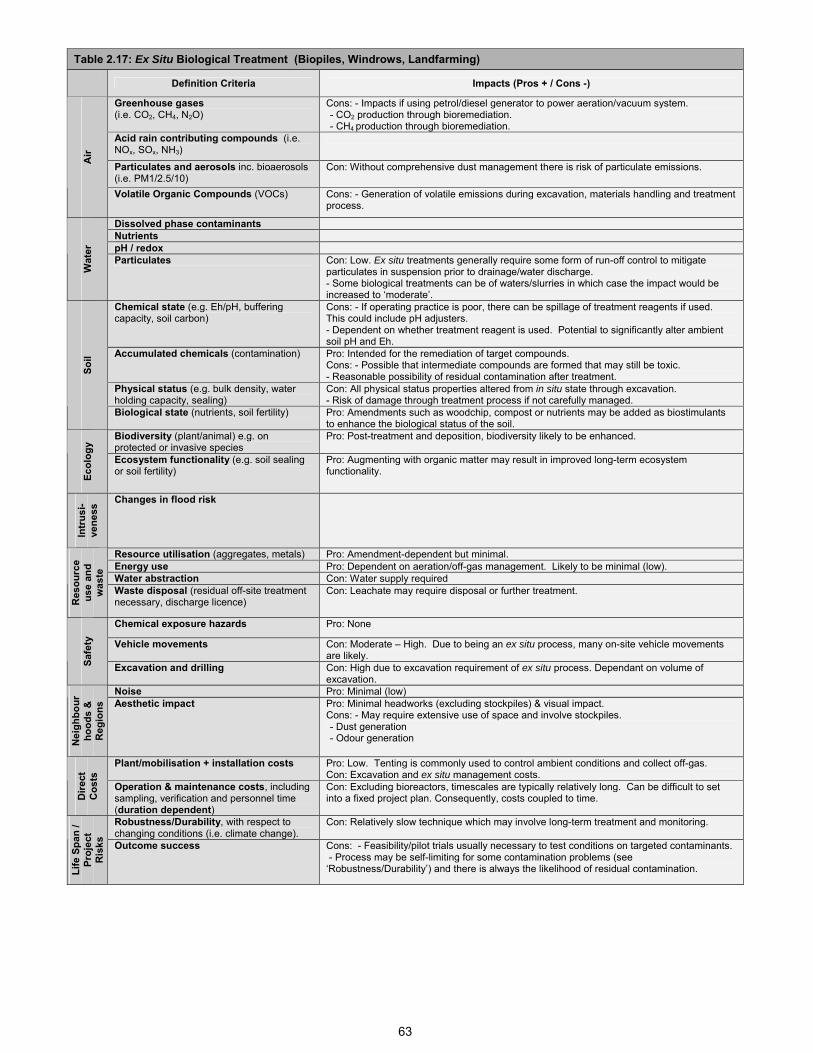
63
Table 2.17: Ex Situ Biological Treatment (Biopiles, Windrows, Landfarming)
Definition Criteria Impacts (Pros + / Cons -)
Greenhouse gases (i.e. CO2, CH4, N2O)
Cons: - Impacts if using petrol/diesel generator to power aeration/vacuum system. - CO2 production through bioremediation. - CH4 production through bioremediation.
Acid rain contributing compounds (i.e. NOx, SOx, NH3)
Particulates and aerosols inc. bioaerosols (i.e. PM1/2.5/10)
Con: Without comprehensive dust management there is risk of particulate emissions. Air
Volatile Organic Compounds (VOCs) Cons: - Generation of volatile emissions during excavation, materials handling and treatment process.
Dissolved phase contaminants Nutrients pH / redox
Wat
er
Particulates Con: Low. Ex situ treatments generally require some form of run-off control to mitigate particulates in suspension prior to drainage/water discharge. - Some biological treatments can be of waters/slurries in which case the impact would be increased to ‘moderate’.
Chemical state (e.g. Eh/pH, buffering capacity, soil carbon)
Cons: - If operating practice is poor, there can be spillage of treatment reagents if used. This could include pH adjusters. - Dependent on whether treatment reagent is used. Potential to significantly alter ambient soil pH and Eh.
Accumulated chemicals (contamination) Pro: Intended for the remediation of target compounds. Cons: - Possible that intermediate compounds are formed that may still be toxic. - Reasonable possibility of residual contamination after treatment.
Physical status (e.g. bulk density, water holding capacity, sealing)
Con: All physical status properties altered from in situ state through excavation. - Risk of damage through treatment process if not carefully managed.
Soil
Biological state (nutrients, soil fertility) Pro: Amendments such as woodchip, compost or nutrients may be added as biostimulants to enhance the biological status of the soil.
Biodiversity (plant/animal) e.g. on protected or invasive species
Pro: Post-treatment and deposition, biodiversity likely to be enhanced.
Ecol
ogy
Ecosystem functionality (e.g. soil sealing or soil fertility)
Pro: Augmenting with organic matter may result in improved long-term ecosystem functionality.
Intr
usi-
vene
ss Changes in flood risk
Resource utilisation (aggregates, metals) Pro: Amendment-dependent but minimal. Energy use Pro: Dependent on aeration/off-gas management. Likely to be minimal (low). Water abstraction Con: Water supply required
Res
ourc
e us
e an
d w
aste
Waste disposal (residual off-site treatment necessary, discharge licence)
Con: Leachate may require disposal or further treatment.
Chemical exposure hazards Pro: None
Vehicle movements Con: Moderate – High. Due to being an ex situ process, many on-site vehicle movements are likely.
Safe
ty
Excavation and drilling Con: High due to excavation requirement of ex situ process. Dependant on volume of excavation.
Noise Pro: Minimal (low)
Nei
ghbo
ur
hood
s &
R
egio
ns Aesthetic impact Pro: Minimal headworks (excluding stockpiles) & visual impact.
Cons: - May require extensive use of space and involve stockpiles. - Dust generation - Odour generation
Plant/mobilisation + installation costs Pro: Low. Tenting is commonly used to control ambient conditions and collect off-gas. Con: Excavation and ex situ management costs.
Dire
ct
Cos
ts
Operation & maintenance costs, including sampling, verification and personnel time (duration dependent)
Con: Excluding bioreactors, timescales are typically relatively long. Can be difficult to set into a fixed project plan. Consequently, costs coupled to time.
Robustness/Durability, with respect to changing conditions (i.e. climate change).
Con: Relatively slow technique which may involve long-term treatment and monitoring.
Life
Spa
n /
Proj
ect
Ris
ks
Outcome success Cons: - Feasibility/pilot trials usually necessary to test conditions on targeted contaminants. - Process may be self-limiting for some contamination problems (see ‘Robustness/Durability’) and there is always the likelihood of residual contamination.
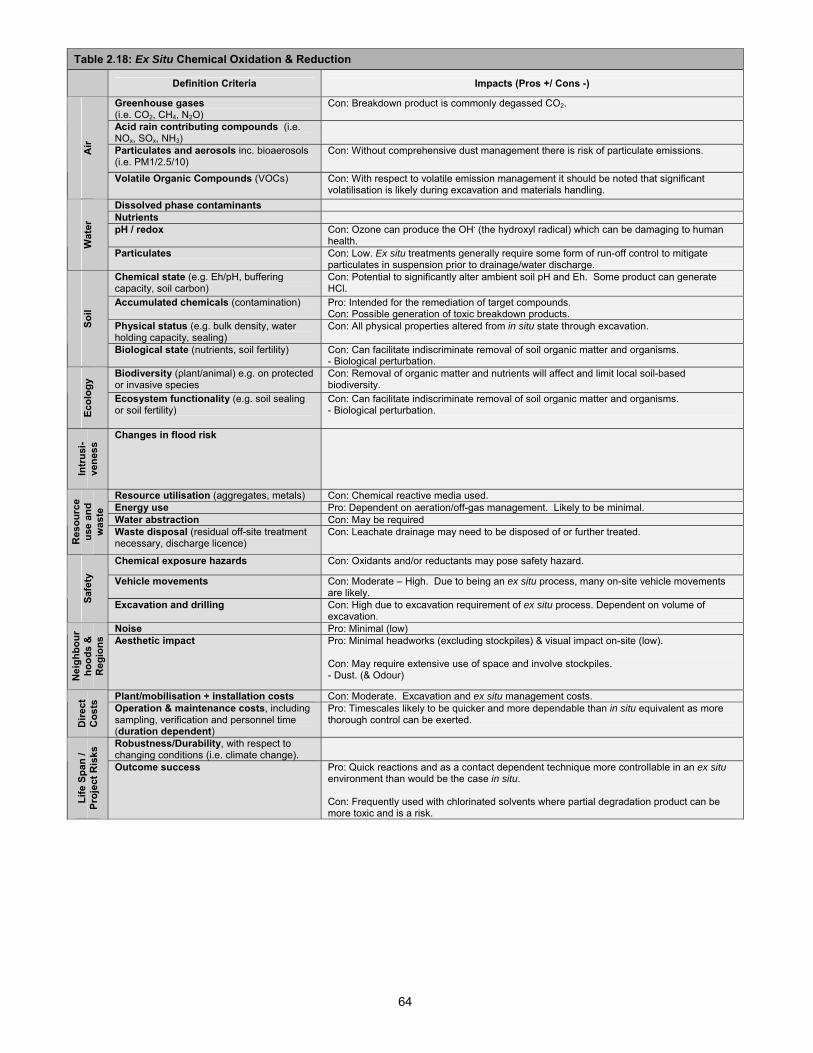
64
Table 2.18: Ex Situ Chemical Oxidation & Reduction
Definition Criteria Impacts (Pros +/ Cons -)
Greenhouse gases (i.e. CO2, CH4, N2O)
Con: Breakdown product is commonly degassed CO2.
Acid rain contributing compounds (i.e. NOx, SOx, NH3)
Particulates and aerosols inc. bioaerosols (i.e. PM1/2.5/10)
Con: Without comprehensive dust management there is risk of particulate emissions. Air
Volatile Organic Compounds (VOCs) Con: With respect to volatile emission management it should be noted that significant volatilisation is likely during excavation and materials handling.
Dissolved phase contaminants Nutrients pH / redox Con: Ozone can produce the OH. (the hydroxyl radical) which can be damaging to human
health. Wat
er
Particulates Con: Low. Ex situ treatments generally require some form of run-off control to mitigate particulates in suspension prior to drainage/water discharge.
Chemical state (e.g. Eh/pH, buffering capacity, soil carbon)
Con: Potential to significantly alter ambient soil pH and Eh. Some product can generate HCl.
Accumulated chemicals (contamination) Pro: Intended for the remediation of target compounds. Con: Possible generation of toxic breakdown products.
Physical status (e.g. bulk density, water holding capacity, sealing)
Con: All physical properties altered from in situ state through excavation. Soil
Biological state (nutrients, soil fertility) Con: Can facilitate indiscriminate removal of soil organic matter and organisms. - Biological perturbation.
Biodiversity (plant/animal) e.g. on protected or invasive species
Con: Removal of organic matter and nutrients will affect and limit local soil-based biodiversity.
Ecol
ogy
Ecosystem functionality (e.g. soil sealing or soil fertility)
Con: Can facilitate indiscriminate removal of soil organic matter and organisms. - Biological perturbation.
Intr
usi-
vene
ss Changes in flood risk
Resource utilisation (aggregates, metals) Con: Chemical reactive media used. Energy use Pro: Dependent on aeration/off-gas management. Likely to be minimal. Water abstraction Con: May be required
Res
ourc
e us
e an
d w
aste
Waste disposal (residual off-site treatment necessary, discharge licence)
Con: Leachate drainage may need to be disposed of or further treated.
Chemical exposure hazards Con: Oxidants and/or reductants may pose safety hazard.
Vehicle movements Con: Moderate – High. Due to being an ex situ process, many on-site vehicle movements are likely.
Safe
ty
Excavation and drilling Con: High due to excavation requirement of ex situ process. Dependent on volume of excavation.
Noise Pro: Minimal (low)
Nei
ghbo
urho
ods
&
Reg
ions
Aesthetic impact Pro: Minimal headworks (excluding stockpiles) & visual impact on-site (low). Con: May require extensive use of space and involve stockpiles. - Dust. (& Odour)
Plant/mobilisation + installation costs Con: Moderate. Excavation and ex situ management costs.
Dire
ct
Cos
ts
Operation & maintenance costs, including sampling, verification and personnel time (duration dependent)
Pro: Timescales likely to be quicker and more dependable than in situ equivalent as more thorough control can be exerted.
Robustness/Durability, with respect to changing conditions (i.e. climate change).
Life
Spa
n /
Proj
ect R
isks
Outcome success Pro: Quick reactions and as a contact dependent technique more controllable in an ex situ environment than would be the case in situ. Con: Frequently used with chlorinated solvents where partial degradation product can be more toxic and is a risk.
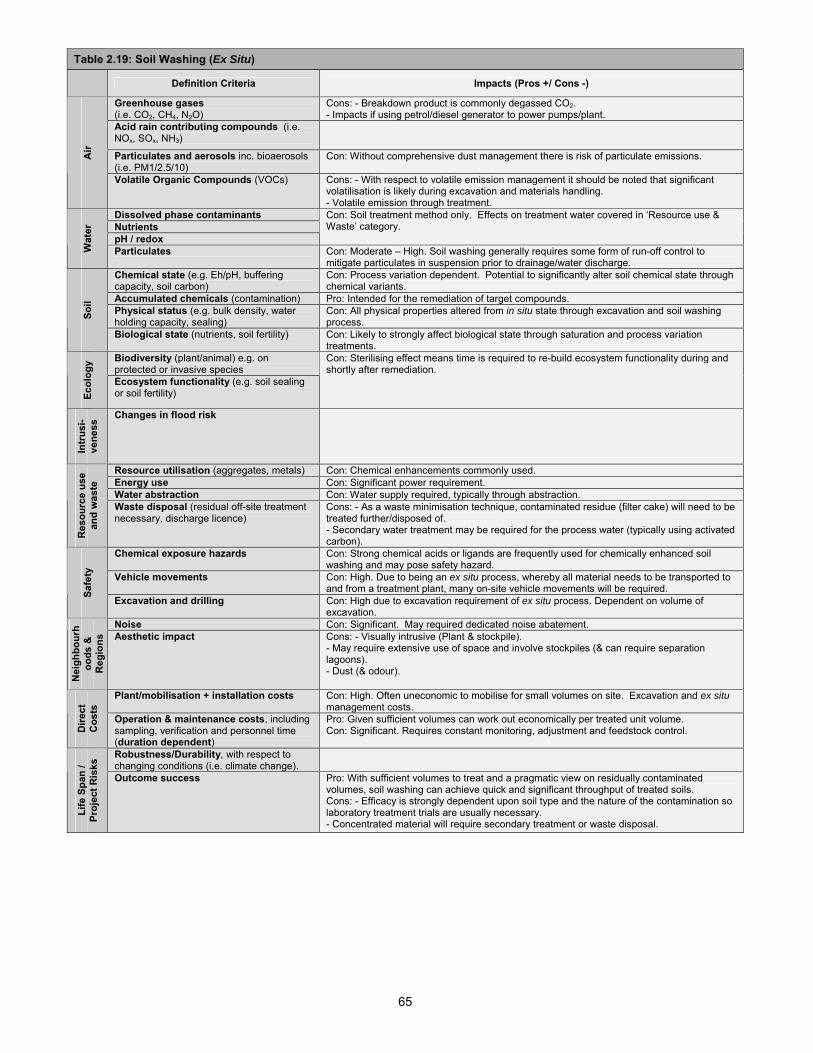
65
Table 2.19: Soil Washing (Ex Situ)
Definition Criteria Impacts (Pros +/ Cons -)
Greenhouse gases (i.e. CO2, CH4, N2O)
Cons: - Breakdown product is commonly degassed CO2. - Impacts if using petrol/diesel generator to power pumps/plant.
Acid rain contributing compounds (i.e. NOx, SOx, NH3)
Particulates and aerosols inc. bioaerosols (i.e. PM1/2.5/10)
Con: Without comprehensive dust management there is risk of particulate emissions. Air
Volatile Organic Compounds (VOCs) Cons: - With respect to volatile emission management it should be noted that significant volatilisation is likely during excavation and materials handling. - Volatile emission through treatment.
Dissolved phase contaminants Nutrients pH / redox
Con: Soil treatment method only. Effects on treatment water covered in ‘Resource use & Waste’ category.
Wat
er
Particulates Con: Moderate – High. Soil washing generally requires some form of run-off control to mitigate particulates in suspension prior to drainage/water discharge.
Chemical state (e.g. Eh/pH, buffering capacity, soil carbon)
Con: Process variation dependent. Potential to significantly alter soil chemical state through chemical variants.
Accumulated chemicals (contamination) Pro: Intended for the remediation of target compounds. Physical status (e.g. bulk density, water holding capacity, sealing)
Con: All physical properties altered from in situ state through excavation and soil washing process. So
il
Biological state (nutrients, soil fertility) Con: Likely to strongly affect biological state through saturation and process variation treatments.
Biodiversity (plant/animal) e.g. on protected or invasive species
Ecol
ogy
Ecosystem functionality (e.g. soil sealing or soil fertility)
Con: Sterilising effect means time is required to re-build ecosystem functionality during and shortly after remediation.
Intr
usi-
vene
ss Changes in flood risk
Resource utilisation (aggregates, metals) Con: Chemical enhancements commonly used. Energy use Con: Significant power requirement. Water abstraction Con: Water supply required, typically through abstraction.
Res
ourc
e us
e an
d w
aste
Waste disposal (residual off-site treatment necessary, discharge licence)
Cons: - As a waste minimisation technique, contaminated residue (filter cake) will need to be treated further/disposed of. - Secondary water treatment may be required for the process water (typically using activated carbon).
Chemical exposure hazards Con: Strong chemical acids or ligands are frequently used for chemically enhanced soil washing and may pose safety hazard.
Vehicle movements Con: High. Due to being an ex situ process, whereby all material needs to be transported to and from a treatment plant, many on-site vehicle movements will be required. Sa
fety
Excavation and drilling Con: High due to excavation requirement of ex situ process. Dependent on volume of excavation.
Noise Con: Significant. May required dedicated noise abatement.
Nei
ghbo
urh
oods
&
Reg
ions
Aesthetic impact Cons: - Visually intrusive (Plant & stockpile). - May require extensive use of space and involve stockpiles (& can require separation lagoons). - Dust (& odour).
Plant/mobilisation + installation costs Con: High. Often uneconomic to mobilise for small volumes on site. Excavation and ex situ management costs.
Dire
ct
Cos
ts
Operation & maintenance costs, including sampling, verification and personnel time (duration dependent)
Pro: Given sufficient volumes can work out economically per treated unit volume. Con: Significant. Requires constant monitoring, adjustment and feedstock control.
Robustness/Durability, with respect to changing conditions (i.e. climate change).
Life
Spa
n /
Proj
ect R
isks
Outcome success Pro: With sufficient volumes to treat and a pragmatic view on residually contaminated volumes, soil washing can achieve quick and significant throughput of treated soils. Cons: - Efficacy is strongly dependent upon soil type and the nature of the contamination so laboratory treatment trials are usually necessary. - Concentrated material will require secondary treatment or waste disposal.
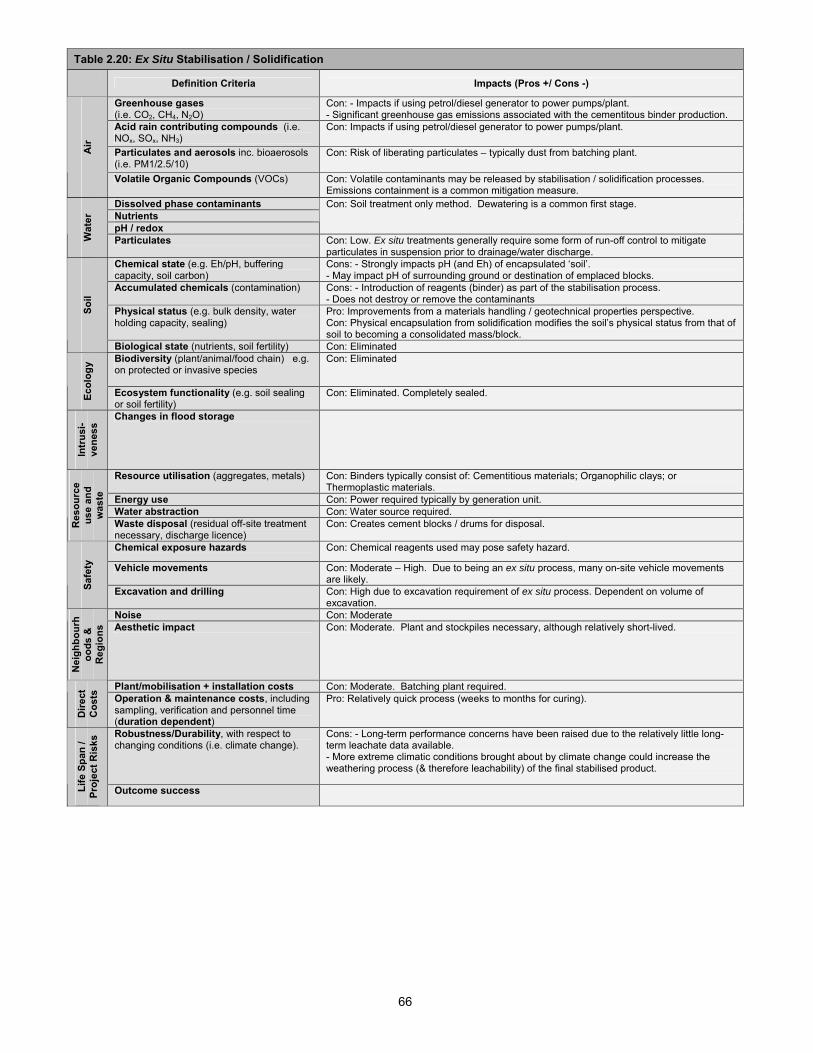
66
Table 2.20: Ex Situ Stabilisation / Solidification
Definition Criteria Impacts (Pros +/ Cons -)
Greenhouse gases (i.e. CO2, CH4, N2O)
Con: - Impacts if using petrol/diesel generator to power pumps/plant. - Significant greenhouse gas emissions associated with the cementitous binder production.
Acid rain contributing compounds (i.e. NOx, SOx, NH3)
Con: Impacts if using petrol/diesel generator to power pumps/plant.
Particulates and aerosols inc. bioaerosols (i.e. PM1/2.5/10)
Con: Risk of liberating particulates – typically dust from batching plant. Air
Volatile Organic Compounds (VOCs) Con: Volatile contaminants may be released by stabilisation / solidification processes. Emissions containment is a common mitigation measure.
Dissolved phase contaminants Nutrients pH / redox
Con: Soil treatment only method. Dewatering is a common first stage.
Wat
er
Particulates Con: Low. Ex situ treatments generally require some form of run-off control to mitigate particulates in suspension prior to drainage/water discharge.
Chemical state (e.g. Eh/pH, buffering capacity, soil carbon)
Cons: - Strongly impacts pH (and Eh) of encapsulated ‘soil’. - May impact pH of surrounding ground or destination of emplaced blocks.
Accumulated chemicals (contamination) Cons: - Introduction of reagents (binder) as part of the stabilisation process. - Does not destroy or remove the contaminants
Physical status (e.g. bulk density, water holding capacity, sealing)
Pro: Improvements from a materials handling / geotechnical properties perspective. Con: Physical encapsulation from solidification modifies the soil’s physical status from that of soil to becoming a consolidated mass/block.
Soil
Biological state (nutrients, soil fertility) Con: Eliminated Biodiversity (plant/animal/food chain) e.g. on protected or invasive species
Con: Eliminated
Ecol
ogy
Ecosystem functionality (e.g. soil sealing or soil fertility)
Con: Eliminated. Completely sealed.
Intr
usi-
vene
ss Changes in flood storage
Resource utilisation (aggregates, metals) Con: Binders typically consist of: Cementitious materials; Organophilic clays; or Thermoplastic materials.
Energy use Con: Power required typically by generation unit. Water abstraction Con: Water source required.
Res
ourc
e us
e an
d w
aste
Waste disposal (residual off-site treatment necessary, discharge licence)
Con: Creates cement blocks / drums for disposal.
Chemical exposure hazards Con: Chemical reagents used may pose safety hazard.
Vehicle movements Con: Moderate – High. Due to being an ex situ process, many on-site vehicle movements are likely.
Safe
ty
Excavation and drilling Con: High due to excavation requirement of ex situ process. Dependent on volume of excavation.
Noise Con: Moderate
Nei
ghbo
urh
oods
&
Reg
ions
Aesthetic impact Con: Moderate. Plant and stockpiles necessary, although relatively short-lived.
Plant/mobilisation + installation costs Con: Moderate. Batching plant required.
Dire
ct
Cos
ts
Operation & maintenance costs, including sampling, verification and personnel time (duration dependent)
Pro: Relatively quick process (weeks to months for curing).
Robustness/Durability, with respect to changing conditions (i.e. climate change).
Cons: - Long-term performance concerns have been raised due to the relatively little long-term leachate data available. - More extreme climatic conditions brought about by climate change could increase the weathering process (& therefore leachability) of the final stabilised product.
Life
Spa
n /
Proj
ect R
isks
Outcome success
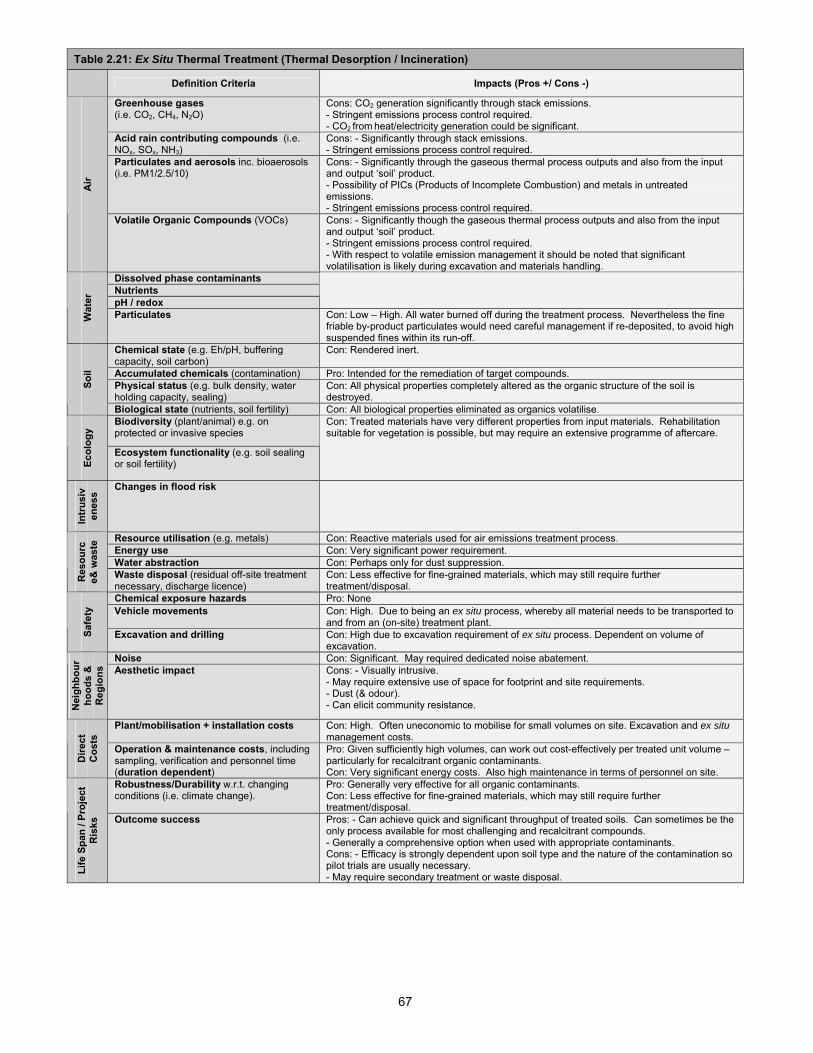
67
Table 2.21: Ex Situ Thermal Treatment (Thermal Desorption / Incineration)
Definition Criteria Impacts (Pros +/ Cons -)
Greenhouse gases (i.e. CO2, CH4, N2O)
Cons: CO2 generation significantly through stack emissions. - Stringent emissions process control required. - CO2 from heat/electricity generation could be significant.
Acid rain contributing compounds (i.e. NOx, SOx, NH3)
Cons: - Significantly through stack emissions. - Stringent emissions process control required.
Particulates and aerosols inc. bioaerosols (i.e. PM1/2.5/10)
Cons: - Significantly through the gaseous thermal process outputs and also from the input and output ‘soil’ product. - Possibility of PICs (Products of Incomplete Combustion) and metals in untreated emissions. - Stringent emissions process control required.
Air
Volatile Organic Compounds (VOCs) Cons: - Significantly though the gaseous thermal process outputs and also from the input and output ‘soil’ product. - Stringent emissions process control required. - With respect to volatile emission management it should be noted that significant volatilisation is likely during excavation and materials handling.
Dissolved phase contaminants Nutrients pH / redox
Wat
er
Particulates Con: Low – High. All water burned off during the treatment process. Nevertheless the fine friable by-product particulates would need careful management if re-deposited, to avoid high suspended fines within its run-off.
Chemical state (e.g. Eh/pH, buffering capacity, soil carbon)
Con: Rendered inert.
Accumulated chemicals (contamination) Pro: Intended for the remediation of target compounds. Physical status (e.g. bulk density, water holding capacity, sealing)
Con: All physical properties completely altered as the organic structure of the soil is destroyed.
Soil
Biological state (nutrients, soil fertility) Con: All biological properties eliminated as organics volatilise. Biodiversity (plant/animal) e.g. on protected or invasive species
Ecol
ogy
Ecosystem functionality (e.g. soil sealing or soil fertility)
Con: Treated materials have very different properties from input materials. Rehabilitation suitable for vegetation is possible, but may require an extensive programme of aftercare.
Intr
usiv
enes
s
Changes in flood risk
Resource utilisation (e.g. metals) Con: Reactive materials used for air emissions treatment process. Energy use Con: Very significant power requirement. Water abstraction Con: Perhaps only for dust suppression.
Res
ourc
e& w
aste
Waste disposal (residual off-site treatment necessary, discharge licence)
Con: Less effective for fine-grained materials, which may still require further treatment/disposal.
Chemical exposure hazards Pro: None Vehicle movements Con: High. Due to being an ex situ process, whereby all material needs to be transported to
and from an (on-site) treatment plant.
Safe
ty
Excavation and drilling Con: High due to excavation requirement of ex situ process. Dependent on volume of excavation.
Noise Con: Significant. May required dedicated noise abatement.
Nei
ghbo
urho
ods
&
Reg
ions
Aesthetic impact Cons: - Visually intrusive. - May require extensive use of space for footprint and site requirements. - Dust (& odour). - Can elicit community resistance.
Plant/mobilisation + installation costs Con: High. Often uneconomic to mobilise for small volumes on site. Excavation and ex situ management costs.
Dire
ct
Cos
ts
Operation & maintenance costs, including sampling, verification and personnel time (duration dependent)
Pro: Given sufficiently high volumes, can work out cost-effectively per treated unit volume – particularly for recalcitrant organic contaminants. Con: Very significant energy costs. Also high maintenance in terms of personnel on site.
Robustness/Durability w.r.t. changing conditions (i.e. climate change).
Pro: Generally very effective for all organic contaminants. Con: Less effective for fine-grained materials, which may still require further treatment/disposal.
Life
Spa
n / P
roje
ct
Ris
ks Outcome success Pros: - Can achieve quick and significant throughput of treated soils. Can sometimes be the
only process available for most challenging and recalcitrant compounds. - Generally a comprehensive option when used with appropriate contaminants. Cons: - Efficacy is strongly dependent upon soil type and the nature of the contamination so pilot trials are usually necessary. - May require secondary treatment or waste disposal.
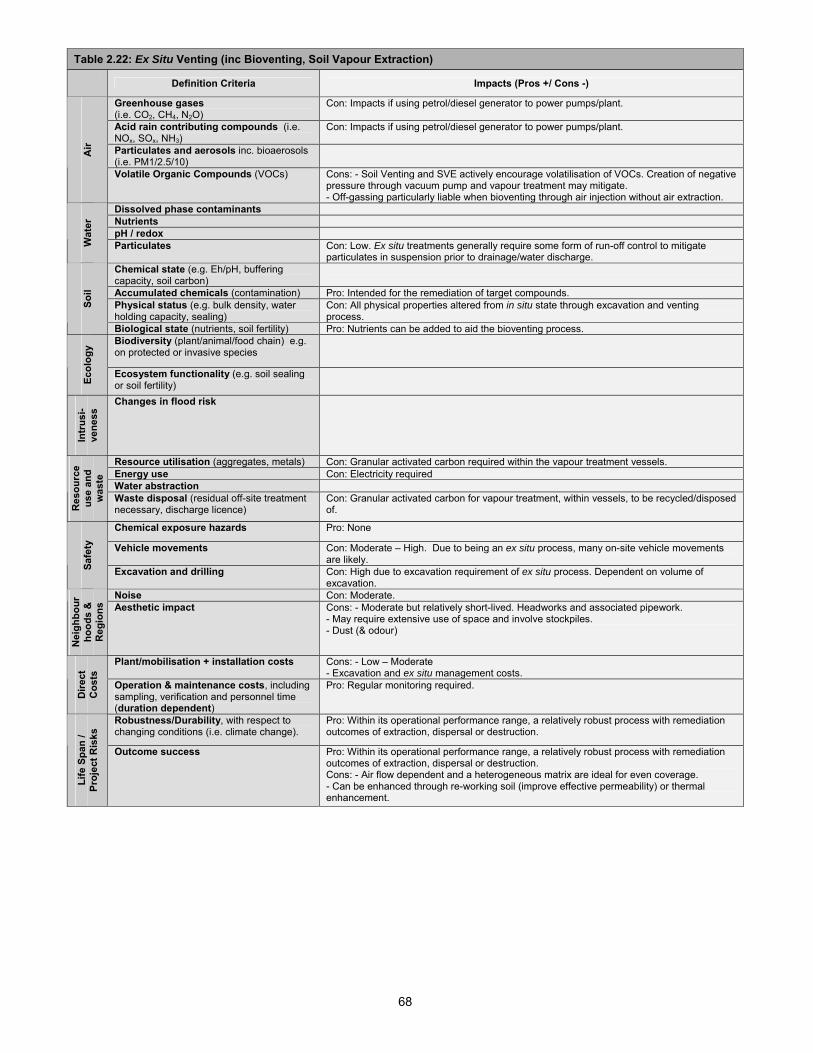
68
Table 2.22: Ex Situ Venting (inc Bioventing, Soil Vapour Extraction)
Definition Criteria Impacts (Pros +/ Cons -)
Greenhouse gases (i.e. CO2, CH4, N2O)
Con: Impacts if using petrol/diesel generator to power pumps/plant.
Acid rain contributing compounds (i.e. NOx, SOx, NH3)
Con: Impacts if using petrol/diesel generator to power pumps/plant.
Particulates and aerosols inc. bioaerosols (i.e. PM1/2.5/10)
Air
Volatile Organic Compounds (VOCs) Cons: - Soil Venting and SVE actively encourage volatilisation of VOCs. Creation of negative pressure through vacuum pump and vapour treatment may mitigate. - Off-gassing particularly liable when bioventing through air injection without air extraction.
Dissolved phase contaminants Nutrients pH / redox
Wat
er
Particulates Con: Low. Ex situ treatments generally require some form of run-off control to mitigate particulates in suspension prior to drainage/water discharge.
Chemical state (e.g. Eh/pH, buffering capacity, soil carbon)
Accumulated chemicals (contamination) Pro: Intended for the remediation of target compounds. Physical status (e.g. bulk density, water holding capacity, sealing)
Con: All physical properties altered from in situ state through excavation and venting process.
Soil
Biological state (nutrients, soil fertility) Pro: Nutrients can be added to aid the bioventing process. Biodiversity (plant/animal/food chain) e.g. on protected or invasive species
Ecol
ogy
Ecosystem functionality (e.g. soil sealing or soil fertility)
Intr
usi-
vene
ss Changes in flood risk
Resource utilisation (aggregates, metals) Con: Granular activated carbon required within the vapour treatment vessels. Energy use Con: Electricity required Water abstraction
Res
ourc
e us
e an
d w
aste
Waste disposal (residual off-site treatment necessary, discharge licence)
Con: Granular activated carbon for vapour treatment, within vessels, to be recycled/disposed of.
Chemical exposure hazards Pro: None
Vehicle movements Con: Moderate – High. Due to being an ex situ process, many on-site vehicle movements are likely.
Safe
ty
Excavation and drilling Con: High due to excavation requirement of ex situ process. Dependent on volume of excavation.
Noise Con: Moderate.
Nei
ghbo
urho
ods
&
Reg
ions
Aesthetic impact Cons: - Moderate but relatively short-lived. Headworks and associated pipework. - May require extensive use of space and involve stockpiles. - Dust (& odour)
Plant/mobilisation + installation costs Cons: - Low – Moderate - Excavation and ex situ management costs.
Dire
ct
Cos
ts
Operation & maintenance costs, including sampling, verification and personnel time (duration dependent)
Pro: Regular monitoring required.
Robustness/Durability, with respect to changing conditions (i.e. climate change).
Pro: Within its operational performance range, a relatively robust process with remediation outcomes of extraction, dispersal or destruction.
Life
Spa
n /
Proj
ect R
isks
Outcome success Pro: Within its operational performance range, a relatively robust process with remediation outcomes of extraction, dispersal or destruction. Cons: - Air flow dependent and a heterogeneous matrix are ideal for even coverage. - Can be enhanced through re-working soil (improve effective permeability) or thermal enhancement.
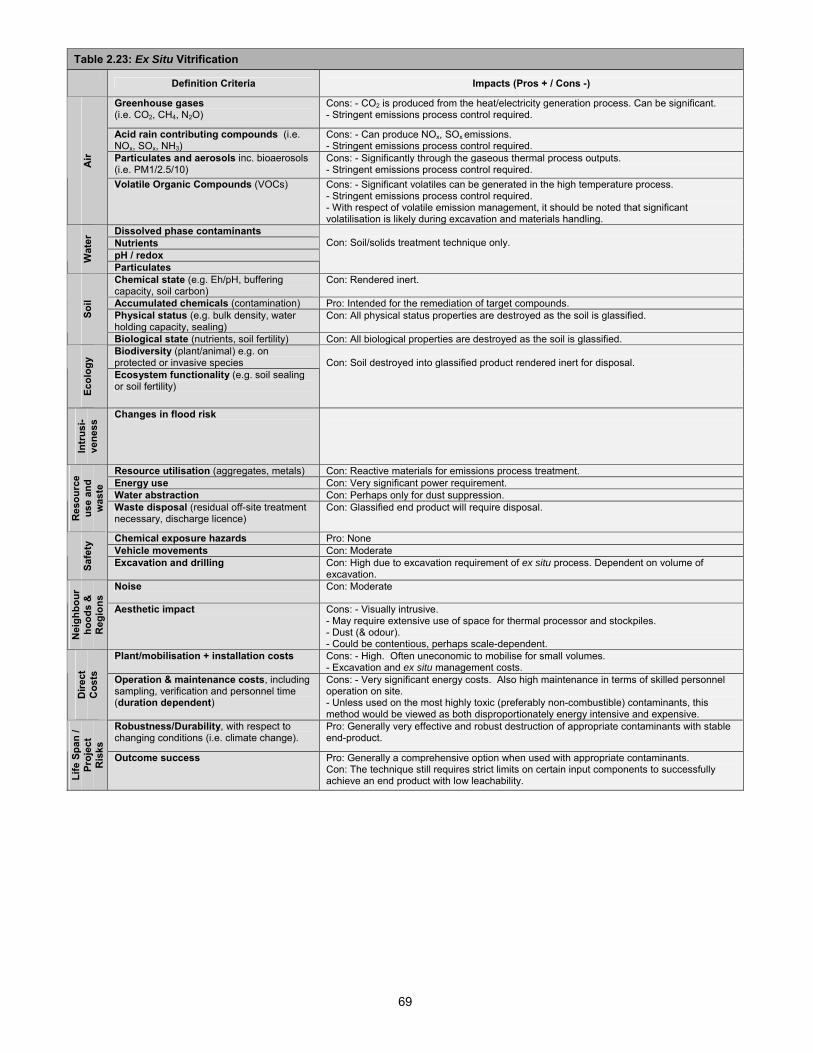
69
Table 2.23: Ex Situ Vitrification
Definition Criteria Impacts (Pros + / Cons -)
Greenhouse gases (i.e. CO2, CH4, N2O)
Cons: - CO2 is produced from the heat/electricity generation process. Can be significant. - Stringent emissions process control required.
Acid rain contributing compounds (i.e. NOx, SOx, NH3)
Cons: - Can produce NOx, SOx emissions. - Stringent emissions process control required.
Particulates and aerosols inc. bioaerosols (i.e. PM1/2.5/10)
Cons: - Significantly through the gaseous thermal process outputs. - Stringent emissions process control required. A
ir
Volatile Organic Compounds (VOCs) Cons: - Significant volatiles can be generated in the high temperature process. - Stringent emissions process control required. - With respect of volatile emission management, it should be noted that significant volatilisation is likely during excavation and materials handling.
Dissolved phase contaminants Nutrients pH / redox W
ater
Particulates
Con: Soil/solids treatment technique only.
Chemical state (e.g. Eh/pH, buffering capacity, soil carbon)
Con: Rendered inert.
Accumulated chemicals (contamination) Pro: Intended for the remediation of target compounds. Physical status (e.g. bulk density, water holding capacity, sealing)
Con: All physical status properties are destroyed as the soil is glassified. Soil
Biological state (nutrients, soil fertility) Con: All biological properties are destroyed as the soil is glassified. Biodiversity (plant/animal) e.g. on protected or invasive species
Ecol
ogy
Ecosystem functionality (e.g. soil sealing or soil fertility)
Con: Soil destroyed into glassified product rendered inert for disposal.
Intr
usi-
vene
ss Changes in flood risk
Resource utilisation (aggregates, metals) Con: Reactive materials for emissions process treatment. Energy use Con: Very significant power requirement. Water abstraction Con: Perhaps only for dust suppression.
Res
ourc
e us
e an
d w
aste
Waste disposal (residual off-site treatment necessary, discharge licence)
Con: Glassified end product will require disposal.
Chemical exposure hazards Pro: None Vehicle movements Con: Moderate
Safe
ty
Excavation and drilling Con: High due to excavation requirement of ex situ process. Dependent on volume of excavation.
Noise Con: Moderate
Nei
ghbo
urho
ods
&
Reg
ions
Aesthetic impact Cons: - Visually intrusive. - May require extensive use of space for thermal processor and stockpiles. - Dust (& odour). - Could be contentious, perhaps scale-dependent.
Plant/mobilisation + installation costs Cons: - High. Often uneconomic to mobilise for small volumes. - Excavation and ex situ management costs.
Dire
ct
Cos
ts
Operation & maintenance costs, including sampling, verification and personnel time (duration dependent)
Cons: - Very significant energy costs. Also high maintenance in terms of skilled personnel operation on site. - Unless used on the most highly toxic (preferably non-combustible) contaminants, this method would be viewed as both disproportionately energy intensive and expensive.
Robustness/Durability, with respect to changing conditions (i.e. climate change).
Pro: Generally very effective and robust destruction of appropriate contaminants with stable end-product.
Life
Spa
n /
Proj
ect
Ris
ks
Outcome success Pro: Generally a comprehensive option when used with appropriate contaminants. Con: The technique still requires strict limits on certain input components to successfully achieve an end product with low leachability.
70
3. A COST ASSESSMENT OF REMEDIATION TECHNIQUES
3.1 Introduction
This section of the report focuses on typical costs of remediation techniques and refers to information sources published within the last 10 years, in addition to up-to-date information obtained from a survey of UK remediation practitioners, comprising technology vendors and environmental consultants. A literature search identified that there is limited information available on remediation costs. It is felt that the main reason for this is because remediation costs are strongly site-specific and dependent upon the details of a number of different aspects such as: geological, hydrogeological and chemical data (e.g. contaminant type and concentration) provided from the site investigation at an individual site. Remediation costs are also strongly influenced by how stringent the remedial targets are. Remedial targets are the maximum permissible concentrations that can ‘safely’ be left in the soil or groundwater for certain contaminants which have been agreed with the regulator and are usually dependent upon intended land use. Differences in remedial targets affect the remediation duration and therefore costs. A hypothetical example is detailed below to demonstrate the complex nature of site remediation and the difficulty of making direct cost comparison.
Hypothetical Remedial Costs Case Study Taking a situation with two identical sites (in terms of geology, hydrogeology, contaminant types and their concentrations), both adopted dual phase extraction for their remedial solution, but “Site 1” had half the remedial targets of “Site 2”, it is likely that the remediation on Site 1 would need to run for far longer than that on Site 2. In fact, due to many additional sub-surface chemical processes at the site (such as sorption and diffusion) the contaminant removal rate would be even harder to predict. Therefore at Site 1 the duration of the remediation could not be accurately measured and conceivably could take two, four or ten times longer to achieve than at Site 2. It is also possible that after a long period the remedial target cannot be achieved with this single remediation technique alone and switching to another remediation technique may be necessary.
This example illustrates how sensitivity to a single variable such as a remedial target could have a large impact on remediation timescales and hence cost. However, as truly identical sites only exist hypothetically there are multiple variables which will also affect remedial performance and time taken to remediate a site, such as differing geology, hydrogeology, contaminant species and concentrations. With the uniquely complex sub-surface and remedial selection being reliant upon point source information taken from site investigation sample points, predicting remediation technology efficacy can be difficult. As stated in the foreword of English Partnership’s Best Practice Note 27, Contamination and Dereliction Remediation Costs (2008), “up to date and comprehensive information is essential, to reduce the risk of grossly underestimating the costs of remediation. In this regard nothing can compete with a recent and well executed site investigation that has been designed with full regard for the land use history of the site”. Remediation costs are therefore not something which can generically be provided with any degree of certainty or reliability as they should be costed on a site by site basis. Nevertheless, it is acknowledged that a broad appreciation of remediation costs is desirable at the first, speculative stage of looking at potential remedial options. As with the stages of phased risk assessment, the level of information required (in this case remediation costs) is built up as additional knowledge is obtained. Initial assessment may involve looking at generic costs. A likely site development involving soil and groundwater remediation may require detailed costing for a few favoured techniques, whilst other remediation projects may necessitate a fully specified site characterisation and a costed bill of quantities.
71
Costs can be broken down into different categories but typically these would include: mobilisation / initialisation; operation and maintenance; and monitoring and analysis. Mobilisation/initialisation costs are commonly considerable for ex situ processes using a treatment plant (e.g. soil washing), but would also be the case for significantly engineered remedial solutions such as a large-scale permeable reactive barrier and some in situ processes. Drilling of the treatment/monitoring borehole network may also be included in this first category. Operation and maintenance costs also vary depending upon how aggressive/passive the treatment method is. For example a passive treatment permeable reactive barrier would generally have low operation and maintenance costs, whereas a chemical injection solution may not. Operation and maintenance costs are strongly time dependent and for some processes could be considerable if the treatment duration unexpectedly increased. The anticipated time of different remedial techniques is outlined in Sections 1.2 and 1.3. Monitoring and analysis costs are usually the smallest component but there are again exceptions such as in the case of monitored natural attenuation. Sources of Information For the reasons discussed above, references to remediation costs for the UK have been sparse over recent years. Early UK reference to remediation technology costs are contained within the 1995-1996 CIRIA series: Remedial Treatment for Contaminated Land (Volumes I-XII), with the most relevant publications within this series listed within the references. More recently this issue is thoroughly addressed in “Contamination and Dereliction Remediation Costs: Best Practice Note 27” (English Partnerships, 2008), albeit generically based on land-use types (transformation from different classifications of site to end-use type). The guidance uses costs based on a “notional development site” using a “notional remediation scheme”, therefore not providing remediation technology specific indicative costs. Spon's Civil Engineering and Highway Works Price Book, 2010 (Davis Langdon, 2010) provides useful contextual information about remediation costs, although this report has benefitted from borrowing the ‘generic level’ information from the detailed Davis Langdon Instruction Manual: Production of Remediation Cost and Risk Management Reports (2009). Generic unit cost ranges for different remediation technologies were also available in the original 2002 version of “Contaminated Land Management: Ready Reference” (Nathanail et al, 2002); however, these costs are not revised in the 2007 update version. Finally, cost information and any notes on key factors or dependencies from the various CL:AIRE Technology Demonstration Project Report series have been reviewed in the compilation of this report. This section of the report is structured as follows:
• Section 3.2 provides a description of the Remediation Technique Questionnaire conducted as part of this project and the cost information that was sought from survey respondents.
• Section 3.3 describes how the cost data were analysed and interpreted. It presents the cost
data using tables and graphs for each remediation technique.
• Section 3.4 provides a summary of the results and a brief discussion of the key points. 3.2 Remediation Technique Questionnaire One of the objectives of this research project was to design two questionnaires to survey (i) technology providers and (ii) environmental consultants. During the design process, it was decided that a single questionnaire would be appropriate as some environmental consultants also provide remediation technology solutions. The Remediation Technique Questionnaire was sent to a group of 24 contaminated land organisations, comprising 14 technology vendors and 10 environmental consultants in March 2010. 18 organisations (11 technology vendors and 7 consultants) kindly shared their informed views on several aspects of remediation practices in the UK, which included costs (see Question 3 below). Contributing organisations are listed within the ‘Acknowledgements’ section of this report. The information provided is felt to be representative of the industry as a whole based on the size and experience of the companies that contributed.
72
Question 3 from the Remediation Technique Questionnaire What are the typical broad range costs of using the techniques (e.g. £25-£55/m3)? It is understood that costs are very site-specific, but that typical values can still be useful. Please use current (2010) values and provide a range for <5,000 m3 of treated material (smaller site) and a range for >5,000 m3 treated material (larger site). Cost estimates should not include desk study, site investigation, waste disposal, but should include mobilisation/demobilisation and monitoring. The full questionnaire is presented in Appendix 2 and a wider discussion of its results is given in Section 4. Many remediation technologies, particularly those relying on large plant assembly, have strongly dependent economies of scale. Specifically, initial outlay of plant mobilisation is the dominant aspect of many technologies when compared to the operation and maintenance costs. Consequently, remediation dealing with relatively small volumes of soil will provide average costs significantly higher than those which treat far larger volumes of material. For this reason, remediation costs were requested for two volume bands, using the cut-off value of 5000 m3, suggested by a remediation practitioner, to provide a better insight into how remedial costs can become more cost-effective for larger volumes. 3.3 Data Analysis and Presentation of the Results The cost data from the survey were provided in the form of cost ranges for each technique, for example £30-£50 per m3 of treated material, and therefore where data were received from several respondents for a single technique it was in the form of several cost ranges. This fact determined the way that the data were analysed and how they have been presented in Figures 3.1-3.19 later in this section. The following paragraphs explain how the data have been processed in more detail:
• Number of survey responses the statistical data are based upon • Total Range • Median or Mean Cost Values • Cost Guide • Cost Variance • Davis Langdon (DL) Cost Range
Number of Survey Responses Several respondents questioned did not have experience of all of the remediation techniques given in the questionnaire and therefore did not provide cost estimates. The number of positive responses from which the statistics are based is shown in the top-left cell of each of the cost tables displayed in Figures 3.1-3.19. Total Range The total range values are simply the minimum and maximum cost values provided by all respondents for each remediation technique. These two values give an indication of the overall variability possible in the data. This statistic provides the ‘most truthful’ range but is less useful in constraining costs to a ‘most likely’ range. Median / Mean Cost Values Depending on the number of responses received for each technique, either median or mean values were calculated from the survey minimum (minimum median/mean) and maximum (maximum median/mean) values to provide a more typical and constrained cost range. Due to the large variability in the surveyed data (which include one or two outliers) it is considered that ‘median’ values would provide the best estimates of costs, as influence from irregular outliers is removed. However, when fewer responses were provided (adjudged to be 3 or 4 responses) the ‘mean’ values are
73
considered the more useful and representative statistic2. Where fewer than 3 responses are received then no graphs have been presented.
Cost Guide In order to assist with interpretation of the survey data, a simple cost guide was developed to provide generalised cost bands for each of the remediation techniques. This was achieved by categorising the mid-point of the “Median/Mean Cost Value Range” (described above) into one of four cost bands, each denoted by a number of “£” symbols, shown in Table 3.1.
Table 3.1: Cost guide: Cost band range categories
Cost Band (£/m3) Symbol 0 – 25 £ 25 - 60 ££ 60 - 100 £££
>100 ££££
Variability Guide Similar to the cost guide, a variability guide was developed to provide generalised cost-variability bands for each of the remediation techniques. Variability bands demonstrate how well the cost data is constrained, and therefore the degree of confidence there is in the costs provided. The standard deviation was calculated for the minimum and maximum values provided for each technique, to give a range of standard deviation and the mid-point of this range was compared against four variability bands, each denoted by a number of “↕” symbols, shown in Table 3.2. Table 3.2: Variability band range categories
Variability Band (Standard Deviation) Symbol 0 – 10 (Low, or well constrained) ↕
10 - 40 ↕↕ 40 - 80 ↕↕↕
>80 (High) ↕↕↕↕ Davis Langdon (DL) Cost Range Davis Langdon (2009) provides cost data for a number of the remediation techniques referred to in this report. Where this data is available it has been included for comparison. The Davis Langdon cost ranges within this reference are not directly available for the following remedial options: in situ enhanced bioremediation; monitored natural attenuation; permeable reactive barriers; ex situ chemical oxidation / reduction; ex situ venting; barrier, containment, cover systems; excavation; pump and treat; and landfill disposal. The results from the cost assessment are presented in Figures 3.1-3.9 for in situ techniques, Figures 3.10-3.15 for ex situ techniques, and Figures 3.16-3.19 for civil engineering-based methods. The data are presented separately for <5000 m3 and >5000 m3 treated material.
2 When working with five or less values to calculate representative statistics it was considered that error introduced by using the median value (to counter error introduced by highly variable values) becomes greater than that created from using a mean value, as the median mid-point used for a small, potentially extreme sample number is more likely to provide a skew.
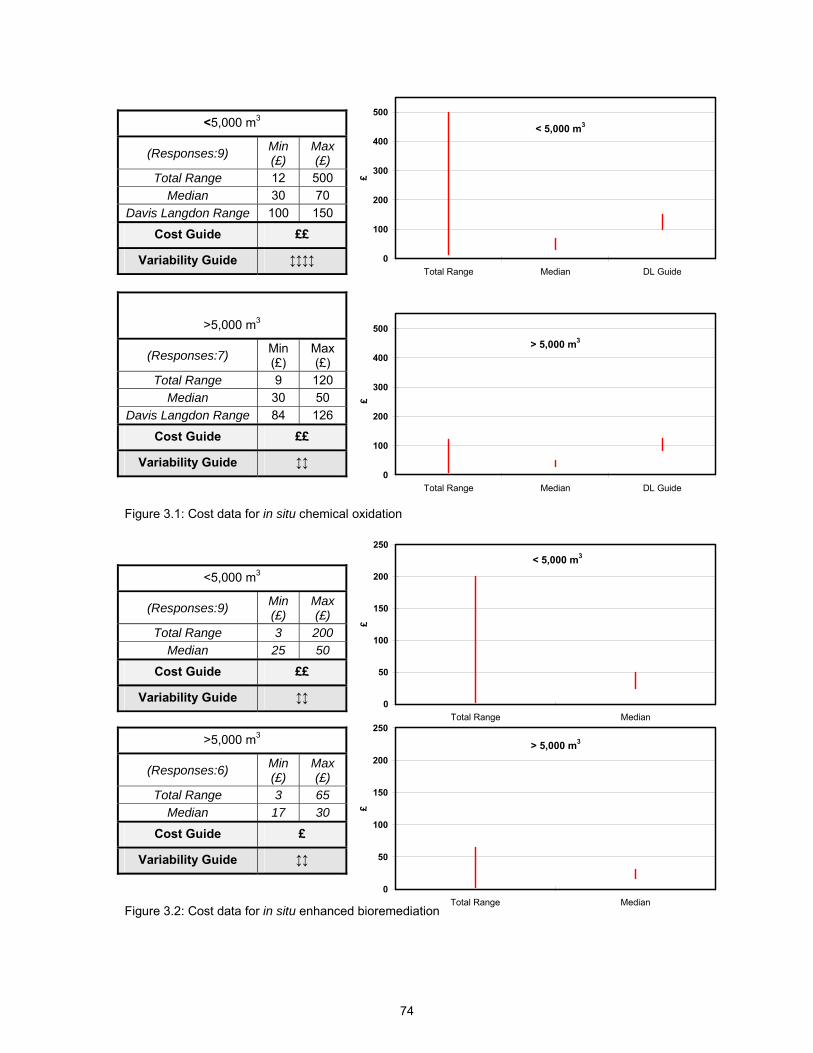
74
<5,000 m3
(Responses:9) Min (£)
Max(£)
Total Range 12 500 Median 30 70
Davis Langdon Range 100 150
Cost Guide ££
Variability Guide ↕↕↕↕
>5,000 m3
(Responses:7) Min (£)
Max(£)
Total Range 9 120 Median 30 50
Davis Langdon Range 84 126
Cost Guide ££
Variability Guide ↕↕
Figure 3.1: Cost data for in situ chemical oxidation
<5,000 m3
(Responses:9) Min (£)
Max(£)
Total Range 3 200 Median 25 50
Cost Guide ££
Variability Guide ↕↕
>5,000 m3
(Responses:6) Min (£)
Max(£)
Total Range 3 65 Median 17 30
Cost Guide £
Variability Guide ↕↕
Figure 3.2: Cost data for in situ enhanced bioremediation
< 5,000 m3
0
100
200
300
400
500
Total Range Median DL Guide
£
> 5,000 m3
0
100
200
300
400
500
Total Range Median DL Guide
£
< 5,000 m3
0
50
100
150
200
250
Total Range Median
£
> 5,000 m3
0
50
100
150
200
250
Total Range Median
£
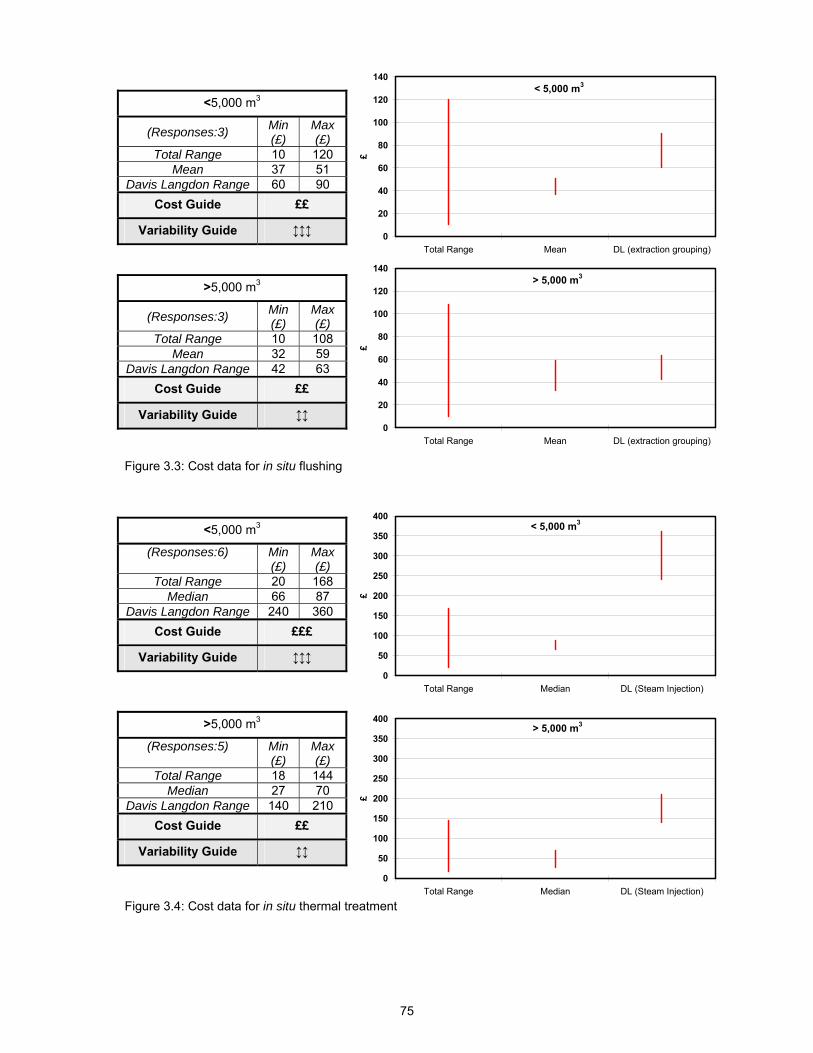
75
<5,000 m3
(Responses:3) Min (£)
Max(£)
Total Range 10 120 Mean 37 51
Davis Langdon Range 60 90 Cost Guide ££
Variability Guide ↕↕↕
>5,000 m3
(Responses:3) Min (£)
Max(£)
Total Range 10 108 Mean 32 59
Davis Langdon Range 42 63 Cost Guide ££
Variability Guide ↕↕
Figure 3.3: Cost data for in situ flushing
>5,000 m3
(Responses:5) Min (£)
Max(£)
Total Range 18 144 Median 27 70
Davis Langdon Range 140 210 Cost Guide ££
Variability Guide ↕↕
Figure 3.4: Cost data for in situ thermal treatment
<5,000 m3
(Responses:6) Min (£)
Max(£)
Total Range 20 168 Median 66 87
Davis Langdon Range 240 360 Cost Guide £££
Variability Guide ↕↕↕
< 5,000 m3
0
20
40
60
80
100
120
140
Total Range Mean DL (extraction grouping)
£
> 5,000 m3
0
20
40
60
80
100
120
140
Total Range Mean DL (extraction grouping)
£
< 5,000 m3
0
50
100
150
200
250
300
350
400
Total Range Median DL (Steam Injection)
£
> 5,000 m3
0
50
100
150
200
250
300
350
400
Total Range Median DL (Steam Injection)
£
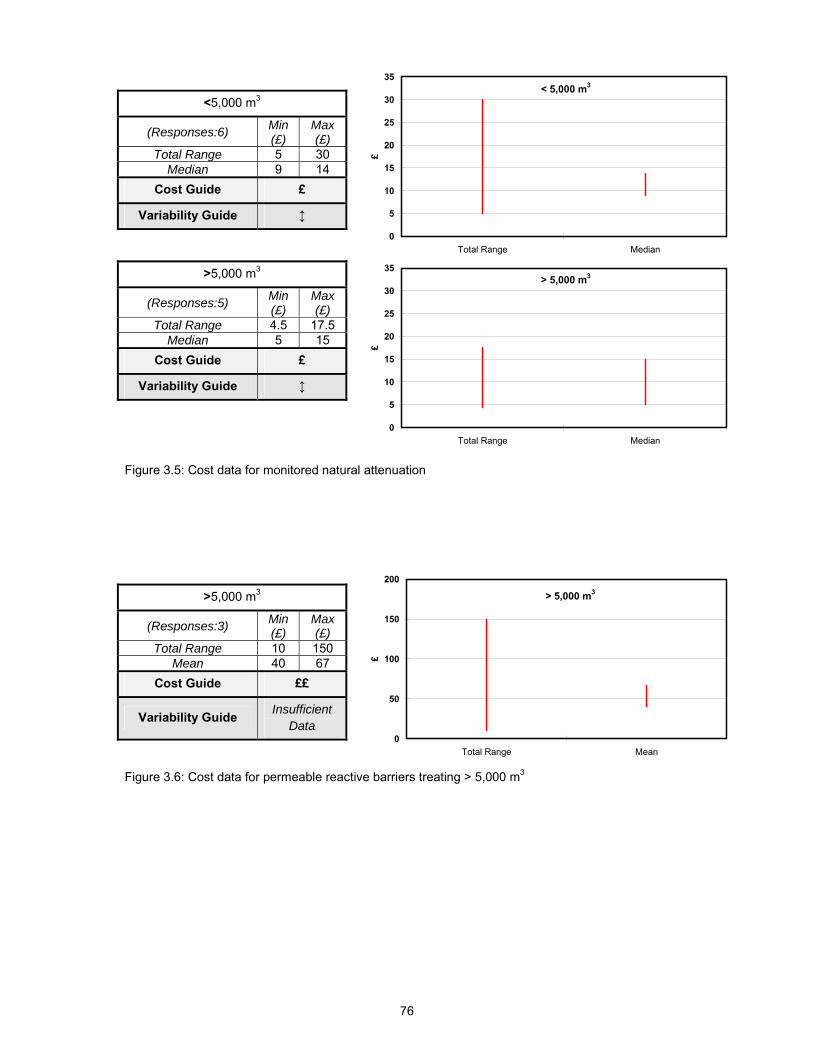
76
<5,000 m3
(Responses:6) Min (£)
Max(£)
Total Range 5 30 Median 9 14
Cost Guide £
Variability Guide ↕
Figure 3.5: Cost data for monitored natural attenuation
Figure 3.6: Cost data for permeable reactive barriers treating > 5,000 m3
>5,000 m3
(Responses:5) Min (£)
Max(£)
Total Range 4.5 17.5 Median 5 15
Cost Guide £
Variability Guide ↕
>5,000 m3
(Responses:3) Min (£)
Max(£)
Total Range 10 150 Mean 40 67
Cost Guide ££
Variability Guide Insufficient Data
< 5,000 m3
0
5
10
15
20
25
30
35
Total Range Median
£
> 5,000 m3
0
5
10
15
20
25
30
35
Total Range Median
£
> 5,000 m3
0
50
100
150
200
Total Range Mean
£
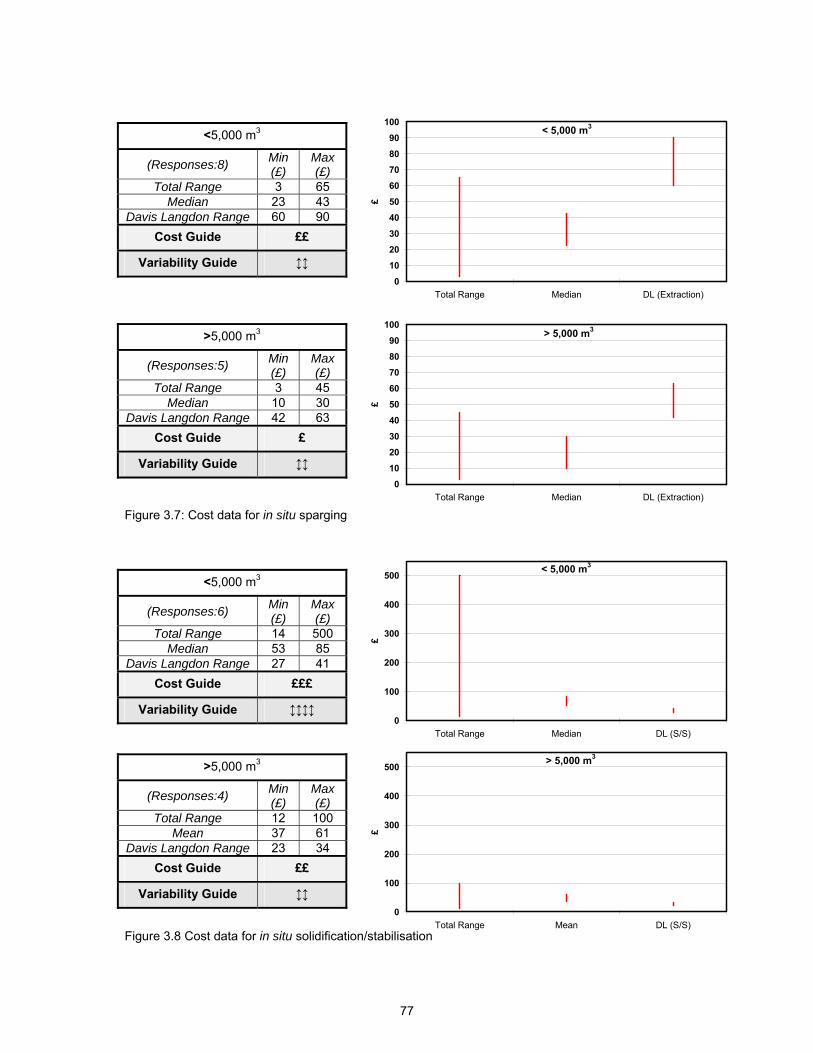
77
<5,000 m3
(Responses:8) Min (£)
Max(£)
Total Range 3 65 Median 23 43
Davis Langdon Range 60 90 Cost Guide ££
Variability Guide ↕↕
>5,000 m3
(Responses:5) Min (£)
Max(£)
Total Range 3 45 Median 10 30
Davis Langdon Range 42 63 Cost Guide £
Variability Guide ↕↕
Figure 3.7: Cost data for in situ sparging
<5,000 m3
(Responses:6) Min (£)
Max(£)
Total Range 14 500 Median 53 85
Davis Langdon Range 27 41 Cost Guide £££
Variability Guide ↕↕↕↕
>5,000 m3
(Responses:4) Min (£)
Max(£)
Total Range 12 100 Mean 37 61
Davis Langdon Range 23 34 Cost Guide ££
Variability Guide ↕↕
Figure 3.8 Cost data for in situ solidification/stabilisation
< 5,000 m3
0
10
2030
40
50
60
7080
90
100
Total Range Median DL (Extraction)
£
> 5,000 m3
0
10
2030
40
50
60
7080
90
100
Total Range Median DL (Extraction)
£
< 5,000 m3
0
100
200
300
400
500
Total Range Median DL (S/S)
£
> 5,000 m3
0
100
200
300
400
500
Total Range Mean DL (S/S)
£
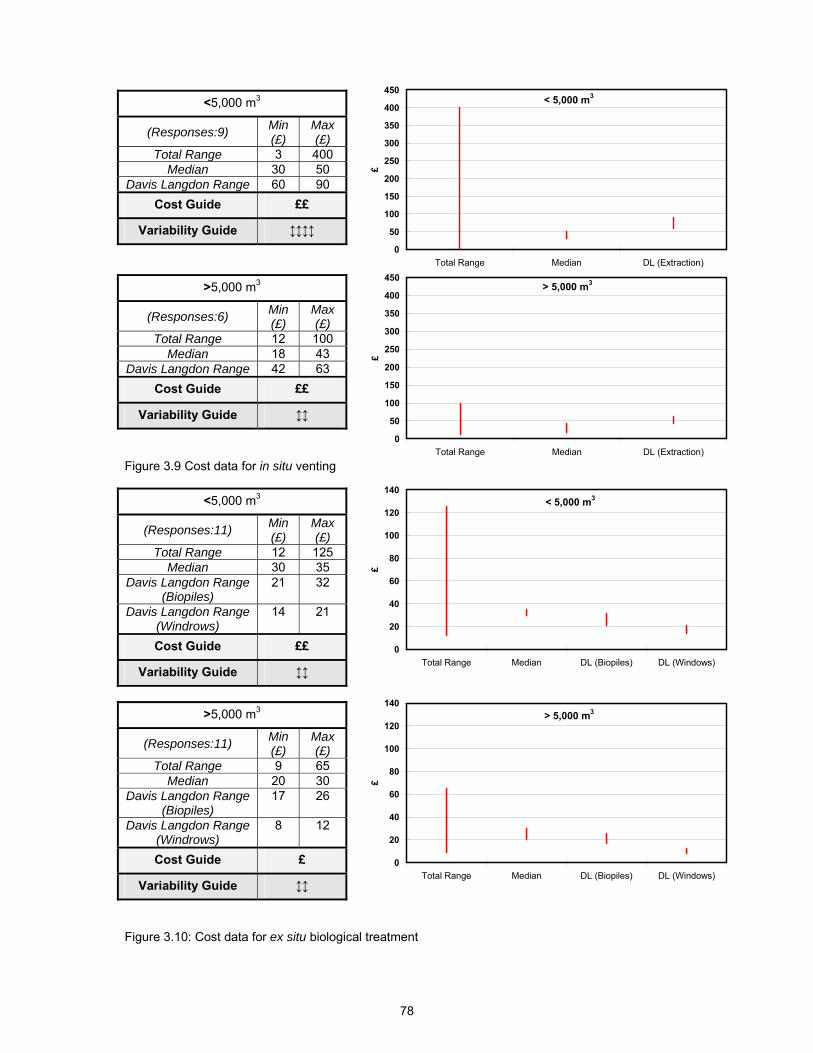
78
<5,000 m3
(Responses:9) Min (£)
Max(£)
Total Range 3 400 Median 30 50
Davis Langdon Range 60 90 Cost Guide ££
Variability Guide ↕↕↕↕
>5,000 m3
(Responses:6) Min (£)
Max(£)
Total Range 12 100 Median 18 43
Davis Langdon Range 42 63 Cost Guide ££
Variability Guide ↕↕
Figure 3.9 Cost data for in situ venting
<5,000 m3
(Responses:11) Min (£)
Max(£)
Total Range 12 125 Median 30 35
Davis Langdon Range (Biopiles)
21 32
Davis Langdon Range (Windrows)
14 21
Cost Guide ££
Variability Guide ↕↕
>5,000 m3
(Responses:11) Min (£)
Max(£)
Total Range 9 65 Median 20 30
Davis Langdon Range (Biopiles)
17 26
Davis Langdon Range (Windrows)
8 12
Cost Guide £
Variability Guide ↕↕
Figure 3.10: Cost data for ex situ biological treatment
< 5,000 m3
0
50
100
150
200
250
300
350
400
450
Total Range Median DL (Extraction)
£
> 5,000 m3
0
50
100
150
200
250
300
350
400
450
Total Range Median DL (Extraction)
£
< 5,000 m3
0
20
40
60
80
100
120
140
Total Range Median DL (Biopiles) DL (Windows)
£
> 5,000 m3
0
20
40
60
80
100
120
140
Total Range Median DL (Biopiles) DL (Windows)
£
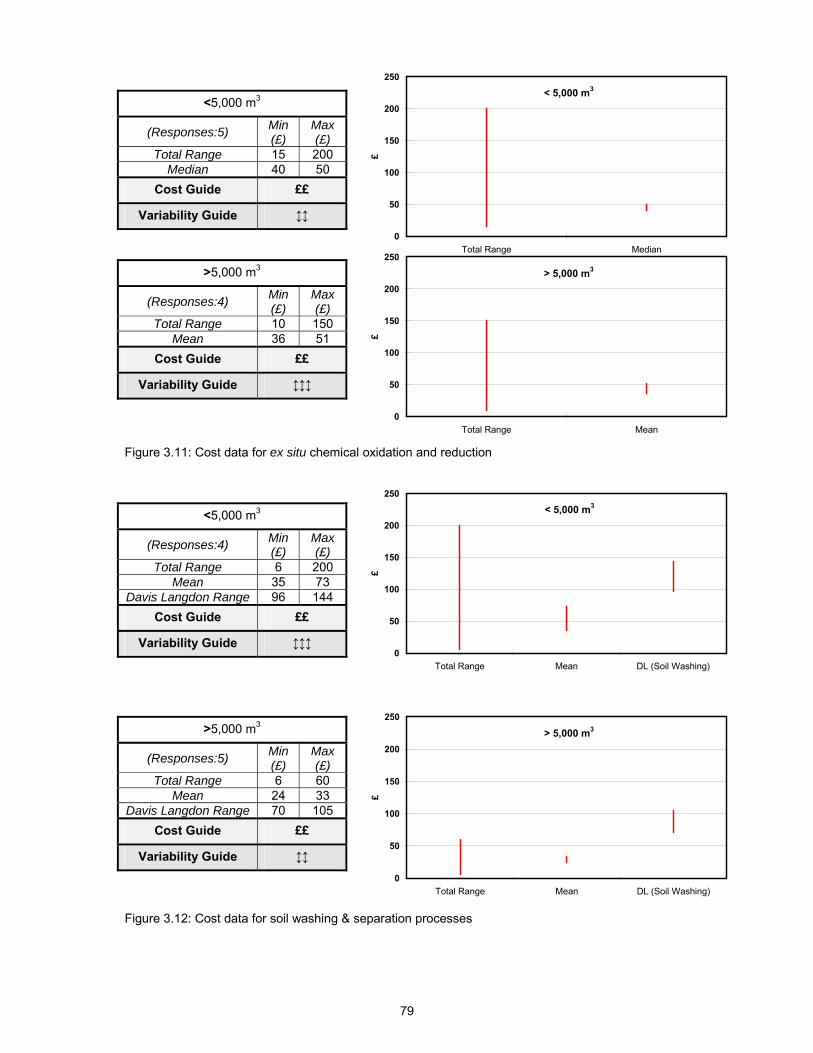
79
<5,000 m3
(Responses:5) Min (£)
Max(£)
Total Range 15 200 Median 40 50
Cost Guide ££
Variability Guide ↕↕
>5,000 m3
(Responses:4) Min (£)
Max(£)
Total Range 10 150 Mean 36 51
Cost Guide ££
Variability Guide ↕↕↕
Figure 3.11: Cost data for ex situ chemical oxidation and reduction
<5,000 m3
(Responses:4) Min (£)
Max(£)
Total Range 6 200 Mean 35 73
Davis Langdon Range 96 144 Cost Guide ££
Variability Guide ↕↕↕
>5,000 m3
(Responses:5) Min (£)
Max(£)
Total Range 6 60 Mean 24 33
Davis Langdon Range 70 105 Cost Guide ££
Variability Guide ↕↕
Figure 3.12: Cost data for soil washing & separation processes
< 5,000 m3
0
50
100
150
200
250
Total Range Median
£
> 5,000 m3
0
50
100
150
200
250
Total Range Mean
£
< 5,000 m3
0
50
100
150
200
250
Total Range Mean DL (Soil Washing)
£
> 5,000 m3
0
50
100
150
200
250
Total Range Mean DL (Soil Washing)
£
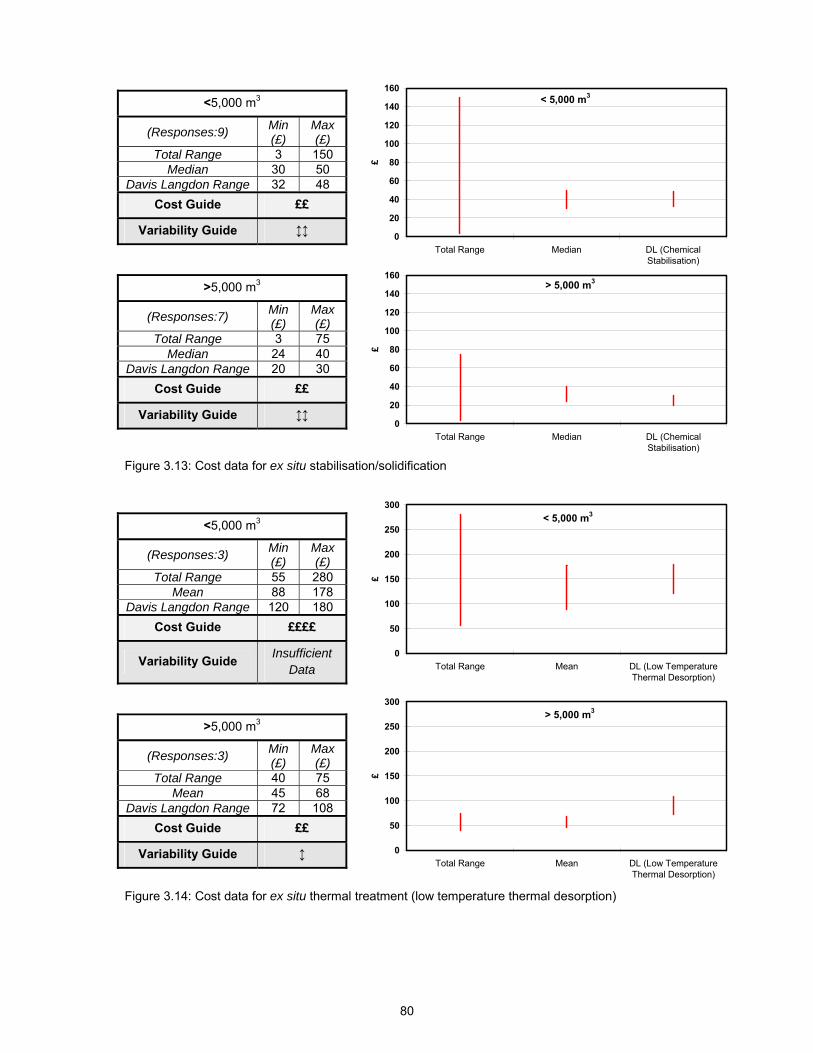
80
<5,000 m3
(Responses:9) Min (£)
Max(£)
Total Range 3 150 Median 30 50
Davis Langdon Range 32 48 Cost Guide ££
Variability Guide ↕↕
>5,000 m3
(Responses:7) Min (£)
Max(£)
Total Range 3 75 Median 24 40
Davis Langdon Range 20 30 Cost Guide ££
Variability Guide ↕↕
Figure 3.13: Cost data for ex situ stabilisation/solidification
<5,000 m3
(Responses:3) Min (£)
Max(£)
Total Range 55 280 Mean 88 178
Davis Langdon Range 120 180 Cost Guide ££££
Variability Guide Insufficient Data
>5,000 m3
(Responses:3) Min (£)
Max(£)
Total Range 40 75 Mean 45 68
Davis Langdon Range 72 108 Cost Guide ££
Variability Guide ↕
Figure 3.14: Cost data for ex situ thermal treatment (low temperature thermal desorption)
< 5,000 m3
0
20
40
60
80
100
120
140
160
Total Range Median DL (ChemicalStabilisation)
£
> 5,000 m3
0
20
40
60
80
100
120
140
160
Total Range Median DL (ChemicalStabilisation)
£
< 5,000 m3
0
50
100
150
200
250
300
Total Range Mean DL (Low TemperatureThermal Desorption)
£
> 5,000 m3
0
50
100
150
200
250
300
Total Range Mean DL (Low TemperatureThermal Desorption)
£
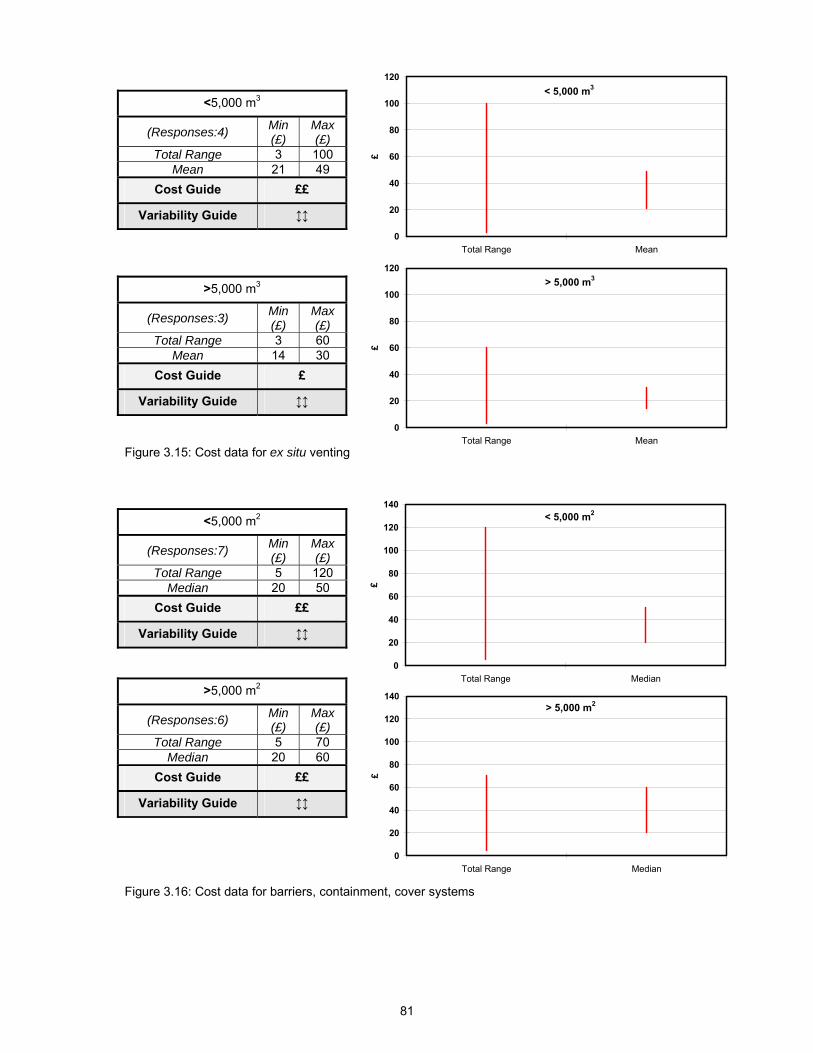
81
<5,000 m3
(Responses:4) Min (£)
Max(£)
Total Range 3 100 Mean 21 49
Cost Guide ££
Variability Guide ↕↕
>5,000 m3
(Responses:3) Min (£)
Max(£)
Total Range 3 60 Mean 14 30
Cost Guide £
Variability Guide ↕↕
Figure 3.15: Cost data for ex situ venting
<5,000 m2
(Responses:7) Min (£)
Max(£)
Total Range 5 120 Median 20 50
Cost Guide ££
Variability Guide ↕↕
>5,000 m2
(Responses:6) Min (£)
Max(£)
Total Range 5 70 Median 20 60
Cost Guide ££
Variability Guide ↕↕
Figure 3.16: Cost data for barriers, containment, cover systems
< 5,000 m3
0
20
40
60
80
100
120
Total Range Mean
£
> 5,000 m3
0
20
40
60
80
100
120
Total Range Mean
£
< 5,000 m2
0
20
40
60
80
100
120
140
Total Range Median
£
> 5,000 m2
0
20
40
60
80
100
120
140
Total Range Median
£
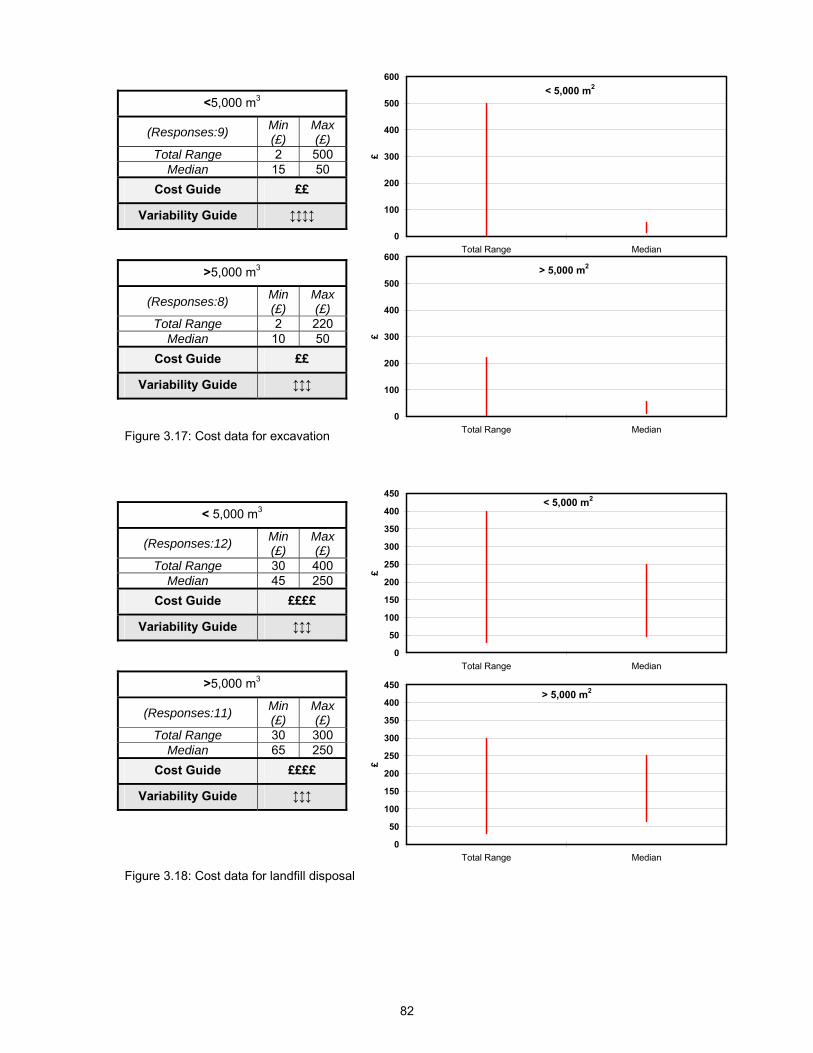
82
<5,000 m3
(Responses:9) Min (£)
Max(£)
Total Range 2 500 Median 15 50
Cost Guide ££
Variability Guide ↕↕↕↕
>5,000 m3
(Responses:8) Min (£)
Max(£)
Total Range 2 220 Median 10 50
Cost Guide ££
Variability Guide ↕↕↕
Figure 3.17: Cost data for excavation
< 5,000 m3
(Responses:12) Min (£)
Max(£)
Total Range 30 400 Median 45 250
Cost Guide ££££
Variability Guide ↕↕↕
>5,000 m3
(Responses:11) Min (£)
Max(£)
Total Range 30 300 Median 65 250
Cost Guide ££££
Variability Guide ↕↕↕
Figure 3.18: Cost data for landfill disposal
< 5,000 m2
0
100
200
300
400
500
600
Total Range Median
£
> 5,000 m2
0
100
200
300
400
500
600
Total Range Median
£
< 5,000 m2
0
50
100
150
200
250
300
350
400
450
Total Range Median
£
> 5,000 m2
0
50
100
150
200
250
300
350
400
450
Total Range Median
£
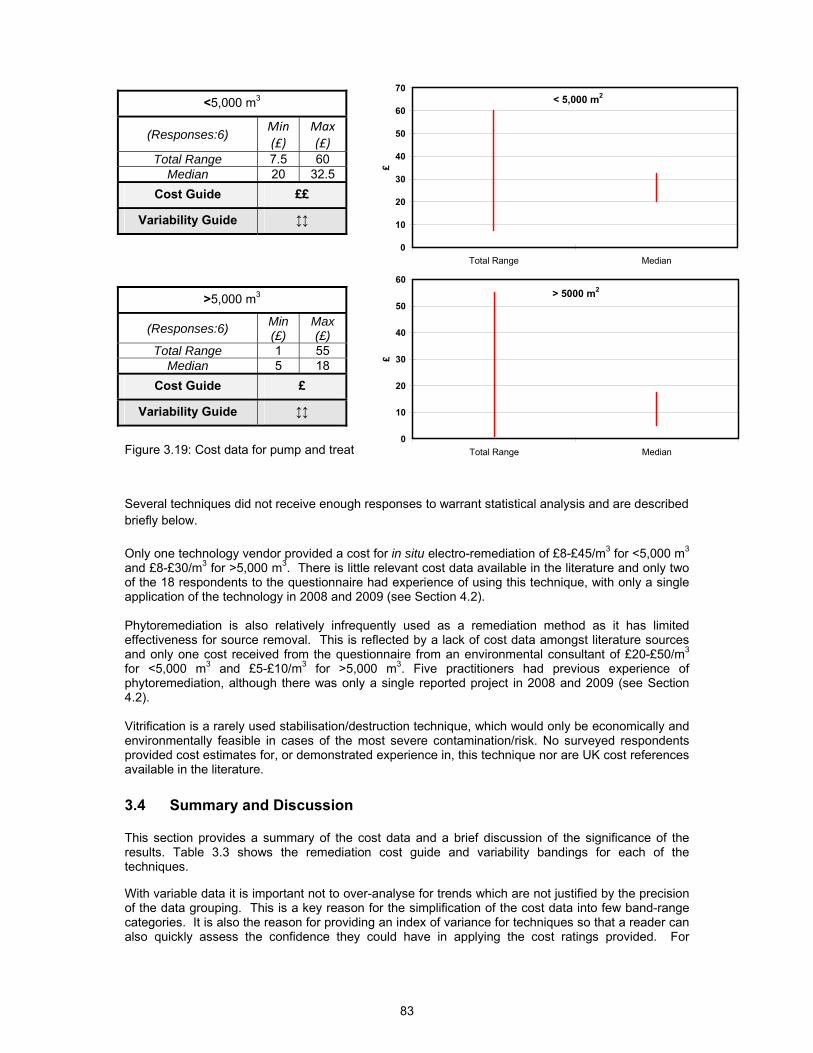
83
<5,000 m3
(Responses:6) Min (£)
Max(£)
Total Range 7.5 60 Median 20 32.5
Cost Guide ££
Variability Guide ↕↕
>5,000 m3
(Responses:6) Min (£)
Max(£)
Total Range 1 55 Median 5 18
Cost Guide £
Variability Guide ↕↕
Figure 3.19: Cost data for pump and treat Several techniques did not receive enough responses to warrant statistical analysis and are described briefly below. Only one technology vendor provided a cost for in situ electro-remediation of £8-£45/m3 for <5,000 m3 and £8-£30/m3 for >5,000 m3. There is little relevant cost data available in the literature and only two of the 18 respondents to the questionnaire had experience of using this technique, with only a single application of the technology in 2008 and 2009 (see Section 4.2). Phytoremediation is also relatively infrequently used as a remediation method as it has limited effectiveness for source removal. This is reflected by a lack of cost data amongst literature sources and only one cost received from the questionnaire from an environmental consultant of £20-£50/m3 for <5,000 m3 and £5-£10/m3 for >5,000 m3. Five practitioners had previous experience of phytoremediation, although there was only a single reported project in 2008 and 2009 (see Section 4.2). Vitrification is a rarely used stabilisation/destruction technique, which would only be economically and environmentally feasible in cases of the most severe contamination/risk. No surveyed respondents provided cost estimates for, or demonstrated experience in, this technique nor are UK cost references available in the literature. 3.4 Summary and Discussion This section provides a summary of the cost data and a brief discussion of the significance of the results. Table 3.3 shows the remediation cost guide and variability bandings for each of the techniques.
With variable data it is important not to over-analyse for trends which are not justified by the precision of the data grouping. This is a key reason for the simplification of the cost data into few band-range categories. It is also the reason for providing an index of variance for techniques so that a reader can also quickly assess the confidence they could have in applying the cost ratings provided. For
< 5,000 m2
0
10
20
30
40
50
60
70
Total Range Median
£
> 5000 m2
0
10
20
30
40
50
60
Total Range Median
£
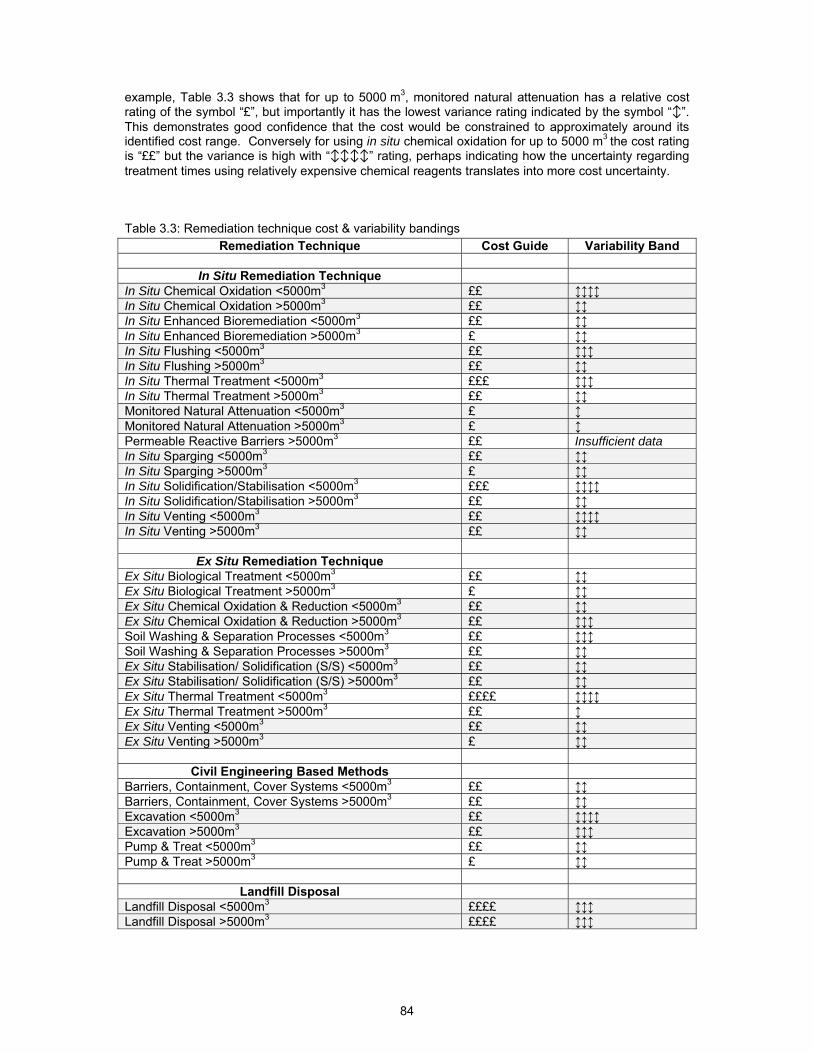
84
example, Table 3.3 shows that for up to 5000 m3, monitored natural attenuation has a relative cost rating of the symbol “£”, but importantly it has the lowest variance rating indicated by the symbol “↕”. This demonstrates good confidence that the cost would be constrained to approximately around its identified cost range. Conversely for using in situ chemical oxidation for up to 5000 m3 the cost rating is “££” but the variance is high with “↕↕↕↕” rating, perhaps indicating how the uncertainty regarding treatment times using relatively expensive chemical reagents translates into more cost uncertainty. Table 3.3: Remediation technique cost & variability bandings
Remediation Technique Cost Guide Variability Band
In Situ Remediation Technique In Situ Chemical Oxidation <5000m3 ££ ↕↕↕↕ In Situ Chemical Oxidation >5000m3 ££ ↕↕ In Situ Enhanced Bioremediation <5000m3 ££ ↕↕ In Situ Enhanced Bioremediation >5000m3 £ ↕↕ In Situ Flushing <5000m3 ££ ↕↕↕ In Situ Flushing >5000m3 ££ ↕↕ In Situ Thermal Treatment <5000m3 £££ ↕↕↕ In Situ Thermal Treatment >5000m3 ££ ↕↕ Monitored Natural Attenuation <5000m3 £ ↕ Monitored Natural Attenuation >5000m3 £ ↕ Permeable Reactive Barriers >5000m3 ££ Insufficient data In Situ Sparging <5000m3 ££ ↕↕ In Situ Sparging >5000m3 £ ↕↕ In Situ Solidification/Stabilisation <5000m3 £££ ↕↕↕↕ In Situ Solidification/Stabilisation >5000m3 ££ ↕↕ In Situ Venting <5000m3 ££ ↕↕↕↕ In Situ Venting >5000m3 ££ ↕↕
Ex Situ Remediation Technique Ex Situ Biological Treatment <5000m3 ££ ↕↕ Ex Situ Biological Treatment >5000m3 £ ↕↕ Ex Situ Chemical Oxidation & Reduction <5000m3 ££ ↕↕ Ex Situ Chemical Oxidation & Reduction >5000m3 ££ ↕↕↕ Soil Washing & Separation Processes <5000m3 ££ ↕↕↕ Soil Washing & Separation Processes >5000m3 ££ ↕↕ Ex Situ Stabilisation/ Solidification (S/S) <5000m3 ££ ↕↕ Ex Situ Stabilisation/ Solidification (S/S) >5000m3 ££ ↕↕ Ex Situ Thermal Treatment <5000m3 ££££ ↕↕↕↕ Ex Situ Thermal Treatment >5000m3 ££ ↕ Ex Situ Venting <5000m3 ££ ↕↕ Ex Situ Venting >5000m3 £ ↕↕
Civil Engineering Based Methods Barriers, Containment, Cover Systems <5000m3 ££ ↕↕ Barriers, Containment, Cover Systems >5000m3 ££ ↕↕ Excavation <5000m3 ££ ↕↕↕↕ Excavation >5000m3 ££ ↕↕↕ Pump & Treat <5000m3 ££ ↕↕ Pump & Treat >5000m3 £ ↕↕
Landfill Disposal Landfill Disposal <5000m3 ££££ ↕↕↕ Landfill Disposal >5000m3 ££££ ↕↕↕
85
Several inferences can be drawn from the results presented in Section 3.3, although no broad conclusions can be drawn that either in situ or ex situ treatment methods are either more costly or have more highly variable costs. For a number of technologies the costs decrease for volumes greater than 5000 m3, particularly for permeable reactive barriers, ex situ thermal desorption and soil washing. These technologies generally have considerable mobilisation/initialisation costs making them a considerably more cost-effective option where larger volumes are required. Another notable trend is that for eight of the remediation techniques (such as in situ chemical oxidation, in situ solidification stabilisation, in situ venting and in and ex situ thermal treatment) the variance decreases for volumes greater than 5000 m3. This trend is again perhaps expected as average costs per m3 should be better constrained for larger volumes where the considerable mobilisation/initialisation costs are averaged across larger volumes.
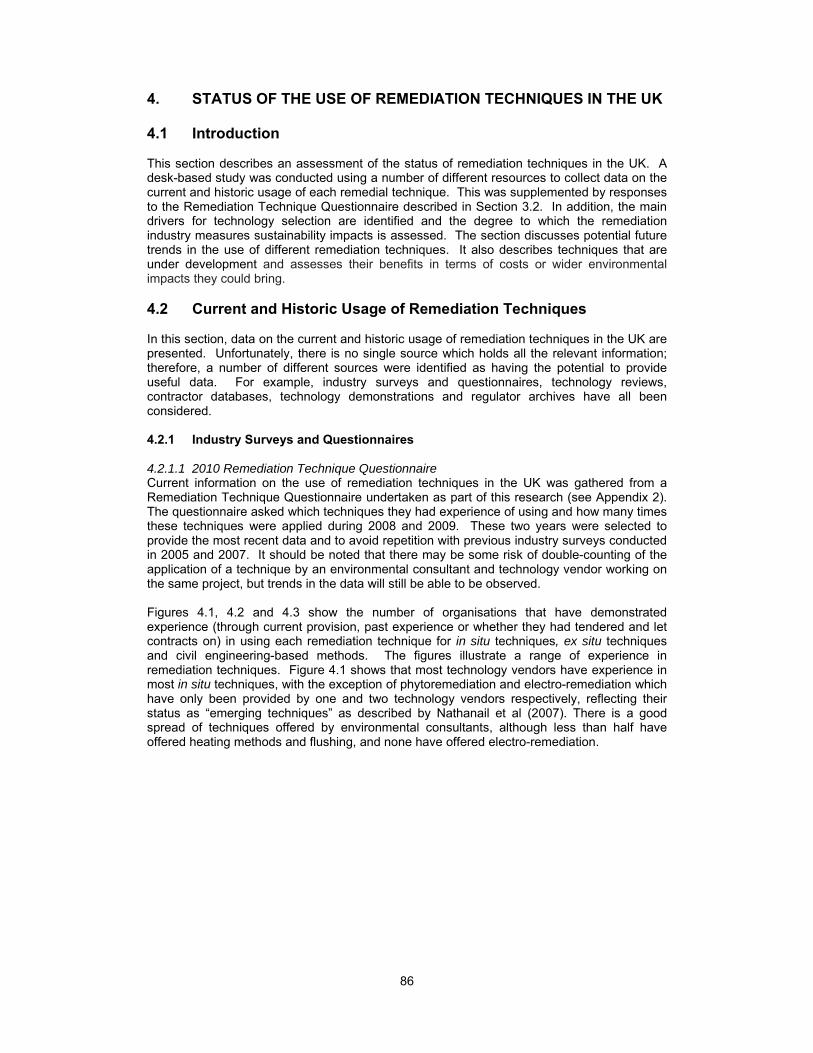
86
4. STATUS OF THE USE OF REMEDIATION TECHNIQUES IN THE UK 4.1 Introduction This section describes an assessment of the status of remediation techniques in the UK. A desk-based study was conducted using a number of different resources to collect data on the current and historic usage of each remedial technique. This was supplemented by responses to the Remediation Technique Questionnaire described in Section 3.2. In addition, the main drivers for technology selection are identified and the degree to which the remediation industry measures sustainability impacts is assessed. The section discusses potential future trends in the use of different remediation techniques. It also describes techniques that are under development and assesses their benefits in terms of costs or wider environmental impacts they could bring. 4.2 Current and Historic Usage of Remediation Techniques In this section, data on the current and historic usage of remediation techniques in the UK are presented. Unfortunately, there is no single source which holds all the relevant information; therefore, a number of different sources were identified as having the potential to provide useful data. For example, industry surveys and questionnaires, technology reviews, contractor databases, technology demonstrations and regulator archives have all been considered. 4.2.1 Industry Surveys and Questionnaires 4.2.1.1 2010 Remediation Technique Questionnaire Current information on the use of remediation techniques in the UK was gathered from a Remediation Technique Questionnaire undertaken as part of this research (see Appendix 2). The questionnaire asked which techniques they had experience of using and how many times these techniques were applied during 2008 and 2009. These two years were selected to provide the most recent data and to avoid repetition with previous industry surveys conducted in 2005 and 2007. It should be noted that there may be some risk of double-counting of the application of a technique by an environmental consultant and technology vendor working on the same project, but trends in the data will still be able to be observed. Figures 4.1, 4.2 and 4.3 show the number of organisations that have demonstrated experience (through current provision, past experience or whether they had tendered and let contracts on) in using each remediation technique for in situ techniques, ex situ techniques and civil engineering-based methods. The figures illustrate a range of experience in remediation techniques. Figure 4.1 shows that most technology vendors have experience in most in situ techniques, with the exception of phytoremediation and electro-remediation which have only been provided by one and two technology vendors respectively, reflecting their status as “emerging techniques” as described by Nathanail et al (2007). There is a good spread of techniques offered by environmental consultants, although less than half have offered heating methods and flushing, and none have offered electro-remediation.
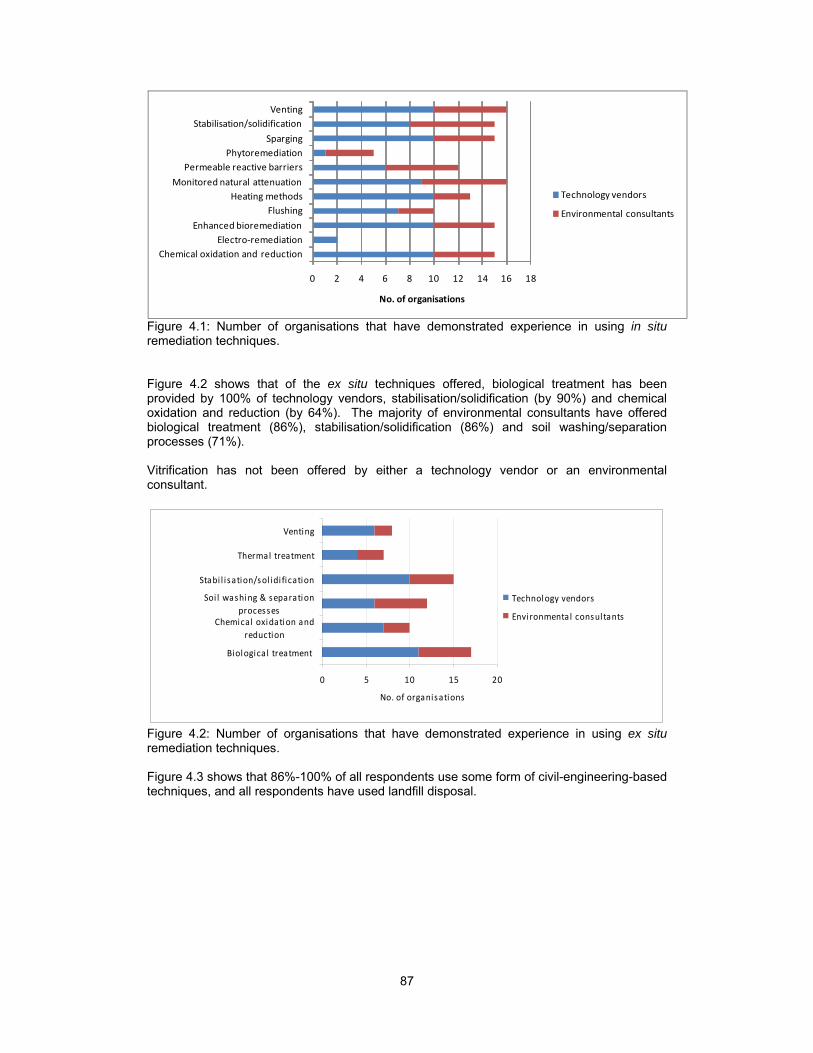
87
0 2 4 6 8 10 12 14 16 18
Chemical oxidation and reductionElectro‐remediation
Enhanced bioremediation
FlushingHeating methods
Monitored natural attenuation
Permeable reactive barriersPhytoremediation
Sparging
Stabilisation/solidificationVenting
No. of organisations
Technology vendors
Environmental consultants
Figure 4.1: Number of organisations that have demonstrated experience in using in situ remediation techniques. Figure 4.2 shows that of the ex situ techniques offered, biological treatment has been provided by 100% of technology vendors, stabilisation/solidification (by 90%) and chemical oxidation and reduction (by 64%). The majority of environmental consultants have offered biological treatment (86%), stabilisation/solidification (86%) and soil washing/separation processes (71%). Vitrification has not been offered by either a technology vendor or an environmental consultant.
0 5 10 15 20
Biological treatment
Chemical oxidation andreduction
Soi l washing & separationprocesses
Stabi l isation/sol idi fication
Thermal treatment
Venting
No. of organisations
Technology vendors
Envi ronmental consul tants
Figure 4.2: Number of organisations that have demonstrated experience in using ex situ remediation techniques. Figure 4.3 shows that 86%-100% of all respondents use some form of civil-engineering-based techniques, and all respondents have used landfill disposal.
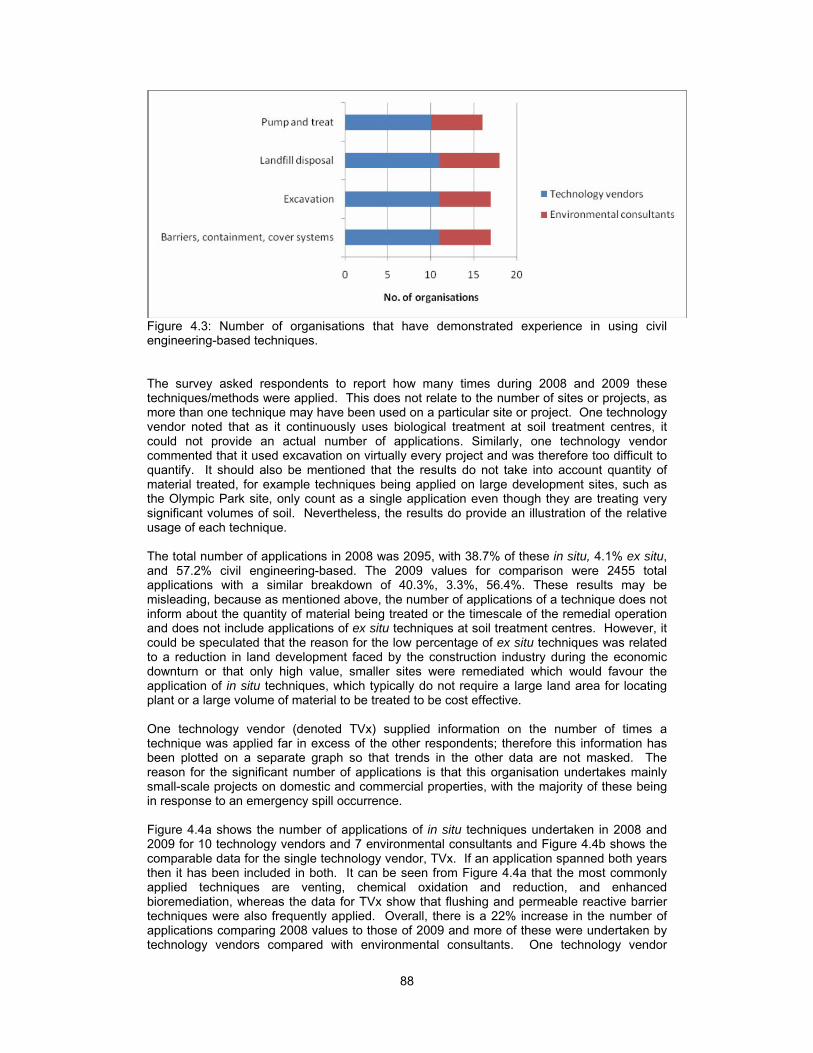
88
Figure 4.3: Number of organisations that have demonstrated experience in using civil engineering-based techniques. The survey asked respondents to report how many times during 2008 and 2009 these techniques/methods were applied. This does not relate to the number of sites or projects, as more than one technique may have been used on a particular site or project. One technology vendor noted that as it continuously uses biological treatment at soil treatment centres, it could not provide an actual number of applications. Similarly, one technology vendor commented that it used excavation on virtually every project and was therefore too difficult to quantify. It should also be mentioned that the results do not take into account quantity of material treated, for example techniques being applied on large development sites, such as the Olympic Park site, only count as a single application even though they are treating very significant volumes of soil. Nevertheless, the results do provide an illustration of the relative usage of each technique. The total number of applications in 2008 was 2095, with 38.7% of these in situ, 4.1% ex situ, and 57.2% civil engineering-based. The 2009 values for comparison were 2455 total applications with a similar breakdown of 40.3%, 3.3%, 56.4%. These results may be misleading, because as mentioned above, the number of applications of a technique does not inform about the quantity of material being treated or the timescale of the remedial operation and does not include applications of ex situ techniques at soil treatment centres. However, it could be speculated that the reason for the low percentage of ex situ techniques was related to a reduction in land development faced by the construction industry during the economic downturn or that only high value, smaller sites were remediated which would favour the application of in situ techniques, which typically do not require a large land area for locating plant or a large volume of material to be treated to be cost effective. One technology vendor (denoted TVx) supplied information on the number of times a technique was applied far in excess of the other respondents; therefore this information has been plotted on a separate graph so that trends in the other data are not masked. The reason for the significant number of applications is that this organisation undertakes mainly small-scale projects on domestic and commercial properties, with the majority of these being in response to an emergency spill occurrence. Figure 4.4a shows the number of applications of in situ techniques undertaken in 2008 and 2009 for 10 technology vendors and 7 environmental consultants and Figure 4.4b shows the comparable data for the single technology vendor, TVx. If an application spanned both years then it has been included in both. It can be seen from Figure 4.4a that the most commonly applied techniques are venting, chemical oxidation and reduction, and enhanced bioremediation, whereas the data for TVx show that flushing and permeable reactive barrier techniques were also frequently applied. Overall, there is a 22% increase in the number of applications comparing 2008 values to those of 2009 and more of these were undertaken by technology vendors compared with environmental consultants. One technology vendor
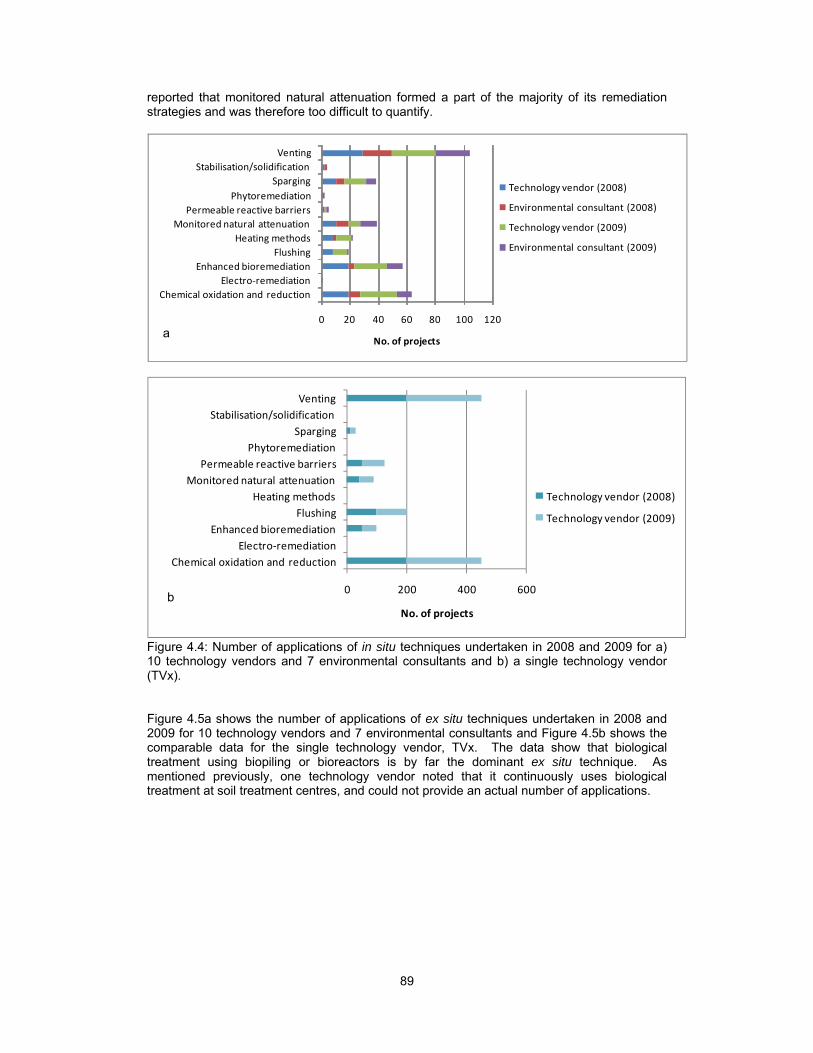
89
reported that monitored natural attenuation formed a part of the majority of its remediation strategies and was therefore too difficult to quantify.
0 20 40 60 80 100 120
Chemical oxidation and reductionElectro‐remediation
Enhanced bioremediationFlushing
Heating methodsMonitored natural attenuation
Permeable reactive barriersPhytoremediation
SpargingStabilisation/solidification
Venting
No. of projects
Technology vendor (2008)
Environmental consultant (2008)
Technology vendor (2009)
Environmental consultant (2009)
0 200 400 600
Chemical oxidation and reductionElectro‐remediation
Enhanced bioremediationFlushing
Heating methodsMonitored natural attenuation
Permeable reactive barriersPhytoremediation
SpargingStabilisation/solidification
Venting
No. of projects
Technology vendor (2008)
Technology vendor (2009)
Figure 4.4: Number of applications of in situ techniques undertaken in 2008 and 2009 for a) 10 technology vendors and 7 environmental consultants and b) a single technology vendor (TVx). Figure 4.5a shows the number of applications of ex situ techniques undertaken in 2008 and 2009 for 10 technology vendors and 7 environmental consultants and Figure 4.5b shows the comparable data for the single technology vendor, TVx. The data show that biological treatment using biopiling or bioreactors is by far the dominant ex situ technique. As mentioned previously, one technology vendor noted that it continuously uses biological treatment at soil treatment centres, and could not provide an actual number of applications.
a
b
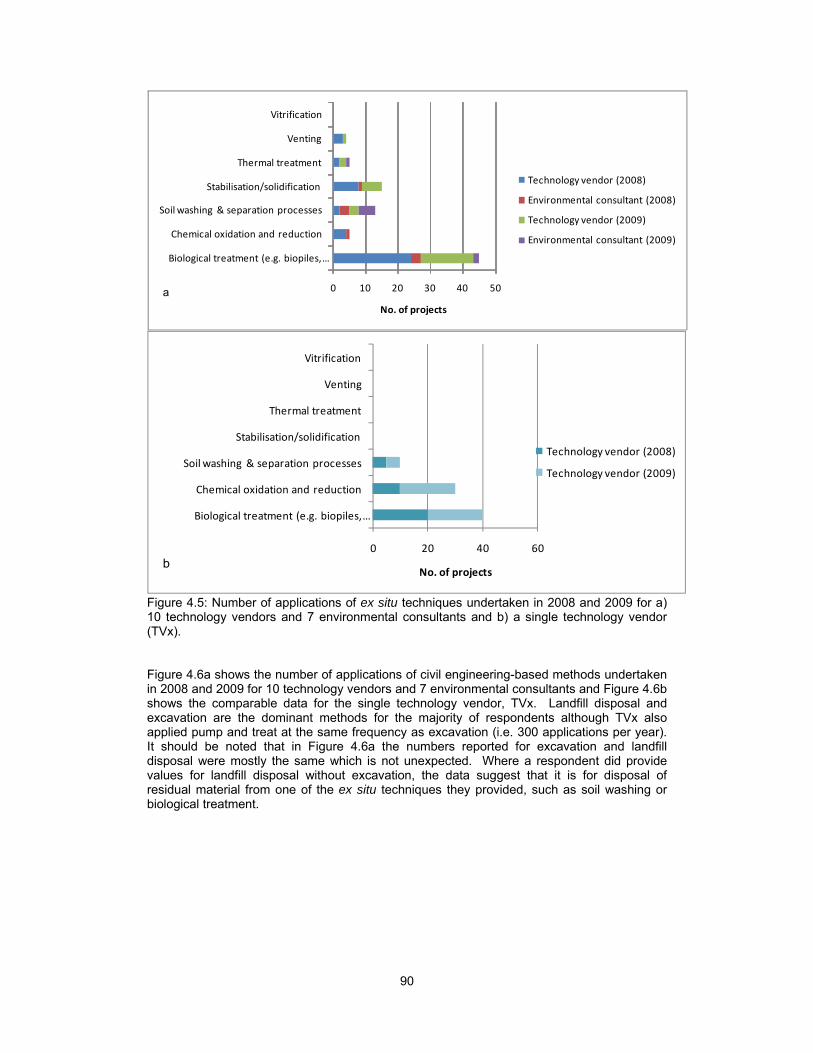
90
0 10 20 30 40 50
Biological treatment (e.g. biopiles, …
Chemical oxidation and reduction
Soil washing & separation processes
Stabilisation/solidification
Thermal treatment
Venting
Vitrification
No. of projects
Technology vendor (2008)
Environmental consultant (2008)
Technology vendor (2009)
Environmental consultant (2009)
0 20 40 60
Biological treatment (e.g. biopiles, …
Chemical oxidation and reduction
Soil washing & separation processes
Stabilisation/solidification
Thermal treatment
Venting
Vitrification
No. of projects
Technology vendor (2008)
Technology vendor (2009)
Figure 4.5: Number of applications of ex situ techniques undertaken in 2008 and 2009 for a) 10 technology vendors and 7 environmental consultants and b) a single technology vendor (TVx). Figure 4.6a shows the number of applications of civil engineering-based methods undertaken in 2008 and 2009 for 10 technology vendors and 7 environmental consultants and Figure 4.6b shows the comparable data for the single technology vendor, TVx. Landfill disposal and excavation are the dominant methods for the majority of respondents although TVx also applied pump and treat at the same frequency as excavation (i.e. 300 applications per year). It should be noted that in Figure 4.6a the numbers reported for excavation and landfill disposal were mostly the same which is not unexpected. Where a respondent did provide values for landfill disposal without excavation, the data suggest that it is for disposal of residual material from one of the ex situ techniques they provided, such as soil washing or biological treatment.
b
a
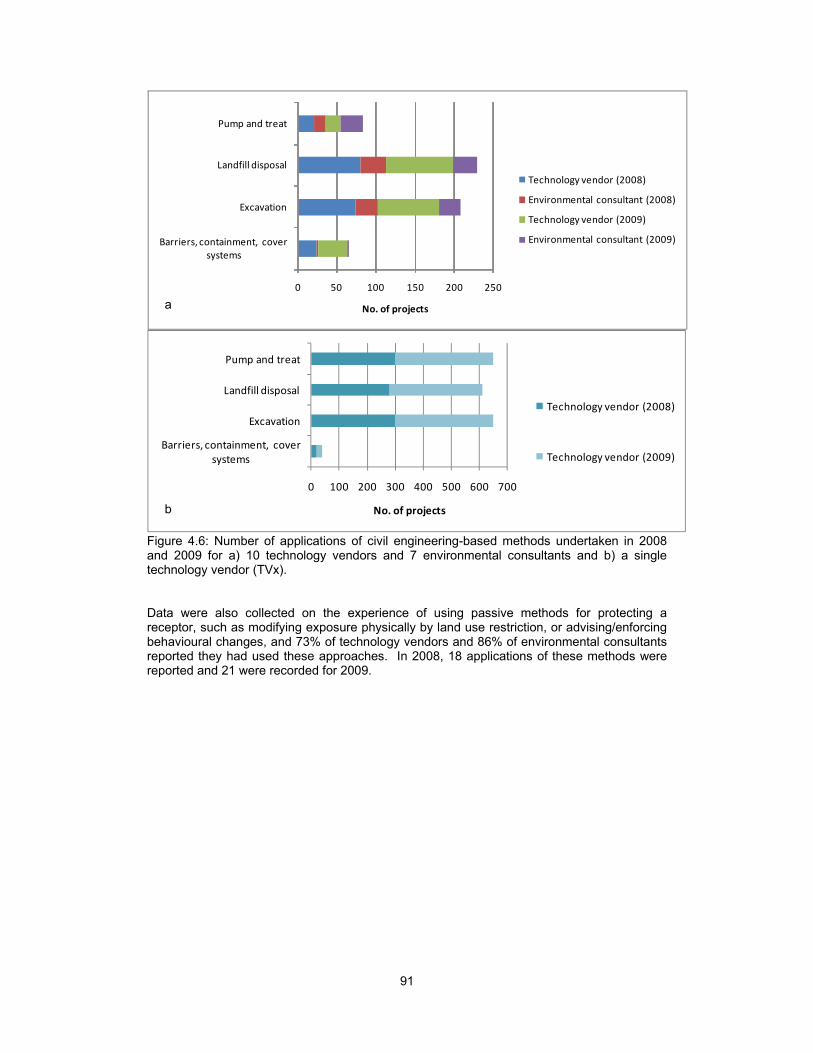
91
0 50 100 150 200 250
Barriers, containment, cover systems
Excavation
Landfill disposal
Pump and treat
No. of projects
Technology vendor (2008)
Environmental consultant (2008)
Technology vendor (2009)
Environmental consultant (2009)
0 100 200 300 400 500 600 700
Barriers, containment, cover systems
Excavation
Landfill disposal
Pump and treat
No. of projects
Technology vendor (2008)
Technology vendor (2009)
Figure 4.6: Number of applications of civil engineering-based methods undertaken in 2008 and 2009 for a) 10 technology vendors and 7 environmental consultants and b) a single technology vendor (TVx). Data were also collected on the experience of using passive methods for protecting a receptor, such as modifying exposure physically by land use restriction, or advising/enforcing behavioural changes, and 73% of technology vendors and 86% of environmental consultants reported they had used these approaches. In 2008, 18 applications of these methods were reported and 21 were recorded for 2009.
b
a
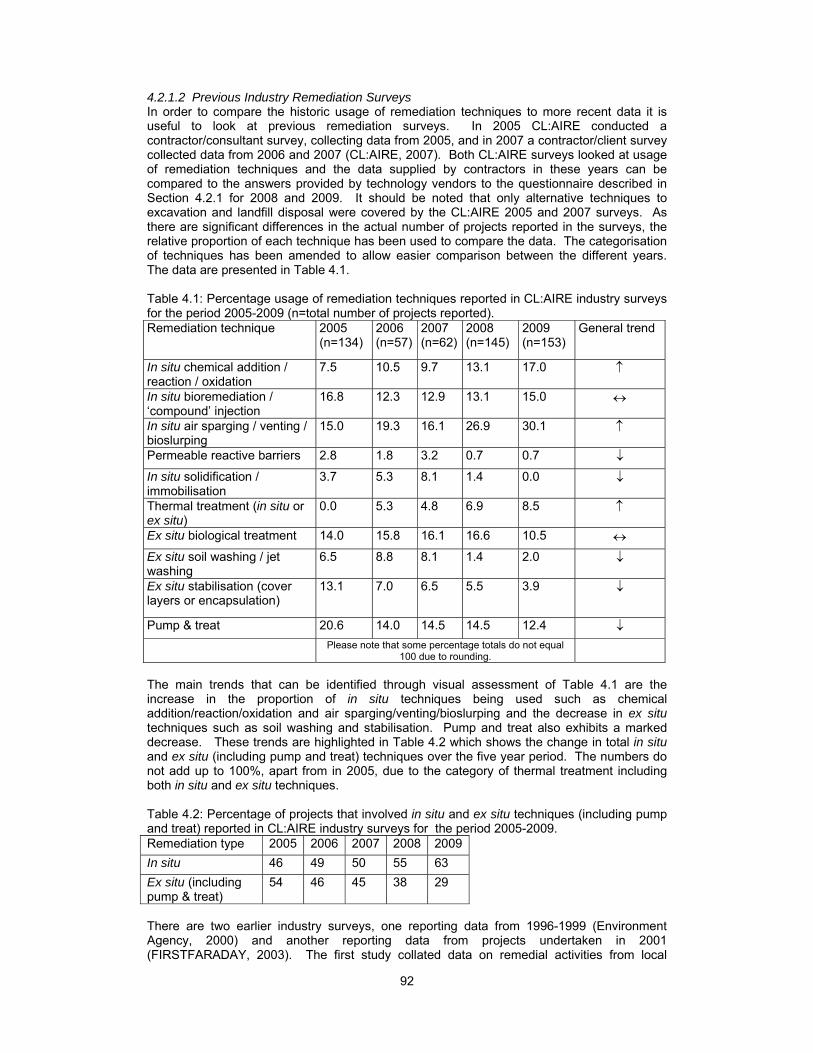
92
4.2.1.2 Previous Industry Remediation Surveys In order to compare the historic usage of remediation techniques to more recent data it is useful to look at previous remediation surveys. In 2005 CL:AIRE conducted a contractor/consultant survey, collecting data from 2005, and in 2007 a contractor/client survey collected data from 2006 and 2007 (CL:AIRE, 2007). Both CL:AIRE surveys looked at usage of remediation techniques and the data supplied by contractors in these years can be compared to the answers provided by technology vendors to the questionnaire described in Section 4.2.1 for 2008 and 2009. It should be noted that only alternative techniques to excavation and landfill disposal were covered by the CL:AIRE 2005 and 2007 surveys. As there are significant differences in the actual number of projects reported in the surveys, the relative proportion of each technique has been used to compare the data. The categorisation of techniques has been amended to allow easier comparison between the different years. The data are presented in Table 4.1. Table 4.1: Percentage usage of remediation techniques reported in CL:AIRE industry surveys for the period 2005-2009 (n=total number of projects reported). Remediation technique 2005
(n=134) 2006 (n=57)
2007 (n=62)
2008 (n=145)
2009 (n=153)
General trend
In situ chemical addition / reaction / oxidation
7.5 10.5 9.7 13.1 17.0 ↑
In situ bioremediation / ‘compound’ injection
16.8 12.3 12.9 13.1 15.0 ↔
In situ air sparging / venting / bioslurping
15.0 19.3 16.1 26.9 30.1 ↑
Permeable reactive barriers 2.8 1.8 3.2 0.7 0.7 ↓ In situ solidification / immobilisation
3.7 5.3 8.1 1.4 0.0 ↓
Thermal treatment (in situ or ex situ)
0.0 5.3 4.8 6.9 8.5 ↑
Ex situ biological treatment 14.0 15.8 16.1 16.6 10.5 ↔ Ex situ soil washing / jet washing
6.5 8.8 8.1 1.4 2.0 ↓
Ex situ stabilisation (cover layers or encapsulation)
13.1 7.0 6.5 5.5 3.9 ↓
Pump & treat 20.6 14.0 14.5 14.5 12.4 ↓ Please note that some percentage totals do not equal
100 due to rounding.
The main trends that can be identified through visual assessment of Table 4.1 are the increase in the proportion of in situ techniques being used such as chemical addition/reaction/oxidation and air sparging/venting/bioslurping and the decrease in ex situ techniques such as soil washing and stabilisation. Pump and treat also exhibits a marked decrease. These trends are highlighted in Table 4.2 which shows the change in total in situ and ex situ (including pump and treat) techniques over the five year period. The numbers do not add up to 100%, apart from in 2005, due to the category of thermal treatment including both in situ and ex situ techniques. Table 4.2: Percentage of projects that involved in situ and ex situ techniques (including pump and treat) reported in CL:AIRE industry surveys for the period 2005-2009. Remediation type 2005 2006 2007 2008 2009In situ 46 49 50 55 63 Ex situ (including pump & treat)
54 46 45 38 29
There are two earlier industry surveys, one reporting data from 1996-1999 (Environment Agency, 2000) and another reporting data from projects undertaken in 2001 (FIRSTFARADAY, 2003). The first study collated data on remedial activities from local
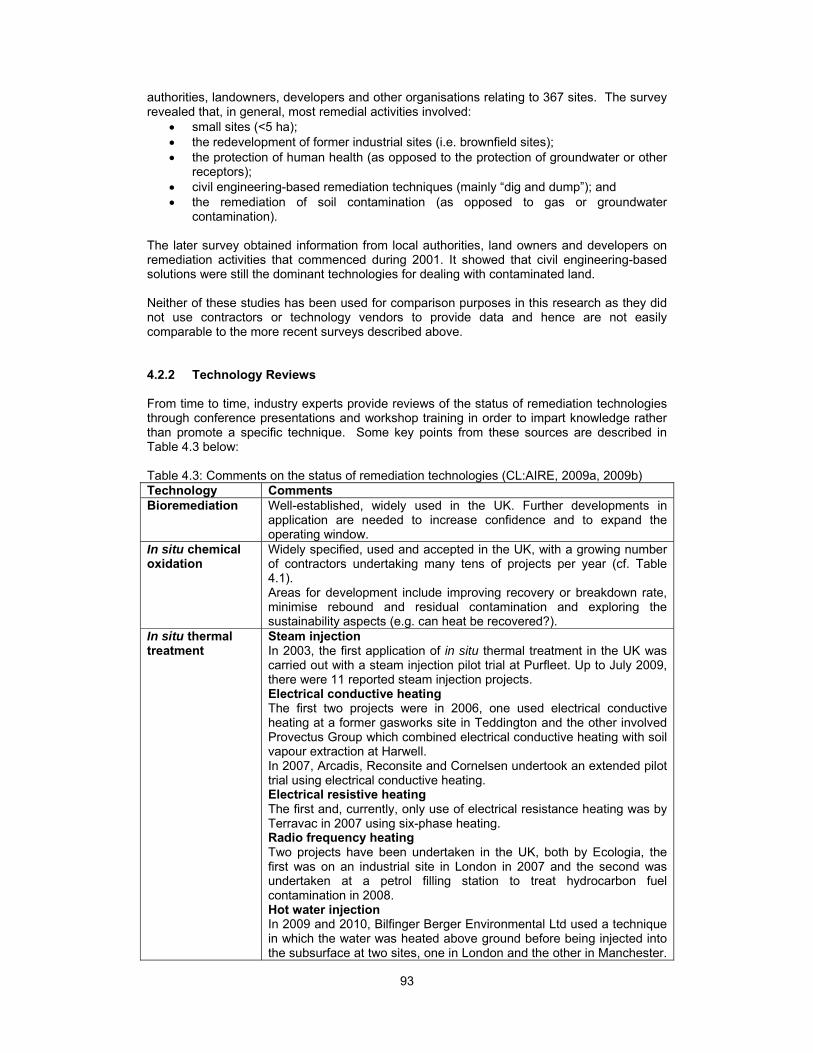
93
authorities, landowners, developers and other organisations relating to 367 sites. The survey revealed that, in general, most remedial activities involved:
• small sites (<5 ha); • the redevelopment of former industrial sites (i.e. brownfield sites); • the protection of human health (as opposed to the protection of groundwater or other
receptors); • civil engineering-based remediation techniques (mainly “dig and dump”); and • the remediation of soil contamination (as opposed to gas or groundwater
contamination). The later survey obtained information from local authorities, land owners and developers on remediation activities that commenced during 2001. It showed that civil engineering-based solutions were still the dominant technologies for dealing with contaminated land. Neither of these studies has been used for comparison purposes in this research as they did not use contractors or technology vendors to provide data and hence are not easily comparable to the more recent surveys described above. 4.2.2 Technology Reviews From time to time, industry experts provide reviews of the status of remediation technologies through conference presentations and workshop training in order to impart knowledge rather than promote a specific technique. Some key points from these sources are described in Table 4.3 below: Table 4.3: Comments on the status of remediation technologies (CL:AIRE, 2009a, 2009b) Technology Comments Bioremediation
Well-established, widely used in the UK. Further developments in application are needed to increase confidence and to expand the operating window.
In situ chemical oxidation
Widely specified, used and accepted in the UK, with a growing number of contractors undertaking many tens of projects per year (cf. Table 4.1). Areas for development include improving recovery or breakdown rate, minimise rebound and residual contamination and exploring the sustainability aspects (e.g. can heat be recovered?).
In situ thermal treatment
Steam injection In 2003, the first application of in situ thermal treatment in the UK was carried out with a steam injection pilot trial at Purfleet. Up to July 2009, there were 11 reported steam injection projects. Electrical conductive heating The first two projects were in 2006, one used electrical conductive heating at a former gasworks site in Teddington and the other involved Provectus Group which combined electrical conductive heating with soil vapour extraction at Harwell. In 2007, Arcadis, Reconsite and Cornelsen undertook an extended pilot trial using electrical conductive heating. Electrical resistive heating The first and, currently, only use of electrical resistance heating was by Terravac in 2007 using six-phase heating. Radio frequency heating Two projects have been undertaken in the UK, both by Ecologia, the first was on an industrial site in London in 2007 and the second was undertaken at a petrol filling station to treat hydrocarbon fuel contamination in 2008. Hot water injection In 2009 and 2010, Bilfinger Berger Environmental Ltd used a technique in which the water was heated above ground before being injected into the subsurface at two sites, one in London and the other in Manchester.
94
The system was designed to have a low carbon footprint and the project in London was carbon neural for the operational phase (Cartwright, personal communication, 2010). Tamdown Regeneration, Cornelsen and Reconsite are currently undertaking a technically challenging in situ thermal project for AECOM combining the technologies of conductive heating, steam injection, high vacuum multi-phase extraction, low vacuum soil vapour extraction and total fluids abstraction (Hulm, personal communication, 2010).
Permeable reactive barriers
Well established, 1st European granular iron PRB at Monkstown, Northern Ireland in 1995. Environment Agency Guidance published in 2002, although by July 2009 still only c12 constructed to date in UK. PRBs can now be designed with a range of media to treat a variety of contaminants. There is a much greater understanding of treatment processes and hydraulic performance as well as improved prediction and verification of long-term performance. Current and future initiatives include optimisation, combinations - such as with electrokinetics and thermal, emerging contaminants, scaling up from site to landscape and scaling down to see if there is a role for nanoparticles.
Soil washing Mature technology, based on mineral processing techniques. Very widely used in Netherlands, Belgium, Germany and USA. Soil washing technology limited mainly to mobile projects in the UK. To date soil washing projects have been carried out by: DEC, HBR, Land and Water, Norwest Holst, VHE. Centralised treatment systems are more common in Europe in which soils are brought to a centralised “fixed” facility.
Monitored natural attenuation
MNA is a well-established risk management technique. MNA evaluation is based on an iterative, “lines of evidence” approach. MNA may work as a stand-alone technique or as a treatment alongside engineered remediation and is often used as a polishing step at the end of a remediation scheme to manage any residual contamination. It can be used on different parts of a site or applied sequentially. Environment Agency Guidance was published in 2000.
Air Sparging & Soil Vapour Extraction
Mature technologies, very widely used in Netherlands, Germany and USA.
Stabilisation & Solidification
Extensive use in the USA. Less so in the UK (very few reported projects). Environment Agency Guidance was published in 2004.
4.2.3 Contractor Databases The Brownfield Briefing Remediation Solutions Guide, published biannually by Newzeye, contains a database of UK remediation contractors and their capabilities. This database can be used as an indicator of remediation technique usage by observing the number of contractors listed and also the techniques they offer in-house. Table 4.4 provides a comparison of the 2006 database to the latest version, published in October 2009 and shows the percentage of contractors that offer each remediation technique. It should be noted that the database relies upon the goodwill of each contractor to be accurate with the information they provide, but there are discrepancies between contractors offering a certain technique and actual applications of that technique. For example, 36 contractors offered soil washing in-house in 2009, yet according to Table 4.3 only five companies have carried out projects using this technique.
95
Table 4.4: Percentage of contractors offering remediation techniques as published in Brownfield Briefing Remediation Solution Guide 2006 and 2009.
% of contractors offering technique
Remediation technique
2006 (n=75)
2009 (n=91)
Monitored natural attenuation 41 52 In situ bioremediation / injection 56 65 In situ air sparging / venting 59 54 Chemical addition / reaction 64 66 In situ heating / steam injection 15 32 Pump & treat (bioslurping) 71 63 Soil vapour extraction / dual vapour extraction 52 51 Permeable reactive barriers 49 49 In-ground barriers / mixing 43 46 Hydrofracture / injection 12 22 Soil washing / jet washing 36 40 Magnetic / chemical separation 16 18 Landfarming / biopiling 69 65 Bioreactors / sludge treatment 40 49 Thermal treatment plant 23 23 Stabilisation ex situ (cover layers) 59 59 Solidification / immobilisation 49 54 Vitrification 0 4 Incineration (off-site) 5 4 Phytoremediation 20 24 Electrolysis / electroremediation 5 10 Landfill 31 40
Table 4.4 shows that there were 75 contractors listed in 2006 and 91 in 2009, which could reflect a growth in the industry or just a more complete database. In terms of changes in the percentage of contractors offering a particular technique, it can be seen that the most marked increase is in in situ heating/steam injection, which has risen from 15% to 32% of contractors. Other increases are observed for monitored natural attenuation, in situ bioremediation/injection, hydrofracture/injection, electrolysis/electroremediation. The results also show that in 2009 there were four contractors offering vitrification compared to none in 2006. Pump & treat (bioslurping) shows the most significant decrease, from 71% to 63% of contractors, perhaps due to long term cost implications in its use and the availability of alternative solutions. 4.2.4 Technology Demonstrations Using its project appraisal system, CL:AIRE has reported on a number of technology demonstration projects between 2001 and 2010 covering all the technologies listed below (Appendix 3 contains a full listing of these projects) :
• Thermal treatment (TDP1, TDP10, TDP23, TDP24, TDP26, TDP28) • Permeable reactive barrier (TDP3, TDP5, TDP13, TDP17, TDP20, TDP21) • Ex situ bioremediation (TDP4, TDP6, TDP12) • Soil washing (TDP2) • Ex situ stabilisation/solidification (TDP8) • Air sparging (TDP9) • Ex situ soil vapour extraction (TDP16) • In situ bioremediation (TDP18) • Chemical treatment (TDP30, TDP31) • Site investigation & monitoring (TDP22, TDP29)
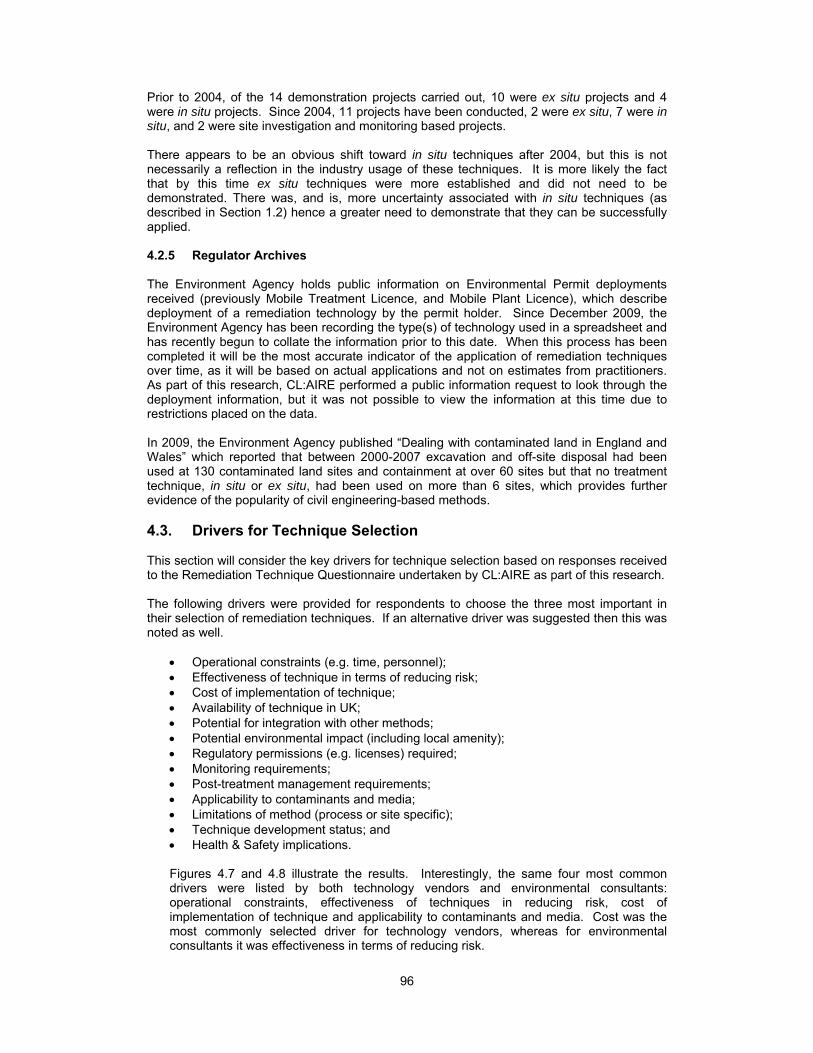
96
Prior to 2004, of the 14 demonstration projects carried out, 10 were ex situ projects and 4 were in situ projects. Since 2004, 11 projects have been conducted, 2 were ex situ, 7 were in situ, and 2 were site investigation and monitoring based projects. There appears to be an obvious shift toward in situ techniques after 2004, but this is not necessarily a reflection in the industry usage of these techniques. It is more likely the fact that by this time ex situ techniques were more established and did not need to be demonstrated. There was, and is, more uncertainty associated with in situ techniques (as described in Section 1.2) hence a greater need to demonstrate that they can be successfully applied. 4.2.5 Regulator Archives The Environment Agency holds public information on Environmental Permit deployments received (previously Mobile Treatment Licence, and Mobile Plant Licence), which describe deployment of a remediation technology by the permit holder. Since December 2009, the Environment Agency has been recording the type(s) of technology used in a spreadsheet and has recently begun to collate the information prior to this date. When this process has been completed it will be the most accurate indicator of the application of remediation techniques over time, as it will be based on actual applications and not on estimates from practitioners. As part of this research, CL:AIRE performed a public information request to look through the deployment information, but it was not possible to view the information at this time due to restrictions placed on the data. In 2009, the Environment Agency published “Dealing with contaminated land in England and Wales” which reported that between 2000-2007 excavation and off-site disposal had been used at 130 contaminated land sites and containment at over 60 sites but that no treatment technique, in situ or ex situ, had been used on more than 6 sites, which provides further evidence of the popularity of civil engineering-based methods. 4.3. Drivers for Technique Selection This section will consider the key drivers for technique selection based on responses received to the Remediation Technique Questionnaire undertaken by CL:AIRE as part of this research. The following drivers were provided for respondents to choose the three most important in their selection of remediation techniques. If an alternative driver was suggested then this was noted as well.
• Operational constraints (e.g. time, personnel); • Effectiveness of technique in terms of reducing risk; • Cost of implementation of technique; • Availability of technique in UK; • Potential for integration with other methods; • Potential environmental impact (including local amenity); • Regulatory permissions (e.g. licenses) required; • Monitoring requirements; • Post-treatment management requirements; • Applicability to contaminants and media; • Limitations of method (process or site specific); • Technique development status; and • Health & Safety implications.
Figures 4.7 and 4.8 illustrate the results. Interestingly, the same four most common drivers were listed by both technology vendors and environmental consultants: operational constraints, effectiveness of techniques in reducing risk, cost of implementation of technique and applicability to contaminants and media. Cost was the most commonly selected driver for technology vendors, whereas for environmental consultants it was effectiveness in terms of reducing risk.
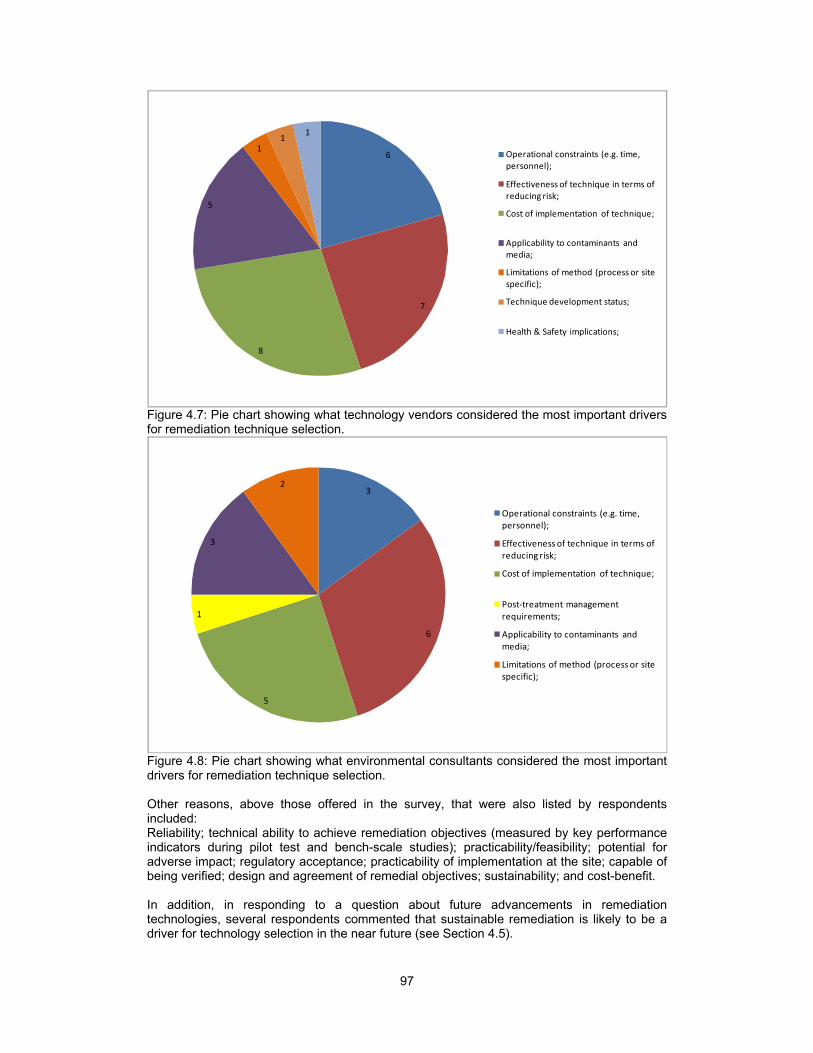
97
6
7
8
5
11
1
Operational constraints (e.g. time, personnel);
Effectiveness of technique in terms of reducing risk;
Cost of implementation of technique;
Applicability to contaminants and media;
Limitations of method (process or site specific);
Technique development status;
Health & Safety implications;
Figure 4.7: Pie chart showing what technology vendors considered the most important drivers for remediation technique selection.
3
6
5
1
3
2
Operational constraints (e.g. time, personnel);
Effectiveness of technique in terms of reducing risk;
Cost of implementation of technique;
Post‐treatment management requirements;
Applicability to contaminants and media;
Limitations of method (process or site specific);
Figure 4.8: Pie chart showing what environmental consultants considered the most important drivers for remediation technique selection. Other reasons, above those offered in the survey, that were also listed by respondents included: Reliability; technical ability to achieve remediation objectives (measured by key performance indicators during pilot test and bench-scale studies); practicability/feasibility; potential for adverse impact; regulatory acceptance; practicability of implementation at the site; capable of being verified; design and agreement of remedial objectives; sustainability; and cost-benefit. In addition, in responding to a question about future advancements in remediation technologies, several respondents commented that sustainable remediation is likely to be a driver for technology selection in the near future (see Section 4.5).
98
4.4. Status of Sustainability Measurement in Remediation To assess the degree to which the remediation industry measures sustainability impacts, a question, “Are sustainability impacts currently measured?” was included in the questionnaire. A summary of the wide-ranging responses is provided below. From the responses received, it is clear that each organisation is at a different stage of development in terms of measuring sustainability. One technology vendor replied with a straightforward “no”, while another said they do not measure sustainability at the moment, but that they are starting to develop their own sustainability system, while three or four other respondents also stated they had internal measurement systems under development. Three companies are involved in the SuRF-UK initiative and are using the SuRF-UK sustainability assessment framework (SuRF-UK, 2010). Several respondents stated that a review of the sustainability of a proposed technique is undertaken at the remediation options appraisal stage. Others mentioned that they use the aspects of sustainability measurement contained within the International Organization for Standardization (ISO) ISO14000 and ISO14001 standards for environmental management systems3, the 18001 occupational health and safety management system and CEEQUAL, which is the assessment and awards scheme for improving sustainability in civil engineering and public realm projects4. Other organisations provided the environmental, social and economic parameters that they currently measure without going into any further detail about specific internal systems or externally available tools. Table 4.5 presents a compilation of all the sustainability parameters that were explicitly mentioned by respondents. It can be seen that some parameters, such as vehicle movements, fall under more than one sustainability criterion, depending on whether one is considering the environmental impacts or the financial impacts. Table 4.5: A compilation of sustainability parameters that were measured by respondents. Sustainability criteria Parameters measured Environmental impacts to air, water, soil, ecology; use of natural resources, waste
generation (e.g. effluent discharged), emissions, greenhouse gases, haulage distance, travel plans to offices, travel to site, recycling options of the materials used, energy consumption (diesel for generators, electrical for treatment plants), climate change, biodiversity, water consumption, dust monitoring, vehicle movements (road wear, road traffic accidents, emissions), carbon footprint
Social health and safety impacts (accidents and near misses); neighbourhood impacts, aesthetics, justice, equity, noise, employment from local area, suppliers from local area, travel plans to offices, travel to site, dust monitoring, complaints
Economic direct and indirect economic costs, reputational damage, assets and liabilities, return on investment, economic development, energy use (cost of), waste generation (cost of), financial risk, accountability, cost/benefit assessment, assess proportion of works being done as part of repeat work (linked to reputation and industry standing), aggregate imported, aggregate recycled, miles travelled, water usage, lorry loads, increase in amenity value, removal of blight, land value
3 The ISO 14000 family of standards addresses various aspects of environmental management. ISO 14001 is a management tool to help identify and control the environmental impact of its activities, products or services, to improve its environmental performance continually, and to implement a systematic approach to setting environmental objectives and targets, to achieving these and to demonstrating that they have been achieved (from ISO website – www.iso.org).
4 CEEQUAL is the assessment and awards scheme for improving sustainability in civil engineering and public realm projects. It aims to deliver improved project specification, design and construction and to demonstrate the commitment of the civil engineering industry to environmental quality and social performance. The Scheme rigorously assesses performance across 12 areas of environmental and social concern (from CEEQUAL website – www.ceequal.com).
99
4.5. Future Remediation Practices This section looks at predicting future trends in the use of different remediation techniques. It also describes techniques that are under development and assess their benefits in terms of costs or wider environmental impacts they could bring. 4.5.1 Trends in Remediation Techniques Responses from industry questionnaire The industry questionnaire that CL:AIRE conducted as part of this research project included a question asking for views on the future advancements in remediation technologies. Within the responses there were several common themes that were raised by a number of the technology vendors and environmental consultants. These have been summarised below. There was a strong view from 39% of respondents that in situ technologies will continue to increase in popularity. Particular mention was made of more aggressive methods, such as thermal treatment and chemical oxidation, and also enhanced bioremediation processes. However, there was a cautionary note that improvements can be made in terms of power efficiency and process design of thermal techniques and methods of delivery of treatment agent to the contamination for chemical oxidation and reduction. Finding ways to reduce costs was mentioned as applicable for both methods. Ways to improve the verification of treatment success was also considered an important area. 22% of respondents predicted an increased use in stabilisation/solidification, including deep soil mixing, half of which specify in situ applications, with the other half not specifying whether in situ or ex situ. A third of respondents thought that the industry already had the techniques that it needed, but that improving understanding and reliability of existing techniques is what is required. 22% of respondents considered that treatment trains and combinations of techniques will become increasingly important. Several respondents predicted a greater consideration of sustainability when evaluating remedial options which may lead to different solutions being used. Two respondents (one technology vendor and one environmental consultant) considered that nanotechnology could be a significant technology for the remediation of difficult/heterogeneous matrices. Other advancements that were raised included the need to see improvement in field screening technologies and the use of on-site decision management tools to assist in better remediation programme delivery and also the continued use of simple and relatively inexpensive techniques such as sparging and soil vapour extraction. One environmental consultant made the following statement about the role of risk mitigation, which can be linked to the use of more passive remediation options: “The role of risk assessment and risk management will grow in importance i.e. risk mitigation and management instead of remediation, as cost and sustainability issues are considered more. An earlier assessment of a broader range of risk mitigation objectives and approaches that could be adopted, rather than deciding on an end point (i.e. development plan) and then fitting the remediation technology or strategy to it. Moving from technology based decision making to higher level strategic and policy level decision making.” “Of equal importance to the development of technology will be the consideration of whether the contamination does actually require human intervention, the degree of risk it actually poses and the costs and benefits of cleaning it up. Advances in plume and contamination characterisation (site investigation techniques) and an improvement in our understanding of contaminant fate in natural systems (microbial activity and contaminant breakdown and attenuation) as well as a consideration of whether contamination does actually pose a
100
significant risk will allow a more holistic and inclusive approach to the development of truly sustainable and economically viable risk mitigation strategies.” Environmental Knowledge Transfer Network Workshop In 2008, the Environmental Knowledge Transfer Network5 held a technology roadmapping workshop on the topic of in situ land remediation technologies. Part of the roadmapping exercise was to identify processes and technologies that would most benefit from investment and a list of those that were identified is provided below:
• Surfactant flushing* • Phytoremediation • Oxygen diffusion* • Edible oils* • Air/ozone sparging* • Ozone chemical oxidation* • Topsoil amendment • Electrokinetics • Sonic tools • Plasma technology • Nitrification* • Enhanced anaerobic degradation* • Clever treatment trains* • Nanotechnology*
The timeline given for development of these technologies was by 2015. It can be seen that some of the specific technologies or general remedial approaches (e.g. in situ methods) are the same as identified in the questionnaire responses described above (indicated by *). 4.5.2 Techniques Under Development This section describes techniques that are currently under development, whether they are near-market or had only limited applications in the UK, focusing on projects that have been undertaken since 2006. Technology vendor-led CL:AIRE projects Monitoring recent CL:AIRE technology demonstration and research projects is a useful way of observing the development of new methods as many companies use CL:AIRE to demonstrate their technologies for the first time as it has an independent appraisal process. Three CL:AIRE technology demonstration projects are described below in which technology vendors have identified a problem on a site and have opted to use a novel technique to deal with the contaminants in question. CL:AIRE Technology Demonstration Project 26 - In situ soil and groundwater decontamination using electric resistive heating technology (six-phase heating) (from www.claire.co.uk) This project was conducted in 2007 by Terra Vac (UK) Ltd and describes the UK’s first use of Six-Phase Heating (SPH), an in situ electrical resistive heating technology, to mitigate the risk posed by historic contamination of a former tools manufacturing site in Sheffield by source removal. After a programme of pre-notification to local residents and through the careful co-ordination of demolition and remediation, the works at the Sheffield site were shown to have achieved the requirements of regulators and client with negligible impact on the local environment / neighbourhood. Final costs for the project fell within budget and were demonstrated to be more controllable and not subject to fluctuation due to such external factors as landfill charges and fuel price
5 Now known as the Environmental Sustainability Knowledge Transfer Network
101
increases, which could have significantly affected alternative options such as excavation and disposal. Despite increased costs associated with treatment of the greater than envisaged mass of contaminants removed, these were offset by the shortened remedial timeframe, and subsequently final project costs were in line with predicted costs. CL:AIRE Technology Demonstration Project 28 - In situ heating using radiofrequency (RF) coupled with soil vapour extraction/high vacuum dual phase extraction for the remediation of contaminated soil in the unsaturated zone (from www.claire.co.uk) This project was undertaken by Ecologia Environmental Solutions Ltd in 2008 at a former Total UK service station near Manston Airport, Kent. It aimed to assess the effectiveness and the commercial viability of combining Soil Vapour Extraction (SVE) with In Situ Radio Frequency Heating (ISRFH) technology in order to remove volatile and semi-volatile organic contaminants from soil. ISRFH in Europe was initially developed by Helmholtz Centre for Environmental Research - UFZ, a German research centre in Leipzig, who demonstrated the potential application of this technology in a limited field trial at a former petrol station. The project demonstrated that the perception that in situ heating is expensive and not sustainable is erroneous; heating of soil requires significant energy input, but soil also has the capacity to retain heat as it is a good insulator. In soils such as Chalk this heat can be retained for days/weeks. Therefore once a predetermined soil temperature has been achieved the operator can switch off the energy intensive ISRFH whilst continuing operation of the SVE at a much improved extraction rate thus significantly reducing the treatment time. The very significant reduction in programme timescales is the principal reason for the overall reduction in energy requirements. A preliminary cost assessment demonstrates the feasibility of this approach in soils with poor permeability where mass transfer of pore water and/or contaminants is minimal and where traditional SVE or high vacuum multiphase extraction have been proven to be less effective for removal of VOC contamination. The cost assessment also suggests that ISRFH is likely to be competitive when compared to traditional excavation and disposal to landfill when material is disposed of as hazardous waste. A key advantage of ISRFH is that heat delivery into the ground can be pinpointed by installing the electrodes at predefined depths. This allows efficient and targeted heating of source areas, often at depth, without the need to heat the entire soil profile. CL:AIRE Technology Demonstration Project 31 - Demonstration of the Arvia® Process of adsorption coupled with electrochemical regeneration for the on-site destruction organic contaminants in groundwaters (from www.claire.co.uk) This project was conducted in 2010 by Arvia and Vertase FLI and the results are currently being written up into a report. Groundwater treatment to remove organic pollutants is often achieved using granular activated carbon (GAC) or other treatment processes followed by GAC. However GAC is both expensive and has significant environmental impact. Using the Arvia® process significant cost and environmental benefits are anticipated. This project aims to quantify these potential benefits by evaluating the results achieved treating pumped groundwater containing a range of complex organics at a site under restoration for development by Vertase FLI. The conventional approach is to use high capacity adsorbents (e.g. activated carbons with high porosities and surface areas) that are excellent adsorbents, but require complex and costly regeneration. The Arvia® process uses a novel, non porous, highly conducting material which can be rapidly and easily regenerated on-site within the Arvia® unit and is an effective but low capacity adsorbent. Collaborative research and development projects It is often difficult to ascertain what new techniques are being developed by industry and the research community as there can be issues with confidentiality and intellectual property rights
102
which restrict the publicity of project information. In 2005, the Technology Strategy Board6 announced a “Contaminated Land Remediation Technologies” call for projects to encourage industry and researchers to collaborate on the advancement of novel techniques. Ten projects7 were funded; four of these focus on new remediation techniques, three are developing new methods for detecting and analysing contaminants, two are developing decision support tools and one project is producing a new type of gas monitoring device. A number of these projects have recently been completed and are starting to disseminate their results. Seven of these projects have involved CL:AIRE as partners in the projects for knowledge transfer and have chosen to put their projects through the CL:AIRE evaluation process for added profile. However, as these projects have yet to disseminate their results it is difficult to assess the potential benefits that they might bring to the remediation industry. Increased acceptability of on-site measurement by estimation and reduction of uncertainty (also approved as CL:AIRE Research Project 20) (from www.claire.co.uk) This project aimed to increase the acceptability of such measurements by developing novel decision making tools (DMT) which effectively estimate and minimise the uncertainty of on-site measurements. This project involved the following participants: Severn Trent Laboratories, National Grid Property Holdings, Corus UK and University of Sussex. The use of biologically enhanced charcoal for in situ remediation of contaminated land (also approved as CL:AIRE Research Project 21) (from www.claire.co.uk) This research project in still ongoing and aims to pilot and further develop biologically enhanced charcoal as a novel method for in situ risk reduction and remediation of contaminated land. The technology works by immobilising contaminants and encouraging the degradation of organics, thus breaking pollutant-receptor linkages. It addresses the problem of sites that are polluted with mixed pollutants such as heavy metals and hydrocarbons. To prove that the technology is effective in the field, an integrated approach consisting of field studies and microcosm studies is being carried out. Key field sites owned by the Ministry of Defence that are contaminated with mixtures of PAHs, oils, fuels and heavy metals will be used for both field studies and laboratory based investigations. The sites are managed by Aspire-Defence which is leading the practical implementation of the technology. Expertise available at the University of Surrey, Forest Research and University of Sheffield is being used to further develop the technology for contaminated land applications. This information will be used to support the further commercialisation of the technology. If proven to be successful in the field, the technology promises to be cost effective (and therefore viable for smaller sites), reliable (it is based on adsorption and enhanced natural attenuation) and sustainable. The technology is passive and requires low material, energy and maintenance inputs. Furthermore, the methodology can be interfaced with normal construction activities and time-constraints. The technology is for in situ treatment of soils which limits the social nuisance of lorry movements, dusts and noise; and the environmental risks of transferring contaminated materials for ex situ treatment or disposal to landfill. Contaminal (also approved as CL:AIRE Research Project 22) (from www.claire.co.uk) This technology uses a novel sampling technique that creates frozen plugs within a closed in situ soil column to which supercritical CO2 is then applied. It can be used for rapid, portable, non-invasive and in situ sampling and analysis of contaminants from land. Reductions in sampling time and cost are anticipated. This project involves the following participants: PJH Partnerships, Pera Innovation, Lankelma and The University of Birmingham. Improved ground gas risk prediction by continuous in-borehole gas monitoring (IRP-IGM) (also approved as CL:AIRE Technology Demonstration Project 22) (from www.claire.co.uk) This project was completed in 2009 and was an industry/ university research collaboration between Salamander (Project Lead), Urban Vision and The University of Manchester. 6 In 2005, the Technology Strategy Board was an advisory body within the former UK Department of Trade and Industry (DTI), before becoming an independent body in July 2007. 7 See www.technologyprogramme.org.uk for full project descriptions
103
The project involved the development of Gasclam, an in-borehole continuous gas monitor and offers distinct advantages over existing technologies based on spot sampling for assessing subsurface conditions and methodologies for modelling contaminant migration. Gasclam sits within the borehole and continuously monitors gas concentration, as well as other key environmental parameters, increasing the temporal resolution of data, reducing error, and allowing correlation with gas migration controls. Furthermore Gasclam allows the quantification of gas flux enabling borehole characterisation. Gasclam alone will allow a more comprehensive assessment of contaminants; furthermore, it can redefine optimal remediation strategies as the new monitoring ability of a responsible body can be “traded” with remediation expense and redevelopment potential. In combination with new methodology an improved model of gas migration and further optimisation of remediation strategies can be achieved. In this way it is expected that marginal areas may become viable for redevelopment, that existing redevelopment programmes could potentially be accelerated and that Gasclam be used as a tool to aid management of existing sites. Decision support tool for innovative in situ multi-contaminant groundwater remediation (also approved as CL:AIRE Technology Demonstration Project 25) (from www.claire.co.uk) An experimental facility was constructed at a former gasworks site to provide comparative trials of various in situ groundwater remediation techniques (IGRTs). Over a period of 2 years a series of field trials (National Grid Property Holdings & WorleyParsons) and laboratory research (Imperial College) was undertaken with the aim of enhancing the understanding of in situ groundwater remediation using chemical oxidants. One of the outputs from the project was a decision support tool to aid in the assessment of the suitability of in situ chemical oxidation (ISCO) as a potential remediation option on a site by site basis – the ISCO Technology Selection Tool. The tool is intended to aid in the assessment of the feasibility of ISCO as a potential option for the remediation of soil and groundwater contamination. It is expected to be used as part of the remediation options appraisal process, not to provide detailed remediation design information. Selection in terms of costs, timescale, performance and risk and provide major benefits to site owners through reduced remediation costs and to stakeholders by improved social and environmental conditions. ISCO remediation techniques and other advanced groundwater treatment technologies have a key role in the future development of UK groundwater remediation and waste disposal. The successful management of groundwater contamination plumes is often a critical factor in minimising contaminated source zone excavation and soil disposal to landfill; a crucial goal of the Landfill Directive. In addition, conventional pump-and-treat technologies for organic contaminants require considerable investment over substantial periods of time, effectively sterilising large areas of development sites with surface equipment, and are not always effective long term solutions. Consequently, there is a considerable need to develop reliable cost effective in situ groundwater remediation techniques. Soil Mix Remediation Technology (SMiRT) (also submitted as a CL:AIRE Research Project) (from http://www-g.eng.cam.ac.uk/smirt/index.htm) This project aims to develop an innovative single soil mix technology (SMT) system for integrated remediation and ground improvement, with simultaneous delivery of wet and dry additives, and with advanced quality assurance system. The project is led by Bachy Soletanche with the University of Cambridge as the research partner, it also includes three engineering consultancies (Arcadis Geraghty & Miller, Arup, Merebrook Consulting), three trade associations (British Urban Regeneration Association, Mineral Products Association, UK Quality Ash Association) and four materials Suppliers (Amcol Minerals Europe, Richard Baker Harrison, Kentish Minerals, and Civil & Marine Ltd).
104
Contaminated Land Assessment of Remediation by Electrical Tomography (CLARET) (from www.claretproject.org) The CLARET project aimed at proving a new contaminated land mapping technology – electrical resistivity tomography (ERT). It has demonstrated detailed time-lapse spatial information to enable the user to visualise resolution geoelectrical monitoring. It has achieved advances in data processing and image recovery, to enable more accurate and higher concentration, transport and evolution of dissolved phase contaminants in a laboratory tank. It demonstrated the successful 4D ERT monitoring of the transport of a bulk non-aqueous phase contaminant. The cost-effectiveness of CLARET depends on the frequency and spatial density of manual sampling with which it is compared. It is clear from the tracer tests that CLARET has excellent prospects for mapping and monitoring contaminant concentration and evolution, especially prior to and during active remediation (e.g. with permeable reactive barriers). The project was undertaken by a consortium of industrial and academic partners: VHE Construction PLC, British Geological Survey, INTERKONSULT Ltd and South Kesteven District Council. Microwave Contaminated Land Remediation (from www.technologyprogramme.org.uk) This project aimed to develop a remediation system to promote the efficient recovery or destruction of highly recalcitrant hydrocarbon contamination utilising novel microwave based thermal desorption heating technologies. This project involved the following participants: Shanks Waste Management, Davis Decade Ltd, Global Energy Associations Ltd, International Moisture Analysers Ltd, Nelson Heat Transfer Ltd, Pera Innovation Ltd, TMD Technologies Ltd, and University of Nottingham RoChemOx (from www.technologyprogramme.org.uk) This project aims to develop a low cost, rapid, on-site, ex situ, low footprint, chemical oxidation treatment in a controlled process environment to destroy organic contaminants, specifically petroleum residues in contaminated soil. The main deliverable will be a scaled prototype chemical oxidation system which can treat 50kg of contaminated soil/hour. The project involves Shanks Group plc, Alpha Environmental Systems Ltd, Pera Innovation Ltd, Rockbourne Environmental Ltd. Development of a conductive polymer ''chemical fuse'' detection of hazardous materials (from www.technologyprogramme.org.uk) This project aims to produce both a single use (sacrificial), and re-useable ''chemical fuse'', capable of detecting the presence of a range of hydrocarbons in contaminated land environments. The project involves Andel Ltd, Intelligent Polymer Systems and Lancaster University. Research projects The UK Research Councils fund research projects that may include a contaminated land focus (typically Engineering and Physical Sciences Research Council (EPSRC), Biotechnology and Biological Sciences Research Council (BBSRC) and Natural Environment Research Council (NERC)). Three of EPSRC’s current projects on remediation techniques are summarised below, but until the research is completed and the results are published it is difficult to assess the benefits of the techniques that are being developed. Designing a trichloroethene source zone treatment based upon nano sized zero valent iron: Professor SA Leharne, University of Greenwich, ends in 2011 (from www.epsrc.ac.uk) This project is investigating how nano sized zero valent iron (nZVI) can be chemically modified and subsequently deployed to be used as emulsion stabilisers to facilitate the removal of chlorinated hydrocarbon solvents (CHSs) from aquifers. The widespread use of CHSs has provided countless opportunities for CHS entry into sub-surface soils and rocks through a combination of spillage, leaking storage tanks and deliberate disposal. Contaminated aquifer restoration is therefore a necessary aspect of sustainable water consumption. Iron can be used to degrade dissolved CHS molecules to
105
safer end-products through reductive dechlorination. However, the sustainable technical solution to aquifer restoration requires the removal of CHS dense non-aqueous phase liquid (DNAPL). Pumping may remove some DNAPL but not all. This is due to the fact that the forces generated by pumping are unable to overcome the capillary forces that trap CHS DNAPL in pore spaces. In these cases much of the CHS mass can be removed via emulsion formation. Emulsions are usually stabilised by surfactants but they can be stabilised by colloidal particles. The basic premise of this proposal is that iron nano-particles can be used as emulsion stabilisers. Such a treatment will provide an effective technical solution to CHS DNAPL contaminated aquifer restoration. The use of 'waste' Mn oxides as contaminated land remediation products: Dr K Johnson, Durham University, ends 2011 (from www.epsrc.ac.uk) This project is investigating the potential use of manganese (Mn) oxides as remediation products capable of treating the challenging 'cocktail' sites, where there are mixtures of metals and Persistent Organic Pollutants (POPs). Mn oxides occur naturally in soils and explain in part soil's natural ability to degrade and sequester contaminants. Mn oxides are powerful oxidising agents capable of both immobilising both metals and enhancing the degradation of POPs in situ. This project will investigate if this natural defence mechanism can be enhanced by adding extra Mn oxide and any positive and negative effects this has on the soil. Since Mn oxides also stimulate humification rates in soils there is the potential for enhancing carbon sequestration and improving general soil health. The use of spectroscopic analytical techniques will provide mechanistic information to assess the long term potential for Mn oxides to remediate contaminated land and therefore the role of natural Mn oxides in the soil. Regeneration Of Brownfield Using Sustainable Technologies (ROBUST): Dr Karen Johnson, Dr Clare Bambra) (from www.dur.ac.uk) This is a five year project between the School of Engineering and the Department of Geography bringing together engineers, health and social geographers, scientists, physicists and geochemists, to work with communities to regenerate their brownfield land. The sustainable technologies in ROBUST involve using 'waste' products from industry. These 'wastes' are actually valuable minerals which have excellent soil remediation properties; minerals such as manganese oxide are already naturally present in soil and form a large part of the soil's natural defence system against man-made pollution. These minerals will be added to the brownfield land and will help transform organic contaminants such as petrol into harmless byproducts and immobilise any metal contaminants within the ground. ROBUST will also develop a new piece of field equipment using far-infrared terahertz radiation for quicker and safer data collection on contaminants at brownfield sites. Unlike other forms of radiation (such as ultraviolet radiation) terahertz is very good at identifying contaminants without any interference effects from the background soil.
106
DISCUSSION AND CONCLUSIONS
This section contains a discussion of the results obtained in this work and includes the main conclusions of the findings and suggestions for future work. It also presents the planned dissemination of the results. Sustainability assessment The contaminated land sector in the UK and elsewhere is looking at ways to improve remediation working practices, including how sustainability is measured and considered during remediation. This thinking includes how to rely less on excavation and removal techniques that involve disposing of large amounts of contaminated soil in landfills and to reuse material wherever possible, thus protecting the use of natural resources and protecting soil which is now such a valued resource. In this work, an assessment of the environmental, social and economic impacts and benefits (i.e. the sustainability) of selected remediation techniques was carried out. This was undertaken by evaluating which sustainability indicators could be used at a technology specific level, and using them to qualitatively assess each selected remediation technique. If required, the assessment could be used to undertake a semi-quantitative assessment using scoring systems and impact weightings. The UK Sustainable Remediation Forum (SuRF-UK) framework document (SuRF-UK, 2010) provides a mechanism for practitioners to undertake sustainability assessments using an agreed methodology. The research in this project complements the work being conducted by SuRF-UK and will be useful for SuRF-UK’s Phase 2 work, which is documenting case studies using the proposed headline indicators to ascertain whether the indicators are robust or need amending when used in a practical situation and through a series of workshops is demonstrating how the framework document can be used to encourage its use. Responses to the Remediation Technique Questionnaire undertaken as part of this work suggest that the industry is still in its infancy with regard to measuring sustainability. There appears to be a mixed interpretation of the term “sustainability”. Although some practitioners have, or have started to develop, their own sustainability measurement systems and others are using the SuRF-UK sustainability assessment framework (SuRF-UK, 2010), there were several more that did not have anything in place. Cost assessment Information on the typical costs of remediation techniques was compiled using information gained through the industry questionnaire. A literature search identified that there is limited research which addresses the issue of remediation costs. The main reason for this would appear to be because remediation costs are strongly site-specific with variability of geological, hydrogeological and chemical factors having a large impact. Remediation costs are also strongly influenced by how stringent the remedial targets are and differences in remedial targets can affect the remediation duration and therefore impact costs. No broad conclusions can be drawn that either in situ or ex situ treatment methods are more costly or have more variable costs. It was observed that costs generally decrease for higher volumes of material treated (>5000 m3), particularly for permeable reactive barriers, ex situ thermal desorption and soil washing. This is a trend that may be expected as these technologies generally have considerable mobilisation/initialisation costs making them a considerably more cost-effective option where larger volumes of material require treatment. Another notable trend is that for a number of remediation techniques the variance in costs decreases for volumes greater than 5000 m3. This trend is again perhaps is to be expected as average costs per m3 should be better constrained for larger volumes where the considerable mobilisation/initialisation costs are averaged across larger volumes. Status of remediation techniques Data collected on the current and historic usage of each remedial technique in the UK, supplemented by the industry questionnaire, showed that over the last 5 years there has been an increase in the proportion of in situ techniques being used such as chemical addition/reaction/oxidation and air sparging/venting/bioslurping and a decrease in ex situ techniques such as soil washing and stabilisation/solidification. This was supported by the questionnaire in which the percentage of ex situ applications in 2008 and 2009 were only 4.1% and 3.3% respectively of the total number of applications. This contrasted with the corresponding in situ values of 38.7% and 40.3%, with the remainder in each case being made up of civil engineering-based methods. These results may be misleading, because as mentioned in Section 4.2.1, the number of applications of a technique does not inform about the quantity of material being treated or the
107
timescale of the remedial operation. For example, techniques being applied on large development sites, such as the Olympic Park site, only count as a single application even though they are treating very significant volumes of soil over a period of many months. However, it could be speculated that the reason for the low percentage of ex situ techniques in the industry survey was related to a reduction in large-scale land development projects faced by the construction industry during the economic downturn, which typically favour ex situ techniques more In terms of looking ahead to the future, there was a strong view from 39% of respondents that in situ technologies will continue to increase in popularity. Particular mention was made of more aggressive methods, such as thermal treatment and chemical oxidation, and also enhanced bioremediation processes. Some of the weaknesses of the type of questionnaire that was used in this research are that the information provided is unverified, some of it is based upon opinion and some is limited by the effort that respondents are willing to put in to provide it. In order to get a better idea of the status of the remediation industry it would be worthwhile to make use of the records that are kept by the Environment Agency. The Environment Agency holds public information on environmental permit deployments received, describing every deployment of a remediation technology by the permit holder. Since December 2009, the Environment Agency has been recording the type(s) of technology used in a spreadsheet and has recently begun to collate the information prior to this date. When this process has been completed it will be the most accurate indicator of the application of remediation techniques over time, as it will be based on actual applications and not on estimates from practitioners. As part of this research, CL:AIRE performed a public information request to look through the deployment information, but it was not possible to view the information at this time due to restrictions placed on the data. It has been suggested that this data may be made available in the near future which would be of great interest to the remediation industry. The research also assessed the use of less impactful, passive ways of dealing with risks on contaminated land, rather than using heavy engineering solutions. For example, land use restrictions might be applied to ensure a site is not used for a sensitive activity. Data were collected on the experience of using passive methods for protecting a receptor, such as modifying exposure physically by land use restriction (e.g. fencing, signage), or advising/enforcing behavioural changes, and 73% of technology vendors and 86% of environmental consultants reported they had used these approaches. In 2008, 18 applications of these methods were reported and 21 were recorded for 2009, which is only about 1% of the total applications reported. There may be ways that practitioners can be made more aware of the benefits of these types of activities, perhaps through guidance or best practice publications. This would help industry to identify all the options rather than resorting to a default remediation solution which may be very expensive and have high environmental and social impacts. With regard to future trends in technologies, one environmental consultant made the considered point that: “The role of risk assessment and risk management will grow in importance i.e. risk mitigation and management instead of remediation, as cost and sustainability issues are considered more. Of equal importance to the development of technology will be the consideration of whether the contamination does actually require human intervention, the degree of risk it actually poses and the costs and benefits of cleaning it up. Advances in plume and contamination characterisation (site investigation techniques) and an improvement in our understanding of contaminant fate in natural systems (microbial activity and contaminant breakdown and attenuation) as well as a consideration of whether contamination does actually pose a significant risk will allow a more holistic and inclusive approach to the development of truly sustainable and economically viable risk mitigation strategies.” In the review of techniques that are currently under development, whether they are near-market or had only limited applications in the UK, it was noted that a number of the collaborative research and development and applied research projects were still ongoing and had yet to disseminate their results. Therefore, it is difficult to assess the potential benefits that they might bring to the remediation industry at this stage. However, it would be of interest to the remediation industry to review these projects when they are complete in order to establish what further work needs to be done to bring them into use, if they have demonstrated potential in being a remedial solution of the future. Knowledge transfer and dissemination Notification of the project findings, via the final report, will be through CL:AIRE’s contacts with the following networks to ensure an effective communication and reporting process is achieved: • Association of Geotechnical and Geoenvironmental Specialists (AGS);
108
• Brownfield Briefing; • Environmental Data Interactive Exchange (edie); • Environmental Data Services (ENDS); • Environmental Industries Commission (EIC); • Environmental Protection UK (EP-UK); • Environmental Sustainability Knowledge Transfer Network; • EUGRIS portal for soil and groundwater management in Europe; • Local Authority e-forum "Contaminated Land Strategies"; • Soil and Groundwater Technology Association (SAGTA); and • USEPA's Tech-Direct dissemination service. The results will be also be disseminated at conferences, workshops and events hosted by CL:AIRE, and via other industry speaking engagements.
109
REFERENCES
Bardos, P., 2010. Initial Sustainability Appraisal of C-CURE Products: Summary for May 19th 2010 C-CURE Dissemination Meeting Prepared for the University of Surrey. British Standards Institution. 1999. BS 5930: Code of Practice for Site Investigations. Brownfield Briefing. 2006. Remediation Solutions: A guide to remediation in the UK. Issue 4. Brownfield Briefing. 2009. Remediation Solutions: A guide to remediation in the UK. Issue 11. Center for Public Environmental Oversight website: http://www.cpeo.org/techtree/ttdescript/ssvit.htm. Accessed February 2010. Cartwright, J. 2010. Bilfinger Berger Environmental Ltd, personal communication. Chemex website www.chemex.co.uk. Accessed September 2010. Circeo, L.J., and Martin Jr, R.C., 2001. In situ plasma vitrification of buried wastes. In proceedings of the International Containment & Remediation Technology Conference and Exhibition, Orlando, Florida. CIRIA. 1995. Remedial treatment for contaminated land: Volume IV: Classification and selection of remedial methods. CIRIA. 1995. Remedial treatment for contaminated land. Volume V: Excavation and disposal. CIRIA. 1995. Remedial Treatment for Contaminated Land. Volume VI: Containment and hydraulic measures. CIRIA. 1995. Remedial treatment for contaminated land: Volume VII: Ex-situ remedial methods for soils, sludges and sediments. CIRIA. 1995. Remedial Treatment for Contaminated Land. Volume VII: In-situ remedial methods for soils, sludges and sediments. CIRIA. 1995. Remedial Treatment for Contaminated Land. Volume VIII: Ex-situ remedial methods for contaminated groundwater and other liquids. CIRIA. 1995. Remedial treatment for contaminated land: Volume IX: In-situ methods of remediation. CIRIA. 2004. Selection of remedial treatments for contaminated land. A guide to good practice. C622. CL:AIRE. 2001. CL:AIRE view newsletter. Autumn Edition. CL:AIRE RB2. 2003. FIRS (Ferric Iron Remediation and Stabilisation): A Novel Electrokinetic Technique for Soil Remediation and Engineering. CL:AIRE TDP2. 2003. Remediation of Basford Gasworks using Soil Washing. CL:AIRE TDP1. 2004. Remediation Trial using Low Temperature Thermal Desorption to Treat Hydrocarbon Contaminated Soil. CL:AIRE TDP9. 2004. Design, Installation and Performance Assessment of an Air Sparge Curtain System. CL:AIRE TDP4. 2004. Slurry-phase Bioreactor Trial. CL:AIRE TB9. 2004. Stabilisation/Solidification Treatment and Remediation: Part 1: Summary of the State of Practice Reports I-IV. CL:AIRE TDP6. 2004. Biopile Field Demonstration at the Avenue Coking Works. CL:AIRE TDP12. 2005. Bioremediation of the Coke Works and Former Colliery at Askern, Doncaster.
110
CL:AIRE TDP13. 2005. Passive Treatment of Severely Contaminated Colliery Spoil Leachate using a Permeable Reactive Barrier. CL:AIRE RB3. 2005. Project SIReN: The Site for Innovative Research into Monitored Natural Attenuation CL:AIRE GB1. 2005. Stabilisation/Solidification for the Treatment of Contaminated Soil CL:AIRE 2006. Case Study Bulletin 5. Remediation Trial at the Avenue Coking Works Using Stabilisation/Solidification and Accelerated Carbonation Technology. CL:AIRE TDP5. 2006. A Reducing and Alkalinity Producing System (RAPS) for Passive Treatment of Acidic, Aluminium-rich Mine Waters. CL:AIRE. 2007. UK Remediation Status Survey Summary. CL:AIRE SUB2. 2007. SUBR:IM Bulletin – Uncovering the True Impacts of Remediation. CL:AIRE TDP16. 2007. Ex situ Soil Vapour Extraction to Remediate Chlorinated Hydrocarbons. CL:AIRE TB13. 2007. Understanding Soil Washing. CL:AIRE TDP26. 2008. In Situ Soil and Groundwater Decontamination Using Electric Resistive Heating Technology (Six-Phase Heating). CL:AIRE TDP17. 2008. A Biological Sequential Reactive Barrier (SEREBAR): Design, Installation and Performance at a Former Manufactured Gas Plant (FMGP) Site in South West England. CL:AIRE. 2008. The Definition of Waste: Development Industry Code of Practice. CL:AIRE. 2009a. Remediation Technology Training Programme 2009/2010 CL:AIRE. 2009b. 10th Anniversary Project Conference. July 2009. Barbican Centre, London. CL:AIRE TDP20. 2009. Design and Installation of a Permeable Reactive Barrier to Treat Carbon Disulphide Contaminated Groundwater CL:AIRE TDP28. 2009. In Situ Heating using Radiofrequency (RF) for the Remediation of Contaminated Soil in the Unsaturated Zone. Presented at the CL:AIRE 10th Anniversary Conference, London. CL:AIRE TDP24. 2010. Thermally Enhanced Soil Vapour Extraction to Remediate the Unsaturated Zone at the Western Storage Area, Harwell Davis Langdon. 2009. David Langdon Instruction Manual: Production of Remediation Cost and Risk Management (RCMC) Reports. Davis Langdon. 2010. Spon's Civil Engineering and Highway Works Price Book. English Partnerships. 2008. Contamination and Dereliction Remediation Costs: Best Practice Note 27. Environment Agency. 2000. Survey of remedial techniques for land contamination in England and Wales. R&D Technical Report P401. ISBN: 1-85705-385-0 Environment Agency. 2006. Guidance: Remediation Position Statements. Environment Agency. 2009. Dealing with contaminated land in England and Wales: A review of progress from 2000-2007 with Part 2A of the Environmental Protection Act. Environment Agency. 2010. Verification of remediation of land contamination. Report: SC030114/R1. Environmental Knowledge Transfer Network. 2008. Business Case 9: In-Situ Land Remediation
111
FIRSTFARADAY. 2003. Research Report No. 1: Review of Remediation Practice in the UK during 2001. ISBN: 0-95330-907-X. Published by Land Quality Press FRTR (Federal Remediation Technologies Roundtable). 2007. The Remediation Technologies Screening Matrix and Reference Guide. Version 4.0. Website: www.frtr.gov/matrix2/ FRTR (Federal Remediation Technologies Roundtable) Cost and Performance Case Studies – Ex situ soil vapour extraction case study. 1993. http://costperformance.org/profile.cfm?ID=18&CaseID=18 Hulm, Q., 2010. Cornelsen Ltd, personal communication. Nathanail, J., Bardos, P., Nathanail, P., 2002. Contaminated Land Management: Ready Reference. Land Quality Press & EPP Publications. Nathanail, J., Bardos, P., Nathanail, P., 2007. Contaminated Land Management: Ready Reference. Land Quality Press & EPP Publications. Naval Facilities Engineering Command (NAVFAC) website: https://portal.navfac.navy.mil/portal/page/portal/navfac/navfac_ww_pp/navfac_nfesc_pp/environmental/erb/vitr-exsitu. Accessed February 2010. Otten, V.J., Johnston, A.R., Law of Toxics. Presentation given at Workshop on Land Use & Global Warming Law http://llsels.org/landuseworkshop.html. Accessed August 2010. Princeton Chemistry and Environment website - Arsenic Contamination of Groundwater. 2003. http://www.princeton.edu/~chm333/2003/arsenic/index.htm. Accessed February 2010. SuRF-UK, 2009. A Review of Published Sustainability Indicator Sets: How applicable are they to contaminated land remediation indicator-set development? ISBN 978-1-905046-18-8. Available at www.claire.co.uk/surfuk SuRF-UK, 2010. A Framework for Assessing the Sustainability of Soil and Groundwater Remediation. ISBN: 978-1-905046-19-5. Available at www.claire.co.uk/surfuk Unified Facilities Criteria. 2006: Design: In Situ Thermal Remediation. UFC 3-280-05. Department of Defense, USA. USEPA. 2006. In Situ Treatment Technologies for Contaminated Soil. Engineering Forum Issue Paper. EPA 542/F-06/013. USEPA Mid-Atlantic Brownfields & Land Revitalization website, Accessed August 2010.
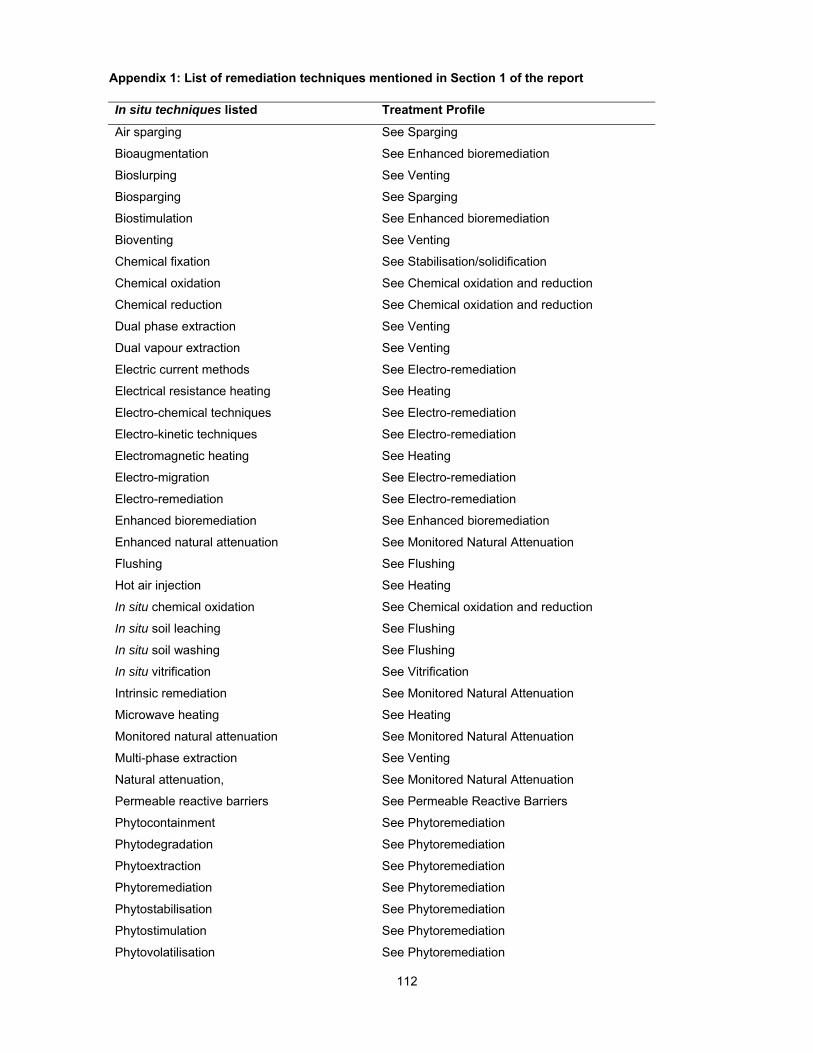
112
Appendix 1: List of remediation techniques mentioned in Section 1 of the report In situ techniques listed Treatment Profile
Air sparging See Sparging
Bioaugmentation See Enhanced bioremediation
Bioslurping See Venting
Biosparging See Sparging
Biostimulation See Enhanced bioremediation
Bioventing See Venting
Chemical fixation See Stabilisation/solidification
Chemical oxidation See Chemical oxidation and reduction
Chemical reduction See Chemical oxidation and reduction
Dual phase extraction See Venting
Dual vapour extraction See Venting
Electric current methods See Electro-remediation
Electrical resistance heating See Heating
Electro-chemical techniques See Electro-remediation
Electro-kinetic techniques See Electro-remediation
Electromagnetic heating See Heating
Electro-migration See Electro-remediation
Electro-remediation See Electro-remediation
Enhanced bioremediation See Enhanced bioremediation
Enhanced natural attenuation See Monitored Natural Attenuation
Flushing See Flushing
Hot air injection See Heating
In situ chemical oxidation See Chemical oxidation and reduction
In situ soil leaching See Flushing
In situ soil washing See Flushing
In situ vitrification See Vitrification
Intrinsic remediation See Monitored Natural Attenuation
Microwave heating See Heating
Monitored natural attenuation See Monitored Natural Attenuation
Multi-phase extraction See Venting
Natural attenuation, See Monitored Natural Attenuation
Permeable reactive barriers See Permeable Reactive Barriers
Phytocontainment See Phytoremediation
Phytodegradation See Phytoremediation
Phytoextraction See Phytoremediation
Phytoremediation See Phytoremediation
Phytostabilisation See Phytoremediation
Phytostimulation See Phytoremediation
Phytovolatilisation See Phytoremediation
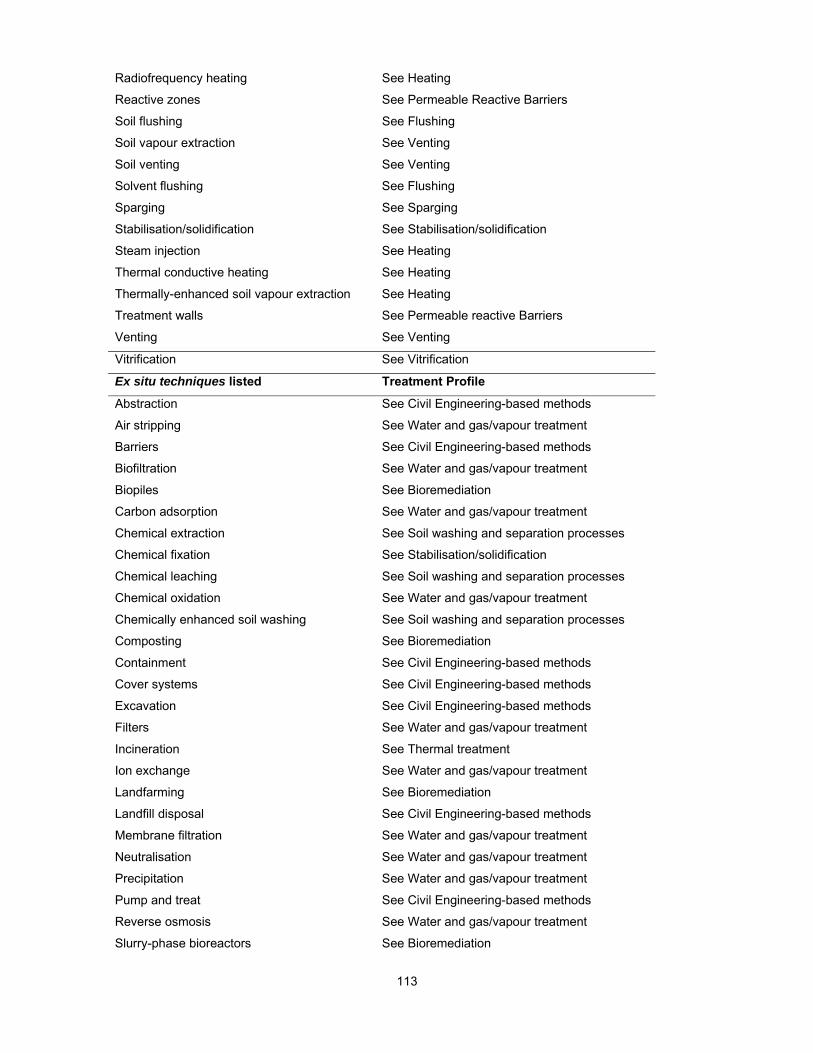
113
Radiofrequency heating See Heating
Reactive zones See Permeable Reactive Barriers
Soil flushing See Flushing
Soil vapour extraction See Venting
Soil venting See Venting
Solvent flushing See Flushing
Sparging See Sparging
Stabilisation/solidification See Stabilisation/solidification
Steam injection See Heating
Thermal conductive heating See Heating
Thermally-enhanced soil vapour extraction See Heating
Treatment walls See Permeable reactive Barriers
Venting See Venting
Vitrification See Vitrification
Ex situ techniques listed Treatment Profile
Abstraction See Civil Engineering-based methods
Air stripping See Water and gas/vapour treatment
Barriers See Civil Engineering-based methods
Biofiltration See Water and gas/vapour treatment
Biopiles See Bioremediation
Carbon adsorption See Water and gas/vapour treatment
Chemical extraction See Soil washing and separation processes
Chemical fixation See Stabilisation/solidification
Chemical leaching See Soil washing and separation processes
Chemical oxidation See Water and gas/vapour treatment
Chemically enhanced soil washing See Soil washing and separation processes
Composting See Bioremediation
Containment See Civil Engineering-based methods
Cover systems See Civil Engineering-based methods
Excavation See Civil Engineering-based methods
Filters See Water and gas/vapour treatment
Incineration See Thermal treatment
Ion exchange See Water and gas/vapour treatment
Landfarming See Bioremediation
Landfill disposal See Civil Engineering-based methods
Membrane filtration See Water and gas/vapour treatment
Neutralisation See Water and gas/vapour treatment
Precipitation See Water and gas/vapour treatment
Pump and treat See Civil Engineering-based methods
Reverse osmosis See Water and gas/vapour treatment
Slurry-phase bioreactors See Bioremediation
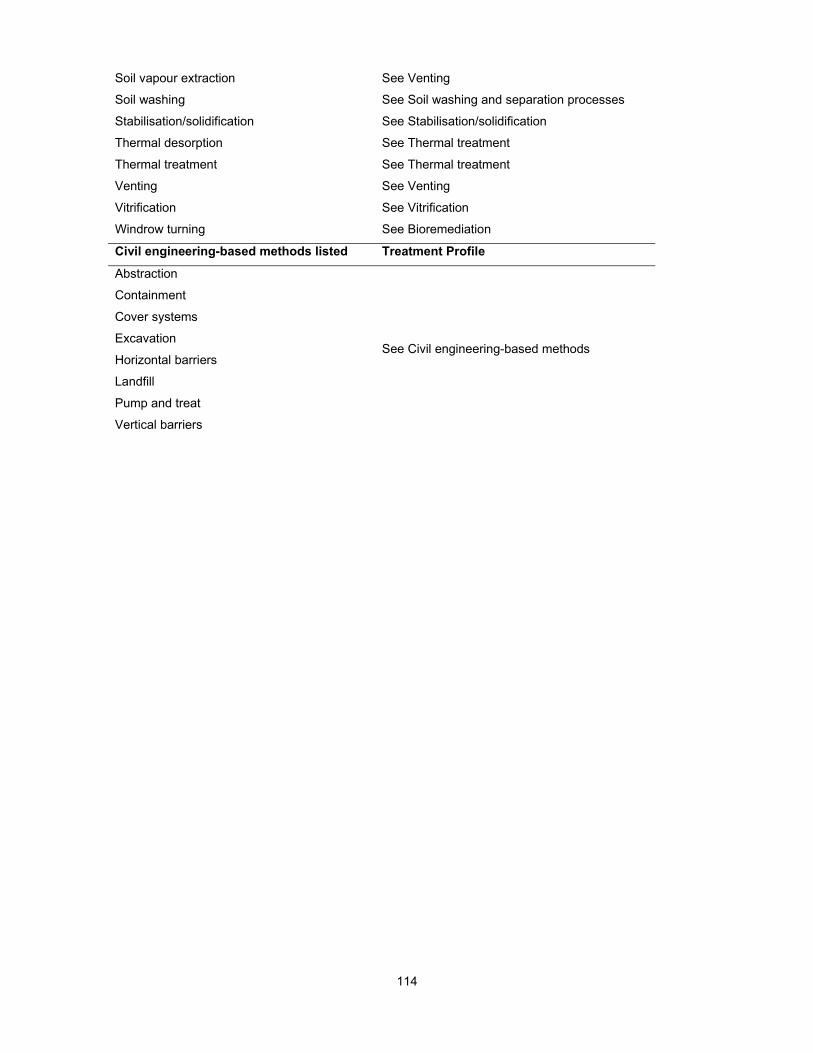
114
Soil vapour extraction See Venting
Soil washing See Soil washing and separation processes
Stabilisation/solidification See Stabilisation/solidification
Thermal desorption See Thermal treatment
Thermal treatment See Thermal treatment
Venting See Venting
Vitrification See Vitrification
Windrow turning See Bioremediation
Civil engineering-based methods listed Treatment Profile
Abstraction
Containment
Cover systems
Excavation
Horizontal barriers
Landfill
Pump and treat
Vertical barriers
See Civil engineering-based methods
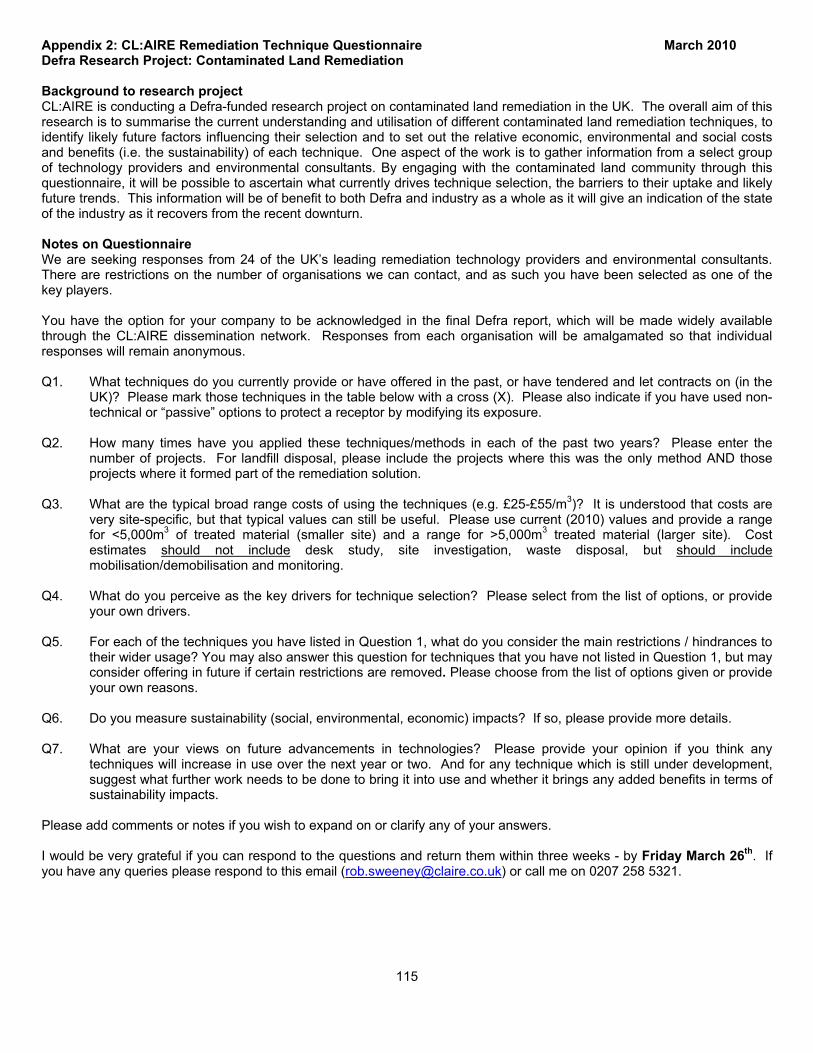
115
Appendix 2: CL:AIRE Remediation Technique Questionnaire March 2010 Defra Research Project: Contaminated Land Remediation Background to research project CL:AIRE is conducting a Defra-funded research project on contaminated land remediation in the UK. The overall aim of this research is to summarise the current understanding and utilisation of different contaminated land remediation techniques, to identify likely future factors influencing their selection and to set out the relative economic, environmental and social costs and benefits (i.e. the sustainability) of each technique. One aspect of the work is to gather information from a select group of technology providers and environmental consultants. By engaging with the contaminated land community through this questionnaire, it will be possible to ascertain what currently drives technique selection, the barriers to their uptake and likely future trends. This information will be of benefit to both Defra and industry as a whole as it will give an indication of the state of the industry as it recovers from the recent downturn. Notes on Questionnaire We are seeking responses from 24 of the UK’s leading remediation technology providers and environmental consultants. There are restrictions on the number of organisations we can contact, and as such you have been selected as one of the key players. You have the option for your company to be acknowledged in the final Defra report, which will be made widely available through the CL:AIRE dissemination network. Responses from each organisation will be amalgamated so that individual responses will remain anonymous. Q1. What techniques do you currently provide or have offered in the past, or have tendered and let contracts on (in the
UK)? Please mark those techniques in the table below with a cross (X). Please also indicate if you have used non-technical or “passive” options to protect a receptor by modifying its exposure.
Q2. How many times have you applied these techniques/methods in each of the past two years? Please enter the
number of projects. For landfill disposal, please include the projects where this was the only method AND those projects where it formed part of the remediation solution.
Q3. What are the typical broad range costs of using the techniques (e.g. £25-£55/m3)? It is understood that costs are
very site-specific, but that typical values can still be useful. Please use current (2010) values and provide a range for <5,000m3 of treated material (smaller site) and a range for >5,000m3 treated material (larger site). Cost estimates should not include desk study, site investigation, waste disposal, but should include mobilisation/demobilisation and monitoring.
Q4. What do you perceive as the key drivers for technique selection? Please select from the list of options, or provide
your own drivers. Q5. For each of the techniques you have listed in Question 1, what do you consider the main restrictions / hindrances to
their wider usage? You may also answer this question for techniques that you have not listed in Question 1, but may consider offering in future if certain restrictions are removed. Please choose from the list of options given or provide your own reasons.
Q6. Do you measure sustainability (social, environmental, economic) impacts? If so, please provide more details. Q7. What are your views on future advancements in technologies? Please provide your opinion if you think any
techniques will increase in use over the next year or two. And for any technique which is still under development, suggest what further work needs to be done to bring it into use and whether it brings any added benefits in terms of sustainability impacts.
Please add comments or notes if you wish to expand on or clarify any of your answers. I would be very grateful if you can respond to the questions and return them within three weeks - by Friday March 26th. If you have any queries please respond to this email ([email protected]) or call me on 0207 258 5321.
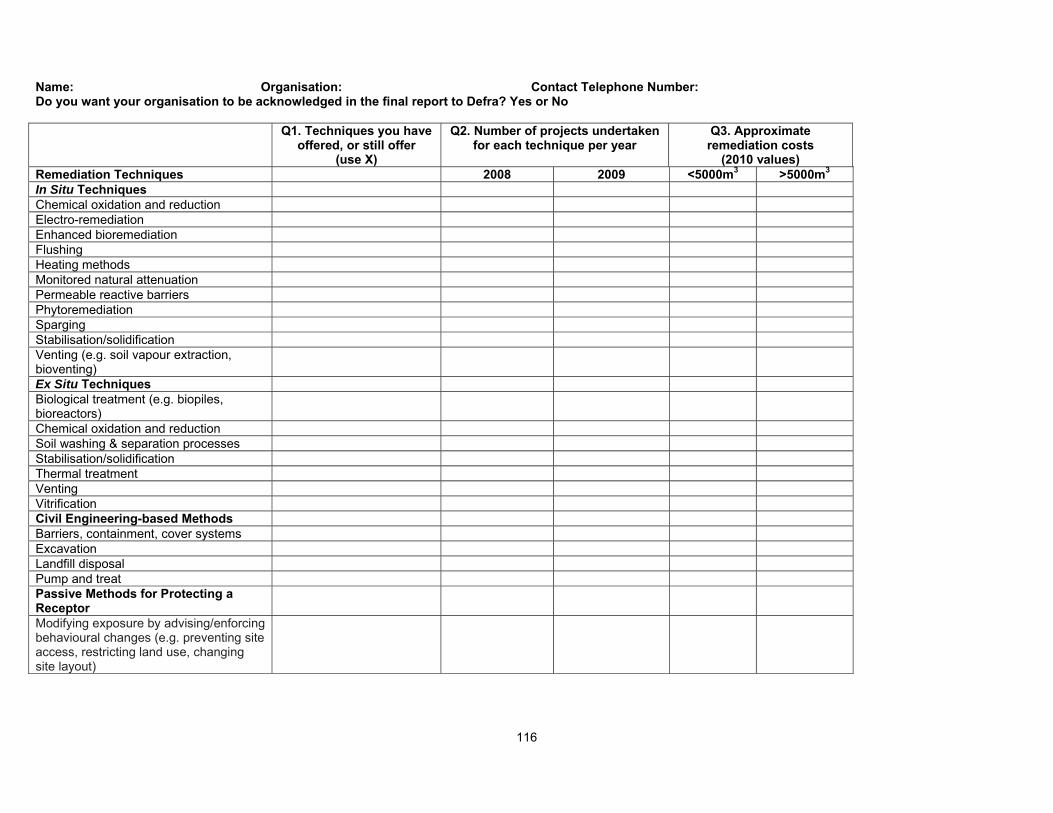
116
Name: Organisation: Contact Telephone Number: Do you want your organisation to be acknowledged in the final report to Defra? Yes or No
Q1. Techniques you have
offered, or still offer (use X)
Q2. Number of projects undertaken for each technique per year
Q3. Approximate remediation costs
(2010 values) Remediation Techniques 2008 2009 <5000m3 >5000m3
In Situ Techniques Chemical oxidation and reduction Electro-remediation Enhanced bioremediation Flushing Heating methods Monitored natural attenuation Permeable reactive barriers Phytoremediation Sparging Stabilisation/solidification Venting (e.g. soil vapour extraction, bioventing)
Ex Situ Techniques Biological treatment (e.g. biopiles, bioreactors)
Chemical oxidation and reduction Soil washing & separation processes Stabilisation/solidification Thermal treatment Venting Vitrification Civil Engineering-based Methods Barriers, containment, cover systems Excavation Landfill disposal Pump and treat Passive Methods for Protecting a Receptor
Modifying exposure by advising/enforcing behavioural changes (e.g. preventing site access, restricting land use, changing site layout)
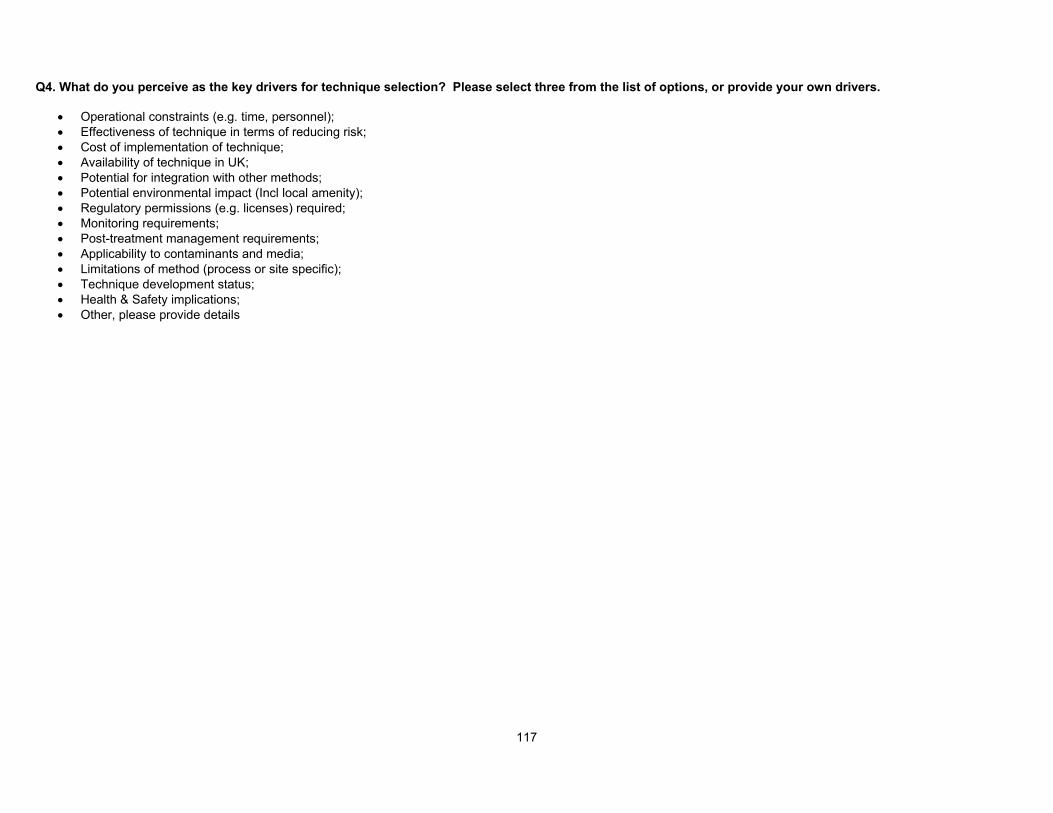
117
Q4. What do you perceive as the key drivers for technique selection? Please select three from the list of options, or provide your own drivers.
• Operational constraints (e.g. time, personnel); • Effectiveness of technique in terms of reducing risk; • Cost of implementation of technique; • Availability of technique in UK; • Potential for integration with other methods; • Potential environmental impact (Incl local amenity); • Regulatory permissions (e.g. licenses) required; • Monitoring requirements; • Post-treatment management requirements; • Applicability to contaminants and media; • Limitations of method (process or site specific); • Technique development status; • Health & Safety implications; • Other, please provide details
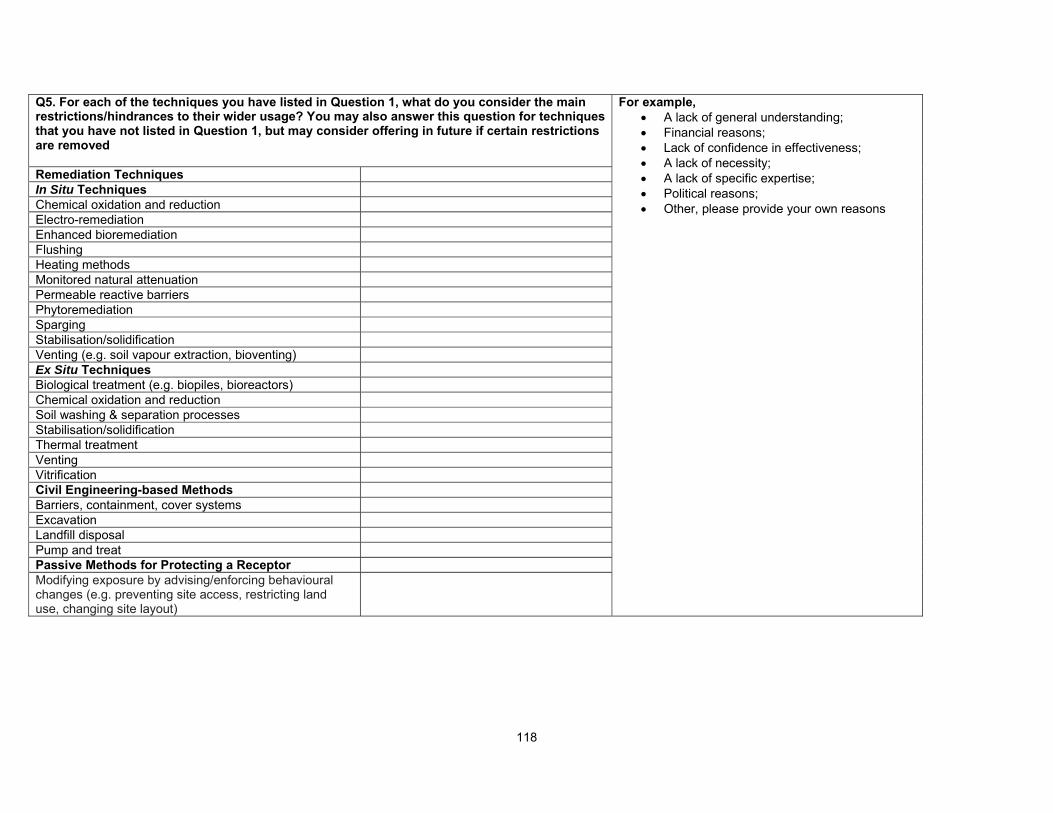
118
Q5. For each of the techniques you have listed in Question 1, what do you consider the main restrictions/hindrances to their wider usage? You may also answer this question for techniques that you have not listed in Question 1, but may consider offering in future if certain restrictions are removed
Remediation Techniques In Situ Techniques Chemical oxidation and reduction Electro-remediation Enhanced bioremediation Flushing Heating methods Monitored natural attenuation Permeable reactive barriers Phytoremediation Sparging Stabilisation/solidification Venting (e.g. soil vapour extraction, bioventing) Ex Situ Techniques Biological treatment (e.g. biopiles, bioreactors) Chemical oxidation and reduction Soil washing & separation processes Stabilisation/solidification Thermal treatment Venting Vitrification Civil Engineering-based Methods Barriers, containment, cover systems Excavation Landfill disposal Pump and treat Passive Methods for Protecting a Receptor Modifying exposure by advising/enforcing behavioural changes (e.g. preventing site access, restricting land use, changing site layout)
For example, • A lack of general understanding; • Financial reasons; • Lack of confidence in effectiveness; • A lack of necessity; • A lack of specific expertise; • Political reasons; • Other, please provide your own reasons
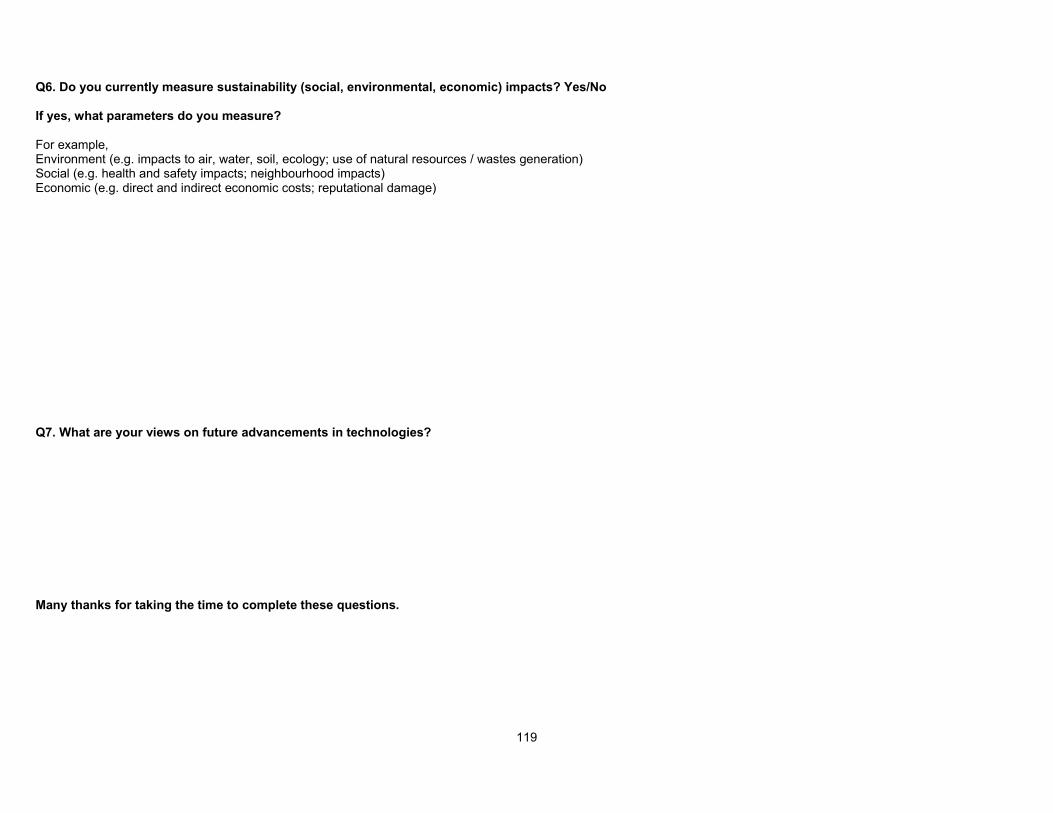
119
Q6. Do you currently measure sustainability (social, environmental, economic) impacts? Yes/No If yes, what parameters do you measure? For example, Environment (e.g. impacts to air, water, soil, ecology; use of natural resources / wastes generation) Social (e.g. health and safety impacts; neighbourhood impacts) Economic (e.g. direct and indirect economic costs; reputational damage) Q7. What are your views on future advancements in technologies? Many thanks for taking the time to complete these questions.
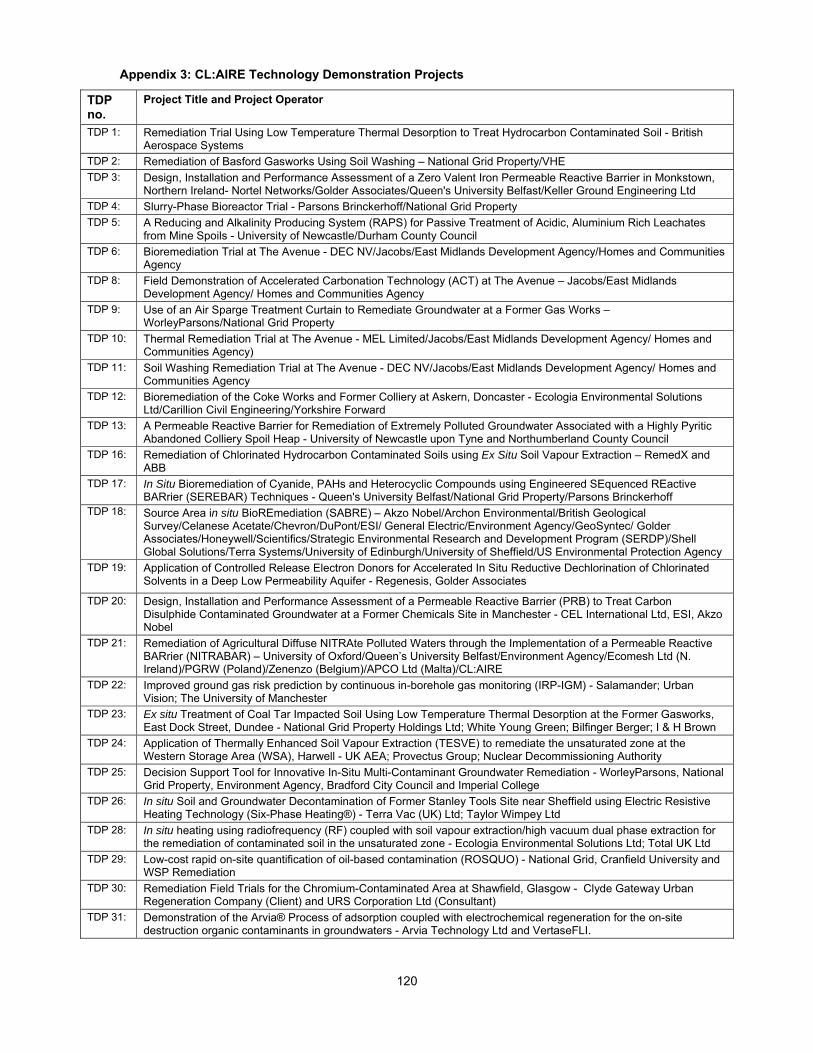
120
Appendix 3: CL:AIRE Technology Demonstration Projects
TDP no.
Project Title and Project Operator
TDP 1: Remediation Trial Using Low Temperature Thermal Desorption to Treat Hydrocarbon Contaminated Soil - British Aerospace Systems
TDP 2: Remediation of Basford Gasworks Using Soil Washing – National Grid Property/VHE TDP 3: Design, Installation and Performance Assessment of a Zero Valent Iron Permeable Reactive Barrier in Monkstown,
Northern Ireland- Nortel Networks/Golder Associates/Queen's University Belfast/Keller Ground Engineering Ltd TDP 4: Slurry-Phase Bioreactor Trial - Parsons Brinckerhoff/National Grid Property TDP 5: A Reducing and Alkalinity Producing System (RAPS) for Passive Treatment of Acidic, Aluminium Rich Leachates
from Mine Spoils - University of Newcastle/Durham County Council TDP 6: Bioremediation Trial at The Avenue - DEC NV/Jacobs/East Midlands Development Agency/Homes and Communities
Agency TDP 8: Field Demonstration of Accelerated Carbonation Technology (ACT) at The Avenue – Jacobs/East Midlands
Development Agency/ Homes and Communities Agency TDP 9: Use of an Air Sparge Treatment Curtain to Remediate Groundwater at a Former Gas Works –
WorleyParsons/National Grid Property TDP 10: Thermal Remediation Trial at The Avenue - MEL Limited/Jacobs/East Midlands Development Agency/ Homes and
Communities Agency) TDP 11: Soil Washing Remediation Trial at The Avenue - DEC NV/Jacobs/East Midlands Development Agency/ Homes and
Communities Agency TDP 12: Bioremediation of the Coke Works and Former Colliery at Askern, Doncaster - Ecologia Environmental Solutions
Ltd/Carillion Civil Engineering/Yorkshire Forward TDP 13: A Permeable Reactive Barrier for Remediation of Extremely Polluted Groundwater Associated with a Highly Pyritic
Abandoned Colliery Spoil Heap - University of Newcastle upon Tyne and Northumberland County Council TDP 16: Remediation of Chlorinated Hydrocarbon Contaminated Soils using Ex Situ Soil Vapour Extraction – RemedX and
ABB TDP 17: In Situ Bioremediation of Cyanide, PAHs and Heterocyclic Compounds using Engineered SEquenced REactive
BARrier (SEREBAR) Techniques - Queen's University Belfast/National Grid Property/Parsons Brinckerhoff TDP 18: Source Area in situ BioREmediation (SABRE) – Akzo Nobel/Archon Environmental/British Geological
Survey/Celanese Acetate/Chevron/DuPont/ESI/ General Electric/Environment Agency/GeoSyntec/ Golder Associates/Honeywell/Scientifics/Strategic Environmental Research and Development Program (SERDP)/Shell Global Solutions/Terra Systems/University of Edinburgh/University of Sheffield/US Environmental Protection Agency
TDP 19: Application of Controlled Release Electron Donors for Accelerated In Situ Reductive Dechlorination of Chlorinated Solvents in a Deep Low Permeability Aquifer - Regenesis, Golder Associates
TDP 20: Design, Installation and Performance Assessment of a Permeable Reactive Barrier (PRB) to Treat Carbon Disulphide Contaminated Groundwater at a Former Chemicals Site in Manchester - CEL International Ltd, ESI, Akzo Nobel
TDP 21:
Remediation of Agricultural Diffuse NITRAte Polluted Waters through the Implementation of a Permeable Reactive BARrier (NITRABAR) – University of Oxford/Queen’s University Belfast/Environment Agency/Ecomesh Ltd (N. Ireland)/PGRW (Poland)/Zenenzo (Belgium)/APCO Ltd (Malta)/CL:AIRE
TDP 22:
Improved ground gas risk prediction by continuous in-borehole gas monitoring (IRP-IGM) - Salamander; Urban Vision; The University of Manchester
TDP 23:
Ex situ Treatment of Coal Tar Impacted Soil Using Low Temperature Thermal Desorption at the Former Gasworks, East Dock Street, Dundee - National Grid Property Holdings Ltd; White Young Green; Bilfinger Berger; I & H Brown
TDP 24:
Application of Thermally Enhanced Soil Vapour Extraction (TESVE) to remediate the unsaturated zone at the Western Storage Area (WSA), Harwell - UK AEA; Provectus Group; Nuclear Decommissioning Authority
TDP 25:
Decision Support Tool for Innovative In-Situ Multi-Contaminant Groundwater Remediation - WorleyParsons, National Grid Property, Environment Agency, Bradford City Council and Imperial College
TDP 26:
In situ Soil and Groundwater Decontamination of Former Stanley Tools Site near Sheffield using Electric Resistive Heating Technology (Six-Phase Heating®) - Terra Vac (UK) Ltd; Taylor Wimpey Ltd
TDP 28: In situ heating using radiofrequency (RF) coupled with soil vapour extraction/high vacuum dual phase extraction for the remediation of contaminated soil in the unsaturated zone - Ecologia Environmental Solutions Ltd; Total UK Ltd
TDP 29: Low-cost rapid on-site quantification of oil-based contamination (ROSQUO) - National Grid, Cranfield University and WSP Remediation
TDP 30:
Remediation Field Trials for the Chromium-Contaminated Area at Shawfield, Glasgow - Clyde Gateway Urban Regeneration Company (Client) and URS Corporation Ltd (Consultant)
TDP 31: Demonstration of the Arvia® Process of adsorption coupled with electrochemical regeneration for the on-site destruction organic contaminants in groundwaters - Arvia Technology Ltd and VertaseFLI.