Embed Size (px)
Citation preview
Contamination levels and transferability of antimicrobial resistance by
Escherichia coli isolated from raw retail chicken meats in Nairobi,
Kenya.
Joyce Arua Odwar
A thesis submitted in partial fulfilment for the degree of Master of
Science in Medical Microbiology in the Jomo Kenyatta University of
Agriculture and Technology.
2015
ii
DECLARATION
This thesis is my original work and has not been presented for a degree in any other
University.
Signature: _____________________ Date: ___________________
Joyce Arua Odwar
This thesis has been submitted for examination with our approval as University
supervisors.
Signature: _____________________ Date: ___________________
Prof. Samuel Kariuki
KEMRI, Kenya.
Signature: _____________________ Date: ___________________
Dr. Gideon Kikuvi
JKUAT, Kenya.
iii
DEDICATION
I would like to dedicate this thesis to my husband, my dearest parents Mr. and Mrs.
George Odwar and my two siblings who mean the world to me. Their unconditional
love, encouragement, patience and support motivated me to complete my project
through difficult and challenging times.
iv
ACKNOWLEDGMENTS
While it is not possible to allocate to each one the credit that is due to them, the
following deserve special attention for making it possible for me to carry out the project
smoothly and complete it successfully; Above all I acknowledge and give glory to the
Almighty God, the giver of life, health, intellect, wisdom and strength. Special gratitude
goes to my supervisors Prof. Samuel Kariuki and Dr. Gideon Kikuvi for their words of
advice, encouragement and dedicating their time to direct me compile my thesis. To Dr.
John Kiiru who assisted by providing his expertise in the field. To all laboratory staff
who tirelessly assisted me with my work both directly and indirectly. To Mr. Kariuki
Ngummo who sacrificed his time and resources in assisting me in my data analysis.
v
TABLE OF CONTENTS
DECLARATION ........................................................................................................ II
DEDICATION .......................................................................................................... III
ACKNOWLEDGMENTS ........................................................................................ IV
LIST OF TABLES .................................................................................................... IX
LIST OF FIGURES .................................................................................................... X
LIST OF PLATES .................................................................................................... XI
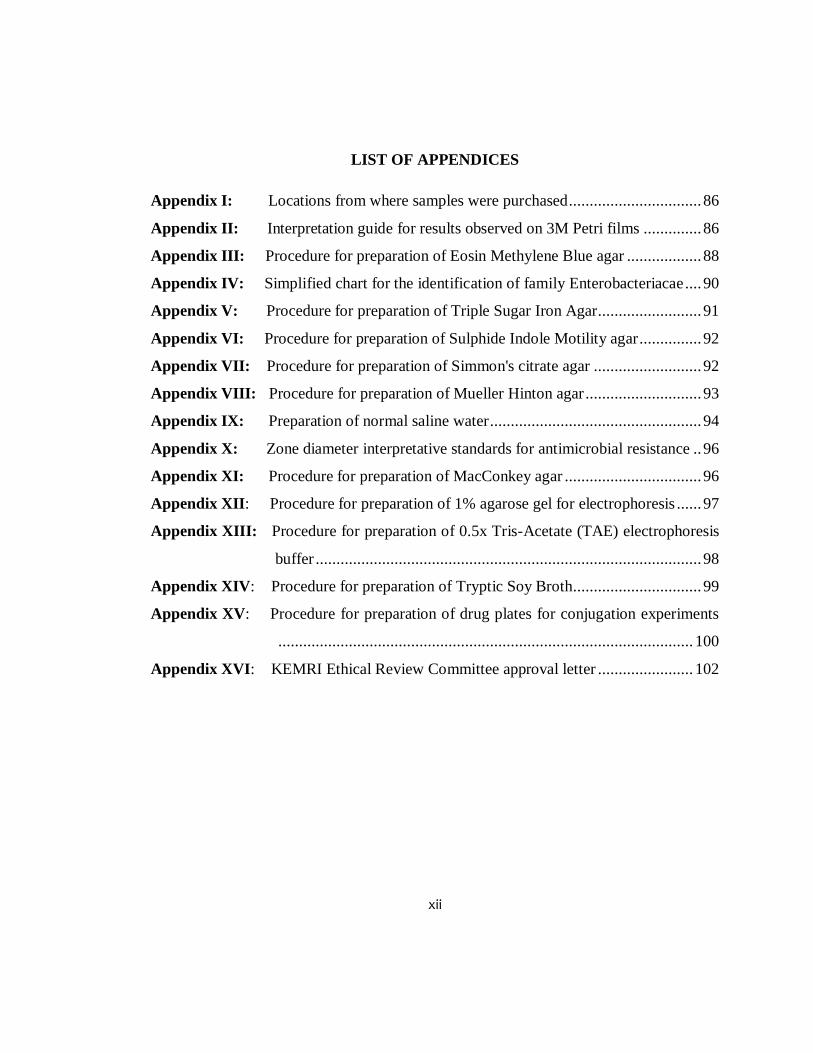
LIST OF APPENDICES .......................................................................................... XII
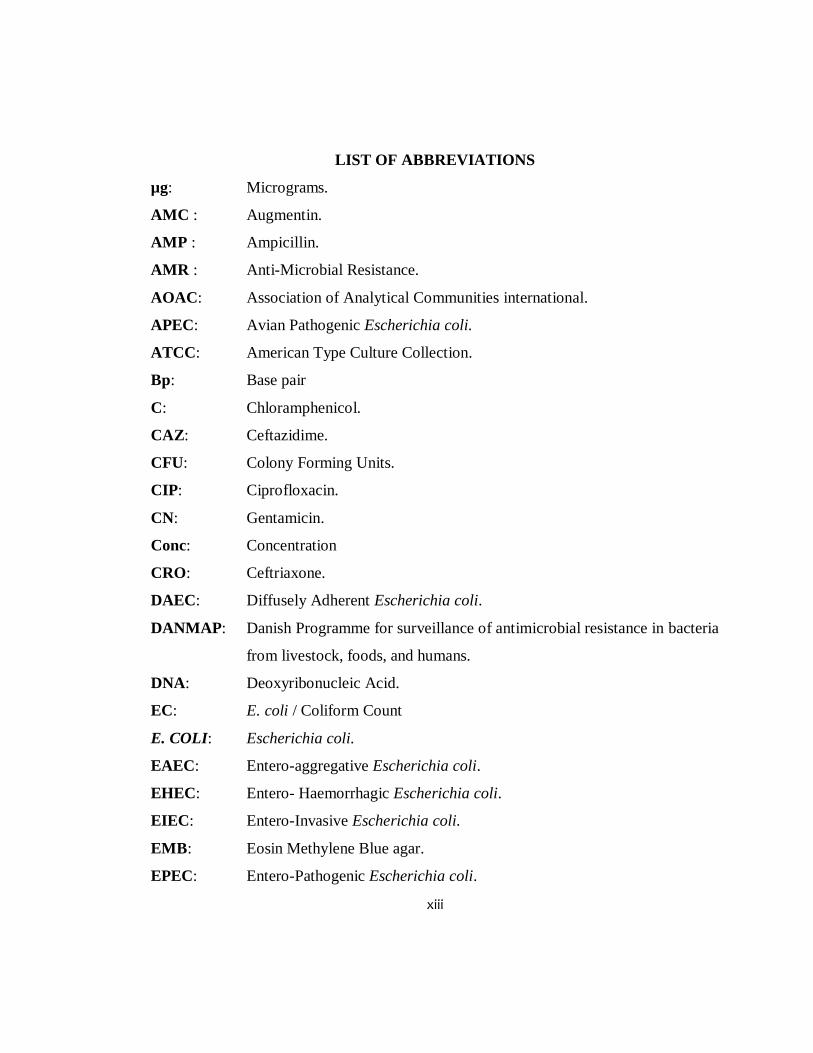
LIST OF ABBREVIATIONS .................................................................................XIII
ABSTRACT ............................................................................................................ XVI
CHAPTER ONE .......................................................................................................... 1
1.0 INTRODUCTION ................................................................................................ 1
1.1 Background information ..................................................................................... 1
1.2 Statement of the problem .................................................................................... 3
1.3 Justification of the study ..................................................................................... 3
1.4 Research questions ............................................................................................. 4
1.5 Objectives........................................................................................................... 5
1.5.1 General objective ......................................................................................... 5
1.5.2 Specific objectives ....................................................................................... 5
CHAPTER TWO ......................................................................................................... 6
2.0 LITERATURE REVIEW .................................................................................... 6
2.1 Poultry production ............................................................................................... 6
vi
2.1.1 Global poultry production ............................................................................ 6
2.1.2 Poultry production and consumption in Kenya ............................................. 6
2.2 Biology of E. coli ............................................................................................... 7
2.2.1 Role of E. coli in causing disease ................................................................. 8
2.2.2 Sources of contamination by E. coli in chicken meat .................................... 9
2.2.3 Laboratory diagnosis and treatment of E. coli infection .............................. 10
2.2.4 Prevention of E. coli contamination in food ................................................ 11
2.3 Antimicrobial consumption in food producing animals ..................................... 12
2.3.1 Global scenario of antimicrobial consumption in food producing animals .. 12
2.3.2 The effects of antibiotics use in food animals on human health ................... 13
2.4 Antimicrobial resistance ................................................................................... 15
2.4.1 Food animals as a source of Antimicrobial resistance ................................. 15
2.4.2 Antimicrobial resistance in E. coli isolated from poultry............................. 16
2.4.3 Transfer of Antibiotic resistance ................................................................. 18
CHAPTER THREE ................................................................................................... 20
3.0 MATERIALS AND METHODS ....................................................................... 20
3.1 Study design ...................................................................................................... 20
3.2 Study site .......................................................................................................... 20
3.3 Study samples ................................................................................................... 22
3.4 Sample size calculation ..................................................................................... 22
3.5 Sampling procedure .......................................................................................... 22
3.6 Laboratory Procedures ...................................................................................... 23
3.6.1 Enumeration of E. coli and total coliform bacteria from retail chicken meat 23
3.6.2 Isolation and presumptive identification of E. coli ...................................... 24
3.6.3 Confirmative identification of E. coli ......................................................... 24
3.6.4 Antimicrobial Susceptibility testing ............................................................ 25
vii
3.6.5 Template DNA preparation ........................................................................ 26
3.6.6 Primers and PCR amplification .................................................................. 27
3.6.7 Agarose gel electrophoresis ........................................................................ 28
3.6.8 Bacterial in-vitro conjugation tests ............................................................. 29
3.6.9 Plasmid DNA extraction............................................................................. 30
3.7 Data management and analysis ......................................................................... 31
3.8 Ethical considerations ....................................................................................... 31
CHAPTER FOUR...................................................................................................... 32
4.0 RESULTS ........................................................................................................... 32
4.1 Contamination rate and microbial count determined from the raw retail chicken 32
4.2 Prevalence of antimicrobial resistance among E. coli isolates............................ 35
4.3 Antibiotic resistance profiles among E. coli isolates. ......................................... 35
4.4 Distribution of antimicrobial resistance in E. coli from chicken meat from the 5
classes of retail outlets .............................................................................................. 36
4.5 Prevalence of E. coli isolates with virulence genes ............................................ 37
4.6 Prevalence of antimicrobial resistance among virulent and non-virulent E. coli. 40
4.7 Conjugative transfer of resistance from resistant E. coli to non-resistant recipient
................................................................................................................................. 42
4.8 Plasmid DNA profiles in Donors and Trans-conjugants .................................... 43
CHAPTER FIVE ....................................................................................................... 45
5.0 DISCUSSION ..................................................................................................... 45
5.1 Contamination levels in raw retail chicken by E. coli and E. coli/coliform count45
5.2 Prevalence of antimicrobial resistant E. coli isolated from raw retail chicken .... 51
5.4 Association between antimicrobial resistance and retail outlet classification ..... 54
viii
5.5 E. coli isolates harbouring virulence markers .................................................... 55
5.6 Association between antibiotic resistance and virulence genes in E. coli isolated
................................................................................................................................. 56
5.7 Co-transfer of antimicrobial resistance .............................................................. 59
5.8 CONCLUSIONS .............................................................................................. 62
5.9 RECOMMENDATIONS ................................................................................. 62
5.10 LIMITATIONS OF THE STUDY ................................................................... 64
REFERENCES .......................................................................................................... 65
ix
LIST OF TABLES
Table 3-1: Control strains of diarrheagenic E. coli .................................................. 27
Table 4-1: Comparison of mean microbial counts among the 5 groups of retail
outlets ................................................................................................... 35
Table 4-2: Antibiotic susceptibility profiles among E. coli isolates in retail chicken
meats........................................................................................................36
Table 4-3: Relationship between retail outlet classification and antibiotic resistance
............................................................................................................. 37
Table 4-4: Classification of pathogenic E. coli isolated from raw retail chicken meats
............................................................................................................. 38
Table 4-5: Relationship between virulence of E. coli isolated and antimicrobial
resistance .............................................................................................. 40
Table 4-6: Antibiotic resistance profiles exhibited by E. coli donors and trans-
conjugants ............................................................................................ 43
x
LIST OF FIGURES
Figure 3-1: Map of Nairobi showing the administrative divisions and locations .. 21
Figure 4-1: Box plot representing distribution of E. coli count among the 5
classifications of retail outlets ........................................................ 33
Figure 4-2: Box plot representing distribution of coliform count among the 5
classifications of retail outlets........................................................... 34
Figure 4-3: Drug resistance phenotypes identified in pathogenic and non-
pathogenic E. coli isolated from raw retail chicken ........................... 41
xi
LIST OF PLATES
Plate 4-1: Gel photograph showing bands representing virulence genes for some
diarrheagenic E. coli ............................................................................. 39
Plate 4-2: Electro-phoretic plasmid profiles of representative donors and trans-
conjugants ............................................................................................ 44
xii
LIST OF APPENDICES
Appendix I: Locations from where samples were purchased ................................ 86
Appendix II: Interpretation guide for results observed on 3M Petri films .............. 86
Appendix III: Procedure for preparation of Eosin Methylene Blue agar .................. 88
Appendix IV: Simplified chart for the identification of family Enterobacteriacae .... 90
Appendix V: Procedure for preparation of Triple Sugar Iron Agar......................... 91
Appendix VI: Procedure for preparation of Sulphide Indole Motility agar ............... 92
Appendix VII: Procedure for preparation of Simmon's citrate agar .......................... 92
Appendix VIII: Procedure for preparation of Mueller Hinton agar ............................ 93
Appendix IX: Preparation of normal saline water ................................................... 94
Appendix X: Zone diameter interpretative standards for antimicrobial resistance .. 96
Appendix XI: Procedure for preparation of MacConkey agar ................................. 96
Appendix XII: Procedure for preparation of 1% agarose gel for electrophoresis ...... 97
Appendix XIII: Procedure for preparation of 0.5x Tris-Acetate (TAE) electrophoresis
buffer ............................................................................................. 98
Appendix XIV: Procedure for preparation of Tryptic Soy Broth ............................... 99
Appendix XV: Procedure for preparation of drug plates for conjugation experiments
.................................................................................................... 100
Appendix XVI: KEMRI Ethical Review Committee approval letter ....................... 102
xiii
LIST OF ABBREVIATIONS
µg: Micrograms.
AMC : Augmentin.
AMP : Ampicillin.
AMR : Anti-Microbial Resistance.
AOAC: Association of Analytical Communities international.
APEC: Avian Pathogenic Escherichia coli.
ATCC: American Type Culture Collection.
Bp: Base pair
C: Chloramphenicol.
CAZ: Ceftazidime.
CFU: Colony Forming Units.
CIP: Ciprofloxacin.
CN: Gentamicin.
Conc: Concentration
CRO: Ceftriaxone.
DAEC: Diffusely Adherent Escherichia coli.
DANMAP: Danish Programme for surveillance of antimicrobial resistance in bacteria
from livestock, foods, and humans.
DNA: Deoxyribonucleic Acid.
EC: E. coli / Coliform Count
E. COLI: Escherichia coli.
EAEC: Entero-aggregative Escherichia coli.
EHEC: Entero- Haemorrhagic Escherichia coli.
EIEC: Entero-Invasive Escherichia coli.
EMB: Eosin Methylene Blue agar.
EPEC: Entero-Pathogenic Escherichia coli.
xiv
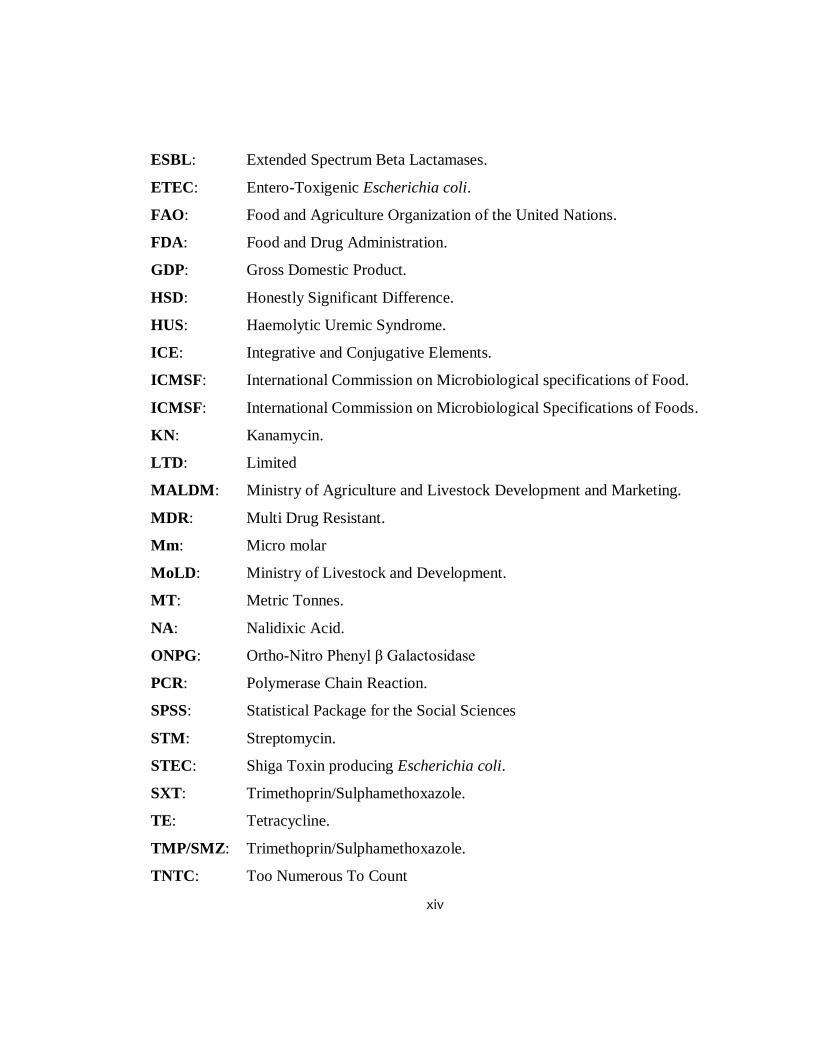
ESBL: Extended Spectrum Beta Lactamases.
ETEC: Entero-Toxigenic Escherichia coli.
FAO: Food and Agriculture Organization of the United Nations.
FDA: Food and Drug Administration.
GDP: Gross Domestic Product.
HSD: Honestly Significant Difference.
HUS: Haemolytic Uremic Syndrome.
ICE: Integrative and Conjugative Elements.
ICMSF: International Commission on Microbiological specifications of Food.
ICMSF: International Commission on Microbiological Specifications of Foods.
KN: Kanamycin.
LTD: Limited
MALDM: Ministry of Agriculture and Livestock Development and Marketing.
MDR: Multi Drug Resistant.
Mm: Micro molar
MoLD: Ministry of Livestock and Development.
MT: Metric Tonnes.
NA: Nalidixic Acid.
ONPG: Ortho-Nitro Phenyl β Galactosidase
PCR: Polymerase Chain Reaction.
SPSS: Statistical Package for the Social Sciences
STM: Streptomycin.
STEC: Shiga Toxin producing Escherichia coli.
SXT: Trimethoprin/Sulphamethoxazole.
TE: Tetracycline.
TMP/SMZ: Trimethoprin/Sulphamethoxazole.
TNTC: Too Numerous To Count
xv
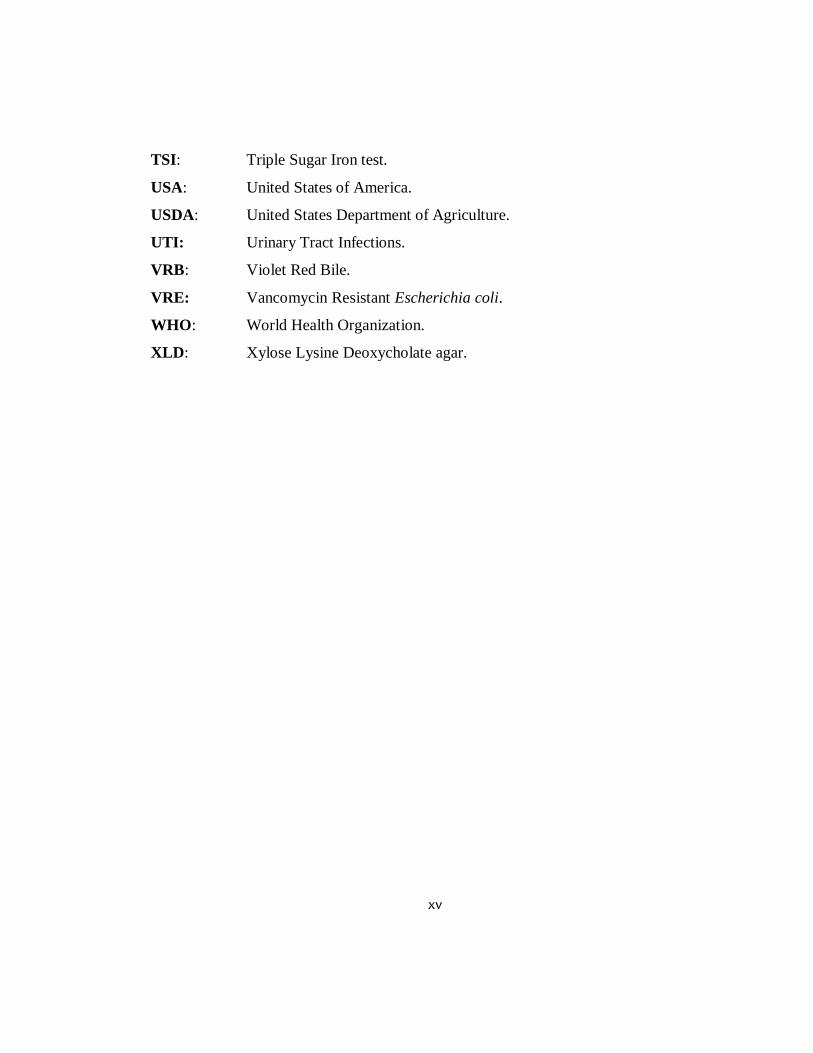
TSI: Triple Sugar Iron test.
USA: United States of America.
USDA: United States Department of Agriculture.
UTI: Urinary Tract Infections.
VRB: Violet Red Bile.
VRE: Vancomycin Resistant Escherichia coli.
WHO: World Health Organization.
XLD: Xylose Lysine Deoxycholate agar.
xvi
ABSTRACT
Chicken is a rich source of meat protein and is increasingly being consumed in urban
Kenya. However, under poor hygienic conditions, raw chicken meat can be an efficient
medium for the spread of infectious agents including bacteria such as Escherichia coli
and other coliforms which indicate the potential presence of other pathogenic bacteria.
In addition, bacterial contaminants in the meat may contain antimicrobial resistance
genes that can be transferred to other bacteria and to the human population resulting in
food borne infections with multidrug resistant pathogens. This study assessed the
microbiological quality and safety of consumption of raw retail chicken meats sold in
Nairobi, Kenya. Focus was laid on determining the E. coli/Coliform contamination
levels, the antimicrobial resistance profiles and virulence of the E. coli isolates. A cross
sectional study design was used. Sample collection was done from August 2011 to
February 2012. Two hundred raw chicken meat samples were randomly purchased from
across five different classes of meat outlets around Nairobi city, namely; high income
area butcheries, high-middle income area butcheries, low income area butcheries, low-
middle income area butcheries and supermarkets. Enumeration of E. coli and coliform
bacteria was done using 3M petrifilm E. coli/Coliform count plates. Isolation and
identification of E. coli was done by standard cultural and biochemical testing. Isolated
E. coli were subjected to antimicrobial susceptibility testing using 12 commonly
prescribed antimicrobials by means of Kirby Bauer disc diffusion method. Susceptibility
data was interpreted according to criteria set by the Clinical and Laboratory Standards
Institute (2012). Polymerase chain reaction assays were used to determine presence of
virulence genes in the isolated E. coli. Isolates resistant to 3 or more antibiotics were
subjected to in-vitro conjugation and plasmid DNA content analysis to test for
transferability of resistance genes. Graphs and tables were used for data presentation and
statistical tests were done by means of Statistical Package for Social Sciences (SPSS).
xvii
The overall E. coli contamination rate was 78% while coliform contamination rate was
97%. The average E. coli and coliform counts for all samples were above the acceptable
microbial count limit (>100 cfu/ml). There was a significant difference in the E.
coli/coliform counts (p< 0.001) among the 5 classifications of retail outlets. Samples
from supermarkets had lower E. coli and coliform counts compared to the rest. Seventy
five per cent of the isolates exhibited resistance to at least one of the 12 antibiotics
tested. Resistance to tetracycline was the highest at 60.3%. E. coli isolates that tested
positive for the presence of at least one of 10 virulence genes tested were 40.4 %. Fifty
five percent of the isolates successfully transferred resistance by conjugation and
together with 17 trans-conjugants, all contained plasmids of molecular weights varying
between 3.0-53.7Kb. In conclusion, our data showed high levels of contamination in raw
retail chicken meat by E. coli and other coliform bacteria in various retail outlets in
Nairobi, Kenya. Raw chicken meat was observed to carry virulent strains of E. coli with
ability to transfer their resistance via conjugation to other bacteria. Prevalence of
antimicrobial resistance among the E. coli isolates was considerably high especially for
commonly available antimicrobials such as tetracycline. These data will be useful for
risk assessment and risk management for implementation of an effective food safety
management system in Nairobi, Kenya.
1
CHAPTER ONE
INTRODUCTION
1.1 Background information
Ensuring safe food supply has been one of the major challenges and concerns for
producers, consumers and public health officials in both developing and developed
countries. This is because foods excessively contaminated with pathogenic and spoilage
micro-organism are undesirable and can cause food borne illnesses (Lindqvist et al.,
2000; Su et al., 2005; Lynch et al., 2006). Such illnesses cost billions of dollars in
medical care and sometimes even result to death (Fratamico, Bhunia & Smith, 2005).
Several epidemiological reports have implicated foods from animal origin as major
vehicles associated with illnesses caused by food borne pathogens (Busani et al., 2006;
Petersen & James, 1998; Todd, 1997).
Coliform bacteria, especially fecal coliforms, are good microbial indicators of the
potential presence of disease causing bacteria and also show the general sanitary quality
of the food. Food contamination with E. coli is closely associated with fecal
contamination. This is because E. coli are the most prevalent commensal enteric bacteria
in animals and humans and are also important zoonotic agents that can be implicated in
animal and human infectious diseases (Costa et al., 2008).
Raw or undercooked chicken meat is particularly prone to contamination. The
microbiological quality of chicken meat as purchased by consumers depends mostly on;
the slaughter process, sanitation during processing and packaging, maintenance of
adequate cold chain storage from the processing to the retail level and to the consumer
and finally sanitation during handling at the retail end (Belluck, 1997; Borche &
Arinder, 2002; Andrea, 2012). Chicken meat can also act as a reservoir of drug resistant
bacteria since the use of antimicrobial agents throughout the food chain contributes to
2
growth of resistant E. coli (Apata, 2009). Antimicrobial resistance among E. coli in food
animals such as chicken is of increasing concern due to the potential for transfer of these
resistant pathogens to the human population (Ojeniyi, 1998; Obrien, 2002; Angulo et al.,
2004; Molbak, 2004).
In urban areas such as Nairobi, marketing of chicken products is generally undertaken in
retail outlets such as supermarkets, local butcheries located in different geo-socio-
economic status and even from street vendors in some low income settings. Public
health research in the United States of America focusing on food qualities demonstrated
that stores in low socio-economic status populations, because of a higher prevalence of
food safety violations, were shown to be consistently exposed to food that is of lower
microbial quality. Because of this access pattern, such populations are placed at
increased risk of food-borne illnesses [Algert et al., 2006; Moore & Diez-Roux, 2006].
In Kenya, there is a paucity of data on coliform contamination and antimicrobial
resistant E. coli in raw retail chicken supplied to retail outlets in the city. Studies related
to antimicrobial resistant E. coli have been done on isolates from farm animals and
chicken carcass samples from slaughter (Kikuvi et al., 2006) but not from raw retail
chicken which is made available to consumers. Furthermore, limited studies are
available on the contamination levels in chicken meat available to populations living in
different socio-economic status yet, these data are essential for performing risk
assessment and risk management for food safety. This study reports on the
microbiological quality and safety of chicken meat available to populations who
purchase from different retail outlets (supermarkets, retail outlets in high income areas,
retail outlets in middle income areas and retail outlets in low income areas) in the city of
Nairobi.
3
1.2 Statement of the problem
Raw retail chicken meat presents an ideal substrate supporting the growth of bacteria
pathogenic to humans such as E. coli. When consumed, these contaminated meats
constitute a major source of food-borne illnesses in humans. Chicken meat can also act
as a reservoir of drug resistant bacteria. Antimicrobial resistance among E. coli in food
animals such as chicken is of increasing global concern due to the potential for transfer
of these resistant pathogens to the human population. This has been documented and
could pose a threat to public health (O‟Brien, 2002; Angulo et al., 2004; Molbak, 2004).
Because of their resistance to commonly used antimicrobial agents, these bacteria may
cause infections for which limited therapeutic options are available. This results in use
of alternative, more expensive and less readily available antibiotics. Furthermore,
commensal E. coli of animal origin may act as a donor of antimicrobial resistance genes
for other pathogenic bacteria.
1.3 Justification of the study
Chicken is fast rising to be a popular meat in Kenya. According to the Ministry of
Livestock and Fisheries Development (MoLFD) Annual Report, 75% of rural families in
Kenya keep chicken for trade and food security and therefore impact significantly on
national food security. For instance, an estimated 14,021,399 chicken were slaughtered
for consumption in only 1 year (Nyaga, 2008). Food safety is of utmost importance to all
stakeholders including livestock producers, animal health experts, the medical
community, consumers, regulatory agencies, the government and the food industry.
E. coli are the most prevalent commensal enteric bacteria in animals across species and
humans and are also important zoonotic agents which can be implicated in animal and
human infectious diseases (Costa et al., 2008). For this reason, they are considered
significant in causing a variety of food-borne illnesses in humans. Furthermore, the level
of antibiotic resistance in commensal E. coli is considered to be a good indicator of the
4
selection pressure exerted by antibiotic use and also for the resistance problems to be
expected in other pathogenic bacteria in humans (Van den Bogaard and Stobberingh,
2000).
Contamination of retail chicken meat by bacteria such as E. coli can occur at slaughter,
during packaging, during transportation to retail meat outlets, hotels and supermarkets or
via butcher‟s hands and contaminated surfaces at these various retail outlets before
distribution to consumers. If the problem is not checked, these resistant E. coli may
colonize the human intestinal tract and may contribute resistant genes to human
endogenous flora as well as other pathogenic micro-organisms thus causing infections
with limited therapeutic options. It was critical therefore, to carry out a science based
assessment of the risk to consumers arising from exposure to retail chicken meat with E.
coli and other coliform bacteria that apart from causing food borne illnesses can also
contribute to the antimicrobial resistance load that already exists.
In Kenya, very few prevalence and resistance surveillance studies with limited number
of E. coli isolates from chicken have been published (Kariuki et al., 2013). There is
limited information showing contamination rate by coliforms and E. coli and their
antimicrobial resistance profiles in retail chicken meat made available to consumers. Yet
these data are essential for performing risk assessment and risk management. This study
was therefore important as the results will constitute a source of information for hazard
assessment during application of food safety management system in Kenya to reduce the
risk of transmission of coliforms and antimicrobial resistant E. coli.
1.4 Research questions
1. What are the levels of E. coli and other coliform contamination in raw chicken meat
purchased in meat outlets in Nairobi, Kenya?
5
2. What are the antimicrobial resistance patterns of E. coli isolated from raw chicken
meat purchased in meat outlets in Nairobi, Kenya?
3. Does E. coli isolated from raw chicken meat purchased in meat outlets in Nairobi,
Kenya have virulent genes?
4. Does resistant E. coli isolated from raw chicken meat purchased in meat outlets in
Nairobi, Kenya have the ability to transfer resistance genes to other bacteria by
means of plasmids?
1.5 Objectives
1.5.1 General objective
To determine the E. coli/coliform contamination levels, antimicrobial susceptibility
patterns, presence of virulence genes and ability to transfer resistance genes through
plasmids by E. coli isolated from raw chicken meat in selected retail outlets in Nairobi,
Kenya.
1.5.2 Specific objectives
1. To determine the contamination levels by E. coli and other coliform bacteria in raw
retail chicken meats from selected outlets in Nairobi, Kenya.
2. To determine the antimicrobial susceptibility patterns of E. coli isolated from raw
retail chicken meats in Nairobi, Kenya.
3. To detect the presence of virulence genes in E. coli isolated from raw retail chicken
meats in Nairobi, Kenya.
4. To determine the transferability of antimicrobial resistance genes and presence of
plasmids from the isolated resistant E. coli to other bacteria.
6
CHAPTER TWO
LITERATURE REVIEW
2.1 Poultry production
2.1.1 Global poultry production
Since the 1960s, the global production of poultry meat has been growing faster than that
of any other meat in both developed and developing countries (Chang, 2004). This
growth pattern was expected to continue because of the inherent efficiency in feed
conversion and the lower production costs associated with intensive poultry production
(Taha, 2003). Globally, production of poultry meat approached 70 million metric tons in
2000 with an average annual growth rate of 5.3% during the previous four decades.
Worldwide, chicken continues to be the most popular poultry meat, representing about
85% of the total poultry meat output with the US leading the world in chicken
production of 14 million metric tons (Bilgili, 1999). World poultry meat production in
developing countries has exceeded that of developed countries during the last decade,
with a per annum expansion rate of 7.4% during the last four decades. Broiler meat is
popular because it is cheaper, more versatile, and is perceived to give more health
benefits than red meat (Shane, 2004).
2.1.2 Poultry production and consumption in Kenya
In Kenya the poultry population is estimated to be about 25-30 million, 80% of which
comprises local chicken and the rest, improved breeds. With the ever-increasing prices
of red meat, local chicken has become the main source of animal protein in the form of
meat and eggs for both the urban and rural population (International research network,
2005). According to figures by the Ministry of Agriculture, livestock, development and
marketing (MALDM), Rift valley province has the highest population of poultry with an
7
estimated poultry population of 6.4 million while North eastern has the least population
of poultry estimated at 143,500 (MALDM, 2005/2006).
Traditionally, poultry plays an important role in Kenya. The chickens have been and still
are a major source of protein in the form of eggs and meat. In addition, poultry
production improves nutrition of the rural people and provides income to the families.
Nationally, the poultry industry contributes to the Gross Domestic Product (GDP). Of
the 25% annual GDP, 4% is from poultry sub-sector. The industry also contributes to
wealth generation in the country. It is estimated that poultry along with other sub-sectors
contribute 43% of the total labour force in the agricultural sector (Kingori et al., 2010).
Increasing human population in the pastoral areas has led to a decline in grazing land,
resource degradation and an overall drop in livestock holdings per household
(Lesorogol, 1998). This has led to a dependence on poultry farming in pastoral areas as
well since chicken production is a landless enterprise and can provide the much-needed
source of protein for the vulnerable groups in pastoral households and at the same time
generate income from sale of surplus birds and eggs (Tuitoek et al., 1998). Local poultry
farmers are now adding value to their chicken by doing some processing and packaging.
It is now possible to find local chicken packaged and labelled in some leading
supermarkets in Nairobi. This has improved the prices by about 50% (Kingori et al.,
2010). Therefore chicken consumption is high in the country.
2.2 Biology of E. coli
E. coli is a member of the large bacterial family, Enterobacteriacae. It is a Gram-
negative, non-spore forming, rod-shaped micro-organism that is often motile by means
of flagella or may be non-motile, and can grow with or without oxygen. It is catalase
positive, oxidase negative, fermentative, reduces nitrate to nitrite and is β-galactosidase
positive. Approximately 95 % of E. coli strains are Indole and methyl red positive, but
8
are Voges-Proskauer and citrate negative. It is characterized by; lactose fermentation
with gas production and Indole production from tryptophan when incubated for 48 ± 2
hours at 44°C to separate E. coli from other organisms of the faecal coliform group
(Todar, 2005; Fratamico and Smith, 2006).
E. coli inhabits the intestinal tract of humans and animals and most of the strains live as
commensal organisms where they are harmless to hosts and are useful for producing
sources of „B‟ and „K‟ vitamins. They are also found inhabiting the environment, water
and food. E. coli are classified as coliform bacteria. The presence of E. coli in food or
water is an indication of faecal contamination due to uncleanliness and careless
handling. It also implies that other enteric pathogens may be present (Fratamico and
Smith, 2006). E. coli is sero-typed on the basis of the somatic (O), flagella (H) and
capsular (K) antigens. More than 170 different O antigen sero-groups are currently
recognized. The combination of O and H antigens define sero-types of an isolate. For
example E. coli O157:H7 is a sero-type of a virulent strain of E. coli associated with
haemorrhagic colitis and haemolytic uremic syndrome (HUS) (Washington et al., 2006).
2.2.1 Role of E. coli in causing disease
Although existing mostly as commensals, E. coli can become pathogenic upon
acquisition of virulence attributes, such as entero-toxins and adhesion or invasion factors
(Garcia, 2002) and result in enteric/diarrheal disease, urinary tract infection, and
sepsis/meningitis (Hammerum and Heuer, 2009). Until the 1950‟s the organism was
more or less regarded as a normal non-pathogenic cohabitant of the enteric tract of
warm-blooded animals and humans (Wasteson, 2001).
However, during the last few decades, a tremendous amount of research has established
E. coli among the important etiological agents of enteritis and several extra intestinal
diseases such as uro-genital infections, wound infections, mastitis, septicaemia, Gram
9
negative pneumonia and meningitis (Coia, 1998). The E. coli strains causing extra
intestinal infections have been collectively called extra-intestinal pathogenic E. coli
(ExPEC). These include two major pathotypes; uro-pathogenic E. coli (UPEC) and
neonatal meningitis E. coli (NMEC) (Rodriguez –Siek et al., 2005).
At-least six classes of diarrheagenic E. coli are known based on specific virulent factors
and phenotypic traits. These include; Entero-Toxigenic E. coli (ETEC), Entero-Invasive
E. coli (EIEC), Entero-Haemorrhagic E. coli (EHEC) also known as Shigella Toxin
producing E. coli (STEC), Entero-Pathogenic E. coli (EPEC), Entero-Aggregative E.
coli (EAEC) and Diffusely Adherent E. coli (DAEC) (Nataro and Kaper, 1998;
Washington et al., 2006). ETEC are an important cause of diarrhoea in infants and
travellers in under-developed countries or regions of poor sanitation. EIEC closely
resemble Shigella in their pathogenic mechanisms and the clinical syndrome is identical
to Shigella dysentery and includes dysentery-like diarrhoea with fever. EHEC are
represented by the strain O157:H7, which causes a diarrheal syndrome that shows a
copious bloody discharge with no fever. EPEC induce watery diarrhoea similar to ETEC
and it usually occurs in infants. EAEC resemble ETEC strains in that the bacteria adhere
to the intestinal mucosa and cause non-bloody diarrhoea without invading or causing
inflammation.
2.2.2 Sources of contamination by E. coli in chicken meat
In living animals the muscles are virtually sterile but other parts of the animal like the
skin or gut contains an enormous amount of bacteria. Among them there is a large
number of E. coli which are often excreted or shed in the environment (Brill, 2007).
They can survive and replicate outside its host environment i.e. in water, soil, sediments,
sand and algae (Byappanhalli et al., 2003; Anderson et al., 2005). Contamination of
meat can occur during carcass processing if the rumen is accidentally cut. In the case of
poultry, the intestine may rupture when the carcass is gutted during processing, releasing
10
its contents into the thoracic and abdominal cavities (Woolcock, 1991). The gut contents
of chickens, especially of the caeca, are considered to be peak environments for bacterial
colonisation.
Depending on the slaughter hygiene a smaller or higher number of the bacteria can be
found in meat during the slaughterhouse operations in particular during skinning,
scalding, evisceration, dressing, transport or meat cutting. Contaminated retail meat can
also be a result of unhygienic conditions via butchers‟ hands, tools, contact with the
equipment and/or through water or air (Belluck, 1997; Moldlab, 2003). Bacterial
contamination in meat is quite normal and not totally avoidable. However, the policy is
to keep the amount of bacteria as low as possible. Since E. coli is as an indicator for
sanitary quality, the organizations such as International Commission on Microbiological
Specifications of Foods (ICMSF) and Codex Alimentarius have already established
microbiological meat standards and report that the acceptable level for E. coli in fresh
meat should not be higher than 100 colony forming units/gram or /ml (Meng, 2001).
2.2.3 Laboratory diagnosis and treatment of E. coli infection
In general, E. coli infections are majorly diagnosed by culturing the bacteria from the
site of infection. Samples of blood, stool, urine, sputum, CSF or other clinical material
are sent to the laboratory for culture. Microscopy will normally show Gram negative
rods, with no particular cell arrangement. The Gram stain is not useful when it comes to
stool samples as stool carries many other Gram negative bacteria. The sample is then
cultured either in Xylose lysine deoxycholate agar (XLD), MacConkey agar or Eosin
Methylene blue (EMB) agar followed by a series of biochemical tests which include;
Indole production, methyl red test, voges-proskauer, triple sugar iron test (TSI), β-
galactosidase (ONPG) among others (Paton and Paton, 1998; Todar, 2005; Washington
et al., 2006).
11
Meningitis requires antibiotics, such as third generation cephalosporins. Pneumonia
requires respiratory support, adequate oxygenation and antibiotics such as third
generation cephalosporins or fluoroquinolones. E. coli-associated UTI‟s can often be
treated with a single dose of antibiotic such as those found in the class of
fluoroquinolones, beta lactams, trimethoprin-sulfamethoxazole, tetracyclines and
aminoglycosides. In most individuals infected with diarrheal E. coli, symptoms of
infection last about a week and resolve without any long-term problems. Diarrhoea may
require fluid replacement with electrolyte solutions. Antibiotics do not improve the
illness. Therefore, apart from good supportive care such as close attention to hydration
and nutrition, there is no specific therapy to halt E. coli diarrhoea symptoms.
Antimicrobials known to be useful in cases of traveller‟s diarrhoea include doxycycline,
trimethoprim-Sulfamethoxazole, fluoroquinolones, and rifaxan. Although traveller‟s
diarrhoea is self-limiting, antibiotics may shorten the duration of diarrhoea (Washington
et al., 2006).
2.2.4 Prevention of E. coli contamination in food
The United States Department of Agriculture (USDA) and the Food Safety and
Inspection Service, formulates policies in all kinds of meat harvesting facilities to
minimize food borne contamination risks. These procedures include strict sanitation of
all environment, utensils and tools used, proper product handling and preservation,
carcass sanitizing, employee hygiene, testing of outgoing product and thorough cooking
of meat at high temperatures to destroy any organisms. Mandatory regulations enforced
by USDA and voluntary efforts by the beef industry have reduced the incidence of E.
coli O157:H7 in ground beef to less than 1 percent (Payne and Sparks, 2009).
Such preventative measures are effective in reducing E. coli infection from food both in
and out of the home. Efforts are also encouraged on monitoring and surveillance of food
borne infections in food premises by the food and health departments so as to identify
12
possible sources of infection, which are thoroughly investigated and a closure order
issued for establishments that pose an immediate health hazards. Surveillance projects in
slaughterhouses are also encouraged in which samples from food animal carcasses are
regularly collected to assess and monitor hygienic practices and sanitation in
slaughterhouses. Training of slaughterhouse staff on hygiene measures and precautions
to be taken during slaughter are particularly encouraged. Health education activities on
prevention and control of contamination of meats are also practiced on personnel of the
food industry and the general public (Heymann, 2004).
2.3 Antimicrobial consumption in food producing animals
In food producing animals, antibiotics are dispensed to animals for a number of reasons
such as therapeutic treatment, disease prophylaxis and growth promotion (Bager, 2000).
The administration of antibiotics for treatment or prophylaxis exposes bacterial
populations to the selection of resistant forms of bacteria and such forms of bacteria can
spread from one organism to another.
2.3.1 Global scenario of antimicrobial consumption in food producing animals
Reliable data on antibiotic consumption for both animals and humans is not widely
available and has been reported on in only a few countries such as Denmark (Bager,
2000). Surveillance carried out in Denmark in 1995 to monitor consumption of
antimicrobial agents and occurrence of antimicrobial resistance in food animals, food
and humans gave unofficial figures. These indicated that although there is a declining
trend in the consumption of antimicrobial agents, consumption was still high. About
22,000 kg (80%) of those being consumed were aminoglycosides, macrolides,
tetracyclines and penicillin thus resulting in high resistance to these antibiotics from
several bacterial species from different animals. Penicillins had the highest consumption.
Driven by a concern for human health, in 1995, Denmark initiated a process to end the
use of antibiotics as growth-promoters in livestock production. This process involved
13
both voluntary and legislative elements and led to the situation that virtually no
antimicrobial growth-promoters are used in Denmark since the end of 1999 (WHO,
2002).
According to Mellon and colleagues (2001), the yearly overall production of antibiotics
in the United States was 17.5 million kilos. From this, 12.5 million kilos were used for
non-therapeutic purposes in livestock production and only 1.5 million kilos for human
medical therapy. WHO (1998) also indicated that a number of quinolones were licensed
for use in food animals in Asia, Latin America and South Africa. The report did not,
however, specify the magnitude of use of these antibiotics in the different regions. The
report contained an estimate that annual quinolone consumption in animals in China was
in the range of 470 tons. A Kenyan study contained reliable quantitative information
about antimicrobial consumption in food animals in Kenya. In the five-year period from
1995 to 1999, the annual mean antimicrobial consumption was 14.6 tons. Tetracyclines
and trimethoprim-sulphonamides accounted for nearly 78% of this use, nitrofurans and
aminoglycosides each accounted for 6-7% of the total use and the other classes of
antimicrobials did not exceed 1% of the use (Mitema et al., 2001).
2.3.2 The effects of antibiotics use in food animals on human health
There is broad scientific consensus that the use of antibiotics in food animals, on some
occasions, has detrimental effects on human health (O‟Brien, 2002; Angulo et al., 2004;
Molbak, 2004). According to Collignon (2003) the use of the antibiotic avoparcin as a
growth promoter in food animals in Europe resulted in the development and
amplification of Vancomycin Resistant Enterococci (VRE) and subsequent colonization
of a significant percentage of the human population via the food chain (between 2 and
17%). A subsequent ban on the use of avoparcin in food animals in the European Union
resulted in a marked reduction of the percentage of the general population carrying VRE
in their bowel. Vancomycin resistance is a cause for concern because vancomycin is
14
widely used in intensive care units as a last-line antibiotic for some hospital-acquired
infections of Enterococci and Staphylococci that have become resistant to the more
commonly used antibiotics (Rivera & Boucher, 2011).
Collignon (2003) also mentions that the use of the antibiotic enrofloxacin had been
approved for use in food production animals in many countries. The use of this antibiotic
in food animals resulted in the development of ciprofloxacin-resistant strains of
Salmonella and Campylobacter. These resistant bacteria subsequently caused human
infections. According to another study in Canada, the use of animal feed supplemented
with the antibiotic tylosin had led to the development of erythromycin-resistant
Streptococci and Staphylococci not only in the animals but also in their caretakers
(Khachatourians, 1998).
The Food and Drug Administration (FDA) in the USA in 2001 stated that since the
approval of fluoroquinolones for use in food-producing animals, reports had identified a
relationship between the approval of fluoroquinolones for therapeutic use in food
producing animals and the development of fluoroquinolone resistance in Campylobacter
in animals and humans. In addition, the approval of these drugs in food-producing
animals in the Netherlands, Spain and the United States preceded increases in resistance
in Campylobacter isolates from treated animals and ill humans. Smith and colleagues
(1999) were cited as one of the sources for this claim. A case of domestically acquired
ceftriaxone-resistant Salmonella was reported in a 12-year old child from Nebraska who
acquired the resistant bacteria from the veterinarian father who had been treating several
cattle herds with ceftiofur antibiotic for outbreaks of Salmonella infection (Fey et al.,
2000).
15
2.4 Antimicrobial resistance
2.4.1 Food animals as a source of Antimicrobial resistance
Food animals exposed to additives such as the antibiotics used for growth promotion
may serve as a reservoir of resistant bacteria and resistance genes that may spread to the
human population through the food chain, thereby limiting the effectiveness of
antimicrobial drugs (Aarestrup et al., 2001). Contaminated meat and meat products are
important sources of antibiotic-resistant bacteria. For instance a study in Minneapolis,
USA found that these products were found to be contaminated with resistant E. coli and
extra-intestinal pathogenic E. coli carrying additional virulent factors (Bester and
Essack, 2010). Bester and Essack determined that these findings corresponded closely
with the prevalence of contamination found for animal carcasses exposed to immediate
contamination from the intestines, as well as for processed meat further along the
production line. This form of meat contamination was also found in Addis Ababa,
Ethiopia, where 8% of the beef and chicken samples collected were contaminated with
resistant E. coli O157:H7 (Hiko et al., 2008). In a number of farms, food animal
production usually incorporates some form of antibiotic usage, either therapeutic or
prophylactic.
According to reviews by Kelly et al., (2009a; 2009b) the transfer of genetic entities,
including those carrying antibiotic-resistance qualities, becomes all the more probable in
environments with high bacterial loads. A recent study in Iceland revealed that out of
419 E. coli isolated from pigs, broiler chicken and humans, 170 (40%) were resistant to
one or more antimicrobial agents. In the pig isolates, over 50 % were resistant to one or
more antimicrobial agents and 22% were multi resistant (Thorsteinsdottir et al., 2010a).
A Kenyan study by Ole Mapenai to investigate the occurrence of antimicrobial
resistance in E. coli in food animals showed that approximately 38% of all E. coli
isolates from food animals were antibiotic resistant with 26% of them being multidrug
16
resistant with resistance to ampicillin, tetracycline and sulphonamides being most
frequent (Ole Mapenai et al., 2006).
2.4.2 Antimicrobial resistance in E. coli isolated from poultry
Antibiotics are used to prevent or treat a number of avian diseases including avian
pathogenic E. coli (APEC) and collibacillosis as well as enhance feed conversion
efficiency and improve growth rates (Aarestrup et al., 2001). Resistance of these
bacterial strains to antimicrobials is therefore important in the selection of agents for
treatment. E. coli is considered to be the organism of choice as a model to studying
resistance levels in bacteria as E. coli strains efficiently exchange genetic material not
only with each other but also other enteric pathogens. In northern Georgia, USA Zhao et
al., (2005) tested 95 APEC isolates and found 92% of the isolates to be resistant to three
or more antimicrobials.
Yang et al., (2004) from China noted that 80% E. coli isolated from the livers of
chickens that had died on 10 poultry farms were resistant to eight or more antibiotics.
Similarly, high levels of Antimicrobial Resistance (AMR) were observed elsewhere in
China where 70 E. coli isolates recovered from diseased chickens between 2004 and
2005 were examined (Li et al., 2007). The isolates showed frequencies of resistance of
100% to tetracycline and trimethoprim-sulphonamide and 79–83% to chloramphenicol,
ampicillin, ciprofloxacin and enrofloxacin. Vertical transmission of a pathogenic O45
strain of E. coli that was resistant to fluoroquinolones was described in one Denmark
study (Petersen et al., 2006). Petersen and his colleagues showed that a single clone was
responsible and the bacterium recovered from five broiler chicks could be traced back to
the broiler parents.
Commensal microbiota play an important role as reservoir of resistance determinants
(Blanc et al., 2006; Scott, 2002). Antimicrobial resistance in commensal strains of E.
17
coli may play an important role in the ecology of resistance and infectious diseases.
Moniri & Dastehgoli (2005) noted resistance to nalidixic acid in 100% E. coli from
broilers while resistance to ciprofloxacin was detected in 42% of the isolates. In addition
to fluoroquinolone resistance, there is considerable interest in resistance to beta-lactams,
especially extended spectrum beta-lactams. In one study in Belgium, 295 ceftiofur
resistant E. coli were recovered from cloacal swabs of 489 broiler chickens from five
farms (Smet et al., 2008). In the US, 73% of 194 E. coli recovered from shell eggs were
susceptible to all seven antimicrobials that were tested. Isolates that were resistant were
mostly resistant to tetracycline (Musgrove et al., 2006).
A prevalence of 42% was reported in Lithuania in one study aimed to estimate the
prevalence and the antimicrobial resistance of E. coli isolated from chicken liver sold in
retail markets (Modestas et al., 2010). The isolates demonstrated frequent resistance to
the most frequently used antimicrobials including aminopenicillins, quinolones and
tetracyclines. Multidrug resistance to the 3rd
generation cephalosporins that are
exclusively important in human medicine by isolates from retail chicken meat was also
recorded in Japan (Ashraf et al., 2009). The most commonly reported resistance
phenotypes were against ampicillin, streptomycin, spectinomycin, kanamycin, SXT,
nalidixic acid, ciprofloxacin and cephalosporins.
In Kenya, Kikuvi and colleagues showed that resistance was highest in chicken E. coli
isolates as compared to isolates from cattle and pigs (74%) (Kikuvi et al., 2006). The
chicken isolates also had significantly high multidrug resistance. Extended Spectrum
Beta Lactamase (ESBL) producing E. coli have been encountered in chicken. With the
extensive use of beta lactam antibiotics in poultry such as amoxicillin and
cephalosporins and especially extended spectrum cephalosporins, ESBL mediated
resistance in Gram negative bacilli has become increasingly critical and therapeutic
options for such infections are becoming limited (Hu et al., 2005).
18
Li and colleagues (2009) showed that 60.8% of the isolates tested were ESBL-producing
E. coli. A survey in 2007 showed that the prevalence of ESBL producing animal-
associated bacteria in China was 30% (Liu et al., 2007). It is important to detect ESBL
producers in order to know the ESBL prevalence in animal-associated bacteria and to
limit the spread of these MDR organisms in veterinary settings.
2.4.3 Transfer of Antibiotic resistance
Acquired antibiotic resistance is attributed to both direct and indirect pathways (Zhang
et al., 2011). Direct pathways, also known as primary pathways are mutations in the
gene encoding resistance against the mechanism of particular antibiotics. Indirect or
secondary pathways are the gaining of smaller fragments of DNA coding for resistance.
Indirect pathways are classified into three categories: Transformation, Transduction and
Conjugation (Dessen et al., 2001).
Transformation is where a dying bacterium cell may release its plasmids, or short
fragments of its DNA into the environment, which allows for the possibility for a
healthy bacterium cell, called a recipient, to acquire this material and use it for its own
benefit directly through the cell wall (Kelly et al., 2009a).
Conjugation allows transmissible plasmids and chromosomal DNA of very large sizes to
be transferred from cell to cell, either within or between species, mediating the
transmitted genetic material through various specified enzyme activities. The
conjugational pathway does not select DNA material simply from the environment, as in
the case of transformation, but instead has a direct cell-to-cell exchange of genetic
material, where one cell is the donor of the genetic material and the other the new host
or recipient (Catry et al., 2003).
19
Transduction is the virus-like injection of genetic material into a host cell after
attachment. Transduction is a feature mainly of bacteriophages commonly acting as
bacterial viruses (Maurelli, 2006).
20
CHAPTER THREE
MATERIALS AND METHODS
3.1 Study design
This study utilized a cross-sectional descriptive study design.
3.2 Study site
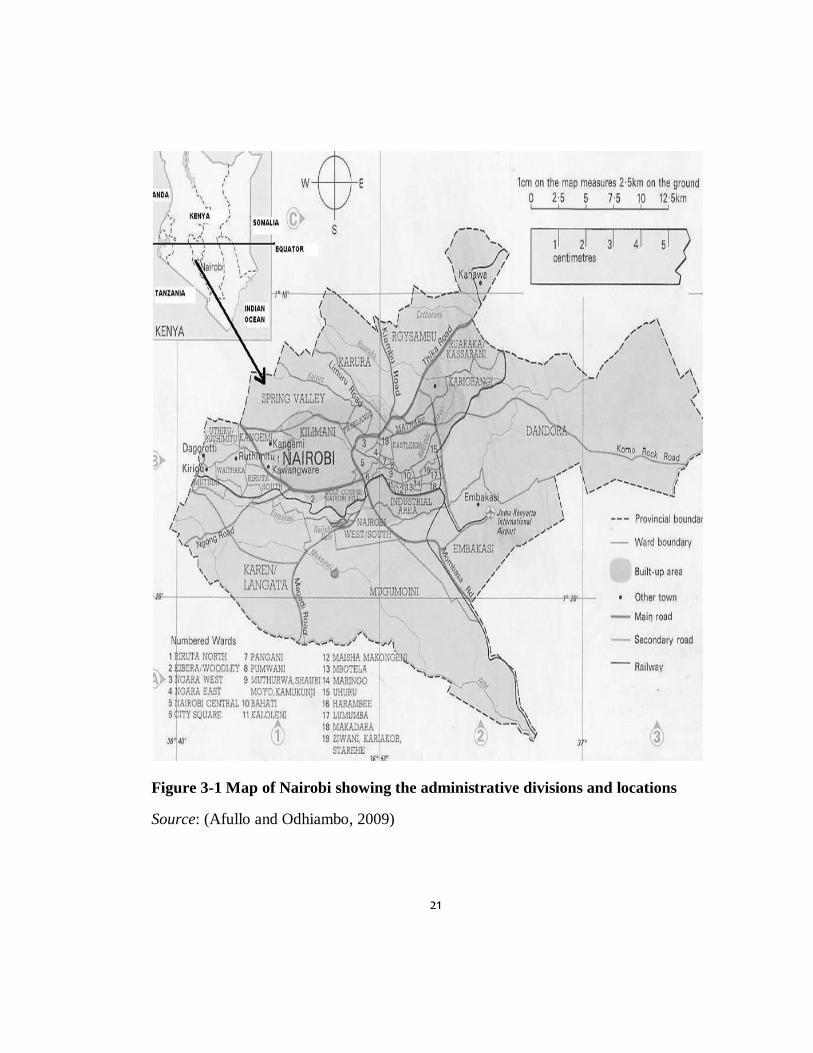
The study was conducted in Nairobi, Kenya. Nairobi City is the administrative and
commercial capital in Kenya and main town in Nairobi County. It is home to thousands
of businesses including the retail chicken business. Nairobi is administratively divided
into nine divisions (Mathare, Central, Westlands, Starehe, Dagoretti, Lang‟ata,
Makadara, Kamkunji and Embakasi) (Figure 3.1). Each division is divided into a
number of locations. Within these locations are found a number of retail meat outlets
some of which deal with selling of raw chicken meat. There is a huge disparity in
income levels and population densities in Nairobi. The people living in the western
suburbs are generally the more affluent while the lower and middle-income populations
dominate the eastern suburbs (Afullo and Odhiambo, 2009).
Study sites for obtaining the samples were 200 randomly selected retail chicken outlets
and supermarkets in twenty eight locations around Nairobi (Appendix 1). Samples were
then processed at the Kenya Medical Research Institute, Centre for Microbiology
Research laboratories, Kenyatta hospital compound.
21
Figure 3-1 Map of Nairobi showing the administrative divisions and locations
Source: (Afullo and Odhiambo, 2009)
22
3.3 Study samples
The study samples were raw retail chicken meat that were purchased from 200 retail
meat outlets in 28 locations around Nairobi in the period between August 2011 to
February 2012. The samples included both the chicken skin and chicken flesh for study.
3.4 Sample size calculation
Kariuki and colleagues conducted a study in Kenya on food safety and antimicrobial
resistance that tried to show the general food safety overview in meat value chains,
including raw retail chicken, but the prevalence of E.coli/coliform contaminants was not
given (Kariuki et al., 2013). Apart from this, there is no other published study in Kenya
giving this prevalence in raw retail chicken. Therefore, the prevalence that was used to
calculate the sample size was from a similar study in a developing country recently
conducted in Osogbo, Nigeria in which the prevalence of E. coli isolated from raw retail
chicken was found to be 16% (Adesiji et al., 2011). Using the Fisher‟s formula, (Fishers,
1995), and taking 16% to be the working prevalence rate (P), 1.96 the standard error
from the mean (Z) and 5% the absolute degree of precision (D), the sample size (N) was
calculated as follows:
N= Z² P (1-P) = 1.96²X0.16x0.84 = 206 samples
d² 0.05²
3.5 Sampling procedure
A random cross-sectional sampling procedure was followed where by samples were
randomly purchased from a pre-existing list of retail outlets within different locations in
Nairobi (Appendix 1). The distribution of samples from each location was not equal in
number since the number of samples purchased per location depended on availability of
chicken retail outlets in each location. Therefore, some locations which had fewer retail
outlets as representatives had fewer samples than others.
23
In order to take into account compounding factors of socio-economic status in the
contamination rate and antimicrobial resistance patterns in the E. coli under study within
Nairobi, the retail outlets where samples were purchased were classified into
Supermarkets, outlets from high end locations (low densely populated, up-market
residential suburbs), outlets from middle end locations (middle densely populated areas
further classified into high middle and low middle income areas) and outlets from low
end locations (densely populated slums and informal settings). Classification of
locations into these groups was done based on a recent study on residential segregation
in Nairobi (K‟Akumu and Olima, 2007). Random sampling was done until a desired
sample size was reached. For each sample, test sites logged the store name, store
location, the purchase date and lab processing date. Freshly packaged chicken samples
were immediately transported at 4°C conditions to the laboratory for bacterial isolation.
3.6 Laboratory Procedures
3.6.1 Enumeration of E. coli and total coliform bacteria from retail chicken meat
Enumeration of E. coli and total coliform bacteria from the chicken samples was
performed as described in the Association of Analytical Communities international,
official methods of analysis using 3M petrifilm E. coli/Coliform count plates (AOAC,
2006) with slight modification. The samples were aseptically removed from the package
and 100g pieces of chicken was weighed and placed in 100 ml sterile distilled water.
The container was shaken manually for 3 min. 3M petrifilm plates were labeled
according to individual sample laboratory numbers and placed on a leveled surface and
the top of the plate lifted.
Using a pipette, 1ml of rinse water from the sample was drawn and in a perpendicular
position placed onto the center of the bottom film. The top of the film was rolled back
down carefully avoiding entrapment of air bubbles and a spreader was placed on the
24
surface of the top film and gently pressed to distribute inoculum over the circular area
before gel was formed. After the gel solidified, the plates from all samples were
incubated for 24± 2h at 35°C. Colony counts for each petrifilm were then done the
following day and the microbial count results converted to base 10 logarithm of the
number of colony forming units per ml (cfu/ml) rinse water obtained from the samples.
E. coli colonies growing on the petrifilm plate appeared as blue colonies with gas while
coliforms were counted as red and blue colonies with gas. An interpretation guide was
referred to when interpreting results (Appendix 2).
3.6.2 Isolation and presumptive identification of E. coli
Isolation of E. coli strains from the chicken samples was performed as described by
Andrew and Hammack, (2003) with modifications. 200 µl of rinse water was streaked
on Eosin Methylene Blue (EMB) agar (Appendix 3) and incubated overnight at 37°C.
The plates were then visually examined to presumptively identify E. coli colonies. E.
coli colonies appeared to be very dark, with a metallic green sheen. Before proceeding, a
Gram stain was performed to determine morphology of the growing colonies and a pure
culture was obtained by sub-culturing a well isolated E. coli colony on another EMB
agar plate and incubating at 37oC for 24 h. After incubation, the plates were examined
and a single colony selected for confirmative identification of E. coli through a series of
biochemical tests.
3.6.3 Confirmative identification of E. coli
Biochemical tests were used to confirm the identity of selected E. coli isolates
(Macfaddin, 2000). A simplified chart for identification of E. coli is shown in Appendix
4.
In the Triple sugar iron agar test (BBL), the selected isolate was streaked on the surface
of a TSI agar slant and then stabbed. The tube was incubated at 37oC for 24 h after
25
which the agar surface was observed to determine visible color change on both the butt
and slant from red to yellow together with gas bubbles in the agar. E. coli ATCC 25922
was used as the positive control while P. aeruginosa ATCC 9027 was used as the
negative control.
In Sulfur, Indole, motility agar test, the isolate to be tested was inoculated in Sulfur
Indole Motility (SIM) agar and incubated overnight at 37°C. Following incubation, few
drops of Kovac‟s reagent were added. Formation of a red or pink colored ring at the top
with spread of cloudiness in the media/ movement from stabbing point of the inoculant
due to motility and lack of blackness in the media was taken as positive for E. coli. E.
coli ATCC 25922 was used as positive control while Klebsiella pneumonia was used as
negative control.
In Citrate utilization test, selected colonies were inoculated into the slope of Simmon‟s
citrate agar and incubated overnight at 37°C. Presence or absence of E. coli in the
medium was determined by a color change from green to blue i.e. No color change
meant presence of E. coli. E. coli ATCC 25922 was used as negative control while
Enterobacter aerogenes ATCC 13048 was used as Positive control.
All positive isolates were stored at -80⁰C in trypticase soy broth for further analysis
(Appendix 5, 6 and 7).
3.6.4 Antimicrobial Susceptibility testing
The Kirby-Bauer disc diffusion method (Bauer et al., 1966) was used to test
susceptibility of the isolated E. coli to antibiotics commonly used in animal and human
health. Antimicrobial sensitivity test was done on Mueller-Hinton agar (Appendix 8)
according to the recommendations reported by the Clinical and Laboratory Standards
Institute (CLSI, 2012). The organisms were tested for their susceptibility to 12
commonly used antimicrobials on disks containing; Ampicillin (AMP 10µg),
26
Amoxycillin-clavulanic acid (AMC, 30µg), Tetracycline (TE 30µg),
sulphamethoxazole-trimethoprin (SXT 30µg), Ciprofloxacin (CIP 5µg), Ceftriaxone
(CRO 30µg), Ceftazidime (CAZ 30µg), Kanamycin (K 30µg), Streptomycin (S 10µg),
Gentamicin (CN 10µg), Nalidixic acid (NA 30µg) and Chloramphenicol (C 30µg).
E. coli strain 25922 was used to control for bacterial growth and potency of antibiotic
disks. Each E. coli isolate was inoculated in normal saline water (Appendix 9) and the
turbidity adjusted to that of Barium chloride 0.5 McFarland standard. Adjusted bacterial
inocula was swabbed onto the MH agar plates using sterile swabs and allowed to dry.
Using multi disk dispensers, the antimicrobial disks were carefully dispensed onto the
surface of the inoculated plates and incubated at 37°C for 24h. Using a ruler, the
susceptibility zones were measured and interpreted according to criteria set by the
Clinical and Laboratory Standards Institute document M100-S17 (CLSI, 2012).
(Appendix 10)
3.6.5 Template DNA preparation
DNA from the isolated E. coli as well as from control strains was extracted following
the procedures described by Ehrt and Schnappinger, (2003) with slight modifications. A
total of 5 controls were used (Table 3-1). Pure E. coli isolates and control strains were
grown in MacConkey agar (Appendix 11) and subsequently sub-cultured in Mueller-
Hinton agar and incubated overnight at 37°C. A loop full of overnight bacterial culture
was suspended in 1000 μl of sterile distilled water and then boiled for 10 min at 95°C in
a heating block (Grant QBT1). The resulting suspension was placed in a centrifuge
(Denville scientific Inc) and centrifuged for 5 min at 14,000 rpm. The supernatant was
stored at -20 °C and used as the DNA template for PCR amplification.
27
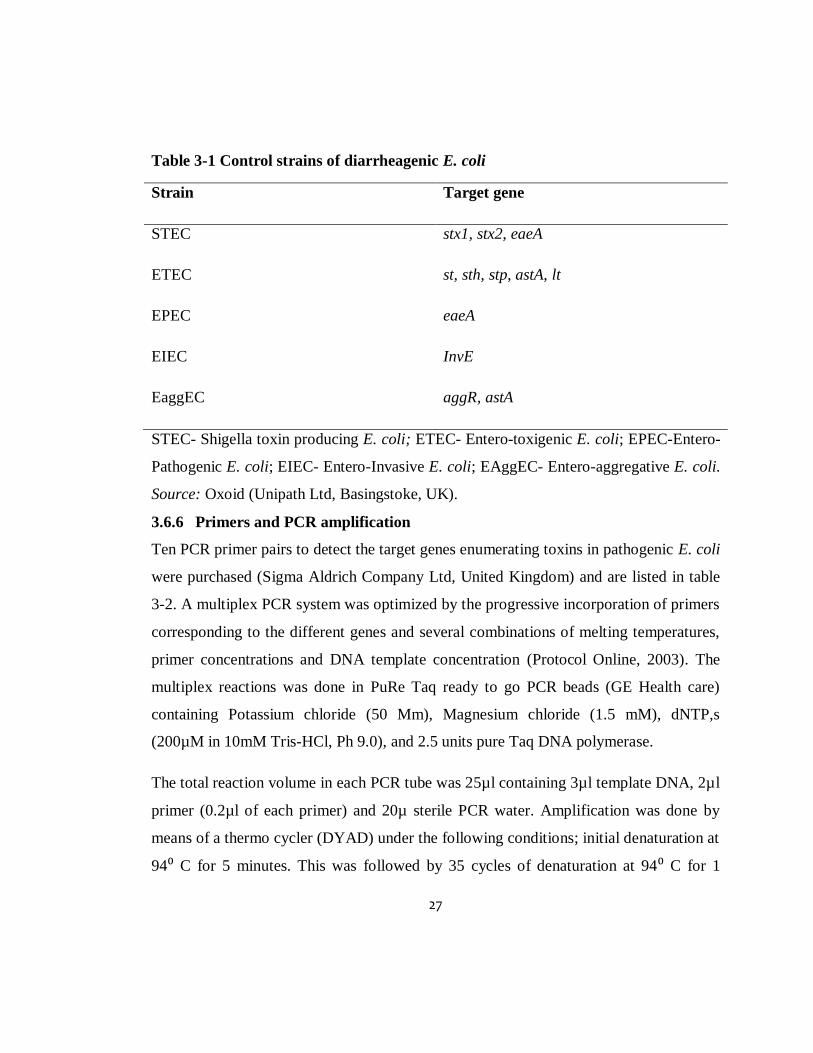
Table 3-1 Control strains of diarrheagenic E. coli
Strain Target gene
STEC stx1, stx2, eaeA
ETEC st, sth, stp, astA, lt
EPEC eaeA
EIEC InvE
EaggEC aggR, astA
STEC- Shigella toxin producing E. coli; ETEC- Entero-toxigenic E. coli; EPEC-Entero-
Pathogenic E. coli; EIEC- Entero-Invasive E. coli; EAggEC- Entero-aggregative E. coli.
Source: Oxoid (Unipath Ltd, Basingstoke, UK).
3.6.6 Primers and PCR amplification
Ten PCR primer pairs to detect the target genes enumerating toxins in pathogenic E. coli
were purchased (Sigma Aldrich Company Ltd, United Kingdom) and are listed in table
3-2. A multiplex PCR system was optimized by the progressive incorporation of primers
corresponding to the different genes and several combinations of melting temperatures,
primer concentrations and DNA template concentration (Protocol Online, 2003). The
multiplex reactions was done in PuRe Taq ready to go PCR beads (GE Health care)
containing Potassium chloride (50 Mm), Magnesium chloride (1.5 mM), dNTP,s
(200µM in 10mM Tris-HCl, Ph 9.0), and 2.5 units pure Taq DNA polymerase.
The total reaction volume in each PCR tube was 25µl containing 3µl template DNA, 2µl
primer (0.2µl of each primer) and 20µ sterile PCR water. Amplification was done by
means of a thermo cycler (DYAD) under the following conditions; initial denaturation at
94⁰ C for 5 minutes. This was followed by 35 cycles of denaturation at 94⁰ C for 1
28
minute, annealing at 56⁰ C for 30s and extension at 72⁰ C for 1 min. The final step was
amplification at 72⁰ C for 10 min. Amplicons were then subjected to agarose gel
electrophoresis.
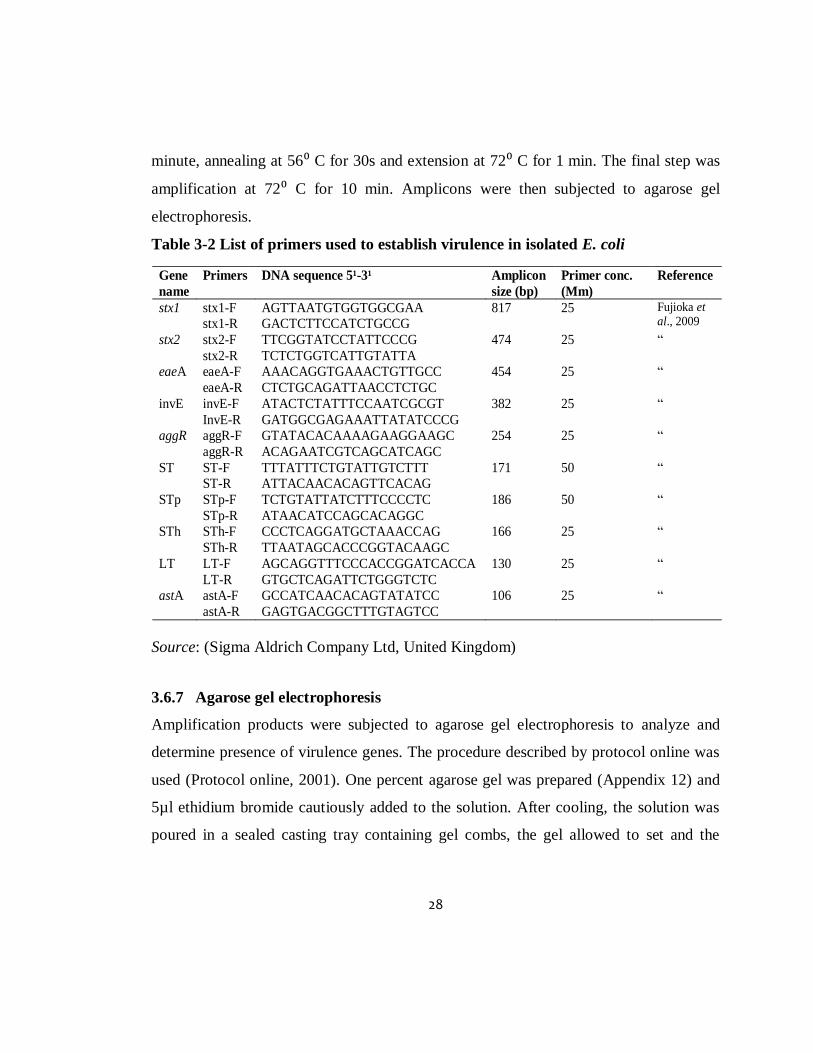
Table 3-2 List of primers used to establish virulence in isolated E. coli
Gene
name
Primers DNA sequence 5¹-3¹ Amplicon
size (bp)
Primer conc.
(Mm)
Reference
stx1 stx1-F AGTTAATGTGGTGGCGAA 817 25 Fujioka et al., 2009 stx1-R GACTCTTCCATCTGCCG
stx2 stx2-F TTCGGTATCCTATTCCCG 474 25 “
stx2-R TCTCTGGTCATTGTATTA eaeA eaeA-F AAACAGGTGAAACTGTTGCC 454 25 “
eaeA-R CTCTGCAGATTAACCTCTGC
invE invE-F ATACTCTATTTCCAATCGCGT 382 25 “
InvE-R GATGGCGAGAAATTATATCCCG aggR aggR-F GTATACACAAAAGAAGGAAGC 254 25 “
aggR-R ACAGAATCGTCAGCATCAGC
ST ST-F TTTATTTCTGTATTGTCTTT 171 50 “ ST-R ATTACAACACAGTTCACAG
STp STp-F TCTGTATTATCTTTCCCCTC 186 50 “
STp-R ATAACATCCAGCACAGGC STh STh-F CCCTCAGGATGCTAAACCAG 166 25 “
STh-R TTAATAGCACCCGGTACAAGC
LT LT-F AGCAGGTTTCCCACCGGATCACCA 130 25 “
LT-R GTGCTCAGATTCTGGGTCTC astA astA-F GCCATCAACACAGTATATCC 106 25 “
astA-R GAGTGACGGCTTTGTAGTCC
Source: (Sigma Aldrich Company Ltd, United Kingdom)
3.6.7 Agarose gel electrophoresis
Amplification products were subjected to agarose gel electrophoresis to analyze and
determine presence of virulence genes. The procedure described by protocol online was
used (Protocol online, 2001). One percent agarose gel was prepared (Appendix 12) and
5µl ethidium bromide cautiously added to the solution. After cooling, the solution was
poured in a sealed casting tray containing gel combs, the gel allowed to set and the
29
combs carefully removed. The gel was mounted in an electrophoresis tank (Thermo E.C)
and TAE electrophoresis buffer added (Appendix 13).
The amount of 10µl DNA sample was mixed with 3µl loading buffer and each sample
was carefully loaded into individual wells in the gel using a micro pipette. The gel was
allowed to run in the electrophoresis tank for 2 h at 126 V with periodic checks. Sigma
molecular weight ladder (Sigma-Aldrich life sciences) of known size (100 base pairs
(bps) was used as the molecular weight standard. After electrophoresis, the gel was
illuminated with an ultraviolet lamp to view the DNA band profiles for virulence
genotypes. The gel was then photographed with a digital camera and the molecular
weight of each band profile was determined.
3.6.8 Bacterial in-vitro conjugation tests
Conjugation experiments were performed for all E. coli isolates that were found to be
resistant to more than 3 antibiotics and acted as the donors (resistant to ampicillin and
susceptible to Sodium azide). E. coli strain J58 was used as the recipient strain (resistant
to Sodium azide and susceptible to ampicillin). Conjugation procedures were performed
in 5 days as described by Shohayeb and Sonbol (1994) with slight modifications. On the
first day, all donors and the recipient bacteria were revived in MacConkey agar and
incubated at 37°C overnight. On the second day, all donors and the recipient bacteria
were subsequently sub-cultured in Mueller-Hinton agar to obtain pure cultures and
incubated at 37°C overnight.
On the third day, pure E. coli isolates (each donor and the recipient) were inoculated in
clearly labeled tubes containing normal saline water and the turbidity of each adjusted to
that of Barium chloride 0.5 McFarland standard. Two hundred micro litres of individual
donor broth from the prepared standards was added to labeled bijou bottles containing
the conjugation broth (tryptone soy broth) (Appendix 14) followed by 200µl of recipient
30
in all bottles. The mixture of donor and recipient was inverted thoroughly several times
and incubated overnight at 37°C.
On the fourth day, using sterile tips and spreaders, 100µl from the incubated conjugation
broth was spread on the following; a set of MacConkey plates to select for trans-
conjugants (containing 100µg/ml Sodium azide and 10µg/ml ampicillin), a set of plates
to select for recipient strain (containing only 100µg/ml Sodium azide), a set of plates to
select for only donor strains (containing only 10µg/ml ampicillin) and a set of plates to
select for both donors and recipient bacteria (plates without any of the anti-bacterial
agents). The plates were then incubated overnight at 37°C (Appendix 15).
On the final day, all plates were removed from the incubator and observed for growth
and colony counts of trans-conjugants. Trans-conjugants were then subjected to
Antimicrobial susceptibility tests following the same procedures used for the donor E.
coli. All positive trans-conjugants were stored at -20 0C in tryptic soy broth stocking
media for further analysis.
3.6.9 Plasmid DNA extraction
The E. coli donors and successful trans-conjugants were subjected to plasmid DNA
extraction and subsequent analysis in agarose gel electrophoresis. Plasmid DNA was
extracted using alkaline lysis technique by means of the plasmid mini extraction kit
(Qiagen, West Sussex, United Kingdom) according to manufacturer‟s instructions. Five
ml of overnight bacterial culture was centrifuged at 8,000 rpm for 3 min and the pellet
re-suspended in RNase containing suspension buffer. The suspension was lysed by
means of an alkaline lysate buffer and after neutralization it was centrifuged for 10 min
at 13,000 rpm. Using a pipette the supernatant was applied to a QIA prep spin column
and centrifuged for 1 min. After discarding the flow through, the bound DNA remaining
in the spin column was precipitated and washed twice using ethanol and after
31
centrifugation the flow through discarded. The plasmid DNA remaining in the spin
column was eluted in elution buffer (10Mm Tris-Cl, p.H 8.5). Plasmids were separated
by electrophoresis on horizontal 0.8% agarose gels at 80 volts for 3 h. Plasmid sizes
were determined by co-electrophoresis with plasmids of known sizes from E. coli strain
V157 (NCTC 50193; 53.7, 7.2, 5.6, 3.9, 3.0, 2.7, 2.1Kb). Plasmid DNA bands were
visualized with an ultraviolet trans-illuminator after staining with 5µl ethidium bromide.
3.7 Data management and analysis
Data was entered in excel spread sheets and stored in the computer hard drive as well as
flash disks. The Statistical software package used for data analysis was Statistical
Package for Social Sciences (SPSS) version 17.0. Descriptive statistics was presented
through use of graphs and frequency tables. One way ANOVA was used in determining
statistical significant difference in mean microbial counts among the different
classifications of retail outlets. The chi-square test was used to asses any statistical
significant association between antimicrobial resistances in the E. coli isolated with
regard to retail outlet classification from where the raw chicken was purchased and
presence of virulence genes in the isolated E. coli.
3.8 Ethical considerations
Retail chicken meats were the study samples and therefore no ethical requirements such
as respect for life was considered. However, societal benefits that have resulted from the
study were considered that will lead to knowledge and improvements in the protection of
the Public health and well-being of both humans and the live animals. The study was
approved by the Jomo Kenyatta University of Agriculture and Technology, Board of
Post-graduate Studies and the Kenya Medical Research Institute, Ethical Review
Committee in accordance with local regulatory requirements (Appendix 16).
32
CHAPTER FOUR
RESULTS
4.1 Contamination rate and microbial count determined from the raw retail
chicken
One hundred and fifty six of the chicken samples examined (78%) were positive for E.
coli contamination. Contamination level of chicken samples by total coliform bacteria
was found to be 97%. The average E.coli and coliform count for all samples were 3.911
and 5.2061 Log₁₀cfu/ml respectively.
Retail outlets from where the raw chicken samples were purchased were classified into 5
major groups and the differences in the microbial loads among these groups were
presented through graphical box plots. According to observation of the positions of the
median line as well as the lower whiskers in figure 4-1, it is evident that the E. coli
counts for High income, High-middle, low-middle and low income areas are negatively
skewed and the bulk of counts are concentrated on the high end of the scale. The E. coli
counts for samples from supermarkets are evenly distributed. Two extreme outliers are
observed in the case of E. coli counts from high income areas.
The size of the boxes for high- middle income, low-middle income and low income
areas indicate that the middle 50% samples for these groups have their E. coli counts
spread and vary in number while for high class butcheries and supermarkets the box
sizes indicate that the middle 50% of the counts are clumped together. Box plots for
supermarkets and high income area butcheries are observed to be much lower in position
than the other three box plots.
33
Figure 4-1 Box plot representing distribution of E. coli count among the 5
classifications of retail outlets
Figure 4-2 which represents coliform count distribution shows that apart from
supermarkets, the other 4 retail outlet classifications have bulk of the count concentrated
on the high end of the scale while supermarkets have an even distribution of coliform
counts. Outliers were observed for High middle income areas and low income areas on
the opposite side of the skew and an extreme outlier is also observed for supermarkets
indicating that some samples from the former two groups had coliform counts which
were low and high in the case of supermarkets thus these counts are seen to deviate
markedly from the rest of the counts.
Values for coliform counts do not vary much in high middle income butcheries, low
income butcheries and supermarkets while they are spread out for high income and low
middle income area butcheries. The mean Log₁₀ E. coli/coliform counts for
supermarkets, high income, high-middle income, low-middle income and low income
34
areas were; 0.9375/1.7237, 2.6510/5.0769, 4.9990/5.2953, 4.8084/6.0111 and
4.9882/6.1855 Log₁₀ cfu/ml respectively.
Figure 4-2 Box plot representing distribution of coliform count among the 5
classifications of retail outlets
Analysis of variance was used to determine if there was indeed a significant difference
in mean microbial counts among the 5 classifications of retail outlets. There was
significant difference in the E. coli count (F (4,175) =16.676; MSE=106.576; p< 0.001)
and coliform counts (F (4,179) =18.37; MSE=105.097; p< 0.001) among the groups.
According to post-hoc tukeys‟ Honestly Significant Difference (HSD) test (Table 4-1),
samples purchased from supermarkets had a significantly lower E. coli and coliform
count than those from 3 other retail outlet classifications (outlets in high-middle, low-
middle and low income areas) but had no significant difference with samples from
outlets in high income areas (p> 0.05). The samples from outlets in high income areas
had significant lower E. coli count than those from high-middle, low-middle and low
income areas but showed no significant difference in coliform count.
35
Table 4-1 Comparison of mean microbial counts among the 5 groups of retail
outlets
Group
*
Difference between means
(E. coli count)
Tukeys' HSD Ϯ
value
Difference between means
(Coliform count)
Tukeys' HSD
value
A-B 1.7135 2.05 3.3532 2.09
A-C 4.0615
4.4618
A-D 3.8709
3.5716
A-E 4.0507
4.2874
B-C 2.348
1.1086
B-D 2.1574
0.2184
B-E 2.3372
0.9342
C-D 0.1906
0.8902
C-E 0.0108
0.1744
D-E 0.1798
0.7158
Ϯ- When the difference between means of 2 groups is greater than the tukeys‟ HSD value then
there is a significant difference between these two groups
*A-Supermarkets
B-High income areas
C-High-middle income areas
D-Low-middle income areas
E-Low income areas
4.2 Prevalence of antimicrobial resistance among E. coli isolates.
Antibiotic susceptibility profiles to 12 commonly used antibiotics were done for all the
156 E. coli isolates. Overall, 75% (117) of the isolates exhibited resistance to at least one
of the 12 antibiotics while the rest of the isolates were fully susceptible.
4.3 Antibiotic resistance profiles among E. coli isolates.
Prevalence of antimicrobial resistance by E. coli isolates was highest for tetracycline
(TE) (60.3%) followed by sulphamethoxazole-trimethoprim (SXT) (49.4 %), ampicillin
(AMP) (34.0 %) and streptomycin (STM) 30.1 % (Table 4-2). In general isolates
showed highest levels of resistance to Tetracyclines (TE) 60.3%, followed by
36
Sulphonamides (SXT) 49.4%, Quinolones/Fluoroquinolones (NA and CIP) 19.2%,
Phenicols (C) 13.5%, Beta-lactams/Cephalosporins (AMP, CAZ, CRO and AMC) 12%
and the lowest resistance in Aminoglycosides (STM, KN and CN) 11.9%
Table 4-2 Antibiotic susceptibility profiles among E. coli isolates in raw retail
chicken meats
Disc potency
Sensitive
isolates Intermediate isolates Resistant isolates Total
Antibiotic µg/disc Frequency % Frequency % Frequency %
AMC 30 142 91 10 6.4 4 2.6 156
SXT 30 78 50 1 1.6 77 49.4 156
TE 30 61 39.1 1 0.6 94 60.3 156
AMP 10 100 64.1 3 1.9 53 34 156
CIP 5 148 94.9 1 0.6 7 4.5 156
CAZ 30 155 99.4 1 0.6 0 0 156
KN 30 139 89.1 9 5.8 8 5.1 156
STM 10 103 66 6 3.8 47 30.1 156
CRO 30 138 88.5 0 0 18 11.5 156
CN 10 154 98.7 1 0.6 1 0.6 156
NA 30 133 85.3 0 0 23 14.7 156
C 30 135 86.5 0 0 21 13.5 156
Out of all the 156 isolates, 60.8% exhibited multiple drug resistance traits. 24.5 % of the
isolates were fully susceptible while 14.7 % showed resistance to only one antibiotic.
4.4 Distribution of antimicrobial resistance in E. coli from chicken meat from the
5 classes of retail outlets
There was no significant difference (p> 0.05) in the prevalence of antimicrobial
resistance among the 5 classifications of retail outlets (χ²n-1= 4.178; d.f= 4; p= 0.382)
i.e. the prevalence of antimicrobial resistance among E.coli isolates from chicken
samples was not associated with the classification of retail outlet from where the
samples were purchased. However, percentage frequencies indicated that the isolates
37
from samples in supermarkets had a higher prevalence (84.6%) while isolates from
samples in low income area outlets had the lowest prevalence of antimicrobial resistance
(62.5%). (Table 4-3)
Table 4-3 Relationship between retail outlet classification and antibiotic resistance
Number of isolates with
resistance phenotype
Number %
Classification of retail outlet
High income areas 22 78.6%
High-middle income areas 48 70.6%
Low income areas 10 62.5%
Low-middle income areas 15 83.3%
Supermarkets 22 84.6%
Total 117 75.0%
4.5 Prevalence of E. coli isolates with virulence genes
Among the 156 E. coli isolates recovered from the raw retail chicken, 63 (40.4%) tested
positive for the presence of at least one of 10 virulence genes; stx1, stx2, stp, sth, st,
astA, invE, lt, aggR, eaeA while 93 (59.6%) tested negative for the presence of any of
these genes and these were considered as non-pathogenic. ETEC were found to be the
most prevalent Among the E. coli that were positive for these virulence genes (60.3%)
(Table 4-4). A gel picture of representative diarrheagenic E. coli carrying virulence
genes is shown (Plate 4-1)
38
Table 4-4 Classification of pathogenic E. coli isolated from raw retail chicken meats
Classification of Pathogenic E. coli Frequency of isolates %
EPEC 13 20.6
ETEC 38 60.3
EIEC 4 6.3
EAEC 3 4.8
STEC 5 7.9
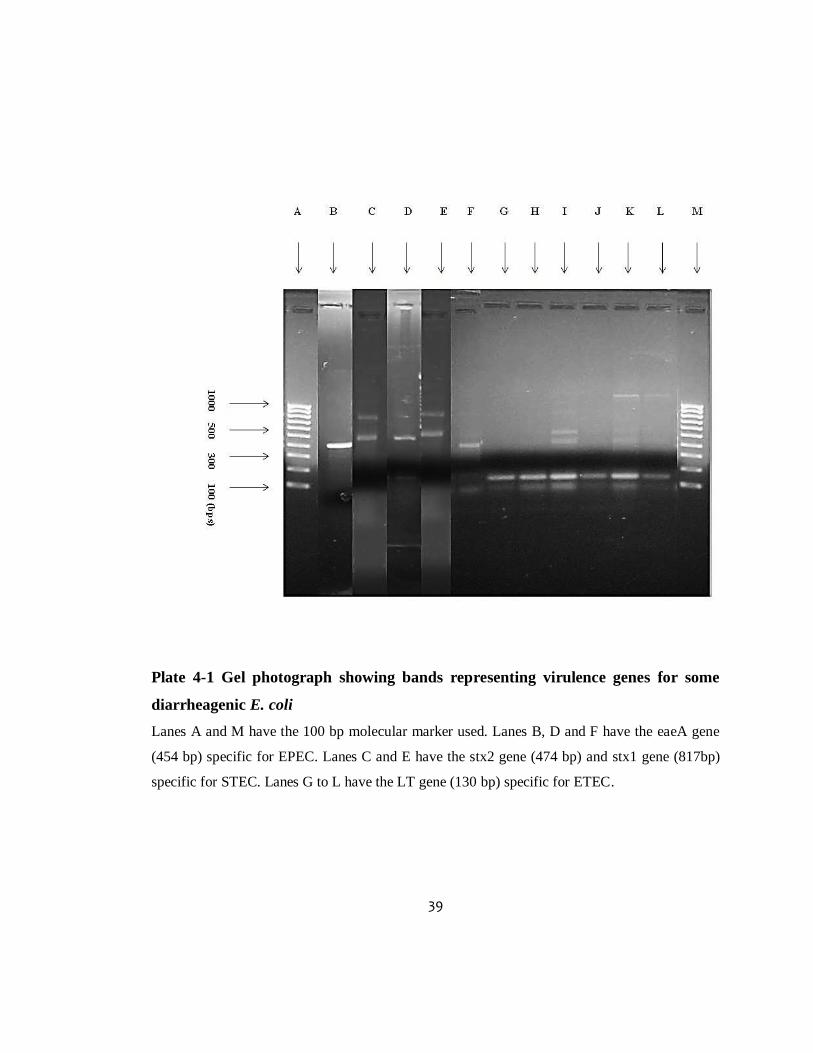
39
Plate 4-1 Gel photograph showing bands representing virulence genes for some
diarrheagenic E. coli
Lanes A and M have the 100 bp molecular marker used. Lanes B, D and F have the eaeA gene
(454 bp) specific for EPEC. Lanes C and E have the stx2 gene (474 bp) and stx1 gene (817bp)
specific for STEC. Lanes G to L have the LT gene (130 bp) specific for ETEC.
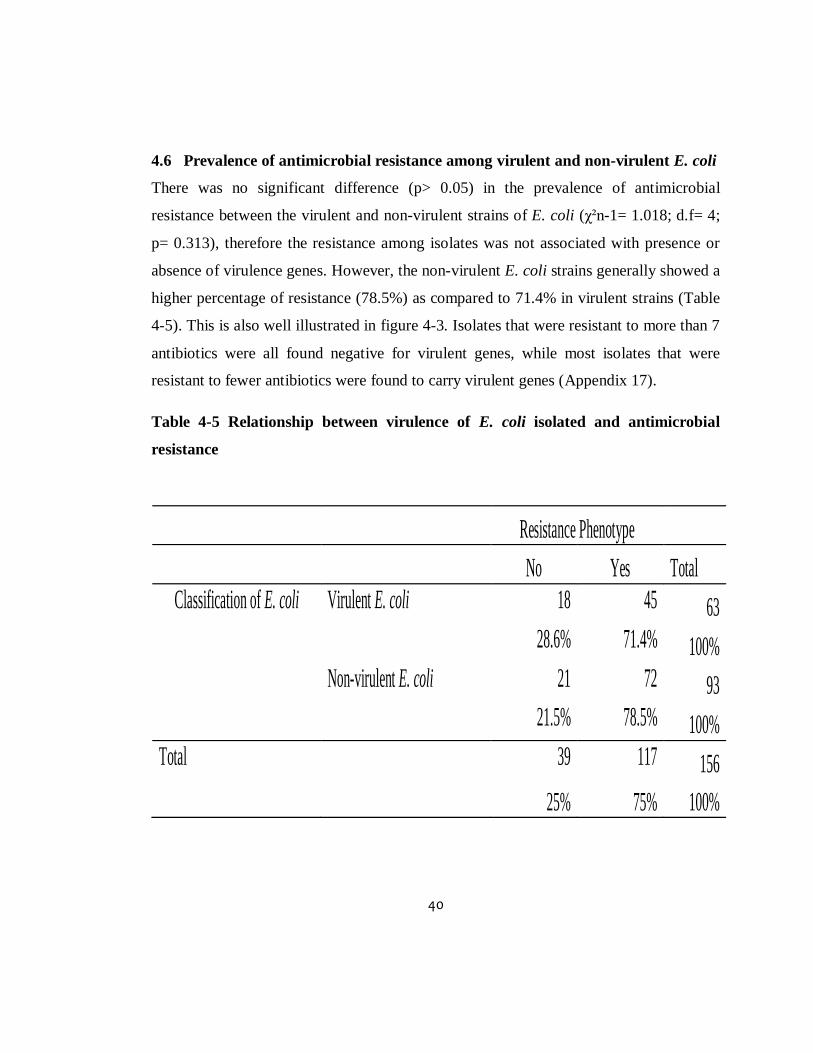
40
4.6 Prevalence of antimicrobial resistance among virulent and non-virulent E. coli
There was no significant difference (p> 0.05) in the prevalence of antimicrobial
resistance between the virulent and non-virulent strains of E. coli (χ²n-1= 1.018; d.f= 4;
p= 0.313), therefore the resistance among isolates was not associated with presence or
absence of virulence genes. However, the non-virulent E. coli strains generally showed a
higher percentage of resistance (78.5%) as compared to 71.4% in virulent strains (Table
4-5). This is also well illustrated in figure 4-3. Isolates that were resistant to more than 7
antibiotics were all found negative for virulent genes, while most isolates that were
resistant to fewer antibiotics were found to carry virulent genes (Appendix 17).
Table 4-5 Relationship between virulence of E. coli isolated and antimicrobial
resistance
Resistance Phenotype
No Yes Total
Classification of E. coli Virulent E. coli 18 45 63
28.6% 71.4% 100%
Non-virulent E. coli 21 72 93
21.5% 78.5% 100%
Total 39 117 156
25% 75% 100%
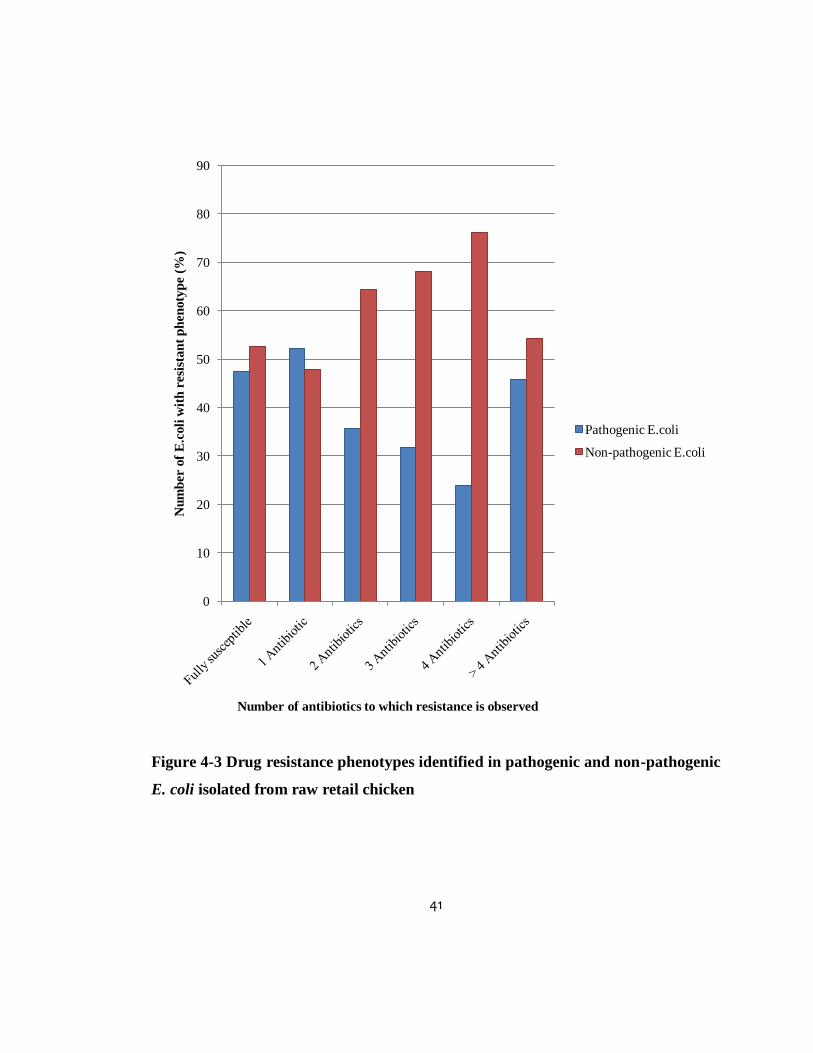
41
Figure 4-3 Drug resistance phenotypes identified in pathogenic and non-pathogenic
E. coli isolated from raw retail chicken
0
10
20
30
40
50
60
70
80
90N
um
ber o
f E
.coli
wit
h r
esi
stan
t p
hen
oty
pe (
%)
Number of antibiotics to which resistance is observed
Pathogenic E.coli
Non-pathogenic E.coli
42
4.7 Conjugative transfer of resistance from resistant E. coli to non-resistant
recipient
A total of 56 E. coli isolates that were resistant to 3 or more antibiotics were subjected to
in-vitro conjugation using E. coli J53 strain as the recipient. Fifty five percent (31) of the
isolates successfully transferred resistance to at least one antibiotic while 25 were
unsuccessful. The 31 successful trans-conjugants were then subjected to antibiotic
susceptibility tests using the same antibiotics that had previously been used for the
donors. The resistance profiles exhibited by the donors and the trans-conjugants after
successful conjugation are shown in table 4-6. Seventeen of the 31 trans-conjugants
(58%) received resistance determinants to at-least 1 antibiotic. Fourteen (42%) trans-
conjugants received the full antibiotic resistance profile from the donors.
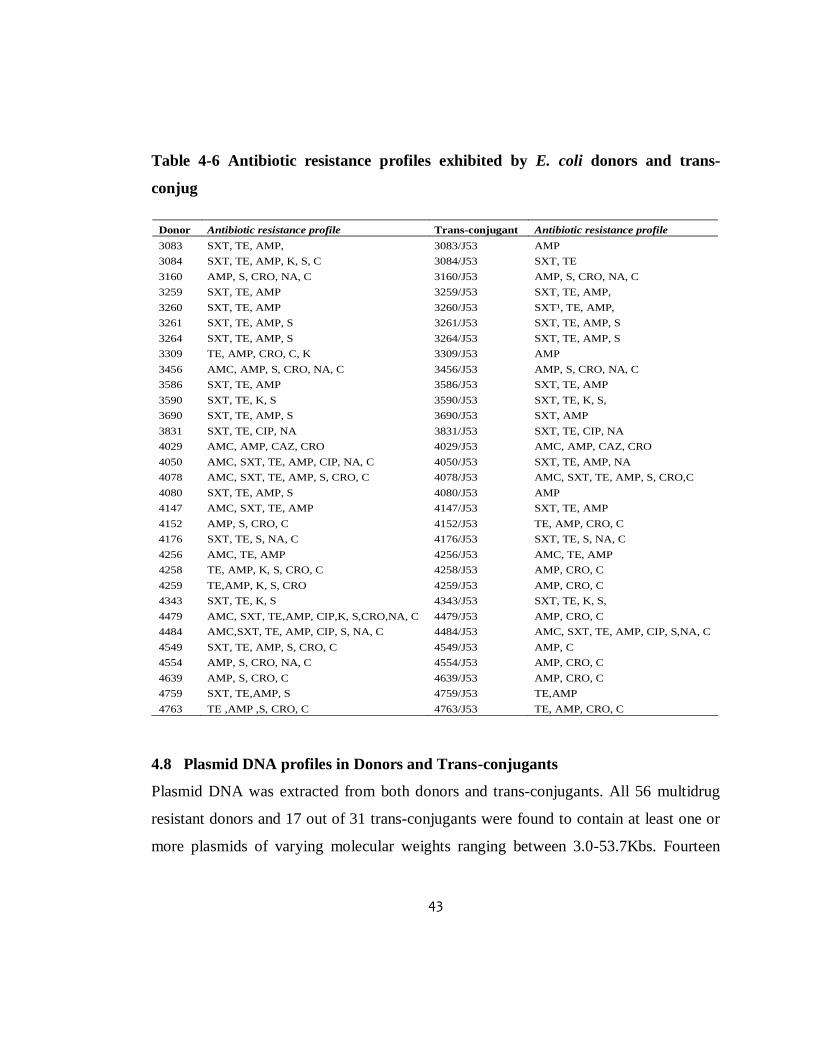
43
Table 4-6 Antibiotic resistance profiles exhibited by E. coli donors and trans-
conjug
Donor Antibiotic resistance profile Trans-conjugant Antibiotic resistance profile
3083 SXT, TE, AMP, 3083/J53 AMP
3084 SXT, TE, AMP, K, S, C 3084/J53 SXT, TE
3160 AMP, S, CRO, NA, C 3160/J53 AMP, S, CRO, NA, C
3259 SXT, TE, AMP 3259/J53 SXT, TE, AMP,
3260 SXT, TE, AMP 3260/J53 SXT¹, TE, AMP,
3261 SXT, TE, AMP, S 3261/J53 SXT, TE, AMP, S
3264 SXT, TE, AMP, S 3264/J53 SXT, TE, AMP, S
3309 TE, AMP, CRO, C, K 3309/J53 AMP
3456 AMC, AMP, S, CRO, NA, C 3456/J53 AMP, S, CRO, NA, C
3586 SXT, TE, AMP 3586/J53 SXT, TE, AMP
3590 SXT, TE, K, S 3590/J53 SXT, TE, K, S,
3690 SXT, TE, AMP, S 3690/J53 SXT, AMP
3831 SXT, TE, CIP, NA 3831/J53 SXT, TE, CIP, NA
4029 AMC, AMP, CAZ, CRO 4029/J53 AMC, AMP, CAZ, CRO
4050 AMC, SXT, TE, AMP, CIP, NA, C 4050/J53 SXT, TE, AMP, NA
4078 AMC, SXT, TE, AMP, S, CRO, C 4078/J53 AMC, SXT, TE, AMP, S, CRO,C
4080 SXT, TE, AMP, S 4080/J53 AMP
4147 AMC, SXT, TE, AMP 4147/J53 SXT, TE, AMP
4152 AMP, S, CRO, C 4152/J53 TE, AMP, CRO, C
4176 SXT, TE, S, NA, C 4176/J53 SXT, TE, S, NA, C
4256 AMC, TE, AMP 4256/J53 AMC, TE, AMP
4258 TE, AMP, K, S, CRO, C 4258/J53 AMP, CRO, C
4259 TE,AMP, K, S, CRO 4259/J53 AMP, CRO, C
4343 SXT, TE, K, S 4343/J53 SXT, TE, K, S,
4479 AMC, SXT, TE,AMP, CIP,K, S,CRO,NA, C 4479/J53 AMP, CRO, C
4484 AMC,SXT, TE, AMP, CIP, S, NA, C 4484/J53 AMC, SXT, TE, AMP, CIP, S,NA, C
4549 SXT, TE, AMP, S, CRO, C 4549/J53 AMP, C
4554 AMP, S, CRO, NA, C 4554/J53 AMP, CRO, C
4639 AMP, S, CRO, C 4639/J53 AMP, CRO, C
4759 SXT, TE,AMP, S 4759/J53 TE,AMP
4763 TE ,AMP ,S, CRO, C 4763/J53 TE, AMP, CRO, C
4.8 Plasmid DNA profiles in Donors and Trans-conjugants
Plasmid DNA was extracted from both donors and trans-conjugants. All 56 multidrug
resistant donors and 17 out of 31 trans-conjugants were found to contain at least one or
more plasmids of varying molecular weights ranging between 3.0-53.7Kbs. Fourteen
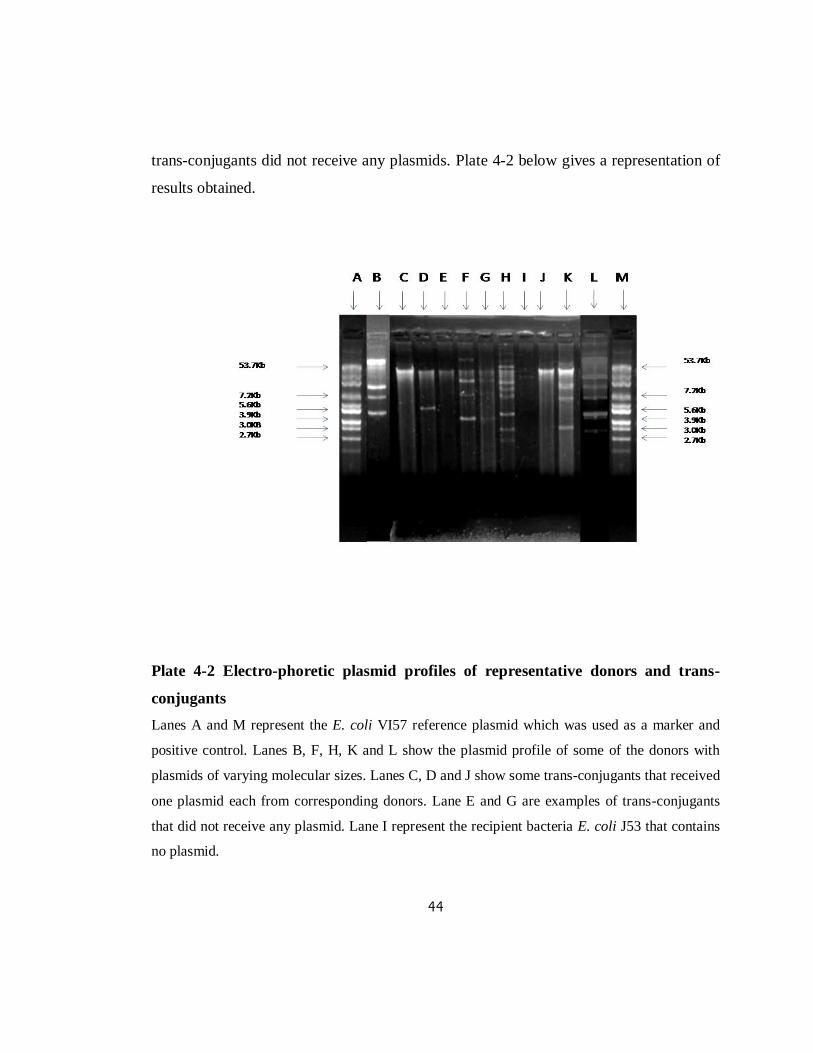
44
trans-conjugants did not receive any plasmids. Plate 4-2 below gives a representation of
results obtained.
Plate 4-2 Electro-phoretic plasmid profiles of representative donors and trans-
conjugants
Lanes A and M represent the E. coli VI57 reference plasmid which was used as a marker and
positive control. Lanes B, F, H, K and L show the plasmid profile of some of the donors with
plasmids of varying molecular sizes. Lanes C, D and J show some trans-conjugants that received
one plasmid each from corresponding donors. Lane E and G are examples of trans-conjugants
that did not receive any plasmid. Lane I represent the recipient bacteria E. coli J53 that contains
no plasmid.
45
CHAPTER FIVE
DISCUSSION
5.1 Contamination levels in raw retail chicken by E. coli and E. coli/coliform count
It has been reported in many studies that contamination of raw retail chicken by E. coli
is a major public health concern worldwide and it is an indication of faecal
contamination along the value chain (Ruzauskas et al., 2010; Hammerum and Heuer,
2009; Nzouankeu et al., 2010).
In the current study, the overall E. coli contamination level was 78%. The contamination
level observed in this study was lower than observed in studies conducted in other
developing countries. For instance, contamination levels of 98% in the north east part of
India, 100% in Cameroon, 100% in Vietnam (Saikia and Joshi, 2010; Nzouankeu et al.,
2010; Thangh Huong et al., 2009) but much higher than others; 43% in Morocco, 41.7%
in Lithuania and 16% in Nigeria (Cohen et al., 2007; Modestas et al., 2010; Adesiji et
al., 2011).
Similarly, high levels have been observed in studies from developed countries.
Contamination levels as high as 100% were found in a study conducted in Japan, 89% in
the state of Minnesota, U.S.A, 80% in four other states in the U.S.A and 90% in two
states in Australia (Ashraf et al., 2009; Johnson et al., 2003; Zhao et al., 2012; Pointon
et al., 2008). These contamination levels prove that there is high microbial cross
contamination during production of retail chicken meats in slaughter and post slaughter
processing in most countries, both developed and developing including Kenya and thus
extra attention needs to be paid in these areas.
The mean E. coli and coliform counts for all samples were beyond the acceptable range
counts as set by the Hazard Analysis and Critical Control Point system (HACCP),
46
developed by Food and Agriculture Organization (FAO) and adopted by the Codex
Alimentarius Commission in order to identify specific hazards and measures to ensure
safety of food. According to this system, the acceptable food safety range for raw meats
is 100 cfu/ml or less (2.000 Log₁₀ cfu/ml or less), the marginal or intermediate range is
over 100 cfu/ml but not above 1000 cfu/ml (over 2.000 but not above 3.000 Log₁₀
cfu/ml) and the unacceptable range is above 1000 cfu/ml (above 3.000 Log₁₀ cfu/ml)
(Meng et al., 2001; Food Safety and Inspection Service, 1996). Only 80 (40%) out of
200 retail chicken samples that were purchased fell under the acceptable range results
for E. coli counts while 60% of the samples fell under the marginal and unacceptable
ranges. 76% of samples fell under the unacceptable range results for coliform counts.
Similar observations were seen in studies in most developing countries. For example a
study in Hanoi, Vietnam found that the percentage of retail chicken samples which were
unacceptable for each microbial criterion was 72.09% for Coliform counts and 59.3%,
for E. coli count (Thangh Huong et al., 2009). Two other studies in Morocco recorded
22.4% and 62% chicken samples falling within unacceptable range, (Cohen et al., 2007;
Amara et al., 1995). The current study merely discusses un-investigated factors within
this study that could explain the contamination levels observed and the presence of a
large number of retail chicken meats with unacceptable ranges of E. coli/coliform count.
The factors discussed by the current study require more detailed studies in future to
conclusively determine the main factors responsible for the results obtained.
Unhygienic practices during slaughter and processing is a possible major cause of
contamination. In Nairobi, there are few private chicken slaughter houses such as
Kenchic Limited, Alpha fine foods Ltd and Gourmet food products Ltd and only a few
municipal chicken slaughter houses which are strictly guided by government laws and
regulations and where stringent bio security measures are strictly observed. Such
slaughter houses are provided with compulsory hygienic measures to be followed during
47
the various processing steps in the manufacture of chicken and their products thus
minimizing microbial contamination. These hygienic measures include but are not
limited to; restricting the entrance to slaughter establishments only to authorized
individuals, adopting an all-in all-out single age group principle in the establishment,
control entry of rodents into the establishment, regular cleaning and disinfection of the
establishment as well as machines and equipments used, adequate personal hygiene of
the personnel and regular disinfection of the water delivery system (Nasser et al., 2006;
Nyaga, 2007).
Furthermore, most of these private companies such as Kenchic limited own laboratories
used to monitor vaccination efficacy in the flocks, test environmental samples from the
houses during cleaning and carry out routine disease diagnostic services. Unfortunately,
there are large numbers of chicken slaughtered in homes of small scale poultry
producers whose hygienic standards cannot be strictly controlled and are thus considered
potential risks for contamination due to bio-security flaws (Andrea, 2010).
A second possible factor could be unfavourable cold chain temperature conditions
during transport of chicken carcasses from the slaughter house to the retail outlets. A lot
of meat products from the small scale farmers do not necessarily undergo cold storage
after slaughter nor during transportation to markets often far away in urban centres. The
production of such poor quality meat predisposes it to early spoilage as well as posing a
threat to the health of the consumer. An unpublished study by a student in the University
Of Chiang Mai Vietnam in the year 2007 showed that meat products that are transported
in ambient temperatures have a higher contamination rate compared to meat products
that are cooled during transport (Van Tuat, 2007).
Another common observation in Nairobi in the transport and packaging of local
butchery chicken meats is that instead of individual packaging of each chicken carcass,
48
the carcasses tend to be lumped together in one large container or sack as they are
transported thus exposing them to the open air in which the hygienic standards cannot be
met. This can also lead to transfer of contaminants from one carcass whose gut contents
might have spilled on the carcass surface to the surface of other clean carcasses and
subsequent microbial multiplication. Studies in Iran and Switzerland confirm this fact as
they were able to show that there were significant differences in contamination rates
between packed and unpacked chicken meat samples (Vaskas et al., 2012; Regula et al.,
2003). Suppliers for supermarkets and mega stores on the other hand use cold chain and
a more hygienic approach and appropriately deliver the meat and its related products in
sterilized packages (Popkin, 2006).
A third possible factor could be the display and storage practices of the raw chicken
carcass at the local retail outlets. Lack of use of proper storage methods such as freezing
was observed at some retail outlets irrespective of any prevailing general practice of
hygiene. This could have contributed to microbial contamination. Most retail outlets
where the chicken samples were purchased also displayed their retail products in glass
display cabinets that lacked sufficient cooling temperatures. It was observed that most
raw chicken on display for sale were displayed together with other types of meat such as
beef, mutton, fish and offals such as the liver, kidneys and even the intestines. The
degree of physical contact between these different kinds of meat on display could have
led to an exchange and transfer of E. coli and other coliform contaminants to the retail
chicken meats. The equipment for handling the raw chicken meat in the butcheries such
as knives, weighing scale and chopping surfaces were the same equipment used to
handle other kinds of meat thus a potential contributor to contamination on the raw
chicken (FAO, 2008).
Mean E. coli/coliform counts in samples from supermarkets were within acceptable food
safety ranges (0.9375/1.7237 Log₁₀ cfu/ml) while samples from the rest of the retail
49
outlets had marginal and unacceptable counts of above 2.000 Log₁₀ cfu/ml. ANOVA
analysis revealed that there were significant differences in the E. coli counts (F (4,175)
=16.676; MSE=106.576; p< 0.001) and coliform counts (F (4,179) =18.37;
MSE=105.097; p< 0.001) among the groups with supermarkets having the lowest E. coli
and coliform counts compared to the rest. Butcheries from high income areas followed
closely with less E. coli counts but high coliform counts. The other three groups (High-
middle income, Low-middle income and low income area butcheries) had higher E.
coli/coliform counts.
These results corresponded closely to those obtained from a study in Philadelphia that
sought to determine differences in microbial quality of foods available to populations of
differing socio-economic status (Koro et al., 2010). The study found that raw poultry,
available in markets in low-socio economic status had higher microbial indicator counts
compared to markets in high-socio economic status. There could be a number of reasons
as to the observations made and this study suggests the following.
This observation could be attributed to the differences in source of the chicken for each
market. As indicated on the packaging of the samples, all samples from supermarkets
and a majority of samples from high income butcheries were products of government
approved private chicken slaughter houses (mainly observed were Kenchic Ltd and
Alpha fine foods Ltd) which are governed by laws and regulations and where stringent
bio security measures are strictly observed from production to marketing of chicken and
their products (Nyaga, 2007). On the other hand, majority of samples from the other
retail categories were supplied by small scale poultry producers who may not abide by
such regulations and as such, gaps may exists in the bio-security measures along the
production line.
50
Another possible factor that could be attributed to this difference is a disparity in
hygienic measures among the classifications that were studied. General observation
showed that hygienic conditions in supermarkets and butcheries from high income areas
were better compared to the hygienic conditions in butcheries from middle and low
income areas. Furthermore, as indicated before, samples from supermarkets were
wrapped individually from the slaughter area and subjected to immediate freezing
temperatures and maintained at adequate refrigeration from the processing to the retail
level.
Inappropriate handling, especially in retail butcheries of middle to low socio-economic
status may have an impact on cross contamination of bacteria in raw chicken products. It
is notable that few samples from high middle income and low income areas showed
acceptable levels of E. coli and coliform counts (as low as 1 cfu/ml). This was attributed
to the use of freezing conditions for storage in these outlets. Thus, freezing of retail
chicken is considered an important factor in reducing microbial contamination and
multiplication (Jakabi et al., 2005). However, it was also observed that at least four
samples from supermarkets had E. coli and coliform counts beyond the acceptable range
of food safety even though they were displayed under refrigeration. This shows that the
spread of contamination is not only confined to seemingly unhygienic environments
(Sackey et al., 2001).
In contrast to the findings in this study, Adu-Gyamfi and colleagues, (2012) from Accra,
Ghana, in the effort to determine the microbiological quality of chicken sold at different
retail outlets (Supermarkets, local markets and farms), found that even though hygienic
conditions in supermarkets were generally better than those in local markets and farms,
there was no significant difference (P>0.05) between the mean total viable count, total
coliform counts and Staphylococcus aureus counts for these retail groups. The different
retail outlets all had low microbial counts (Adu-Gyamfi et al., 2012). The study
51
attributed this observation to the efforts in improving the hygienic procedures in the
processing of poultry over the years. Such efforts included de-contaminating chicken
meat by addition of chemicals to the processing water, irradiation by exposing the
chicken to ionising radiations as well as use of improved storage methods such as
freezing in most of these retail outlets in addition to the prevailing hygienic conditions
that were already observed.
5.2 Prevalence of antimicrobial resistant E. coli isolated from raw retail chicken
In this study, 75% of the E. coli isolated exhibited resistance to at least one of the 12
antibiotics that were tested. Similar prevalence of antibiotic resistance in E. coli isolated
from retail chicken have been observed in other studies ranging from 40.6% in Japan,
52% in Iceland, 84.6% in Minneapolis, U.S.A, 83.8% in Vietnam and even 100%
isolates in Senegal being resistant to one or more antibiotics (Ashraf et al., 2009;
Thorsteinsdottir et al., 2010a; Van et al., 2007; Johnson et al., 2005; Fofana et al.,
2006). Such prevalences are alarming given the evidence of possible transmission of
antibiotic resistant food borne bacteria to consumers and food preparers (Bester and
Essack, 2010).
Presence of antimicrobial resistant E. coli in retail chicken meat is just one aspect of the
much wider public health problems associated with antibiotic resistance in bacteria. In
an effort to determine whether there was a difference in antimicrobial resistance between
different types of food samples, Johnson et al., (2005) found poultry having the highest
prevalence of resistant E. coli compared to the rest of the food groups. This shows the
important role that chicken plays as a reservoir of resistant bacteria that may spread to
the human population.
The current study demonstrated higher prevalence of resistance to certain antimicrobial
agents such as tetracycline (60.3%), SXT (49.4%), streptomycin (30.1%) and ampicillin
52
(34.0%). Other studies in Japan, Vietnam, Saudi Arabia and Slovakia on E. coli in retail
chicken have also shown high prevalences of resistance to these commonly available
antimicrobials (Ashraf et al., 2009; Al-Ghamdi et al., 1999; Ruzauskas et al., 2010;
Thangh Huong et al., 2009). These resistance phenotypes observed in E. coli are of great
clinical significance since these antimicrobials are considered to be among the frontline
therapeutic drugs for treatment of most bacterial infections in humans (Todar, 2012). In
Kenya, where alternative choices for treatment are either too expensive or unavailable,
this poses a major public health challenge.
One reason that could explain the high prevalence of resistance in E. coli to these
antimicrobials could be because of their frequent use in live chicken for therapeutic
purposes as well as enhanced growth promotion. Mitema and associates (2001) made an
assessment of antimicrobial consumption in food producing animals in Kenya and were
able to show that tetracyclines, sulphonamides and trimethoprins, nitrofurans,
aminoglycosides, beta lactams and the quinolones were the most commonly used drugs
in food producing animals. Tetracyclines and sulphonamides/trimethoprin topped the list
in popularity and accounted for nearly 78% of the use. Nonga and colleagues (2009) in
Tanzania showed similar results.
Such use has been shown to result in the development of resistant bacteria which can
then reach heavily exposed individuals such as slaughter house workers, food handlers
and farmers who feed the animals with the antimicrobials (Hammerum and Heuer,
2009). These resistant bacteria can then easily contaminate the carcasses of food animals
along the production line to the retail outlets. Hammerum and Heuer (2009) also
reviewed findings from other studies regarding E. coli from the animal reservoir that
carry resistance to antimicrobial agents and revealed that since the 1990‟s, Extended
Spectrum Beta Lactamase producing E. coli (ESBL‟s) have been detected in retail meat
and production animals in Europe, Asia, Africa and the United states and attributed this
53
observation to the use of 3rd
generation cephalosporins in food animals. They also
showed that fluoroquinolone resistance could arise in the intestines of poultry from
susceptible E. coli ancestors and subsequently be transmitted to humans via the food
chain.
In contrast to the current study, Ashraf and colleagues in Japan observed a high
resistance involving antibiotics which are considered to be critically important for
human health care following failure of first line antimicrobials. The study showed much
higher resistances towards ampicillin (73.9%), the aminoglycosides (streptomycin
(66.6%), Kanamycin (55.1%), Gentamicin (7.2%)), the Quinolones and
fluoroquinolones (Nalidixic acid (47.8%) and ciprofloxacin (30.4%)), the beta-lactamase
inhibitor Augmentin (14.5%) and even the 3rd
generation cephalosporin, Ceftazidime
(13%) (Ashraf et al., 2009). It has been documented (Turnidge, 2003) that there is an
indiscriminate use of antibiotics in Japan in both food animals and humans and this
could be the reason for this difference.
It is interesting to note that studies in Japan, China, Slovakia and Lithuania all
characterising antimicrobial resistance on E. coli isolated in live and raw retail chicken
show that a high number of E. coli (>50%) have a high resistance to fluoroquinolones
and this has been associated to widespread use of quinolones and fluoroquinolones
especially as feed additives (Ashraf et al., 2009; Dai et al., 2008; KmeŤ and KmeŤova,
2010; Lei et al., 2010; Ružauskas et al., 2010; Thangh Huong et al., 2009; Yang et al.,
2004). This study however, observed low resistance levels towards fluoroquinolones as
compared to the rest (14.7% for Nalidixic acid and 4.5% for Ciprofloxacin). This might
be due to the fact documented by Mitema and colleagues (2001) in a study in Kenya that
showed use of quinolones and cephalosporins is not common in animal food production.
54
5.4 Association between antimicrobial resistance and retail outlet classification
There was no significant difference in distribution of the resistance phenotype among
the 5 classifications of retail outlets (χ²n-1= 4.178; d.f= 4; p= 0.382). However, E. coli
isolated from samples from supermarkets showed a high frequency of antimicrobial
resistance (84.6%) while isolates from samples from low income areas had the least
frequency of resistance (62.5%). This might be hypothetically attributed to the critical
link that exists between antimicrobial consumption in food animals and subsequent
antimicrobial resistance in bacteria isolated. Two studies, one from Uganda and the
other from Iceland (Majalija et al., 2010; Thorsteinsdottir et al., 2010b), on
antimicrobial resistance in E. coli isolated from food animals have shown that broiler
chicken production has been associated with a high prevalence of antimicrobial
resistance in isolates from these chickens due to consumption of antimicrobials.
Even though numbers were not considered, the current study observed that most of the
samples from supermarkets were improved breeds of chicken/broilers while most
samples from low income areas were from local/indigenous chicken breeds. It is a
common practice for broiler chicken producers in Kenya to include additives in the
commercial feeds of broiler chicken (Mitema et al., 2001).
Several classes of antibiotics are included as additives for growth promotion and
prevention of infectious diseases (Butaye et al., 2003; Singer and Hofacre, 2006). These
antibiotics improve feed conversion and body weight gain, presumably by altering the
composition and activities of micro flora, such that a one day old bird is able to grow
fast and be marketed within a period of less than 2 months (Knarreborg et al., 2002).
This practice may modify the intestinal flora and create a selective pressure in favor of
resistant bacteria (Diarra et al., 2007).
55
On the other hand, indigenous chicken production in most African countries including
Kenya are traditionally based on free range breeding systems where birds scavenge for
feed around the home environment and at times they may even be given home food left-
overs. If the farmer can afford it, they are provided with supplementary feed like maize
grains, cassava, sweet potatoes or commercial feed (Nyaga, 2007). As estimated by
Upton (2004) they reach a mature and marketable age by 225 days or almost 8 months.
Therefore, indigenous chicken breeds are less exposed to undue antimicrobial
consumption as compared to improved breeds.
The current study suggests that this may explain why E. coli in samples from most low
income area butcheries that were a market for only indigenous chicken showed least
tendency to antimicrobial resistance. A more comprehensive study is required to
establish this hypothesis.
5.5 E. coli isolates harbouring virulence markers
Chicken meat contaminated with pathogenic bacteria is a big health concern as poultry
contribute substantially to the human diet as an important source of animal protein thus
has a direct impact on human health. Pathogenic E. coli that contaminates chicken
results in significant numbers of diarrheagenic food poisoning cases as well as extra
intestinal diseases (Hazell, 2012; Rane, 2011). The current study recorded 40.4% of the
E. coli contaminants that carried at least one of the 10 virulence genes tested and
specific for 5 known diarrheagenic E. coli. Of the E. coli positive for virulence genes in
this study, ETEC was the most common pathogenic E. coli (61%) followed by EPEC
(21%), STEC (8%), EIEC (6%) and EAEC (5%).
Similar studies also showed presence of E. coli contaminants harbouring virulence genes
in fresh meat. These include studies done in Burkina Faso with 43% pathogenic E. coli,
Korea (14%) and Lebanon (14%) (Kagambega et al., 2012; Lee et al., 2009; El-Rami et
56
al., 2012). Results from the studies mentioned above were also similar in showing that
ETEC, EPEC and STEC were the most common diarrheagenic E. coli detected among
poultry E. coli contaminants.
A reason for these observations could be because ETEC, EPEC and STEC are much
frequently implicated in various food and water borne diseases and they are known
contaminants of meat and meat products (CDC, 2012; Feng et al., 2011). A Canadian
study also showed that live chicken and other food animals are known reservoirs of
these pathogenic E. coli therefore contamination could actually be from the animal
during evisceration or even from water used during their processing (Bergeron et al.,
2012).
On the other hand EIEC and EAEC are not implicated much in food and water borne
illnesses and there are no known animal reservoirs for these pathogens hence any
primary source of contamination appears to be infected humans (Feng et al., 2011;
Smith et al., 2004). Another reason for this observation is that ETEC had several
virulent gene markers and thus could be easily detected more than the others. In any case
this observation might indicate poor sanitation at any stage of production and processing
of the retail chicken which needs to be thoroughly investigated and addressed.
5.6 Association between antibiotic resistance and virulence genes in E. coli isolated
The interplay between virulence and antibiotic resistance in E. coli is an area that still
deserves much study. Findings from research published to date indicate there is a strong
link between resistance and virulence (Johnson and Nolan, 2009). The majority of
virulence associated plasmids in E. coli belong to the F incompatibility group that
performs transfer functions and often carry antimicrobial resistance determinants as well
and this may explain co-transfer of virulence and resistance factors when gut flora
including E. coli are under antimicrobial selective pressure (Villa et al., 2010). If
57
virulence genetic determinants are located on the same genetic platform as antimicrobial
resistance genes such as plasmids, they may be co-mobilized. Chicken and pork E. coli
isolates have been shown to exhibit a higher degree of resistance and more virulence
genes than any other meat. Some multi-resistant strains have even been shown to carry
from 6-9 virulence genes (Ewers et al., 2009; Hao-Van et al., 2008).
A good example is EHEC (E. coli O157:H7), which is an E. coli pathotype, that has
known virulent strains. Due to its virulence potential, it is one of the most threatening
serotypes and yet it is known to exhibit a high degree of antibiotic resistance (De Silva
and Mendonca, 2012). Several studies from Asia, Europe and North America have
shown that E. coli O157 co-expresses both resistance genes and virulence determinants
but little is known on the genetic mechanism facilitating the acquisition and transmission
of both traits at the same time (Ateba & Bezuidenhout, 2008; Galland et al., 2001; Mora
et al., 2005; You et al., 2006).
In the current study however, there was no significant association between antibiotic
resistance and presence of virulence genes (χ²n-1= 1.018; d.f= 4; p= 0.313). On the
contrary E. coli isolates that did not carry any virulence genes had more resistance
(78.5%) compared to the isolates that had virulence genes (71.4%) but the difference
was not significant. Conflicting data such as the one in this study on the association of
virulence and antibiotic resistance have also been published and have shown that at least
in certain strains, a co-relation between these two factors is not significant. For example
Orden and colleagues in a study from Argentina in STEC, isolated from diarrheic dairy
calves, were shown to exhibit very low degrees of multidrug resistance. They also
showed that Necro-Toxigenic E. coli (NTEC) with low multidrug resistance has been
shown to concurrently express many virulent determinants (Orden et al., 2000).
58
Conversely, another strain which showed very high level of multidrug resistance was
detected among low frequency virulent strains suggesting that low frequency of
virulence factors may be associated with a high multiple resistance to antibiotics (Cid et
al., 1996). Johnson and colleagues (2006) compared similarities between human and
chicken E. coli isolates in relation to ciprofloxacin resistance and found that antibiotic
susceptible human E. coli isolates contained more virulence associated genes and more
frequently expressed virulence-associated O antigens than did resistant human or
chicken E. coli isolates. A study by Blaquez and associates (1999) concluded that in
bacteria, increasing the number of virulence factors will increase the antimicrobial
resistance until a certain limit and then the resistance decreases and sensitivity increases.
This was also confirmed by Marwa et al., (2012) who that showed antibiotic resistance
was increased by increasing the detected virulence genes until a certain cut-off limit was
reached from which the bacteria then starts to become totally susceptible. Where isolates
had none, 1 or 2 virulence genes, they showed a high degree of antibiotic resistance.
However, this had a cut-off of 2 virulence genes as isolates with 3 virulence genes were
more sensitive and those with 4 virulence genes were totally susceptible to all tested
antibiotics. The study went on to explain that when bacteria acquire either virulence
and/or resistance genes, it leads to bacterial fitness. But if the bacteria continue to
acquire these resistances, it may lead to a lethal amount of mutations or genetic re-
arrangements that reduces the bacterial fitness and affect the bacterial virulence by loss
of genes (Anderson and Hughes, 1996). The current study showed similar patterns as all
isolates that were resistant to more than 7 antibiotics were all found negative for virulent
genes, while most isolates that were resistant to fewer antibiotics were found to carry
virulent genes.
Although this current data can be viewed as re-assuring since it shows no association
between virulence and resistance, it is still evident that virulent and resistant E. coli are
59
being disseminated via the food chain by means of contaminated raw retail chicken
meat. This can be hazardous because these bacteria combine pathogenic potential with
resistance to first line therapeutic agents. It is also evident that non-virulent/commensal
E. coli have a high potential of disseminating resistance genes to the same first-line
therapeutic agents.
5.7 Co-transfer of antimicrobial resistance
In the current study, 55% of donor E. coli that exhibited resistances to at least 3
antibiotics were able to transfer antimicrobial resistance to sensitive recipient E. coli
bacteria. This has also been described in other studies which have shown the same
antimicrobial genes detected in isolates from both animal and/or meat are detected in
human isolates thus suggesting horizontal transfer (Schjorring and Krogfelt, 2010;
Corpet, 1993). Studies in Germany and by researchers in California University on
horizontal gene transfer showed that ampicillin and kanamycin resistances were
especially highly transferrable and common in Gram negative bacteria such as E. coli
(Smalla et al., 1993; Barlow, 2009). A thesis by Naliaka from Kenyatta University to
determine the possibility of transfer of resistance genes from resistant E. coli in broiler
chicken, also showed that at least 38% of isolates underwent successful conjugation
when subjected to such experiment and transferred their resistance to non-resistant
recipient bacteria (Naliaka, 2011).
Using animal models, researchers have also shown that the intestines are especially a hot
spot for the transfer of resistance genes between E. coli. For example, transfer of
resistance from E. coli of animal source to E. coli of human source in the intestines of
chicken and mice has been well demonstrated (Hart et al., 2006). Furthermore, transfer
of resistance between E. coli has even been demonstrated in the intestines of humans
whereby gene transfer is detected a few days after ingestion of the donor strain by
human volunteers (Smith, 1969; Trobus et al., 2008). These studies all demonstrate a
60
high probability of transfer of resistance genes between E. coli of animal/ chicken origin
and human origin in the intestine.
Plasmid content analysis of donors via gel electrophoresis showed that all 56 multi-drug
resistant donors used in the conjugation experiments contained more than one plasmid
varying in molecular sizes of 3.0-53.7 Kb. The donors that transferred their resistance
phenotypes to trans-conjugants can be said to have contained transferrable/conjugative
plasmids and were able to transfer their resistance determinants via conjugation using
these plasmids. Studies have shown the presence of transferrable plasmids and high
transfer potential in multi-drug resistant bacteria, including E. coli as evidenced by
similarities in antimicrobial resistance patterns observed between bacteria of the same
and even different species. For example, retail chicken wings sold in Halifax, Canada
contained E. coli isolates carrying CMY-2 bearing plasmids responsible for resistance
towards cephalosporins as well as other resistance genes that can be transferred to other
pathogens (Forward et al., 2004).
Similarities were found between the CMY-2 plasmids in these E. coli and the CMY-2
plasmids in Salmonella isolates suggesting that the CMY-2 plasmids were transmitted
between the 2 genera of bacteria. Another study revealed E. coli isolates carrying
varying amounts of plasmid numbers, of up to 8 plasmids, with each plasmid containing
antibiotic resistance genes to various antibiotics (Nariman et al., 1998). The study by
Nariman interestingly noted that majority of the E. coli strains isolated that carried a low
number of plasmids were resistant to most of the antibiotics tested while strains that
carried high number of plasmids were susceptible to most of the antibiotics tested. This
observation was also seen in the current study.
Plasmid were observed in some but not all trans-conjugants even though the
antimicrobial resistance profiles showed the trans-conjugants had indeed received
61
resistance phenotypes to antibiotics from the donors. Out of 31 trans-conjugants, only 17
showed at least one plasmid band each when observed in the gel after gel
electrophoresis. Results such as these, whereby plasmids can be observed in donors but
cannot be observed in successive trans-conjugants even though resistant determinants
were transferred, could be explained by a couple of factors.
The trans-conjugant might have received limited copy number plasmids/stringently
controlled plasmids thus interfering with efficiency of replication. Having a low copy
number plasmid also makes it difficult to purify the plasmid away from the
chromosomal DNA or to observe it on the gel (Watve et al., 2010; Del Solar and
Espinosa, 2000).
In addition, other mobile genetic elements known as integrative and conjugative
elements (ICE‟s) that also mediate horizontal gene transfer and disseminate resistance
genes via conjugation could be responsible for the resistance gene transfers. These
elements are self-transmissible (promote their own mobilization) and are increasingly
recognized to contribute to lateral gene flow in prokaryotes. ICE‟s integrate into the
donor/host bacterial genome but have intricate regulatory systems that control excision
of the ICE from the chromosome and then like conjugative plasmids, disseminate by
conjugative transfer to new host transferring both antimicrobial resistance genes and
even virulence factors (Burrus and Waldore, 2004; Wozniak and Waldor, 2010).
Several entities discovered more than a decade ago that had previously been classified as
plasmids or conjugative transposons have now been defined as ICE‟s (Te Poele et al.,
2008). Therefore, presence of the resistant phenotype in these trans-conjugants from the
donor bacteria could be as a result of these Integrative and Conjugative Elements which
could not be seen in the gel. This is an interesting area that deserves special attention to
determine which of the two elements plays a major role in gene transfer through
62
conjugation. Finally, the plasmids might have been super coiled or too small to be
detected in the gel. (Actis et al., 2000).
5.8 Conclusions
I. The study found that raw chicken meats sold in retail meat outlets in Nairobi,
Kenya have high contamination levels by E. coli and other coliform bacteria and
therefore are prone to quick spoilage and are a significant source for the
acquisition of pathogenic bacteria. Even though the sources of contamination
were not conclusively determined, it is speculated that cross contamination could
have occurred at any point between the farms to the retail continuum. The study
demonstrated that in terms of contamination levels, supermarkets are the best
retail source of purchasing raw chicken meat as their samples had lower
microbial loads (which fell under acceptable ranges) compared to the rest of the
retail outlets.
II. The study also concluded that there exists high antimicrobial resistance among E.
coli isolates in the chicken meat sold in various retail outlets in Nairobi and that
meat from supermarkets, regardless of their low microbial counts, can be
hypothetically implicated to have isolates with the highest prevalence in
antimicrobial resistance.
III. Chicken meat is one of the highest but under recognized risk-associated food
source in terms of contamination by both antibiotic resistant and virulent E. coli
that are able to disseminate these elements to other bacteria and subsequently
result to an increase to the already high antimicrobial resistance burden in the
population.
5.9 Recommendations
I. Since contamination of retail chicken meats can occur at any stage of production,
the study recommends that each sector in chicken production should develop and
63
apply efficient hygiene programmes which will be specifically adapted to their
relevant range of production. This includes measures that will guide in
prevention of microbial contamination from the beginning of production
(slaughter hygiene), minimizing growth in the middle of production (meat
cutting and transportation) and reducing or eliminating contamination at the final
processing stage (hygiene in the retail market).
II. The government should put extra effort in making sure that the bio-safety rules
that encompass all municipal and privately owned slaughter houses to be strictly
followed and adhered to by individuals who carry out home slaughter.
III. Prudent use of antimicrobials in food animals should be prioritized in order to
preserve these valuable drugs for use in both animals and human health.
IV. Continued and more rigorous surveillance of antimicrobial resistance in raw
meats such as chicken is urgently needed to establish trends of antimicrobial
resistance in Nairobi and the country at large to prevent the progressive carriage
of these resistance genes and minimize the likelihood of horizontal gene transfer
to other bacteria.
V. More studies should be carried out in ICE‟s to determine how big a role they
play in the transfer of genes from one bacteria to another.
VI. More studies in Kenya with comprehensive and substantial collections of
chicken samples and more investigations on risk factors urgently need to be done
and obtained data well documented in order to establish the situation on the
overall burden of contamination and antimicrobial resistance among E. coli from
raw retail chicken for risk assessment purposes as these bacteria together with
their mobile genetic elements carrying resistance and even virulence genes are
able to be transferred to the human population through such food products.
VII. The dynamics of the association between antimicrobial drug resistance and
presence of virulence genes is a complex area that still requires much research.
64
There is still a gap in understanding the genetic background of antibiotic
resistance and virulence of enteric bacteria from chicken or any other food.
Therefore the study recommends that this area be paid attention to.
5.10 Limitations of the study
Due to time and financial constraints, the exact source/sources of contamination by E.
coli and other coliform bacteria were not clearly defined in this study.
65
REFERENCES
Aarestrup, F. M., Seyforth, A. M., Emborg, H. D., Pedersen, K., Hendriksen, R.,
and Bager F. (2001). Effects of abolishment of the use of antimicrobial agents
for growth promotion on occurrence of antimicrobial resistance in faecal
enterococci from foods in Denmark. Antimicrobial agents and chemotherapy,
45, 2054-2059.
Actis, L., Tolmasky, M., and Crosa, J. (2000). Bacterial plasmids: Replication of extra
chromosomal genetic elements encoding resistance to antimicrobial compounds.
Frontiers in Bioscience, 4, 43-62.
Adesiji, Y. O., Alli, O. T., Adekanle, M. A., and Jolayemi J. B. (2011). Prevalence of
Arcobacter, Escherichia coli, Staphylococcus aureus and Salmonella species in
Retail raw chicken, pork, beef and goat meat in Osogbo, Nigeria. Sierra Leone
Journal of Biomedical Research, 3, 8-12.
Adu-Gyamfi, A., Torgby-Tetteh, W., and Appiah, V. (2012). Microbiological quality
of chicken sold in Accra and determination of D10-value of E. coli. Journal of
Food and Nutrition Sciences, 3, 693-698.
Afullo, A., and Odhiambo, F. (2009). The primary solid waste storage gaps
experienced by Nairobi households. Ethiopian Journal of Environmental Studies
and Management, 2, 3
Algert, S. J., Agrawal, A., and Lewis D. S (2006). Disparities in access to fresh
produce in low income neighborhoods in Los Angeles. American Journal of
Preventative Medicine, 30, 365-370.
Al-Ghamdi, S. A., El-Morsy, F., Al-Mustafa, Z. H., Al-Ramadhan, M., and Hanif,
M. (1999). Antibiotic resistance of Escherichia Coli isolated from poultry
workers, patients and chicken in the eastern province of Saudi Arabia. Journal of
Tropical Medicine and International Health, 4(4), 278-283.
66
Amara, A., Ziani, Z., and Bouzoubaa K. (1995). Antibiotic resistance of Escherichia
coli strains isolated in Morocco from chickens with coccilobacillosis. Veterinary
Microbiology, 43, 325–330.
Anderson, D. I. D., and Hughes. (January 23rd
1996). Muller‟s ratchet decreases
fitness of DNA based microbes. Proceedings of the National Academy of
Sciences, U.S.A. 93, 906-907.
Anderson, K. L., Whitlook, J.E., and Harwood, V.J. (2005). Persistence and
differential survival of faecal indicator bacteria in subtropical water and
sediments. Applied and Environmental Microbiology, 71(6), 3041-3048.
Andrea, W. (July 25th
2010). Mobile slaughter houses will help small farmers. News
observer, p 3.
Andrew, W. H., and Hammack, T. S. (2003). Food sampling and preparation of
sample homogenate: Bacteriological Analytical Manual (8th
Ed) Revision A.
Retrieved June 20th 2011 from the Food and Drug Administration (FAO)
website: http://www.fda.gov/food/scienceresearch.
Angulo, F. J., Nargund, V. N., and Chiller T. C, (2004). Evidence of an association
between use of anti-microbial agents in food animals and anti-microbial
resistance among bacteria isolated from humans and the human health
consequences of such resistance. Journal of Veterinary Medicine, 51, 374–379.
AOAC, (2006). Official methods 966.24 for enumeration of Escherichia coli and
Coliform bacteria in raw meats. Retrieved on January 1st 2012 from Journal of
AOAC international website: http://www.3M.com/microbiology
Apata, D. F. (2009). Antibiotic resistance in poultry. International Journal of Poultry
Science, 8, 404-408.
Ashraf, M. A., Hirofumi, S., and Tadashi, S. (2009). Isolation and molecular
characterization of multidrug resistant strains of Escherichia coli and Salmonella
from retail chicken meat in Japan. Journal of food science, 74, 7.
67
Ateba, C. N., and Bezuidenhout, C. C. (2008). Characterization of Escherichia coli
O157 strains from humans, cattle and pigs in North-west province, South Africa.
International Journal of Food Microbiology, 128,181-188.
Bager, F. (2000). DANMAP: Monitoring antimicrobial resistance in Denmark.
International Journal of Antimicrobial Agents, 14(4), 271-274
Barlow, M. (2009). What antimicrobial resistance has taught us about horizontal gene
transfer. Methods in Molecular Biology, 532, 397-411.
Bauer, A. W., Kirby, W. M. M., Sherris, J. C., and Turk, M. (1966). Antibiotic
susceptibility testing by a standardized single disk method. American Journal of
Clinical Pathology, 45, 493–496.
Belluck, P. (1997). Federal inspectors seek source of Escherichia coli contamination.
Newyork times, p 1.
Bergeron, C. R., Prussing, C., Boerlin, P., Daignault, D., Dutil, L., Reid-Smith, R.,
and other aouthors (2012). Chicken as reservoir for extra-intestinal pathogenic
Escherichia coli in humans, Canada. Emerging Infectious Disease Journal, 18, 3.
Bester, L. A., and Essack, S. Y. (2010). Antibiotic resistance via the food chain: Fact or
fiction? South African Journal of Science, 106(9/10), 1-5.
Bilgili, S. F. (1999). Assuring the safety of poultry products in a global market: The US
perspective. 14th
European symposium on quality of poultry meat, 14, 513-519.
Blanc, V., Mesa, R., Saco, M., Lavilla, S., Prats, G., Miro, E., Navarro, F., Cortes,
P., and Llagostera, M. (2006). ESBL and plasmidic class C β-lactamase-
producing E. coli strains isolated from poultry, pig and rabbit farms. Veterinary
Microbiology, 118, 299–304.
Blaquez, R., Menasalvas, A., Carpena, I., Ramirez, C., Guerrero, C., and Moreno,
S. (1999). Invasive diseases caused by Ciprofloxacin resistant Uro-pathogenic
Escherichia coli. European Journal of Clinical Microbiology and infectious
Disease, 18, 503-505.
68
Borche E, Arinder P (2002). Bacteriological safety issues in beef and ready to eat meat
products as well as control measures. Meat Science, 62(3), 381-390.
Brill, R. (2007). Tiny bacteria loom large over processes of life. Honolulu Star Bulletin,
12, 77.
Burrus, V., and Waldor, M.K. (2004). Shaping bacterial genomes with integrative and
conjugative elements. Research in Microbiology, 155 (5), 376-386.
Busani, L., Scavia, G., Luzzi, I., and Caprioli, A. (2006). Laboratory surveillance for
prevention and control of food-borne zoonoses. Annual 1st super Sanita, 42, 401-
404.
Butaye, P., Devriese, L. A., and Haesebrouck, F. (2003). Antimicrobial growth
promoters used in animal feed: effects of less well known antibiotics on gram-
positive bacteria. Journal of Clinical Microbiology, a review, 16, 175-188.
Byappanhalli, M., Flowler, M., Shively, D., and Whitman, R. (2003). Ubiquity and
persistence of Escherichia coli in a Midwestern costal stream. Applied
Environmental Microbiology, 69 (8), 4549-4555.
Catry, B., Laevens, H., Devriese, L., Opsomer, G., and De Kruif, A. (2003).
Antimicrobial resistance in livestock. Journal of Veterinary Pharmacology and
Therapy, 26, 81–93.
Chang, H. S. (2004). Overview of the world broiler industry: implication for the
Philippines. Asian Journal of Agriculture and Development, 4, 2.
CDC, (2012). Escherichia coli: General information. Retrieved from
http://www.cdc.gov/e.coli/general
Cid, D., Piriz, S., Ruiz-Santa-Quiteria, J. A., Valle, J., Vadillo, S., and Dela Fuento,
R. (1996). Invitro susceptibility of Escherichia coli strains isolated from
diarrheagenic lambs and goat kids to 14 antimicrobial agents. Journal of
veterinary Pharmacology and therapy, 19, 397-401.
69
Clinical Laboratory Standards Institute, CLSI. (2012). Performance standards for
antimicrobial susceptibility testing: twenty-second informational supplement.
CLSI document M100-S22 [Electronic]. Wayne Pennsylvania: USA.
Cohen, N., Ennaji, H., Bouchrif, B., Hassar, M., and Karib, H. (2007). Comparative
study of microbiological quality of raw poultry meat at various seasons and for
different slaughtering processes in Casablanca, Morocco. Poultry Science
Association, 16, 502-504.
Coia, J. (1998). Clinical, microbiological and epidemiological aspects of Escherichia
coli O157. FEMS: Immunology and Medical Microbiology, 20(1), 1-9.
Collignon, P., Wegener, H. C., Braam, P., and Butler, C. D. (2003). The Routine Use
of Antibiotics to Promote Animal Growth Does Little to Benefit Protein Under
nutrition in the Developing World. Clinical Infectious Diseases, 41 (7), 1007-
1013.
Corpet, D. E. (1993). An evaluation of methods to assess the effect of antimicrobial
residues on the human gut flora. Veterinary Microbiology, 35, 199-212.
Costa, D., Poeta, P., Saenz, Y., Coelho, A. C., Matos, M., and Vinue´, L. (2008).
Prevalence of antimicrobial resistance and resistance genes in faecal Escherichia
coli isolates recovered from healthy pets. Veterinary Microbiology, 127, 97–105.
Dai, L., Lu, L. M., Wu, C. M., Li, B. B., Huang, S. Y., Wang S. C., Qi, Y. H., and
Shen, J. Z. (2008). Characterization of antimicrobial resistance among
Escherichia coli isolates from chickens in China between 2001 and 2006. FEMS
Microbiology letters, 286, 178-183.
De Silva, G. J., and Mendonca, N., (2012). Association between antimicrobial
resistance and virulence in Escherichia coli. Landes Biosciences, 3(1), 18-28.
Del Solar, G., and Espinosa, M. (2000). Plasmid copy number control: an ever growing
story. Molecular Biology, 37, 492-500.
70
Dessen, A., Di Guilmi, A. M., Vernet, T., and Dideberg, O. (2001). Molecular
mechanisms of antibiotic resistance in Gram-positive pathogens. Current Drug
Targets and Infectious Disorders, 1(1), 63.
Diarra, M. S., Silversides, F. G., Diarrassouba, F., Pritchard, J., Masson, L.,
Brousseau, R., and other authors (2007). Impact of feed supplementation with
antimicrobial agents on growth performance of broiler chickens, Clostridium
pefringens and Enterococcus counts and antibiotic resistance phenotypes and
distribution of antimicrobial resistance determinants in Escherichia coli isolates.
Applied and Environmental Microbiology, 73(20), 6566-6576.
Ehrt, S., and Schnappinger, D. (2003). Isolation of plasmids from E. coli by alkaline
lysis: Methods in molecular biology. Springer protocols, 235, 75-78.
El-Rami, F. E., Rahal, E. A., Sleiman, F. T., and Abdolnoor, A. M. (2012).
Identification of virulence genes among antibacterial resistant Escherichia coli
isolated from poultry. Advanced Studies in Biology. 4(8), 385-396.
Ewers, C., Antao E. M., Diehl, I., Phillips, H. C., and Wieler, L. H. (2009). Intestines
and environment of the chicken as reservoirs for extra-intestinal pathogenic
Escherichia coli strains with zoonotic potential. Journal of Applied and
Environmental Microbiology, 75, 184-192.
FAO, (2008). Principles of meat processing hygiene and regulatory practices [data file].
Retrieved from: http://faostat.org/docrep.
FDA, (2001). The Human Health Impact of Fluoroquinolone Resistant Campylobacter
Attributed to the Consumption of Chicken. Retrieved from http://www.fda.gov.
Feng, P., Stephen, D. W. and Jinneman, K. (2011). Diarrheagenic Escherichia coli:
Bacteriological analytical manual. 8th Ed, Review A. Retrieved from:
http://www.fda.gov
Fey, P. D., Safranek, T. J., Rupp, M. E., Dunne, E. F., Ribot, E., Iwen, P. C.,
Bradford, P. A., Angulo, F. J., and Hinrichs, S. H. (2000). Ceftriaxone-
71
Resistant Salmonella Infection Acquired by a Child from Cattle. New England
Journal of Medicine, 342 (17), 1242.
Fishers, R. A. and Bennet, J. H. (Eds) (1995). Statistical methods, experimental design
and scientific inference. 14th Ed. Oxford university press, New York. 42-45.
Fofana, A., Bada, A. R., Seydi, M., and Akakpo, A. J. (2006). Antibiotic resistance of
Escherichia Coli strains isolated from raw meat in Senegal. Dakar Medical,
51(3), 145-150.
Food Safety and Inspection Service, (1996). Guidelines for Escherichia coli testing for
process control verification in poultry slaughter establishment: HACCP
guidelines and policies.Retrieved November 3rd
2012 from the Food Safety and
Inspection Service website: http://www.fsis.usda.gov.
Forward, K. R., Matheson, K. M., Hiltz, M., Musgrave, H., and Poppe, C. (2004).
Recovery of cephalosporin-resistant Escherichia coli and Salmonella from pork,
beef and chicken marketed in Nova Scotia. Canadian Journal of Infectious
Diseases and Medical Microbiology, 15(4), 226-231.
Fratamico, P. M., and Smith, J. L. (2006). Escherichia coli infections In Riemann in
Cliver, D.O (Ed) Food-borne infections and intoxications, 3rd
ed Florida:
Elsevier Inc. Academic Press.
Fujioka, M., Kasai, K., Miura, T., Sato, T., and Otomo, Y. (2009). Rapid diagnostic
method for the detection of diarrheagenic Escherichia coli by multiplex PCR.
Japan Journal of Infectious Disease, 62, 476-480.
Galland, J. C., Hyatt, D.R., Cropper, S. S., and Acheson, D.W. (2001). Prevalence,
antibiotic susceptibility and diversity of Escherichia coli O157:H7 isolates from
a longitudinal study of beef cattle feedlots. Journal of Applied and
Environmental Microbiology, 67, 1619-1627.
72
Garcia, E. A. (2002). Animal health and food borne pathogenic entero-haemorrhagic
O157:H7 strains and other pathogenic Escherichia coli viro-types (EPEC, ETEC,
EIEC, EHEC). Polish Journal of Veterinary Sciences, 5, 103-115.
Hammerum, A. M., and Heuer, O. E. (2009). Human health hazards from
antimicrobial resistant Escherichia coli of animal origin. Journal of Clinical and
Infectious Diseases, 48, 916-921.
Hao-Van, T. T., Chin, J., Chapman, T., Tran, L. T., and Coloe, P. J. (2008). Safety
of raw meat and shellfish in Vietnam: An analysis of Escherichia coli isolations
for antibiotic resistance and virulence genes. International journal of Food
Microbiology, 124, 217-223.
Hart, W. S., Heuzenroeder, M. W., and Barton, M. D. (2006). A study of the transfer
of tetracycline resistance genes between Escherichia coli in the intestinal tract of
a mouse and chicken model. Journal of Veterinary Medicine Series B-Infectious
Diseases and Veterinary Public Health. 53, 333-340.
Hazell, K. (2012). One in five chickens is contaminated with food poisoning bacteria.
Huffington post, p 6.
Heymann, D. L (2004). Diarrhea caused by Escherichia coli. In, Control of
Communicable Diseases Manual. (18th
ed) (pp 160-162).
Hiko, A., Asrat, D., and Zewde, G. (2008). Occurence of Esherichia coli O157:H7 in
retail raw meat products in Ethiopia. Journal of Infections in Developing
Countries, 2(5), 389-393.
Holt, J. G (1994). Identification of family Enterobacteriaceae. In, Sneath, P.H., Noel,
R.K and Holt J. G (Eds): Bergeys manual of determinative bacteriology. (9th
ed)
(pp 154-155). Newyork: Lippincott, Williams & Wilkins
Hu, G. Z., Zhang, C. H., Yuan, L., Yang, Y. R., and Liang, J. (2005). Detection of b-
lactamase and extended-spectrum b-lactamase of pathogens isolated from pig
73
and chicken and their antibiotic susceptibility test. Agriculture and Science
China, 4, 877–882.
International research network Kenya, (2005). Meat production in Kenya. Retrieved
from http://www.epzkenya.com.
Jakabi, M., Gelli, D. S., Ristiri, C. A., De Paula, A. M. R., Sakuma, H., and Lopez,
G. I. S. (2005). Presence of Salmonella species and Escherichia coli O157:H7 in
raw meat in Sao Paolo city, Brazil and evaluation of low temperature
(refrigeration and freezing) in resistance of these bacteria. International Atomic
Energy, 16, 35-42.
Johnson, J. R., Murray, A. C., Gajewski, A., Sullivan, M., Snippes P., Kuswoski M.
A., and Smith K. E. (2003). Isolation and molecular characterization of
Nalidixic acid resistant extra intestinal pathogen Escherichia coli from retail
chicken products. Antimicrobial agents and Chemotherapy, 7, 2161-2168.
Johnson, J. R., Kuskowski, M. A., Smith, K., O’Bryan, T. T., and Tatini, S. (2005).
Antimicrobial resistant and extra intestinal pathogenic Escherichia coli in retail
foods. Journal of Infectious Disease, 191, 1040-1049.
Johnson, J. R., Kuskowski, M. A., Menard, M., Gajewski, A., Xercavins, M., and
Garau, J. (2006). Similarity between chicken and human Escherichia coli
isolates in relation to Ciprofloxacin resistance status. Journal of Infectious
Diseases, 194, 71-78.
Johnson, T. J., and Nolan, L. K. (2009). Patho-genomics of the virulence plasmids of
Escherichia coli. Journal of Microbiology and Molecular Biology, 73, 750-774.
K’Akumu, O. A., and Olima, W. H. A. (2007). The dynamics and implications of
residential segregation in Nairobi. Habitat International, 31, 87-99
Kariuki, S., Onsare, R., Mwituria, J., Ngetich, R., Nafula, C., Karimi, K., and other
authors (2013). Improving food safety in meat value chains in Kenya. General
interest paper: FAO/WHO project report. Food protection trend, 5, 172-179
74
Kagambega, A., Martikainen, O., Lienemann, T., Siitonen, A., Traore, A. S., Barro,
N., and Haukka, K. (2012). Diarrheagenic Escherichia coli detected by 16-plex
PCR in raw meat and beef intestines sold at local markets in Ouagadougou,
Burkina Faso. International Journal of Food Microbiology, 153(1-2), 154-158.
Kelly, B. G., Vespermann, A., and Bolton, D. J. (2009b). The role of horizontal gene
transfer in the evolution of selected food borne bacterial pathogens. Food and
Chemical Toxicology. 47, 951–968.
Kelly, B. G., Vespermann, A., and Bolton D. J. (2009a). Horizontal gene transfer of
virulence determinants in selected bacterial food-borne pathogens. Food and
Chemical Toxicology, 47, 969–977.
Khachatourians, G. G. (1998). Agricultural use of antibiotics and the evolution and
transfer of antibiotic-resistant bacteria. Canadian Medical Association journal,
159(9), 1129–1136.
Kikuvi, G. M., Ole-Mapenay, I. M., Mitema, E. S., and Ombui, J.N. (2006).
Antimicrobial resistance in Escherichia coli isolates from faeces and carcass
samples of slaughter cattle, swine and chickens in Kenya. Israel Journal of
Veterinary Medicine, 61(3-4), 82- 88.
Kingori, A. M., Wachira, A. M., and Tuitoek, J. K. (2010). Indigenous chicken
production in Kenya: A review. International Journal of Poultry Science, 9 (4),
309-316.
KmeŤ, V., and KmeŤova, M. (2010). High level of quinolones resistance in
Escherichia coli from healthy chicken broilers. Folia Microbiology, 55(1), 79-
82.
Knarreborg, A., Simon, M. A., Engberg, R. M., Jensen, B. B., and Tannock, G. W.
(2002). Effects of dietary fat source and sub therapeutic levels of antibiotics on
the bacterial community in the ileum of broiler chickens at various ages. Journal
of Applied and Environmental Microbiology, 68, 5918-5924.
75
Koro, M. E., Anandan, S., and Quinlan, J. J. (2010). Microbial quality of food
available to populations of differing socio economic status. American Journal of
Preventive Medicine: Elsevier Inc, 20(10), 30.
Lee, G. Y., Jang, H. I., Hwang, Z. G., and Rhee, M. S. (2009). Prevalence and
classification of pathogenic Escherichia coli isolated from fresh beef, poultry and
pork in Korea. International Journal of Food Microbiology, 134(3), 196-200.
Lei, T., Tian, W., He, L., Huang, X.H., Sun Y.X., Deng, Y.T., and other authors
(2010). Antimicrobial resistance in Escherichia coli isolates from food animals,
animal food products and companion animals in China. Veterinary Microbiology,
146, 85-89.
Lesorogol, C. K. (1998). Life on the margins: Perspectives on Pastoralism and
development in Kenya. A paper submitted to USAID/Kenya.
Li, X. S., Wang, G. Q., Du, X. D., Cui, B. A., Zhang, S. M., and Shen, J. Z (2007).
Antimicrobial susceptibility and molecular detection of chloramphenicol and
florfenicol resistance among Escherichia coli isolates from diseased chickens.
Journal of Veterinary Science, 8, 243–247.
Lindqvist, R., Anderson, Y., De Jong, B., and Norberg, P (2000). A summary of
reported food borne disease incidents in Sweden, 1992 to 1997. Journal of Food
Protection, 63, 1315-1320.
Liu, J. H., Wei, S. Y., Ma, J. Y., Zeng, Z. L., Lu, D. H., Yang, G. X., and Chen, Z.
L. (2007). Detection and characterisation of CTX-M and CMY-2 β-Lactamases
among Escherichia coliisolates from farm animals in Guangdong Province of
China. International Journal of Antimicrobial Agents, 29, 576–581.
Lynch, M., Painter, J., Woodruff, R., and Braden, C (2006). Surveillance of food
borne disease outbreaks in United States, 1998 to 2002. Morbidity and mortality
weekly report, surveillance summaries/ CDC, 55, 1-34.
76
MacFaddin, J. F. (2000). Biochemical Tests for Identification of Medical Bacteria.
(3rd ed) (363-36). Philadelphia: Lippincott Williams and Wilkins.
Majalija, S., Oweka, F., Wito, G. S., Lubowa, M., Vudriko, P., and Nakamaya, F.
M. (2010).Antibiotic susceptibility profiles of faecal Escherichia coli isolates
from dip-litter broiler chickens in Northern and Central Uganda. Journal of
Veterinary Research, 3(4), 75-80.
Marwa, E. A., Essam, T. M., and Anin, M. A. (2012). Involvement of virulence genes
and antibiotic resistance in clinical and food borne diarrheagenic Escherichia
coli isolates from Egypt. World Journal of Medical Sciences, 7(4), 276-284.
Maurelli, A. (2006). Bacterial-epithelial cell cross-talk molecular mechanisms in
pathogenesis in McCormick, B.(Ed), Evolution of bacterial pathogens. (pp 30–
56). Cambridge: Cambridge University Press.
Mellon, M., Benbrook, C., and Benbrook K. L. (2001). Hogging It. Estimates of
Antimicrobial Abuse in Livestock. Retrieved from Union of Concerned Scientist
website Cambridge:
http://www.ucsusa.org/foodandenvironment/antibioticsandfood/margaret-
mellon-on-hogging-it.html.
Meng, J., Doyle, M. P., Zhao, T., and Zhao, S. (2001). Enterohemorrhagic Escherichia
coli.In Doyle M.P., and Montville, T.J (Eds) Food microbiology – Fundamentals
and Frontiers. 2nd
ed (pp 193-213). Washington D.C: American Society for
Microbiology.
Ministry of Agriculture, Livestock and Development-MALDM (2005/2006). Third
livestock development project. Nairobi: Government printer.
Mitema, E. S., Kikuvi, G. M., Wegener, H. C., and Stohr, K. (2001). An assessment
of antimicrobial consumption in food producing animals in Kenya. Journal of
Veterinary Pharmacology & Therapeutics, 24(6), 385-390.
77
Modestas, R., Rita, S., Ricardas, K., Marius, V., and Dainius, Z. (2010). Prevalence
and antimicrobial resistance of E. coli isolated from chicken liver sold in retail
markets. Veterinarija Ir zootechnika, 52(74), 1392-2130.
Molbak, K. (2004). Spread of resistant bacteria and resistance genes from animals to
humans – the public health consequences. Journal of Veterinary Medicine, 51,
364–369.
Moldlab, (2003). Sewage \ Black-water: Contamination and Escherichia coli. Retrieved
from: http://www.moldlab.com/sewage
Moniri, R., and Dastehgoli, K. (2005). Fluoroquinolone-resistant Escherichia coli
isolated from healthy broilers with previous exposure to fluoroquinolones: is
there a link? Microbial Ecology in Health and Disease, 17, 69–74.
Moore, L.V., and Diez-Roux, A.V (2006). Associations of neighborhood
characteristics with the location and type of food store. American Journal of
Public Health, 96, 325-331.
Mora, A., Blanco, J. E., Blanco, M., Alonso, M. P, Dhabi, G., and Ekheita, A.
(2005). Antimicrobial resistance of shiga toxin (vero-toxin) producing
Escherichia coli O157:H7 and non O157 strains isolated from humans, cattle,
sheep and Food in Spain. Research in Microbiology, 156, 793-806.
Musgrove, M. T., Jones, D. R., Northcutt, J. K., Cox, N. A., Harrison, M. A.,
Fedorka-Cray, P. J., and Ladely, S. R. (2006). Antimicrobial resistance in
Salmonella and Escherichia coli isolated from commercial shell eggs. Poultry
Science, 85, 1665–1669.
Naliaka, A. (2011). A comparative study of antimicrobial resistance profiles among
enteric bacteria in broilers and traditional chicken from selected farms in
Kericho, Kenya. Unpublished MSc thesis, Kenyatta University, Kenya.
Nariman, A. H. A., Tharwat, A., and El-Baz, W. F. (1998). Plasmid- mediated
antibiotic resistance in E. coli. Arab Journal of Biotechnology, 1(1), 17-27.
78
Nasser, A. A., Haddad, A. A., Bahouh, M. A., and Mashally, M. (2006). Principles of
poultry bio-security program. (pp 76-95). Kuwait: Kuwait institute for scientific
research
Nataro, J., and Kaper, J. B. (1998). Diarrheagenic Escherichia coli. Clinical
Microbiology Reviews, 11, 142-201.
Nonga, H. E., Mariki, M., Karmurbo, E. D., and Mdegela, R. H. (2009). Assessment
of antimicrobial usage and antimicrobial residues in broiler chickens in
Morogoro municipality, Tanzania. Pakistan journal of Nutrition, 8(3), 203-207.
Nyaga, P. (2007). Good bio-security practices in small scale commercial and
scavenging production systems in Kenya. Retrieved from
http://www.fao.org/docrep
Nyaga, P. (2008).The structure, marketing and importance of the commercial and
village poultry industry: An analysis of the poultry sector in Kenya. Poultry
sector country review. Retrieved from the Food and Agriculture Organization of
the United Nations website: http://www.fao.org/avianflu/en/farmingsystems.html
Nzouankeu, A., Ngandjia, A., Ejenguele, G., Njine, T., and Wouafo, M. H. (2010).
Multiple contamination of chickens with Campylobacter, Escherichia coli and
Salmonella in Yaoundé, Cameroon. Journals of Infections in Developing
Countries, 4(9), 583-586.
O’Brien, T. F. (2002). Emergence, spread, and environmental effect of antimicrobial
resistance: how use of an antimicrobial anywhere can increase resistance to any
antimicrobial anywhere else. Journal of Clinical and Infectious Diseases, 34(3),
78–84.
Ojeniyi, A. A. (1989). Direct transmission of Escherichia coli from poultry to humans.
Epidemiology information, 103, 513-522.
Ole Mapenai, L. M., Mitema, E., and Ombui, J. N. (2006). Studies of antimicrobials
and occurrence of antimicrobial resistance in Escherichia coli in food animals in
79
Kenya and public health implication. Unpublished MSc. thesis. University of
Nairobi, Kenya.
Orden, J. A., Ruiz-Santa-Quiteria, J. A.,Garcia, S., Cid, D., and De la Fuente, R.
(2000). In-vitro susceptibility of Escherichia coli strains isolated from
diarrheagenic dairy calves to 15 antimicrobial agents. Journal of veterinary of
veterinary medicine, 47, 329-335.
Paton, J. C., and Paton, A. W. (1998). Pathogenesis and diagnosis of Shiga toxin-
producing Escherichia coli infections. Clinical Microbiology Reviews, 11 (3),
450–79.
Payne, J., and Sparks, D. (2009). E. coli: An overview. Stillwater, Oklahoma:
Oklahoma state University. Retrieved from http://www.worldcat.org/title/e.coli-
an-overview.
Pertersen, KE., and James, W.O (1998). Agents, vehicles and causal inference in
bacterial food borne disease outbreaks, 1986 to 1995. Journal of Antimicrobials
and Veterinary Medicine Association, 212, 1874-1881.
Petersen, A., Christensen, J. P., Kuhnert, P., Bisgaard, M., and Olsen, J. E (2006).
Vertical transmission of a Fluoroquinolone-resistant Escherichia coli within an
integrated broiler operation. Veterinary Microbiology, 116, 120–128.
Pointon, A., Sexton, M., Dowsett, P., Saputra, T., Kiermeier, A., Lorimer, M., and
other authors (2008). A baseline survey of the microbiological quality of
chicken portions and carcasses at retail in two Australian States, 2005 to 2006.
Journal of Food Protection, 71(6), 1123-1134.
Popkin, B. M. (2006). Technology, transport, globalization and the nutrition transition
food poultry. Journal of Food Poultry, 10, 1016.
Protocol online, (2001). Agarose gel electrophoresis - Basic method. Retrieved 8th
June
2011 from the protocol online website: http://www.protocolonline.org/prot
80
Protocol online, (2003). Protocol for PCR using Taq DNA polymerase. Retrieved from:
http://www.protocolonline.org/cgi-bin
Rane, S. (2011). Street vended food in developing world: hazard analysis. India Journal
of Microbiology, 51(1), 100-106.
Regula, G., Ursula, L., Roger, S., and Danuser, J. (2003). Risk factors for antibiotic
resistance in campylobacter species isolated from raw retail poultry in
Switzerland. BioMed Central: Public Health, 3, 39.
Rivera, A. M., and Boucher, H. W (2011). Current concepts in antimicrobial therapy
against select gram-positive organisms: Methicillin-Resistant-Staphylococcus
Aureus, Penicillin-Resistant Pneumococci and Vancomycin Resistant
Enterococci. Mayo Clinic Proceedings, 86(12), 1230-1243
Rodriguez-Siek, K. E., Giddings, C. W., Doetkott, C., Johnson, T. J., Fakhr, M. K.,
and Nolan, L. K. (2005). Comparison of Escherichia coli isolates implicated in
human urinary tract infection and avian colibacillosis. Microbiology, 151, 2097-
2110.
Ruzauskas, M., Šiugždinienė, R., Šeputienė, V.,Sužiedėlienė, V., Virgailis, M.,
Daugelavičius., and other authors (2010). The situation of antimicrobial
resistance of enteric bacteria isolated from animal origin to quinolones and
fluoroquinolones. Veterinarija ir zootechnika, 50, 73-80.
Sackey, B. A., Mensah, P., Collison, E., and Dawson, E. S. (2001).
Campylobacter,Salmonella, Shigella and Escherichia coli in live dressed poultry
from metropolitan Accra. International Journal of Food Microbiology, 71, 2128.
Saikia, P., and Joshi, S. R. (2010). Retail market poultry meats of North-East India: A
microbiological survey for pathogenic contaminants. Research Journal of
Microbiology, 5(1), 36-43.
81
Scott, K. P. (2002). The role of conjugative transposons in spreading antibiotic
resistance between bacteria that inhabit the gastrointestinal tract. Cellular and
Molecular Life Sciences, 59, 2071–2082.
Schjorring, S., and Krogfelt, K. (2010). Assesment of bacterial antibiotic resistance
transfer in the gut. International Journal of Microbiology, 2011, 1-10.
Shane, S. (2004). The challenges, successes and issues facing today‟s industry. World
Poultry, 20 (2), 16-19.
Singer, R. S., and Hofacre, C. L. (2006). Potential impacts of antibiotic use in poultry
production. Journal of Avian Diseases, 50, 161-177.
Smalla, K., Overbeek, L. V., Pulrall, J. P., and Van-Elsas, J. D. (1993). Prevalence of
nptII and Tn5 in Kanamycin resistant bacteria from different environments.
FEMS Microbial Ecology, 13, 47-58.
Smet, A., Martel, A., Persoons, D., Dewulf, J., Heyndrickx, M., Catry, B., and other
authors (2008). Diversity of extended-spectrum beta-lactamases and class C
beta lactamases among cloacal Escherichia coli Isolates in Belgian broiler farms.
Antimicrobial Agents and Chemotherapy, 52, 1238–1243.
Smith, H. W. (1969). Transfer of antibiotic resistance from animal and human strains of
Escherichia coli to resident E. coli in the alimentary tract of man. Lancet,
1,1174–1176.
Smith, K. E., Besser, J. M., Hedberg, C. W., Leano, F. T., Bender, J. B., Wickland,
J. H., and other authors (1999). Quinolone resistant Campylobacter jejuni
infections in Minnesota. The new England Journal of medicine, 340 (20), 1525.
Smith, H., Willshaw, G., and Cheasty, T., (2004). E. coli as a cause of out breaks of
diarrhoeal disease in the U.K. MicrobiologyToday, 31,117-118.
Shohayeb, M., and Sonbol, F. (1994). Conjugal transfer of antibiotic resistance of
Shigella isolated in Tanta. Alexandria Journal of Pharmaceutical Sciences, 8,
177-180.
82
Su, H.P., Chu, S.I., Tsai, J.L., Lee, C.L., and Pan, T.M (2005). Bacterial food borne
illness outbreaks in Northern Taiwan, 1995 to 2001. Journal of Infection and
Chemistry, 11, 146-151.
Taha, F. A. (2003). The Poultry Sector in Middle-income Countries and its Feed
Requirements: The Case of Egypt. Outlook Report No. WRS03-02. Retrieved
from: http://www.ers.usda.gov/publications.
Te Poele, E. M., Bolhuis, H., and Dijkhuizen, L. (2008). Actinomycte Integrative and
Conjugative Elements. Antoine Van Leeuwenhoek, 94, 127-143.
Thangh Huong, C. T., Hai Duong, N. T., and Thu Hien, N. T. (2009). Contamination
of some bacteria isolated from chicken meat in retail markets in Hanoi and
examination of the antibiotic resistance ability of Salmonella and E. coli strains
isolated. Journal of Science and Development, 7(2), 181-186.
Thorsteinsdottir, T. R., Haraldsson, G., Fridriksdottir, V., Kristinsson, K. G., and
Gunnarsson, E. (2010a). Prevalence and genetic relatedness of antimicrobial
resistant Escherichia coli isolated from food animals, food and humans in
Iceland. Zooneses and public health, 57, 189-196.
Thorsteinsdottir, T. R., Haraldsson, G., Fridriksdottir, V., Kristinsson, K. G., and
Gunnarsson, E. (2010b). Broiler chickens as source of human fluoroquinolone
resistant Escherichia coli, Iceland. Journal of Emerging Infectious Diseases,
16(1), 133-135.
Todar, K. (2005). Ken Todar's Microbial World: Escherichia coli. Retrieved from:
http://www.bact.wisc.edu/themicrobialworld/Escherichia coli.
Todar, K. (2012). Bacterial resistance to antibiotics: In Todars‟ online textbook of
bacteriology. Retrieved from: http://textbookofbacteriology.net, 3, 4
Todd, A. (1997). Epidemiology of food borne diseases. World health statistics, 50, 1-2.
Trobus, M., Lester, C. H., Olsen, J. E., Frimodt-Moller, N., and Hammerum, A. M.
(2008). Natural transfer of sulphonamide and ampicillin resistance between
83
Escherichia coli residing in the human intestines. Journal of Antimicrobial
Chemotherapy, 63, 80-86.
Tuitoek, J. W., Chemjor, J. M., and Ottaro, J. M. (1998). Morphological
characteristics and protein requirements of Kenyan indigenous chicken In
Agronam Services Ltd:Proceeding of the 6th KARI Scientific Conference, KARI
Headquarters, Nairobi, Kenya.
Turnidge, J. (2003). Antibiotic use in animals-prejudices, perceptions and realities.
Journal of Antimicrobial Therapy, 53, 26-27.
Upton M (2004). The role of livestock in economic development and poverty reduction.
Retrieved from http://www.fao.org/ag/againfo/projects
Van den Bogaard, A. E., and Stobberingh, E. E. (2000). Epidemiology of resistance
to antibiotics links between animals and humans. International Journal of
Antimicrobial Agents, 14, 327–335.
Van Tuat, C. (2007). A study of antimicrobial resistance of Escherichia coli isolated
from retail fresh pork in Hanoi, Vietnam. Unpublished MSc. thesis, Chiang Mai
University, Vietnam and Freie University, Berlin.
Van, T. T. H., George, M., Istivan, T., Tran, L., and Cole, P. J. (2007). Antibiotic
resistance in food-borne bacteria contaminants in Vietnam. Applied and
Environmental Microbiology, 73(12), 7906-7911.
Vaskas, T. A., Dahesht, E. A., Seifi, S., Rahmani, M., Motaghifar, A., and
Safanavaee, R. (2012). Study and comparison of the bacterial contamination
outbreak of chicken meat consumed in some cities of Mazandaran province, Iran.
African Journal of Microbiology Research, 6 (33), 6286-6290.
Villa, L., Garcia-Fernandez, A., Fortini, D., and Carattoli, A. (2010). Replicon
sequence typing of the IncF plasmids carrying virulence and resistance
determinants. Journal of Antimicrobial Chemotherapy, 65, 2518-2529.
84
Washington, C., Stephen, D., William, M., Elmer, W., Gary, W., Paul, C., and Gail,
L. (2006). The Enterobacteriacea: Tribe Escherichiae. In Koneman’s color atlas
and textbook of diagnostic microbiology 6th
ed (pp 212-248). New York:
Lippincott Williams and Wilkins
Wasteson, Y. (2001). Zoonotic Escherichia coli. Acta veterinaria Scandinavica, 95, 79-
84.
Watve, M. M., Dahanukar, N., and Watve, M. G. (2010). Socio-biological control of
plasmid copy number in bacteria. PLos ONE, 5(2), 1-8.
WHO, (1998). Use of quinolones in food animals and potential impact on human health
in Geneva. Retrieved from :http://www.who.org
WHO, (2002). Impacts of antimicrobial growth promoter termination in Denmark.
Retrieved from: http://www.who.org
Woolcock, J.B (1991). World animal science: Microbiology of animals and animal
products, Amsterdam. Elsevier, 32, 4.
Wozniak, R. A., and Waldor, M. K. (2010). Integrative and Conjugative Elements
enabling dynamic lateral gene flow. Nature reviews Microbiology, 8, 552-563.
Yang. H., Chen, S., White, D.G., Zhao, S., McDermott, P., Walker, R., and Meng, J.
(2004). Characterization of multiple-antimicrobial resistant Escherichia coli
isolates from diseased chickens and swine in China. Journal of Clinical
Microbiology, 42, 3483–3489.
You, J. Y., Moon, B. M., Oh, I. G., Baek, B. K., Li, L. G., and Kim, B. S. (2006).
Antimicrobial resistance of Escherichia coli O157 from cattle in Korea.
International Journal of Food Microbiology. 106, 74-78
Zhang, L., Kinkelaar, D., Huang, Y., Li, Y., Li, X., and Wang, H. H. (2011).
Acquired antibiotic resistance: Are we born with it. Applied and Environmental
Microbiology. 77(20), 7134-7141.
85
Zhao, S., Blickenstaff, K., Bodeis-Jones, S., Gaines, S. A., Tong, E., and
McDermott, P. F. (2012). Comparison of the prevalence and antimicrobial
resistances of Escherichia coli isolates from different retail meats in the United
States, 2002 t0 2008. American society of Microbiology, 78, 23.
Zhao, S., Maurer, J. J., Hubert, S., De Villena, J. F., McDermott, P. F., Meng, J.,
and other authors (2005). Antimicrobial susceptibility and molecular
characterization of avian pathogenic Escherichia coli isolates. Veterinary
Microbiology, 107, 215–224.
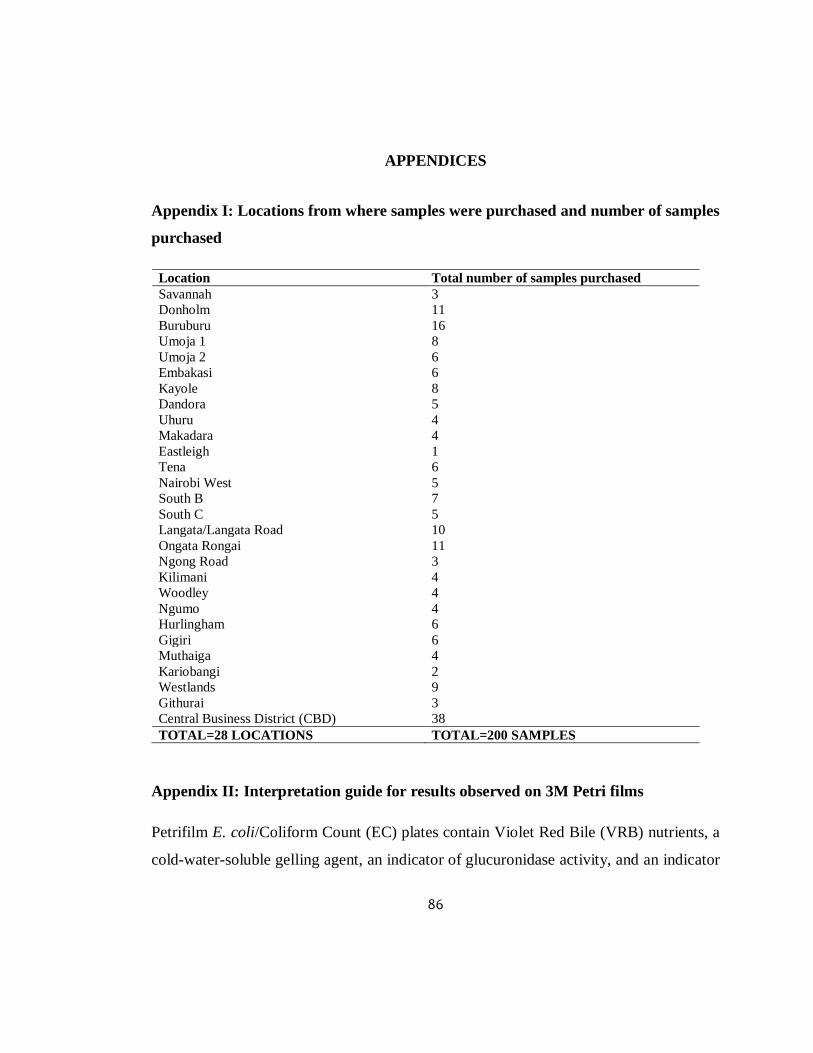
86
APPENDICES
Appendix I: Locations from where samples were purchased and number of samples
purchased
Location Total number of samples purchased
Savannah 3
Donholm 11
Buruburu 16
Umoja 1 8
Umoja 2 6
Embakasi 6
Kayole 8
Dandora 5
Uhuru 4
Makadara 4
Eastleigh 1
Tena 6
Nairobi West 5
South B 7
South C 5
Langata/Langata Road 10
Ongata Rongai 11
Ngong Road 3
Kilimani 4
Woodley 4
Ngumo 4
Hurlingham 6
Gigiri 6
Muthaiga 4
Kariobangi 2
Westlands 9
Githurai 3
Central Business District (CBD) 38
TOTAL=28 LOCATIONS TOTAL=200 SAMPLES
Appendix II: Interpretation guide for results observed on 3M Petri films
Petrifilm E. coli/Coliform Count (EC) plates contain Violet Red Bile (VRB) nutrients, a
cold-water-soluble gelling agent, an indicator of glucuronidase activity, and an indicator

87
that facilitates colony enumeration. Most E. coli (about 97%) produce beta-
glucuronidase which produces a blue precipitate associated with the colony. The top film
traps gas produced by the lactose fermenting Coliforms and E. coli. About 95% of E.
coli produce gas, indicated by blue to red-blue colonies associated with entrapped gas on
the Petrifilm EC plate (within approximately one colony diameter). AOAC
INTERNATIONAL and United States FDA Bacteriological Analytical Manual define
Coliforms as gram-negative rods which produce acid and gas from lactose during
metabolic fermentation. Coliform colonies growing on the Petrifilm EC plate produce
acid which causes the pH indicator to make the gel color darker red. Gas trapped around
red coliform colonies indicates confirmed Coliforms. The following were some of the
guides used for interpretation.
a) When there is no visible color change in the gel it means there is no growth.
b) E. coli colonies will appear as blue colonies with gas while Coliforms will be the
blue plus red colonies with gas.
c) As the E. coli or coliform count increases the color of the gel turns to dark red (if
Coliforms are more) or purple-blue (if E. coli is more).
d) Background bubbles are a characteristic of the gel and are not a result of E. coli
or coliform growth.
e) Do not count colonies that appear on the foam barrier because they are removed
from the selective influence of the media.
f) The circular growth area is approximately 20 cm². Estimates can be made on
plates containing greater than 150 colonies by counting the number of colonies in
one or more representative squares and determining the average number per
square. Multiply the average number by 20 to determine the estimated count per
plate.
g) Petrifilm EC plates with colonies that are TNTC have one or more of the
following characteristics: many small colonies, many gas bubbles, and a
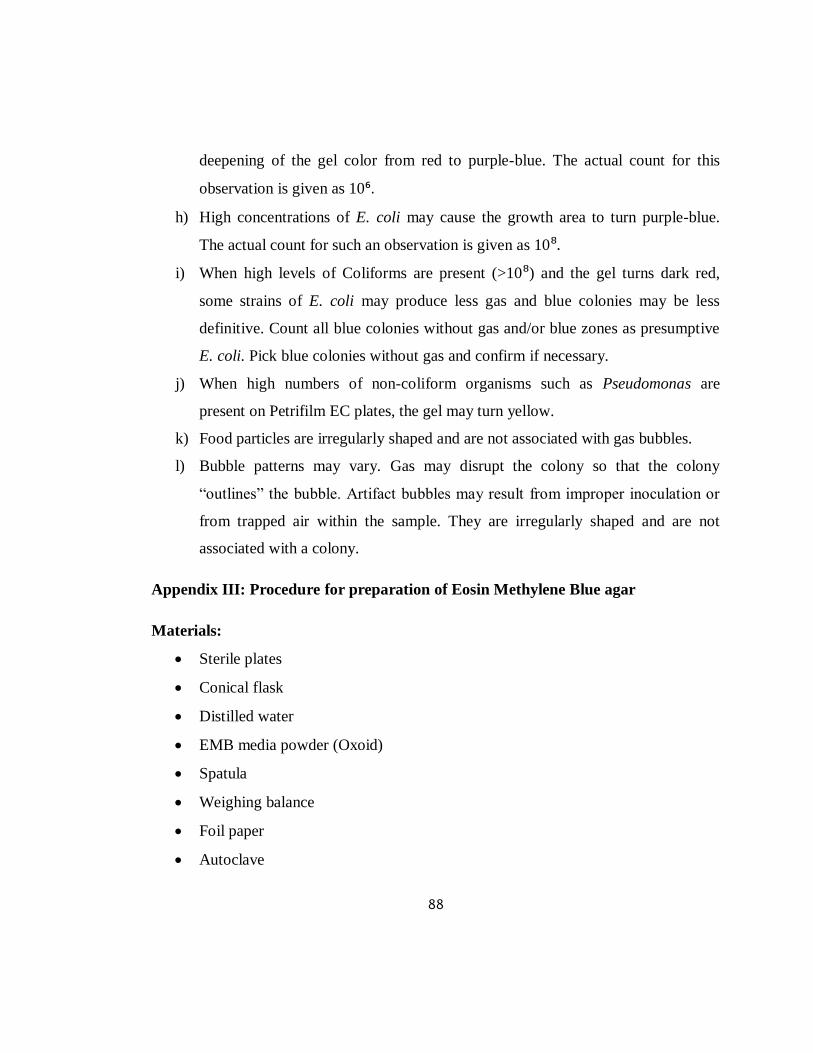
88
deepening of the gel color from red to purple-blue. The actual count for this
observation is given as 10⁶.
h) High concentrations of E. coli may cause the growth area to turn purple-blue.
The actual count for such an observation is given as 10⁸.
i) When high levels of Coliforms are present (>10⁸) and the gel turns dark red,
some strains of E. coli may produce less gas and blue colonies may be less
definitive. Count all blue colonies without gas and/or blue zones as presumptive
E. coli. Pick blue colonies without gas and confirm if necessary.
j) When high numbers of non-coliform organisms such as Pseudomonas are
present on Petrifilm EC plates, the gel may turn yellow.
k) Food particles are irregularly shaped and are not associated with gas bubbles.
l) Bubble patterns may vary. Gas may disrupt the colony so that the colony
“outlines” the bubble. Artifact bubbles may result from improper inoculation or
from trapped air within the sample. They are irregularly shaped and are not
associated with a colony.
Appendix III: Procedure for preparation of Eosin Methylene Blue agar
Materials:
Sterile plates
Conical flask
Distilled water
EMB media powder (Oxoid)
Spatula
Weighing balance
Foil paper
Autoclave
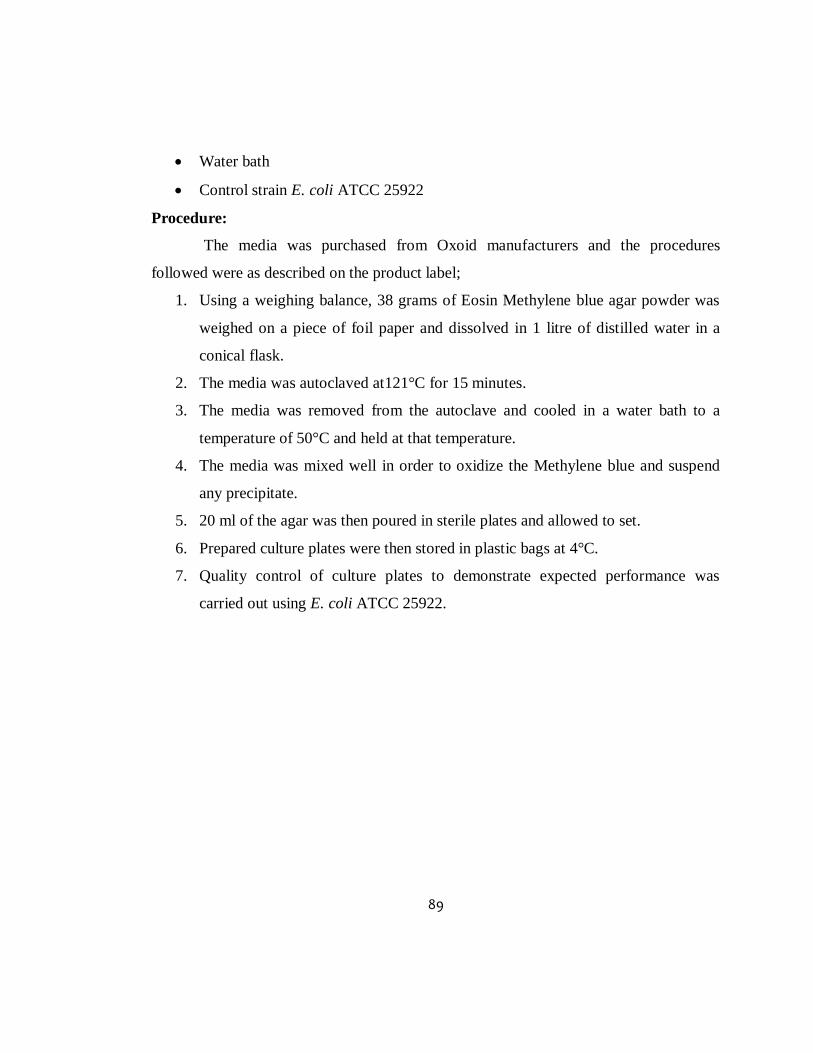
89
Water bath
Control strain E. coli ATCC 25922
Procedure:
The media was purchased from Oxoid manufacturers and the procedures
followed were as described on the product label;
1. Using a weighing balance, 38 grams of Eosin Methylene blue agar powder was
weighed on a piece of foil paper and dissolved in 1 litre of distilled water in a
conical flask.
2. The media was autoclaved at121°C for 15 minutes.
3. The media was removed from the autoclave and cooled in a water bath to a
temperature of 50°C and held at that temperature.
4. The media was mixed well in order to oxidize the Methylene blue and suspend
any precipitate.
5. 20 ml of the agar was then poured in sterile plates and allowed to set.
6. Prepared culture plates were then stored in plastic bags at 4°C.
7. Quality control of culture plates to demonstrate expected performance was
carried out using E. coli ATCC 25922.
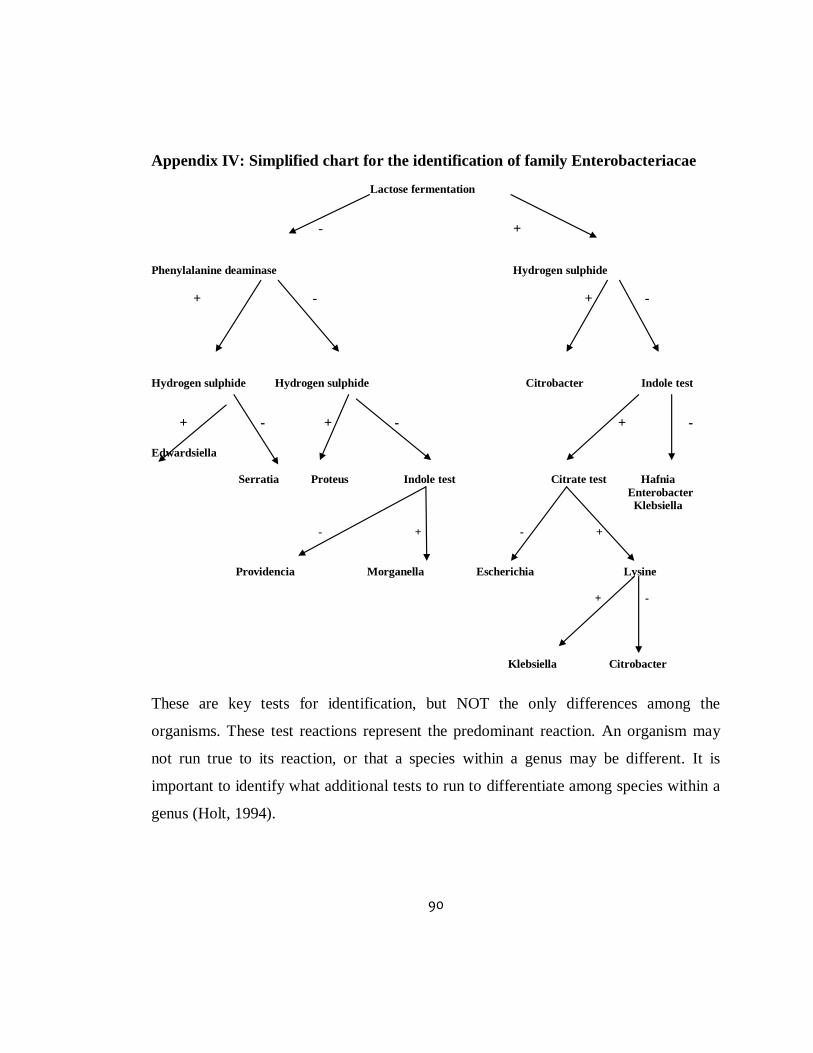
90
Appendix IV: Simplified chart for the identification of family Enterobacteriacae
Lactose fermentation
- +
Phenylalanine deaminase Hydrogen sulphide
+ - +
Hydrogen sulphide Hydrogen sulphide Citrobacter Indole test
+ - + - + -
Edwardsiella
Serratia Proteus Indole test Citrate test Hafnia
Enterobacter
Klebsiella
- + - +
Providencia Morganella Escherichia Lysine
+ -
Klebsiella Citrobacter
These are key tests for identification, but NOT the only differences among the
organisms. These test reactions represent the predominant reaction. An organism may
not run true to its reaction, or that a species within a genus may be different. It is
important to identify what additional tests to run to differentiate among species within a
genus (Holt, 1994).
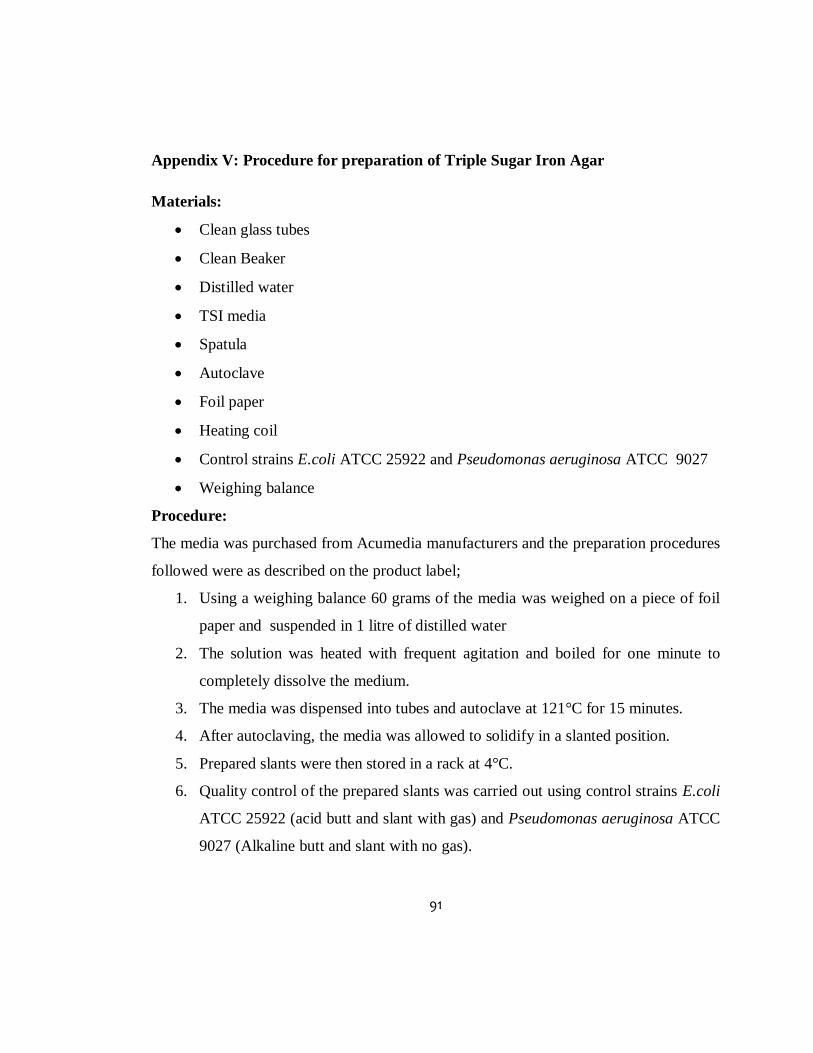
91
Appendix V: Procedure for preparation of Triple Sugar Iron Agar
Materials:
Clean glass tubes
Clean Beaker
Distilled water
TSI media
Spatula
Autoclave
Foil paper
Heating coil
Control strains E.coli ATCC 25922 and Pseudomonas aeruginosa ATCC 9027
Weighing balance
Procedure:
The media was purchased from Acumedia manufacturers and the preparation procedures
followed were as described on the product label;
1. Using a weighing balance 60 grams of the media was weighed on a piece of foil
paper and suspended in 1 litre of distilled water
2. The solution was heated with frequent agitation and boiled for one minute to
completely dissolve the medium.
3. The media was dispensed into tubes and autoclave at 121°C for 15 minutes.
4. After autoclaving, the media was allowed to solidify in a slanted position.
5. Prepared slants were then stored in a rack at 4°C.
6. Quality control of the prepared slants was carried out using control strains E.coli
ATCC 25922 (acid butt and slant with gas) and Pseudomonas aeruginosa ATCC
9027 (Alkaline butt and slant with no gas).
92
Appendix VI: Procedure for preparation of Sulphide Indole Motility agar
Materials:
Bijou bottles
Beaker
SIM agar media
Distilled water
Autoclave
Spatula
Autoclave
Weighing balance
Controls E.coli ATCC 25922 and Klebsiella pneumoniae ATCC 13883
Procedure
The media was purchased from Oxoid and the preparation procedures that were
followed were as described on the product label;
1. Using a weighing balance, 30 grams of powdered media was weighed on a small
piece of foil paper and suspended in 1 litre of distilled water.
2. The mixture was boiled to dissolve the media completely.
3. The media was dispensed into clean bijou bottles (5ml each).
4. The media was sterilized by autoclaving for 15 minutes at 121°C.
5. Prepared media was allowed to cool and stored in a refrigerator at 4°C.
6. Quality control on the media was done using controls E.coli ATCC 25922 and
Klebsiella pneumoniae ATCC 13883
Appendix VII: Procedure for preparation of Simmon's citrate agar
Materials:
Clean glass tubes
93
Beaker
Simmon‟s citrate powdered media
Spatula
Weighing balance
Foil paper
Distilled water
Heating coil
Autoclave
Control strains E.coli ATCC 25922 and Enterobacter aerogenes ATCC 13048
Procedure:
The agar was purchased from Oxoid manufacturers and preparation procedures that were
followed were as described on the product label;
1. Using a weighing balance 24.3 grams of the powdered media was weighed on a
piece of foil paper and suspended in 1 litre of distilled water.
2. The liquid agar was mixed well and dissolved by heating with frequent agitation.
3. The liquid agar was dispensed into tubes and autoclaved at 121°C for 15
minutes.
4. The liquid agar was then allowed to cool in slanted positions in order to obtain
short butts of 1.5 cm. depth.
5. The prepared media was then stored at 4°C.
6. Quality control on the citrate slants was carried out using control strains E.coli
ATCC 25922 (growth inhibited and no change in media color) and Enterobacter
aerogenes ATCC 13048 (good growth and change of media color from green to
blue).
Appendix VIII: Procedure for preparation of Mueller Hinton agar
Material:
94
Sterile plates
Distilled water
Powdered MH media
Spatula
Weighing balance
Foil paper
Autoclave
Conical flask
Control strains E.coli ATCC 25922
Procedure:
The media was purchased from Oxoid and the preparation procedures that were
followed were as described on the product label;
1. Using a weighing balance, 38 grams of the powdered media was suspended in 1
litre of distilled water.
2. The mixture was brought to the boil to dissolve the medium completely.
3. The media was then sterilized by autoclaving for 15 minutes at 121°C.
4. The media was removed from the autoclave and cooled in a water bath to a
temperature of 50°C and held at that temperature.
5. 20 ml of the agar was then poured in sterile plates and allowed to set.
6. Prepared culture plates were then stored in plastic bags at 4°C.
7. Quality control of culture plates to demonstrate expected performance was
carried out using E.coli ATCC 25922.
Appendix IX: Preparation of normal saline water
Materials:
Sodium chloride salt
Distilled water
95
Glass tubes
Beaker
Spatula
Weighing balance
Foil paper
Autoclave
Droppers
Procedure:
1. Using a weighing balance, 0.85 grams of sodium chloride was weighed on a
piece of foil paper and dissolved in a beaker containing 100 ml of distilled water.
2. The solution was mixed well and dissolved by heating with frequent agitation.
3. Using sterile droppers, 3ml of the normal saline was dispensed into clean tubes
and autoclaved at 121°C for 15 minutes. The normal saline was allowed to cool
and stored at room temperature in sterile environment.
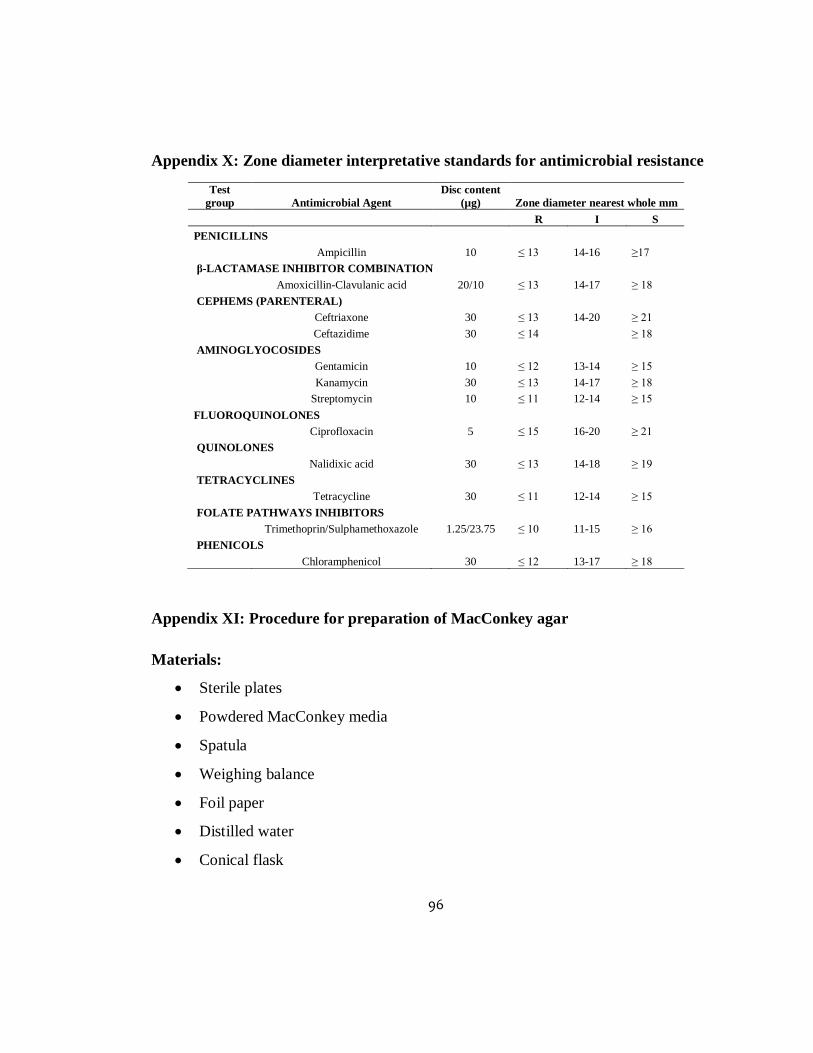
96
Appendix X: Zone diameter interpretative standards for antimicrobial resistance
Test
group Antimicrobial Agent
Disc content
(µg) Zone diameter nearest whole mm
R I S
PENICILLINS
Ampicillin 10 ≤ 13 14-16 ≥17
β-LACTAMASE INHIBITOR COMBINATION
Amoxicillin-Clavulanic acid 20/10 ≤ 13 14-17 ≥ 18
CEPHEMS (PARENTERAL)
Ceftriaxone 30 ≤ 13 14-20 ≥ 21
Ceftazidime 30 ≤ 14 ≥ 18
AMINOGLYOCOSIDES
Gentamicin 10 ≤ 12 13-14 ≥ 15
Kanamycin 30 ≤ 13 14-17 ≥ 18
Streptomycin 10 ≤ 11 12-14 ≥ 15
FLUOROQUINOLONES
Ciprofloxacin 5 ≤ 15 16-20 ≥ 21
QUINOLONES
Nalidixic acid 30 ≤ 13 14-18 ≥ 19
TETRACYCLINES
Tetracycline 30 ≤ 11 12-14 ≥ 15
FOLATE PATHWAYS INHIBITORS
Trimethoprin/Sulphamethoxazole 1.25/23.75 ≤ 10 11-15 ≥ 16
PHENICOLS
Chloramphenicol 30 ≤ 12 13-17 ≥ 18
Appendix XI: Procedure for preparation of MacConkey agar
Materials:
Sterile plates
Powdered MacConkey media
Spatula
Weighing balance
Foil paper
Distilled water
Conical flask
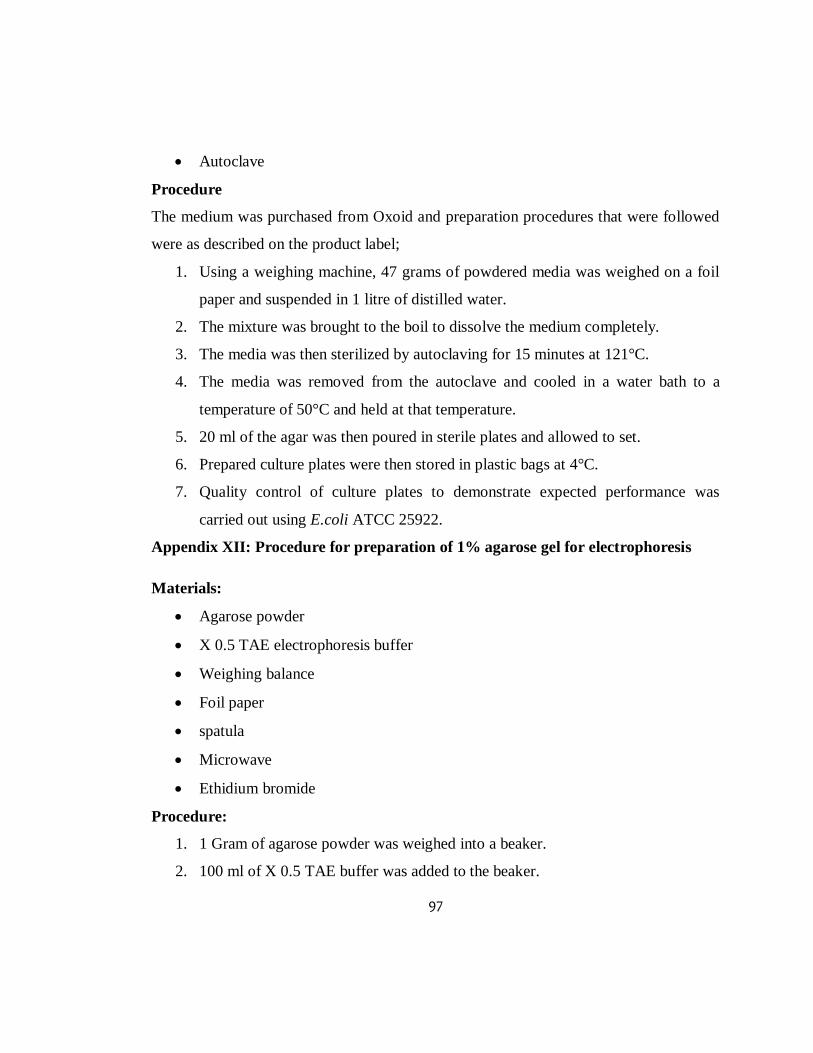
97
Autoclave
Procedure
The medium was purchased from Oxoid and preparation procedures that were followed
were as described on the product label;
1. Using a weighing machine, 47 grams of powdered media was weighed on a foil
paper and suspended in 1 litre of distilled water.
2. The mixture was brought to the boil to dissolve the medium completely.
3. The media was then sterilized by autoclaving for 15 minutes at 121°C.
4. The media was removed from the autoclave and cooled in a water bath to a
temperature of 50°C and held at that temperature.
5. 20 ml of the agar was then poured in sterile plates and allowed to set.
6. Prepared culture plates were then stored in plastic bags at 4°C.
7. Quality control of culture plates to demonstrate expected performance was
carried out using E.coli ATCC 25922.
Appendix XII: Procedure for preparation of 1% agarose gel for electrophoresis
Materials:
Agarose powder
X 0.5 TAE electrophoresis buffer
Weighing balance
Foil paper
spatula
Microwave
Ethidium bromide
Procedure:
1. 1 Gram of agarose powder was weighed into a beaker.
2. 100 ml of X 0.5 TAE buffer was added to the beaker.
98
3. The mixture was dissolved by boiling in a microwave for 2 minutes.
4. 5µl of ethidium bromide was carefully added into the agarose gel.
5. The gel was then carefully poured into the electrophoresis tank avoiding
formation of bubbles.
6. The well combs were then placed on the gel and the gel allowed to cool
Appendix XIII: Procedure for preparation of 0.5x Tris-Acetate (TAE)
electrophoresis buffer
Materials:
Clean beakers
Weighing balance
Foil paper
48.4 grams Tris base (tris (hydroxymethyl) amino methane
11.4ml 1.0 M glacial acetic acid
3.7 grams EDTA, disodium salt
Deionized water
Procedure:
Using a weighing balance, 48.4 grams of tris base was weighed on a piece of foil
paper and dissolved into 800ml of deionized water.
11.4ml of acetic acid and 3.7 grams of EDTA disodium salt was added to the
solution and mixed thoroughly.
The solution was diluted to a final volume of 1 litre by adding deionized water to
make 10 X TAE stock solution and stored at room temperature.
In order to make 0.5 X TAE buffer, 50 ml of 10 X stock solution was diluted into
950 ml of deionized water.
99
Appendix XIV: Procedure for preparation of Tryptic Soy Broth
Materials:
Beaker
Clean bijou bottles
5ml pipettes
Pipette aid
Powdered Tryptic soy media
Weighing balance
Foil paper
Spatula
Distilled water
Autoclave
Procedure:
1. Using a weighing balance, 30 grams of the powdered media was weighed on a
piece of foil paper and dissolved in one litre of distilled water.
2. The broth was mixed thoroughly and using sterile pipettes, 5ml was dispensed
into clean bijou bottles.
3. The dispensed broth was then autoclaved at 121°C for 15 minutes.
4. The broth was removed from the autoclaved and allowed to cool and stored at
4°C.
5. Quality control on the Tryptic soy broth was carried out using control strains
E.coli ATCC 25922.
100
Appendix XV: Procedure for preparation of drug plates for conjugation
experiments
Materials:
Sterile plates
MacConkey powdered agar
Distilled water
Conical flasks
Sodium azide powder (Assay potency 90µg/mg)
Ampicillin antibiotic powder (Assay potency 98µg/mg)
Weighing balance
Spatula
Foil paper
Autoclave
Water bath
Procedure:
1. 3 sets of media were prepared by weighing 38 grams MacConkey powder into a
foil paper and suspending in a 3 conical flasks each containing 1 litre of distilled
water.
2. The prepared media was autoclaved at 121°C for 15 minutes.
3. The media was removed from the autoclave and cooled in a water bath to a
temperature of 50°C and held at that temperature.
4. To determine the amount of each drug to use for preparing the drug plates, the
following formula for drug calculation was used;
Volume (ml) of media= Weight of drug (mg) x Assay potency/ purity of drug (µg/mg)
Desired concentration (µg/ml)
101
5. Using the above formula the amount of drugs required were calculated and
weighed carefully on a weighing balance and mixed with the cooled media. The
following sets of drug plates were prepared:
MacConkey agar containing 30 µg/ml of ampicillin and 300 µg/ml of
sodium azide to select for transconjugants.
MacConkey agar containing 30 µg/ml of ampicillin as control for only
the donor organism to grow in.
MacConkey agar containing 300 µg/ml of sodium azide as control for
only recipient organism (J53) to grow in.
6. The liquid agar containing the drugs was mixed well in order to have uniform
distribution of the drugs within the media.
7. 20 ml of the agar was then poured in sterile plates and allowed to set.
8. Prepared drug plates were then stored in plastic bags at 4°C.
9. Quality control of drug plates to demonstrate expected performance was carried
out using sodium azide resistant recipient E.coli J53 and ampicillin resistant
donors.
102
Appendix XVI: KEMRI Ethical Review Committee approval letter

1