Embed Size (px)
Citation preview
Content is deleted for demo purpose
1
STEEL INDUSTRY REPORT Q1/2020
Content is deleted for demo purpose
CONTENT
2
Section Page Section Page
Abbreviations 4 4. Raw materials
27
Executive summary 65. Production
34
I. Business environment8
6. Consumption37
1. Macroeconomic situation9
7. Import - export39
2. Legal framework12
8. Current situation of key nations in the industry41
3. Trade agreements15
9. Regional current situation49
II. Global market18
10. Major companies in the industry50
1. Definition and classification19
III. Vietnam market51
2. Production process21
1. History of development52
3. Production technology 25 2. Industry value chain 53
Content is deleted for demo purpose
CONTENT
3
Section Page Section Page
3. Production technology55 1. Risks 84
4. Raw materials57 2. SWOT analysis 86
5. Scale66 V. Planning and forecasts 87
6. Construction steel 70 1. Planning 87
7. Steel pipe74 2. Global market forecasts 88
8. Galvanized steel75 3. Vietnam market forecasts 90
9. Import - export76 VI. Enterprise analysis 91
10. Distribution channel 79 1. Enterprise introduction 92
11. Competitive analysis 80 2. Financial analysis 96
IV. Risk analysis 84 VII. Appendix of financial statements 111
Content is deleted for demo purpose
ABBREVIATIONS
4
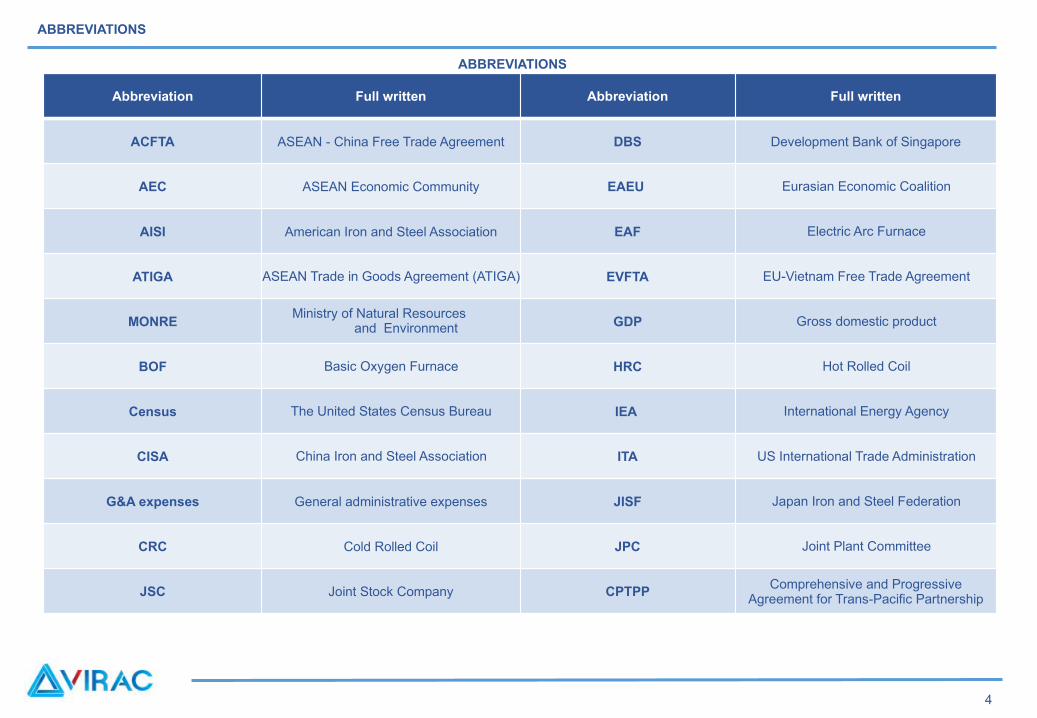
Abbreviation Full written Abbreviation Full written
ACFTA ASEAN - China Free Trade Agreement DBS Development Bank of Singapore
AEC ASEAN Economic Community EAEU Eurasian Economic Coalition
AISI American Iron and Steel Association EAF Electric Arc Furnace
ATIGA ASEAN Trade in Goods Agreement (ATIGA) EVFTA EU-Vietnam Free Trade Agreement
MONREMinistry of Natural Resources
and Environment GDP Gross domestic product
BOF Basic Oxygen Furnace HRC Hot Rolled Coil
Census The United States Census Bureau IEA International Energy Agency
CISA China Iron and Steel Association ITA US International Trade Administration
G&A expenses General administrative expenses JISF Japan Iron and Steel Federation
CRC Cold Rolled Coil JPC Joint Plant Committee
JSC Joint Stock Company CPTPPComprehensive and Progressive
Agreement for Trans-Pacific Partnership
ABBREVIATIONS
Content is deleted for demo purpose
ABBREVIATIONS
5
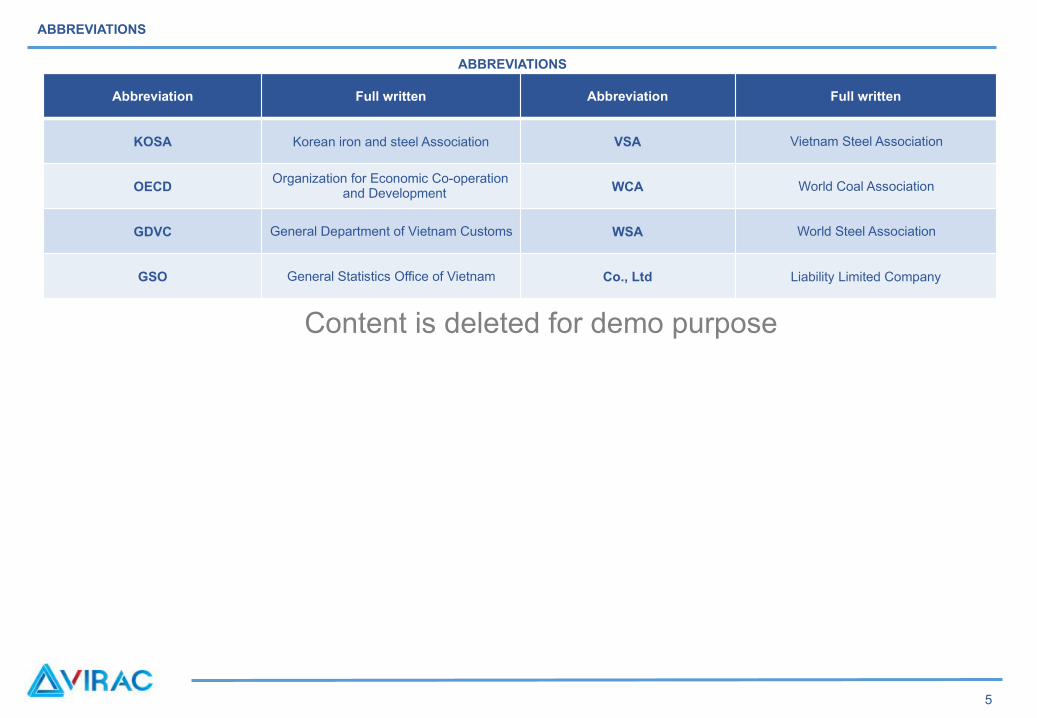
Abbreviation Full written Abbreviation Full written
KOSA Korean iron and steel Association VSA Vietnam Steel Association
OECDOrganization for Economic Co-operation
and Development WCA World Coal Association
GDVC General Department of Vietnam Customs WSA World Steel Association
GSO General Statistics Office of Vietnam Co., Ltd Liability Limited Company
ABBREVIATIONS
Content is deleted for demo purpose
EXECUTIVE SUMMARY
6
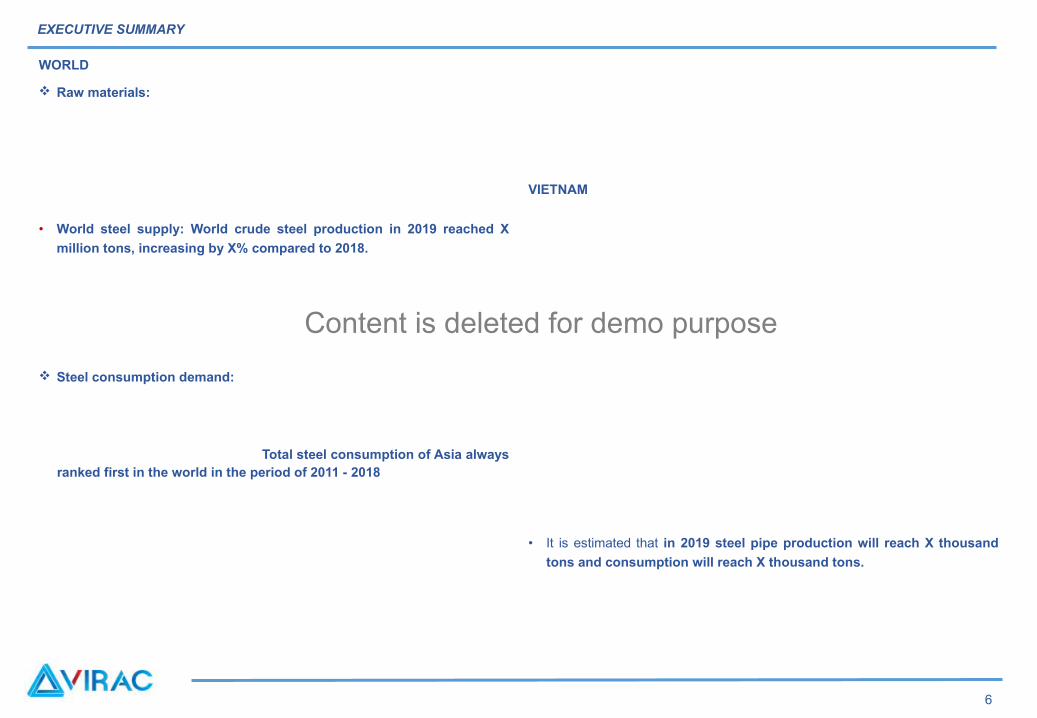
WORLD
Raw materials:
• World steel supply: World crude steel production in 2019 reached X
million tons, increasing by X% compared to 2018.
Steel consumption demand:
Total steel consumption of Asia always ranked first in the world in the period of 2011 - 2018
VIETNAM
• It is estimated that in 2019 steel pipe production will reach X thousand
tons and consumption will reach X thousand tons.
Content is deleted for demo purpose
EXECUTIVE SUMMARY
7
Enterprises
Business performance of steel enterprises in 2018 was quite optimistic but
paled in comparison with 2 years ago. Forecasts
2019 will continue to be a hard year for steel enterprises.

Content is deleted for demo purpose
8
BUSINESS ENVIRONMENT
Content is deleted for demo purpose
Part I. Business environment
1. Macroeconomic situation
9
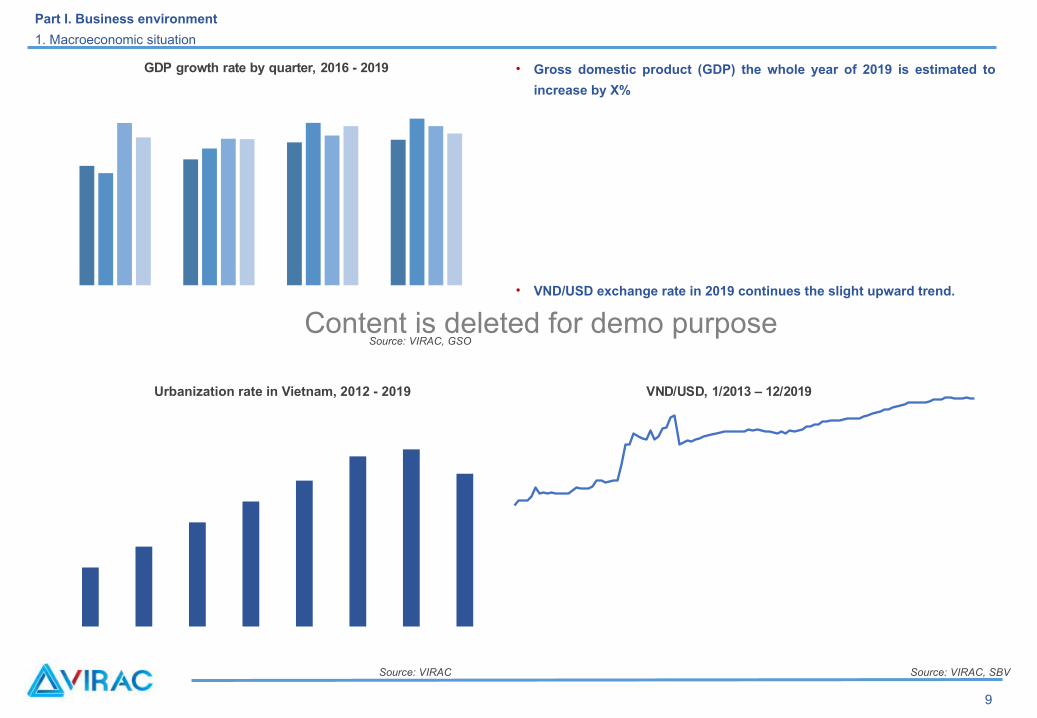
• Gross domestic product (GDP) the whole year of 2019 is estimated to
increase by X%
• VND/USD exchange rate in 2019 continues the slight upward trend.
Source: VIRAC, GSO
Source: VIRAC
Urbanization rate in Vietnam, 2012 - 2019
Source: VIRAC, SBV
GDP growth rate by quarter, 2016 - 2019
VND/USD, 1/2013 – 12/2019
Content is deleted for demo purpose
Part I. Business environment
1. Macroeconomic situation
10
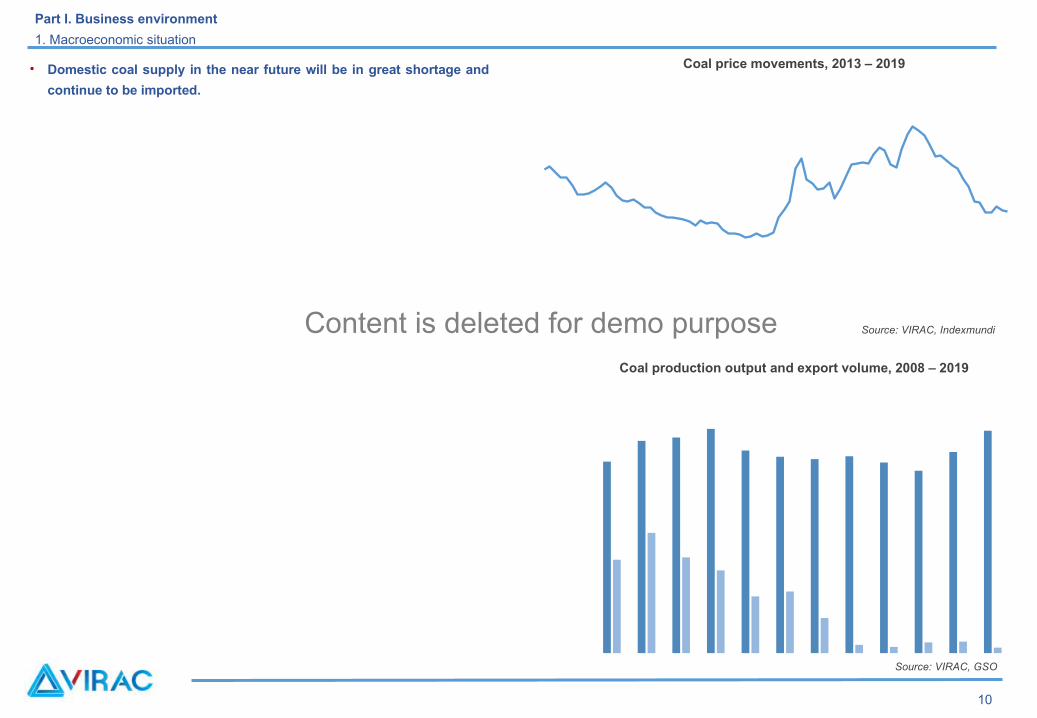
• Domestic coal supply in the near future will be in great shortage and
continue to be imported.
Source: VIRAC, Indexmundi
Source: VIRAC, GSO
Coal price movements, 2013 – 2019
Coal production output and export volume, 2008 – 2019
Content is deleted for demo purpose
Part I. Business environment
2. Legal framework
11
• Circular No. 101/2015/TT-BTC dated June 29, 2015
• Decree No. 38/2015/ND-CP of the Government
• Circular No. 165/2014/TT-BTC was issued by the Ministry of Finance on January 1, 2015
Content is deleted for demo purpose
Part I. Business environment
2. Legal framework
12
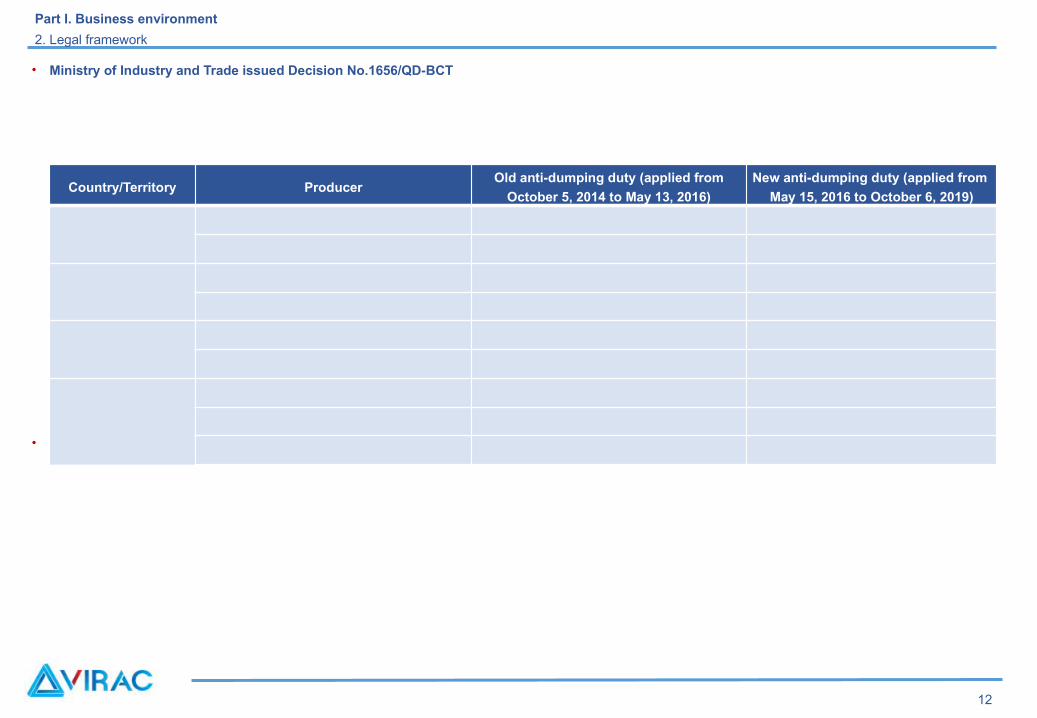
• Ministry of Industry and Trade issued Decision No.1656/QD-BCT
• Joint Circular No. 58/2015/BCT-BKHCN issued by the Ministry of Industry and Trade, and the Ministry of Science and Technology
Country/Territory ProducerOld anti-dumping duty (applied from
October 5, 2014 to May 13, 2016)
New anti-dumping duty (applied from
May 15, 2016 to October 6, 2019)
Content is deleted for demo purpose
Part I. Business environment
2. Legal framework
13
• On March 3, 2016, the Minister of Industry and Trade issued Decision No. 818/QD-BCT
• Resolution No. 1084/2015/UBTVQH13 dated 10/12/2015 of the National Assembly Standing Committee
• Ministry of Industry and Trade issued Circular No. 12/2015/TT-BCT
• Decision No. 1931/QD-BCT
• Decision No. 2754/QD-BCT
Content is deleted for demo purpose
Part I. Business environment
2. Legal framework
14
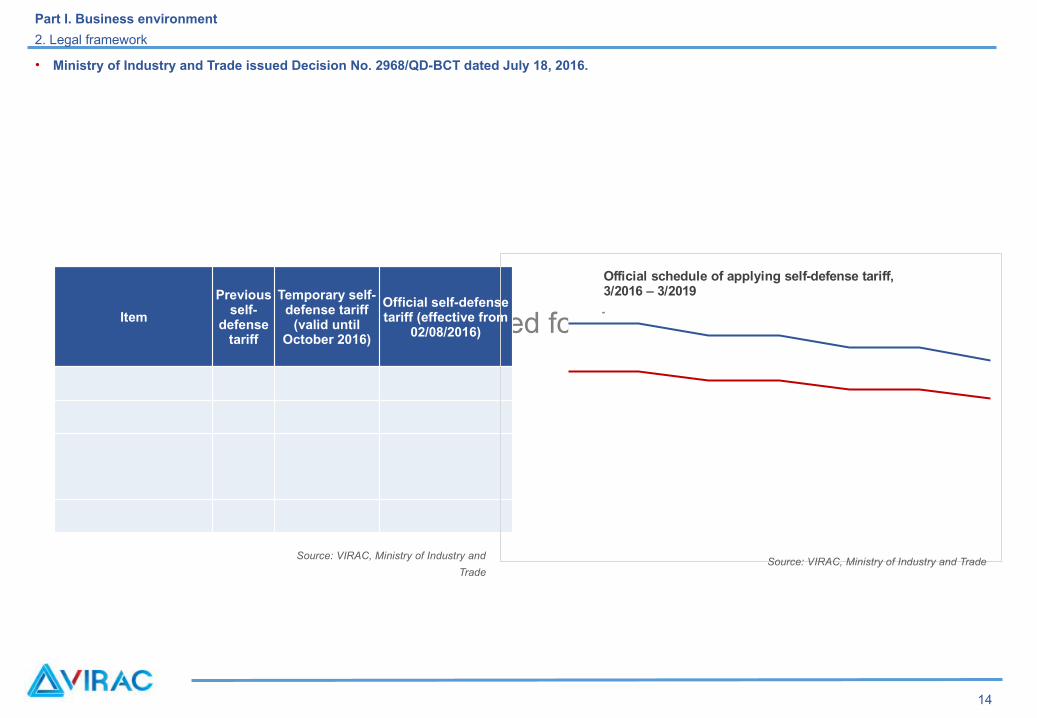
• Ministry of Industry and Trade issued Decision No. 2968/QD-BCT dated July 18, 2016.
Item
Previous self-
defense tariff
Temporary self-defense tariff
(valid until October 2016)
Official self-defense tariff (effective from
02/08/2016)
Official schedule of applying self-defense tariff, 3/2016 – 3/2019
Source: VIRAC, Ministry of Industry and
TradeSource: VIRAC, Ministry of Industry and Trade
Content is deleted for demo purpose
Part I. Business environment
3. Trade agreements
AEC’s impacts on Vietnam steel enterprises
ASEAN Trade in Goods Agreement (ATIGA)
18
Content is deleted for demo purpose
Part I. Business environment
3. Trade agreements
19
Impacts of CPTPP on Vietnam’s steel industry
Content is deleted for demo purpose
Part I. Business environment
3. Trade agreements
20
EU – Vietnam Free Trade Agreement
Vietnam – Eurasian Economic Union Free Trade Agreement
ASEAN-China Free Trade Area

Content is deleted for demo purpose
18
GLOBAL MARKET
Content is deleted for demo purpose
Part II. Global market
1. Definition and classification
Definition
Classification
22
Content is deleted for demo purpose
Part II. Global market
1. Definition and classification
23
Content is deleted for demo purpose
Part II. Global market
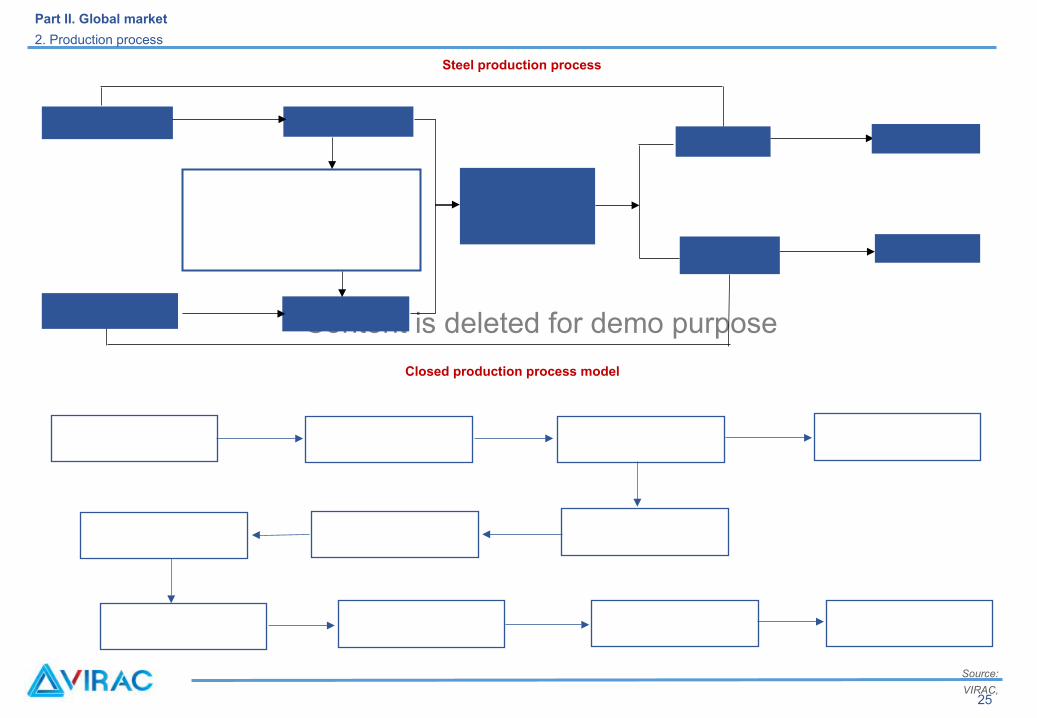
2. Production process
Steel production process
Closed production process model
25
Source:
VIRAC,
Content is deleted for demo purpose
Part II. Global market
2. Production process
26
Steel production process
Source: VIRAC, WSA
Content is deleted for demo purpose
Part II. Global market
2. Production process
Process: including 4 basic steps
1) Ironmaking:
26
Chemical reactions in the furnace
Source: VIRAC
2) Steelmaking:
Content is deleted for demo purpose
Part II. Global market
2. Production process
3) Continuous Casting:
4) Rolling:
26
Content is deleted for demo purpose
Part II. Global market
3. Production technology
Method
According to the World Coal Association (WCA), there currently exist 4 steel production methods:
• BOF – Basic Oxygen Furnace
• EAF – Electric arc furnaces
30
Content is deleted for demo purpose
Part II. Global market
3. Production technology
• Pulverised coal injection:
• Recycling:
31
Content is deleted for demo purpose
Part II. Global market
4. Raw materials
Raw materials for steel production include: metal scrap and iron ore.
Fuel in steel production includes coal and gas
27
Content is deleted for demo purpose
Part II. Global market
4. Raw materials
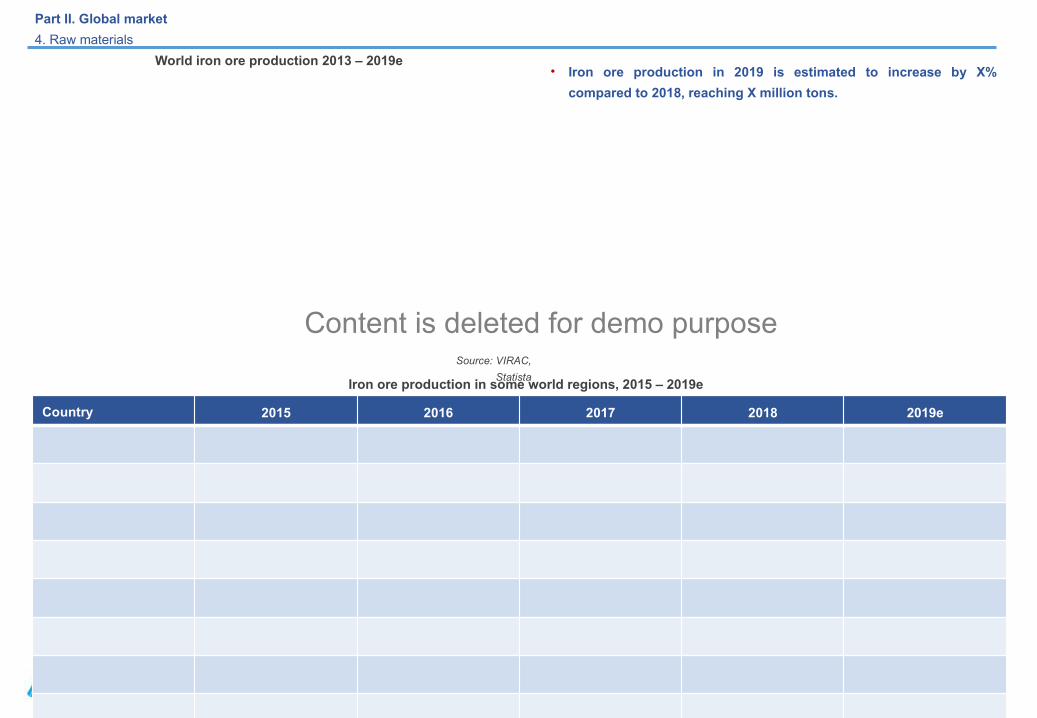
• Iron ore production in 2019 is estimated to increase by X%
compared to 2018, reaching X million tons.
Source: VIRAC,
Statista
32
World iron ore production 2013 – 2019e
Source: VIRAC, Statista
Country 2015 2016 2017 2018 2019e
Iron ore production in some world regions, 2015 – 2019e
Content is deleted for demo purpose
Part II. Global market
4. Raw materials
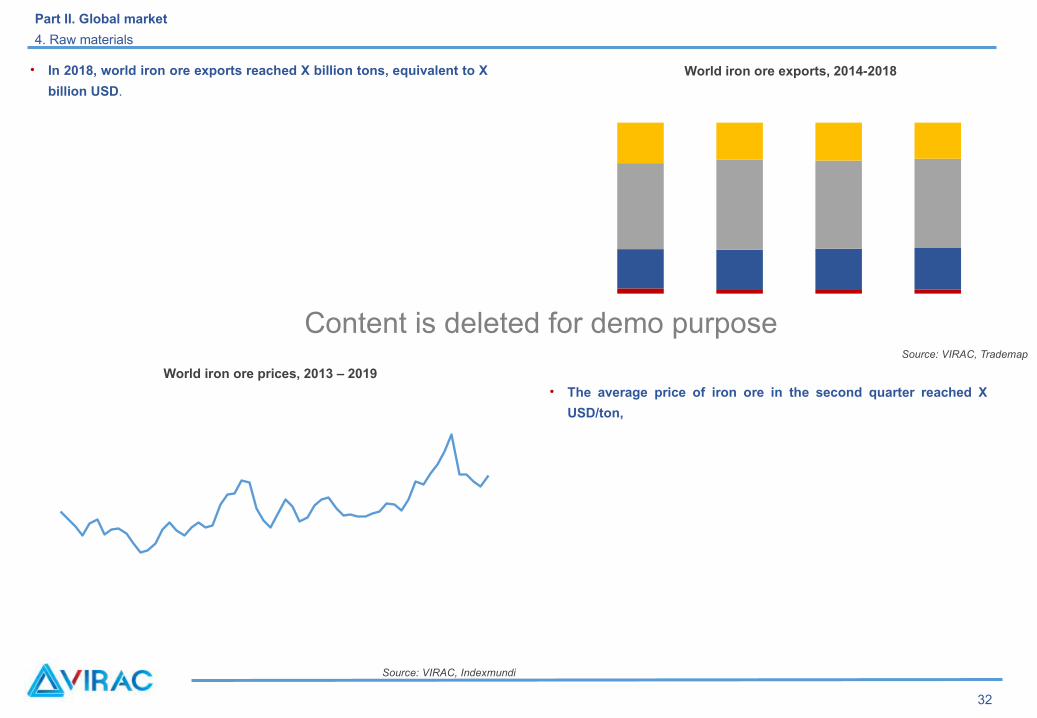
• In 2018, world iron ore exports reached X billion tons, equivalent to X
billion USD.
Source: VIRAC, Trademap
32
World iron ore exports, 2014-2018
World iron ore prices, 2013 – 2019• The average price of iron ore in the second quarter reached X
USD/ton,
Source: VIRAC, Indexmundi
Content is deleted for demo purpose
Iron, steel scrap
Part II. Global market
4. Raw materials
Source: VIRAC, WSA
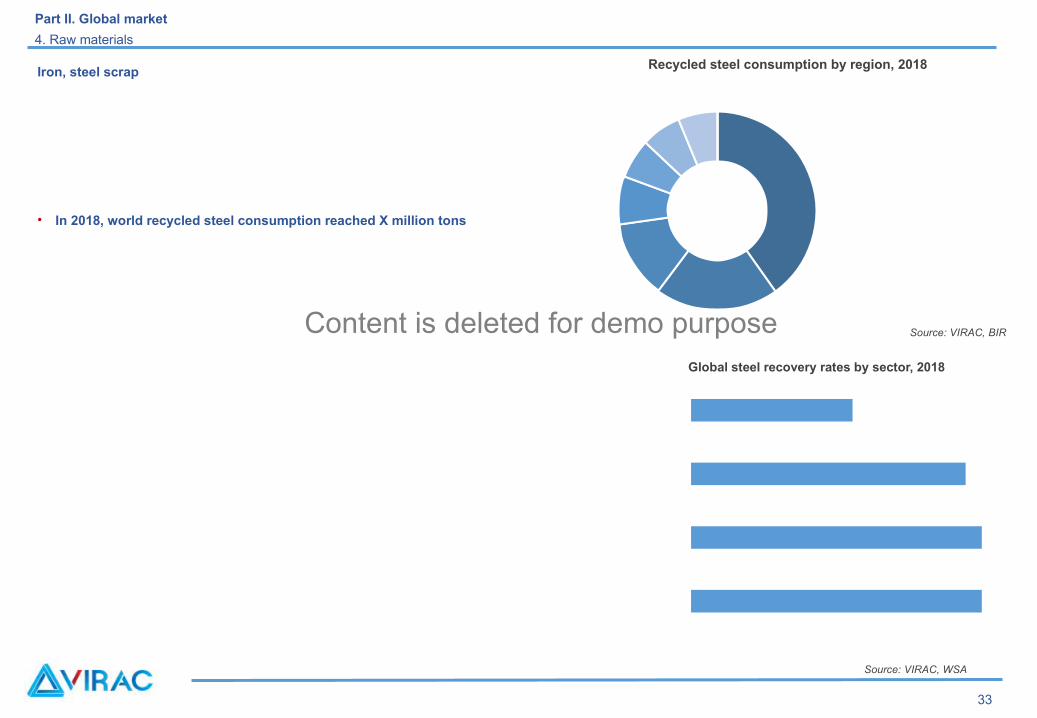
• In 2018, world recycled steel consumption reached X million tons
33
Source: VIRAC, BIR
Global steel recovery rates by sector, 2018
Recycled steel consumption by region, 2018
Content is deleted for demo purpose
Part II. Global market
4. Raw materials
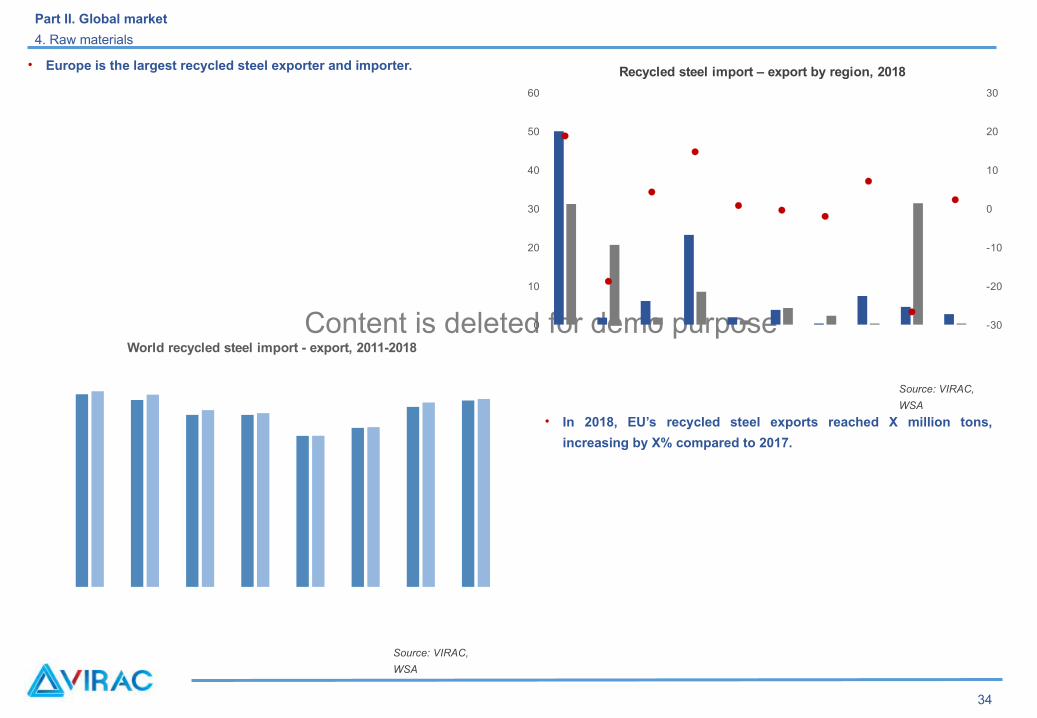
• Europe is the largest recycled steel exporter and importer.
• In 2018, EU’s recycled steel exports reached X million tons,
increasing by X% compared to 2017.
Source: VIRAC,
WSA
Source: VIRAC,
WSA
34
World recycled steel import - export, 2011-2018
0
10
20
30
40
50
60
-30
-20
-10
0
10
20
30
Recycled steel import – export by region, 2018
Content is deleted for demo purpose
Part II. Global market
4. Raw materials
Coal and coke
About X% of total world steel production depends directly on the input coal. About X billion tons of coal is used in world steel production, accounting
for about X% of total world coal consumption.
35
Content is deleted for demo purpose
Part II. Global market
4. Raw materials
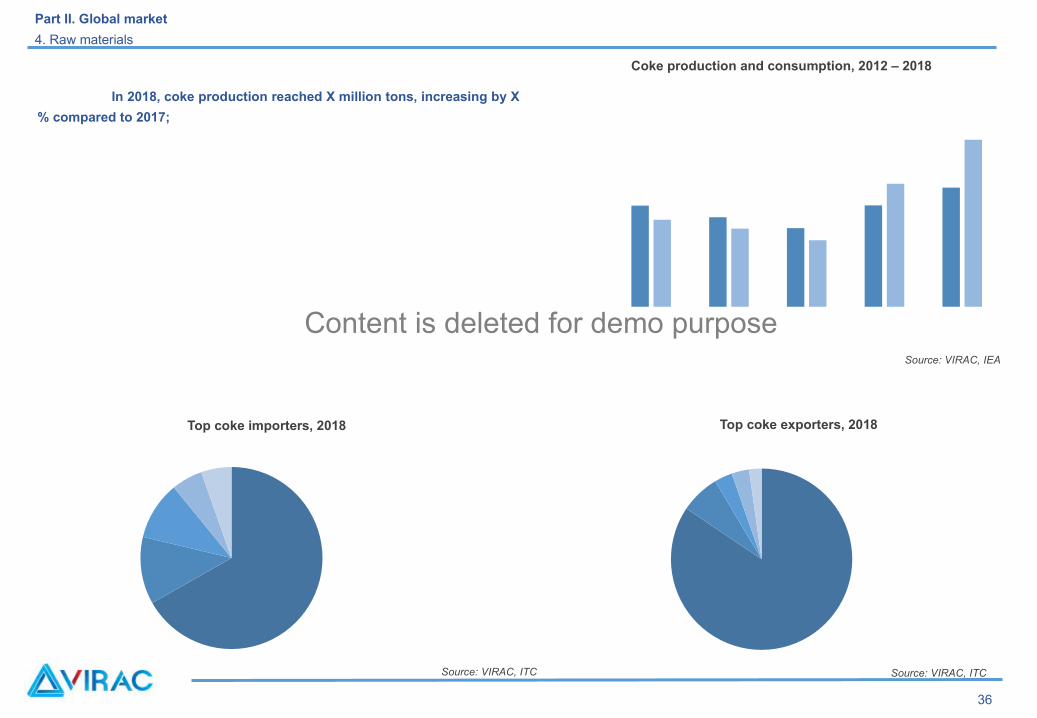
In 2018, coke production reached X million tons, increasing by X
% compared to 2017;
Source: VIRAC, IEA
36
Source: VIRAC, ITC Source: VIRAC, ITC
Coke production and consumption, 2012 – 2018
Top coke exporters, 2018Top coke importers, 2018
Content is deleted for demo purpose
Part II. Global market
5. Production
38
Source: VIRAC, WSA
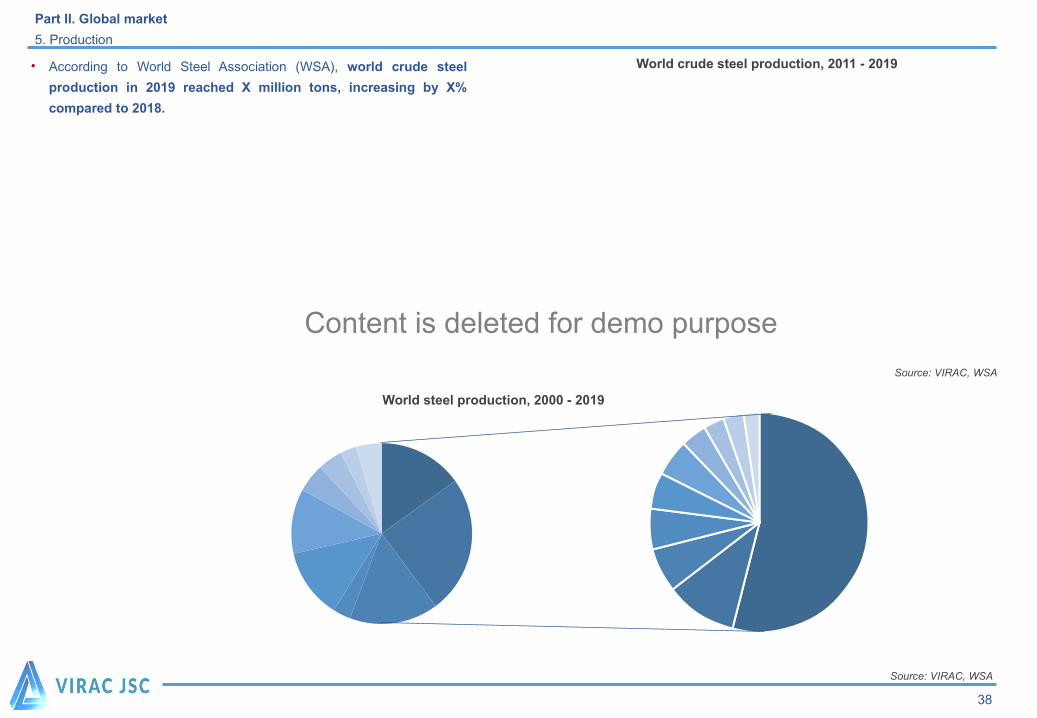
• According to World Steel Association (WSA), world crude steel
production in 2019 reached X million tons, increasing by X%
compared to 2018.
World steel production, 2000 - 2019
Source: VIRAC, WSA
World crude steel production, 2011 - 2019
Content is deleted for demo purpose
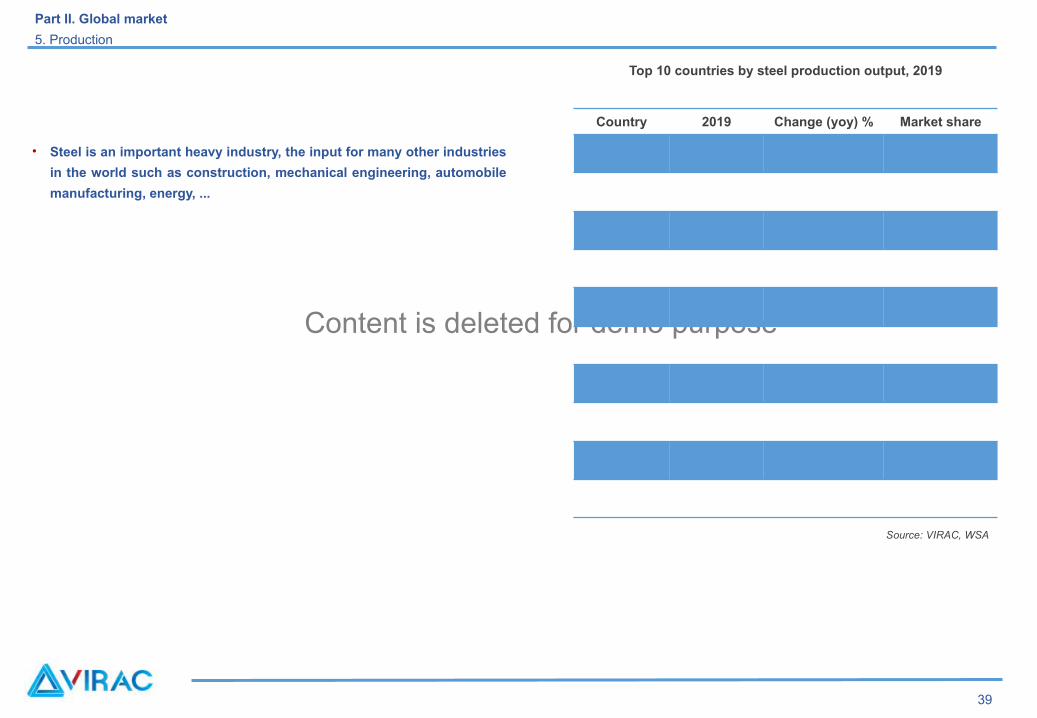
• Steel is an important heavy industry, the input for many other industries
in the world such as construction, mechanical engineering, automobile
manufacturing, energy, ...
Part II. Global market
5. Production
39
Source: VIRAC, WSA
Top 10 countries by steel production output, 2019
Country 2019 Change (yoy) % Market share
Content is deleted for demo purpose
Part II. Global market
5. Production
39
Source: VIRAC, WSA
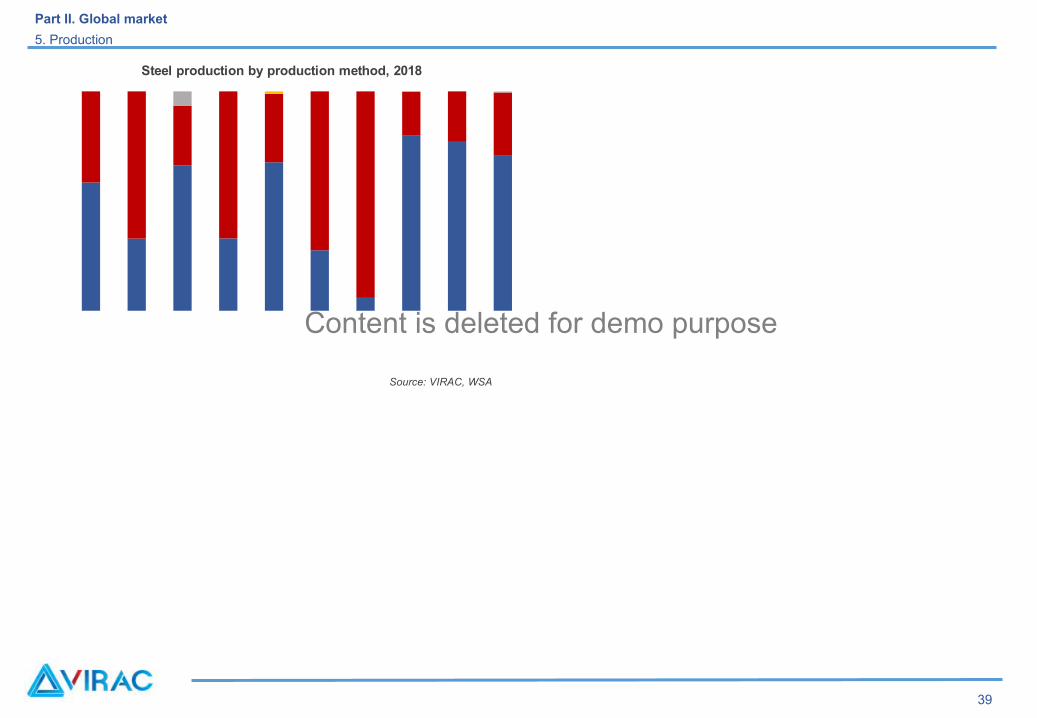
Steel production by production method, 2018
Content is deleted for demo purpose
Part II. Global market
6. Consumption
41
Source: VIRAC,
WSA
Source: VIRAC, WSA
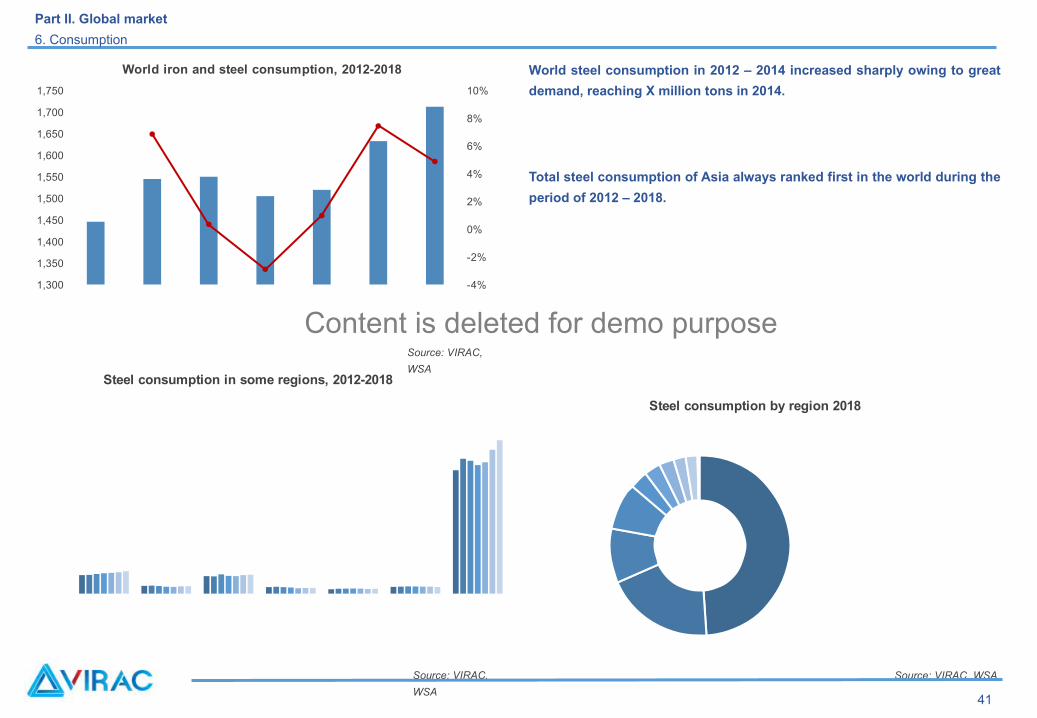
World steel consumption in 2012 – 2014 increased sharply owing to great
demand, reaching X million tons in 2014.
Total steel consumption of Asia always ranked first in the world during the
period of 2012 – 2018.
Source: VIRAC,
WSA
1,300
1,350
1,400
1,450
1,500
1,550
1,600
1,650
1,700
1,750
-4%
-2%
0%
2%
4%
6%
8%
10%
World iron and steel consumption, 2012-2018
Steel consumption in some regions, 2012-2018
Steel consumption by region 2018
Content is deleted for demo purpose
Part II. Global market
6. Consumption
42
Source: VIRAC,
OECD
Source: VIRAC,
WSA
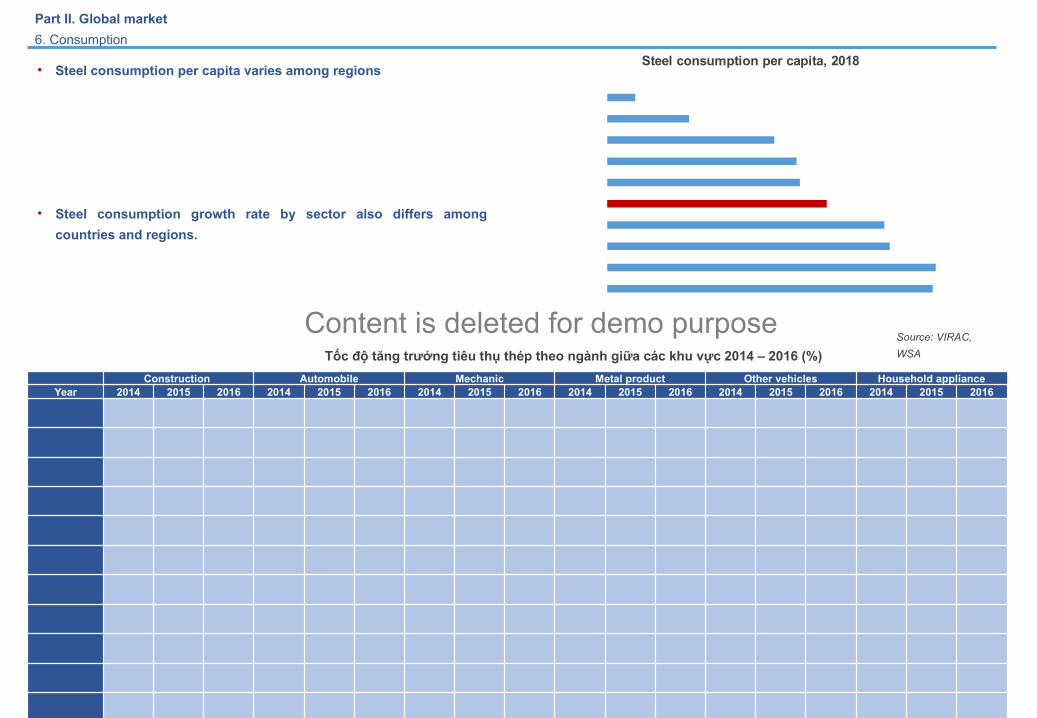
• Steel consumption per capita varies among regions
• Steel consumption growth rate by sector also differs among
countries and regions.
Construction Automobile Mechanic Metal product Other vehicles Household applianceYear 2014 2015 2016 2014 2015 2016 2014 2015 2016 2014 2015 2016 2014 2015 2016 2014 2015 2016
Tốc độ tăng trưởng tiêu thụ thép theo ngành giữa các khu vực 2014 – 2016 (%)
Steel consumption per capita, 2018
Content is deleted for demo purpose
Part II. Global market
7. Import - export
44
Source: VIRAC,
WSA
Source: VIRAC,
WSA
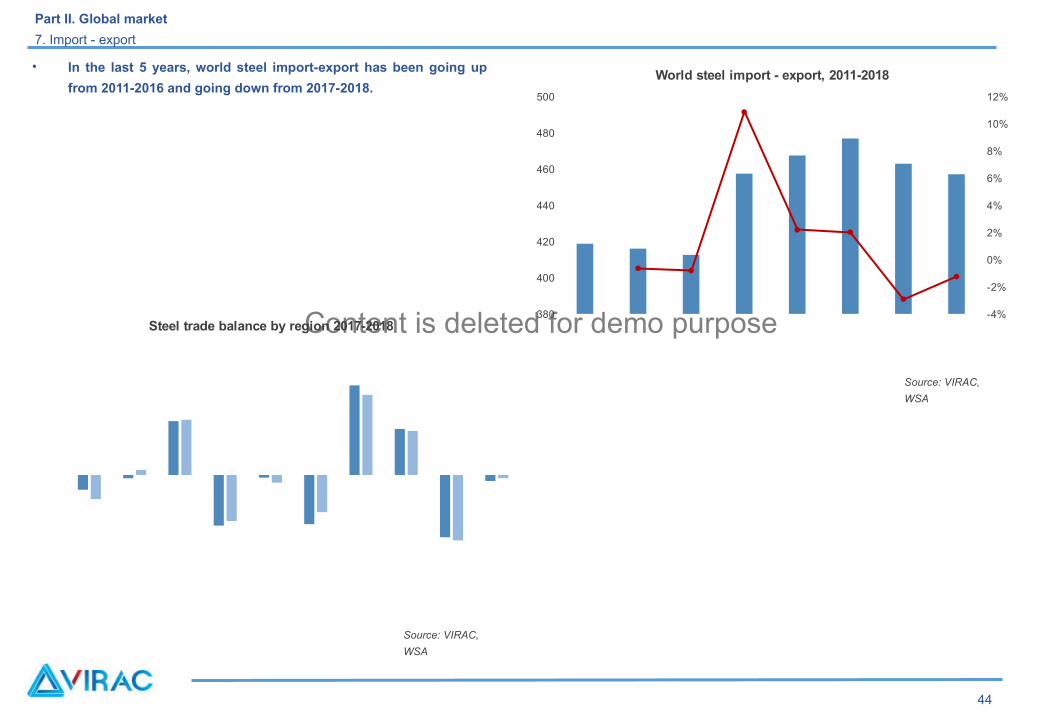
• In the last 5 years, world steel import-export has been going up
from 2011-2016 and going down from 2017-2018.
380
400
420
440
460
480
500
-4%
-2%
0%
2%
4%
6%
8%
10%
12%
World steel import - export, 2011-2018
Steel trade balance by region 2017-2018
Content is deleted for demo purpose
Part II. Global market
7. Import - export
45
Source: VIRAC, WSA
Source: VIRAC,
WSA
Source: VIRAC, WSA
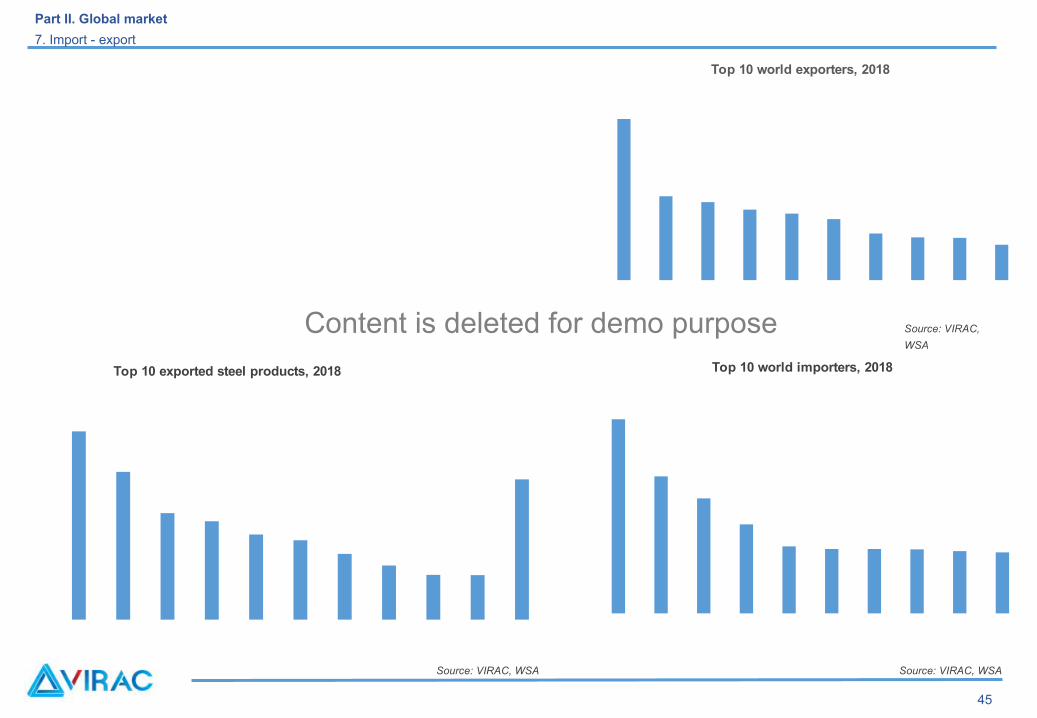
Top 10 world exporters, 2018
Top 10 world importers, 2018Top 10 exported steel products, 2018
Content is deleted for demo purpose
Part II. Global market
8. Current situation of key nations in the industry – 8.1 – China
47
Source: VIRAC, WSA,
JISF
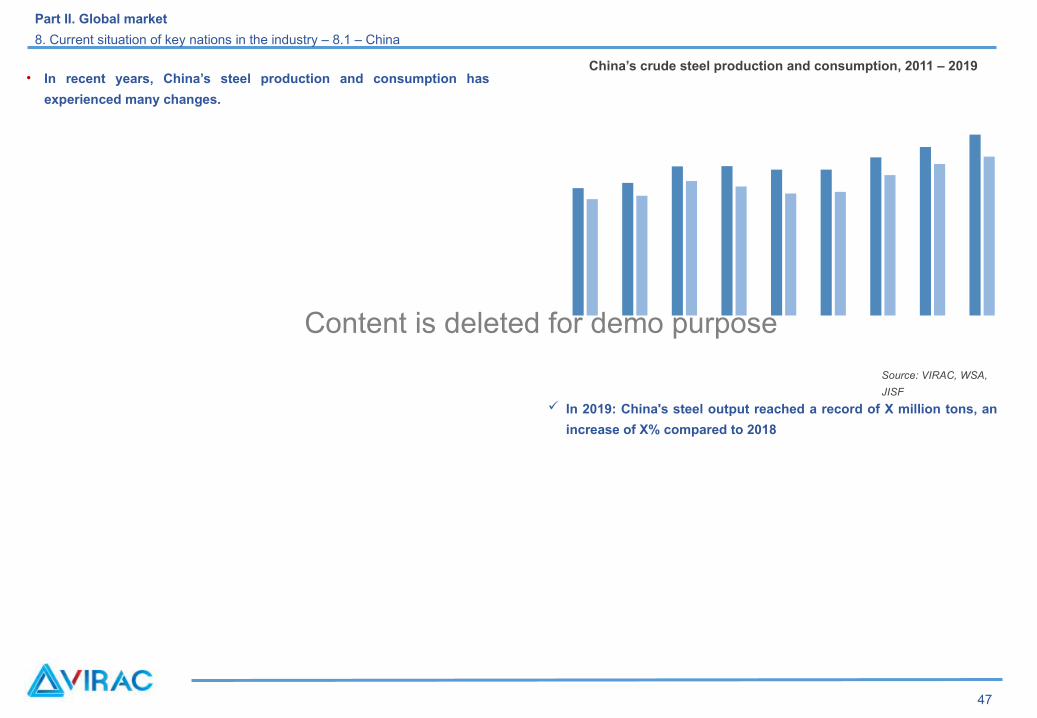
• In recent years, China’s steel production and consumption has
experienced many changes.
China’s crude steel production and consumption, 2011 – 2019
In 2019: China's steel output reached a record of X million tons, an
increase of X% compared to 2018
Content is deleted for demo purpose
Part II. Global market
8. Current situation of key nations in the industry – 8.1 – China
47
Source: VIRAC, WSA, China custom
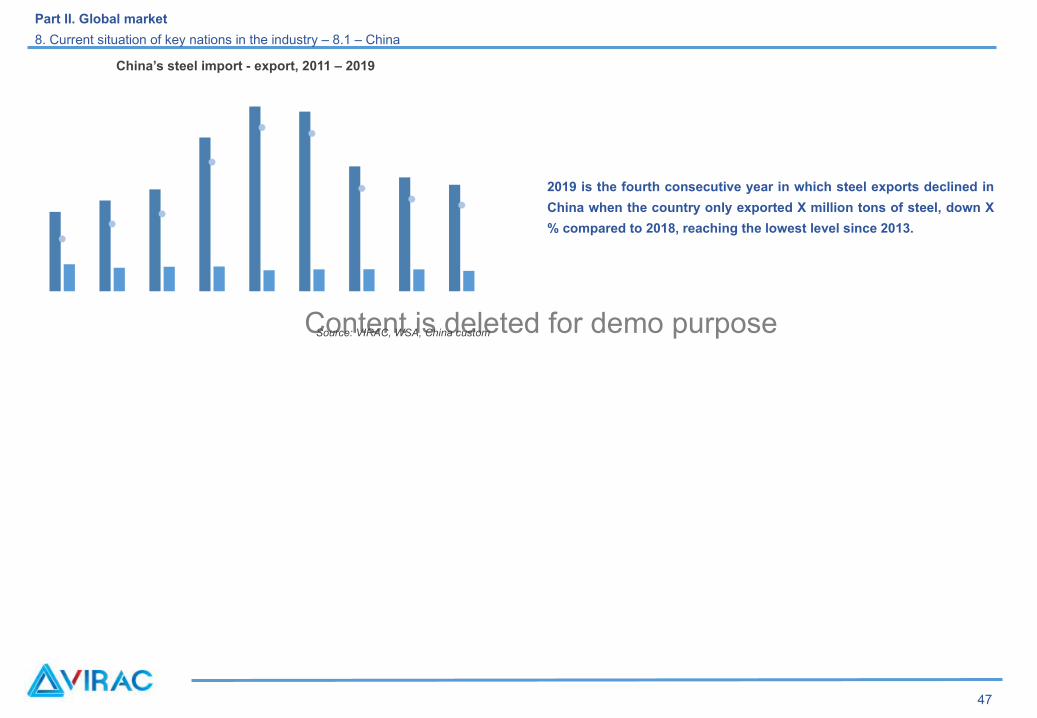
2019 is the fourth consecutive year in which steel exports declined in
China when the country only exported X million tons of steel, down X
% compared to 2018, reaching the lowest level since 2013.
China’s steel import - export, 2011 – 2019
Content is deleted for demo purpose
Part II. Global market
8. Current situation of key nations in the industry – 8.2 – Japan
48
Source: VIRAC, WSA, JISF
Source: VIRAC, WSA,
JISF
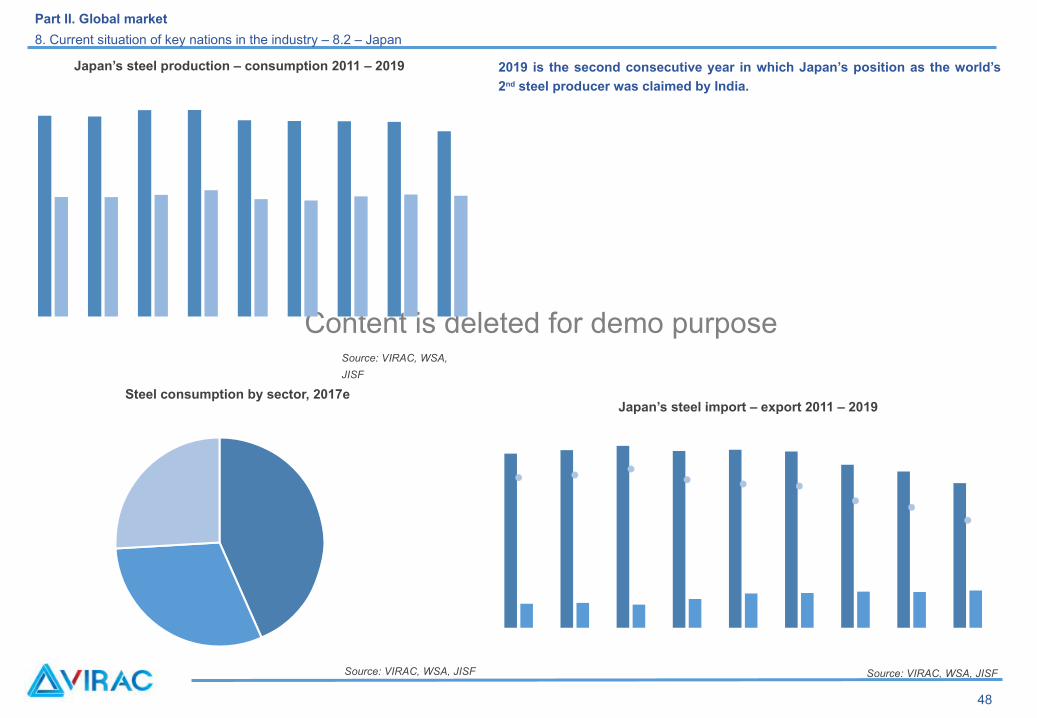
2019 is the second consecutive year in which Japan’s position as the world’s
2nd steel producer was claimed by India.
Source: VIRAC, WSA, JISF
Steel consumption by sector, 2017e
Japan’s steel production – consumption 2011 – 2019
Japan’s steel import – export 2011 – 2019
Content is deleted for demo purpose
Part II. Global market
8. Current situation of key nations in the industry – 8.3 – India
49
Source: VIRAC, JPC, Indian ministry of steel
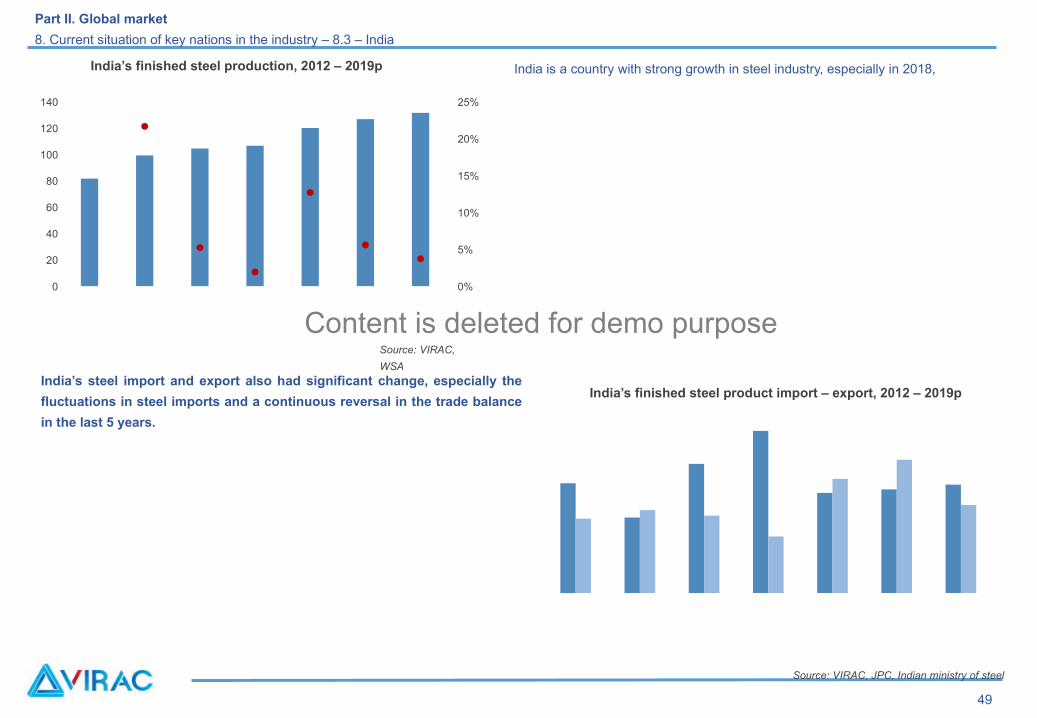
India is a country with strong growth in steel industry, especially in 2018,
India’s steel import and export also had significant change, especially the
fluctuations in steel imports and a continuous reversal in the trade balance
in the last 5 years.
Source: VIRAC,
WSA
India’s finished steel product import – export, 2012 – 2019p
India’s finished steel production, 2012 – 2019p
0
20
40
60
80
100
120
140
0%
5%
10%
15%
20%
25%
Content is deleted for demo purpose
Part II. Global market
8. Current situation of key nations in the industry – 8.4 – Korea
50
Source: VIRAC,
WSA
Source: VIRAC,
WSA
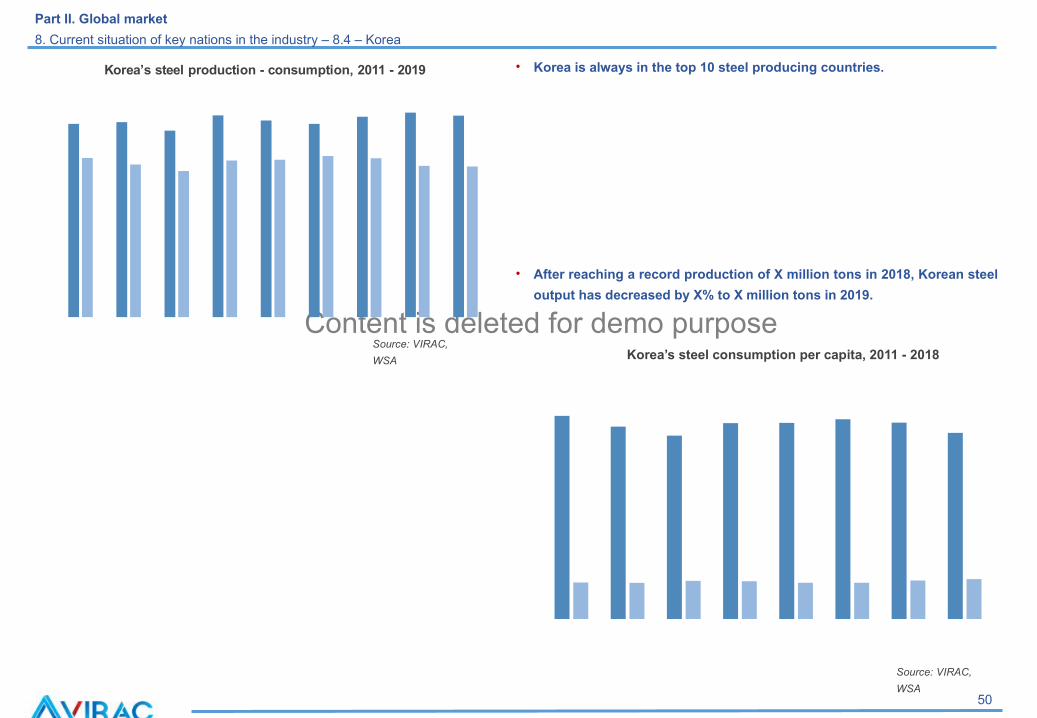
• Korea is always in the top 10 steel producing countries.
• After reaching a record production of X million tons in 2018, Korean steel
output has decreased by X% to X million tons in 2019.
Korea’s steel consumption per capita, 2011 - 2018
Korea’s steel production - consumption, 2011 - 2019
Content is deleted for demo purpose
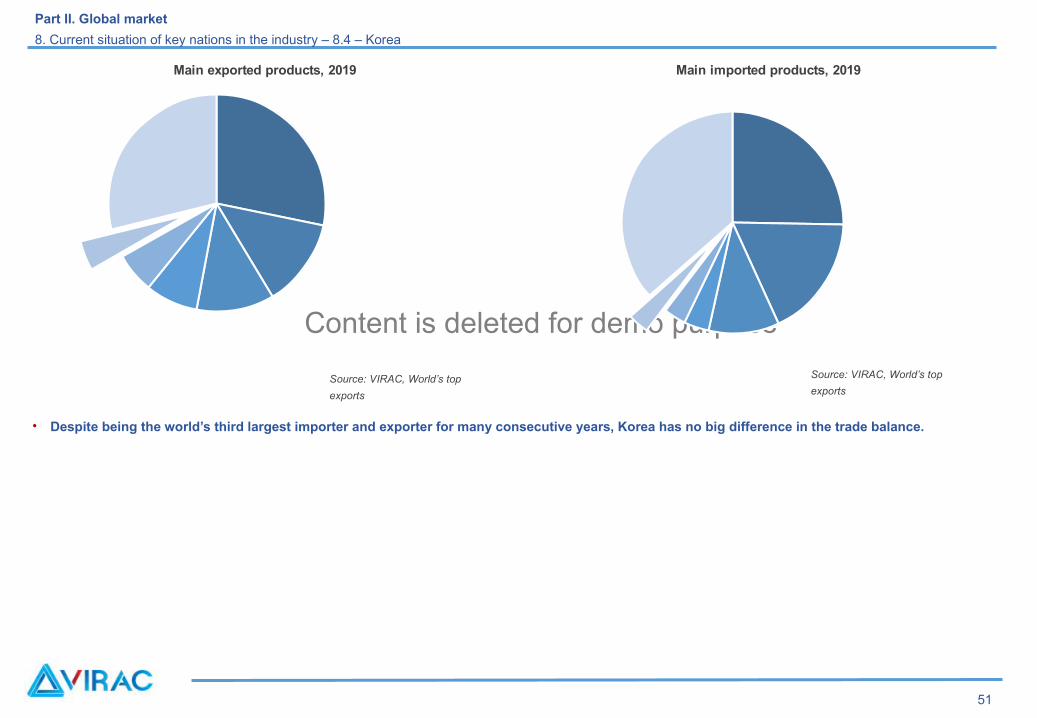
• Despite being the world’s third largest importer and exporter for many consecutive years, Korea has no big difference in the trade balance.
Source: VIRAC, World’s top
exports
Source: VIRAC, World’s top
exports
Part II. Global market
8. Current situation of key nations in the industry – 8.4 – Korea
51
Main exported products, 2019 Main imported products, 2019
Content is deleted for demo purpose
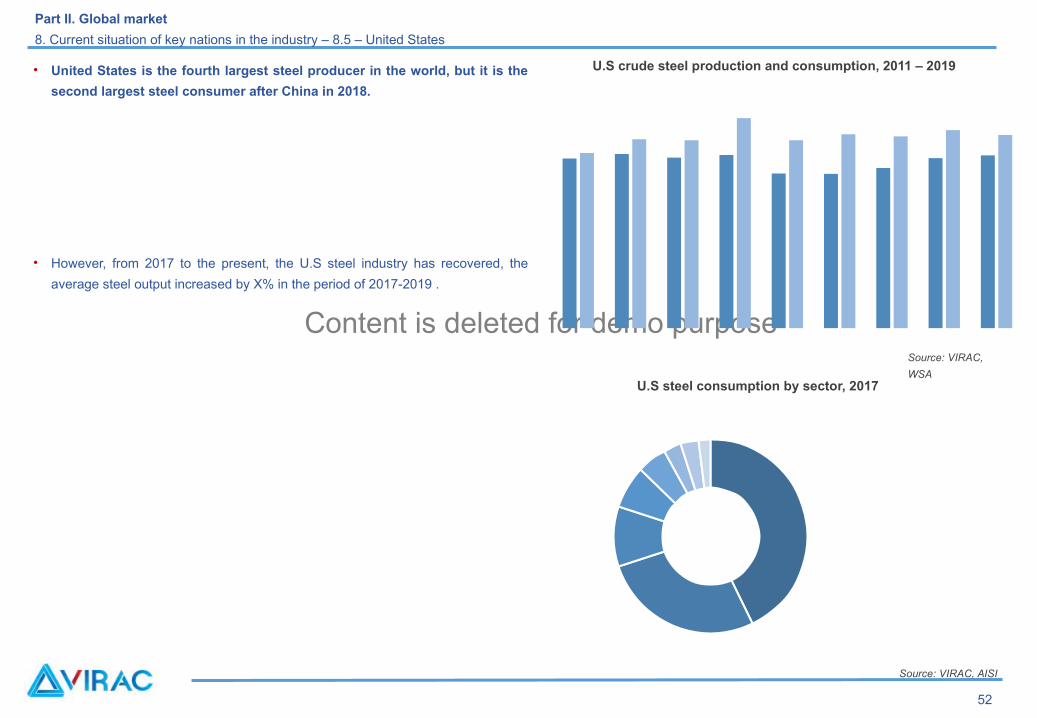
• United States is the fourth largest steel producer in the world, but it is the
second largest steel consumer after China in 2018.
• However, from 2017 to the present, the U.S steel industry has recovered, the
average steel output increased by X% in the period of 2017-2019 .
Source: VIRAC,
WSA
Source: VIRAC, AISI
Part II. Global market
8. Current situation of key nations in the industry – 8.5 – United States
52
U.S crude steel production and consumption, 2011 – 2019
U.S steel consumption by sector, 2017
Content is deleted for demo purpose
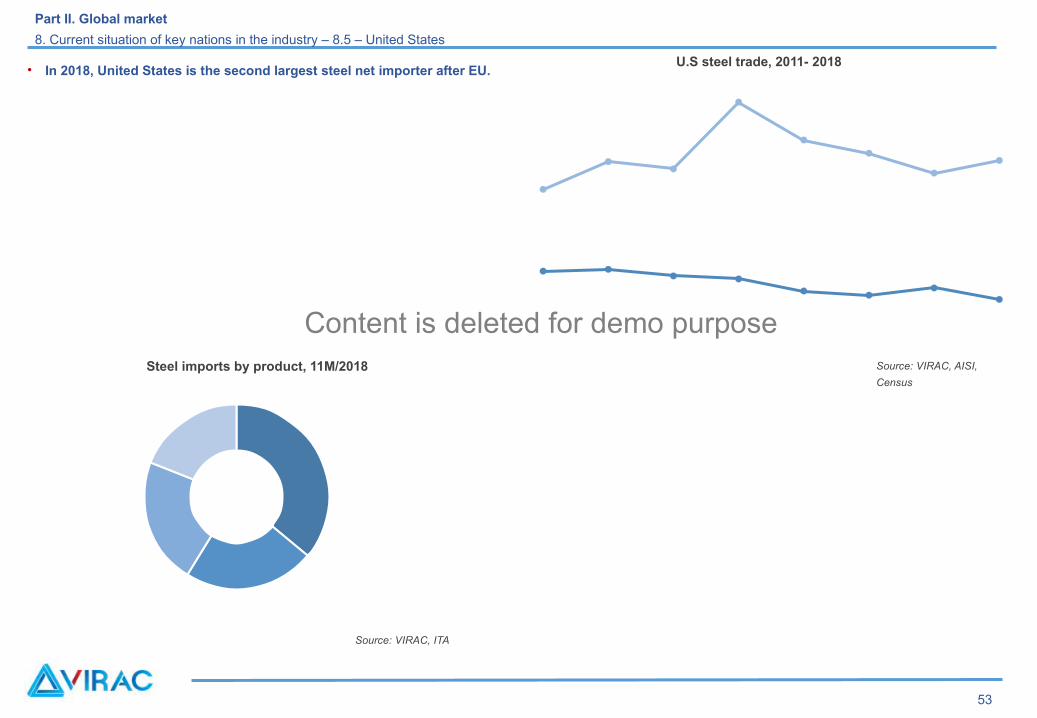
• In 2018, United States is the second largest steel net importer after EU.
Source: VIRAC, AISI,
Census
Source: VIRAC, ITA
Part II. Global market
8. Current situation of key nations in the industry – 8.5 – United States
53
Steel imports by product, 11M/2018
U.S steel trade, 2011- 2018
Content is deleted for demo purpose
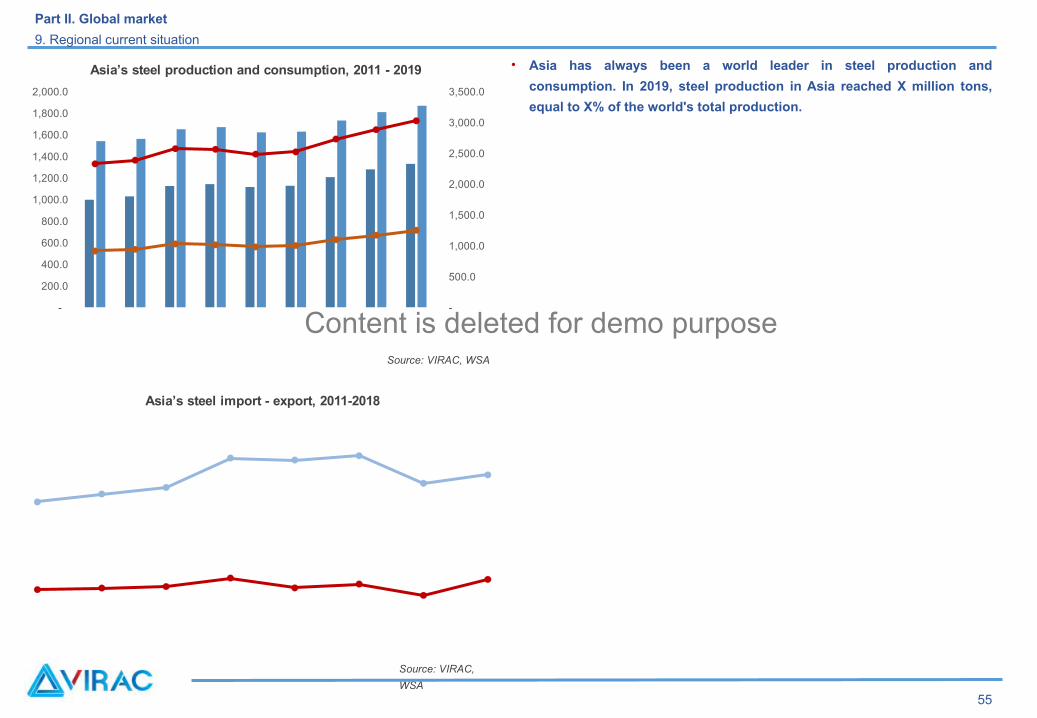
• Asia has always been a world leader in steel production and
consumption. In 2019, steel production in Asia reached X million tons,
equal to X% of the world's total production.
Source: VIRAC,
WSA
Part II. Global market
9. Regional current situation
55
Source: VIRAC, WSA
Asia’s steel import - export, 2011-2018
-
200.0
400.0
600.0
800.0
1,000.0
1,200.0
1,400.0
1,600.0
1,800.0
2,000.0
-
500.0
1,000.0
1,500.0
2,000.0
2,500.0
3,000.0
3,500.0
Asia’s steel production and consumption, 2011 - 2019
Content is deleted for demo purpose
Source: VIRAC, WSA
Top 10 steel producing enterprises in the world, 2017 – 2018
Part II. Global market
10. Major companies in the industry
57
Ranked in 2017 Ranked in 2018 Enterprise2017 2018 Growth rate
Market share 2018(Million tons) (Million tons) 2017 – 2018

Content is deleted for demo purpose
51
VIETNAM MARKET
Content is deleted for demo purpose
• Vietnamese steel industry started from 1959
• In recent years, Vietnam’s steel industry has experienced high growth rate
Part III. Vietnam market
1. History of development
64
Content is deleted for demo purpose
Long steel industry value chainThe current value chain of long steel production in Vietnam includes:
Ore + limestone + coal => Cast iron => Steel refining => Steel casting => Steel rolling.
Part III. Vietnam market
2. Industry value chain
66
Content is deleted for demo purpose
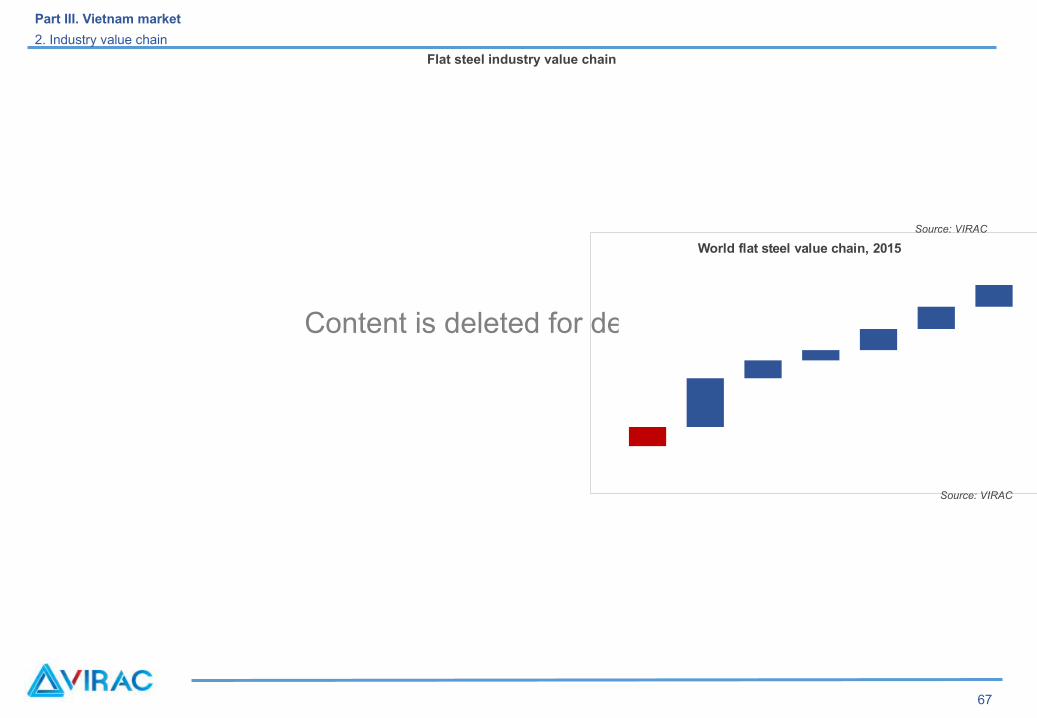
Flat steel industry value chain
World flat steel value chain, 2015
Part III. Vietnam market
2. Industry value chain
Source: VIRAC
Source: VIRAC
67
Content is deleted for demo purpose
69
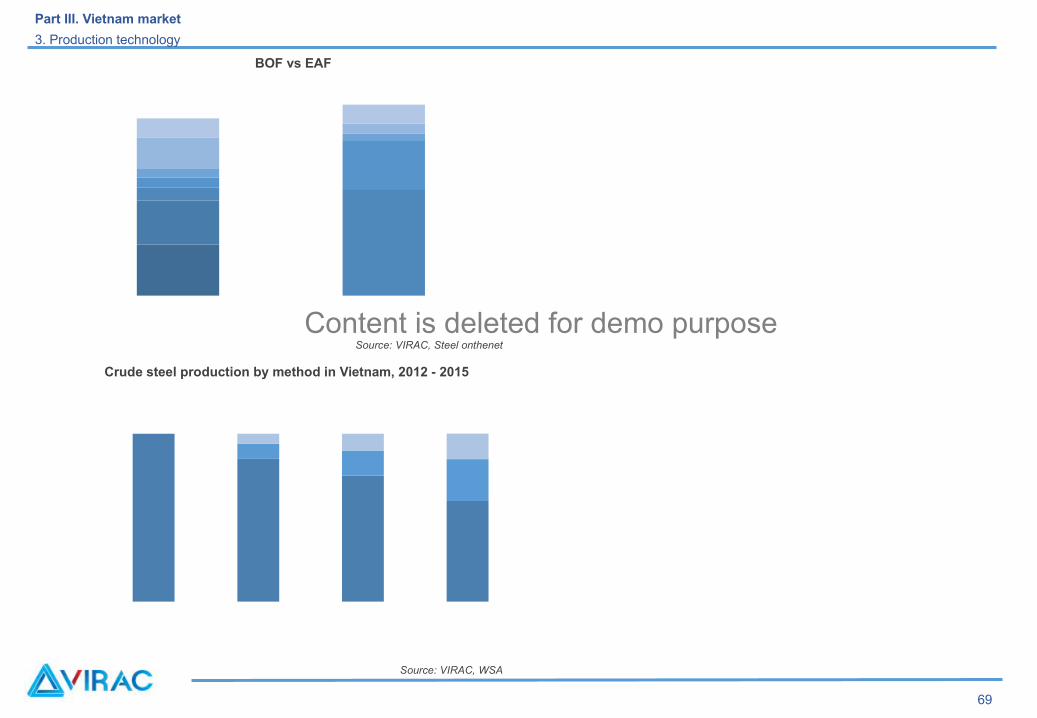
Part III. Vietnam market
3. Production technology
BOF vs EAF
Source: VIRAC, Steel onthenet
Crude steel production by method in Vietnam, 2012 - 2015
Source: VIRAC, WSA
Content is deleted for demo purpose
70
Part III. Vietnam market
3. Production technology
Enterprise Method applied Product
Method applied by enterprises
Content is deleted for demo purpose
BOF: Main input raw materials: Iron ore and coke
72
Part III. Vietnam market
4. Raw materials
Content is deleted for demo purpose
73
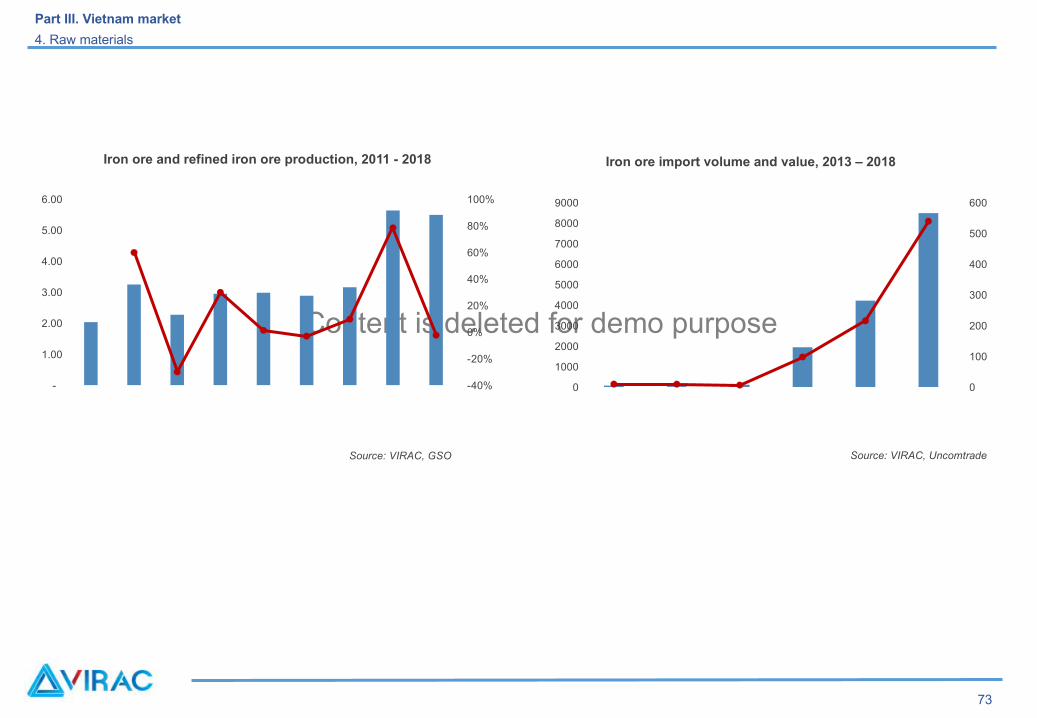
Part III. Vietnam market
4. Raw materials
Iron ore and refined iron ore production, 2011 - 2018 Iron ore import volume and value, 2013 – 2018
Source: VIRAC, UncomtradeSource: VIRAC, GSO
-
1.00
2.00
3.00
4.00
5.00
6.00
-40%
-20%
0%
20%
40%
60%
80%
100%
0
1000
2000
3000
4000
5000
6000
7000
8000
9000
0
100
200
300
400
500
600
Content is deleted for demo purpose
74
Part III. Vietnam market
4. Raw materials
Content is deleted for demo purpose
75
Part III. Vietnam market
4. Raw materials
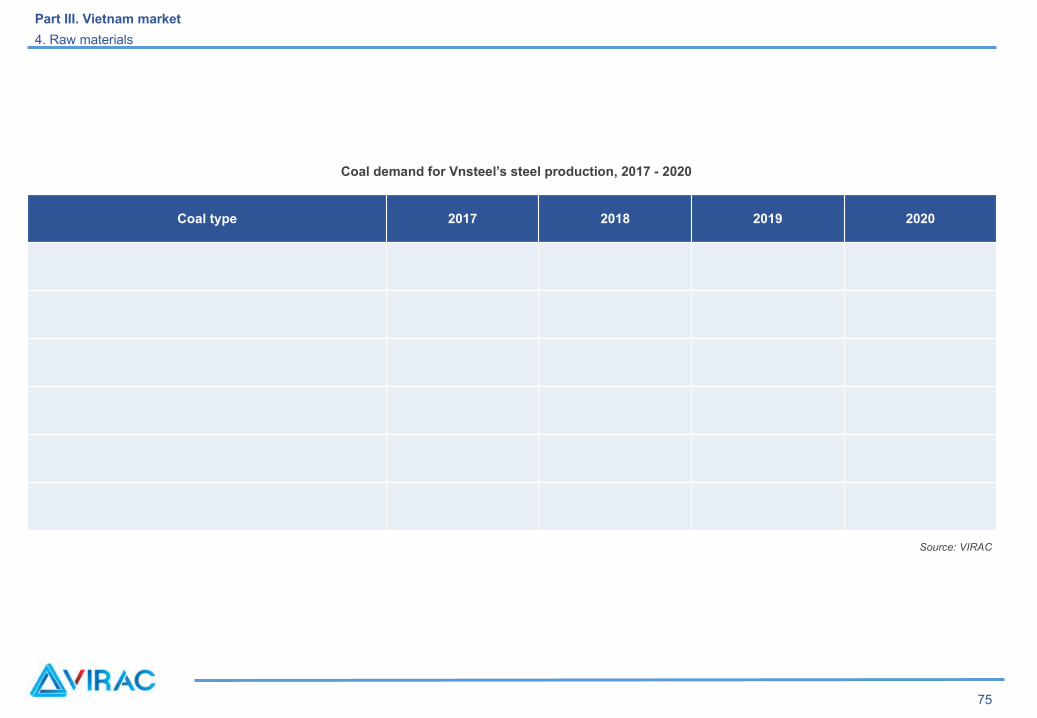
Coal demand for Vnsteel’s steel production, 2017 - 2020
Coal type 2017 2018 2019 2020
Source: VIRAC
Content is deleted for demo purpose
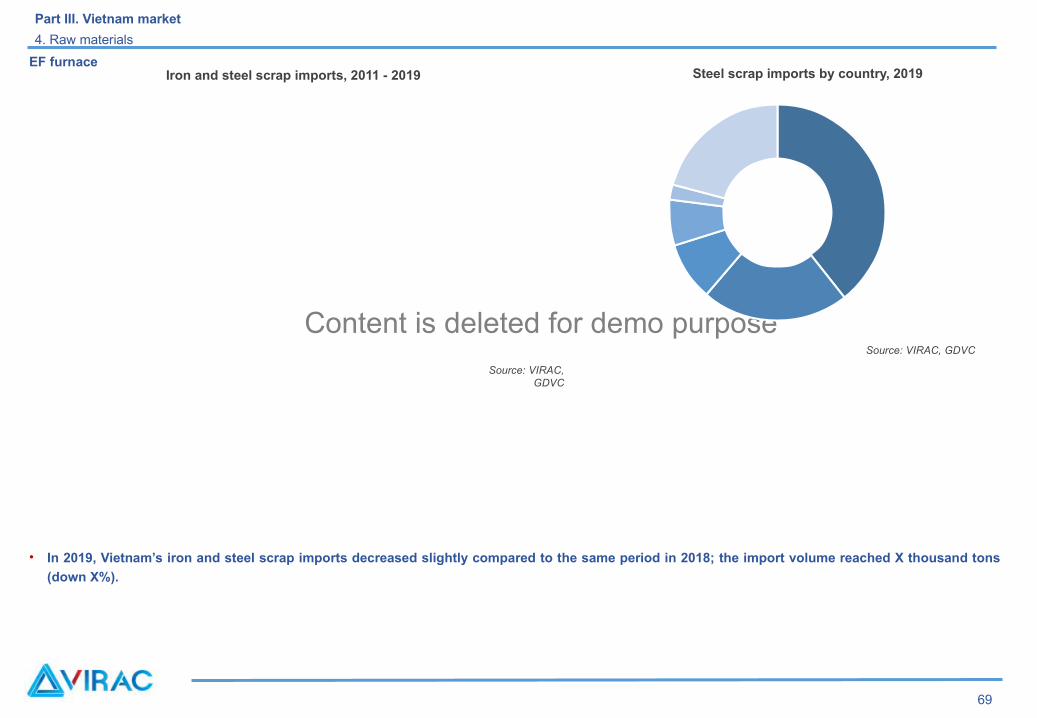
• In 2019, Vietnam’s iron and steel scrap imports decreased slightly compared to the same period in 2018; the import volume reached X thousand tons
(down X%).
69
Part III. Vietnam market
4. Raw materials
Source: VIRAC, GDVC
Source: VIRAC, GDVC
Iron and steel scrap imports, 2011 - 2019EF furnace
Steel scrap imports by country, 2019
Content is deleted for demo purpose
Part III. Vietnam market
4. Raw materials
70
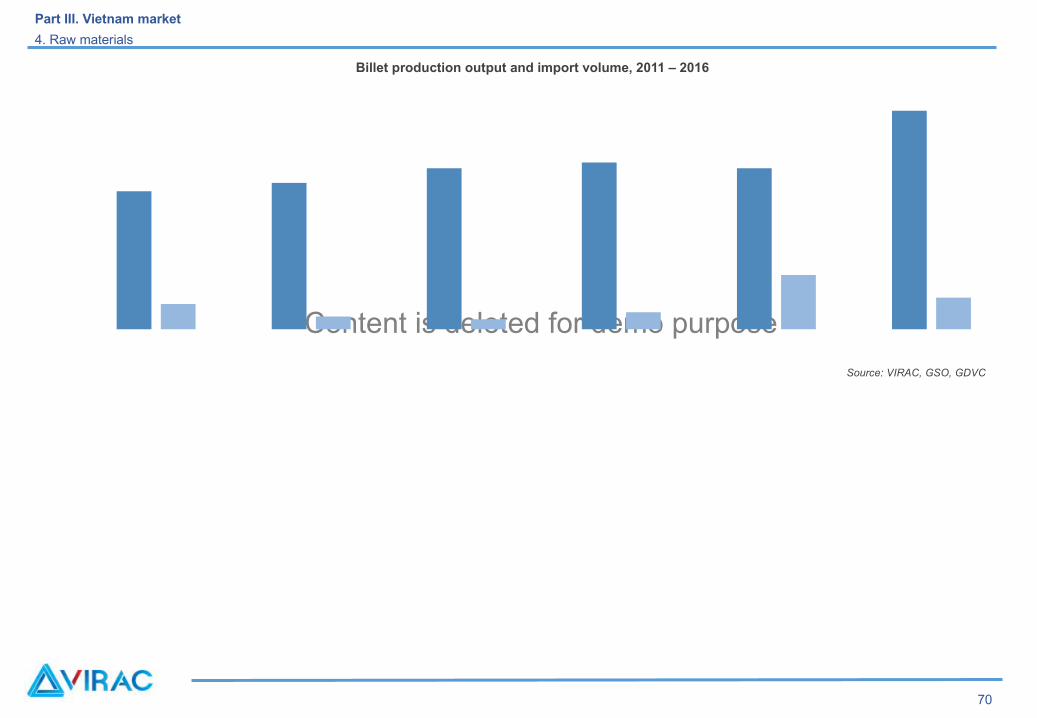
Billet production output and import volume, 2011 – 2016
Source: VIRAC, GSO, GDVC
Content is deleted for demo purpose
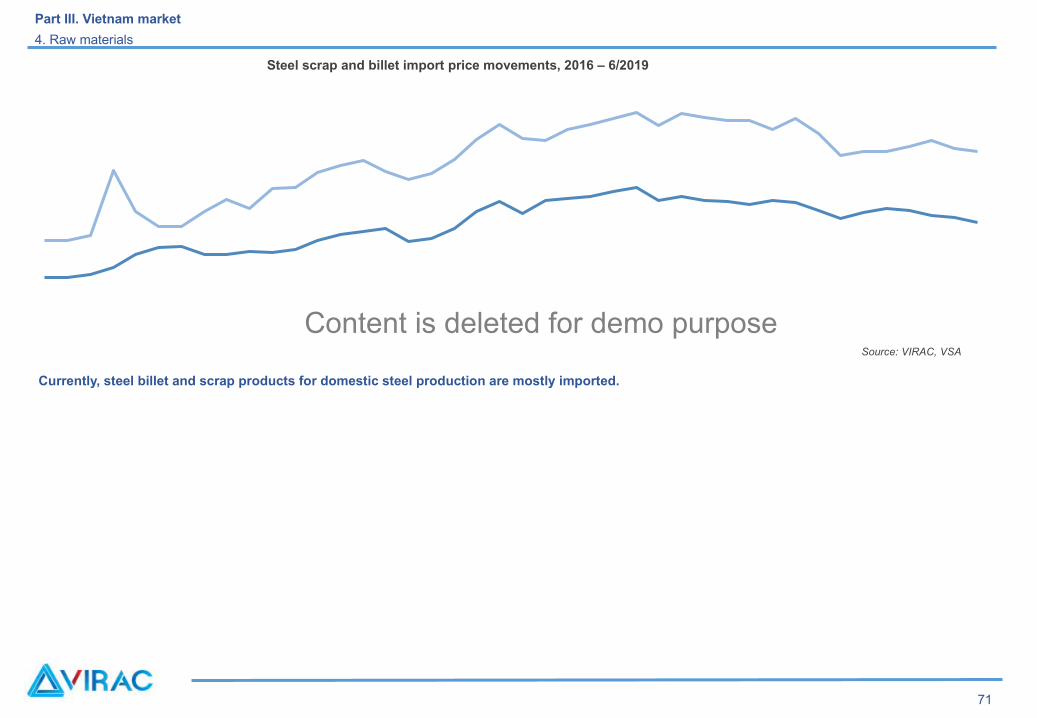
Currently, steel billet and scrap products for domestic steel production are mostly imported.
Part III. Vietnam market
4. Raw materials
71
Source: VIRAC, VSA
Steel scrap and billet import price movements, 2016 – 6/2019
Content is deleted for demo purpose
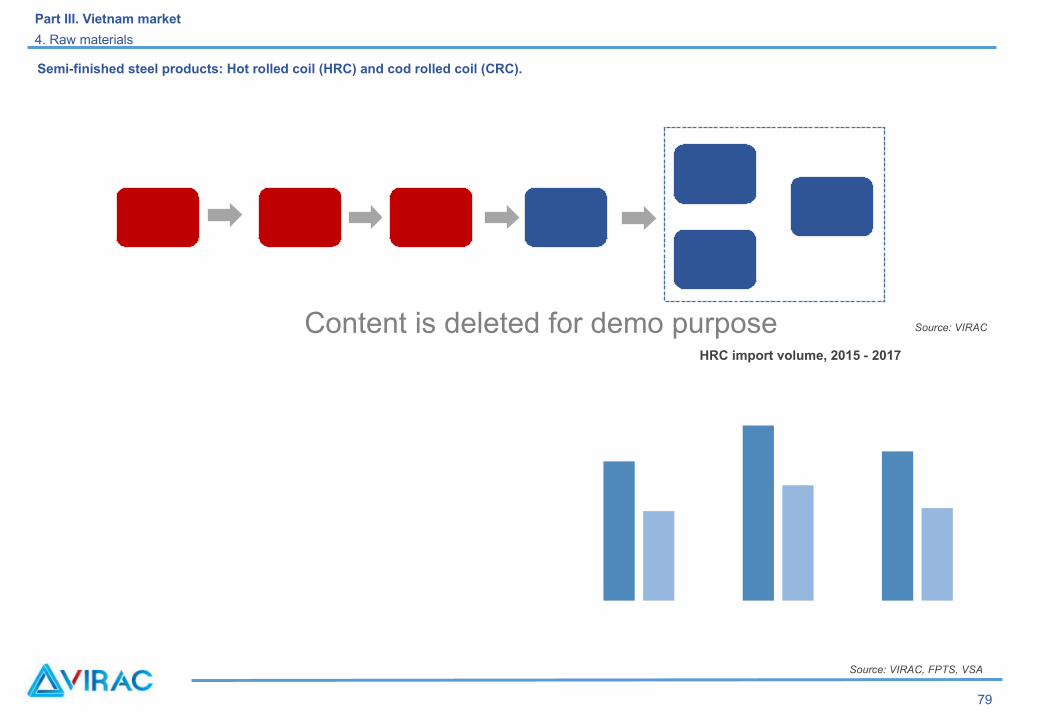
Semi-finished steel products: Hot rolled coil (HRC) and cod rolled coil (CRC).
Part III. Vietnam market
4. Raw materials
79
Source: VIRAC
Source: VIRAC, FPTS, VSA
HRC import volume, 2015 - 2017
Content is deleted for demo purpose
Part III. Vietnam market
4. Raw materials
80
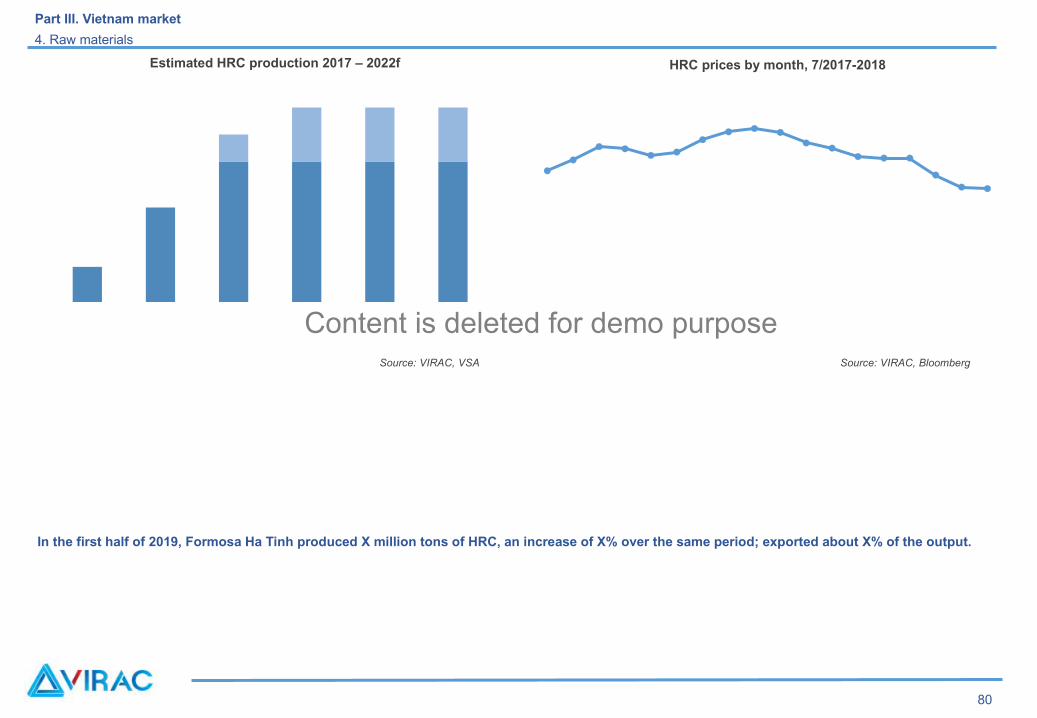
Source: VIRAC, Bloomberg
HRC prices by month, 7/2017-2018
In the first half of 2019, Formosa Ha Tinh produced X million tons of HRC, an increase of X% over the same period; exported about X% of the output.
Source: VIRAC, VSA
Estimated HRC production 2017 – 2022f
Content is deleted for demo purpose
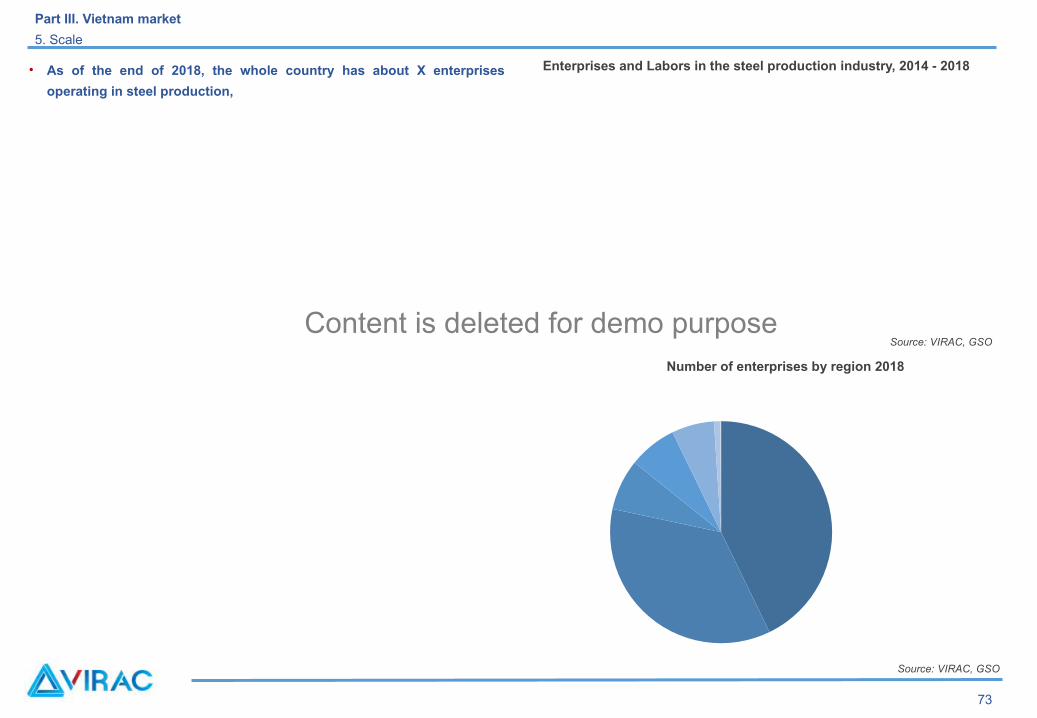
• As of the end of 2018, the whole country has about X enterprises
operating in steel production,
73
Part III. Vietnam market
5. Scale
Source: VIRAC, GSO
Source: VIRAC, GSO
Enterprises and Labors in the steel production industry, 2014 - 2018
Number of enterprises by region 2018
Content is deleted for demo purpose
Part III. Vietnam market
5. Scale
74
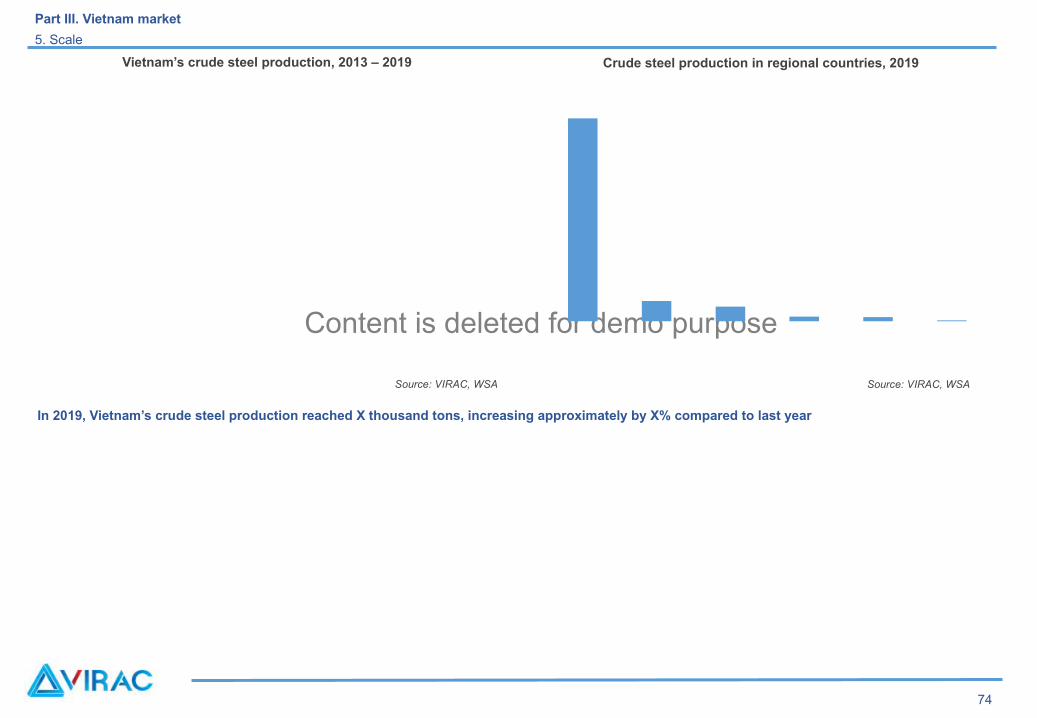
Vietnam’s crude steel production, 2013 – 2019
Source: VIRAC, WSA
In 2019, Vietnam’s crude steel production reached X thousand tons, increasing approximately by X% compared to last year
Source: VIRAC, WSA
Crude steel production in regional countries, 2019
Content is deleted for demo purpose
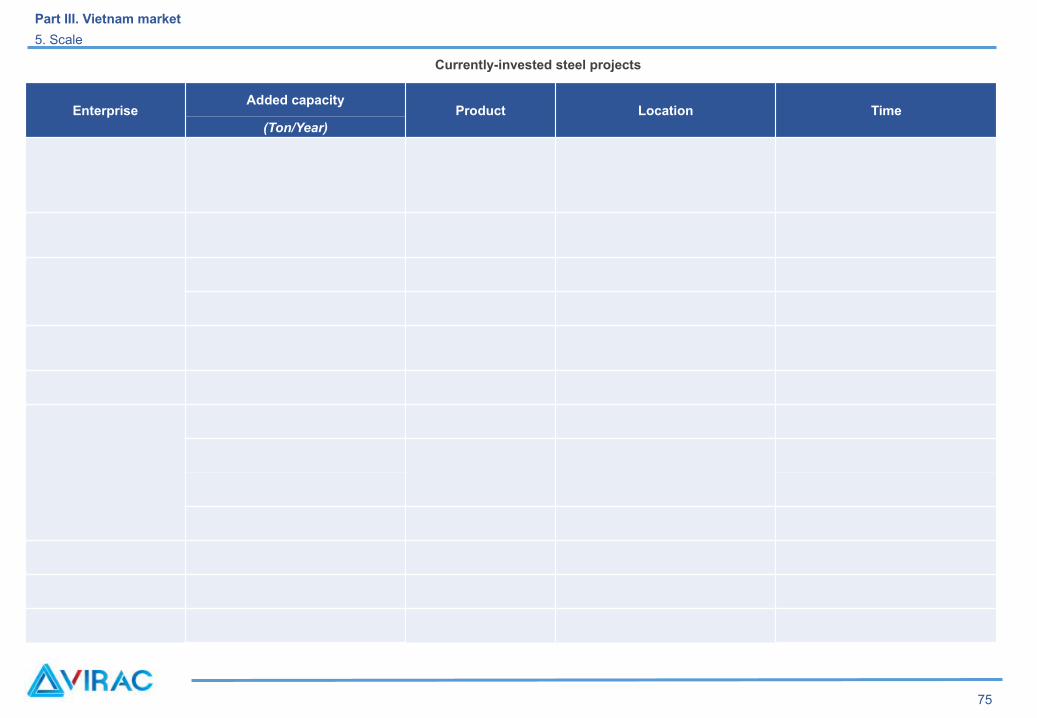
Currently-invested steel projects
75
Part III. Vietnam market
5. Scale
Source: VIRAC
EnterpriseAdded capacity
Product Location Time(Ton/Year)
Content is deleted for demo purpose
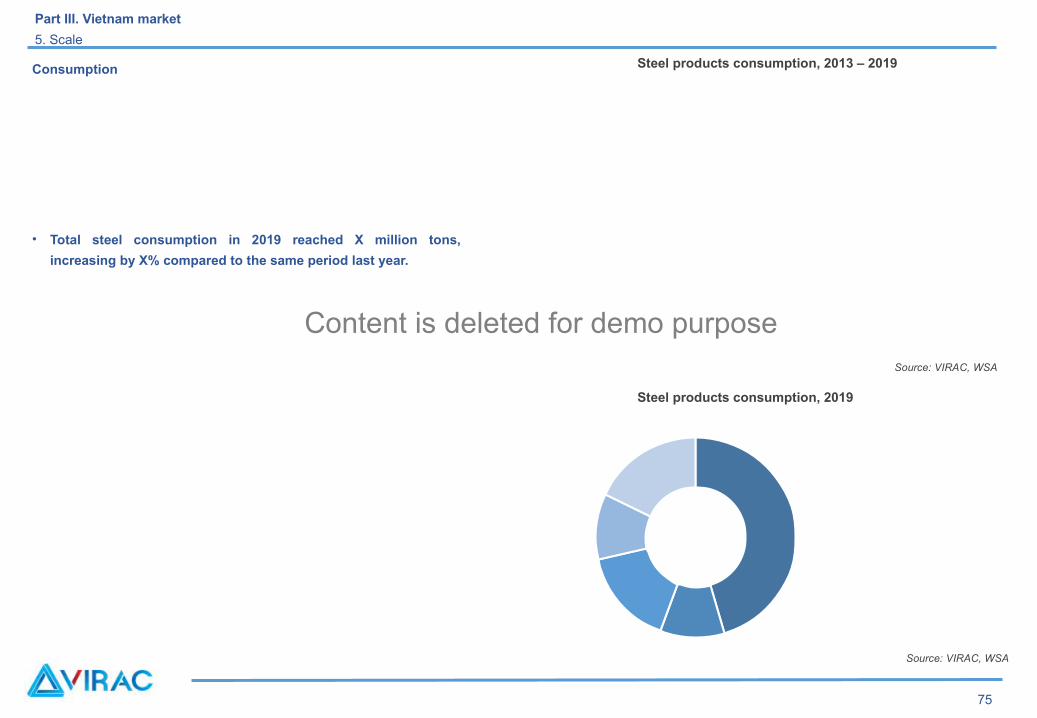
Consumption
75
Part III. Vietnam market
5. Scale
Steel products consumption, 2019
• Total steel consumption in 2019 reached X million tons,
increasing by X% compared to the same period last year.
Source: VIRAC, WSA
Source: VIRAC, WSA
Steel products consumption, 2013 – 2019
Content is deleted for demo purpose
Part III. Vietnam market
6. Construction steel
74
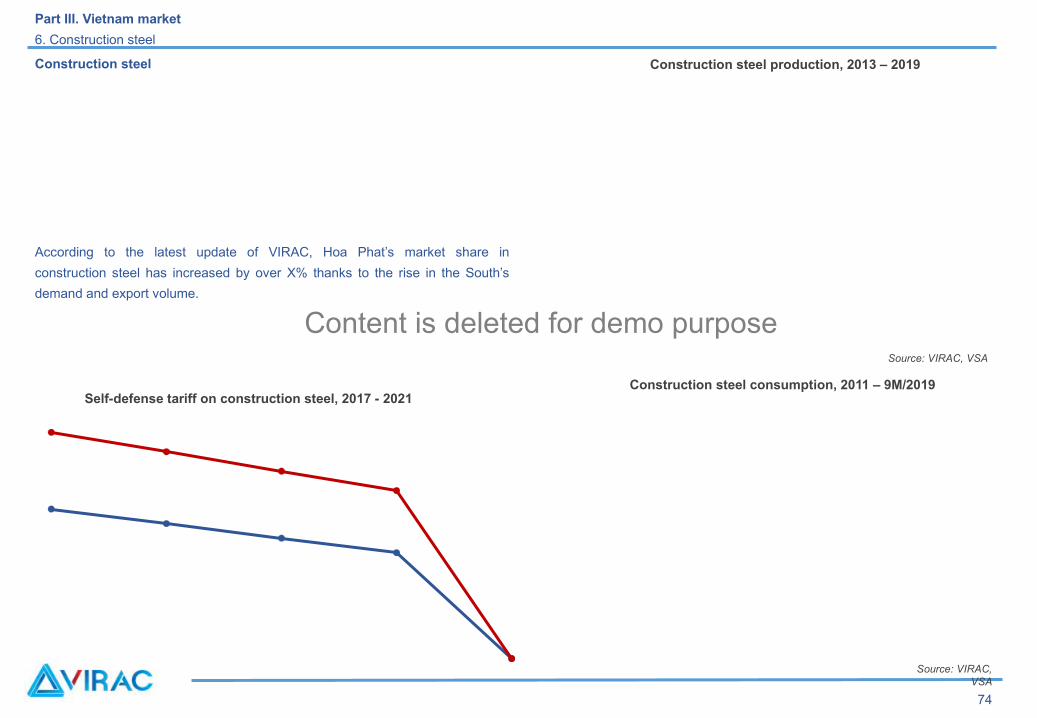
Source: VIRAC, VSA
Construction steel production, 2013 – 2019Construction steel
According to the latest update of VIRAC, Hoa Phat’s market share in
construction steel has increased by over X% thanks to the rise in the South’s
demand and export volume.
Source: VIRAC, VSA
Self-defense tariff on construction steel, 2017 - 2021 Construction steel consumption, 2011 – 9M/2019

Content is deleted for demo purpose
Part III. Vietnam market
6. Construction steel
74
Source: VIRAC, VSA
No. Exempted enterprise No. of exemption decision
Exempted product Exempted quantity in 2019 (tons)
Content is deleted for demo purpose
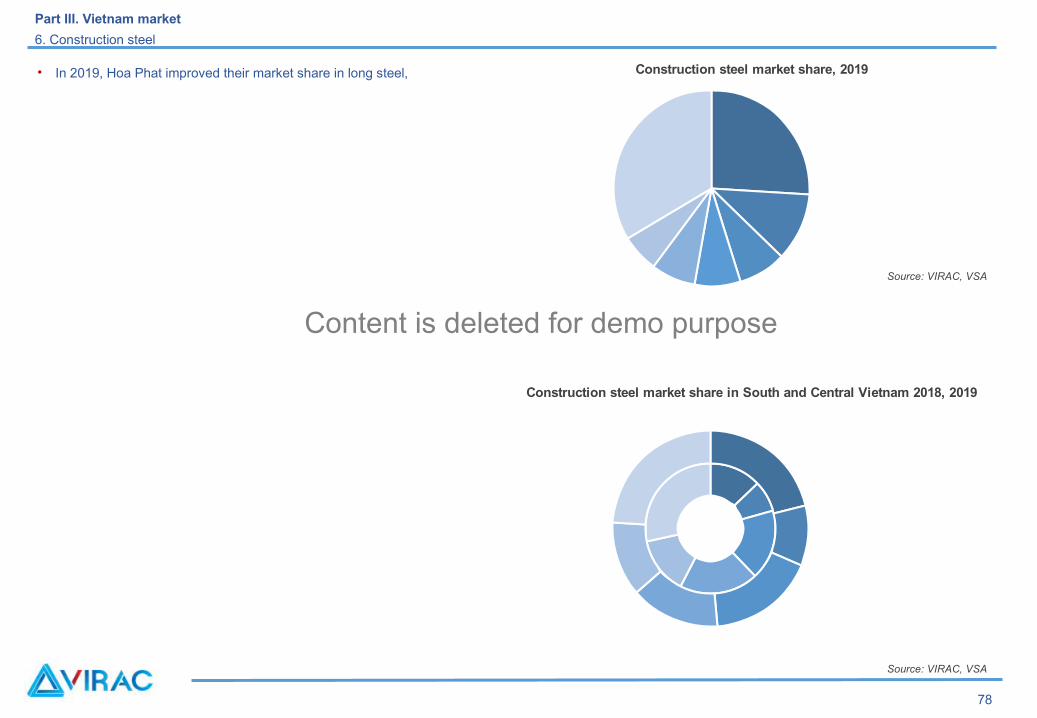
Construction steel market share in South and Central Vietnam 2018, 2019
• In 2019, Hoa Phat improved their market share in long steel,
78
Source: VIRAC, VSA
Part III. Vietnam market
6. Construction steel
Construction steel market share, 2019
Source: VIRAC, VSA
Content is deleted for demo purpose
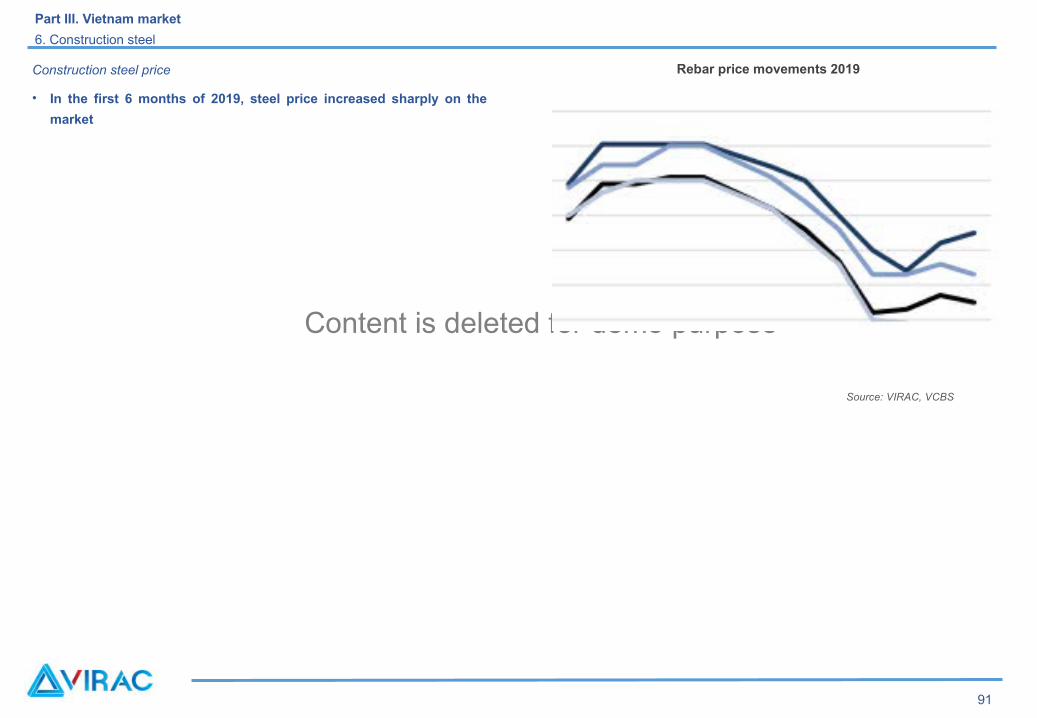
Construction steel price
• In the first 6 months of 2019, steel price increased sharply on the
market
91
Part III. Vietnam market
6. Construction steel
Source: VIRAC, VCBS
Rebar price movements 2019

Content is deleted for demo purpose
Steel pipe
Regarding market share, in 2019, Hoa Phat maintained their leading
position in the steel pipe production market (accounting for X%);
80
Part III. Vietnam market
7. Steel pipe
Steel pipe production and consumption 2013 – 2019
Source: VIRAC, VSA
Source: VIRAC, VSA
Steel pipe market share 2019
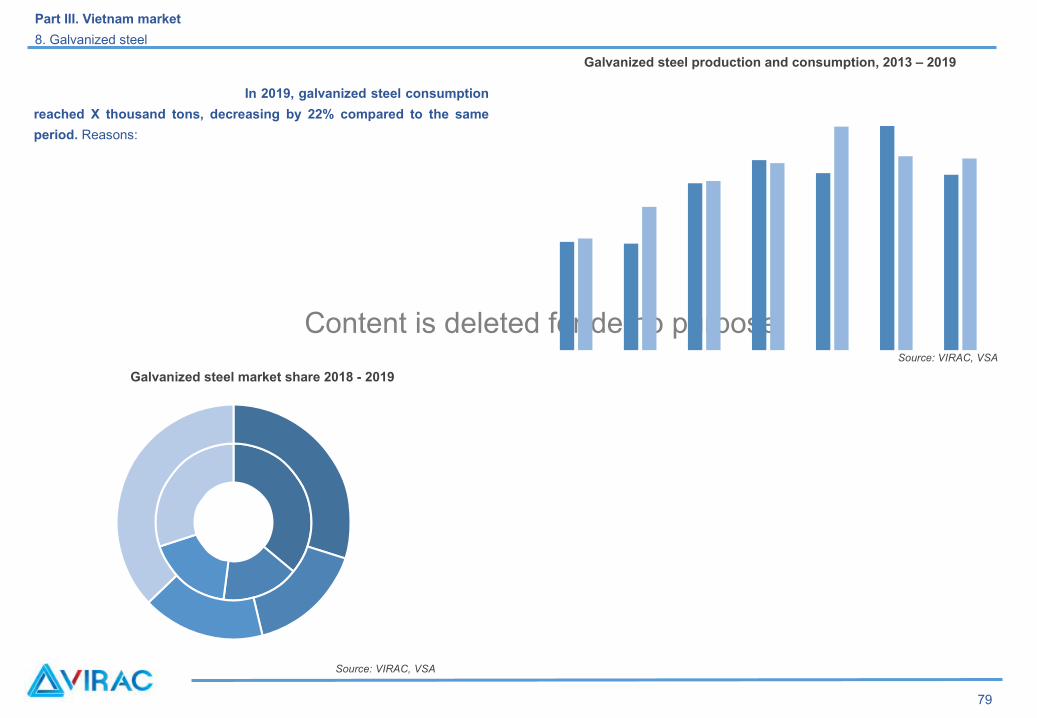
Content is deleted for demo purposeSource: VIRAC, VSA
In 2019, galvanized steel consumption
reached X thousand tons, decreasing by 22% compared to the same
period. Reasons:
79
Part III. Vietnam market
8. Galvanized steel
Source: VIRAC, VSA
Galvanized steel production and consumption, 2013 – 2019
Galvanized steel market share 2018 - 2019
Content is deleted for demo purpose
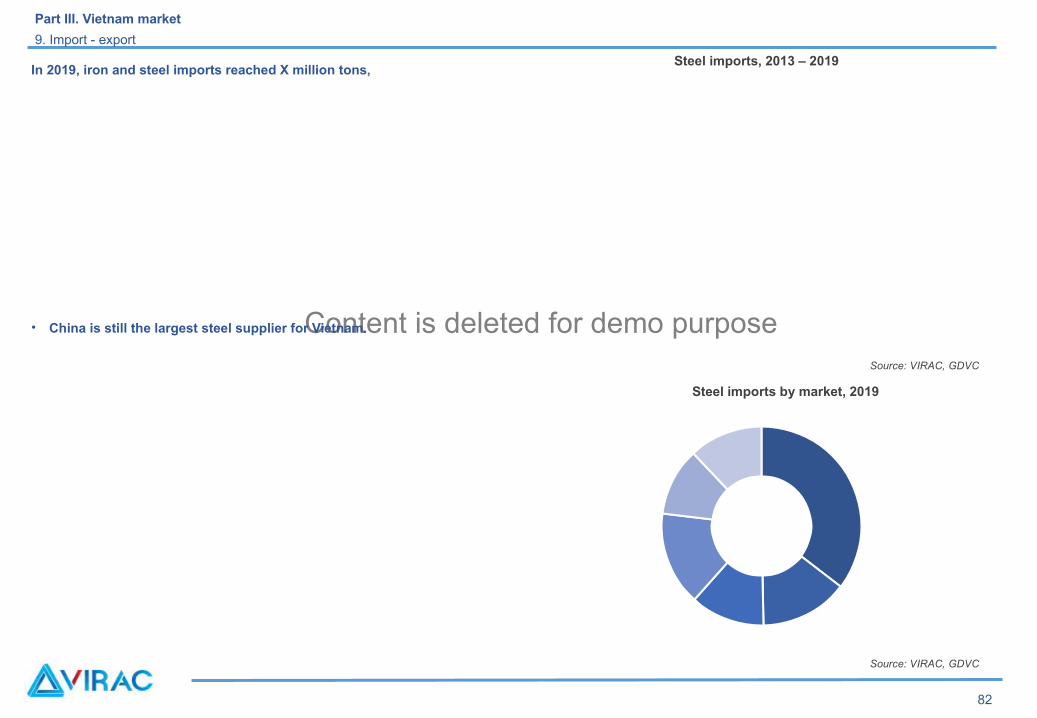
Source: VIRAC, GDVC
In 2019, iron and steel imports reached X million tons,
• China is still the largest steel supplier for Vietnam.
Source: VIRAC, GDVC
82
Part III. Vietnam market
9. Import - export
Steel imports, 2013 – 2019
Steel imports by market, 2019
Content is deleted for demo purpose
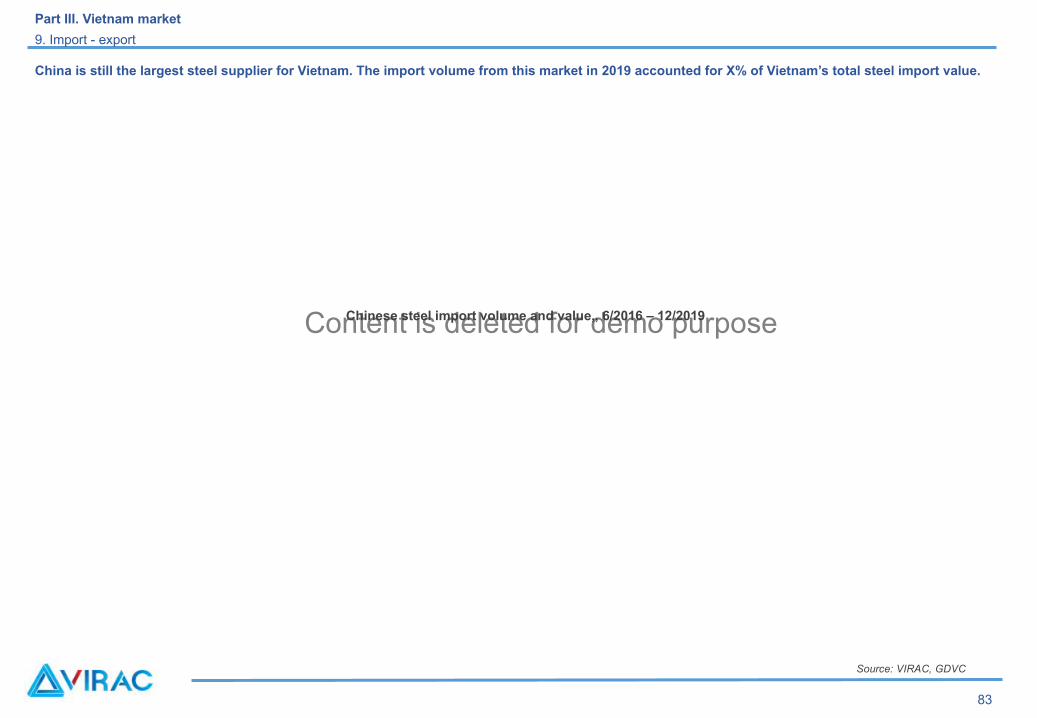
China is still the largest steel supplier for Vietnam. The import volume from this market in 2019 accounted for X% of Vietnam’s total steel import value.
Source: VIRAC, GDVC
83
Part III. Vietnam market
9. Import - export
Chinese steel import volume and value,, 6/2016 – 12/2019
Content is deleted for demo purpose
Source: VIRAC, GDVC
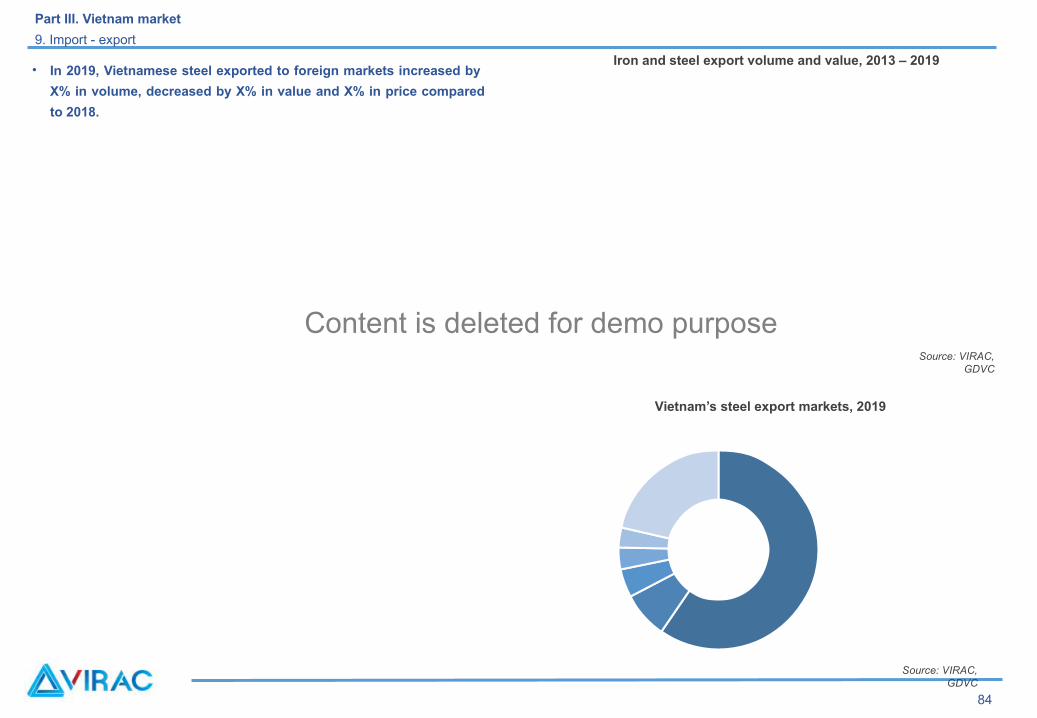
• In 2019, Vietnamese steel exported to foreign markets increased by
X% in volume, decreased by X% in value and X% in price compared
to 2018.
Source: VIRAC, GDVC
84
Iron and steel export volume and value, 2013 – 2019
Part III. Vietnam market
9. Import - export
Vietnam’s steel export markets, 2019
Content is deleted for demo purpose
Hoa Phat’s steel distribution system• Currently, most domestic steel enterprises, enterprises with
100% foreign capital, even private enterprises do not have
direct consumption system, thus sell goods through tier 1
companies,
93
Part III. Vietnam market
10. Distribution channel
Content is deleted for demo purpose
• The competitiveness of enterprises in Vietnam's steel industry is quite low
86
Part III. Vietnam market
11. Competitive analysis
Content is deleted for demo purpose
Closed process - Difference of Hoa Phat Steel
So far, Hoa Phat is the only construction steel enterprise in Vietnam that has been successful with a closed blast furnace technology from iron ore to
finished steel, also known as steel production from upstream.
87
Part III. Vietnam market
11. Competitive analysis
Content is deleted for demo purpose
Hoa Sen Group, the leading company in galvanized steel segment, also has its own competing strategies such as developing retail system, building
strong brands, expanding investment quickly with good technology and low cost, building a professional team.
Developing retail system
Building strong brands
Expanding investment quickly with good technology and low cost
88
Part III. Vietnam market
11. Competitive analysis
Content is deleted for demo purpose
Building a professional team
89
Part III. Vietnam market
11. Competitive analysis
Content is deleted for demo purpose
Polluted environment risks
Policy risks
97
Part IV. Risk analysis
1. Risks
Content is deleted for demo purpose
Competitive risks
Consumption market risks
98
Part IV. Risk analysis
1. Risks
Content is deleted for demo purpose
Strengths Weaknesses
Opportunities Threats
101
Part IV. Risk analysis
2. SWOT analysis
Content is deleted for demo purpose
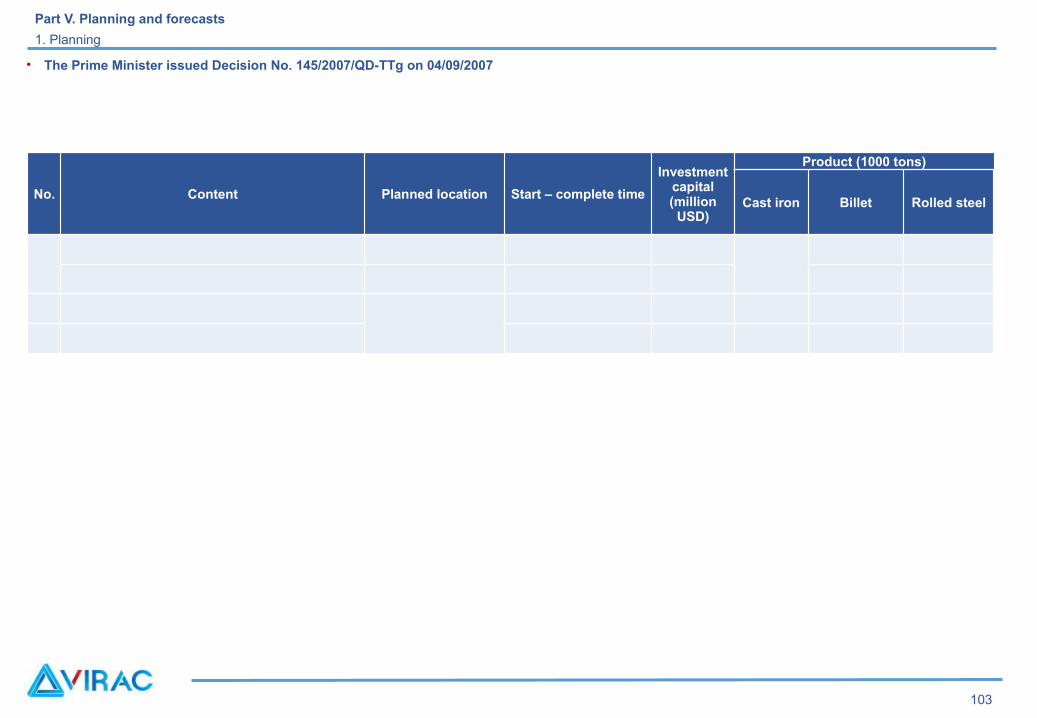
• The Prime Minister issued Decision No. 145/2007/QD-TTg on 04/09/2007
No. Content Planned location Start – complete time
Investment capital (million
USD)
Product (1000 tons)
Cast iron Billet Rolled steel
103
Part V. Planning and forecasts
1. Planning
Content is deleted for demo purpose
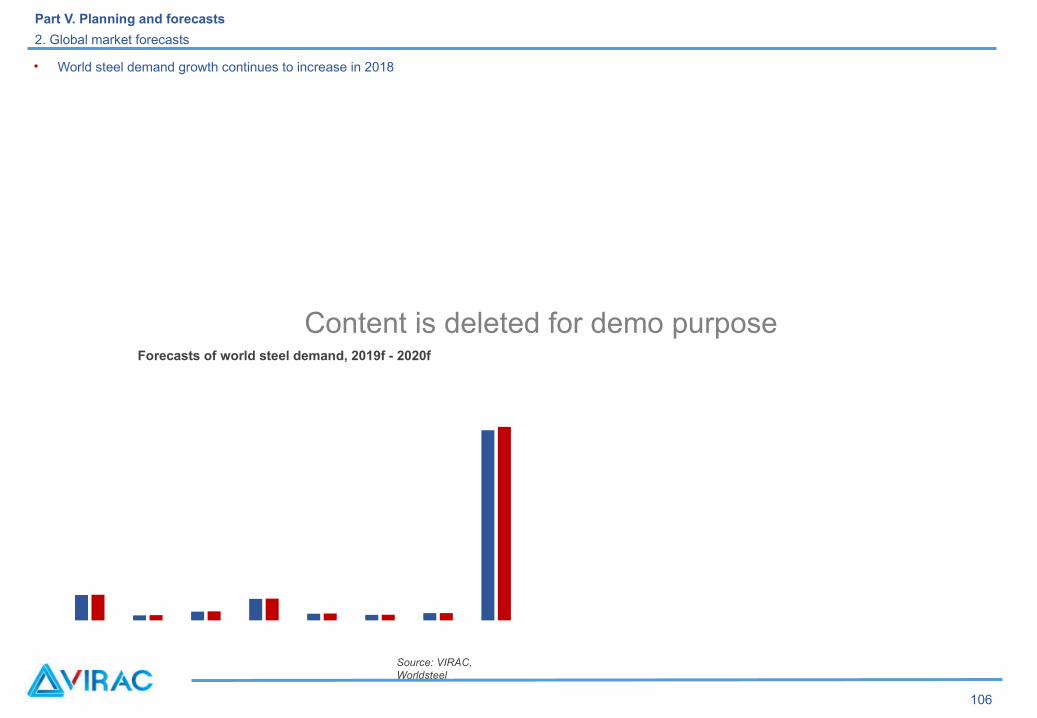
• World steel demand growth continues to increase in 2018
106
Part V. Planning and forecasts
2. Global market forecasts
Source: VIRAC, Worldsteel
Forecasts of world steel demand, 2019f - 2020f
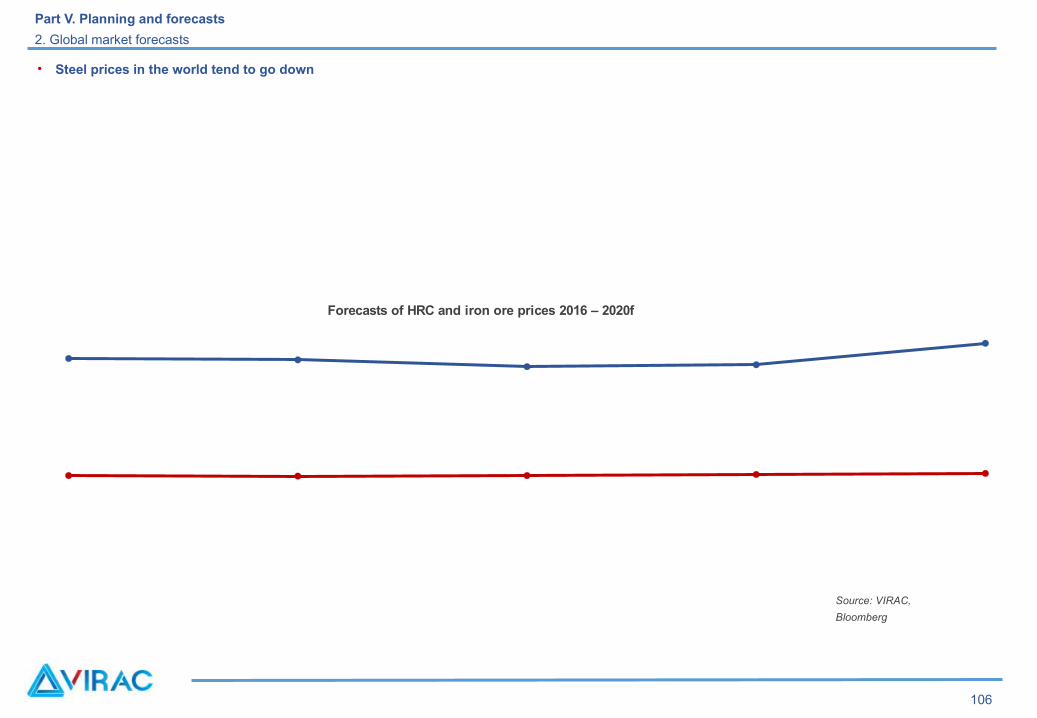
Content is deleted for demo purposeForecasts of HRC and iron ore prices 2016 – 2020f
• Steel prices in the world tend to go down
Source: VIRAC,
Bloomberg
106
Part V. Planning and forecasts
2. Global market forecasts
Content is deleted for demo purpose
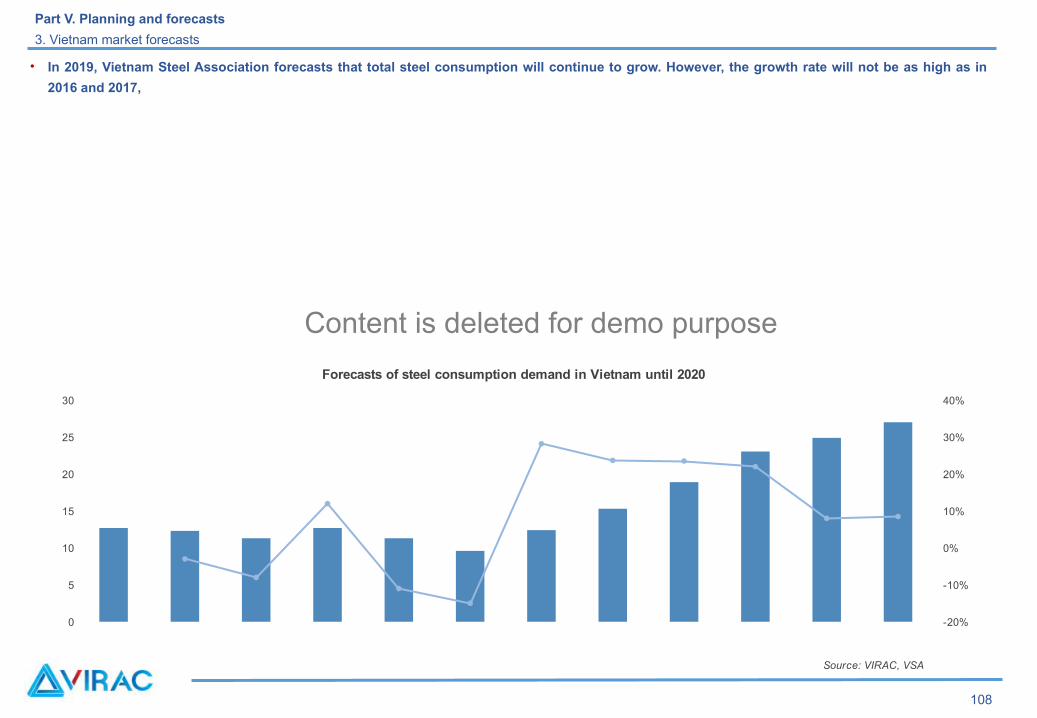
• In 2019, Vietnam Steel Association forecasts that total steel consumption will continue to grow. However, the growth rate will not be as high as in
2016 and 2017,
0
5
10
15
20
25
30
-20%
-10%
0%
10%
20%
30%
40%
Forecasts of steel consumption demand in Vietnam until 2020
Source: VIRAC, VSA
108
Part V. Planning and forecasts
3. Vietnam market forecasts

Content is deleted for demo purpose
ENTERPRISE ANALYSIS
Content is deleted for demo purpose
Enterprise Logo Total assets
Revenue General information
123
Part VI. Enterprise analysis
1. Enterprise introduction
Content is deleted for demo purpose
Enterprise Logo Total
assets
Revenu
e
General information
124
Part VI. Enterprise analysis
1. Enterprise introduction
Content is deleted for demo purpose
Enterprise Logo Total assets
Revenue General information
125
Part VI. Enterprise analysis
1. Enterprise introduction
Content is deleted for demo purpose
Enterprise Logo Total assets
Revenue General information
126
Part VI. Enterprise analysis
1. Enterprise introduction
Content is deleted for demo purpose
128
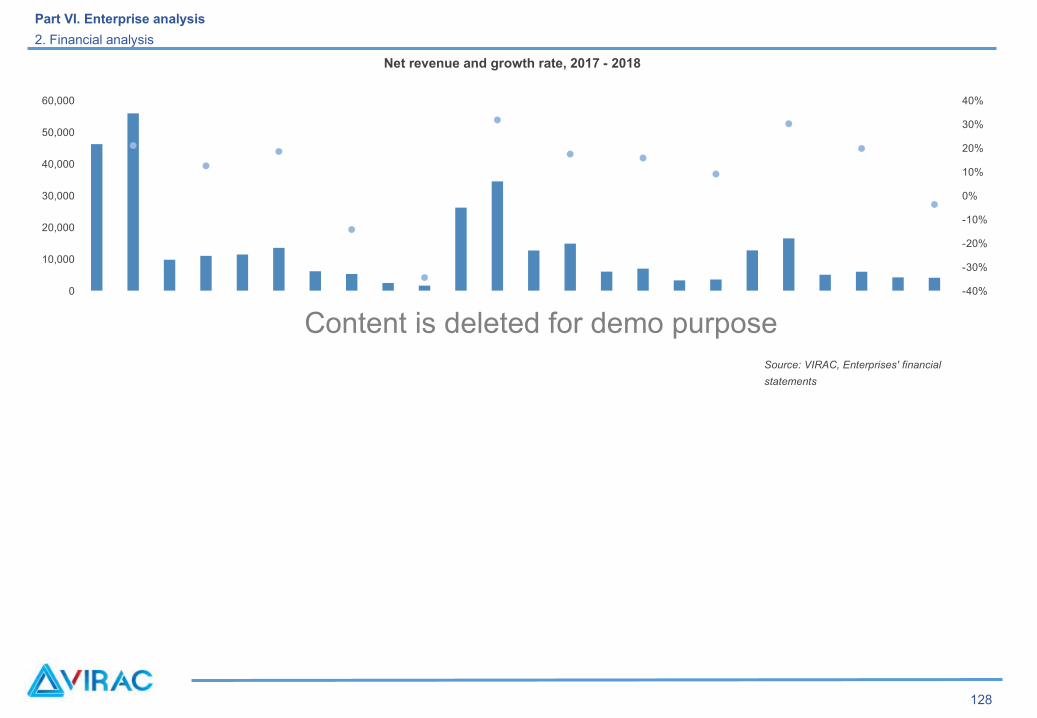
Part VI. Enterprise analysis
2. Financial analysis
Net revenue and growth rate, 2017 - 2018
Source: VIRAC, Enterprises' financial
statements
0
10,000
20,000
30,000
40,000
50,000
60,000
-40%
-30%
-20%
-10%
0%
10%
20%
30%
40%

Content is deleted for demo purpose
129
Part VI. Enterprise analysis
2. Financial analysis
Content is deleted for demo purpose
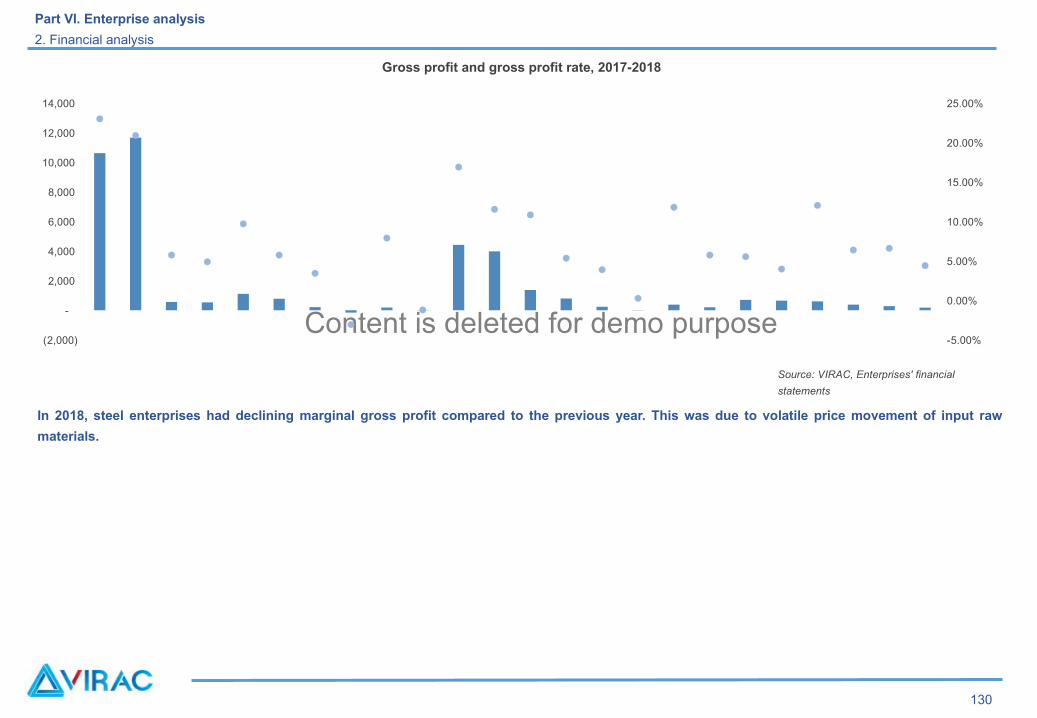
In 2018, steel enterprises had declining marginal gross profit compared to the previous year. This was due to volatile price movement of input raw
materials.
Source: VIRAC, Enterprises' financial
statements
130
Part VI. Enterprise analysis
2. Financial analysis
Gross profit and gross profit rate, 2017-2018
(2,000)
-
2,000
4,000
6,000
8,000
10,000
12,000
14,000
-5.00%
0.00%
5.00%
10.00%
15.00%
20.00%
25.00%

Content is deleted for demo purpose
131
Part VI. Enterprise analysis
2. Financial analysis
Content is deleted for demo purpose
132
Part VI. Enterprise analysis
2. Financial analysis
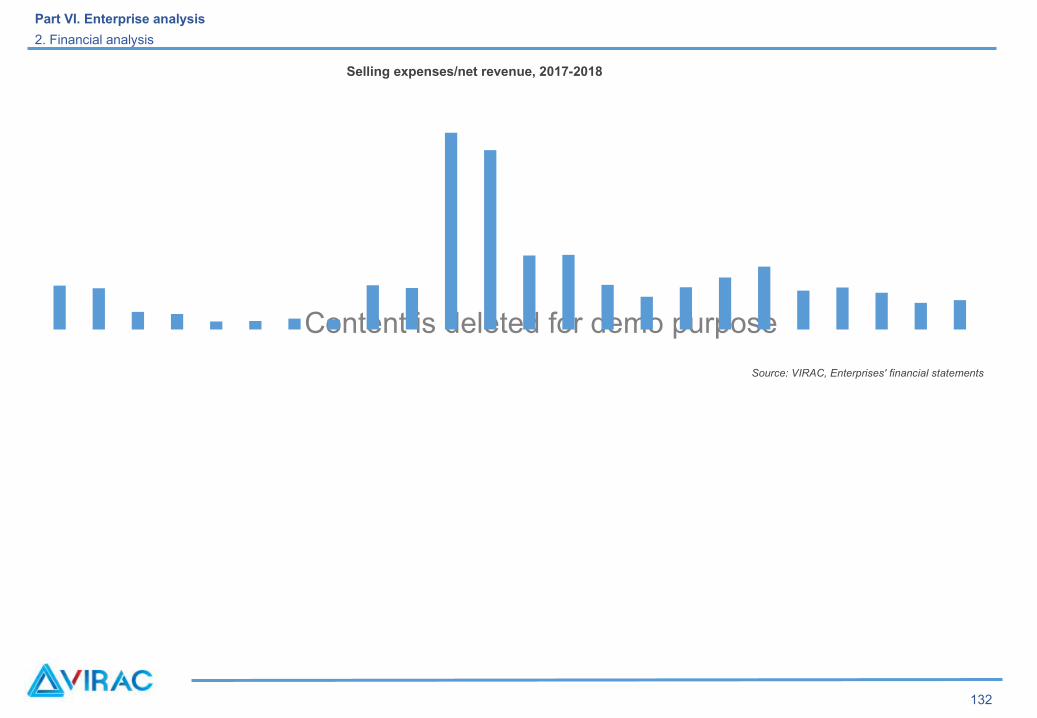
Selling expenses/net revenue, 2017-2018
Source: VIRAC, Enterprises' financial statements

Content is deleted for demo purpose
133
Part VI. Enterprise analysis
2. Financial analysis
Content is deleted for demo purpose
134
Part VI. Enterprise analysis
2. Financial analysis
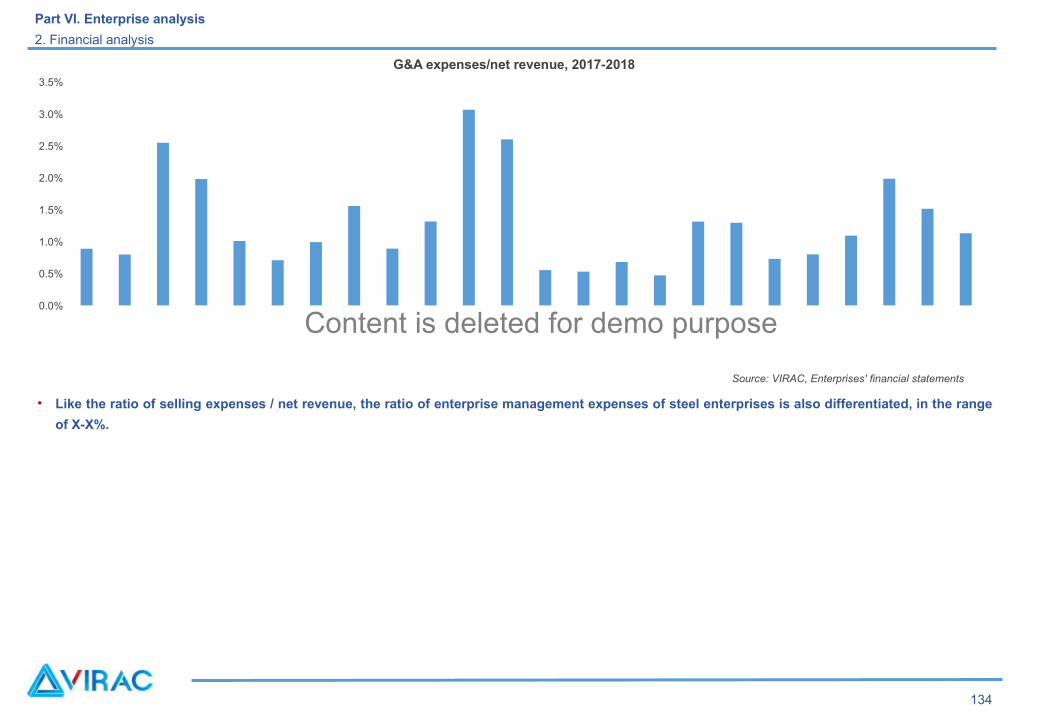
G&A expenses/net revenue, 2017-2018
• Like the ratio of selling expenses / net revenue, the ratio of enterprise management expenses of steel enterprises is also differentiated, in the range
of X-X%.
Source: VIRAC, Enterprises' financial statements
0.0%
0.5%
1.0%
1.5%
2.0%
2.5%
3.0%
3.5%
Content is deleted for demo purpose
135
Part VI. Enterprise analysis
2. Financial analysis
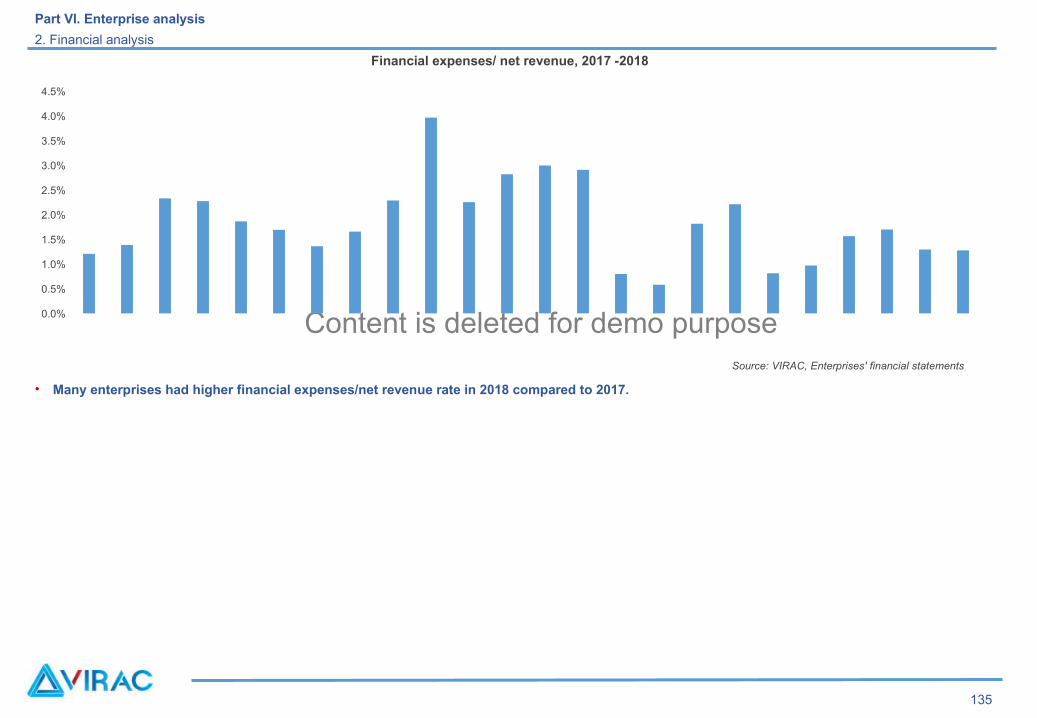
Financial expenses/ net revenue, 2017 -2018
• Many enterprises had higher financial expenses/net revenue rate in 2018 compared to 2017.
Source: VIRAC, Enterprises' financial statements
0.0%
0.5%
1.0%
1.5%
2.0%
2.5%
3.0%
3.5%
4.0%
4.5%
Content is deleted for demo purpose
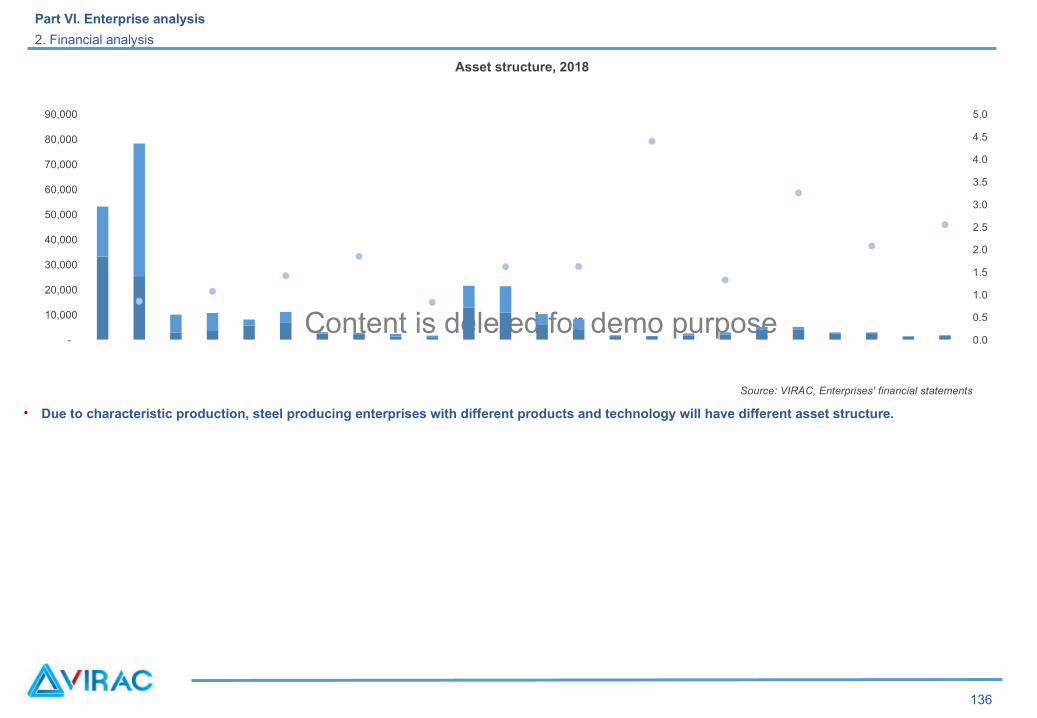
• Due to characteristic production, steel producing enterprises with different products and technology will have different asset structure.
136
Part VI. Enterprise analysis
2. Financial analysis
Asset structure, 2018
Source: VIRAC, Enterprises' financial statements
-
10,000
20,000
30,000
40,000
50,000
60,000
70,000
80,000
90,000
0.0
0.5
1.0
1.5
2.0
2.5
3.0
3.5
4.0
4.5
5.0

Content is deleted for demo purpose
• The level of using financial leverage of enterprises in the industry is quite diversified depending on the risk appetite of each enterprise.
137
Part VI. Enterprise analysis
2. Financial analysis
Debt structure, 2018
Source: VIRAC, Enterprises' financial statements
-
5,000
10,000
15,000
20,000
25,000
30,000
35,000
40,000
0.00
1.00
2.00
3.00
4.00
5.00
6.00
Content is deleted for demo purpose
138
Part VI. Enterprise analysis
2. Financial analysis
Content is deleted for demo purpose
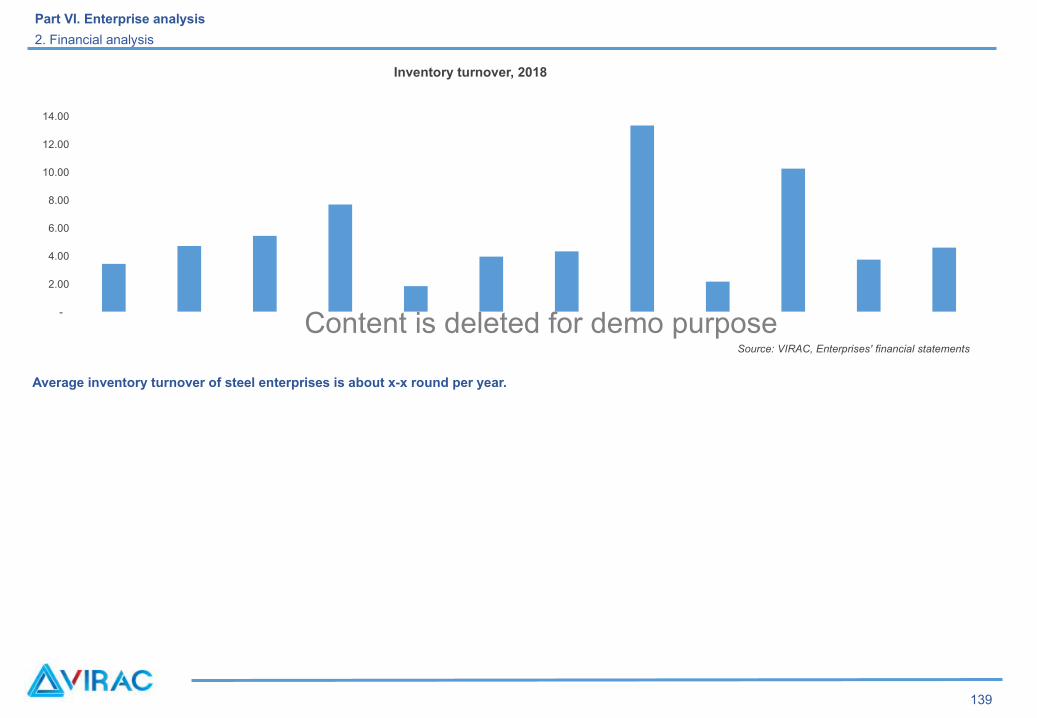
Average inventory turnover of steel enterprises is about x-x round per year.
139
Part VI. Enterprise analysis
2. Financial analysis
Inventory turnover, 2018
Source: VIRAC, Enterprises' financial statements
-
2.00
4.00
6.00
8.00
10.00
12.00
14.00
Content is deleted for demo purpose
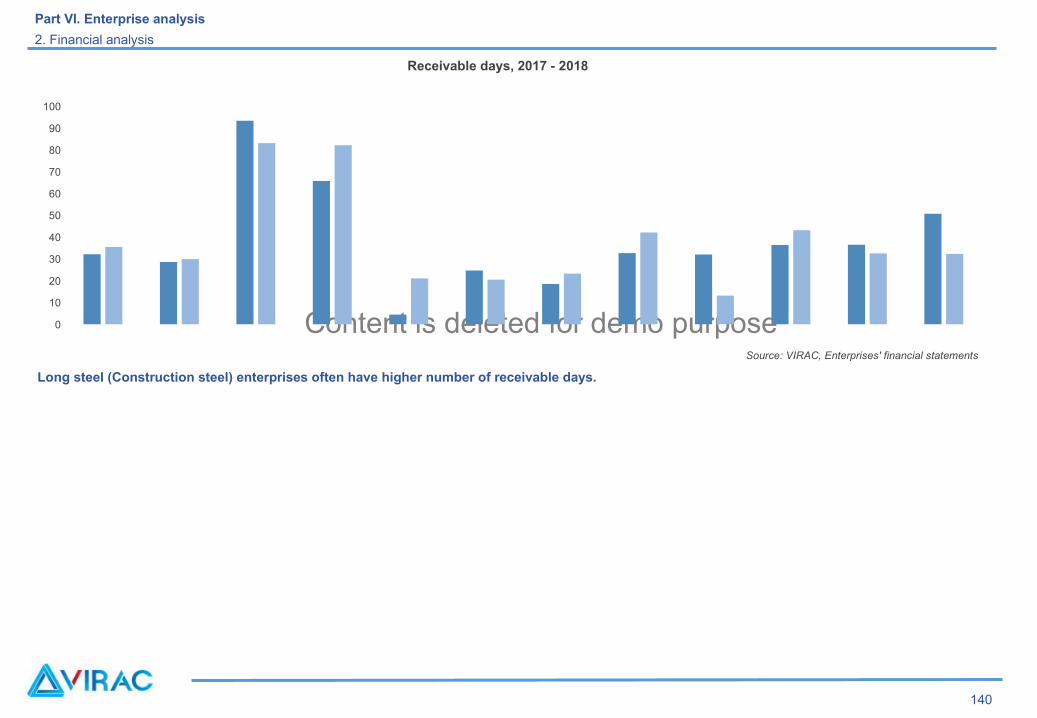
Long steel (Construction steel) enterprises often have higher number of receivable days.
140
Part VI. Enterprise analysis
2. Financial analysis
Receivable days, 2017 - 2018
Source: VIRAC, Enterprises' financial statements
0
10
20
30
40
50
60
70
80
90
100
Content is deleted for demo purpose
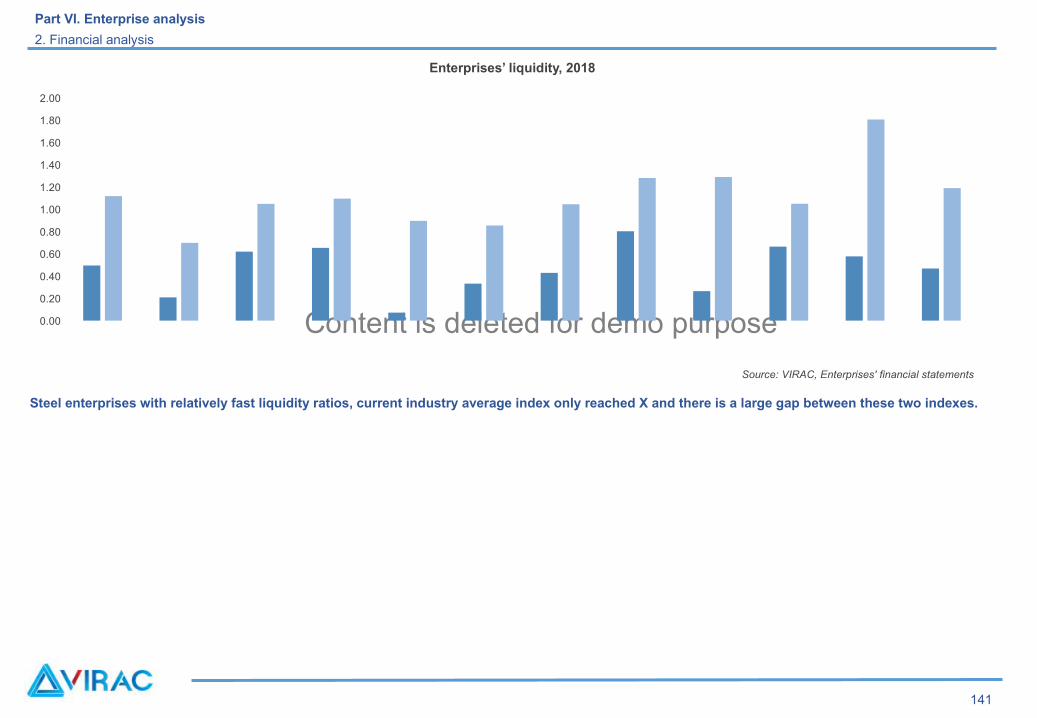
Steel enterprises with relatively fast liquidity ratios, current industry average index only reached X and there is a large gap between these two indexes.
141
Part VI. Enterprise analysis
2. Financial analysis
Enterprises’ liquidity, 2018
Source: VIRAC, Enterprises' financial statements
0.00
0.20
0.40
0.60
0.80
1.00
1.20
1.40
1.60
1.80
2.00
Content is deleted for demo purpose
142
Part VI. Enterprise analysis
2. Financial analysis
Source: VIRAC, Enterprises' financial statements
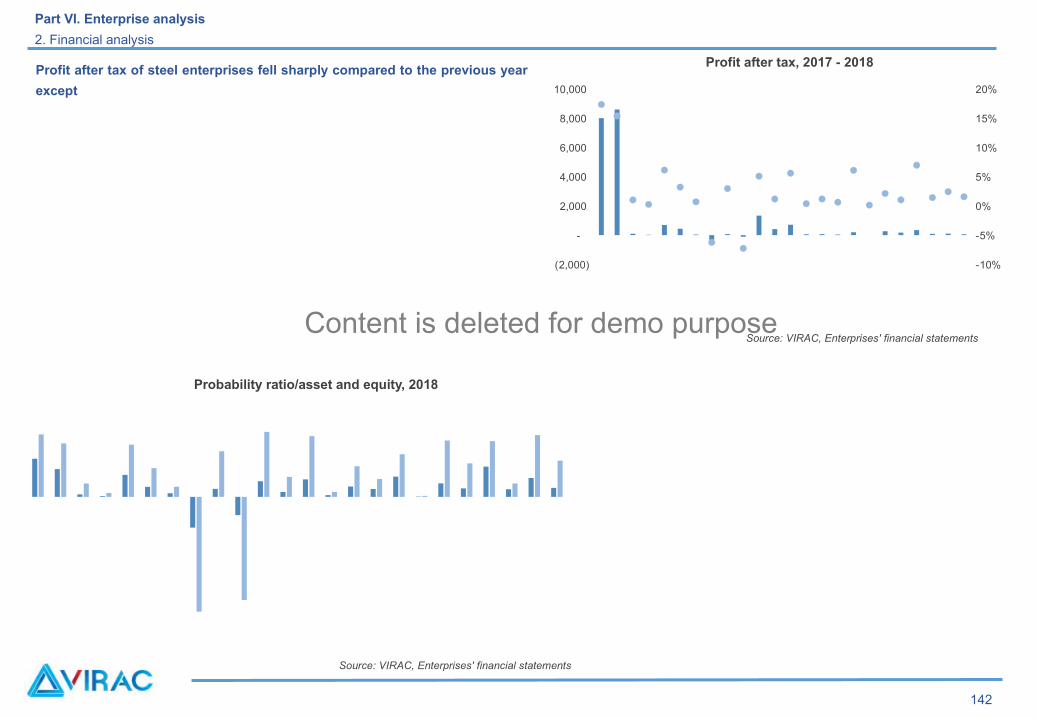
Probability ratio/asset and equity, 2018
Profit after tax, 2017 - 2018
Source: VIRAC, Enterprises' financial statements
Profit after tax of steel enterprises fell sharply compared to the previous year
except
(2,000)
-
2,000
4,000
6,000
8,000
10,000
-10%
-5%
0%
5%
10%
15%
20%
Content is deleted for demo purpose
Part VII. Appendix of financial statements
111
Content is deleted for demo purpose
BALANCE SHEET
Unit: Billion VND 2017 2018
A. CURRENT ASSETS
I. Cash and cash equivalents
II. Short-term financial investments
III. Short-term receivables
IV. Inventories
B. LONG-TERM ASSETS
I. Fixed assets
TOTAL ASSETS
A. LIABILITIES
I. Current liabilities
II. Long-term liabilities
B. OWNER’S EQUITY
TOTAL CAPITAL RESOURCES
INCOME STATEMENT
Unit: Billion VND 2017 2018
Net revenue of goods sold and services
provided
Cost of goods sold and services provided
Gross profit of goods sold and services
provided
Revenue of financial activities
Financial expenses
Cost of sales
Administrative expenses
Net profit of business activities
Total accounting profit before taxProfit after tax
CASH FLOW STATEMENT
2017 2018
I. Cash flow from business activities
Net cash flow from business activities
II. Cash flow from investing activities
Net cash flow from investing activities
III. Cash flow from financial activities
Net cash flow from financial activities
Net cash flows during the fiscal yearCash and cash equivalents at the beginning of the fiscal yearCash and cash equivalents at the end of the fiscal year
Part VII. Financial Statements Appendix
Financial statements - Hoa Phat Joint Stock Company
144
Content is deleted for demo purpose
BALANCE SHEET
Unit: Billion VND 2017 2018
A. CURRENT ASSETS
I. Cash and cash equivalents
II. Short-term financial investments
III. Short-term receivables
Hàng tồn kho
B. LONG-TERM ASSETS
I. Fixed assets
TOTAL ASSETS
A. LIABILITIES
I. Current liabilities
II. Long-term liabilities
B. OWNER’S EQUITY
TOTAL CAPITAL RESOURCES
INCOME STATEMENT
Unit: Billion VND 2017 2018
Net revenue of goods sold and services
provided
Cost of goods sold and services provided
Gross profit of goods sold and services
provided
Revenue of financial activities
Financial expenses
Cost of sales
Administrative expenses
Net profit of business activities
Total accounting profit before taxProfit after tax
CASH FLOW STATEMENT
Unit: Billion VND 2017 2018
I. Cash flow from business activities
Net cash flow from business activities
II. Cash flow from investing activities
Net cash flow from investing activities
III. Cash flow from financial activities
Net cash flow from financial activities
Net cash flows during the fiscal yearCash and cash equivalents at the beginning of the fiscal yearCash and cash equivalents at the end of the fiscal year
145
Part VII. Financial Statements Appendix
Financial statement– TISCO
Content is deleted for demo purpose
BALANCE SHEET
Unit: Billion VND 2017 2018
A. CURRENT ASSETS
I. Cash and cash equivalents
II. Short-term financial investments
III. Short-term receivables
Hàng tồn kho
B. LONG-TERM ASSETS
I. Fixed assets
TOTAL ASSETS
A. LIABILITIES
I. Current liabilities
II. Long-term liabilities
B. OWNER’S EQUITY
TOTAL CAPITAL RESOURCES
INCOME STATEMENT
Unit: Billion VND 2017 2018
Net revenue of goods sold and services
provided
Cost of goods sold and services provided
Gross profit of goods sold and services
provided
Revenue of financial activities
Financial expenses
Cost of sales
Administrative expenses
Net profit of business activities
Total accounting profit before taxProfit after tax
CASH FLOW STATEMENT
Unit: Billion VND 2017 2018
I. Cash flow from business activities
Net cash flow from business activities
II. Cash flow from investing activities
Net cash flow from investing activities
III. Cash flow from financial activities
Net cash flow from financial activities
Net cash flows during the fiscal year
Cash and cash equivalents at the beginning of the fiscal year
Cash and cash equivalents at the end of the fiscal year
146
Part VII. Financial Statements Appendix
Financial statement- POM
Content is deleted for demo purpose
BALANCE SHEET
Unit: Billion VND 2017 2018
A. CURRENT ASSETS
I. Cash and cash equivalents
II. Short-term financial investments
III. Short-term receivables
Hàng tồn kho
B. LONG-TERM ASSETS
I. Fixed assets
TOTAL ASSETS
A. LIABILITIES
I. Current liabilities
II. Long-term liabilities
B. OWNER’S EQUITY
TOTAL CAPITAL RESOURCES
INCOME STATEMENT
Unit: Billion VND 2017 2018
Net revenue of goods sold and services
provided
Cost of goods sold and services provided
Gross profit of goods sold and services
provided
Revenue of financial activities
Financial expenses
Cost of sales
Administrative expenses
Net profit of business activities
Total accounting profit before taxProfit after tax
CASH FLOW STATEMENT
Unit: Billion VND 2017 2018
I. Cash flow from business activities
Net cash flow from business activities
II. Cash flow from investing activities
Net cash flow from investing activities
III. Cash flow from financial activities
Net cash flow from financial activities
Net cash flows during the fiscal year
Cash and cash equivalents at the beginning of the fiscal year
Cash and cash equivalents at the end of the fiscal year
147
Part VII. Financial Statements Appendix
Financial statement- VISCO

Content is deleted for demo purpose
BALANCE SHEET
Unit: Billion VND 2017 2018
A. CURRENT ASSETS
I. Cash and cash equivalents
II. Short-term financial investments
III. Short-term receivables
Hàng tồn kho
B. LONG-TERM ASSETS
I. Fixed assets
TOTAL ASSETS
A. LIABILITIES
I. Current liabilities
II. Long-term liabilities
B. OWNER’S EQUITY
TOTAL CAPITAL RESOURCES
INCOME STATEMENT
Unit: Billion VND 2017 2018
Net revenue of goods sold and services
provided
Cost of goods sold and services provided
Gross profit of goods sold and services
provided
Revenue of financial activities
Financial expenses
Cost of sales
Administrative expenses
Net profit of business activities
Total accounting profit before taxProfit after tax
CASH FLOW STATEMENT
Unit: Billion VND 2017 2018
I. Cash flow from business activities
Net cash flow from business activities
II. Cash flow from investing activities
Net cash flow from investing activities
III. Cash flow from financial activities
Net cash flow from financial activities
Net cash flows during the fiscal yearCash and cash equivalents at the beginning of the fiscal yearCash and cash equivalents at the end of the fiscal year
148
Part VII. Financial Statements Appendix
Financial statement- DNY
Content is deleted for demo purpose
BALANCE SHEET
Unit: Billion VND 2017 2018
A. CURRENT ASSETS
I. Cash and cash equivalents
II. Short-term financial investments
III. Short-term receivables
Hàng tồn kho
B. LONG-TERM ASSETS
I. Fixed assets
TOTAL ASSETS
A. LIABILITIES
I. Current liabilities
II. Long-term liabilities
B. OWNER’S EQUITY
TOTAL CAPITAL RESOURCES
INCOME STATEMENT
Unit: Billion VND 2017 2018
Net revenue of goods sold and services
provided
Cost of goods sold and services provided
Gross profit of goods sold and services
provided
Revenue of financial activities
Financial expenses
Cost of sales
Administrative expenses
Net profit of business activities
Total accounting profit before taxProfit after tax
CASH FLOW STATEMENT
Unit: Billion VND 2017 2018
I. Cash flow from business activities
Net cash flow from business activities
II. Cash flow from investing activities
Net cash flow from investing activities
III. Cash flow from financial activities
Net cash flow from financial activities
Net cash flows during the fiscal yearCash and cash equivalents at the beginning of the fiscal yearCash and cash equivalents at the end of the fiscal year
149
Part VII. Financial Statements Appendix
Financial statement- HSG
Content is deleted for demo purpose
BALANCE SHEET
Unit: Billion VND 2017 2018
A. CURRENT ASSETS
I. Cash and cash equivalents
II. Short-term financial investments
III. Short-term receivables
Hàng tồn kho
B. LONG-TERM ASSETS
I. Fixed assets
TOTAL ASSETS
A. LIABILITIES
I. Current liabilities
II. Long-term liabilities
B. OWNER’S EQUITY
TOTAL CAPITAL RESOURCES
INCOME STATEMENT
Unit: Billion VND 2017 2018
Net revenue of goods sold and services
provided
Cost of goods sold and services provided
Gross profit of goods sold and services
provided
Revenue of financial activities
Financial expenses
Cost of sales
Administrative expenses
Net profit of business activities
Total accounting profit before taxProfit after tax
CASH FLOW STATEMENT
Unit: Billion VND 2017 2018
I. Cash flow from business activities
Net cash flow from business activities
II. Cash flow from investing activities
Net cash flow from investing activities
III. Cash flow from financial activities
Net cash flow from financial activities
Net cash flows during the fiscal yearCash and cash equivalents at the beginning of the fiscal yearCash and cash equivalents at the end of the fiscal year
150
Part VII. Financial Statements Appendix
Financial statement- NAKISCO
Content is deleted for demo purpose
BALANCE SHEET
Unit: Billion VND 2017 2018
A. CURRENT ASSETS
I. Cash and cash equivalents
II. Short-term financial investments
III. Short-term receivables
Hàng tồn kho
B. LONG-TERM ASSETS
I. Fixed assets
TOTAL ASSETS
A. LIABILITIES
I. Current liabilities
II. Long-term liabilities
B. OWNER’S EQUITY
TOTAL CAPITAL RESOURCES
INCOME STATEMENT
Unit: Billion VND 2017 2018
Net revenue of goods sold and services
provided
Cost of goods sold and services provided
Gross profit of goods sold and services
provided
Revenue of financial activities
Financial expenses
Cost of sales
Administrative expenses
Net profit of business activities
Total accounting profit before taxProfit after tax
CASH FLOW STATEMENT
Unit: Billion VND 2017 2018
I. Cash flow from business activities
Net cash flow from business activities
II. Cash flow from investing activities
Net cash flow from investing activities
III. Cash flow from financial activities
Net cash flow from financial activities
Net cash flows during the fiscal yearCash and cash equivalents at the beginning of the fiscal yearCash and cash equivalents at the end of the fiscal year
151
Part VII. Financial Statements Appendix
Financial statement- VGS

Content is deleted for demo purpose
BALANCE SHEET
Unit: Billion VND 2017 2018
A. CURRENT ASSETS
I. Cash and cash equivalents
II. Short-term financial investments
III. Short-term receivables
Hàng tồn kho
B. LONG-TERM ASSETS
I. Fixed assets
TOTAL ASSETS
A. LIABILITIES
I. Current liabilities
II. Long-term liabilities
B. OWNER’S EQUITY
TOTAL CAPITAL RESOURCES
INCOME STATEMENT
Unit: Billion VND 2017 2018
Net revenue of goods sold and services
provided
Cost of goods sold and services provided
Gross profit of goods sold and services
provided
Revenue of financial activities
Financial expenses
Cost of sales
Administrative expenses
Net profit of business activities
Total accounting profit before taxProfit after tax
CASH FLOW STATEMENT
Unit: Billion VND 2017 2018
I. Cash flow from business activities
Net cash flow from business activities
II. Cash flow from investing activities
Net cash flow from investing activities
III. Cash flow from financial activities
Net cash flow from financial activities
Net cash flows during the fiscal yearCash and cash equivalents at the beginning of the fiscal yearCash and cash equivalents at the end of the fiscal year
152
Part VII. Financial Statements Appendix
Financial statement- DTL

Content is deleted for demo purpose
BALANCE SHEET
Unit: Billion VND 2017 2018
A. CURRENT ASSETS
I. Cash and cash equivalents
II. Short-term financial investments
III. Short-term receivables
Hàng tồn kho
B. LONG-TERM ASSETS
I. Fixed assets
TOTAL ASSETS
A. LIABILITIES
I. Current liabilities
II. Long-term liabilities
B. OWNER’S EQUITY
TOTAL CAPITAL RESOURCES
INCOME STATEMENT
Unit: Billion VND 2017 2018
Net revenue of goods sold and services
provided
Cost of goods sold and services provided
Gross profit of goods sold and services
provided
Revenue of financial activities
Financial expenses
Cost of sales
Administrative expenses
Net profit of business activities
Total accounting profit before taxProfit after tax
CASH FLOW STATEMENT
Unit: Billion VND 2017 2018
I. Cash flow from business activities
Net cash flow from business activities
II. Cash flow from investing activities
Net cash flow from investing activities
III. Cash flow from financial activities
Net cash flow from financial activities
Net cash flows during the fiscal yearCash and cash equivalents at the beginning of the fiscal yearCash and cash equivalents at the end of the fiscal year
153
Part VII. Financial Statements Appendix
Financial statement- SMC
Content is deleted for demo purpose
BALANCE SHEET
Unit: Billion VND 2017 2018
A. CURRENT ASSETS
I. Cash and cash equivalents
II. Short-term financial investments
III. Short-term receivables
Hàng tồn kho
B. LONG-TERM ASSETS
I. Fixed assets
TOTAL ASSETS
A. LIABILITIES
I. Current liabilities
II. Long-term liabilities
B. OWNER’S EQUITY
TOTAL CAPITAL RESOURCES
INCOME STATEMENT
Unit: Billion VND 2017 2018
Net revenue of goods sold and services
provided
Cost of goods sold and services provided
Gross profit of goods sold and services
provided
Revenue of financial activities
Financial expenses
Cost of sales
Administrative expenses
Net profit of business activities
Total accounting profit before taxProfit after tax
CASH FLOW STATEMENT
Unit: Billion VND 2017 2018
I. Cash flow from business activities
Net cash flow from business activities
II. Cash flow from investing activities
Net cash flow from investing activities
III. Cash flow from financial activities
Net cash flow from financial activities
Net cash flows during the fiscal yearCash and cash equivalents at the beginning of the fiscal year
Cash and cash equivalents at the end of the fiscal year
154
Part VII. Financial Statements Appendix
Financial statement- TLH
Content is deleted for demo purpose
123
Recommendation
Recommended uses
This report is made Vietnam Industry Research and Consultancy (VIRAC), providing only the industry overview and business analysis. All information, statements
and projections are based on reliable sources with ultimate prudence as of the time of writing. However, due to subjective and objective reasons in terms of
published formation sources, VIRAC does not guarantee or bear any responsibility for information accuracy and no liability for damages on using this report partly
or wholly. All viewpoints and statements in this report are subjected to changes without notice. This publication is protected by copyright owned by Vietnam
Industry Research and Consultancy (VIRAC). Copying, modifying and printing without permission are strictly prohibited.
Please contact us for more details:VIETNAM INDUSTRY RESEARCH AND CONSULTANCY
Floor 6, Anh Minh Building, 36 Hoang Cau Street, O Cho Dua Ward, Dong Da District, Hanoi
Website: http://virac.com.vn/
Email: [email protected] | Phone: +84 463289520

Content is deleted for demo purposeThank you !


![CBI-DELETED COPY...CBI-deleted CBI-deleted guide RNA targets Cas9 to the intended site of action. Due to the design of the [ ] #4 CBI-deleted spacer used in the development of line](https://img.pdfslide.net/doc/110x75/5f6824d95ae97d5e681729bf/cbi-deleted-copy-cbi-deleted-cbi-deleted-guide-rna-targets-cas9-to-the-intended.jpg)
![SECTION 1 - PURPOSE AND DEFINITIONS [revised x/x/2020] Deleted · 2020. 10. 15. · SECTION 1 - PURPOSE AND DEFINITIONS [revised x/x/2020]. 1.01 Purposes. This ordinance shall be](https://img.pdfslide.net/doc/110x75/60aa848a4fd3292da22d33b8/section-1-purpose-and-definitions-revised-xx2020-deleted-2020-10-15-section.jpg)