Embed Size (px)
Citation preview

ContentsOverview
2 Highlights
3 Challenges
4 Zambeef at a glance
6 Geographical representation
Strategic report10 Chairman’s report
14 Joint Chief Executive Officer’s review
17 Operational and financial review
Retail and Cold Chain Food Products
Stock Feed (Novatek)
Cropping
Other businesses
Discontinued activities
21 Sustainability report
Corporate governance34 Corporate governance
38 Board of directors
40 Report of the directors
45 Statement of directors’ responsibilities
Financial statements50 Report of the independent auditors
53 Statement of comprehensive income
54 Consolidated statement of changes in equity
56 Company statement of changes in equity
58 Consolidated statement of financial position
60 Company statement of financial position
61 Consolidated statement of cash flows
62 Company statement of cash flows
63 Notes to the financial statements
120 Notice of AGM and agenda
121 Proxy form

1
Our vision and strategyOur vision is to be one of the most accessible and affordable quality protein providers in the Southern Africa region, delivered through the Group’s extensive retail and distribution network.
Our business model Our vertically integrated business model provides for strong foundations for growth and:• Underpins margin
capture and value add;• Secures supply chain;• Reduces risk and
earnings volatility.
Overview Strategicreport
Corporategovernance
Financialstatements
Zambeef Products PLC Annual Report 2017
Our profileThe Zambeef Group is one of the largest integrated agri-businesses in Zambia, involved in the primary production, processing, distribution and retailing of beef, chicken, pork, milk, eggs, dairy products, fish, flour and stock feed, throughout Zambia and the surrounding region, as well as Nigeria and Ghana. The Group is also one of the largest cereal row cropping operations in Zambia, with approximately 7,787 hectares of row crops under irrigation which are planted twice a year, and a further 8,694 hectares of rainfed/dry-land crops available for planting each year.

2 Zambeef Products PLC Annual Report 2017
Highlights
Zambia Retailing Turnover
h 44.9% (USD)
h 27.3% (ZMW)2017: ZMW1,441m (USD151m)2016: ZMW1,132m (USD104m)
Retailing and CCFP EBITDA
h 77.1% (USD)
h 55.7% (ZMW)2017: ZMW133m (USD13.9m)2016: ZMW85m (USD7.9m)
Stock Feed EBITDA
h 37% (USD)
h 20% (ZMW)2017: ZMW117m (USD9m)2016: ZMW97m (USD12.2m)
Solid performance from the Stock Feed division which was the top performing division within the Group
Robust CostControl
Good operational performance ofthe traditional coreCold Chain FoodProducts division
Agreement to sell 90% stake in Zampalm to the Industrial Development Corporation of Zambia for USD16m
Successful completion of capacity expansion and efficiency improvement capex projects, including:• 10 Macro stores opened• Commissioning of USD30m hatchery
and stock feed mill at Mpongwe Farm
• Commissioning of USD1.2m rotary milking parlour at Kalundu Dairy Farm

3Zambeef Products PLC Annual Report 2017
Challenges
Financialstatements
Corporategovernance
Strategicreport
Overview
Cropping EBITDA
86.6% (USD)
88.3% (ZMW)2017: ZMW16m (USD1.7m)2016: ZMW140m (USD12.9m)
Wheat yields adversely impacted by the outbreak of a fungal disease, Septoria, which reduced wheat yields by 10.2%
Material drop in soft commodity prices with soya prices dropping around 34% and maize prices dropping around 44%
Tight monetary policies and increase in fuel and electricty costs impacted consumer spending and put margins under pressure

4 Zambeef Products PLC Annual Report 2017
Zambeef at a glanceRobust business model of vertical integration
Retail and distribution • Currently 160 retail outlets in Zambia: 78 retail outlets, 19 macro stores, three fast food
outlets, 17 Novatek outlets, 12 Zamshu outlets and 31 Shoprite butcheries.• Currently 35 retail outlets in West Africa: six retail outlets, 22 Shoprite butcheries and
one U Save outlet in Nigeria; and six Shoprite butcheries in Ghana.• Shoprite butcheries throughout Zambia, Nigeria and Ghana provide an exciting
opportunity for the Zambeef Group, in partnership with Shoprite.• Total Shoprite butcheries of 59: Zambia (31); Nigeria (22) and Ghana (6).• Vast majority of Zambeef products retailed directly to end consumer, in a value
added form, through the Group’s extensive retail and distribution network.• Zambeef also operates one of the largest transport and trucking fleets in Zambia
and has its own workshop to service and maintain its vehicle fleet, giving the Group control over logistics and distribution.
Cold Chain Food Products• One of the largest suppliers of beef in Zambia. Five beef abattoirs and three feedlots
located throughout Zambia, with a capacity to slaughter 100,000 cattle p.a. and a capacity to feedlot 24,000 grain fed cattle p.a. In 2017, Zambeef slaughtered 78,223 cattle (2016: 69,848).
• One of the largest chicken and egg producers in Zambia, currently producing 12.6 million day-old chicks p.a.; processing 7.3 million chickens p.a. (2016: 6.75 million); and producing over 69 million eggs p.a. (2016: 40.2 million).
• One of the largest piggeries, pig abattoirs and pork processing plants in Zambia, with a capacity to slaughter 100,000 pigs p.a. In 2017, Masterpork slaughtered 61,152 pigs (2016: 69,644).
• Rotary milking parlour commissioned at Kalundu Dairy in December 2016, enabling the milking of 70 cows at a time, thus increasing efficiency.
• Dairy farm with approximately 2,456 dairy cattle, with 1,039 currently lactating and currently producing/processing around 19.3 million litres of milk p.a. (2016: 14.8 million).
• Meat and dairy processing plants add value in producing yoghurt, drinking yoghurt, cheese, butter, milk-based juices and processed meat products.

5
Corporategovernance
Financialstatements
Overview Strategicreport
Zambeef Products PLC Annual Report 2017
Stock Feed • One of the leading animal feed suppliers in Zambia and the surrounding region, with
a capacity of 25,000 M.T. per month (14,000 M.T. Lusaka plant, 11,000 M.T. Mpongwe plant). In 2017, Novatek produced 154,000 tons of stock feed (2016: 150,000 tons).
• Second stock feed plant 11,000 M.T. p. m. capacity was commissioned at Mpongwe Farm in August 2017, nearly doubling capacity. This plant is ideally placed to service Zambia’s Copperbelt and North Western provinces, as well as the Democratic Republic of Congo market, while simultaneously reducing distribution costs.
• Over 70 per cent. of Novatek’s stock feed production is for the large and growing poultry sector.
• Approximately 30 per cent. of Novatek’s production is for internal consumption within the Zambeef Group; the balance of 70 per cent. is sold in the external market, both within Zambia and in the surrounding region.
• Novatek stock feed marketing and distribution aided by over 90 branded Novatek agency distribution points and 17 Novatek outlets in Zambia; and 18 agency distribution points in Zimbabwe.
• Novatek products have been certified by the Zambia Bureau of Standards (ZS 017, ZS 018 and ZS 019) and Novatek is also ISO 9001 (Quality Management) and ISO 22,000 (Food Safety Management) certified.
Cropping • One of the largest irrigated row cropping operations in Zambia.• Approximately 7,787 Ha irrigated and 8,694 Ha rainfed, arable, developed land
available for planting each year. 2017: 16,465 Ha planted in the summer and 7,787 Ha planted in the winter (24,252 Ha in total).
• Crop production focused on soya beans during summer and wheat during winter.• In 2017, Zambeef Cropping division produced 42,832 tons soya (2016: 39,942 tons);
42,500 tons wheat (2016: 40,643 tons); 30,040 tons maize (2016: 33,032 tons); and 24,073 tons maize silage (2016: 27,334 tons).
• 125,000 M.T. storage capacity (68,000 M.T. silo storage capacity).• Cropping division provides raw materials input (wheat, soya, and maize) for further
value add processing within the Group.
Other • Wheat mill with a capacity to mill 30,000 M.T. of wheat p.a. In 2017, the wheat mill
produced 10,377 tons of flour (2016: 9,820 tons). • Wheat mill adds value to the wheat from the Zambeef farms, producing flour.• One of the largest tanneries in Zambia, with a processing capacity of 130,000 hides
p.a. In 2017, the tannery processed 100,000 hides (2016: 97,533 hides).• One of the largest shoe plants in Zambia with a processing capacity of 150,000 pairs
p.a. In 2017, the shoe plant produced 68,500 pairs of shoes (2016: 67,746 pairs).• Tannery and shoe plant add value to the by-product of the beef division (cattle hides);
producing leather, industrial footwear and protective leather clothing.

6 Zambeef Products PLC Annual Report 2017
Our Zambia operations
0)

7
Corporategovernance
Financialstatements
Overview Strategicreport
Zambeef Products PLC Annual Report 2017
Feeding a growing region
2017 2016 2015
Zambia
Zambeef Outlets 78 83 85
Zambeef Macros 19 10 6
Zam Chick Inns 3 4 6
Novatek 17 10 5
Zamshu Outlets 12 2 0
Zambeef Outlets 129 109 102
Shoprites 31 31 26
Total Zambia 160 140 128
Nigeria
Shoprites 23 20 14
Master Meats Outlets
6 6 6
Total Nigeria 29 26 20
Ghana
Shoprites 6 5 4
Total Ghana 6 5 4
2017 2016 2015
Total Zambeef
135 115 108
Total Shoprites
60 56 44
Total Retail Network
195 171 152

8 Zambeef Products PLC Annual Report 2017

9
Corporategovernance
Financialstatements
Overview Strategicreport
Zambeef Products PLC Annual Report 2017
Strategicreport

10 Zambeef Products PLC Annual Report 2017
Chairman’s reportDespite record profits in the Retailing and Cold Chain Food Products division, the material drop in commodity prices have significantly impacted our Cropping division and thereby impacted the results for the year
Operating environment The financial year ended 30 September 2017 has been particularly challenging for Zambeef Products PLC. Despite a record contribution from our Stock Feed division and strong growth in our Retail and Cold Chain Food Products (“CCFP”) divisions, our results have been impacted by external factors largely outside of Management’s control. Global and local commodity prices for soya and maize fell sharply to seven year lows, and lower than expected wheat yields due to the fungal disease Septoria have adversely impacted gross profits in our Cropping division by USD9.1 million. The Cropping division has historically generated circa 29 per cent. of the Group’s overall gross profit (five year average fiscal years 2012-2016) and this will be the first year in which this division will have reported an operating loss. Many farming businesses and small-scale growers in Zambia are also suffering from the fall in soya and maize prices, which for many are now below the cost of production. It is pleasing to see the recent initiative by Zambia Agricultural Commodities Exchange (ZAMACE) and the Johannesburg Stock Exchange to launch future contracts for Zambian maize, soya and wheat, which will give the Group and other Zambian growers the opportunity to more easily manage commodity price risk.
Following the Zambian General Election in October 2016, the Bank of Zambia put in strict measures to stabilise the currency and reduce inflation. These measures, which included high interest rates and tight control of the money supply, impacted consumer spending in the first half of the year. Consequently, gross margins in our Retail and CCFP divisions declined by 6.1 per cent. in the first half, to 23.3 per cent. (H12016: 29.4 per cent.). It is pleasing to see
Overview of financial performanceThe Group has achieved an Adjusted Profit Before Tax from continuing operations (after adjusting for unrealised exchange gains and losses, and losses arising from price adjustments in fair value of biological assets) of ZMW4.5 million (USD0.5 million) compared with an Adjusted Profit Before Tax of ZMW92.7 million (USD8.6 million) in the previous year.
The Group’s Profit After Tax for the year from continuing operations was ZMW4.4 million (USD0.5 million) versus a Profit After Tax from continuing operations of ZMW123.8 million (USD11.4 million) in the prior year.
Group EBITDA after adjusting for fair value adjustments and unrealised exchange gains has decreased to ZMW173.6 million (USD18.2 million) versus a prior year comparative of ZMW316.6 million (USD29.2 million).
While the financial results for the year are disappointing, it is pleasing to report strong growth in our Zambian Retail sales revenue which has increased by 27.3 per cent. in ZMW from ZMW1,132 million to ZMW1,441 million (44.9 per cent. increase in USD from USD104.5 million to USD151.3 million). Our CCFP division has also performed well with volumes handled up 15.8 per cent., although operational difficulties experienced in our dairy unit in the first half of the year (now resolved) and higher diesel
that these tough short-term measures have achieved their goals, with Zambia now back to single digit inflation, a relatively stable currency and reduced interest rates. This has resulted in margins starting to normalise and increasing to 26.8 per cent. for H2.

11
Corporategovernance
Financialstatements
Overview Strategicreport
Zambeef Products PLC Annual Report 2017
Strategic progressAs we set out in the 2016 Annual Report, Zambeef’s vision is to become a leading provider of Cold Chain Food Products in Zambia, the Southern African Development Community (SADC) and the Common Market for Eastern and Southern Africa (COMESA) regions, where there is a growing and rapidly urbanising population of circa 450 million people. In pursuit of this vision, the Group committed to a number of strategic priorities and objectives. These included:1. Expansion of our retail network and
footprint across Zambia;2. Expansion of production capacity
across our Cold Chain Food Production facilities;
3. The construction of a second stock feed plant;
4. The disposal of non-core businesses.
It is pleasing to be able to report significant progress during the year in achieving these objectives.
Retail • A 28 per cent. increase in Zambeef’s
retail footprint with the successful opening of 10 new Macro stores in Zambia (of which seven opened in the second half), adding circa 4,950 sq. m of retail space to bring Zambeef’s own retail footprint at the year-end to circa 22,740 sq. m from 130 outlets across Zambia.
• The opening in partnership with Shoprite of eight new Zambeef butchery counter concessions. Four new stores in Zambia (bringing the total to 31, with two stores closed and one store closed temporarily following a fire), three in Nigeria (bringing the total to 23) and one in Ghana (bringing the total to six).
Cold Chain Food Products• Day-old chick production capacity
increased from 210,000 per week to 340,000 per week during the second half of the year.
• Broiler slaughter and processing capacity increased by 30,000 birds per week, to a total of 160,000 per week from June 2017.
• Installation of a 70 unit (365 cows/hour capacity) rotary milking parlour at the Kalundu Dairy Farm in December 2016.
Stock Feed• The opening in August 2017 of a
new 120,000 M.T. annual capacity Stock Feed Mill at Mpongwe which will service the Copperbelt and DRC markets.
The full economic benefits of these capacity improvements are expected to flow through to the underlying business divisions in FY2018.
Disposal of non-core assetsThe Group entered into an agreement on 6 September 2017 to sell 90 per cent. of the Group’s equity in Zampalm Limited to the Industrial Development Corporation of Zambia (“IDC”). This disposal is expected to complete by February 2018 for a cash consideration of USD16 million, with a further performance amount of up to USD2 million being payable by IDC, dependent on the achievement of certain performance milestones over the three years 2018 to
and electricity costs adversely impacted cost of sales. In the second half, the Retail and CCFP gross margins started to recover. Notwithstanding these challenges, EBITDA in this division significantly increased in ZMW by 55.7 per cent. from ZMW82 million to ZMW133 million (in USD by 77.1 per cent. from USD7.9 million to USD13.9 million) .Our Stock Feed division had a record year with falling raw material prices contributing to a 20 per cent. increase in EBITDA in ZMW, from ZMW97 million to ZMW116 million (36.5 per cent. in USD, from USD9.0 million to USD12.2 million).

12 Zambeef Products PLC Annual Report 2017
Chairman’s report continued
2020. Following the Group’s disposal of its oilseed crushing business Zamanita in 2016, the Board concluded that given the long timescales required to create value from the Zampalm plantation project, with only 2,911 Ha of the 20,238 Ha concession planted out to date, it was in the best interests of Zampalm stakeholders to seek a new majority shareholder. IDC represents the ideal partner given its mandate of working with the private sector to deliver long-term economic transformation. We are pleased that Zambeef has been appointed by IDC to manage the Zampalm plantation on its behalf for an initial term of three years, during which time we will be assisting IDC with the launch of a smallholder out-grower scheme.
Dividend policyIn view of the financial performance of the Group during the year to 30 September 2017, no dividend will be payable in respect of this financial year. However, it remains the Board’s intention to keep its dividend policy under review with a view to adopting a policy of regular progressive dividend payments to shareholders once operating cash flow permits.
Leadership successionDuring the last nine months a special committee of the Board, including the founders and Joint Chief Executive Officers, Dr. Carl Irwin and Francis Grogan, has undertaken a leadership succession planning process with the assistance of an executive recruitment consultant ahead of the planned retirement on 31 March 2018 of Dr. Carl Irwin. I am pleased to announce that Tim Pollock, Investment Director for Food & Agriculture for CDC Group Plc, has tendered his resignation from CDC and will join Zambeef on 1 January 2018 initially as Group Managing Director and subsequently as Joint Chief Executive Officer effective from 31st March 2018, subject to usual regulatory requirements. Mr. Pollock, who has been a Non-Executive Director of Zambeef since September 2016, has over 35 years of experience across the food and agribusiness sectors in operational, leadership and strategic roles in businesses operating in both developed and frontier markets. We look forward to his and Francis Grogan’s ongoing contribution to the Group over the coming years. In light of Mr. Pollock’s candidature, CDC Group recused its nominee directors from the special committee and from any involvement in subsequent Board discussions regarding the leadership succession.
I would like to take this opportunity to thank on behalf of shareholders, employees and the Board, Carl Irwin for his outstanding contribution to Zambeef over the past 23 years. He, along with Francis Grogan, co-founded the business and it has been through their vision, entrepreneurial drive and leadership that Zambeef has grown to become a market-leading and respected Zambian and Southern African business.

13
Corporategovernance
Financialstatements
Overview Strategicreport
Zambeef Products PLC Annual Report 2017
I am also pleased to announce that Mike Lovett, General Manager of the Cropping Division, has been appointed Chief Operating Officer and Director of Agriculture, and Walter Roodt, General Manager of our Stock Feed Division, has been appointed Deputy Managing Director with the additional responsibility for leading the implementation across the Cold Chain Food Products Division of a food safety management system and certification to ISO standards.
BoardDuring the year there have been a number of changes to the composition of the Zambeef Board. Graham Clark stepped down in April 2017 as non-executive Director, in order to take up the full-time role of CEO of Fiji Sugar Corporation Ltd. His extensive business experience has been greatly appreciated, and I would like to thank him for his contribution.
Three new non-executive Directors were appointed in April 2017, to broaden the depth of experience and diversity on the Board. Yollard Kachinda, a Zambian national who is currently Director General of the National Pension Scheme Authority (NAPSA) which holds 8.3 per cent. of the Company’s equity; Margaret Kunda Chalwe-Mudenda, a Zambian lawyer and former Director General of the Zambia Information and Communications Authority; and Professor Enala Lyson Tembo-Mwase, a prominent Zambian academic who holds a Doctorate in Entomology from the University of London, and is currently Deputy Vice Chancellor of the University of Zambia.
In August 2017, Jonathan Kirby joined the Board as a non-executive Director. Mr. Kirby is a qualified Chartered Accountant with over 25 years’ experience with SABMiller, predominantly as Finance Director of SABMiller’s African portfolio, comprising of operations in 18 countries, until his retirement earlier this year.
CDC Group has advised Zambeef that it will in due course nominate a non-executive Director to replace Tim Pollock as one of its two representatives on the Board.
I believe that our new non-executive Directors all bring relevant experience and skills to the Board which will help support Management in building the business in the future, and I welcome their appointments.
Outlook for 2018The Board is conscious of the significant level of investment that has been made in the Zambeef business over the past two years, and of the need to improve shareholder returns. Whilst the financial performance in FY2017 has been disappointing for reasons largely outside of Management’s direct control, the strength of Zambeef’s
balance sheet provides a solid platform from which to continue to deliver sustainable long-term growth and added shareholder value.
Management’s focus in FY2018 will be largely upon improving the financial performance, optimising the price volume and product line mix to improve operating margins and the return on capital employed from our existing assets. Capital expenditure in FY2018 is expected to moderate to USD14.5 million (FY2017: USD21.5 million).
We do not expect a significant improvement in global soya or maize prices in the next fiscal year, given what in historical terms are relatively high global stocks-to-use ratios, unless there is a significant weather event regionally or in one of the major producing countries, and therefore Management’s focus is on ensuring we continue to be a globally competitive low cost producer. During the year the Directors of Zambeef took the decision to explore strategic options for our southern Chiawa and Sinazongwe farms, both of which have amenity value and climates which could permit alternative crops to be produced. Chiawa also has a valuable 2,737 Ha game conservation area and corridor. Options being considered include sale and leaseback, joint venture share farming and disposal, all with a view to reducing the overall level of long-term capital employed within our Cropping division.
It has been encouraging to see the recent strengthening of the Zambian economy, which translated into improved consumer spending across our retail network in Q4 FY2017, which if maintained, bodes well for our FY2018 Retail and CCFP sales. However, over the past year there has been a significant expansion in the number of new FMCG retail outlets and malls servicing the Lusaka premium consumer market and competing with the Shoprite chain, so margins and volumes in our concessions within Shoprite, which account for circa 17 per cent. (2016: 22 per cent.) of our retail sales, are expected to remain competitive.
The fall in soya and maize raw material prices in FY2017 should benefit the Group’s in-house livestock production operations, with feed prices now some 20 per cent. lower than a year ago. Consequently, we expect continued improved operating margins from these businesses in FY2018.
We have an experienced and capable Management team and loyal, committed and motivated staff, whose efforts have been fundamental in delivering our growth over recent years. I thank them all for their valued contribution over the past year. Finally, I would like to thank our shareholders and all my Board colleagues for their support and commitment during the past year.
Dr. Jacob MwanzaChairman
14 November 2017

14 Zambeef Products PLC Annual Report 2017
Joint Chief Executive Officers’ review
OverviewThe financial year ended 30 September 2017 has been particularly challenging for Zambeef Products PLC. Despite a record contribution from our Stock Feed business and strong growth in revenues from our Retail and Cold Chain Food Products (CCFP) divisions, a sharp fall in commodity prices to seven year lows and lower than expected wheat yields severely impacted gross profits in our Cropping division. The Group is reporting an Adjusted Profit Before Tax from continuing operations (after adjusting for unrealised exchange gains and losses, and losses arising from price adjustments in fair value of biological assets) of ZMW4.5 million (USD0.5 million) compared to an Adjusted Profit Before Tax of ZMW92.7 million (USD8.6 million) in the previous year.
The Group’s Profit After Tax for the year from continuing operations was ZMW4.4 million (USD0.5 million) versus a Profit After Tax of ZMW123.8 million (USD11.4 million) in the prior year. Group EBITDA, after adjusting for fair value adjustments and unrealised exchange gains, has decreased to ZMW173.6 million (USD18.2 million) versus a prior year comparative of ZMW316.6 million (USD29.2 million).
Whilst the financial results for the year are disappointing (principally because the sharp fall in soya and maize prices and lower wheat yields have adversely impacted the gross profit in our Cropping division by USD9.1 million), they mask strong growth in revenues from our Retail and CCFP divisions.
It is pleasing to report that our Zambian retail sales have increased by 27.3 per cent. in ZMW from ZMW1,132 million to ZMW1,441 million (44.9 per cent. in USD from USD104.4 million to USD151.3 million), and like for like sales in the Zambeef Macro and retail stores increased by 18.2 per cent. in ZMW (34.4 per cent. in USD).
However, a slowdown in consumer spending in the first half of the year as the Bank of Zambia tightened money supply and raised interest rates to stabilise the economy, operational difficulties in our dairy unit (now resolved) and higher transport and electricity costs impacted cost of sales, resulting in the Retail & CCFP margin falling by 6.1 per cent. in the first half, from 29.4 per cent. to 23.3 per cent. The Retail & CCFP margin improved in the second half to 26.8 per cent. to give an average margin for the year of 25.0 per cent. (prior year 29.4 per cent.). Notwithstanding these challenges, EBITDA in this division increased in ZMW by 55.7 per cent. from ZMW82 million to ZMW133 million (77.1 per cent. in USD from USD7.9 million to USD13.9 million).
Our Stock Feed division had a record year with falling raw material prices contributing to a 20 per cent. increase in EBITDA in ZMW from ZMW97 million to ZMW117 million (36.5 per cent. in USD from USD9.0 million to USD12.2 million). The year has seen significant progress in the Board’s strategy of disposing of non-core activities with an agreement signed on 6 September 2017 to divest 90 per cent. of the Group’s equity in Zampalm Limited to the Industrial Development Corporation of Zambia (“IDC”). This disposal is expected to complete by February 2018 for a cash consideration of USD16 million, with a further performance amount of up to USD2 million being payable by IDC, dependent on the achievement of certain performance milestones over the three years 2018 to 2020. Proceeds from the disposal will be used to reduce debt and further strengthen the Zambeef balance sheet.
The Group has continued to invest in the expansion of processing capacity in its Cold Chain Food Products division, and in the
Continued focus by Zambeef on its Retailing and Cold Food Chain Products division have resulted in record profits and growth in these operations

15
Corporategovernance
Financialstatements
Overview Strategicreport
Zambeef Products PLC Annual Report 2017
expansion of its Retailing footprint. Group capital expenditure of ZMW209 million (USD22 million) has been incurred during the year (2016: ZMW179 million or USD16.5 million), with Group net debt at year-end increasing from ZMW483.2 million (USD48.3 million) to ZMW620 million (USD64 million). However, overall gearing for the Group reduced from 25.7 per cent. (2016) to 21.4 per cent. (2017). Net debt is expected to fall in FY2018 as the proceeds from the disposal of Zampalm are received.
Retail: building our networkIn line with the strategic priorities set out in our 2016 Annual Report, a key area of focus for Management during the year has been the expansion of Zambeef’s retailing activities. We are pleased to report that Zambeef’s total retail presence has increased from 171 outlets to 196 outlets during the past year. This growth has been driven both by the expansion of the Shoprite retail network in Zambia, Nigeria and Ghana, and the expansion of Zambeef’s own retail network, with the building of new Zambeef Macro outlets across Zambia.
Shoprite is Africa’s leading supermarket chain with whom Zambeef holds a concession agreement to operate in-store meat butchery counters in Zambia and West Africa. During the year, Shoprite opened four new stores in Zambia (bringing the total to 31 after closing two stores, and closing one temporarily due to fire damage), three in Nigeria (bringing the total to 23) and one in Ghana (bringing the total to six), all with Zambeef concessions within.
Zambeef has opened 10 new Macro stores in Zambia (of which seven opened in the second half), adding circa 4,950 sq. m of retail space to bring Zambeef’s own retail footprint at the year-end to circa 22,740 sq. m from 130 outlets across Zambia, and delivering ZMW58 million (USD6.1 million) in new sales. These new Macro stores are expected to deliver sales, once fully established, of ZMW20 million (USD2 million) each on an annualised basis. All of
the new Zambeef stores are on premises owned by Zambeef and are outlets that have been built and fitted to Zambeef’s specifications with the Group’s own construction, IT and refrigeration teams ensuring cost-effective and timely delivery of the rollout programme. Total capital expenditure in Retail was ZMW46 million (USD4.7 million), including expenditure securing future sites, and the new Kitwe distribution centre. The progressive expansion of our Retail business will drive Zambeef’s growth and ensure the Group plays a leading role in providing food to a fast growing and urbanising population in Zambia, West Africa and the wider SADC/COMESA regions.
Cold Chain Food Products: building capacityIn order to meet future growth in consumer demand for affordable proteins, Zambeef continued to invest in its Cold Chain Food Products division.
During the year, we invested USD3.1 million in:• Additional broiler breeder rearing
and laying housing and additional hatchery setters to increase day-old chick production from 210,000 per week to 340,000 per week effective May 2017;
• Increasing the Huntley broiler slaughter and processing capacity by 30,000 birds per week to a total of 160,000 per week from June 2017;
• Construction of a new CCFP depot outside Kitwe, in order to improve distribution efficiency to our expanding retail network in the Copperbelt region, which is expected to be completed in December 2017;
• Installed a new rotary milking parlour at the Kalundu dairy unit in February 2017.
The full benefits of these capacity improvements are expected to flow through into the CCFP business in FY2018.
Stock Feed: new Mpongwe plantZambeef’s Stock Feed operation, which trades under the brand name Novatek, had an excellent year, helped by the expansion of the retail network and growth in demand from monogastric and ruminant customers in both the formal and informal sectors. Demand remains high and our existing plant in Lusaka has been operating at full capacity for the past two years in order to meet this demand. It is therefore pleasing to be able to report that our new Mpongwe feed mill was commissioned in August 2017. This will add 120,000 M.T. of annual capacity to our existing annual capacity of 140,000 M.T. at our Lusaka mill. The new Mpongwe mill is ideally placed to supply the Copperbelt market, the northern half of Zambia and the northern export markets. This will save upon finished feed transport costs and further improve the efficiencies of Novatek.
Cropping This has been one of the most difficult years for our Cropping division, with sharp falls in the international and local prices of soya and maize to seven year lows on the back of large global and regional harvests and an increase in carryover stocks. Soya prices in Zambia fell from USD530/M.T. to USD360/M.T. and maize prices fell from an average of USD225/M.T. to USD125/M.T. The Cropping result has been further impacted by lower than expected biological realisation from the FY2016 year-end valuation, wheat yields which were 10.2 per cent. below budget at 41,750 M.T. due to a fungal disease, Septoria, which appears to have been more virulent this year despite implementation of our usual fungicide control programme, and diesel fuel and electricity cost of sales increasing by USD1.8 million. Consequently, gross profit in the Cropping division fell by ZMW86 million (USD9.1 million) from ZMW252 million to ZMW135 million (USD23.2 million to USD14.1 million), and the business has, for the first time, posted a small operating loss of ZMW14 million (USD1.5 million) versus an operating profit of ZMW107 million (USD9.9 million) in the prior year.

16 Zambeef Products PLC Annual Report 2017
Joint Chief Executive Officers’ review continued
Other activitiesDuring the last quarter of the year, we refurbished our flour mill at Huntley and commenced trials of an in-store bakery at our Mtendere Macro store, to ensure we maximise value from our wheat production.
Zamleather has had a difficult year, with poor export demand for wet blue hides.
As reported above, the Group has signed an agreement to sell 90 per cent. of the equity it holds in Zampalm Limited to the Industrial Development Corporation of Zambia (“IDC”). This disposal is expected to complete by February 2018. Following the Group’s disposal of its oilseed crushing business Zamanita in 2016, the Board concluded that given the long timescales required to create value from the Zampalm plantation project, with only 2,911 Ha of the 20,238 Ha concession planted out, it was in the best interests of Zampalm stakeholders to seek a new majority shareholder. IDC represents the ideal partner given its mandate of working with the private sector to deliver long-term economic transformation. We are pleased that Zambeef has been appointed by IDC to manage the Zampalm plantation on its behalf for an initial term of three years, during which time we will be assisting IDC with the launch of a smallholder out-grower scheme.
Outlook for FY2018The Board is conscious of the significant level of investment that has been made in the Zambeef business over the past two years, and of the need to improve shareholder returns. Our focus in FY2018 will be largely upon optimising operating margins and the return on capital employed from our existing assets.
The strengthening of the Zambian economy seen in Q4 FY2017 translated into improved consumer spending across the Zambeef retail network, which bodes well for our FY2018 Retail and CCFP sales. However, there has been a significant expansion in the number of FMCG retail outlets and malls servicing the Lusaka premium consumer market and competing with the Shoprite chain, so margins and
volumes in our concessions within Shoprite are expected to remain competitive.
We do not expect a significant improvement in global soya or maize prices in the next fiscal year given what in historical terms are relatively high global stocks-to-use ratios, unless there is a significant weather event regionally or in one of the major producing countries, and therefore Management’s focus is on ensuring we continue to be a globally competitive low cost producer. We may idle and fallow some of our poorer yielding land.
The recent fall in soya and maize raw material prices should benefit our own broiler, egg, dairy and beef feedlot livestock operations, with feed prices now some 20 per cent. lower than a year ago, thus we expect improved operating margins from these businesses in FY2018.
The pace of capital investment will slow from USD22.0 million in FY2017 to circa USD14.5 million in FY2018. Budgeted projects including amounts originally planned for FY2017 but carried forward include:• USD2.5 million on the construction
of a further eight macro outlets and investment in refrigerated distribution capacity;
• USD2.9 million completing the Mpongwe stock feed mill;
• USD1.8 million of improvements across Cold Chain Food Product operations in beef, dairy and pork;
• USD1.2 million increasing our IQF gyro freezer capacity to meet rising fast food outlet demand for portions;
• USD1.3 million expansion of broiler breeder laying farms capacity to complete the increase in day-old chick production from 210,000 to 340,000 per week;
• USD1.0 million on the delivery of the E&S improvements under the ESAP;
• USD3.8 million in replacement and contingency capex.
In line with our previously announced strategy, we will divest non-core operations and assets with a view to enabling Management to focus on those areas of
Carl Irwin & Francis GroganJoint CEOs
14 November 2017
the business where we can maximise shareholder returns, as well as reducing gearing and net debt. Following the usual four yearly revaluation of fixed assets which was undertaken during the past year, Group gearing stood at 21.4 per cent. at the year-end (2016: 25.7 per cent.). Gearing and net debt are expected to fall in FY2018 once the proceeds from the disposal of Zampalm to IDC are received.
Zambeef is fortunate to be operating in areas with some of the fastest growing urbanising populations in the world. The consequence of this is that the demand for food is growing rapidly, and the immediate challenge for Zambeef will be to meet this growing demand whilst driving operational efficiencies and margin improvements across our beef, chicken, pork, eggs and dairy products lines to reflect the significant capital investment made over the past two years in increasing our retail footprint and production capacities in our CCFP division. It has been an extremely busy year at Zambeef and we feel incredibly proud of our 7,000 employees and what they have achieved over this period despite what has been a challenging trading environment, and we would like to take this opportunity to thank all of our employees for the contribution they have made to the Company. In addition, we would like to thank our Chairman, Dr. Jacob Mwanza, as well as our entire Board of Directors for their valuable guidance and support.
17
Corporategovernance
Financialstatements
Overview Strategicreport
Zambeef Products PLC Annual Report 2017
Operational and financial reviewSummaryTurnover for the Group increased by 2.5 per cent. in ZMW to ZMW2,435 million (16.6 per cent. in USD to USD255.8 million), while gross profit margins reduced from 36.9 per cent. to 32.8 per cent., resulting in gross profit reducing by 8.8 per cent. in ZMW from ZMW876 million to ZMW799 million (increasing by 3.7 per cent. in USD from USD80.9 million to USD83.9 million). The Group has tightly controlled its overheads despite the average inflation rate at the start of the year being 18.9 per cent., dropping to finish the year at 6.6 per cent., with overheads increasing by 3.0 per cent. in ZMW (17.1 per cent. in USD). EBITDA margin (after adjusting for fair value adjustments and unrealised exchange gains) reduced from 13.3 per cent. to 7.1 per cent. Operating profit decreased by 53.8 per cent. in ZMW from ZMW188 million to ZMW87 million (47.5 per cent. in USD from USD17.3 million to USD9.1 million).
The ZMW101 million (USD8.2 million) fall in operating profit was largely driven by a drop in Cropping division gross profit of USD9.1 million from USD23.3 million to USD14.1 million arising from:• A sharp fall in global and local soft
commodity prices, with Zambian soya prices dropping from USD530/M.T. at the end of March 2016 to USD360/M.T. by September 2017, and regional maize prices falling from USD225/M.T. in April 2016 to USD125/M.T. by September 2017. It should be noted that the Zambian forward market is generally illiquid, making forward hedge sales very difficult.
• Cost of sales and distribution costs were impacted by circa USD1.8 million as a result of a 30 per cent. increase in fuel prices during the first half of the year, and a 50 per cent. increase in electricity costs in May 2017 as
Zambia moves towards a market-based electricity pricing policy.
• A shortfall in budgeted wheat yields of 10.2 per cent. and in the realisations from the 2016 year-end biological valuation.
The poor result from Cropping was partially offset by:• Novatek, our Stock Feed business,
which had a record year with falling raw material prices contributing to a 20.4 per cent. (in ZMW) increase in operating profit from ZMW94 million to ZMW113 million (36.9 per cent. in USD from USD8.7 million to USD11.9 million).
• The Retail and Cold Chain Food Products (CCFP) divisions, which contributed to a 77.1 per cent. (in ZMW) increase in operating profit from ZMW49 million to ZMW86 million (101.4 per cent. in USD from USD4.5m to USD9.1m).
Operating profit was also impacted by a rise in central overheads which increased from ZMW75 million to ZMW107 million (USD7.0 million to USD11.3 million). Interest expense has fallen by 21 per cent. in ZMW (10.2 per cent. in USD) to ZMW88 million (2016: ZMW111 million) as a result of lower debt levels, although interest rates were higher for the first half of the year.
The Group has achieved an Adjusted Profit Before Tax from continuing operations (after adjusting for unrealised exchange gains and losses arising from price adjustments in fair value of biological assets) of ZMW4.5 million (USD0.5 million) compared with an Adjusted Profit Before Tax of ZMW92.7 million (USD8.6 million) in the previous year.
The Group’s Profit After Tax for the year
from continuing operations was ZMW4.4 million (USD0.5 million) versus a Profit After Tax of ZMW123.8 million (USD11.4 million) in the prior year.
Group EBITDA, after adjusting for fair value adjustments and unrealised exchange gains, has decreased to ZMW173.6 million (USD18.2 million) versus a prior year comparative of ZMW316.6 million (USD29.2 million).
Exchange rates and macroeconomic environment This past year has been a challenging eco-nomic environment. Post-election in Octo-ber 2016 the Bank of Zambia put in strict measures to stabilise the currency, restrict money supply and reduce inflation. The measures implemented by Bank of Zam-bia, which included high interest rates and tight control on the money supply, impact-ed consumer spending and put Retail op-erating margins under significant pressure in H1. It is pleasing to see that these tough short-term measures have achieved their goals, with Zambia now back to single dig-it inflation, a relatively stable currency and reduced interest rates.
Inflation started the year at 18.9 per cent. and by year-end had reduced to 6.6 per cent. The 273 day treasury bills started the period at 24.9 per cent. but with the stabilisation of the currency and reduction in inflation the 273 day treasury bill rate has reduced to 8.5 per cent. at 30 September 2017.
During the year, the ZMW has steadily appreciated against the USD from 10.01 ZMW/USD at 30 September 2016 to 9.67 ZMW/USD at 30 September 2017. The exchange rates for the last two years are summarised in the table below:
2016 2017
ZMW/USD ZMW/USD
Average rate for year 10.83 9.52
Closing rate at 30 September 10.01 9.67
The appreciation of the ZMW exchange rate during the year has resulted in both realised and unrealised exchange gains of ZMW6.7 million (USD0.7 million) being recorded (2016: ZMW58.3 million, USD5.4 million). It is worth noting that the Group has a natural currency hedge in that most of its Cropping sales income is USD denominated.

18 Zambeef Products PLC Annual Report 2017
Average Rate (USD) Average Rate (ZMW)USD : ZMW
Debt Split (%)
March 2015 4.0% 15.6% 77.0% : 23.0%
September 2015 4.4% 16.7% 64.5% : 35.5%
March 2016 6.5% 28.1% 59.8% : 40.2%
September 2016 6.6% 27.6% 82.1% : 17.9%
March 2017 7.0% 24.1% 62.3% : 37.7%
September 2017 6.3% 17.0% 67.4% : 32.6%
Administration and overhead costsStrong control of administrative and overhead costs has continued to be a key focus of Management, with total administrative and overhead costs for the year of ZMW631 million (2016: ZMW612 million), representing an increase of 3.0 per cent. in ZMW on the prior year (17.3 per cent. in USD from USD56.5 million to USD66.3 million). These costs, excluding depreciation, as a percentage of turnover marginally increased from 25.8 per cent. in 2016 to 25.9 per cent. This is an excellent achievement when one considers that:• Fuel prices increased by 30 per cent.
during H1;• Electricity costs increased by 50 per
cent. in May 2017 as Zambia moves towards a market-based electricity pricing policy. However, good rains this year have been positive for power generation, resulting in a reduction in load shedding;
• Councils increased levy and slaughter fees by up to 500 per cent.;
• Toll fees introduced on all major arterial routes.
Within our Retail division, distribution costs, which are a cost of sale rather than an
overhead, increased by 78.3 per cent. on the prior year to ZMW41.2 million (USD4.3 million), or 2.9 per cent. of turnover (2016: 2.0 per cent.) reflecting higher diesel fuel and road toll expenses.
Our largest single cost is wages and salaries which increased in ZMW by 16 per cent. from ZMW307 million (USD28.4 million) to ZMW357 million (USD37.5 million), which accounts for 56.6 per cent. of total administration and overhead costs (2016: 50.2 per cent.).
Balance sheetTotal capital employed in the Group has increased to ZMW3,246 million (USD336 million) versus a prior year comparative of ZMW2,422 million (USD242 million), reflecting capital investment and an increase of ZMW790 million (USD82 million) in revaluation reserves following the usual four yearly revaluation of the Group’s fixed assets.
A term loan of USD15 million was drawn down from Deutsche Investitions-und Entwicklungsgesellschaft mbH (DEG) on 17 May 2017 to fund capex. This loan is repayable over six years with semi-annual
payments of USD1.25 million starting in March 2018. The interest rate is six month USD LIBOR plus 5.75 per cent.
During the year term debt totaling USD10.5 million (2016: USD9.4 million) was repaid. Debt capital repayment servicing is expected to be USD8.0 million in 2018.
Net debt at the year end was ZMW620 million (USD64.1 million) versus a prior year comparative of ZMW483 million (USD48.3 million), giving a debt-to-equity ratio of 21.4 per cent. (2016: 25.7 per cent.). Finance costsThe finance costs for the Group have decreased by 21 per cent. in ZMW from ZMW111 million to ZMW88 million (10.2 per cent. in USD from USD10.3 million to USD9.2 million). This decrease was as a result of a reduction in net debt versus the previous year following the investment of USD65 million by CDC Group Plc in September 2016. The lower gearing was partially offset by an increase in interest rates during the first half of the year. The table below shows the movement in the average interest rates incurred by Zambeef over the year:
Finance expenses are expected to reduce during 2018.
Capital expenditureTotal capital expenditure during the year was ZMW209 million or USD22 million (2016: ZMW179 million or USD16.5 million).
Capital expenditure incurred during the year included:• USD4.2 million on the rollout of 10 new Zambeef Macro outlets plus the acquisition of seven new sites;• USD2.3 million on the new Kalundu Dairy rotary milking parlour and upgrades to milk processing plant;• USD1.0 million on the new Mpongwe stock feed plant;• USD2.2 million on the expansion of the Zamhatch hatchery and breeder farm;• USD0.8 million on the expansion of the Zam Chick processing plant;• USD1.0 million on the expansion of added value foods processing plant at Masterpork;
19
Corporategovernance
Financialstatements
Overview Strategicreport
Zambeef Products PLC Annual Report 2017
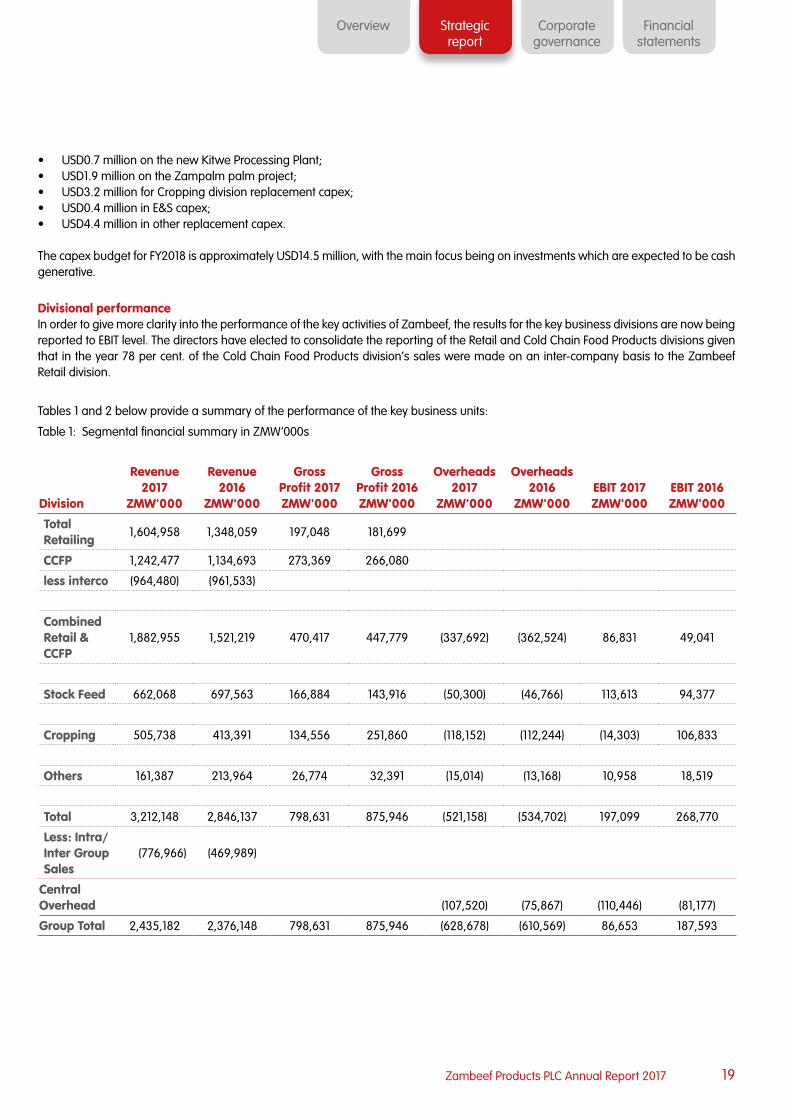
Divisional performanceIn order to give more clarity into the performance of the key activities of Zambeef, the results for the key business divisions are now being reported to EBIT level. The directors have elected to consolidate the reporting of the Retail and Cold Chain Food Products divisions given that in the year 78 per cent. of the Cold Chain Food Products division’s sales were made on an inter-company basis to the Zambeef Retail division.
Tables 1 and 2 below provide a summary of the performance of the key business units:
Table 1: Segmental financial summary in ZMW’000s
Division
Revenue 2017
ZMW'000
Revenue 2016
ZMW'000
Gross Profit 2017 ZMW'000
Gross Profit 2016 ZMW'000
Overheads 2017
ZMW'000
Overheads 2016
ZMW'000EBIT 2017 ZMW'000
EBIT 2016 ZMW'000
Total Retailing
1,604,958 1,348,059 197,048 181,699
CCFP 1,242,477 1,134,693 273,369 266,080
less interco (964,480) (961,533)
Combined Retail & CCFP
1,882,955 1,521,219 470,417 447,779 (337,692) (362,524) 86,831 49,041
Stock Feed 662,068 697,563 166,884 143,916 (50,300) (46,766) 113,613 94,377
Cropping 505,738 413,391 134,556 251,860 (118,152) (112,244) (14,303) 106,833
Others 161,387 213,964 26,774 32,391 (15,014) (13,168) 10,958 18,519
Total 3,212,148 2,846,137 798,631 875,946 (521,158) (534,702) 197,099 268,770
Less: Intra/Inter Group Sales
(776,966) (469,989)
Central Overhead (107,520) (75,867) (110,446) (81,177)
Group Total 2,435,182 2,376,148 798,631 875,946 (628,678) (610,569) 86,653 187,593
• USD0.7 million on the new Kitwe Processing Plant;• USD1.9 million on the Zampalm palm project;• USD3.2 million for Cropping division replacement capex;• USD0.4 million in E&S capex;• USD4.4 million in other replacement capex.
The capex budget for FY2018 is approximately USD14.5 million, with the main focus being on investments which are expected to be cash generative.

20 Zambeef Products PLC Annual Report 2017
Division
Revenue 2017
USD’000
Revenue 2016
USD’000
Gross Profit 2017 USD’000
Gross Profit 2016 USD’000
Overheads 2017
USD’000
Overheads 2016
USD’000EBIT 2017 USD’000
EBIT 2016 USD’000
Total Retailing
168,588 124,475
CCFP 130,512 104,773
less interco (101,311) (88,784)
Combined Retail & CCFP
197,789 140,463 49,414 41,346 (35,472) (33,474) 9,121 4,528
Stock Feed 69,545 64,410 17,530 13,289 (5,284) (4,318) 11,934 8,714
Cropping 53,124 38,171 14,134 23,256 (12,411) (10,364) (1,502) 9,865
Others 16,952 19,757 2,812 2,991 (1,577) (1,216) 1,151 1,710
Total 337,411 262,801 83,890 80,881 (54,743) (49,372) 20,704 24,817
Less: Intra/Inter Group Sales
(81,614) (43,397) - - - - - -
Central Overhead
- - - - (11,294) (7,005) (11,601) (7,496)
Group Total 255,796 219,404 83,890 80,881 (66,038) (56,378) 9,102 17,322
Capital EmployedZMW’000
Operating Profit %
ZMW’000
Operating Profit %
ZMW’000
Capital EmployedUSD’000
Operating Profit %USD’000
Operating Profit %USD’000
Retail & CCFP 1,053,014 86,831 4.61% 108,895 9,121 4.61%
Cropping 1,603,704 (14,303) (2.83)% 165,843 (1,502) (2.83)%
Stock Feed 264,109 113,613 17.16% 27,312 11,934 17.16%
Other 75,949 10,958 6.79% 7,854 1,151 6.79%
Group 2,996,776 197,099 7.89% 309,904 20,704 7.89%
Discontinued 220,099 (1,133) (4.76)% 22,761 (119) (4.76)%
Table 2: Segmental financial summary in USD’000s
Return on capital employedThe Directors are presenting for the first time the return on capital employed for each of the Group’s major activities. (Note: Directors unable to accurately allocate interest expense to each division as borrowings are centrally managed and held).

21
Corporategovernance
Financialstatements
Overview Strategicreport
Zambeef Products PLC Annual Report 2017
Retail and Cold Chain Food Products
DIVISIONAL REVIEWTaking each of our key business areas in turn as follows:
DivisionRevenue 2017
ZMW'000Revenue 2016
ZMW'000
Gross Profit 2017 ZMW'000
Gross Profit 2016 ZMW'000
Overheads 2017
ZMW'000
Overheads 2016
ZMW'000
EBIT 2017
ZMW'000
EBIT 2016
ZMW'000
Retailing Zambia 1,440,784 1,131,524
Retailing West Africa 164,174 216,535
Total Retailing 1,604,958 1,348,059
CCFP 1,242,477 1,134,693
less interco (964,480) (961,533)
Combined Retail & CCFP 1,882,955 1,521,219 470,417 447,779 (337,692) (362,524) 86,831 49,041
DivisionRevenue 2017
USD ’000Revenue 2016
USD ’000
Gross Profit 2017
USD ’000
Gross Profit 2016 USD ’000
Overheads 2017
USD ’000
Overheads 2016
USD ’000
EBIT 2017
USD ’000
EBIT 2016
USD ’000
Retailing Zambia 151,343 104,481
Retailing West Africa 17,245 19,994
Total Retailing 168,588 124,475
CCFP 130,512 104,773
less interco (101,311) (88,784) -
Combined Retail & CCFP 197,789 140,463 49,414 41,346 (35,472) (33,474) 9,121 4,528
Retail and Cold Chain Food Products - Summary financial performance
Net sales in the combined Retail and Cold Chain Food Products divisions increased by 23.8 per cent. in ZMW and 40.8 per cent. in USD. Gross profit grew by 5.1 per cent. in ZMW and 19.5 per cent. in USD. Growth in gross profit was impacted principally because of a slowdown in consumer spending in the first half of the year as the Bank of Zambia tightened money supply and raised interest rates to stabilise the economy, operational difficulties in our dairy unit (now resolved) and higher transport and electricity costs which in turn impacted cost of sales, resulting in the Retail & CCFP margin falling by 6.1 per cent. in the first half from 29.4 per cent. to 23.3 per cent. The Retail & CCFP margin improved in the second half to 26.8 per cent. to give an average margin for the year of 25.0 per cent. (prior year 29.4 per cent.). Notwithstanding these challenges, operating profit in this division increased in ZMW by 77.1 per cent. (101.4 per cent. in USD from USD4.5 million to USD9.1 million).
EBITDA in ZMW increased 55 per cent., from ZMW85 million to ZMW133 million, whilst in USD, it increased by 77.1 per cent., from USD7.8 million to USD13.9 million. The business has generated a satisfactory EBITDA margin of 7.0 per cent. (2016: 5.6 per cent.), which is broadly in line with EBITDA margins seen across the unbranded cold chain foods sector. Further details of the Cold Chain Food Products business are set out in the analysis of the performance of each product line.
22 Zambeef Products PLC Annual Report 2017
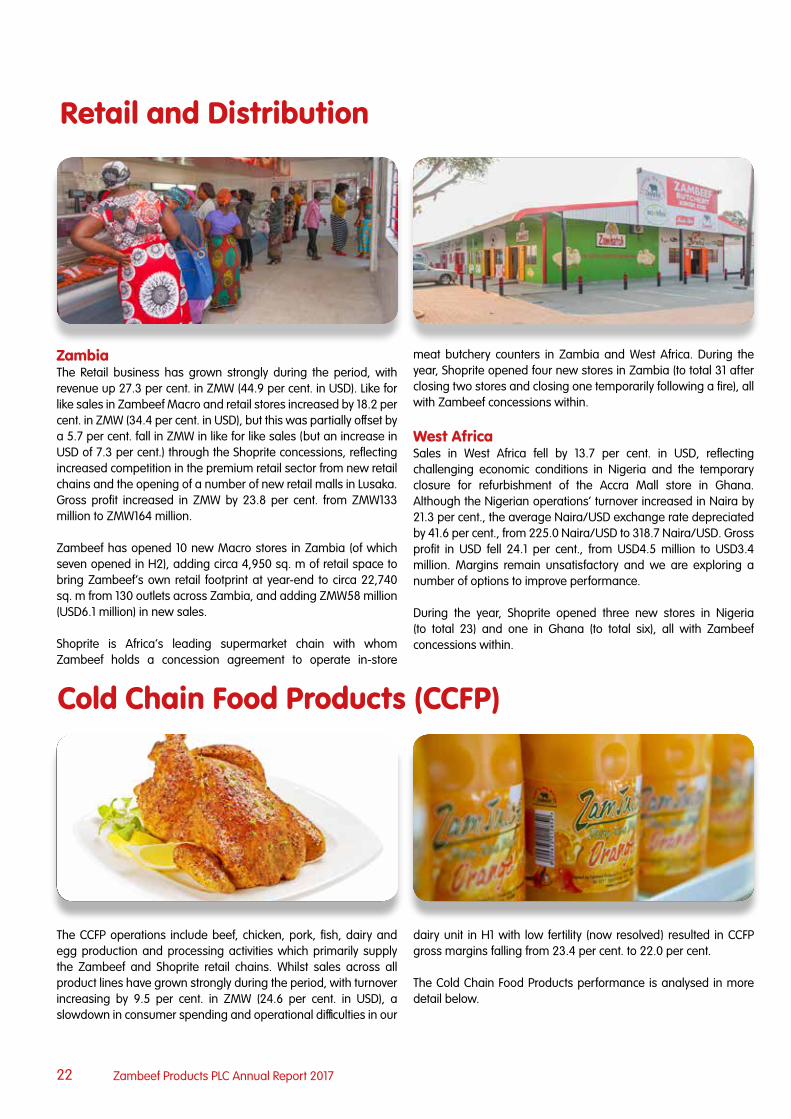
Retail and Distribution
Zambia The Retail business has grown strongly during the period, with revenue up 27.3 per cent. in ZMW (44.9 per cent. in USD). Like for like sales in Zambeef Macro and retail stores increased by 18.2 per cent. in ZMW (34.4 per cent. in USD), but this was partially offset by a 5.7 per cent. fall in ZMW in like for like sales (but an increase in USD of 7.3 per cent.) through the Shoprite concessions, reflecting increased competition in the premium retail sector from new retail chains and the opening of a number of new retail malls in Lusaka. Gross profit increased in ZMW by 23.8 per cent. from ZMW133 million to ZMW164 million.
Zambeef has opened 10 new Macro stores in Zambia (of which seven opened in H2), adding circa 4,950 sq. m of retail space to bring Zambeef’s own retail footprint at year-end to circa 22,740 sq. m from 130 outlets across Zambia, and adding ZMW58 million (USD6.1 million) in new sales.
Shoprite is Africa’s leading supermarket chain with whom Zambeef holds a concession agreement to operate in-store
meat butchery counters in Zambia and West Africa. During the year, Shoprite opened four new stores in Zambia (to total 31 after closing two stores and closing one temporarily following a fire), all with Zambeef concessions within.
West Africa Sales in West Africa fell by 13.7 per cent. in USD, reflecting challenging economic conditions in Nigeria and the temporary closure for refurbishment of the Accra Mall store in Ghana. Although the Nigerian operations’ turnover increased in Naira by 21.3 per cent., the average Naira/USD exchange rate depreciated by 41.6 per cent., from 225.0 Naira/USD to 318.7 Naira/USD. Gross profit in USD fell 24.1 per cent., from USD4.5 million to USD3.4 million. Margins remain unsatisfactory and we are exploring a number of options to improve performance.
During the year, Shoprite opened three new stores in Nigeria (to total 23) and one in Ghana (to total six), all with Zambeef concessions within.
Cold Chain Food Products (CCFP)
The CCFP operations include beef, chicken, pork, fish, dairy and egg production and processing activities which primarily supply the Zambeef and Shoprite retail chains. Whilst sales across all product lines have grown strongly during the period, with turnover increasing by 9.5 per cent. in ZMW (24.6 per cent. in USD), a slowdown in consumer spending and operational difficulties in our
dairy unit in H1 with low fertility (now resolved) resulted in CCFP gross margins falling from 23.4 per cent. to 22.0 per cent.
The Cold Chain Food Products performance is analysed in more detail below.

23
Corporategovernance
Financialstatements
Overview Strategicreport
Zambeef Products PLC Annual Report 2017
Cold Chain Food Products continuedBeef (Zambeef)Volumes in the beef category increased by 2.2 per cent. from 16.4 million kg to 16.8 million kg, and cattle slaughtered increased from 69,848 to 78,223 head. Revenue decreased by 2.5 per cent., reflecting the general fall in cattle prices. Beef margins improved with gross margin increasing from 22.8 per cent. to 24.9 per cent., principally because of a decline in cattle value. Gross profit increased by 6.8 per cent. in ZMW, from ZMW97 million to ZMW104 million. Beef remains the largest product line within the Cold Chain Food Product operations, accounting for 33.5 per cent. of turnover (2016: 37.6 per cent.).
Chicken (Zam Chick and Zamhatch)Turnover of our poultry business increased by a satisfactory 4.3 per cent. in ZMW over the prior year. The Zam Chick and Zamhatch operations account for 23.9 per cent. of turnover of the Cold Chain Food Products division, making it the second biggest part of the CCFP operations. Overall gross margins were stable at 22.1 per cent. (2016: 22.1 per cent.) as we maintained domestic and export volumes despite the strengthening of the ZMW. Gross profit increased in ZMW by 4.2 per cent., from ZMW63 million to ZMW66 million.
Zam Chick processed volumes increased by 9.2 per cent., from 10.7 million kg of chicken to 11.7 million kg. Zamhatch increased day-old chick volumes by 26.8 per cent., from 9.9 million day-old chicks to 12.6 million during the year.
During the year, we invested USD3.1 million in:• Additional broiler breeder rearing and laying housing
and additional hatchery setters to increase day old chick production from 210,000 per week to 340,000 per week during the second half of the year;
• Increasing the Huntley broiler slaughter and processing capacity by 30,000 birds per week, totalling 170,000 birds per week from June 2017.
The full benefits of these capacity improvements are expected to flow through into the CCFP business in FY2018.
Pork (Masterpork)Masterpork has shown strong growth with volumes increasing by 8.2 per cent., from 10.0 million kg to 10.8 million kg. Turnover increased by 14.0 per cent. in ZMW while gross profit increased by 58.8 per cent., from ZMW23 million to ZMW37 million. It was pleasing see gross margins in Masterpork improve from 10.9 per cent. to 15.2 per cent., although still below the divisional average margin. We will continue to seek to introduce added value products within the pork category.
Masterpork accounts for 19.6 per cent. of the Cold Chain Food Products turnover, making it the third largest product line within the Cold Chain Food Products division.
Milk and dairy (Zammilk)The milk products business has also shown strong growth, with turnover in ZMW up 37.4 per cent. and sales volumes up 35.5 per cent., from 14.8 million litres to 20.0 million litres. Despite this strong volume growth, poor fertility in our Kalundu Dairy unit led to a drop in milk output in H1, and a rise in the cost of goods as cows were culled and liquid milk was acquired from third parties to replace the shortfall in our own volumes. This has resulted in gross profits in ZMW falling by 11.2 per cent., from ZMW56 million to ZMW49 million. Gross margin in the first half declined from 45.1 per cent. to 18.4 per cent. Following a change of management in February 2017, milk output and culling rates at Kalundu Dairy have normalised, and gross margin in the second half of the year recovered to 38.9 per cent. versus 43.5 per cent. in the prior year. Zammilk accounts for 13.9 per cent. (2016: 11.1 per cent.) of the Cold Chain Food Products turnover.
Capital expenditure of USD2.1 million during the past year includes the building of a new rotary milking parlor at Kalundu Dairy as part of the continued growth of the milk production from Zambeef’s own dairy herd, and investment in extra processing capacity at the Huntley facilities, enabling us to widen the range of branded value-added yoghurt and drinking yoghurt lines produced.
FishFish is gaining popularity as a cheap source of protein. Volumes grew by 57.5 per cent. from 1.8 million kg to 2.9 million kg. Changes in product mix resulted in a 15.1 per cent. increase in ZMW turnover ,but a 24.7 per cent. decline in gross profit contribution, from ZMW14 million to ZMW11 million. Fish accounts for only 4.5 per cent. of turnover within the Cold Chain Food Products division. It is pleasing to see increasing supplies of locally produced tilapia becoming available.
Eggs (Zamegg)The egg operations, trading under the brand name Zamegg, increased volumes by 73.4 per cent. to 70 million eggs. Gross profit in ZMW decreased by 45.9 per cent., from ZMW13 million to ZMW7 million with egg prices coming down sharply in H1 due to the difficulties in Katanga Province of DRC. This resulted in large volumes of eggs, which are normally exported into DRC, being dumped in Zambia. Eggs account for only 4.6 per cent. of turnover within the Cold Chain Food Products division.

24 Zambeef Products PLC Annual Report 2017
Stock Feed (Novatek)
Revenue2017
ZMW’000
Revenue2016
ZMW’000
Gross Profit2017
ZMW’000
Gross Profit2016
ZMW’000
Overheads2017
ZMW’000
Overheads2016
ZMW’000
EBIT2017
ZMW’000
EBIT2016
ZMW’000
662,068 697,563 166,884 143,916 (50,300) (46,766) 113,613 94,377
Revenue2017
USD’000
Revenue2016
USD’000
Gross Profit2017
USD’000
Gross Profit2016
USD’000
Overheads2017
USD’000
Overheads2016
USD’000
EBIT2017
USD’000
EBIT2016
USD’000
69,545 64,410 17,530 13,289 (5,284) (4,318) 11,934 8,714
Novatek has had a record year, maintaining its market share and market leadership, with volumes increasing by 3.6 per cent. from 150,280 M.T. to 155,752 M.T. Our existing Lusaka mill has been operating at full capacity throughout the year. Unfortunately, the new Mpongwe mill only commenced operations in August 2017, some four months later than budgeted due to delays in sub-contract installation works, and therefore has only produced circa 1,600 M.T. in FY2017. Whilst margins in H1 were adversely impacted by the fall in feed prices as competitors sought to liquidate high priced 2016 old crop stocks of raw materials ahead of the new crop harvest in April/May 2017, margins recovered strongly in H2 as cheaper soya and maize raw material became available. Gross margin improved from 20.6 per cent. to 25.2 per cent. Operating profit has increased by 20.4 per cent. in ZMW from ZMW94 million
to ZMW113 million (36.9 per cent. in USD from USD8.7 million to USD11.9 million).
The new Mpongwe mill will provide an additional 120,000 M.T. of annual production capacity and is well placed to supply the Copperbelt Province, the North Western Province and the DRC markets, enabling Novatek and its customers to benefit from savings in transport costs. Novatek continues to explore new markets in the region and is now exporting to Zimbabwe, Angola, DRC, Rwanda, Kenya, Malawi and Mozambique.
Capital investment of USD2.9 million will be incurred at Mpongwe mill in FY2018 to increase bagged storage capacity and employee housing facilities and to improve road access.

25
Corporategovernance
Financialstatements
Overview Strategicreport
Zambeef Products PLC Annual Report 2017
Revenue2017
ZMW’000
Revenue2016
ZMW’000
Gross Profit2017
ZMW’000
Gross Profit2016
ZMW’000
Overheads2017
ZMW’000
Overheads2016
ZMW’000
EBIT2017
ZMW’000
EBIT2016
ZMW’000
505,738 413,391 134,556 251,860 (118,152) (112,244) (14,303) 106,833
Revenue2017
USD’000
Revenue2016
USD’000
Gross Profit2017
USD’000
Gross Profit2016
USD’000
Overheads2017
USD’000
Overheads2016
USD’000
EBIT2017
USD’000
EBIT2016
USD’000
53,124 38,171 14,134 23,256 (12,411) (10,364) (1,502) 9,865
Cropping
The Cropping division planted a summer crop of 12,005 Ha of soya, 2,416 Ha of maize and 500 Ha of silage, and a winter crop of 6,263 Ha of wheat, 997 Ha of winter maize, 78 Ha of seed maize and 193 Ha of Lucerne. The summer farming operations performed well with a record yield of soya crop averaging 3.57 M.T./Ha. The division has harvested 42,833 M.T. of soya, (2016: 39,942 M.T.) 22,172 M.T. of summer maize (2016:15,532 M.T.), and 24,073 M.T. of maize silage (2016: 27,334 M.T.). Winter wheat yields were 10.2 per cent. below budget at 6.8 M.T./Ha due to a fungal disease known as Septoria, which appears to have been more virulent this year despite implementation of our usual fungicide control programme. Wheat production was 41,750 M.T., winter maize production was 8,455 M.T., seed maize production was 306 M.T. and Lucerne production was 640 M.T. This has been a tough year for our Cropping division, with gross profit declining by ZMW117 million (USD9.1 million) from ZMW252 million to ZMW135 million (USD23.2 million to USD14.1 million) from factors largely outside of Management’s control. Firstly, global and local commodity prices declined sharply following a significant build-up of stocks in most major production areas, with international soya and maize prices touching seven year lows. Zambian soya prices dropped from USD530/M.T. at the end of March 2016 to USD360/M.T. by September 2017, and regional maize prices fell from USD225/M.T. in April 2016 to USD125/M.T. by September 2017. It should be noted that the Zambian forward market is generally illiquid, making forward hedge sales very
difficult. Secondly, costs of sales and distribution costs were impacted by circa USD1.8 million from a 30 per cent. increase in diesel fuel prices during the first half of the year, and a 50 per cent. increase in electricity costs in May 2017. Thirdly, the division experienced a shortfall in budgeted wheat yields which were 10.2 per cent. below budget due to a fungal disease, Septoria, which appears to have been more virulent this year despite implementation of our usual fungicide control programme. Fourthly, the business experienced a shortfall in the realisations from the 2016 year-end biological valuation.
Overhead expenses increased by 5.7 per cent. in ZMW, from ZMW112 million to ZMW118 million (19.7 per cent. in USD, from USD10.4 million to USD12.4 million), principally because of the strengthening of the ZMW. Replacement capital expenditure of USD3.1 million was incurred during the year.
Zambeef’s Mpongwe farming and irrigation assets are of the highest quality, enabling relatively consistent high yields to be achieved. During the year the directors of Zambeef took the decision to explore strategic options for the Chiawa and Sinazongwe farms, both of which have amenity value and climates which could permit alternative crops to be produced. Chiawa also has a valuable 2,289 Ha game conservation area and corridor. Options being considered include sale and leaseback, joint venture share farming and disposal, all with a view to reducing the overall level of long term capital employed within our Cropping Division.

26 Zambeef Products PLC Annual Report 2017
Other businesses
Flour millingThe milling operations have performed well, with flour sale volumes increasing by 22.2 per cent. as we made the decision to increase throughput in our milling operations by selling more flour through our retail network. This strategy has worked well, with retail sales in Zambeef’s own retail network increasing by 189 per cent., and representing 43 per cent. of overall flour sales (2016: 18 per cent.). Operating profit improved from ZMW15 million to ZMW18 million. Following refurbishment of one of the flour lines in FY2017, the aim is to increase flour sales further in 2018 by continuing to drive sales through Zambeef’s expanding retail network.
ZamleatherThis division has had a difficult year, with world hide prices dropping
and the market for lower grade hides being very sluggish. The number of hides processed increased by 4.3 per cent. to 101,706 hides from 97,533 last year. In addition, shoe sales increased by 10.8 per cent. from 67,746 pairs to 75,076 pairs. Gross profit in ZMW fell by 21.2 per cent. and operating profit fell from ZMW1 million to an operating loss of ZMW6 million.
Edible oilFollowing the sale of Zambeef’s edible oil operation Zamanita Ltd to Cargill in 2015, Zambeef has continued to retail edible oil through its retail network. These sales have increased during the year. However, the majority of the oil is now delivered directly into the Retail network by Cargill, hence is reflected in the Retail division,
Revenue2017
ZMW’000
Revenue2016
ZMW’000
Gross Profit2017
ZMW’000
Gross Profit2016
ZMW’000
Overheads2017
ZMW’000
Overheads2016
ZMW’000
EBIT2017
ZMW’000
EBIT2016
ZMW’000
161,387 213,964 26,774 32,391 (15,014) (13,168) 10,958 18,519
Revenue2017
USD’000
Revenue2016
USD’000
Gross Profit2017
USD’000
Gross Profit2016
USD’000
Overheads2017
USD’000
Overheads2016
USD’000
EBIT2017
USD’000
EBIT2016
USD’000
16,952 19,757 2,812 2,991 (1,577) (1,216) 1,151 1,710

27
Corporategovernance
Financialstatements
Overview Strategicreport
Zambeef Products PLC Annual Report 2017
Discontinued activities
ZampalmIn line with Group strategy of disposing of non-core activities, an agreement was signed on 6 September 2017 to sell 90 per cent. of the Group’s equity in Zampalm Limited to the Industrial Development Corporation of Zambia (“IDC”). This disposal is expected to complete by February 2018 for a cash consideration of USD16 million, with a further performance amount of up to USD2million being payable by IDC, dependent on the achievement of certain performance milestones over the three years 2018 to 2020. Proceeds from the disposal will be used to reduce debt and further strengthen the Zambeef balance sheet.
Discontinued trading losses of ZMW1.1 million (USD0.1 million)
arose during the year as 2012 planted palm started to come into production. Any gain or loss, if any, against the carrying value will be recognised in fiscal 2018 once the transaction has completed.
Going forward Zambeef’s 10per cent. equity interest in Zampalm, will be treated as an investment in an associate. Zambeef will not be required under its shareholder agreement with IDC to provide any further funding for Zampalm. We are pleased that Zambeef has been appointed by IDC to manage the Zampalm plantation on its behalf for an initial term of three years, during which time we will be assisting IDC with the launch of a smallholder out-grower scheme.

28 Zambeef Products PLC Annual Report 2017
Sustainability report
PolicyZambeef takes a sustainable ‘triple bottom line’ approach to its operations thus helping ensure a positive social, environmental and financial impact.
We believe that sustainable development is a fundamental aspect of sound business management. We are committed to providing a safe and healthy workplace, protecting the environment and being a responsible corporate citizen in the communities where we operate. This commitment is enshrined in our Environmental and Social Policy.
Continuous improvement in environ-mental and social managementZambeef continues to work towards international best practice in all aspects of its operations. We have established an Environmental and Social Committee to the Board to provide strategic advice and guidance regarding systemic and strategic environmental and social issues. We have also developed a structured Environmental and Social Action Plan (ESAP) to help ensure continuous performance improvement at
the operational level.
Zambeef has a dedicated unit of nine corporate staff to deal with environmental and social compliance and improvements to the operations. There is a complement of 18 operational level individuals dedicated to environmental and social activities across the business. In the year under review, the environmental and social team has seen the recruitment of an additional 10 staff, four added to the corporate team and the other six at operational level. These recruitments have been made to further strengthen the team in the areas of occupational health and safety, food safety, biosecurity and social performance. Environmental and social performance at operational level has been further strengthened by making each business unit head responsible and accountable for these functions in their respective divisions. The corporate team offers support to the business units. In addition, Zambeef regularly contracts other global/international consultants and specialists to supplement in-house expertise. The dedication has resulted in no penalty by the authorities for any form
of environmental violation on Zambeef’s part in the preceding four years.
Key achievements this year have included:
Asbestos management• As part of our continuing improvements
to our facilities as we work towards international standards in food safety management we required the removal of asbestos-containing material from our Masterpork site, which is undergoing renovations. Zambeef contracted a specialist consultancy to ensure safe handling, removal, transport and safe disposal in line good international industry practice.
• A dedicated group, including staff from maintenance and the environment and social compliance team, has received specialised training in the safe handling and disposal of asbestos.
Staff trainingAll operational staff have received further training in areas of occupational health and safety, food safety, etc. This is an
Zambeef takes a ‘triple bottom line’ approach to its sustainability and is committed to ensuring a positive social, environmental and economic impact.
Specialised asbestos removal team donning appropriate personal protective equipment (PPE)

29
Corporategovernance
Financialstatements
Overview Strategicreport
Zambeef Products PLC Annual Report 2017
ongoing process with the overall objective of improving the performance of the Company in these areas to international standards.
Improvements to environmental per-formance/compliance• Two new EU compliant waste
incinerators were procured and will be installed at the Masterpork and Mbala abattoirs before the end of the calendar year; this will lead to a reduction in air emissions and ensure compliance with international environmental norms. Resources have been allocated to procure more incinerator units for other Company sites.
• Further improvements are being made to the effluent treatment plant at Masterpork. Resources have also been allocated to improve effluent treatment at other Company facilities.
• A new de-watering unit has been commissioned at Zamleather to speed up the separation of solids from the effluent stream. This has significantly improved the effluent treatment process and has freed up space that was previously occupied by traditional sludge drying beds. This space will now be used to expand the chemical store, leading to better safety in chemical handling.
Social investment Zambeef aligns its social investments with the United Nations Sustainable Development Goals (UN SDGs).
SuppliersRaw material suppliersZambeef works very closely with small and medium scale farmers in every sphere of its operations. These farmers make up the majority of the Company’s suppliers of beef, chicken, pork and milk to the Cold Chain Food Products division, and maize suppliers for its Novatek stock feed operation.
Zambeef has 20 poultry out-growers who supply 70 per cent. of the slaughtered broilers. In the year under review, 215 farmers supplied 85 per cent. of the pigs slaughtered at Masterpork. 100 third party dairy farmers accounted for 46 per cent. of the raw fresh milk processed at the dairy plant. All the beef animals processed by the Company are sourced from third party suppliers, the majority (9,600 in the year under review) of them smallholder farmers. The Company also supports over 20,000 small scale farmers through purchase of maize at its Novatek stock feed plants.
New supplier support initiativesAlong with Musika, Zambeef embarked on a private scheme to provide farmers in
Mongu and the surrounding areas within Western Province with a market for their raw fresh milk.
A 1,000 litres per hour plant processing fresh raw milk from small scale farmers into fermented lacto was installed. Before this plant was commissioned, most milk from small scale farmers in the area was going to waste. These farmers are now managing to sell most of their milk to the processing facility, resulting in increased and more stable income. Extension services are being provided and milk cooling tanks have been installed nearer to farmers living in far flung areas in order to preserve the milk, resulting in reduced spoilage, consequently cutting down economic losses for these rural farmers.
A similar program, mainly focusing on increasing the cattle population and improving the health of animals, is under implementation in the Northern Province. This program is termed ‘stimulation of early stage private investment and cattle development in the agricultural markets in Northern Province’.
Zambeef has noted the vast potential of the Northern Province in terms of beef production; it therefore partnered with
Food safety training session in progress

30 Zambeef Products PLC Annual Report 2017
Sustainability report continued
Musika in order to improve and increase the cattle population in the Province. This is being done through provision of extension services, improved genetics and breeding, management of herd health, vaccinations, deworming and dipping, which is resulting in improved health, reduced mortalities and better quality animals. There are currently 317 farmers being supported through this program.
One vet (Project Manager) and three assistant vets (Livestock Scouts) have been recruited. One cattle delivery truck, one vehicle for the Project Manager and three motorcycles for the Scouts have been bought so far.
There also seven livestock centres, each equipped with improved animal handling facilities, crush pens, spray races and a mobile scale.
The Company team is supplementing
the work of the government vets in the province.
The Company also commissioned an abattoir in Mbala to ensure that a readily available market for the beef cattle exists.
This strong linkage to rural based suppliers helps fight poverty in these otherwise ‘economically excluded’ communities, meeting the aspirations of UN SDG 1: “…ending poverty in all its forms everywhere.”
Support to vulnerable communites/groups through foodstuff donationsThe Company continues to render support to the vulnerable (hospices/hospitals, or-phanages, care homes) through donation of foodstuffs. This is done on a weekly or monthly basis, for those institutions with adequate storage facilities. There are cur-rently 21 institutions hosting vulnerable people that the Company supports through its food supply program.
This gesture by the company aligns strongly with UN SDG 2: “…end hunger, achieve food security and improved nutrition.”
Support to educational and healthcare institutionsZambeef continues to fund educational and healthcare institutions. This includes those institutions like Mpongwe School and Company Clinic, wholly owned by the Company, where teachers, teaching aids, healthcare workers, equipment and facilities are fully funded by Zambeef.
The Group also supports community/government schools and healthcare institutions located in the communities where it operates. Six classrooms, an administration block and a laboratory are currently being built by the Company at Mwayasunka Secondary School located in Chibombo District.
These activities align with UN SDG 3:

31
Corporategovernance
Financialstatements
Overview Strategicreport
Zambeef Products PLC Annual Report 2017
Building a nation
“…ensure healthy lives and promote wellbeing for all at all ages” – and UN SDG 4: “...ensure inclusive and equitable quality education and promote lifelong learning opportunities for all.”
The Company also supports a number of traditional ceremonies and sporting activities.
Economic and social contributionThe Group is a significant contributor to the country’s economic activities, with a turnover in excess of 1 per cent. of national GDP.
Employment• Zambeef continues to be one of the
largest employers in the country, with over 7,200 staff, 16 per cent. of whom are female.
• Over 99.6 per cent. of employees are Zambian.
• The Group’s Cropping division provides significant employment to rural communities, where poverty levels are higher than in urban areas.
• Most of the Company’s raw material
suppliers are located in rural areas and provide employment to communities in these locations.
ReinvestmentsZambeef has a strong development re-cord, being one of the largest investors in the agricultural sector in Zambia over the last seven years, amounting to over (USD150 million).
TaxesThe Group is a significant contributor to government revenues.
Local capital marketsA significant percentage of the Group’s shareholding is owned by local institutional investors and pension funds including the National Pension Scheme Authority (NAPSA), which means every working Zambian has a stake in the Company.
Export earnings• The Group is a member of the Zambia
Development Agency’s elite Million Dollar Club of leading exporters.
• For the FYE 30 September 2017, the
Group recorded foreign exchange export income of over USD2.6 million, while total Group USD-denominated revenues were USD55 million.
Skills development• The Group is fully committed to
developing and training its employees at all levels.
• During the year, specific trainings in food safety, occupational health and safety, and safe handling of hazardous materials (asbestos, chemicals) were offered to employees.
• The Group’s continual reinvestment in human resources has resulted in many senior positions being held by Zambians.
Food securityZambeef plays a pivotal role in the national food security of Zambia, ensuring that the country has sufficient capacity to feed its growing population as well as a surplus for export to help feed neighbouring countries. The Company produced over 115,000 M.T. of grains in the year under review.

32 Zambeef Products PLC Annual Report 2017

33
Corporategovernance
Financialstatements
Overview Strategicreport
Zambeef Products PLC Annual Report 2017
Corporate governance

34 Zambeef Products PLC Annual Report 2017
Corporate governance
The Board of Directors believes that high ethical standards in the conduct of business, and a verifiable corporate governance framework of policies and procedures should be at the heart of how we do business
Zambeef values excellence in corporate governance, and the principles that enhance openness, integrity, transparency and accountability. High ethical standards in the conduct of business and a verifiable framework of corporate governance policies and procedures underpin all Zambeef’s decision making and management.
The Board of Directors believes that demonstrably good corporate governance fosters trust and confidence in the management of our business, amongst all our stakeholders.
Corporate Governance in actionThe Board has an approved Corporate Governance Code, originally issued in 2006, which is monitored for compliance on an annual basis via the Audit Committee.As a listed company, Zambeef also adheres to the LuSE Corporate Governance Code, and is in compliance with its principles and provisions. Zambeef is confident that the concepts contained within this code can be clearly demonstrated throughout its corporate governance framework, and as detailed in this statement of corporate governance.In June 2011, the Company was also admitted to the AIM Market of the London Stock Exchange, and whilst not technically required to comply with the UK Corporate Governance Code, the Board agreed to progressively adopt best practices in line with the UK Corporate Governance Code so far as it is practicable for a public company of its size, stage of development and nature quoted on AIM.
Board of DirectorsThe Board of Directors has been appointed by and is responsible to the shareholders, for the performance and direction of Zambeef through the establishment of strategic objectives and key policies, as well as approving major business decisions in accordance with its charter.The Board currently consists of twelve directors, of whom nine are non executive directors and three are executive directors. Seven non executive directors are considered to be independent.The Board believes that its overall composition is appropriate, with no individual or group dominating the decision-making process. The role of Chairman is a separate role and position from that of the Joint Chief Executive Officers. The Chairman is considered to be independent.The Board is responsible for:• Strategy and leadership – setting the
long term objectives and strategic aims;
• Values and standards – developing and monitoring the Group Code of Ethics and Conduct and the Anti Bribery and Corruption programme;
• Governance – approval of Board membership, review of corporate governance processes, Board Charter and Committees’ terms of reference, Board and Committee performance, Board and senior executive succession planning, senior executive appointments;
• Business performance – monitoring financial and business performance of the Group, approval of the annual

35
Corporategovernance
Financialstatements
Overview Strategicreport
Zambeef Products PLC Annual Report 2017
and half year financial results, interim management statements, dividend policy, monitoring executive performance;
• Representing shareholders’ interests – Shareholder and market feedback, analysis of shareholder register.
Corporate Governance in actionRisk ManagementAn effective Group Risk Assessment/Risk Management tool, based on recommended best practice and regular inputs from senior management, is formally reviewed on a quarterly basis. Formal risk assessments are carried out every quarter at Group level, as well as per company and division, in conjunction with respective General Managers. This provides the Audit Committee and directors with regular updates/mitigating action plans on all the major risks facing the Group.
Internal AuditThe dedicated and independent Internal Audit function, operating under an Internal Audit Charter, reports directly to the Audit Committee of the Board in order to maintain its independence and objectivity. It independently reviews and monitors governance processes, the risk management framework/processes, and related mitigating action plans implemented by Management. It also provides objective assurance of the operation and validity of the systems of internal control through its regular compliance audit programmes, making recommendations for improvement as required.The Board requires competitive bidding for significant purchases and contracts, above determined thresholds, through a formal Board-approved Delegations of Authority policy document that covers the Board and senior management.
Share Dealing Code The Company has adopted a share dealing code for dealings in shares by the Directors and senior employees that is appropriate for an AIM listed company.
The Directors ensure that they comply with Rule 21 of the AIM rules for Companies relating to Directors’ dealings, and take all reasonable steps to ensure compliance by the Company’s relevant employees.
Incident Reporting, Anti Bribery/Corruption, and Whistleblowing policies and procedures The Company has detailed policies and procedures covering Incident Reporting, Anti Bribery and Corruption (ABC), and Whistleblowing. The Group’s ABC programme has been formulated in conjunction with CDC Group PLC (CDC), following best international practice. It is well structured, documented and rigorously monitored. There is a dedicated internal high level Whistleblowing Manager who handles reports and complaints. These complaints can be made in various forms, including anonymously, without fear of adverse consequences. This policy has active senior management encouragement and has had widespread communication within the Group, with a verifiable and transparent process of handling complaints. This has resulted in valuable information being obtained for further action/investigation. Internal Audit closely monitors, reviews and reports on all of these policies to the Audit Committee of the Board.
Group Code of Ethics and ConductThe Company, in line with its Corporate Governance Code section on Organisational Integrity, has implemented and widely disseminated a Group Code of Ethics and Conduct to all stakeholders, including suppliers. This Code of Ethics covers the important principles and more detailed ethical guidelines with respect to responsibility, accountability, transparency, and fairness.The key aspects covered under this Code are:
Responsibility and accountability• Obedience to all laws, applicable rules
and regulations;• Honesty, accuracy and full disclosure
in all reports;
• Highest standards of service and productivity;
• Safeguarding and protection of all Zambeef’s assets and intellectual property;
• Confidentiality regarding non-public information;
• Provision of a safe and healthful work place, environmental protection in all our operations, and being a responsible corporate citizen in our communities.
Transparency• Honesty and clear communication in
all dealings;• Avoidance of conflicts of interest;• Avoidance of accepting or offering
gifts or entertainment other than per prescribed policy;
• Avoidance of all forms of criminal activity.
Fairness• Fair treatment of all stakeholders;• Personal growth and professional
development of staff;• Valuing the diversity of cultures and
beliefs;• Respect for the communities where
Zambeef is located.
Board evaluationThe Board annually carries out a self-assessment of its performance during the year, based on its Charter’s objectives, with the Company Secretary collating and reporting on the findings from each Board member.Areas covered in the self-assessment include:• Management of Board meetings and
discussions;• External and internal Board
relationships;• Skills of Board members;• Reaction to events;• Chairman;• Chairman and CEO relationships;• Attendance of and contribution in
meetings;• Open channels of communication;• Risk and Control frameworks;

36 Zambeef Products PLC Annual Report 2017
• Composition;• Terms of reference;• Committees of the Board;• Company Secretary;• Timeliness of information;• Board agenda;• AGM;• External stakeholders;• Induction and training;• Succession planning.
Board committeesThe Board has three principal standing committees led by non-executive Chairmen, each with written terms of reference. The terms of reference are per recommended best practice for AIM listed companies/ICSA, and also per requirements from co-operating partners.
Remuneration and Succession CommitteeChairman: David OsborneMembers:
Lawrence SikutwaJohn RabbYollard Kachinda
Audit CommitteeChairman: Lawrence SikutwaMembers:David OsborneMargaret Chalwe-MudendaHastings Mtine
Environmental and Social CommitteeChairman: Tim PollockMembers:Lawrence SikutwaEnala Tembo-MwaseJohn Rabb
Remuneration and Succession Committee responsibilities• To regularly review the structure, size,
knowledge, experience and diversity of the Board, as well as the sub-committees of the Board, and make
recommendations to the Board with regard to any changes.
• To be responsible for identifying, evaluating and nominating for the approval of the Board, candidates to fill Board vacancies as and when they arise.
• To give full consideration to succession planning for Directors and other senior executive management, and in particular, for the key roles of Chairman and Chief Executive Officer of the Company.
• The appointment of CEO and directors can only be made following a formal, rigorous assessment by this Committee and its formal recommendations being made to the Board, having also evaluated the balance of skills, knowledge, experience and diversity on the Board.
• To determine and agree with the Board the framework or broad policy for the remuneration of the Chief
Board Audit E&S R&S
Non-Executive A B A B A B A B
Dr. Jacob Mwanza 4 4
Dr. Lawrence Sikutwa 4 4 5 5 4 2 1 1
John Rabb 4 4 4 3 1 1
Graham Clark* 4 2 5 2 4 2 1 1
David Osborne 4 4 5 5 1 1
Tim Pollock 4 4 4 4
Yollard Kachinda # 4 1 1 0
Margaret Mudenda # 4 2 5 1
Enala Mwase # 4 2 4 2
Jonathan Kirby # 4 1
Executive
Carl Irwin 4 4
Francis Grogan 4 4
Yusuf Koya 4 4
Danny Museteka 4 4 5 5 4 4 1 1
Notes* Director left during the year# Director joined during the yearA indicates number of meetings held during the yearB indicates number of meetings attended during the year
Board engagementThe attendance by the Directors during the year was as follows:

37
Corporategovernance
Financialstatements
Overview Strategicreport
Zambeef Products PLC Annual Report 2017
Executive, the Chairman of the Board, the executive directors, the Company Secretary, and such other members of the executive management of the Group to whom the Board has extended the remit of the Committee.
• In determining the remuneration policy, take into account all factors which it deems necessary, including relevant legal and regulatory requirements, the provisions and recommendations of the UK Corporate Governance Code and associated guidance.
• The objective of such policy shall be to ensure that members of the executive management of the Group are provided with appropriate incentives to encourage enhanced performance and are, in a fair and responsible manner, rewarded for their individual contributions to the success of the Group.
• The committee ensures clear, transparent reporting of the Remuneration Committee’s agreed fees and remuneration, for both the executive directors and non executive directors, in the formal Report of the Directors in the Annual Report. This requires formal approval by the shareholders in an AGM. The Chairman ensures he is available to answer any questions/comments put forward by the shareholders in the AGM regarding directors’ fees and remuneration.
• Perform evaluations of the Board, Board Committees, respective Chairmen and non executive directors, and recommend training where necessary.
Audit Committee responsibilities• The primary role of the audit committee
is to ensure the integrity of the financial reporting and audit process, including review of the interim and annual financial statements before they are submitted to the Board for final approval.
• To ensure that a sound risk management and internal control system is maintained, as well as reviewing the system for monitoring compliance with applicable laws and regulations.
• To give due consideration and review of corporate governance matters in
accordance with relevant frameworks including the LuSE Corporate Governance Code and the UK Corporate Governance Code.
• Monitor and review the reports and function of the Internal Audit department in line with its own charter, which requires systematic evaluation of the effectiveness of risk management, control, compliance and governance processes for the Group.
• At least once a year, the members of the committee should meet the external auditors without the presence of any executive director.
• The committee should also consider and make recommendations to the Board, to be put to shareholders for approval at the Annual General Meeting, as regards the appointment and/or reappointment of the company’s external auditor.
Environmental and Social Committeeresponsibilities• Provide strategic advice and guidance
to the Board in relation to systemic and strategic Environmental and Social issues which affect the Company’s business model and strategy.
• Ensure that the Company has in place adequate and robust systems, policies and procedures for monitoring the Environmental and Social management of the Company, in accordance with applicable legislation and Good International Industry Practice (GIIP), defined by IFC Performance Standards.
• Monitor the implementation of the Environmental and Social Action Plan and any corrective action plans that may be developed in due course.
• Oversee any Company investigations relating to breaches of ES laws, regulations and standards and/or the Company’s ES policies, management systems and plans.
• Ensure good corporate citizenship through promotion of equality, prevention of unfair discrimination and reduction of corruption.
• Ensure contribution to development of the communities in which its activities are predominantly conducted, or within which its products or services
are predominantly marketed. • Monitor the ethical conduct of the
Company, its executives and senior officials.
Directors’ interests in other companiesIn compliance with Section 218 of the Companies Act of Zambia, all Directors are required to declare to the Board their interests in other companies. This is taken into account in the event that any such company enters into any contract with any Group company. The Group has a Related Parties Transactions policy which aims to ensure transparency in related party transactions, as well as identification and removal of any potential conflict of interest in such transactions.
Directors’ shareholdingsIn compliance with Section 225 of the Companies Act of Zambia all directors are required to disclose their shareholdings in the Company and any related companies. The register containing this information is available for inspection by shareholders for 14 days before the Annual General Meeting, at the meeting, and three days thereafter.
Company SecretaryThe Board appoints the Company Secretary and all Directors have access to his services. If deemed necessary, the Board may seek independent professional advice on some matters. The Company Secretary ensures the following:• Sufficient and timeous information
is provided to all the Members prior to commencement of the Board and sub-committee meetings.
• Promotion of Good Corporate Governance, and related frameworks and standards.
• Good relations and liaison with Security and Exchange Commission (SEC), the Lusaka Stock Exchange (LuSE), and Patents and Companies Registration (PACRA).
• Maintenance of statutory registers.• Key liaison for investors and contact
point for shareholders.• Board is updated on relevant statutory
amendments and developments.

38 Zambeef Products PLC Annual Report 2017
Board of Directors
Dr. Jacob Mwanza(age 81)Non-Executive ChairmanNationality: Zambian
Qualifications:PhD (Cornell University, (USA)MA Economics(W. Germany).
Experience:Over 30 years’ businessmanagementexperience, both in the public and private sectors. PreviouslyGovernor of the Bank of Zambia, currently Chancellor of the University of Zambia.
External appointmentsHas served and iscurrently serving onseveral boards, including IMF Advisory Group onSub-Sahara AfricanEconomic and SocialAffairs, PangaeaSecurities, David Shepard Foundation and Kafue Sanctuary.
Francis Grogan(age 56)Joint CEONationality: Irish
Qualifications:BSc Agriculture (Ireland).
Experience:Over 22 years’experience in agricultureand meat, both in Ireland and Zambia.Co-founder of Zambeef.
External appointmentsOther directorshipsinclude ZambeziRanching and Cropping Ltd,Fraca Meat Company Ltd and Tractorzam Ltd.
Dr. Carl Irwin(age 52)Joint CEONationality: Zambian
Qualifications:B. Com (University ofCape Town)FCA (UK)FZICA Honorary doctorate(CopperbeltUniversity).
Experience:Over 20 years’ accounting and finance experiencewith a number ofcompanies, including Coopers & Lybrand UK. Co-founder of Zambeef.
External appointmentsOther directorshipsinclude ProflightCommuter Services Ltd, Zambezi Ranching andCropping Ltd, Kanyanja Development Company Ltd, Leopard InvestmentCompany Ltd, Fraca Meat Company Ltd and Tractorzam
Margaret Chalwe-Mudenda(age 45)Non-Executive DirectorNationality: Zambian
Qualifications:LLB (University of Zambia) LLM (Southampton University, UK)Post Grad Diploma in Legislative Drafting.
Experience:Over 10 years’ legal experience across several disciplines, including investment banking and labour law. Almost 10 years’ experience in ICT and telecommunications.Previously Director General of Zambia Information and Communications Authority.
External appointmentsCurrently serving on the Boards of Madison Financial Services Plc, Medical Stores Ltd and MCK Legal Practitioners.
Prof. Enala Tembo-Mwase(age 58)Non-Executive DirectorNationality: Zambian
Qualifications:BSc Biological Sciences (University of Zambia)MSc Medical Parasitology (University of London, UK)PhD in Zoology – Entomology (University of London, UK).
Experience:Over 30 years’ research and teaching experience. Associate Professor at University of Zambia. A founding member of the Zambia Association of Women in Science and Technology. Has previously served on a number of boards and technical committees.
External appointmentsDeputy Vice Chancellor of University of Zambia (UNZA)
Yusuf Koya(age 52)Executive DirectorNationality: British
Qualifications:BSc in Geology &Economics (KeeleUniversity, UK)MSc in Economics (Keele University, UK) AIFS (UK).
Experience:Over 20 years’ businessmanagement experience in corporate finance and credit risk management,both in the UK andZambia. PreviouslyCountry Credit Director with Barclays BankZambia PLC.
External appointmentsDirector in MarhabaService Station Ltd.

39
Corporategovernance
Financialstatements
Overview Strategicreport
Zambeef Products PLC Annual Report 2017
John Rabb(age 74)Non-Executive DirectorNationality: South African
Qualifications:BSc (Agriculture)MBA (RSA).
Experience:Over 30 years’ business managementexperience. FormerlyManaging Director of the Wooltru Groupin South Africa, which was listed on the Johannesburg Stock Exchange.
External appointmentsHas served on, and is currently serving on, several boards, including Wellspring Ltd.
Yollard Kachinda(age 54)Non-Executive DirectorNationality: Zambian
Qualifications:BSc (Ed.) Mathematics and Statistics (University of Zambia) MSc Social Protection Financing (Maastricht University, Netherlands).
Experience:Over 25 years’ experience at the Zambian National Pension Scheme Authority (NAPSA), Zambeef’s biggest local shareholder.
External appointmentsDirector General of NAPSA. Currently serving on the Board of Trustees of NAPSA Lusaka Trust Hospital Staff Pension Scheme.
Dr. Lawrence Sikutwa(age 63)Non-Executive DirectorNationality: Zambian
Qualifications:MBAFCIIPost Grad Diploma in Insurance (UK).Honorary doctorate(University of Lusaka).
Experience:Over 30 years’experience in business management. Previously General Manager of Zambia State InsuranceCorporation Limited.
External appointmentsCurrently Chairman of Lawrence SikutwaAssociates Ltd Group of Companies.
Jonathan Kirby(age 55)Non-Executive DirectorNationality: South African
QualificationsBachelor of Accounting (University of the Witwatersrand, RSA)Higher Diploma in Tax Law (Rand Afrikaans University, RSA).
Experience:25 years’ experience with SABMiller. Previously SABMiller Finance Director: Africa. Appointed VP Finance for AB InBev Africa before retirement.
External appointmentsDelta Corporation (Zimbabwe)
David Osborne(age 53)Non-Executive DirectorNationality: British
Qualifications:Cambridge University;Trinity College (NaturalSciences).
Experience:Over 30 years’investment experience in private equity and infrastructure in UK,Europe, Africa and Asia. Previously Managing Partner and Head of the Islamic Infrastructure Fund at CapAsia.
External appointmentsDirector of Direct Equity Team and Head of Portfolio Management with CDC Group PLC.
Tim Pollock(age 59)Non-Executive DirectorNationality: British
Qualifications:Royal AgriculturalCollege, Cirencester(Agriculture).London Business School (Corporate Finance).
Experience:Over 30 years’management, supply chain, manufacturingand M&A experiencein agribusiness.Previously director ofStrategic Development and Operations withLallemand Inc, and CEO of Grainfarmers Group.
External appointmentsInvestment Director of Food and Agriculturewith CDC Group PLC.

40 Zambeef Products PLC Annual Report 2017
Report of the DirectorsIn compliance with Division 8.3 of the Zambian Companies Act, the Directors submit their report on the activities of the Group for the year ended 30 September 2017.
1. Principal activitiesZambeef Products PLC and its subsidiaries (“Group”) is one of the largest agribusinesses in Zambia. The Group is principally involved in the production, processing, distribution and retailing of beef, chicken, pork, milk, dairy products, eggs, edible oils, stock feed and flour. The Group also has large row cropping operations (principally maize, soya beans and wheat), with approximately 7,787 Ha of row crops under irrigation and 8,694 Ha of rain-fed/dry-land crops available for planting each year. The Group is also in the process of rolling out its West Africa expansion in Nigeria and Ghana.
2. The CompanyThe Company is incorporated and domiciled in Zambia.
Business address Postal address Plot 4970, Manda Road Private Bag 17 Industrial Area Woodlands Lusaka Lusaka ZAMBIA ZAMBIA
3. Share capitalDetails of the Company’s authorised and issued share capital are as follows:
30 September 2017 30-September 2016
ZMW'000s USD'000s ZMW'000s USD'000s
Authorised
700,000,000 ordinary shares of ZMW0.01 each 7,000 938 7,000 938
Issued and fully paid
Ordinary shares
300,579,590 of ZMW0.01 each 3,006 449 3,006 449
Preference shares – Convertible Redeemable
100,057,658 of ZMW0.01 each 1,000 100 1,000 100
4. ResultsThe Group’s results are as follows:
Group Notes
2017 2017 2016 2016
ZMW’000s USD’000s ZMW’000s USD’000s
Revenue 5 2,435,182 255,796 2,376,148 219,404
Profit/(Loss) before taxation 5,450 572 134,592 12,427
Taxation charge 10 (1,049) (110) (10,798) (997)
Profit/(loss) from discontinued operation (1,133) (119) 33,592 3,101
Group profit/(loss) for the year 3,268 343 157,386 14,531
Group profit/(loss) attributable to:
Equity holders of the parent 4,037 424 137,103 12,659
Non-controlling interest (769) (81) 20,283 1,872
3,268 343 157,386 14,531

41
Corporategovernance
Financialstatements
Overview Strategicreport
Zambeef Products PLC Annual Report 2017
5. DividendsThere has been no dividend proposed for the year ended 30 September 2017 (2016: ZMW nil).
6. ManagementThe senior management currently comprises:Francis Grogan - Joint Chief Executive Officer Carl Irwin - Joint Chief Executive OfficerYusuf Koya - Executive DirectorCraig Harris - Chief Financial OfficerDanny Museteka - Company SecretaryMike Lovett - General Manager Farming DivisionFelix Lupindula - Corporate Affairs and General Manager - Zambeef RetailingPravin Abraham - Chief Internal AuditorEbrahim Israel - General Manager – International RetailingMurray Moore - General Manager – Beef and DairyDavid Mynhardt - General Manager – Sinazongwe FarmRobert Hoskins Davies - General Manager – Chiawa Farm Francis Mondomona - General Manager – Huntley Farm Richard Franklin - General Manager – Zamleather LimitedWalter Roodt - General Manager – Stock FeedHarry Hayden-Payne - General Manager – Zampalm LimitedWillem Abraham Vorster - General Manager – DairyWebster Mapulanga - General Manager – Masterpork LimitedTheo de Lange - Group Technical ManagerBartholomew Mbao - Dairy Processing ManagerAndries Van Rensburg - Piggery ManagerSamson Lungu - Flour Mill ManagerCharles Milupi - Poultry ManagerIvor Chilufya - Group Financial ControllerJustin Rust - Commercial ManagerBasil Webber - Commercial ManagerChristiaan Engelbrecht - Commercial Manager Niyaas Dalal - Finance Manager – Zambeef Products Plc, Zam Chick LimitedRory Park - Finance Manager – Masterpork Limited, Zampalm Limited, Zamhatch LimitedSimon Nkhata - Finance Manager – Zambeef Retailing LimitedBaron Chisola - Financial Controller – Group InventoryShadreck Banda - Financial Controller – Group SuppliersGbenga Ibitoye - Financial Controller – West AfricaSamantha Dale - Group Head – Debtors and Credit ControlAnthony Seno - Head of ITGuy Changole - Head of Human ResourcesMathews Mbasela - Head of Payroll ProcessingEddie Tembo - Chief Security ManagerJones Kayawe - Head of Environment, Health and SafetyField Musongole - Maintenance Manager Justo Kopulande - CSR/PR ManagerErnest Gondwe - Regional Manager – Shoprite & Excellent MeatsFrancis Mulenga - Regional Manager – ShopriteNoel Chola - Regional Manager – ShopriteRodgers Chinkuli - Regional Manager – Zambeef Outlets Deon Conradie - Managing Director – Master Meats NigeriaHillary Anderson - National Retail Manager – NigeriaLufeyo Nkhoma - General Manager – Master Meats GhanaClement Mulenga - General Manager – Master Meats Nigeria

42 Zambeef Products PLC Annual Report 2017
Report of the Directors continued7. Directors and SecretaryThe Directors in office at the financial period and at the date of this report were as follows:Dr. Jacob Mwanza - ChairmanDr. Lawrence S. SikutwaJohn RabbGraham Clark - Resigned on March 7, 2017David Osborne Timothy Pollock Yollard Kachinda - Appointed on April 18, 2017Margaret Mudenda - Appointed on April 18, 2017Enala Mwase - Appointed on April 18, 2017Jonathan Kirby - Appointed on August 3, 2017Francis Grogan - Joint Chief Executive OfficerDr. Carl Irwin - Joint Chief Executive OfficerYusuf Koya - Executive Director Danny Museteka - Company Secretary
8. Directors’ InterestsThe Directors held the following interests in the Company’s ordinary shares at the reporting date:
30 September 2017 30-September-16
Direct Indirect Direct Indirect
Jacob Mwanza (Dr) 1,100,000 - 1,100,000 -
Carl Irwin (Dr) 3,763 5,406,445 3,763 5,406,445
Francis Grogan 995,000 3,596,631 995,000 4,591,631
John Rabb - 14,000,000 - 12,000,000
Yusuf Koya 245,482 - 245,482 -
2,344,245 23,003,076 2,344,245 21,998,076 9. Directors’ fees and remunerationThe Remuneration Committee has agreed the following gross annual packages.
Salary BonusCar
AllowanceAir Fares
Allowance Medicals
Long Term Incentive
Plan 2 (Shares)
ZMW
NON-EXECUTIVE
Jacob Mwanza 822,108.12 - - - -
John Rabb 309,360.34 - - - -
Yollard Kachinda 129,751.13 - - - -
Enala Mwase 129,308.50 - - - -
Margaret Mudenda 129,308.50
Lawrence Sikutwa 360,921.50
Jonathan Kirby 52,389.06
Graham Clark 179,885.68 - - - -
EXECUTIVE
Carl Irwin 3,167,502.72 5,000 Company Car 460,800 Yes 6,250,000
Francis Grogan 3,002,736.25 5,000 Company Car 460,800 Yes 6,250,000
Yusuf Koya 3,343,653.82 5,000 - 384,000 Yes 275,000
Danny Museteka 2,629,293.46 267,517.88 - 384,000 Yes 275,000

43
Corporategovernance
Financialstatements
Overview Strategicreport
Zambeef Products PLC Annual Report 2017
Further, the Board co-opted Mr. Hastings Mtine into the Audit Committee as an expert advisor. Mr. Mtine’s remuneration is ZMW4.6 thousand per sitting and ZMW12 thousand for any special projects and advisory services.
9. Directors fees and remuneration (continued)In addition to the above, all Executive Directors are entitled to a gratuity of 10 per cent. of their gross basic salary paid over the contract term, less statutory deductions for tax.
The Long-Term Incentive Plan 2 (“LTIP 2”) has the following key terms/conditions:
(a) Structure: market value option shares (“Options”);(b) Exercise price: 15 pence;(c) Maximum shares: The annual award base value (number of shares multiplied by the share price on the date of grant plus number of Options multiplied by the exercise price) may not exceed three times the Executive’s base salary; (this term/ condition does not apply to the two Joint CEOs under the JCEO LTIP Scheme).(d) Vesting period: three years from 2015 to 2018; exercisable from June 2018.(e) The Options can only be exercised if Zambeef achieves the following targets:
(i) If the share price reaches 40 pence, then 25 per cent. of the Options become exercisable.(ii) If the share price reaches 48 pence, a further 25 per cent. of the Options become exercisable.(iii) If the share price reaches 56 pence, a further 25 per cent. of the Options become exercisable.(iv) If the share price reaches 65 pence, the final 25 per cent. of the Options become exercisable.(v) Zambeef achieving a debt-to-equity (gearing) ratio of less than 35 per cent. in the audited accounts immediately prior to exercising the Options.(vi) Zambeef achieving a current ratio (current assets divided by current liabilities) of 1.5 or higher in the audited annual accounts immediately prior to the exercising of the Options.(vii) Zambeef generating free cash flows.(viii) The Zambeef share price triggers set above will be considered achieved if in the 14 days immediately prior to exercising the Options, the shares have traded continuously at not less than these prices for 14 days.(ix) The Options will be exercisable at any time for 2 years after the 3-year period from the issue of the Options have lapsed.(x) The Options can only be exercised if the relevant executives are still employed by the Company.
10. Significant ShareholdingsAs at 30 September 2017, the Company has been advised of the following notable interests in its ordinary share capital:
Investor NameCurrent Position
% of Shareholding
CDC Group Plc 52,601,435 17.5%
M & G Investment Management 46,304,408 15.4%
National Pension Scheme Authority (Zambia) 24,979,819 8.3%
Rhodora 22,797,537 7.6%
Africa Life 15,530,053 5.2%
Sussex Trust 14,000,000 4.7%
Miton Asset Management 9,608,437 3.2%
Artio Global Investors 9,360,000 3.1%
CDC Group Plc are also the holders of 100,057,658 convertible redeemable preference shares. These shares have three voting rights for every four preference shares held resulting in CDC having 34.8% of the voting rights.

44 Zambeef Products PLC Annual Report 2017
11. EmployeesThe Group employed an average of 7,068 (30 September 2016 – 6,253) employees and total salaries and wages were ZMW357 million (USD28.3 million) for the year ended 30 September 2017 (30 September 2016 – ZMW307 million [USD37.5 million]).
The average number of persons employed by the Group in each month of the financial year is as follows:
Oct-16 Nov-16 Dec-16 Jan-17 Feb-17 Mar-17 Apr-17 May-17 Jun-17 Jul-17 Aug-17 Sep-17
Headcount 6,754 6,900 7,023 6,826 6,756 6,861 7,037 7,085 7,364 7,535 7,411 7,267
12. Safety, Health and Environmental issuesAs part of some of the Group’s term loans, as well as the CDC Group PLC equity investment, the Group has signed up to an Environmental and Social Action Plan (“ESAP”), which requires the Group to meet both local Zambian standards as well as international standards relating to the environment, food safety, health and safety and social responsibility. The Group provides education and healthcare services to its employees. The Group also supports various community activities in the areas that it operates from.
13. Legal mattersThere are no significant legal or arbitration proceedings (including to the knowledge of the Directors, any such proceedings which are pending or threatened, by or against the Company or any subsidiary of the Group) which may have or have had during the 12 months immediately preceding the date of this document a significant effect on the financial position or profitability of the Company or any member of the Group.
14. Gifts and donationsThe Group made donations of ZMW2 million (USD0.2 million) (30 September 2016: ZMW2.2 million [USD0.2 million]) to a number of activities.
15. Export salesThe Group made exports of ZMW24.5 million (USD2.6 million) during the period (30 September 2016: ZMW90.7 million [USD8.6 million]).
16. Property, plant and equipmentAssets totalling ZMW209.4 million (USD22 million) were purchased by the Group during the period (30 September 2016 – ZMW178.8 million [USD16.5 million]) which included expenditure on the palm plantation development during the period of ZMW13.8 million (USD1.5 million) (30 September 2016 – ZMW12.2 million [USD1.1 million]).
17. Other material facts, circumstances and eventsThe directors are not aware of any material fact, circumstance or event which occurred between the accounting date and the date of this report which might influence an assessment of the Group’s financial position or the results of its operations.
18. Events since the Year-EndThere have been no significant events affecting the Group since the year-end.
19. Annual financial statementsThe annual financial statements set out on pages 53 to 117 have been approved by the directors.
20. AuditorIn accordance with the provisions of section 171(3) of the Zambian Companies Act, the auditors, Messrs Grant Thornton, will retire as auditors of the Company at the forthcoming Annual General Meeting, and having expressed their willingness to continue in office a resolution for their re-appointment will be proposed at the Annual General Meeting.
By order of the BoardDanny Shaba Museteka
Company SecretaryDate: 14 November 2017
Report of the Directors continued

45
Corporategovernance
Financialstatements
Overview Strategicreport
Zambeef Products PLC Annual Report 2017
Section 164 of the Zambian Companies Act 1994 requires the Directors to prepare financial statements for each financial year which give a true and fair view of the financial position of Zambeef Products PLC and its subsidiaries and of its financial performance and its cash flows for the year then ended. In preparing such financial statements, the directors are responsible for:• designing, implementing and maintaining internal control relevant to the preparation and fair presentation of financial statements
that are free from material misstatement whether due to fraud or error;• selecting appropriate accounting policies and applying them consistently;• making judgements and accounting estimates that are reasonable in the circumstances; and• preparing the financial statements in accordance with the applicable financial reporting framework, and on the going concern basis
unless it is inappropriate to presume that the Group will continue in business.
The Directors are responsible for keeping proper accounting records which disclose with reasonable accuracy at any time the financial position of the Group and enable them to ensure that the financial statements comply with the Zambian Companies Act 1994. They are also responsible for safeguarding the assets of the Group and hence for taking reasonable steps for the prevention and detection of fraud and other irregularities.
The Board of Directors confirm that in their opinion:(a) the financial statements give a true and fair view of the financial position of Zambeef Products PLC and its subsidiaries as at 30
September 2017, and of its financial performance and its cash flows for the year then ended;(b) at the date of this statement there are reasonable grounds to believe that the Group will be able to pay its debts as and when these
fall due; and(c) the financial statements are drawn up in accordance with the provisions of the second schedule to section 164 of the Companies
Act and International Financial Reporting Standards.
This statement is made in accordance with a resolution of the Directors.
Signed at Lusaka on 14 November 2017
Dr. Jacob Mwanza Carl IrwinChairman Joint Chief Executive Officer
Statement Of Directors’ Responsibilities

46 Zambeef Products PLC Annual Report 2017
Approval of annual financial statements
Annual compliance certificate
The annual financial statements that appear on pages 53 to 117 were approved by the Board of Directors on 14 November 2017 andsigned on its behalf by:
Pursuant to the requirements of schedule 18 to the rules of the Lusaka Stock Exchange, I the undersigned Danny Museteka being the duly appointed and registered Secretary certify to the Lusaka Stock Exchange that Zambeef Products Plc has during the twelve months ended 30 September 2017, complied with every disclosure requirement for continued listing on the Lusaka Stock Exchange imposed by the Board of the Exchange during that period.In addition, I hereby confirm that for the year ended 30 September 2017, the Company has lodged with the Registrar of Companies all such returns as are required by a public company in terms of the Zambian Companies Act 1994 and that all such returns are true and correct.
Dr. Jacob MwanzaChairman
Signed in Lusaka on 14 November 2017
Dr. Carl IrwinJoint CEO
Danny MusetekaCompany Secretary14 November 2017

47
Corporategovernance
Financialstatements
Overview Strategicreport
Zambeef Products PLC Annual Report 2017

48 Zambeef Products PLC Annual Report 2015

49
Corporategovernance
Financialstatements
Overview Strategicreport
Zambeef Products PLC Annual Report 2017
Financialstatements

50 Zambeef Products PLC Annual Report 2017
Report of the Independent Auditors to the Members of Zambeef Products PLC and its Subsidiaries
Opinion We have audited the financial statements of Zambeef Products and its subsidiaries (the group), which comprise the statements of financial position as at 30 September 2017, and the statements of comprehensive income, statements of changes in equity and statements of cash flows for the year then ended, and notes to the financial statements, including a summary of significant accounting policies.
In our opinion, the accompanying financial statements or give a true and fair view of the financial position of the group as at 30 September 2017, and of its financial performance and its cash flows for the year then ended in accordance with International
Financial Reporting Standards (IFRSs).
Basis for Opinion We conducted our audit in accordance with International Standards on Auditing (ISAs). Our responsibilities under those standards are further described in the Auditor’s Responsibilities for the Audit of the Financial Statements section of our report. We are independent of the Company in accordance with the ethical requirements that are relevant to our audit of the financial statements in Zambia, and we have fulfilled our other ethical responsibilities in accordance with these requirements. We believe that the audit evidence we have obtained is sufficient and appropriate to provide a basis for our opinion.
Key Audit Matters Key audit matters are those matters that, in our professional judgment, were of most significance in our audit of the financial statements of the current period. These matters were addressed in the context of our audit of the financial statements as a whole, and in forming our opinion thereon, and we do not provide a separate opinion on these matters.
Key Audit Matters During the year, the group’s property, plant and equipment was revalued and a revaluation surplus of K790 million (USD82 million) has been included in these financial statements.
The investent in Zampalm Limited included in the financial statements at K220 million (USD23 million). This asset has been presented as held for sale in these financial statements.
The group breached the debt service coverage ratio, interest bearing debt/EBITDA ratio and net financial debt/EBITDA ratio covenants with some lenders.
How the matter was addressed in our reportWe relied on the report of the external expert that the group engaged to carry out the revaluation exercise.
We relied on the report of the external expert that the group engaged to carry out a valuation of this unit. The valuation was higher than the value included in the financial statements.
We reviewed the waivers that the group received from its lenders after the year end in respect of these covenant breaches. None of the group’s borrowing facilities have been rescinded of materially altered.
Responsibilities of Management and Those Charged with Governance for the Financial StatementsManagement is responsible for the preparation and fair presentation of the financial statements in accordance with IFRSs,
and for such internal control as management determines is necessary to enable the preparation of financial statements that are free from material misstatement, whether due to fraud or error.
In preparing the financial statements, management is responsible for assessing the group’s ability to continue as a going concern, disclosing, as applicable, matters related to going concern and using the going concern basis of accounting unless management either intends to liquidate the group or to cease operations, or has no realistic alternative but to do so.
Those charged with governance are responsible for overseeing the group’s financial reporting process.
Auditor’s Responsibilities for the Audit of the Financial Statements Our objectives are to obtain reasonable assurance about whether the financial statements as a whole are free from material misstatement, whether due to fraud or error, and to issue an auditor’s report that includes our opinion. Reasonable assurance is a high level of assurance, but is not a guarantee that an audit conducted in accordance with ISAs will always detect a material misstatement when it exists. Misstatements can arise from fraud or error and are considered material if, individually or in the aggregate, they could reasonably be expected to influence the economic decisions of users taken on the basis of these financial statements.
Responsibilities of Management and Those Charged with Governance for the Financial StatementsManagement is responsible for the preparation and fair

51
Corporategovernance
Financialstatements
Overview Strategicreport
Zambeef Products PLC Annual Report 2017
presentation of the financial statements in accordance with IFRSs, and for such internal control as management determines is necessary to enable the preparation of financial statements that are free from material misstatement, whether due to fraud or error.
In preparing the financial statements, management is responsible for assessing the group’s ability to continue as a going concern,
disclosing, as applicable, matters related to going concern and using the going concern basis of accounting unless management either intends to liquidate the group or to cease operations, or has no realistic alternative but to do so.
Those charged with governance are responsible for overseeing the group’s financial reporting process.
Auditor’s Responsibilities for the Audit of the Financial Statements Our objectives are to obtain reasonable assurance about whether the financial statements as a whole are free from material misstatement, whether due to fraud or error, and to issue an auditor’s report that includes our opinion. Reasonable assurance is a high level of assurance, but is not a guarantee that an audit conducted in accordance with ISAs will always detect a material misstatement when it exists. Misstatements can arise from fraud or error and are considered material if, individually or in the aggregate, they could reasonably be expected to influence the economic decisions of users taken on the basis of these financial statements. Responsibilities of Management and Those Charged with Governance for the Financial StatementsManagement is responsible for the preparation and fair presentation of the financial statements in accordance with IFRSs, and for such internal control as management determines is necessary to enable the preparation of financial statements that are free from material misstatement, whether due to fraud or error.
In preparing the financial statements, management is responsible for assessing the group’s ability to continue as a going concern, disclosing, as applicable, matters related to going concern and using the going concern basis of accounting unless management either intends to liquidate the group or to cease operations, or has no realistic alternative but to do so.
Those charged with governance are responsible for overseeing the group’s financial reporting process.
Auditor’s Responsibilities for the Audit of the Financial Statements Our objectives are to obtain reasonable assurance about whether the financial statements as a whole are free from material
misstatement, whether due to fraud or error, and to issue an auditor’s report that includes our opinion. Reasonable assurance is a high level of assurance, but is not a guarantee that an audit conducted in accordance with ISAs will always detect a material misstatement when it exists. Misstatements can arise from fraud or error and are considered material if, individually or in the aggregate, they could reasonably be expected to influence the economic decisions of users taken on the basis of these financial statements.
As part of an audit in accordance with ISAs, we exercise professional judgment and maintain professional skepticism throughout the audit. We also:
• Identify and assess the risks of material misstatement of the financial statements, whether due to fraud or error, design and perform audit procedures responsive to those risks, and obtain audit evidence that is sufficient and appropriate to provide a basis for our opinion. The risk of not detecting a material misstatement resulting from fraud is higher than for one resulting from error, as fraud may involve collusion, forgery, intentional omissions, misrepresentations, or the override of internal control.
• Obtain an understanding of internal control relevant to the audit in order to design audit procedures that are appropriate in the circumstances, but not for the purpose of expressing an opinion on the effectiveness of the group’s internal control.
• Evaluate the appropriateness of accounting policies used and the reasonableness of accounting estimates and related disclosures made by management.
• Conclude on the appropriateness of management’s use of
the going concern basis of accounting and, based on the audit evidence obtained, whether a material uncertainty exists related to events or conditions that may cast significant doubt on the group’s ability to continue as a going concern. If we conclude that a material uncertainty exists, we are required to draw attention in our auditor’s report to the related disclosures in the financial statements or, if such disclosures are inadequate, to modify our opinion. Our conclusions are based on the audit evidence obtained up to the date of our auditor’s report. However, future events or conditions may cause the group to cease to continue as a going concern.
• Evaluate the overall presentation, structure and content of the financial statements, including the disclosures, and whether the financial statements represent the underlying transactions and events in a manner that achieves fair presentation.
We communicate with those charged with governance regarding,

52 Zambeef Products PLC Annual Report 2017
among other matters, the planned scope and timing of the audit and significant audit findings, including any significant deficiencies in internal control that we identify during our audit.
We also provide those charged with governance with a statement that we have complied with relevant ethical requirements regarding independence, and to communicate with them all relationships and other matters that may reasonably be thought to bear on our independence, and where applicable, related safeguards.
From the matters communicated with those charged with governance, we determine those matters that were of most significance in the audit of the financial statements of the current period and are therefore the key audit matters. We describe these matters in our auditor’s report unless law or regulation precludes public disclosure about the matter or when, in extremely rare circumstances, we determine that a matter should not be communicated in our report because the adverse consequences of doing so would reasonably be expected to outweigh the public interest benefits of such communication.
Report on Other Legal and Regulatory RequirementsIn our opinion, the financial statements of Zambeef Products PLC and its subsidiaries as at 30 September 2016 have been properly prepared in accordance with the Zambian Companies Act 1994, and the accounting and other records and registers have been properly kept in accordance with the Act.
Grant Thorton
Chartered Accountants
Christopher Mulenga (AUD/F000178)Name of Partner signing on behalf of the firm
Lusaka
Date: 14 November 2017

53
Corporategovernance
Financialstatements
Overview Strategicreport
Zambeef Products PLC Annual Report 2017
Consolidated Statement of Comprehensive IncomeFor the year ended 30 September 2017
Group Notes 2017 2017 2016 2016
ZMW’000s USD’000s ZMW’000s USD’000s
Revenue 5 2,435,182 255,796 2,376,148 219,404
Net gain/(loss) arising from price changes in fair value of biological assets 16 (3,491) (367) 13,257 1,224
Cost of sales (1,633,060) (171,540) (1,513,459) (139,747)
Gross profit 798,631 83,890 875,946 80,881
Administrative expenses (714,746) (75,078) (690,047) (63,716)
Other income 6 2,768 291 1,694 156
Operating profit 7 86,653 9,102 187,593 17,321
Exchange gains/(losses) on translating foreign currency transactions and balances 6,701 704 58,345 5,387
Finance costs 9 (87,904) (9,234) (111,346) (10,281)
Profit/(loss) before taxation 5,450 572 134,592 12,427
Taxation charge 10 (1,049) (110) (10,798) (997)
Group income/(loss) for the year from continuing operations 4,401 462 123,794 11,430
Profit/(loss) from discontinued operations 33 (1,133) (119) 33,592 3,101
Group income/(loss) for the year 3,268 343 157,386 14,531
Group income/(loss) attributable to:
Equity holders of the parent 4,037 424 137,103 12,659
Non-controlling interest (769) (81) 20,283 1,872
3,268 343 157,386 14,531
Other comprehensive income:
Exchange (losses) /gains on translating presentational currency (31,190) 4,243 (86,511) 16,909
Total comprehensive (loss)/income for the year (27,922) 4,586 70,875 31,440
Total comprehensive (loss)/income for the year attributable to:
Equity holders of the parent (27,257) 4,681 52,292 29,473
Non-controlling interest (665) (95) 18,583 1,967
(27,922) 4,586 70,875 31,440
Ngwee Cents Ngwee Cents
Earnings per share
Basic earnings per share – continued operations 12 1.72 0.18 41.38 3.82
Basic earnings per share – discontinued operations 12 (0.38) (0.04) 13.42 1.24
Total Basic earnings per share 12 1.34 0.14 54.80 5.06

54 Zambeef Products PLC Annual Report 2017
Consolidated Statement of Changes in EquityFor the year ended 30 September 2017
(i) In Zambian Kwacha
Issued share
capitalZMW’000s
Sharepremium
ZMW’000s
Preference share
capital ZMW’000s
Foreign exchange
reserve ZMW’000s
Revaluation reserve
ZMW’000s
Retained earnings
ZMW’000s
Total attributable to owners of
the parentZMW’000s
Non- controlling
interestZMW’000s
Total equity
ZMW’000s
At 1 October 2015 2,480 506,277 - 188,332 504,671 239,449 1,441,209 34,083 1,475,292
Profit for the year - - - - - 137,103 137,103 20,283 157,386
Transfer of surplus depreciation - - - - (18,906) 18,906 - - -
Other comprehensive income:
Exchange losses on translating presentational currency
- - - (84,811) - - (84,811) (1,700) (86,511)
Total comprehensive income
- - - (84,811) (18,906) 156,009 52,292 18,583 70,875
Transactions with owners
Non-controlling interest shares acquired
- - - - - 22,177 22,177 (60,282) (38,105)
Shares issued 526 618,735 1,000 - - 620,261 - 620,261
Total Transactions with owners 526 618,735 1,000 - - 22,177 642,438 (60,282) 582,156
At 30 September 2016 3,006 1,125,012 1,000 103,521 485,765 417,635 2,135,939 (7,616) 2,128,323
Profit for the year - - -- - - 4,037 4,037 (769) 3,268
Transfer of surplus depreciation - - - - (23,418) 23,418 - - -
Other comprehensive income:
Exchange (loss)gain on translating presentational currency
- - - (31,294) - - (31,294) 104 (31,190)
Revaluation - - - - 789,795 - 789,795 - 789,795
Total comprehensive income - - - (31,294) 766,377 27,455 762,538 (665) 761,873
At 30 September 2017 3,006 1,125,012 1,000 72,227 1,252,142 445,090 2,898,477 (8,281) 2,890,196
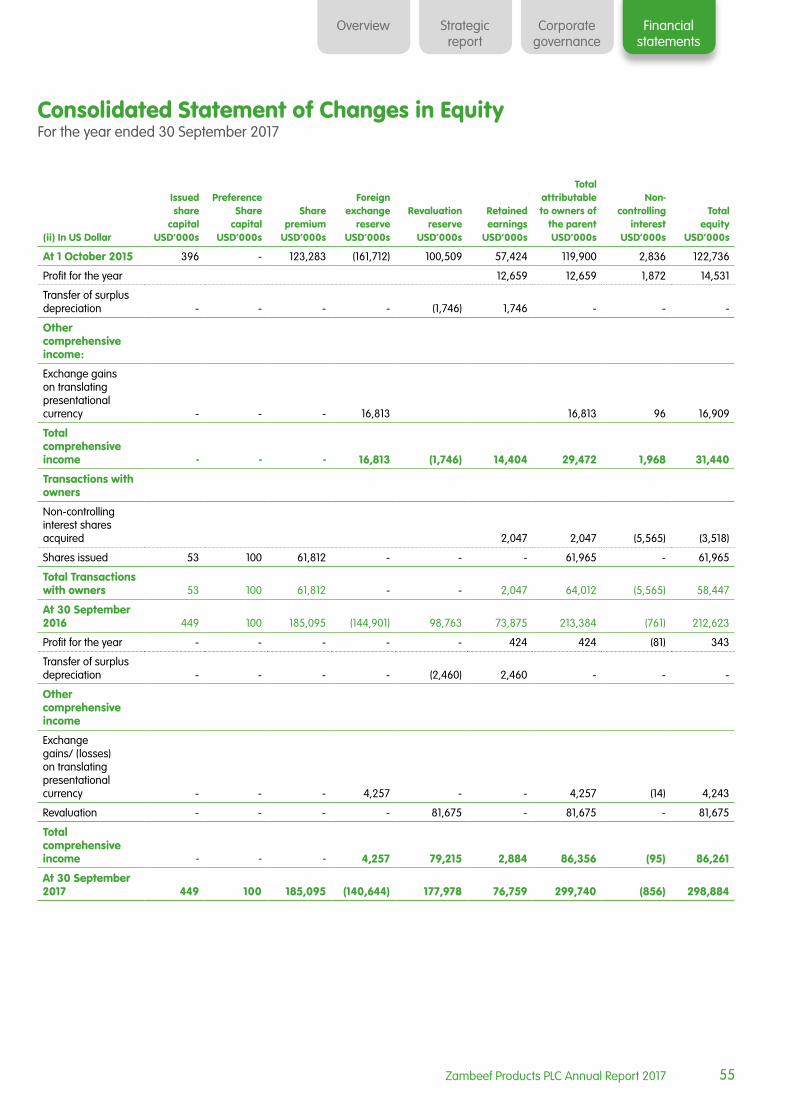
55
Corporategovernance
Financialstatements
Overview Strategicreport
Zambeef Products PLC Annual Report 2017
(ii) In US Dollar
Issued share
capitalUSD’000s
Preference Share
capitalUSD’000s
Share premium
USD’000s
Foreign exchange
reserve USD’000s
Revaluation reserve
USD’000s
Retained earnings
USD’000s
Total attributable to owners of
the parent USD’000s
Non- controlling
interestUSD’000s
Total equity
USD’000s
At 1 October 2015 396 - 123,283 (161,712) 100,509 57,424 119,900 2,836 122,736
Profit for the year 12,659 12,659 1,872 14,531
Transfer of surplus depreciation - - - - (1,746) 1,746 - - -
Other comprehensive income:
Exchange gains on translating presentational currency - - - 16,813 16,813 96 16,909
Total comprehensive income - - - 16,813 (1,746) 14,404 29,472 1,968 31,440
Transactions with owners
Non-controlling interest shares acquired 2,047 2,047 (5,565) (3,518)
Shares issued 53 100 61,812 - - - 61,965 - 61,965
Total Transactions with owners 53 100 61,812 - - 2,047 64,012 (5,565) 58,447
At 30 September 2016 449 100 185,095 (144,901) 98,763 73,875 213,384 (761) 212,623
Profit for the year - - - - - 424 424 (81) 343
Transfer of surplus depreciation - - - - (2,460) 2,460 - - -
Other comprehensive income
Exchange gains/ (losses) on translating presentational currency - - - 4,257 - - 4,257 (14) 4,243
Revaluation - - - - 81,675 - 81,675 - 81,675
Total comprehensive income - - - 4,257 79,215 2,884 86,356 (95) 86,261
At 30 September 2017 449 100 185,095 (140,644) 177,978 76,759 299,740 (856) 298,884
Consolidated Statement of Changes in EquityFor the year ended 30 September 2017

56 Zambeef Products PLC Annual Report 2017
Company Statement of Changes in EquityFor the year ended 30 September 2017
(i) In Zambian Kwacha
Issued share capital
ZMW’000s
Preference share
capital ZMW’000s
Share premium
ZMW’000s
Revaluation reserve
ZMW’000s
Retained earnings
ZMW’000sTotal equityZMW’000s
At 1 October 2015 2,480 - 506,277 297,712 469,967 1,276,436
Profit for the year - - - - 91,377 91,377
Transfer of surplus depreciation - - - (16,731) 16,731 -
Other comprehensive income
Exchange gains on translating presentational currency - - - - (73,394) (73,394)
Total comprehensive income - - - (16,731) 34,714 17,983
Shares issued 526 1,000 618,735 - - 620,261
Total transactions with owners 526 1,000 618,735 - - 620,261
At 30 September 2016 3,006 1,000 1,125,012 280,981 504,681 1,914,680
Profit for the year - - - - 24,003 24,003
Transfer of surplus depreciation (14,605) 14,605
Other comprehensive income:
Surplus on revaluation - - - 651,521 - 651,521
Exchange gains on translating presentational currency - - - - (31,682) (31,682)
Total comprehensive income - - - 636,916 6,926 643,842
At 30 September 2017 3,006 1,000 1,125,012 917,897 511,607 2,558,522

57
Corporategovernance
Financialstatements
Overview Strategicreport
Zambeef Products PLC Annual Report 2017
(ii) In US Dollars
Issued share capital
USD’000s
Preference share
capital USD’000s
Share premium
USD’000s
Revaluation reserve
USD’000s
Foreign exchange
reserve USD’000s
Retained earnings
USD’000sTotal equity
USD’000s
At 1 October 2015 396 - 123,283 56,533 (137,414) 63,394 106,192
Profit for the year - - - - - 8,439 8,439
Transfer of surplus depreciation - - - (2,370) 2,370 -
Other comprehensive income:
Exchange losses on translating presentational currency - - - - 14,708 - 14,708
Total comprehensive income - - - (2,370) 14,708 10,809 23,147
Transactions with owners
Shares issued 53 100 61,812 - - - 61,965
Total transactions with owners 53 100 61,812 - - - 61,965
At 30 September 2016 449 100 185,095 54,163 (122,706) 74,203 191,304
Profit for the year - - - - - 2,522 2,522
Transfer of surplus depreciation - - - - -
Other comprehensive income:
Surplus on revaluation - - - 68,437 - - 68,437
Exchange losses on translating presentational currency - - - - 2,321 - 2,321
Total comprehensive income - - - 68,437 2,321 2,522 73,280
At 30 September 2017 449 100 185,095 122,600 (120,385) 76,725 264,584
Company Statement of Changes in EquityFor the year ended 30 September 2017

58 Zambeef Products PLC Annual Report 2017
Consolidated Statement of Financial PositionFor the year ended 30 September 2017
2017 2017 2016 2016
ASSETS Notes ZMW’000s USD’000s ZMW’000s USD’000s
Non-current assets
Goodwill 13 166,801 17,249 157,922 15,776
Property, plant and equipment 14 2.610,488 269,958 1,769,966 176,820
Plantation development expenditure 14 - - 94,302 9,421
Assets held for disposal 33 221,087 22,863 - -
Biological assets 16 - - 48,480 4,843
Deferred tax asset 10(e) 43,368 4,485 28,366 2,834
3,041,745 314,555 2,099,036 209,694
Current assets
Biological assets 16 167,857 17,359 187,026 18,684
Inventories 17 516,418 53,404 544,739 54,419
Trade and other receivables 18 90,792 9,390 113,151 11,304
Assets held for disposal 33 91 9 - -
Amounts due from related companies 19 11,422 1,181 10,543 1,053
Income tax recoverable 10(c) 1,376 142 1,759 176
Cash and cash equivalents 20 - - 64,806 6,474
787,956 81,485 922,024 92,110
Total assets 3,829,701 396,040 3,021,060 301,804
EQUITY AND LIABILITIES
Capital and reserves
Share capital 21 3,006 449 3,006 449
Preference share capital 21 100 100 1,000 100
Share premium 22 1,125,012 185,095 1,125,012 185,095
Other reserves 1,769,459 114,096 1,006,921 27,740
2,898,477 299,740 2,135,939 213,384
Non-controlling interest (8,281) (856) (7,616) (761)
2,890,196 298,884 2,128,323 212,623

59
Corporategovernance
Financialstatements
Overview Strategicreport
Zambeef Products PLC Annual Report 2017
Dr. Jacob Mwanza Chairman
Carl IrwinJoint Chief Executive Officer
Consolidated Statement of Financial PositionFor the year ended 30 September 2017
Non-current liabilities
Interest bearing liabilities 23 328,238 33,944 261,734 26,147
Obligations under finance leases 24 27,915 2,887 31,485 3,145
Deferred liability 25 16,756 1,733 10,442 1,043
Deferred tax liability 10(e) 7,212 746 4,039 403
380,121 39,310 307,700 30,738
Current liabilities
Interest bearing liabilities 23 78,080 8,074 116,223 11,611
Collateral management agreement 23 60,248 6,230 118,849 11,873
Obligations under finance leases 24 19,916 2,060 19,697 1,968
Trade and other payables 26 291,843 30,307 322,133 32,179
Assets held for disposal 33 1,079 111 - -
Amounts due to related companies 27 81 9 313 31
Taxation payable 10(c) 2,988 309 7,822 781
Cash and cash equivalents 20 105,148 10,874 - -
559,384 57,846 585,037 58,443
Total equity and liabilities 3,829,701 396,040 3,021,060 301,804
The financial statements on pages 53 to 117 were approved by the Board of Directors on 14 November 2017 and were signed on its behalf by:

60 Zambeef Products PLC Annual Report 2017
Company Statement of Financial PositionFor the year ended 30 September 2017
ASSETS Notes2017
ZMW’000s2017
USD’000s2016
ZMW’000s2016
USD’000s
Non-current assets
Property, plant and equipment 14 1,915,760 198,114 1,161,485 116,032
Investment in subsidiaries 15 245,807 25,420 293,763 29,347
Deferred tax asset 10(e) 26,566 2,747 28,366 2,834
2,188,133 226,281 1,483,614 148,213
Current assets
Biological assets 16 150,087 15,521 170,511 17,034
Inventories 17 411,841 42,590 413,670 41,326
Cash and cash equivalents 20 - - 37,193 3,716
Asset held for disposal 56,835 5,877 - -
Trade and other receivables 18 37,169 3,844 45,866 4,582
Amounts due from related companies 19 655,060 67,741 463,114 46,265
Income tax recoverable 10(c) - - - -
1,310,992 135,573 1,130,354 112,924
Total assets 3,499,125 361,854 2,613,968 261,137
EQUITY AND LIABILITIES
Capital and reserves
Share capital 21 3,006 449 3,006 449
Preference share capital 21 1,000 1,000 1,000 100
Share premium 22 1,125,012 185,095 1,125,012 185,095
Other reserves 1,429,504 78,940 785,662 5,660
2,558,522 264,584 1,914,680 191,304
Non-current liabilities
Interest bearing liabilities 23 328,238 33,945 261,734 26,147
Obligations under finance leases 24 17,195 1,778 19,685 1,967
Deferred liability 25 3,659 378 2,266 227
Deferred tax liability 10(e) 4,169 431 3,382 338
353,261 36,532 287,067 28,679
Current liabilities
Interest bearing liabilities 23 138,328 14,305 229,394 22,916
Obligations under finance leases 24 13,272 1,373 14,108 1,409
Trade and other payables 26 164,843 17,046 164,467 16,404
Amounts due to related companies 27 243,876 25,220 325 33
Taxation payable 10(c) 1,588 164 3,927 392
Cash and cash equivalents 20 25,435 2,630 - -
587,342 60,738 412,221 41,154
Total equity and liabilities 3,499,125 361,854 2,613,968 261,137 The financial statements on pages 53 to 117 were approved by the Board of Directors on 14 November 2017 and were signed on its behalf by:
Dr. Jacob Mwanza Carl IrwinChairman Joint Chief Executive Officer

61
Corporategovernance
Financialstatements
Overview Strategicreport
Zambeef Products PLC Annual Report 2017
Consolidated Statement of Cash FlowsFor the year ended 30 September 2017
Notes2017
ZMW’000s2017
USD’000s2016
ZMW’000s2016
USD’000s
Cash inflow from operating activities
Profit before taxation 5,450 572 134,592 12,427
Finance costs 9 87,904 9,234 111,346 10,281
Profit/(loss) on disposal of property, plant and equipment (974) (102) 1,124 104
Depreciation 14 83,301 8,750 77,784 7,182
Loss on discontinued operations (1,133) (119) 33,592 3,101
Fair value price adjustment 16 3,491 367 (13,257) (1,224)
Net unrealised foreign exchange differences (4,410) (463) (28,626) (2,643)
Earnings before interest, tax, depreciation and amortisation, fair value adjustments and net unrealised foreign exchange losses/gains
173,629 18,239 316,555 29,228
(Increase)/decrease in biological assets 19,169 2,014 (46,308) (4,276)
(Increase)/decrease in inventory 28,321 2,975 (132,500) (12,235)
Increase/(decrease) in trade and other receivables 22,503 2,363 97,078 8,949
(Increase)/decrease in amounts due from related companies (1,158) (122) (1,650) (137)
(Increase)/decrease in trade and other payables (33,308) (3,499) (50,200) (4,636)
(Decrease)/increase in amounts due to related companies 4,113 432 (44,165) (4,078)
Increase in deferred liability 6,314 663 1,188 110
Cash outflow from assets held for disposal (14,226) (1,494) - -
Income tax paid 10(c) (17,329) (1,820) (8,850) (817)
Net cash inflow from operating activities 188,028 19,751 131,148 12,109
Investing activities
Purchase of property, plant and equipment 14 (195,610) (20,547) (166,513) (15,376)
Expenditure on plantation development 14 (13,805) (1,450) (12,259) (1,132)
Movement in investments (8,879) (933) - -
Proceeds from the issue of shares - - 620,262 57,273
Purchase of shares - - (175,075) (16,166)
Net cash inflow/(outflow) on investing activities (218,294) (22,931) 266,415 24,599
Net cash inflow/(outflow) before financing activities (30,266) (3,179) 397,563 36,708
Financing activities
Long term loans repaid (104,768) (11,005) (110,289) (10,184)
Receipt of long term loans 140,100 15,000 - -
Receipt/ (repayment of short term funding (55,292) (5,808) 26,997 2,493
Lease finance obtained/(repayment) (3,551) (373) 16,249 1,500
Finance costs including discontinued operations 9 (87,904) (9,234) (111,346) (10,281)
Net cash outflow on financing activities (111,415) (11,420) (178,389) (16,472)
Increase/(decrease) in cash and cash equivalents (141,681) (14,599) 219,177 20,236
Cash and cash equivalents at beginning of the year 64,806 6,474 (190,648) (15,861)
Effects of exchange rate changes on the balance of cash held in foreign currencies (28,273) (2,749) 36,280 2,099
Cash and cash equivalents at end of the year 20 (105,148) (10,874) 64,806 6,474
Represented by:
Cash in hand and at bank 20 62,518 6,465 95,747 9,565
Bank overdrafts 20 (167,729) (17,339) (30,941) (3,091)
(105,148) (10,874) 64,806 6,474

62 Zambeef Products PLC Annual Report 2017
Company Statement of Cash FlowsFor the year ended 30 September 2017
Notes2017
ZMW’000s2017
USD’000s2016
ZMW’000s2016
USD’000s
Cash inflow from operating activities
Profit before taxation 37,735 3,964 101,173 9,342
Finance costs 67,744 7,116 87,815 8,109
Depreciation 14 41,706 4,381 43,728 4,037
Fair value price adjustment 16 3,452 363 (12,587) (1,162)
(Profit)/Loss on disposal of property, plant and equipment (825) (87) 824 76
Net unrealised foreign exchange differences 3,871 407 (17,010) (1,571)
Earnings before interest, tax, depreciation and amortisation 153,683 16,144 203,943 18,831
(Increase)/decrease in biological assets 20,424 2,144 (21,601) (1,995)
(Increase)/decrease in inventory 1,829 192 (102,428) (9,458)
Decrease in trade and other receivables 6,727 707 103,853 9,574
Assets held for disposal (56,835) (5,970) - -
(Increase)/decrease in amounts due from related companies (189,976) (19,955) (178,682) (16,484)
(Decrease)/increase in trade and other payables 376 39 (87,379) (8,068)
Increase/(decrease) in amounts due to related companies 243,551 25,583 289 27
Increase in deferred liability 1,393 146 596 55
Income tax paid 10(c) (13,484) (1,416) (4,438) (410)
Net cash inflow/(outflow operating activities 167,688 17,615 (85,847) (7,928)
Investing activities
Purchase of property, plant and equipment 14 (154,880) (16,269) (49,743) (4,593)
Proceeds from the issue of shares - - 620,261 57,273
Movements in investments 15 47,956 5,037 (175,075) (16,166)
Proceeds from disposal of investment - - - -
Proceeds from sale of assets 1,239 130 65 6
Net cash inflow from investing activities (105,685) (11,102) 395,509 36,520
Net cash inflow before financing activities 62,003 6,513 309,662 28,592
Financing activities
Long term loans repaid (99,663) (10,468) (101,811) (9,401)
Receipt from term loans 140,100 14,716 - -
Movement in short term funding (55,292) (5,808) 39,938 3,688
Lease finance obtained/(repayment) (3,551) (374) 11,823 1,092
Interest paid (67,744) (7,116) (87,815) (8,109)
Net cash outflow from financing activities (86,150) (9,050) (137,865) (12,730)
Increase/(decrease) in cash and cash equivalents (24,147) (2,537) 171,797 15,862
Cash and cash equivalents at beginning of the year 37,193 3,716 (140,855) (11,718)
Effects of exchange rate changes on the balance of cash held in foreign currencies (38,481) (3,810) 6,251 (428)
Cash and cash equivalents at end of the year 20 (25,435) (2,631) 37,193 3,716
Represented by:
Cash in hand and at bank 20 16,509 1,707 52,239 5,219
Bank overdrafts 20 (41,944) (4,338) (15,046) (1,503)
(25,435) (2,631) 37,193 3,716

63
Corporategovernance
Financialstatements
Overview Strategicreport
Zambeef Products PLC Annual Report 2017
Notes to the Financial Statements continuedFor the year ended 30 September 2017
1. The GroupZambeef Products PLC and its subsidiaries (“Group”) is one of the largest agri-businesses in Zambia. The Group is principally involved in the production, processing, distribution and retailing of beef, chicken, pork, milk, dairy products, eggs, edible oils, stock feed and flour. The Group also has large row cropping operations (principally maize, soya beans and wheat), with approximately 7,787 Ha of row crops under irrigation and 8,694 Ha of rain-fed/dry-land crops available for planting each year. The Group is also in the process of rolling out its West Africa expansion in Nigeria and Ghana.
2. Principal accounting policiesThe principal accounting policies applied by the Group in the preparation of these financial statements are set out below. These policies have been consistently applied to all the periods presented, unless otherwise stated.
(a) Basis of consolidationThe consolidated financial statements include the financial statements of the parent Company and its subsidiary companies made up to the end of the financial year. The results of subsidiaries acquired or disposed of during the year are included in the consolidated statement of comprehensive income from the date of their acquisition or up to the date of their disposal. Intercompany transactions and profits are eliminated on consolidation and all income and profit figures relate to external transactions only.
Non-controlling interests, presented as part of equity, represent the portion of a subsidiary’s profit or loss and net assets that is not held by the Group. The Group attributes total comprehensive income or loss of subsidiaries between the owners of the parent and the non-controlling interests based on their respective ownership interests. Profit or loss and other comprehensive income of subsidiaries acquired or disposed of during the year are recognised from the effective date of acquisition or up to the effective date of disposal, as applicable.
(b) Going ConcernAt the reporting date loans and other finance amounts repayable within twelve months amount to ZMW158.2 million (USD16.4 million) [2016: ZMW254.8 million (USD25.5 million)]. After reviewing the available information including the Group’s strategic plans and continuing support from the Group’s working capital funders, the Directors have a reasonable expectation that the Group has adequate resources to continue in operational existence for the foreseeable future. For this reason, they continue to adopt the going concern basis in preparing the financial statements. The Group has also increased its term facilities to fund the capital assets being acquired during the current financial year and the next financial year. All current liabilities will be settled from the continued liquidation of stock and expected increase in income from the capital expenditure carried out during the financial year.
(c) Basis of presentationThe financial statements are prepared in accordance with the provisions of the Zambian Companies Act 1994 and International Financial Reporting Standards (IFRS). The financial statements are presented in accordance with IAS 1 “Preparation of financial statements” (Revised 2007). The Group has elected to present the “Statement of Comprehensive Income” in one statement namely the “Statement of Comprehensive Income”.
The financial statements have been prepared under the historic cost convention, as modified by the revaluation of property, plant and equipment, and financial assets and liabilities at fair value through profit or loss. Biological assets are measured at fair value less costs to sell.
The preparation of financial statements in conformity with IFRS requires the use of certain critical accounting estimates. It also requires management to exercise its judgement in the process of applying the Group’s accounting policies. The areas involving a higher degree of judgement or complexity, or areas where assumptions and estimates are significant to the financial statements, are disclosed in note 3.
(d) Foreign currencies(i) Presentation and functional currencyThe Company has twelve operating branches of which eleven have a functional currency of Zambian Kwacha (ZMW) and one (the Mpongwe Farms Branch) has a functional currency of United States Dollars (USD) being an operational branch set up during the year ended 30 September 2012. Management have chosen a variant on the functional currency of Mpongwe due to the following factors:- the majority of farm input costs (fertilizer, farming chemicals, agricultural machinery spares, etc.), which are primarily sourced from
overseas, are driven by USD to ZMW exchange rate due to origin prices being USD;- the pricing of Mpongwe’s principal outputs (wheat, soya and maize) are significantly influenced by world USD denominated grain prices; - the capital raised attached to the acquisition of the Mpongwe assets was denominated in foreign currency;- the Mpongwe assets were purchased in USD;- upon admission and dual listing on the AIM market of the London Stock Exchange (LSE), Zambeef was required to report in USD in addition to
reporting in ZMW for the LuSE listing; and- the majority of financial liabilities associated with working capital funding and capital expenditure are sourced in USD and repayable in USD, with
a substantial portion of the Company’s term liabilities secured on the assets of Mpongwe.
In light of this, Mpongwe’s assets and liabilities are translated to ZMW and consolidated with other branches of the Company for reporting and tax purposes in Zambia.
As a result of using a functional currency of USD for Mpongwe, there arose an exchange difference of ZMW31.7 million (2016: ZMW73.4 million) upon translating all assets and liabilities, which has been recognised as an unrealised gain in the statement of comprehensive income of the company and an exchange adjustment under property, plant and equipment.

64 Zambeef Products PLC Annual Report 2017
2. Principal accounting policies continuedThe Group’s reporting currency in Zambia is ZMW and the presentation of financial statements to Non-Zambian shareholders and for the purposes of being listed on the AIM market of the London Stock Exchange also necessitate the presentation of the financial statements in United States Dollars (USD).
(ii) Basis of translating presentation currency to USD for the purposes of supplementary informationIncome statement items have been translated using the average exchange rate for the year as an approximation to the actual exchange rate. Assets and liabilities have been translated using the closing exchange rate. Any differences arising from this process have been recognised in other comprehensive income and accumulated in the foreign exchange reserve in equity.
Equity items have been translated at the closing exchange rate. Exchange differences arising on retranslating equity items and opening net assets have been transferred to the foreign exchange reserve within equity.
The following exchange rates have been applied:
ZMW: USD Average exchange rate Closing exchange rate
Year ended 30 September 2016 10.83 10.01
Year ended 30 September 2017 9.52 9.67
All historical financial information, except where specifically stated, is presented in Zambian Kwacha rounded to the nearest ZMW’000s and United States Dollars rounded to the nearest USD’000s.
(iii) Basis of translating transactions and balancesForeign currency transactions are translated into the functional currency using the rates of exchange prevailing at the date of transactions. Foreign exchange gains and losses resulting from the settlement of such transactions and from the translation at year end exchange rates of monetary assets and liabilities denominated in foreign currencies are recognized in the Statement of Comprehensive Income.
Non-operating foreign exchange gains and losses mainly arise on fluctuations of the exchange rate between United States Dollars and Zambian Kwacha. Due to the instability of the exchange rate, which may result in significant unrealised variances of foreign exchange related assets and liabilities, these gains and losses have been presented below operating profit in the Statement of Comprehensive Income.
(iv) Basis of translating foreign operationsIn the consolidated financial statements, the financial statements of the foreign subsidiaries originally presented in their local currency have been translated into Zambian Kwacha. Assets and liabilities have been translated into Zambian Kwacha at the exchange rates ruling at the year end. Statement of comprehensive income items have been translated at an average monthly rate for the year. Any differences arising from this procedure are taken to the foreign exchange reserve.
ZMW: Nigeria Naira Average exchange rate Closing exchange rate
Year ended 30 September 2016 29.09 31.47
Year ended 30 September 2017 36.55 36.79
ZMW: Ghana Cedi Average exchange rate Closing exchange rate
Year ended 30 September 2016 0.36 0.40
Year ended 30 September 2017 0.45 0.45
(e) New and revised standards that are effective for annual periods beginning on or after 1 January 2016The Group has not adopted any new standards or amendments that have a significant impact on the Group’s results or financial position.
The standards and amendments that are effective for the first time in 2017 (for entities with a 31 December 2017 year end) and could be applicable to the Group are:
• ‘Annual Improvements to IFRSs’ 2014-2016 cycle; • Classification and measurement of share-based payment transactions (Amendments to IFRS 2)• Recognition of Deferred tax assets for unrealized losses (Amendments to IAS 12); and• ‘Disclosure Initiative’ (Amendments to IAS 7)
These amendments do not have a significant impact on amounts recognised in prior periods and will not affect current or future periods.
Notes to the Financial Statements continuedFor the year ended 30 September 2017

65
Corporategovernance
Financialstatements
Overview Strategicreport
Zambeef Products PLC Annual Report 2017
2. Principal accounting policies continued
In addition, IFRS 14 ‘Regulatory Deferral Accounts’ is also effective from 1 January 2016. However, it is only applicable to first time adopters of IFRS and therefore is not applicable to the Group.
(f) Standards, amendments and interpretations to existing standards that are not yet effective and have not been adopted early by the Group At the date of authorisation of these financial statements, certain new standards, and amendments to existing standards have been published by the IASB that are not yet effective, and have not been adopted early by the Group. Information on those expected to be relevant to the Group’s financial statements is provided below.
Management anticipates that all relevant pronouncements will be adopted in the Company’s accounting policies for the first period beginning after the effective date of the pronouncement. New standards, interpretations and amendments not either adopted or listed below are not expected to have a material impact on the Group’s financial statements.
IFRS 9 ‘Financial Instruments’The new standard for financial instruments (IFRS 9) introduces extensive changes to IAS 39’s guidance on the classification and measurement of financial assets and introduces a new ‘expected credit loss’ model for the impairment of financial assets. IFRS 9 also provides new guidance on the application of hedge accounting.
Management has started to assess the impact of IFRS 9 but is not yet in a position to provide quantified information. At this stage the main areas of expected impact are as follows:
• the classification and measurement of the Group’s financial assets will need to be reviewed based on the new criteria that considers the assets’ contractual cash flows and the business model in which they are managed
• an expected credit loss-based impairment will need to be recognised on the Group’s trade receivables and investments in debt-type assets currently classified as Available for Sale (AFS) and Held To Maturity (HTM), unless classified as at fair value through profit or loss in accordance with the new criteria
• it will no longer be possible to measure equity investments at cost less impairment and all such investments will instead be measured at fair value. Changes in fair value will be presented in profit or loss unless the Group makes an irrevocable designation to present them in other comprehensive income.
• if the Group continues to elect the fair value option for certain financial liabilities, fair value movements will be presented in other comprehensive income to the extent those changes relate to the Group’s own credit risk.
IFRS 9 is effective for annual reporting periods beginning on or after 1 January 2018.
IFRS 15 ‘Revenue from Contracts with Customers’IFRS 15 presents new requirements for the recognition of revenue, replacing IAS 18 ‘Revenue’, IAS 11 ‘Construction Contracts’, and several revenue-related Interpretations. The new standard establishes a control-based revenue recognition model and provides additional guidance in many areas not covered in detail under existing IFRSs, including how to account for arrangements with multiple performance obligations, variable pricing, customer refund rights, supplier repurchase options, and other common complexities.
IFRS 15 is effective for annual reporting periods beginning on or after 1 January 2018.
IFRS 15 introduces new guidance that will require the Group to evaluate the separability of multiple elements based on whether they are ‘distinct’. A promised good or service is ‘distinct’ if both:• the customer benefits from the item either on its own or together with other readily available resources, and• it is ‘separately identifiable’ (i.e. the Group does not provide a significant service integrating, modifying or customising it).
The subsequent allocation of arrangement consideration to individual performance obligations is based on their relative stand-alone selling prices.
The Group is currently in the process of reviewing all its contracts to ascertain how the new requirements will impact the identification of distinct goods or services and the allocation of consideration to them.
The standard allows adoption using either retrospectively in full to each prior reporting period or modified retrospective with application only to contracts that are not complete at the date of initial application.

66 Zambeef Products PLC Annual Report 2017
2. Principal accounting policies continuedIFRS 16 ‘LeasesIFRS 16 will replace IAS 17 and three related Interpretations. It completes the IASB’s long-running project to overhaul lease accounting. Leases will be recorded on the statement of financial position in the form of a right-of-use asset and a lease liability.
IFRS 16 is effective from periods beginning on or after 1 January 2019. Management is yet to fully assess the impact, of the Standard and therefore is unable to provide quantified information. However, in order to determine the impact the Group are in the process of:
• performing a full review of all agreements to assess whether any additional contracts will now become a lease under IFRS 16’s new definition• deciding which transitional provision to adopt; either full retrospective application or partial retrospective application (which means comparatives
do not need to be restated). The partial application method also provides optional relief from reassessing whether contracts in place are, or contain, a lease, as well as other reliefs. Deciding which of these practical expedients to adopt is important as they are one-off choices
• assessing their current disclosures for finance leases (note 2(m)) and operating leases (note 2(m)) as these are likely to form the basis of the amounts to be capitalised and become right-of-use assets
• determining which optional accounting simplifications apply to their lease portfolio and if they are going to use these exemptions• assessing the additional disclosures that will be required.
(g) Business combinationsOn acquisition, the assets, liabilities and contingent liabilities of a subsidiary are measured at their fair values at the date of acquisition. Any excess of the cost of acquisition over the fair values of the identifiable net assets acquired is recognized as goodwill. Any deficiency of the cost of acquisition below the fair values of the identifiable net asset acquired is credited to the statement of comprehensive income in the period of acquisition. Changes in the Group’s ownership interest that do not result in a loss of control are accounted for as equity transactions. Purchase of non-controlling interests are recognized directly within equity being the difference between the fair value of the consideration paid and the relevant share acquired of the carrying value of the net assets to the subsidiary.
Contingent and deferred consideration arising as a result of acquisitions is stated at fair value. Contingent and deferred consideration is based on management’s best estimate of the likely outcome and best estimate of fair value, which is usually, but not always, a contracted formula based on a multiple of net profit after tax. All acquisition expenses are recognised in the statement of comprehensive income.
(h) Discontinued operationsA discontinued operation is a component of the entity that has been disposed of. A component can be distinguished operationally and for financial reporting purposes if:• its operating assets and liabilities can be directly attributed to it• its income (gross revenue) can be directly attributed to it• at least a majority of its operating expenses can be directly attributed to it.
Profit or loss from discontinued operations, including prior year comparatives, is presented in a single amount in the income statement. This amount comprises the post-tax profit or loss of discontinued operations and the post-tax gain or loss resulting from the disposal of the Group’s share of the entity’s net assets.
The disclosures for discontinued operations in prior years relate to all operations that have been discontinued by the reporting date for the latest period presented.
(i) GoodwillGoodwill represents future economic benefits arising from a business combination that is not individually identified and separately recognized. Goodwill is carried at cost less accumulated impairment losses and is tested annually for impairment. Refer to the note for a description of impairment testing procedures.
(j) Revenue recognitionRevenue comprises the sale of goods as shown in note 5. Revenue is recognized when the significant risks and rewards of ownership have been transferred to the buyers and no significant uncertainties remain regarding the derivation of consideration, associated costs or the possible return of goods.
Revenue comprises the fair value of consideration received or receivable for the sale of the Group’s products in the ordinary course of the Group’s activities. Revenue is shown net of trade allowances, duties and taxes paid and after eliminating sales within the Group.
Revenue from sale of agricultural commoditiesRevenue for the agribusiness division includes the invoice value of goods where the Group grows or takes ownership risk on the relevant produce. Revenue is recognised when the supply of the goods is contracted. There are no discounts or other arrangements that create uncertainty over the level of revenue recognised.
2. Principal accounting policies continued
Notes to the Financial Statements continuedFor the year ended 30 September 2017

67
Corporategovernance
Financialstatements
Overview Strategicreport
Zambeef Products PLC Annual Report 2017
Revenue from retail salesRevenue from the sale of products produced and supplied via Zambeef’s retail outlets and to external parties is recognised on delivery to customers either by way of cash sales or credit sales.
(k) Property, plant and equipmentAll classes of property, plant and equipment are stated at valuation except for plantation development expenditure and capital work in progress which are stated at historical cost. Capital work in progress relates to internally constructed building parts and plant and machinery and are categorised as such on completion. Historical cost includes expenditure that is directly attributable to the acquisition of the items.
Subsequent costs are included in the asset’s carrying amount or recognised as a separate asset, as appropriate, only when it is probable that future economic benefits associated with the item will flow to the Group and the cost of the item can be measured reliably. All other repairs and maintenance are charged to profit or loss in the statement of comprehensive income during the financial year in which they are incurred.
The Group has adopted a policy of revaluing all classes of property, plant and equipment, excluding capital work in progress and plantation development expenditure. Revaluations are conducted with sufficient regularity to ensure that the carrying amount does not differ materially from that which would be determined using fair value at the end of the reporting period.
Increases in the carrying amount arising on revaluation of property, plant and equipment are recognised in other comprehensive income and accumulated in the revaluation surplus in shareholders’ equity. Decreases that offset previous increases of the same asset are charged against the revaluation surplus in shareholders’ equity; all other decreases are charged to the statement of comprehensive income. Each year, the difference between depreciation based on the revalued carrying amount of the asset charged to the statement of comprehensive income and depreciation based on the asset’s original cost, net of any related deferred income tax, is transferred from the revaluation surplus to retained earnings.
Depreciation is calculated to write off the cost of property, plant and equipment on a straight line basis over the expected useful lives of the assets concerned. The principal annual rates used for this purpose are:
Buildings 2%Motor vehicles 20%Furniture & equipment 10%Plant & machinery 10%Aircraft 10%
Land and capital work in progress is not depreciated.
The assets’ residual values and useful lives are reviewed at each reporting date and adjusted where appropriate.
An asset’s carrying amount is written down immediately to its recoverable amount if the asset’s carrying amount is greater than its recoverable amount.
Gains and losses on disposals are determined by comparing the proceeds with the carrying amount. These are included in the statement of comprehensive income in other income. When revalued assets are sold, the amounts included in the revaluation surplus relating to these assets are
transferred to retained earnings.
(l) Plantation development expenditurePlantation development expenditure comprises assets held for plantation development activities. All capital expenditure related costs are recognised under plantation development during the development stage. Upon completion of any development phase, capitalised items are transferred to property, plant and equipment and depreciated, which depreciation is capitalised until the oil palms reach maturity and the plantation generates operating income.
All costs relating directly to plantation development are capitalized until such time as the oil palms reach maturity and meet the criteria for commercial production, at which point capitalized items are reclassified as mature plantations in property, plant and equipment, and all further costs expensed and depreciation commences. Such capitalized costs include:
– construction of roads and bridges attached to the plantation– installation of drainage– land preparation– construction of an office block and workshops
- borrowing costs
These are stated at cost less accumulated depreciation and impairment losses, if any.

68 Zambeef Products PLC Annual Report 2017
2. Principal accounting policies continuedDepreciation is calculated on the straight-line method to write off the cost of assets over their estimated useful lives. The principal annual rates of depreciation are:Bridges and roads 5%Mature plantations 4%
Mature plantations are amortised over the estimated productive life of the trees estimated to be 25 years. The period of the plantations’ productive life was determined by vegetative growth calculated and estimated by management.
m) Leased assetsWhere property, plant and equipment are financed by leasing agreements which give rights approximating to ownership (finance leases) the assets are treated as if they had been purchased and the capital element of the leasing commitments is shown as obligations under finance lease. The lease rentals are treated as consisting of capital and interest elements. The capital element is applied to reduce the outstanding obligations and the interest element is charged to the statement of comprehensive income over the period of the lease so as to produce a constant periodic rate of interest in the remaining balance of the liability under the lease agreement for each accounting period.
Rentals payable under operating leases are charged to profit or loss in the statement of comprehensive income over the term of the relevant lease and in accordance with the terms of the relevant leases.
(n) Financial assetsFor the purpose of measurement financial assets are classified into categories. Management determines the classification of its investments at initial recognition and re-evaluates this at every reporting date.
(o) Loans and receivablesLoans and receivables are non-derivative financial assets with fixed or determinable payments that are not quoted in an active market. Loans and receivables are recognised initially at their fair value and subsequently measured at amortised cost using the effective interest method, less provision for impairment. Discounting is omitted where the effect of discounting is immaterial. The Group’s cash and cash equivalents, trade and most other receivables fall into this category of financial instruments.
Financial assets are derecognised when the rights to receive cash flows from them have expired or where they have been transferred and the Group has also transferred substantially all risks and rewards of ownership.
(p) Impairment of assets
(i) Financial assets carried at amortised costThe Group assesses at each reporting date whether there is objective evidence that a financial asset or group of financial assets is impaired. A financial asset or group of financial assets is impaired and impairment losses are incurred only if there is objective evidence of impairment as a result of one or more events that have occurred after the initial recognition of the asset (a ‘loss event’) and that loss event (or events) has an impact on the estimated future cash flows of the financial asset or group of financial assets that can be reliably estimated. Objective evidence that a financial asset or group of assets is impaired includes observable data that comes to the attention of the Group about the following events:• significant financial difficulty of the issuer or debtor;• a breach of contract, such as a default or delinquency in payments;• it becoming probable that the issuer or debtor will enter bankruptcy or other financial reorganization; or• observable data indicating that there is a measurable decrease in the estimated future cash flow from a group of financial assets since the initial
recognition of those assets, although the decrease cannot yet be identified with the individual financial assets in the Group, including:– adverse changes in the payment status of issuers or debtors in the Group; or– national or local economic conditions that correlate with defaults on the assets in the Group.
2. Principal accounting policies continuedThe Group first assesses whether objective evidence of impairment exists individually for financial assets that are individually significant. If the Group determines that no objective evidence of impairment exists for an individual assessed financial asset, whether significant or not, it includes the asset in a group of financial assets with similar credit risk characteristics and collectively assesses them for impairment. Assets that are individually assessed for impairment and for which an impairment loss is, or continues to be, recognised are not included in a collective assessment of impairment.
If there is objective evidence that an impairment loss has been incurred on loans and receivables or held-to-maturity investments, the amount of the loss is measured as the difference between the asset’s carrying amount and the present value. The carrying amount of the asset is reduced through the use of an allowance account, and the amount of the loss is recognised in the statement of comprehensive income.
If in a subsequent year, the amount of the impairment loss decreases and the decrease can be related objectively to an event occurring after the impairment was recognised, the previously recognised impairment loss is reversed by adjusting the allowance account. The amount of the reversal is recognised in the statement of comprehensive income.
Notes to the Financial Statements continuedFor the year ended 30 September 2017

69
Corporategovernance
Financialstatements
Overview Strategicreport
Zambeef Products PLC Annual Report 2017
2. Principal accounting policies continued
(ii) Impairment of goodwillFor impairment assessment purposes, assets are grouped at the lowest levels for which there are largely independent cash inflows (cash generating units). As a result, some assets are tested individually for impairment and some are tested at cash-generating unit level. Goodwill is allocated to those cash-generating units that are expected to benefit from synergies of the related business combination and represent the lowest level within the Group at which management monitors goodwill.
Cash-generating units to which goodwill has been allocated (determined by the Group’s management as equivalent to its operating segments) are tested for impairment at least annually. All other individual assets or cash-generating units are tested for impairment whenever events or changes in circumstances indicate that the carrying amount may not be recoverable.
An impairment loss is recognised for the amount by which the asset’s or cash-generating unit’s carrying amount exceeds its recoverable amount, which is the higher of fair value less costs to sell and value-in use. To determine the value-in-use, management estimates expected future cash flows from each cash-generating unit and determines a suitable interest rate in order to calculate the present value of those cash flows. The data used for impairment testing procedures are directly linked to the Group’s latest approved budget, adjusted as necessary to exclude the effects of future reorganisations and asset enhancements. Discount factors are determined individually for each cash-generating unit and reflect management’s assessment of respective risk profiles, such as market and asset-specific risks factors.
Impairment losses for cash-generating units reduce first the carrying amount of any goodwill allocated to that cash-generating unit. Any remaining impairment loss is charged pro rata to the other assets in the cash-generating unit. With the exception of goodwill, all assets are subsequently reassessed for indications that an impairment loss previously recognised may no longer exist. An impairment charge is reversed if the cash-generating unit’s recoverable amount exceeds its carrying amount.
(q) Financial liabilitiesThe Group’s financial liabilities include bank overdrafts, interest bearing liabilities, obligations under finance leases and trade and other payables. Financial liabilities are recognised when the Group becomes party to the contractual agreements of the instrument. All interest related charges are recognised as an expense in ‘Finance costs’ in the consolidated statement of comprehensive income. Financial liabilities are recognised initially at their fair value, net of transaction costs and subsequently measured at amortised cost using the effective interest method. A financial liability is derecognised when it is extinguished, discharged, cancelled or expires.
(r) Biological assets
(i) Current assetsBiological assets are valued at their fair values less estimated point of sale costs as determined by the Directors. The fair value of livestock is determined based on market prices of animals of similar age, breed and genetic merit. Standing crops are revalued to fair value at each reporting date based on the estimated market value of fully grown standing crops adjusted for the age and condition of the crops at the reporting date. Feedlot, standing and dairy cattle, chickens (broilers and layers), and pigs have been classified as current biological assets based on Directors’ expectation of their useful economic life. Upon maturity of biological assets, they are transferred to inventory through harvest and culling.
Net gains and losses arising from changes in fair value less estimated point of sale costs of biological assets are recognised in profit and loss in the statement of comprehensive income.
(ii) Non-current assetsOil palms which are not yet mature at the accounting date, and hence are not producing fresh fruit bunches (FFB), are valued at cost as an approximation of fair value which is not capable of being accurately measured.
All expenditure on the oil palms up to maturity is treated as an addition to the oil palms. Such costs include seedling costs, holing and planting, transport and field distribution, lining and pruning. The variation in the value of the oil palms in each accounting period, after allowing for additions to the oil palms in the period, is charged or credited to profit or loss in the statement of comprehensive income as appropriate, with no depreciation being provided on such assets.
Bearer plans are accounted for in the same way as property, plant and equipment in IAS16.
(s) InventoryInventory is stated at the lower of cost and net realizable value. Cost is determined on a first in first out basis and includes all expenditure incurred in the normal course of business in bringing the goods to their present location and condition, including production overheads based on normal level of activity. Net realizable value takes into account all further costs directly related to marketing, selling and distribution.
Biological assets are transferred to inventory at the point of harvest/slaughter at fair value in accordance with IAS 41.

70 Zambeef Products PLC Annual Report 2017
2. Principal accounting policies continued(t) Cash and cash equivalentsCash and cash equivalents include cash in hand, bank overdrafts, deposits held at call with banks, structured agricultural finance, other short-term highly liquid investments and balances held with banks.Bank overdrafts are defined as facilities which are repayable on demand and classified as current liabilities.
(u) Borrowing costsBorrowing costs directly attributable to the acquisition, construction or production of qualifying assets, which are assets that necessarily take a substantial period of time to be prepared for their intended use or sale, are added to the cost of those assets, until such time as the assets are substantially ready for their intended use or sale.
Investment income earned on the temporary investment of specific borrowings pending their expenditure on qualifying assets is deducted from the borrowing costs eligible for capitalisation. All other borrowing costs are recognized within ‘finance costs’ in profit or loss in the statement of comprehensive income in the period in which they are incurred.
(v) Interest bearing liabilitiesShort term interest bearing liabilities include all amounts expected to be repayable within twelve months from the reporting date, including instalments due on loans of longer duration. Long term interest bearing liabilities represent all amounts payable more than twelve months from the reporting date.
(w) Other incomeOther income is income not related to the operation or management of the specific business activities of the Group, but which arises from the function of operating an agri-business. Other income comprises the fair value of the consideration received or receivable.
(x) TaxationCurrent income tax assets and/or liabilities comprise those obligations to, or claims from, fiscal authorities relating to the current or prior reporting periods, that are unpaid at the reporting date. Current tax is payable on taxable profit, which differs from profit or loss in the financial statements. Calculation of current tax is based on tax rates and tax laws that have been enacted or substantively enacted by the end of the reporting period.
Deferred income taxes are calculated using the liability method on temporary differences between the carrying amounts of assets and liabilities and their tax bases. However, deferred tax is not provided on the initial recognition of goodwill, or on the initial recognition of an asset or liability unless the related transaction is a business combination or affects tax or accounting profit. Deferred tax on temporary differences associated with investments in subsidiaries and joint ventures is not provided if reversal of these temporary differences can be controlled by the Group and it is probable that reversal will not occur in the foreseeable future.
Deferred tax assets and liabilities are calculated, without discounting, at tax rates that are expected to apply to their respective period of realization, provided they are enacted or substantively enacted by the end of the reporting period. Deferred tax liabilities are always provided for in full.
Deferred tax assets are recognized to the extent that it is probable that they will be able to be utilized against future taxable income.
Deferred tax assets and liabilities are offset only when the Group has a right and intention to set off current tax assets and liabilities from the same taxation authority.
Changes in deferred tax assets or liabilities are recognized as a component of tax income or expense in profit or loss, except where they relate to items that are recognized in other comprehensive income or directly in equity, in which case the related deferred tax is also recognized in other comprehensive income or equity, respectively.
(y) Employee benefits(i) Pension obligationsThe Group has a plan with National Pension Scheme Authority (NAPSA) where the Group pays an amount equal to the employee’s contributions. Employees contribute 5 per cent. of their gross earnings up to the statutory cap.
Notes to the Financial Statements continuedFor the year ended 30 September 2017

71
Corporategovernance
Financialstatements
Overview Strategicreport
Zambeef Products PLC Annual Report 2017
2. Principal accounting policies continued(ii) Termination benefitsTermination benefits are payable when employment is terminated before the normal retirement date, or whenever an employee accepts voluntary redundancy in exchange for these benefits. The Group recognises termination benefits when it is demonstrably committed to either terminating the employment of current employees according to a detailed formal plan without possibility of withdrawal; or providing termination benefits as a result of an offer made to encourage voluntary redundancy.
(z) Dividend distributionsDividend distributions to the Company’s shareholders are recognised as a liability in the financial statements in the year in which the dividends are approved by the Company’s shareholders at a general meeting.
(aa) Equity and reservesShare capital represents the nominal value of shares that have been issued.
Share premium includes any premiums received on issue of share capital. Any transaction costs associated with the issuing of shares are deducted from share premium, net of any related income tax benefits.
The revaluation reserve within equity comprises gains and losses due to the revaluation of property, plant and equipment. This reserve is non-distributable.
Foreign currency translation differences arising from translating to presentational currency and translating foreign operations are included in the foreign exchange reserve. These reserves are non-distributable.
Retained earnings include all current and prior period results as disclosed in the statement of comprehensive income. All transactions with owners of the parent are recorded separately within equity.
(bb) Segmental reportingIFRS 8 requires segments to be identified on the basis of the internal reports about operating units of the Group that are regularly reviewed by the Joint Chief Executive Officers and Chief Financial Officer who are the Chief Operating Decision Maker (CODMs) to allocate resources and to assess their performance. The Group operates 14 main reportable divisions which match the main external revenues earned by the Group:• Beef• Chicken• Pork• Crops• Stock feed• Eggs• Retailing• Fish• Milk and dairy• Edible oils• Mill and bakery• Leather and shoe• Master Meats (Nigeria)• Master Meats (Ghana)
Due to the nature of the Group’s operations, namely that Groups of assets and liabilities are each used to generate a number of the revenue streams above, balance sheet items cannot be discretely allocated to the above components, and the CODM also reviews management information regarding the operating assets and liabilities of the main reporting entities within the Group as follows:• Zambeef• Retailing• Zam Chick• Zamanita• MasterPork• Zampalm• Other
The ‘Other’ segment includes the foreign subsidiaries, Zamleather Limited and Zamhatch Limited. Foreign subsidiaries include the Group’s two majority-owned subsidiaries in Nigeria and Ghana. Inter and intra-divisional, and inter-company sales are recognised based on an internally set transfer price. The prices are reviewed periodically and aim to reflect what each Business segment could achieve if it sold its output to external parties at arm’s length.

72 Zambeef Products PLC Annual Report 2017
2. Principal accounting policies continued(cc) Provisions (Restructuring costs and legal claims)Provisions for restructuring costs and legal claims are recognised when the Group has a present legal or constructive obligation as a result of past events it is more likely than not that an outflow of resources will be required to settle the obligation and the amount has been reliably estimated. Restructuring provisions comprise lease termination penalties and employee termination payments. Provisions are not recognised for future operating losses. Where there are a number of similar obligations, the likelihood that an outflow will be required in settlement is determined by considering the class of obligations as a whole.
(dd) Share-based employee remunerationThe Group operates equity-settled share-based remuneration plans for its employees. None of the Group’s plans are cash-settled.
All goods and services received in exchange for the grant of any share-based payment are measured at their fair values.
Where employees are rewarded using share-based payments, the fair value of employees’ services is determined indirectly by reference to the fair value of the equity instruments granted. This fair value is appraised at the grant date and excludes the impact of non-market vesting conditions (for example profitability and sales growth targets and performance conditions).
All share-based remuneration is ultimately recognised as an expense in profit or loss with a corresponding credit to retained earnings. If vesting periods or other vesting conditions apply, the expense is allocated over the vesting period, based on the best available estimate of the number of share options expected to vest.
Non-market vesting conditions are included in assumptions about the number of options that are expected to become exercisable. Estimates are subsequently revised if there is any indication that the number of share options expected to vest differs from previous estimates. Any adjustment to cumulative share-based compensation resulting from a revision is recognised in the current period. The number of vested options ultimately exercised by holders does not impact the expense recorded in any period.
Upon exercise of share options, the proceeds received, net of any directly attributable transaction costs, are allocated to share capital up to the nominal (or par) value of the shares issued with any excess being recorded as share premium.
3. Critical accounting estimates and judgementsThe preparation of financial statements in conformity with adopted IFRS requires management to make judgements and estimates that affect the application of policies and reported amounts of assets, liabilities, income, expenses and contingent liabilities. Estimates are based on historical experience and other assumptions that are considered reasonable under the circumstances. The estimates and judgements are under continuous review.
(i) Plantation development expenditureManagement exercises judgement in assessing whether costs incurred at the Zampalm plantation:• Continue plantation development expenditure (and are therefore capitalised).• Constitute other classes of property, plant and equipment (and are therefore capitalised and allocated as such).• Relate directly to palm oil trees (and are therefore accounted for via the valuation of biological assets).
(ii) Deferred taxManagement applies judgement in assessing whether a deferred tax asset is recognised on carried forward trading losses based on anticipated future profits.
3.1 Significant accounting estimates(i) Translating to the presentational currencyManagement have applied the average exchange rate as an approximation to the actual exchange rate for the purposes of translating the Group’s consolidated financial statements into USD. The Directors have conducted an exercise to evaluate the impact of these fluctuations on the presentation of the Group’s results and has concluded that the application of the average exchange rate is a reasonable approximation to the actual rate. The Group has long-term borrowings denominated in USD and management has conducted sensitivity analysis on the Group’s reported profits and equity for the periods reported (see note 28).
Notes to the Financial Statements continuedFor the year ended 30 September 2015
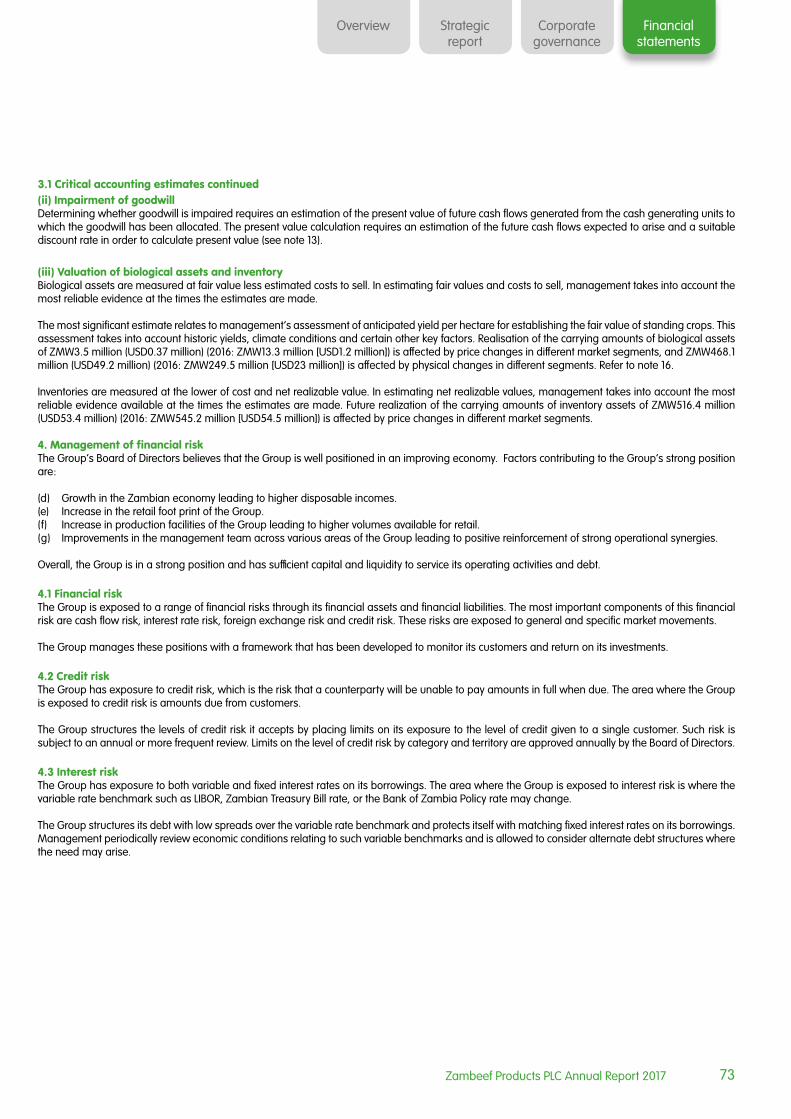
73
Corporategovernance
Financialstatements
Overview Strategicreport
Zambeef Products PLC Annual Report 2017
3.1 Critical accounting estimates continued(ii) Impairment of goodwillDetermining whether goodwill is impaired requires an estimation of the present value of future cash flows generated from the cash generating units to which the goodwill has been allocated. The present value calculation requires an estimation of the future cash flows expected to arise and a suitable discount rate in order to calculate present value (see note 13).
(iii) Valuation of biological assets and inventoryBiological assets are measured at fair value less estimated costs to sell. In estimating fair values and costs to sell, management takes into account the most reliable evidence at the times the estimates are made.
The most significant estimate relates to management’s assessment of anticipated yield per hectare for establishing the fair value of standing crops. This assessment takes into account historic yields, climate conditions and certain other key factors. Realisation of the carrying amounts of biological assets of ZMW3.5 million (USD0.37 million) (2016: ZMW13.3 million [USD1.2 million]) is affected by price changes in different market segments, and ZMW468.1 million (USD49.2 million) (2016: ZMW249.5 million [USD23 million]) is affected by physical changes in different segments. Refer to note 16.
Inventories are measured at the lower of cost and net realizable value. In estimating net realizable values, management takes into account the most reliable evidence available at the times the estimates are made. Future realization of the carrying amounts of inventory assets of ZMW516.4 million (USD53.4 million) (2016: ZMW545.2 million [USD54.5 million]) is affected by price changes in different market segments.
4. Management of financial riskThe Group’s Board of Directors believes that the Group is well positioned in an improving economy. Factors contributing to the Group’s strong position are:
(d) Growth in the Zambian economy leading to higher disposable incomes.(e) Increase in the retail foot print of the Group.(f) Increase in production facilities of the Group leading to higher volumes available for retail.(g) Improvements in the management team across various areas of the Group leading to positive reinforcement of strong operational synergies.
Overall, the Group is in a strong position and has sufficient capital and liquidity to service its operating activities and debt.
4.1 Financial riskThe Group is exposed to a range of financial risks through its financial assets and financial liabilities. The most important components of this financial risk are cash flow risk, interest rate risk, foreign exchange risk and credit risk. These risks are exposed to general and specific market movements.
The Group manages these positions with a framework that has been developed to monitor its customers and return on its investments.
4.2 Credit riskThe Group has exposure to credit risk, which is the risk that a counterparty will be unable to pay amounts in full when due. The area where the Group is exposed to credit risk is amounts due from customers.
The Group structures the levels of credit risk it accepts by placing limits on its exposure to the level of credit given to a single customer. Such risk is subject to an annual or more frequent review. Limits on the level of credit risk by category and territory are approved annually by the Board of Directors.
4.3 Interest riskThe Group has exposure to both variable and fixed interest rates on its borrowings. The area where the Group is exposed to interest risk is where the variable rate benchmark such as LIBOR, Zambian Treasury Bill rate, or the Bank of Zambia Policy rate may change.
The Group structures its debt with low spreads over the variable rate benchmark and protects itself with matching fixed interest rates on its borrowings. Management periodically review economic conditions relating to such variable benchmarks and is allowed to consider alternate debt structures where the need may arise.

74 Zambeef Products PLC Annual Report 2017
4.4 Capital managementThe Group’s objective when managing capital is to safeguard the Group’s ability to continue as a going concern so that it can continue to provide returns for shareholders and benefits for other stakeholders.
The Group sets the amount of capital in proportion to its overall financing structure. The Group manages the capital structure and makes adjustments to it in the light of the economic conditions and the risk characteristics of the underlying assets. In order to maintain or adjust the capital structure, the Group may adjust the amount of the dividends paid to shareholders, return capital to shareholders, issue new shares, or sell assets to reduce debt.
Capital structure
(i) In Zambian Kwacha2017
ZMW’000s2016
ZMW’000s
Cash and cash equivalents (105,148) 64,806
Interest bearing liabilities (514,397) (547,988)
Equity 2,898,477 2,135,939
2,278,932 1,652,757
(ii) In United States Dollars2017
USD’000s2016
USD’000s
Cash and cash equivalents (10,874) 6,474
Interest bearing liabilities (53,195) (54,744)
Equity 299,740 213,383
235,671 165,113
The Directors define capital as equity plus cash less borrowings and its financial strategy in the short term is to minimize the level of debt in the business whilst ensuring sufficient finances are available to continue the Group’s business activities.
4.5 Foreign exchange riskThe Group is exposed to foreign exchange risk arising from exchange rate fluctuations. Foreign currency denominated purchases and sales, together with foreign currency denominated borrowings, comprise the currency risk of the Group. These risks are minimized by matching the foreign currency receipts to the foreign currency payments as well as holding foreign currency bank accounts and export sales.4.6 Agricultural riskAgricultural production by its nature contains elements of significant risks and uncertainties which may adversely affect the business and operations of the Group, including but not limited to the following: (i) any future climate change with a potential shift in weather patterns leading to floods or droughts and associated crop losses; (ii) potential insect, fungal and weed infestations resulting in crop failure and reduced yields; (iii) wild and domestic animal conflicts and crop raiding; and (iv) livestock disease outbreaks. Adverse weather conditions represent a significant operating risk to the Business, affecting the quality and quantity of production and the levels of farm inputs.
The Group minimises these risks through a robust insurance policy on biological stock (crop and livestock) and grain inventory.
Notes to the Financial Statements continuedFor the year ended 30 September 2017

75
Corporategovernance
Financialstatements
Overview Strategicreport
Zambeef Products PLC Annual Report 2017
5. Segmental reportingAn operating segment is a distinguishable component of the Group that engages in business activities from which it may earn revenues and incur expenses, whose operating results are regularly reviewed by the Group’s Chief Operating Decision Maker (‘CODMs’), which is the Chief Executive officers and Chief Financial officer, to make decisions about the allocation of resources and assessment of performance about which discrete financial information is available. Gross margin information is sufficient for the CODM to use for such purposes. The CODM reviews information regarding the operating divisions which match the main external revenues earned by the Group, and management information regarding the operating assets and liabilities of the main business divisions within the Group.
Year ended 30 September 2017
(i) In Zambian Kwacha
SegmentRevenue
ZMW’000sRevenue
ZMW’000sGross ProfitZMW’000s
Gross ProfitZMW’000s
Retailing – Zambia 1,440,784 164,450
Master Meats Nigeria 137,759 25,139
Master Meats Ghana 26,415 2,775
Retailing West Africa 164,174 32,598
Total Retailing 1,604,958 197,048
Beef 415,963 103,725
Chicken 297,340 65,686
Pork 243,491 36,980
Milk and dairy 172,516 49,338
Fish 55,438 10,591
Eggs 57,729 7,049
Total Cold Chain Food Production 1,242,477 273,369
Stock Feed 662,068 166,884
Crops 505,738 134,556
Mill and Bakery 117,504 19,827
Leather and shoe 31,571 7,260
Edible oils 12,312 (313)
Total Other 161,387 26,774
Total 4,176,628 798,631
Less: Intra/Inter Group Sales (1,741,446) (182,925)
Group total 2,435,182 798,631
Central operating costs and other income (711,978)
Operating profit 86,653
Foreign exchange gains 6,701
Finance costs (87,904)
Profit before tax 5,450
Operating assets/(liabilities)Zambeef
ZMW’000sRetailing
ZMW’000sMaster Pork
ZMW’000sOther
ZMW’000sTotal
ZMW’000s
Property plant and equipment 1,915,758 167,854 85,779 441,097 2,610,488
Biological assets and inventories 561,928 47,624 22,837 51,886 684,275
Cash, cash equivalents and bank overdrafts (24,435) (96,578) 1,108 14,757 (105,148)

76 Zambeef Products PLC Annual Report 2017
5. Segmental reporting continued
(ii) In US Dollars
SegmentRevenue
USD’000sRevenue
USD’000sGross Profit
USD’000sGross Profit
USD’000s
Retailing – Zambia 151,343 17,273
Master Meats Nigeria 14,470 2,641
Master Meats Ghana 2,775 784
Retail – West Africa 17,245 3,425
Total Retailing 168,588 20,698
Beef 43,694 10,895
Chicken 31,233 6,900
Pork 25,577 3,884
Milk and dairy 18,121 5,183
Fish 5,823 1,113
Eggs 6,064 740
Total Cold Chain Food Production 130,512 28,715
Stock Feed 69,545 17,530
Crops 53,124 14,134
Mill and Bakery 12,343 2,083
Leather and shoe 3,316 763
Edible oils 1,293 (33)
Total Other 16,952 2,813
Total 438,721 83,890
Less: Intra/Inter Group Sales (182,925)
Group total 255,796 83,890
Central operating costs and other income (74,788)
Operating profit 9,102
Foreign exchange gains 704
Finance costs (9,234)
Profit before tax 572
Operating assets/(liabilities)Zambeef
USD’000sRetailing
USD’000sMaster Pork
USD’000sOther
USD’000sTotal
USD’000s
Property plant and equipment 198,114 17,358 8,871 45,615 269,958
Biological assets and inventories 58,110 4,925 2,362 5,366 70,763
Cash, cash equivalents and bank overdrafts (2,630) (9,987) 115 1,628 (10,874)
Year ended 30 September 2016
Notes to the Financial Statements continuedFor the year ended 30 September 2017

77
Corporategovernance
Financialstatements
Overview Strategicreport
Zambeef Products PLC Annual Report 2017
(i) In Zambian Kwacha
SegmentRevenue
ZMW’000sRevenue
ZMW’000sGross Profit ZMW’000s
Gross Profit ZMW’000s
Retailing – Zambia 1,131,524 132,872
Master Meats Nigeria 182,825 39,421
Master Meats Ghana 33,710 9,406
Total Retailing 1,348,059 181,699
Retailing West Africa 216,535 48,827
Beef 426,731 97,130
Chicken 285,056 63,028
Pork 213,535 23,285
Milk and dairy 125,526 55,538
Fish 48,172 14,062
Eggs 35,673 13,037
Total Cold Chain Food Production 1,134,693 266,080
Stock Feed 697,563 143,916
Crops 413,391 251,860
Mill and Bakery 89,137 20,464
Leather and shoe 33,037 9,216
Edible oils 91,790 2,711
Total Other 213,964 32,391
Total 3,807,670 875,946
Less: Intra/Inter Group Sales (1,431,522)
Group total 2,376,148 875,946
Central operating costs and other income (688,353)
Operating profit 187,593
Foreign exchange gains 58,345
Finance costs (111,346)
Profit before tax 134,592
Operating assets/(liabilities)Zambeef
ZMW’000sRetailing
ZMW’000sMaster Pork
ZMW’000sZampalm
ZMW’000sOther
ZMW’000sTotal
ZMW’000s
Property plant and equipment 1,161,484 192,846 62,521 46,159 306,956 1,769,966
Biological assets and inventories 584,181 85,628 20,414 48,480 41,542 780,245
Cash, cash equivalents and bank overdrafts 37,193 7,991 232 738 18,652 64,806
5. Segmental reporting continued

78 Zambeef Products PLC Annual Report 2017
(ii) In US Dollars
SegmentRevenue
USD’000sRevenue
USD’000sGross Profit
USD’́000sGross Profit
USD’́000s
Retailing – Zambia 104,481 12,269
Master Meats Nigeria 16,881 3,640
Master Meats Ghana 3,113 869
Total Retailing 124,475 16,778
Retail – West Africa 19,994 4,508
Beef 39,400 8,967
Chicken 26,321 5,820
Pork 19,717 2,150
Milk and dairy 11,591 5,128
Fish 4,448 1,298
Eggs 3,294 1,204
Total Cold Chain Food Production 104,771 24,567
Stock Feed 64,410 13,289
Crops 38,171 23,256
Mill and Bakery 8,231 1,890
Leather and shoe 3,051 851
Edible oils 8,476 250
Total Other 19,758 2,991
Total 351,585 80,881
Less: Intra/Inter Group Sales (132,181)
Group total 219,404 80,881
Central operating costs and other income (63,560)
Operating profit 17,321
Foreign exchange gains 5,387
Finance costs (10,281)
Profit before tax 12,427
Operating assets/(liabilities)Zambeef
USD’000sRetailing
USD’000sMasterpork
USD’000sZampalm USD’000s
Other USD’000s
Total USD’000s
Property plant and equipment 116,032 19,265 6,246 4,612 30,665 176,820
Biological assets and inventories 58360 8,584 2,039 4,843 4,120 77,946
Cash, cash equivalents and bank overdrafts 3,716 798 23 74 1,863 6,474
2017 2016
GeographicalZMW’000s
Revenues
ZMW’000s Non-current
assetsUSD’000s Revenues
USD’000s Non-current
assetsZMW’000s
Revenues
ZMW’000s Non-current
assetsUSD’000s Revenues
USD’000s Non-current
assets
Zambia 2,104,431 3,142,675 221,055 324,992 1,977,148 2,081,055 182,562 207,898
West Africa 306,296 24,946 32,174 2,580 306,296 17,981 28,282 1,796
Rest of world 24,455 - 2,568 - 92,704 - 8,560 -
2,435,182 3,167,621 255,796 327,572 2,376,148 2,099,036 219,404 209,694
5. Segmental reporting continued
Notes to the Financial Statements continuedFor the year ended 30 September 2017
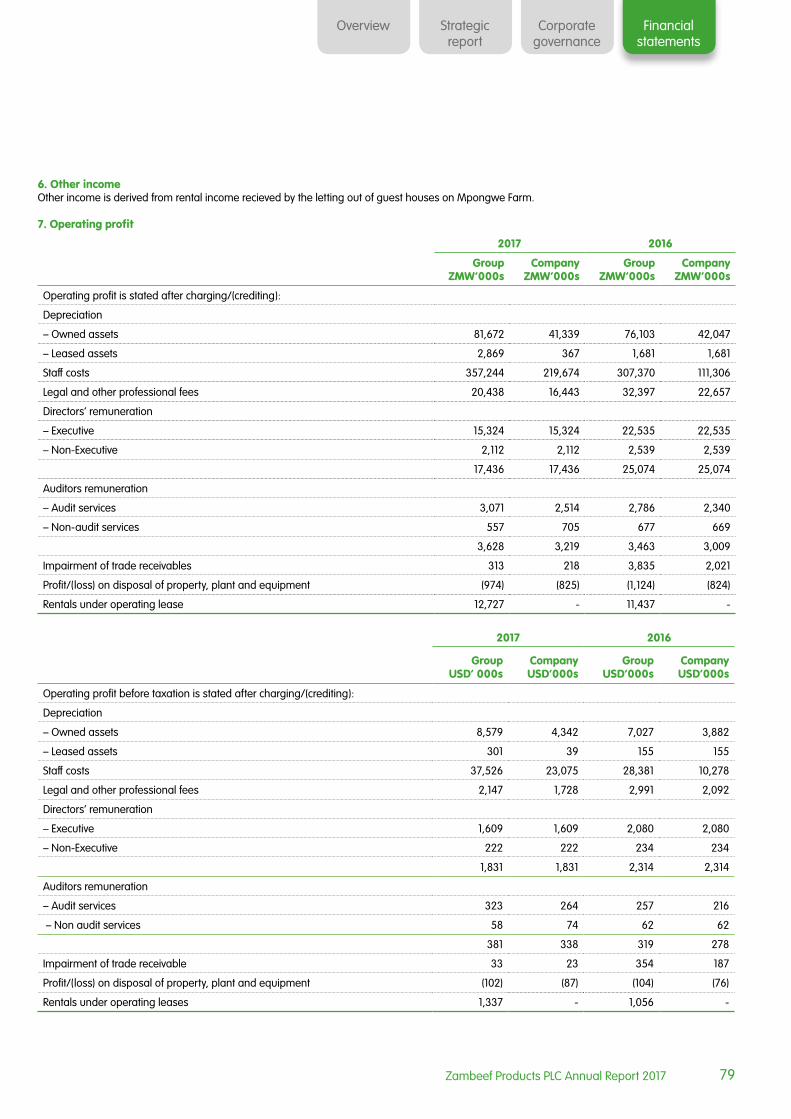
79
Corporategovernance
Financialstatements
Overview Strategicreport
Zambeef Products PLC Annual Report 2017
6. Other incomeOther income is derived from rental income recieved by the letting out of guest houses on Mpongwe Farm.
7. Operating profit
2017 2016
Group ZMW’000s
Company ZMW’000s
Group ZMW’000s
Company ZMW’000s
Operating profit is stated after charging/(crediting):
Depreciation
– Owned assets 81,672 41,339 76,103 42,047
– Leased assets 2,869 367 1,681 1,681
Staff costs 357,244 219,674 307,370 111,306
Legal and other professional fees 20,438 16,443 32,397 22,657
Directors’ remuneration
– Executive 15,324 15,324 22,535 22,535
– Non-Executive 2,112 2,112 2,539 2,539
17,436 17,436 25,074 25,074
Auditors remuneration
– Audit services 3,071 2,514 2,786 2,340
– Non-audit services 557 705 677 669
3,628 3,219 3,463 3,009
Impairment of trade receivables 313 218 3,835 2,021
Profit/(loss) on disposal of property, plant and equipment (974) (825) (1,124) (824)
Rentals under operating lease 12,727 - 11,437 -
2017 2016
Group USD’́000s
Company USD’000s
Group USD’000s
Company USD’000s
Operating profit before taxation is stated after charging/(crediting):
Depreciation
– Owned assets 8,579 4,342 7,027 3,882
– Leased assets 301 39 155 155
Staff costs 37,526 23,075 28,381 10,278
Legal and other professional fees 2,147 1,728 2,991 2,092
Directors’ remuneration
– Executive 1,609 1,609 2,080 2,080
– Non-Executive 222 222 234 234
1,831 1,831 2,314 2,314
Auditors remuneration
– Audit services 323 264 257 216
– Non audit services 58 74 62 62
381 338 319 278
Impairment of trade receivable 33 23 354 187
Profit/(loss) on disposal of property, plant and equipment (102) (87) (104) (76)
Rentals under operating leases 1,337 - 1,056 -
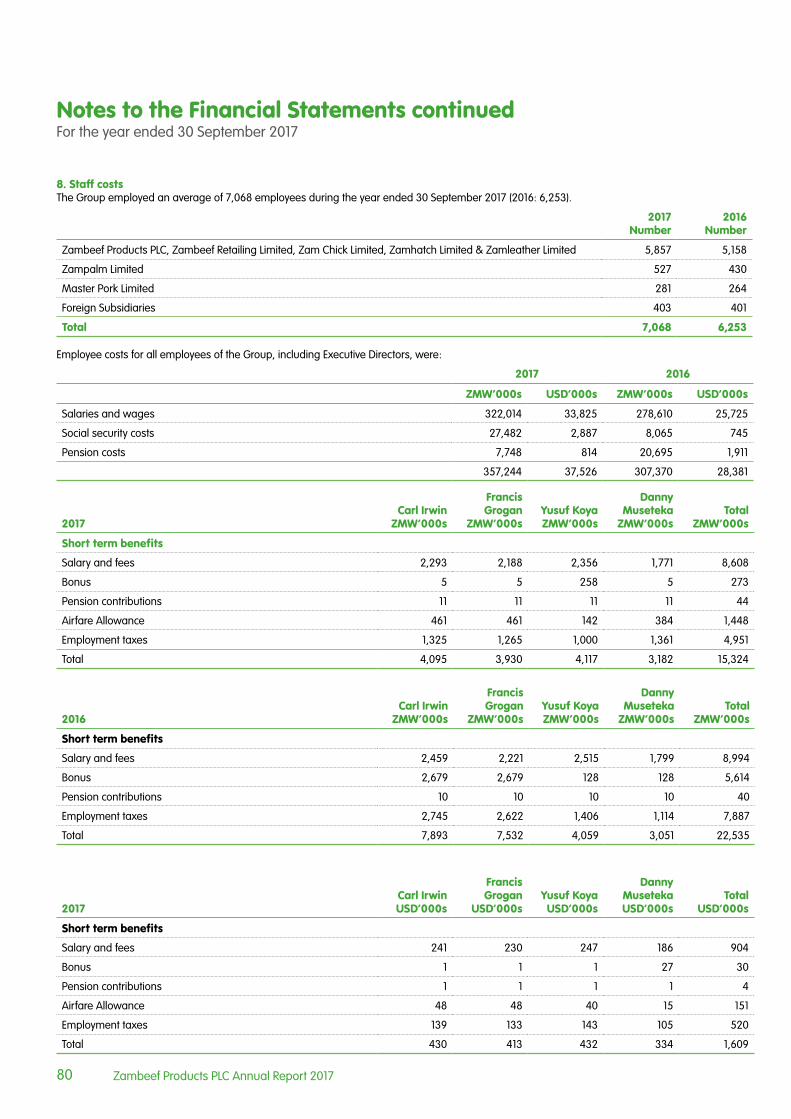
80 Zambeef Products PLC Annual Report 2017
8. Staff costsThe Group employed an average of 7,068 employees during the year ended 30 September 2017 (2016: 6,253).
2017 Number
2016 Number
Zambeef Products PLC, Zambeef Retailing Limited, Zam Chick Limited, Zamhatch Limited & Zamleather Limited 5,857 5,158
Zampalm Limited 527 430
Master Pork Limited 281 264
Foreign Subsidiaries 403 401
Total 7,068 6,253
Employee costs for all employees of the Group, including Executive Directors, were:
2017 2016
ZMW’000s USD’000s ZMW’000s USD’000s
Salaries and wages 322,014 33,825 278,610 25,725
Social security costs 27,482 2,887 8,065 745
Pension costs 7,748 814 20,695 1,911
357,244 37,526 307,370 28,381
2017Carl Irwin
ZMW’000s
Francis Grogan
ZMW’000sYusuf Koya ZMW’000s
Danny Museteka
ZMW’000sTotal
ZMW’000s
Short term benefits
Salary and fees 2,293 2,188 2,356 1,771 8,608
Bonus 5 5 258 5 273
Pension contributions 11 11 11 11 44
Airfare Allowance 461 461 142 384 1,448
Employment taxes 1,325 1,265 1,000 1,361 4,951
Total 4,095 3,930 4,117 3,182 15,324
2016Carl Irwin
ZMW’000s
Francis Grogan
ZMW’000sYusuf Koya ZMW’000s
Danny Museteka
ZMW’000sTotal
ZMW’000s
Short term benefits
Salary and fees 2,459 2,221 2,515 1,799 8,994
Bonus 2,679 2,679 128 128 5,614
Pension contributions 10 10 10 10 40
Employment taxes 2,745 2,622 1,406 1,114 7,887
Total 7,893 7,532 4,059 3,051 22,535
2017Carl Irwin USD’000s
Francis Grogan
USD’000sYusuf Koya
USD’000s
Danny MusetekaUSD’000s
Total USD’000s
Short term benefits
Salary and fees 241 230 247 186 904
Bonus 1 1 1 27 30
Pension contributions 1 1 1 1 4
Airfare Allowance 48 48 40 15 151
Employment taxes 139 133 143 105 520
Total 430 413 432 334 1,609
Notes to the Financial Statements continuedFor the year ended 30 September 2017

81
Corporategovernance
Financialstatements
Overview Strategicreport
Zambeef Products PLC Annual Report 2017
2016Carl Irwin USD’000s
Francis Grogan
USD’000sYusuf Koya
USD’000s
Danny MusetekaUSD’000s
Total USD’000s
Short term benefits
Salary and fees 227 205 232 166 830
Bonus 247 247 13 12 518
Pension contributions 1 1 1 1 4
Employment taxes 253 242 130 103 728
Total 728 695 375 282 2,080
Details of Directors’ contracts may be found in the Directors’ Report.
9. Finance costs
2017 2016
ZMW’000s USD’000s ZMW’000s USD’000s
Interest on bank loans and overdrafts 82,348 8,650 108,704 10,037
Finance lease cost 5,556 584 2,642 244
Total 87,904 9,234 111,346 10,281
8. Staff costs continued

82 Zambeef Products PLC Annual Report 2017
10. Taxation The Group has various tax rates applicable on the basis of individual entities being defined as agricultural entities or divisions (income tax rate of 10%) or manufacturing entities or divisions (income tax rate of 35%). The Group has further obtained tax holidays through investment incentives offered by the Zambian Government.
(i) In Zambian Kwacha 2017 2016
Group ZMW’000s
Company ZMW’000s
Group ZMW’000s
Company ZMW’000s
(a) Tax charge
Current tax:
Tax charge 12,878 11,145 17,896 12,403
12,878 11,145 17,896 12,403
Deferred tax:
Deferred taxation (note 9(e)) (11,829) 2,587 (7,098) (2,607)
Tax charge/(credit) for the year 1,049 13,732 10,798 9,796
Profit/(loss) before taxation 5,450 37,735 134,592 101,173
(b) Reconciliation of tax charge/(credit)
Taxation on accounting loss (6,872) 6,069 19,210 8,839
Effects of:
Permanent differences:
Disallowable expenses 1,191 1,496 4,304 1,887
Timing differences:
Capital allowances and depreciation 1,763 (10,626) (167) (1,071)
Livestock and crop valuations adjustment 3,283 3.250 (3,174) (3,110)
Other income (5) 4 2,907 -
Unrealised exchange (gains)/ losses 1,581 834 (6,999) (4,074)
Unrealised tax losses 11,937 10,118 1,815 9,932
Tax charge for the year 12,878 11,145 17,896 12,403
(c) Movement in taxation account
Taxation recoverable at 1 October 6,063 3,927 (2,983) (4,038)
Charge for the year 12,878 11,145 17,896 12,403
Arising on discontinued operation - -
Taxation paid (17,329) (13,484) (8,850) (4,438)
Taxation payable/ ( recoverable) as at 30 September 1,612 1,588 6,063 3,927
Analysed as follows:
Taxation payable 2,988 1,588 7,822 3,927
Taxation recoverable (1,376) - (1,759) -
1,612 1,588 6,063 3,927
(d) A self-assessment system for income tax was introduced for periods subsequent to 31 March 2004. Tax returns for the year ended 30 September 2017 will be made on the due date.
Notes to the Financial Statements continuedFor the year ended 30 September 2017

83
Corporategovernance
Financialstatements
Overview Strategicreport
Zambeef Products PLC Annual Report 2017
10. Taxation continued
2017 2016
Group ZMW’000s
Company ZMW’000s
Group ZMW’000s
Company ZMW’000s
(e) Deferred taxation
Represented by:
Biological valuation 11,005 10,644 9,792 9,398
Accelerated tax allowances 39,213 32,783 39,295 19,847
Provisions (6,974) (1,162) (4,580) (710)
Tax loss (79,400) (64,662) (68,834) (53,519)
(36,156) 22,397 (24,327) (24,984)
Analysis of movement:
Deferred tax asset as at 1 October (24,327) (24,984) (17,229) (22,377)
Charge/(credit) to profit and loss account (note 9(a)) (11,829) 2,587 (7,098) (2,607)
Arising on discontinued operations - - - -
Deferred tax asset as at 30 September (36,156) 22,397 (24,327) (24,984)
Deferred tax asset (43,368) (26,566) (28,366) (28,366)
Deferred tax liability 7,212 4,169 4,039 3,382
(ii) In US Dollars 2017 2016
Group USD’000s
Company USD’000s
Group USD’000s
Company USD’000s
(a) Tax charge
Current tax:
Tax charge 1,353 1,171 1,652 1,145
1,353 1,171 1,652 1,145
Deferred tax:
Deferred taxation (note 9(e)) (1,243) 271 (655) (241)
Tax charge/ (credit) for the year 110 1,442 997 904

84 Zambeef Products PLC Annual Report 2017
9. Taxation continued(b) Reconciliation of tax charge
2017 2016
Group USD’000s
Company USD’000s
Group USD’000s
Company USD’000s
Profit/(loss) before taxation 572 3,964 12,427 9,342
Taxation on accounting profit/(loss) (722) 638 1,774 816
Effects of:
Permanent differences:
Disallowable expenses 126 157 397 174
Timing differences:
Capital allowances and depreciation 185 (1,116) (15) (99)
Livestock and crop valuations adjustment 345 341 (293) (287)
Other income (1) - 268 -
Unrealised exchange (gains)/losses 166 1,063 (646) (376)
Unrealised tax loss 1,254 88 167 917
Tax charge for the year 1,353 1,171 1,652 1,145
(c) Movement in taxation account
2017 2016
Group USD’000s
Company USD’000s
Group USD’000s
Company USD’000s
Taxation recoverable at 1 October 605 392 (248) (336)
Charge for the year 1,353 1,171 1,652 1,145
Arising on discontinued operations - -
Taxation paid (1,820) (1,416) (817) (410)
Foreign exchange differences 29 17 18 (7)
Taxation payable /(recoverable) as at 30 September 167 164 605 392
Analysed as follows:
Taxation payable 309 164 781 392
Taxation recoverable (142) - (176) -
167 164 605 392
(d) A self-assessment system for income tax was introduced for periods subsequent to 31 March 2004. Tax returns for the year ended 30 September 2017 will be made on the due date.
Notes to the Financial Statements continuedFor the year ended 30 September 2017

85
Corporategovernance
Financialstatements
Overview Strategicreport
Zambeef Products PLC Annual Report 2017
10. Taxation continued
(e) Deferred taxation 2017 2016
Group USD’000s
Company USD’000s
Group USD’000s
Company USD’000s
Represented by:
Biological valuation 1,138 1,118 978 781
Accelerated tax allowances 4,055 3,444 3,926 1,651
Provisions (721) (122) (458) (59)
Tax loss (8,211) (6,756) (6,877) (4,869)
(3,739) (2,316) (2,431) (2,496)
Analysis of movement:
Deferred tax asset as at 1 October (2,431) (2,496) (1,433) (1,862)
Charge/(credit) to profit and loss account (note 9(a)) (1,243) 272 (655) (241)
Arising on discontinued operations - - -
Foreign exchange (65) (92) (343) (393)
Deferred tax asset as at 30 September (3,739) (2,316) (2,431) (2,496)
Deferred tax asset (4,485) (2,747) (2,834) (2,834)
Deferred tax liability 746 431 403 338
(3,739) (2,316) (2,431) (2,496)
11. Equity dividends
2017 2016
ZMW’000s USD’000s ZMW’000s USD’000s
Dividends declared or paid - - - -
There has been no dividend paid or proposed for 2017 (2016: ZMW nil).
12. Earnings per shareEarnings per shareBasic earnings per share have been calculated in accordance with IAS 33 which requires that earnings should be based on the net profit or loss attributable to ordinary shareholders and the weighted average number of ordinary shares in issue during the period.
The calculation of the basic earnings per share is based on the earnings attributable to ordinary shareholders divided by the weighted average number of shares in issue during the period.
The earnings and weighted average number of ordinary shares used in the calculation of basic earnings per share are as follows:
2017 2016
Basic earnings per share
ZMW’000s USD’000s ZMW’000s USD’000s
Profit/(loss) for the year 4,037 424 137,103 12,659
Weighted average number of ordinary shares for the purposes of basic and diluted earnings per share 300,579 300,579 250,170 250,170
Ngwee US cents Ngwee US cents
Basic earnings per share (ZMW and US cents) – Continued operations 1.72 0.18 41.38 3.82
Basic earnings per share (ZMW and US cents) – Discontinued operations (0.38) (0.04) 13.42 1.24

86 Zambeef Products PLC Annual Report 2017
2017 2016
Basic earnings per share
Total Basic earnings per share (ZMW and US cents) 1.34 0.14 54.80 5.06
Weighted average number of ordinary shares for the purposes of basic and diluted earnings per share (including preference shares) 300,579 300,579 254,339 254,339
Basic earnings per share (ZMW and US cents) – Continued operations 1.72 0.18 40.70 3.76
Basic earnings per share (ZMW and US cents) – Discontinued operations (0.38) (0.04) 13.21 1.22
Total Basic earnings per share (ZMW and US cents) 1.34 0.14 53.91 4.98
13. Goodwill
ZMW’000s USD’000s
Cost and Net Book Value
At 1 October 2015 15,699 1,306
Arising during the year 142,223 14,208
Foreign exchange difference - 262
At 30 September 2016 157,922 15,776
Arising during the year 8,879 918
Foreign exchange difference - 555
At 30 September 2017 166,801 17,249
For the purpose of annual impairment testing goodwill is allocated to the following cash-generating unit, which is the unit expected to benefit from the synergies of the business combinations in which the goodwill arises:
2017 2016
ZMW’000s USD’000s ZMW’000s USD’000s
Masterpork Limited 15,699 1,623 15,699 1,568
Zam Chick Limited 141,786 14,663 134,590 13,445
Zamhatch Limited 9,316 963 7,633 763
166,801 17,249 157,922 15,776
The Group tests annually for impairment, or more frequently if there are indicators that goodwill might be impaired. The recoverable amounts of the cash generating unit (CGU) is determined from value in use calculations.
The Board’s key assumptions are based on their past experience and future expectations of the market over the longer term. The Board estimates a discount rate of 15 per cent. post tax derived from the Group’s cost of external borrowing and dividend payment history, adjusted to reflect currency risk and price risk, in accordance with IAS 36 ‘Impairment of Assets’. Master Pork Limited is expected to achieve a minimum growth rate of Zambian inflation plus Zambian GDP growth, in light of its infrastructure, and continued increase in protein consumption in the domestic market.
Due to the significant headroom within historical impairment calculations (approximately 2 times utilising a discounted cash flow for a period of three years), assumptions including growth rates of cash flows and changes to selling prices and direct costs have not been sensitised.
The Board is not aware of any other changes that would necessitate changes to its calculations.
12. Earnings per share continued
Notes to the Financial Statements continuedFor the year ended 30 September 2017

87
Corporategovernance
Financialstatements
Overview Strategicreport
Zambeef Products PLC Annual Report 2017
14. Property, plant and equipment
(i) In Zambian Kwacha
(a) Group
Plantation development expenditure
ZMW’000s
Leasehold land and buildings
ZMW’000sAircraft
ZMW’000s
Plant and machinery ZMW’000s
Motor vehicles
ZMW’000s
Furniture and equipment ZMW’000s
Capital work in progress ZMW’000s
Total ZMW’000s
Cost or valuation
As at 1 October 2015 76,218 1,004,500 604,326 87,585 30,016 235,201 2,037,846
Exchange differences - (91,844) (58,343) (4,959) (922) (1,226) (157,294)
Additions 12,259 3,244 29,216 8,191 2,627 123,235 178,772
Transfers - 116,356 62,131 2,470 1,345 (182,350) (48)
Disposals - (619) (2,305) (2,630) (114) - (5,668)
Reclassification - - - 190 (190) - (24) (24)
As at 30 September 2016 88,477 1,031,637 635,215 90,467 32,952 174,836 2,053,584
Exchange differences (1,346) (6,744) (981) (1,676) (2,157) (12,904)
Additions 13,805 63,332 865 100,863 9,704 6,611 14,235 209,415
Disposals (166) (2,098) 51 (2,213)
Transfers
Surplus/ (deficit) on revaluation 720,622 (117,250) (48,415) (21,372) 533,585
Reclassification
As at 30 September 2017 102,282 1,814,079 865 612,084 48,677 16,566 186,914 2,781,688
Depreciation
As at 1 October 2015 (4,606) 17,689 73,925 29,743 6,641 - 123,392
Exchange difference - (1,746) (5,638) (2,058) (646) - (10,088)
Charge for the year - 9,744 47,230 17,689 3,121 - 77,784
Depreciation on Palm Plantation (1,219) - - - - - (1,219)
Disposals - (181) (434) (52) - (667)
Transfers - - - 114 - - 114
Reclassification - - 76 (76) - - -
As at 30 September 2016 (5,825) 25,687 - 115,412 44,978 9,064 - 189,316
Exchange difference (388) - (1,531) (623) (458) - (3,000)
Charge for the year 10,612 50 50,570 19,489 3,820 - 84,541
Depreciation on Palm Plantation (1,239) (1,239)
Disposals (82) (7,411) (9) - (7,502)
Revaluation (33,618) (50) (153,329) (57,857) (11,356) - (256,210)
As at 30 September 2017 (7,064) 2,293 - 11,124 5,302 1,098 (1,019) 11,733
Net book value
At 30 September 2017 109,346 1,811,786 865 601,044 43,375 15,505 186,914 2,768,835
At 30 September 2016 94,302 1,005,950 519,803 45,489 23,888 174,836 1,864,268

88 Zambeef Products PLC Annual Report 2017
(ii) In US Dollars
(a) Group
Plantation development expenditure
USD’000s
Leasehold land and buildings
USD’000sAircraft
USD’000s
Plant and machinery USD’000s
Motor vehicles
USD’000s
Furniture and equipment USD’000s
Capital work in progress USD’000s
Total USD’000s
Cost or valuation
As at 1 October 2015 6,341 83,569 - 50,277 7,286 2,497 19,567 169,537
Foreign translation 1,366 8,505 4,943 1,027 439 3,359 19,639
Additions 1,132 300 2,698 756 243 11,379 16,508
Transfers - 10,744 5,737 228 124 (16,837) (4)
Disposals - (57) (213) (243) (11) - (524)
Reclassification - - 18 (18) - - -
As at 30 September 2016 8,839 103,061 63,460 9,036 3,292 17,468 205,156
Foreign translation 288 2,207 1,558 285 1,250 365 4,692
Additions 1,450 6,653 91 10,595 1,019 694 1,495 21,997
Disposals (17) (220) 5 (232)
Surplus/ (deficit) on revaluation - 75,696 (12,316) (5,086) (3,529) 56,049
Reclassification
As at 30 September 2017 10,577 187,600 91 63,297 5,034 1,712 19,328 287,662
As at 1 October 2015 (383) 1,471 6,150 2,474 553 - 10,265
Charge for the year - 900 4,361 1,633 288 - 7,182
Depreciation on Palm Plantation (113) - - - - - (113)
Disposals - - (17) (40) (5) - (62)
Transfer - - - 11 - - 11
Reclassification - - 7 (7) - - -
Disposal of subsidiary - (204) (1,646) (129) (30) - (2,009)
Foreign Translation (86) 195 1,031 423 69 - 1,632
As at 30 September 2016 (582) 2,566 11,532 4,494 905 - 18,915
Charge for the year 1,115 5 5,312 2,047 401 - 8,880
Depreciation on Palm Plantation (130) (130)
Disposals (9) (71) (1) - (81)
Revaluation (3,531) (5) (16,106) (6,077) (1,190) (26,909)
Foreign Translation (19) 91 412 156 (9) - 631
As at 30 September 2017 (731) 241 - 1,141 549 106 - 1,306
Net book value
At 30 September 2017 11,308 187,359 91 62,156 4,485 1,606 19,328 286,333
At 30 September 2016 9,421 100,495 51,928 4,542 2,387 17,468 186,241
14. Property, plant and equipment continued
Notes to the Financial Statements continuedFor the year ended 30 September 2017

89
Corporategovernance
Financialstatements
Overview Strategicreport
Zambeef Products PLC Annual Report 2017
(a) The depreciation charge for the year includes ZMW23.4 million (USD2.5 million) (2016: ZMW18.9 million [USD1.7 million]) which relates to the surplus over the original cost of fixed assets shown at a valuation. As this amount should not be taken to reduce the Group’s distributable reserve, an equivalent amount has been transferred to distributable reserve from revaluation reserve.(b) The carrying value of the Group’s property, plant and equipment includes an amount of ZMW49.6 million (USD5.1 million) (2016: ZMW33.7 million [USD3.4 million]) in respect of assets held under finance leases. The depreciation charged to the income statement in respect of such assets amounted to ZMW2.9 million (USD0.3 million) (2016: ZMW3.3 million [USD0.16 million]).(c) The capital work in progress depicts all capital expenditure items on projects that are yet to be completed.(d) In the opinion of the Directors, the carrying values of property, plant and equipment stated above are not higher than their fair values.
(i) In Zambian Kwacha
(b) Company
Leasehold land and buildings
ZMW’000s
Plant and machinery ZMW’000s
Motor vehicles
ZMW’000s
Furniture and
equipment ZMW’000s
Capital work in progress ZMW’000s
Total ZMW’000s
Cost or valuation
At 1 October 2015 832,565 452,460 39,637 6,184 24,600 1,355,446
Exchange differences (84,671) (47,484) (2,281) (111) (904) (135,451)
Additions 3,235 965 1,854 307 41,801 48,162
Transfers 1,329 10,514 501 235 (10,456) 2,123
Disposals (619) (540) (1,369) (17) - (2,545)
Reclassification 982 (982)
At 30 September 2016 751,839 416,897 37,360 6,598 55,041 1,267,735
Exchange differences
(8,670)
(7,134)
(712) (131) - (16,647)
Additions 31,468 71,722 6,283 2,503 75,230 187,206
Transfers 48,374 44,599 11,536 1,798 (102,376) (19,141)
Disposals (166) - (551) - - (717)
Revaluation 608,447 (96,132) (14,021) (970) - 497,324
As at 30 September 2017 1,431,292 429,952 16,823 9,798 27,985 1,915,760
Depreciation
As at 1 October 2015 9,580 41,617 11,455 984 - 63,636
Charge for the year 5,710 30,151 7,239 628 - 43,728
Disposals (98) (35) (1,518) (5) - (1,656)
Transfers - 428 114 - - 542
As at 30 September 2016 15,192 72,161 17,290 1,607 - 106,250
Charge for the year 5,485 29,669 5,809 743 - 41,706
Transfers 3,315 5,787 3,518 565 - 13,185
Disposals - (82) (6.862) - - (6,944)
Depreciation no longer required (23,992) (107,535) (19,755) (2,915) - (154,197)
As at 30 September 2017 - - - - - -
Net book value
At 30 September 2017 1,431,292 429,952 16,823 9,798 27,895 1,915,760
At 30 September 2016 736,647 344,736 20,070 4,991 55,041 1,161,485
14. Property, plant and equipment continued

90 Zambeef Products PLC Annual Report 2017
(ii) In US Dollars
(b) Company
Leasehold land and buildings
USD’000s
Plant and machinery USD’000s
Motor vehicles
USD’000s
Furniture and
equipment USD’000s
Capital work in progress USD’000s
Total USD’000s
Cost or valuation
As at 1 October 2015 69,265 37,643 3,297 514 2,047 112,766
Exchange differences (7,818) (4,385) (211) (10) (83) (12,507)
Additions 299 89 171 28 3,860 4,447
Transfers 109 396 13 13 (531) -
Disposals (57) (50) (126) (2) - (235)
Foreign translation 13,298 7,289 645 106 641 21,979
Reclassification 94 (94)
As at 30 September 2016 75,110 41,650 3,728 658 5,501 126,646
Exchange differences (911) (749) (75) (14) - (1,749)
Additions 3,305 7,534 660 263 7,902 19,664
Transfers 5,082 4,685 (1,212) 189 (10,754) (2,010)
Disposals (17) - (58) - - (75)
Foreign translation 1,532 1,444 167 19 237 3,398
Surplus/ (deficit) on revaluation 63,913 (10,098) (1,473) (102) - 52,240
As at 30 September 2017 148,014 44,462 1,740 1,013 2,885 198,114
Depreciation
As at 1 October 2015 797 3,462 953 82 - 5,294
Charge for the year 527 2,784 668 58 - 4,037
Foreign translation 203 927 235 21 - 1,386
Disposals (9) (3) (140) (1) - (153)
Transfers - 40 10 - - 50
As at 30 September 2016 1,518 7,210 1,726 160 - 10,614
Charge for the year 576 3,116 610 79 - 4,381
Disposals - (9) (721) (730)
Transfers 348 608 370 59 - 1,385
Foreign translation 78 371 91 8 - 548
Depreciation no longer required (2,520) (11,296) (2,075) (306) - (16,197)
As at 30 September 2017
Net book value
At 30 September 2017 148,014 44,462 1,740 1,013 2,885 198,114
At 30 September 2016 73,592 34,374 2,005 498 5,500 116,032
(a) The carrying value of the Company’s property, plant and equipment includes an amount of ZMW25.2 million (USD2.6 million) (2016: ZMW12.6 million [USD1.3 million]) in respect of assets held under finance leases. The depreciation charged to the income statement in respect of such assets amounted to ZMW0.367 million (USD0.039 million) (2016: ZMW1.7 million [USD0.15 million]).
(b) In the opinion of the Directors, the carrying values of property, plant and equipment stated above are not higher than their fair values.
14. Property, plant and equipment continued
Notes to the Financial Statements continuedFor the year ended 30 September 2017
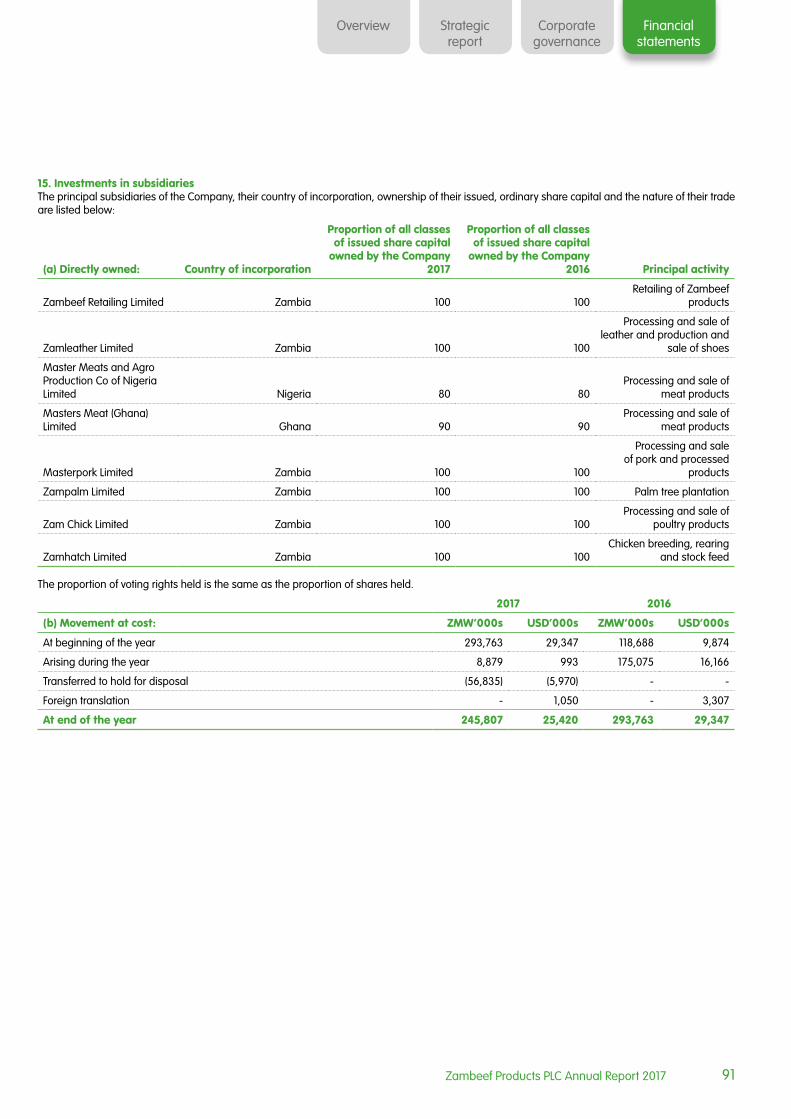
91
Corporategovernance
Financialstatements
Overview Strategicreport
Zambeef Products PLC Annual Report 2017
15. Investments in subsidiaries The principal subsidiaries of the Company, their country of incorporation, ownership of their issued, ordinary share capital and the nature of their trade are listed below:
(a) Directly owned: Country of incorporation
Proportion of all classes of issued share capital
owned by the Company 2017
Proportion of all classes of issued share capital
owned by the Company 2016 Principal activity
Zambeef Retailing Limited Zambia 100 100Retailing of Zambeef
products
Zamleather Limited Zambia 100 100
Processing and sale of leather and production and
sale of shoes
Master Meats and Agro Production Co of Nigeria Limited Nigeria 80 80
Processing and sale of meat products
Masters Meat (Ghana) Limited Ghana 90 90
Processing and sale of meat products
Masterpork Limited Zambia 100 100
Processing and sale of pork and processed
products
Zampalm Limited Zambia 100 100 Palm tree plantation
Zam Chick Limited Zambia 100 100Processing and sale of
poultry products
Zamhatch Limited Zambia 100 100Chicken breeding, rearing
and stock feed
The proportion of voting rights held is the same as the proportion of shares held.
2017 2016
(b) Movement at cost: ZMW’000s USD’000s ZMW’000s USD’000s
At beginning of the year 293,763 29,347 118,688 9,874
Arising during the year 8,879 993 175,075 16,166
Transferred to hold for disposal (56,835) (5,970) - -
Foreign translation - 1,050 - 3,307
At end of the year 245,807 25,420 293,763 29,347

92 Zambeef Products PLC Annual Report 2017
(c) The Company’s interests in its subsidiaries, which are unlisted, are as follows:
Name of companyCountry of
IncorporationAssets
ZMW’000sLiabilities
ZMW’000sRevenues
ZMW’000sProfit/(loss) ZMW’000s
Zambeef Retailing Limited Zambia 653,093 619,909 1,440,784 (25,930)
Zamleather Limited Zambia 55,853 19,814 31,571 (6,894)
West Africa OperationsNigeria &
Ghana 47,664 86,173 164,174 (4,782)
Masterpork Limited Zambia 283,585 199,902 243,491 2,177
Zampalm Limited Zambia 221,418 140,263 238 (1,133)
Zam Chick Limited Zambia 497,189 333,879 230,931 12,015
Zamhatch Limited Zambia 313,362 217,484 71,103 1,021
Total at the end of 30 September 2017 2,072,164 1,617,424 2,182,292 (23,526)
Zambeef Retailing Limited Zambia 416,285 385,325 1,363,809 34,613
Zamleather Limited Zambia 48,076 18,430 33,037 (1,849)
West Africa OperationsNigeria &
Ghana 40,351 74,569 52,535 (9,821)
Masterpork Limited Zambia 146,472 84,902 234,474 398
Zampalm Limited Zambia 189,813 107,524 135 (1,563)
Zam Chick Limited Zambia 302,088 201,745 224,331 19,634
Zamhatch Limited Zambia 192,716 140,143 54,464 24,620
Total at the end of 30 September 2016 1,335,801 1,012,638 1,962,785 66,032
Name of companyCountry of
IncorporationAssets
USD’000sLiabilities USD’000s
Revenues USD’000s
Profit/(loss) USD’000s
Zambeef Retailing Limited Zambia 67,538 64,106 151,343 (2,724)
Zamleather Limited Zambia 5,776 2,049 3,316 (724)
West Africa OperationsNigeria &
Ghana 4,929 8,911 17,245 (502)
Masterpork Limited Zambia 29,326 20,762 25,577 229
Zampalm Limited Zambia 22,897 14,505 25 (119)
Zam Chick Limited Zambia 51,416 34,527 24,257 1,262
Zamhatch Limited Zambia 32,406 21,656 7,469 107
Total at the end of 30 September 2017 214,288 166,516 229,232 (2,471)
Zambeef Retailing Limited Zambia 41,587 38,838 125,929 3,196
Zamleather Limited Zambia 4,803 1,841 3,051 (171)
West Africa OperationsNigeria &
Ghana 4,031 7,449 5,248 (907)
Masterpork Limited Zambia 14,633 8,482 21,650 37
Zampalm Limited Zambia 18,962 10,742 12 (146)
Zam Chick Limited Zambia 30,179 20,154 20,714 1,813
Zamhatch Limited Zambia 19,252 14,000 5,029 2,273
Total at the end of 30 September 2016 133,447 101,506 181,633 6,095
15. Investments in subsidiaries continued
Notes to the Financial Statements continuedFor the year ended 30 September 2017
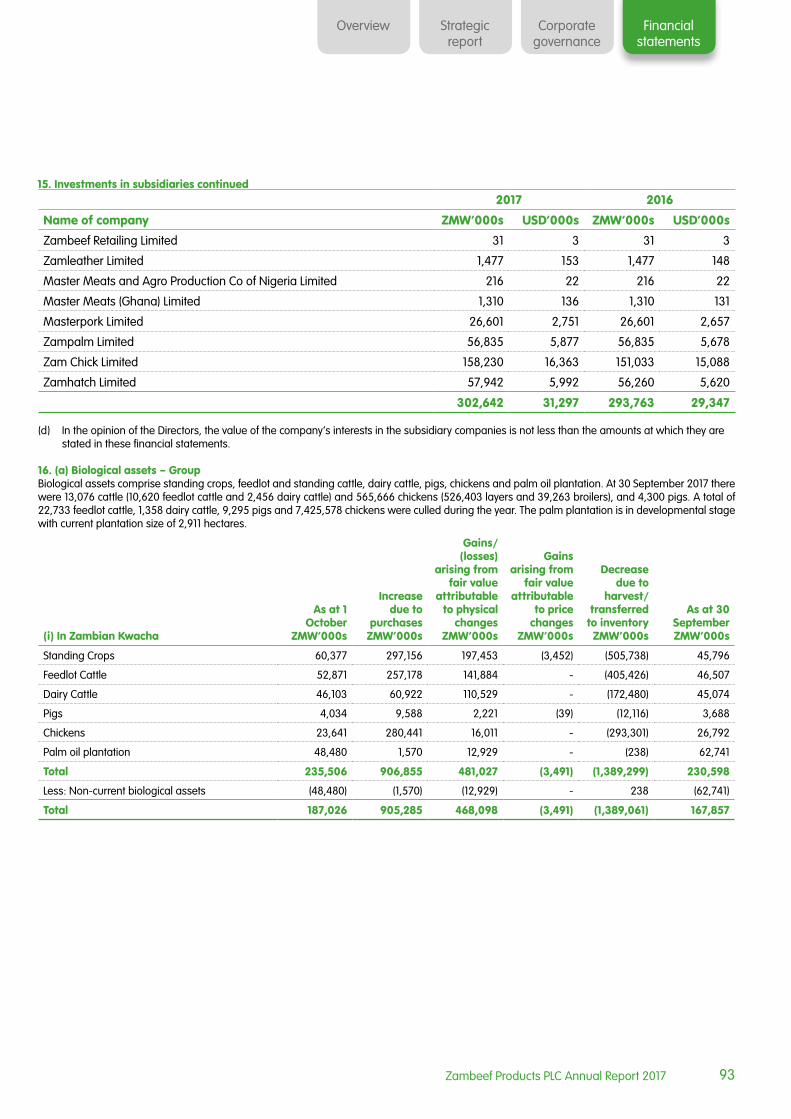
93
Corporategovernance
Financialstatements
Overview Strategicreport
Zambeef Products PLC Annual Report 2017
2017 2016
Name of company ZMW’000s USD’000s ZMW’000s USD’000s
Zambeef Retailing Limited 31 3 31 3
Zamleather Limited 1,477 153 1,477 148
Master Meats and Agro Production Co of Nigeria Limited 216 22 216 22
Master Meats (Ghana) Limited 1,310 136 1,310 131
Masterpork Limited 26,601 2,751 26,601 2,657
Zampalm Limited 56,835 5,877 56,835 5,678
Zam Chick Limited 158,230 16,363 151,033 15,088
Zamhatch Limited 57,942 5,992 56,260 5,620
302,642 31,297 293,763 29,347
(d) In the opinion of the Directors, the value of the company’s interests in the subsidiary companies is not less than the amounts at which they are stated in these financial statements.
16. (a) Biological assets – GroupBiological assets comprise standing crops, feedlot and standing cattle, dairy cattle, pigs, chickens and palm oil plantation. At 30 September 2017 there were 13,076 cattle (10,620 feedlot cattle and 2,456 dairy cattle) and 565,666 chickens (526,403 layers and 39,263 broilers), and 4,300 pigs. A total of 22,733 feedlot cattle, 1,358 dairy cattle, 9,295 pigs and 7,425,578 chickens were culled during the year. The palm plantation is in developmental stage with current plantation size of 2,911 hectares.
(i) In Zambian Kwacha
As at 1 October
ZMW’000s
Increase due to
purchases ZMW’000s
Gains/(losses)
arising from fair value
attributable to physical
changes ZMW’000s
Gains arising from
fair value attributable
to price changes
ZMW’000s
Decrease due to
harvest/transferred
to inventoryZMW’000s
As at 30 SeptemberZMW’000s
Standing Crops 60,377 297,156 197,453 (3,452) (505,738) 45,796
Feedlot Cattle 52,871 257,178 141,884 - (405,426) 46,507
Dairy Cattle 46,103 60,922 110,529 - (172,480) 45,074
Pigs 4,034 9,588 2,221 (39) (12,116) 3,688
Chickens 23,641 280,441 16,011 - (293,301) 26,792
Palm oil plantation 48,480 1,570 12,929 - (238) 62,741
Total 235,506 906,855 481,027 (3,491) (1,389,299) 230,598
Less: Non-current biological assets (48,480) (1,570) (12,929) - 238 (62,741)
Total 187,026 905,285 468,098 (3,491) (1,389,061) 167,857
15. Investments in subsidiaries continued

94 Zambeef Products PLC Annual Report 2017
(ii) In US Dollars
As at 1 October
USD’000s
Foreign exchange USD’000s
Increase due to
purchases USD’000s
Gains/(losses)
arising from fair value
attributable to physical
changes USD’000s
Gains arising from
fair value attributable
to price changes
USD’000s
Decrease due to
harvest/transferred
to inventory USD’000s
As at 30 September USD’000s
Standing Crops 6,031 237 31,214 20,741 (363) (53,124) 4,736
Feedlot Cattle 5,282 197 27,015 14,904 - (42,587) 4,811
Dairy Cattle 4,606 163 6,399 11,610 - (18,118) 4,660
Pigs 403 15 1,007 233 (4) (1,273) 381
Chickens 2,362 78 29,458 1,682 - (30,809) 2,771
Palm oil plantation 4,843 147 165 1,358 - (25) 6,488
Total 23,527 837 95,258 50,528 (367) (145,936) 23,847
Less: Non-current biological assets (4,843) (147) (165) (1,358) - 25 (6,488)
Total 18,684 690 95,093 49,170 (367) (145,911) 17,359
16. (b) Biological assets – CompanyBiological assets comprise standing crops, feedlot and standing cattle, dairy cattle, and chickens. At 30 September 2017 there were 13,076 cattle (10,620 feedlot cattle and 2,456 dairy cattle), and 351,959 chickens (351,959 layers). A total of 22,733 feedlot cattle and 1,358 dairy cattle were culled during the year.
(i) In Zambian Kwacha
As at 1 October
ZMW’000s
Increase due to
purchases ZMW’000s
Gains/(losses)
arising from fair value
attributable to physical
changes ZMW’000s
Gains arising from
fair value attributable
to price changes
ZMW’000s
Decrease due to
harvest/transferred
to inventory ZMW’000s
As at 30 SeptemberZMW’000s
Standing Crops 60,377 297,156 197,453 (3,452) (505,738) 45,796
Feedlot Cattle 52,875 257,178 141,884 - (405,430) 46,507
Dairy Cattle 46,101 60,922 110,529 - (172,478) 45,074
Chickens 11,158 52,537 6,745 - (57,730) 12,710
Total 170,511 667,793 456,611 (3,452) (1,141,376) 150,087
(ii) In US Dollars
As at 1 October
USD’000s
Foreign exchangeUSD’000s
Increase due to
purchasesUSD’000s
Gains/(losses)
arising from fair value
attributable to physical
changes USD’000s
Gains arising from
fair value attributable
to price changes
USD’000s
Decrease due to
harvest/transferred
to inventoryUSD’000s
As at 30 SeptemberUSD’000s
Standing Crops 6,031 236 31,214 20,741 (363) (53,124) 4,735
Feedlot Cattle 5,283 195 27,015 14,904 - (42,587) 4,810
Dairy Cattle 4,606 163 6,399 11,610 - (18,117) 4,661
Chickens 1,114 37 5,519 709 - (6,064) 1,315
Total 17,034 631 70,147 47,964 (363) (119,892) 15,521
16. (a) Biological assets – Group continued
Notes to the Financial Statements continuedFor the year ended 30 September 2017

95
Corporategovernance
Financialstatements
Overview Strategicreport
Zambeef Products PLC Annual Report 2017
17. Inventories
2017 2016
(i) In Zambian KwachaGroup
ZMW’000sCompany
ZMW’000sGroup
ZMW’000sCompany
ZMW’000s
Trading stocks 241,289 195,697 298,317 231,740
Abattoir stocks 6,217 - 3,282 -
Raw materials 78,820 - 6,377 -
Stock feed 17,621 85,491 58,212 54,467
Consumables 169,693 130,653 176,269 127,463
Raw hides and chemicals 2,778 - 2,282 -
516,418 411,841 544,739 413,670
2017 2016
(ii) In US DollarsGroup
USD’000sCompany USD’000s
Group USD’000s
Company USD’000s
Trading stocks 24,953 20,238 29,802 23,151
Abattoir stocks 643 - 328 -
Raw materials 8,151 - 637 -
Stock feed 1,822 8,841 5,815 5,552
Consumables 17,548 13,511 17,609 12,623
Raw hides and chemicals 287 - 228 -
53,404 42,590 54,419 41,326
A total of ZMW1,633.1 million (USD171.5 million) (2016: ZMW1,513.5 million (USD139.7 million]) was included in profit and loss as an expense within cost of sales. Inventory was turned every 118 days (2016: 116 days).
Biological assets totalling ZMW1,389.1 million (USD145.9 million) (2016: ZMW944.7 million [USD87.2 million]) were transferred to inventories during the year.
18. Trade and other receivables
2017 2016
(i) In Zambian KwachaGroup
ZMW’000sCompany
ZMW’000sGroup
ZMW’000sCompany
ZMW’000s
Gross trade receivables 66,155 28,227 92,150 33,303
Less: provision for impairment of trade receivables (4,504) (2,254) (5,475) (2,033)
Trade receivables 61,651 25,973 86,675 31,270
Prepayments 28,474 11,196 26,019 14,596
Other receivables 667 - 457 -
90,792 37,169 113,151 45,866

96 Zambeef Products PLC Annual Report 2017
18. Trade and other receivables continued
2017 2016
(ii) In US DollarsGroup
USD’000Company USD’000
Group USD’000
Company USD’000
Gross trade receivables 6,842 2,919 9,206 3,327
Less: provision for impairment of trade receivables (466) (233) (547) (203)
Trade receivables 6,376 2,686 8,659 3,124
Prepayments 2,945 1,158 2,599 1,458
Other receivables 69 - 46 -
9,390 3,844 11,304 4,582
(a) Provision for impairment of trade receivablesThe Directors have made a provision against some of the trade receivables that are long standing. Before accepting any new customer, the Group assesses the potential customer’s credit quality and defines credit limits by customer.
The fair value of these short term financial assets is not individually determined as the carrying amount is a reasonable approximation of fair value.
Movements on the Group’s provision for impairment of trade receivables are set out in the table below:
2017 2016
(i) In Zambian KwachaGroup
ZMW’000sCompany
ZMW’000sGroup
ZMW’000sCompany
ZMW’000s
At 1 October 5,475 2,033 1,438 226
Utilised (1,002) - 202 (214)
Arising on discontinued operations - -
Charge for the year 313 218 3,835 2,021
At 30 September 4,786 2,254 5,475 2,033
2017 2016
(ii) In US DollarsGroup
USD’000sCompany USD’000s
Group USD’000s
Company USD’000s
At 1 October 547 203 120 19
Foreign exchange (9) 7 54 17
Utilised (105) - 19 (20)
Charge for the year 33 23 354 187
At 30 September 466 233 547 203
Trade receivables have a 15 or 30 day credit period.
Some of the unimpaired trade receivables are past due as at the reporting date. Financial assets past due but not impaired are shown below:
2017 2016
(i) In Zambian KwachaGroup
ZMW’000s Company
ZMW’000sGroup
ZMW’000sCompany
ZMW’000s
More than 3 months but not more than 6 months 2,691 541 2,365 672
More than 6 months but not more than a year - - - -
More than one year - - - -
Total 2,691 541 2,365 672
Notes to the Financial Statements continuedFor the year ended 30 September 2017

97
Corporategovernance
Financialstatements
Overview Strategicreport
Zambeef Products PLC Annual Report 2017
2017 2016
(ii) In US DollarsGroup
USD’000s Company USD’000s
Group USD’000s
Company USD’000s
More than 3 months but not more than 6 months 278 56 236 67
More than 6 months but not more than a year - - - -
More than one year - - - -
Total 278 56 236 67
Management reviews recoverability of trade receivables on a continuous basis and where necessary makes provision for impairment on long outstanding receivables. 19. Amounts due from related companies
2017 2016
(i) In Zambian KwachaGroup
ZMW’000s Company
ZMW’000sGroup
ZMW’000sCompany
ZMW’000s
Leopard Investments Company Limited 565 703 2,034 1,626
Tractorzam Limited 162 162 258 258
Zambezi Ranching and Cropping Limited 10,385 6,153 5,924 -
Tembilo Farms Limited - 247 -
Wellspring Limited 6 6 1,861 1,861
Squares Ranch 304 304 -
Zambia Pig Genetics Limited - 279 219 219
Zambeef Retailing Limited - - - 3,780
Zamleather Limited - 12,464 - 4,200
Masterpork Limited - - - 29,701
Zampalm Limited - 82,807 - 55,100
Master Meats & Agro Production Co. of Nigeria Limited - 56,603 - 42,756
Zam Chick Limited - 325,381 - 195,649
Master Meats (Ghana) Limited - 720 - 531
Zamhatch Limited - 169,478 - 127,433
11,422 655,060 10,543 463,114
18. Trade and other receivables continued

98 Zambeef Products PLC Annual Report 2017
19. Amounts due from related companies continued
2017 2016
(ii) In US DollarsGroup
USD’000sCompany USD’000s
Group USD’000s
Company USD’000s
Leopard Investments Company Limited 58 73 203 162
Tractorzam Limited 17 17 26 26
Zambezi Ranching and Cropping 1,074 636 591 -
Tembilo Farms Limited - 25 -
Wellspring Limited 1 - 186 186
Squares Ranch 31 31 -
Zambia Pig Genetics - 29 22 22
Zambeef Retailing Limited - - - 378
Zamleather Limited - 1,289 - 420
Master Pork Limited - - - 2,967
Zampalm Limited - 8,563 - 5,504
Zam Chick Limited - 33,649 - 19,545
Master Meats & Agro Production Co. of Nigeria Limited - 5,854 - 4,271
Master Meats (Ghana) Limited - 74 - 53
Zamhatch Limited - 17,526 - 12,731
1,181 67,741 1,053 46,265
The above balances relate to arm’s length transactions between the transacting parties. External parties that fall under the ‘Related Party’ disclosure are with respect to all common shareholding companies of the Board of Directors of the Group. Unless otherwise stated, none of the transactions incorporate special terms and conditions and no guarantees were given or received. Outstanding balances are usually settled in cash.
20. Cash and cash equivalents
2017 2016
(i) In Zambian KwachaGroup
ZMW’000sCompany
ZMW’000sGroup
ZMW’000sCompany
ZMW’000s
Cash in hand and at bank 62,518 16,509 95,747 52,239
Bank overdrafts (note (b)) (167,666) (41,944) (30,941) (15,046)
(105,148) (25,435) 64,806 37,193
2017 2016
(ii) In US DollarsGroup
USD’000sCompany USD’000s
Group USD’000s
Company USD’000s
Cash in hand and at bank 6,465 1,707 9,565 5,219
Bank overdrafts (note (b)) (17,339) (4,337) (3,091) (1,503)
(10,874) (2,630) 6,474 3,716
Notes to the Financial Statements continuedFor the year ended 30 September 2017
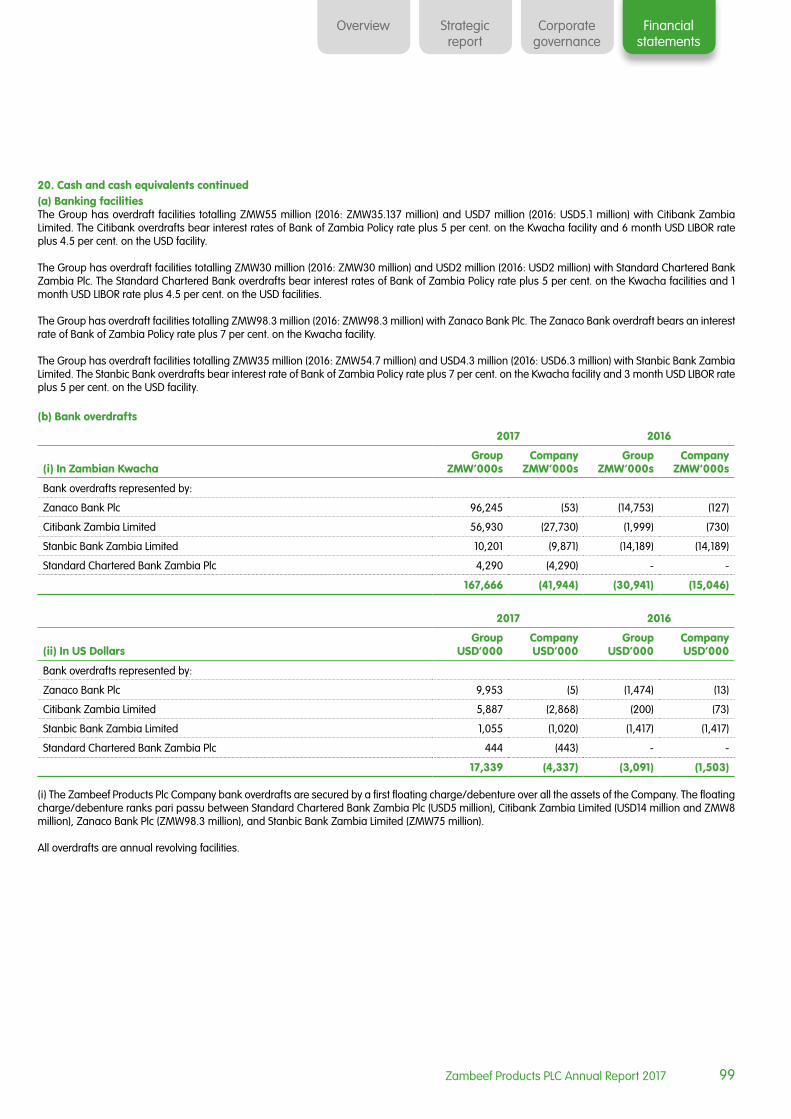
99
Corporategovernance
Financialstatements
Overview Strategicreport
Zambeef Products PLC Annual Report 2017
20. Cash and cash equivalents continued(a) Banking facilitiesThe Group has overdraft facilities totalling ZMW55 million (2016: ZMW35.137 million) and USD7 million (2016: USD5.1 million) with Citibank Zambia Limited. The Citibank overdrafts bear interest rates of Bank of Zambia Policy rate plus 5 per cent. on the Kwacha facility and 6 month USD LIBOR rate plus 4.5 per cent. on the USD facility.
The Group has overdraft facilities totalling ZMW30 million (2016: ZMW30 million) and USD2 million (2016: USD2 million) with Standard Chartered Bank Zambia Plc. The Standard Chartered Bank overdrafts bear interest rates of Bank of Zambia Policy rate plus 5 per cent. on the Kwacha facilities and 1 month USD LIBOR rate plus 4.5 per cent. on the USD facilities.
The Group has overdraft facilities totalling ZMW98.3 million (2016: ZMW98.3 million) with Zanaco Bank Plc. The Zanaco Bank overdraft bears an interest rate of Bank of Zambia Policy rate plus 7 per cent. on the Kwacha facility.
The Group has overdraft facilities totalling ZMW35 million (2016: ZMW54.7 million) and USD4.3 million (2016: USD6.3 million) with Stanbic Bank Zambia Limited. The Stanbic Bank overdrafts bear interest rate of Bank of Zambia Policy rate plus 7 per cent. on the Kwacha facility and 3 month USD LIBOR rate plus 5 per cent. on the USD facility.
(b) Bank overdrafts
2017 2016
(i) In Zambian KwachaGroup
ZMW’000sCompany
ZMW’000sGroup
ZMW’000sCompany
ZMW’000s
Bank overdrafts represented by:
Zanaco Bank Plc 96,245 (53) (14,753) (127)
Citibank Zambia Limited 56,930 (27,730) (1,999) (730)
Stanbic Bank Zambia Limited 10,201 (9,871) (14,189) (14,189)
Standard Chartered Bank Zambia Plc 4,290 (4,290) - -
167,666 (41,944) (30,941) (15,046)
2017 2016
(ii) In US DollarsGroup
USD’000Company USD’000
Group USD’000
Company USD’000
Bank overdrafts represented by:
Zanaco Bank Plc 9,953 (5) (1,474) (13)
Citibank Zambia Limited 5,887 (2,868) (200) (73)
Stanbic Bank Zambia Limited 1,055 (1,020) (1,417) (1,417)
Standard Chartered Bank Zambia Plc 444 (443) - -
17,339 (4,337) (3,091) (1,503)
(i) The Zambeef Products Plc Company bank overdrafts are secured by a first floating charge/debenture over all the assets of the Company. The floating charge/debenture ranks pari passu between Standard Chartered Bank Zambia Plc (USD5 million), Citibank Zambia Limited (USD14 million and ZMW8 million), Zanaco Bank Plc (ZMW98.3 million), and Stanbic Bank Zambia Limited (ZMW75 million).
All overdrafts are annual revolving facilities.

100 Zambeef Products PLC Annual Report 2017
21. Share capital
(a) Ordinary share capital
2017 2016
ZMW’000s USD’000s ZMW’000s USD’000s
Authorised
700,000,000 ordinary shares of ZMW0.01 each 7,000 938 7,000 938
(2016 : 700,000,000 ordinary shares of ZMW0.01 each)
Issued and fully paid
At 1 October 3,006 449 2,480 396
Issued during the year - - 526 53
At 30 September
300,579,590 ordinary shares of ZMW0.01 each 3,006 449 3,006 449
(2016 : 300,579,590 ordinary shares of ZMW0.01 each)
(b) Preference share capital
Issued and fully paid
At 1 October 1,000 100 - -
Issued during the year - - 1,000 100
At 30 September
100,057,658 preference shares of ZMW0.01 each 1,000 100 1,000 100
(2016 : 100,057,658 preference shares of ZMW0.01 each)
(c) At an Extraordinary General Meeting (EGM) held on 8 September 2016, the shareholders approved the alteration of the authorised share capital from 400,000,000 shares with a par value of ZMW0.01 each to 700,000,000 shares with a par value of ZMW0.01. The EGM also approved the issue of 52,601,435 ordinary shares with a par value of ZMW0.01 and 100,057,658 preference shares with a par value of ZMW0.01.
22. Share premium
2017 2016
ZMW’000s USD’000s ZMW’000s USD’000s
At 1 October 1,125,012 185,095 506,277 123,283
Arising during the year - - 618,735 61,812
At 30 September 1,125,012 185,095 1,125,012 185,095
23. Interest bearing liabilities
2017 2016
(i) In Zambian KwachaGroup
ZMW’000sCompany
ZMW’000sGroup
ZMW’000sCompany
ZMW’000s
DEG – Deutsche Investitions- und Entwicklungsgesellschaft mbH (note (a)) 220,573 220,573 128,228 128,228
Zanaco Bank Plc (note (b)) 26,571 26,571 33,214 33,214
Standard Chartered Bank Zambia Plc (note (c)) 60,248 60,248 118,849 118,849
IFC – International Finance Corporation (note (d)) 159,174 159,174 216,515 210,837
466,566 466,566 496,806 491,128
Less: Short term portion (repayable within next 12 months) (138,328) (138,328) (235,072) (229,394)
Long term portion (repayable after 12 months) 328,238 328,238 261,734 261,734
Notes to the Financial Statements continuedFor the year ended 30 September 2017

101
Corporategovernance
Financialstatements
Overview Strategicreport
Zambeef Products PLC Annual Report 2017
24. Interest bearing liabilities
2017 2016
(ii) In US DollarsGroup
USD’000sCompany USD’000s
Group USD’000s
Company USD’000s
DEG – Deutsche Investitions- und Entwicklungsgesellschaft mbH (note (a)) 22,810 22,810 12,810 12,810
Zanaco Bank Plc (note (b)) 2,748 2,748 3,318 3,318
Standard Chartered Bank Zambia Plc (note (c)) 6,230 6,231 11,873 11,873
IFC – International Finance Corporation (note (d)) 16,460 16,461 21,630 21,062
48,248 48,250 49,631 49,063
Less: Short term portion (repayable within next 12 months) (14,304) (14,305) (23,484) (22,916)
Long term portion (repayable after 12 months) 33,944 33,945 26,147 26,147
(a) (i) DEG Term Loan 2The Group has a loan facility of USDNil million (2016: USD3.58 million and original amount of USD25 million) from DEG. Interest on the loan was 4.55 per cent. above the 6 month USD LIBOR rate per annum payable six-monthly in arrears. The principal is repayable in 14 bi-annual instalments of USD1,785,000 commencing November 2010 and expired in May 2017.
The DEG term loan 2 was secured by:• First ranking legal mortgage over Farm No. 4906, Lot No. 18835/M and Lot No. 18836/M (Sinazongwe farm); and• First ranking legal mortgage over Farm No. 10097, R/E of Farm No. 5063 and Lot No. 8409/M (Chiawa farm).
(ii) DEG Term Loan 3The Group has a loan facility of USD7.81 million (2016: USD9.23 million and original amount of USD10 million) from DEG. Interest on the loan is 4.25 per cent. above the 6 month USD LIBOR rate per annum payable 6 monthly in arrears. The capital is repayable in 14 biannual instalments of USD710,000 commencing May 2016 and expiring in November 2022.
The DEG term loan 3 is secured by:• First ranking legal mortgage over Farm No. 4906, Lot No. 18835/M and Lot No. 18836/M (Sinazongwe farm); and• First ranking legal mortgage over Farm No. 10097, R/E of Farm No. 5063 and Lot No. 8409/M (Chiawa farm).
(iii) DEG Term Loan 4The Group has a loan facility of USD15 million (2016: USDnil million) from DEG. Interest on the loan is 5.75 per cent. above the 6 month USD LIBOR rate per annum payable quarterly in arrears. The capital is repayable in 12 quarterly instalments of USD1,250,000 commencing March 2018 and expiring in March 2023.
The DEG term loan 4 is secured by:• Second ranking legal mortgage over Farm No. 4906, Lot No. 18835/M and Lot No. 18836/M (Sinazongwe farm); and• Second ranking legal mortgage over Farm No. 10097, R/E of Farm No. 5063 and Lot No. 8409/M (Chiawa farm).
(b) Zanaco Bank PlcThe Group has a loan facility of ZMW26.6 million (2016: ZMW33.2 million) with Zanaco Bank Plc. Interest on the loan is 7 per cent. above the Bank of Zambia policy rate per annum payable monthly in arrears. The principal is repayable in 7 annual instalments of ZMW6,642,857 commencing December 2014 and expiring in December 2020.
The loan is secured by a first ranking legal mortgage over Stand No. 4970, Industrial Area, Lusaka (Head Office).
(c) Standard Chartered Bank Zambia PlcThe Group has a structured agricultural facility with an annual revolving limit totalling USD20 million (2016 – USD20 million) with Standard Chartered Bank Zambia PLC. The purpose of the facility is the financing of wheat, soya beans, and maize under collateral management agreements and is for 180 days. The balance on the facilities at year end was USD6.2 million (2016: USD11.9 million). Interest on the facility is 3 month LIBOR plus 4 per cent. per annum calculated on the daily overdrawn balances.
(d) (i) International Finance Corporation Loan 1The Group has a loan facility of USDNil million (2016: USD1.84 million in Zambia and USD0.57 million in Nigeria and original amount of USD10 million) from IFC. Interest on the loan was 4.75 per cent. above the 6 month USD LIBOR rate per annum payable six-monthly in arrears. The principal was repayable in 11 equal bi-annual instalments of USD636,364 (Zambeef) and USD283,634 (Nigeria) commencing June 2012 and expired in June 2017.
The portion of the loan attributable to Zambia was secured through a first ranking legal mortgage over Plots 9070, 9071 and 9074, off Mumbwa Road, Lusaka, (Novatek stock feed premises) and the portion of the loan attributable to the Nigerian operations was secured by a floating charge over all assets of Master Meat and Agro Production Co of Nigeria Limited and a parental guarantee from Zambeef Products PLC.

102 Zambeef Products PLC Annual Report 2017
24. Interest bearing liabilities continued(d) (ii) International Finance Corporation Loan 2The Group has a loan facility of USD13.1 million and ZMW32.5 million (2016: USD15.9 million and ZMW39.3 million). Interest on the loan is 4.75 per cent. above the 6 month USD LIBOR rate per annum for the USD facility and 4.45 per cent. above the 91 day Treasury Bill rate plus a variable swap margin for the Kwacha facility payable quarterly in arrears. The principal is repayable in 29 equal quarterly instalments of USD689,655 and ZMW1,710,345 commencing June 2015 and expiring in June 2022.
The loan is secured through a first ranking legal mortgage over Farm No. 4450, 4451 & 5388 (Mpongwe farm).
25. Obligations under finance leases
2017 2016
(i) In Zambian KwachaGroup
ZMW’000sCompany
ZMW’000sGroup
ZMW’000sCompany
ZMW’000s
Freddy Hirsch Group Zambia Limited (note (a)) 17,364 - 17,389 -
Stanbic Bank Zambia Limited (note (b)) 30,467 30,467 33,793 33,793
47,831 30,467 51,182 33,793
Less: Payable within 12 months (19,916) (13,272) (19,697) (14,108)
Repayable after 12 months 27,915 17,195 31,485 19,685
2017 2016
(ii) In US DollarsGroup
USD’000sCompany USD’000s
Group USD’000s
Company USD’000s
Freddy Hirsch Group Zambia Limited (note (a)) 1,796 - 1,737 -
Stanbic Bank Zambia Limited (note (b)) 3,151 3,151 3,376 3,376
4,947 3,151 5,113 3,376
Less: Payable within 12 months (2,060) (1,373) (1,968) (1,409)
Repayable after 12 months 2,887 1,778 3,145 1,967
The ageing for the finance leases is as detailed below:
(i) In Zambian Kwacha
Within 1 year
ZMW’000s1 to 5 years ZMW’000s
After 5 years
ZMW’000sTotal
ZMW’000s
2017
Lease payments 20,667 29,396 - 50,063
Finance charges (751) (1,481) - (2,232)
Net present values 19,916 27,915 - 47,831
2016
Lease payments 20,300 32,541 - 52,841
Finance charges (603) (1,056) - (1,659)
Net present values 19,697 31,485 - 51,182
Notes to the Financial Statements continuedFor the year ended 30 September 2017

103
Corporategovernance
Financialstatements
Overview Strategicreport
Zambeef Products PLC Annual Report 2017
25. Obligations under finance leases continued
(ii) In US Dollars
Within 1 year
USD’000s1 to 5 years
USD’000s
After 5 years
USD’000sTotal
USD’000s
2017
Lease payments 2,138 3,040 - 5,178
Finance charges (78) (153) - (231)
Net present values 2,060 2,887 - 4,947
2016
Lease payments 2,028 3,250 5,278
Finance charges (60) (105) (165)
Net present values 1,968 3,145 5,113
(a) Masterpork Limited, a subsidiary of the Group, has hire purchase facilities of ZMW17.364 million (2016 – ZMW17.389 million) with Freddy Hirsch Group Zambia Ltd. The following equipment is on hire purchase and are interest free: HirschPro 400, Ulma, Cozzini Blender, 2 x Smokehouse machines, Salami Cabinet, Spiral Dryer and Polyclipper. The principle on the Kwacha hire purchase facilities is repayable in 48 equal monthly instalments totalling ZMW0.46 million (USD0.046 million).
(b) The Stanbic Bank Zambia Limited finance lease relates to the purchase of motor vehicles and agricultural machinery with terms of 48 months. The group has a facility of USD2m and ZMW25m. The interest on the finance lease is charged at 3 month USD LIBOR plus 5 per cent on the USD facility and the Bank of Zambia Policy Rate plus 7 per cent. on the Kwacha facility. The obligations under finance leases are secured by the lessor’s absolute ownership over the leased assets comprehensively insured with the bank’s interest noted as first loss payee.
26. Deferred liabilityUnder the terms of employment, employees are entitled to certain terminal benefits. Provision has been made during the year towards these benefits. This statutory entitlement, which is lost if the employee is summarily dismissed, becomes payable only when the employee retires after attaining the age of 55 years and that employee has been employed for more than ten years. Uncertainty exists over the amount of future outflows due to staff turnover levels, but are not considered material to the Group.
2017 2016
(i) In Zambian KwachaGroup
ZMW’000sCompany
ZMW’000sGroup
ZMW’000sCompany
ZMW’000s
At 1 October 10,442 2,266 9,254 1,670
Provision made during the year 8,146 2,438 3,589 1,018
Payments made during the year (1,832) (1,045) (2,401) (422)
At 30 September 16,756 3,659 10,442 2,266
The company engaged a professional actuary, Quantum Consultants & Actuaries, to perform an actuarial valuation of the liability arising from the employee defined benefit plan as at 30 September 2017. As of the report date, the actuary had finalised the report and the provision was adjusted to agree to the report.
2017 2016
(ii) In US DollarGroup
USD’000sCompany USD’000s
Group USD’000s
Company USD’000s
At 1 October 1,043 227 770 139
Provision made during the year 856 256 331 94
Payments made during the year (192) (110) (187) (21)
(222) (39) (201) (43)
Foreign translation 26 5 164 33
At 30 September 1,733 378 1,043 227

104 Zambeef Products PLC Annual Report 2017
27. Trade and other payables
2017 2016
(i) In Zambian KwachaGroup
ZMW’000sCompany
ZMW’000sGroup
ZMW’000sCompany
ZMW’000s
Trade payables 223,630 133,516 253,271 127,438
Provisions and accruals 68,213 31,327 68,862 37,029
291,843 164,843 322,133 164,467
2017 2016
(ii) In US DollarsGroup
USD’000sCompany USD’000s
Group USD’000s
Company USD’000s
Trade payables 23,253 13,807 25,302 12,731
Provisions and accruals 7,054 3.239 6,877 3,673
30,307 17,046 32,179 16,404
The average credit period taken in 2017 was 64 days (2016: 61 days).
All amounts shown under trade and other payables fall due for payment within one year. The carrying value of trade and other payables are considered to be a reasonable approximation of fair value.
28. Amounts due to related companies
2017 2016
(i) In Zambian KwachaGroup
ZMW’000sCompany
ZMW’000sGroup
ZMW’000sCompany
ZMW’000s
Zambian Pig Genetics 81 - - -
Zambeef Retailing Limited 202,261 - -
Masterpork Limited 41,615 - -
Squares Ranch 313 313
Zambezi Ranching and Cropping Limited 81 - 12
243,876 313 325
Non-current - - - -
Current 81 - 313 325
Notes to the Financial Statements continuedFor the year ended 30 September 2017

105
Corporategovernance
Financialstatements
Overview Strategicreport
Zambeef Products PLC Annual Report 2017
2017 2016
(ii) In US DollarsGroup
USD’000sCompany USD’000s
Group USD’000s
Company USD’000s
Zambian Pig Genetics 9 -
Zambeef Retailing Limited 20,916
Masterpork Limited 4,304
Squares Ranch - 31 31
Zambezi Ranching and Cropping Limited - - 2
25,220 31 33
Non-current - -
Current 9 - 31 33
The above balances relate to arm’s length transactions with the related parties. External parties that fall under the ‘Related Party’ disclosure are with respect to all common shareholding companies of the Board of Directors of the Group. Unless otherwise stated, none of the transactions incorporate special terms and conditions and no guarantees were given or received.
Outstanding balances are usually settled in cash.
29. Financial instrumentsFinancial assetsThe Group’s principal financial assets are bank balances and cash and trade receivables. The Group maintains its bank accounts with major banks in Zambia of high credit standing. Trade receivables are stated at amounts reduced by appropriate allowances for estimated irrecoverable amounts.
Financial liabilitiesThe Group’s financial liabilities are bank overdrafts, long term loans and trade payables. Financial liabilities are classified according to the substance of the contractual arrangements entered into. Trade payables and loans are stated at their nominal value.
Monetary assets and liabilities in foreign currenciesThe tables below show the extent to which Group companies have monetary assets and liabilities in currencies other than their local currency:
2017 2016
(i) In Zambian KwachaGroup
ZMW’000sCompany
ZMW’000sGroup
ZMW’000sCompany
ZMW’000s
Financial assets
- Cash at bank 46,821 15,813 49,207 39,635
- Trade receivables 41,384 25,372 14,590 2,959
- Other receivables 2,318 - 2,904 2,904
Financial liabilities
- Bank overdrafts (125,391) (11,703) (11,863)
- Trade and other payables (167,038) (119,824) (90,297) (70,511)
- Bank loans (347,250) (347,250) (418,576) (418,576)
- Finance leases (36,427) (20,280) (31,047) (16,091)
Net exposure (585,583) (446,169) (484,922) (471,543)
28. Amounts due to related companies continued

106 Zambeef Products PLC Annual Report 2017
28. Financial instruments continued
2017 2016
(ii) In US DollarsGroup
USD’000sCompany USD’000s
Group USD’000s
Company USD’000s
Financial assets
- Cash at bank 4,843 1,635 4,916 3,960
- Trade receivables 4,279 2,624 1,458 296
- Other receivables 238 - 290 290
Financial liabilities
- Bank overdrafts (12,967) - (1,169) (1,185)
- Trade and other payables (17,273) (12,391) (9,021) (7,044)
- Bank loans (35,910) (35,910) (41,816) (41,816)
- Finance leases (3,767) (2,097) (3,102) (1,607)
Net exposure (60,557) (46,139) (48,444) (47,106)
In Zambian Kwacha2016
US Dollar ZMW’000s
SA Rand ZMW’000s
Other ZMW’000s
Total ZMW’000s
Financial Assets
- Cash at bank 49,021 13 173 49,207
- Trade receivables 12,173 767 1,651 14,591
- Other receivables 1,719 1,185 1 2,905
Financial Liabilities
- Bank overdrafts (11,862) - - (11,862)
- Trade and other payables (92,228) 148 1,781 (90,299)
- Bank loans (418,417) - - (418,417)
- Finance leases (31,047) - - (31,047)
Net exposure (490,641) 2,113 3,606 (484,922)
Notes to the Financial Statements continuedFor the year ended 30 September 2017

107
Corporategovernance
Financialstatements
Overview Strategicreport
Zambeef Products PLC Annual Report 2017
28. Financial instruments continued
2017US Dollar
ZMW’000sSA Rand
ZMW’000sOther
ZMW’000sTotal
ZMW’000s
Financial Assets
- Cash at bank 13,061 190 33,570 46,821
- Trade receivables 10,728 554 30,102 41,384
- Other receivables - - 2,318 2,318
Financial Liabilities
- Bank overdrafts (28,829) - (95,562) (125,391)
- Trade and other payables (93,047) (14,777) (59,214) (167,038)
- Bank loans (347,250) - - (347,250)
- Finance leases (36,427) - - (36,427)
Net exposure (481,764) (14,033) (89,786) (585,583)
(ii) In US Dollars2016
US Dollar USD’000s
SA Rand USD’000s
Other USD’000s
Total USD’000s
Financial Assets
- Cash at bank 4,897 1 17 4,915
- Trade receivables 1,216 77 165 1,458
- Other receivables 172 118 - 290
Financial Liabilities
- Bank overdrafts (1,185) - - (1,185)
- Trade and other payables (9,214) 15 178 (9,021)
- Bank loans (41,800) - - (41,800)
- Finance leases (3,102) - - (3,102)
Net exposure (49,016) 211 360 (48,445)
2017US Dollar
USD’000sSA Rand
USD’000sOther
USD’000sTotal
USD’000s
Financial Assets
- Cash at bank 1,351 20 3,472 4,843
- Trade receivables 1,109 57 3,113 4,279
- Other receivables - - 238 238
Financial Liabilities
- Bank overdrafts (2,981) - (9,986) (12,967)
- Trade and other payables (9,622) (1,528) (6,123) (17,273)
- Bank loans (35,910) - - (35,910)
- Finance leases (3,767) - - (3,767)
Net exposure (49,820) (1,451) (9,286) (60,557)
Exposure to currency exchange rates arise from the Group’s sales and purchases which are primarily denominated in US Dollar and South African Rand. It also arises from the retranslation of its foreign subsidiaries in West Africa. The Group activities expose it to a variety of financial risks. The main risks faced by the Group relate to foreign exchange rates, the risk of default by counter-parties to financial transactions and the availability of funds to meet business needs.o meet business needs.
These risks are managed as described below:

108 Zambeef Products PLC Annual Report 2017
29. Financial instruments continued (i) Currency riskSome of the interest bearing borrowings are denominated in foreign currencies and therefore lead to a risk of fluctuation of value due to changes in the foreign exchange rate. This risk is partially hedged by holding United States Dollar bank balances and United States Dollar denominated exports.
The table below shows the extent to which Group companies have interest bearing liabilities in currencies other than their functional currency:
2017 2016
ZMW’000s USD’000s ZMW’000s USD’000s
DEG - Deutsche Investitions- und Entwicklungsgesellschaft mbH 220,573 22,810 128,228 12,810
International Finance Corporation 126,706 13,103 177,198 17,702
347,279 35,913 305,426 30,512
Foreign currency risk sensitivity analysisZambian Kwacha/United States Dollar exchange riskThe following tables illustrate the sensitivity of the net result for the year and equity with regard to the Group’s foreign currency borrowings “with all other things being equal”. It assumes a +/-10 per cent. and 5 per cent., movement in the United States Dollar/Zambian Kwacha exchange rate for the year ended 30 September 2017.If the Zambian Kwacha had weakened against the United States dollar by 10 per cent. (2016: 10 per cent.) then this would have resulted in the following impact on net profit and equity:
2017 2016
Weakening of the Kwacha ZMW’000s USD’000s ZMW’000s USD’000s
Net profit/(loss) (31,460) (3,004) 126,843 10,647
Equity 2,863,749 269,225 2,105,396 191,208
If Zambian Kwacha had strengthened against the United States Dollar by 5 per cent. (2015: 5 per cent) then this would have resulted in the following impact on net profit and equity:
2017 2016
Strengthening of the Kwacha ZMW’000s USD’000s ZMW’000s USD’000s
Net profit/(loss) 20,632 2,281 172,657 16,782
Equity 2,915,841 317,405 2,151,210 226,217
There is no material difference between the carrying value and the fair value of the Group’s financial liabilities.
(ii) Interest rate riskAs the Group has no significant interest-bearing assets, the Group’s income and operating cash flows are substantially independent of changes in market interest rates.
The Group’s interest rate risk arises from overdraft facilities and long-term borrowings. Borrowings issued at variable rates expose the Group to interest rate risk. The interest rates to which the Group is exposed are set out in notes 20, 23 and 24. The risk of interest rate movements is managed through on-going monitoring of the Group’s overdrafts and long-term borrowings, the spreading of debt between a number of financial institutions and the denomination of debt in Zambian Kwacha and USD.
The Group’s term facilities are medium to long term with fixed spread over LIBOR. A 0.5 per cent. movement in the LIBOR rate would not have a material impact on the interest expense for the Group.
(iii) Market riskThe Group is not exposed to the risk of the value of its financial assets fluctuating as a result of changes in market prices.
(b) Credit risk(i) Trade receivablesThe Directors believe the credit risk of trade receivables is low. The credit risk is managed by the selective granting of credit.
(c) Liquidity riskLiquidity risk is the risk that the Group might be unable to meet its obligations associated with its financial liabilities. The Group monitors rolling forecasts of the Group’s liquidity requirements to ensure it has sufficient cash to meet operational needs while maintaining sufficient headroom on any undrawn borrowing facilities so that the Group does not breach limits or covenants (where applicable) on any of its borrowing facilities. The maturity of the Group’s financial liabilities with respect to borrowings is set out in notes 20, 23 and 24.
Notes to the Financial Statements continuedFor the year ended 30 September 2017

109
Corporategovernance
Financialstatements
Overview Strategicreport
Zambeef Products PLC Annual Report 2017
29. Financial instruments continued
30 September 2017 Current Non-current
Within 6 months
6 to 12 months 1 to 5 years
later than 5 years
ZMW’000 ZMW’000 ZMW’000 ZMW’000
Interest bearing liabilities 42,355 35,725 290,601 37,637
Other bank borrowings 60,248
Finance lease obligations 9,958 9,958 27,915 -
Trade and other payables 291,843 - - -
30 September 2017 Current Non-current
Within 6 months
6 to 12 months 1 to 5 years later than 5
years
USD’000 USD’000 USD’000 USD’000
Interest bearing liabilities 6,381 3,694 30,052 3,892
Other bank borrowings 6,230
Finance lease obligations 1,030 1,030 2,887
Trade and other payables 29,867 - -

110 Zambeef Products PLC Annual Report 2017
30. Fair value measurementFair value measurement of financial instrumentsFinancial assets and financial liabilities measured at fair value in the statement of financial position are grouped into three Levels of a fair value hierarchy. The three Levels are defined based on the observability of significant inputs to the measurement, as follows:
•Level 1: quoted prices (unadjusted) in active markets for identical assets or liabilities•Level 2: inputs other than quoted prices included within Level 1 that are observable for the asset or liability, either directly or indirectly•Level 3: unobservable inputs for the asset or liability.
The following table shows the Levels within the hierarchy of financial assets and liabilities measured at fair value on a recurring basis at 30 September 2017, 30 September 2016, and 1 October 2015.
30 September 2017 Level 1 Level 2 Level 3 Total
ZMW’000 ZMW’000 ZMW’000 ZMW’000
Financial assets
Other forward exchange contracts inventory (CMA) - 60,248 - 60,248
Total Assets - 60,248 - 60,248
Financial liabilities
US-dollar loans - (347,279) - (347,279)
Total Liabilities - (347,279) - (287,031)
Net fair value - (287,031) - (287,031)
30 September 2016 Level 1 Level 2 Level 3 Total
ZMW’000 ZMW’000 ZMW’000 ZMW’000
Financial assets
Other forward exchange contracts inventory (CMA) - 118,849 - 118,849
Total Assets - 118,849 - 118,849
Financial liabilities
US-dollar loans - (377,957) - (377,957)
Total Liabilities - (377,957) - (377,957)
Net fair value - (259,108) - (259,108)
1 October 2015 Level 1 Level 2 Level 3 Total
ZMW’000 ZMW’000 ZMW’000 ZMW’000
Financial assets
Other forward exchange contracts inventory (CMA) - 41,435 - 41,435
Total Assets - 41,435 - 41,435
Financial liabilities
US-dollar loans - (474,197) - (474,197)
Total Liabilities - (474,197) - (474,197)
Net fair value - (432,762) - (432,762)
Notes to the Financial Statements continuedFor the year ended 30 September 2017

111
Corporategovernance
Financialstatements
Overview Strategicreport
Zambeef Products PLC Annual Report 2017
30 September 2017 Level 1 Level 2 Level 3 Total
USD’000 USD’000 USD’000 USD’000
Financial assets
Other forward exchange contracts inventory (CMA) - 6,230 - 6,230
Total Assets - 6,230 - 6,230
Financial Liabilities
US-dollar loans - (35,913) - (35,913)
Total Liabilities - (35,913) - (35,913)
Net fair value - (29,683) - (29,683)
30 September 2016 Level 1 Level 2 Level 3 Total
USD’000 USD’000 USD’000 USD’000
Other forward exchange contracts inventory (CMA) - 11,873 - 11,873
Total Assets - 11,873 - 11,873
(26,769)
Financial liabilities
US-dollar loans - (37,758) - (37,758)
Total Liabilities - (37,758) - (37,758)
Net fair value - (25,885) - (25,885)
1 October 2015 Level 1 Level 2 Level 3 Total
USD’000 USD’000 USD’000 USD’000
Financial assets
Other forward exchange contracts inventory (CMA) - 3,447 - 3,447
Total Assets - 3,447 - 3,447
Financial liabilities
US-dollar loans - (39,451) - (39,451)
Total Liabilities - (39,451) - (39,451)
Net fair value - (36,004) (39,451) (36,004)
There were no transfers between Level 1 and Level 2 in 2017 or 2016.
Measurement of fair value of financial instrumentsThe Group’s finance team performs valuations of financial items for financial reporting purposes, including Level 3 fair values, in consultation with third party valuation specialists for complex valuations. Valuation techniques are selected based on the characteristics of each instrument, with the overall objective of maximising the use of market-based information. The finance team reports directly to the Chief Financial Officer (CFO) and to the audit committee.
Valuation processes and fair value changes are discussed among the audit committee and the valuation team at least every year, in line with the Group’s reporting dates. The valuation techniques used for instruments categorised in Levels 2 and 3 are described below:Foreign currency forward contracts (Level 2)The Group’s foreign currency forward contracts are not traded in active markets. These have been fair valued using observable forward exchange rates and interest rates corresponding to the maturity of the contract. The effects of non-observable inputs are not significant for foreign currency forward contracts.
30. Fair value measurement continued
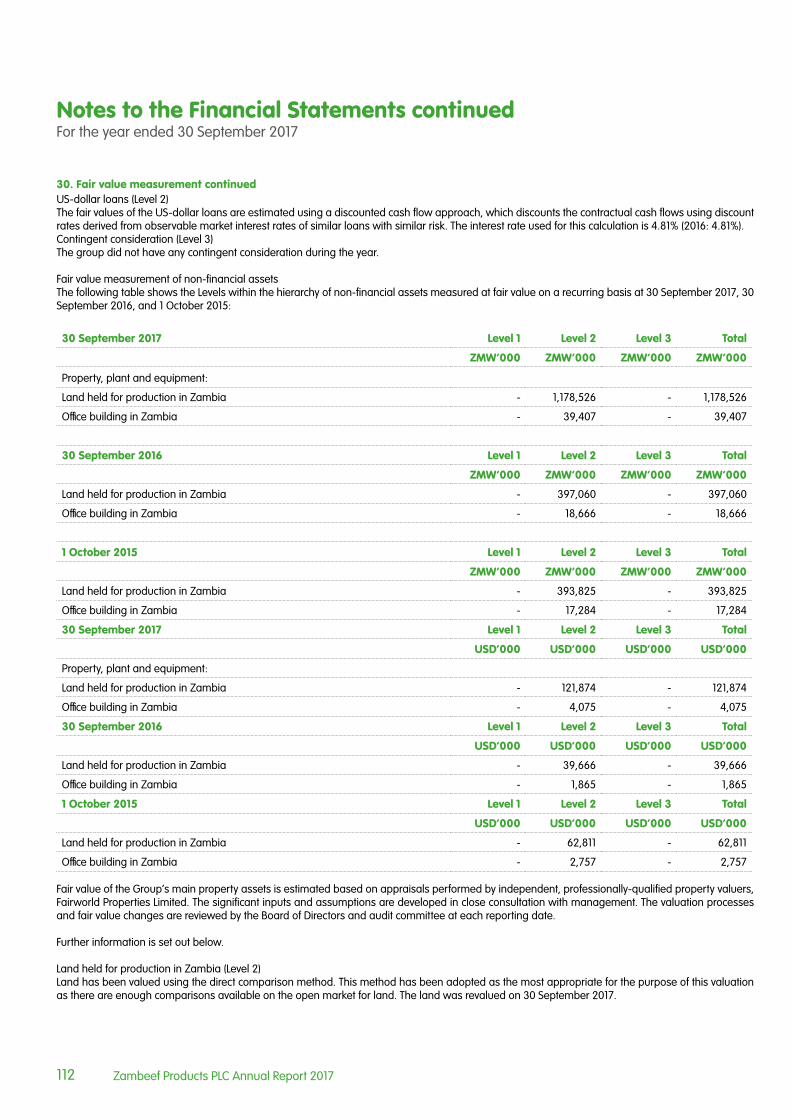
112 Zambeef Products PLC Annual Report 2017
US-dollar loans (Level 2)The fair values of the US-dollar loans are estimated using a discounted cash flow approach, which discounts the contractual cash flows using discount rates derived from observable market interest rates of similar loans with similar risk. The interest rate used for this calculation is 4.81% (2016: 4.81%).Contingent consideration (Level 3)The group did not have any contingent consideration during the year.
Fair value measurement of non-financial assetsThe following table shows the Levels within the hierarchy of non-financial assets measured at fair value on a recurring basis at 30 September 2017, 30 September 2016, and 1 October 2015:
30 September 2017 Level 1 Level 2 Level 3 Total
ZMW’000 ZMW’000 ZMW’000 ZMW’000
Property, plant and equipment:
Land held for production in Zambia - 1,178,526 - 1,178,526
Office building in Zambia - 39,407 - 39,407
30 September 2016 Level 1 Level 2 Level 3 Total
ZMW’000 ZMW’000 ZMW’000 ZMW’000
Land held for production in Zambia - 397,060 - 397,060
Office building in Zambia - 18,666 - 18,666
1 October 2015 Level 1 Level 2 Level 3 Total
ZMW’000 ZMW’000 ZMW’000 ZMW’000
Land held for production in Zambia - 393,825 - 393,825
Office building in Zambia - 17,284 - 17,284
30 September 2017 Level 1 Level 2 Level 3 Total
USD’000 USD’000 USD’000 USD’000
Property, plant and equipment:
Land held for production in Zambia - 121,874 - 121,874
Office building in Zambia - 4,075 - 4,075
30 September 2016 Level 1 Level 2 Level 3 Total
USD’000 USD’000 USD’000 USD’000
Land held for production in Zambia - 39,666 - 39,666
Office building in Zambia - 1,865 - 1,865
1 October 2015 Level 1 Level 2 Level 3 Total
USD’000 USD’000 USD’000 USD’000
Land held for production in Zambia - 62,811 - 62,811
Office building in Zambia - 2,757 - 2,757
Fair value of the Group’s main property assets is estimated based on appraisals performed by independent, professionally-qualified property valuers, Fairworld Properties Limited. The significant inputs and assumptions are developed in close consultation with management. The valuation processes and fair value changes are reviewed by the Board of Directors and audit committee at each reporting date.
Further information is set out below.
Land held for production in Zambia (Level 2)Land has been valued using the direct comparison method. This method has been adopted as the most appropriate for the purpose of this valuation as there are enough comparisons available on the open market for land. The land was revalued on 30 September 2017.
30. Fair value measurement continued
Notes to the Financial Statements continuedFor the year ended 30 September 2017

113
Corporategovernance
Financialstatements
Overview Strategicreport
Zambeef Products PLC Annual Report 2017
The significant unobservable input is the adjustment for factors specific to the land in question. The extent and direction of this adjustment depends on the number and characteristics of the observable market transactions in similar properties that are used as the starting point for valuation. Although this input is a subjective judgement, management considers that the overall valuation would not be materially affected by reasonably possible alternative assumptions.
The fair values of the office buildings are estimated by using the direct comparison method. This method has been adopted as the most appropriate for the purpose of this valuation as there are enough comparisons available on the open market for buildings.
31. Contingent liabilityCertain legal cases are pending against the Company in the Court of Law. In the opinion of the Directors, and the Company’s lawyers, none of these cases will result in any material loss to the Company for which a provision is required.
32. Capital commitments
2017 2016
ZMW’000s USD’000s ZMW’000s USD’000s
Capital commitments entered into at the reporting date 19,804 2,048 31,672 3,164
Not contracted for at the reporting date 108,420 11,212 185,545 18,536
33. Operating leasesThe total value of future minimum annual lease payments under non-cancellable operating leases is as follows:
2017 2016
(i) In Zambian KwachaGroup
ZMW’000sCompany
ZMW’000sGroup
ZMW’000sCompany
ZMW’000s
Within one year 11,852 - 11,387 -
One to five years 17,964 - 30,754 -
2017 2016
(ii) In US DollarsGroup
USD’000sCompany USD’000s
Group USD’000s
Company USD’000s
Within one year 1,226 - 1,138 -
One to five years 1,858 - 3,072 -
The Company’s subsidiary, Zambeef Retailing Limited, has operating leases for its butcheries that are for a minimum period of 12 months and a maximum period of 5 years and renewable at the request of either party. There are no purchase options, contingent rent payments or restrictions arising on these leases.
30. Fair value measurement continued

114 Zambeef Products PLC Annual Report 2017
34. Related party transactionsTransactions between the Company and its subsidiaries, which are related parties of the Company, have been eliminated on consolidation and are not disclosed in this note. Details of the significant transactions between the Group and other related parties during the year ended 30 September 2017 are as follows:(a)The Group made the following sales to related parties:
2017 2016
Sale of ZMW’000s USD’000s ZMW’000s USD’000s
Wellspring Limited Animal feeds/bran 425 45 485 45
Squares Ranch Limited Animal feeds/bran 10 1 - -
Zambezi Ranching and Cropping Limited Animal feeds/bran 107 11 41,494 3,831
Leopard Investments Company Limited Animal feeds/bran 8,181 859 11,122 1,027
Tembilo Farms Limited Animal feeds/bran 2,589 239
Tractorzam Limited Spares 33 3
Zambia Pig Genetics Limited Animal feeds/bran 3,007 278
8,723 916 58,730 5,423
(b) The Group made the following purchases from related parties:
2017 2016
Purchase of ZMW’000s USD’000s ZMW’000s USD’000s
Zambezi Ranching and Cropping Limited Cattle beef, wheat, soya beans 58,206 6,114 60,424 5,579
Zambian Pig Genetics Pigs 1,168 123 - -
Wellspring Limited Cattle beef 7,564 795 3,391 313
Leopard Investments Company LimitedCattle beef, chickens, pigs, rental of property 25,674 2,697 17,804 1,644
Proflight Commuter Services Limited Air travel tickets 143 15 91 8
Tembilo Farms Chickens - - 3,096 286
Tractorzam Limited Tractors/spares 7,322 769 4,135 382
Sqaures Ranch Limited Cattle beef 180 19 664 61
Pro Charter Air travel tickets - - 805 74
Nanga Plc Cattle beef 534 56 1,160 107
100,791 10,588 91,613 8,458
(c) Sales of goods to related parties were made at the Group’s usual list prices.(d) Purchases were made at market price.(e) The amounts outstanding are unsecured and will be settled in cash. No guarantees have been given or received.(f) No expense has been recognised in the period for bad or doubtful debts in respect of the amounts owed by related parties.(g) The parties are related by virtue of certain Directors of the Group having a shareholding in the respective companies.(h) Directors of the Group have shareholdings in the Company as stated in the Report of the Directors. No dividends have been paid to the Directors via their direct and indirect shareholdings at the same dividend per share as per Note 10.(i) Key management compensation.
Notes to the Financial Statements continuedFor the year ended 30 September 2017

115
Corporategovernance
Financialstatements
Overview Strategicreport
Zambeef Products PLC Annual Report 2017
34. Related party transactions continuedThe remuneration of Directors and other members of key management during the year were as follows:
2017 2016
Group ZMW’000s
Company ZMW’000s
Group ZMW’000s
Company ZMW’000s
Short-term benefits 80,449 29,342 63,285 27,858
Post-employment benefits - - - -
Other long-term benefits - - - -
Group USD’000s
Company USD’000s
Group USD’000s
Company USD’000s
Short-term benefits 8,451 3,082 5,843 3,946
Post-employment benefits - - - -
Other long-term benefits - - - -
The remuneration of Directors and key executives is determined by the remuneration committee having regard to the performance of individuals and market trends.
(j) There were no loans to related parties and key management personnel.
(k) The Company made the following sales to related parties:
2017 2016
ZMW’000s USD’000s ZMW’000s USD’000s
Zambeef Retailing 903,647 94,921 373,280 34,467
Zambezi Ranching and Cropping Limited 107 11 85 8
Wellspring Limited 425 45 485 45
Zambia Pig Genetics 2,786 293 3,007
Masterpork Limited 13,972 1,468 10,077 931
Zam Chick Limited 112,298 11,796 104,639 9,662
Zamhatch Limited 30,690 3,174 20,175 1,863
Zamleather Limited 3,272 344 - -
Zampalm Limited 65 7 - -
Squares Ranch 10 1 - -
Leopard Investments Company Limited 8,181 859 9,322 861
1,075,453 112,969 521,070 48,115

116 Zambeef Products PLC Annual Report 2017
34. Related party transactions continued(l) The Group made the following purchases from related parties:
2017 2016
ZMW’000s USD’000s ZMW’000s USD’000s
Zambeef Retailing 50,611 5,059 54,787 5,059
Zambezi Ranching and Cropping Limited 9,819 1,031 13,117 1,211
Zamleather Limited 572 60 333 31
Zam Chick Limited 201 21 33 3
Tractorzam Limited 7,322 769 3,505 324
Leopard Investments Company Limited 37 4 1,697 157
Proflight Commuter Services Limited 143 15 91 8
Procharter 1,161 122 805
Masterpork 93,255 9,796 - -
Nanga Plc 534 56 1,160 107
Squares Ranch 180 19 664 61
Zamhatch Limited 442 46
Wellspring Limited 7,564 795 3,391 313
171,841 18,050 79,583 7,348
35. Discontinued Operations
During the previous period management decided to sell a majority stake of a 100% owned subsidiary, Zampalm Limited (Zampalm). The sale is subject to competition commission approval. As such the assets and liabilities of Zampalm are disclosed in accordance with IFRS 5. A shareholder’s agreement was signed during the period.
The income generated by assets held for sale was generated as follows:
September 2017
ZMW’000
September 2017
USD’000
Revenue 238 25
Cost of sales (1,570) (165)
Administration costs 199 21
Operating loss (1,133) (119)
Finance Costs - -
Exchange losses - -
Loss from discontinued operation before tax (1,133) (119)
Tax (expense)/credit - -
Profit for the year (1,133) (119)
Notes to the Financial Statements continuedFor the year ended 30 September 2017

117
Corporategovernance
Financialstatements
Overview Strategicreport
Zambeef Products PLC Annual Report 2017
35. Discontinued Operations continued
September 2017
ZMW’000
September 2017
USD’000
Plantation development expenditure 109,346 11,308
Property, plant and equipment 49,001 5,067
Biological assets 62,740 6,488
Total non-current assets 221,087 22,863
Trade and other receivables 91 9
Total current assets 91 9
Total non-current liabilities - -
Trade and other payables 1,318 136
Cash and cash equivalents (239) (25)
Total current liabilities 1,079 111
September 2017
ZMW’000
September 2017
USD’000
Cash inflow from operating activities (15,359) (1,613)
Cash outflow from investing activities (13,805) (1,450)
Cash outflow from financing activities - -
36. Events subsequent to reporting dateNo item, transaction or event of a material and unusual nature has arisen since 30 September 2017, which in the opinion of the directors would substantially affect the operations of the economic entity, the results of those operations or the state of affairs of the economic entity in the subsequent financial years.

118 Zambeef Products PLC Annual Report 2017

119
Corporategovernance
Financialstatements
Overview Strategicreport
Zambeef Products PLC Annual Report 2017

120 Zambeef Products PLC Annual Report 2017
Notice is hereby given that the 23rd Annual General Meeting of Zambeef Products PLC will take place at the Taj Pamodzi Hotel, along Addis Ababa Drive, Lusaka, on Monday, December 18, 2017 at 09:00 hours.
AGENDA
1. To read the Notice of the Meeting and confirm that a quorum is present.
2. To read and confirm the minutes of the 22nd Annual General Meeting held on December 19, 2016.
3. Consider any matters arising from the minutes.
4. To receive the report of the Directors, the Auditors report and the Financial Statements for the year ended September 30, 2017. (Resolution 1).
5. To re-appoint Grant Thornton (Zambia) as Auditors for 2017/18 and to authorize the Directors to fix their remuneration. (Resolution 2).
6. In terms of the Companies Act, John Rabb retires but is eligible to offer himself for re-election. (Resolution 3)
7. To ratifiy the appointments of the following (Resolution 4): Mr. Yollard Kachinda Mr. Jonathan Kirby Mrs. Margaret Chalwe-Mudenda Prof. Enala Tembo-Mwase
8. To consider any competent business of which due notice has been given.
By order of the Board, Danny Museteka, Company Secretary
Note: A Member is entitled to appoint one or more proxies to attend, speak and vote in his or her stead. A proxy need not be a member of the Company. Proxies must be lodged at the registered office of the Company at least 48 hours before the time fixed for the meeting.
Notice of Annual General Meeting and agenda

121
Corporategovernance
Financialstatements
Overview Strategicreport
Zambeef Products PLC Annual Report 2017
I/We, ……………………………………………………………..........................................................................................................................
of ……………………………………………………………................................................................................................................................
being a member/s of and the registered holder/s of ..........................................................................................................................................
Zambeef shares hereby appoint ……………………………………………………………...………………...................................................
of ...........................................................................................................................................................................................................................
or, in his/her absence, the Chairman of the Company.
As my/our proxy to vote for me/us on my/our behalf at the Annual/Extraordinary General Meeting of the Company to be held on the 18th day of December 2017 and at any adjournment of that meeting.
In Favour of/against (please tick) In Favour Against
Resolution 1 To recieve, approve and adopt financial statements for the year ended 30 September 2017. Resolution 2 To re-appoint Grant Thornton as Auditors for 2017/18 and authorise the Directors to fix their remuneration. Resolution 3 To re-elect Mr. John Rabb
Resolution 4 To ratifiy the appointments of the following:
• Mr. Yollard Kachinda
• Mr. Jonathan Kirby
• Mrs. Margaret Chalwe-Mudenda
• Prof. Enala Tembo-Mwase
Unless otherwise instructed, the proxy will vote as he/she thinks fit.
Signed: ………………………………........................................................................................................…………………………..........................……..........
Name: ………………………………........................................................................................................……………………………..........................…...........
Date: ………………………………................................................................................………………………………...............................................................
Witnessed by: ………………………………........................................................... Signature: ………………………………...................................................
Name: ………………………………........................................................................................................……………………………….....................................
Address: ………………………………........................................................................................................……………………………….................................
.......................................................................………………………………..................................................................................................................................
Proxy form

122 Zambeef Products PLC Annual Report 2017
1. A shareholder may insert the name of a proxy or the names of two alternative proxies of his/her choice in the space provided, with or without deleting “the Chairman of the Company”. The person whose name stands first on the form of proxy and who is present at the Annual General Meeting will be entitled to act as proxy to the exclusion of those whose names follow. Any such proxy, who need not be a shareholder of the Company, is entitled to attend, speak and vote on behalf of the shareholder.
2. A proxy is entitled to one vote on a show of hands and, on a poll, one vote for each share held. A shareholder’s instructions to the proxy must be indicated in the appropriate spaces.
3. If a shareholder does not indicate on this instrument that the proxy is to vote in favour of or against any resolution or to abstain from voting or gives contradictory instructions, or should any further resolution/s or any amendment/s which may be properly put before the Annual General Meeting be proposed, the proxy shall be entitled to vote as he/she thinks fit.
4. This form of proxy must be received by the Company secretary at the registered head office, Plot 4970, Manda Road, Industrial Area, P/B 17, Woodlands, Lusaka, by no later than 09:30 on Thursday, 14th December, 2017.
5. Documentary evidence establishing the authority of the person signing the proxy in representative capacity must be attached hereto unless previously recorded by the Company’s transfer secretaries.
6. The completion and lodging of this form of proxy will not preclude a shareholder from attending the Annual General Meeting and speaking and voting in person thereat to the exclusion of any proxy appointed in terms of this proxy form.
7. Any alteration or correction made to this form of proxy must be initialed by the signatory/ies.
8. The Chairman of the meeting may accept or reject any form of proxy, which is completed and/or received other than in accordance with these notes.
Notes to the Proxy Form

123
Corporategovernance
Financialstatements
Overview Strategicreport
Zambeef Products PLC Annual Report 2017

124 Zambeef Products PLC Annual Report 2017

125
Corporategovernance
Financialstatements
Overview Strategicreport
Zambeef Products PLC Annual Report 2017


![[XLS]upmsp.edu.in · Web view91.6 91.4 91 90.4 90.4 90.2 90.2 90.2 90 89.6 89 89 88.6 88.2 88.2 87.8 87.4 87.4 87.2 87 86.8 86.6 86.6 86.4 86.2 86.2 86 85.8 85.8 85.6 85.4 85.4 85.2](https://img.pdfslide.net/doc/110x75/5ac03a7f7f8b9a4e7c8ba3b5/xlsupmspeduin-view916-914-91-904-904-902-902-902-90-896-89-89-886-882.jpg)