Embed Size (px)
Citation preview

Cons
olid
ated
Dis
clos
ure
of N
on-F
inan
cial
Info
rmat
ion
in
acco
rdan
ce w
ith It
alia
n Le
gisl
ativ
e D
ecre
e no
. 254
/201
6SH
APIN
G T
HE
FUTU
RE T
OD
AY20
18
| S
uppl
emen
t to
the
Inte
grat
ed R
epor
t
SupplementIntegrated Report
2018
Consolidated Disclosure ofNon-Financial Informationin accordance with Italian Legislative Decree no. 254/2016

Stakeholder engagement and materiality analysis 2
Financial capital 10
Manufacturing capital 13
Natural capital 17
Human capital 25
Relational capital 35
The Acsm Agam Group 51
Contents

Stakeholder engagement and materiality analysis
Financial capital
Manufacturing capital
Natural capital
Human capital
Relational capital
The Acsm Agam Group
Stakeholder engagement and materiality analysis A2A 2018 Integrated Report - Supplement
32
Stakeholder engagement and materiality analysisFigure 1_Stakeholder engagement initiatives activated in 2018
STAKEHOLDERS INVOLVED
MODE OF COMMUNICATION
AND INVOLVEMENT
ISSUES ADDRESSED DURING ENGAGEMENT ACTIVITIES, IDENTIFIED BY BU
Consumer Associations
• Meetings (physical, telephone and Web)
• Convention/press conferences/events
• Work groups/committee
• Plant tours
Group• Meeting with the various BUs of the Group to illustrate the news of
the market and the activities that will be carried out in the territories. Presentation of conciliation data. A moment of dialogue with consumer associations.
Environment BUVisit to the Acerra plant reserved for national and local presidentNetworks and District Heating BU• Preparatory meetings for an out-of-court agreement with Codacons on
the subject of incorrect commercial contracts on district heating to the detriment of certain condominiums
• Advocacy Federconsumatori for intervention referendum public water Brescia
• Codacons Agreement - district heating communication planningMarket BU• Presentation of the proposed project communication on electric
mobility• Meeting with consumer associations dedicated to A2A Energia:
presentation of new commercial actions, actions designed to accompany consumers towards the free market, ADR updates
• Verification of consumer association positions on AGCM survey towards A2A Energia
• Verification and analysis of data from commercial survey results• Training meeting dedicated to Adiconsum operators on overcoming the
protected market and on A2A Energia's activitiesCorporate BU• Participation in the events of associations with activities of social
responsibility and environmental education• Meetings with new summits• Evaluation of collaboration proposals• Meetings of the ADR A2A Joint Guarantee Body 2018, conciliatory
courses, presentation of conciliation dataSmart City• Presentation of the A2A Smart City-Open Fiber optical fibre laying
project
Environmental associations
• Convention/press conferences/events
• Meetings (physical, telephone and Web)
• Plant tours
Environment BU• Definition of activities A2A Ambiente 2018• Distribution compost gardens Legambiente• Definition of 2018 collaboration activities with Legambiente Lombardia• Participation in the national conference on energy efficiency of Amici
della Terra (Friends of the Earth)Networks and District Heating BU• Meetings in Brescia and Milan to define the stakeholder questionnaire
on investments in the network managed by Unareti• Definition of 2018 collaboration activities with Legambiente Lombardia• Visit to the Vetrobalsamo plant to illustrate the recovery of heat fed
into the grid• Presentation of the A2A Ciclo Idrico Investment Plan• Intervention at "Fa la Cosa Giusta" on investments and innovations in
district heating in MilanMarket BU• Proposed collaboration Legambiente on electric mobilityCorporate BU• Presentation of activities to various environmental associations• Meetings with new summits• Evaluation of collaborations and ways of listening to territorial needsGeneration and Trading BU• Meetings on the themes of decarbonisation and conversion of
Monfalcone plant
STAKEHOLDERS INVOLVED
MODE OF COMMUNICATION
AND INVOLVEMENT
ISSUES ADDRESSED DURING ENGAGEMENT ACTIVITIES, IDENTIFIED BY BU
InstitutionsRegulatory and Inspection Authorities
• Meetings (physical, telephone and Web)
• Convention/press conferences/events
• Work groups/committee
• Plant tours
Environment BU• Start of relations with ARERA. Information meetings on the activities of
A2A Ambiente, providing first priority points and "hot" themes• Meeting with administrators of the municipality of Pero for problems of
fumes in the area near the waste-to-energy plant Silla2• Plant/office visits• Hearings and commissionsNetworks and District Heating BU• Meeting of the AU Conciliation Service - assessment of the
management and reporting of critical issues detected• Presentation of Unareti's first evaluations of the 2G smart meters
commissioning plan for the areas for which it is responsible and initiation of discussions with Arera's Infrastructure Department on the main technical and regulatory criticalities
• Meetings with institutions to review the prices of district heating and tax credit services
• Visit to the site of the new Nuvolera purification plant by the mayors, assessors and councillors of the municipalities involved
Market BU• Meeting of the AU Conciliation Service - assessment of the
management and reporting of critical issues detected• With the support of the company Utilitatis, organized a workshop to
present the Green Book to the Directorate of Energy and Basic Industry (DG Competition of AGCM)
• Meetings for expansion of electric mobility Valtellina• Meetings for expansion of electric mobility MilanCorporate BU• Meetings with the representatives of the institutions in the territories
in which the Group operates to listen to needs, report on activities and evaluate future projects
Generation and Trading BU• Meeting with directors for various activities on hydroelectric plants in
Calabria• Meeting with the Commission for the Project for the redevelopment of
the chimney of the Ponti sul Mincio power plant• Meetings for activities related to the conversion of Monfalcone Plant• Delivery of Intercultura Scholarships at the Monfalcone Thermoelectric
Power Plant• Meeting with administrators for requests for enhancement of the
territory• Meeting for industrial heat recovery
Multi-stakeholders
• Conventions/press conferences/events
• Meetings (physical, telephone and Web)
• Work groups/committees
• Studies/Surveys• Plant tours• The forumAscolto
programme
Group• Materiality analysisEnvironment BU• Inauguration of the new plastic selection plant in Cavaglià• Visits to national and international delegation facilities• Presentation of the university study on energy/environment• Presentation with the Municipality of Brescia of the booklet "Il viaggio
della materia" (The journey of matter)• Event DM Biomethane at the House of Energy - Training and public
information on the new biomethane decree for exclusive use in transport
• Compostable information campaign• Food Waste Reduction, project from forumAscolto Milan• Project Urban Decoration, project from forumAscolto Milan• Ecoisole Project• Project for the collection of waste from electrical and electronic
equipment (WEEE) at large-scale retail• Project for the collection of used food oil at large-scale retail• Conference "The sustainable evolution of vehicles for environmental
services" at the auditorium via Olgettina: a day of discussion between the most authoritative players in the market of reference that illustrated the developments of new technologies on vehicles for waste collection and street sweeping
• Collaboration with the Bollate Prison for the introduction of separate collection within the Institute with the collaboration of prisoners
• Presentation to Consumer Associations of the results of Customer Satisfaction on the services provided by AMSA
Stakeholder engagement and materiality analysis
Financial capital
Manufacturing capital
Natural capital
Human capital
Relational capital
The Acsm Agam Group
Stakeholder engagement and materiality analysis A2A 2018 Integrated Report - Supplement
54
STAKEHOLDERS INVOLVED
MODE OF COMMUNICATION
AND INVOLVEMENT
ISSUES ADDRESSED DURING ENGAGEMENT ACTIVITIES, IDENTIFIED BY BU
Multi-stakeholders
• Convention/press conferences/events
• Meetings (physical, telephone and Web)
• Work groups/committee
• Studies/Surveys• Plant tours• The forumAscolto
programme
Networks and District Heating BU• Presentation of the new decorations of the electrical stations of the
municipality of Brescia• Plan advocacy referendum on public water• Training course for water and district heating conciliators• Participation in the Robot&scienza event with workshops on waste and
water saving• Presentation of the new Valtrompia purification plant• Presentation of the works of the collector in the stretch between Brozzo
di Marcheno and Tavernole sul Mella, as part of the project of the new collector Valtrompia
• Presentation of the intervention on the river Mella prodromal to the realization of the purifier of Valtrompia
• Inauguration of a drinking water treatment plant for the abatement of Chromium VI
• Visit of the Korean delegation to the Verziano purification plant• Presentation of the project to phase out coal for the Lamarmora
cogeneration plantMarket BU• Research project for the creation of a new commercial offer • Table: What are the scenarios for the end of protection in energy
markets?• Meeting ARERA - Adr organisms• Presentation of the installation of 32 new electric recharging stations in
the municipality of Bergamo• Joint Board of Directors between Confindustria Bergamo/Varese and
AIB Brescia tertiary sector with visit to the waste-to-energy plantCorporate BU• Meetings with authorities, consumer associations, competitors and
other companies on the subject of ADR conciliation and definition of communication plans
• Meetings with companies, start-ups and young entrepreneurs for possible collaborations
• School-Work Alternation (lessons, visits to facilities and internships)• Presentation of 2017 Integrated Financial Statements• Presentation of territorial sustainability reports (Milan, Brescia,
Bergamo, Valtellina and Valchiavenna, FVG, Piedmont)• forumAscolto Piedmont• Award ceremony for the territorial sustainability initiative CreiAMO
FVG, from the forumAscolto FVGGeneration and Trading BU• Ampezzo and Somplago open plants• Conference Ideas Competition - Renovation of the central chimney of
Ponti sul Mincio and awardingSmart City• Delegation of young entrepreneurs to visit the waste-to-energy plant
and smart city lab• Presentation of the Smart City project in collaboration with the
Province of Brescia for fibre coverage and smart services in 26 Brescia municipalities
Shareholders Investors
• Meeting (physical, telephone and Web)
• Work groups/committee
Environment BU• Intervention "Sustainability in A2A", with focus on the Circular
EconomyCorporate BU• Presentation of fiscal year 2017 Results and 2018-2022 Strategic Plan• Presentation of first quarter 2018 Results• Presentation of first half 2018 Results• Presentation of third quarter 2018 Results
Suppliers
• Conventions/press conferences/events
• Meetings (physical, telephone and Web)
Market BU
• Event with commercial suppliers to share strategies and objectives• Training events for sales network
STAKEHOLDERS INVOLVED
MODE OF COMMUNICATION
AND INVOLVEMENT
ISSUES ADDRESSED DURING ENGAGEMENT ACTIVITIES, IDENTIFIED BY BU
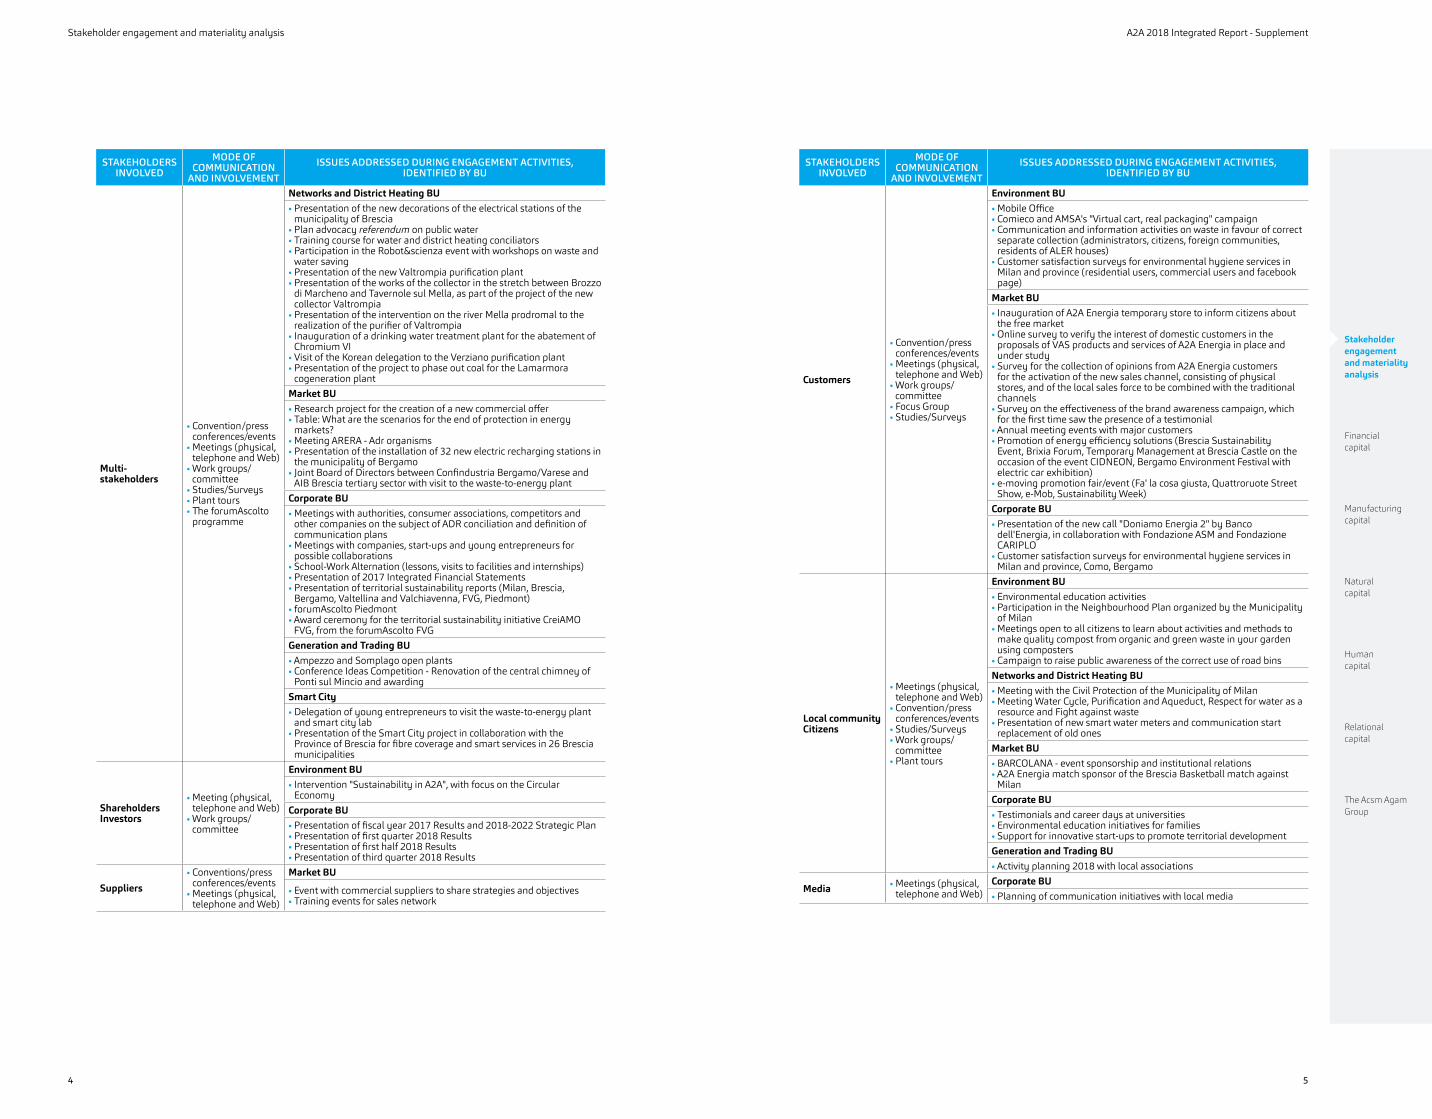
Customers
• Convention/press conferences/events
• Meetings (physical, telephone and Web)
• Work groups/committee
• Focus Group• Studies/Surveys
Environment BU• Mobile Office• Comieco and AMSA's "Virtual cart, real packaging" campaign• Communication and information activities on waste in favour of correct
separate collection (administrators, citizens, foreign communities, residents of ALER houses)
• Customer satisfaction surveys for environmental hygiene services in Milan and province (residential users, commercial users and facebook page)
Market BU• Inauguration of A2A Energia temporary store to inform citizens about
the free market • Online survey to verify the interest of domestic customers in the
proposals of VAS products and services of A2A Energia in place and under study
• Survey for the collection of opinions from A2A Energia customers for the activation of the new sales channel, consisting of physical stores, and of the local sales force to be combined with the traditional channels
• Survey on the effectiveness of the brand awareness campaign, which for the first time saw the presence of a testimonial
• Annual meeting events with major customers• Promotion of energy efficiency solutions (Brescia Sustainability
Event, Brixia Forum, Temporary Management at Brescia Castle on the occasion of the event CIDNEON, Bergamo Environment Festival with electric car exhibition)
• e-moving promotion fair/event (Fa' la cosa giusta, Quattroruote Street Show, e-Mob, Sustainability Week)
Corporate BU• Presentation of the new call "Doniamo Energia 2" by Banco
dell'Energia, in collaboration with Fondazione ASM and Fondazione CARIPLO
• Customer satisfaction surveys for environmental hygiene services in Milan and province, Como, Bergamo
Local communityCitizens
• Meetings (physical, telephone and Web)
• Convention/press conferences/events
• Studies/Surveys• Work groups/
committee• Plant tours
Environment BU• Environmental education activities• Participation in the Neighbourhood Plan organized by the Municipality
of Milan• Meetings open to all citizens to learn about activities and methods to
make quality compost from organic and green waste in your garden using composters
• Campaign to raise public awareness of the correct use of road binsNetworks and District Heating BU• Meeting with the Civil Protection of the Municipality of Milan • Meeting Water Cycle, Purification and Aqueduct, Respect for water as a
resource and Fight against waste• Presentation of new smart water meters and communication start
replacement of old onesMarket BU• BARCOLANA - event sponsorship and institutional relations• A2A Energia match sponsor of the Brescia Basketball match against
MilanCorporate BU• Testimonials and career days at universities• Environmental education initiatives for families• Support for innovative start-ups to promote territorial developmentGeneration and Trading BU• Activity planning 2018 with local associations
Media • Meetings (physical, telephone and Web)
Corporate BU• Planning of communication initiatives with local media

Stakeholder engagement and materiality analysis
Financial capital
Manufacturing capital
Natural capital
Human capital
Relational capital
The Acsm Agam Group
Stakeholder engagement and materiality analysis A2A 2018 Integrated Report - Supplement
76
STAKEHOLDERS INVOLVED
MODE OF COMMUNICATION
AND INVOLVEMENT
ISSUES ADDRESSED DURING ENGAGEMENT ACTIVITIES, IDENTIFIED BY BU
Employees
• Convention/press conferences/events
• Meetings (physical, telephone and Web)
• Work groups/committee
• Focus Group• Studies/Surveys
Group• Induction A2A, a project dedicated to new recruits under 35 years of
age who are professional graduates of the Group• As part of the Talent Management project, the Young Talent programme
was launched, dedicated to the Group's potential young people (under 35 years of age, graduates with a professional role), about 130
• ABC Managerial Development - Start of the third, fourth, fifth and sixth Plenaries and 2 training modules of the managerial training course dedicated to the 1,100 managers
• LiHS programme, aimed at developing the culture of safety within the organization through a cascading path
• Awareness-raising activities for employers on the subject of procurement with regard to environmental and occupational safety aspects
• Survey to understand the status of application and effectiveness of the currently adopted HSE organizational model
Environment BU• Team building and change management initiativesNetworks and District Heating BU• Network Day: 2,000 people from the Networks and District Heating
BU were involved in 9 half-day training sessions on the following topics: Positioning and strategy of the BU; Projects in progress for the BU Companies; HR Themes; Lean and Mistral Sites and improvement paths
Market BU• Change management initiatives• Various training initiatives: Digital Customer Experience (training
project to support Digital Transformation), training aimed at the Group's Marketing function, aims to explore technical skills, industry developments, reference trends and customer-centric approach, issues related to SEUs and self-production to support new investments of the A2A Group internally or related to third parties
Corporate BU• ABC Managerial Development - coordination with CoDir for the in-
depth study of priority issues and in phase of innovation and process review related to the management model, issued after the first phase of the project ABC
• Team building and change managementinitiatives• Meetings Ambassador Banco dell'Energia• Widespread training initiatives, both on site and through webinars on
various topics (purchases, 231, sales, security...)• Events Ad Incontra• Sharing and openness to the use of the Bussola 2.0 tool and sharing
with all Staff Directors of the Dynamic Dimensioning Model• Lean methodology application through 15 project initiatives in all BUs• Welfare day aimed at presenting the new welfare platform and its
services to employees• Events of scholarship delivery to the children of employees• Survey of internal customers of corporate functions and BUs on the
level of satisfaction perceived with regard to the services provided by the Staff functions
• Participation in a survey by Panorama magazine. Results: A2A is one of the companies where the best work is done in Italy in the Raw Materials, Energy, Procurement and Disposal sectors
Generation and Trading BU• Change management initiatives• Internal training initiative on market abuse regulation and the role of
enforcement authoritiesSmart City• Smart City Day at "Campus Party": develop the ability to collaborate
and work in teams; strengthen the sense of identity and increase engagement with the Group and the Company
STAKEHOLDERS INVOLVED
MODE OF COMMUNICATION
AND INVOLVEMENT
ISSUES ADDRESSED DURING ENGAGEMENT ACTIVITIES, IDENTIFIED BY BU
Auditors• Meetings (physical,
telephone and Web)• Focus Group
Environment BU• Performance bonus agreement years 2018-2019• Provision of a business contribution in the event of obtaining a C
licence and CQC certification• Annual education and training planCorporate BU• Sharing with trade unions:• Conversion Welfare Project• Smartworking Project
Trade associations/professional orders/Civic and spontaneous committees
• Meetings (physical, telephone and Web)
• Convention/press conferences/events
• Work groups/committee
Corporate BU• Meetings with new summits• Evaluation of possible synergies, partnerships and collaborations• Fundraising events for Banco dell'EnergiaSmart City• Meeting for possible collaboration in drafting the report "Osservatorio
Milano 2019" with focus on smart cities
Schools
• Meetings (physical, telephone and Web)
• Convention/press conferences/events
Environment BU• Exhibition workshop "The game of 4R - Reduction, Reuse, Recycling,
Recovery" to raise awareness among new generations and their families on the theme of waste reduction and recycling in the philosophy of the circular economy; the exhibition and its free use by schools has had a very significant educational value. It has been set up in Milan, Brescia and Acerra
• Involvement and participation in the STEM (Science Technology Engineering Mathematics) initiatives promoted by the Municipality of Milan to raise awareness among the new generations towards the study and professional path in the technical and technological field
• Event Mission Earth for 35 classes of the city of Milan which challenged each other in skill games and quizzes on the listed themes - Civic Arena, April 19
• Development of differentiated waste collection in schools in Milan through the pilot project #Ambienteascuola involving 540 classes of primary and I and II grade secondary schools, distributed in about thirty school complexes in the nine municipalities, for a total of 12 thousand pupils. 2,400 containers were distributed in the classrooms and common areas as well as eight hundred informative posters
Corporate BU• Event of presentation to teachers of activities for schools in Milan and
Brescia on the themes of respect and enhancement of diversity• Training meetings with groups made up of school leaders, teachers, ata
staff, student representatives and parents on the subject of separate collection
• Award event for the 6 winning classes of the reality game "Our energy for the environment"
Generation and Trading BU • Meetings with universities for possible collaboration activities and
research grants• School-Work Alternation project: Promotion of environmental
education initiatives, active citizenship and knowledge of the Group's activities, also through the organization of plant visits and internships for II grade secondary school students
Stakeholder engagement and materiality analysis
Financial capital
Manufacturing capital
Natural capital
Human capital
Relational capital
The Acsm Agam Group
Stakeholder engagement and materiality analysis A2A 2018 Integrated Report - Supplement
98
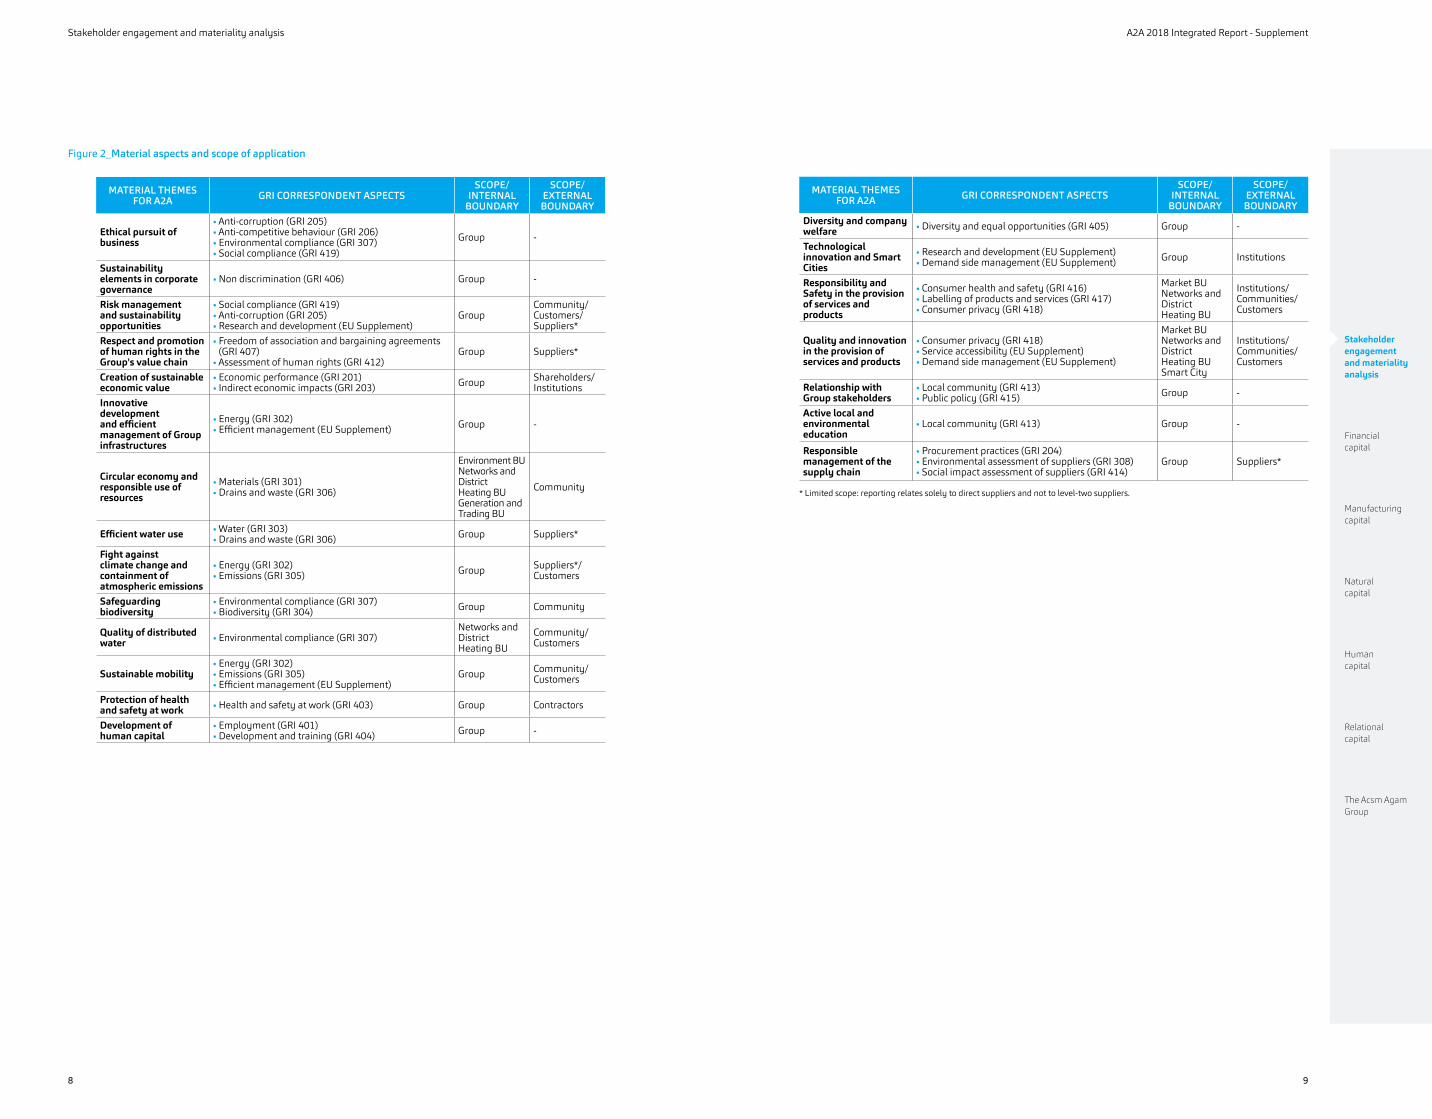
Figure 2_Material aspects and scope of application
MATERIAL THEMES FOR A2A GRI CORRESPONDENT ASPECTS
SCOPE/INTERNAL
BOUNDARY
SCOPE/EXTERNAL BOUNDARY
Ethical pursuit of business
• Anti-corruption (GRI 205)• Anti-competitive behaviour (GRI 206)• Environmental compliance (GRI 307)• Social compliance (GRI 419)
Group -
Sustainability elements in corporate governance
• Non discrimination (GRI 406) Group -
Risk management and sustainability opportunities
• Social compliance (GRI 419)• Anti-corruption (GRI 205)• Research and development (EU Supplement)
GroupCommunity/Customers/Suppliers*
Respect and promotion of human rights in the Group's value chain
• Freedom of association and bargaining agreements (GRI 407)
• Assessment of human rights (GRI 412)Group Suppliers*
Creation of sustainable economic value
• Economic performance (GRI 201)• Indirect economic impacts (GRI 203) Group Shareholders/
InstitutionsInnovative development and efficient management of Group infrastructures
• Energy (GRI 302)• Efficient management (EU Supplement) Group -
Circular economy and responsible use of resources
• Materials (GRI 301)• Drains and waste (GRI 306)
Environment BUNetworks and District Heating BUGeneration and Trading BU
Community
Efficient water use • Water (GRI 303)• Drains and waste (GRI 306) Group Suppliers*
Fight against climate change and containment of atmospheric emissions
• Energy (GRI 302)• Emissions (GRI 305) Group Suppliers*/
Customers
Safeguarding biodiversity
• Environmental compliance (GRI 307)• Biodiversity (GRI 304) Group Community
Quality of distributed water • Environmental compliance (GRI 307)
Networks and District Heating BU
Community/Customers
Sustainable mobility• Energy (GRI 302)• Emissions (GRI 305)• Efficient management (EU Supplement)
Group Community/Customers
Protection of health and safety at work • Health and safety at work (GRI 403) Group Contractors
Development of human capital
• Employment (GRI 401)• Development and training (GRI 404) Group -
MATERIAL THEMES FOR A2A GRI CORRESPONDENT ASPECTS
SCOPE/INTERNAL
BOUNDARY
SCOPE/EXTERNAL BOUNDARY
Diversity and company welfare • Diversity and equal opportunities (GRI 405) Group -
Technological innovation and Smart Cities
• Research and development (EU Supplement)• Demand side management (EU Supplement) Group Institutions
Responsibility and Safety in the provision of services and products
• Consumer health and safety (GRI 416)• Labelling of products and services (GRI 417)• Consumer privacy (GRI 418)
Market BUNetworks and District Heating BU
Institutions/Communities/Customers
Quality and innovation in the provision of services and products
• Consumer privacy (GRI 418)• Service accessibility (EU Supplement)• Demand side management (EU Supplement)
Market BUNetworks and District Heating BUSmart City
Institutions/Communities/Customers
Relationship with Group stakeholders
• Local community (GRI 413)• Public policy (GRI 415) Group -
Active local and environmental education
• Local community (GRI 413) Group -
Responsible management of the supply chain
• Procurement practices (GRI 204)• Environmental assessment of suppliers (GRI 308)• Social impact assessment of suppliers (GRI 414)
Group Suppliers*
* Limited scope: reporting relates solely to direct suppliers and not to level-two suppliers.

Stakeholder engagement and materiality analysis
Financial capital
Manufacturing capital
Natural capital
Human capital
Relational capital
The Acsm Agam Group
Financial capital A2A 2018 Integrated Report - Supplement
1110
Figure 4_Statement for distribution of the gross global added value [GRI 201 - 1_4]
(millions of euro) 2016 2017 2018
REMUNERATION OF PERSONNEL 450 475 492
Wages and salaries 389 420 428
Employees' leaving entitlement (TFR) 26 29 31
Other costs 35 26 33
REMUNERATION OF EQUITY CAPITAL 125 159 190
Profits distributed 126 153 180
Net Income attributable to minority Interests -1 6 10
REMUNERATION OF DEBT CAPITAL 159 138 116
TRANSFERS TO THE GOVERNMENT 286 268 322
Direct taxes for the Treasury 139 106 148
Other taxes and duties for the Treasury 1 2 1
Social security charges 146 160 173
TRANSFERS TO THE LOCAL COMMUNITY 63 65 67
Direct taxes for local authorities 28 26 30
Local taxes and duties 31 33 33
Sponsorships 1 1 1
Contributions to AEM and ASM foundations, aid, donations and charity 3 5 3
COMPANY REMUNERATION 509 550 627
Reserves 106 140 164
Amortization, depreciation 403 410 463
GROSS GLOBAL VALUE ADDED 1,592 1,655 1,814
Figure 5_Gross operating margin by Business Unit*
(millions of euro) 2016 2017 2018
Generation and Trading 404 356 370
Market 144 216 206
Environment 240 261 268
Networks and District Heating 397 391 410
Smart City 6 7 11
Corporate -29 -30 -34
International 69 -2 0
Total 1,231 1,199 1,231
* 2017 data have been restated as they reflect the reclassification of the EPCG Group’s results in accordance with IFRS 5.
Financial capitalFigure 3_Statement for calculating the global added value [GRI 201 - 1_4]
(millions of euro) 2016 2017 2018
+A) Production value 4,860 5,796 6,494
Revenue from sales and services (- revenue adjustments) 4,576 5,590 6,270
Change in inventory of products in progress, semi-finished products and finished products 0 0 0
Change in contract work in progress 5 0 1
Other revenue and income 279 206 223
Government grants 0 0 0
- B) Intermediate production costs 3,382 4,000 4,740
Raw materials and consumables consumption 176 296 344
Energy and fuel consumption 1,938 2,554 3,038
Costs for services 758 849 985
Other operating expenses 108 106 93
Accruals to bad debt provision - current receivables 21 35 25
Provisions for risks 50 10 -5
Other write-downs of fixed assets 245 34 160
Other operating expenses 100 135 136
Material own work capitalised -14 -19 -36
GROSS CORE VALUE ADDED 1,478 1,796 1,754
- C) Financial balance -2 4 4
Financial income 16 19 16
Financial expenses other than interest on loans -15 -20 -16
Unrealised gains and losses on equity investments in associates -3 5 4
-D) Auxiliary and extraordinary components 116 -145 56
+/- auxiliary balance 64 -145 42
+/- extraordinary balance 52 0 14
GROSS GLOBAL VALUE ADDED 1,592 1,655 1,814
- Depreciation and amortisation 403 410 463
NET GLOBAL VALUE ADDED 1,189 1,245 1,351
Stakeholder engagement and materiality analysis
Financial capital
Manufacturing capital
Natural capital
Human capital
Relational capital
The Acsm Agam Group
A2A 2018 Integrated Report - Supplement
13
Financial capital
12
Manufacturing capitalEnergy production
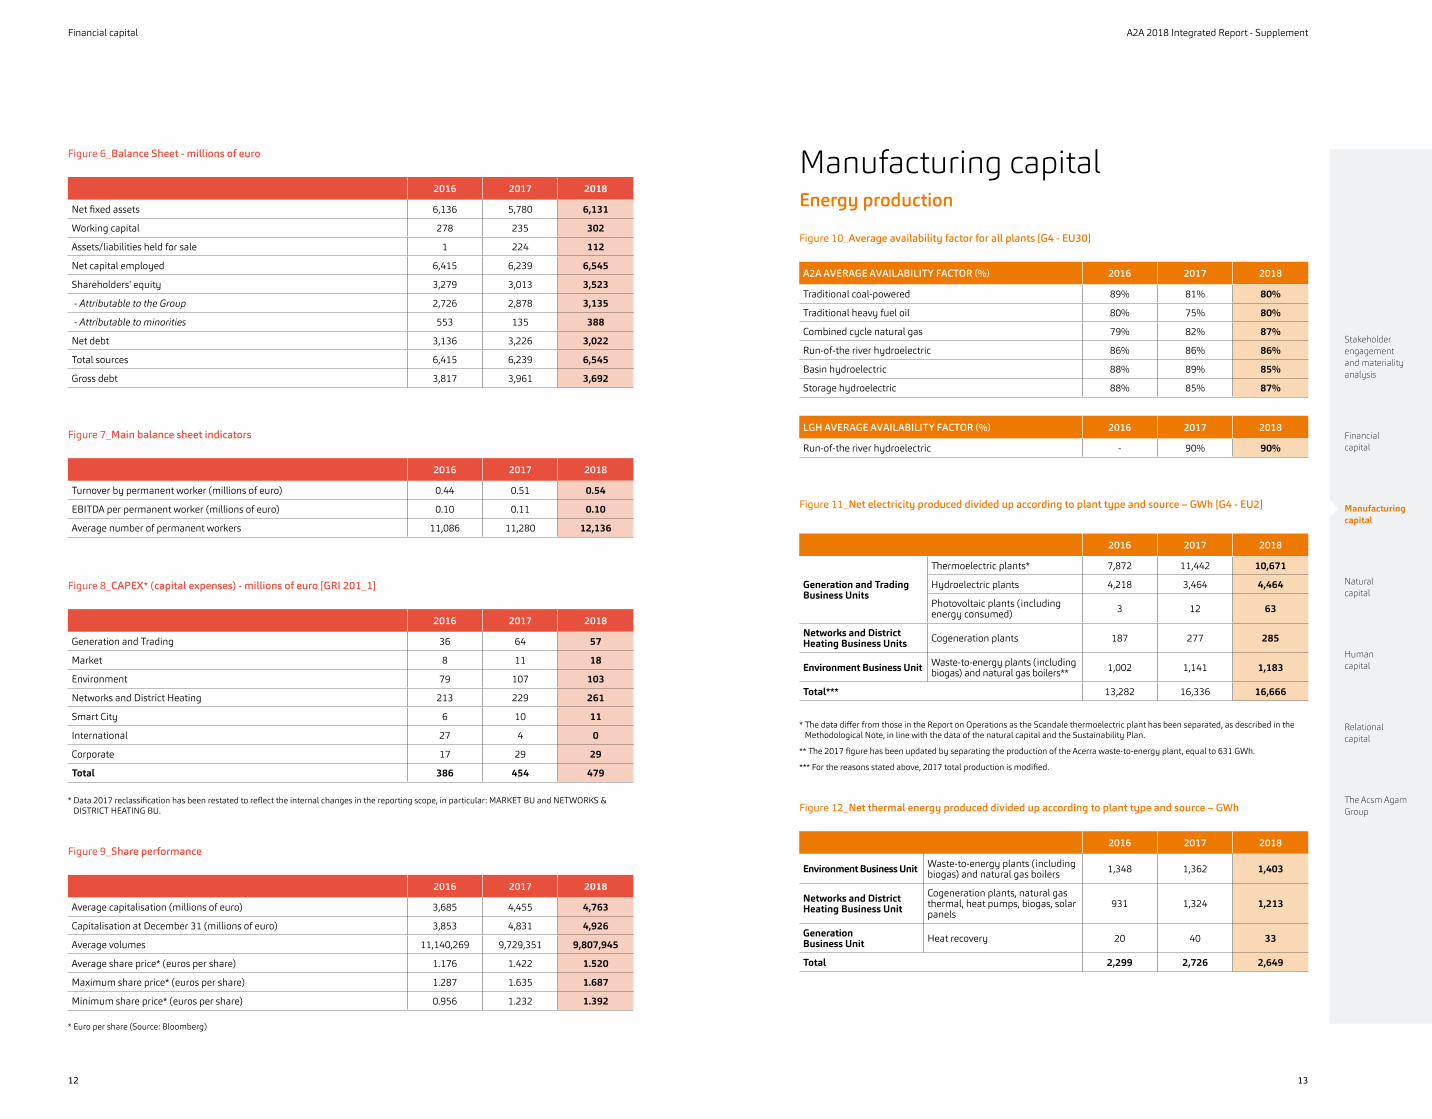
Figure 10_Average availability factor for all plants [G4 - EU30]
A2A AVERAGE AVAILABILITY FACTOR (%) 2016 2017 2018
Traditional coal-powered 89% 81% 80%
Traditional heavy fuel oil 80% 75% 80%
Combined cycle natural gas 79% 82% 87%
Run-of-the river hydroelectric 86% 86% 86%
Basin hydroelectric 88% 89% 85%
Storage hydroelectric 88% 85% 87%
LGH AVERAGE AVAILABILITY FACTOR (%) 2016 2017 2018
Run-of-the river hydroelectric - 90% 90%
Figure 11_Net electricity produced divided up according to plant type and source – GWh [G4 - EU2]
2016 2017 2018
Generation and Trading Business Units
Thermoelectric plants* 7,872 11,442 10,671
Hydroelectric plants 4,218 3,464 4,464
Photovoltaic plants (including energy consumed) 3 12 63
Networks and District Heating Business Units Cogeneration plants 187 277 285
Environment Business Unit Waste-to-energy plants (including biogas) and natural gas boilers** 1,002 1,141 1,183
Total*** 13,282 16,336 16,666
* The data differ from those in the Report on Operations as the Scandale thermoelectric plant has been separated, as described in the Methodological Note, in line with the data of the natural capital and the Sustainability Plan.
** The 2017 figure has been updated by separating the production of the Acerra waste-to-energy plant, equal to 631 GWh.
*** For the reasons stated above, 2017 total production is modified.
Figure 12_Net thermal energy produced divided up according to plant type and source – GWh
2016 2017 2018
Environment Business Unit Waste-to-energy plants (including biogas) and natural gas boilers 1,348 1,362 1,403
Networks and District Heating Business Unit
Cogeneration plants, natural gas thermal, heat pumps, biogas, solar panels
931 1,324 1,213
Generation Business Unit Heat recovery 20 40 33
Total 2,299 2,726 2,649
Figure 6_Balance Sheet - millions of euro
2016 2017 2018
Net fixed assets 6,136 5,780 6,131
Working capital 278 235 302
Assets/liabilities held for sale 1 224 112
Net capital employed 6,415 6,239 6,545
Shareholders' equity 3,279 3,013 3,523
- Attributable to the Group 2,726 2,878 3,135
- Attributable to minorities 553 135 388
Net debt 3,136 3,226 3,022
Total sources 6,415 6,239 6,545
Gross debt 3,817 3,961 3,692
Figure 7_Main balance sheet indicators
2016 2017 2018
Turnover by permanent worker (millions of euro) 0.44 0.51 0.54
EBITDA per permanent worker (millions of euro) 0.10 0.11 0.10
Average number of permanent workers 11,086 11,280 12,136
Figure 8_CAPEX* (capital expenses) - millions of euro [GRI 201_1]
2016 2017 2018
Generation and Trading 36 64 57
Market 8 11 18
Environment 79 107 103
Networks and District Heating 213 229 261
Smart City 6 10 11
International 27 4 0
Corporate 17 29 29
Total 386 454 479
* Data 2017 reclassification has been restated to reflect the internal changes in the reporting scope, in particular: MARKET BU and NETWORKS & DISTRICT HEATING BU.
Figure 9_Share performance
2016 2017 2018
Average capitalisation (millions of euro) 3,685 4,455 4,763
Capitalisation at December 31 (millions of euro) 3,853 4,831 4,926
Average volumes 11,140,269 9,729,351 9,807,945
Average share price* (euros per share) 1.176 1.422 1.520
Maximum share price* (euros per share) 1.287 1.635 1.687
Minimum share price* (euros per share) 0.956 1.232 1.392
* Euro per share (Source: Bloomberg)
Stakeholder engagement and materiality analysis
Financial capital
Manufacturing capital
Natural capital
Human capital
Relational capital
The Acsm Agam Group
Manufacturing capital A2A 2018 Integrated Report - Supplement
1514
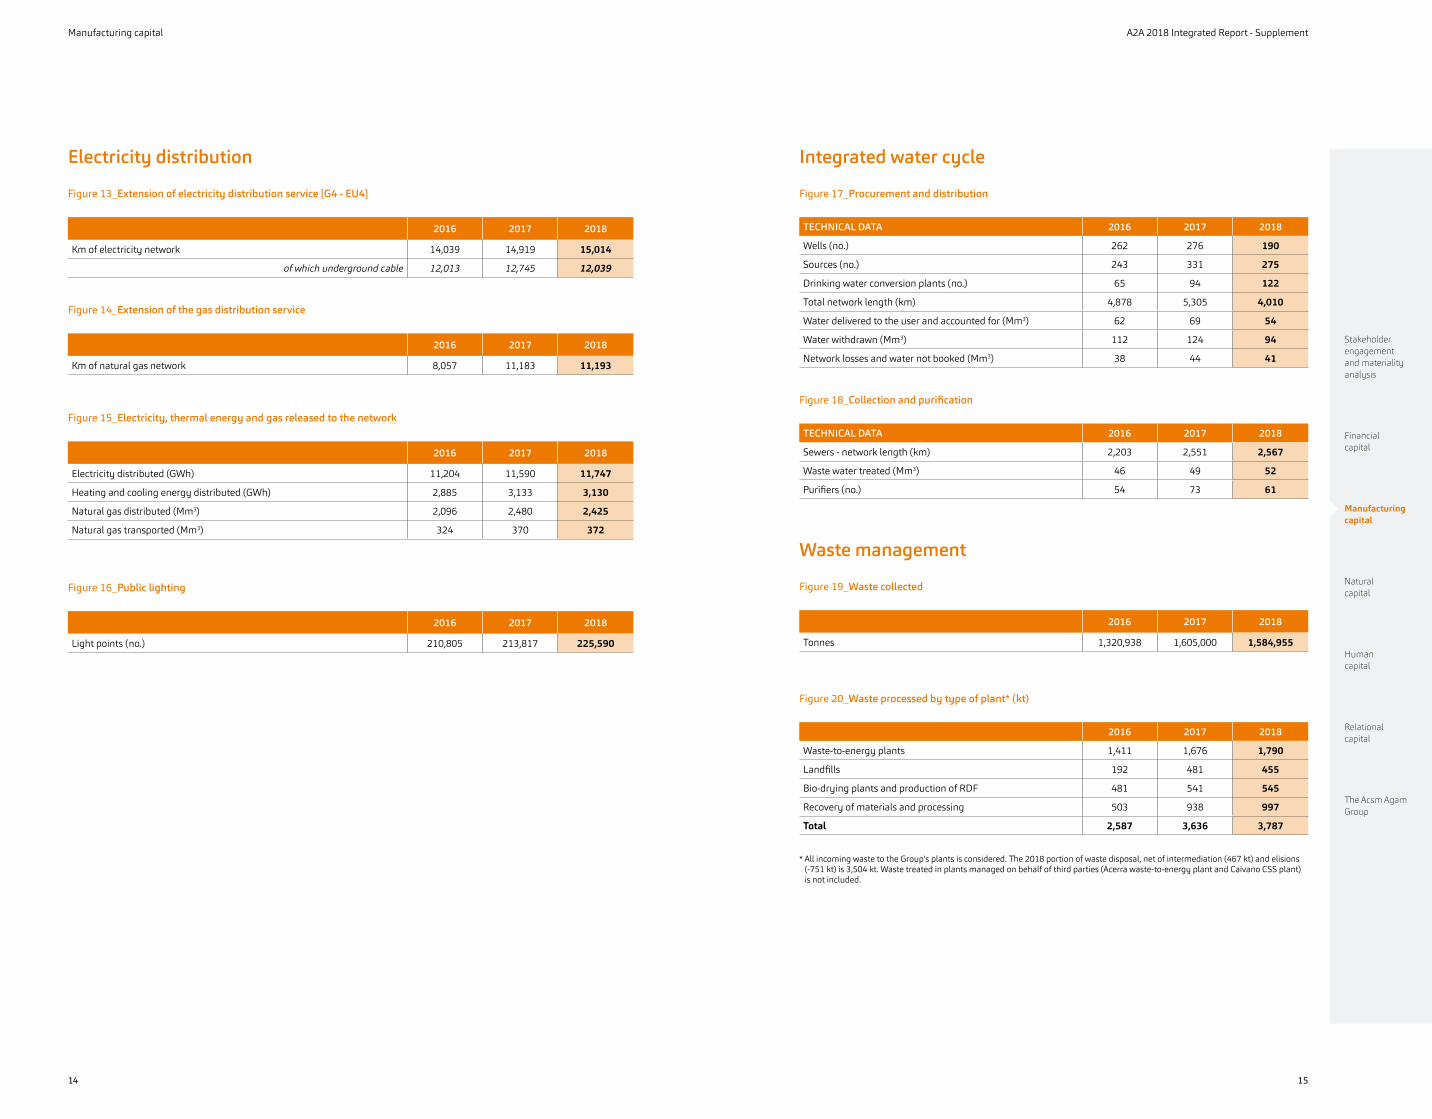
Integrated water cycle
Figure 17_Procurement and distribution
TECHNICAL DATA 2016 2017 2018
Wells (no.) 262 276 190
Sources (no.) 243 331 275
Drinking water conversion plants (no.) 65 94 122
Total network length (km) 4,878 5,305 4,010
Water delivered to the user and accounted for (Mm3) 62 69 54
Water withdrawn (Mm3) 112 124 94
Network losses and water not booked (Mm3) 38 44 41
Figure 18_Collection and purification
TECHNICAL DATA 2016 2017 2018
Sewers - network length (km) 2,203 2,551 2,567
Waste water treated (Mm3) 46 49 52
Purifiers (no.) 54 73 61
Waste management
Figure 19_Waste collected
2016 2017 2018
Tonnes 1,320,938 1,605,000 1,584,955
Figure 20_Waste processed by type of plant* (kt)
2016 2017 2018
Waste-to-energy plants 1,411 1,676 1,790
Landfills 192 481 455
Bio-drying plants and production of RDF 481 541 545
Recovery of materials and processing 503 938 997
Total 2,587 3,636 3,787
* All incoming waste to the Group's plants is considered. The 2018 portion of waste disposal, net of intermediation (467 kt) and elisions (-751 kt) is 3,504 kt. Waste treated in plants managed on behalf of third parties (Acerra waste-to-energy plant and Caivano CSS plant) is not included.
Electricity distribution
Figure 13_Extension of electricity distribution service [G4 - EU4]
2016 2017 2018
Km of electricity network 14,039 14,919 15,014
of which underground cable 12,013 12,745 12,039
Figure 14_Extension of the gas distribution service
2016 2017 2018
Km of natural gas network 8,057 11,183 11,193
Figure 15_Electricity, thermal energy and gas released to the network
2016 2017 2018
Electricity distributed (GWh) 11,204 11,590 11,747
Heating and cooling energy distributed (GWh) 2,885 3,133 3,130
Natural gas distributed (Mm3) 2,096 2,480 2,425
Natural gas transported (Mm3) 324 370 372
Figure 16_Public lighting
2016 2017 2018
Light points (no.) 210,805 213,817 225,590
Stakeholder engagement and materiality analysis
Financial capital
Manufacturing capital
Natural capital
Human capital
Relational capital
The Acsm Agam Group
A2A 2018 Integrated Report - Supplement
17
Manufacturing capital
16
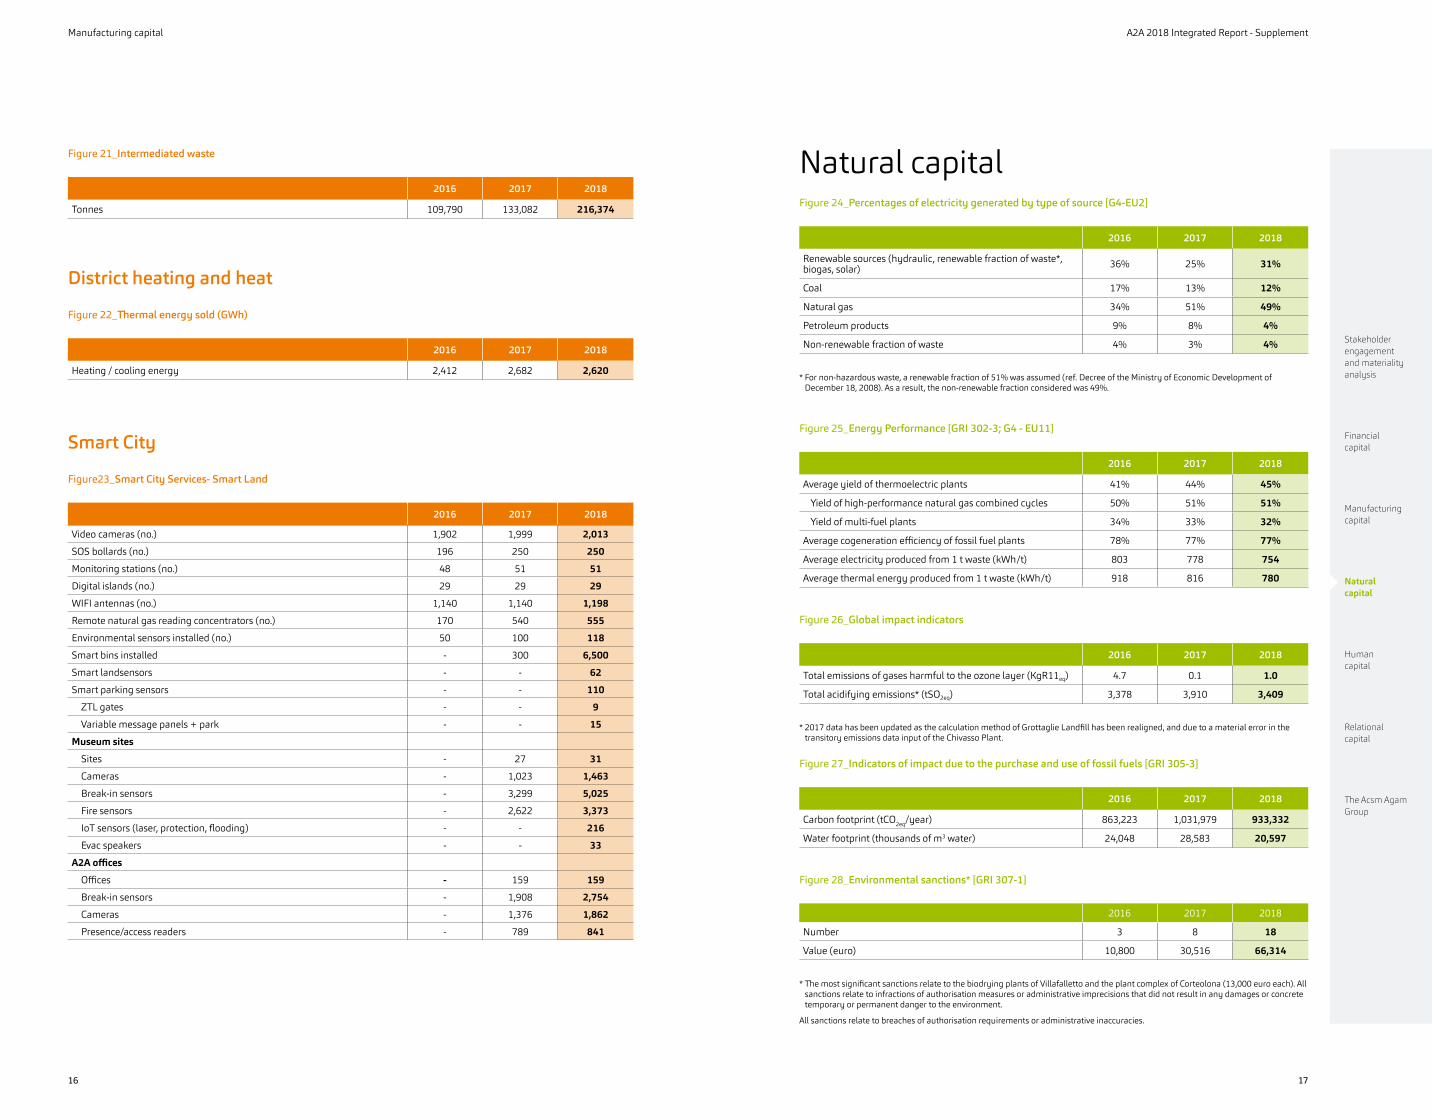
Natural capitalFigure 24_Percentages of electricity generated by type of source [G4-EU2]
2016 2017 2018
Renewable sources (hydraulic, renewable fraction of waste*, biogas, solar) 36% 25% 31%
Coal 17% 13% 12%
Natural gas 34% 51% 49%
Petroleum products 9% 8% 4%
Non-renewable fraction of waste 4% 3% 4%
* For non-hazardous waste, a renewable fraction of 51% was assumed (ref. Decree of the Ministry of Economic Development of December 18, 2008). As a result, the non-renewable fraction considered was 49%.
Figure 25_Energy Performance [GRI 302-3; G4 - EU11]
2016 2017 2018
Average yield of thermoelectric plants 41% 44% 45%
Yield of high-performance natural gas combined cycles 50% 51% 51%
Yield of multi-fuel plants 34% 33% 32%
Average cogeneration efficiency of fossil fuel plants 78% 77% 77%
Average electricity produced from 1 t waste (kWh/t) 803 778 754
Average thermal energy produced from 1 t waste (kWh/t) 918 816 780
Figure 26_Global impact indicators
2016 2017 2018
Total emissions of gases harmful to the ozone layer (KgR11eq) 4.7 0.1 1.0
Total acidifying emissions* (tSO2eq) 3,378 3,910 3,409
* 2017 data has been updated as the calculation method of Grottaglie Landfill has been realigned, and due to a material error in the transitory emissions data input of the Chivasso Plant.
Figure 27_Indicators of impact due to the purchase and use of fossil fuels [GRI 305-3]
2016 2017 2018
Carbon footprint (tCO2eq/year) 863,223 1,031,979 933,332
Water footprint (thousands of m3 water) 24,048 28,583 20,597
Figure 28_Environmental sanctions* [GRI 307-1]
2016 2017 2018
Number 3 8 18
Value (euro) 10,800 30,516 66,314
* The most significant sanctions relate to the biodrying plants of Villafalletto and the plant complex of Corteolona (13,000 euro each). All sanctions relate to infractions of authorisation measures or administrative imprecisions that did not result in any damages or concrete temporary or permanent danger to the environment.
All sanctions relate to breaches of authorisation requirements or administrative inaccuracies.
Figure 21_Intermediated waste
2016 2017 2018
Tonnes 109,790 133,082 216,374
District heating and heat
Figure 22_Thermal energy sold (GWh)
2016 2017 2018
Heating / cooling energy 2,412 2,682 2,620
Smart City
Figure23_Smart City Services- Smart Land
2016 2017 2018
Video cameras (no.) 1,902 1,999 2,013
SOS bollards (no.) 196 250 250
Monitoring stations (no.) 48 51 51
Digital islands (no.) 29 29 29
WIFI antennas (no.) 1,140 1,140 1,198
Remote natural gas reading concentrators (no.) 170 540 555
Environmental sensors installed (no.) 50 100 118
Smart bins installed - 300 6,500
Smart landsensors - - 62
Smart parking sensors - - 110
ZTL gates - - 9
Variable message panels + park - - 15
Museum sites
Sites - 27 31
Cameras - 1,023 1,463
Break-in sensors - 3,299 5,025
Fire sensors - 2,622 3,373
IoT sensors (laser, protection, flooding) - - 216
Evac speakers - - 33
A2A offices
Offices - 159 159
Break-in sensors - 1,908 2,754
Cameras - 1,376 1,862
Presence/access readers - 789 841

Stakeholder engagement and materiality analysis
Financial capital
Manufacturing capital
Natural capital
Human capital
Relational capital
The Acsm Agam Group
Natural capital A2A 2018 Integrated Report - Supplement
1918
Natural capital in the Environment BU
Resources and materials used
Figure 29_Resources used - Environment Business Unit [GRI 301-1; GRI 302-1_2; GRI 303-1]
2016 2017 2018
Fuel (TJ)
Natural gas 464 656 694
Petroleum derivatives (heavy fuel oil and diesel) 24 67 71
Waste, biomass and CSS 15,889 19,317 21,095
Biogas (from landfills and treatment facilities) 624 631 484
Automotive fuels (TJ)
Petrol 6 9 7
Diesel 398 552 504
Methane 96 98 111
Electricity (GWh) 52 53 54
Water resource consumed (thousands m3)
From aqueducts 871 735 511
From wells 2,495 3,004 3,160
Chemical products and materials (t)
Mineral acids 1,771 1,305 1,565
Water additives/conditioners 310 263 260
Ammonia (solution) 5,223 5,722 6,196
Lime and solid neutralisers 26,068 32,124 33,152
Active carbon 1,052 1,293 1,422
Cement, sand an inert materials 136,605 216,722 188,808
Sodium chloride 98 1,704 283
Technical gases (nitrogen, C02, hydrogen, oxygen) 848 1,118 1,370
Sodium hydroxide (solution) 3,131 1,917 2,260
Methanol, solvents and other products 1,486 1,923 2,461
Oils and lubricants 58 141 100
Urea (solution) 1,139 2,032 1,704
Total chemical products 177,789 266,265 239,583
Effluents
Figure 30_Industrial waste water [GRI 306-1]
2016 2017 2018
Volumes (thousands of m3)
Discharged into sewers 404 491 503
Discharged into surface water 1,402 1,115 919
Recovered in the production cycle 363 387 401
% of total water withdrawn 9.9% 10.5% 10.9%
Derivative waters for cooling 709 703 713
Pollutant discharges into surface water (t)
BOD 27 27 20
COD 114 69 47
Waste
Figure 31_Special waste produced [GRI 306-2_4]
2016 2017 2018
Special non-hazardous (t) 443,791 515,353 529,422
Special hazardous (t) 84,306 104,612 111,751
Total special (t) 528,097 619,965 641,173
Sent for recovery (% of total) 47% 52% 52%
Emissions
Figure 32_Total emissions – Environment BU [GRI 305-1_2_6_7]
2016 2017 2018
CO2 from combustion processes (t) 904,171 1,147,430 1,209,825
Biogenic emissions 856,550 1,083,853 1,087,985
CO2 from motor vehicles (t) 35,060 46,430 43,434
CO2 indirect from energy acquisition (t) 16,982 17,558 17,148
Fluorinated gases (t CO2eq) 409 448 524
NOx (t) 621 893 883
SO2 (t) 16 17 36
Powders (t) 2.8 5.7 6.2
Methane (CH4) – biogas losses released in landfills (t CO2eq) 49,092 94,452 90,188
Polycyclic aromatic hydrocarbons (kg) 0.04 0.37 0.07
Mercury (kg) 15 14 15
Other metals (Sb + As + Pb + Cr + Cu + Mn + Ni + V + Sn+Cd+Tl) (kg) 166 321 215
Dioxins* (grams - toxic equivalency) 0.015 0.033 0.039
Dioxin-like PCBs (polychlorinated biphenyls) (grams - toxic equivalency) 0.0043 0.0038 0.0079
* 2016 data have been updated in line with the scope of Environment BU compared to the following years.
Figure 33_Energy generated by waste-to-energy processes [G4-EU2]
2016 2017 2018
Thermal energy from waste-to-energy and biogas process 56% 52% 55%
Electricity from waste-to-energy and biogas process 8% 7% 7%
Stakeholder engagement and materiality analysis
Financial capital
Manufacturing capital
Natural capital
Human capital
Relational capital
The Acsm Agam Group
Natural capital A2A 2018 Integrated Report - Supplement
2120
Natural capital in the Generation and Trading BU
Resources and materials used
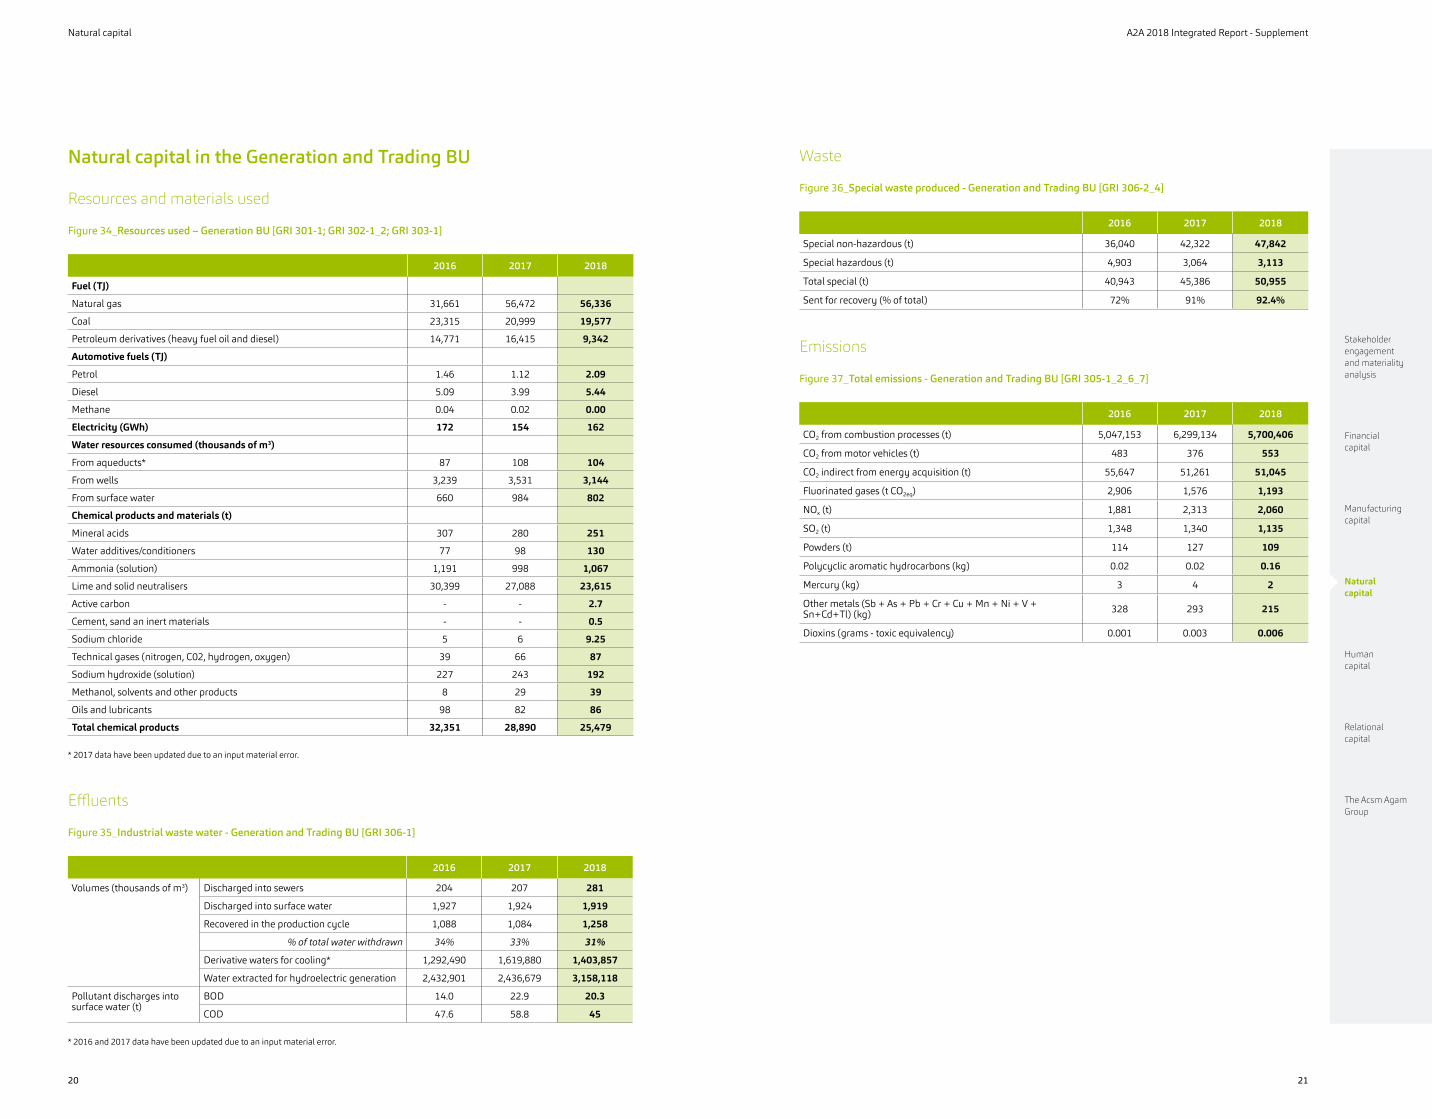
Figure 34_Resources used – Generation BU [GRI 301-1; GRI 302-1_2; GRI 303-1]
2016 2017 2018
Fuel (TJ)
Natural gas 31,661 56,472 56,336
Coal 23,315 20,999 19,577
Petroleum derivatives (heavy fuel oil and diesel) 14,771 16,415 9,342
Automotive fuels (TJ)
Petrol 1.46 1.12 2.09
Diesel 5.09 3.99 5.44
Methane 0.04 0.02 0.00
Electricity (GWh) 172 154 162
Water resources consumed (thousands of m3)
From aqueducts* 87 108 104
From wells 3,239 3,531 3,144
From surface water 660 984 802
Chemical products and materials (t)
Mineral acids 307 280 251
Water additives/conditioners 77 98 130
Ammonia (solution) 1,191 998 1,067
Lime and solid neutralisers 30,399 27,088 23,615
Active carbon - - 2.7
Cement, sand an inert materials - - 0.5
Sodium chloride 5 6 9.25
Technical gases (nitrogen, C02, hydrogen, oxygen) 39 66 87
Sodium hydroxide (solution) 227 243 192
Methanol, solvents and other products 8 29 39
Oils and lubricants 98 82 86
Total chemical products 32,351 28,890 25,479
* 2017 data have been updated due to an input material error.
Effluents
Figure 35_Industrial waste water - Generation and Trading BU [GRI 306-1]
2016 2017 2018
Volumes (thousands of m3) Discharged into sewers 204 207 281
Discharged into surface water 1,927 1,924 1,919
Recovered in the production cycle 1,088 1,084 1,258
% of total water withdrawn 34% 33% 31%
Derivative waters for cooling* 1,292,490 1,619,880 1,403,857
Water extracted for hydroelectric generation 2,432,901 2,436,679 3,158,118
Pollutant discharges into surface water (t)
BOD 14.0 22.9 20.3
COD 47.6 58.8 45
* 2016 and 2017 data have been updated due to an input material error.
Waste
Figure 36_Special waste produced - Generation and Trading BU [GRI 306-2_4]
2016 2017 2018
Special non-hazardous (t) 36,040 42,322 47,842
Special hazardous (t) 4,903 3,064 3,113
Total special (t) 40,943 45,386 50,955
Sent for recovery (% of total) 72% 91% 92.4%
Emissions
Figure 37_Total emissions - Generation and Trading BU [GRI 305-1_2_6_7]
2016 2017 2018
CO2 from combustion processes (t) 5,047,153 6,299,134 5,700,406
CO2 from motor vehicles (t) 483 376 553
CO2 indirect from energy acquisition (t) 55,647 51,261 51,045
Fluorinated gases (t CO2eq) 2,906 1,576 1,193
NOx (t) 1,881 2,313 2,060
SO2 (t) 1,348 1,340 1,135
Powders (t) 114 127 109
Polycyclic aromatic hydrocarbons (kg) 0.02 0.02 0.16
Mercury (kg) 3 4 2
Other metals (Sb + As + Pb + Cr + Cu + Mn + Ni + V + Sn+Cd+Tl) (kg) 328 293 215
Dioxins (grams - toxic equivalency) 0.001 0.003 0.006

Stakeholder engagement and materiality analysis
Financial capital
Manufacturing capital
Natural capital
Human capital
Relational capital
The Acsm Agam Group
Natural capital A2A 2018 Integrated Report - Supplement
2322
Natural capital in the Networks & District Heating BU
Resources and materials used Figure 38_Resources used – Networks and District Heating BU [GRI 301-1; GRI 302-1_2; GRI 303-1]
2016 2017 2018
Fuel (TJ)
Natural gas 2,804 4,215 3,830
Coal 1,846 1,828 1,781
Petroleum derivatives (heavy fuel oil, diesel) 0.5 0.3 0.1
Biogas (from group purification plants) 7 7 6
Automotive fuels (TJ)
Petrol 12 12 10
Diesel 18 18 18
Methane 10 7 9
Electricity (GWh) 128 145 118
Heat energy (GWh - purchased from external sources) 385 446 456
Water resources consumed (thousands of m3)
From aqueducts 673 806 728
From wells 1,857 1,764 2,070
Chemical products and materials (t)
Mineral acids 554 547 674
Water additives/conditioners 8,581 8,457 8,141
Lime and solid neutralisers 1,420 1,812 1,910
Active carbon 50 53 94
Sodium chloride 1 23.65 10.8
Technical gases (nitrogen, C02, hydrogen, oxygen) 162 174 140
Sodium hydroxide (solution) 176 159 198
Methanol, solvents and other products 738 678 740
Odorants 48 52 57
Oils and lubricants 22 43 48
Urea (solution) 439 520 528
Total chemical products 12,191 12,519 12,541
Effluents
Figure 39_Industrial waste water - Networks and District Heating BU [GRI 306-1]
2016 2017 2018
Volumes (thousands of m3)
Discharged into sewers 372 418 355
Discharged into surface water 170 143 251
Recovered in the production cycle 3.8 2.3 3.1
% of total water withdrawn 0.1% 0.1% 0.1%
Derivative waters for cooling 18 15 22
Pollutant discharges into surface water (t)
BOD 0.9 0.4 1.2
COD 3.3 1.7 3.2
Waste
Figure 40_Special waste produced - Networks and District Heating BU [GRI 306-2_4]
2016 2017 2018
Special non-hazardous* (t) 32,333 38,662 38,979
Special hazardous (t) 275 299 321
Total special** (t) 32,608 38,961 39,299
Sent for recovery (% of total) 92% 92% 91%
* 2017 data have been updated to correct an input material error.
** 2017 total value changed due to the update of the data relating to special non-hazardous waste.
Emissions
Figure 41_Total emissions - Networks and District Heating BU [GRI 305-1_2_6_7]
2016 2017 2018
CO2 from combustion processes (t) 338,675 419,238 392,712
CO2 from motor vehicles (t) 2,721 2,608 2,541
CO2 indirect from energy acquisition (t) 41,854 48,100 37,237
Fluorinated gases (t CCO2eq) 2,154 292 960
Methane (CH4) - losses from natural gas distribution networks (t CO2eq) 43,931 38,824 43,154
NOx (t) 203 259 179
SO2 (t) 118 123 129
Powders (t) 0.4 0.5 0.7
Figure 42_Electricity losses in the grid [GRI EU 12]
2016 2017 2018
GWh 323 389 354

Stakeholder engagement and materiality analysis
Financial capital
Manufacturing capital
Natural capital
Human capital
Relational capital
The Acsm Agam Group
A2A 2018 Integrated Report - Supplement
25
Natural capital
24
Natural capital in the Corporate BU
Resources and materials used
Figure 43_Resources used – Corporate Business Unit [GRI 301-1; GRI 302-1_2; GRI 303-1]
2016 2017 2018
Water (thousand m3) 184 169 168
Electricity (GWh) 17 16 14
Fuel (TJ)
Methane 35 29 25
Fuels (TJ)
Petrol 2 4 3
Diesel 12 56 48
Methane 2 3 3
Waste
Figure 44_Special waste produced – Corporate BU [GRI 306-2_4]
2016 2017 2018
Special non-hazardous (t) 48 111 169
Special hazardous (t) 26 93 93
Total special (t) 74 204 262
Sent for recovery (% of total) 90% 90% 98.5%
Emissions
Figure 45_Total emissions – Corporate BU [GRI 305-1_2_6_7]
2016 2017 2018
CO2 from combustion processes (t) 1,940 1,613 1,425
CO2 from motor vehicles (t) 1,070 4,601 3,927
CO2 indirect from energy acquisition (t) 5,454 5,368 4,377
Fluorinated gases (t CO2eq) 536 276 552
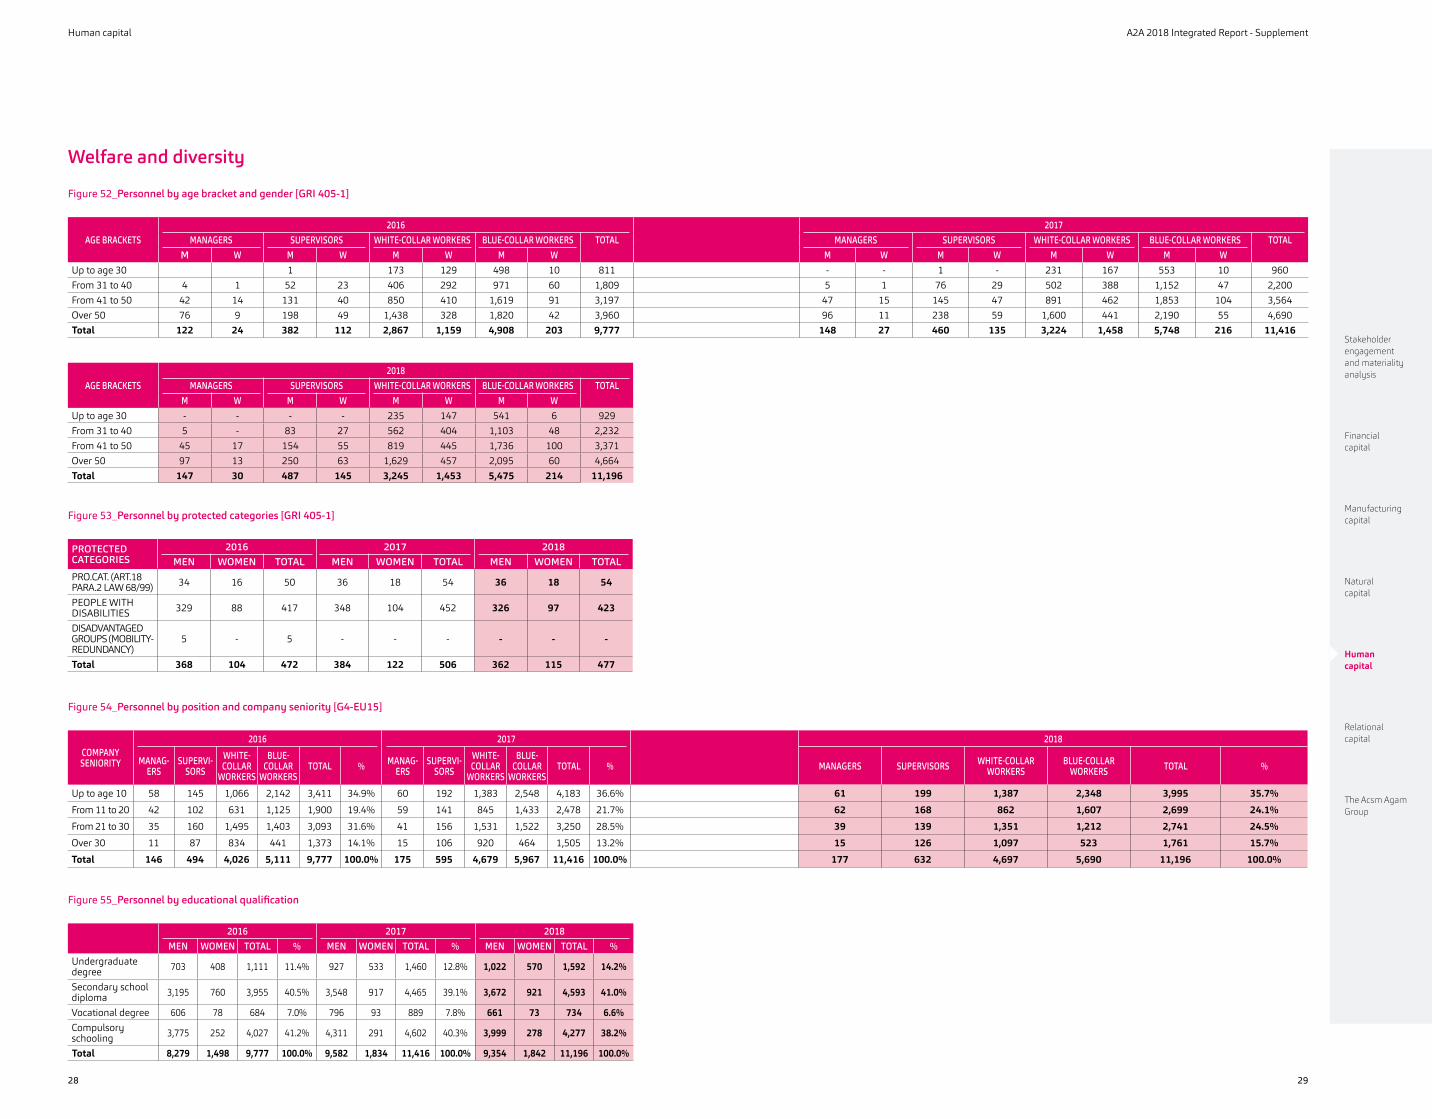
Human capitalComposition of personnel
Figure 46_Personnel by category and type of contract [GRI 102-8; 405-1]
2016 2017 2018
MEN WOMEN TOTAL MEN WOMEN TOTAL MEN WOMEN TOTAL
Managers 121 24 145 147 27 174 146 29 175
Supervisors 381 112 493 458 135 593 485 145 630
White-collar workers 2,844 1,141 3,985 3,185 1,416 4,601 3,213 1,421 4,634
Blue-collar workers 4,527 193 4,720 5,241 205 5,446 4,992 202 5,194
Permanent workers 7,873 1,470 9,343 9,031 1,783 10,814 8,836 1,797 10,633
of which, on-the-job training and first job
contracts5 - 5 11 - 11 - - -
Fixed-term workers 406 28 434 551 51 602 518 45 563
of which:
Managers 1 - 1 1 - 1 1 1 2
Supervisors 1 - 1 2 - 2 2 - 2
White-collar workers 23 18 41 40 39 79 32 32 64
Blue-collar workers 381 10 391 507 11 518 483 12 495
TOTAL 8,279 1,498 9,777 9,582 1,834 11,416 9,354 1,842 11,196
of which workers with part-time contracts 51 244 295 38 286 324 75 275 350
of which workers with full-time contracts 8,228 1,254 9,482 9,544 1,548 11,092 9,279 1,567 10,846
Workers with non-standard contracts* (temporary/interns/collaborators)
26 9 35 84 44 128 118 40 158
* Workers under non-standard contracts do not include consultants.
Figure 47_Personnel by type of contract applied [GRI 102-41]
2016 2017 2018
Executive contracts 146 174 177
Electrical contracts 3,160 3,387 3,473
Single natural gas and water contracts 1,250 1,781 1,567
Commercial contracts 341 389 453
Urban hygiene contracts 4,246 4,756 4,556
FISE contracts 456 661 735
Chemical contracts 178 178 178
Other contracts - 90 57
Total 9,777 11,416 11,196

Stakeholder engagement and materiality analysis
Financial capital
Manufacturing capital
Natural capital
Human capital
Relational capital
The Acsm Agam Group
Human capital A2A 2018 Integrated Report - Supplement
2726
Figure 48_Personnel by workplace [GRI 102-8]
REGION2016 2017 2018
MEN WOMEN TOTAL MEN WOMEN TOTAL MEN WOMEN TOTAL
Abruzzo 51 5 56 51 5 56 50 5 55
Calabria 79 1 80 78 1 79 77 1 78
Campania 192 15 207 192 16 208 193 17 210
Emilia Romagna 47 6 53 46 6 52 54 10 64
Friuli Venezia Giulia 156 5 161 151 5 156 149 5 154
Lazio 2 1 3 2 1 3 3 2 5
Lombardy 7,491 1,440 8,931 8,757 1,769 10,526 8,508 1,770 10,278
Marches - - - 7 4 11 8 4 12
Piedmont 78 21 99 88 21 109 100 22 122
Puglia 28 - 28 48 2 50 47 2 49
Sicily 151 4 155 160 4 164 160 4 164
Veneto - - - - - - 4 - 4
International 4 - 4 2 - 2 1 - 1
TOTAL 8,279 1,498 9,777 9,582 1,834 11,416 9,354 1,842 11,196
Figure 49_Number of hires and turnover rate, by age, gender and geographical area [GRI 401-1]
AGE BRACKETS2016 2017 2018
MEN WOMEN TOTAL MEN WOMEN TOTAL MEN WOMEN TOTAL
Permanent workers
Up to age 30 83 12 95 108 26 134 130 26 156
From 31 to 40 67 8 75 90 16 106 114 26 140
From 41 to 50 36 6 42 84 4 88 61 12 73
Over 50 34 - 34 24 - 24 31 3 34
Fixed-term workers
Up to age 30 224 24 248 221 24 245 188 22 210
From 31 to 40 144 8 152 157 6 163 141 12 153
From 41 to 50 58 2 60 108 1 109 97 5 102
Over 50 22 - 22 35 2 37 47 5 52
Total 668 60 728 827 79 906 809 111 920
Percentage of new employees out of total workforce
8.10% 4.00% 7.40% 8.63% 4.31% 7.94% 8.44% 6.05% 8.22%
Figure 50_Workers leaving, by gender [GRI 401-1]
ITALY2016 2017 2018
MEN WOMEN TOTAL MEN WOMEN TOTAL MEN WOMEN TOTAL
Retirement 133 7 140 168 10 178 251 9 260
Voluntary resignation 88 22 110 118 27 145 149 27 176
Decease 9 1 10 14 - 14 10 1 11
Dismissal 132 13 145 35 3 38 53 2 55
Other (e.g., end of fixed-term contract) 239 20 259 292 9 301 318 25 343
Total 601 63 664 627 49 676 781 64 845
Turnover rate* 7.30% 4.20% 6.80% 6.54% 2.67% 5.92% 8.15% 3.49% 7.55%
* The turnover rate was calculated according to the following formula: (outgoing) / (employees) at December 31.
Figure 51_Workers leaving, by age bracket [GRI 401-1]
ITALY
2016 2017 2018
UP TO 30 31-40 41-50 OVER
50 TOTAL UP TO 30 31-40 41-50 OVER
50 TOTAL UP TO 30 31-40 41-50 OVER
50 TOTAL
Retirement - - - 140 140 - - - 178 178 - - - 260 260
Voluntary resignation 23 27 16 44 110 27 43 32 43 145 41 41 37 57 176
Decease - 1 3 6 10 1 1 5 7 14 - 1 4 6 11
Dismissal - 8 11 126 145 8 9 12 9 38 8 12 20 15 55
Other (e.g., end of fixed-term contract)
113 74 39 33 259 116 92 63 30 301 143 92 60 48 343
Total 136 110 69 349 664 152 145 112 267 676 192 146 121 386 845
Turnover rate 16.77% 6.08% 2.16% 8.81% 6.80% 15.80% 6.50% 3.14% 5.69% 5.92% 19.96% 6.50% 3.40% 8.23% 7.55%
Stakeholder engagement and materiality analysis
Financial capital
Manufacturing capital
Natural capital
Human capital
Relational capital
The Acsm Agam Group
Human capital A2A 2018 Integrated Report - Supplement
2928
Welfare and diversity
Figure 52_Personnel by age bracket and gender [GRI 405-1]
AGE BRACKETS2016 2017
MANAGERS SUPERVISORS WHITE-COLLAR WORKERS BLUE-COLLAR WORKERS TOTAL MANAGERS SUPERVISORS WHITE-COLLAR WORKERS BLUE-COLLAR WORKERS TOTALM W M W M W M W M W M W M W M W
Up to age 30 1 173 129 498 10 811 - - 1 - 231 167 553 10 960From 31 to 40 4 1 52 23 406 292 971 60 1,809 5 1 76 29 502 388 1,152 47 2,200From 41 to 50 42 14 131 40 850 410 1,619 91 3,197 47 15 145 47 891 462 1,853 104 3,564Over 50 76 9 198 49 1,438 328 1,820 42 3,960 96 11 238 59 1,600 441 2,190 55 4,690Total 122 24 382 112 2,867 1,159 4,908 203 9,777 148 27 460 135 3,224 1,458 5,748 216 11,416
AGE BRACKETS2018
MANAGERS SUPERVISORS WHITE-COLLAR WORKERS BLUE-COLLAR WORKERS TOTALM W M W M W M W
Up to age 30 - - - - 235 147 541 6 929From 31 to 40 5 - 83 27 562 404 1,103 48 2,232From 41 to 50 45 17 154 55 819 445 1,736 100 3,371Over 50 97 13 250 63 1,629 457 2,095 60 4,664Total 147 30 487 145 3,245 1,453 5,475 214 11,196
Figure 53_Personnel by protected categories [GRI 405-1]
PROTECTED CATEGORIES
2016 2017 2018MEN WOMEN TOTAL MEN WOMEN TOTAL MEN WOMEN TOTAL
PRO.CAT. (ART.18 PARA.2 LAW 68/99) 34 16 50 36 18 54 36 18 54
PEOPLE WITH DISABILITIES 329 88 417 348 104 452 326 97 423
DISADVANTAGED GROUPS (MOBILITY-REDUNDANCY)
5 - 5 - - - - - -
Total 368 104 472 384 122 506 362 115 477
Figure 54_Personnel by position and company seniority [G4-EU15]
COMPANY SENIORITY
2016 2017 2018
MANAG-ERS
SUPERVI-SORS
WHITE-COLLAR
WORKERS
BLUE-COLLAR
WORKERSTOTAL % MANAG-
ERSSUPERVI-
SORS
WHITE-COLLAR
WORKERS
BLUE-COLLAR
WORKERSTOTAL % MANAGERS SUPERVISORS WHITE-COLLAR
WORKERSBLUE-COLLAR
WORKERS TOTAL %
Up to age 10 58 145 1,066 2,142 3,411 34.9% 60 192 1,383 2,548 4,183 36.6% 61 199 1,387 2,348 3,995 35.7%
From 11 to 20 42 102 631 1,125 1,900 19.4% 59 141 845 1,433 2,478 21.7% 62 168 862 1,607 2,699 24.1%
From 21 to 30 35 160 1,495 1,403 3,093 31.6% 41 156 1,531 1,522 3,250 28.5% 39 139 1,351 1,212 2,741 24.5%
Over 30 11 87 834 441 1,373 14.1% 15 106 920 464 1,505 13.2% 15 126 1,097 523 1,761 15.7%
Total 146 494 4,026 5,111 9,777 100.0% 175 595 4,679 5,967 11,416 100.0% 177 632 4,697 5,690 11,196 100.0%
Figure 55_Personnel by educational qualification
2016 2017 2018MEN WOMEN TOTAL % MEN WOMEN TOTAL % MEN WOMEN TOTAL %
Undergraduate degree 703 408 1,111 11.4% 927 533 1,460 12.8% 1,022 570 1,592 14.2%
Secondary school diploma 3,195 760 3,955 40.5% 3,548 917 4,465 39.1% 3,672 921 4,593 41.0%
Vocational degree 606 78 684 7.0% 796 93 889 7.8% 661 73 734 6.6%Compulsory schooling 3,775 252 4,027 41.2% 4,311 291 4,602 40.3% 3,999 278 4,277 38.2%
Total 8,279 1,498 9,777 100.0% 9,582 1,834 11,416 100.0% 9,354 1,842 11,196 100.0%

Stakeholder engagement and materiality analysis
Financial capital
Manufacturing capital
Natural capital
Human capital
Relational capital
The Acsm Agam Group
Human capital A2A 2018 Integrated Report - Supplement
3130
Personnel training and development
Figure 56_Training delivered by role [GRI 404-1]
2016 2017 2018
NUMBER OF HOURS
AVERAGE ANNUAL
HOURS OF TRAINING PER
EMPLOYEE
NUMBER OF HOURS
AVERAGE ANNUAL
HOURS OF TRAINING PER
EMPLOYEE
NUMBER OF HOURS
AVERAGE ANNUAL
HOURS OF TRAINING PER
EMPLOYEE
Managers 4,322 29.6 6,691 38.2 9,313 52.6
Supervisors 15,935 32.3 22,542 37.9 35,099 55.5
White-collar workers 78,124 19.4 96,744 20.7 116,255 24.7
Blue-collar workers 65,443 12.8 86,979 14.6 66,996 11.8
Total 163,824 16.8 212,956 18.7 227,663 20.3
Figure 57_Training delivered by gender [GRI 404-1]
2016 2017 2018
NUMBER OF HOURS
AVERAGE HOURS PER EMPLOYEE
NUMBER OF HOURS
AVERAGE HOURS PER EMPLOYEE
NUMBER OF HOURS
AVERAGE HOURS PER EMPLOYEE
Men 144,317 17.4 185,338 19.3 186,109 19.9
Women 19,507 13 27,617 15.1 41,554 22.6
Total 163,824 16.8 212,956 18.7 227,663 20.3
Figure 58_Health and safety training
2016 2017 2018
Training hours 86,492 112,023 102,776
Figure 59_Cost of training
2016 2017 2018
€ 1,800,223 3,013,190 2,520,072
% of training costs covered by inter-professional funds 30% 29% 29%
Figure60_Employees trained in the year (percentage of total)
2016 2017 2018
% 87% 92% 85%
Figure 61_Attendance of training courses (total number)
2016 2017 2018
no. 37,634 55,830 57,209
Figure 62_Percentage of employees who regularly receive performance assessments [GRI 404-3]
2016 2017 2018
% 47% 47% 49%
Figure 63_Third-party employees that have undergone relevant health and safety training
NO. EMPLOYEES INVOLVED
TRAINING HOURS
PROVIDED
2016 1,691 6,011
2017 2,353 4,506
2018 1,291 3,876
Health and safety at work
Figure 64_Data on injuries* [GRI 403-2]
2016 2017 2018
Number of deaths - - -
No. of incidents (excl. during travel) 556 577 521
Men 506 526 485
Women 50 51 36
No. of days absence 14,109 14,861 12,710
Average duration 25.42 25.76 24.21
Frequency index FI 35.66 31.80 29.14
Severity index SI 0.91 0.82 0.71
Incidence index II 11.52 10.0 8.0
Commuting accidents 112 113 90
* When calculating indices, only professional accidents, that result in at least one day of absence, not including the day of the event, are considered. Medications and precautionary absences and unrecognised accidents are therefore excluded. Professional accidents also include those that occur in transit, with or without a vehicle. The table counts all injuries involving employees.
FI = frequency index (no. accidents x 1,000,000: hours worked)
SI = severity index (no days of absence x 1,000: hours worked)
II = incidence index (no accidents x 1,000: headcount) – it is calculated on the number of commuting accidents.
Commuting accidents: accidents suffered by workers while commuting from home to work and vice-versa (but not while in service).
Figure 65_ Incident indices of contractors and subcontractors for construction and maintenance works [GRI 403-2_G4-EU17]
NO. OF HOURS
WORKED BY CONTRACTORS
DEATHS NO. OF ACCIDENTS DAYS LOST FREQUENCY
INDEXSEVERITY
INDEX
2016 1,720,753 - 11 464 6.39 0.27
2017 2,350,008 - 15 354 6.38 0.15
2018 2,264,294 - 22 169 9.72 0.07

Stakeholder engagement and materiality analysis
Financial capital
Manufacturing capital
Natural capital
Human capital
Relational capital
The Acsm Agam Group
Human capital A2A 2018 Integrated Report - Supplement
3332
Figure 66_Health data by BU
GENERATION AND TRADING
BU
MARKET BU
ENVIRONMENT
BU
NETWORKS AND DISTRICT HEATING BU
CORPORATE
TOTAL
2016 2017 2018 2016 2017 2018 2016 2017 2018 2016 2017 2018 2016 2017 2018 2016 2017 2018
Visits as per 81/08 722 825 746 152 171 260 4,119 6,112 5,880 1,513 1,259 1,226 454 420 513 6,960 8,787 8,625
Tox visits - - 166 - - 60 - - 2,120 - - 285 - - - - - 2,631
Assessments 1,414 1,715 1,833 95 174 277 7,604 8,789 11,045 1,793 2,633 2,533 366 461 494 11,272 13,772 16,182
Influenza Vaccination - - 35 - - 39 - - 223 - - 198 - - 129 - - 624
Vaccinations 40 80 79 - 29 42 541 943 851 67 509 314 - 114 2 648 1,675 1,288
Site inspections - 17 16 - 8 6 - 29 54 - 35 31 - 11 12 83 100 119
Reported professional disease
- - 5 - - 0 - - 4 - - 0 - - 0 8 3 9
Health provisions - - 17 - - 5 - - 27 - - 9 - - 7 40 41 65
Specialist visits - 7 - - - 272 68 - 3 7 - - 191 282 75
Figure 67_Percentage of workers represented in formal health and safety committees [GRI 403-1]
2016 2017 2018
Percentage of the total 100% 100% 100%
Absenteeism
Figure 68_Number of working days lost by gender [GRI 403-2]
2016 2017 2018
MEN WOMEN MEN WOMEN MEN WOMEN
Illness 94,360 17,629 97,453 18,880 98,515 18,166
Unpaid leave/absence 5,761 1,681 6,461 1,473 6,008 698
Company strikes 2,926 209 - - - -
National strikes 410 29 497 84 626 73
Accidents* 12,884 1,983 14,082 1,782 12,390 1,391
Total 116,340 21,531 118,493 22,219 117,539 20,327
Total days worked by the workforce in the reporting period 2,142,530 369,643 2,091,868 370,106 2,424,831 457,695
Absentee Rate 5% 6% 6% 6% 5% 4%
* It should be noted that the figures presented in this table refer solely to working days lost due to accidents and not to calendar days lost, which are used to calculate the severity index.
Figure 69_ Lost day rate* (total number of days lost through injury or illness out of total working hours by the workforce in the reporting period) [GRI 403-2]
2016 2017 2018
MEN WOMEN TOTAL MEN WOMEN TOTAL MEN WOMEN TOTAL
Days lost to accidents 12,037 1,983 14,020 14,802 1,782 15,864 12,390 1,391 13,781
Total workable hours of the workforce in the reporting period
14,911,363 2,595,243 17,506,606 15,217,692 2,633,211 17,850,903 17,613,164 3,346,340 20,959,504
Total hours worked by the workforce in the reporting period
13,003,431 2,111,103 15,114,534 13,157,472 2,120,568 15,278,040 15,279,598 2,694,030 17,973,628
Lost day rate 0.08% 0.08% 0.08% 0.10% 0.07% 0.08% 0.07% 0.04% 0.07%
* Days lost means days on which work cannot be performed due to an occupational accident or occupational disease. They are not counted if there is a partial return to working activity. Occupational disease is defined as an illness caused by the working environment or professional activity (e.g., stress or regular exposure to harmful chemical substances) or resulting from an accident.
Figure 70_Return to work and retention rates after parental leave*
2016 2017 ** 2018
MEN WOMEN MEN WOMEN MEN WOMEN
Employees who took parental leave 119 133 229 195 325 208
of whom, employees who returned to work in 2016 103 103 - - - -
of whom, employees who returned to work in 2017 13 25 216 165 - -
of whom, employees who returned to work in 2018 1 - 13 30 302 176
* Employees who did not return to work relative to 2018 have not necessarily resigned, but are continuing their leave.
** Due to the change in the HR management software in 2017, errors were detected in the entries in the new system on data relating to parental leave when preparing the 2018 Integrated Financial Statements. For this reason, it was decided to extract the same data from the payroll system, and recalculate the data communicated in 2017.

Stakeholder engagement and materiality analysis
Financial capital
Manufacturing capital
Natural capital
Human capital
Relational capital
The Acsm Agam Group
A2A 2018 Integrated Report - Supplement
35
Human capital
34
Relational capitalRelations with customers
Electricity and natural gas sales service
Figure 74_Electricity supply contracts by type of market
2016 2017 2018
Protected market 674,551 619,114 547,994
Free market 321,746 472,003 586,998
Total 996,297 1,091,117 1,134,992
Figure 75_Electricity supply contracts by type of customer [G4 - EU3]
2016 2017 2018
Domestic 820,420 895,041 914,937
SME 111,179 128,704 133,237
Large customers 30,954 34,292 52,563
Condominiums 33,744 33,080 34,255
Total 996,297 1,091,117 1,134,992
Figure 76_Gas supply contracts by type of market
2016 2017 2018
Protected market 813,729 841,282 698,406
Free market 276,898 453,141 542,554
Total 1,090,627 1,294,423 1,240,960
Figure 71_Registrations with trade union
2016 2017 2018
N° % N° % N° %
Italy - members of union federations 3,424 35.0% 3,662 32.1% 3,646 32.6%
Italy - members of other unions 1,062 10.9% 1,137 10.0% 1,188 10.6%
Employees not enrolled in unions 5,287 54.1% 6,617 58.0% 6,362 56.8%
Abroad - Employees not enrolled in unions 4 0.0% - 0.0% - 0.0%
Total 9,777 100.0% 11,416 100.0% 11,196 100.0%
Figure 72_Hours spent on strike
2016 2017 2018
Total strike hours 22,700 4,402 502
Strike hours per capita* 2.3 0.4 0.0
* Per capita hours are calculated on the average headcount.
Benefits and remuneration
Figure 73_Contributions to Recreational and Welfare Circles
2016 2017 2018
Total (€) 4,631,251 5,000,668 5,097,116

Stakeholder engagement and materiality analysis
Financial capital
Manufacturing capital
Natural capital
Human capital
Relational capital
The Acsm Agam Group
Relational capital A2A 2018 Integrated Report - Supplement
3736
Figure 77_Gas supply contracts by type of customer [G4 - EU3]
2016 2017 2018
Domestic 1,022,433 1,212,980 1,161,611
SME 53,859 64,933 63,722
Large customers 4,997 6,748 6,582
Condominiums 9,338 9,762 9,045
Total 1,090,627 1,294,423 1,240,960
Figure 78_Geographic breakdown of electricity sales volumes
2016 2017 2018
Lombardy 78% 83% 76%
Rest of Italy 22% 17% 24%
Figure 79_Geographic breakdown of gas sales volumes
2016 2017 2018
Lombardy 88% 90% 88%
Rest of Italy 12% 10% 12%
Figure 80_Number of fidelity programme adhesions
2016 2017 2018
Adhesions 257,075 286,834 40,522
Increase (percentage) 31% 12% -86%
Figure 81_Quality of the call centre
ARERA TARGET
A2A ENERGIA LINEA PIÙ
2016 2017 2018 2016 2017 2018
Percentage of successful calls >=80% 95.5% 94.2% 96.7% 92.3% 97.4% 96.1%
Accessibility of lines and services (time when line is free vs operator presence time) >=80% 98.8% 99.3% 100.0% 100.0% 100.0% 100.0%
Average waiting time on the telephone <=240'' 131 140 122 147 84 84
* The position in the rankings derives from the comparison of the performance of A2A Energia with that of the main market players, apart from the macro category of "Other suppliers", which combines several operators and whose results cannot be read individually due to the number of associated interviews.
Figure 82_Customer satisfaction on call centre operations
FIRST HALF 2016
2ND HALF 2016
1ST HALF 2017
2ND HALF 2017
2018 (ANNUAL)
A2A Energia 97.1% 95.7% 95.7% 95.2% 98.1%
Linea Più n.a. 94.5% 93.2% 90.5% 94.0%
National average 91.0% 92.4% 93.2% 91.7% 92.3%
Figure 83_Gas and electricity complaint trend
2016 2017 2018
A2A Energia - number of complaints 2,823 3,447 3,550
Linea Più - number of complaints - 2,399 1,682
A2A Energia - percentage "simple" complaints out of average no. of customers* 0.14% 0.17% 0.18%
Linea Più - percentage "simple" complaints out of average no. of customers* - 0.82% 0.56%
* ARERA defines complaints as "simple" when they refer exclusively to the seller and do not require any data pertaining to the distribution company in order to prepare the answer.
Figure 84_Electricity bill cost trends (in euro) for a typical household*
A2A ENERGIA LINEA PIÙ
2016 2017 2018 2016 2017 2018
Sales services 216.05 245.16 274.78 266.51 264.52 302.46
Network services 215.35 206.04 204.03 213.84 206.35 204.05
Tax 21.79 21.82 21.82 21.79 21.79 21.79
VAT 45.32 47.3 50.06 50.21 49.27 52.83
Total 498.51 520.32 550.69 552.35 541.93 581.13
* For electricity, the Authority took as an example a resident domestic use contract, with 3 kW of available power and an average annual use of 2,700 kWh.
Figure 85_Gas bill cost trends (in euro) for a typical household*
A2A ENERGIA LINEA PIÙ
2016 2017 2018 2016 2017 2018
Sales services 401.88 411.56 454.70 488.88 421.68 478.95
Network services 209.62 214.75 224.25 212.75 212.16 221.24
Tax 224.68 224.68 224.68 224.68 224.68 224.68
VAT 170.55 173.2 182.61 165.68 153.55 185
Total 1,006.73 1,024.19 1,086.24 1,091.99 1,012.08 1,109.87
* For gas, domestic use with independent heating in the north-east and an annual use of 1,400 cm was considered by the Authority.
Stakeholder engagement and materiality analysis
Financial capital
Manufacturing capital
Natural capital
Human capital
Relational capital
The Acsm Agam Group
Relational capital A2A 2018 Integrated Report - Supplement
3938
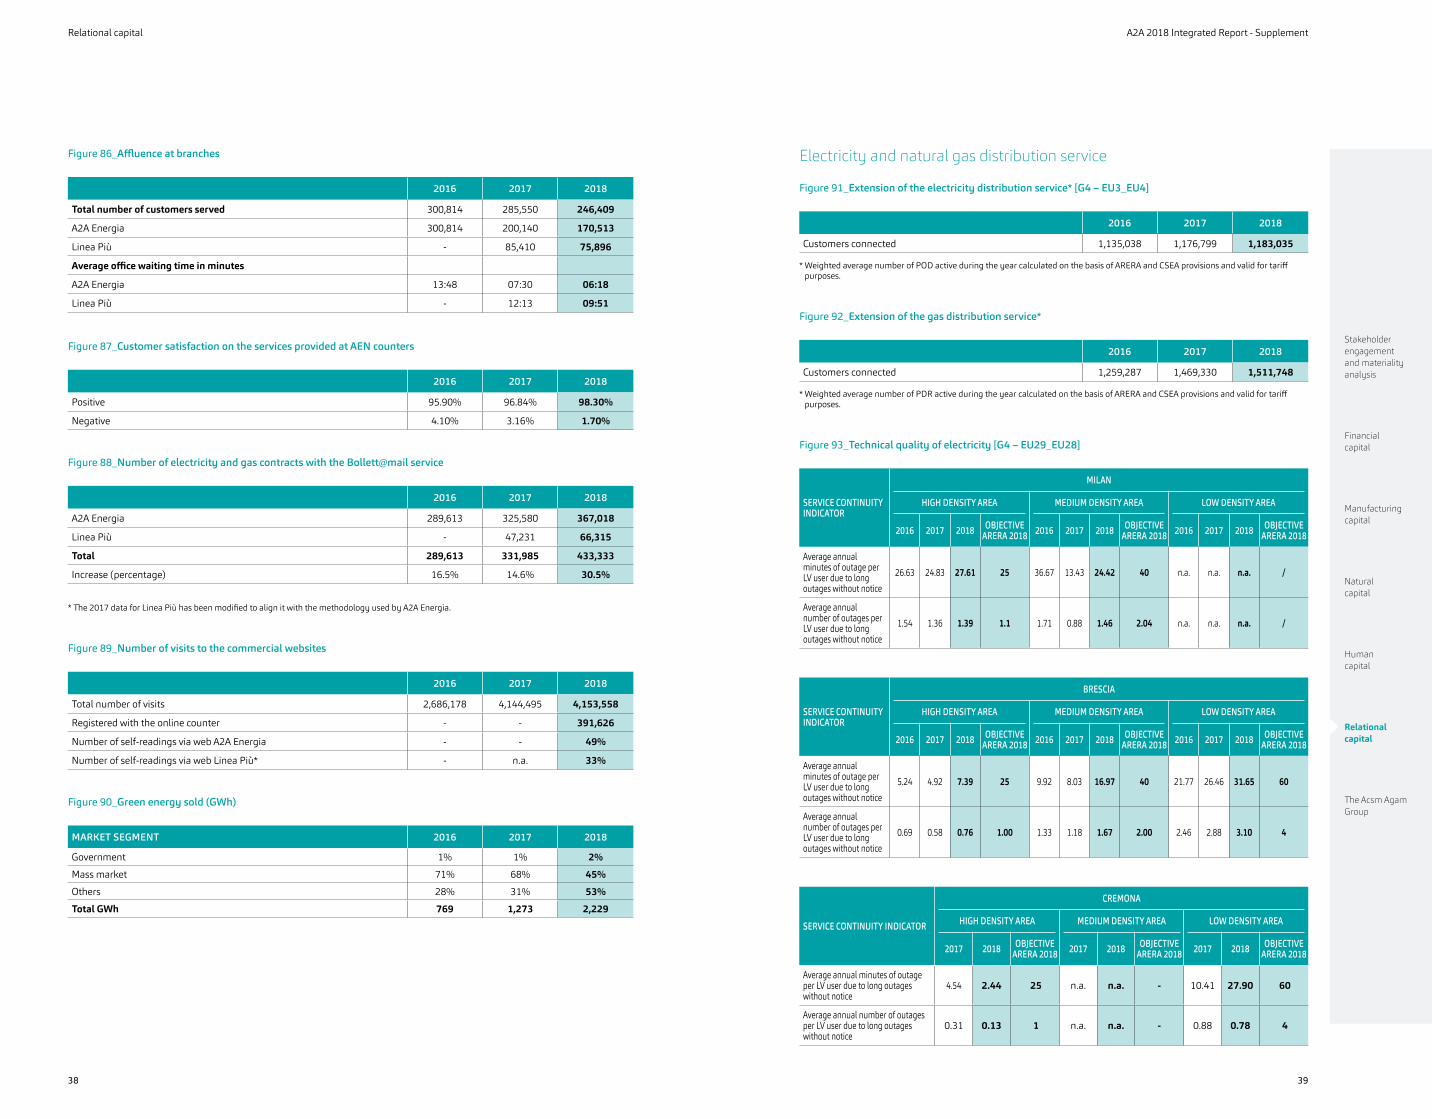
Figure 86_Affluence at branches
2016 2017 2018
Total number of customers served 300,814 285,550 246,409
A2A Energia 300,814 200,140 170,513
Linea Più - 85,410 75,896
Average office waiting time in minutes
A2A Energia 13:48 07:30 06:18
Linea Più - 12:13 09:51
Figure 87_Customer satisfaction on the services provided at AEN counters
2016 2017 2018
Positive 95.90% 96.84% 98.30%
Negative 4.10% 3.16% 1.70%
Figure 88_Number of electricity and gas contracts with the Bollett@mail service
2016 2017 2018
A2A Energia 289,613 325,580 367,018
Linea Più - 47,231 66,315
Total 289,613 331,985 433,333
Increase (percentage) 16.5% 14.6% 30.5%
* The 2017 data for Linea Più has been modified to align it with the methodology used by A2A Energia.
Figure 89_Number of visits to the commercial websites
2016 2017 2018
Total number of visits 2,686,178 4,144,495 4,153,558
Registered with the online counter - - 391,626
Number of self-readings via web A2A Energia - - 49%
Number of self-readings via web Linea Più* - n.a. 33%
Figure 90_Green energy sold (GWh)
MARKET SEGMENT 2016 2017 2018
Government 1% 1% 2%
Mass market 71% 68% 45%
Others 28% 31% 53%
Total GWh 769 1,273 2,229
Electricity and natural gas distribution service
Figure 91_Extension of the electricity distribution service* [G4 – EU3_EU4]
2016 2017 2018
Customers connected 1,135,038 1,176,799 1,183,035
* Weighted average number of POD active during the year calculated on the basis of ARERA and CSEA provisions and valid for tariff purposes.
Figure 92_Extension of the gas distribution service*
2016 2017 2018
Customers connected 1,259,287 1,469,330 1,511,748
* Weighted average number of PDR active during the year calculated on the basis of ARERA and CSEA provisions and valid for tariff purposes.
Figure 93_Technical quality of electricity [G4 – EU29_EU28]
SERVICE CONTINUITY INDICATOR
MILAN
HIGH DENSITY AREA MEDIUM DENSITY AREA LOW DENSITY AREA
2016 2017 2018 OBJECTIVE ARERA 2018 2016 2017 2018 OBJECTIVE
ARERA 2018 2016 2017 2018 OBJECTIVE ARERA 2018
Average annual minutes of outage per LV user due to long outages without notice
26.63 24.83 27.61 25 36.67 13.43 24.42 40 n.a. n.a. n.a. /
Average annual number of outages per LV user due to long outages without notice
1.54 1.36 1.39 1.1 1.71 0.88 1.46 2.04 n.a. n.a. n.a. /
SERVICE CONTINUITY INDICATOR
BRESCIA
HIGH DENSITY AREA MEDIUM DENSITY AREA LOW DENSITY AREA
2016 2017 2018 OBJECTIVE ARERA 2018 2016 2017 2018 OBJECTIVE
ARERA 2018 2016 2017 2018 OBJECTIVE ARERA 2018
Average annual minutes of outage per LV user due to long outages without notice
5.24 4.92 7.39 25 9.92 8.03 16.97 40 21.77 26.46 31.65 60
Average annual number of outages per LV user due to long outages without notice
0.69 0.58 0.76 1.00 1.33 1.18 1.67 2.00 2.46 2.88 3.10 4
SERVICE CONTINUITY INDICATOR
CREMONA
HIGH DENSITY AREA MEDIUM DENSITY AREA LOW DENSITY AREA
2017 2018 OBJECTIVE ARERA 2018 2017 2018 OBJECTIVE
ARERA 2018 2017 2018 OBJECTIVE ARERA 2018
Average annual minutes of outage per LV user due to long outages without notice
4.54 2.44 25 n.a. n.a. - 10.41 27.90 60
Average annual number of outages per LV user due to long outages without notice
0.31 0.13 1 n.a. n.a. - 0.88 0.78 4

Stakeholder engagement and materiality analysis
Financial capital
Manufacturing capital
Natural capital
Human capital
Relational capital
The Acsm Agam Group
Relational capital A2A 2018 Integrated Report - Supplement
4140
Figure 94_Electricity emergency service [G4 – EU28]
MILAN BRESCIA CREMONA
2016 2017 2018 2016 2017 2018 2017 2018
No. MV customers with more than 6 interruptions per year for high density areas
35 14 25 - - - - -
No. of MV customers with more than 8 interruptions a year for medium-concentration areas
- - - - - 5 n.a. n.a.
No. MV customers with more than 9 interruptions per year for low density areas
- - - 18 12 12 - -
In the event of an electricity shortfall, Terna - National Electrical Network requests that distributors implement a scheduled rotating outage plan in order to avoid a general blackout. There are five levels of severity of electricity shortfall used to determine the number of users involved and the frequency of outages. The disconnections, which will last up to 90 minutes, are notified by Terna 30 minutes in advance and can take place at any time during the specified time frames and not necessarily at their start. The scheduled outage plan prepared by A2A Reti Elettriche, by day and time slot, is available from the company's website.
Figure 95_Commercial quality of electricity: specific indicators for the Milan-Brescia area [G4 – EU21]
SIMPLE INDICATORS ARERA LEVEL RES. 646/15
SERVICES PROVIDED ON THE INDICATED
TIMETABLE (%)
AVERAGE TIME TO EXECUTE THE SERVICE
(DAYS)
2016 2017 2018 2016 2017 2018
Time to prepare estimate for work on the network
15 working days for LV
30 working days for MV
99.61% 98.66% 98.40% 6.38 6.61 6.89
Execution time for simple work
10 working days for LV
20 working days for MV
99.71% 99.32% 98.66% 5.06 4.71 5.43
Execution time for complex work 50 working days 100.00% 99.86% 99.46% 9.19 10.14 10.21
Activation time for LV/MV supply 5 working days 99.89% 99.84% 99.68% 0.73 0.63 0.62
Supply de-activation time
5 working days for LV
7 working days for MV
99.81% 99.86% 99.59% 0.64 0.59 0.64
Reactivation time following suspension due to non-payment 1 working day 99.87% 99.90% 99.70% 0.1 0.08 0.08
Observance of time bracket for appointments Two hours 99.85% 99.84% 99.45% n.a. n.a. n.a.
Time to restore service following failure of meter equipment during business days from 8 AM to 6 PM on the LV network
Three hours 90.42% 88.01% 81.87% 1.77 2.01 2.31
Time to restore service following failure of meter equipment during non-working days from 6 PM to 8 AM on the LV network
Four hours 98.28% 97.02% 93.73% 1.4 1.52 2.11
Time to report results of testing of LV/MV meter equipment 15 working days 97.16% 92.70% 92.45% 9.2 11.40 10.62
Time for notifying the result of the verification of voltage 20 working days 96.55% 95.45% 84.62% 15.76 15.28 20.93
Figure 96_Commercial quality of electricity: specific indicators for the Cremona area [G4 – EU21]
SIMPLE INDICATORS ARERA LEVEL RES. 646/15
SERVICES PROVIDED ON THE INDICATED
TIMETABLE (%)
AVERAGE TIME TO EXECUTE THE SERVICE
(DAYS)
2017 2018 2017 2018
Time to prepare estimate for work on the network
10 working days for LV
30 working days for MV
100%100%
98.64%81.82%
3.348.88
4.3920.91
Execution time for simple work
10 working days for LV
20 working days for MV
98%;100%
99.45% 2.983.00
2.62
Execution time for complex work
50 working days for LV
50 working days for MV
100% 100%
100%100%
14.4510.50
16.5010.50
Activation time for LV/MV supply 5 working days 100% 99.96%100% 0.58 0.31
3
Supply de-activation time
5 working days for LV
7 working days for MV
100% 100%
99.98%100%
0.54.00
0.436
Reactivation time following suspension due to non-payment
1 working day on zeroed
1 working day reduced 15%
100% 100%
99.83% 0.110.6
0.08
Observance of time bracket for appointments Two hours 100% 100% - -
Time to restore service following failure of meter equipment during business days from 8 AM to 6 PM on the LV network
Three hours 100% 100% 1h and 10 min
1h and 22 min
Time to restore service following failure of meter equipment during non-working days from 6 PM to 8 AM on the LV network
Four hours 100% 100% 1h and 10 min
1h and 48 min
Time to report results of testing of LV/MV meter equipment 15 working days 100% 78% 13 9.67
Time for notifying the result of the verification of voltage 20 working days n.a. n.a. n.a. n.a.
Figure 97_Commercial quality of electricity: general indicators for the Milan-Brescia area [G4 – EU21]
TYPE OF SERVICEARERA LEVEL -
LV
SERVICES PROVIDED ON THE INDICATED TIMETABLE (%)
2016 2017 2018
Minimum percentage of detailed responses to written complaints or requests for information provided within the maximum period of 30 calendar days
95% 99.41% 93.93% 96.59%
TYPE OF SERVICEARERA LEVEL -
MV
SERVICES PROVIDED ON THE INDICATED TIMETABLE (%)
2016 2017 2018
Minimum percentage of detailed responses to written complaints or requests for information provided within the maximum period of 30 calendar days
95% 99.72% 98.93% 99.50%
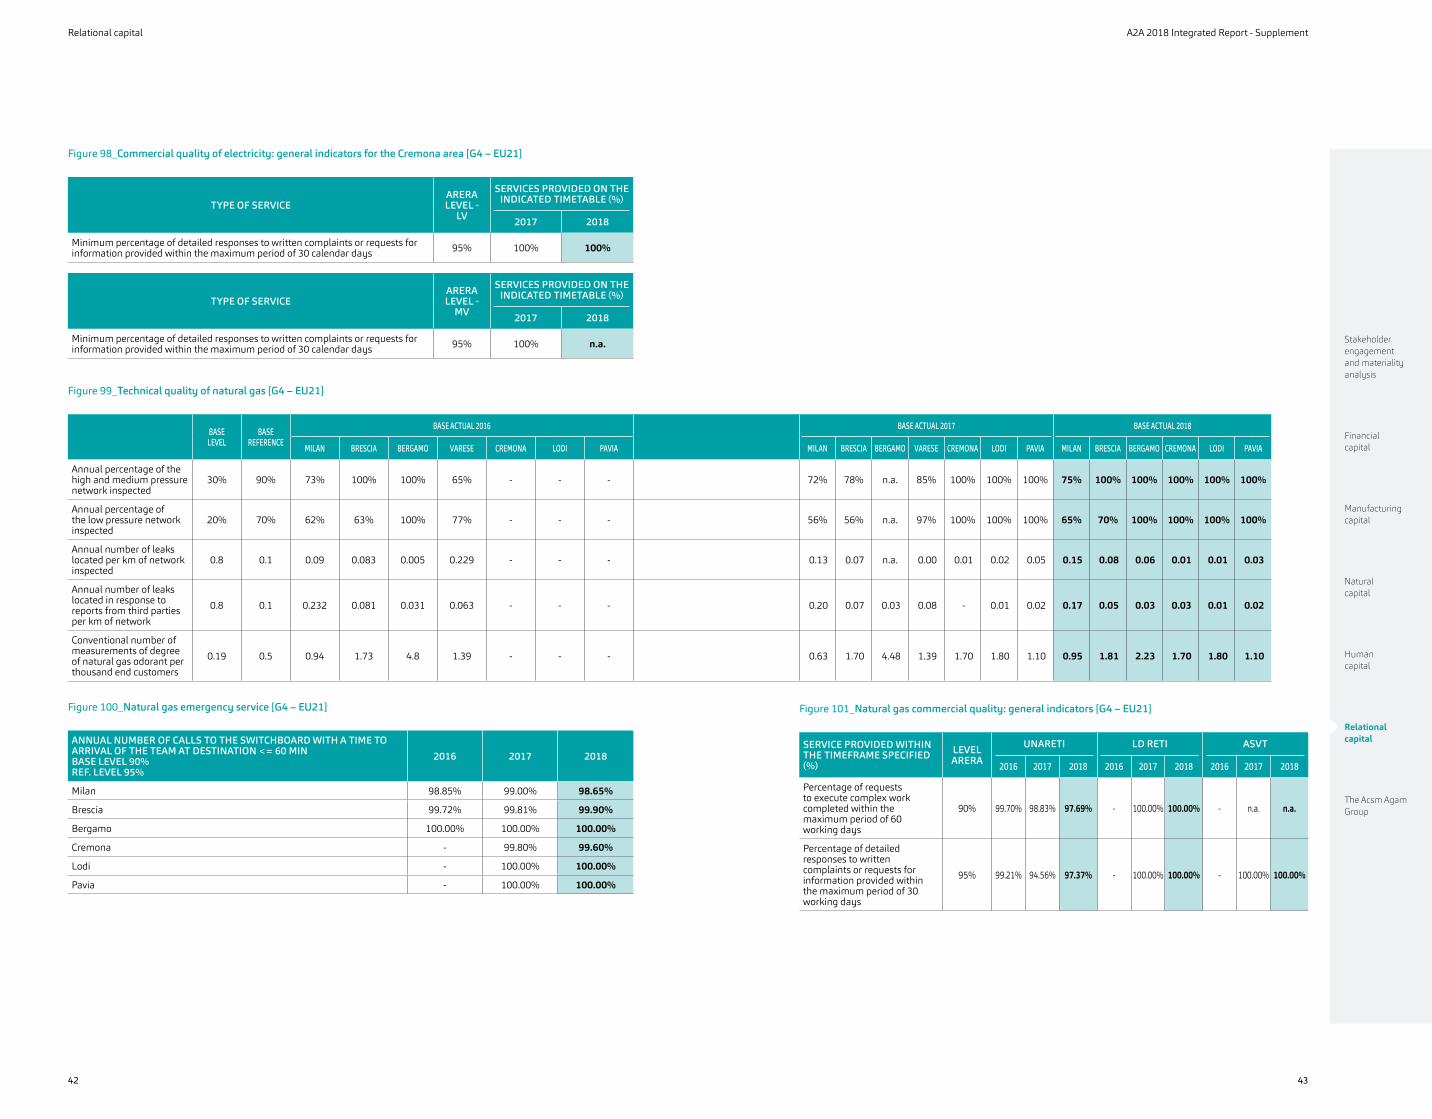
Stakeholder engagement and materiality analysis
Financial capital
Manufacturing capital
Natural capital
Human capital
Relational capital
The Acsm Agam Group
Relational capital A2A 2018 Integrated Report - Supplement
4342
Figure 98_Commercial quality of electricity: general indicators for the Cremona area [G4 – EU21]
TYPE OF SERVICEARERA LEVEL -
LV
SERVICES PROVIDED ON THE INDICATED TIMETABLE (%)
2017 2018
Minimum percentage of detailed responses to written complaints or requests for information provided within the maximum period of 30 calendar days 95% 100% 100%
TYPE OF SERVICEARERA LEVEL -
MV
SERVICES PROVIDED ON THE INDICATED TIMETABLE (%)
2017 2018
Minimum percentage of detailed responses to written complaints or requests for information provided within the maximum period of 30 calendar days 95% 100% n.a.
Figure 99_Technical quality of natural gas [G4 – EU21]
BASE LEVEL
BASE REFERENCE
BASE ACTUAL 2016 BASE ACTUAL 2017 BASE ACTUAL 2018
MILAN BRESCIA BERGAMO VARESE CREMONA LODI PAVIA MILAN BRESCIA BERGAMO VARESE CREMONA LODI PAVIA MILAN BRESCIA BERGAMO CREMONA LODI PAVIA
Annual percentage of the high and medium pressure network inspected
30% 90% 73% 100% 100% 65% - - - 72% 78% n.a. 85% 100% 100% 100% 75% 100% 100% 100% 100% 100%
Annual percentage of the low pressure network inspected
20% 70% 62% 63% 100% 77% - - - 56% 56% n.a. 97% 100% 100% 100% 65% 70% 100% 100% 100% 100%
Annual number of leaks located per km of network inspected
0.8 0.1 0.09 0.083 0.005 0.229 - - - 0.13 0.07 n.a. 0.00 0.01 0.02 0.05 0.15 0.08 0.06 0.01 0.01 0.03
Annual number of leaks located in response to reports from third parties per km of network
0.8 0.1 0.232 0.081 0.031 0.063 - - - 0.20 0.07 0.03 0.08 - 0.01 0.02 0.17 0.05 0.03 0.03 0.01 0.02
Conventional number of measurements of degree of natural gas odorant per thousand end customers
0.19 0.5 0.94 1.73 4.8 1.39 - - - 0.63 1.70 4.48 1.39 1.70 1.80 1.10 0.95 1.81 2.23 1.70 1.80 1.10
Figure 100_Natural gas emergency service [G4 – EU21]
ANNUAL NUMBER OF CALLS TO THE SWITCHBOARD WITH A TIME TO ARRIVAL OF THE TEAM AT DESTINATION <= 60 MINBASE LEVEL 90%REF. LEVEL 95%
2016 2017 2018
Milan 98.85% 99.00% 98.65%
Brescia 99.72% 99.81% 99.90%
Bergamo 100.00% 100.00% 100.00%
Cremona - 99.80% 99.60%
Lodi - 100.00% 100.00%
Pavia - 100.00% 100.00%
Figure 101_Natural gas commercial quality: general indicators [G4 – EU21]
SERVICE PROVIDED WITHIN THE TIMEFRAME SPECIFIED (%)
LEVEL ARERA
UNARETI LD RETI ASVT
2016 2017 2018 2016 2017 2018 2016 2017 2018
Percentage of requests to execute complex work completed within the maximum period of 60 working days
90% 99.70% 98.83% 97.69% - 100.00% 100.00% - n.a. n.a.
Percentage of detailed responses to written complaints or requests for information provided within the maximum period of 30 working days
95% 99.21% 94.56% 97.37% - 100.00% 100.00% - 100.00% 100.00%

Stakeholder engagement and materiality analysis
Financial capital
Manufacturing capital
Natural capital
Human capital
Relational capital
The Acsm Agam Group
Relational capital A2A 2018 Integrated Report - Supplement
4544
Figure 102_Natural gas commercial quality: specific indicators: Milan, Brescia, Bergamo and Chieti Area [G4 – EU21]
TYPE OF SERVICE ARERA LEVELS RES. 574/13
SERVICES PROVIDED ON THE INDICATED TIMETABLE (%)
AVERAGE TIME TO EXECUTE THE SERVICE (DAYS)
2016 2017 2018 2016 2017 2018
Estimate time (simple work) 15 working days 96.34% 85.86% 93.96% 9.03 10.58 9.37
Execution time (simple work) 10 working days 92.79% 80.97% 80.41% 7.13 8.5 8.34
Estimating time (complex works) 30 working days 94.24% 96.08% 96.39% 15.09 13.92 14.89
Supply activation time 10 working days 99.93% 99.86% 99.88% 3.72 3.31 3.1
Supply de-activation time 5 working days 99.49% 99.51% 99.58% 3.09 3.05 2.8
Reactivation time following suspension due to non-payment 2 working days 97.59% 97.07% 98.14% 1.24 1.18 1.15
Observance of time bracket for appointments Two hours 99.79% 99.83% 99.83% n.a. n.a. n.a.
Time to notify results of testing of meter equipment 20 working days 62.86% 96.39% 77.08% 20.11 18.01 15.6
Figure 103_Natural gas commercial quality: specific indicators for ASVT [G4 – EU21]
TYPE OF SERVICE
ARERA LEVELS RES.
574/13 OF 01/01/2014
SERVICES PROVIDED ON THE INDICATED
TIMETABLE (%)
AVERAGE TIME TO EXECUTE THE SERVICE
(DAYS)
2017 2018 2017 2018
Estimate time (simple work) 15 working days 96.64% 100.00% 4.96 4.45
Execution time (simple work) 10 working days 98.96% 100.00% 1.96 1.04
Estimating time (complex works) 30 working days 100.00% n.a. 3.00 n.a.
Supply activation time 10 working days 100.00% 99.89% 1.72 1.74
Supply de-activation time 5 working days 100.00% 100.00% 1.70 1.88
Reactivation time following suspension due to non-payment 2 working days 100.00% 100.00% 0.65 0.52
Observance of time bracket for appointments Two hours 100.00% 99.74% n.a. n.a.
Time to notify results of testing of meter equipment 20 working days 100.00% 80.00% 16.20 26.20
Figure 104_Natural gas commercial quality: specific indicators for LGH [G4 – EU21]
TYPE OF SERVICE
ARERA LEVELS RES.
574/13 OF 01/01/2014
SERVICES PROVIDED ON THE INDICATED
TIMETABLE (%)
AVERAGE TIME TO EXECUTE THE SERVICE
(DAYS)
2017 2018 2017 2018
Estimate time (simple work) 15 working days 100.00% 99.61% 3.95 4.43
Execution time (simple work) 10 working days 99.81% 99.50% 3.16 3.14
Estimating time (complex works) 30 working days 100.00% 100.00% 5.33 6.08
Supply activation time 10 working days 99.58% 99.83% 3.05 3.19
Supply de-activation time 5 working days 96.06% 96.85% 2.65 2.60
Reactivation time following suspension due to non-payment 2 working days 97.33% 98.10% 1.23 1.23
Observance of time bracket for appointments Two hours 98.89% 99.12% - -
Time to notify results of testing of meter equipment 20 working days 67.35% 59.65% 18.31 20.72
Integrated water service
Figure 105_Extension of integrated water service
2016 2017 2018
Municipalities served by Integrated Water Service 114 129 95
Municipalities served by aqueduct service 108 120 86
Customers served - aqueduct 283,479 308,178 194,362
Inhabitants served - aqueduct 812,654 886,195 614,896
Inhabitants served by sewer systems 563,516 652,956 652,754
Inhabitants served by purification services 549,311 641,194 640,967
Figure 106_Call centerquality [GRI 102-43_44]
A2A CICLO IDRICO
2016 2017 2018
Service accessibility rate (free lines with respect to operator presence time) 100% 100% 100%
Number of calls to the call centre 79,277 118,231 94,205
Average telephone waiting time for calls from end customers (sec) 73 78 72
Percentage of successful calls 87.70% 64.67% 94.06%
Figure 107_Quality of the A2A Ciclo Idrico and ASVT service
Data in daysA2A CICLO IDRICO ASVT
2016 2017 2018 2016 2017 2018
Response time to requests for estimate for connection to the aqueduct 7.37 5.16 10.5 - 2.3 2.73
Response time to requests for estimate for connection to the sewers 4.6 3.21 9.64 - 1.67 0.85
District heating and heat management
Figure 108_Transformations*
2016 2017 2018
Transformations (no.) 13 40 28
Capacity installed (kW) 16,950 16,918 17,400
* These refer to replacement of methane with methane with a condensing boiler, of methane with district heating, of diesel with methane with a condensing boiler and of diesel with district heating.

Stakeholder engagement and materiality analysis
Financial capital
Manufacturing capital
Natural capital
Human capital
Relational capital
The Acsm Agam Group
Relational capital A2A 2018 Integrated Report - Supplement
4746
Integrated waste cycle
Figure 109_Population served by the urban hygiene service
2016 2017 2018
Municipalities served 117 258 215
Population served 2,646 3,549 3,376
Figure 110_Customer Satisfaction of the urban hygiene service carried out by AMSA (average vote)
SERVICE 2017 2018
Urban waste collection 7.8 7.74
Road and pavement cleaning and washing 7.29 7.57
Emptying of large road bins 7.27 7.32
Cleaning of market areas 7.78 7.61
Cleaning of green areas 7.06 7.52
Cleaning and collection during and after events 7.57 7.61
Cumbersome waste collection 8.3 7.88
Clarity and completeness of the communication on separate collection 7.86 7.61
Toll Free Number 7.59 7.9
Amsa counter 7.33 7.63
Website 7.57 7.68
App Puliamo - 8
Recycling 8.2 7.78
Snow service - 7.56
Figure 111_Customer Satisfaction of the urban hygiene service carried out by Aprica (average vote)
SERVICE 2016* 2018
Overall satisfaction with the service 7.77 7.84
Urban waste collection 8.28 8.29
Home collection of cumbersome waste 8.83 8.7
Vegetable oil collection - 8.61
Ecological platform 8.55 8.67
Road and pavement cleaning 7.12 7.44
Road bins 7.55 7.62
Toll Free Number 8.06 8.55
Website 7.66 8.03
Counter 8.28 8.79
* The survey is carried out every two years.
Figure 112_ Services in exchange for payment (waste disposal and other services specifically for private customers)
CUSTOMERS SERVED 2016 2017 2018
Amsa 9,206 9,091 9,899
Aprica 1,357 1,397 1,375
La.Bi.Co. Due - 259 260
LGH Group n.a. n.a. 744
Figure 113_Waste disposal service
2016 2017 2018
Municipalities served 962 988 992
Companies served 1,860 3,160 3,150
Figure 114_Call centre services
AMSA APRICA
2016 2017 2018 2016 2017 2018
Number of calls to the call centre 321,778 376,027 419,383 45,901 80,962 57,618
Accessibility of lines and services (time when line is free vs operator presence time) 100% 100% 100% 100% 100% 100%
Average waiting time on the telephone (seconds) 70 76 47 60 52 45
Percentage of successful calls 94% 94% 97% 82% 72% 93%
Conciliation management
Figure 115_ADR A2A-Consumer associations conciliation procedures
ISSUES OF DISPUTES RECEIVED GAS % ELECTRICITY % DUAL
FUEL % TOTAL REQUESTS % WATER %
Invoicing 5 31% 8 31% - - 13 30% - -
Size 9 56% 16 62% - - 25 58% - -
Contracts - - 1 4% - - 1 2% - -
Market - - 1 4% 1 100% 2 5% - -
Connections, works and technical quality 1 6% - - - - 1 2% 1 100%
Other (not included in protocol) 1 6% - - - - 1 2% - -
Overall total 16 37% 26 60% 1 2% 43 100% 1 100%
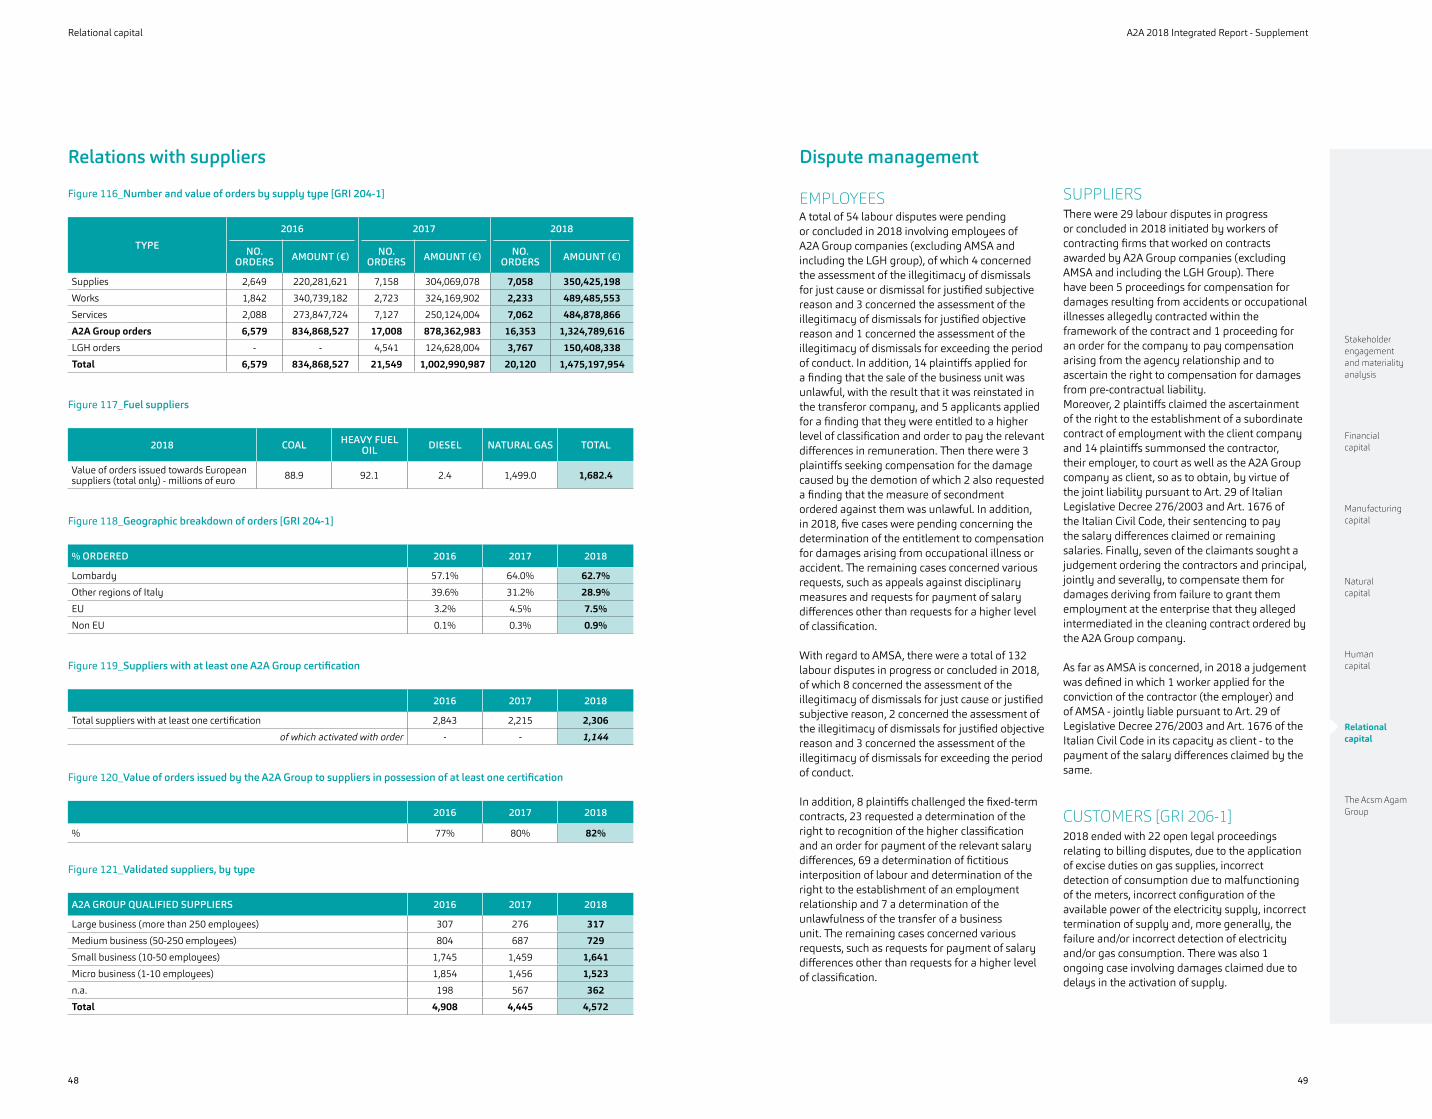
Stakeholder engagement and materiality analysis
Financial capital
Manufacturing capital
Natural capital
Human capital
Relational capital
The Acsm Agam Group
Relational capital A2A 2018 Integrated Report - Supplement
4948
Relations with suppliers
Figure 116_Number and value of orders by supply type [GRI 204-1]
TYPE
2016 2017 2018
NO. ORDERS AMOUNT (€) NO.
ORDERS AMOUNT (€) NO. ORDERS AMOUNT (€)
Supplies 2,649 220,281,621 7,158 304,069,078 7,058 350,425,198
Works 1,842 340,739,182 2,723 324,169,902 2,233 489,485,553
Services 2,088 273,847,724 7,127 250,124,004 7,062 484,878,866
A2A Group orders 6,579 834,868,527 17,008 878,362,983 16,353 1,324,789,616
LGH orders - - 4,541 124,628,004 3,767 150,408,338
Total 6,579 834,868,527 21,549 1,002,990,987 20,120 1,475,197,954
Figure 117_Fuel suppliers
2018 COAL HEAVY FUEL OIL DIESEL NATURAL GAS TOTAL
Value of orders issued towards European suppliers (total only) - millions of euro 88.9 92.1 2.4 1,499.0 1,682.4
Figure 118_Geographic breakdown of orders [GRI 204-1]
% ORDERED 2016 2017 2018
Lombardy 57.1% 64.0% 62.7%
Other regions of Italy 39.6% 31.2% 28.9%
EU 3.2% 4.5% 7.5%
Non EU 0.1% 0.3% 0.9%
Figure 119_Suppliers with at least one A2A Group certification
2016 2017 2018
Total suppliers with at least one certification 2,843 2,215 2,306
of which activated with order - - 1,144
Figure 120_ Value of orders issued by the A2A Group to suppliers in possession of at least one certification
2016 2017 2018
% 77% 80% 82%
Figure 121_Validated suppliers, by type
A2A GROUP QUALIFIED SUPPLIERS 2016 2017 2018
Large business (more than 250 employees) 307 276 317
Medium business (50-250 employees) 804 687 729
Small business (10-50 employees) 1,745 1,459 1,641
Micro business (1-10 employees) 1,854 1,456 1,523
n.a. 198 567 362
Total 4,908 4,445 4,572
Dispute management
EMPLOYEESA total of 54 labour disputes were pending or concluded in 2018 involving employees of A2A Group companies (excluding AMSA and including the LGH group), of which 4 concerned the assessment of the illegitimacy of dismissals for just cause or dismissal for justified subjective reason and 3 concerned the assessment of the illegitimacy of dismissals for justified objective reason and 1 concerned the assessment of the illegitimacy of dismissals for exceeding the period of conduct. In addition, 14 plaintiffs applied for a finding that the sale of the business unit was unlawful, with the result that it was reinstated in the transferor company, and 5 applicants applied for a finding that they were entitled to a higher level of classification and order to pay the relevant differences in remuneration. Then there were 3 plaintiffs seeking compensation for the damage caused by the demotion of which 2 also requested a finding that the measure of secondment ordered against them was unlawful. In addition, in 2018, five cases were pending concerning the determination of the entitlement to compensation for damages arising from occupational illness or accident. The remaining cases concerned various requests, such as appeals against disciplinary measures and requests for payment of salary differences other than requests for a higher level of classification.
With regard to AMSA, there were a total of 132 labour disputes in progress or concluded in 2018, of which 8 concerned the assessment of the illegitimacy of dismissals for just cause or justified subjective reason, 2 concerned the assessment of the illegitimacy of dismissals for justified objective reason and 3 concerned the assessment of the illegitimacy of dismissals for exceeding the period of conduct.
In addition, 8 plaintiffs challenged the fixed-term contracts, 23 requested a determination of the right to recognition of the higher classification and an order for payment of the relevant salary differences, 69 a determination of fictitious interposition of labour and determination of the right to the establishment of an employment relationship and 7 a determination of the unlawfulness of the transfer of a business unit. The remaining cases concerned various requests, such as requests for payment of salary differences other than requests for a higher level of classification.
SUPPLIERSThere were 29 labour disputes in progress or concluded in 2018 initiated by workers of contracting firms that worked on contracts awarded by A2A Group companies (excluding AMSA and including the LGH Group). There have been 5 proceedings for compensation for damages resulting from accidents or occupational illnesses allegedly contracted within the framework of the contract and 1 proceeding for an order for the company to pay compensation arising from the agency relationship and to ascertain the right to compensation for damages from pre-contractual liability.Moreover, 2 plaintiffs claimed the ascertainment of the right to the establishment of a subordinate contract of employment with the client company and 14 plaintiffs summonsed the contractor, their employer, to court as well as the A2A Group company as client, so as to obtain, by virtue of the joint liability pursuant to Art. 29 of Italian Legislative Decree 276/2003 and Art. 1676 of the Italian Civil Code, their sentencing to pay the salary differences claimed or remaining salaries. Finally, seven of the claimants sought a judgement ordering the contractors and principal, jointly and severally, to compensate them for damages deriving from failure to grant them employment at the enterprise that they alleged intermediated in the cleaning contract ordered by the A2A Group company.
As far as AMSA is concerned, in 2018 a judgement was defined in which 1 worker applied for the conviction of the contractor (the employer) and of AMSA - jointly liable pursuant to Art. 29 of Legislative Decree 276/2003 and Art. 1676 of the Italian Civil Code in its capacity as client - to the payment of the salary differences claimed by the same.
CUSTOMERS [GRI 206-1] 2018 ended with 22 open legal proceedings relating to billing disputes, due to the application of excise duties on gas supplies, incorrect detection of consumption due to malfunctioning of the meters, incorrect configuration of the available power of the electricity supply, incorrect termination of supply and, more generally, the failure and/or incorrect detection of electricity and/or gas consumption. There was also 1 ongoing case involving damages claimed due to delays in the activation of supply.

Stakeholder engagement and materiality analysis
Financial capital
Manufacturing capital
Natural capital
Human capital
Relational capital
The Acsm Agam Group
A2A 2018 Integrated Report - Supplement
51
Relational capital
50
The Acsm Agam GroupGroup ProfileThe Acsm Agam Group includes 11 companies and is divided into 4 Business Units (BUs):• Networks BU includes the companies that deal with: - water service and gas distribution for the provinces of Monza, Como and Varese; - only gas distribution in the provinces of Lecco and in Veneto; - gas and electricity distribution in the province of Sondrio.• Environment BU deals with waste collection activities (in the province of Varese and Como) and
waste-to-energy (Como);• Sales BU to which the Group companies operating in the sale of natural gas and electricity refer;• Energy and Smart Technologies BU oversees the activities of energy efficiency, electricity
generation, heat management, new innovative and smart city services, public lighting and district heating.
AEVV Farmacie s.r.l., which operates three pharmacies in the city of Sondrio, should also be added to these BUs.
Governance The Company is listed on the Italian stock exchange in Milan and has adopted, since 2016, the Corporate Governance Code promoted by Borsa Italiana. The company's Corporate Governance structure is based on the traditional organizational model. Currently, all Group companies adopt their own Organization, Management and Control Models in accordance with Italian Legislative Decree No. 231/01 (MOG), covering 100% of the Group's employees (at December 31, 2018 only the subsidiary Serenissima did not have a 231 Model, which however approved one of its own on February 26, 2019).
In addition to the control instruments provided for in the Legislative Decree, 231/01, the Company has adopted a Code of Ethics, which also contains the main elements of its human rights policy: in 2018, there were no episodes of violation of the Code. The Group companies are monitored with regards to risks connected with corruption. In accordance with the provisions of the Company's Code of Ethics, the Group does not allow active or passive corruption or collusion of any nature or form. In 2018, there were no cases of corruption and no cases of corruption are pending. Finally, the company policy does not provide for the payment of contributions of any kind to parties or politicians.
In addition, in 2016, A2A Reti Elettriche was charged by the Milan Chamber of Commerce Metric Office with alleged administrative violations concerning 63 electric meters, establishing an administrative sanction of 500 euro per meter. A fine was also ordered against A2A Energia as the "intermediary" in the supply arrangement through the distributor's meters for 47 of these meters. All of the notices of violations and related penalties have been appealed by the two companies. As regards the sanctions charged by the Metrics Office of Milan Chamber of Commerce and as challenged, in 2017, the competent authority had not yet ruled.
Lastly, in 2018, a dispute continued brought by a customer of AMSA, A2A Ambiente and Aprica, who is claiming termination of contract due to it having become excessively expensive; moreover, A2A Ciclo Idrico has been notified of a petition brought pursuant to Art. 702 bis of the Italian Code of Criminal Procedure by a credit institute, which has brought a suit opposing the transfer of credit, which has subsequently been joined by a parallel request for payment (for invoices issued in respect of works partially carried out) by the receiver of the contractor (which has, in the meantime, been declared bankrupt).
COMMUNITY [G4 - EU25]At the end of 2018, 75 cases of claims by citizens, mostly small amounts, for financial or property damage and 35 cases of physical damage related to personal injury were pending; of these, one relates to a fatal road accident involving a Group company (an operating vehicle for cleaning a cycle path) and one relates to a fall due to an uneven road surface due to work in progress on the electricity distribution network, but the company contracted to excavate and repair the road surface was held liable.
Finally, 3 cases of alleged infringements of property rights and 2 cases of alleged damage to neighbouring crops from previous years are pending.
Non-compliance with environmental regulations [GRI 307-1]At December 31, 2018, there were 14 ongoing or concluded environmental proceedings, of which 4 closed proceedings, 1 new proceeding and 9 already ongoing proceedings, concerning challenges in various capacities of integrated environmental permits (A.I.A.) issued to Group companies, various alleged irregularities in waste management and other alleged violations of other laws or regulations. In addition, in 2018, 2 Linea Green S.p.A. employees were notified of their identification reports for the alleged violation of environmental regulations in relation to the Isola plant at the intake on the Val delle Valli stream in the Mantelera locality in the Municipality of Bienno (BS).With regard to pre-existing disputes, the following are the 4 proceedings closed in 2018:• the GIP (Preliminary Investigations Judge) of Pavia has
declared closed, due to the extinction of the crime, the procedure in progress for alleged violations of A.I.A. regulations;
• the GIP of Pavia decided not to proceed and revoked the decree of condemnation for alleged violations of A.I.A. prescriptions;
• the Milan Public Prosecutor's Office has ordered the definitive closure of certain criminal investigations against former AMSA executives;
• the Ivrea Public Prosecutor's Office has asked for a case to be dismissed for harmful emissions and the GIP has definitively dismissed it.
In addition, by opposing the criminal decree of conviction for violations of A.I.A. regulations, the GIP accepted the request for oblation that was paid. The sentence of extinction of the crime is awaited.

Stakeholder engagement and materiality analysis
Financial capital
Manufacturing capital
Natural capital
Human capital
Relational capital
The Acsm Agam Group
The Acsm Agam Group A2A 2018 Integrated Report - Supplement
5352
Efficient infrastructure management
Figure 124_Installed capacity
2018
Electric (MWe) 45
Thermal (MWt) 245
Figure 125_Energy produced
2018
Electricity (GWhe) 149
Thermal energy (GWht) 301
Figure 126_Gas and electricity distribution
GAS 2018
Distributed natural gas (Mm3) 621
Gas network extension (km) 3,247
ELECTRICITY 2018
Electricity distributed (GWh) 161
Electricity losses in the grid (GWh) 4
Extension of the electricity distribution service (km) 556
of which underground cable (km) 427
Figure 127_Thermal energy released to the network
2018
GWh 191
Figure 128_Water service
2018
Wells (no.) 96
Sources (no.) 168
Drinking water conversion plants (no.) 18
Total network length (km) 1,659
Water delivered to the user and accounted for (Mm3) 27.8
Water withdrawn (Mm3) 43
Network losses and water not booked (Mm3) 15
Economic value generated and distributed
Figure 122_ Statement for distributing the gross global added value - millions of euro
(millions of euro) 2018
Remuneration of personnel 36.41
Wages and salaries 34.35
Employees' leaving entitlement (TFR) 1.72
Other costs 0.34
Remuneration of risk capital 6.2
Profits distributed 5.16
Net Income attributable to minority Interests 1.06
Remuneration of debt capital 0.92
Transfers to the government 6.96
Direct taxes for the Treasury 6.6
Other taxes and duties for the Treasury 0.32
Social security charges 0.04
Transfers to the local community 2.65
Direct taxes for local authorities 1.55
Local taxes and duties 0.52
Sponsorships, contributions to foundations, aid, donations, charities 0.58
Remuneration of the company 296.9
Reserves 269.81
Amortization, depreciation 27.09
Gross global value added 350.06
Figure 123_ Investments in Group infrastructure
2018
millions of euro 31.7

Stakeholder engagement and materiality analysis
Financial capital
Manufacturing capital
Natural capital
Human capital
Relational capital
The Acsm Agam Group
The Acsm Agam Group A2A 2018 Integrated Report - Supplement
5554
Figure 129_Municipal waste collected and separate collection
2018
QUANTITY COLLECTED (t) INDEX %
Varese 40,207 68.5%
Province of Varese 31,265 81.3%
Province of Como 4,568 74.5%
Total 76,040 74.1%
Figure 130_Urban waste collected by destination - tonnes
2018 % OF TOTAL
Disposal (landfill or other type D destination) 2,791 4%
Waste-to-energy plant 14,378 19%
Recovery 58,871 77%
Total 76,040 100%
Environmental responsibility
Figure 131_Resources used
RESOURCES USED 2018
Fuel (TJ) 1,985
Automotive fuels (TJ) 36
Electricity (GWh) 46
Water resource consumed (thousands m3) 368
Aqueduct 356
Well 12
Chemical products and materials used (t) 6,269
Figure 132_Greenhouse gases emissions1 – tonnes of CO2eq
2018
Direct emissions (Scope 1) 144,359
Indirect emissions (Scope 2 - location based) 14,632
Figure 133_Emissions of pollutants
2018
Nitrogen oxides (NOX) (t) 82
Sulphur oxides (SOX) (t) 0.6
Powders (t) 0.1
CO (t) 22
Fluorinated gases (kg) 13
Figure 134_Industrial waste water
2018
Volumes (thousands m3)
Discharged into sewers 165
Discharged into surface water 15
Water extracted for hydroelectric generation 93
Figure 135_Special waste produced
2018
Special non-hazardous waste (t) 17,475
Special hazardous waste (t) 2,233
Total (t) 19,708
Sent for recovery (% of total) 93%
Responsible management of people
Figure 136_Personnel by gender and type of contract
2018
MEN WOMEN TOTAL
Workers 641 224 865
Permanent contract 627 219 846
Temporary Contract 14 5 19
Workers with non-standard contracts (temporary/interns/collaborators) 39 19 58
Total 680 243 923
of which with part-time contract 6 45 51
Figure 137_Number of hires, outgoing and turnover rate
2018
Hires 36
Outgoing 33
Turnover rate 4%
Figure 138_Workers represented in formal health and safety committees
2018
Percentage of the total 100%
1. Source of emission coefficients for natural gas/methane, diesel and oil, petrol and waste: Ministry of the Environment and Protection of Land and Sea, National Standard Parameter Table, 2018.

Stakeholder engagement and materiality analysis
Financial capital
Manufacturing capital
Natural capital
Human capital
Relational capital
The Acsm Agam Group
The Acsm Agam Group A2A 2018 Integrated Report - Supplement
5756
Figure 139_Number of accidents and days lost by gender - (number)
2018
MEN WOMEN TOTAL
Accidents at work 25 1 26
Days lost due to accidents at work 1,041 52 1,093
Commuting accidents 2 2 4
Days lost due to commuting accidents 18 17 35
Figure 140_Personnel by qualification, gender and age bracket
2018
MANAGERS SUPERVISORS WHITE-COLLAR WORKERS
BLUE-COLLAR WORKERS TOTAL
Men 20 36 218 366 641
Women 2 14 208 1 224
Total 22 50 426 367 865
<30 - 1 35 23 59
30-50 years 7 27 252 168 454
>50 15 22 139 176 352
Total 22 50 426 367 865
Figure 141_Personnel covered by collective bargaining agreements
2018
Percentage of the total 100%
With regard to employee training on human rights, the Code of Ethics and Model 231, in 2017, 580 hours of training sessions were provided with approximately 250 participants for a total of approximately 250 trained employees of the Group (approximately 60% of the company population).In 2018, a training programme called "In.Te.Gr.A." was also launched, which will start in 2019, in order to guide the change and facilitate the progress of the individual projects that make it up: • INtegration, with the aim of coordinating the Group's integration projects;• Territory, with the aim of enhancing the best practices and ideas of employees; • Efficiency, with the aim of simplifying and streamlining the processes of the organization, increasing their
effectiveness and efficiency, also through a lean approach;• GRowth, with the aim of creating a common corporate culture based on shared values and an evolved
management model by developing people's transversal skills; • Agile, with the objective of digitization and automation of activities, supporting the transformation of the business
with integrated and intelligent systems.
Within the Acsm Agam Group, the well-being of workers is considered a key element for the achievement of company objectives and for this reason, many projects have been implemented, such as: the implementation of flexible working hours, smartworking, the addition of bonus hours for parent employees to accompany the integration of children at the beginning of the school year.
Relations with customers
Figure 142_Gas distribution: connected customers and municipalities served
2018
Customers connected 314,066
Municipalities served 88
Figure 143_Electricity distribution: connected customers and municipalities served
2018
Customers connected 25,757
Municipalities served 4
Figure 144_Urban hygiene: number of customers and municipalities served
2018
Population served 154,858
Municipalities served 19
Figure 145_Water service: number of customers and municipalities served
2018
Municipalities served by aqueduct service 37
Customers served aqueduct 83,178
Inhabitants served aqueduct 312,958
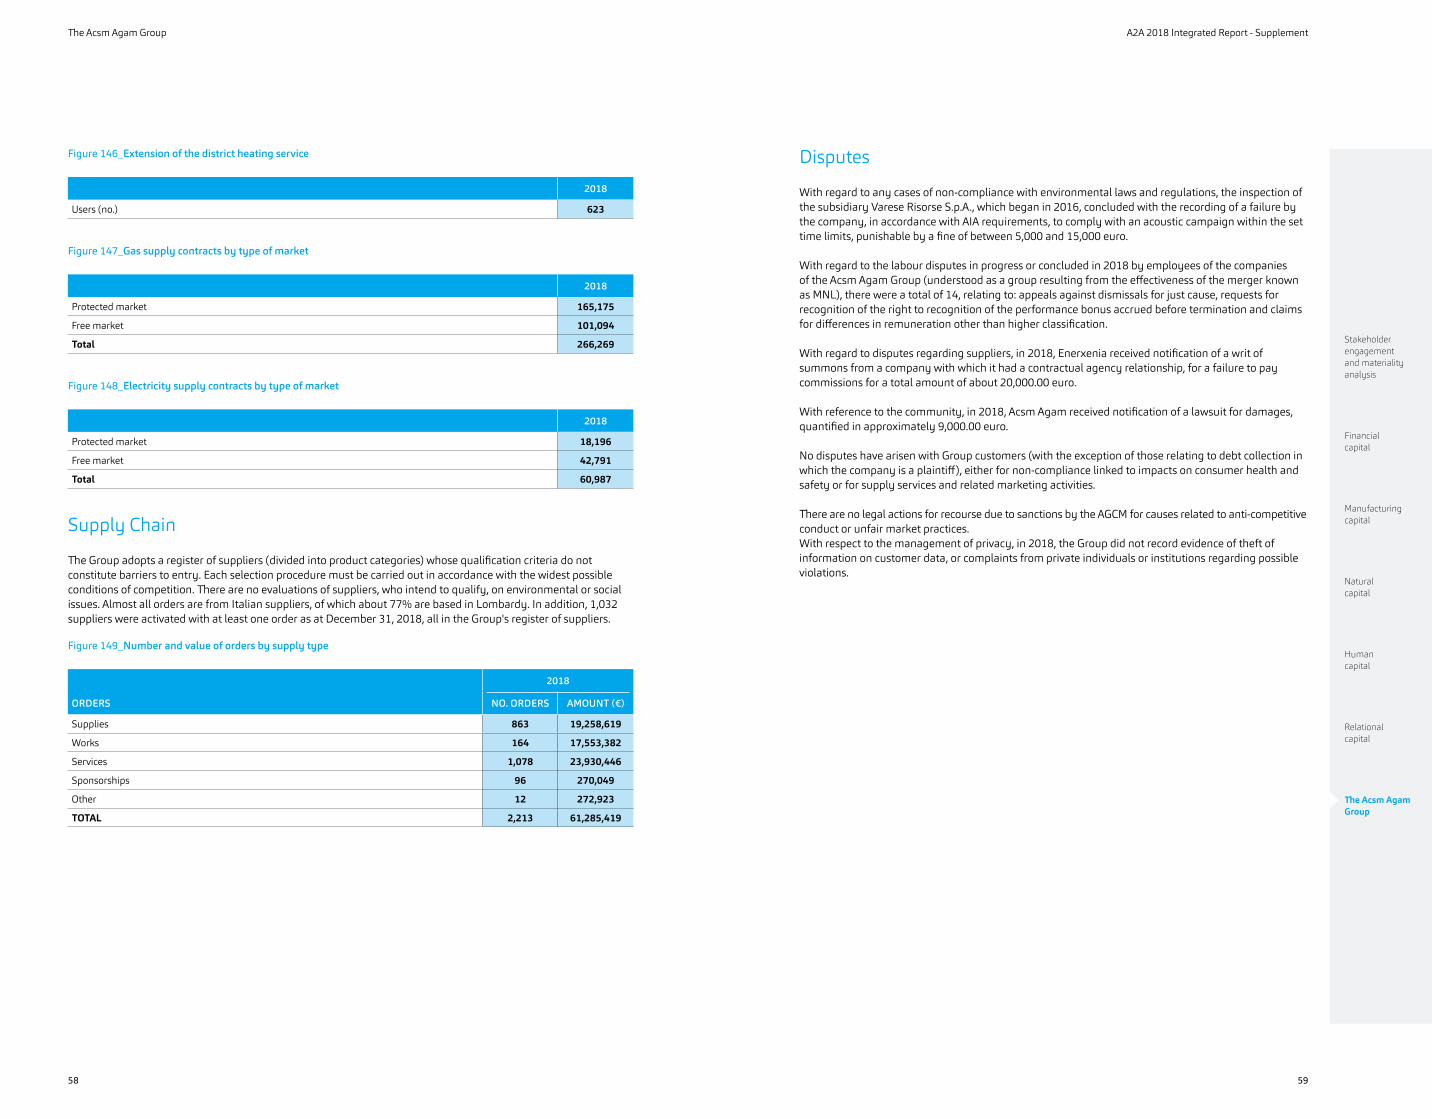
Stakeholder engagement and materiality analysis
Financial capital
Manufacturing capital
Natural capital
Human capital
Relational capital
The Acsm Agam Group
The Acsm Agam Group A2A 2018 Integrated Report - Supplement
5958
Disputes
With regard to any cases of non-compliance with environmental laws and regulations, the inspection of the subsidiary Varese Risorse S.p.A., which began in 2016, concluded with the recording of a failure by the company, in accordance with AIA requirements, to comply with an acoustic campaign within the set time limits, punishable by a fine of between 5,000 and 15,000 euro.
With regard to the labour disputes in progress or concluded in 2018 by employees of the companies of the Acsm Agam Group (understood as a group resulting from the effectiveness of the merger known as MNL), there were a total of 14, relating to: appeals against dismissals for just cause, requests for recognition of the right to recognition of the performance bonus accrued before termination and claims for differences in remuneration other than higher classification.
With regard to disputes regarding suppliers, in 2018, Enerxenia received notification of a writ of summons from a company with which it had a contractual agency relationship, for a failure to pay commissions for a total amount of about 20,000.00 euro.
With reference to the community, in 2018, Acsm Agam received notification of a lawsuit for damages, quantified in approximately 9,000.00 euro.
No disputes have arisen with Group customers (with the exception of those relating to debt collection in which the company is a plaintiff), either for non-compliance linked to impacts on consumer health and safety or for supply services and related marketing activities.
There are no legal actions for recourse due to sanctions by the AGCM for causes related to anti-competitive conduct or unfair market practices. With respect to the management of privacy, in 2018, the Group did not record evidence of theft of information on customer data, or complaints from private individuals or institutions regarding possible violations.
Figure 146_Extension of the district heating service
2018
Users (no.) 623
Figure 147_Gas supply contracts by type of market
2018
Protected market 165,175
Free market 101,094
Total 266,269
Figure 148_Electricity supply contracts by type of market
2018
Protected market 18,196
Free market 42,791
Total 60,987
Supply Chain
The Group adopts a register of suppliers (divided into product categories) whose qualification criteria do not constitute barriers to entry. Each selection procedure must be carried out in accordance with the widest possible conditions of competition. There are no evaluations of suppliers, who intend to qualify, on environmental or social issues. Almost all orders are from Italian suppliers, of which about 77% are based in Lombardy. In addition, 1,032 suppliers were activated with at least one order as at December 31, 2018, all in the Group's register of suppliers.
Figure 149_Number and value of orders by supply type
2018
ORDERS NO. ORDERS AMOUNT (€)
Supplies 863 19,258,619
Works 164 17,553,382
Services 1,078 23,930,446
Sponsorships 96 270,049
Other 12 272,923
TOTAL 2,213 61,285,419

A2A S.p.A.Registered offi ce:
Via Lamarmora, 230 - 25124 BresciaT [+39] 030 35531 F [+39] 030 3553204
Managerial and administrative headquarters:Corso Porta Vittoria, 4 - 20122 Milan
T [+39] 02 77201 F [+39] 02 77203920
Created by:S.O. Corporate Communication and Media Relations
S.O. Environment, Health and SafetyT [+39] 02 77201 - [email protected] - www.a2a.eu
We would like to thank all our colleagues of A2A who worked on the preparation of this Report.
Graphic design and layout:BOUTIQUE CREATIVA
MERCURIO GP
Printing:AGEMA S.p.A.
Milan, April 2019

Cons
olid
ated
Dis
clos
ure
of N
on-F
inan
cial
Info
rmat
ion
in
acco
rdan
ce w
ith It
alia
n Le
gisl
ativ
e D
ecre
e no
. 254
/201
6SH
APIN
G T
HE
FUTU
RE T
OD
AY20
18
| S
uppl
emen
t to
the
Inte
grat
ed R
epor
t
www.a2a.eu
SHAPING THE FUTURE TODAY