Embed Size (px)
Citation preview


I
CONTENTS
Acronyms ........................................................................................................................................ II
Acknowledgments.......................................................................................................................... III
Background .................................................................................................................................... IV
Executive Summary ......................................................................................................................... 1
Reporting Rates (Table 1A) ............................................................................................................. 3
Reporting Details by Provinces and NGOs (Table 1B) ..................................................................... 4
The Summary of Overall Value Indicators (Table 2A) ..................................................................... 6
The Summary of Value Indicators by Levels (Table 2B) .................................................................. 7
The Consumed Value of HMIS Indicator Medicines for MIAR (Table 2C) .................................... 11
The Consumed Value of HMIS Indicator Medicines for HMIR (Table 2D) .................................... 12
The Consumed Value of RMNCH Medicines (Table 2E) ................................................................ 13
Summary for ABC Analysis for All Consumed Medicines (Table 3A1) .......................................... 17
Class A Items for ABC Analysis of All Consumed Medicines (Table 3A2) ..................................... 18
Summary of ABC Analysis for HMIS Indicator Medicines (Table 3B1) .......................................... 22
ABC Analysis for All HMIS Indicator Medicines (Table 3B2) ......................................................... 23
Quarterly Public Expenditures on Medicines per Patient/Client (Table 4A) ................................ 31
Quarterly Public Expenditures on Medicines per Capita (Table 4B) ............................................ 33
Average HF Days of Stock-out for Each Medicine (Table 5A) ....................................................... 35
The Summary of the Overall Volume Indicators for HMIS Indicator Medicines (Table 6) ........... 45

II
Acronyms
BDN Bakhtar Development Network
BPHS Basic Package of Health Services
CAF Care of Afghan Families
CPDS Coordinated Procurement and Distribution System
DIC Data and Information Committee
EPHS Essential Package of Hospital Services
GCMU Grant Contract Management Unit
GDPA General Directorate for Pharmaceutical Affairs
HF Health facility
HMIR Hospital Monthly Inpatient Report
HMIS Health Management Information System
HN-TPO Health Net Trans-Cultural Psychosocial Organization
M&E Monitoring and Evaluation
MIAR Monthly Integrated Activity Report
MoPH Ministry of Public Health
MSH Management Sciences for Health
NGO Nongovernmental Organization
PCH Partnership Contracts for Health
PLIS Pharmaceutical Logistics Information System
PMIS Pharmaceutical management information system
RMNCH Reproductive, maternal, newborn and child health
SCA Swedish Committee for Afghanistan
SCD Supply Chain Development
SPS Strengthening Pharmaceutical Systems
USAID US Agency for International Development

III
Acknowledgments
The MoPH would like to express its appreciation to the following professionals for their contribution and technical support to the PLIS and generating of PLIS quarterly reports:
Pharm. Nazir Ahmad Ahmadzad Planning Manager of Planning Dept. MoPH/GDPA
Dr. Ajmal Yadgari CPDS Technical Coordinator MoPH/GDPA
Syed Asmatullah Fatimi PLIS Consultant MoPH/GDPA
Ajmal Sediqi PLIS Consultant MoPH/GDPA
Pharm. Nanyali Gulistani Staff of Planning Dept. MoPH/GDPA
Pharm. Homa Musawi Staff of Planning Dept. MoPH/GDPA
Pharm. Sayed Hassan Staff of Planning Dept. MoPH/GDPA
Pharm. Khalil Veijah Staff of Planning Dept. MoPH/GDPA
Pharm. Zakiullah Azizi Staff of Planning Dept. MoPH/GDPA
Jamshid Sabiri HMIS Specialist MoPH
Dr. Zmary Saleh Pharmacy Manager BDN
Pharm. Hashmatullah Hayat Pharmacy Officer CAF
Pharm. Khalil-ur-Rahman Pharmacy Procurement Manager HN-TPO
Dr. Khalil Jibran Senior BPHS Officer SCA
Hafizullah Mahmoodi M&E/PMIS Advisor SPS
Dr. Najia Dehzad SCD Advisor SPS
Dr. Mohammad Osman Zaki Technical Officer SPS
Ahmad Seyar Samadi Database Developer SPS
Dr. Paul Ickx Senior Principal Technical Advisor SPS
Ms. Shiou-Chu Judy Wang Senior Technical Advisor SPS
Special thanks also go to all the participating BPHS/EPHS implementers for their cooperation and support. The PLIS quarterly reports would not be possible without the full and active participation of these implementers.
The MoPH is also grateful for the generous financial support from the US Agency for International Development (USAID).

IV
Background
Afghanistan’s Ministry of Public Health (MoPH) has contracted out the implementation of Basic Package of Health Services (BPHS) and the Essential Package of Hospital Services (EPHS) services to national or international nongovernmental organizations (NGOs) with the financial support of international donors since 2005. These implementer NGOs provide pharmaceutical supplies to their catchment provinces and produced customized pharmaceutical logistics reports for their own use. However, a system to coordinate and gather the pharmaceutical supply information in the public sector has been lacking, and the MoPH did not have information regarding procurement, distribution and consumption of medicine of the BPHS/EPHS implementer NGOs. The MoPH identified this gap and included the establishment of pharmaceutical management information system (PMIS) in its Health Information System Strategic Plan (GOA, 2009).
In order to coordinate the services provided by the BPHS/EPHS implementer NGOs, the MoPH established the Coordinated Procurement and Distribution System (CPDS) in 2010 (GOA/MoPH, 2010). To address the lack of pharmaceutical supply information, a Data and Information Committee (DIC) of the CPDS was established and tasked to develop a Pharmaceutical Logistics Information System (PLIS) to gather the information about pharmaceutical procurement, distribution and consumption in the BPHS/EPHS implementers and health facilities. With the support of Strengthening Pharmaceutical Systems (SPS) program, the DIC developed a PLIS quarterly reporting form and data analysis system in a Microsoft Excel application, its user manual, macro (value1) and micro (volume2) indicators. The objectives of the PLIS are to inform the value and volume of the medicines that flow through the supply chain in the BPHS/EPHS implementers between central/provincial stores and health facilities; to analyze the consumption pattern; to redistribute the medicines that are near to expire; and to further forecast the need of the medicines and the budget.
The PLIS was initially tested with eight BPHS/EPHS implementers in September 2012. It was followed by revising the reporting form and testing with all BPHS/EPHS implementer NGOs in September 2013. After improving the system, which includes developing a Microsoft Access database, the PLIS was approved by MoPH and officially launched on January 05, 2015. Since then, all BPHS/EPHS implementer NGOs are required to submit their PLIS quarterly reports to the GDPA/MoPH.
1 “Value” refers to the direct monetary value of the products [sum of (unit price*quantity)]. It does not include other handling or administrative costs. 2 “Volume” refers to the quantities of the products in their administering units (such as tablets, capsules, vials, etc.) or packing unit (such as bottles of any liquid products, or tubes of any cream/ointment etc. with indicated volumes in the medicine list).
1
Executive Summary
The PLIS presents the information in the following categories:
• Reporting rates and reporting implementers: Table 1A and 1B • Value indicators for overall transactions: Table 2A, 2B, Figures 1-3 • Value indicators for the consumption of HMIS indicator medicines and RMNCH
medicines: Table 2C (MIAR), 2D (HMIR), and 2E (RMNCH) • ABC analysis for total consumed medicines: Table 3A1 and 3A2 • ABC analysis for the consumption of HMIS indicator medicines: Table 3B1 and 3B2 • Quarterly public expenditure on medicines per patient/client and per capita at the
BPHS/EPHS level: Table 4A and 4B • Average days of stock-out of medicines among health facilities: Table 5A • Summary of volume indicators for overall transactions for HMIS indicator medicines:
Table 6
Highlights for This Reporting Quarter
In this reporting quarter, 19 BPHS/EPHS implementer NGOs were contracted by MoPH. With the cooperation of these implementers, the reporting rates were 100%, 92%, and 89% for central, provincial stores, and health facilities (HFs), respectively.
The summary of the values of medicines are as follows.
Overall value indicators: • Total value of the available medicines at the beginning of quarter was
US$7,792,234.72 • Total value of medicines purchased and received through donation during the
quarter was US$3,151,879.60 • Total value of consumed medicine for the reporting quarter was US$3,425,048.07.
(See ABC analysis below). • Total reported wastage of medicine was US$23,777.08. • Total value of reported ending stock was US$7,292,472.60.
ABC analysis3 for the total consumed value (US$3,425,048.07):
3 ABC analysis: A method by which medicines are classified as Pareto category A, B, or C according to the monetary value of their usage (unit cost multiplied by consumption volume). The class 'A' items typically account for a large proportion of the overall value with a small percentage of number of items. In the business management, they are the priority items to be managed or controlled.

2
• Only 11.53% (58 items) of the medicines accounted for 80% (US$2,728,793) of the
total consumed value. These are classified as Class A items and are the priority medicines to be managed and monitored closely.
• 13.52% (68 items) of the medicines accounted for 15% (US$522,768) of the total consumed value: Class B items.
• 74.95% (377 items) of the medicines accounted for only 5% (US$173,488) of the total consumed value: Class C items.
• Amoxicillin 500mg cap accounted for the highest consumed value (US$327,877.98), followed by co-trimoxazole 480mg tab (US$144,964.68) and amoxicillin 250mg cap (US$118,843.11).
HMIS indicator medicines: • There were 100 items of medicines in the MIAR and 40 items in HMIR reported this
quarter. • ABC analysis: only 18.80% (25 items) of the medicines accounted for 79%
(US$2,122,468) of the total HMIS medicines’ cost (US$2,687,790). • The top 3 consumed HMIS indicator medicines based on their consumption
quantities are: 1. Paracetamol 500mg tab: 19,148,890 tabs (US$100,620.66) 2. Co-trimoxazaole 480mg tab: 12,430,764 tabs (US$144,964.68) 3. Ferrous sulphate 60mg+folic acid 0.4mg tab: 11,342,219 tabs (US$75,052.35)
Reproductive, maternal, newborn and child health (RMNCH) indicator medicines:
• There were 94 RMNCH medicines reported this quarter. • The total value of consumed RMNCH medicines was US$1,992,042.93. Since some of
these medicines are widely used for other health conditions, this value is based on the grand total consumption for all treatments. It is not specific for the use in RMNCH.
Quarterly public expenditure on medicines at the BPHS/EPHS level:
• In this quarter, the public expenditure on medicines per patient/client was between US$0.04 and US$0.86 in the provinces, with the overall average of US$0.30.
• The public expenditure on medicines per capita at the BPHS/EPHS level was between US$0.01 and US$0.60 in the provinces, with the overall average of US$0.18.
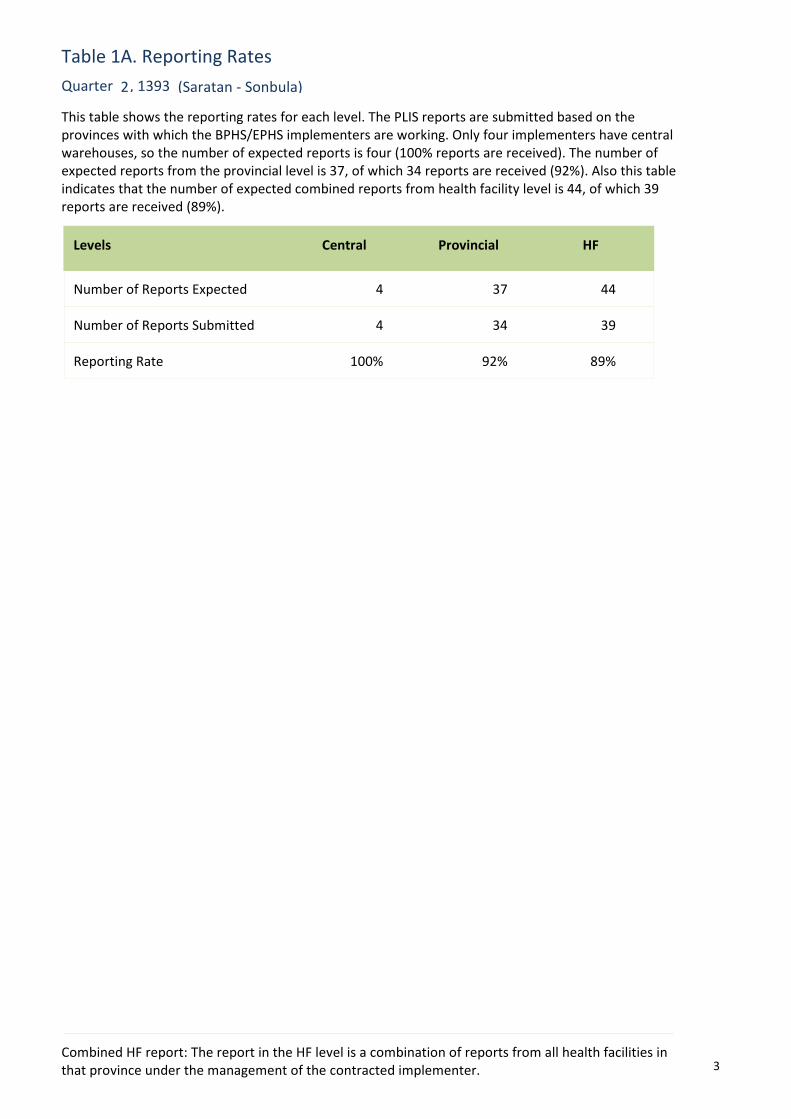
Table 1A. Reporting Rates
2Quarter , 1393 (Saratan - Sonbula)
Levels Central Provincial HF
This table shows the reporting rates for each level. The PLIS reports are submitted based on the provinces with which the BPHS/EPHS implementers are working. Only four implementers have central warehouses, so the number of expected reports is four (100% reports are received). The number of expected reports from the provincial level is 37, of which 34 reports are received (92%). Also this table indicates that the number of expected combined reports from health facility level is 44, of which 39 reports are received (89%).
Number of Reports Expected 4 37 44
Number of Reports Submitted 4 34 39
Reporting Rate 100% 92% 89%
Combined HF report: The report in the HF level is a combination of reports from all health facilities in that province under the management of the contracted implementer. 3

Table 1B. Reporting Details by Provinces and NGOs
2Quarter , 1393 (Saratan - Sonbula)
This table shows the reporting details of each NGO with the details of their reporting level and the provinces with which they are working.
HFsProvincialCentralProvinciesNGOs Status
YesYesN/ABadakhshanCAF C
YesN/AN/ABadakhshanAKHS C
YesYesN/ABadghisMOVE C
YesYesN/ABaghlanBDN C
YesYesN/ABaghlanAKHS C
YesYesN/ABalkhBDN C
YesYesN/ABamyanAKHS C
YesYesN/ABamyanAADA C
NoYesN/ADykundiCAF NC
YesYesYesDykundiPU-AMI C
YesYesN/AFarahCHA C
YesN/AN/AFarahMRCA C
YesYesN/AFaryabSAF C
YesYesN/AGhazniSDO C
YesN/AN/AGhazniBDN C
YesYesN/AGhazniAADA C
YesYesN/AGhorACTD C
YesYesN/AHelmandACTD C
YesYesN/AHiratBDN C
YesYesN/AJawzjanSAF C
YesN/AN/AKabulBRAC C
N/AN/AYesKabulSCA C
YesYesN/AKandaharAHDS C
NoYesN/AKapisaSM NC
YesYesN/AKhostHNTPO C
YesYesYesKunarPU-AMI C
YesYesN/AKunduzSCI C
YesN/AN/ALaghmanSCA C
YesYesN/ALogarCAF C
YesN/AYesLogarMRCA C
C= Completed (All the required reports were submitted), NC= Not Completed (Not all the required reports were submitted), NA= Not Applicable (Don’t have service at this level)
4

HFsProvincialCentralProvinciesNGOs Status
YesYesN/ANangarharAADA C
YesYesN/ANangarharHNTPO C
YesYesN/ANimrozSAF C
YesYesN/ANooristanIMC C
YesYesN/APaktikaIMC C
YesYesN/APaktyaHNTPO C
YesYesN/ASamanganAADA C
YesYesN/ASar-e-PulBDN C
YesYesN/ATakharCAF C
YesYesN/AUrozganAHDS C
YesN/AN/AWardakSCA C
YesYesN/AZabulHADAAF C
C= Completed (All the required reports were submitted), NC= Not Completed (Not all the required reports were submitted), NA= Not Applicable (Don’t have service at this level)
5

Table 2A. The Summary of Overall Value Indicators
2Quarter , 1393 (Saratan -Sonbula)
Beginning Stock
Total Value of Purchased and Donation during the Quarter
Total Value of Received from Central/Provincial levels during the Quarter
Total Consumed
Reported Wastage
Reported Ending Stock
Indicators
This table summarizes the overall value of the reported medicines flowing between central, provincial and health facilities. There was US$7,792,234.72 of the medicines at the beginning of the quarter, with the addition of purchases and donations during the quarter worth US$3,151,879.60. The grand total consumed value for this quarter was US$3,425,048.07, this table also shows that the total wastage was US$23,777.08, and total remaining medicines’ value at the end of quarter was US$7,292,472.60.
Value in US$
7,792,234.72
3,151,879.60
4,742,161.06
3,425,048.07
23,777.08
7,292,472.60
Beginning Stock
The stock on hand at the beginning of the quarter in all the central and provincial stores and HFs (same as the ending stock reported in the previous quarter)
Total Value of Received from Central/Provincial
Reflect the sum-up value in both provincial and health facility levels. It may include the vlaue that is received at the provincial level, and some of them distributed to health facility level, which may have double count in the "Grand Total" value.
Total Value of Purchased and Donation during the quarter
Reflect the total Medicine Purchased in Central and Provincial levels plus total Donation received in all levels during the quarter
Reported wastage
The total wastage due to expiration or damage reported by all central and provincial stores and HFs
Reported Ending stock
The stock on hand reported by all the central and all central and provincial stores and HFs 6

Table 2B. The Summary of Value Indicators by Levels2Quarter , 1393 (Saratan - Sonbula)
Central Provincial HFs Grand Total
Total Value of Beginning Stock
Total Value of Purchased and Donation during the Quarter
Total Value of Recived Medicines from Central/Provincial levels
Total value of the medicines distributed
Total value of the medicines donated out
Total value of the medicines consumed
Total value of wastage
Reported total value remained at the end of the quarter
Value in US$
This table indicates the breakdown of the information shown in Table 2A at each level (central, provincial and health facilities).
7,792,234.7028,882.63 2,887,523.40 4,875,828.67
3,151,879.731,030,590.74 2,108,772.35 12,516.64
4,742,161.170.00 1,547,856.88 3,194,304.29
4,058,346.58937,114.31 3,121,232.27 0.00
16,219.940.00 16,219.94 0.00
3,425,048.110.00 0.00 3,425,048.11
23,777.0760.60 6,555.65 17,160.82
7,292,472.54122,698.06 2,724,486.87 4,445,287.61
Total Value of Recived Medicines from Central/Provincial levels:
Reflect the sum-up value in both provincial and health facility levels. It may include the vlaue that is received at the provincial level, and some of them distributed to health facility level, which may have double count in the "Grand Total" value.
Total Value of Purchased and Donation during the quarter
Reflect the total Medicine Purchased in Central and Provincial levels plus total Donation received in all levels during the quarter
7

2Quarter , 1393 (Saratan - Sonbula)
Figure 1
Figure 1: Total Value and Sources of Received Medicines at the Central Level (Value in US$)
0%
100%
0%
Direct Donation
National Purchase
From Donors
This figure displays the total value and sources of medicine at the central level. It shows that almost all the medicines at the central stores came from national purchase (US$1.03 million, 100%); the value from direct donation was very minimal.
International Purchase Direct Donation National Purchase From Donors Total
0.00 244.67 1,030,345.96 0.00 1,030,590.63
8

2Quarter , 1393 (Saratan - Sonbula)
Figure 2: Total Value and Sources of Received Medicines at the Provincial Level (Value in US$)
1%
23%
28%
5%
43%International Purchase
National Purchase
From Donors
Direct Donation
Received from Central
This figure shows the total value and sources of medicine at the provincial level. It indicates that the medicines were received from five sources: direct donation, international purchase, local purchase, from donors via international purchase, and from central stores. Most of the medicines were received from central stores (US$1,547,856.77: 43%), followed by donors’ international purchases (US$ 1,025,998.79; 28%) (for PCH NGOs), and only (US$53,058.18, 1%) was purchased from international market.
International Purchase National Purchase From Donors Direct Donation Received Central Total
53,058.18 851,150.57 1,025,998.79 178,564.80 1,547,856.77 3,656,629.10
9

2Quarter , 1393 (Saratan - Sonbula)
Figure 3: Total value of Medicines available and consumed at the HFs level (Value in US$)
0
1000000
2000000
3000000
4000000
5000000
6000000
Value at the Beginning Value Received Donation Value Consumed Value at the end
This figure indicates the total value of medicine available and consumed at the HF level. Total value of medicine at the beginning of the quarter in all HFs was US$ 4,875,828.67 and total value of medicine received from central or provincial levels was US$ 3,194,304.29; the value of the received donation was US$ 12,516.64. The total consumption of medicines in all HFs was US$ 3,425,048.11, the value of the medicines remaining at the end of the quarter was US$ 4,445,287.61.
Value at the Beginning Value Received Donation Value Consumed Value at the end
4,875,828.67 3,194,304.29 12,516.64 3,425,048.11 4,445,287.61
10
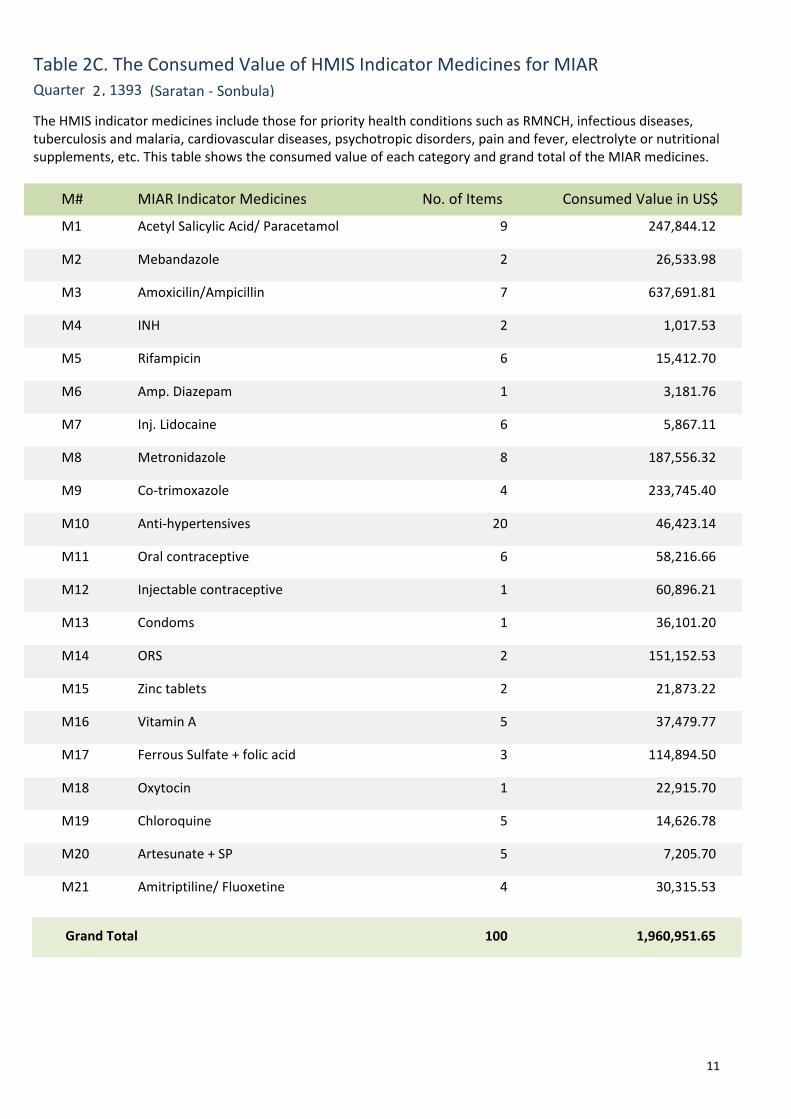
Table 2C. The Consumed Value of HMIS Indicator Medicines for MIAR
2Quarter , 1393 (Saratan - Sonbula)
The HMIS indicator medicines include those for priority health conditions such as RMNCH, infectious diseases, tuberculosis and malaria, cardiovascular diseases, psychotropic disorders, pain and fever, electrolyte or nutritional supplements, etc. This table shows the consumed value of each category and grand total of the MIAR medicines.
M# MIAR Indicator Medicines No. of Items Consumed Value in US$
M1 Acetyl Salicylic Acid/ Paracetamol 9 247,844.12
M2 Mebandazole 2 26,533.98
M3 Amoxicilin/Ampicillin 7 637,691.81
M4 INH 2 1,017.53
M5 Rifampicin 6 15,412.70
M6 Amp. Diazepam 1 3,181.76
M7 Inj. Lidocaine 6 5,867.11
M8 Metronidazole 8 187,556.32
M9 Co-trimoxazole 4 233,745.40
M10 Anti-hypertensives 20 46,423.14
M11 Oral contraceptive 6 58,216.66
M12 Injectable contraceptive 1 60,896.21
M13 Condoms 1 36,101.20
M14 ORS 2 151,152.53
M15 Zinc tablets 2 21,873.22
M16 Vitamin A 5 37,479.77
M17 Ferrous Sulfate + folic acid 3 114,894.50
M18 Oxytocin 1 22,915.70
M19 Chloroquine 5 14,626.78
M20 Artesunate + SP 5 7,205.70
M21 Amitriptiline/ Fluoxetine 4 30,315.53
Grand Total 100 1,960,951.65
11

Table 2D. The Consumed Value of HMIS Indicator Medicines for HMIR
2Quarter , 1393 (Saratan - Sonbula)
This table shows the consumed value of each category and grand total of the HMIR medicines.
H# HMIR Indicator Medicines No. of Items Consumed Value in US$
H1 ACT 5 7,205.70
H2 Atropine inj 2 611.48
H3 Benzyl Penicilline inj 2 3,241.12
H4 Digoxin 2 315.69
H5 Ergometrine inj 4 6,715.89
H6 Furosemide inj 1 1,390.96
H7 Gentamicin inj 3 20,252.64
H8 Iodine povidone 1 17,905.85
H9 Ketamin inj 1 8,353.32
H10 Lidocaine 5% spinal inj 1 104.46
H11 Magnesium Sulphate 2 3,148.34
H12 Morphine inj 1 8,639.64
H13 Naloxone inj 1 1,234.11
H14 Hydralazine inj 1 2,093.41
H15 Pethidine inj 2 52.78
H16 Phenobarbital inj 3 246.56
H17 Quinine inj 1 1,854.98
H18 Ranitidine inj 1 783.54
H19 Ringer lactate IV 2 125,085.06
H20 Salbutamol inj 2 1,874.57
H21 Sodium chloride IV 2 49,770.45
Grand Total 40 260,880.54
12

Table 2E. The Consumed Value of RMNCH Medicines
2Quarter , 1393 (Saratan -Sonbula)
This table shows the consumption value of RMNCH indicator medicines. In total, 94 RMNCH medicines were reported. The total value of consumed RMNCH medicines was US$ 1,992,042.93.
RMNCH Medicines Consumed Value in US$
Acetylsalicylic acid (Aspirin) 100mg tab 2,000.47
Amoxicillin 125mg + Clavulanic acid 31.25mg/5ml, in 60ml bottle, Susp 398.31
Amoxicillin 125mg/5ml, in 60ml bottle, susp 23,585.30
Amoxicillin 250mg Cap 118,843.07
Amoxicillin 250mg/5ml, in 60ml bottle, Susp 88,873.25
Amoxicillin 500mg Cap 327,877.98
Amoxicillin 500mg+Clavulanic acid 125mg (Co-amoxiclav) Tab 41.23
Ampicillin 1g vial 48,831.39
Ampicillin 500mg Tab 1,784.69
Ampicillin 500mg vial 27,896.12
Calcium 250mg Tab 40.31
Calcium Gluconate 10% 10ml Amp 765.90
Chloroquine 100mg Tab 6.41
Chloroquine 150mg Tab 7,096.26
Chloroquine 50mg/5ml 60ml Syr 7,384.23
Condom 36,101.20
Dexamethasone 4mg /ml 1ml Amp 179.36
Ergometrine 0.2mg Tab 3,820.62
Ergometrine 0.2mg/ml, 1ml Amp 2,114.17
Erythromycin (Base) 200mg/5ml, in 60ml, susp 33,382.78
Erythromycin (Ethyl Succinate) 100mg/ml 100ml Susp 9,222.28
Erythromycin Stearate 250mg Tab 13,234.82
Erythromycin Stearate 500mg Tab 11,580.12
Ethinylestradiol 0.035mg+Norethisterone 1mg Cycle 1,446.10
Ethinylestradiol 0.03mg+Levonorgestrel 0.15mg Cycle 25,390.85
-Essential Interventions, Commodities and Guideline for Reproductive, Maternal, Newborn and Child Health WHO.
Note: The consumption of these medicines is not only for RMNCH, but also for other health conditions. The consumed values indicate the overall usage of these medicines in the reporting quarter.
The RMNCH Medicine List has been taken from below references:
13

RMNCH Medicines Consumed Value in US$
Ethinylestradiol 0.03mg+Norgestrel 0.3mg Cycle 14,874.90
Ethinylestradiol 0.05mg+Levonorgestrel 0.25mg Cycle 0.00
Ferrous sulfate 125mg/5ml, in 120ml , oral liquid 3,614.12
Ferrous sulfate 200mg+Folic acid (Vit B9) 0.25mg Tab 38,598.80
Ferrous sulfate 200mg+Folic acid (Vit B9) 0.5mg Tab 1,243.36
Ferrous Sulfate 25mg/ml 120ml Drop 25,481.79
Ferrous Sulfate 60mg Tab 3,463.35
Ferrous Sulphate 200mg Tab 2,419.37
Ferrous Sulphate 60mg+Folic Acid 0.4mg Tab 75,052.34
Folic Acid 1mg Tab 1,879.06
Folic Acid 5mg Tab 7,758.93
Gentamicin 10mg/ml, 2ml Amp 2,820.97
Gentamicin 20mg/ml, 2ml Amp 5,500.68
Gentamicin 40mg/ml, 2ml Amp 11,930.99
Hydralazine 20mg/ml, in 2ml , Amp 2,093.41
Hydralazine 25mg Tab 0.00
Hydralazine 50mg Tab 0.00
Hydroxocobalamine (Vit B12) 1mg/ml, in 1ml Amp 3.93
Intrauterine device (IUD) with copper 1pce , vaginal intra uterine device 267.04
Magnesium Sulfate 500mg/ml (50%) 10ml Amp 2,997.84
Magnesium Sulfate 500mg/ml (50%) 20ml Amp 150.50
Medroxyprogesterone acetate Depot 150mg/ml, in 1ml vial 60,896.21
Methyldopa 250mg Tab 27,955.35
Methylergometrine 0.125mg Tab 582.79
Methylergometrine 0.2mg Tab 24.33
Methylergometrine 0.2mg/ml, 1ml Amp 198.32
Metronidazole 120mg/5ml, in 100ml bottle, Susp 3,376.91
Metronidazole 200mg Tab 66,996.18
Metronidazole 200mg/5ml, in 100ml bottle, Susp 55,159.62
-Essential Interventions, Commodities and Guideline for Reproductive, Maternal, Newborn and Child Health WHO.
Note: The consumption of these medicines is not only for RMNCH, but also for other health conditions. The consumed values indicate the overall usage of these medicines in the reporting quarter.
The RMNCH Medicine List has been taken from below references:
14

RMNCH Medicines Consumed Value in US$
Metronidazole 250mg Tab 0.00
Metronidazole 400mg Tab 37,321.32
Metronidazole 500mg Tab 0.00
Metronidazole 5mg/ml, in 100ml bottle, infusion Sol 21,377.11
Misoprostol 200mcg Tab 752.23
Nifedipine 10mg Tab/Cap 3,885.01
Nifedipine 20mg Tab/Cap 248.14
Norethindrone 0.35mg (Progestin-Only Pills or Mini-Pills) 0.00
Norgestrel 0.03mg Cycle 15,886.71
Norgestrel 0.075mg Cycle 618.09
Oral rehydration salts (ORS , Resomal and low osmolar) 20.5g/Lit 74,561.77
Oral rehydration salts (ORS , Resomal and low osmolar) 27.9g/Lit 76,590.76
Oxytocine 10IU/ml in 1ml Amp 22,915.70
Paracetamol (Acetaminophen) 225mg/3ml, Amp (75mg/ml) 0.00
Paracetamol 100mg Tab 24,913.25
Paracetamol 100mg/ml, 15ml Drop 124.52
Paracetamol 120mg/5ml, 60ml Syr 89,547.63
Paracetamol 325mg Tab 120.03
Paracetamol 500mg Tab 100,620.66
Penicillin Benzyl (Peni G crystal) 1MU Vial 72.42
Penicillin Benzyl (Peni G crystal) 5MU Vial 3,168.70
Penicillin Benzyl Benzathine 1.2MU Vial 3,235.62
Penicillin Benzyl Benzathine 2.4MU Vial 4,938.44
Penicillin Benzyl Procaine 1MU Vial 0.00
Penicillin Benzyl Procaine 2MU Vial 1,483.20
Penicillin Benzyl Procaine 3MU Vial 6,274.58
Penicillin Benzyl Procaine 4MU Vial 2,767.56
Penicillin Benzyl Procaine 800,000U Vial 282.77
Retinol (Vit A) 100,000 IU Amp 183.46
-Essential Interventions, Commodities and Guideline for Reproductive, Maternal, Newborn and Child Health WHO.
Note: The consumption of these medicines is not only for RMNCH, but also for other health conditions. The consumed values indicate the overall usage of these medicines in the reporting quarter.
The RMNCH Medicine List has been taken from below references:
15

RMNCH Medicines Consumed Value in US$
Retinol (Vit A) 100,000 IU Tab 6,769.05
Retinol (Vit A) 200,000 IU Cap 29,540.32
Retinol (Vit A) 25,000IU Cap 0.00
Retinol (Vit A) 50,000IU Cap 986.95
Sulfamethoxazole 100mg+Trimethoprim 20mg Tab (Co-trimoxazole) 29,644.51
Sulfamethoxazole 200mg+Trimethoprim 40mg/5ml 50ml Susp (Co-trimoxa 34,179.48
Sulfamethoxazole 400mg+Trimethoprim 80mg 50ml Susp (Co-trimoxazole) 24,956.75
Sulfamethoxazole 400mg+Trimethoprim 80mg Tab (Co-trimoxazole) 144,964.67
Zinc Sulfate 10mg Tab 0.00
Zinc Sulfate 10mg/5ml, 100ml Syr 0.00
Zinc Sulfate 20mg Tab 21,873.22
Grand Total 1,992,042.93
-Essential Interventions, Commodities and Guideline for Reproductive, Maternal, Newborn and Child Health WHO.
Note: The consumption of these medicines is not only for RMNCH, but also for other health conditions. The consumed values indicate the overall usage of these medicines in the reporting quarter.
The RMNCH Medicine List has been taken from below references:
16

Class % Of Consumed Value in US$
Number of Medicines Consumed Value in US$
% Of Medicines
Table 3A1. Summary for ABC Analysis for All Consumed Medicines
2Quarter , 1393 (Saratan - Sonbula)
This table shows the summary of ABC analysis for the overall consumption, which reveals that only 11.53% (58 items) of the medicines accounted for 80% (US$2,728,793) of the total consumed value (class A items); 13.52% of medicines (68 items) accounted for 15% (US$522,768) of the total consumed value (class B items); and 74.95% (377 items) of the medicines accounted for only 5% (US$173,488) of the total consumed value (class C items). This information indicates that the 58 class A items should be closely monitored and managed as they cost most. The next table (table 3A2) will provide details of the class A medicines.
A 80 58 2,728,79311.53
B 15 68 522,76813.52
C 5 377 173,48874.95
Total 100 503 3,425,048100.00
17

Table 3A2. Class A Items for ABC Analysis of All Consumed Medicines2Quarter , 1393 (Saratan - Sonbula)
This table shows the medicines that cost most (class A items) from ABC analysis by the order of their consumed value (The unit prices are rounded to two decimals). It is to highlight the small portion of the medicines which accounted for majority of the cost. They are the priority medicines that need to be managed and monitored closely. For example, amoxicillin 500mg cap alone accounted for 9.57% (US$327,877.98) of the total consumed value. It is followed by co-trimoxazole 480mg tablets for 4.23% (US$144,964.68), and amoxicillin 250mg cap for 3.47% (US$118,843.11) of the total cost. These three medicines were ranked as the top three consumed medicines of the overall consumption in value.
Medicines HMIS Code Total Consumed Value at all HFs in US$
Total Consumed Quantity
Average Unit Pricein US$
% of the Value % of Cumulative Value
Class
Amoxicillin 500mg Cap 327,877.98 7,828,727 0.04 9.57 9.57 AM3
Sulfamethoxazole 400mg+Trimethoprim 80mg Tab (Co-trimoxazole)
144,964.68 12,430,764 0.01 4.23 13.81 AM9
Amoxicillin 250mg Cap 118,843.11 6,226,962 0.02 3.47 17.28 AM3
Ringer lactate 1000ml IV infusion 104,304.14 161,952 0.67 3.05 20.32 AH19
Paracetamol 500mg Tab 100,620.66 19,148,890 0.01 2.94 23.26 AM1
Paracetamol 120mg/5ml, 60ml Syr 89,547.64 335,252 0.29 2.61 25.87 AM1
Amoxicillin 250mg/5ml, in 60ml bottle, Susp
88,873.25 174,841 0.49 2.59 28.47 AM3
Oral rehydration salts (ORS , Resomal and low osmolar) 27.9g/Lit
76,590.76 1,088,068 0.06 2.24 30.70 AM14
Ferrous Sulphate 60mg+Folic Acid 0.4mg Tab
75,052.35 11,342,219 0.01 2.19 32.90 AM17
Oral rehydration salts (ORS , Resomal and low osmolar) 20.5g/Lit
74,561.79 1,254,112 0.06 2.18 35.07 AM14
Multivitamin Tab 74,413.32 16,400,021 0.00 2.17 37.24 A
Metronidazole 200mg Tab 66,996.17 6,560,766 0.01 1.96 39.20 AM8
Medroxyprogesterone acetate Depot 150mg/ml, in 1ml vial
60,896.22 136,930 0.51 1.78 40.98 AM12
Metronidazole 200mg/5ml, in 100ml bottle, Susp
55,159.60 171,760 0.31 1.61 42.59 AM8
18

Medicines HMIS Code Total Consumed Value at all HFs in US$
Total Consumed Quantity
Average Unit Pricein US$
% of the Value % of Cumulative Value
Class
Penicillin V Potassium 500mg Tab 50,234.62 1,075,204 0.04 1.47 44.06 A
Ampicillin 1g vial 48,831.39 239,823 0.20 1.43 45.48 AM3
Penicillin V(Phenoxy methyl Penicillin) 250mg/5ml, in 100ml bottle, Susp
45,633.98 56,061 0.70 1.33 46.81 A
Sodium Chloride 0.9% 1000ml IV infusion (Normal Saline)
44,922.74 76,891 0.60 1.31 48.13 AH21
Tetracycline Eye 1% Oint 38,753.47 299,906 0.13 1.13 49.26 A
Ferrous sulfate 200mg+Folic acid (Vit B9) 0.25mg Tab
38,598.80 9,402,766 0.01 1.13 50.38 AM17
Metronidazole 400mg Tab 37,321.33 2,745,764 0.01 1.09 51.47 AM8
Ceftriaxone 1g Vial 37,035.86 53,285 0.48 1.08 52.56 A
Condom 36,101.20 1,671,563 0.02 1.05 53.61 AM13
Chloramphenicol 125mg/5ml 100ml Bottle Susp
35,041.93 69,841 0.47 1.02 54.63 A
Sulfamethoxazole 200mg+Trimethoprim 40mg/5ml 50ml Susp (Co-trimoxazole)
34,179.48 133,244 0.23 1.00 55.63 AM9
Erythromycin (Base) 200mg/5ml, in 60ml, susp
33,382.76 51,312 0.62 0.97 56.60 A
Sulfamethoxazole 100mg+Trimethoprim 20mg Tab (Co-trimoxazole)
29,644.52 6,194,785 0.01 0.87 57.47 AM9
Aluminium hydroxide 500mg tab 29,637.84 3,452,366 0.00 0.87 58.34 A
Retinol (Vit A) 200,000 IU Cap 29,540.32 1,044,525 0.03 0.86 59.20 AM16
Acetylsalicylic acid (Aspirin) 500mg tab 28,994.10 3,396,794 0.01 0.85 60.04 AM1
Methyldopa 250mg Tab 27,955.37 1,180,594 0.03 0.82 60.86 AM10
Ampicillin 500mg vial 27,896.13 202,544 0.14 0.81 61.68 AM3
Glucose 5% 500ml IV infusion 27,466.81 61,817 0.41 0.80 62.48 A
19

Medicines HMIS Code Total Consumed Value at all HFs in US$
Total Consumed Quantity
Average Unit Pricein US$
% of the Value % of Cumulative Value
Class
Mebendazole 100mg Tab 26,533.97 2,289,498 0.01 0.77 63.25 AM2
Chloramphenicol 250mg Cap 26,456.16 1,314,942 0.02 0.77 64.02 A
Ibuprofen 200mg Tab 26,359.74 4,426,876 0.01 0.77 64.79 A
Silver Sulfadiazine 1% Oint 25,592.63 36,358 0.68 0.75 65.54 A
Ferrous Sulfate 25mg/ml 120ml Drop 25,481.79 64,114 0.26 0.74 66.29 A
Ethinylestradiol 0.03mg+Levonorgestrel 0.15mg Cycle
25,390.86 167,640 0.16 0.74 67.03 AM11
Methylrosaniline (Gentian Violet) 25g Powder
25,157.81 25,116 1.05 0.73 67.76 A
Aluminium hydroxide 120mg+Magnesium trisilicate 250mg tab
25,137.47 8,405,908 0.00 0.73 68.49 A
Ciprofloxacin 250mg Tab 25,121.15 728,531 0.03 0.73 69.23 A
Ibuprofen 400 mg Tab 25,000.13 2,264,898 0.02 0.73 69.96 A
Sulfamethoxazole 400mg+Trimethoprim 80mg 50ml Susp (Co-trimoxazole)
24,956.75 527,750 0.18 0.73 70.69 AM9
Paracetamol 100mg Tab 24,913.26 7,932,078 0.00 0.73 71.41 AM1
Cetrimide 15%+Chlorhexidine gluconate 1.5% topical Sol
24,263.77 10,740 1.97 0.71 72.12 A
Doxycycline 100mg Cap 23,948.93 1,563,491 0.02 0.70 72.82 A
Amoxicillin 125mg/5ml, in 60ml bottle, susp 23,585.31 64,846 0.37 0.69 73.51 AM3
Oxytocine 10IU/ml in 1ml Amp 22,915.68 251,238 0.10 0.67 74.18 AM18
Ceftriaxone 500mg Vial 22,271.05 51,449 0.42 0.65 74.83 A
Zinc Sulfate 20mg Tab 21,873.22 1,455,013 0.02 0.64 75.47 AM15
Aluminium hydroxide 200mg+Magnesium hydroxide 200mg tab
21,392.28 2,808,866 0.01 0.62 76.09 A
20

Medicines HMIS Code Total Consumed Value at all HFs in US$
Total Consumed Quantity
Average Unit Pricein US$
% of the Value % of Cumulative Value
Class
Metronidazole 5mg/ml, in 100ml bottle, infusion Sol
21,377.12 47,955 0.43 0.62 76.72 AM8
Fluoxetine 20mg Cap 20,872.67 506,604 0.03 0.61 77.33 AM21
Ringer lactate 500ml IV infusion 20,780.93 34,668 0.56 0.61 77.93 AH19
Chloramphenicol 1g Vial 20,397.56 62,811 0.34 0.60 78.53 A
Penicillin V Potassium 250mg Tab 19,641.84 631,348 0.03 0.57 79.10 A
Hydrogen Peroxide 25% 500ml topical Solution
19,496.34 111,558 0.17 0.57 79.67 A
21

Class % Of Consumed Value in US$
Number of Medicines Consumed Value in US$
% Of Medicines
Table 3B1. Summary of ABC Analysis for HMIS Indicator Medicines
2Quarter , 1393 (Saratan - Sonbula)
This table indicates the summary of ABC analysis for HMIS indicator medicines. It shows that, out of 133 total HMIS indicator medicines, only 18.80% (25 items) of them accounted for 79% (US$2,122,468) of the total consumed value (Class A items), 17.29% (23 items) accounted for 16% (US$429,309) of the total consumed value (Class B items), and 63.91% (85 items) accounted for only 5.06% (US$136,013) of the total consumed value (Class C items). This information indicates that, among HMIS medicines, these 25 class A items should be closely monitored and managed as they cost most. The next table (Table 3B2) provides details of the ABC analysis by the order of the medicines consumed values.
A 79 25 2,122,46818.80
B 16 23 429,30917.29
C 5 85 136,01363.91
Total 100 133 2,687,790100.00
22

Table 3B2. ABC Analysis for All HMIS Indicator Medicines
2Quarter , 1393 (Saratan - Sonbula)
This table shows the ABC analysis for all HMIS indicator medicines with details by the order of their consumed value and ABC classes. The HMIS code represents the categories of the medicines (M for MIAR, H for HMIR). (The unit prices are rounded to two decimals). The data indicate that amoxicillin 500mg cap alone accounted for 12.20% (US$327,877.98) of the total HMIS medicines’ consumed value. It is followed by ringer lactate 1000ml IV which accounted for 10.40% (US$279,535.50) and co-trimoxazole 480mg tablets for 5.39% (US$144,964.68) of the total HMIS medicines’ consumed value. These three medicines were ranked as the top three consumed HMIS indicator medicines in value.
Medicines HMIS Code Total Conumed Value at all HFs in US$
Total Consumed Quantity
Average Unit Pricein US$
% of the Value % of Cumulative Value
Class
Amoxicillin 500mg Cap 327,877.98 7,828,727 0.04 12.20 12.20 AM3
Ringer lactate 1000ml IV infusion 279,535.50 428,624 0.67 10.40 22.60 AH19
Sulfamethoxazole 400mg+Trimethoprim 80mg Tab (Co-trimoxazole)
144,964.68 12,430,764 0.01 5.39 27.99 AM9
Sodium Chloride 0.9% 1000ml IV infusion (Normal Saline)
126,086.17 207,784 0.62 4.69 32.68 AH21
Amoxicillin 250mg Cap 118,843.11 6,226,962 0.02 4.42 37.11 AM3
Paracetamol 500mg Tab 100,620.66 19,148,890 0.01 3.74 40.85 AM1
Paracetamol 120mg/5ml, 60ml Syr 89,547.64 335,252 0.29 3.33 44.18 AM1
Amoxicillin 250mg/5ml, in 60ml bottle, Susp
88,873.25 174,841 0.49 3.31 47.49 AM3
Oral rehydration salts (ORS , Resomal and low osmolar) 27.9g/Lit
76,590.76 1,088,068 0.06 2.85 50.34 AM14
Ferrous Sulphate 60mg+Folic Acid 0.4mg Tab
75,052.35 11,342,219 0.01 2.79 53.13 AM17
Oral rehydration salts (ORS , Resomal and low osmolar) 20.5g/Lit
74,561.79 1,254,112 0.06 2.77 55.90 AM14
Metronidazole 200mg Tab 66,996.17 6,560,766 0.01 2.49 58.40 AM8
Medroxyprogesterone acetate Depot 150mg/ml, in 1ml vial
60,896.22 136,930 0.51 2.27 60.66 AM12
23

Medicines HMIS Code Total Conumed Value at all HFs in US$
Total Consumed Quantity
Average Unit Pricein US$
% of the Value % of Cumulative Value
Class
Ringer lactate 500ml IV infusion 56,481.57 92,063 0.50 2.10 62.76 AH19
Povidone-Iodine 10% Topical Sol 55,747.15 33,170 1.62 2.07 64.84 AH8
Metronidazole 200mg/5ml, in 100ml bottle, Susp
55,159.60 171,760 0.31 2.05 66.89 AM8
Ampicillin 1g vial 48,831.39 239,823 0.20 1.82 68.71 AM3
Ferrous sulfate 200mg+Folic acid (Vit B9) 0.25mg Tab
38,598.80 9,402,766 0.01 1.44 70.14 AM17
Gentamicin 40mg/ml, 2ml Amp 38,559.47 359,692 0.12 1.43 71.58 AH7
Metronidazole 400mg Tab 37,321.33 2,745,764 0.01 1.39 72.96 AM8
Condom 36,101.20 1,671,563 0.02 1.34 74.31 AM13
Sulfamethoxazole 200mg+Trimethoprim 40mg/5ml 50ml Susp (Co-trimoxazole)
34,179.48 133,244 0.23 1.27 75.58 AM9
Ketamin 50mg/ml 10ml Vial 31,857.34 17,072 1.70 1.19 76.77 AH9
Sulfamethoxazole 100mg+Trimethoprim 20mg Tab (Co-trimoxazole)
29,644.52 6,194,785 0.01 1.10 77.87 AM9
Retinol (Vit A) 200,000 IU Cap 29,540.32 1,044,525 0.03 1.10 78.97 AM16
Acetylsalicylic acid (Aspirin) 500mg tab 28,994.10 3,396,794 0.01 1.08 80.05 BM1
Methyldopa 250mg Tab 27,955.37 1,180,594 0.03 1.04 81.09 BM10
Ampicillin 500mg vial 27,896.13 202,544 0.14 1.04 82.12 BM3
Mebendazole 100mg Tab 26,533.97 2,289,498 0.01 0.99 83.11 BM2
Ethinylestradiol 0.03mg+Levonorgestrel 0.15mg Cycle
25,390.86 167,640 0.16 0.94 84.06 BM11
Sulfamethoxazole 400mg+Trimethoprim 80mg 50ml Susp (Co-trimoxazole)
24,956.75 527,750 0.18 0.93 84.98 BM9
24

Medicines HMIS Code Total Conumed Value at all HFs in US$
Total Consumed Quantity
Average Unit Pricein US$
% of the Value % of Cumulative Value
Class
Paracetamol 100mg Tab 24,913.26 7,932,078 0.00 0.93 85.91 BM1
Amoxicillin 125mg/5ml, in 60ml bottle, susp 23,585.31 64,846 0.37 0.88 86.79 BM3
Oxytocine 10IU/ml in 1ml Amp 22,915.68 251,238 0.10 0.85 87.64 BM18
Zinc Sulfate 20mg Tab 21,873.22 1,455,013 0.02 0.81 88.45 BM15
Metronidazole 5mg/ml, in 100ml bottle, infusion Sol
21,377.12 47,955 0.43 0.80 89.25 BM8
Fluoxetine 20mg Cap 20,872.67 506,604 0.03 0.78 90.03 BM21
Morphine (sulfate,hydrochloride) 10mg/ml, in 1ml Amp
17,250.84 6,401 1.91 0.64 90.67 BH12
Norgestrel 0.03mg Cycle 15,886.71 58,673 0.27 0.59 91.26 BM11
Gentamicin 20mg/ml, 2ml Amp 15,812.62 168,212 0.08 0.59 91.85 BH7
Ethinylestradiol 0.03mg+Norgestrel 0.3mg Cycle
14,874.91 79,151 0.15 0.55 92.40 BM11
Sodium Chloride 0.9% 500ml IV infusion (Normal Saline)
12,629.91 22,262 0.47 0.47 92.87 BH21
Ergometrine 0.2mg Tab 11,500.20 564,060 0.02 0.43 93.30 BH5
Amitriptylline 25mg tab 9,138.41 1,152,048 0.01 0.34 93.64 BM21
Gentamicin 10mg/ml, 2ml Amp 9,004.43 151,981 0.06 0.34 93.97 BH7
Hydralazine 20mg/ml, in 2ml , Amp 8,752.47 17,465 0.88 0.33 94.30 BH14, M10
Rifampicin 150mg+Isoniazid 75mg+Pyrazinamide 400mg+Ethambutol 275mg (RHZE) per Tab
8,647.09 100,981 0.05 0.32 94.62 BM5
Artesunate 100mg+Pyrimethamine 25mg+ Sulfadoxine 500mg Blister
8,546.68 6,554 1.21 0.32 94.94 BH1, M20
25

Medicines HMIS Code Total Conumed Value at all HFs in US$
Total Consumed Quantity
Average Unit Pricein US$
% of the Value % of Cumulative Value
Class
Artesunate 50mg+Pyrimethamine 25mg+Sulfadoxine 500mg Blister
8,480.52 13,003 0.72 0.32 95.26 CH1, M20
Penicillin Benzyl (Peni G crystal) 5MU Vial 8,050.95 30,011 0.23 0.30 95.55 CH3
Magnesium Sulfate 500mg/ml (50%) 10ml Amp
7,612.62 29,374 0.39 0.28 95.84 CH11
Chloroquine 50mg/5ml 60ml Syr 7,384.22 23,051 0.33 0.27 96.11 CM19
Chloroquine 150mg Tab 7,096.27 700,284 0.01 0.26 96.38 CM19
Retinol (Vit A) 100,000 IU Tab 6,769.06 175,548 0.03 0.25 96.63 CM16
Ergometrine 0.2mg/ml, 1ml Amp 6,739.47 80,612 0.09 0.25 96.88 CH5
Salbutamol 0.05mg/ml (50mcg/ml) in 5ml Amp
5,345.86 22,159 0.21 0.20 97.08 CH20
Furosemide 10mg/ml, in 2ml Amp 4,829.57 48,319 0.11 0.18 97.26 CH6, M10
Rifampicin 150mg+Isoniazid 75mg (RH) Tab 4,592.73 119,360 0.01 0.17 97.43 CM5
Atenolol 50mg Tab 4,466.74 341,956 0.01 0.17 97.59 CM10
Naloxone 400mcg/ml (0.4mg/ml) in 1ml Amp
3,974.59 10,091 0.42 0.15 97.74 CH13
Nifedipine 10mg Tab/Cap 3,885.02 148,705 0.03 0.14 97.89 CM10
Quinine dihydrochloride 300mg/ml, in 2ml Amp
3,609.21 7,865 0.34 0.13 98.02 CH17
Lidocaine 2% in 20ml Vial 3,542.03 7,859 0.42 0.13 98.15 CM7
Metronidazole 120mg/5ml, in 100ml bottle, Susp
3,376.91 15,897 0.21 0.13 98.28 CM8
Metronidazole 200mg/5ml, in 60ml bottle, Susp
3,325.17 11,017 0.33 0.12 98.40 CM8
Diazepam 5mg/ml 2ml Amp 3,181.78 36,152 0.09 0.12 98.52 CM6
26

Medicines HMIS Code Total Conumed Value at all HFs in US$
Total Consumed Quantity
Average Unit Pricein US$
% of the Value % of Cumulative Value
Class
Atenolol 100mg Tab 2,313.38 105,552 0.03 0.09 98.61 CM10
Ranitidine 25mg/ml, in 2ml Amp 2,129.54 13,287 0.15 0.08 98.69 CH18
Lidocaine 1% in 2ml Amp 2,091.70 8,105 0.18 0.08 98.76 CM7
Atropine sulfate 1mg/ml, in 1ml Amp 2,038.92 32,308 0.07 0.08 98.84 CH2
Methylergometrine 0.125mg Tab 2,026.45 132,031 0.01 0.08 98.92 CH5
Hydrochlorothiazide 50mg Tab 2,011.61 302,951 0.01 0.07 98.99 CM10
Acetylsalicylic acid (Aspirin) 100mg tab 2,000.45 562,636 0.00 0.07 99.06 CM1
Artesunate 300mg+Pyrimethamine 25mg+Sulfadoxine 1000mg Blister
1,849.03 2,688 0.48 0.07 99.13 CH1, M20
Ampicillin 500mg Tab 1,784.69 44,400 0.04 0.07 99.20 CM3
Acetylsalicylic acid (Aspirin) 300mg tab 1,523.43 165,548 0.01 0.06 99.26 CM1
Artesunate 150mg+Pyrimethamine 25mg+Sulfadoxine 500mg Blister
1,468.25 4,642 0.51 0.05 99.31 CH1, M20
Ethinylestradiol 0.035mg+Norethisterone 1mg Cycle
1,446.10 13,791 0.15 0.05 99.36 CM11
Ferrous sulfate 200mg+Folic acid (Vit B9) 0.5mg Tab
1,243.36 41,850 0.03 0.05 99.41 CM17
Lidocaine 5% 2ml Amp 1,215.75 4,134 0.17 0.05 99.46 CH10
Artesunate 600mg+Pyrimethamine 75mg+ Sulfadoxine 1500mg Blister
1,061.22 1,344 0.47 0.04 99.50 CH1, M20
Phenobarbital 100mg/ml, in 2ml Amp 1,045.48 2,398 0.40 0.04 99.53 CH16
Isoniazid 100mg Tab (INH) 1,017.53 16,132 0.04 0.04 99.57 CM4
Rifampicin 150mg+Isoniazid 75mg+Ethambutol 275mg (RHE) Tab
1,008.61 12,872 0.05 0.04 99.61 CM5
27

Medicines HMIS Code Total Conumed Value at all HFs in US$
Total Consumed Quantity
Average Unit Pricein US$
% of the Value % of Cumulative Value
Class
Retinol (Vit A) 50,000IU Cap 986.93 20,453 0.04 0.04 99.65 CM16
Methylergometrine 0.2mg/ml, 1ml Amp 976.08 14,231 0.06 0.04 99.68 CH5
Magnesium Sulfate 500mg/ml (50%) 20ml Amp
833.07 1,444 0.47 0.03 99.71 CH11
Rifampicin 60mg+Isoniazid 30mg (RH) Tab 701.26 12,854 0.02 0.03 99.74 CM5
Furosemide 20mg Tab 671.96 35,109 0.01 0.03 99.77 CM10
Digoxin 0.25mg/ml 2ml Amp 640.99 2,065 0.19 0.02 99.79 CH4
Norgestrel 0.075mg Cycle 618.09 5,210 0.09 0.02 99.81 CM11
Phenobarbital 200mg/ml, 1ml Amp 562.41 2,046 0.29 0.02 99.83 CH16
Furosemide 40mg Tab 557.87 50,636 0.01 0.02 99.85 CM10
Digoxin 0.25mg Tab 496.02 29,169 0.02 0.02 99.87 CH4
Propranolol 40mg Tab 479.42 47,592 0.01 0.02 99.89 CM10
Rifampicin 60mg+Isoniazid 30mg+Pyrazinamide 150mg (RHZ) Tab
442.05 5,843 0.03 0.02 99.91 CM5
Salbutamol 0.5mg/ml, in 1ml Amp 384.74 2,722 0.16 0.01 99.92 CH20
Phenobarbital 50mg/ml 5ml Amp 261.22 754 0.29 0.01 99.93 CH16
Nifedipine 20mg Tab/Cap 248.15 13,851 0.02 0.01 99.94 CM10
Amitriptylline 10mg tab 188.75 13,500 0.01 0.01 99.95 CM21
Retinol (Vit A) 100,000 IU Amp 183.47 4,112 0.04 0.01 99.95 CM16
Hydrochlorothiazide 25mg Tab 161.57 10,280 0.01 0.01 99.96 CM10
28

Medicines HMIS Code Total Conumed Value at all HFs in US$
Total Consumed Quantity
Average Unit Pricein US$
% of the Value % of Cumulative Value
Class
Paracetamol 100mg/ml, 15ml Drop 124.52 475 0.24 0.00 99.96 CM1
Paracetamol 325mg Tab 120.03 17,170 0.01 0.00 99.97 CM1
Fluoxetine 10mg Tab 115.73 3,010 0.04 0.00 99.97 CM21
Lidocaine 2% in 50ml Vial 104.93 262 0.40 0.00 99.98 CM7
Captopril 25mg Tab 90.29 3,914 0.03 0.00 99.98 CM10
Chloroquine 40mg/ml, in 5ml Amp 87.37 498 0.10 0.00 99.98 CM19
Lidocaine 1% 50ml Vial 82.14 235 0.35 0.00 99.99 CM7
Penicillin Benzyl (Peni G crystal) 1MU Vial 72.42 296 0.12 0.00 99.99 CH3
Spironolactone 100mg Tab 61.15 500 0.12 0.00 99.99 CM10
Pethidine 100mg/ml, 1ml Amp 52.78 1,514 0.01 0.00 99.99 CH15
Chloroquine 250mg Tab 52.52 4,693 0.01 0.00 100.00 CM19
Lidocaine 1% 20ml Vial 46.32 106 0.37 0.00 100.00 CM7
Propranolol 10mg Tab 32.81 1,950 0.01 0.00 100.00 CM10
Rifampicin 300mg Tab 20.97 1,200 0.02 0.00 100.00 CM5
Atropine Sulfate 1% in 5ml bottle, ophthalmic drop
7.07 136 0.06 0.00 100.00 CH2
Chloroquine 100mg Tab 6.41 693 0.01 0.00 100.00 CM19
Atenolol 25mg Tab 3.50 100 0.03 0.00 100.00 CM10
Retinol (Vit A) 25,000IU Cap 0.00 0 0.03 0.00 100.00 CM16
29

Medicines HMIS Code Total Conumed Value at all HFs in US$
Total Consumed Quantity
Average Unit Pricein US$
% of the Value % of Cumulative Value
Class
Zinc Sulfate 10mg Tab 0.00 0 0.00 0.00 100.00 CM15
Hydralazine 50mg Tab 0.00 0 0.00 0.00 100.00 CM10
Isoniazid 300mg Tab (INH) 0.00 0 0.01 0.00 100.00 CM4
Ethinylestradiol 0.05mg+Levonorgestrel 0.25mg Cycle
0.00 0 0.03 0.00 100.00 CM11
Lidocaine 20mg/ml 5ml Amp 0.00 0 0.35 0.00 100.00 CM7
Paracetamol (Acetaminophen) 225mg/3ml, Amp (75mg/ml)
0.00 0 0.10 0.00 100.00 CM1
Metronidazole 250mg Tab 0.00 0 0.01 0.00 100.00 CM8
Pethidine 50mg/ml, 2ml Amp 0.00 0 0.09 0.00 100.00 CH15
Metronidazole 500mg Tab 0.00 0 0.00 0.00 100.00 CM8
Hydralazine 25mg Tab 0.00 0 0.00 0.00 100.00 CM10
Propranolol 20mg Tab 0.00 0 0.01 0.00 100.00 CM10
Mebendazole 500mg Tab 0.00 0 0.00 0.00 100.00 CM2
Metoprolol 1mg/ml, in 5ml Amp 0.00 0 0.14 0.00 100.00 CM10
30

Table 4A. Quarterly Public Expenditures on Medicines per Patient/Client at BPHS/EPHS, by Province
2Quarter , 1393 (Saratan - Sonbula)
This table shows the quarterly public expenditure on medicines per patient/client at the BPHS/EPHS level in the provinces. It was between US$0.04 (Kabul) and US$0.86 (Laghman) with the overall average of US$0.30. This information reveals that quarterly public expenditure on medicines per patient/client at the BPHS/EPHS level is very low. The total number of patients/clients was obtained from HMIS data for the same quarter.
Province Total Patients/clients Value of Medicines Consumed in US$
Average Medicine Expenditure in US$
Badakhshan 557,738 158,187.22 0.28
Badghis 263,542 33,058.26 0.13
Baghlan 473,810 125,366.76 0.26
Balkh 691,469 126,124.59 0.18
Bamyan 324,826 79,292.46 0.24
Dykundi 259,922 125,360.23 0.48
Farah 243,840 68,069.90 0.28
Faryab 486,702 101,920.69 0.21
Ghazni 500,096 119,090.07 0.24
Ghor 353,327 195,548.34 0.55
Helmand 520,351 202,586.07 0.39
Hirat 861,498 94,036.74 0.11
Jawzjan 339,293 55,945.25 0.16
Kabul 1,382,700 53,429.63 0.04
Kandahar 443,092 62,065.06 0.14
Khost 294,844 82,040.63 0.28
Kunar 381,877 228,169.37 0.60
Kunduz 384,199 130,599.81 0.34
Laghman 294,903 254,508.27 0.86
Logar 288,792 60,092.47 0.21
Nangarhar 1,009,581 383,138.01 0.38
Nimroz 101,621 14,908.35 0.15
Nooristan 78,628 48,663.16 0.62
Paktika 212,364 66,614.11 0.31
Paktya 305,242 84,947.21 0.28
Samangan 224,612 40,592.08 0.18
Sar-e-Pul 303,655 79,832.50 0.26
*Definition of "Total Patient/client": total number of new, <5, >5, male and female and revisits of out-patients and in-patients. Source: National Health Management Information System Procedures Manual Section III, Annex 2, Indicator 65. 31

Province Total Patients/clients Value of Medicines Consumed in US$
Average Medicine Expenditure in US$
Takhar 461,484 110,824.85 0.24
Urozgan 270,311 82,264.98 0.30
Wardak 293,959 128,875.31 0.44
Zabul 132,549 28,895.72 0.22
Overall 12,740,827 3,425,048.11 0.30
*Definition of "Total Patient/client": total number of new, <5, >5, male and female and revisits of out-patients and in-patients. Source: National Health Management Information System Procedures Manual Section III, Annex 2, Indicator 65. 32

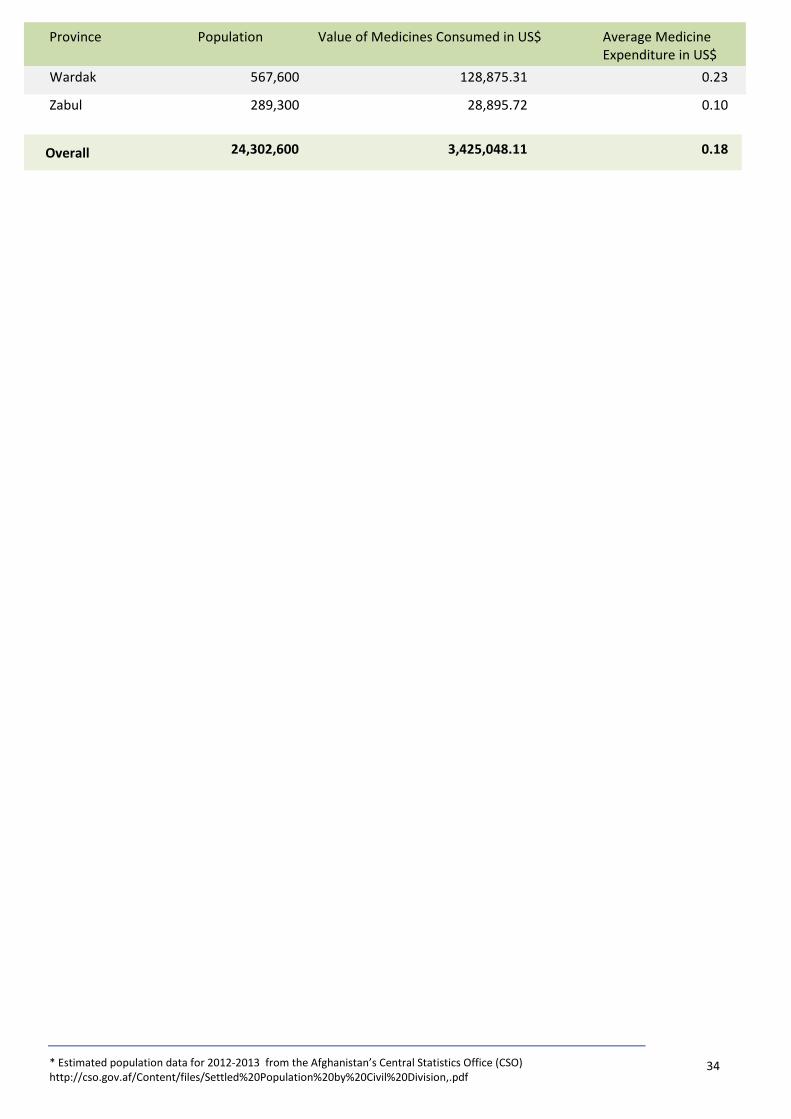
Table 4B. Quarterly Public Expenditures on Medicines per Capita at BPHS/EPHS, by Province
2Quarter , 1393 (Saratan - Sonbula)
This table reflects the quarterly public expenditure on medicines per capita at the BPHS/EPHS level in the provinces. It was between US$0.01(Kabul) and US$0.60 (Laghman). With the overall average of US$0.18. Estimated population data are obtained from the latest update of Afghanistan’s Central Statistics Office.
Province Population Value of Medicines Consumed in US$ Average Medicine Expenditure in US$
Badakhshan 904,700 158,187.22 0.17
Badghis 471,900 33,058.26 0.07
Baghlan 863,700 125,366.76 0.15
Balkh 1,245,100 126,124.59 0.10
Bamyan 425,500 79,292.46 0.19
Dykundi 438,500 125,360.23 0.29
Farah 482,400 68,069.90 0.14
Faryab 948,000 101,920.69 0.11
Ghazni 1,168,800 119,090.07 0.10
Ghor 657,200 195,548.34 0.30
Helmand 879,500 202,586.07 0.23
Hirat 1,780,000 94,036.74 0.05
Jawzjan 512,100 55,945.25 0.11
Kabul 3,950,300 53,429.63 0.01
Kandahar 1,151,100 62,065.06 0.05
Khost 546,800 82,040.63 0.15
Kunar 428,800 228,169.37 0.53
Kunduz 953,800 130,599.81 0.14
Laghman 424,100 254,508.27 0.60
Logar 373,100 60,092.47 0.16
Nangarhar 1,436,000 383,138.01 0.27
Nimroz 156,600 14,908.35 0.10
Nooristan 140,900 48,663.16 0.35
Paktika 413,800 66,614.11 0.16
Paktya 525,000 84,947.21 0.16
Samangan 368,800 40,592.08 0.11
Sar-e-Pul 532,000 79,832.50 0.15
Takhar 933,700 110,824.85 0.12
Urozgan 333,500 82,264.98 0.25
* Estimated population data for 2012-2013 from the Afghanistan’s Central Statistics Office (CSO) http://cso.gov.af/Content/files/Settled%20Population%20by%20Civil%20Division,.pdf
33
Province Population Value of Medicines Consumed in US$ Average Medicine Expenditure in US$
Wardak 567,600 128,875.31 0.23
Zabul 289,300 28,895.72 0.10
Overall 24,302,600 3,425,048.11 0.18
* Estimated population data for 2012-2013 from the Afghanistan’s Central Statistics Office (CSO) http://cso.gov.af/Content/files/Settled%20Population%20by%20Civil%20Division,.pdf
34

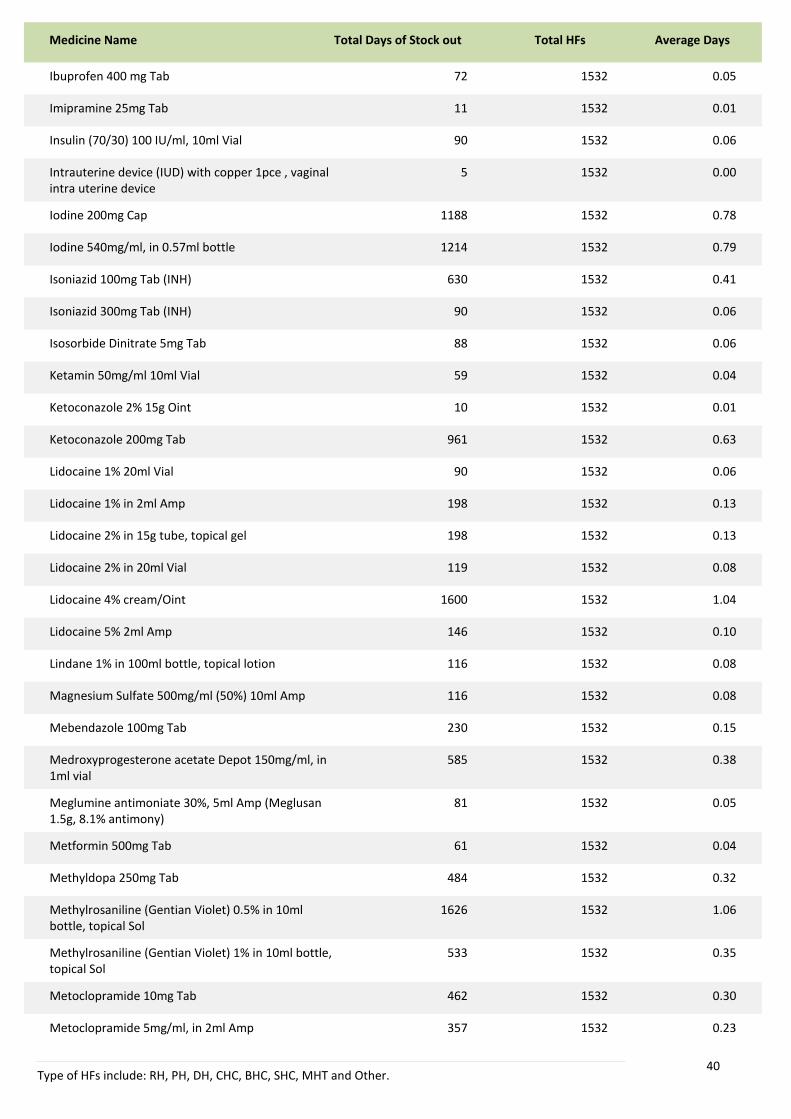
Table 5A. Average HF Days of Stock-out for Each Medicine 2Quarter , 1393 (Saratan -Sonbula)
This table shows the average days of stock-out of each medicine among health facilities. The current version of PLIS is not able to provide the exact number of days of medicine stock-outs within HFs. This table is to provide highlights of the general extent of stock-out of the medicines within HFs.
Medicine Name Total Days of Stock out Total HFs Average Days
Acetylsalicylic acid (Aspirin) 100mg tab 951 1532 0.62
Acetylsalicylic acid (Aspirin) 300mg tab 90 1532 0.06
Acetylsalicylic acid (Aspirin) 500mg tab 1120 1532 0.73
Activated charcoal 125mg tab 67 1532 0.04
Activated charcoal 250mg tab 672 1532 0.44
Adrenalin 0.0005%+Lidocaine 2% in 50ml vial 425 1532 0.28
Adrenalin 0.00125%+Lidocaine dental 1% Amp 290 1532 0.19
Adrenalin 1:200,000 (0.0005%)+Lidocaine 1% Amp 462 1532 0.30
Albendazole 200mg tab 78 1532 0.05
Albendazole 400mg tab 168 1532 0.11
Alcuronium Injection, 5mg/ml in 2ml Amp 390 1532 0.25
Alprazolam 0.5mg tab 78 1532 0.05
Aluminium hydroxide 200mg+Magnesium hydroxide 200mg tab
548 1532 0.36
Aluminium hydroxide 225mg+Magnesium hydroxide 200mg/5ml, 200ml/bottle, susp
2661 1532 1.74
Aluminium hydroxide 500mg tab 1041 1532 0.68
Aminophylline 100mg tab 904 1532 0.59
Aminophylline 25mg/ml, in 10ml Amp 513 1532 0.33
Amitriptylline 25mg tab 476 1532 0.31
Amoxicillin 125mg/5ml, in 60ml bottle, susp 427 1532 0.28
Amoxicillin 250mg Cap 482 1532 0.31
Amoxicillin 250mg/5ml, in 60ml bottle, Susp 302 1532 0.20
Amoxicillin 500mg Cap 632 1532 0.41
Ampicillin 1g vial 1599 1532 1.04
Ampicillin 500mg vial 1487 1532 0.97
Antihaemorrhoidal 30g Oint 90 1532 0.06
Type of HFs include: RH, PH, DH, CHC, BHC, SHC, MHT and Other.35

Medicine Name Total Days of Stock out Total HFs Average Days
Antitetanus Immunoglobulin 1500IU/1ml, in 1ml Amp
197 1532 0.13
Artemether 20mg/ml, 1ml Amp 1020 1532 0.67
Artemether 80mg/ml, 1ml, Amp 380 1532 0.25
Artesunate 150mg+Pyrimethamine 25mg+Sulfadoxine 500mg Blister
367 1532 0.24
Artesunate 300mg+Pyrimethamine 25mg+Sulfadoxine 1000mg Blister
585 1532 0.38
Artesunate 50mg+Pyrimethamine 25mg+Sulfadoxine 500mg Blister
154 1532 0.10
Artesunate 600mg+Pyrimethamine 75mg+ Sulfadoxine 1500mg Blister
1043 1532 0.68
Atenolol 100mg Tab 431 1532 0.28
Atenolol 50mg Tab 416 1532 0.27
Atropine sulfate 1mg/ml, in 1ml Amp 140 1532 0.09
Bacitracin 500IU+Neomycin 5mg/g, 15g topical Oint 23 1532 0.02
Benzoic Acid 6%+Salicylic acid 3% topical Oint 1099 1532 0.72
Benzyl benzoate 25% in 60ml bottle, topical lotion 90 1532 0.06
Betamethasone 0.1%+Neomycine 0.5% in 10ml bottle, ophthalmic drop
263 1532 0.17
Biperiden 2mg Tab 78 1532 0.05
Bisacodyl 5mg Tab 357 1532 0.23
Bupivacaine 0.5% in 10ml Amp 90 1532 0.06
Bupivacaine 0.5% in 20ml Amp 90 1532 0.06
Bupivacaine 5mg/ml, 4ml Amp 30 1532 0.02
Calamine (ZnO + Fe2O3) 8% in 60ml bottle, topical lotion
90 1532 0.06
Calcium Gluconate 10% 10ml Amp 406 1532 0.27
Calcium Lactate 300mg Tab 90 1532 0.06
Captopril 25mg Tab 90 1532 0.06
Carbamazepine 200mg Tab 93 1532 0.06
Ceftriaxone 1g Vial 120 1532 0.08
Ceftriaxone 500mg Vial 125 1532 0.08
Cetrimide 15%+Chlorhexidine gluconate 1.5% topical Sol
323 1532 0.21
Type of HFs include: RH, PH, DH, CHC, BHC, SHC, MHT and Other.36

Medicine Name Total Days of Stock out Total HFs Average Days
Chloramphenicol 0.5% in 2.5ml bottle, ophthalmic drop
90 1532 0.06
Chloramphenicol 1%, 3.5g eye Oint 90 1532 0.06
Chloramphenicol 125mg/5ml 100ml Bottle Susp 649 1532 0.42
Chloramphenicol 1g Vial 848 1532 0.55
Chloramphenicol 250mg Cap 959 1532 0.63
Chlorhexidine Digluconate 5% Topical Sol 1742 1532 1.14
Chloroquine 100mg Tab 90 1532 0.06
Chloroquine 150mg Tab 121 1532 0.08
Chloroquine 40mg/ml, in 5ml Amp 90 1532 0.06
Chloroquine 50mg/5ml 60ml Syr 169 1532 0.11
Chloroxylenol 4.8% , topical Sol 90 1532 0.06
Chlorphenamine maleate 10mg/ml , in 1ml Amp 247 1532 0.16
Chlorphenamine maleate 4mg Tab 267 1532 0.17
Chlorpromazine 100mg Tab 648 1532 0.42
Chlorpromazine 25mg/ml, 2ml Amp 1112 1532 0.73
Chlorpromazine 50mg/ml, 2ml Amp 28 1532 0.02
Cimetidine 100mg/ml 2ml Amp 90 1532 0.06
Cimetidine 200mg Tab 90 1532 0.06
Ciprofloxacin 250mg Tab 171 1532 0.11
Ciprofloxacin 500mg Tab 213 1532 0.14
Cloxacillin 250mg Cap 88 1532 0.06
Cloxacillin 500mg Cap 141 1532 0.09
Cloxacillin 500mg Vial 56 1532 0.04
Condom 291 1532 0.19
Dexamethasone 4mg /ml 1ml Amp 30 1532 0.02
Diazepam 10mg Tab 486 1532 0.32
Diazepam 5mg Tab 362 1532 0.24
Diazepam 5mg/ml 2ml Amp 848 1532 0.55
Diclofenac 25mg/ml 3ml Amp 391 1532 0.26
Diclofenac 75mg Tab 90 1532 0.06
Type of HFs include: RH, PH, DH, CHC, BHC, SHC, MHT and Other.37

Medicine Name Total Days of Stock out Total HFs Average Days
Diethylcarbamazine citrate 50mg Tab 168 1532 0.11
Digoxin 0.25mg/ml 2ml Amp 10 1532 0.01
Diphenhydramine chloride 5mg/5ml, 60ml, Syr 90 1532 0.06
Dopamine 40mg/ml 5ml Amp 90 1532 0.06
Doxycycline 100mg Cap 627 1532 0.41
Ephedrine Hcl 3mg/ml, in 10ml , Amp 110 1532 0.07
Epinephrine (Adrenaline) 0.1% in 1ml Amp 720 1532 0.47
Ergometrine 0.2mg Tab 563 1532 0.37
Ergometrine 0.2mg/ml, 1ml Amp 497 1532 0.32
Erythromycin (Base) 200mg/5ml, in 60ml, susp 181 1532 0.12
Erythromycin (Ethyl Succinate) 100mg/ml 100ml Susp
845 1532 0.55
Erythromycin Stearate 250mg Tab 28 1532 0.02
Erythromycin Stearate 500mg Tab 90 1532 0.06
Ethambutol (EMB) 400mg Tab 1347 1532 0.88
Ethambutol 400mg+Isoniazid 150mg Tab (EH) 842 1532 0.55
Ethanol 70% topical solution 90 1532 0.06
Ethinylestradiol 0.035mg+Norethisterone 1mg Cycle 4532 1532 2.96
Ethinylestradiol 0.03mg+Levonorgestrel 0.15mg Cycle
253 1532 0.17
Ethinylestradiol 0.03mg+Norgestrel 0.3mg Cycle 90 1532 0.06
Ethinylestradiol 0.05mg+Levonorgestrel 0.25mg Cycle
4584 1532 2.99
Ferrous Sulfate 25mg/ml 120ml Drop 1223 1532 0.80
Ferrous Sulfate 60mg Tab 685 1532 0.45
Ferrous Sulphate 200mg Tab 760 1532 0.50
Ferrous Sulphate 60mg+Folic Acid 0.4mg Tab 1025 1532 0.67
Fluphenazine 25mg/ml, 1ml Amp 78 1532 0.05
Folic Acid 1mg Tab 261 1532 0.17
Folic Acid 5mg Tab 284 1532 0.19
Furosemide 10mg/ml, in 2ml Amp 37 1532 0.02
Furosemide 20mg Tab 273 1532 0.18
Type of HFs include: RH, PH, DH, CHC, BHC, SHC, MHT and Other.38

Medicine Name Total Days of Stock out Total HFs Average Days
Furosemide 40mg Tab 335 1532 0.22
Gentamicin 10mg/ml, 2ml Amp 654 1532 0.43
Gentamicin 40mg/ml, 2ml Amp 1100 1532 0.72
Glibenclamide 5mg Tab 436 1532 0.28
Glocuse 2.5% + Sodium chloride 0.45% 1000ml 90 1532 0.06
Glucose 10% 500ml IV infusion 784 1532 0.51
Glucose 4%+Sodium Chloride 0.18% 500ml IV infusion
1532 1532 1.00
Glucose 5% 1000ml IV infusion 533 1532 0.35
Glucose 5% 500ml IV infusion 575 1532 0.38
Glucose 5%+Sodium Chloride 0.9% 1000ml IV infusion
500 1532 0.33
Glucose 5%+Sodium Chloride 0.9% 500ml IV infusion 317 1532 0.21
Glucose 50% 50ml IV 715 1532 0.47
Glucose 7.5%+Lidocaine 5% (Lidocaine Spinal) 2ml Amp
60 1532 0.04
Glyceryl trinitrate (Nitroglycerine) 0.5mg per tablet, sublingual-oral tablet
90 1532 0.06
Griseofulvin 125mg Tab 380 1532 0.25
Haloperidol 5mg Tab 55 1532 0.04
Haloperidol 5mg/ml, 1ml Amp 212 1532 0.14
Halothane 250ml Inhaler 90 1532 0.06
Heparin 25000IU/ml 1ml Amp 120 1532 0.08
Hydralazine 20mg/ml, in 2ml , Amp 244 1532 0.16
Hydralazine 25mg Tab 90 1532 0.06
Hydralazine 50mg Tab 90 1532 0.06
Hydrochlorothiazide 25mg Tab 90 1532 0.06
Hydrochlorothiazide 50mg Tab 392 1532 0.26
Hydrocortisone Acetate 1% 15g Oint 90 1532 0.06
Hydrocortisone Sodium Succinate 100mg Vial 266 1532 0.17
Hydrogen peroxide 6% topical Solution 56 1532 0.04
Hyoscine (butylbromide,hydrobromide) 10mg Tab 138 1532 0.09
Ibuprofen 200mg Tab 649 1532 0.42
Type of HFs include: RH, PH, DH, CHC, BHC, SHC, MHT and Other.39
Medicine Name Total Days of Stock out Total HFs Average Days
Ibuprofen 400 mg Tab 72 1532 0.05
Imipramine 25mg Tab 11 1532 0.01
Insulin (70/30) 100 IU/ml, 10ml Vial 90 1532 0.06
Intrauterine device (IUD) with copper 1pce , vaginal intra uterine device
5 1532 0.00
Iodine 200mg Cap 1188 1532 0.78
Iodine 540mg/ml, in 0.57ml bottle 1214 1532 0.79
Isoniazid 100mg Tab (INH) 630 1532 0.41
Isoniazid 300mg Tab (INH) 90 1532 0.06
Isosorbide Dinitrate 5mg Tab 88 1532 0.06
Ketamin 50mg/ml 10ml Vial 59 1532 0.04
Ketoconazole 2% 15g Oint 10 1532 0.01
Ketoconazole 200mg Tab 961 1532 0.63
Lidocaine 1% 20ml Vial 90 1532 0.06
Lidocaine 1% in 2ml Amp 198 1532 0.13
Lidocaine 2% in 15g tube, topical gel 198 1532 0.13
Lidocaine 2% in 20ml Vial 119 1532 0.08
Lidocaine 4% cream/Oint 1600 1532 1.04
Lidocaine 5% 2ml Amp 146 1532 0.10
Lindane 1% in 100ml bottle, topical lotion 116 1532 0.08
Magnesium Sulfate 500mg/ml (50%) 10ml Amp 116 1532 0.08
Mebendazole 100mg Tab 230 1532 0.15
Medroxyprogesterone acetate Depot 150mg/ml, in 1ml vial
585 1532 0.38
Meglumine antimoniate 30%, 5ml Amp (Meglusan 1.5g, 8.1% antimony)
81 1532 0.05
Metformin 500mg Tab 61 1532 0.04
Methyldopa 250mg Tab 484 1532 0.32
Methylrosaniline (Gentian Violet) 0.5% in 10ml bottle, topical Sol
1626 1532 1.06
Methylrosaniline (Gentian Violet) 1% in 10ml bottle, topical Sol
533 1532 0.35
Metoclopramide 10mg Tab 462 1532 0.30
Metoclopramide 5mg/ml, in 2ml Amp 357 1532 0.23
Type of HFs include: RH, PH, DH, CHC, BHC, SHC, MHT and Other.40

Medicine Name Total Days of Stock out Total HFs Average Days
Metronidazole 200mg Tab 553 1532 0.36
Metronidazole 200mg/5ml, in 100ml bottle, Susp 934 1532 0.61
Metronidazole 400mg Tab 735 1532 0.48
Metronidazole 5mg/ml, in 100ml bottle, infusion Sol 210 1532 0.14
Miconazole 2% in 30g , topical Oint 90 1532 0.06
Misoprostol 200mcg Tab 56 1532 0.04
Morphine (sulfate,hydrochloride) 10mg/ml, in 1ml Amp
53 1532 0.03
Multivitamin Tab 1053 1532 0.69
Naloxone 400mcg/ml (0.4mg/ml) in 1ml Amp 30 1532 0.02
Neostigmine methylsulfate 0.5mg/ml, in 10ml Amp 5 1532 0.00
Nifedipine 10mg Tab/Cap 324 1532 0.21
Nitrofurantoin 100mg Tab/Cap 752 1532 0.49
Norethindrone 0.35mg (Progestin-Only Pills or Mini-Pills)
4621 1532 3.02
Norgestrel 0.03mg Cycle 138 1532 0.09
Norgestrel 0.075mg Cycle 90 1532 0.06
Nystatin 100,000IU 15g Vaginal Oint 834 1532 0.54
Nystatin 100,000IU 30ml Oral Topical Drop 911 1532 0.59
Nystatin 100,000IU Oral Tab 1360 1532 0.89
Nystatin 100,000IU Vaginal Tab/ovule suppository 243 1532 0.16
Nystatin 500,000IU Tab, oral 552 1532 0.36
Omeprazole 20mg Cap 232 1532 0.15
Oral rehydration salts (ORS , Resomal and low osmolar) 20.5g/Lit
221 1532 0.14
Oral rehydration salts (ORS , Resomal and low osmolar) 27.9g/Lit
90 1532 0.06
Oxytocine 10IU/ml in 1ml Amp 197 1532 0.13
Pancuronium Bromide (Pavulon) 2mg/ml, 2ml Amp 90 1532 0.06
Paracetamol 100mg Tab 806 1532 0.53
Paracetamol 120mg/5ml, 60ml Syr 510 1532 0.33
Paracetamol 500mg Tab 287 1532 0.19
Paraffin liquid in 10ml oral 90 1532 0.06
Type of HFs include: RH, PH, DH, CHC, BHC, SHC, MHT and Other.41

Medicine Name Total Days of Stock out Total HFs Average Days
Penicillin Benzyl (Peni G crystal) 1MU Vial 260 1532 0.17
Penicillin Benzyl (Peni G crystal) 5MU Vial 290 1532 0.19
Penicillin Benzyl Benzathine 1.2MU Vial 256 1532 0.17
Penicillin Benzyl Benzathine 2.4MU Vial 197 1532 0.13
Penicillin Benzyl Procaine 2MU Vial 956 1532 0.62
Penicillin Benzyl Procaine 4MU Vial 599 1532 0.39
Penicillin V Potassium 250mg Tab 552 1532 0.36
Penicillin V Potassium 500mg Tab 1268 1532 0.83
Penicillin V(Phenoxy methyl Penicillin) 125mg/5ml, in 100ml bottle, Susp
180 1532 0.12
Penicillin V(Phenoxy methyl Penicillin) 250mg/5ml, in 100ml bottle, Susp
776 1532 0.51
Pethidine 100mg Tab 78 1532 0.05
Pethidine 100mg/ml, 1ml Amp 180 1532 0.12
Pethidine 50mg Tab 78 1532 0.05
Pethidine 50mg/ml, 2ml Amp 78 1532 0.05
Phenobarbital 100mg Tab 1040 1532 0.68
Phenobarbital 15mg Tab 378 1532 0.25
Phenobarbital 50mg/ml 5ml Amp 78 1532 0.05
Phytomenadione (Vit K) 10mg Tab 45 1532 0.03
Phytomenadione (Vit K) 10mg/2ml, Amp 71 1532 0.05
Phytomenadione (Vit K) 10mg/ml, 5ml Amp (50mg/5ml)
439 1532 0.29
Potassium Chloride 10% 10ml Amp 90 1532 0.06
Potassium Chloride 11.2% 20ml Amp 294 1532 0.19
Povidone-Iodine 10% Topical Sol 232 1532 0.15
Precipitated Sulfur Powder 90 1532 0.06
Prednisolone 5mg Tab 355 1532 0.23
Primaquine 15mg Tab 378 1532 0.25
Propofol 10mg/ml 20ml Infusion Sol 90 1532 0.06
Propranolol 10mg Tab 696 1532 0.45
Propranolol 40mg Tab 700 1532 0.46
Type of HFs include: RH, PH, DH, CHC, BHC, SHC, MHT and Other.42

Medicine Name Total Days of Stock out Total HFs Average Days
Protamine Sulfate 10mg/ml 5ml Amp 78 1532 0.05
Pyrazinamide (PZA) 500mg Tab 4571 1532 2.98
Pyrimethamine 25mg+Sulfadoxine 500mg Tab 90 1532 0.06
Quinine dihydrochloride 300mg/ml, in 2ml Amp 159 1532 0.10
Quinine Sulfate 300mg Tab 785 1532 0.51
Ranitidine 150mg Tab 710 1532 0.46
Ranitidine 25mg/ml, in 2ml Amp 90 1532 0.06
Ranitidine 300mg Tab 380 1532 0.25
Retinol (Vit A) 100,000 IU Amp 683 1532 0.45
Retinol (Vit A) 100,000 IU Tab 91 1532 0.06
Retinol (Vit A) 200,000 IU Cap 63731 1532 41.60
Retinol (Vit A) 50,000IU Cap 90 1532 0.06
Rifampicin 150mg+Isoniazid 75mg (RH) Tab 1351 1532 0.88
Rifampicin 150mg+Isoniazid 75mg+Ethambutol 275mg (RHE) Tab
787 1532 0.51
Rifampicin 150mg+Isoniazid 75mg+Pyrazinamide 400mg+Ethambutol 275mg (RHZE) per Tab
395 1532 0.26
Rifampicin 60mg+Isoniazid 30mg (RH) Tab 743 1532 0.48
Rifampicin 60mg+Isoniazid 30mg+Pyrazinamide 150mg (RHZ) Tab
1253 1532 0.82
Ringer lactate 1000ml IV infusion 563 1532 0.37
Ringer lactate 500ml IV infusion 793 1532 0.52
Salbutamol 0.05mg/ml (50mcg/ml) in 5ml Amp 872 1532 0.57
Salbutamol 0.1mg/dose 200 dose Bottle Inhalation Sol
224 1532 0.15
Salbutamol 0.5mg/ml, in 1ml Amp 5 1532 0.00
Salbutamol 2mg Tab 90 1532 0.06
Salbutamol 2mg/5ml, in 60ml bottle, Syr 589 1532 0.38
Salbutamol 4mg Tab 357 1532 0.23
Salbutamol 5mg/ml in 30ml Inhalation Sol 186 1532 0.12
Salicylic Acid 5% Oint 78 1532 0.05
Silver sulfadiazine 1% in 250g container, topical cream
10 1532 0.01
Silver Sulfadiazine 1% Oint 312 1532 0.20
Type of HFs include: RH, PH, DH, CHC, BHC, SHC, MHT and Other.43

Medicine Name Total Days of Stock out Total HFs Average Days
Sodium Bicarbonate 8.4% 10ml Amp 466 1532 0.30
Sodium Chloride 0.9% 1000ml IV infusion (Normal Saline)
277 1532 0.18
Sodium Chloride 0.9% 500ml IV infusion (Normal Saline)
90 1532 0.06
Sodium Citrate Powder 90 1532 0.06
Sodium Stibogluconate 100mg/ml, 30ml Vial 670 1532 0.44
Streptomycin 1g Vial 455 1532 0.30
Sulfamethoxazole 100mg+Trimethoprim 20mg Tab (Co-trimoxazole)
469 1532 0.31
Sulfamethoxazole 200mg+Trimethoprim 40mg/5ml 50ml Susp (Co-trimoxazole)
705 1532 0.46
Sulfamethoxazole 400mg+Trimethoprim 80mg 50ml Susp (Co-trimoxazole)
90 1532 0.06
Sulfamethoxazole 400mg+Trimethoprim 80mg Tab (Co-trimoxazole)
823 1532 0.54
Tetracaine 0.5% 15ml Eye Drop 756 1532 0.49
Tetracycline Eye 1% Oint 354 1532 0.23
Thiopental Sodium 1g Vial 65 1532 0.04
Thiopental Sodium 500mg Vial 90 1532 0.06
Thioridazine 25mg Tab 26 1532 0.02
Tramadol 100mg/2ml, Amp 21 1532 0.01
Tramadol 50mg/ml, in 2ml Amp 50 1532 0.03
Trihexyphenidyl 2mg Tab 180 1532 0.12
Tuberculin Purified 10IU/ml, in 1ml Amp 78 1532 0.05
Valproic Acid (Sodium valproate) 200mg Tab 264 1532 0.17
Water for Injection 10ml Amp 1499 1532 0.98
Water for Injection 5ml Amp 233 1532 0.15
Zinc Oxide 10% 20g Oint 90 1532 0.06
Zinc Oxide 20% 20g Oint 78 1532 0.05
Zinc Sulfate 20mg Tab 1266 1532 0.83
Type of HFs include: RH, PH, DH, CHC, BHC, SHC, MHT and Other.44

Table 6. The Summary of the Overall Volume Indicators for HMIS Indicator Medicines
2Quarter ,1393 (Saratan - Sonbula)
This table shows the summary of overall quantities (volume indicators) flow between the three levels of supply chain for HMIS indicator medicines. The data reveals that paracetamol 500mg tab had the highest consumed quantity (19,148,890 tabs) in the reporting quarter.
Medicines Beginning Stock Added Stock Grand Total Available
Donated Out Consumed quantity Reported Wastage Reported Ending Stock
Acetylsalicylic acid (Aspirin) 100mg tab 1,563,930 429,740 1,993,670 0 562,636 26 1,225,771
Acetylsalicylic acid (Aspirin) 300mg tab 767,285 70,200 837,485 0 165,548 0 370,575
Acetylsalicylic acid (Aspirin) 500mg tab 5,130,974 3,483,540 8,614,514 0 3,396,794 8,593 5,504,487
Amitriptylline 10mg tab 17,600 0 17,600 0 13,500 0 4,100
Amitriptylline 25mg tab 3,900,503 777,488 4,677,991 0 1,152,048 1,140 3,144,929
Amoxicillin 125mg/5ml, in 60ml bottle, susp 200,445 15,377 215,822 0 64,846 2 142,858
Amoxicillin 250mg Cap 10,747,201 6,539,060 17,286,261 9,000 6,226,962 600 10,698,172
Amoxicillin 250mg/5ml, in 60ml bottle, Susp 188,484 199,218 387,702 0 174,841 56 240,438
Amoxicillin 500mg Cap 9,589,428 8,169,117 17,758,545 0 7,828,727 415 9,656,281
Ampicillin 1g vial 353,221 213,014 566,235 670 239,823 0 345,999
Ampicillin 500mg Tab 21,100 29,300 50,400 0 44,400 0 6,000
Ampicillin 500mg vial 353,180 181,454 534,634 0 202,544 1 344,039
Artesunate 100mg+Pyrimethamine 25mg+ Sulfadoxine 500mg Blister
12,193 1,535 13,728 0 1,955 1,179 11,466
Artesunate 150mg+Pyrimethamine 25mg+Sulfadoxine 500mg Blister
5,358 810 6,168 0 742 124 5,094
Artesunate 300mg+Pyrimethamine 25mg+Sulfadoxine 1000mg Blister
2,926 560 3,486 0 152 469 2,864
Artesunate 50mg+Pyrimethamine 25mg+Sulfadoxine 500mg Blister
52,531 1,057 53,588 0 5,069 242 49,761
Artesunate 600mg+Pyrimethamine 75mg+ Sulfadoxine 1500mg Blister
36,892 50 36,942 0 508 468 35,972
Atenolol 100mg Tab 239,406 41,020 280,426 0 105,552 0 170,464
45

Medicines Beginning Stock Added Stock Grand Total Available
Donated Out Consumed quantity Reported Wastage Reported Ending Stock
Atenolol 25mg Tab 612 3,000 3,612 0 100 0 700
Atenolol 50mg Tab 667,123 303,732 970,855 504 341,956 730 618,311
Atropine Sulfate 1% in 5ml bottle, ophthalmic drop 0 0 0 0 0 0 0
Atropine sulfate 1mg/ml, in 1ml Amp 30,414 8,848 39,262 0 10,200 46 29,864
Captopril 25mg Tab 11,813 20,000 31,813 0 3,914 0 8,679
Chloroquine 100mg Tab 15,800 0 15,800 0 693 0 16,457
Chloroquine 150mg Tab 2,716,813 607,580 3,324,393 0 700,284 6,665 2,548,041
Chloroquine 250mg Tab 27,743 0 27,743 0 4,693 0 24,050
Chloroquine 40mg/ml, in 5ml Amp 1,186 0 1,186 0 498 0 695
Chloroquine 50mg/5ml 60ml Syr 141,709 15,771 157,480 0 23,051 516 124,825
Chloroquine Phosphate 300mg Tab 0 0 0 0 0 0 0
Condom 3,034,715 2,139,573 5,174,288 0 1,671,563 1,373 2,833,087
Diazepam 5mg/ml 2ml Amp 68,587 30,078 98,665 0 36,152 173 62,435
Digoxin 0.25mg Tab 63,167 7,600 70,767 0 7,876 12,270 46,616
Digoxin 0.25mg/ml 2ml Amp 5,606 430 6,036 0 695 90 6,151
Ergometrine 0.2mg Tab 1,015,178 128,616 1,143,794 10,000 188,557 1,960 977,681
Ergometrine 0.2mg/ml, 1ml Amp 87,773 20,159 107,932 0 29,367 1,177 78,985
Ethinylestradiol 0.035mg+Norethisterone 1mg Cycle 236,390 0 236,390 0 13,791 0 222,599
Ethinylestradiol 0.03mg+Levonorgestrel 0.15mg Cycle
645,917 149,548 795,465 0 167,640 109 624,184
Ethinylestradiol 0.03mg+Norgestrel 0.3mg Cycle 240,059 42,131 282,190 0 79,151 3,652 207,973
Ethinylestradiol 0.05mg+Levonorgestrel 0.25mg Cycle
0 0 0 0 0 0 0
Ferrous sulfate 200mg+Folic acid (Vit B9) 0.25mg Tab 13,674,189 7,536,800 21,210,989 0 9,402,766 6,304 13,206,601
Ferrous sulfate 200mg+Folic acid (Vit B9) 0.5mg Tab 119,525 101,000 220,525 0 41,850 0 178,675
46

Medicines Beginning Stock Added Stock Grand Total Available
Donated Out Consumed quantity Reported Wastage Reported Ending Stock
Ferrous Sulphate 60mg+Folic Acid 0.4mg Tab 20,094,667 18,067,953 38,162,620 915,600 11,342,219 0 18,848,554
Fluoxetine 10mg Tab 4,430 0 4,430 0 3,010 0 1,420
Fluoxetine 20mg Cap 1,572,107 268,510 1,840,617 0 506,604 0 1,297,382
Furosemide 10mg/ml, in 2ml Amp 64,153 4,853 69,006 50 14,940 30 51,842
Furosemide 20mg Tab 191,908 15,400 207,308 0 35,109 0 163,249
Furosemide 40mg Tab 265,417 41,740 307,157 0 50,636 1,500 206,803
Gentamicin 10mg/ml, 2ml Amp 66,171 35,617 101,788 0 46,456 0 59,913
Gentamicin 20mg/ml, 2ml Amp 169,743 52,720 222,463 0 51,827 0 168,490
Gentamicin 40mg/ml, 2ml Amp 212,885 102,851 315,736 0 107,402 274 215,089
Hydralazine 20mg/ml, in 2ml , Amp 20,373 1,499 21,872 140 3,481 0 20,847
Hydralazine 25mg Tab 0 0 0 0 0 0 0
Hydralazine 50mg Tab 0 0 0 0 0 0 0
Hydrochlorothiazide 25mg Tab 34,104 9,960 44,064 0 10,280 0 17,567
Hydrochlorothiazide 50mg Tab 1,090,010 407,752 1,497,762 0 302,951 0 1,249,718
Isoniazid 100mg Tab (INH) 60,572 42,964 103,536 5,366 16,132 3,800 64,528
Isoniazid 300mg Tab (INH) 0 0 0 0 0 0 0
Ketamin 50mg/ml 10ml Vial 17,367 3,391 20,758 0 5,112 368 16,812
Lidocaine 1% 20ml Vial 347 0 347 0 106 0 241
Lidocaine 1% 50ml Vial 589 716 1,305 0 235 0 0
Lidocaine 1% in 2ml Amp 26,124 520 26,644 0 8,105 0 17,957
Lidocaine 2% in 20ml Vial 18,195 7,566 25,761 594 7,859 128 17,074
Lidocaine 2% in 50ml Vial 3,908 0 3,908 0 262 0 3,264
Lidocaine 20mg/ml 5ml Amp 0 0 0 0 0 0 0
47

Medicines Beginning Stock Added Stock Grand Total Available
Donated Out Consumed quantity Reported Wastage Reported Ending Stock
Lidocaine 5% 2ml Amp 2,246 1,980 4,226 0 600 280 1,957
Magnesium Sulfate 500mg/ml (50%) 10ml Amp 48,464 6,473 54,937 0 12,560 35 54,260
Magnesium Sulfate 500mg/ml (50%) 20ml Amp 3,815 1,490 5,305 0 503 61 4,880
Mebendazole 100mg Tab 4,239,970 2,041,674 6,281,644 70,210 2,289,498 3,384 3,866,098
Mebendazole 500mg Tab 0 0 0 0 0 0 15,000
Medroxyprogesterone acetate Depot 150mg/ml, in 1ml vial
748,082 64,738 812,820 0 136,930 2,632 667,001
Methyldopa 250mg Tab 1,938,106 1,030,880 2,968,986 0 1,180,594 0 1,787,035
Methylergometrine 0.125mg Tab 127,338 100,100 227,438 0 28,079 790 121,195
Methylergometrine 0.2mg/ml, 1ml Amp 5,235 5,220 10,455 0 3,142 72 9,560
Metoprolol 1mg/ml, in 5ml Amp 0 0 0 0 0 0 0
Metronidazole 120mg/5ml, in 100ml bottle, Susp 17,201 33,950 51,151 0 15,897 0 26,151
Metronidazole 200mg Tab 9,539,744 5,068,442 14,608,186 0 6,560,766 0 8,494,052
Metronidazole 200mg/5ml, in 100ml bottle, Susp 260,927 168,982 429,909 0 171,760 0 275,980
Metronidazole 200mg/5ml, in 60ml bottle, Susp 19,612 4,000 23,612 0 11,017 0 13,411
Metronidazole 250mg Tab 686,000 106,000 792,000 0 0 0 99,400
Metronidazole 400mg Tab 6,654,119 2,221,400 8,875,519 0 2,745,764 0 5,293,120
Metronidazole 500mg Tab 0 0 0 0 0 0 0
Metronidazole 5mg/ml, in 100ml bottle, infusion Sol 50,283 33,463 83,746 300 47,955 723 59,619
Morphine (sulfate,hydrochloride) 10mg/ml, in 1ml Amp
8,140 1,137 9,277 0 2,680 18 6,663
Naloxone 400mcg/ml (0.4mg/ml) in 1ml Amp 12,322 3,223 15,545 0 3,205 0 13,044
Nifedipine 10mg Tab/Cap 557,900 159,360 717,260 29,430 148,705 70 595,585
Nifedipine 20mg Tab/Cap 25,957 22,590 48,547 0 13,851 0 13,856
Norgestrel 0.03mg Cycle 175,572 36,000 211,572 0 58,673 205 159,539
48

Medicines Beginning Stock Added Stock Grand Total Available
Donated Out Consumed quantity Reported Wastage Reported Ending Stock
Norgestrel 0.075mg Cycle 57,665 3,900 61,565 0 5,210 0 55,325
Oral rehydration salts (ORS , Resomal and low osmolar) 20.5g/Lit
2,063,256 966,325 3,029,581 600 1,254,112 790 1,772,290
Oral rehydration salts (ORS , Resomal and low osmolar) 27.9g/Lit
1,518,954 854,105 2,373,059 0 1,088,068 6,314 1,384,102
Oxytocine 10IU/ml in 1ml Amp 464,621 147,683 612,304 1,000 251,238 2,137 370,896
Paracetamol (Acetaminophen) 225mg/3ml, Amp (75mg/ml)
0 0 0 0 0 0 0
Paracetamol 100mg Tab 11,583,520 6,126,864 17,710,384 3,000 7,932,078 5,000 10,103,910
Paracetamol 100mg/ml, 15ml Drop 1,097 0 1,097 0 475 0 626
Paracetamol 120mg/5ml, 60ml Syr 676,019 209,549 885,568 0 335,252 5,180 548,732
Paracetamol 325mg Tab 33,730 4,000 37,730 0 17,170 0 23,170
Paracetamol 500mg Tab 22,964,507 22,662,848 45,627,355 6,000 19,148,890 0 25,213,937
Penicillin Benzyl (Peni G crystal) 1MU Vial 296 0 296 0 296 0 0
Penicillin Benzyl (Peni G crystal) 5MU Vial 39,246 7,573 46,819 0 12,321 1,740 34,184
Pethidine 100mg/ml, 1ml Amp 6,378 0 6,378 0 1,510 0 8,368
Pethidine 50mg/ml, 2ml Amp 0 0 0 0 0 0 0
Phenobarbital 100mg/ml, in 2ml Amp 518 300 818 0 168 0 635
Phenobarbital 200mg/ml, 1ml Amp 1,181 0 1,181 0 587 0 924
Phenobarbital 50mg/ml 5ml Amp 644 0 644 0 50 0 0
Povidone-Iodine 10% Topical Sol 20,829 8,736 29,565 0 10,651 3 19,181
Propranolol 10mg Tab 4,980 60 5,040 0 1,950 0 3,620
Propranolol 20mg Tab 0 0 0 0 0 0 0
Propranolol 40mg Tab 151,573 8,980 160,553 0 47,592 1,000 75,336
Quinine dihydrochloride 300mg/ml, in 2ml Amp 16,651 1,793 18,444 0 4,232 32 14,839
Ranitidine 25mg/ml, in 2ml Amp 16,518 1,372 17,890 0 4,349 0 15,061
49

Medicines Beginning Stock Added Stock Grand Total Available
Donated Out Consumed quantity Reported Wastage Reported Ending Stock
Retinol (Vit A) 100,000 IU Amp 5,339 5,500 10,839 0 4,112 0 6,727
Retinol (Vit A) 100,000 IU Tab 847,754 21,000 868,754 0 175,548 0 678,703
Retinol (Vit A) 200,000 IU Cap 1,818,150 1,371,464 3,189,614 40,000 1,044,525 1,873 1,811,080
Retinol (Vit A) 25,000IU Cap 0 0 0 0 0 0 0
Retinol (Vit A) 50,000IU Cap 666,737 8,000 674,737 0 20,453 0 664,934
Rifampicin 150mg+Isoniazid 75mg (RH) Tab 54,874 355,578 410,452 18,542 119,360 0 180,010
Rifampicin 150mg+Isoniazid 75mg+Ethambutol 275mg (RHE) Tab
30,199 35,958 66,157 1,008 12,872 0 45,727
Rifampicin 150mg+Isoniazid 75mg+Pyrazinamide 400mg+Ethambutol 275mg (RHZE) per Tab
120,330 171,277 291,607 24,689 100,981 1,300 128,547
Rifampicin 300mg Tab 3,000 0 3,000 0 1,200 0 1,800
Rifampicin 60mg+Isoniazid 30mg (RH) Tab 28,841 23,096 51,937 4,258 12,854 2,296 27,345
Rifampicin 60mg+Isoniazid 30mg+Pyrazinamide 150mg (RHZ) Tab
13,540 15,730 29,270 3,888 5,843 2,544 16,649
Ringer lactate 1000ml IV infusion 211,379 144,755 356,134 0 161,952 22 230,829
Ringer lactate 500ml IV infusion 104,889 24,760 129,649 0 34,668 0 89,119
Salbutamol 0.05mg/ml (50mcg/ml) in 5ml Amp 23,242 3,426 26,668 0 7,124 614 19,829
Salbutamol 0.5mg/ml, in 1ml Amp 4,304 1,655 5,959 0 1,046 29 4,842
Sodium Chloride 0.9% 1000ml IV infusion (Normal Saline)
104,714 62,021 166,735 0 76,891 205 99,903
Sodium Chloride 0.9% 500ml IV infusion (Normal Saline)
32,600 5,500 38,100 0 8,693 0 33,353
Spironolactone 100mg Tab 300 0 300 0 500 0 100
Sulfamethoxazole 100mg+Trimethoprim 20mg Tab (Co-trimoxazole)
17,038,172 4,305,188 21,343,360 175,000 6,194,785 255 14,781,912
Sulfamethoxazole 200mg+Trimethoprim 40mg/5ml 50ml Susp (Co-trimoxazole)
332,001 68,693 400,694 0 133,244 0 228,723
Sulfamethoxazole 400mg+Trimethoprim 80mg 50ml Susp (Co-trimoxazole)
1,120,326 2,269,500 3,389,826 0 527,750 0 1,054,478
50
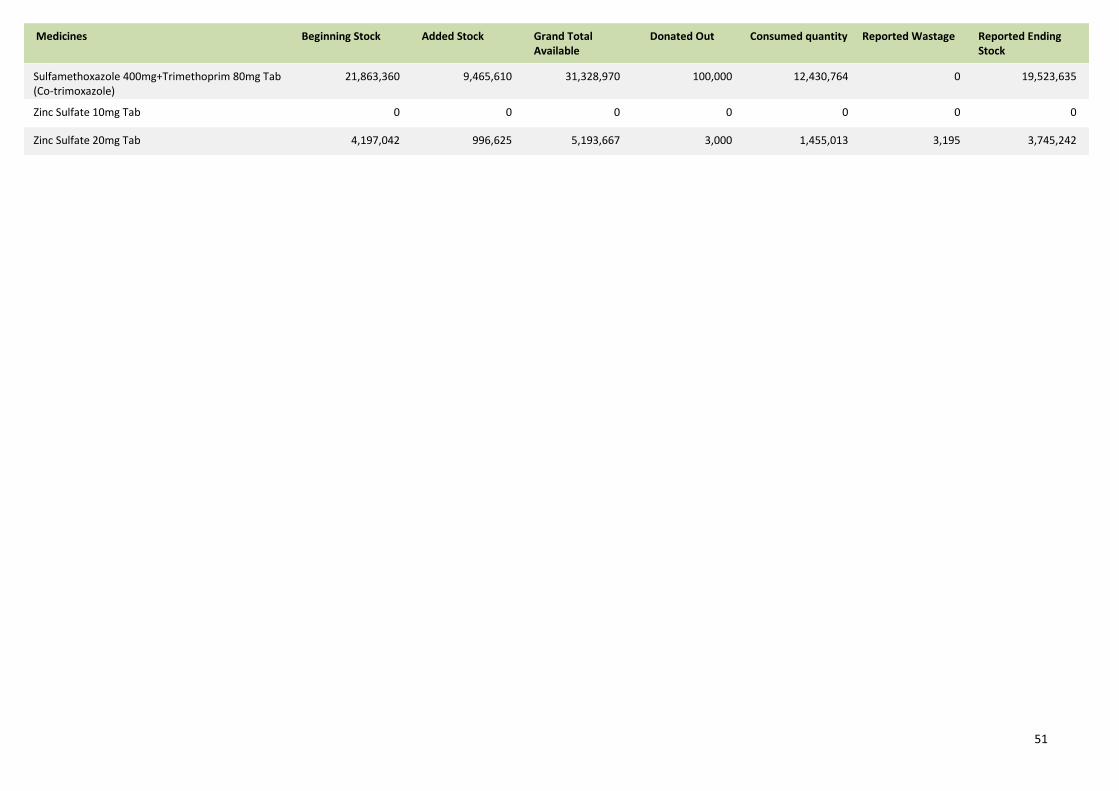
Medicines Beginning Stock Added Stock Grand Total Available
Donated Out Consumed quantity Reported Wastage Reported Ending Stock
Sulfamethoxazole 400mg+Trimethoprim 80mg Tab (Co-trimoxazole)
21,863,360 9,465,610 31,328,970 100,000 12,430,764 0 19,523,635
Zinc Sulfate 10mg Tab 0 0 0 0 0 0 0
Zinc Sulfate 20mg Tab 4,197,042 996,625 5,193,667 3,000 1,455,013 3,195 3,745,242
51