Embed Size (px)
Citation preview
1Quarterly Report
UNCONSOLIDATED CONDENSED INTERIM FINANCIAL INFORMATION
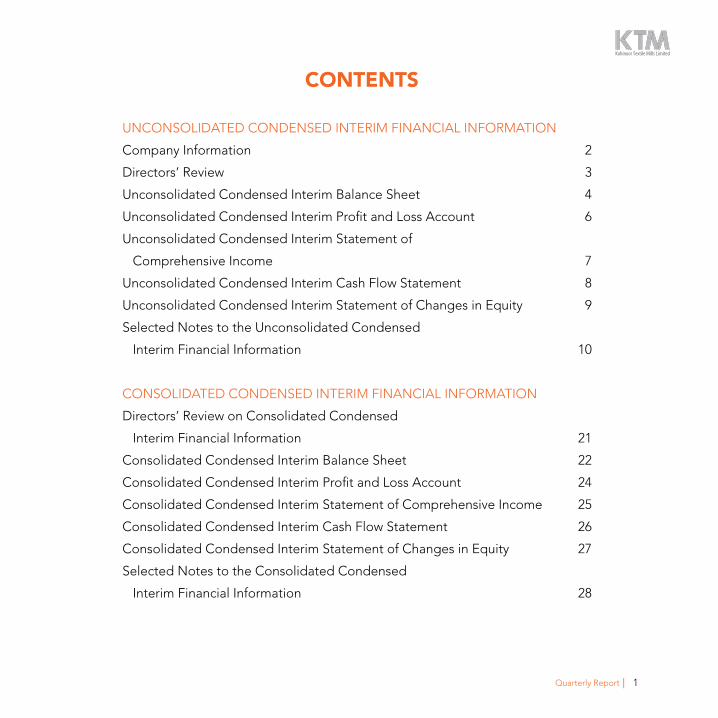
Company Information 2
Directors’ Review 3
Unconsolidated Condensed Interim Balance Sheet 4
Unconsolidated Condensed Interim Profit and Loss Account 6
Unconsolidated Condensed Interim Statement of
Comprehensive Income 7
Unconsolidated Condensed Interim Cash Flow Statement 8
Unconsolidated Condensed Interim Statement of Changes in Equity 9
Selected Notes to the Unconsolidated Condensed
Interim Financial Information 10
CONSOLIDATED CONDENSED INTERIM FINANCIAL INFORMATION
Directors’ Review on Consolidated Condensed
Interim Financial Information 21
Consolidated Condensed Interim Balance Sheet 22
Consolidated Condensed Interim Profit and Loss Account 24
Consolidated Condensed Interim Statement of Comprehensive Income 25
Consolidated Condensed Interim Cash Flow Statement 26
Consolidated Condensed Interim Statement of Changes in Equity 27
Selected Notes to the Consolidated Condensed
Interim Financial Information 28
CONTENTS
2 Kohinoor Textile Mills Limited
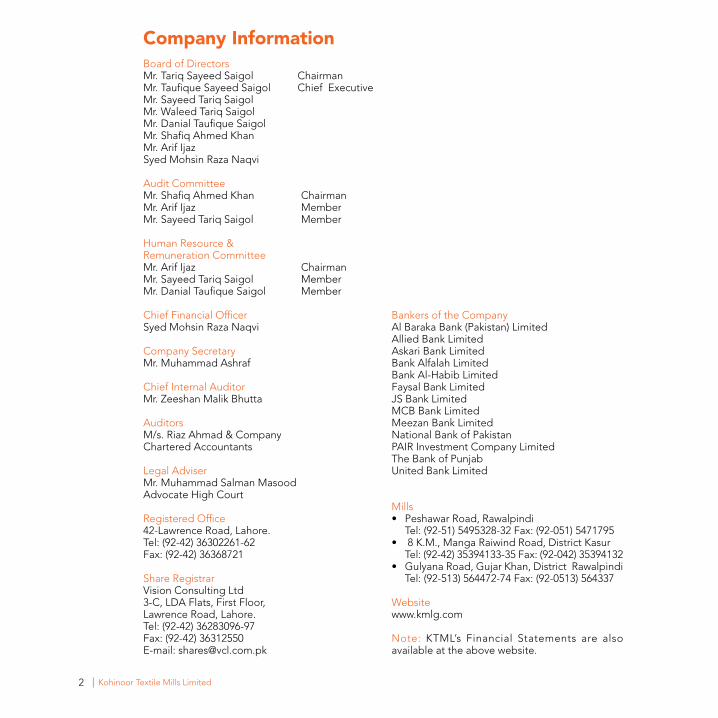
Company InformationBoard of DirectorsMr. Tariq Sayeed Saigol ChairmanMr. Taufique Sayeed Saigol Chief ExecutiveMr. Sayeed Tariq Saigol Mr. Waleed Tariq Saigol Mr. Danial Taufique Saigol Mr. Shafiq Ahmed Khan Mr. Arif Ijaz Syed Mohsin Raza Naqvi
Audit CommitteeMr. Shafiq Ahmed Khan ChairmanMr. Arif Ijaz MemberMr. Sayeed Tariq Saigol Member
Human Resource & Remuneration CommitteeMr. Arif Ijaz ChairmanMr. Sayeed Tariq Saigol MemberMr. Danial Taufique Saigol Member
Chief Financial OfficerSyed Mohsin Raza Naqvi
Company SecretaryMr. Muhammad Ashraf
Chief Internal AuditorMr. Zeeshan Malik Bhutta
AuditorsM/s. Riaz Ahmad & CompanyChartered Accountants
Legal AdviserMr. Muhammad Salman MasoodAdvocate High Court
Registered Office42-Lawrence Road, Lahore.Tel: (92-42) 36302261-62Fax: (92-42) 36368721
Share RegistrarVision Consulting Ltd 3-C, LDA Flats, First Floor,Lawrence Road, Lahore.Tel: (92-42) 36283096-97Fax: (92-42) 36312550E-mail: [email protected]
Bankers of the CompanyAl Baraka Bank (Pakistan) LimitedAllied Bank LimitedAskari Bank LimitedBank Alfalah LimitedBank Al-Habib LimitedFaysal Bank LimitedJS Bank LimitedMCB Bank LimitedMeezan Bank LimitedNational Bank of PakistanPAIR Investment Company LimitedThe Bank of PunjabUnited Bank Limited
Mills• Peshawar Road, Rawalpindi Tel: (92-51) 5495328-32 Fax: (92-051) 5471795• 8K.M.,MangaRaiwindRoad,DistrictKasur Tel: (92-42) 35394133-35 Fax: (92-042) 35394132• GulyanaRoad,GujarKhan,DistrictRawalpindi Tel: (92-513) 564472-74 Fax: (92-0513) 564337
Websitewww.kmlg.com
Note: KTML’s Financial Statements are also available at the above website.
3Quarterly Report
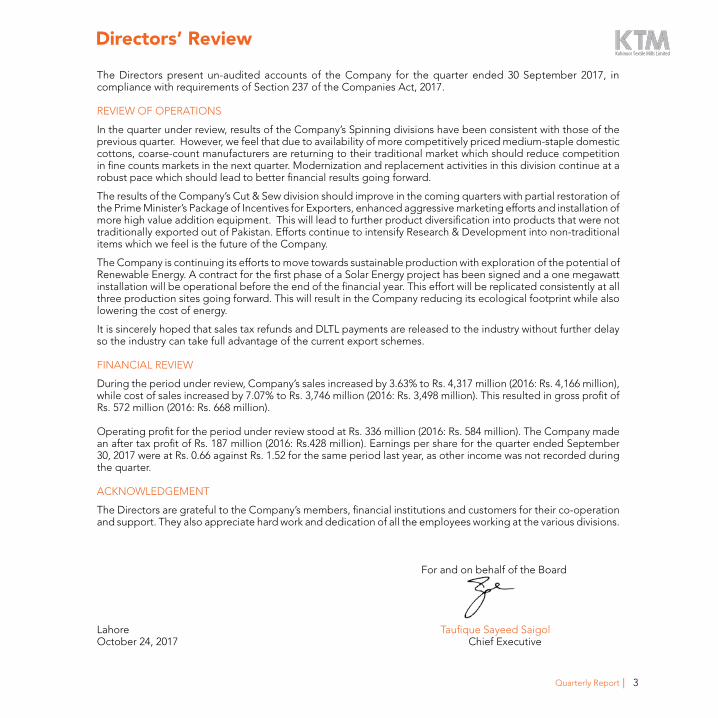
The Directors present un-audited accounts of the Company for the quarter ended 30 September 2017, in compliance with requirements of Section 237 of the Companies Act, 2017.
REVIEW OF OPERATIONS
In the quarter under review, results of the Company’s Spinning divisions have been consistent with those of the previous quarter. However, we feel that due to availability of more competitively priced medium-staple domestic cottons, coarse-count manufacturers are returning to their traditional market which should reduce competition in fine counts markets in the next quarter. Modernization and replacement activities in this division continue at a robust pace which should lead to better financial results going forward.
The results of the Company’s Cut & Sew division should improve in the coming quarters with partial restoration of the Prime Minister’s Package of Incentives for Exporters, enhanced aggressive marketing efforts and installation of more high value addition equipment. This will lead to further product diversification into products that were not traditionally exported out of Pakistan. Efforts continue to intensify Research & Development into non-traditional items which we feel is the future of the Company.
The Company is continuing its efforts to move towards sustainable production with exploration of the potential of Renewable Energy. A contract for the first phase of a Solar Energy project has been signed and a one megawatt installation will be operational before the end of the financial year. This effort will be replicated consistently at all three production sites going forward. This will result in the Company reducing its ecological footprint while also lowering the cost of energy.
It is sincerely hoped that sales tax refunds and DLTL payments are released to the industry without further delay so the industry can take full advantage of the current export schemes.
FINANCIAL REVIEW
During the period under review, Company’s sales increased by 3.63% to Rs. 4,317 million (2016: Rs. 4,166 million), while cost of sales increased by 7.07% to Rs. 3,746 million (2016: Rs. 3,498 million). This resulted in gross profit of Rs. 572 million (2016: Rs. 668 million).
Operating profit for the period under review stood at Rs. 336 million (2016: Rs. 584 million). The Company made an after tax profit of Rs. 187 million (2016: Rs.428 million). Earnings per share for the quarter ended September 30, 2017 were at Rs. 0.66 against Rs. 1.52 for the same period last year, as other income was not recorded during the quarter.
ACKNOWLEDGEMENT
The Directors are grateful to the Company’s members, financial institutions and customers for their co-operation and support. They also appreciate hard work and dedication of all the employees working at the various divisions.
For and on behalf of the Board
Lahore Taufique Sayeed SaigolOctober 24, 2017 Chief Executive
Directors’ Review
4 Kohinoor Textile Mills Limited
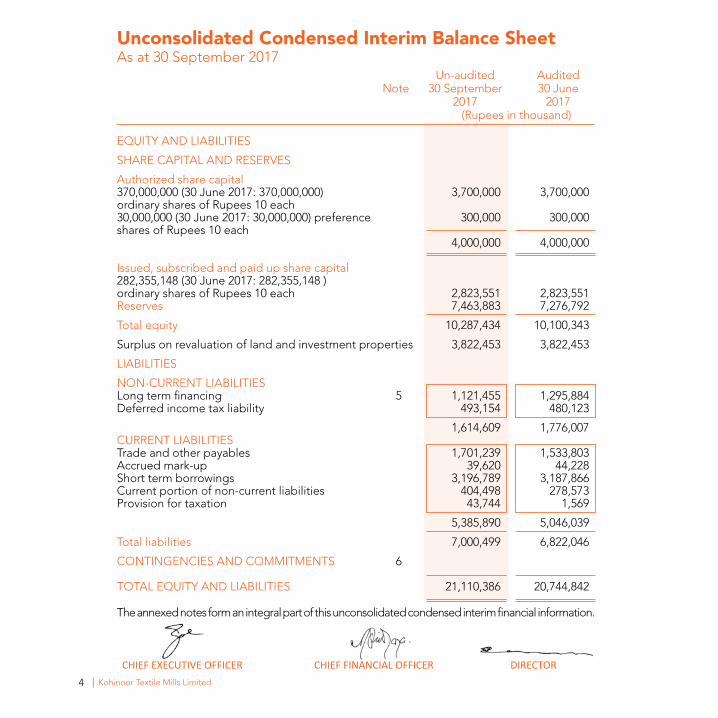
Un-audited Audited Note 30 September 30 June 2017 2017 (Rupees in thousand)
EQUITY AND LIABILITIES SHARE CAPITAL AND RESERVES Authorized share capital 370,000,000 (30 June 2017: 370,000,000) 3,700,000 3,700,000 ordinary shares of Rupees 10 each 30,000,000 (30 June 2017: 30,000,000) preference 300,000 300,000 shares of Rupees 10 each 4,000,000 4,000,000
Issued, subscribed and paid up share capital 282,355,148 (30 June 2017: 282,355,148 ) ordinary shares of Rupees 10 each 2,823,551 2,823,551 Reserves 7,463,883 7,276,792 Total equity 10,287,434 10,100,343 Surplus on revaluation of land and investment properties 3,822,453 3,822,453 LIABILITIES NON-CURRENT LIABILITIES Long term financing 5 1,121,455 1,295,884 Deferred income tax liability 493,154 480,123 1,614,609 1,776,007 CURRENT LIABILITIES Trade and other payables 1,701,239 1,533,803 Accrued mark-up 39,620 44,228 Short term borrowings 3,196,789 3,187,866 Current portion of non-current liabilities 404,498 278,573 Provision for taxation 43,744 1,569 5,385,890 5,046,039 Total liabilities 7,000,499 6,822,046 CONTINGENCIESANDCOMMITMENTS 6 TOTAL EQUITY AND LIABILITIES 21,110,386 20,744,842 The annexed notes form an integral part of this unconsolidated condensed interim financial information.
Unconsolidated Condensed Interim Balance SheetAs at 30 September 2017
CHIEF EXECUTIVE OFFICER CHIEF FINANCIAL OFFICER DIRECTOR
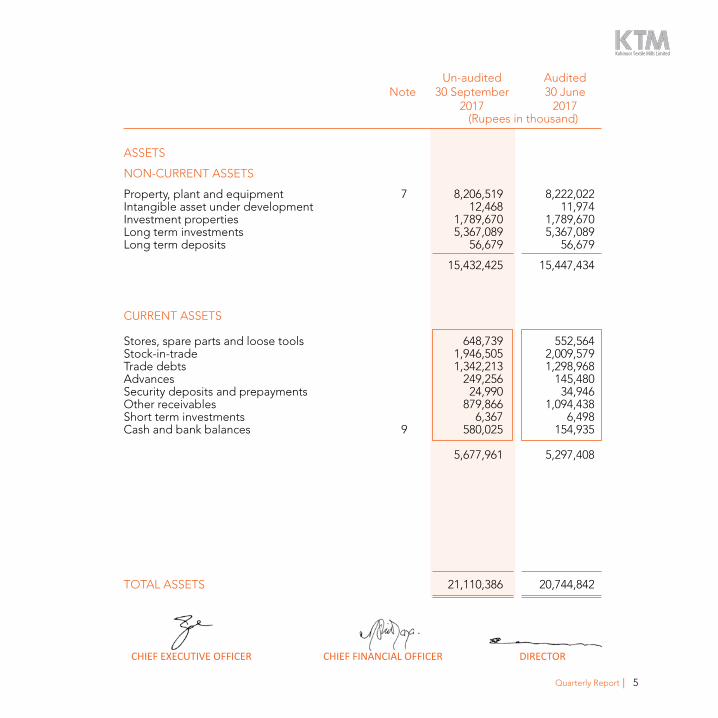
5Quarterly Report
Un-audited Audited Note 30 September 30 June 2017 2017 (Rupees in thousand)
ASSETS NON-CURRENT ASSETS Property, plant and equipment 7 8,206,519 8,222,022 Intangible asset under development 12,468 11,974 Investment properties 1,789,670 1,789,670 Long term investments 5,367,089 5,367,089 Long term deposits 56,679 56,679 15,432,425 15,447,434 CURRENT ASSETS Stores, spare parts and loose tools 648,739 552,564 Stock-in-trade 1,946,505 2,009,579 Trade debts 1,342,213 1,298,968 Advances 249,256 145,480 Security deposits and prepayments 24,990 34,946 Other receivables 879,866 1,094,438 Short term investments 6,367 6,498 Cash and bank balances 9 580,025 154,935 5,677,961 5,297,408 TOTAL ASSETS 21,110,386 20,744,842
CHIEF EXECUTIVE OFFICER CHIEF FINANCIAL OFFICER DIRECTOR
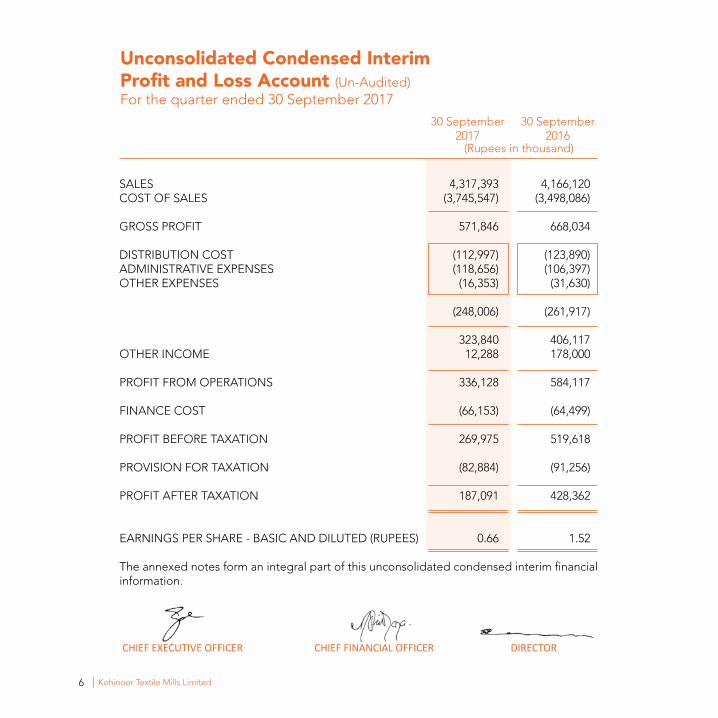
6 Kohinoor Textile Mills Limited
Unconsolidated Condensed Interim Profit and Loss Account (Un-Audited)For the quarter ended 30 September 2017 30 September 30 September 2017 2016 (Rupees in thousand)
SALES 4,317,393 4,166,120 COST OF SALES (3,745,547) (3,498,086)
GROSSPROFIT 571,846 668,034 DISTRIBUTION COST (112,997) (123,890)ADMINISTRATIVE EXPENSES (118,656) (106,397)OTHER EXPENSES (16,353) (31,630)
(248,006) (261,917)
323,840 406,117 OTHER INCOME 12,288 178,000 PROFIT FROM OPERATIONS 336,128 584,117 FINANCE COST (66,153) (64,499)
PROFIT BEFORE TAXATION 269,975 519,618 PROVISION FOR TAXATION (82,884) (91,256)
PROFIT AFTER TAXATION 187,091 428,362 EARNINGSPERSHARE-BASICANDDILUTED(RUPEES) 0.66 1.52 The annexed notes form an integral part of this unconsolidated condensed interim financial information.
CHIEF EXECUTIVE OFFICER CHIEF FINANCIAL OFFICER DIRECTOR
7Quarterly Report
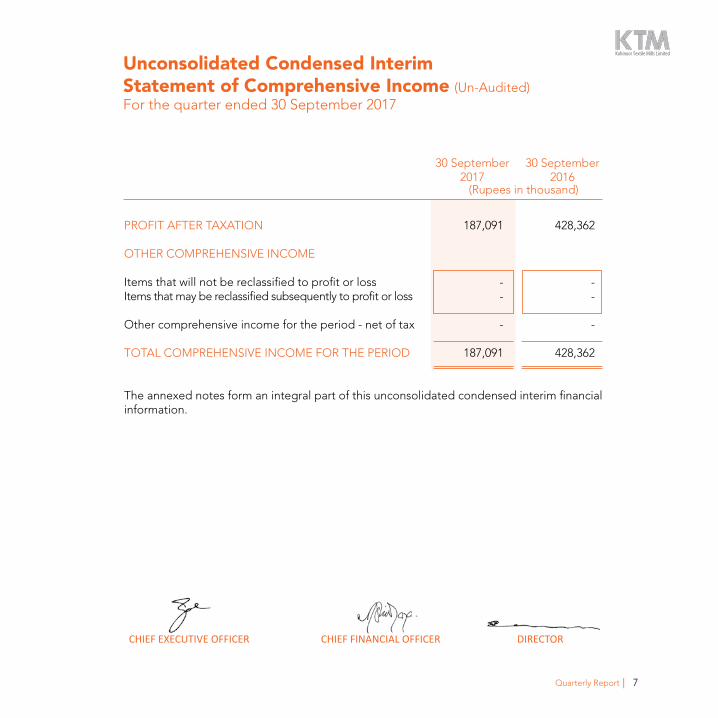
Unconsolidated Condensed Interim Statement of Comprehensive Income (Un-Audited)For the quarter ended 30 September 2017
30 September 30 September 2017 2016 (Rupees in thousand)
PROFIT AFTER TAXATION 187,091 428,362 OTHER COMPREHENSIVE INCOME Items that will not be reclassified to profit or loss - - Items that may be reclassified subsequently to profit or loss - - Other comprehensive income for the period - net of tax - - TOTAL COMPREHENSIVE INCOME FOR THE PERIOD 187,091 428,362 The annexed notes form an integral part of this unconsolidated condensed interim financial information.
CHIEF EXECUTIVE OFFICER CHIEF FINANCIAL OFFICER DIRECTOR
8 Kohinoor Textile Mills Limited
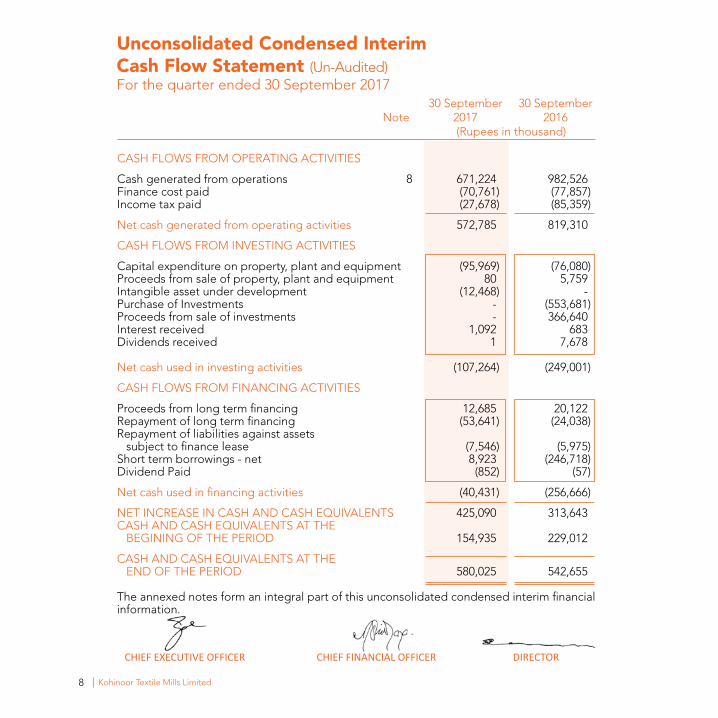
Unconsolidated Condensed Interim Cash Flow Statement (Un-Audited)For the quarter ended 30 September 2017 30 September 30 September Note 2017 2016 (Rupees in thousand)
CASHFLOWSFROMOPERATINGACTIVITIES Cash generated from operations 8 671,224 982,526 Finance cost paid (70,761) (77,857)Income tax paid (27,678) (85,359) Net cash generated from operating activities 572,785 819,310 CASHFLOWSFROMINVESTINGACTIVITIES Capital expenditure on property, plant and equipment (95,969) (76,080)Proceeds from sale of property, plant and equipment 80 5,759 Intangible asset under development (12,468) - Purchase of Investments - (553,681)Proceeds from sale of investments - 366,640 Interest received 1,092 683 Dividends received 1 7,678
Net cash used in investing activities (107,264) (249,001) CASHFLOWSFROMFINANCINGACTIVITIES Proceeds from long term financing 12,685 20,122 Repayment of long term financing (53,641) (24,038)Repayment of liabilities against assets subject to finance lease (7,546) (5,975)Short term borrowings - net 8,923 (246,718)Dividend Paid (852) (57) Net cash used in financing activities (40,431) (256,666) NET INCREASE IN CASH AND CASH EQUIVALENTS 425,090 313,643 CASH AND CASH EQUIVALENTS AT THE BEGININGOFTHEPERIOD 154,935 229,012 CASH AND CASH EQUIVALENTS AT THE END OF THE PERIOD 580,025 542,655 The annexed notes form an integral part of this unconsolidated condensed interim financial information.
CHIEF EXECUTIVE OFFICER CHIEF FINANCIAL OFFICER DIRECTOR
9Quarterly Report
Unc
onso
lidat
ed C
ond
ense
d In
teri
m S
tate
men
t of
Cha
nges
in E
qui
ty (U
n-A
udite
d)
For
the
qua
rter
end
ed 3
0 Se
pte
mb
er 2
017
---
----
----
----
----
----
----
----
----
----
----
----
----
----
----
-(R
upee
s in
tho
usan
d)-
----
----
----
----
----
----
----
----
----
----
----
----
----
----
B
alan
ce a
s at
30
June
201
6 -
(Aud
ited
) 2
,823
,551
1
44,9
19
1,4
50,4
91
4,7
41,3
78
6,1
91,8
69
6,3
36,7
88
9,1
60,3
39
Pr
ofit
for
the
qua
rter
end
ed 3
0 Se
pte
meb
er 2
016
-
-
-
4
28,3
62
428
,362
4
28,3
62
428
,362
O
ther
co
mp
rehe
nsiv
e in
com
e fo
r th
e q
uart
er
en
ded
30
Sep
tem
ber
201
6 -
-
-
-
-
-
-
To
tal c
om
pre
hens
ive
inco
me
for
the
qua
rter
end
ed
30
Sep
tem
ber
201
6 -
-
-
428
,362
4
28,3
62
428
,362
4
28,3
62
Bal
ance
as
at 3
0 Se
pte
mb
er 2
016
- (U
n-A
udite
d)
2,8
23,5
51
144
,919
1
,450
,491
5
,169
,740
6
,620
,231
6
,765
,150
9
,588
,701
Tran
sact
ions
with
ow
ners
-
final
div
iden
d fo
r th
e ye
ar e
nded
30
June
201
6
@ R
upee
s 3.
00 p
er s
hare
-
-
-
(847
,065
) (8
47,0
65)
(847
,065
) (8
47,0
65)
- in
terim
div
iden
d fo
r th
e ye
ar e
nded
30
June
201
7
@ R
upee
s 2.
00 p
er s
hare
-
-
-
(564
,710
) (5
64,7
10)
(564
,710
) (5
64,7
10)
-
-
-
(1
,411
,775
) (1
,411
,775
) (1
,411
,775
) (1
,411
,775
)
Pro
fit fo
r th
e p
erio
d e
nded
30
June
201
7 -
-
-
1,9
23,4
17
1,9
23,4
17
1,9
23,4
17
1,9
23,4
17
Oth
er c
om
pre
hens
ive
inco
me
for
the
per
iod
end
ed 3
0 Ju
ne 2
017
-
-
-
-
-
-
-
To
tal c
om
pre
hens
ive
inco
me
for
the
per
iod
end
ed 3
0 Ju
ne 2
017
-
-
-
1
,923
,417
1
,923
,417
1
,923
,417
1
,923
,417
Bal
ance
as
at 3
0 Ju
ne 2
017
- (A
udite
d)
2,8
23,5
51
144
,919
1
,450
,491
5
,681
,382
7
,131
,873
7
,276
,792
1
0,10
0,34
3
Pro
fit fo
r th
e q
uart
er e
nded
30
Sep
tem
eber
201
7 -
-
-
187
,091
1
87,0
91
187
,091
1
87,0
91
Oth
er c
om
pre
hens
ive
inco
me
for
the
qua
rter
end
ed
30
Sep
tem
ber
201
7 -
-
-
-
-
-
-
Tota
l co
mp
rehe
nsiv
e in
com
e fo
r th
e q
uart
er e
nded
30 S
epte
mb
er 2
017
-
-
-
1
87,0
91
187
,091
1
87,0
91
187
,091
Bal
ance
as
at 3
0 Se
pte
mb
er 2
017
- (U
n-A
udite
d)
2,8
23,5
51
144
,919
1
,450
,491
5
,868
,473
7
,318
,964
7
,463
,883
1
0,28
7,43
4
The
anne
xed
no
tes
form
an
inte
gra
l par
t o
f thi
s un
cons
olid
ated
co
nden
sed
inte
rim fi
nanc
ial i
nfo
rmat
ion.
Shar
eC
apita
lSh
are
Prem
ium
Gen
eral
Res
erve
Acc
umul
ated
Pr
ofit
Tota
l R
eser
ves
Tota
lE
qui
tySu
b T
ota
l
Cap
ital R
eser
veR
even
ue R
eser
ves
Res
erve
s
CH
IEF
EXEC
UTI
VE O
FFIC
ER
CHIE
F FI
NAN
CIAL
OFF
ICER
DI
RECT
OR
10 Kohinoor Textile Mills Limited
Selected Notes to the Unconsolidated Condensed Interim Financial Information (Un-Audited)For the quarter ended 30 September 2017
1. THE COMPANY AND ITS OPERATIONS Kohinoor Textile Mills Limited is a public limited company incorporated in Pakistan under
the Companies Act, 1913 (now the Companies Act, 2017) and listed on Pakistan Stock Exchange Limited. The registered office of the Company is situated at 42 Lawrence Road, Lahore. The principal activity of the Company is manufacturing of yarn and cloth, processing and home textile and trading textile products.
2. BASIS OF PREPARATION This unconsolidated condensed interim financial information of the Company for
the quarter ended 30 September 2017 has been prepared in accordance with the requirements of the International Accounting Standard (IAS) 34 ‘Interim Financial Reporting’ and provisions of and directives issued under the Companies Act, 2017. In case where requirements differ, the provisions of or directives issued under the Companies Act, 2017 have been followed. This unconsolidated condensed interim financial information is un-audited and is being submitted to the shareholders in accordance with the requirements of section 245 of the Companies Act, 2017. This unconsolidated condensed interim financial information should be read in conjunction with the annual financial statements of the Company for the year ended 30 June 2017.
3. ACCOUNTINGPOLICIES The accounting policies and methods of computation adopted for the preparation of
this unconsolidated condensed interim financial information are the same as applied in the preparation of the preceding audited annual published financial statements of the Company for the year ended 30 June 2017.
4. CRITICALACCOUNTINGESTIMATESANDJUDGEMENTS The preparation of this unconsolidated condensed interim financial information in
conformity with the approved accounting standards requires the use of certain critical accounting estimates. It also requires the management to exercise its judgment in the process of applying the Company’s accounting policies. Estimates and judgments are continually evaluated and are based on historical experience and other factors, including expectations of future events that are believed to be reasonable under the circumstances.
During preparation of this unconsolidated condensed interim financial information, the
significant judgments made by the management in applying the Company’s accounting policies and the key sources of estimation and uncertainty were the same as those that applied in the preceding audited annual published financial statements of the Company for the year ended 30 June 2017.
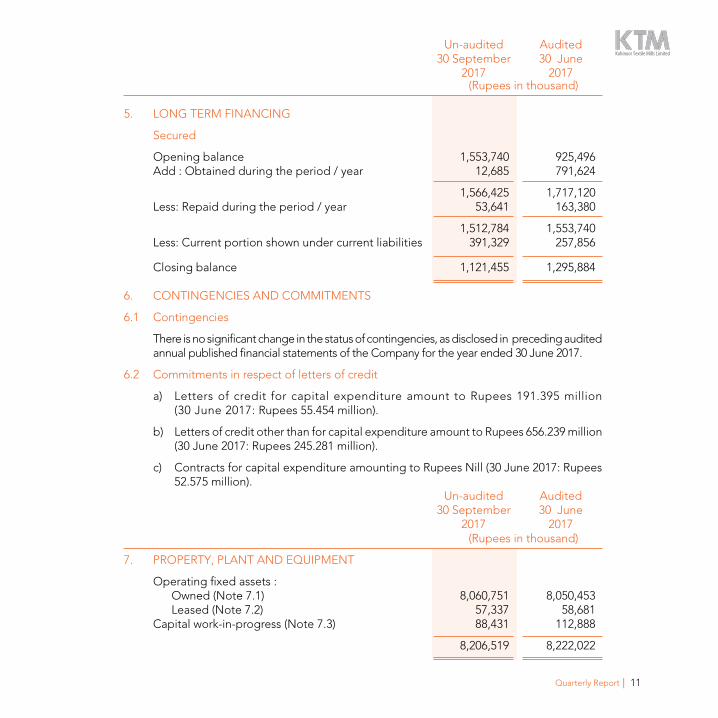
11Quarterly Report
Un-audited Audited 30 September 30 June 2017 2017 (Rupees in thousand)
5. LONGTERMFINANCING Secured Opening balance 1,553,740 925,496 Add : Obtained during the period / year 12,685 791,624 1,566,425 1,717,120 Less: Repaid during the period / year 53,641 163,380 1,512,784 1,553,740 Less: Current portion shown under current liabilities 391,329 257,856
Closing balance 1,121,455 1,295,884 6. CONTINGENCIESANDCOMMITMENTS 6.1 Contingencies There is no significant change in the status of contingencies, as disclosed in preceding audited
annual published financial statements of the Company for the year ended 30 June 2017. 6.2 Commitments in respect of letters of credit a) Letters of credit for capital expenditure amount to Rupees 191.395 million
(30 June 2017: Rupees 55.454 million). b) Letters of credit other than for capital expenditure amount to Rupees 656.239 million
(30 June 2017: Rupees 245.281 million). c) Contracts for capital expenditure amounting to Rupees Nill (30 June 2017: Rupees
52.575 million). Un-audited Audited 30 September 30 June 2017 2017 (Rupees in thousand) 7. PROPERTY, PLANT AND EQUIPMENT Operating fixed assets : Owned (Note 7.1) 8,060,751 8,050,453 Leased (Note 7.2) 57,337 58,681 Capital work-in-progress (Note 7.3) 88,431 112,888 8,206,519 8,222,022
12 Kohinoor Textile Mills Limited
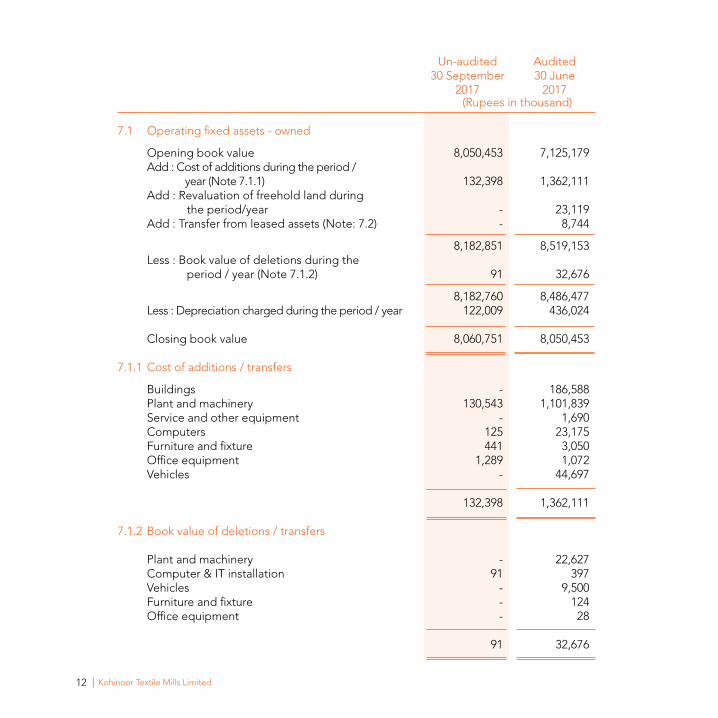
Un-audited Audited 30 September 30 June 2017 2017 (Rupees in thousand)
7.1 Operating fixed assets - owned Opening book value 8,050,453 7,125,179 Add : Cost of additions during the period / year (Note 7.1.1) 132,398 1,362,111 Add : Revaluation of freehold land during the period/year - 23,119 Add : Transfer from leased assets (Note: 7.2) - 8,744 8,182,851 8,519,153 Less : Book value of deletions during the period / year (Note 7.1.2) 91 32,676 8,182,760 8,486,477 Less : Depreciation charged during the period / year 122,009 436,024 Closing book value 8,060,751 8,050,453 7.1.1 Cost of additions / transfers Buildings - 186,588 Plant and machinery 130,543 1,101,839 Service and other equipment - 1,690 Computers 125 23,175 Furniture and fixture 441 3,050 Office equipment 1,289 1,072 Vehicles - 44,697 132,398 1,362,111 7.1.2 Book value of deletions / transfers Plant and machinery - 22,627 Computer & IT installation 91 397 Vehicles - 9,500 Furniture and fixture - 124 Office equipment - 28 91 32,676
13Quarterly Report
Un-audited Audited 30 September 30 June 2017 2017 (Rupees in thousand)
7.2 Operating fixed assets - leased Opening book value 58,681 73,953 Transfer to own assets Note : 7.2.1) - 8,744 58,681 65,209 Less : Depreciation charged during the period / year 1,344 6,528 Closing book value 57,337 58,681
7.2.1 Book value of deletions / transfers Plant and machinery - 7,155 Vehicles - 1,589 - 8,744 7.3 Capital work-in-progress
Civil works and buildings 836 199 Plant and machinery 27,542 103,453 Advances for capital expenditure 60,053 6,899 Letters of credit - 2,337 88,431 112,888
14 Kohinoor Textile Mills Limited
Un-audited Un-audited 30 September 30 September 2017 2016 (Rupees in thousand)
8. CASHGENERATEDFROMOPERATIONS Profit before taxation 269,975 519,618 Adjustments for non-cash charges and other items: Depreciation 123,353 99,891 Finance cost 66,153 64,499 Loss/(gain) on sale of property, plant and equipment 11 (734) Loss/(gain) on remeasurement of fair value of investments at fair value 131 (119,853) Gainonsaleofinvestments - (36,829) Dividend Income (1) (4,430) Return on bank deposits (1,092) (683) Working capital changes (Note 8.1) 212,694 461,047 671,224 982,526 8.1 Working capital changes (Increase) / decrease in current assets: Stores, spare parts and loose tools (96,175) 31,422 Stock-in-trade 63,074 53,450 Trade debts (43,245) (98,532) Advances (103,776) (51,166) Security deposits and prepayments 9,956 (15,026) Other receivables 214,572 206,697 44,406 126,845 Increase in current liabilities: Trade and other payables 168,288 334,202 212,694 461,047
15Quarterly Report
Un-audited Audited 30 September 30 June 2017 2017 (Rupees in thousand)
9. CASH AND BANK BALANCES Cash in hand 21,686 6,129 Cash at bank: - On current accounts 243,228 116,304 - On saving accounts 315,111 32,502 558,339 148,806 580,025 154,935
9.1 The balances in saving accounts carry rate of profit ranging from 0.15% to 5.25 % (30 June 2017: 0.15% to 5.25 %) per annum.
9.2 The balances in current and saving accounts include US $ 24,044 (30 June 2017: US $ 30,131).
16 Kohinoor Textile Mills Limited
10.
SEGMENTIN
FORMATION
10.1
Spin
ning
W
eavi
ng
Pro
cess
ing
and
ho
me
text
ile
C
om
pan
y
U
n-A
udite
d
Un-
Aud
ited
U
n-A
udite
d
Un-
Aud
ited
U
n-A
udite
d
Q
uart
er e
nded
Q
uart
er e
nded
Q
uart
er e
nded
Q
uart
er e
nded
Q
uart
er e
nded
30
Sep
tem
ber
30
Sep
tem
ber
30
Sep
tem
ber
30
Sep
tem
ber
30
Sep
tem
ber
30
Sep
tem
ber
30
Sep
tem
ber
30
Sep
tem
ber
30
Sep
tem
ber
30
Sep
tem
ber
20
17
2016
20
17
2016
20
17
2016
20
17
2016
20
17
2016
--
----
----
----
----
----
----
----
----
----
----
----
----
----
----
----
----
----
----
----
----
----
----
----
(Rup
ees
in t
hous
and
s) -
----
----
----
----
----
----
----
----
----
----
----
----
----
----
----
----
----
----
----
----
----
----
-
SA
LES
:
E
XTE
RN
AL
2,1
98,8
25
1,7
05,3
73
835
,300
7
98,7
82
1,2
83,2
68
1,6
61,9
65
-
-
4,3
17,3
93
4,1
66,1
20
IN
TER-SEGMENT
130
,365
174
,727
352
,364
257
,733
-
-
(482
,729
)(4
32,460
)-
-
2,3
29,1
90
1,8
80,1
00
1,1
87,6
64
1,0
56,5
15
1,2
83,2
68
1,6
61,9
65
(482
,729
) (4
32,4
60)
4,3
17,3
93
4,1
66,1
20
C
OST
OF
SALE
S (2
,047
,942
) (1
,563
,865
) (1
,120
,556
) (9
80,4
64)
(1,0
59,7
78)
(1,3
86,2
17)
482
,729
4
32,4
60
(3,7
45,5
47)
(3,4
98,0
86)
GROSS
PROFIT
281
,248
316
,235
67,10
8
76,05
1
223
,490
275
,748
-
-
571
,846
668
,034
SE
LLIN
GANDD
ISTR
IBUTIONEXPE
NSE
S(9
,384
)(4
,549
)(1
9,73
4)
(17,14
5)
(83,87
9)
(102
,196
)-
-
(112
,997
)(1
23,890
)
AD
MIN
ISTR
ATI
VE
EX
PEN
SES
(40,
497)
(3
3,32
0)
(37,
398)
(3
8,45
5)
(40,
761)
(3
4,62
2)
-
-
(118
,656
) (1
06,3
97)
(49,
881)
(3
7,86
9)
(57,
132)
(5
5,60
0)
(124
,640
) (1
36,8
18)
-
-
(231
,653
) (2
30,2
87)
PR
OFI
T B
EFO
RE
TA
X A
ND
UN
ALL
OC
ATE
D
INC
OM
E A
ND
EX
PEN
SES
231
,367
2
78,3
66
9,9
76
20,
451
9
8,85
0
138
,930
-
-
3
40,1
93
437
,747
U
NA
LLO
CA
TED
INC
OM
E A
ND
EX
PEN
SES
OTH
ER
EX
PEN
SES
(16,
353)
(3
1,63
0)
OTH
ER
INC
OM
E
12,
288
1
78,0
00
FI
NA
NC
E C
OST
(6
6,15
3)
(64,
499)
PR
OV
ISIO
N F
OR
TA
XA
TIO
N
(82,
884)
(9
1,25
6)
(153
,102
) (9
,385
)
PR
OFI
T A
FTE
R T
AX
ATI
ON
1
87,0
91
428
,362
10.2
R
eco
ncili
atio
n o
f rep
ort
able
seg
men
t as
sets
and
liab
ilitie
s:
Sp
inni
ng
Wea
ving
Pr
oces
sing
and
hom
e te
xtile
C
ompa
ny
U
n-au
dite
d
Aud
ited
U
n-au
dite
d
Aud
ited
U
n-au
dite
d
Aud
ited
U
n-au
dite
d
Aud
ited
30 S
epte
mbe
r 30
Jun
e 30
Sep
tem
ber
30 J
une
30 S
epte
mbe
r 30
Jun
e 30
Sep
tem
ber
30 J
une
2017
20
17
2017
20
17
2017
20
17
2017
20
17
----
----
----
----
----
----
----
----
----
----
----
----
----
----
----
----
-Rup
ees
in t
hous
and
s---
----
----
----
----
----
----
----
----
----
----
----
----
----
----
----
--
TOTA
LASS
ETSFO
RRE
PORT
ABLE
SEG
MEN
TS
4,568
,889
4,665
,385
3,297
,857
3,313
,886
3,144
,258
2,912
,971
11,01
1,00
4
10,89
2,24
2
U
NA
LLO
CA
TED
ASS
ETS
1
0,09
9,38
2
9,8
52,6
00
TOTA
L A
SSE
TS A
S PE
R B
ALA
NC
E S
HE
ET
21,
110,
386
2
0,74
4,84
2
A
ll se
gm
ent
asse
ts a
re a
lloca
ted
to
rep
ort
able
seg
men
ts o
ther
tha
n th
ose
dire
ctly
rela
ting
to
co
rpo
rate
and
tax
ass
ets.
TO
TALLIABILITIES
FORRE
PORTABL
ESE
GMEN
T607
,794
932
,919
1,200
,706
1,283
,415
3,017
,676
2,590
,431
4,826
,176
4,806
,765
U
NA
LLO
CA
TED
LIA
BIL
ITIE
S
2
,174
,323
2
,015
,281
7,0
00,4
99
6,8
22,0
46
All
seg
men
t lia
bili
ties
are
allo
cate
d t
o re
po
rtab
le s
egm
ents
oth
er t
han
trad
e an
d o
ther
pay
able
s, c
orp
ora
te b
orr
ow
ing
s an
d c
urre
nt a
nd d
efer
red
tax
liab
ilitie
s.
Elim
inat
ion
of i
nter
-seg
men
t tr
ansa
ctio
ns
17Quarterly Report
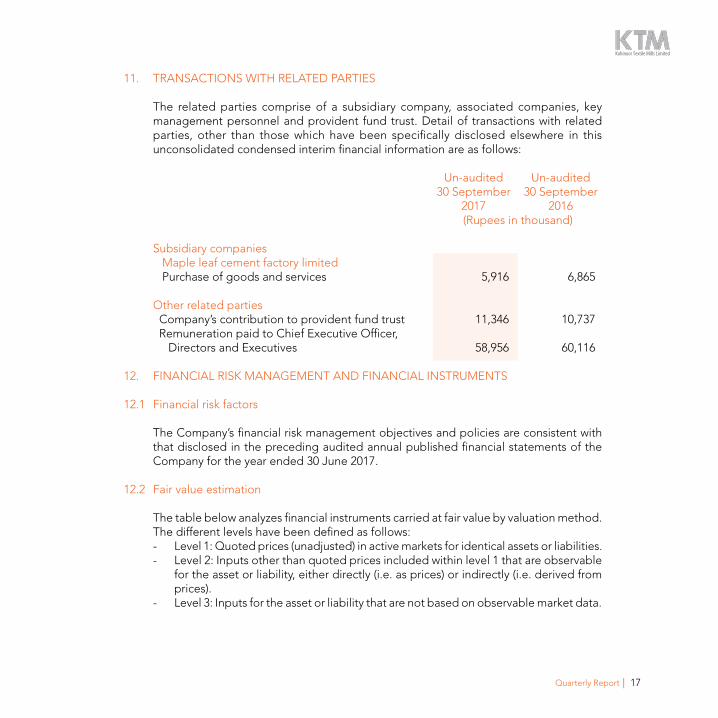
11. TRANSACTIONS WITH RELATED PARTIES The related parties comprise of a subsidiary company, associated companies, key
management personnel and provident fund trust. Detail of transactions with related parties, other than those which have been specifically disclosed elsewhere in this unconsolidated condensed interim financial information are as follows:
Un-audited Un-audited 30 September 30 September 2017 2016 (Rupees in thousand)
Subsidiary companies Maple leaf cement factory limited Purchase of goods and services 5,916 6,865 Other related parties Company’s contribution to provident fund trust 11,346 10,737 Remuneration paid to Chief Executive Officer, Directors and Executives 58,956 60,116 12. FINANCIALRISKMANAGEMENTANDFINANCIALINSTRUMENTS 12.1 Financial risk factors The Company’s financial risk management objectives and policies are consistent with
that disclosed in the preceding audited annual published financial statements of the Company for the year ended 30 June 2017.
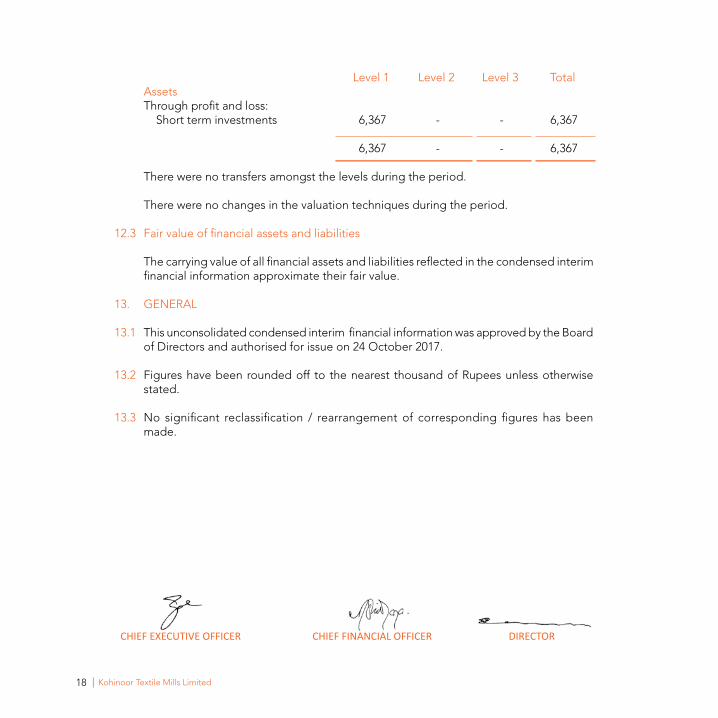
12.2 Fair value estimation The table below analyzes financial instruments carried at fair value by valuation method.
The different levels have been defined as follows: - Level 1: Quoted prices (unadjusted) in active markets for identical assets or liabilities. - Level 2: Inputs other than quoted prices included within level 1 that are observable
for the asset or liability, either directly (i.e. as prices) or indirectly (i.e. derived from prices).
- Level 3: Inputs for the asset or liability that are not based on observable market data.
18 Kohinoor Textile Mills Limited
Level 1 Level 2 Level 3 Total Assets Through profit and loss: Short term investments 6,367 - - 6,367 6,367 - - 6,367
There were no transfers amongst the levels during the period. There were no changes in the valuation techniques during the period. 12.3 Fair value of financial assets and liabilities The carrying value of all financial assets and liabilities reflected in the condensed interim
financial information approximate their fair value. 13. GENERAL 13.1 This unconsolidated condensed interim financial information was approved by the Board
of Directors and authorised for issue on 24 October 2017. 13.2 Figures have been rounded off to the nearest thousand of Rupees unless otherwise
stated. 13.3 No significant reclassification / rearrangement of corresponding figures has been
made.
CHIEF EXECUTIVE OFFICER CHIEF FINANCIAL OFFICER DIRECTOR
20 Kohinoor Textile Mills Limited
21Quarterly Report
The Directors are pleased to present the unaudited consolidated condensed financial statements
of Kohinoor Textile Mills Limited (the Holding Company) and its Subsidiary Companies Maple Leaf
Cement Factory Limited (55.22%), Maple Leaf Capital Limited (82.93%) and Maple Leaf power Limited
(55.22%) (together referred to as Group) for the quarter ended 30 September 2017.
GROUp RESULTS
The Group has earned gross profit of Rupees 2,798 million as compared to Rupees 3,106 million of
corresponding year. The group made pretax profit of Rupees 1,938 million this year as compared to
Rupees 2,579 million during the last year.
SUbSIDIARY COMpANIES
Maple Leaf Cement Factory Limited (MLCFL)
It has earned after tax profit of Rupees 1,049 million during the current period as compared to Rupees
1,223 million during the corresponding period of previous year.
Maple Leaf power Limited (MLpL)
Subsidiary Company (MLCFL) holds 100.00% shares of MLpL.
Maple Leaf Capital Limited (MLCL)
MLCL has earned after tax profit of Rupees 97 million during the current period as compared to Rupees
268 million during the corresponding period of previous year.
Lahore Taufique Sayeed SaigolOctober 24, 2017 Chief Executive Officer
Directors’ Report on Consolidated Financial Statements
22 Kohinoor Textile Mills Limited
Un-audited Audited Note 30 September 30 June 2017 2017 (Rupees in thousand) EQUITY AND LIAbILITIES SHARE CApITAL AND RESERVES Authorized share capital 370,000,000 (30 June 2017 : 370,000,000) ordinary shares of Rupees 10 each 3,700,000 3,700,000 30,000,000 (30 June 2017 : 30,000,000) preference shares of Rupees 10 each 300,000 300,000 4,000,000 4,000,000 Issued, subscribed and paid up share capital 2,823,551 2,823,551 282,355,148 (30 June 2017: 282,355,148) ordinary shares of Rupees 10 each. Reserves 17,229,100 16,338,523 Equity attributable to equity holders of the Holding Company 20,052,651 19,162,074 Non-controlling interest 9,955,170 9,433,113 Total equity 30,007,821 28,595,187 Surplus on revaluation of land and investment properties 4,183,283 4,183,283 LIAbILITIES NON-CURRENT LIAbILITIES Long term financing 5 4,530,776 4,186,110 Liabilities against assets subject to finance lease - 270,615 Long term deposits 8,764 8,699 Retirement benefits 143,385 150,778 Deferred income tax liability 3,236,826 3,167,039 7,919,751 7,783,241 CURRENT LIAbILITIESTrade and other payables 6,739,905 5,625,467 Accrued mark-up 163,228 145,693 Short term borrowings 6,787,771 6,326,025 Current portion of non-current liabilities 789,173 702,107 provision for taxation 794,083 476,711 15,274,160 13,276,003 Total liabilities 23,193,911 21,059,244 CONTINGENCIES AND COMMITMENTS 6 TOTAL EQUITY AND LIAbILITIES 57,385,015 53,837,714 The annexed notes form an integral part of this consolidated condensed interim financial information.
Consolidated Condensed Interim Balance SheetAs at 30 September 2017
CHIEF EXECUTIVE OFFICER CHIEF FINANCIAL OFFICER DIRECTOR
23Quarterly Report
Un-audited Audited Note 30 September 30 June 2017 2017 (Rupees in thousand)
ASSETS NON-CURRENT ASSETS property, plant and equipment 7 33,417,847 31,222,866 Investment properties 1,789,670 1,789,670 Intangibles 35,558 37,180 Long term loans to employees 8,746 5,799 Long term deposits 113,233 113,153 35,365,054 33,168,668
CURRENT ASSETS Stores, spare parts and loose tools 7,625,893 7,303,150 Stock -in- trade 3,429,741 3,310,815 Trade debts 2,620,790 2,239,776 Loans and advances 976,151 963,596 Security deposits and short term prepayments 421,701 123,134 Accrued interest 995 2,628 Other receivables 1,391,501 1,693,947 Short term investments 2,534,222 3,214,826 Cash and bank balances 3,018,967 1,817,174 22,019,961 20,669,046
TOTAL ASSETS 57,385,015 53,837,714
CHIEF EXECUTIVE OFFICER CHIEF FINANCIAL OFFICER DIRECTOR
24 Kohinoor Textile Mills Limited
Consolidated Condensed Interim Profit and Loss Account (Un-Audited)For the quarter ended 30 September 2017 (Un-Audited)
30 September 30 September 2017 2016 (Rupees in thousand)
SALES 10,111,971 9,685,761 COST OF SALES (7,313,668) (6,579,645)
GROSS pROFIT 2,798,303 3,106,116 DISTRIbUTION COST (379,147) (497,371)ADMINISTRATIVE EXpENSES (297,683) (250,118)OTHER EXpENSES (140,546) (180,895)
(817,376) (928,384)
1,980,927 2,177,732 OTHER INCOME 166,118 519,736
pROFIT FROM OpERATIONS 2,147,045 2,697,468 FINANCE COST (209,347) (118,432)
pROFIT bEFORE TAXATION 1,937,698 2,579,036
pROVISION FOR TAXATION (525,064) (632,718) pROFIT AFTER TAXATION 1,412,634 1,946,318 SHARE OF pROFIT ATTRIbUTAbLE TO: EQUITY HOLDERS OF HOLDING COMpANY 890,577 1,295,448 NON CONTROLLING INTEREST 522,057 650,870 1,412,634 1,946,318
EARNING pER SHARE - bASIC AND DILUTED (RUpEES) 3.15 4.59 The annexed notes form an integral part of this consolidated condensed interim financial information.
CHIEF EXECUTIVE OFFICER CHIEF FINANCIAL OFFICER DIRECTOR
25Quarterly Report
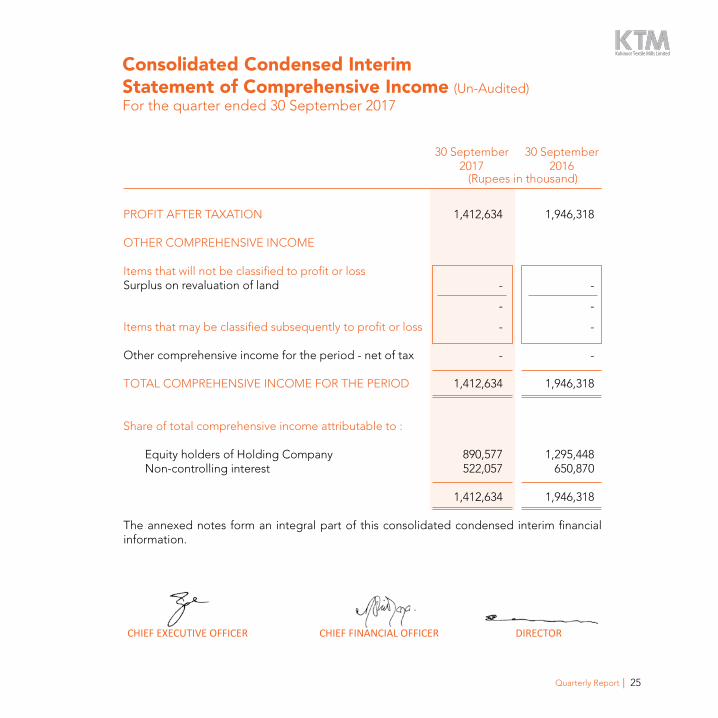
Consolidated Condensed Interim Statement of Comprehensive Income (Un-Audited)For the quarter ended 30 September 2017
30 September 30 September 2017 2016 (Rupees in thousand)
pROFIT AFTER TAXATION 1,412,634 1,946,318 OTHER COMpREHENSIVE INCOME Items that will not be classified to profit or loss Surplus on revaluation of land - -
- - Items that may be classified subsequently to profit or loss - - Other comprehensive income for the period - net of tax - - TOTAL COMpREHENSIVE INCOME FOR THE pERIOD 1,412,634 1,946,318 Share of total comprehensive income attributable to : Equity holders of Holding Company 890,577 1,295,448 Non-controlling interest 522,057 650,870 1,412,634 1,946,318 The annexed notes form an integral part of this consolidated condensed interim financial information.
CHIEF EXECUTIVE OFFICER CHIEF FINANCIAL OFFICER DIRECTOR
26 Kohinoor Textile Mills Limited
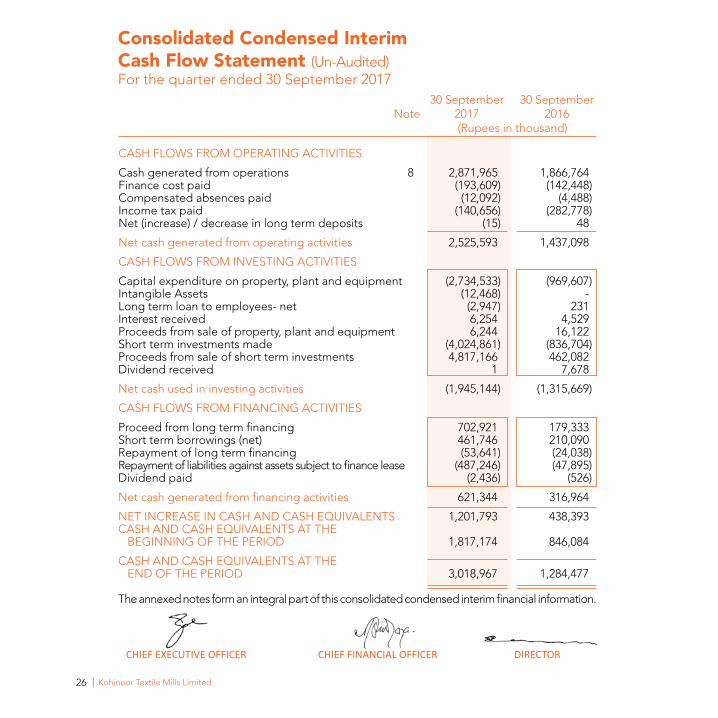
Consolidated Condensed Interim Cash Flow Statement (Un-Audited)For the quarter ended 30 September 2017 30 September 30 September Note 2017 2016 (Rupees in thousand)
CASH FLOWS FROM OpERATING ACTIVITIES Cash generated from operations 8 2,871,965 1,866,764 Finance cost paid (193,609) (142,448)Compensated absences paid (12,092) (4,488)Income tax paid (140,656) (282,778)Net (increase) / decrease in long term deposits (15) 48 Net cash generated from operating activities 2,525,593 1,437,098 CASH FLOWS FROM INVESTING ACTIVITIES Capital expenditure on property, plant and equipment (2,734,533) (969,607)Intangible Assets (12,468) - Long term loan to employees- net (2,947) 231 Interest received 6,254 4,529 proceeds from sale of property, plant and equipment 6,244 16,122 Short term investments made (4,024,861) (836,704)proceeds from sale of short term investments 4,817,166 462,082 Dividend received 1 7,678 Net cash used in investing activities (1,945,144) (1,315,669) CASH FLOWS FROM FINANCING ACTIVITIES proceed from long term financing 702,921 179,333 Short term borrowings (net) 461,746 210,090 Repayment of long term financing (53,641) (24,038)Repayment of liabilities against assets subject to finance lease (487,246) (47,895)Dividend paid (2,436) (526) Net cash generated from financing activities 621,344 316,964 NET INCREASE IN CASH AND CASH EQUIVALENTS 1,201,793 438,393 CASH AND CASH EQUIVALENTS AT THE bEGINNING OF THE pERIOD 1,817,174 846,084 CASH AND CASH EQUIVALENTS AT THE END OF THE pERIOD 3,018,967 1,284,477 The annexed notes form an integral part of this consolidated condensed interim financial information.
CHIEF EXECUTIVE OFFICER CHIEF FINANCIAL OFFICER DIRECTOR
27Quarterly Report
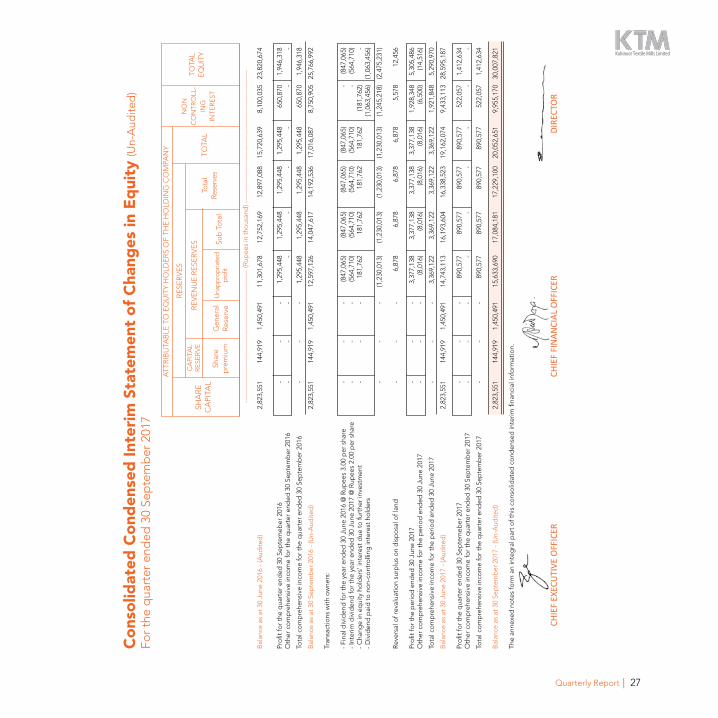
Co
nso
lidat
ed C
ond
ense
d In
teri
m S
tate
men
t o
f C
hang
es in
Eq
uity
(Un-
Aud
ited
)Fo
r th
e q
uart
er e
nded
30
Sep
tem
ber
201
7
CH
IEF
EXEC
UTI
VE O
FFIC
ER
CHIE
F FI
NAN
CIAL
OFF
ICER
DI
RECT
OR
SHA
RE
CA
pITA
LG
ener
alR
eser
ve
Tota
lRe
serv
es
NO
N
CO
NTR
OLL
-IN
GIN
TER
EST
TOTA
LEQ
UIT
YTO
TAL
CA
pITA
L R
ESE
RV
ER
EV
EN
UE
RE
SER
VE
S
RE
SER
VE
S
ATT
RIb
UTA
bLE
TO
EQ
UIT
Y H
OLD
ER
S O
F TH
E H
OLD
ING
CO
MpA
NY
Una
ppro
pria
ted
profi
tSu
b T
ota
lSh
are
pre
miu
m
---
----
----
----
----
----
----
----
----
----
----
----
----
----
----
(Rup
ees
in t
hous
and
) ---
----
----
----
----
----
----
----
----
----
----
----
----
----
----
bal
ance
as
at 3
0 Ju
ne 2
016
- (A
udite
d)
2,8
23,5
51
144
,919
1
,450
,491
1
1,30
1,67
8
12,
752,
169
1
2,89
7,08
8
15,
720,
639
8
,100
,035
23
,820
,674
pro
fit fo
r th
e q
uart
er e
nded
30
Sep
tem
eber
201
6 -
-
-
1,2
95,4
48
1,2
95,4
48
1,2
95,4
48
1,2
95,4
48
650
,870
1
,946
,318
O
ther
co
mp
rehe
nsiv
e in
com
e fo
r th
e q
uart
er e
nded
30
Sep
tem
ber
201
6 -
-
-
-
-
-
-
-
-
Tota
l co
mp
rehe
nsiv
e in
com
e fo
r th
e q
uart
er e
nded
30
Sep
tem
ber
201
6 -
-
-
1,2
95,4
48
1,2
95,4
48
1,2
95,4
48
1,2
95,4
48
650
,870
1
,946
,318
bal
ance
as
at 3
0 Se
pte
mb
er 2
016
- (U
n-A
udite
d)
2,8
23,5
51
144
,919
1
,450
,491
1
2,59
7,12
6
14,
047,
617
1
4,19
2,53
6
17,
016,
087
8
,750
,905
25
,766
,992
Tran
sact
ions
with
ow
ners
:
- Fi
nal d
ivid
end
for
the
year
end
ed 3
0 Ju
ne 2
016
@ R
upee
s 3.
00 p
er s
hare
-
-
-
(847
,065
) (8
47,0
65)
(847
,065
) (8
47,0
65)
-
(8
47,0
65)
- In
terim
div
iden
d fo
r th
e ye
ar e
nded
30
June
201
7 @
Rup
ees
2.00
per
sha
re
-
-
-
(5
64,7
10)
(564
,710
) (5
64,7
10)
(564
,710
) -
(564
,710
)-
Cha
nge
in e
qui
ty h
old
ers’
inte
rest
due
to
furt
her
inve
stm
ent
-
-
-
1
81,7
62
181
,762
1
81,7
62
181
,762
(1
81,7
62)
-
- D
ivid
end
pai
d t
o n
on-
cont
rolli
ng in
tere
st h
old
ers
(1
,063
,456
) (1
,063
,456
)
-
-
-
(1,2
30,0
13)
(1,2
30,0
13)
(1,2
30,0
13)
(1,2
30,0
13)
(1,2
45,2
18)
(2,4
75,2
31)
R
ever
sal o
f rev
alua
tion
surp
lus
on
dis
po
sal o
f lan
d
-
-
-
6
,878
6
,878
6
,878
6
,878
5
,578
1
2,45
6
pro
fit fo
r th
e p
erio
d e
nded
30
June
201
7 -
-
-
3,3
77,1
38
3,3
77,1
38
3,3
77,1
38
3,3
77,1
38
1,9
28,3
48
5,3
05,4
86
Oth
er c
om
pre
hens
ive
inco
me
for
the
per
iod
end
ed 3
0 Ju
ne 2
017
-
-
-
(8
,016
) (8
,016
) (8
,016
) (8
,016
) (6
,500
) (1
4,51
6)
Tota
l co
mp
rehe
nsiv
e in
com
e fo
r th
e p
erio
d e
nded
30
June
201
7 -
-
-
3,3
69,1
22
3,3
69,1
22
3,3
69,1
22
3,3
69,1
22
1,9
21,8
48
5,2
90,9
70
bal
ance
as
at 3
0 Ju
ne 2
017
- (A
udite
d)
2,8
23,5
51
144
,919
1
,450
,491
1
4,74
3,11
3
16,
193,
604
1
6,33
8,52
3
19,
162,
074
9
,433
,113
28
,595
,187
pro
fit fo
r th
e q
uart
er e
nded
30
Sep
tem
eber
201
7 -
-
-
890
,577
8
90,5
77
890
,577
8
90,5
77
522
,057
1
,412
,634
O
ther
co
mp
rehe
nsiv
e in
com
e fo
r th
e q
uart
er e
nded
30
Sep
tem
ber
201
7 -
-
-
-
-
-
-
-
-
Tota
l co
mp
rehe
nsiv
e in
com
e fo
r th
e q
uart
er e
nded
30
Sep
tem
ber
201
7 -
-
-
890
,577
8
90,5
77
890
,577
8
90,5
77
522
,057
1
,412
,634
bal
ance
as
at 3
0 Se
pte
mb
er 2
017
- (U
n-A
udite
d)
2,8
23,5
51
144
,919
1
,450
,491
1
5,63
3,69
0
17,
084,
181
1
7,22
9,10
0
20,
052,
651
9
,955
,170
30
,007
,821
The
anne
xed
no
tes
form
an
inte
gra
l par
t o
f thi
s co
nso
lidat
ed c
ond
ense
d in
terim
fina
ncia
l inf
orm
atio
n.
28 Kohinoor Textile Mills Limited
Selected Notes to the Consolidated Condensed Interim Financial Information (Un-Audited)For the quarter ended 30 September 2017
1. THE GROUp AND ITS OpERATIONS 1.1 Holding Company Kohinoor Textile Mills Limited (“the Holding Company”) is a public limited company
incorporated in pakistan under the Companies Act,1913 (now Companies Act 2017) and listed on pakistan Stock Exchange (pSX). The registered office of the Company is situated at 42-Lawrence Road, Lahore. The principal activity of the Holding Company is manufacturing of yarn and cloth, processing and stitching the cloth and trade of textile products.
The Holding Company holds 55.22% (30 June 2017: 55.22%) shares of Maple Leaf Cement
Factory Limited and 82.93% (30 June 2017: 82.93%) shares of Maple Leaf Capital Limited and 55.22% (30 June 2017: 55.22%) shares of Maple Leaf power Limited
1.2 Subsidiary Companies 1.2.1 Maple Leaf Cement factory Limited (MLCFL) Maple Leaf Cement Factory Limited (MLCFL) was incorporated in pakistan on 13 April, 1960
under the Companies Act, 1913 (now the Companies Act, 2017) as a public company limited by shares and was listed on stock exchange in pakistan on 17 August, 1994. The registered office of the Subsidiary is situated at 42-Lawrence Road, Lahore. The Subsidiary is engaged in production and sale of cement.
1.2.2 Maple Leaf Capital Limited (MLCL) Maple Leaf Capital Limited (MLCL) was incorporated in pakistan on 25 April, 2014 under
the Companies Ordinance, 1984(Now Comapnies Act 2017) as a public company.The registered office of the Subsidiary is situated at 42-Lawrence Road, Lahore. The principal objects of the Subsidiary are to buy, sell, hold, or otherwise acquire or invest the capital in any sort of financial instruments.
1.2.3 Maple Leaf power Limited (MLpL) Maple Leaf power Limited (“the Subsidiary”) was incorporated in pakistan on 15 October
2015 as a public limited company under the Companies Ordinance, 1984 (Now the Comanies Act 2017). The registered office of MLpL is located at 42-Lawrence Road,
29Quarterly Report
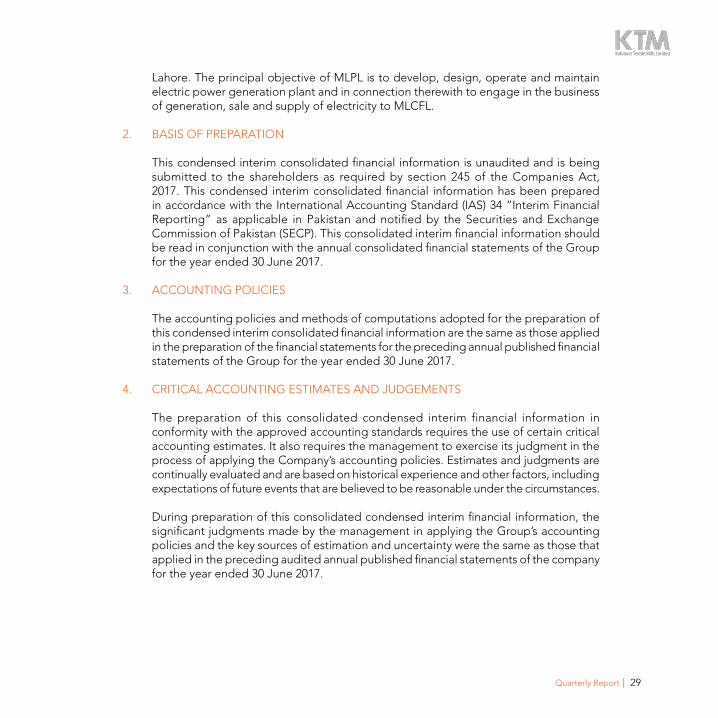
Lahore. The principal objective of MLpL is to develop, design, operate and maintain electric power generation plant and in connection therewith to engage in the business of generation, sale and supply of electricity to MLCFL.
2. bASIS OF pREpARATION This condensed interim consolidated financial information is unaudited and is being
submitted to the shareholders as required by section 245 of the Companies Act, 2017. This condensed interim consolidated financial information has been prepared in accordance with the International Accounting Standard (IAS) 34 “Interim Financial Reporting” as applicable in pakistan and notified by the Securities and Exchange Commission of pakistan (SECp). This consolidated interim financial information should be read in conjunction with the annual consolidated financial statements of the Group for the year ended 30 June 2017.
3. ACCOUNTING pOLICIES The accounting policies and methods of computations adopted for the preparation of
this condensed interim consolidated financial information are the same as those applied in the preparation of the financial statements for the preceding annual published financial statements of the Group for the year ended 30 June 2017.
4. CRITICAL ACCOUNTING ESTIMATES AND JUDGEMENTS The preparation of this consolidated condensed interim financial information in
conformity with the approved accounting standards requires the use of certain critical accounting estimates. It also requires the management to exercise its judgment in the process of applying the Company’s accounting policies. Estimates and judgments are continually evaluated and are based on historical experience and other factors, including expectations of future events that are believed to be reasonable under the circumstances.
During preparation of this consolidated condensed interim financial information, the
significant judgments made by the management in applying the Group’s accounting policies and the key sources of estimation and uncertainty were the same as those that applied in the preceding audited annual published financial statements of the company for the year ended 30 June 2017.
30 Kohinoor Textile Mills Limited
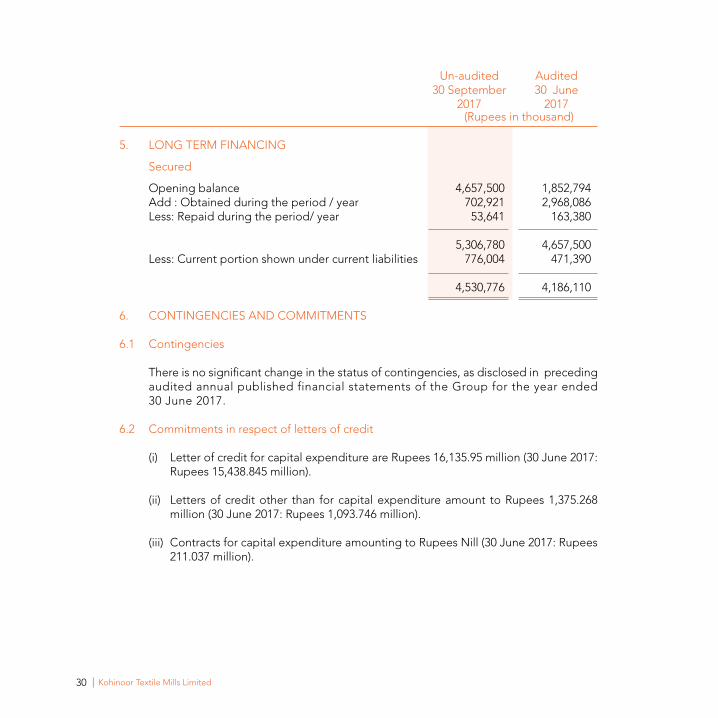
Un-audited Audited 30 September 30 June 2017 2017 (Rupees in thousand)
5. LONG TERM FINANCING Secured Opening balance 4,657,500 1,852,794 Add : Obtained during the period / year 702,921 2,968,086 Less: Repaid during the period/ year 53,641 163,380
5,306,780 4,657,500 Less: Current portion shown under current liabilities 776,004 471,390 4,530,776 4,186,110 6. CONTINGENCIES AND COMMITMENTS 6.1 Contingencies There is no significant change in the status of contingencies, as disclosed in preceding
audited annual published financial statements of the Group for the year ended 30 June 2017.
6.2 Commitments in respect of letters of credit (i) Letter of credit for capital expenditure are Rupees 16,135.95 million (30 June 2017:
Rupees 15,438.845 million). (ii) Letters of credit other than for capital expenditure amount to Rupees 1,375.268
million (30 June 2017: Rupees 1,093.746 million). (iii) Contracts for capital expenditure amounting to Rupees Nill (30 June 2017: Rupees
211.037 million).
31Quarterly Report
Un-audited Audited 30 September 30 June 2017 2017 (Rupees in thousand)
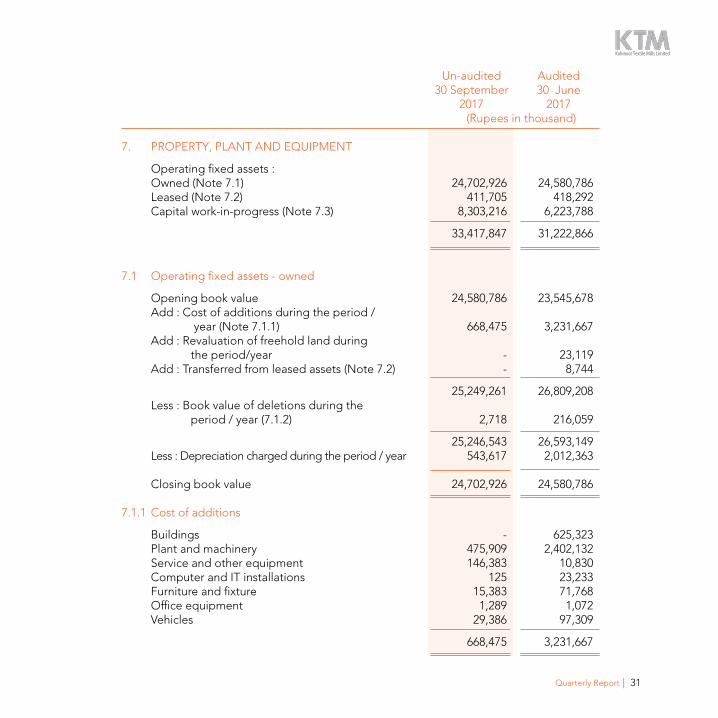
7. pROpERTY, pLANT AND EQUIpMENT Operating fixed assets : Owned (Note 7.1) 24,702,926 24,580,786 Leased (Note 7.2) 411,705 418,292 Capital work-in-progress (Note 7.3) 8,303,216 6,223,788 33,417,847 31,222,866
7.1 Operating fixed assets - owned Opening book value 24,580,786 23,545,678 Add : Cost of additions during the period / year (Note 7.1.1) 668,475 3,231,667 Add : Revaluation of freehold land during the period/year - 23,119 Add : Transferred from leased assets (Note 7.2) - 8,744 25,249,261 26,809,208 Less : book value of deletions during the period / year (7.1.2) 2,718 216,059 25,246,543 26,593,149 Less : Depreciation charged during the period / year 543,617 2,012,363
Closing book value 24,702,926 24,580,786 7.1.1 Cost of additions buildings - 625,323 plant and machinery 475,909 2,402,132 Service and other equipment 146,383 10,830 Computer and IT installations 125 23,233 Furniture and fixture 15,383 71,768 Office equipment 1,289 1,072 Vehicles 29,386 97,309 668,475 3,231,667
32 Kohinoor Textile Mills Limited
Un-audited Audited 30 September 30 June 2017 2017 (Rupees in thousand)
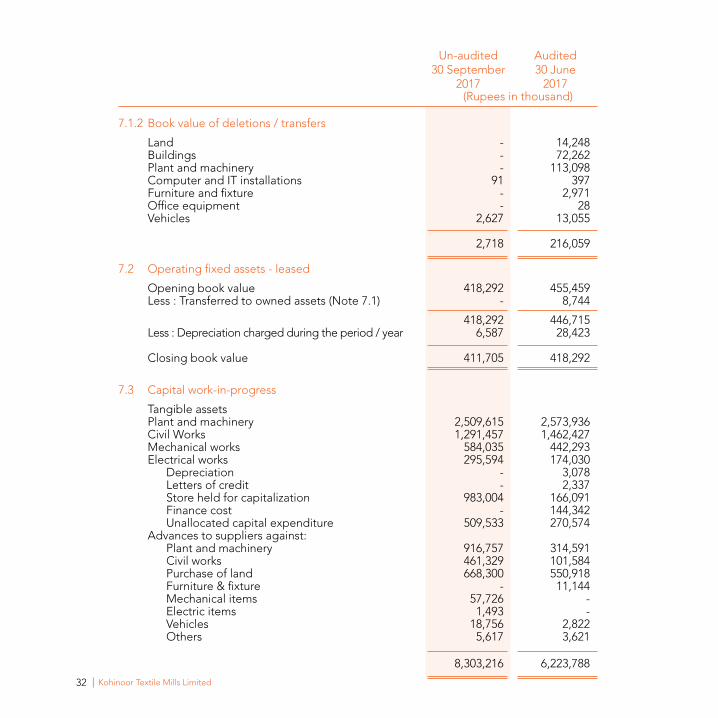
7.1.2 book value of deletions / transfers Land - 14,248 buildings - 72,262 plant and machinery - 113,098 Computer and IT installations 91 397 Furniture and fixture - 2,971 Office equipment - 28 Vehicles 2,627 13,055 2,718 216,059 7.2 Operating fixed assets - leased Opening book value 418,292 455,459 Less : Transferred to owned assets (Note 7.1) - 8,744 418,292 446,715 Less : Depreciation charged during the period / year 6,587 28,423 Closing book value 411,705 418,292
7.3 Capital work-in-progress Tangible assets plant and machinery 2,509,615 2,573,936 Civil Works 1,291,457 1,462,427 Mechanical works 584,035 442,293 Electrical works 295,594 174,030 Depreciation - 3,078 Letters of credit - 2,337 Store held for capitalization 983,004 166,091 Finance cost - 144,342 Unallocated capital expenditure 509,533 270,574 Advances to suppliers against: plant and machinery 916,757 314,591 Civil works 461,329 101,584 purchase of land 668,300 550,918 Furniture & fixture - 11,144 Mechanical items 57,726 - Electric items 1,493 - Vehicles 18,756 2,822 Others 5,617 3,621 8,303,216 6,223,788
33Quarterly Report
Un-audited Un-audited 30 September 30 September 2017 2016 (Rupees in thousand)
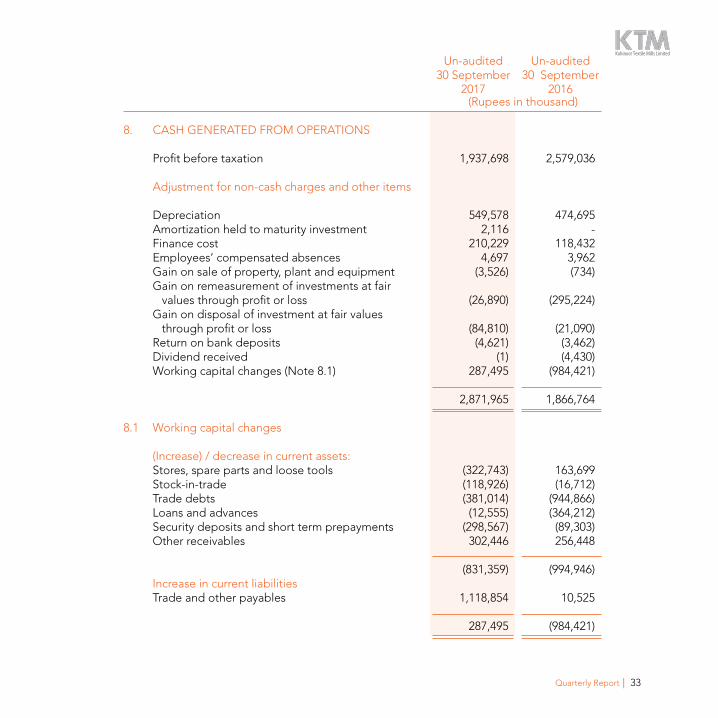
8. CASH GENERATED FROM OpERATIONS profit before taxation 1,937,698 2,579,036 Adjustment for non-cash charges and other items Depreciation 549,578 474,695 Amortization held to maturity investment 2,116 - Finance cost 210,229 118,432 Employees’ compensated absences 4,697 3,962 Gain on sale of property, plant and equipment (3,526) (734) Gain on remeasurement of investments at fair values through profit or loss (26,890) (295,224) Gain on disposal of investment at fair values through profit or loss (84,810) (21,090) Return on bank deposits (4,621) (3,462) Dividend received (1) (4,430) Working capital changes (Note 8.1) 287,495 (984,421) 2,871,965 1,866,764 8.1 Working capital changes (Increase) / decrease in current assets: Stores, spare parts and loose tools (322,743) 163,699 Stock-in-trade (118,926) (16,712) Trade debts (381,014) (944,866) Loans and advances (12,555) (364,212) Security deposits and short term prepayments (298,567) (89,303) Other receivables 302,446 256,448 (831,359) (994,946) Increase in current liabilities Trade and other payables 1,118,854 10,525 287,495 (984,421)
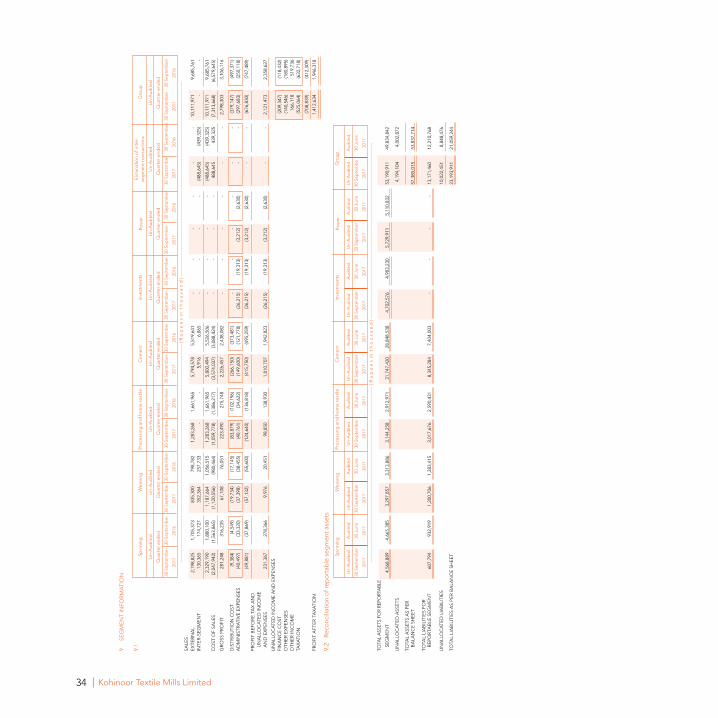
34 Kohinoor Textile Mills Limited
9
SE
GM
EN
T IN
FOR
MA
TIO
N
9.1
Sp
inni
ng
Wea
ving
p
roce
ssin
g a
nd h
om
e te
xtile
C
emen
t In
vest
men
ts
po
wer
E
limin
atio
n o
f int
er-
Gro
up
seg
men
t tr
ansa
ctio
ns
U
n-A
udite
d
Un-
Aud
ited
U
n-A
udite
d
Un-
Aud
ited
U
n-A
udite
d
Un-
Aud
ited
U
n-A
udite
d
Un-
Aud
ited
Q
uart
er e
nded
Q
uart
er e
nded
Q
uart
er e
nded
Q
uart
er e
nded
Q
uart
er e
nded
Q
uart
er e
nded
Q
uart
er e
nded
Q
uart
er e
nded
30
Sep
tem
ber
30
Sep
tem
ber
30
Sep
tem
ber
30
Sep
tem
ber
30
Sep
tem
ber
30
Sep
tem
ber
30
Sep
tem
ber
30
Sep
tem
ber
30
Sep
tem
ber
30
Sep
tem
ber
30
Sep
tem
ber
3
0 Se
pte
mb
er
30
Sep
tem
ber
3
0 Se
pte
mb
er 3
0 Se
pte
mb
er
30 S
epte
mb
er
20
17
2016
20
17
2016
20
17
2016
20
17
2016
20
17
2016
20
17
2016
20
17
2016
20
17
2016
--
----
----
----
----
----
----
----
----
----
----
----
----
----
----
----
----
----
----
----
----
----
----
----
----
----
----
----
----
----
----
----
----
----
- ( R
u p
e e
s i
n t
h o
u s
a n
d )
----
----
----
----
----
----
----
----
----
----
----
----
----
----
----
----
----
----
----
----
----
----
----
----
----
----
----
----
----
----
- SA
LES
:
EX
TE
RN
AL
2
,198
,825
1
,705
,373
8
35,3
00
798
,782
1
,283
,268
1
,661
,965
5
,794
,578
5
,519
,641
-
-
-
-
-
-
1
0,11
1,97
1
9,6
85,7
61
INT
ER
-SE
GM
EN
T
130
,365
1
74,7
27
352
,364
2
57,7
33
-
-
5,9
16
6,8
65
-
-
-
-
(488
,645
) (4
39,3
25)
-
-
2
,329
,190
1
,880
,100
1
,187
,664
1
,056
,515
1
,283
,268
1
,661
,965
5
,800
,494
5
,526
,506
-
-
-
-
(4
88,6
45)
(439
,325
) 1
0,11
1,97
1
9,6
85,7
61
CO
ST O
F SA
LES
(2,0
47,9
42)
(1,5
63,8
65)
(1,1
20,5
56)
(980
,464
) (1
,059
,778
) (1
,386
,217
) (3
,574
,037
) (3
,088
,424
) -
-
-
-
4
88,6
45
439
,325
(7
,313
,668
) (6
,579
,645
)
GR
OSS
pR
OFI
T
281
,248
3
16,2
35
67,
108
7
6,05
1
223
,490
2
75,7
48
2,2
26,4
57
2,4
38,0
82
-
-
-
-
-
-
2,7
98,3
03
3,1
06,1
16
DIS
TR
IbU
TIO
N C
OST
(9
,384
) (4
,549
) (1
9,73
4)
(17,
145)
(8
3,87
9)
(102
,196
) (2
66,1
50)
(373
,481
) -
-
-
-
-
-
(3
79,1
47)
(497
,371
)A
DM
INIS
TR
AT
IVE
EX
pE
NSE
S (4
0,49
7)
(33,
320)
(3
7,39
8)
(38,
455)
(4
0,76
1)
(34,
622)
(1
49,6
00)
(121
,778
) (2
6,21
5)
(19,
313)
(3
,212
) (2
,630
) -
-
(2
97,6
83)
(250
,118
)
(4
9,88
1)
(37,
869)
(5
7,13
2)
(55,
600)
(1
24,6
40)
(136
,818
) (4
15,7
50)
(495
,259
) (2
6,21
5)
(19,
313)
(3
,212
) (2
,630
) -
-
(6
76,8
30)
(747
,489
)p
RO
FIT
bE
FOR
E T
AX
AN
D
U
NA
LLO
CA
TE
D IN
CO
ME
AN
D E
Xp
EN
SES
231
,367
2
78,3
66
9,9
76
20,
451
9
8,85
0
138
,930
1
,810
,707
1
,942
,823
(2
6,21
5)
(19,
313)
(3
,212
) (2
,630
) -
-
2
,121
,473
2
,358
,627
UN
ALL
OC
AT
ED
INC
OM
E A
ND
EX
pE
NSE
S
FIN
AN
CE
CO
ST
(209
,347
) (1
18,4
32)
OT
HE
R E
Xp
EN
SES
(140
,546
) (1
80,8
95)
OT
HE
R IN
CO
ME
1
66,1
18
519
,736
TA
XA
TIO
N
(525
,064
) (6
32,7
18)
(7
08,8
39)
(412
,309
)
pR
OFI
T A
FTE
R T
AX
AT
ION
1
,412
,634
1
,946
,318
9.2
Rec
onc
iliat
ion
of r
epo
rtab
le s
egm
ent
asse
ts
Spin
ning
W
eavi
ng
pro
cess
ing
and
ho
me
text
ile
Cem
ent
Inve
stm
ents
p
ow
er
Gro
up
U
n-A
udite
d
Aud
ited
U
n-A
udite
d
Aud
ited
U
n-A
udite
d
Aud
ited
U
n-A
udite
d
Aud
ited
U
n-A
udite
d
Aud
ited
U
n-A
udite
d
Aud
ited
U
n-A
udite
d
Aud
ited
30
Sep
tem
ber
30
Jun
e 30
Sep
tem
ber
30
Jun
e 30
Sep
tem
ber
30
Jun
e 30
Sep
tem
ber
30
Jun
e 30
Sep
tem
ber
30
Jun
e 30
Sep
tem
ber
30
June
30
Sep
tem
be
30 J
une
20
17
2017
20
17
2017
20
17
2017
20
17
2017
20
17
2017
20
17
2017
20
17
2017
--
----
----
----
----
----
----
----
----
----
----
----
----
----
----
----
----
----
----
----
----
----
----
----
----
----
----
---
( R u
p e
e s
in
t h
o u
s a
n d
) --
----
----
----
----
----
----
----
----
----
----
----
----
----
----
----
----
----
----
----
----
----
----
----
----
----
----
---
TOTA
L A
SSET
S FO
R RE
pORT
Ab
LE
SE
GM
EN
T
4,5
68,8
89
4,6
65,3
85
3,2
97,8
57
3,3
13,8
86
3,1
44,2
58
2,9
12,9
71
31,
747,
420
2
8,84
8,53
8
4,7
02,5
76
4,9
83,2
30
5,7
29,9
11
5,1
10,8
32
53,
190,
911
4
9,83
4,84
2
UN
ALL
OC
AT
ED
ASS
ET
S
4
,194
,104
4
,002
,872
TO
TAL
ASS
ET
S A
S p
ER
bA
LAN
CE
SH
EE
T
57,
385,
015
5
3,83
7,71
4
TO
TAL
LIA
bIL
ITIE
S FO
R
R
Ep
OR
TAb
LE S
EG
ME
NT
6
07,7
94
932
,919
1
,200
,706
1
,283
,415
3
,017
,676
2
,590
,431
8
,345
,284
7
,404
,003
-
-
-
-
1
3,17
1,46
0
12,
210,
768
UN
ALL
OC
AT
ED
LIA
bIL
ITIE
S
1
0,02
2,45
1
8,8
48,4
76
TO
TAL
LIA
bIL
ITIE
S A
S p
ER
bA
LAN
CE
SH
EE
T
2
3,19
3,91
1
21,
059,
244
35Quarterly Report
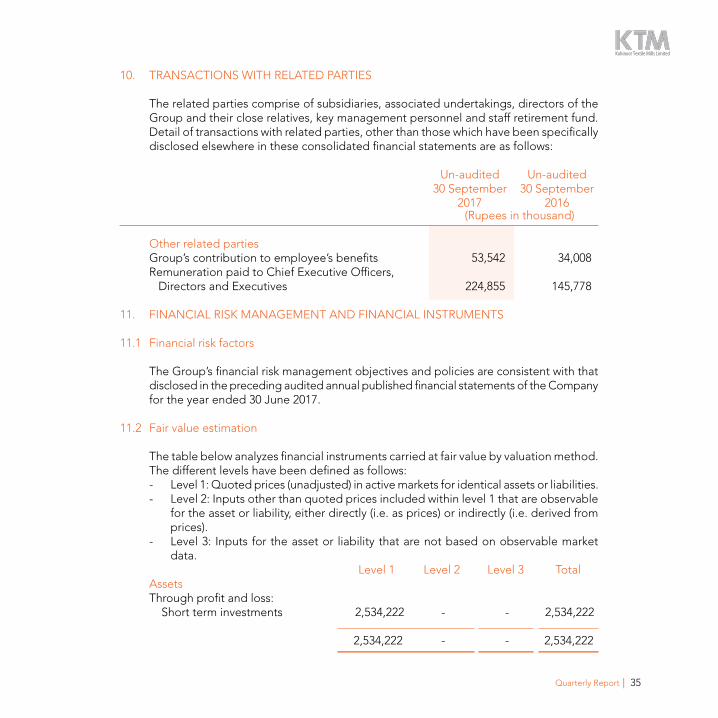
10. TRANSACTIONS WITH RELATED pARTIES The related parties comprise of subsidiaries, associated undertakings, directors of the
Group and their close relatives, key management personnel and staff retirement fund. Detail of transactions with related parties, other than those which have been specifically disclosed elsewhere in these consolidated financial statements are as follows:
Un-audited Un-audited 30 September 30 September 2017 2016 (Rupees in thousand)
Other related parties Group’s contribution to employee’s benefits 53,542 34,008 Remuneration paid to Chief Executive Officers, Directors and Executives 224,855 145,778 11. FINANCIAL RISK MANAGEMENT AND FINANCIAL INSTRUMENTS 11.1 Financial risk factors The Group’s financial risk management objectives and policies are consistent with that
disclosed in the preceding audited annual published financial statements of the Company for the year ended 30 June 2017.
11.2 Fair value estimation The table below analyzes financial instruments carried at fair value by valuation method.
The different levels have been defined as follows: - Level 1: Quoted prices (unadjusted) in active markets for identical assets or liabilities. - Level 2: Inputs other than quoted prices included within level 1 that are observable
for the asset or liability, either directly (i.e. as prices) or indirectly (i.e. derived from prices).
- Level 3: Inputs for the asset or liability that are not based on observable market data.
Level 1 Level 2 Level 3 Total Assets Through profit and loss: Short term investments 2,534,222 - - 2,534,222 2,534,222 - - 2,534,222
36 Kohinoor Textile Mills Limited
12. GENERAL 12.1 This consolidated condensed interim financial information was approved by the board
of Directors and authorised for issue on 24 October 2017. 12.2 No significant reclassification / rearrangements of corresponding figures has been made. 12.3 Figures have been rounded off to the nearest thousand of Rupees unless otherwise
stated.
CHIEF EXECUTIVE OFFICER CHIEF FINANCIAL OFFICER DIRECTOR
42-Lawrence Road, Lahore, Pakistan