Embed Size (px)
Citation preview
Ed
FVa
b
c
d
e
a
ARRAA
KDSLCHF
1
ogam(
dA
h0
International Journal of Applied Earth Observation and Geoinformation 47 (2016) 60–68
Contents lists available at ScienceDirect
International Journal of Applied Earth Observation andGeoinformation
jo ur nal home p age: www.elsev ier .com/ locate / jag
stimation of canopy attributes in beech forests using true colourigital images from a small fixed-wing UAV
rancesco Chianuccia,b,c,∗, Leonardo Disperatib,e, Donatella Guzzic, Daniele Bianchinid,anni Nardinoc, Cinzia Lastri c, Andrea Rindinellab,e, Piermaria Coronaa
Consiglio per la Ricerca in Agricoltura e l’Analisi dell’Economia Agraria—Forestry Research Centre, viale Santa Margherita 80, 52100 Arezzo, ItalyUniversità di Siena, Centro di GeoTecnologie, via Vetri Vecchi 34, 52027 San Giovanni Valdarno, ItalyConsiglio Nazionale delle Ricerche, via Madonna del Piano 10, 50019 Sesto Fiorentino, ItalyMenci Software, Loc. Tregozzano 87, 52100 Arezzo, ItalyUniversità di Siena, Dipartimento di Scienze Fisiche, della Terra e dell’Ambiente, 8, 53100 Siena, Italy
r t i c l e i n f o
rticle history:eceived 1 October 2015eceived in revised form 1 December 2015ccepted 2 December 2015vailable online 17 December 2015
eywords:roneensefly eBeeeaf area indexover photographyemispherical photographyagus sylvatica
a b s t r a c t
Accurate estimates of forest canopy are essential for the characterization of forest ecosystems. Remotely-sensed techniques provide a unique way to obtain estimates over spatially extensive areas, but theirapplication is limited by the spectral and temporal resolution available from these systems, which isoften not suited to meet regional or local objectives. The use of unmanned aerial vehicles (UAV) as remotesensing platforms has recently gained increasing attention, but their applications in forestry are still atan experimental stage. In this study we described a methodology to obtain rapid and reliable estimates offorest canopy from a small UAV equipped with a commercial RGB camera. The red, green and blue digitalnumbers were converted to the green leaf algorithm (GLA) and to the CIE L∗a∗b∗ colour space to obtainestimates of canopy cover, foliage clumping and leaf area index (L) from aerial images. Canopy attributeswere compared with in situ estimates obtained from two digital canopy photographic techniques (coverand fisheye photography).
The method was tested in beech forests. UAV images accurately quantified canopy cover even in verydense stand conditions, despite a tendency to not detecting small within-crown gaps in aerial images,leading to a measurement of a quantity much closer to crown cover estimated from in situ cover photog-raphy. Estimates of L from UAV images significantly agreed with that obtained from fisheye images, but
the accuracy of UAV estimates is influenced by the appropriate assumption of leaf angle distribution.We concluded that true colour UAV images can be effectively used to obtain rapid, cheap and mean-ingful estimates of forest canopy attributes at medium-large scales. UAV can combine the advantage ofhigh resolution imagery with quick turnaround series, being therefore suitable for routine forest standmonitoring and real-time applications.
© 2015 Elsevier B.V. All rights reserved.
. Introduction
Accurate estimates of forest canopy are central for a wide rangef studies including hydrology, carbon and nutrient cycling, andlobal change. Leaf area index (L), canopy cover and clumping index
re amongst the most widely used canopy attributes. Ground-basedethods to estimate these variables include either direct contactdestructive sampling) or indirect optical methods (for a review,
∗ Corresponding author at: Consiglio per la Ricerca in Agricoltura e l’Analisiell’Economia Agraria—Forestry Research Centre, viale Santa Margherita 80, 52100rezzo, Italy. Fax: +39 0575 353490.
E-mail address: [email protected] (F. Chianucci).
ttp://dx.doi.org/10.1016/j.jag.2015.12.005303-2434/© 2015 Elsevier B.V. All rights reserved.
see Jonckheere et al., 2004). Generally, both approaches are timeconsuming and unpractical for large forest areas. In addition, thesemethods are unsuitable for real-time application such as moni-toring wildfire spread or plant disease outbreaks (Anderson andGaston, 2013). Remotely-sensed information offers a unique wayto obtain large scale mapping of forest canopy attributes. In par-ticular, several studies indicated that space-borne sensors can beused to obtain spatially extensive information from landscape tothe global scale (e.g., Davi et al., 2006; Turner et al., 1999; Hu et al.,2007; Lamonaca et al., 2008; Pellikka et al., 2009; Prospatin and
Panferov, 2013). However, the spatial and temporal resolutions ofsatellite-based data are often not suited to meet regional or localobjectives. New satellite sensors have become operational over thepast decade, offering data at finer spatial scale and more respon-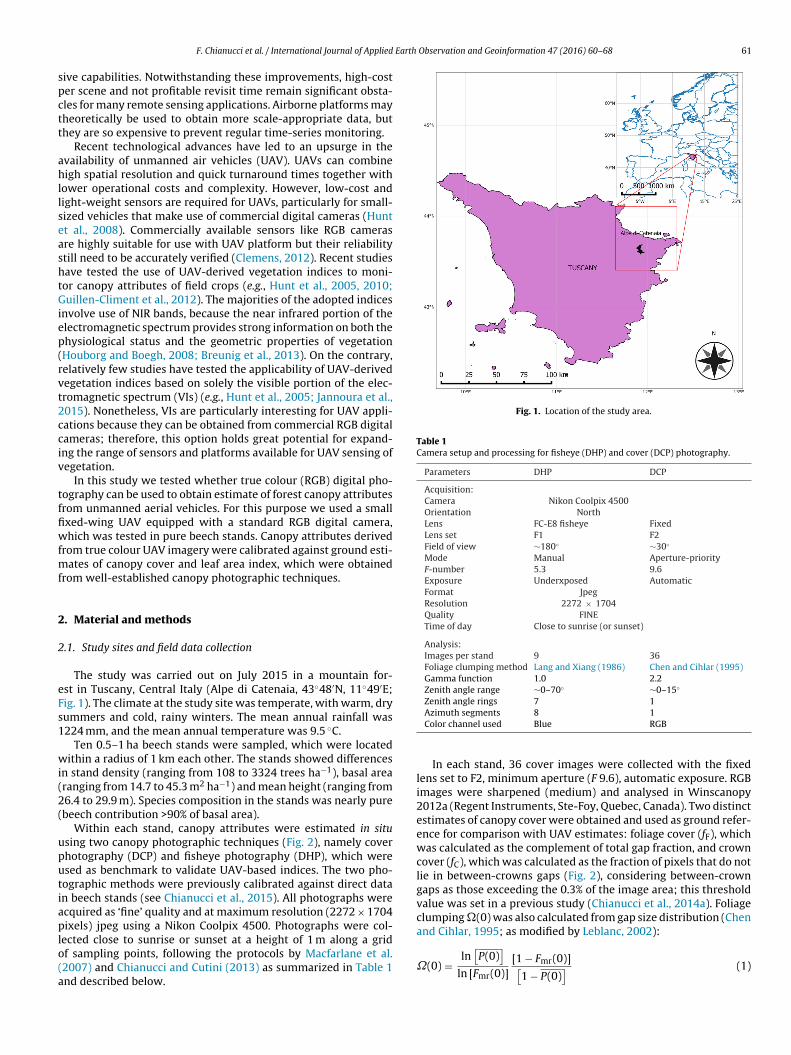
Earth Observation and Geoinformation 47 (2016) 60–68 61
spctt
ahllseashtGiep(rvt2cciv
tffiwfmf
2
2
eFs1
wi(2(
uputiaplo(a
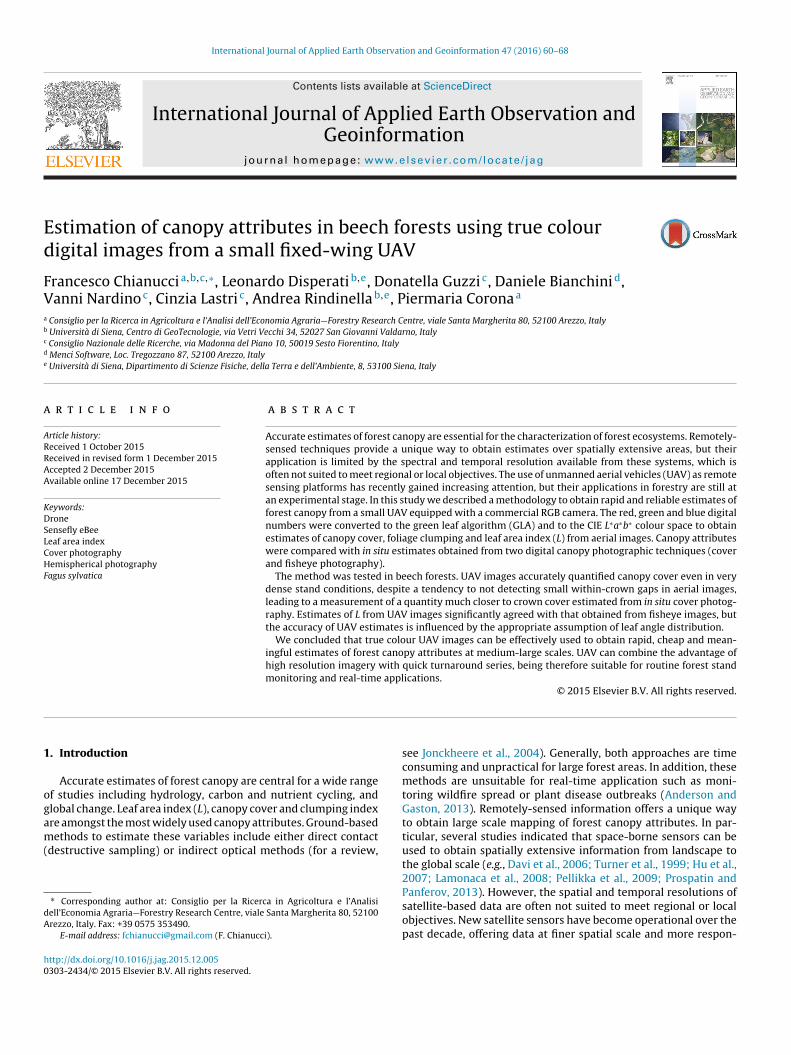
Fig. 1. Location of the study area.
Table 1Camera setup and processing for fisheye (DHP) and cover (DCP) photography.
Parameters DHP DCP
Acquisition:Camera Nikon Coolpix 4500Orientation NorthLens FC-E8 fisheye FixedLens set F1 F2Field of view ∼180◦ ∼30◦
Mode Manual Aperture-priorityF-number 5.3 9.6Exposure Underxposed AutomaticFormat JpegResolution 2272 × 1704Quality FINETime of day Close to sunrise (or sunset)
Analysis:Images per stand 9 36Foliage clumping method Lang and Xiang (1986) Chen and Cihlar (1995)Gamma function 1.0 2.2Zenith angle range ∼0–70◦ ∼0–15◦
Zenith angle rings 7 1
F. Chianucci et al. / International Journal of Applied
ive capabilities. Notwithstanding these improvements, high-coster scene and not profitable revisit time remain significant obsta-les for many remote sensing applications. Airborne platforms mayheoretically be used to obtain more scale-appropriate data, buthey are so expensive to prevent regular time-series monitoring.
Recent technological advances have led to an upsurge in thevailability of unmanned air vehicles (UAV). UAVs can combineigh spatial resolution and quick turnaround times together with
ower operational costs and complexity. However, low-cost andight-weight sensors are required for UAVs, particularly for small-ized vehicles that make use of commercial digital cameras (Huntt al., 2008). Commercially available sensors like RGB camerasre highly suitable for use with UAV platform but their reliabilitytill need to be accurately verified (Clemens, 2012). Recent studiesave tested the use of UAV-derived vegetation indices to moni-or canopy attributes of field crops (e.g., Hunt et al., 2005, 2010;uillen-Climent et al., 2012). The majorities of the adopted indices
nvolve use of NIR bands, because the near infrared portion of thelectromagnetic spectrum provides strong information on both thehysiological status and the geometric properties of vegetationHouborg and Boegh, 2008; Breunig et al., 2013). On the contrary,elatively few studies have tested the applicability of UAV-derivedegetation indices based on solely the visible portion of the elec-romagnetic spectrum (VIs) (e.g., Hunt et al., 2005; Jannoura et al.,015). Nonetheless, VIs are particularly interesting for UAV appli-ations because they can be obtained from commercial RGB digitalameras; therefore, this option holds great potential for expand-ng the range of sensors and platforms available for UAV sensing ofegetation.
In this study we tested whether true colour (RGB) digital pho-ography can be used to obtain estimate of forest canopy attributesrom unmanned aerial vehicles. For this purpose we used a smallxed-wing UAV equipped with a standard RGB digital camera,hich was tested in pure beech stands. Canopy attributes derived
rom true colour UAV imagery were calibrated against ground esti-ates of canopy cover and leaf area index, which were obtained
rom well-established canopy photographic techniques.
. Material and methods
.1. Study sites and field data collection
The study was carried out on July 2015 in a mountain for-st in Tuscany, Central Italy (Alpe di Catenaia, 43◦48′N, 11◦49′E;ig. 1). The climate at the study site was temperate, with warm, dryummers and cold, rainy winters. The mean annual rainfall was224 mm, and the mean annual temperature was 9.5 ◦C.
Ten 0.5–1 ha beech stands were sampled, which were locatedithin a radius of 1 km each other. The stands showed differences
n stand density (ranging from 108 to 3324 trees ha−1), basal arearanging from 14.7 to 45.3 m2 ha−1) and mean height (ranging from6.4 to 29.9 m). Species composition in the stands was nearly purebeech contribution >90% of basal area).
Within each stand, canopy attributes were estimated in situsing two canopy photographic techniques (Fig. 2), namely coverhotography (DCP) and fisheye photography (DHP), which weresed as benchmark to validate UAV-based indices. The two pho-ographic methods were previously calibrated against direct datan beech stands (see Chianucci et al., 2015). All photographs werecquired as ‘fine’ quality and at maximum resolution (2272 × 1704ixels) jpeg using a Nikon Coolpix 4500. Photographs were col-
ected close to sunrise or sunset at a height of 1 m along a gridf sampling points, following the protocols by Macfarlane et al.2007) and Chianucci and Cutini (2013) as summarized in Table 1nd described below.
Azimuth segments 8 1Color channel used Blue RGB
In each stand, 36 cover images were collected with the fixedlens set to F2, minimum aperture (F 9.6), automatic exposure. RGBimages were sharpened (medium) and analysed in Winscanopy2012a (Regent Instruments, Ste-Foy, Quebec, Canada). Two distinctestimates of canopy cover were obtained and used as ground refer-ence for comparison with UAV estimates: foliage cover (fF), whichwas calculated as the complement of total gap fraction, and crowncover (fC), which was calculated as the fraction of pixels that do notlie in between-crowns gaps (Fig. 2), considering between-crowngaps as those exceeding the 0.3% of the image area; this thresholdvalue was set in a previous study (Chianucci et al., 2014a). Foliageclumping �(0) was also calculated from gap size distribution (Chenand Cihlar, 1995; as modified by Leblanc, 2002):
˝(0) =ln
[P(0)
]
ln [Fmr(0)][1 − Fmr(0)][
1 − P(0)] (1)
62 F. Chianucci et al. / International Journal of Applied Earth Observation and Geoinformation 47 (2016) 60–68
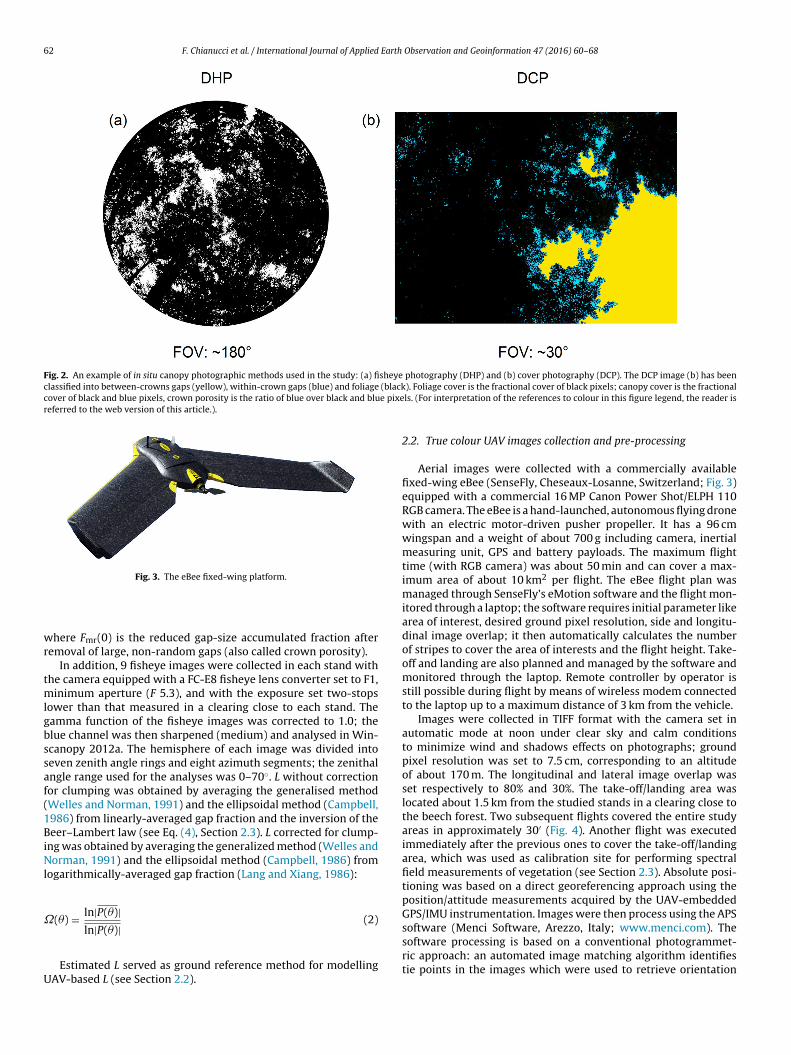
Fig. 2. An example of in situ canopy photographic methods used in the study: (a) fisheye photography (DHP) and (b) cover photography (DCP). The DCP image (b) has beenclassified into between-crowns gaps (yellow), within-crown gaps (blue) and foliage (blackcover of black and blue pixels, crown porosity is the ratio of blue over black and blue pixereferred to the web version of this article.).
Fig. 3. The eBee fixed-wing platform.
wr
tmlgbssaf(1BiNl
˝
U
software processing is based on a conventional photogrammet-ric approach: an automated image matching algorithm identifies
here Fmr(0) is the reduced gap-size accumulated fraction afteremoval of large, non-random gaps (also called crown porosity).
In addition, 9 fisheye images were collected in each stand withhe camera equipped with a FC-E8 fisheye lens converter set to F1,
inimum aperture (F 5.3), and with the exposure set two-stopsower than that measured in a clearing close to each stand. Theamma function of the fisheye images was corrected to 1.0; thelue channel was then sharpened (medium) and analysed in Win-canopy 2012a. The hemisphere of each image was divided intoeven zenith angle rings and eight azimuth segments; the zenithalngle range used for the analyses was 0–70◦. L without correctionor clumping was obtained by averaging the generalised methodWelles and Norman, 1991) and the ellipsoidal method (Campbell,986) from linearly-averaged gap fraction and the inversion of theeer–Lambert law (see Eq. (4), Section 2.3). L corrected for clump-
ng was obtained by averaging the generalized method (Welles andorman, 1991) and the ellipsoidal method (Campbell, 1986) from
ogarithmically-averaged gap fraction (Lang and Xiang, 1986):
(�) = ln|P(�)|ln|P(�)|
(2)
Estimated L served as ground reference method for modellingAV-based L (see Section 2.2).
). Foliage cover is the fractional cover of black pixels; canopy cover is the fractionalls. (For interpretation of the references to colour in this figure legend, the reader is
2.2. True colour UAV images collection and pre-processing
Aerial images were collected with a commercially availablefixed-wing eBee (SenseFly, Cheseaux-Losanne, Switzerland; Fig. 3)equipped with a commercial 16 MP Canon Power Shot/ELPH 110RGB camera. The eBee is a hand-launched, autonomous flying dronewith an electric motor-driven pusher propeller. It has a 96 cmwingspan and a weight of about 700 g including camera, inertialmeasuring unit, GPS and battery payloads. The maximum flighttime (with RGB camera) was about 50 min and can cover a max-imum area of about 10 km2 per flight. The eBee flight plan wasmanaged through SenseFly’s eMotion software and the flight mon-itored through a laptop; the software requires initial parameter likearea of interest, desired ground pixel resolution, side and longitu-dinal image overlap; it then automatically calculates the numberof stripes to cover the area of interests and the flight height. Take-off and landing are also planned and managed by the software andmonitored through the laptop. Remote controller by operator isstill possible during flight by means of wireless modem connectedto the laptop up to a maximum distance of 3 km from the vehicle.
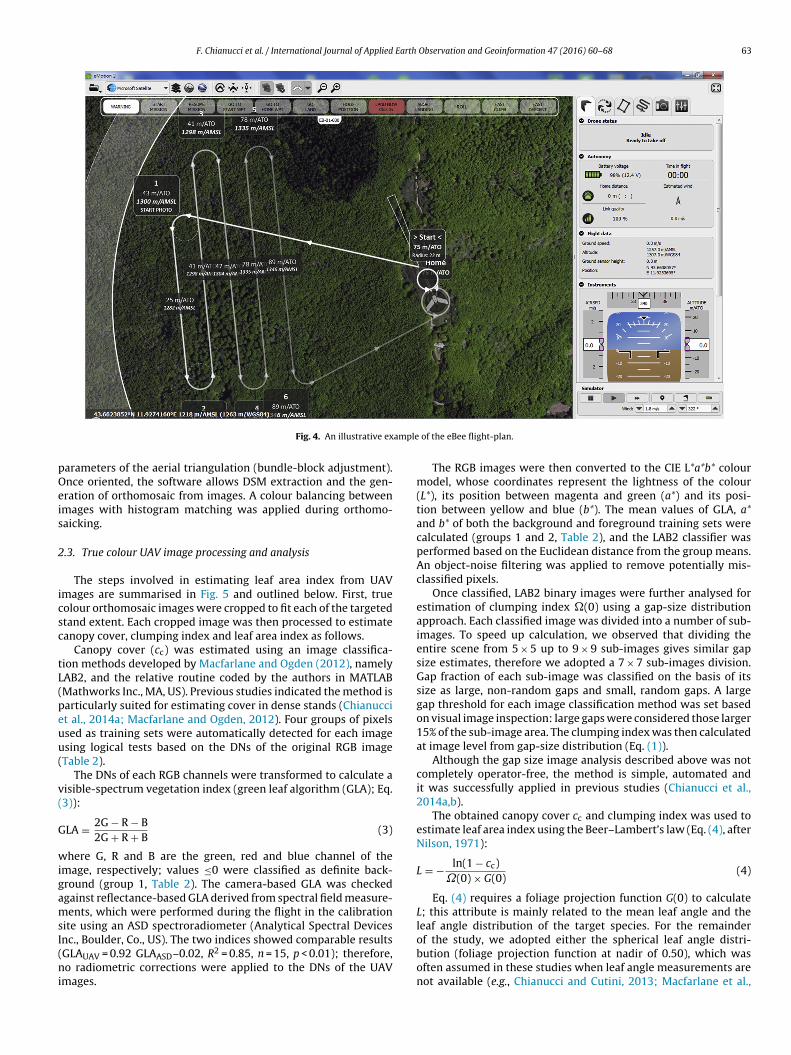
Images were collected in TIFF format with the camera set inautomatic mode at noon under clear sky and calm conditionsto minimize wind and shadows effects on photographs; groundpixel resolution was set to 7.5 cm, corresponding to an altitudeof about 170 m. The longitudinal and lateral image overlap wasset respectively to 80% and 30%. The take-off/landing area waslocated about 1.5 km from the studied stands in a clearing close tothe beech forest. Two subsequent flights covered the entire studyareas in approximately 30′ (Fig. 4). Another flight was executedimmediately after the previous ones to cover the take-off/landingarea, which was used as calibration site for performing spectralfield measurements of vegetation (see Section 2.3). Absolute posi-tioning was based on a direct georeferencing approach using theposition/attitude measurements acquired by the UAV-embeddedGPS/IMU instrumentation. Images were then process using the APSsoftware (Menci Software, Arezzo, Italy; www.menci.com). The
tie points in the images which were used to retrieve orientation
F. Chianucci et al. / International Journal of Applied Earth Observation and Geoinformation 47 (2016) 60–68 63
ample
pOeis
2
icsc
tL(peuu(
v(
G
wigamsI(ni
Fig. 4. An illustrative ex
arameters of the aerial triangulation (bundle-block adjustment).nce oriented, the software allows DSM extraction and the gen-ration of orthomosaic from images. A colour balancing betweenmages with histogram matching was applied during orthomo-aicking.
.3. True colour UAV image processing and analysis
The steps involved in estimating leaf area index from UAVmages are summarised in Fig. 5 and outlined below. First, trueolour orthomosaic images were cropped to fit each of the targetedtand extent. Each cropped image was then processed to estimateanopy cover, clumping index and leaf area index as follows.
Canopy cover (cc) was estimated using an image classifica-ion methods developed by Macfarlane and Ogden (2012), namelyAB2, and the relative routine coded by the authors in MATLABMathworks Inc., MA, US). Previous studies indicated the method isarticularly suited for estimating cover in dense stands (Chianuccit al., 2014a; Macfarlane and Ogden, 2012). Four groups of pixelssed as training sets were automatically detected for each imagesing logical tests based on the DNs of the original RGB imageTable 2).
The DNs of each RGB channels were transformed to calculate aisible-spectrum vegetation index (green leaf algorithm (GLA); Eq.3)):
LA = 2G − R − B2G + R + B
(3)
here G, R and B are the green, red and blue channel of themage, respectively; values ≤0 were classified as definite back-round (group 1, Table 2). The camera-based GLA was checkedgainst reflectance-based GLA derived from spectral field measure-ents, which were performed during the flight in the calibration
ite using an ASD spectroradiometer (Analytical Spectral Devices
nc., Boulder, Co., US). The two indices showed comparable resultsGLAUAV = 0.92 GLAASD–0.02, R2 = 0.85, n = 15, p < 0.01); therefore,o radiometric corrections were applied to the DNs of the UAVmages.
of the eBee flight-plan.
The RGB images were then converted to the CIE L*a*b* colourmodel, whose coordinates represent the lightness of the colour(L*), its position between magenta and green (a*) and its posi-tion between yellow and blue (b*). The mean values of GLA, a*and b* of both the background and foreground training sets werecalculated (groups 1 and 2, Table 2), and the LAB2 classifier wasperformed based on the Euclidean distance from the group means.An object-noise filtering was applied to remove potentially mis-classified pixels.
Once classified, LAB2 binary images were further analysed forestimation of clumping index �(0) using a gap-size distributionapproach. Each classified image was divided into a number of sub-images. To speed up calculation, we observed that dividing theentire scene from 5 × 5 up to 9 × 9 sub-images gives similar gapsize estimates, therefore we adopted a 7 × 7 sub-images division.Gap fraction of each sub-image was classified on the basis of itssize as large, non-random gaps and small, random gaps. A largegap threshold for each image classification method was set basedon visual image inspection: large gaps were considered those larger15% of the sub-image area. The clumping index was then calculatedat image level from gap-size distribution (Eq. (1)).
Although the gap size image analysis described above was notcompletely operator-free, the method is simple, automated andit was successfully applied in previous studies (Chianucci et al.,2014a,b).
The obtained canopy cover cc and clumping index was used toestimate leaf area index using the Beer–Lambert’s law (Eq. (4), afterNilson, 1971):
L = − ln(1 − cc)˝(0) × G(0)
(4)
Eq. (4) requires a foliage projection function G(0) to calculateL; this attribute is mainly related to the mean leaf angle and theleaf angle distribution of the target species. For the remainder
of the study, we adopted either the spherical leaf angle distri-bution (foliage projection function at nadir of 0.50), which wasoften assumed in these studies when leaf angle measurements arenot available (e.g., Chianucci and Cutini, 2013; Macfarlane et al.,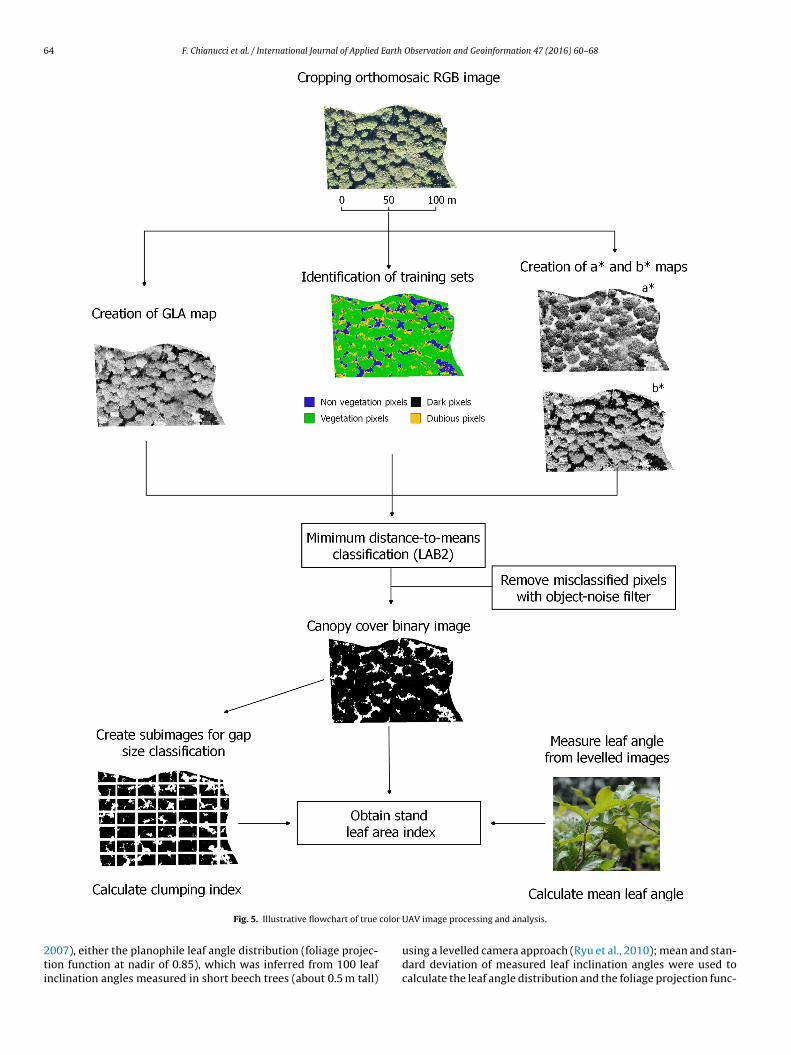
64 F. Chianucci et al. / International Journal of Applied Earth Observation and Geoinformation 47 (2016) 60–68
color
2ti
Fig. 5. Illustrative flowchart of true
007), either the planophile leaf angle distribution (foliage projec-ion function at nadir of 0.85), which was inferred from 100 leafnclination angles measured in short beech trees (about 0.5 m tall)
UAV image processing and analysis.
using a levelled camera approach (Ryu et al., 2010); mean and stan-dard deviation of measured leaf inclination angles were used tocalculate the leaf angle distribution and the foliage projection func-
F. Chianucci et al. / International Journal of Applied Earth Observation and Geoinformation 47 (2016) 60–68 65
Table 2Identification of training sets for foliage cover classification (for meaning of abbre-viations, see Section 2.3).
Group ID Note Logical test
1 Non vegetation materials (background) R + B ≥ 2G = GLA ≤ 02 Green vegetation (foreground) G > R & G > B & G > 25
tc
2
apanlta3
3
a(c((Dcffri
0ye
c
(dcsm(t
c
0eR0mUd
a(
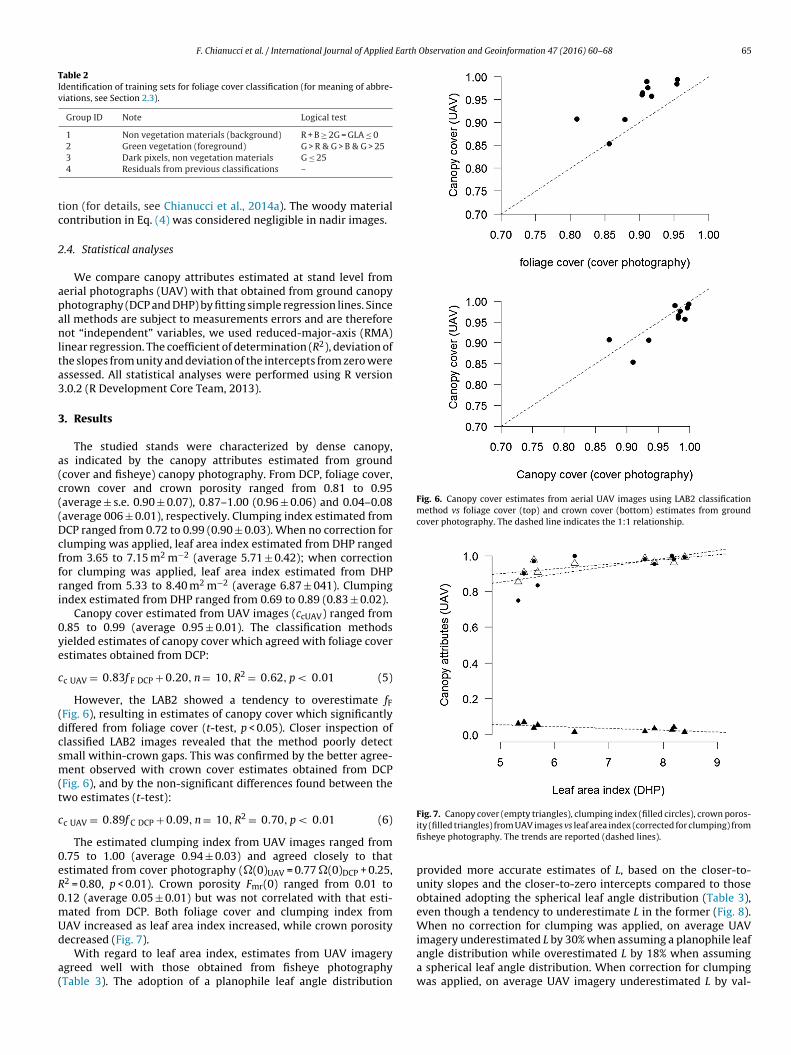
Fig. 6. Canopy cover estimates from aerial UAV images using LAB2 classificationmethod vs foliage cover (top) and crown cover (bottom) estimates from groundcover photography. The dashed line indicates the 1:1 relationship.
3 Dark pixels, non vegetation materials G ≤ 254 Residuals from previous classifications –
ion (for details, see Chianucci et al., 2014a). The woody materialontribution in Eq. (4) was considered negligible in nadir images.
.4. Statistical analyses
We compare canopy attributes estimated at stand level fromerial photographs (UAV) with that obtained from ground canopyhotography (DCP and DHP) by fitting simple regression lines. Sincell methods are subject to measurements errors and are thereforeot “independent” variables, we used reduced-major-axis (RMA)
inear regression. The coefficient of determination (R2), deviation ofhe slopes from unity and deviation of the intercepts from zero weressessed. All statistical analyses were performed using R version.0.2 (R Development Core Team, 2013).
. Results
The studied stands were characterized by dense canopy,s indicated by the canopy attributes estimated from groundcover and fisheye) canopy photography. From DCP, foliage cover,rown cover and crown porosity ranged from 0.81 to 0.95average ± s.e. 0.90 ± 0.07), 0.87–1.00 (0.96 ± 0.06) and 0.04–0.08average 006 ± 0.01), respectively. Clumping index estimated fromCP ranged from 0.72 to 0.99 (0.90 ± 0.03). When no correction forlumping was applied, leaf area index estimated from DHP rangedrom 3.65 to 7.15 m2 m−2 (average 5.71 ± 0.42); when correctionor clumping was applied, leaf area index estimated from DHPanged from 5.33 to 8.40 m2 m−2 (average 6.87 ± 041). Clumpingndex estimated from DHP ranged from 0.69 to 0.89 (0.83 ± 0.02).
Canopy cover estimated from UAV images (ccUAV) ranged from.85 to 0.99 (average 0.95 ± 0.01). The classification methodsielded estimates of canopy cover which agreed with foliage coverstimates obtained from DCP:
c UAV = 0.83f F DCP + 0.20, n = 10, R2 = 0.62, p < 0.01 (5)
However, the LAB2 showed a tendency to overestimate fFFig. 6), resulting in estimates of canopy cover which significantlyiffered from foliage cover (t-test, p < 0.05). Closer inspection oflassified LAB2 images revealed that the method poorly detectmall within-crown gaps. This was confirmed by the better agree-ent observed with crown cover estimates obtained from DCP
Fig. 6), and by the non-significant differences found between thewo estimates (t-test):
c UAV = 0.89f C DCP + 0.09, n = 10, R2 = 0.70, p < 0.01 (6)
The estimated clumping index from UAV images ranged from.75 to 1.00 (average 0.94 ± 0.03) and agreed closely to thatstimated from cover photography (�(0)UAV = 0.77 �(0)DCP + 0.25,2 = 0.80, p < 0.01). Crown porosity Fmr(0) ranged from 0.01 to.12 (average 0.05 ± 0.01) but was not correlated with that esti-ated from DCP. Both foliage cover and clumping index fromAV increased as leaf area index increased, while crown porosity
ecreased (Fig. 7).With regard to leaf area index, estimates from UAV imagerygreed well with those obtained from fisheye photographyTable 3). The adoption of a planophile leaf angle distribution
Fig. 7. Canopy cover (empty triangles), clumping index (filled circles), crown poros-ity (filled triangles) from UAV images vs leaf area index (corrected for clumping) fromfisheye photography. The trends are reported (dashed lines).
provided more accurate estimates of L, based on the closer-to-unity slopes and the closer-to-zero intercepts compared to thoseobtained adopting the spherical leaf angle distribution (Table 3),even though a tendency to underestimate L in the former (Fig. 8).When no correction for clumping was applied, on average UAV
imagery underestimated L by 30% when assuming a planophile leafangle distribution while overestimated L by 18% when assuminga spherical leaf angle distribution. When correction for clumpingwas applied, on average UAV imagery underestimated L by val-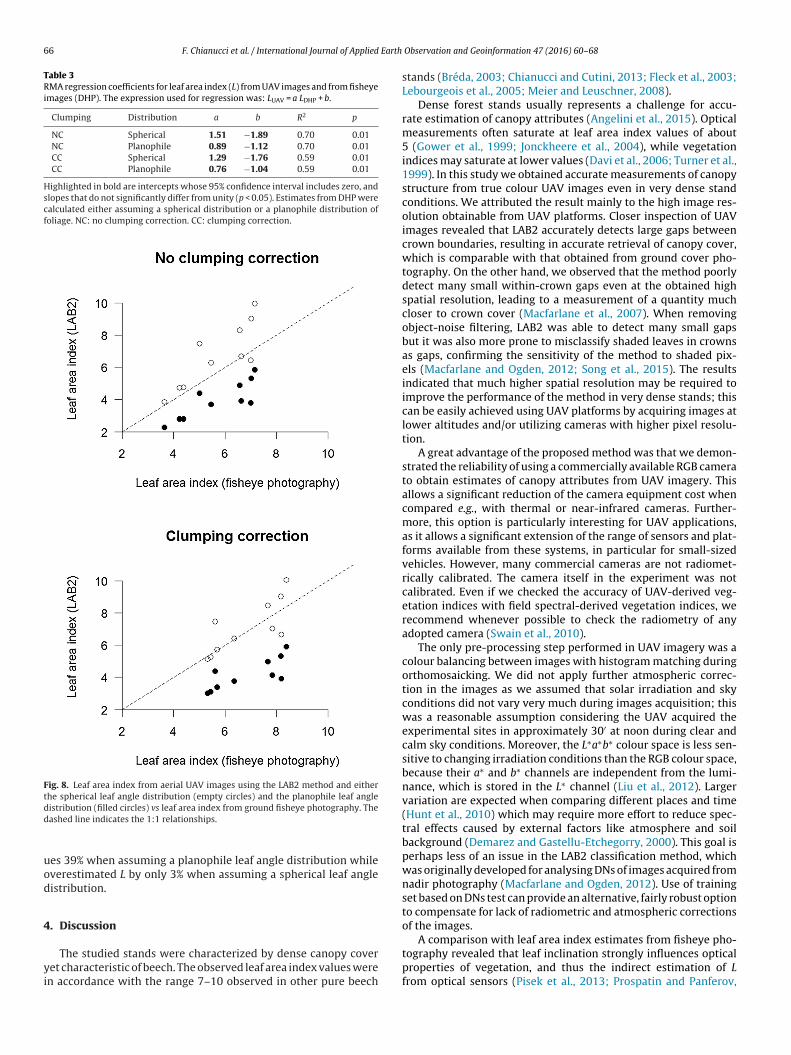
66 F. Chianucci et al. / International Journal of Applied Earth
Table 3RMA regression coefficients for leaf area index (L) from UAV images and from fisheyeimages (DHP). The expression used for regression was: LUAV = a LDHP + b.
Clumping Distribution a b R2 p
NC Spherical 1.51 −1.89 0.70 0.01NC Planophile 0.89 −1.12 0.70 0.01CC Spherical 1.29 −1.76 0.59 0.01CC Planophile 0.76 −1.04 0.59 0.01
Highlighted in bold are intercepts whose 95% confidence interval includes zero, andslopes that do not significantly differ from unity (p < 0.05). Estimates from DHP werecalculated either assuming a spherical distribution or a planophile distribution offoliage. NC: no clumping correction. CC: clumping correction.
Fig. 8. Leaf area index from aerial UAV images using the LAB2 method and eitherthe spherical leaf angle distribution (empty circles) and the planophile leaf angledd
uod
4
yi
A comparison with leaf area index estimates from fisheye pho-
istribution (filled circles) vs leaf area index from ground fisheye photography. Theashed line indicates the 1:1 relationships.
es 39% when assuming a planophile leaf angle distribution whileverestimated L by only 3% when assuming a spherical leaf angleistribution.
. Discussion
The studied stands were characterized by dense canopy coveret characteristic of beech. The observed leaf area index values weren accordance with the range 7–10 observed in other pure beech
Observation and Geoinformation 47 (2016) 60–68
stands (Bréda, 2003; Chianucci and Cutini, 2013; Fleck et al., 2003;Lebourgeois et al., 2005; Meier and Leuschner, 2008).
Dense forest stands usually represents a challenge for accu-rate estimation of canopy attributes (Angelini et al., 2015). Opticalmeasurements often saturate at leaf area index values of about5 (Gower et al., 1999; Jonckheere et al., 2004), while vegetationindices may saturate at lower values (Davi et al., 2006; Turner et al.,1999). In this study we obtained accurate measurements of canopystructure from true colour UAV images even in very dense standconditions. We attributed the result mainly to the high image res-olution obtainable from UAV platforms. Closer inspection of UAVimages revealed that LAB2 accurately detects large gaps betweencrown boundaries, resulting in accurate retrieval of canopy cover,which is comparable with that obtained from ground cover pho-tography. On the other hand, we observed that the method poorlydetect many small within-crown gaps even at the obtained highspatial resolution, leading to a measurement of a quantity muchcloser to crown cover (Macfarlane et al., 2007). When removingobject-noise filtering, LAB2 was able to detect many small gapsbut it was also more prone to misclassify shaded leaves in crownsas gaps, confirming the sensitivity of the method to shaded pix-els (Macfarlane and Ogden, 2012; Song et al., 2015). The resultsindicated that much higher spatial resolution may be required toimprove the performance of the method in very dense stands; thiscan be easily achieved using UAV platforms by acquiring images atlower altitudes and/or utilizing cameras with higher pixel resolu-tion.
A great advantage of the proposed method was that we demon-strated the reliability of using a commercially available RGB camerato obtain estimates of canopy attributes from UAV imagery. Thisallows a significant reduction of the camera equipment cost whencompared e.g., with thermal or near-infrared cameras. Further-more, this option is particularly interesting for UAV applications,as it allows a significant extension of the range of sensors and plat-forms available from these systems, in particular for small-sizedvehicles. However, many commercial cameras are not radiomet-rically calibrated. The camera itself in the experiment was notcalibrated. Even if we checked the accuracy of UAV-derived veg-etation indices with field spectral-derived vegetation indices, werecommend whenever possible to check the radiometry of anyadopted camera (Swain et al., 2010).
The only pre-processing step performed in UAV imagery was acolour balancing between images with histogram matching duringorthomosaicking. We did not apply further atmospheric correc-tion in the images as we assumed that solar irradiation and skyconditions did not vary very much during images acquisition; thiswas a reasonable assumption considering the UAV acquired theexperimental sites in approximately 30′ at noon during clear andcalm sky conditions. Moreover, the L∗a∗b∗ colour space is less sen-sitive to changing irradiation conditions than the RGB colour space,because their a∗ and b∗ channels are independent from the lumi-nance, which is stored in the L∗ channel (Liu et al., 2012). Largervariation are expected when comparing different places and time(Hunt et al., 2010) which may require more effort to reduce spec-tral effects caused by external factors like atmosphere and soilbackground (Demarez and Gastellu-Etchegorry, 2000). This goal isperhaps less of an issue in the LAB2 classification method, whichwas originally developed for analysing DNs of images acquired fromnadir photography (Macfarlane and Ogden, 2012). Use of trainingset based on DNs test can provide an alternative, fairly robust optionto compensate for lack of radiometric and atmospheric correctionsof the images.
tography revealed that leaf inclination strongly influences opticalproperties of vegetation, and thus the indirect estimation of Lfrom optical sensors (Pisek et al., 2013; Prospatin and Panferov,

Earth
2tmvjfnialediHcalstcbLftacmeeatblcasla
5
ccmra
eptpfoyv
A
MemF(
F. Chianucci et al. / International Journal of Applied
013; Ryu et al., 2010). While hemispherical sensors were ableo eliminate the influence of leaf angle by integrating measure-
ents over the entire zenith angle range (Miller, 1967) restrictediew angle methods are strongly influenced by the foliage pro-ection coefficient. Moreover, the differences between theoreticaloliage projection functions are largest at lower view zenith angles,amely across the field of view usually considered from aerial
magery; under such circumstances, the common assumption of spherical leaf angle distribution may lead to large errors in theeaf area inversion (Pisek et al., 2013). In the current study, goodstimates of L were obtained by adopting a planophile leaf angleistribution, which was inferred from a previous study conducted
n young beech trees (about 0.5 m tall; Chianucci et al., 2014a).owever, our result suggest that the optimal foliage projectionoefficient occupies an intermediate value between the planophilend the spherical leaf angle distribution; that is, the plagiophileeaf angle distribution appears more suited for leaf area inver-ion in the studied stands. This was also confirmed by regressionesting against leaf area index values from DHP, based on theloser-to-unity slopes obtained from adopting a plagiophile distri-ution (LNC UAV = 1.11 LNC DHP −1.39, R2 = 0.70, p < 0.01; LC UAV = 0.95C DHP −1.29, R2 = 0.59, p < 0.01), compared with those obtainedrom adopting either the planophile or the spherical leaf angle dis-ribution. This does not necessarily imply that the plagiophile leafngle distribution was the dominant distribution in the observedanopies; it has been noted previously that leaf angle distributionight change with canopy height (Hutchinson et al., 1986; Raabe
t al., 2015). At the top of canopy light is frequently received inxcessive amount, and more inclined distribution of foliage canllow trees to reduce photo-inibition and optimizing light intercep-ion (Ball et al., 1988); conversely, more horizontally leaves at theottom of the canopy allows increasing light use efficiency at lower
ight intensities (Ford and Newbould, 1971). Based on the aboveonsiderations we concluded that direct leaf angle measurementsre strongly recommend to model leaf area index from optical sen-ors. This can be easily achieved by a recently developed groundevelled photographic method (Ryu et al., 2010), which can providencillary data to improve the indirect retrieval of canopy attributes.
. Conclusions
We demonstrated that true colour UAV images acquired with aommercial digital camera can be effectively used to obtain rapid,heap and meaningful estimates of forest canopy attributes atedium-large scales. As UAV can combine the advantage of high
esolution imagery with quick turnaround series, it is highly suit-ble for routine forest stand monitoring and real-time applications.
Among the canopy attributes, the method allows objectivevaluation of forest canopy cover, without requiring additionalarameters (e.g., foliage projection coefficient, leaf angle distribu-ion); while this option holds great potential for forest inventoryurposes, the high-resolution canopy cover estimates obtainablerom UAV platforms could also be used for calibrating metricsbtained from coarser-scale remote sensing products and/or anal-ses that use morphological processing (rather than relying only onegetation indices), avoiding the need of ground measurements.
cknowledgments
Aerial images were acquired, processed and analysed byenci Software, which also provided the UAV and aerial camera
quipment. We thank an anonymous referee for the helpful com-ents, which improved the original version of the manuscript.
rancesco Chianucci was supported by the Project “ALForLab”PON03PE 00024 1) co-funded by the Italian Operational Pro-
Observation and Geoinformation 47 (2016) 60–68 67
gramme for Research and Competitiveness (PON R&C) 2007-2013,through the European Regional Development Fund (ERDF) andnational resource (Revolving Fund—Cohesion Action Plan (CAP)MIUR).
Appendix A. Supplementary data
Supplementary data associated with this article can be found, inthe online version, at http://dx.doi.org/10.1016/j.jag.2015.12.005.
References
Anderson, K., Gaston, K.J., 2013. Lightweight unmanned aerial vehicles willrevolutionize spatial ecology. Front. Ecol. Environ. 11, 138–146.
Angelini, A., Corona, P., Chianucci, F., Portoghesi, L., 2015. Structural attributes ofstand overstory and light under the canopy. Ann. Silvicultural Res. 39, 23–31.
Ball, M.C., Cowan, I.R., Farquhar, G.D., 1988. Maintenance of leaf temperature andthe optimisation of carbon gain in relation to water loss in a tropical mangroveforest. Aust. J. Plant. Physiol. 15, 263–276.
Bréda, N., 2003. Ground-based measurements of leaf area index: a review ofmethods, instruments and current controversies. J. Exp. Bot. 54, 2403–2417.
Breunig, F.M., Galvao, L.S., Formaggio, A.R., Epiphanio, J.C.N., 2013. Influence of dataacquisition geometry on soybean spectral response simulated by the Prosailmodel. Engenharia Agrıcola 33, 176–187.
Campbell, G.S., 1986. Extinction coefficients for radiation in plant canopiescalculated using an ellipsoidal inclination angle distribution. Agric. For.Meteorol. 36, 317–321.
Chen, J.M., Cihlar, J., 1995. Quantifying the effect of canopy architecture on opticalmeasurements of leaf area index using two gap size analysis methods. IEEE T.Geosci. Remote Sens. 33, 777–787.
Chianucci, F., Cutini, A., 2013. Estimation of canopy properties in deciduous forestswith digital hemispherical and cover photography. Agric. For. Meteorol. 168,130–139.
Chianucci, F., Chiavetta, U., Cutini, A., 2014a. The estimation of canopy attributesfrom digital cover photography by two different image analysis methods. iFor.Biogeosci. For. 7, 254–258.
Chianucci, F., Cutini, A., Corona, P., Puletti, N., 2014b. Estimation of leaf area indexin understory deciduous trees using digital photography. Agric. For. Meteorol.198, 259–264.
Chianucci, F., Macfarlane, C., Pisek, J., Cutini, A., Casa, R., 2015. Estimation of foliageclumping from the LAI-2000 plant canopy analyzer: effect of view caps. Trees29, 355–366.
Clemens, S.R., 2012. Procedures for correcting digital camera imagery acquired bythe AggieAir remote sensing platform.
Davi, H., Soudani, K., Deckx, T., Dufrene, E., Le Dantec, V., Francois, C., 2006.Estimation of forest leaf area index from SPOT imagery using NDVI distributionover forest stands. Int. J. Remote Sens. 27, 885–902.
Demarez, V., Gastellu-Etchegorry, J.P., 2000. A modeling approach for studyingforest chlorophyll content. Remote Sens. Environ. 712, 226–238.
Fleck, S., Niinemets, Ü., Cescatti, A., Tenhunen, J.D., 2003. Three-dimensionallamina architecture alters light-harvesting efficiency in Fagus: a leaf-scaleanalysis. Tree Physiol. 23, 577–589.
Ford, E.D., Newbould, P.J., 1971. The leaf canopy of a coppiced deciduouswoodland. 1. Development and structure. J. Ecol. 59, 843–862.
Gower, S.T., Kucharik, C.J., Norman, J.M., 1999. Direct and indirect estimation ofleaf area index, fAPAR, and net primary production of terrestrial ecosystems.Remote Sens. Environ. 70, 29–51.
Guillen-Climent, M.L., Zarco-Tejada, P.J., Berni, J.A., North, P.R.J., Villalobos, F., 2012.Mapping radiation interception in row-structured orchards using 3Dsimulation and high-resolution airborne imagery acquired from a UAV. Precis.Agric. 13, 473–500.
Houborg, R., Boegh, E., 2008. Mapping leaf chlorophyll and leaf area index usinginverse and forward canopy reflectance modeling and SPOT reflectance data.Remote Sens. Environ. 112, 186–202.
Hu, J., Su, Y., Tan, B., Huang, D., Yang, W., Schull, M., Myneni, R.B., 2007. Analysis ofthe MISR LAI/FPAR product for spatial and temporal coverage, accuracy andconsistency. Remote Sens. Environ. 107, 334–347.
Hunt, E.R., Cavigelli, M., Daughtry, C.S.T., McMurtrey, J.E., Walthall, C.L., 2005.Evaluation of digital photography from model aircraft for remote sensing ofcrop biomass and nitrogen status. Precis. Agric. 6, 359–378.
Hunt, E.R., Hively, W.D., Daughtry, C.S., McCarty, G.W., Fujikawa, S.J., Ng, T.L.,Tranchitella, M., Linden, D.S., Yoel, D.W., 2008. Remote sensing of crop leaf areaindex using unmanned airborne vehicles. In: In Proceedings of the Pecora 17Symposium, Denver, CO.
Hunt, E.R., Hively, W.D., Fujikawa, S.J., Linden, D.S., Daughtry, C.S.T., McCarty, G.W.,
2010. Acquisition of NIR-green–blue digital photographs from unmannedaircraft for crop monitoring. Remote Sensing 2, 290–305.Hutchinson, B.A., Matt, D.R., McMillen, R.T., Gross, L.J., Tajchman, S.J., Norman, J.M.,1986. The architecture of a deciduous forest canopy in eastern Tennessee. USAJ. Ecol. 74, 635–646.
6 Earth
J
J
L
L
L
L
L
M
M
M
MN
Turner, P.D., Cohen, W.B., Kennedy, R.E., Fassnacht, K.S., Riggs, J.M., 1999.Relationships between leaf area index and Landsat TM spectral vegetationindices across three temperate zone sites. Remote Sens. Environ. 70, 52–68.
Welles, J.M., Norman, J.M., 1991. Instrument for indirect measurement of canopy
8 F. Chianucci et al. / International Journal of Applied
annoura, R., Brinkmann, K., Uteau, D., Bruns, C., Joergensen, R.G., 2015. Monitoringof crop biomass using true colour aerial photographs taken from a remotecontrolled hexacopter. Biosyst. Eng. 129, 341–351.
onckheere, I., Fleck, S., Nackaerts, K., Muys, B., Coppin, P., Weiss, M., Baret, F., 2004.Review of methods for in situ leaf area index determination: part I. Theoriessensors hemispherical photography. Agric. For. Meteorol. 121, 19–35.
amonaca, A., Corona, P., Barbati, A., 2008. Exploring forest structural complexityby multi-scale segmentation of VHR imagery. Remote Sens. Environ. 112,2839–2849.
ang, A.R.G., Xiang, Y., 1986. Estimation of leaf area index from transmission ofdirect sunlight in discontinuous canopies. Agric. For. Meteorol. 35, 229–243.
eblanc, S.G., 2002. Correction to the plant canopy gap-size analysis theory used bythe tracing radiation and architecture of canopies instrument. Appl. Opt. 41,7667–7670.
ebourgeois, F., Bréda, N., Ulrich, E., Granier, A., 2005. Climate-growthrelationships of European beech (Fagus sylvatica L.) in the French permanentplot network (RENECOFOR). Trees 19, 385–401.
iu, Y., Mu, X., Wang, H., Yan, G., 2012. A novel method for extracting greenfractional vegetation cover from digital images. J. Veg. Sci. 23, 406–418.
acfarlane, C., Hoffman, M., Eamus, D., Kerp, N., Higginson, S., McMurtrie, R.,Adams, M.A., 2007. Estimation of leaf area index in eucalypt forest using digitalphotography. Agric. For. Meteorol. 143, 176–188.
acfarlane, C., Ogden, G.N., 2012. Automated estimation of foliage cover in forestunderstorey from digital nadir images. Methods Ecol. Evol. 3, 405–415.
eier, I.C., Leuschner, C., 2008. Leaf size and leaf area index in Fagus sylvatica
forests: competing effects of precipitation, temperature and nitrogenavailability. Ecosystems 11, 655–669.iller, J.B., 1967. A formula for average foliage density. Aust. J. Bot. 15, 141–144.ilson, T., 1971. A theoretical analysis of the frequency of gaps in plant stands.
Agric. For. Meteorol. 8, 25–38.
Observation and Geoinformation 47 (2016) 60–68
Pellikka, P.K., Lötjönen, M., Siljander, M., Lens, L., 2009. Airborne remote sensing ofspatiotemporal change (1955–2004) in indigenous and exotic forest cover inthe Taita Hills, Kenya. Int. J. Appl. Earth Observ. Geoinf. 11, 221–232.
Pisek, J., Sonnentag, O., Richardson, A.D., Mõttus, M., 2013. Is the spherical leafinclination angle distribution a valid assumption for temperate and borealbroadleaf tree species? Agric. For. Meteorol. 169, 186–194.
Prospatin, P., Panferov, O., 2013. Retrieval of remotely sensed LAI using LandsatETM+ data and ground measurements of solar radiation and vegetationstructure: implication of leaf angle. Int. J. Appl. Earth Observ. Geoinf. 25, 38–46.
Raabe, K., Pisek, J., Sonnentag, O., Annuk, K., 2015. Variations of leaf inclinationangle distribution with height over the growing season and light exposure foreight broadleaf tree species. Agric. For. Meteorol. 214, 2–11.
Ryu, Y., Sonnentag, O., Nilson, T., Vargas, R., Kobayashi, H., Wenk, R., Baldocchi, D.D.,2010. How to quantify tree leaf area index in an open savanna ecosystem: amulti-instrument and multi-model approach. Agric. For. Meteorol. 150, 63–76.
Song, W., Mu, X., Yan, G., Huang, S., 2015. Extracting the green fractionalvegetation cover from digital images using a shadow-resistant algorithm(SHAR-LABFVC). Remote Sensing 7, 10425–10443.
Swain, K.C., Thomson, S.J., Jayasuriya, H.P.W., 2010. Adoption of unmannedhelicopter for low-altitude remote sensing to estimate yield and total biomassof a rice crop. Trans. ASABE 53, 21–27.
architecture. Agron. J. 83, 818–825.