Embed Size (px)
Citation preview

1
2
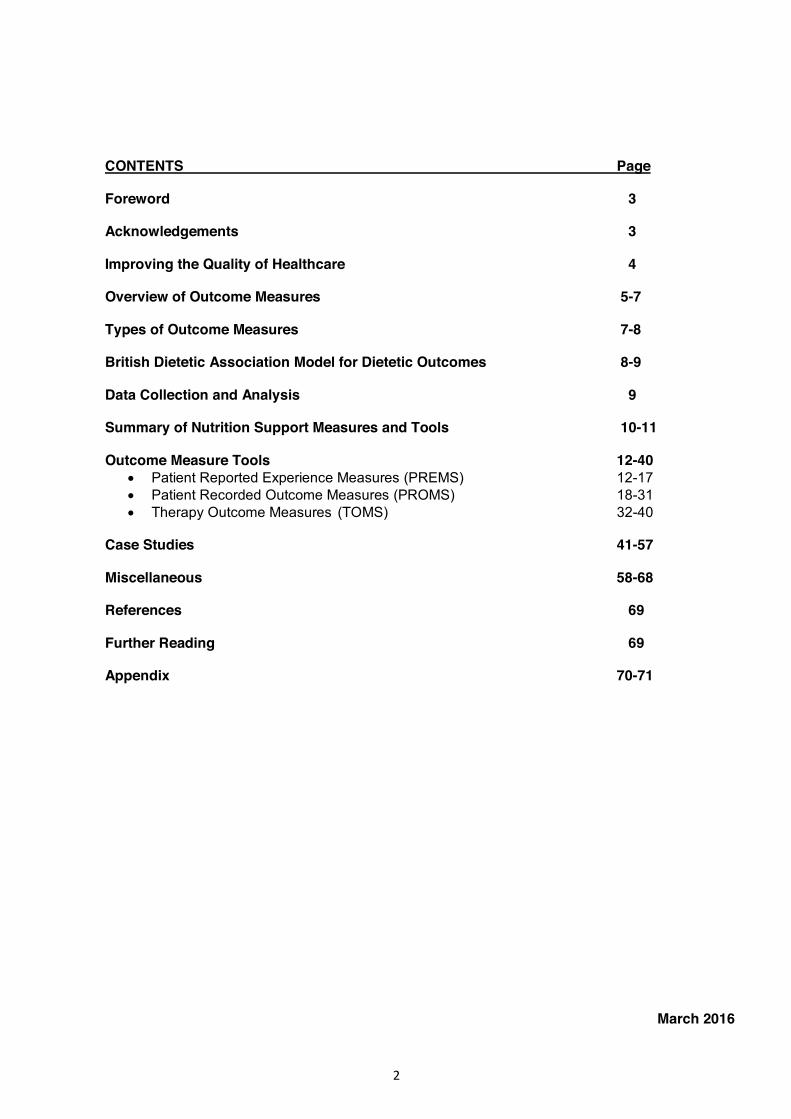
CONTENTS Page Foreword 3 Acknowledgements 3 Improving the Quality of Healthcare 4 Overview of Outcome Measures 5-7 Types of Outcome Measures 7-8 British Dietetic Association Model for Dietetic Outcomes 8-9 Data Collection and Analysis 9 Summary of Nutrition Support Measures and Tools 10-11 Outcome Measure Tools 12-40
x Patient Reported Experience Measures (PREMS) 12-17 x Patient Recorded Outcome Measures (PROMS) 18-31 x Therapy Outcome Measures (TOMS) 32-40
Case Studies 41-57 Miscellaneous 58-68 References 69 Further Reading 69 Appendix 70-71
March 2016
3
Foreword
The Dietetic Outcomes Toolkit (DOT) was instigated and produced by a panel of dietitians, after several consultations, and supported by the Parenteral and Enteral Nutrition Group (PENG). Five years on from outcomes being a central theme at our National Conference, the adoption and reporting for dietetics remains low. Since then many departments have been working to incorporate outcomes into their practice. Our vision was to provide a practical toolkit to collectively capture the tools available and develop new tools, with the aim of facilitating the adoption of outcome data collection. More importantly we wanted to facilitate the reporting of outcomes in a manner that is meaningful not only to us as professionals, but also for our end users and those who commission our services. The toolkit provides dietitians with a variety of approaches for identifying and addressing the challenge of measuring outcomes in nutrition care, with a particular focus on those outcomes relevant to nutrition support (oral, enteral and parenteral). The measures included in this toolkit are examples of the different tools currently available and can be used by dietitians in a variety of conditions. The selection of tool(s) will depend on the individual and the intervention goal(s). To allow the cross fertilisation of ideas we have also included some tools that are not specific to nutrition support, but which may help the development of new and refined tools. There are also case studies that focus on goal setting, measuring intervention effectiveness using some of the tools, as well as examples of how to report outcomes. As new tools are identified and validated they will be added to the toolkit. Increasing usage of the outcome measures will reinforce the evidence-base; this will not only improve patient care, but also reinforce the ‘added-value’ that we provide as a profession. Finally our thanks to all NHS Trusts for the inclusion of tools in this kit, and also to everyone who contributed to the project.
Anne Holdoway and Sean White, PENG Acknowledgements
x Nick Bergin: Specialist Nutrition Support Dietitian and Team Leader, Airedale NHS Foundation Trust x Bernice Carter: Stroke Specialist Dietitian, York Hospital x Rowan Clemente: Clinical Lead for Critical Care, Southmead Hospital, Bristol x Alison Culkin: Research Dietitian, St Marks Hospital and PENG Parenteral Nutrition and
Supplementary Prescribing Lead x Janet Gordon: Dietitian and Team Leader for Nutrition Support, Birmingham Community Healthcare
NHS Trust x Jemma Hendley: Advanced Dietitian, Peterborough City Hospital x Anne Holdoway: Consultant Dietitian and PENG Chair x Jacklyn Jones: Senior Lecturer Nutrition and Dietetics, Queen Margaret University, Edinburgh x Sue Kellie: Deputy Chief Executive/Head of Professional Policy. The British Dietetic Association x Bruno Mafrici: Lead Renal Dietitian/Team Leader, Nottingham University Hospital NHS Trust x Victoria Prendiville, Service Lead Nutrition Support (Dietetics), Hywel Dda University Health Board x Laura Smith: Community Home Enteral Feed Dietitian, The Pennine Acute Hospitals NHS Trust x Linda Tarm: Principal Renal Dietitian and Directorate Audit Lead, Guy's and St Thomas's NHS
Foundation Trust x Vera Todorovic: Consultant Dietitian, Doncaster and Bassetlaw NHS and PENG Quality/Resource
Officer, Governance, Standards and Patient Safety Trust x Carol Weir: Operations and Clinical Director, MoreLife (UK) Ltd x Sean White: Home Enteral Feed Dietitian, Sheffield Teaching Hospitals NHS Foundation Trust and
PENG Clinical Lead HETF
4
Improving the Quality of Healthcare The National Health Service (NHS) Five-Year Forward View for England (2014), the Scottish Government’s 2020 Vision for Health and Social Care (2011), Delivering Local Health Care - Accelerating the Pace of Change (NHS Wales, 2013) and Developing Better Health Services (DHSSPS, 2015) all look at the future of healthcare across Britain and the choices that need to be faced. These documents represent the shared view of NHS leadership that healthcare services need to change; this is also the emerging consensus of patient groups, clinicians, local communities and frontline NHS staff. They present a vision of a better NHS across each of the four home countries and the steps and actions required to achieve this. Improving the quality of care is a long-term and ongoing priority with each country and uses different approaches with commonality around three key themes of patient experience, safety and effectiveness. A current strategy in healthcare is to create an NHS which is not only more responsive to patients with better outcomes, but also has increased autonomy and clear accountability at every level. At a local level, limited resources and increased demands for accountability mean that quality measurement is now a major concern for providers and commissioners of care. As new care models are established it is essential to ascertain which produce the best experience for patients and the best value for money. The increased policy emphasis on outcomes is reflected in the Outcomes Frameworks for the NHS, public health and social care. Although this is an NHS England initiative, the focus on outcomes is relevant across the NHS as a whole. The NHS Outcomes Framework, which is updated annually, provides a national overview of how well the NHS is performing and is the primary accountability mechanism between the Secretary of State for Health and NHS England. It is responsible for improving quality throughout the NHS by encouraging a change in culture and behaviour that is focused on health outcomes. The NHS Outcomes Framework is a set of 68 indicators which measure performance in the health and care system at a national level and is grouped into the following domains: Domain 1: Preventing people from dying prematurely Domain 2: Enhancing quality of life for people with long-term conditions Domain 3: Helping people to recover from episodes of ill health or following injury Domain 4: Ensuring that people have a positive experience of care Domain 5: Treating and caring for people in a safe environment and protecting them from avoidable harm In the era of accountability in medicine, information regarding healthcare outcomes plays a pivotal role in medical decision making for all healthcare providers, patients and commissioners. Systematic collection and analysis of outcomes data can facilitate medical decision making and also enhance the quality of medical care. Although the field of outcomes assessment has not fully matured, a number of tools and methods can be used reliably to produce valid information. Advances in outcomes measurement are providing tools that can quantify components of quality such as clinical outcomes, patient satisfaction, and functional status. The key to dietetic practice is the provision of safe, effective and good quality care or interventions. Dietitians need to be able to identify and predict what the desired outcome of their intervention will be, and to what extent this has been achieved from the viewpoint of both the dietitian and the patient. Measuring outcomes and sharing this information demonstrates the value of a dietetic service to commissioners and to the wider health community.
5
Overview of Outcome Measures What is an outcome measure? ‘Change in the health of an individual, group of people or a population which is attributable to an intervention, or series of interventions’ (British Dietetic Association 2011)
The term outcome measure refers to the impact that healthcare activities have on people; on their symptoms, the ability to do what they want to do, and ultimately on whether they live or die. Health outcomes include whether a given disease process gets better or worse, what the costs of care are, and how satisfied patients are with the care they receive. It focuses not on what is done for patients but what results from what is done. Outcome measures identify the status of a patient when a service is initiated i.e. the ‘baseline’ and when it ceases i.e. the endpoint, and determines if anything meaningful has been achieved. The measures should indicate the effectiveness of services delivered. What does an outcome measure? The fundamental principles of a health outcome measure are validity, reliability and responsiveness, all measured over a specified time period. Outcome measures use a systematic process of gathering, interpreting and reporting information to determine and illustrate what changes occur as a result of an intervention. x Means of determining if goals or objectives have been met, the effectiveness and efficiency of a
programme and /or the perceptions of the persons served x Evaluation of procedures that attach a number, ordination or categorisation to the results Why are outcome measures required? Outcome measures can be used to reinforce and maintain a service. Realism is essential – it is not just about numbers, it is about what can be achieved, at what cost and compared to the costs of not doing something. x For commissioners: to demonstrate they are commissioning the most efficient and effective service x For clinicians: to support decision making around the delivery of effective interventions, service
planning and to promote productivity and job satisfaction x For clients/patients: to demonstrate that they are receiving a quality service that makes a difference
to their health and quality of life Criteria for outcome measures x Influenced by healthcare provision i.e. fit for
purpose x Robust x Measure what they intend to measure x Responsive to change – times can be variable x Clearly defined and consistently clear x Not too broad and not too specific
x Clinically credible and effective x Collectable x Timely x Efficient x Cost-effective to collect x Verifiable x Result in minimum burden x Meaningful
6
Why are outcome measures important for dietitians? x Allow a dietitian to measure their own
effectiveness x Justify the role of dietitian in different clinical
areas x Highlight areas for service development and
personal development x Improve goal setting with individuals x Allow comparison between services provided
and standards/other services x Measure service strengths and weaknesses
x Help develop and follow care pathways x Identify service gaps x Compare effectiveness between dietitians, multi-
disciplinary teams and patient groups x Enable benchmarking within teams and services x Identify inefficiencies x Identify cost saving opportunities x Improve reflection on practice by providing direct
feedback to clinicians on the effectiveness of their intervention
Outcome categories Objective health outcomes Outcomes that can be objectively determined by an unbiased health professional using assessment, medical records or biological testing. Subjective health outcomes Primarily measured using self-report measures such as questionnaires, surveys or interviews. They are reported by the patient and or their carer/relative. Subjective health outcomes are problematic when comparing groups of patients because of the element of personal bias, levels of understanding and ability to participate. The categories of outcome measures include: x Direct nutrition outcomes e.g. knowledge gained, behaviour change, food or nutrient intake
changes, improved nutritional status x Clinical and health status outcomes e.g. laboratory values, weight, blood pressure, risk factor profile
changes, signs and symptoms, clinical status, infections, complications x Patient/client centred outcomes e.g. quality of life, satisfaction, self-efficacy, self-management,
functional ability x Health care utilisation and cost outcomes e.g. medication changes, special procedures,
planned/unplanned clinic visits, preventable hospitalisation, length of hospitalisation, prevent or delay nursing home admission
What are the barriers to achieving dietetic goals? It is important to document why a goal has not have been achieved i.e. the so-called ‘barrier’. Identifying the barrier will enable the goal to be revised and facilitate effective intervention and quality care for the patient. Barrier type Barriers to achieving dietetic goals Physical /symptom Vomiting/nausea
Dysphagia developed/worsened Pain Fatigue Abdominal discomfort/bloating Diarrhoea Constipation Appetite change
Behavioural Low motivation to change Low confidence in ability to make changes Poor adherence with regime/tube/stoma care Poor attendance
Psychological Low mood/depression/anxiety Disordered eating
Practical/social Lifestyle issues

7
Lack of carer/family support Reduced ability to self-care Impaired ability to shop/prepare meals Patient discharged prior to review
Biochemical Poor insulin control Medical Approaching end of life
Adverse change in medical condition Period of hospitalisation Death
Institutional (nursing homes)
Poor meal provision Inadequate staffing levels Staff non-compliant with recommendations Staff require training
Organisational Delays/problems in acquiring feed/ancillaries/ONS Unable to weigh patient Food record charts not completed Lack of dietetic resource
Pharmaceutical Medication changes adversely affecting dietetic outcome Information Poor understanding/comprehension
Patient has communication difficulties Literacy or language barriers Lack of capacity Learning difficulties/cognitive impairment Unsuitable sources of information e.g. internet
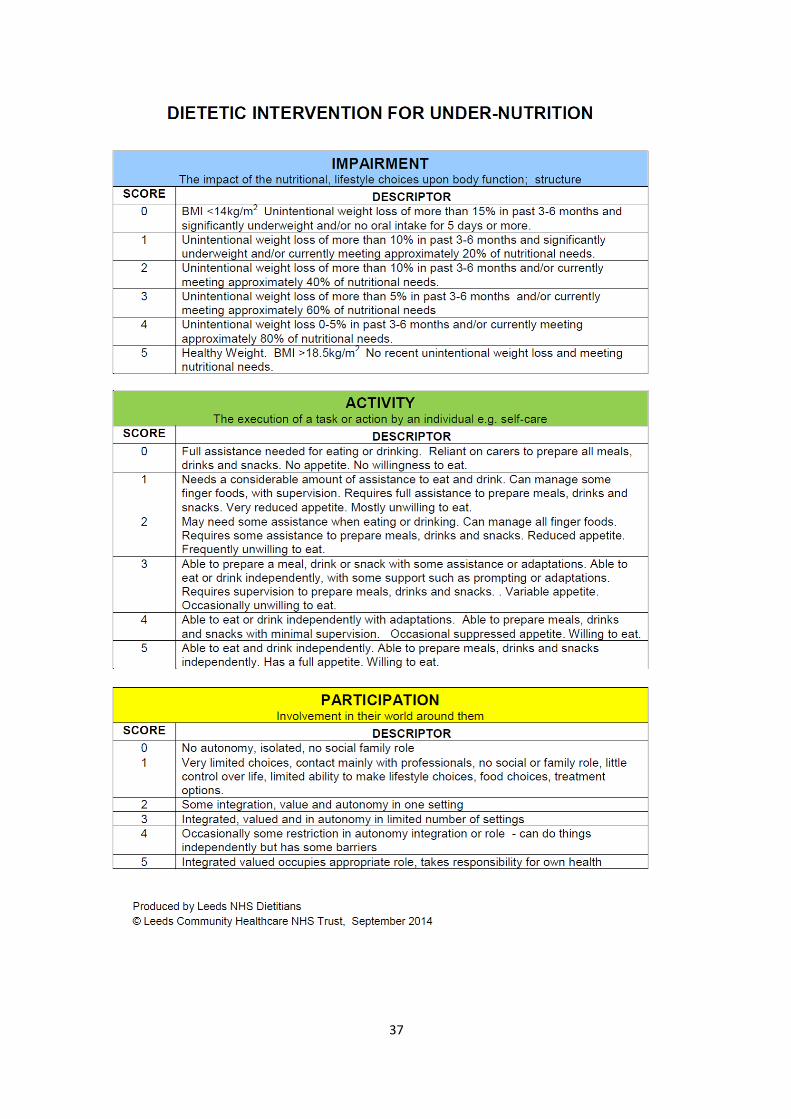
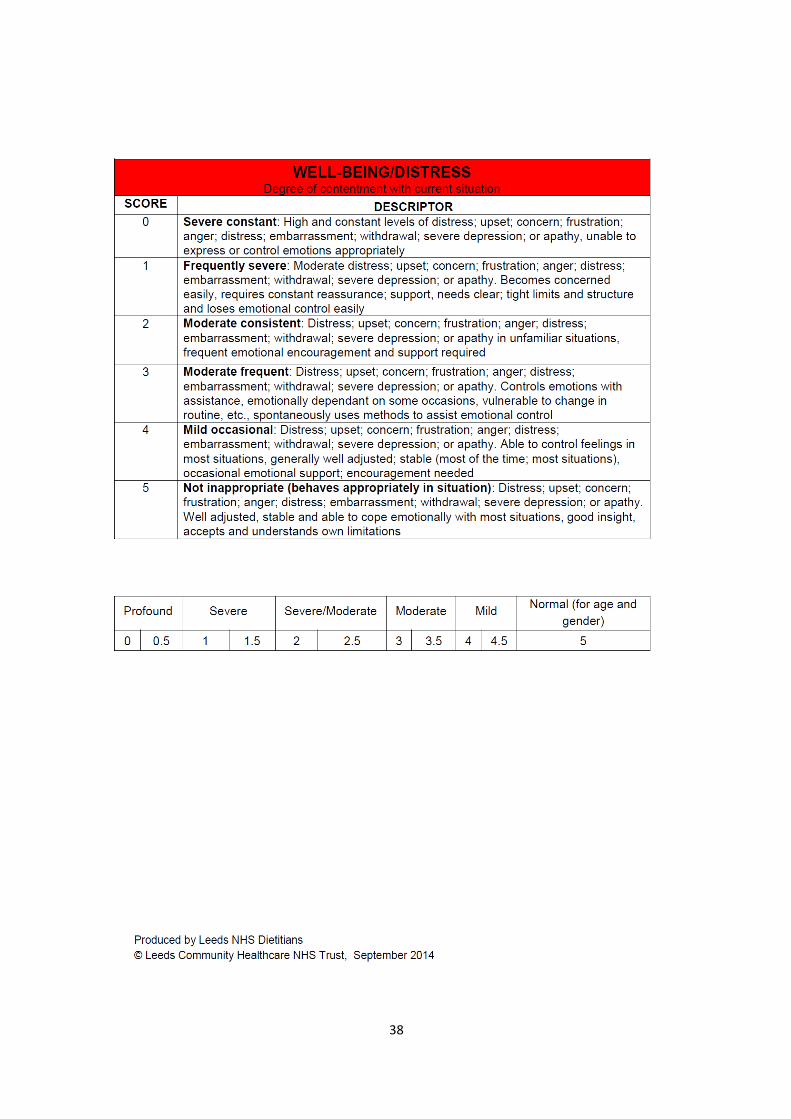
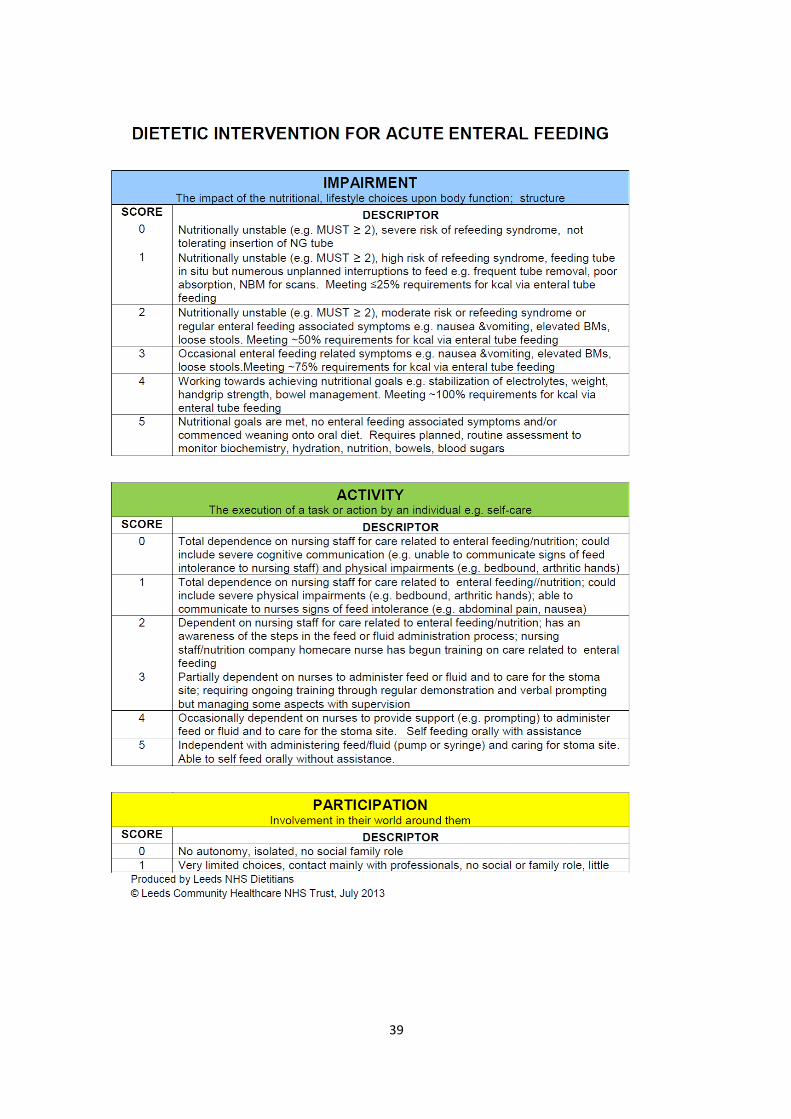
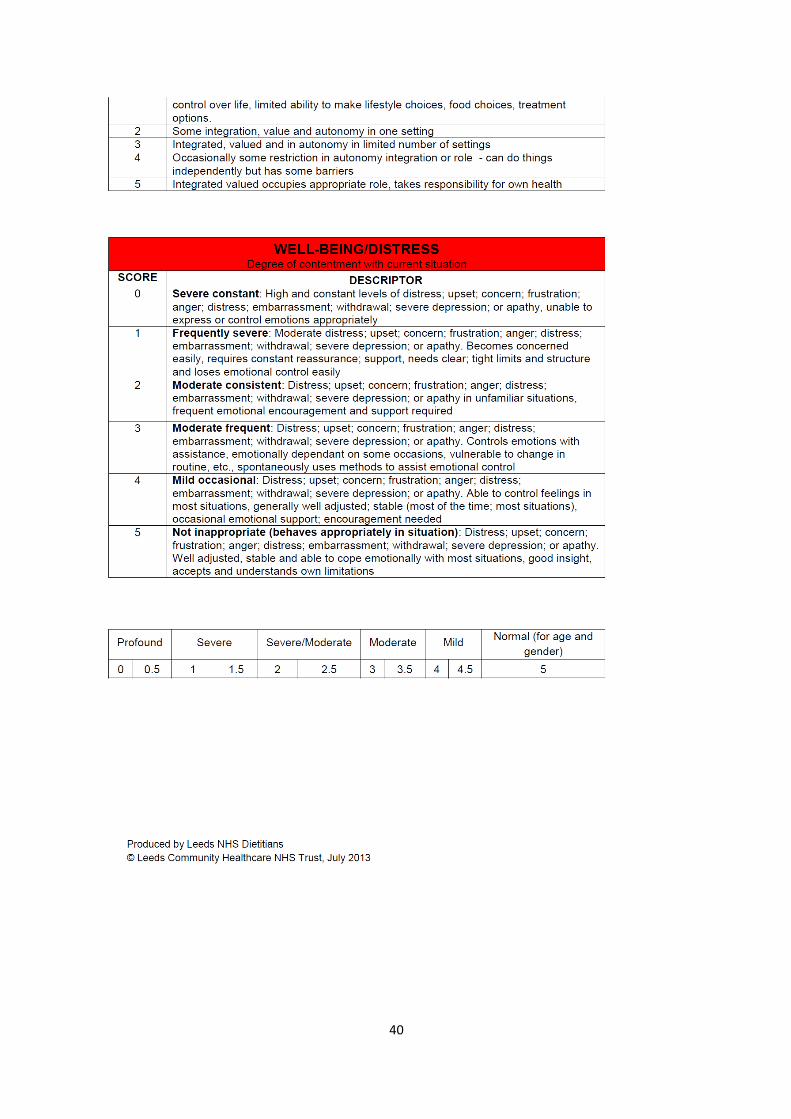
Types of Outcome Measures There are several approaches to measurement and examples are included in this tool kit, however, all measure must be SMAART. Specific Measurable (must be readily observable and measurable). Appropriate Acceptable (to clinician and patient) Reliable (giving consistent measures across organisations and time) Targeted (it is clear what the population, conditions, interventions it is focused on) Patient Reported Experience Measures (PREMs) PREMs collate the patients’ objective experience of care. By focusing on specific aspects of the care process, e.g. being seen on time, PREMs seek to remove the subjectivity associated with measures of satisfaction. Patient Reported Outcome Measures (PROMs) PROMs are standardised, validated instruments or question sets used to measure patients’ perceptions of factors such as their health status (impairment), their functional status (disability), and their health-related quality of life (well-being). They are usually designed as questionnaires that measure the impact of clinical interventions in a strictly clinical sense i.e. did the intervention improve the patient’s physical or mental condition in a meaningful sense, and if so, by how much? Therapy Outcome Measures (TOMs) TOMs allow professionals from many disciplines working in health, social care and education to describe the relative abilities and difficulties of a patient/client across four domains of impairment, activity, participation and wellbeing, in order to monitor changes over time: Impairment: problems in body structure or function. A physiological aspect that deviates from the population norm e.g. raised blood pressure. Activity: performance of activities. The ability of the individual to carry out a task or action.
8
Participation: involvement in life situations. How the person relates to their own environment, e.g. what they can do for themselves (this may be affected by impairment). Wellbeing: emotional level of upset or distress, degree of contentment. If a patient presents with a number of nutritional problems e.g. diabetes and obesity the TOM is used for the reason they were referred e.g. if diabetes is unstable use the diabetes TOM. If they are steadily gaining weight use the obesity TOM. There are TOMs available for many areas of clinical practice; those with a focus on nutrition include:
x Under-nutrition x Acute enteral feeding x Home enteral feeding
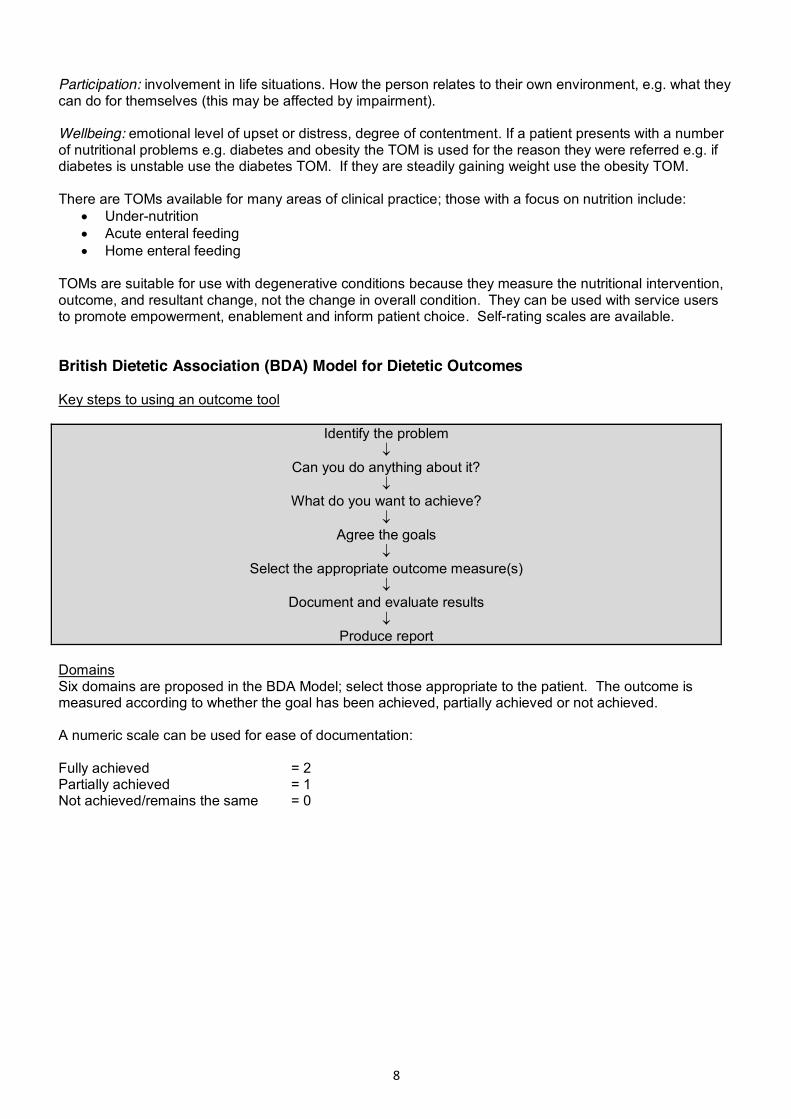
TOMs are suitable for use with degenerative conditions because they measure the nutritional intervention, outcome, and resultant change, not the change in overall condition. They can be used with service users to promote empowerment, enablement and inform patient choice. Self-rating scales are available. British Dietetic Association (BDA) Model for Dietetic Outcomes Key steps to using an outcome tool
Identify the problem p
Can you do anything about it? p
What do you want to achieve? p
Agree the goals p
Select the appropriate outcome measure(s) p
Document and evaluate results p
Produce report Domains Six domains are proposed in the BDA Model; select those appropriate to the patient. The outcome is measured according to whether the goal has been achieved, partially achieved or not achieved. A numeric scale can be used for ease of documentation: Fully achieved = 2 Partially achieved = 1 Not achieved/remains the same = 0

9
Data Collection and Analysis Data collection can be perceived as time consuming and arduous. However, it is crucial for establishing an accurate baseline at the initial patient consultation, monitoring the patient at follow-up appointments, treatment endpoint information and six-month/annual patient reviews. An assessment or measurement form is required. Some NHS Trusts have IT systems in place with assessment forms and drop-down menus as part of the patient record. These should be explored before re-inventing the wheel as the process of amending existing forms may be simpler and quicker than creating new ones and incorporating them into the patient record system. Many systems also facilitate recording patient information in real time during the consultation which may be more time-efficient. The data needs to be analysed with useful information highlighted, suggested conclusions and to support further decision making. This tool kit includes cases studies and examples of assessment forms. PENG recognises that the detail in some of the screenshots included in this document may not be legible. They are included as examples, and to illustrate how outcomes can be incorporated and collected in currently available electronic patient records. The teams where they are used can be contacted for further information.
10
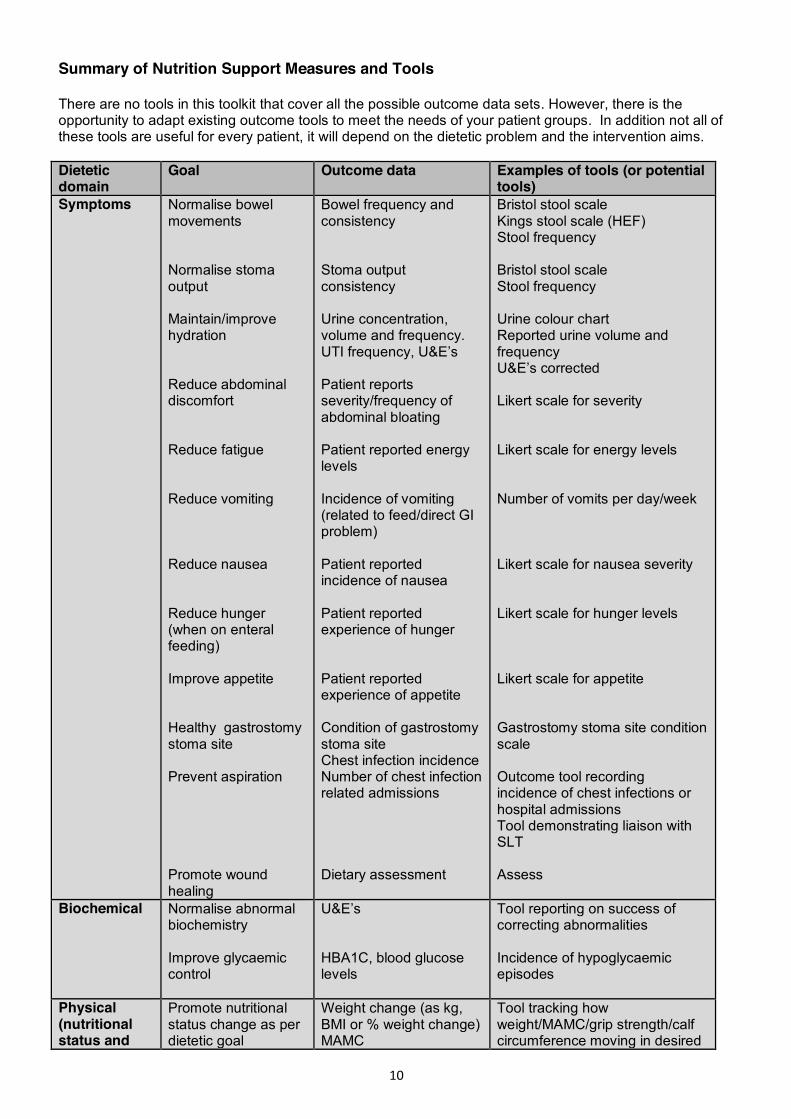
Summary of Nutrition Support Measures and Tools There are no tools in this toolkit that cover all the possible outcome data sets. However, there is the opportunity to adapt existing outcome tools to meet the needs of your patient groups. In addition not all of these tools are useful for every patient, it will depend on the dietetic problem and the intervention aims. Dietetic domain
Goal Outcome data Examples of tools (or potential tools)
Symptoms Normalise bowel movements Normalise stoma output Maintain/improve hydration Reduce abdominal discomfort Reduce fatigue Reduce vomiting Reduce nausea Reduce hunger (when on enteral feeding) Improve appetite Healthy gastrostomy stoma site Prevent aspiration Promote wound healing
Bowel frequency and consistency Stoma output consistency Urine concentration, volume and frequency. UTI frequency, U&E’s Patient reports severity/frequency of abdominal bloating Patient reported energy levels Incidence of vomiting (related to feed/direct GI problem) Patient reported incidence of nausea Patient reported experience of hunger Patient reported experience of appetite Condition of gastrostomy stoma site Chest infection incidence Number of chest infection related admissions Dietary assessment
Bristol stool scale Kings stool scale (HEF) Stool frequency Bristol stool scale Stool frequency Urine colour chart Reported urine volume and frequency U&E’s corrected Likert scale for severity Likert scale for energy levels Number of vomits per day/week Likert scale for nausea severity Likert scale for hunger levels Likert scale for appetite Gastrostomy stoma site condition scale Outcome tool recording incidence of chest infections or hospital admissions Tool demonstrating liaison with SLT Assess
Biochemical Normalise abnormal biochemistry Improve glycaemic control
U&E’s HBA1C, blood glucose levels
Tool reporting on success of correcting abnormalities Incidence of hypoglycaemic episodes
Physical (nutritional status and
Promote nutritional status change as per dietetic goal
Weight change (as kg, BMI or % weight change) MAMC
Tool tracking how weight/MAMC/grip strength/calf circumference moving in desired
11
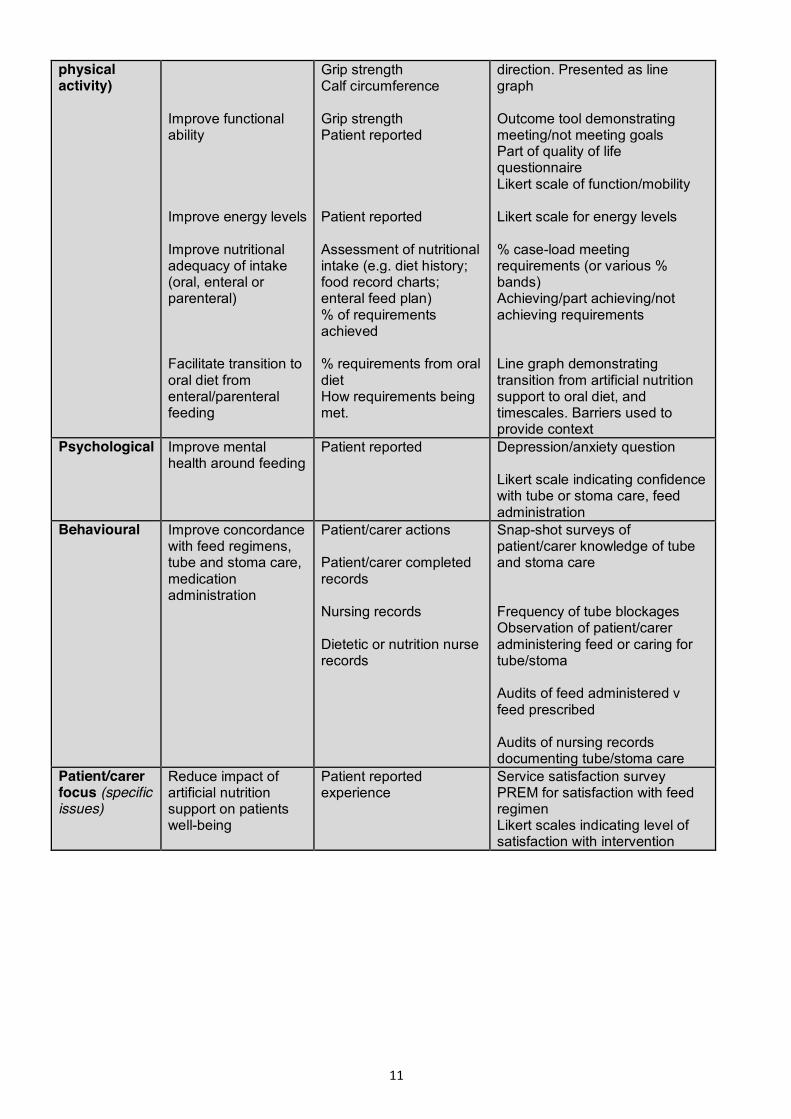
physical activity)
Improve functional ability Improve energy levels Improve nutritional adequacy of intake (oral, enteral or parenteral) Facilitate transition to oral diet from enteral/parenteral feeding
Grip strength Calf circumference Grip strength Patient reported Patient reported Assessment of nutritional intake (e.g. diet history; food record charts; enteral feed plan) % of requirements achieved % requirements from oral diet How requirements being met.
direction. Presented as line graph Outcome tool demonstrating meeting/not meeting goals Part of quality of life questionnaire Likert scale of function/mobility Likert scale for energy levels % case-load meeting requirements (or various % bands) Achieving/part achieving/not achieving requirements Line graph demonstrating transition from artificial nutrition support to oral diet, and timescales. Barriers used to provide context
Psychological Improve mental health around feeding
Patient reported Depression/anxiety question Likert scale indicating confidence with tube or stoma care, feed administration
Behavioural Improve concordance with feed regimens, tube and stoma care, medication administration
Patient/carer actions Patient/carer completed records Nursing records Dietetic or nutrition nurse records
Snap-shot surveys of patient/carer knowledge of tube and stoma care Frequency of tube blockages Observation of patient/carer administering feed or caring for tube/stoma Audits of feed administered v feed prescribed Audits of nursing records documenting tube/stoma care
Patient/carer focus (specific issues)
Reduce impact of artificial nutrition support on patients well-being
Patient reported experience
Service satisfaction survey PREM for satisfaction with feed regimen Likert scales indicating level of satisfaction with intervention

12
Patient Reported Experience Measures
(PREMS)

13
NOTTINGHAM UNIVERSITY HOSPITALS NHS TRUST QUESTIONNAIRE The patient is given this simple questionnaire at the end of the consultation, but ideally not in front of the dietitian. The tool could be completed and handed in after any consultation. Another option may be to post to the patient reviewed by the dietitian and to be returned anonymously (this may incur a cost i.e. a stamped addressed envelope and may reduce the response rate). In order to evaluate the dietitian’s role in your care, we would be grateful if you could take the time to complete the following questions. Please circle the answer that applies to you: 1: Do you feel you have gained useful information to help you to make changes in your diet?
0 1 2 3 4 5 Not at all very little a little some quite a lot a lot
2: Do you feel you have gained practical information to help you to make changes in your diet?
0 1 2 3 4 5 Not at all very little a little some quite a lot a lot 3: How confident are you to use the information provided?
0 1 2 3 4 5 Not at all very little a little some quite a lot a lot 4: Do you feel that one or more aspects of your diet will change as a result of seeing the dietitian?
Yes/No
Data collection and analysis A bar chart could be used to demonstrate how patients have responded over a defined period of time. This tool helps demonstrate how effective the dietitian has been in facilitating a change of behaviour in patients.
See Case Study C for use of this tool.
14
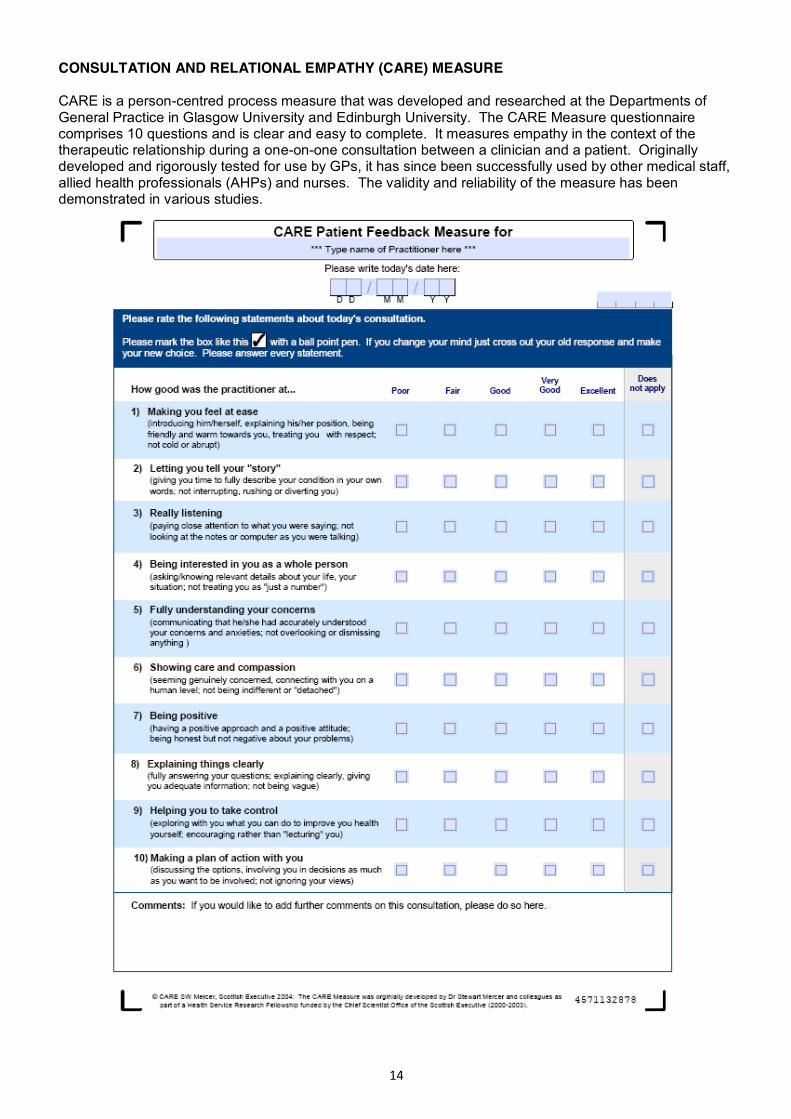
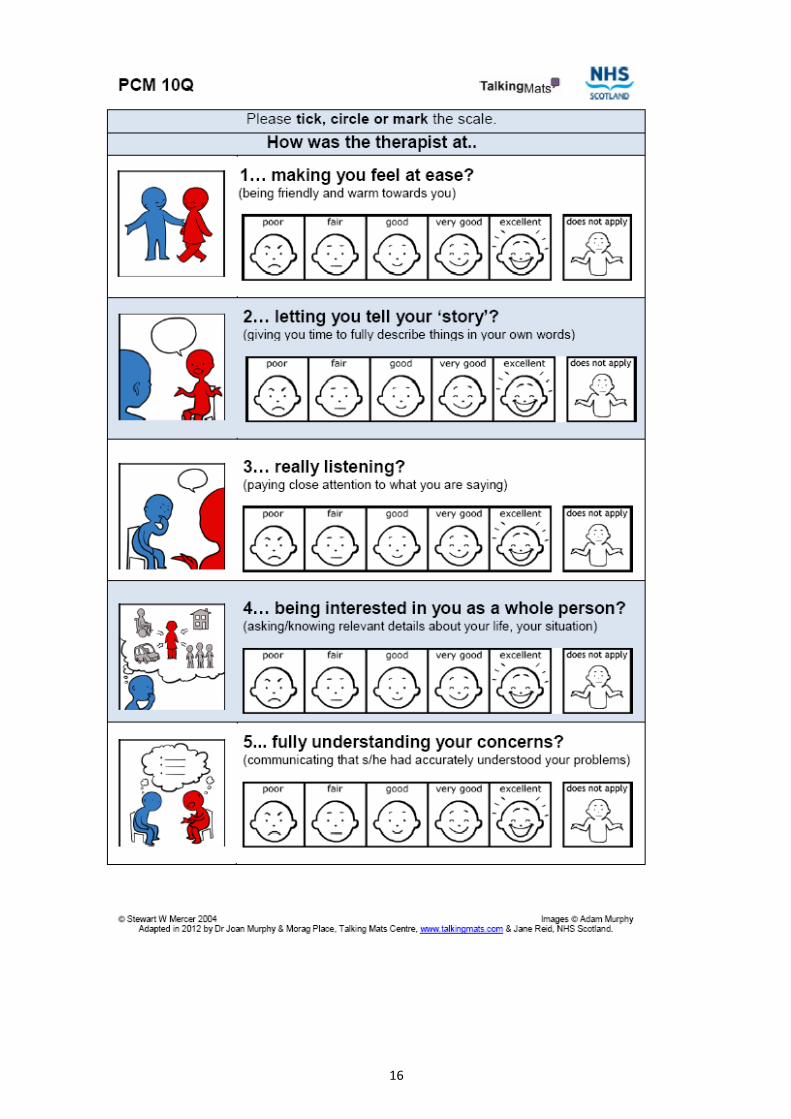
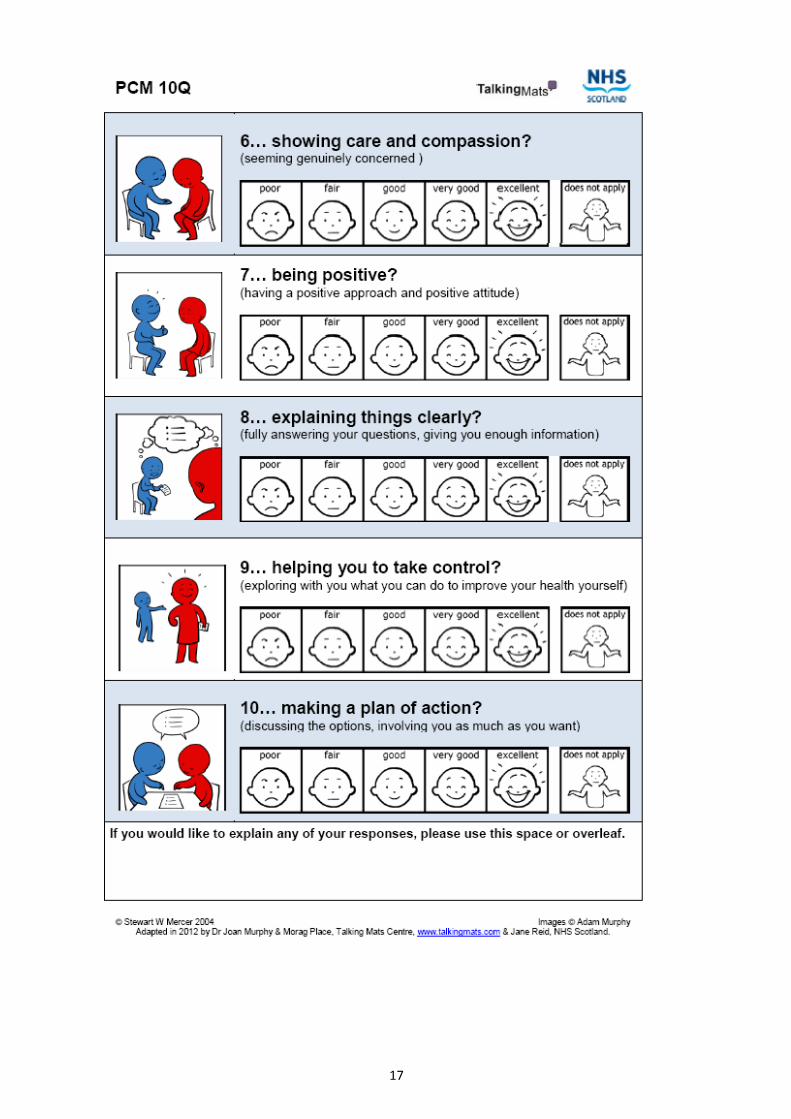
CONSULTATION AND RELATIONAL EMPATHY (CARE) MEASURE CARE is a person-centred process measure that was developed and researched at the Departments of General Practice in Glasgow University and Edinburgh University. The CARE Measure questionnaire comprises 10 questions and is clear and easy to complete. It measures empathy in the context of the therapeutic relationship during a one-on-one consultation between a clinician and a patient. Originally developed and rigorously tested for use by GPs, it has since been successfully used by other medical staff, allied health professionals (AHPs) and nurses. The validity and reliability of the measure has been demonstrated in various studies.

15
16
17

18
Patient Reported Outcome Measures (PROMS)
19
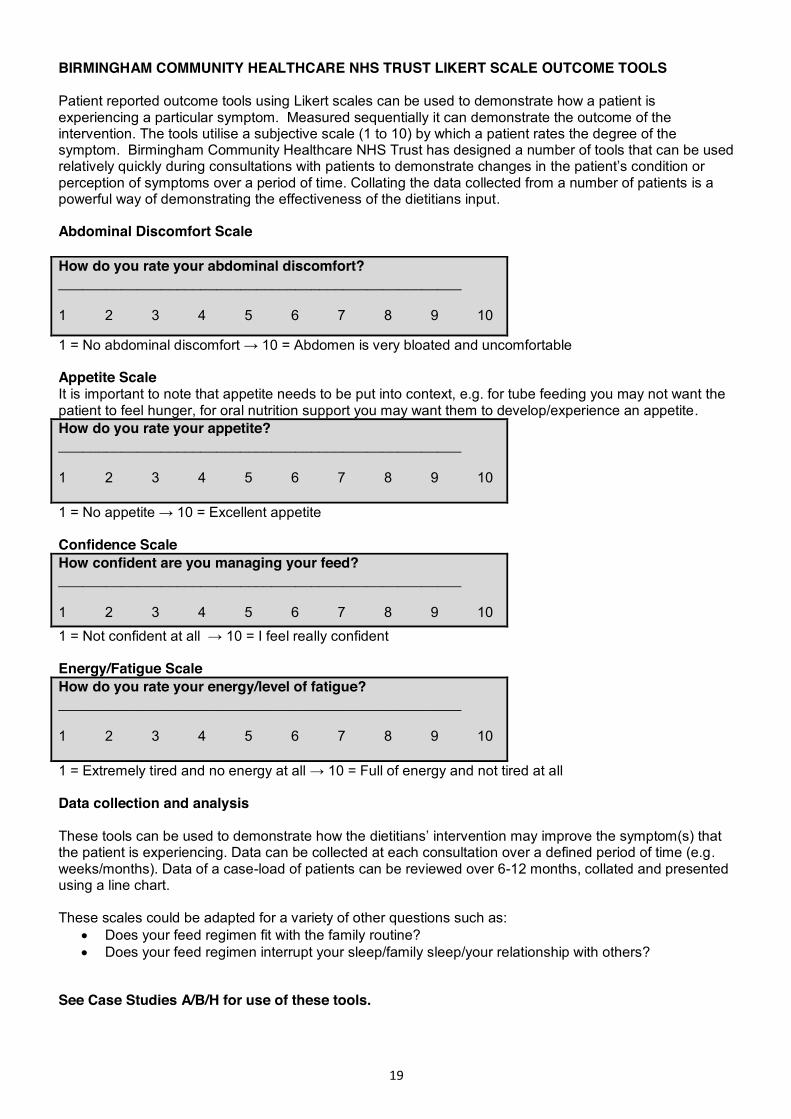
BIRMINGHAM COMMUNITY HEALTHCARE NHS TRUST LIKERT SCALE OUTCOME TOOLS Patient reported outcome tools using Likert scales can be used to demonstrate how a patient is experiencing a particular symptom. Measured sequentially it can demonstrate the outcome of the intervention. The tools utilise a subjective scale (1 to 10) by which a patient rates the degree of the symptom. Birmingham Community Healthcare NHS Trust has designed a number of tools that can be used relatively quickly during consultations with patients to demonstrate changes in the patient’s condition or perception of symptoms over a period of time. Collating the data collected from a number of patients is a powerful way of demonstrating the effectiveness of the dietitians input. Abdominal Discomfort Scale How do you rate your abdominal discomfort? ___________________________________________________ 1 2 3 4 5 6 7 8 9 10
1 = No abdominal discomfort → 10 = Abdomen is very bloated and uncomfortable Appetite Scale It is important to note that appetite needs to be put into context, e.g. for tube feeding you may not want the patient to feel hunger, for oral nutrition support you may want them to develop/experience an appetite. How do you rate your appetite? ___________________________________________________ 1 2 3 4 5 6 7 8 9 10 1 = No appetite → 10 = Excellent appetite Confidence Scale How confident are you managing your feed? ___________________________________________________ 1 2 3 4 5 6 7 8 9 10
1 = Not confident at all → 10 = I feel really confident Energy/Fatigue Scale How do you rate your energy/level of fatigue? ___________________________________________________ 1 2 3 4 5 6 7 8 9 10 1 = Extremely tired and no energy at all → 10 = Full of energy and not tired at all Data collection and analysis These tools can be used to demonstrate how the dietitians’ intervention may improve the symptom(s) that the patient is experiencing. Data can be collected at each consultation over a defined period of time (e.g. weeks/months). Data of a case-load of patients can be reviewed over 6-12 months, collated and presented using a line chart. These scales could be adapted for a variety of other questions such as:
x Does your feed regimen fit with the family routine? x Does your feed regimen interrupt your sleep/family sleep/your relationship with others?
See Case Studies A/B/H for use of these tools.

20
BOWEL FUNCTION
Bristol Stool Chart The Bristol Stool Chart is a medical visual aid designed to classify faeces into seven groups which can be used by patients.
Measures Type 1-2: indicates constipation Type 3-4: ideal stools and easy to pass Type 5-7: may indicate diarrhoea and urgency and may be as a result of other underlying conditions Data collection and analysis The tool can be used to demonstrate how the dietitians intervention (e.g. through changes in feed rate, feed/supplement fibre content, laxative advice), may help improve the bowel function of the patient. Data can be collected at each consultation over a defined period of time (e.g. weeks/months). Data of a case-load or patients reviewed over a 6-12 months period can be collated and presented using a line chart. This may be used along with recording reduced laxative use etc. to demonstrate potential cost savings See Case Study A for use of this tool.
21
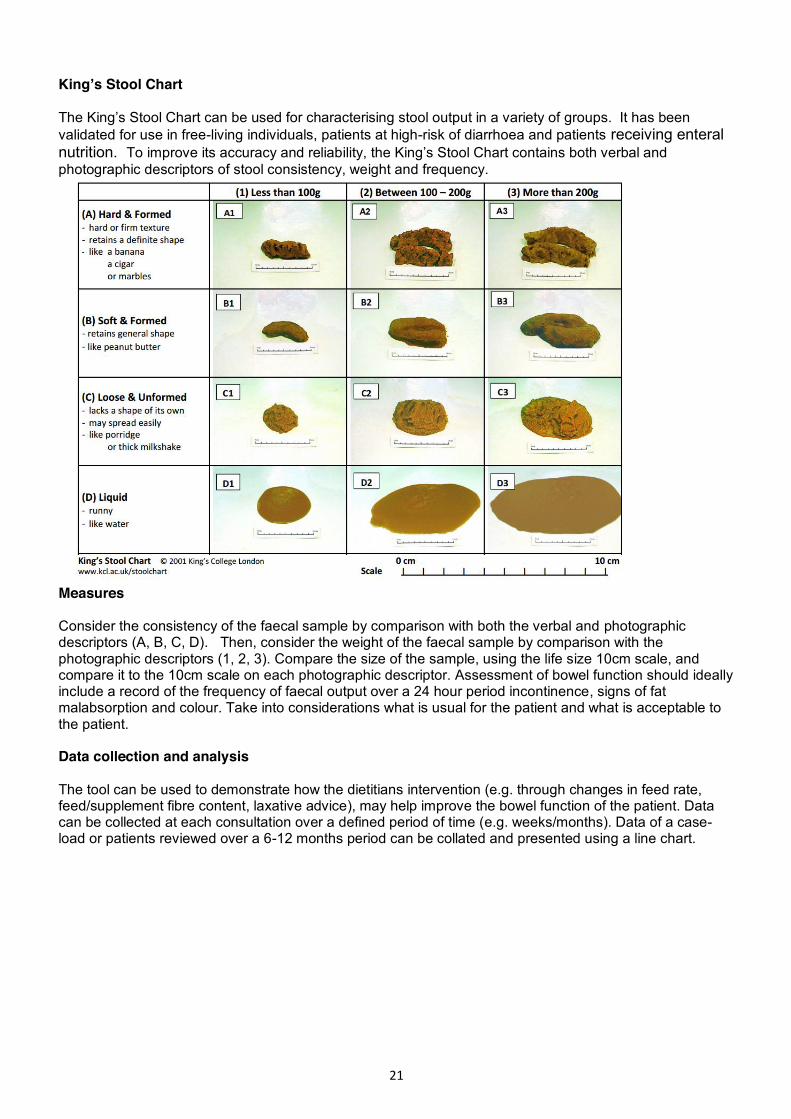
King’s Stool Chart The King’s Stool Chart can be used for characterising stool output in a variety of groups. It has been validated for use in free-living individuals, patients at high-risk of diarrhoea and patients receiving enteral nutrition. To improve its accuracy and reliability, the King’s Stool Chart contains both verbal and photographic descriptors of stool consistency, weight and frequency.
Measures Consider the consistency of the faecal sample by comparison with both the verbal and photographic descriptors (A, B, C, D). Then, consider the weight of the faecal sample by comparison with the photographic descriptors (1, 2, 3). Compare the size of the sample, using the life size 10cm scale, and compare it to the 10cm scale on each photographic descriptor. Assessment of bowel function should ideally include a record of the frequency of faecal output over a 24 hour period incontinence, signs of fat malabsorption and colour. Take into considerations what is usual for the patient and what is acceptable to the patient. Data collection and analysis The tool can be used to demonstrate how the dietitians intervention (e.g. through changes in feed rate, feed/supplement fibre content, laxative advice), may help improve the bowel function of the patient. Data can be collected at each consultation over a defined period of time (e.g. weeks/months). Data of a case-load or patients reviewed over a 6-12 months period can be collated and presented using a line chart.

22
ENTERAL FEEDING UNIVERSITY HOSPITALS BRISTOL NHS FOUNDATION TRUST CLINICAL OUTCOMES Seven outcomes measures are scored at each dietetic consultation (as appropriate). The data collection form and guidance on how each outcome measure is scored are described below.
Measures
1. Improvement in patient experience: Identified by the patient or dietitian and could be as simple as changing feed times, sizes of a bolus, or type of equipment to allow activities of daily living.
2. Maintain nutritional status: Aiming to keep the feeding situation and nutritional parameters at a status quo.
3. Beneficial change in weight/growth: An actual weight or centile could be specified or a weight range or direction.
4. Improve tolerance of feed: Included factors such as improving diarrhoea, constipation, vomiting, nausea, reflux or distension.
5. Maintain or improve skin integrity: Included keeping vulnerable skin intact, preventing deterioration of existing redness or broken areas, or improvement of existing pressure sores or broken areas.
6. Improvement in clinical parameters: Included improving hydration, biochemistry, or glycaemic control and increasing the nutrient value of intake (e.g. post dietary analysis).
7. Involvement of relevant health professionals/agencies: Effective liaison with/employment of, relevant and appropriate professionals or agencies. For example, involving speech therapists, nurses, asking the GP for soluble medications, alerting social services to issues, attending/initiating multidisciplinary meetings or joint visits.
The patient is scored at each appointment over a defined time period.

23
Outcome Score Result
2 The objective was fully met. For example, the aim of dietetic intervention was to improve feed tolerance by preventing diarrhoea and it was completely resolved
1 The objective was partially met. For example, the aim of dietetic intervention was to improve feed tolerance by preventing diarrhoea and it did not resolve completely but reduced in frequency or volume
0 The objective was not met but did not worsen. For example, the aim was to improve feed tolerance by preventing diarrhoea but it remained unchanged
-1 For this objective the outcome or situation worsened over time (specifically due to our intervention). For example, the aim was to improve feed tolerance by preventing diarrhoea but frequency or volume increased
Data collection and analysis A line graph can be used to demonstrate the effectiveness of the dietitians’ interventions on this range of indicators and for collated data collected from a number of patients, over a defined period of time. Episodes can be defined as an inpatient admission, for the period of time a patient attends an out-patient clinic, or until the symptom/indicator is no longer changing e.g. target weight met, or tolerating feed plan.

24
EQ-5D EQ-5D™ is a standardised, validated instrument for use as a measure of health outcome; it is applicable to a wide range of health conditions and treatments. The EQ-5D health questionnaire provides a simple descriptive profile and a single index value for health status. If you are thinking of using EQ-5D but would like to see it first, please download the UK English sample version of the EQ-5D-3L, EQ-5D-5L or the EQ-5D-Y. If you have already seen EQ-5D and/or decided to go ahead and use it, please complete the EQ-5D registration form. The EuroQol Office will then contact you by e-mail and inform you about the terms and conditions which apply to your use of the EQ-5D, including licensing fees (if applicable) http://www.euroqol.org/eq-5d-products/how-to-obtain-eq-5d.html. The following questionnaire is an example of the EQ-5D-3L, comprising the EQ-5D descriptive system and the EQ visual analogue scale. The EQ-5D-3L descriptive system comprises five dimensions and each dimension has three levels. By placing a tick in one box in each group below, please indicate which statements best describe your own health state today. Mobility □ I have no problems in walking about □ I have some problems in walking about □ I am confined to bed Self-care □ I have no problems with self-care □ I have some problems washing or dressing myself □ I am unable to wash or dress myself Usual activities (e.g. work, study, housework, family or leisure activities) □ I have no problems with performing my usual activities □ I have some problems with performing my usual activities □ I am unable to perform my usual activities Pain/discomfort □ I have no pain or discomfort □ I have moderate pain or discomfort □ I have extreme pain or discomfort Anxiety/depression □ I am not anxious or depressed □ I am moderately anxious or depressed □ I am extremely anxious or depressed Measures To help people say how good or bad a health state is, there is a scale (rather like a thermometer) on which the best state you can imagine is marked 100 and the worst state you can imagine is marked 0. QoL is often adversely affected by a chronic condition. However, using a QoL tool sequentially on a patient may illustrate for example the positive impact of changing a feed regimen on an individual’s ability to participate in family routine, or undertake ADLs secondary to a suitable feeding regimen or increased strength gained from adequate nutrition. Chronic disease should therefore not preclude the use of QoL measures, but requires one to account for the deterioration in health relating to the underlying clinical disease. NICE utilise cost per QALY (quality adjusted life years) to evaluate whether it is economically worth investing in or recommending a service. Little data is available for dietetics but the potential is very powerful as dietetic consultations resulting in improved QoL may be very cost effective. Reference: http://www.euroqol.org/eq-5d-products.html
25
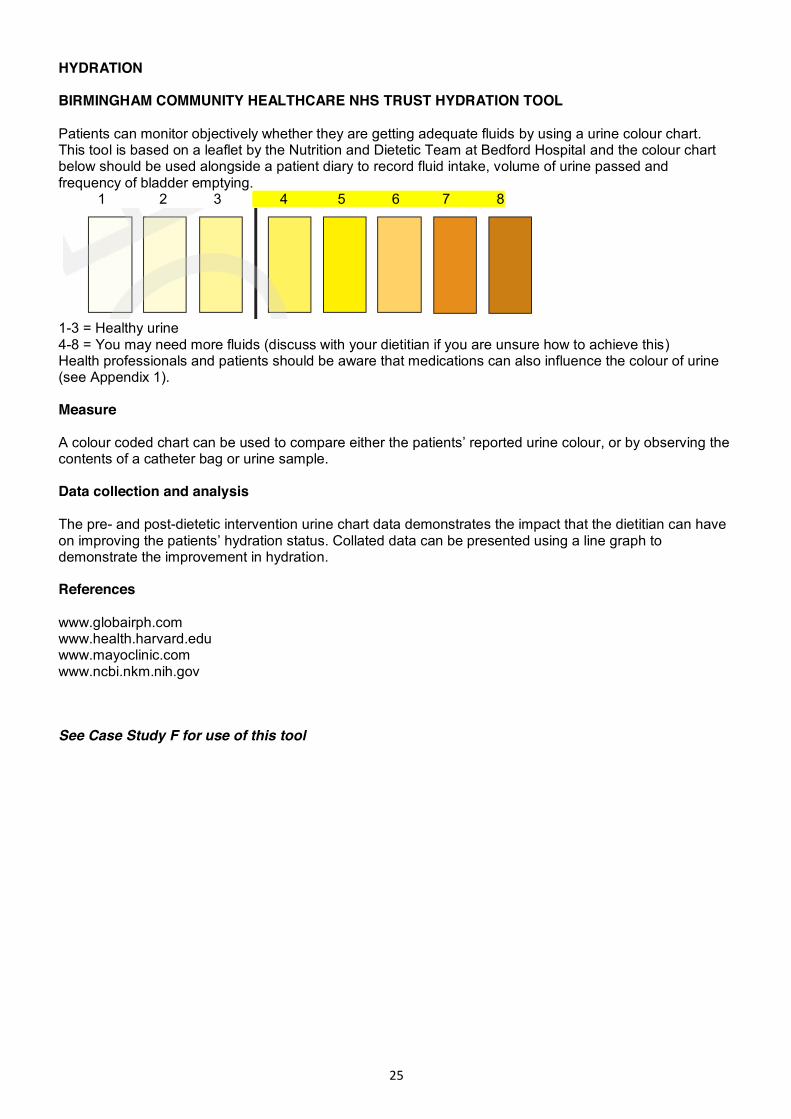
HYDRATION BIRMINGHAM COMMUNITY HEALTHCARE NHS TRUST HYDRATION TOOL Patients can monitor objectively whether they are getting adequate fluids by using a urine colour chart. This tool is based on a leaflet by the Nutrition and Dietetic Team at Bedford Hospital and the colour chart below should be used alongside a patient diary to record fluid intake, volume of urine passed and frequency of bladder emptying. 1 2 3 4 5 6 7 8
1-3 = Healthy urine 4-8 = You may need more fluids (discuss with your dietitian if you are unsure how to achieve this) Health professionals and patients should be aware that medications can also influence the colour of urine (see Appendix 1). Measure A colour coded chart can be used to compare either the patients’ reported urine colour, or by observing the contents of a catheter bag or urine sample. Data collection and analysis The pre- and post-dietetic intervention urine chart data demonstrates the impact that the dietitian can have on improving the patients’ hydration status. Collated data can be presented using a line graph to demonstrate the improvement in hydration. References www.globairph.com www.health.harvard.edu www.mayoclinic.com www.ncbi.nkm.nih.gov
See Case Study F for use of this tool
26
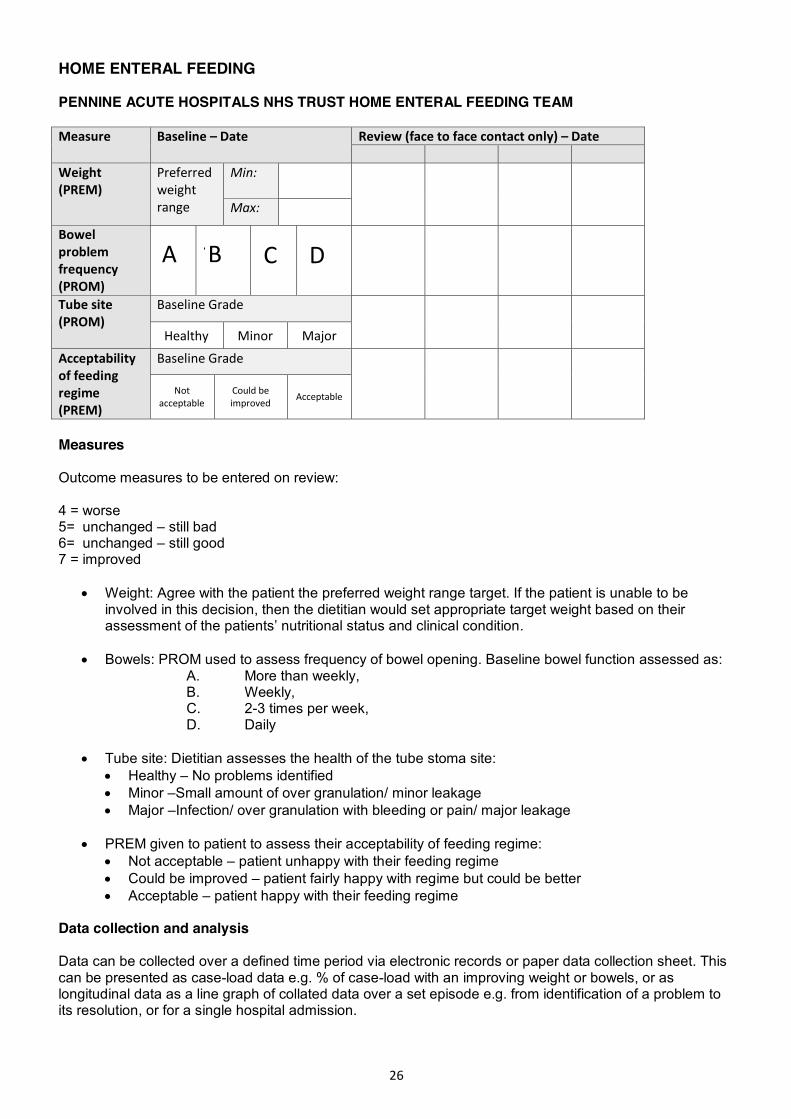
HOME ENTERAL FEEDING PENNINE ACUTE HOSPITALS NHS TRUST HOME ENTERAL FEEDING TEAM Measure Baseline – Date Review (face to face contact only) – Date
Weight (PREM)
Preferred weight range
Min:
Max:
Bowel problem frequency (PROM)
Tube site (PROM)
Baseline Grade
Healthy Minor Major
Acceptability of feeding regime (PREM)
Baseline Grade
Not acceptable
Could be improved Acceptable
Measures Outcome measures to be entered on review: 4 = worse 5= unchanged – still bad 6= unchanged – still good 7 = improved
x Weight: Agree with the patient the preferred weight range target. If the patient is unable to be involved in this decision, then the dietitian would set appropriate target weight based on their assessment of the patients’ nutritional status and clinical condition.
x Bowels: PROM used to assess frequency of bowel opening. Baseline bowel function assessed as: A. More than weekly, B. Weekly, C. 2-3 times per week, D. Daily
x Tube site: Dietitian assesses the health of the tube stoma site:
x Healthy – No problems identified x Minor –Small amount of over granulation/ minor leakage x Major –Infection/ over granulation with bleeding or pain/ major leakage
x PREM given to patient to assess their acceptability of feeding regime:
x Not acceptable – patient unhappy with their feeding regime x Could be improved – patient fairly happy with regime but could be better x Acceptable – patient happy with their feeding regime
Data collection and analysis Data can be collected over a defined time period via electronic records or paper data collection sheet. This can be presented as case-load data e.g. % of case-load with an improving weight or bowels, or as longitudinal data as a line graph of collated data over a set episode e.g. from identification of a problem to its resolution, or for a single hospital admission.
A B C D
27
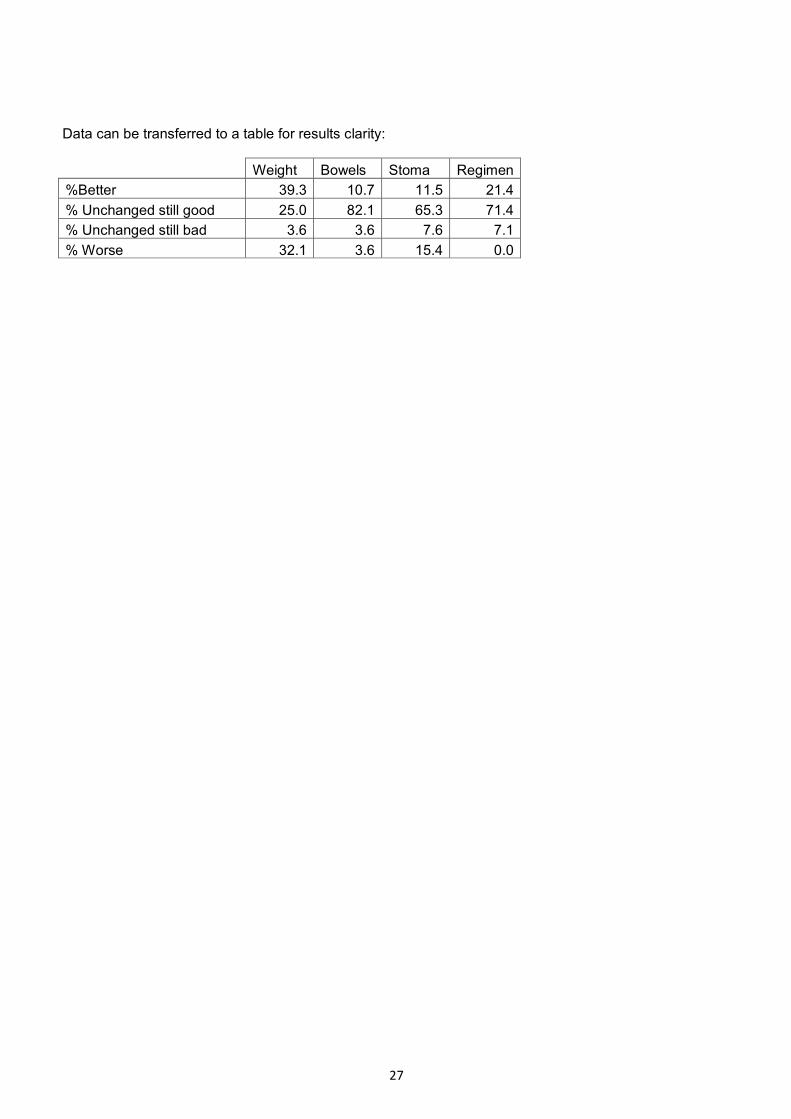
Data can be transferred to a table for results clarity:
Weight Bowels Stoma Regimen
%Better 39.3 10.7 11.5 21.4 % Unchanged still good 25.0 82.1 65.3 71.4 % Unchanged still bad 3.6 3.6 7.6 7.1 % Worse 32.1 3.6 15.4 0.0
28
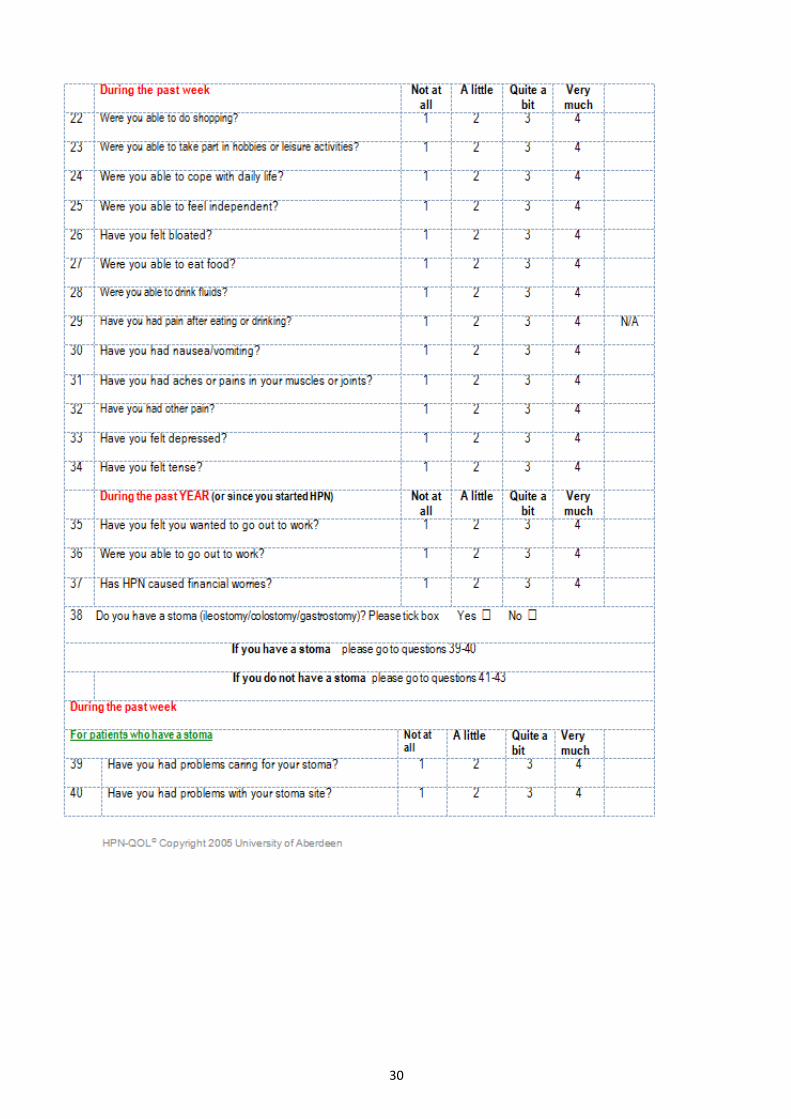
HOME PARENTERAL NUTRITION: QUALITY OF LIFE (HPN QoL) The HPN-QOL© is a 48-item questionnaire that focuses on physical, emotional and symptomatic issues. The questionnaire contains seven multi-item functional scales and one single-item functional scale, as well as six multi-item and three single-item symptom scales. The functional scales include general health, ability to holiday or travel, coping, physical function, ability to eat and drink, employment, sexual function and emotional function. The symptom or problem scales include body image, immobility, fatigue, sleep pattern, gastrointestinal symptoms, other pain, either stoma management or bowel movements, financial issues and body weight. There are three global health status/quality of life numerical rating scales. The first is a global QoL question. The other two numerical rating scales pertain to the effect on QoL of the underlying illness leading to the need for HPN and its effect. Two single HPN items relate to the nutrition team and the availability of an ambulatory pump for infusion of HPN, in which a high score represents a good outcome.

29
30

31

32
Therapy Outcome Measures (TOMS)
33
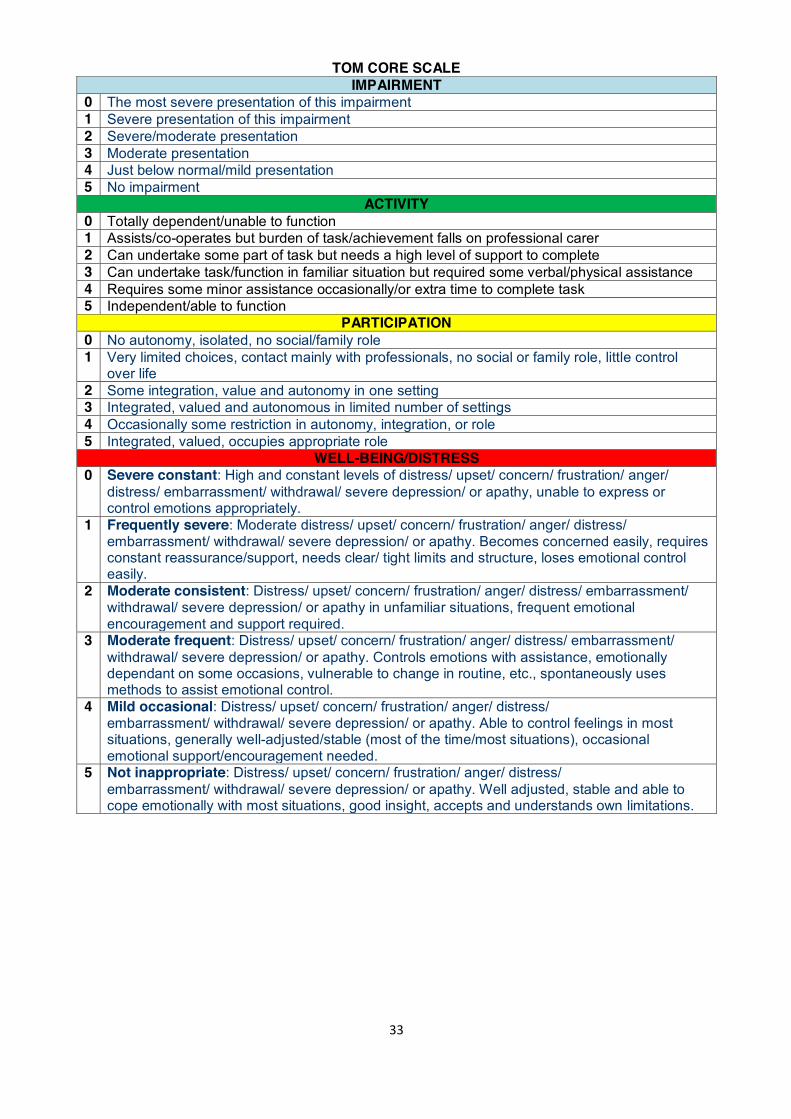
TOM CORE SCALE IMPAIRMENT
0 The most severe presentation of this impairment 1 Severe presentation of this impairment 2 Severe/moderate presentation 3 Moderate presentation 4 Just below normal/mild presentation 5 No impairment
ACTIVITY 0 Totally dependent/unable to function 1 Assists/co-operates but burden of task/achievement falls on professional carer 2 Can undertake some part of task but needs a high level of support to complete 3 Can undertake task/function in familiar situation but required some verbal/physical assistance 4 Requires some minor assistance occasionally/or extra time to complete task 5 Independent/able to function
PARTICIPATION 0 No autonomy, isolated, no social/family role 1 Very limited choices, contact mainly with professionals, no social or family role, little control
over life 2 Some integration, value and autonomy in one setting 3 Integrated, valued and autonomous in limited number of settings 4 Occasionally some restriction in autonomy, integration, or role 5 Integrated, valued, occupies appropriate role
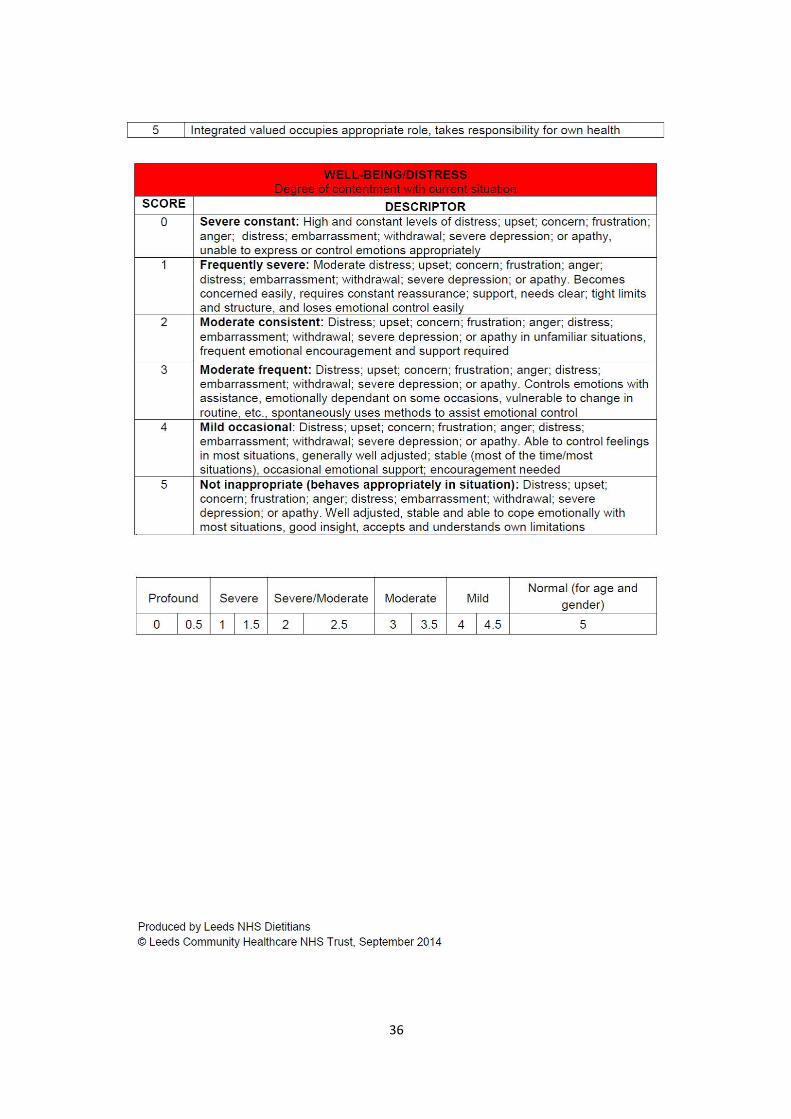
WELL-BEING/DISTRESS 0 Severe constant: High and constant levels of distress/ upset/ concern/ frustration/ anger/
distress/ embarrassment/ withdrawal/ severe depression/ or apathy, unable to express or control emotions appropriately.
1 Frequently severe: Moderate distress/ upset/ concern/ frustration/ anger/ distress/ embarrassment/ withdrawal/ severe depression/ or apathy. Becomes concerned easily, requires constant reassurance/support, needs clear/ tight limits and structure, loses emotional control easily.
2 Moderate consistent: Distress/ upset/ concern/ frustration/ anger/ distress/ embarrassment/ withdrawal/ severe depression/ or apathy in unfamiliar situations, frequent emotional encouragement and support required.
3 Moderate frequent: Distress/ upset/ concern/ frustration/ anger/ distress/ embarrassment/ withdrawal/ severe depression/ or apathy. Controls emotions with assistance, emotionally dependant on some occasions, vulnerable to change in routine, etc., spontaneously uses methods to assist emotional control.
4 Mild occasional: Distress/ upset/ concern/ frustration/ anger/ distress/ embarrassment/ withdrawal/ severe depression/ or apathy. Able to control feelings in most situations, generally well-adjusted/stable (most of the time/most situations), occasional emotional support/encouragement needed.
5 Not inappropriate: Distress/ upset/ concern/ frustration/ anger/ distress/ embarrassment/ withdrawal/ severe depression/ or apathy. Well adjusted, stable and able to cope emotionally with most situations, good insight, accepts and understands own limitations.
34
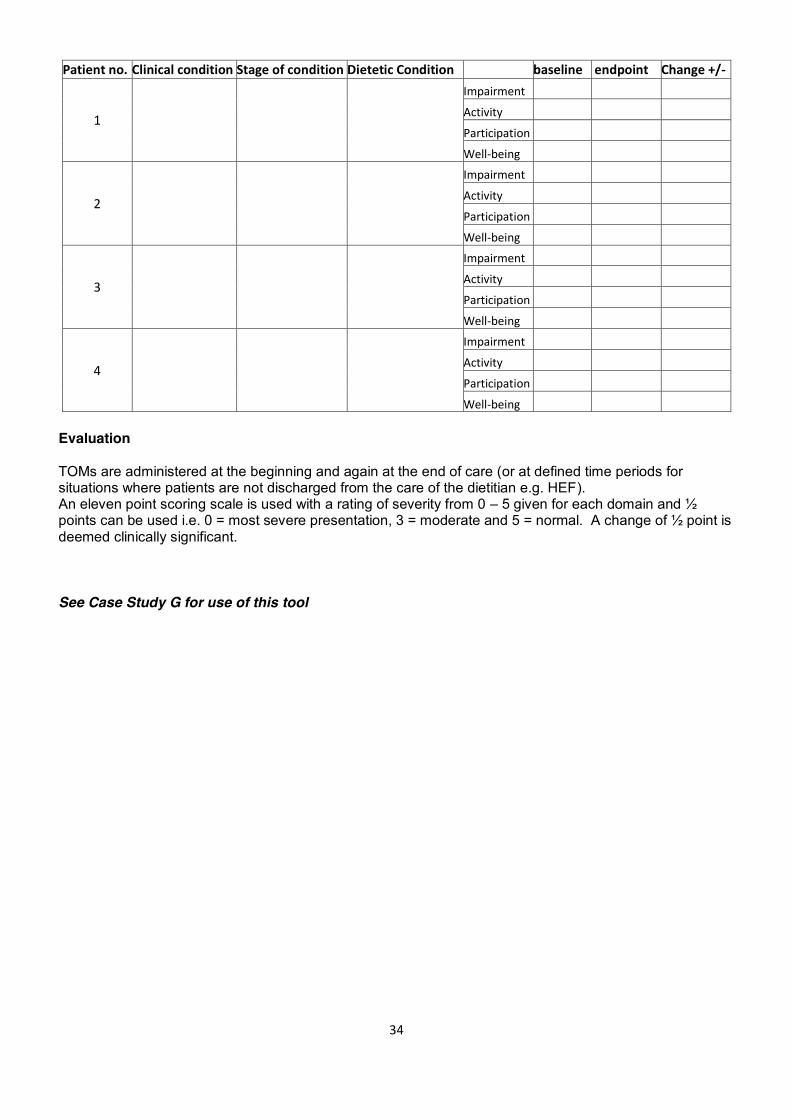
Patient no. Clinical condition Stage of condition Dietetic Condition baseline endpoint Change +/-
1
Impairment Activity Participation Well-being
2
Impairment Activity Participation Well-being
3
Impairment Activity Participation Well-being
4
Impairment Activity Participation Well-being
Evaluation TOMs are administered at the beginning and again at the end of care (or at defined time periods for situations where patients are not discharged from the care of the dietitian e.g. HEF). An eleven point scoring scale is used with a rating of severity from 0 – 5 given for each domain and ½ points can be used i.e. 0 = most severe presentation, 3 = moderate and 5 = normal. A change of ½ point is deemed clinically significant.
See Case Study G for use of this tool

35
36
37
38
39
40

41
Case Studies
The following case studies have been included to demonstrate how some of the outcomes measures outlined could be used in practice.
42
CASE STUDY A Mrs A. 65 years of age. Diagnosed with Motor Neurone Disease 12 months previously. Current status Mrs A is nil by mouth and has been discharged from hospital with a gastrostomy in place on a 12 hour overnight pump feeding plan that meets her nutritional requirements. Her husband has agreed to administer the feed, fluids and medications via the gastrostomy with support from district nurses. She is on non-invasive ventilation (NIV) overnight. Week 1 review Assessment Mrs A is underweight with a weight 46kg (BMI 17 kg/m2). She is constipated and reports being tired with headaches during the day. The time the feed finishes in the morning is inconvenient with Mrs A having to remain in bed longer than she would like, and her husband reports some difficulties setting up the feeding pump. Goals
1. Move towards initial target weight of 54kg (BMI 20kg/m2) 2. Normal bowel motions (Bristol stool chart 3-4) 3. Improve patient’s and husband’s general well-being 4. Improve patient’s husbands confidence with feed administration
Actions 1. Changed to a fibre feed to improve bowel consistency 2. Feed rate increased to better fit with when the patient wishes to go to bed and get up. 3. Provided additional training for husband on operating the feeding pump. 4. Referred to the GP for review of why patient reporting tiredness and headaches
Week 3 review Assessment Weight stable (BMI 17kg/m2). Happier with timing on pump but continues with tiredness/headaches despite GP review. She reveals she does not like to be on NIV and feed at the same time. Stool consistency improved but still only opening every 3-4 days. Husband now managing the feeding pump independently. Actions
1. Changed to 4 bolus feeds during the day to facilitate full use of NIV overnight 2. Delayed advising on an increase in calories until patient settled on feeding method
Week 5 review Assessment Headaches and tiredness improved. Weight remains stable. Bowels opening every 3-4 days and feeling bloated. Bolus feed regimen well tolerated. Her husband reports bolus feed difficult to administer using the syringe. Mr and Mrs A reporting prevented from leaving the house because of the need to feed. Actions
1. Changed to bolus feed using pump to reduce the burden associated with feeding 2. Arranged for delivery of a pump back pack to facilitate feeding outside of the house 3. Introduced high calorie, low volume modular supplement, to promote weight gain 4. GP asked to prescribe laxative
Week 7 review Assessment Bowels opening daily and Bristol Stool Chart 4. She is pleased with a 1.5kg weight increase (BMI 17kg/m2). Mr and Mrs A have started visiting friends and attending social events. Actions 1. Continue with current feed regimen. Agreed with Mr and Mrs A to visit in 1 month Week 8 review Assessment Gastrostomy tube displaced at home. Actions
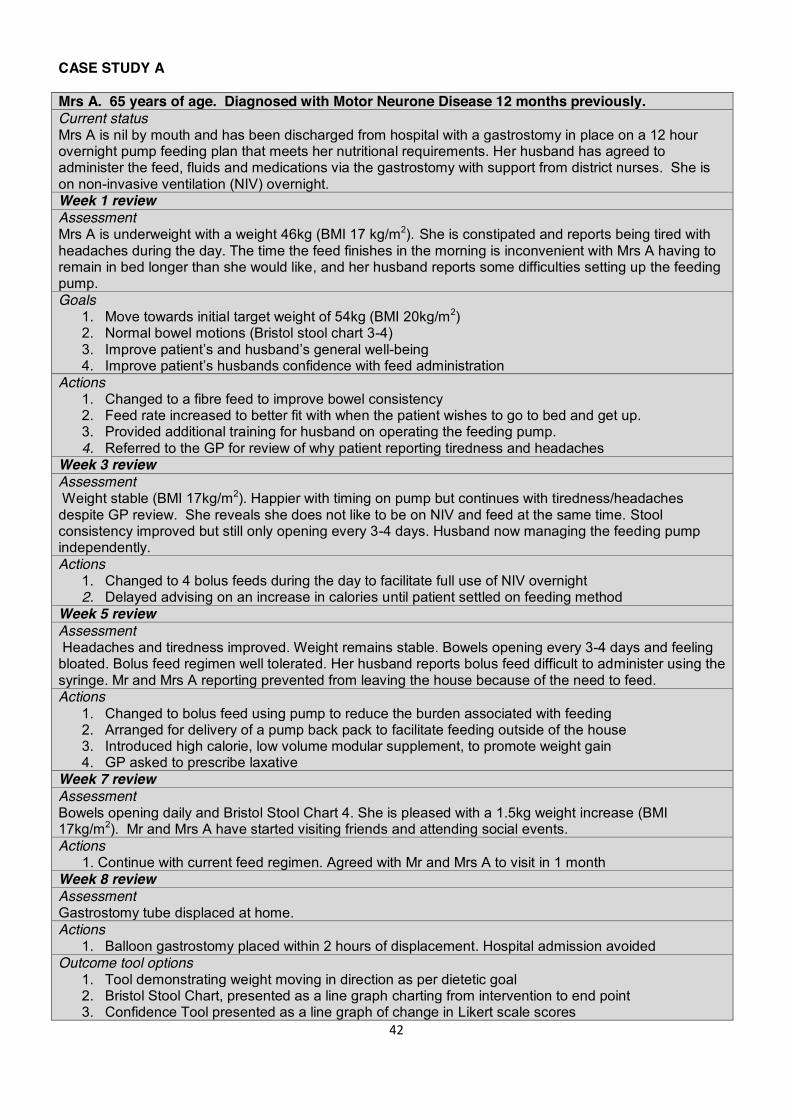
1. Balloon gastrostomy placed within 2 hours of displacement. Hospital admission avoided Outcome tool options
1. Tool demonstrating weight moving in direction as per dietetic goal 2. Bristol Stool Chart, presented as a line graph charting from intervention to end point 3. Confidence Tool presented as a line graph of change in Likert scale scores
43
4. Admission avoidance: % of total tube displacements resulting in hospital visit per year Comments Collection of longitudinal outcome data demonstrated that frequent dietetic review of this complex patient, was effective in improving health outcomes, patient/carer experience and reduced health service costs by avoiding hospital visits. Reporting
Demonstrated that weight is moving in the direction as per dietetic goal.
Used Bristol Stool Chart Scores to demonstrate improvement in constipation.
Demonstrated that patient confidence in self-management of feeding method has increased.
Utilised information from this and other cases over a year to demonstrate how admissions have been avoided.
44
CASE STUDY B Female. 72 years of age. Oesophageal cancer with liver metastases. Current status Nil by mouth with nasogastric tube in-situ. Awaiting decision for palliative treatment. Discharged 4 days ago on home enteral feeding via pump, supplemented with 3 high energy boluses. Assessment Patient: Tolerating pump feed and boluses well. Mobilising well. Self-caring. Unhappy about her lack of confidence in setting up feed, water flushes, pH checking and administering bolus feeds. Family: They visit to set up feeds (husband takes over when they leave). Goal 1. Improve patient’s level of confidence in managing her feed Actions 1. Assessed confidence level: 3/10 2. Identified the aspects that the patient found confusing and provided education and re-assurance 3. Motivated patient to set up all aspects of her feed
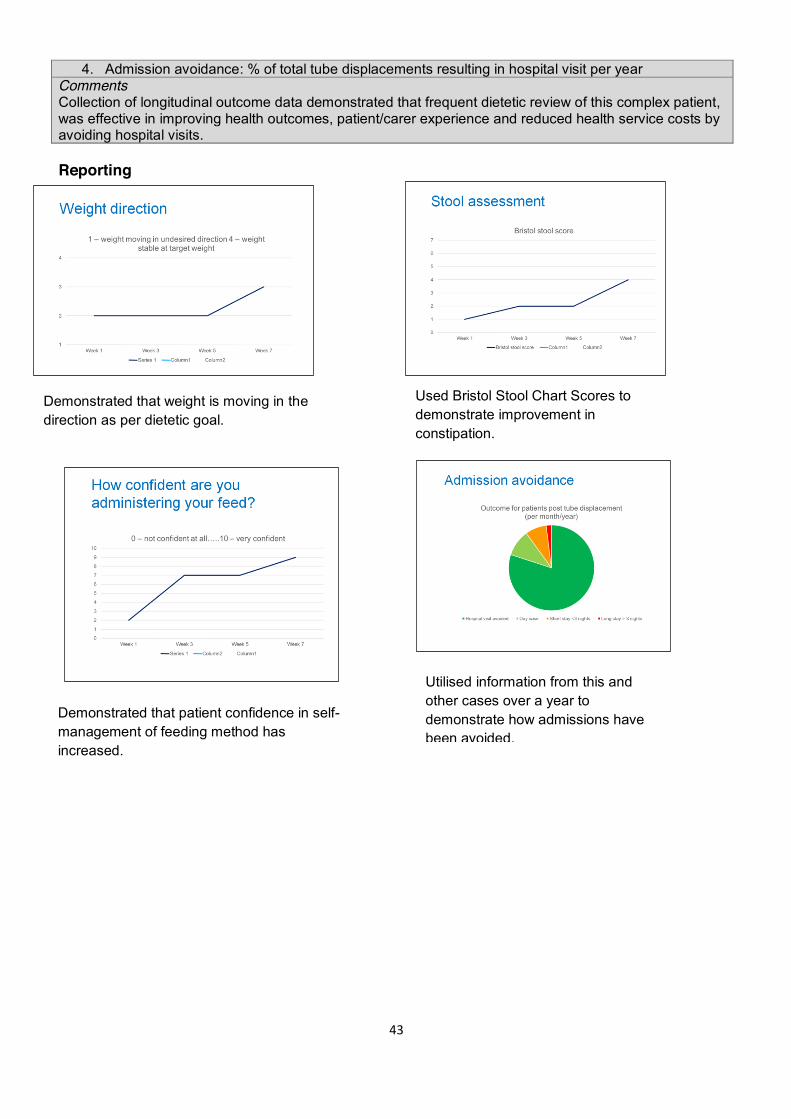
Week 4 review Assessment Assessed confidence level: 7/10. All self-care conducted confidently except pH (being done by husband).
Outcome tool Confidence Tool. Comments Dietetic review of this patient identified that improving her confidence about her feed would facilitate better self-care and also help her family and husband in her care. Following education and re-assurance the patient’s confidence improved significantly. Reporting
Demonstrated increased confidence in self-management of feed.

45
CASE STUDY C Mrs C. 61 years of age. 3 recent hospital admissions, for exacerbation of COPD treated with antibiotics. Current status Usual weight 60 kg. Current weight 52kg (BMI 18.0kg/m2). 13% weight loss in the past 3 months. Initial assessment in outpatient clinic Patient: Diet history reveals she is eating a healthy diet, following being given previous advice to reduce her fat and sugar intake. Family: Her husband is obese and has recently commenced insulin for type 2 diabetes. Goals
1. Improve patient’s knowledge and confidence to change her current dietary habits 2. Prevent further weight loss and aim for 2kg weight gain in the next 2 months
Actions 1. Educate the patient about COPD, importance to prevent further weight loss/muscle wasting and
increase body weight towards usual weight. 2. Advise practical and achievable dietary changes that will have a positive impact on her
nutritional status, giving consideration to the patients husband own health problems. 2 month review Assessment Mrs C has gained 3kg now weighing 55kg (BMI 19kg/m2). She has successfully implemented the food fortification advice given. Diet history indicates that the patient is now meeting 90% of her calorie requirements. Outcome tool PREM completed by patient following consultation (not in presence of the dietitian). 1. Do you feel you have gained useful and practical information to help you to make changes in your diet?
0 1 2 3 4 5 Not at all very little a little some quite a lot a lot 2. How confident are you to use the information provided
0 1 2 3 4 5 Not at all very little a little some quite a lot a lot 3. Do you feel that one or more aspects of your diet will change as a result of seeing the dietitian?
Yes No Comments The use of this simple PREM tool demonstrated that patient knowledge and confidence improved as a result of the dietitians input. Providing the PREM tool following the end of the follow up consultation (and only once) is less time consuming for both the dietitian and patient.
46
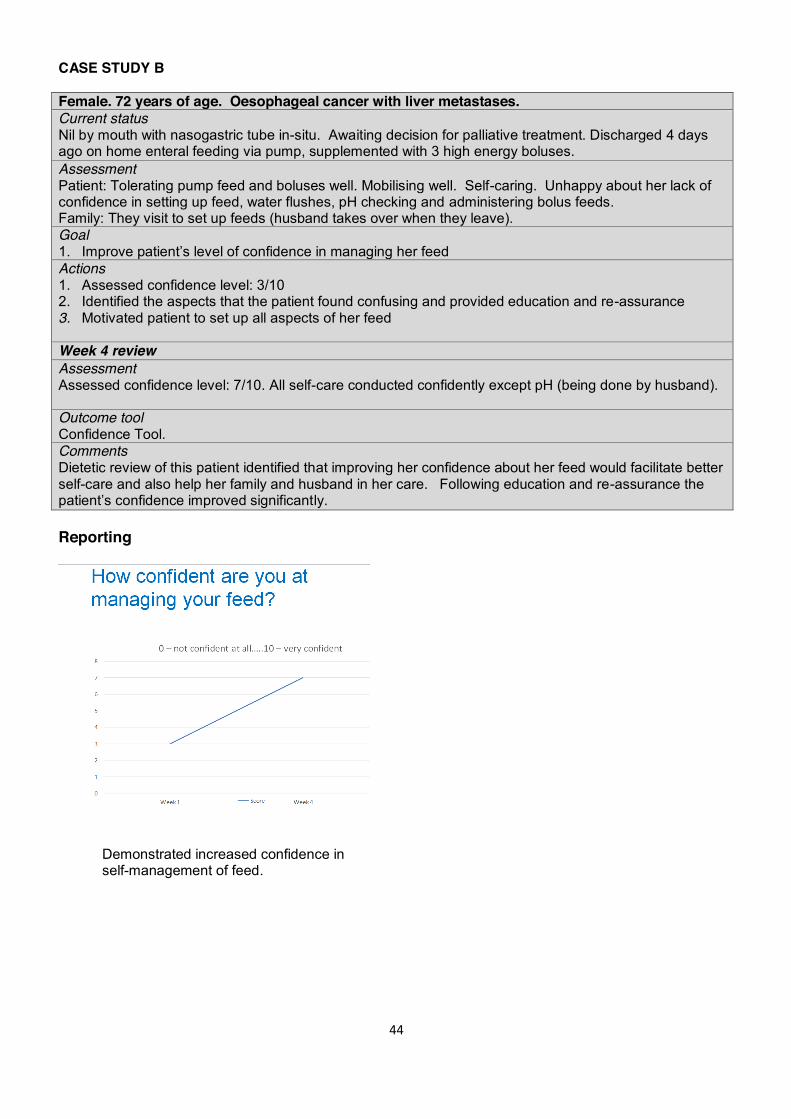
Reporting Collated data can be transferred to Excel spreadsheet and presented every 6 months as demonstrated below.
0% 1% 3% 10%
35% 51%
Question 1: Do you feel you have gained useful and practical knowledge to make
suitable changes to your diet?
Not at all Very little A little Some Quite a lot A lot
0% 1% 1%
4%
33% 61%
Question 2: How confident are you to apply the advice provided?
Not at all Very little A little Some Quite a lot A lot
98%
2%
Question 3: Do you feel that one or more aspects of your diet has
changed /will change as a result of seeing the dietitian?
Yes No
Demonstrated increased level of confidence by patient.
Demonstrated increased level of knowledge gained by patient.

47
CASE STUDY D Mr P. 80 years of age. Admitted to hospital with falls and sepsis. Current status Mr P is assessed as being unsafe to swallow all diet and fluid consistencies, and made nil by mouth. A nasogastric (NG) tube is inserted for feeding. Patient has Type II diabetes. Initial assessment Assessment Weight: 50kg (BMI 18kg/m2). He has unintentionally lost 10% weight over the past 2 months. Pump feed is running continuously overnight which is affecting Mr D’s sleep and he is complaining of tiredness during the day. Bowels opening normally. Fluid balance is on average positive >1000ml per day. Mr P remains on IV fluids. Goals 1. Maintain patient’s weight initially and then promote weight gain towards target weight of 56kg
(BMI 20kg/m2) 2. Improve patient’s wellbeing by facilitating quality sleep 3. Maintain blood glucose levels whilst being enterally fed Actions 1. NG feeding rate gradually increased and changed to daytime feeding 2. Advised medical team to reduce IV fluids as NG feed increased 3. Informed diabetes specialist nurse about feeding regimen to ensure glycaemic control
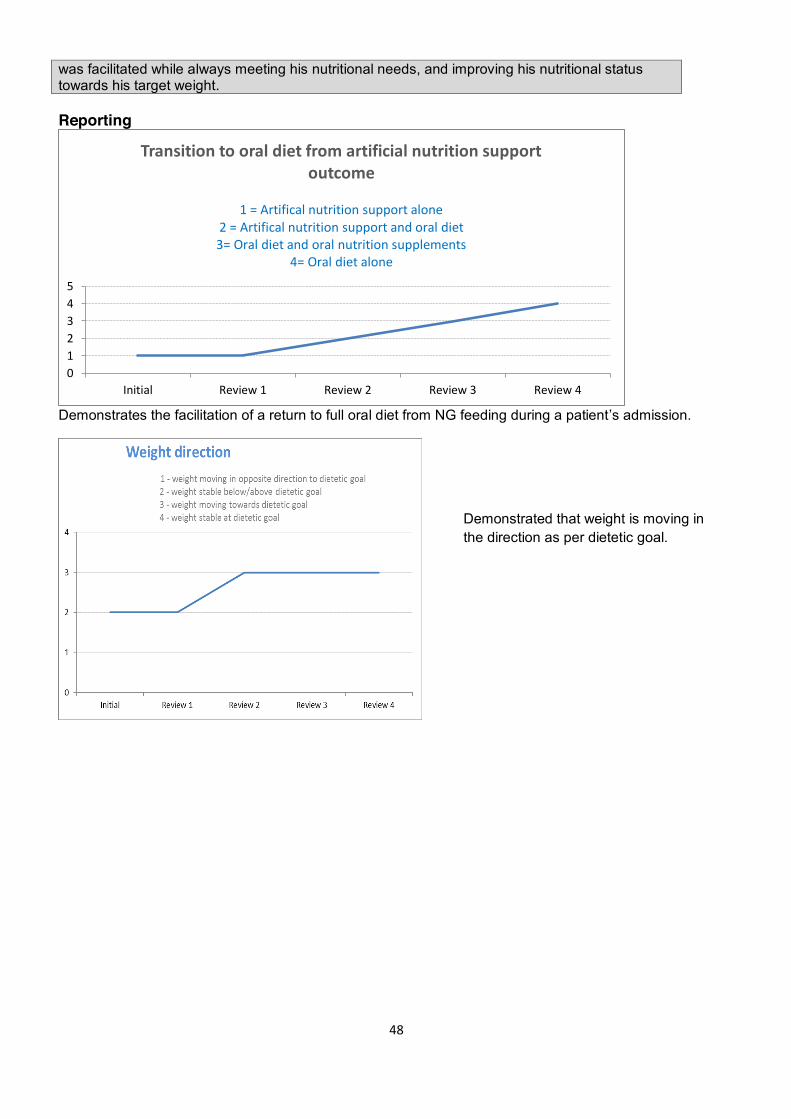
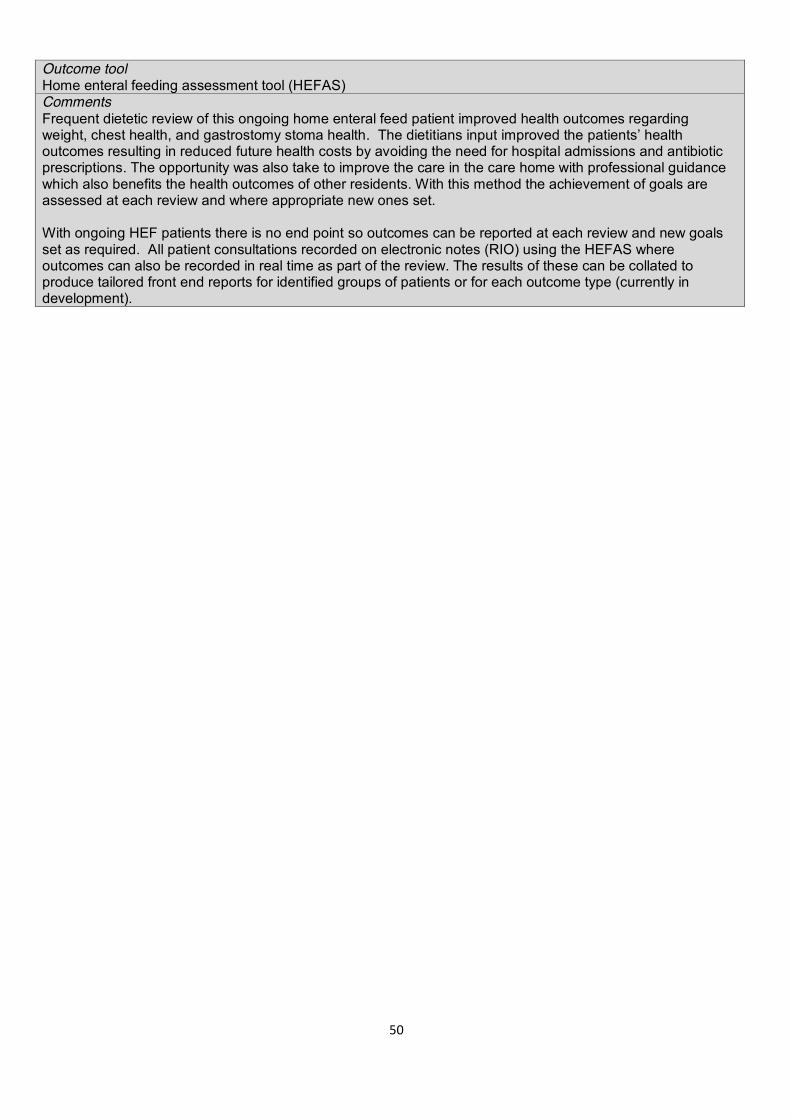
maintained and appropriate medications prescribed Review 1 Assessment NG feed tolerated at target rate. Weight stable. Blood glucose levels in normal range. Mr D is now sleeping better as a result of day-time pump feeding. Action 1. Feed changed to an energy feed and volume increased to promote weight gain Review 2 Assessment SLT commenced patient on puree diet and Stage 2 fluids. Patient not keen on thickened fluids. Weight increased by 1kg. Actions 1. NG feed reduced to account for oral intake 2. Oral nutritional supplements prescribed to meet nutritional requirements 3. Ward asked to keep food record chart to monitor intake Review 3 Assessment SLT commenced on soft diet and normal fluids. Weight increased by another 1kg. Actions 1. NG tube removed 2. High energy and protein soft foods encouraged with food fortification techniques 3. Advised to only take oral nutritional supplements if eats less than ½ his meals Review 4 Assessment Meeting all of his nutritional requirements with oral diet alone. Weight increased by a further 1kg. Medically fit for discharge home. Actions 1. Oral nutrition supplements stopped 2. Food fortification advice provided for home 3. Discharged from dietetic service. Ward to manage and re-refer if indicated Outcome tools 1. Tool demonstrating weight moving in direction as per dietetic goal 2. Transition from artificial nutrition support to oral diet outcome tool Comments Dietetic intervention supported this patient at a time when he was unable to meet his nutritional requirements orally. Through regular review smooth transition from tube feeding back to oral diet
48
was facilitated while always meeting his nutritional needs, and improving his nutritional status towards his target weight. Reporting
Demonstrates the facilitation of a return to full oral diet from NG feeding during a patient’s admission.
012345
Initial Review 1 Review 2 Review 3 Review 4
Transition to oral diet from artificial nutrition support outcome
1 = Artifical nutrition support alone
2 = Artifical nutrition support and oral diet 3= Oral diet and oral nutrition supplements
4= Oral diet alone
Demonstrated that weight is moving in the direction as per dietetic goal.

49
CASE STUDY E
Mr E. 70 years of age. Advanced Multiple Sclerosis. Living in a nursing home and bedbound. Current status Mr E is nil by mouth due to aspiration risk and has been fed via a gastrostomy for 2 years. He is receiving 1500kcals with a pump feeding regimen. His weight has gradually increased over the last few years and his feed had been reduced from 1800kcal 4 months ago with a goal to stabilise his weight. Month 1 review Assessment Home Enteral Feeding Assessment Score (HEFAS) completed on electronic record (RIO). Further weight gain of 3kg in previous 4 months. Weight 75kg (BMI 27.2kg/m2). He has had 2 chest infections, one of which resulted in a hospital admission, in the last 3 months. On observation he was lying at a 25o angle when feeding. His gastrostomy stoma site was red (scored 4 on stoma care tool) and unclean. The nursing home was unable to produce documentation evidencing daily care of the tube and stoma. Goals and timescales 1. Prevent further weight gain – within 3 months 2. Prevent aspiration – immediately 3. Improve health of gastrostomy stoma - immediately 4. Improve adherence with standard gastrostomy tube care – immediately Actions 1. Changed to a lower energy (1200 kcal) complete feed to prevent further weight gain 2. Care home staff advised that his feeding position in bed should be a minimum of 45o angle to prevent
aspiration 3. Gastrostomy stoma swabbed to inform correct intervention required 4. Educated care home staff on tube and stoma care and provided a gastrostomy care chart to document
care given Month 4 review Assessment Weight stable at 75.1kg (BMI 27kg/ m2). No further chest infections and patient observed lying at 45o angle. Staff confirmed the gastrostomy stoma had been infected and treated effectively with antibiotics. However, the stoma site remained dirty and staff reported it had not been cleaned that day. No documentation on tube or stoma care recorded. Outcome scores
1. Prevent further weight gain: Achieved (A) 2. Prevent aspiration: Achieved (A). Likely hospital admission avoided 3. Improve gastrostomy stoma health: Partially achieved (PA) infection treated but still
not clean, due to non-adherence of staff with advice 4. Improve tube care : Not achieved (NA), due to non-adherence with advice
Goals 1. Maintain current weight 2. Improve gastrostomy stoma health 3. Improve tube care Actions 1. Continue 1200kcal complete feed and monitor weight 2. Ensure gastrostomy stoma care is completed and documented 3. Ensure daily tube care is completed and documented. Concerns about tube and stoma care raised with
care home manager Month 7 review Assessment Weight remains stable at 74kg. No chest infections and positioning good. PEG site clean and dry and documentation of daily PEG care in place. Outcome scores
1. Prevent further weight gain Achieved (A) 2. Improve PEG site Achieved (A) as stoma is clean and dry. 3. Improve tube care Achieved (A) as PEG site good and documentation
evident
50
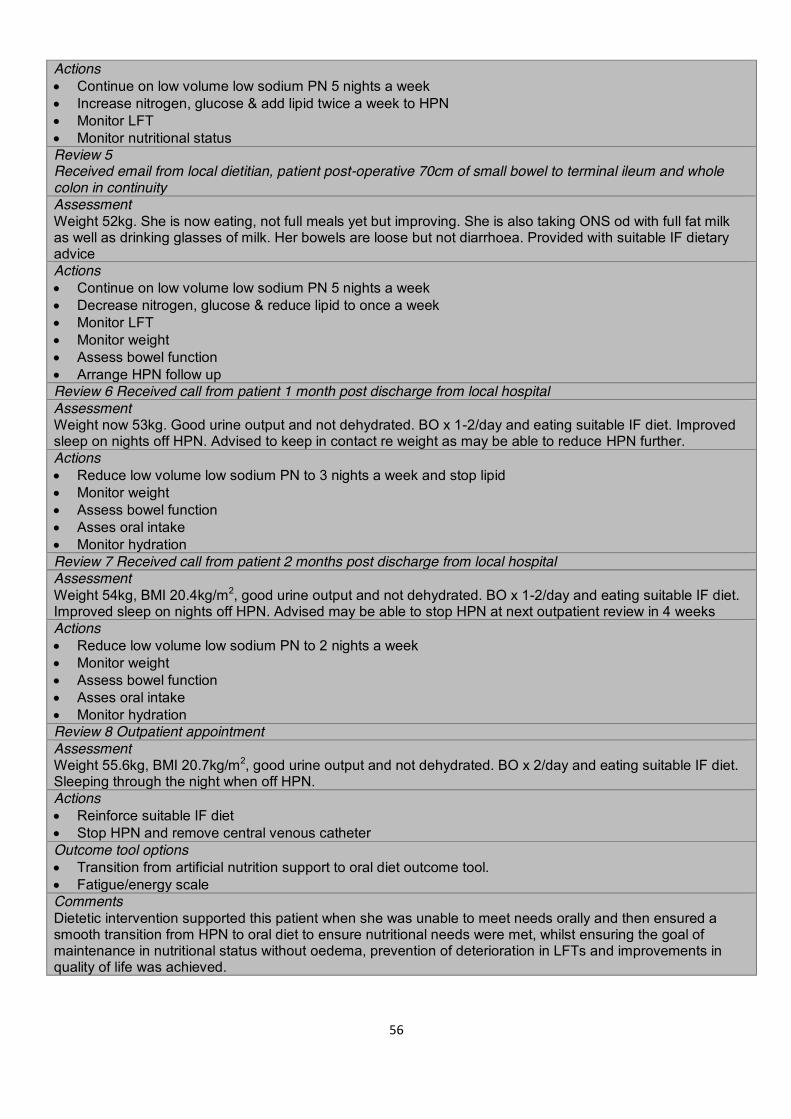
Outcome tool Home enteral feeding assessment tool (HEFAS) Comments Frequent dietetic review of this ongoing home enteral feed patient improved health outcomes regarding weight, chest health, and gastrostomy stoma health. The dietitians input improved the patients’ health outcomes resulting in reduced future health costs by avoiding the need for hospital admissions and antibiotic prescriptions. The opportunity was also take to improve the care in the care home with professional guidance which also benefits the health outcomes of other residents. With this method the achievement of goals are assessed at each review and where appropriate new ones set. With ongoing HEF patients there is no end point so outcomes can be reported at each review and new goals set as required. All patient consultations recorded on electronic notes (RIO) using the HEFAS where outcomes can also be recorded in real time as part of the review. The results of these can be collated to produce tailored front end reports for identified groups of patients or for each outcome type (currently in development).

51
CASE STUDY F Mrs P. 79 years of age. COPD and recent hospital admission with pneumonia. Referred by community nursing. Current status Mrs P lives alone. She has carers twice a day (morning & 5pm). She has COPD managed with inhalers and is prone to chest infections. She gave up smoking several years ago. On referral her BMI was 17kg/m2 (Ht. 1.6m, Wt. 44kg). She has lost 3.5 kg in weight in recent weeks. Her ‘MUST’ score = 3. Week 1 Review Patient: Since referral she has lost a further 1 kg in weight (43kg). She reports feeling weak and tired (energy levels 4/10 on scale). She is not mobilising as well as she did pre-admission which is of concern to her. She is prescribed one compact ONS daily but reports not liking it so use is intermittent not daily as recommended. She reports the carers ‘are good’, and her daughter who is local does the shopping. She rates her appetite as 4/10 (on appetite scale). She is not bothering with getting any lunch and is not having any snacks between meals, but does eat breakfast & one ready meal a day prepared by the carer. On questioning her fluid intake is only 800ml daily, she describes her urine colour (see urine tool) as 6 with only small volumes produced. She is able to mobilise to the downstairs toilet but is struggling with tasks such as making meals, getting drinks due to levels of fatigue and breathlessness. Goals 1. Increase weight/BMI (target 47.5kg BMI 18.5 kg/m2 within 3 months) 2. Improve hydration 3. Reduce fatigue Actions 1. An extra carer call a day (lunchtime to provide a small sandwich and hot drink) for the time being would
be acceptable and Mrs P. has consented for her daughter to be phoned to request this to be arranged 2. Care agency to be called to request her care plan to include leaving out a drink of her choice for
between visits and also leaving out a small snack plate of high calorie treats (chocolate, grapes, small cake agreed)
3. To try samples of a ‘shake’ style ONS which the carer would prepare at the tea time call and she could drink in the evening (in place of the compact ONS that is rarely consumed)
Week 2 Phone review Patient: Likes the ‘shake’ style ONS and would like to continue. Extra carer visit in place and says managing to eat the small lunch, drinking more and picking at the snacks left out. Overall feeling better in herself and not as weak. Actions 1. GP contacted to prescribe the ‘shake’ style ONS & daughter informed of progress Week 6 Review Patient: Weight 44.5kg, Urine colour 4 and passing greater volume. Energy levels 5/10. Managing to take the daily ONS – prefers the taste of this one. She is pleased she can see an improvement. Actions 1. Continue with same carer regime 2. Continue one shake style ONS daily Week 13 Review Patient: Weight 46.8kg (> 5% weight gain). Urine colour 3. Mobilising better and energy levels reported to be 8/10. Appetite rated at 8/10. Now feels she can prepare some food and getting hot drinks herself between meals so she is considering stopping the lunch carer call for the time being. Actions 1. Continue the one shake style ONS daily, 3 meals daily and snacks 2. Agreed target weight to be revised to 50kg for a healthier BMI 3. Discharged and handed over to community nursing, who review COPD regularly, to monitor weight and ongoing ONS with guidance to stop ONS when target weight reached Outcome scores
1. Increase weight/BMI (target 47.5kg BMI 18.5 kg/m2 within 3 months) – Achieved (A) as > 5% weight gained over this time

52
2. Improve hydration – Achieved (A) as urine colour now in normal range on the scale and volume of urine increased
3. Decrease fatigue – Achieved (A) as energy levels moved up 4 (> 3) on the scale Outcome tools Oral nutrition support assessment tools (ONSAS and ONSRS) Fluid hydration. Comments Three dietetic contacts taking a holistic approach to assessment and action facilitated weight gain, greater independence and improved health outcomes regarding dehydration risk. It is likely a hospital admission for dehydration/UTI was avoided. As nutritional status improves, immunity levels are likely to improve possibly decreasing the frequency of chest infections. With ONS community patients there is usually an end point as they are generally only seen two –four times and then discharged, so outcomes can be reported once at the final consultation. All patient consultations are recorded on electronic notes (RIO) using the ONSAS initially and then the review form ONSRS where outcomes can be recorded at the final review. The results of these for can be collated electronically using software to produce tailored front end reports for identified groups of patients or for each outcome type (currently in development). Examples of RIO Screen shots (test patient) to demonstrate recording method Month 1
How weight is recorded on electronic ONSAS
Recording of urine and fatigue

53
Week 13 – on discharge
Collation of outcomes for the community dietetic team Front end reporting is being developed for some of the key outcomes likely to be of interest to commissioners. For example ‘improving hydration’. This outcome will be able to be selected from, for example 6 months’ worth of reviews, and the number of A, PA, & NA entries collated along with the summary of medical interventions considered avoided and then presented in bar chart format e.g.:
Based on local tariffs and prescribing costs the money saved by avoiding hospital admissions can be quantified.
010203040506070
No. outcomes recorded
Medical interventionavoided
Recording the outcomes & hospital avoidance
Recording the goals (aims)

54
CASE STUDY G (Leeds Community Healthcare NHS Trust) Male. 73 years of age. Recent diagnosis of palliative lung cancer. Current status Mr C lives at home with his wife, is having some hospice day care but prefers life at home, where his niece visits frequently. He and his family are very worried about the weight he has lost in recent weeks (>15% in last 2 months), and he has also noticed that he is having trouble swallowing some textures, which is also worrying him. His appetite is ‘touch and go’, he reports. He’d like to feel comfortable eating out with his work mates too. Initial advice and recommendations Goals x Mitigate against weight loss x Food and hydration for quality of life Actions x Discussed means of optimising intake through food choice and food fortification (Food-First advice), collaborative
effort to find some specific practical ways of implementing this x Looked at options for eating out with friends – smaller portions, choosing softer textures, letting them know ahead
of time that his appetite is poor x Discussed whether patient would like to be assessed by SLT – referral made x Discussed and agreed realistic aims and expectations (as well as limitations) for treatment x TOMs are assessed and documented Week 4 Review Current status Mr C and his family have made changes to Mr C’s diet to optimise nutrient intake. Having some specific aims has helped Mrs C focus on how she can care for her husband, and his niece has made some of his favourite cakes without feeling worried that she is giving him ‘unhealthy’ food. He has eaten out with friends twice and feels this could continue. Mr C has lost a small amount of weight, and although he is still worried about this, he has recognised that his rate of weight loss is slowing. He is still waiting to be assessed for his swallow, and this is an area of worry. His appetite is poor and he sometimes feels guilty that his niece is making cakes he doesn’t always feel able to eat. The majority of the conversation focuses on how Mr C would like to move forward, and any other changes he feels able to make. There is also a conversation about whether nutritional supplements would be beneficial. Actions x Mr C would like to be a bit more involved in food choices. Mrs C to investigate a motorised trolley so that Mr C
can go shopping with her and choose some foods he likes x Trial some oral nutritional supplements (ONS) and see if Mr C can tolerate these x TOMs are assessed and documented Week 8 Phone Review Review Mr C is feeling increasingly unwell, does not want to be visited in person, and does not want to be weighed. He enjoyed the supermarket visit but found it very exhausting – so instead is choosing foods he ‘fancies’ on an online shop. He no longer has the energy to leave the house to socialise. His swallow has been assessed and some texture recommendations have been made to make his swallow safer Actions x Agreed that at this point Mr C and his family are much more reassured and confident in understanding the role
that food can play in keeping his as well as possible x Mr C feels that ongoing input from the dietitian may be more detrimental than beneficial, and that monitoring his
weight is likely to pressurise him Recording outcomes via TOMs Impairment: TOM scored as 0.5 at initial, remains at this level on review and again at discharge Activity: Scored 3.5 initially, increased to 4 when some straightforward changes implemented at 4 weeks, down to 3 again by 8 weeks Participation: TOM 2 at assessment, rose to 3 after 4 week review, in decline at 3 after 8 weeks Wellbeing: Originally assessed at 2.5, rose to 3.5 at 4 weeks at maintained at 8 weeks Family/Carer Wellbeing: Assessed at 3, rose to 4.5 at 4 weeks, dipped to 4 by 8 weeks

55
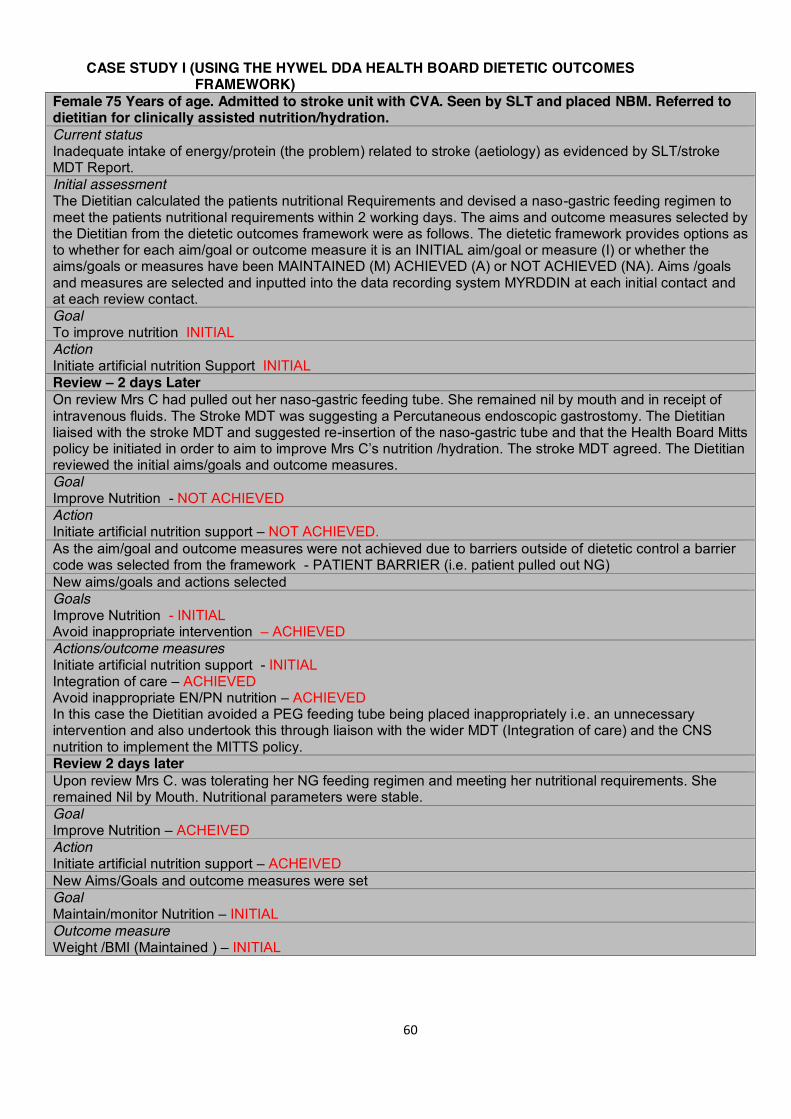
CASE STUDY H – HOME PARENTERAL NUTRITION TRANSITION TO ORAL NUTRITION Female, 66 years old, admitted for home parenteral nutrition (HPN) assessment. Current status Ischaemic bowel with 70cm of small bowel to stoma. 20cm of terminal ileum to whole colon not in continuity. PMH Portal vein thrombosis, liver cirrhosis. Initial assessment Weight 64kg with oedema, estimated dry weight 58Kg (usual wt), BMI 21.8kg/m2, %weight loss 0%, MAC, TST and MAMC all <5th centile, Handgrip >85% normal. Raised LFTs, stoma output 600-1330ml/day, poor appetite and c/o nausea therefore difficulty taking oral rehydration solution (ORS). Goals x Reverse fluid overload and oedema and maintain nutritional status x Provide suitable dietary advice for high output stoma x Minimise deterioration in LFTs by preventing overfeeding x Prevent deterioration in quality of life due to PN Actions x Provide low volume low sodium PN x Provide written information of dietary advice for high output stoma x Feed to BMR x Give 1 night off PN Review 1 after 1 week on PN Assessment Weight 60kg as oedema resolving, no adverse effect of 1 night off PN and patient reported improved sleep, no evidence of dehydration, patient following appropriate IF diet, stoma output 1.3L/d, able to take more ORS Actions x Continue on low volume, low sodium PN x Continue to encourage ORS and suitable Intestinal failure (IF) diet x Monitor LFTs x Give another night off PN x Assess micronutrient status Review 2 after 2 weeks on PN Assessment Weight 58kg with no oedema, no adverse effects of 2 nights off PN and patient reported improved sleep, no evidence of dehydration, patient following appropriate IF diet, stoma output 1.5L/d, Selenium, and Vitamin A deplete Actions x Continue on low volume low sodium PN x Continue to encourage ORS and suitable IF diet x Monitor LFTs x Monitor nutritional status x Give IM Vitamin A x Provide double selenium in PN Review 3 after 5 weeks on PN Assessment Weight 57kg with no oedema, stable on 5 nights a week PN, no dehydration, MAMC reduced by 1cm, handgrip stable, selenium increasing, AP reducing other LFTs stable, patient following appropriate IF diet, stoma 1.7L/d, good urine output 1.6L/d, Actions x Continue on low volume low sodium PN x Continue to encourage ORS and suitable IF diet x Monitor LFTs x Monitor nutritional status Review 4 First outpatient review after 9 weeks on HPN Assessment Weight 53kg, BMI 20kg/m2, no dehydration but weight loss thought to be due to increased activity at home, reduction in MAMC, handgrip maintained, patient following appropriate IF diet but unable to increase, stoma output 1.5L/d but leaking++, sleeping well on nights off therefore not keen to increase frequency of HPN.
56
Actions x Continue on low volume low sodium PN 5 nights a week x Increase nitrogen, glucose & add lipid twice a week to HPN x Monitor LFT x Monitor nutritional status Review 5 Received email from local dietitian, patient post-operative 70cm of small bowel to terminal ileum and whole colon in continuity Assessment Weight 52kg. She is now eating, not full meals yet but improving. She is also taking ONS od with full fat milk as well as drinking glasses of milk. Her bowels are loose but not diarrhoea. Provided with suitable IF dietary advice Actions x Continue on low volume low sodium PN 5 nights a week x Decrease nitrogen, glucose & reduce lipid to once a week x Monitor LFT x Monitor weight x Assess bowel function x Arrange HPN follow up Review 6 Received call from patient 1 month post discharge from local hospital Assessment Weight now 53kg. Good urine output and not dehydrated. BO x 1-2/day and eating suitable IF diet. Improved sleep on nights off HPN. Advised to keep in contact re weight as may be able to reduce HPN further. Actions x Reduce low volume low sodium PN to 3 nights a week and stop lipid x Monitor weight x Assess bowel function x Asses oral intake x Monitor hydration Review 7 Received call from patient 2 months post discharge from local hospital Assessment Weight 54kg, BMI 20.4kg/m2, good urine output and not dehydrated. BO x 1-2/day and eating suitable IF diet. Improved sleep on nights off HPN. Advised may be able to stop HPN at next outpatient review in 4 weeks Actions x Reduce low volume low sodium PN to 2 nights a week x Monitor weight x Assess bowel function x Asses oral intake x Monitor hydration Review 8 Outpatient appointment Assessment Weight 55.6kg, BMI 20.7kg/m2, good urine output and not dehydrated. BO x 2/day and eating suitable IF diet. Sleeping through the night when off HPN. Actions x Reinforce suitable IF diet x Stop HPN and remove central venous catheter Outcome tool options x Transition from artificial nutrition support to oral diet outcome tool. x Fatigue/energy scale Comments Dietetic intervention supported this patient when she was unable to meet needs orally and then ensured a smooth transition from HPN to oral diet to ensure nutritional needs were met, whilst ensuring the goal of maintenance in nutritional status without oedema, prevention of deterioration in LFTs and improvements in quality of life was achieved.

57
Reporting
Demonstrates the facilitation of a return to full oral diet from HPN
Demonstrates the improvement in energy levels due to reduction in HPN infusions which facilitated an improved sleep pattern
1
2
3
4
Initial Review 1Review 2Review 3Review 4Review 5Review 6Review 7Review 8
Transition from PN to HPN to oral diet 1 = PN alone
2= PN and oral diet 3 = PN and ONS and oral diet
4 = Oral diet
123456789
10
Initial Review1
Review2
Review3
Review4
Review5
Review6
Review7
Review8
1=extremely tired and no energy at all 10=full of energy and not tired at all

58
Miscellaneous

59
HYWEL DA UNIVERSITY HEALTH BOARD Patient progression and nutrition intake is measured by the dietitian and inputted on to the Patient Administration System (Myrddin).
Measures Use BDA Model and Care Process (Assessment, Nutritional Diagnosis, Set Aims/Goals – agree corresponding clinical outcomes framework aims/goals and outcome measures and set plan). Input diagnosis code and initial intervention on Myrddin (initial aims/goals and outcome measures). Record outcome on Myrddin. Data collection and analysis Myrddin data is translated to ‘real time’ reporting via Information Reporting Intelligence System (IRIS).
60
CASE STUDY I (USING THE HYWEL DDA HEALTH BOARD DIETETIC OUTCOMES FRAMEWORK)
Female 75 Years of age. Admitted to stroke unit with CVA. Seen by SLT and placed NBM. Referred to dietitian for clinically assisted nutrition/hydration. Current status Inadequate intake of energy/protein (the problem) related to stroke (aetiology) as evidenced by SLT/stroke MDT Report. Initial assessment The Dietitian calculated the patients nutritional Requirements and devised a naso-gastric feeding regimen to meet the patients nutritional requirements within 2 working days. The aims and outcome measures selected by the Dietitian from the dietetic outcomes framework were as follows. The dietetic framework provides options as to whether for each aim/goal or outcome measure it is an INITIAL aim/goal or measure (I) or whether the aims/goals or measures have been MAINTAINED (M) ACHIEVED (A) or NOT ACHIEVED (NA). Aims /goals and measures are selected and inputted into the data recording system MYRDDIN at each initial contact and at each review contact. Goal To improve nutrition INITIAL Action Initiate artificial nutrition Support INITIAL Review – 2 days Later On review Mrs C had pulled out her naso-gastric feeding tube. She remained nil by mouth and in receipt of intravenous fluids. The Stroke MDT was suggesting a Percutaneous endoscopic gastrostomy. The Dietitian liaised with the stroke MDT and suggested re-insertion of the naso-gastric tube and that the Health Board Mitts policy be initiated in order to aim to improve Mrs C’s nutrition /hydration. The stroke MDT agreed. The Dietitian reviewed the initial aims/goals and outcome measures. Goal Improve Nutrition - NOT ACHIEVED Action Initiate artificial nutrition support – NOT ACHIEVED. As the aim/goal and outcome measures were not achieved due to barriers outside of dietetic control a barrier code was selected from the framework - PATIENT BARRIER (i.e. patient pulled out NG) New aims/goals and actions selected Goals Improve Nutrition - INITIAL Avoid inappropriate intervention – ACHIEVED Actions/outcome measures Initiate artificial nutrition support - INITIAL Integration of care – ACHIEVED Avoid inappropriate EN/PN nutrition – ACHIEVED In this case the Dietitian avoided a PEG feeding tube being placed inappropriately i.e. an unnecessary intervention and also undertook this through liaison with the wider MDT (Integration of care) and the CNS nutrition to implement the MITTS policy. Review 2 days later Upon review Mrs C. was tolerating her NG feeding regimen and meeting her nutritional requirements. She remained Nil by Mouth. Nutritional parameters were stable. Goal Improve Nutrition – ACHEIVED Action Initiate artificial nutrition support – ACHEIVED New Aims/Goals and outcome measures were set Goal Maintain/monitor Nutrition – INITIAL Outcome measure Weight /BMI (Maintained ) – INITIAL

61
Example of Outcomes Data entry on Myrddin
The Data is reported through a system called IRIS which reports on treatment outcomes at a clinician level in ‘Real Time’. The example below illustrates how the data inputted into Myrddin is aggregated to provide a summary of the treatment outcomes achieved. Further charts capture individual aims/goals and the corresponding outcome measures that add validity to the aims/goals being achieved.

62

63
BIRMINGHAM COMMUNITY NHS TRUST HOME ENTERAL FEEDING (HEF) RECORDING FORM

64
ONS in-patients outcomes collection audit: (April to June 2014)
1. 118 forms were completed. 50 with only one score and 68 with two scores. 2. In total, 50 out of 118 had barriers completed (42%) 3. The average % change in score was 45% 4. For each section the change in numerical score was looked at and whether it increased,
decreased or remained the same following dietetic intervention. Section No. where score
increased No. where score decreased
No. where score stayed the same
Food intake 36 (53%)
11 (16%)
21 (31%)
ONS 10 (15%)
4 (6%)
51 (79%)
Knowledge 25 (37%)
1 (1%)
42 (62%)
Weight 27 (40%)
4 (6%)
36 (54%)
5. The barriers to outcomes where patients were seen at least twice were:
Barrier Number Barrier Number Pain Nausea and vomiting Diarrhoea NBM Dislikes ONS Restricted diet Cognitive impairment Incomplete food record charts Incomplete fluid charts Catering issues Lack of assistance to eat meals
6 12 2 10 12 3 6 9 1 2 0
Other: Palliation Infection Bereavement Swallowing problems Dr cancelled ONS Smell of food Anxiety and hallucinations No barriers
7 1 1 1 1 1 1 2
6. Conclusions:
x The average % change in score has increased from 30% to 45% x Food intake increased x ONS intake stayed the same x Knowledge stayed the same x Weight stayed the same x Most common barriers were Nausea and vomiting and dislike of ONS.

65
DATA ANALYSIS: LIQUID DIET FOR CROHN’S DISEASE
Patient’s Name ………………………………. DOB ……………
Domains Initial Contact Date :
Review Date:
Review Date:
Discharge Date:
Score Score Score Score Oral nutritional supplements 1 Takes none of prescribed ONS 2 Takes 1% - 25% of prescribed ONS 3 Takes 26% - 50% of prescribed ONS 4 Takes 51% - 75% of prescribed ONS 5 Takes 76% - 100% of prescribed ONS
Symptoms 1 No improvement in GI symptoms 2 Some improvements in GI symptoms 3 No GI symptoms
Bloods 1 Bloods have deteriorated 2 Bloods are stable 3 Bloods have improved
Weight 1 Has recently lost weight/is still losing weight 2 Weight is stable/has maintained weight
Total Scores Dietitian’s Signature Difference between initial and final scores Difference as a percentage of initial score (Difference/initial x 100)
Clinical Manager Codes: D0 = no improvement (or got worse) D1 = 1 - 20% improvement D2 = 21 - 40% improvement) D3 = 41 - 60% improvement D4 = 61 - 80% improvement D5 = 81 - 100% improvement
PLEASE RECORD ANY BARRIERS TO OUTCOMES
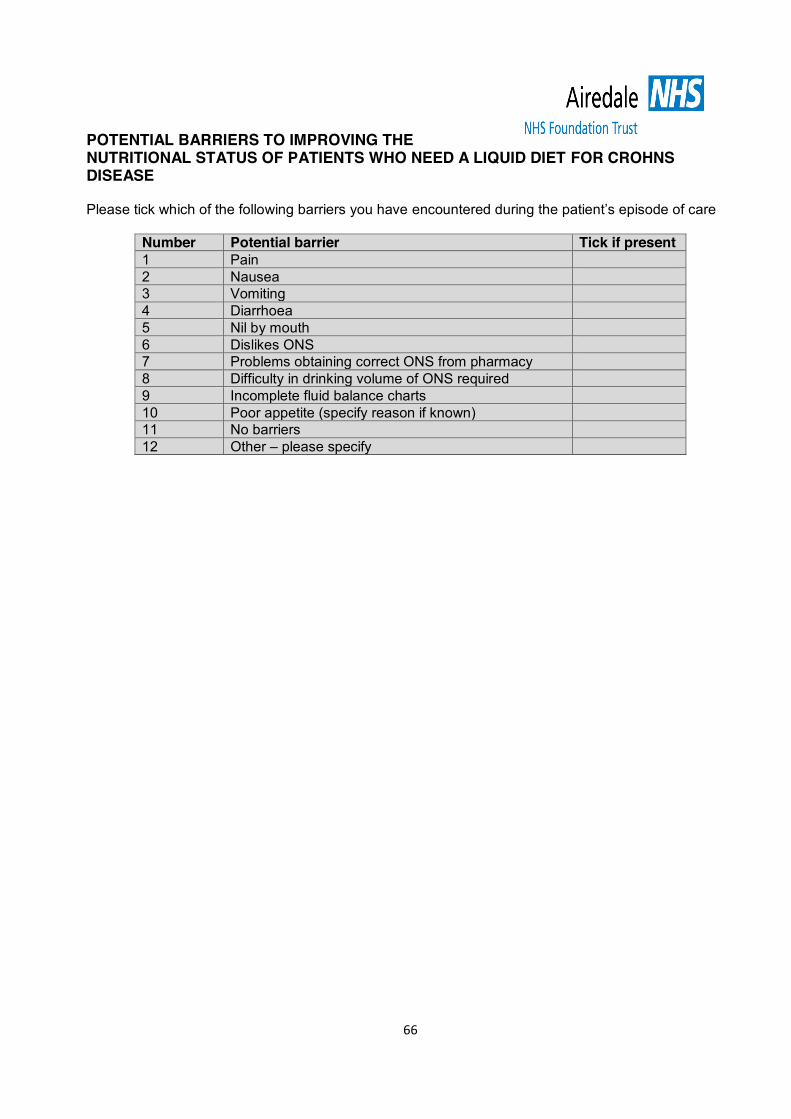
66
POTENTIAL BARRIERS TO IMPROVING THE NUTRITIONAL STATUS OF PATIENTS WHO NEED A LIQUID DIET FOR CROHNS DISEASE Please tick which of the following barriers you have encountered during the patient’s episode of care
Number Potential barrier Tick if present 1 Pain 2 Nausea 3 Vomiting 4 Diarrhoea 5 Nil by mouth 6 Dislikes ONS 7 Problems obtaining correct ONS from pharmacy 8 Difficulty in drinking volume of ONS required 9 Incomplete fluid balance charts 10 Poor appetite (specify reason if known) 11 No barriers 12 Other – please specify

67
Dietetics Outcome Measure
Inpatients – Enteral Tube Feeding
Patient’s Name ………………………………. DOB …………… Domains Initial Contact
Date : Review Date:
Review Date:
Discharge Date:
Score Score Score Score Feed/Oral intake 1 No feed/oral intake 2 Feed/oral intake meets 1% - 25% of requirements 3 Feed/oral intake meets 26% - 50% of requirements 4 Feed/oral intake meets 51% - 75% of requirements 5 Feed/oral intake meets 76% - 100% of requirements
Fluid 1 Fluid requirements not met (under or over requirement) 2 Fluid requirements are met
Symptoms 1 Feed stopped due to feed related GI symptoms 2 Some GI symptoms 3 Feed well tolerated – no symptoms
Blood biochemistry (not refeeding bloods) 1 Relevant blood biochemistry is not being monitored 2 Relevant blood biochemistry is being monitored
Refeeding blood biochemistry 1 Refeeding blood biochemistry is abnormal 2 Refeeding blood biochemistry is abnormal but is being corrected 3 Refeeding blood biochemistry abnormalities have been corrected 4 Refeeding syndrome is not evident
Weight (document if unable to weigh) 1 Has recently lost weight/is still losing weight 2 Weight is stable/has maintained weight
Total Scores Dietitian’s Signature Difference between initial and final scores Difference as a percentage of initial score (Difference/initial x 100)
Clinical Manager Codes: D0 = no improvement (or got worse) D1 = 1 - 20% improvement D2 = 21 - 40% improvement) D3 = 41 - 60% improvement D4 = 61 - 80% improvement D5 = 81 - 100% improvement
PLEASE RECORD ANY BARRIERS TO OUTCOMES (SEE OVERLEAF)
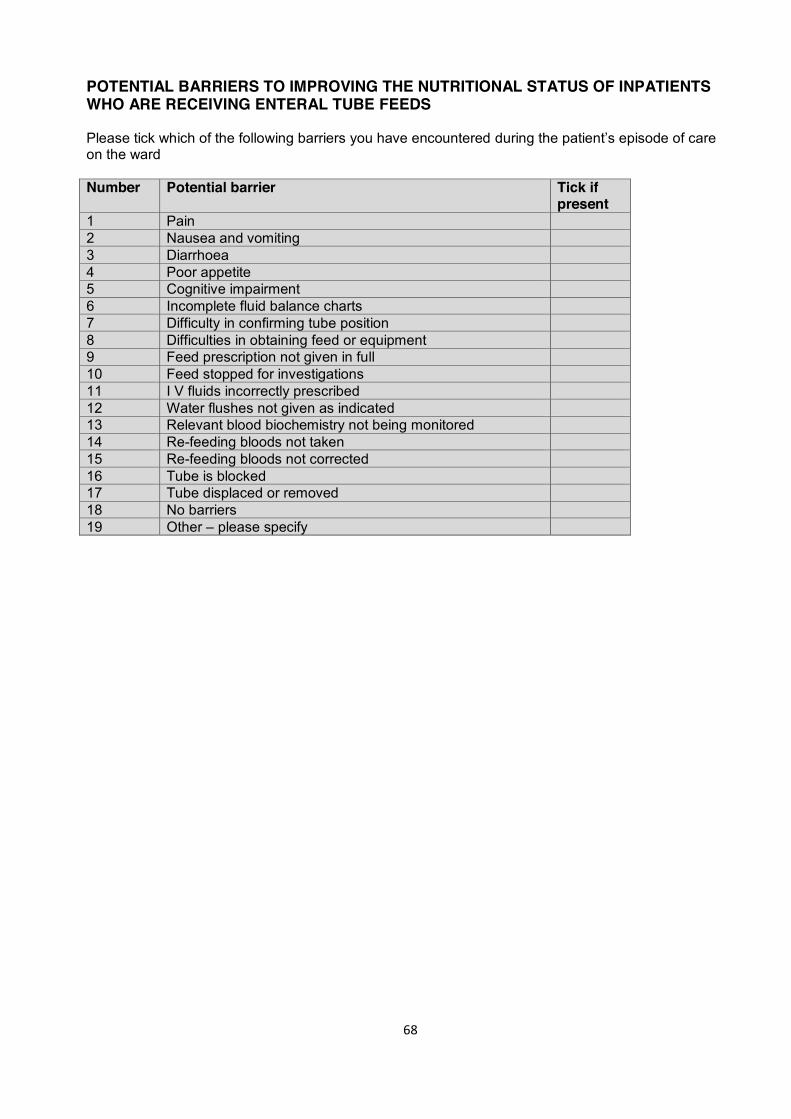
68
POTENTIAL BARRIERS TO IMPROVING THE NUTRITIONAL STATUS OF INPATIENTS WHO ARE RECEIVING ENTERAL TUBE FEEDS Please tick which of the following barriers you have encountered during the patient’s episode of care on the ward Number Potential barrier Tick if
present 1 Pain 2 Nausea and vomiting 3 Diarrhoea 4 Poor appetite 5 Cognitive impairment 6 Incomplete fluid balance charts 7 Difficulty in confirming tube position 8 Difficulties in obtaining feed or equipment 9 Feed prescription not given in full 10 Feed stopped for investigations 11 I V fluids incorrectly prescribed 12 Water flushes not given as indicated 13 Relevant blood biochemistry not being monitored 14 Re-feeding bloods not taken 15 Re-feeding bloods not corrected 16 Tube is blocked 17 Tube displaced or removed 18 No barriers 19 Other – please specify

69
References
x Baxter JP, Fayers PM, McKinlay AW. The clinical and psychometric validation of a questionnaire to assess the quality of life of adult patients treated with long-term parenteral nutrition. J Parenter Enteral Nutr 2010;34:131–142.
x British Dietetic Association. Model for Dietetic Outcomes. 2011 x BDA and BSNA. The value of nutritional care in helping the NHS to deliver on the NHS Outcomes
Framework - An assessment of how delivering high quality nutritional care can enhance the quality of life for people with long-term conditions. 2013. https://www.bsna.co.uk/documents/Value%20of%20Nutritional%20Care%20report.pdf
x Collins A. Measuring what really matters. Towards a coherent measurement system to support person-centred care The Health Foundation. 2014. http://www.health.org.uk/publication/measuring-what-really-matters-towards-coherent-measurement-system-support-person-centred (accessed 17th February 2016)
x Commissioning Support Programme. Speech and Language Therapy Evaluating Outcomes. 2011. https://www.thecommunicationtrust.org.uk/media/12886/slcn_tools_evaluating-outcomes_1_.pdf (accessed 17th February 2016)
x De Silva D. Helping measure person-centred care. A review of evidence about commonly used approaches and tools used to help measure person-centred care. The Health Foundation 2014. http://www.health.org.uk/publication/helping-measure-person-centred-care(accessed 17th February 2016)
x Devlin NJ and Appleby J. Getting the most out of proms - Putting health outcomes at the heart of NHS decision-making. The King’s Fund. 2010. http://www.kingsfund.org.uk/sites/files/kf/Getting-the-most-out-of-PROMs-Nancy-Devlin-John-Appleby-Kings-Fund-March-2010.pdf
x Enderby P and Johns A Johns (eds). Therapy Outcome Measures for Rehabilitation Professionals. 3rd edition. 2015.
x NHS – Five Year Forward View. October 2014. www.england.nhs.uk/wp-content/uploads/2014/10/5yfv-web.pdf
x NHS Outcomes Framework 2015/2016. https://www.gov.uk/government/publications/nhs-outcomes-framework-2015-to-2016
x The King’s Fund. How to measure for improving outcomes: a guide for commissioners. 2012 http://www.kingsfund.org.uk/topics/commissioning/how-measure-improving-outcomes-guide-commissioners (accessed 15 February 2016)
x Woodcock T. 12 tips for measuring improvements. 2014. http://www.health.org.uk/blog/twelve-tips-measuring-improvement
Further Reading
x Department of Health. Liberating the NHS: Transparency in outcomes a framework for the NHS. A consultation on proposals. 2010 http://webarchive.nationalarchives.gov.uk/20130107105354/http://www.dh.gov.uk/prod_consum_dh/groups/dh_digitalassets/@dh/@en/documents/digitalasset/dh_117591.pdf
x British Dietetic Association. Model and Process for Nutrition and Dietetic Practice. July 2012. https://www.bda.uk.com/professional/practice/process and https://www.bda.uk.com/professional/practice/process_workshops and https://www.bda.uk.com/professional/practice/terminology
x NICE. Patient Experience in Adult NHS services: Improving the experience of care for people using Adult NHS services. 2012. NICE Clinical Guideline 138.
x NICE Quality Standard for patient Experience in Adult NHS services. 2012 NICE Quality Standard 15.
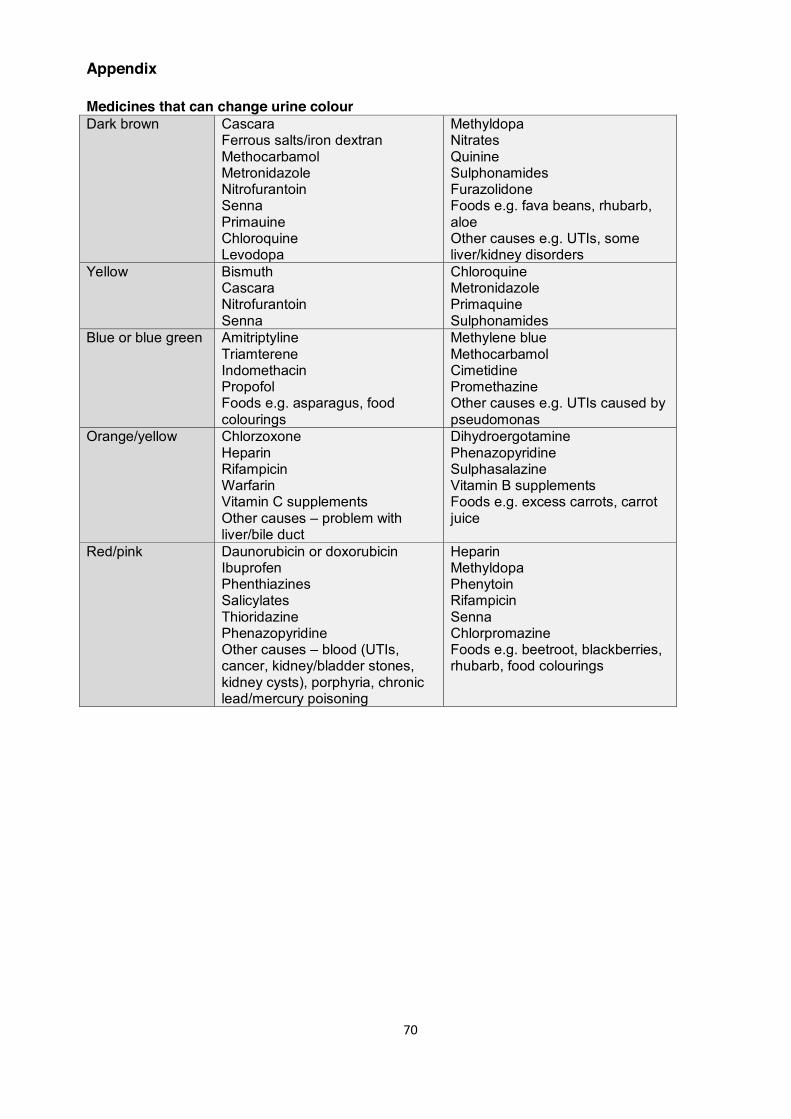
70
Appendix Medicines that can change urine colour Dark brown Cascara
Ferrous salts/iron dextran Methocarbamol Metronidazole Nitrofurantoin Senna Primauine Chloroquine Levodopa
Methyldopa Nitrates Quinine Sulphonamides Furazolidone Foods e.g. fava beans, rhubarb, aloe Other causes e.g. UTIs, some liver/kidney disorders
Yellow
Bismuth Cascara Nitrofurantoin Senna
Chloroquine Metronidazole Primaquine Sulphonamides
Blue or blue green Amitriptyline Triamterene Indomethacin Propofol Foods e.g. asparagus, food colourings
Methylene blue Methocarbamol Cimetidine Promethazine Other causes e.g. UTIs caused by pseudomonas
Orange/yellow Chlorzoxone Heparin Rifampicin Warfarin Vitamin C supplements Other causes – problem with liver/bile duct
Dihydroergotamine Phenazopyridine Sulphasalazine Vitamin B supplements Foods e.g. excess carrots, carrot juice
Red/pink Daunorubicin or doxorubicin Ibuprofen Phenthiazines Salicylates Thioridazine Phenazopyridine Other causes – blood (UTIs, cancer, kidney/bladder stones, kidney cysts), porphyria, chronic lead/mercury poisoning
Heparin Methyldopa Phenytoin Rifampicin Senna Chlorpromazine Foods e.g. beetroot, blackberries, rhubarb, food colourings
71
TOOL UNDER DEVELOPMENT
Transition from Artificial Nutrition Support to Oral Diet Tool The aim of this tool is to chart the progress of patients on artificial nutrition support who are able to transition to meeting part, or all of their nutritional requirements via the oral route. This tool is currently being developed and tested.