Embed Size (px)
Citation preview
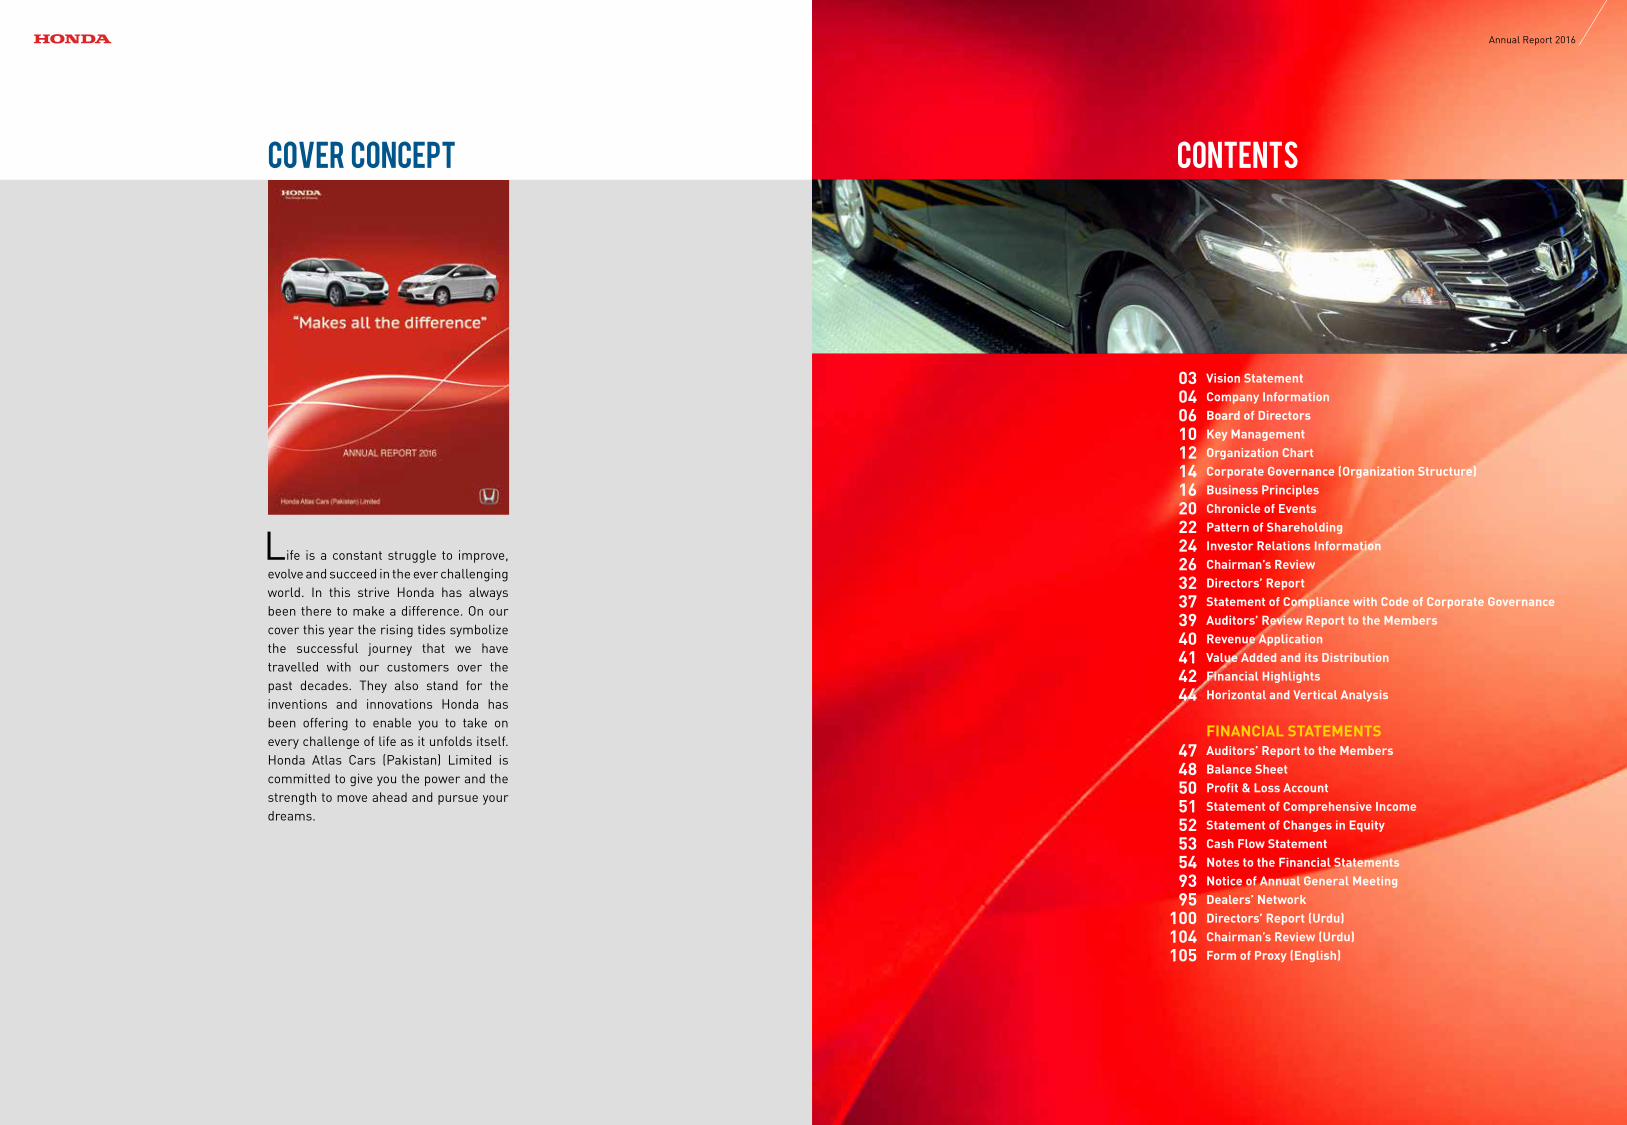
Vision StatementCompany InformationBoard of DirectorsKey ManagementOrganization ChartCorporate Governance (Organization Structure)Business PrinciplesChronicle of EventsPattern of ShareholdingInvestor Relations InformationChairman’s ReviewDirectors’ ReportStatement of Compliance with Code of Corporate GovernanceAuditors’ Review Report to the MembersRevenue ApplicationValue Added and its DistributionFinancial HighlightsHorizontal and Vertical Analysis
FINANCIAL STATEMENTSAuditors’ Report to the MembersBalance SheetProfit & Loss AccountStatement of Comprehensive IncomeStatement of Changes in EquityCash Flow Statement Notes to the Financial StatementsNotice of Annual General MeetingDealers’ NetworkDirectors’ Report (Urdu)Chairman’s Review (Urdu)Form of Proxy (English)
Contents
030406101214162022242632373940414244
474850515253549395
100104105
Life is a constant struggle to improve, evolve and succeed in the ever challenging world. In this strive Honda has always been there to make a difference. On our cover this year the rising tides symbolize the successful journey that we have travelled with our customers over the past decades. They also stand for the inventions and innovations Honda has been offering to enable you to take on every challenge of life as it unfolds itself. Honda Atlas Cars (Pakistan) Limited is committed to give you the power and the strength to move ahead and pursue your dreams.
Cover Concept
Annual Report 2016
11 22 33 55 44 Management /Company’s Structure
Management /Company’s Structure
Auditors’ Report & Accounts
Auditors’ Report & Accounts Review ReportsReview Reports Financial HighlightsFinancial Highlights Notice of MeetingNotice of Meeting
Vision StatementSTRIVING TO BE A COMPANY THAT SOCIETY WANTS TO EXIST BY SHARING JOYS WITH PEOPLE THROUGHOUT THE WORLD.
CREATING PRODUCTS THAT MAXIMIZE THE JOY OF CUSTOMERS, WITH SPEED, AFFORDABILITY AND LOW CO2.
2
3Annual Report 2016
Company I nformation
BOARD OF DIRECTORSMr. Yusuf H. ShiraziChairmanMr. Toichi IshiyamaPresident/CEOMr. Aamir H. ShiraziMr. Kenichi MatsuoMr. Kazuhisa HirotaMr. M. Naeem KhanMr. Nadeem Arshad ElahiMr. Shigeru YamazakiMr. Yasutaka Uda
COMPANY SECRETARYMr. Maqsood-ur-Rehman Rehmani
CHIEF FINANCIAL OFFICERMr. Ahmad Umair Wajid
EXECUTIVE COMMITTEEMr. Toichi IshiyamaMr. Kenichi MatsuoMr. Maqsood-ur-Rehman Rehmani
REGISTERED OFFICE1-Mcleod Road, Lahore, Pakistan.Tel: +92 42 37225015-17Fax: +92 42 37233518
SHARE REGISTRARM/s Hameed Majeed AssociatesHM House, 7-Bank Square,Lahore, Pakistan. Tel: +92 42 37235081-82
FACTORY43 Km, Multan Road,Manga Mandi, Lahore, Pakistan.Tel: +92 42 35384671-80Fax: +92 42 35384691-92E-mail: [email protected]
AUDIT COMMITTEEMr. Aamir H. ShiraziChairmanMr. Kazuhisa HirotaMr. M. Naeem KhanMr. Nadeem Arshad ElahiMr. Yasutaka UdaMr. Hamood-ur-RahmanSecretary
HUMAN RESOURCE AND REMUNERATION COMMITTEEMr. Aamir H. ShiraziChairmanMr. Toichi IshiyamaMr. Kenichi MatsuoMr. Kazuhisa HirotaMr. M. Naeem Khan
HEAD OF INTERNAL AUDITMr. Hamood-ur-Rahman
REGIONAL OFFICES Lahore1-XX, Phase III, DHA.Tel: +92 42 35694851-3 35694809, 35693992 Fax: +92 42 35694854
KarachiHouse No. 16, Block ‘C’,KDA Housing Scheme,Karsaz Road.Tel: +92 21 34305411-3 Fax: +92 21 34305414
AUDITORSM/s A. F. Ferguson & CompanyChartered Accountants
LEGAL ADVISORCornelius, Lane & MuftiBokhari Aziz & Karim
BANKERSCitibank N.A.Deutsche Bank AGFaysal Bank LimitedHabib Bank LimitedMCB Bank LimitedNational Bank of PakistanSoneri Bank LimitedStandard Chartered Bank (Pakistan) LimitedThe Bank of Tokyo-Mitsubishi UFJ, LimitedUnited Bank Limited
WEB SITEwww.honda.com.pk www.facebook.com/hacpl
11 22 33 55 44 Management /Company’s Structure
Management /Company’s Structure
Auditors’ Report & Accounts
Auditors’ Report & Accounts Review ReportsReview Reports Financial HighlightsFinancial Highlights Notice of MeetingNotice of Meeting
4
5Annual Report 2016
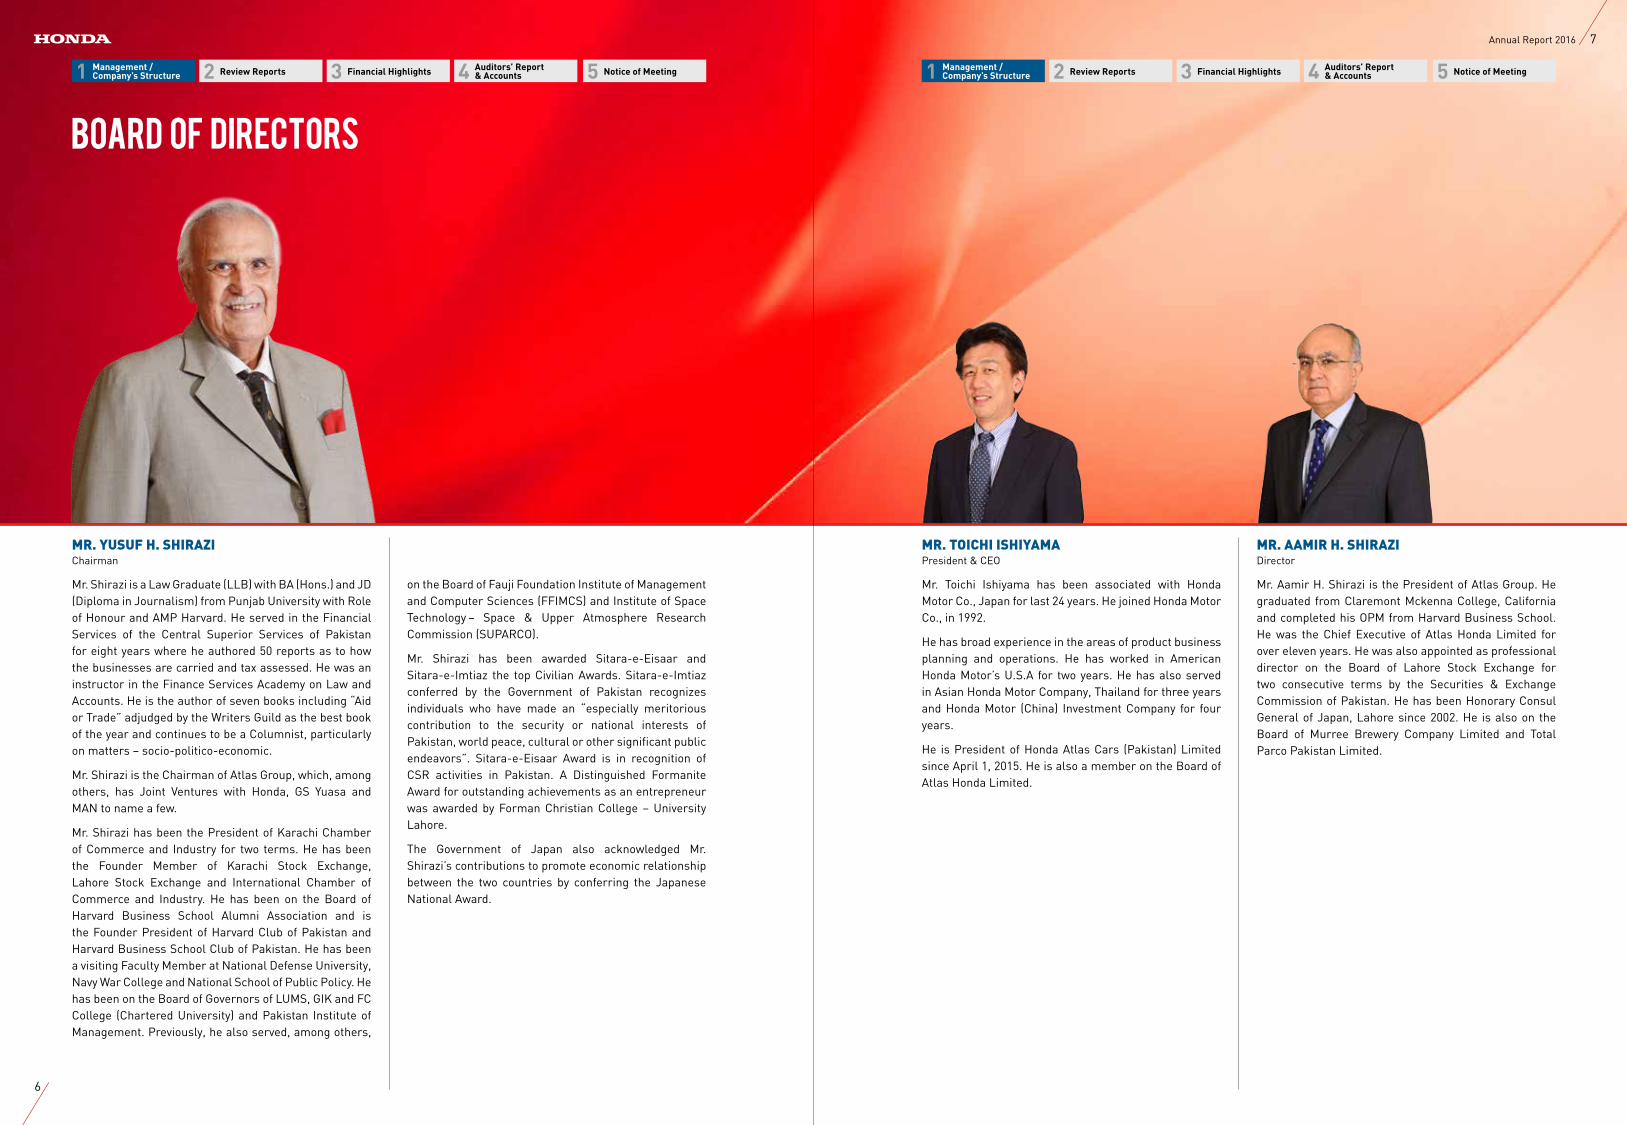
MR. YUSUF H. SHIRAZIChairman
Mr. Shirazi is a Law Graduate (LLB) with BA (Hons.) and JD (Diploma in Journalism) from Punjab University with Role of Honour and AMP Harvard. He served in the Financial Services of the Central Superior Services of Pakistan for eight years where he authored 50 reports as to how the businesses are carried and tax assessed. He was an instructor in the Finance Services Academy on Law and Accounts. He is the author of seven books including “Aid or Trade” adjudged by the Writers Guild as the best book of the year and continues to be a Columnist, particularly on matters – socio-politico-economic.
Mr. Shirazi is the Chairman of Atlas Group, which, among others, has Joint Ventures with Honda, GS Yuasa and MAN to name a few.
Mr. Shirazi has been the President of Karachi Chamber of Commerce and Industry for two terms. He has been the Founder Member of Karachi Stock Exchange, Lahore Stock Exchange and International Chamber of Commerce and Industry. He has been on the Board of Harvard Business School Alumni Association and is the Founder President of Harvard Club of Pakistan and Harvard Business School Club of Pakistan. He has been a visiting Faculty Member at National Defense University, Navy War College and National School of Public Policy. He has been on the Board of Governors of LUMS, GIK and FC College (Chartered University) and Pakistan Institute of Management. Previously, he also served, among others,
Board of Directors
11 22 33 55 44 Management /Company’s Structure
Management /Company’s Structure
Auditors’ Report & Accounts
Auditors’ Report & Accounts Review ReportsReview Reports Financial HighlightsFinancial Highlights Notice of MeetingNotice of Meeting
on the Board of Fauji Foundation Institute of Management and Computer Sciences (FFIMCS) and Institute of Space Technology – Space & Upper Atmosphere Research Commission (SUPARCO).
Mr. Shirazi has been awarded Sitara-e-Eisaar and Sitara-e-Imtiaz the top Civilian Awards. Sitara-e-Imtiaz conferred by the Government of Pakistan recognizes individuals who have made an “especially meritorious contribution to the security or national interests of Pakistan, world peace, cultural or other significant public endeavors”. Sitara-e-Eisaar Award is in recognition of CSR activities in Pakistan. A Distinguished Formanite Award for outstanding achievements as an entrepreneur was awarded by Forman Christian College – University Lahore.
The Government of Japan also acknowledged Mr. Shirazi’s contributions to promote economic relationship between the two countries by conferring the Japanese National Award.
MR. TOICHI ISHIYAMAPresident & CEO
Mr. Toichi Ishiyama has been associated with Honda Motor Co., Japan for last 24 years. He joined Honda Motor Co., in 1992.
He has broad experience in the areas of product business planning and operations. He has worked in American Honda Motor’s U.S.A for two years. He has also served in Asian Honda Motor Company, Thailand for three years and Honda Motor (China) Investment Company for four years.
He is President of Honda Atlas Cars (Pakistan) Limited since April 1, 2015. He is also a member on the Board of Atlas Honda Limited.
MR. AAMIR H. SHIRAZIDirector
Mr. Aamir H. Shirazi is the President of Atlas Group. He graduated from Claremont Mckenna College, California and completed his OPM from Harvard Business School. He was the Chief Executive of Atlas Honda Limited for over eleven years. He was also appointed as professional director on the Board of Lahore Stock Exchange for two consecutive terms by the Securities & Exchange Commission of Pakistan. He has been Honorary Consul General of Japan, Lahore since 2002. He is also on the Board of Murree Brewery Company Limited and Total Parco Pakistan Limited.
6
7Annual Report 2016
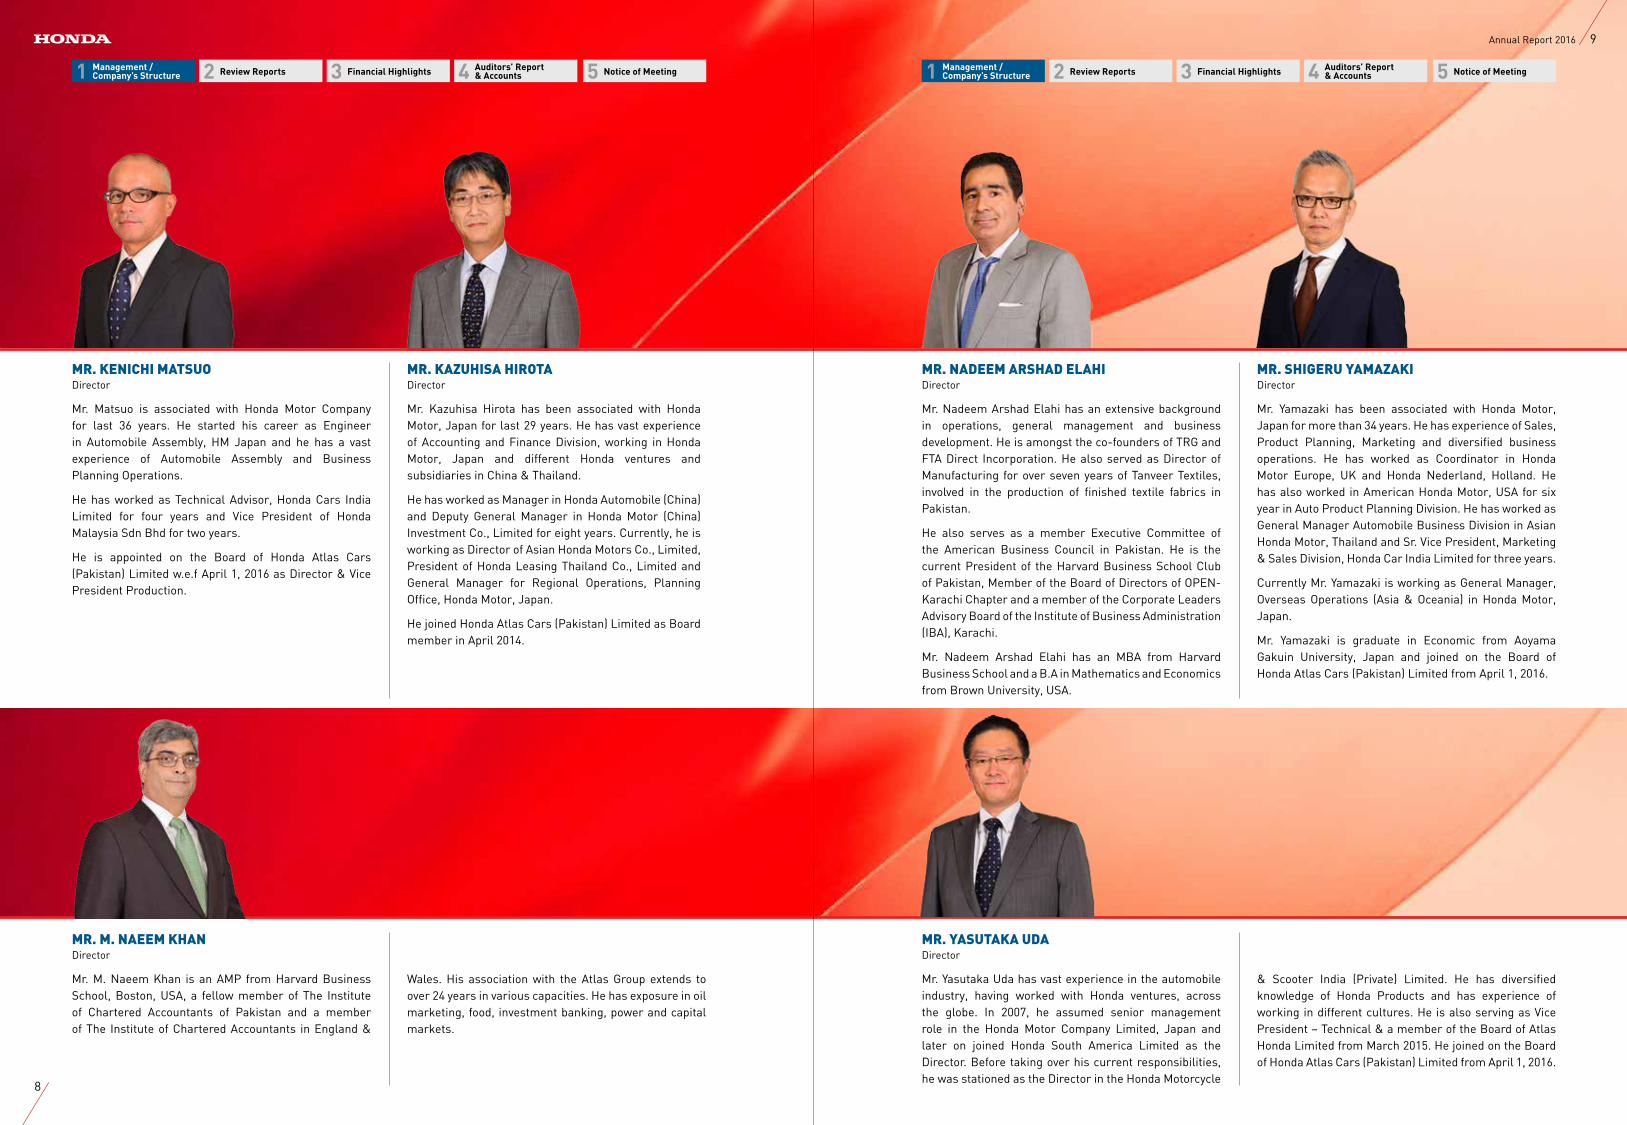
MR. YASUTAKA UDADirector
Mr. Yasutaka Uda has vast experience in the automobile industry, having worked with Honda ventures, across the globe. In 2007, he assumed senior management role in the Honda Motor Company Limited, Japan and later on joined Honda South America Limited as the Director. Before taking over his current responsibilities, he was stationed as the Director in the Honda Motorcycle
MR. SHIGERU YAMAZAKIDirector
Mr. Yamazaki has been associated with Honda Motor, Japan for more than 34 years. He has experience of Sales, Product Planning, Marketing and diversified business operations. He has worked as Coordinator in Honda Motor Europe, UK and Honda Nederland, Holland. He has also worked in American Honda Motor, USA for six year in Auto Product Planning Division. He has worked as General Manager Automobile Business Division in Asian Honda Motor, Thailand and Sr. Vice President, Marketing & Sales Division, Honda Car India Limited for three years.
Currently Mr. Yamazaki is working as General Manager, Overseas Operations (Asia & Oceania) in Honda Motor, Japan.
Mr. Yamazaki is graduate in Economic from Aoyama Gakuin University, Japan and joined on the Board of Honda Atlas Cars (Pakistan) Limited from April 1, 2016.
MR. NADEEM ARSHAD ELAHIDirector
Mr. Nadeem Arshad Elahi has an extensive background in operations, general management and business development. He is amongst the co-founders of TRG and FTA Direct Incorporation. He also served as Director of Manufacturing for over seven years of Tanveer Textiles, involved in the production of finished textile fabrics in Pakistan.
He also serves as a member Executive Committee of the American Business Council in Pakistan. He is the current President of the Harvard Business School Club of Pakistan, Member of the Board of Directors of OPEN-Karachi Chapter and a member of the Corporate Leaders Advisory Board of the Institute of Business Administration (IBA), Karachi.
Mr. Nadeem Arshad Elahi has an MBA from Harvard Business School and a B.A in Mathematics and Economics from Brown University, USA.
MR. M. NAEEM KHANDirector
Mr. M. Naeem Khan is an AMP from Harvard Business School, Boston, USA, a fellow member of The Institute of Chartered Accountants of Pakistan and a member of The Institute of Chartered Accountants in England &
11 22 33 55 44 Management /Company’s Structure
Management /Company’s Structure
Auditors’ Report & Accounts
Auditors’ Report & Accounts Review ReportsReview Reports Financial HighlightsFinancial Highlights Notice of MeetingNotice of Meeting
MR. KAZUHISA HIROTADirector
Mr. Kazuhisa Hirota has been associated with Honda Motor, Japan for last 29 years. He has vast experience of Accounting and Finance Division, working in Honda Motor, Japan and different Honda ventures and subsidiaries in China & Thailand.
He has worked as Manager in Honda Automobile (China) and Deputy General Manager in Honda Motor (China) Investment Co., Limited for eight years. Currently, he is working as Director of Asian Honda Motors Co., Limited, President of Honda Leasing Thailand Co., Limited and General Manager for Regional Operations, Planning Office, Honda Motor, Japan.
He joined Honda Atlas Cars (Pakistan) Limited as Board member in April 2014.
MR. KENICHI MATSUODirector
Mr. Matsuo is associated with Honda Motor Company for last 36 years. He started his career as Engineer in Automobile Assembly, HM Japan and he has a vast experience of Automobile Assembly and Business Planning Operations.
He has worked as Technical Advisor, Honda Cars India Limited for four years and Vice President of Honda Malaysia Sdn Bhd for two years.
He is appointed on the Board of Honda Atlas Cars (Pakistan) Limited w.e.f April 1, 2016 as Director & Vice President Production.
Wales. His association with the Atlas Group extends to over 24 years in various capacities. He has exposure in oil marketing, food, investment banking, power and capital markets.
& Scooter India (Private) Limited. He has diversified knowledge of Honda Products and has experience of working in different cultures. He is also serving as Vice President – Technical & a member of the Board of Atlas Honda Limited from March 2015. He joined on the Board of Honda Atlas Cars (Pakistan) Limited from April 1, 2016.
8
9Annual Report 2016
MR. AHMAD UMAIR WAJIDChief Financial Officer
Mr. Umair is an Associate Member of the Institute of Chartered Accountant of Pakistan and having more than 11 years post qualification experience. He has been involved in financial management, Budgeting, Strategic
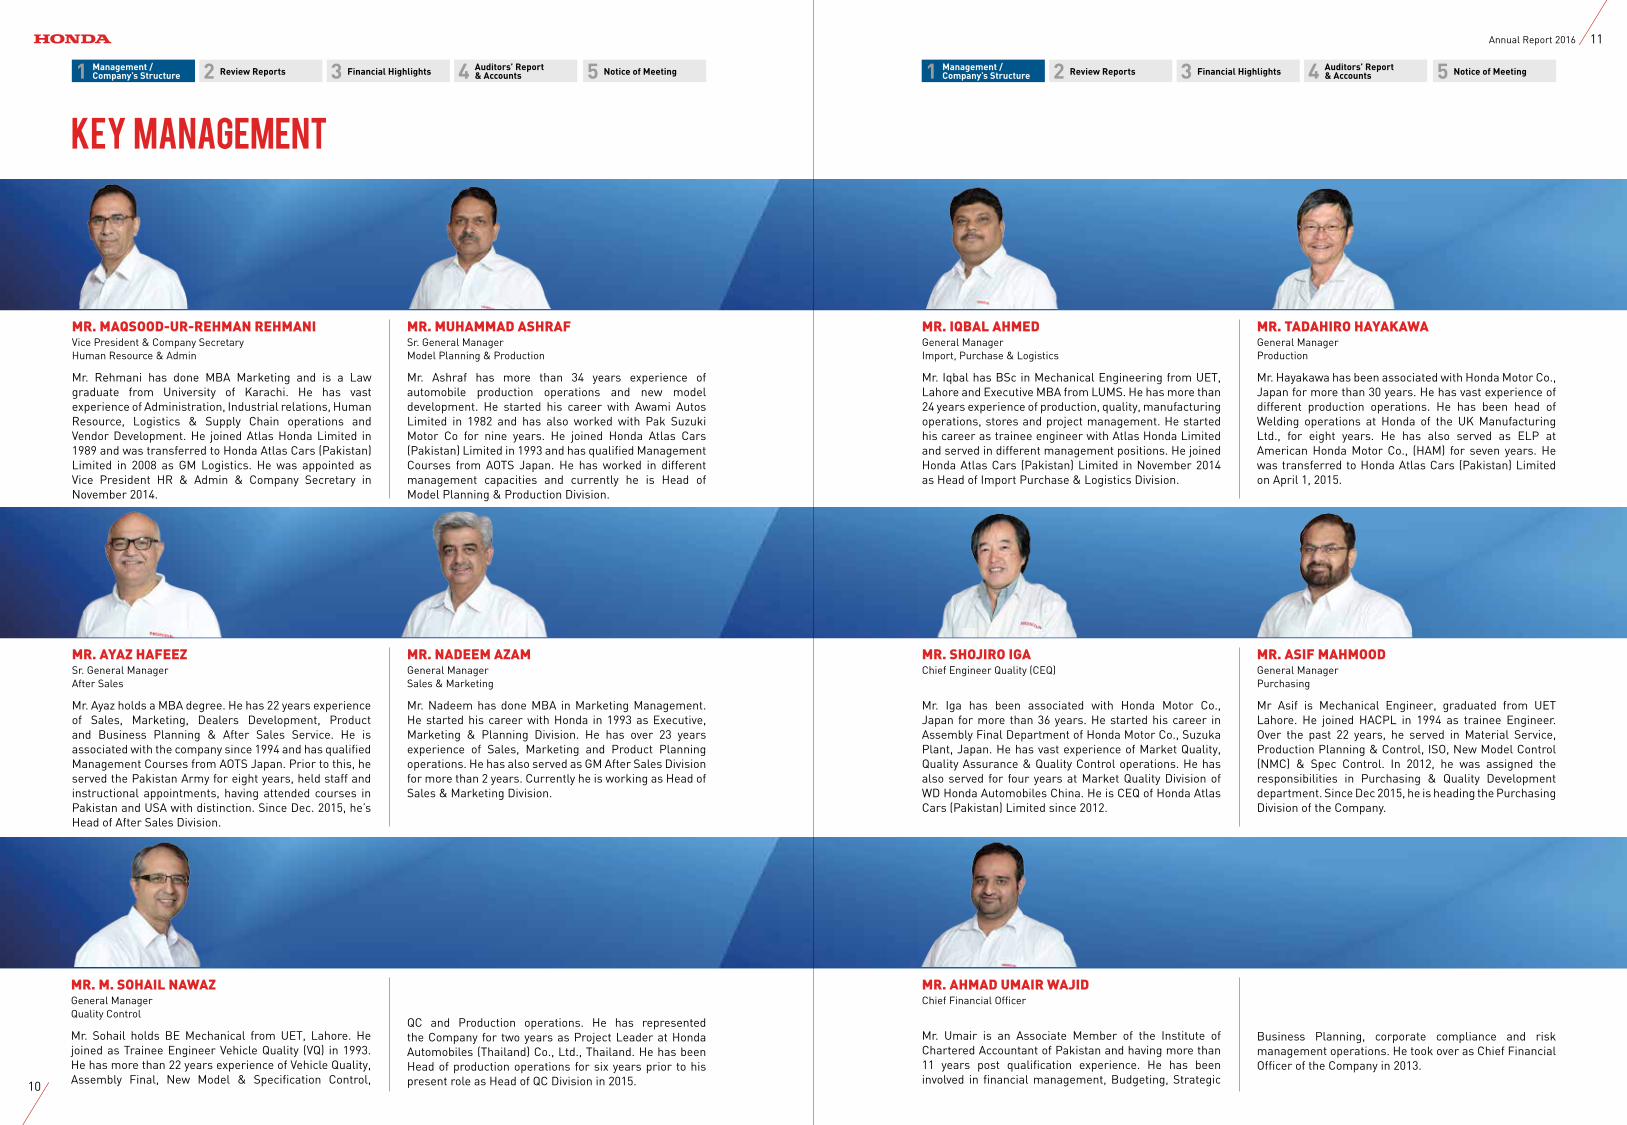
MR. MAQSOOD-UR-REHMAN REHMANIVice President & Company SecretaryHuman Resource & Admin
Mr. Rehmani has done MBA Marketing and is a Law graduate from University of Karachi. He has vast experience of Administration, Industrial relations, Human Resource, Logistics & Supply Chain operations and Vendor Development. He joined Atlas Honda Limited in 1989 and was transferred to Honda Atlas Cars (Pakistan) Limited in 2008 as GM Logistics. He was appointed as Vice President HR & Admin & Company Secretary in November 2014.
MR. NADEEM AZAMGeneral ManagerSales & Marketing
Mr. Nadeem has done MBA in Marketing Management. He started his career with Honda in 1993 as Executive, Marketing & Planning Division. He has over 23 years experience of Sales, Marketing and Product Planning operations. He has also served as GM After Sales Division for more than 2 years. Currently he is working as Head of Sales & Marketing Division.
MR. TADAHIRO HAYAKAWAGeneral ManagerProduction
Mr. Hayakawa has been associated with Honda Motor Co., Japan for more than 30 years. He has vast experience of different production operations. He has been head of Welding operations at Honda of the UK Manufacturing Ltd., for eight years. He has also served as ELP at American Honda Motor Co., (HAM) for seven years. He was transferred to Honda Atlas Cars (Pakistan) Limited on April 1, 2015.
MR. MUHAMMAD ASHRAF Sr. General ManagerModel Planning & Production
Mr. Ashraf has more than 34 years experience of automobile production operations and new model development. He started his career with Awami Autos Limited in 1982 and has also worked with Pak Suzuki Motor Co for nine years. He joined Honda Atlas Cars (Pakistan) Limited in 1993 and has qualified Management Courses from AOTS Japan. He has worked in different management capacities and currently he is Head of Model Planning & Production Division.
MR. M. SOHAIL NAWAZGeneral Manager Quality Control
Mr. Sohail holds BE Mechanical from UET, Lahore. He joined as Trainee Engineer Vehicle Quality (VQ) in 1993. He has more than 22 years experience of Vehicle Quality, Assembly Final, New Model & Specification Control,
MR. SHOJIRO IGAChief Engineer Quality (CEQ)
Mr. Iga has been associated with Honda Motor Co., Japan for more than 36 years. He started his career in Assembly Final Department of Honda Motor Co., Suzuka Plant, Japan. He has vast experience of Market Quality, Quality Assurance & Quality Control operations. He has also served for four years at Market Quality Division of WD Honda Automobiles China. He is CEQ of Honda Atlas Cars (Pakistan) Limited since 2012.
MR. ASIF MAHMOODGeneral ManagerPurchasing
Mr Asif is Mechanical Engineer, graduated from UET Lahore. He joined HACPL in 1994 as trainee Engineer. Over the past 22 years, he served in Material Service, Production Planning & Control, ISO, New Model Control (NMC) & Spec Control. In 2012, he was assigned the responsibilities in Purchasing & Quality Development department. Since Dec 2015, he is heading the Purchasing Division of the Company.
MR. AYAZ HAFEEZSr. General Manager After Sales
Mr. Ayaz holds a MBA degree. He has 22 years experience of Sales, Marketing, Dealers Development, Product and Business Planning & After Sales Service. He is associated with the company since 1994 and has qualified Management Courses from AOTS Japan. Prior to this, he served the Pakistan Army for eight years, held staff and instructional appointments, having attended courses in Pakistan and USA with distinction. Since Dec. 2015, he’s Head of After Sales Division.
MR. IQBAL AHMEDGeneral Manager Import, Purchase & Logistics
Mr. Iqbal has BSc in Mechanical Engineering from UET, Lahore and Executive MBA from LUMS. He has more than 24 years experience of production, quality, manufacturing operations, stores and project management. He started his career as trainee engineer with Atlas Honda Limited and served in different management positions. He joined Honda Atlas Cars (Pakistan) Limited in November 2014 as Head of Import Purchase & Logistics Division.
Key Management
11 22 33 55 44 Management /Company’s Structure
Management /Company’s Structure
Auditors’ Report & Accounts
Auditors’ Report & Accounts Review ReportsReview Reports Financial HighlightsFinancial Highlights Notice of MeetingNotice of Meeting
QC and Production operations. He has represented the Company for two years as Project Leader at Honda Automobiles (Thailand) Co., Ltd., Thailand. He has been Head of production operations for six years prior to his present role as Head of QC Division in 2015.
Business Planning, corporate compliance and risk management operations. He took over as Chief Financial Officer of the Company in 2013.
10
11Annual Report 2016
Organization Chart
11 22 33 55 44 Management /Company’s Structure
Management /Company’s Structure
Auditors’ Report & Accounts
Auditors’ Report & Accounts Review ReportsReview Reports Financial HighlightsFinancial Highlights Notice of MeetingNotice of Meeting
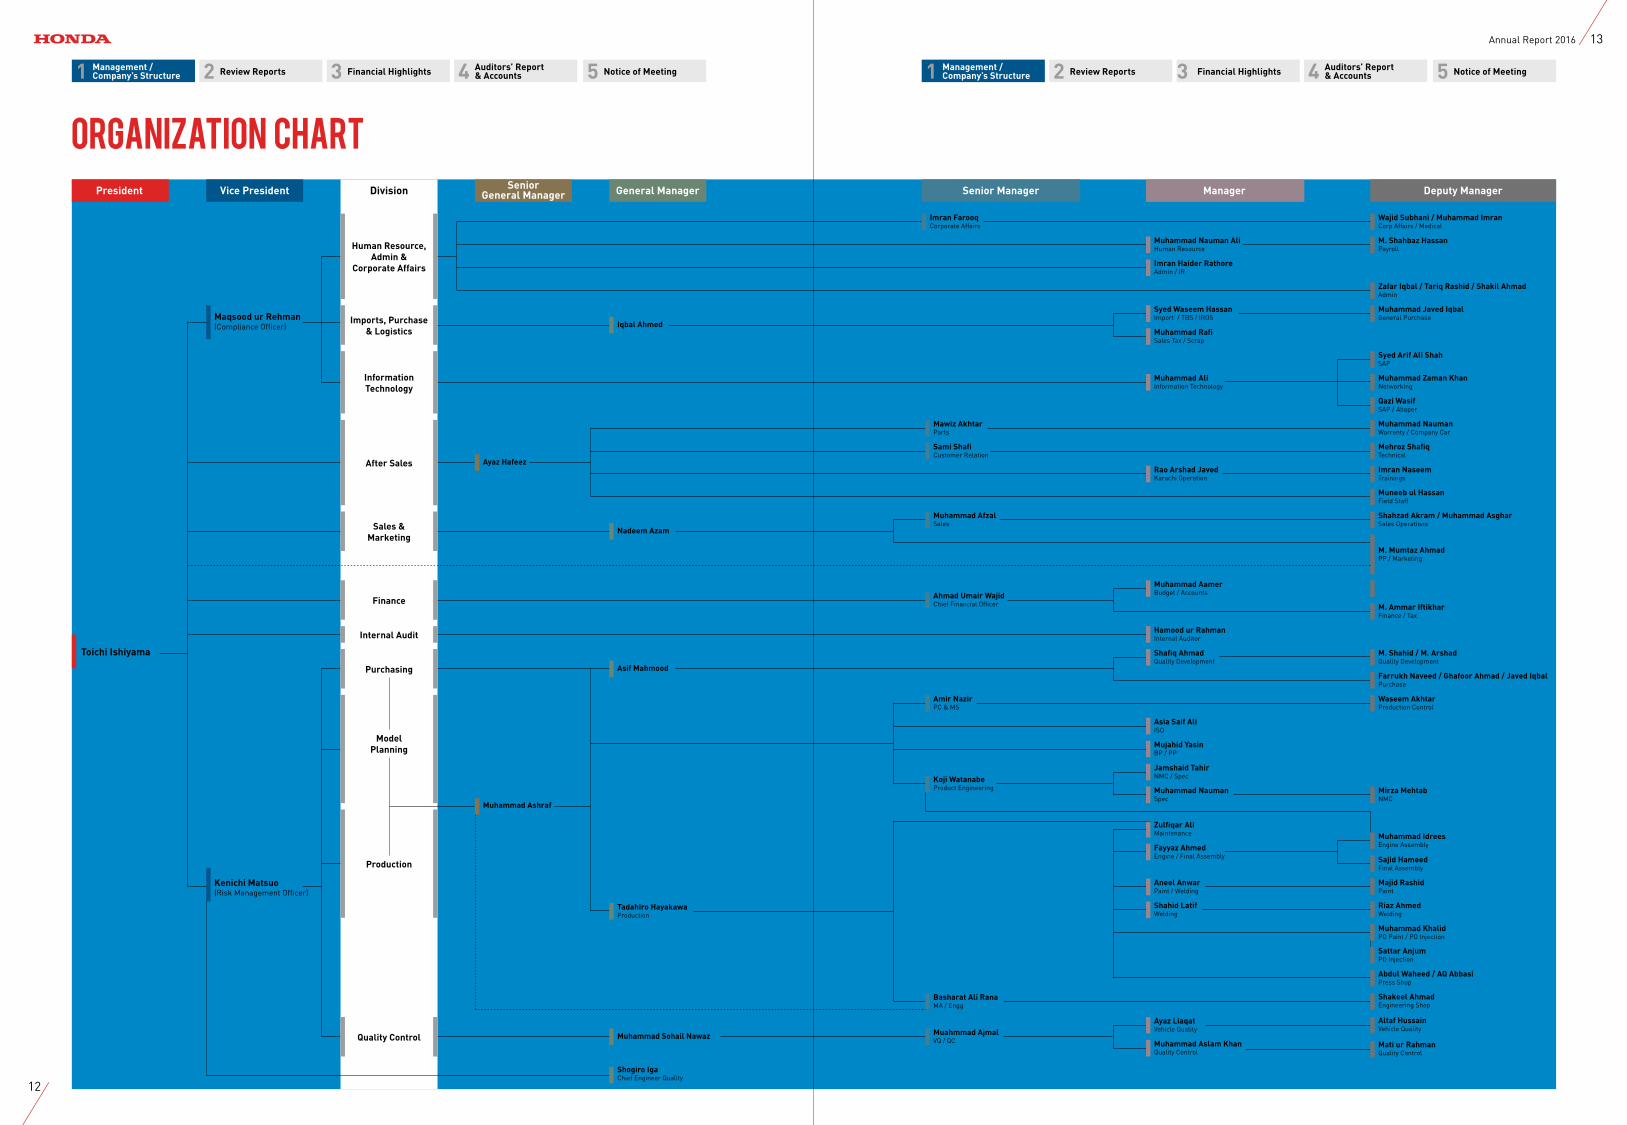
Wajid Subhani / Muhammad ImranCorp Affairs / Medical
Imran FarooqCorporate Affairs
Mawiz AkhtarParts
Sami ShafiCustomer Relation
Muhammad AfzalSales
Ahmad Umair WajidChief Financial Officer
Amir NazirPC & MS
Koji WatanabeProduct Engineering
Basharat Ali RanaMA / Engg
Muahmmad AjmalVQ / QC
M. Shahbaz HassanPayroll
Muhammad Nauman AliHuman Resource
Imran Haider RathoreAdmin / IR
Syed Waseem HassanImport / TBS / IROS
Iqbal Ahmed
Nadeem Azam
Asif Mahmood
Tadahiro HayakawaProduction
Shogiro IgaChief Engineer Quality
Muhammad Sohail Nawaz
Ayaz Hafeez
Muhammad Ashraf
Muhammad RafiSales Tax / Scrap
Muhammad AliInformation Technology
Rao Arshad JavedKarachi Operation
Muhammad AamerBudget / Accounts
Hamood ur RahmanInternal Auditor
Maqsood ur Rehman(Compliance Officer)
Human Resource, Admin &
Corporate Affairs
Imports, Purchase& Logistics
InformationTechnology
After Sales
Sales & Marketing
Finance
Quality Control
Purchasing
Model Planning
Production
Internal Audit
Kenichi Matsuo(Risk Management Officer)
Toichi Ishiyama Shafiq Ahmad Quality Development
Asia Saif AliISO
Mujahid YasinBP / PP
Jamshaid TahirNMC / Spec
Muhammad NaumanSpec
Zulfiqar AliMaintenance
Fayyaz AhmedEngine / Final Assembly
Aneel AnwarPaint / Welding
Shahid LatifWelding
Ayaz LiaqatVehicle Quality
Muhammad Aslam KhanQuality Control
Zafar Iqbal / Tariq Rashid / Shakil AhmadAdmin
Muhammad Javed IqbalGeneral Purchase
Syed Arif Ali ShahSAP
Muhammad Zaman KhanNetworking
Qazi WasifSAP / Abaper
Muhammad NaumanWarrenty / Company Car
Mehroz ShafiqTechnical
Imran NaseemTrainings
Muneeb ul HassanField Staff
Shahzad Akram / Muhammad AsgharSales Operations
M. Mumtaz AhmadPP / Marketing
M. Ammar IftikharFinance / Tax
M. Shahid / M. ArshadQuality Development
Farrukh Naveed / Ghafoor Ahmad / Javed IqbalPurchase
Waseem AkhtarProduction Control
Mirza MehtabNMC
Muhammad IdreesEngine Assembly
Sajid HameedFinal Assembly
Majid RashidPaint
Riaz AhmedWelding
Muhammad KhalidPO Paint / PO Injection
Sattar AnjumPO Injection
Abdul Waheed / AQ AbbasiPress Shop
Shakeel Ahmad Engineering Shop
Altaf HussainVehicle Quality
Mati ur RahmanQuality Control
Senior Manager Manager Deputy ManagerGeneral ManagerVice PresidentPresident Division SeniorGeneral Manager
12
13Annual Report 2016
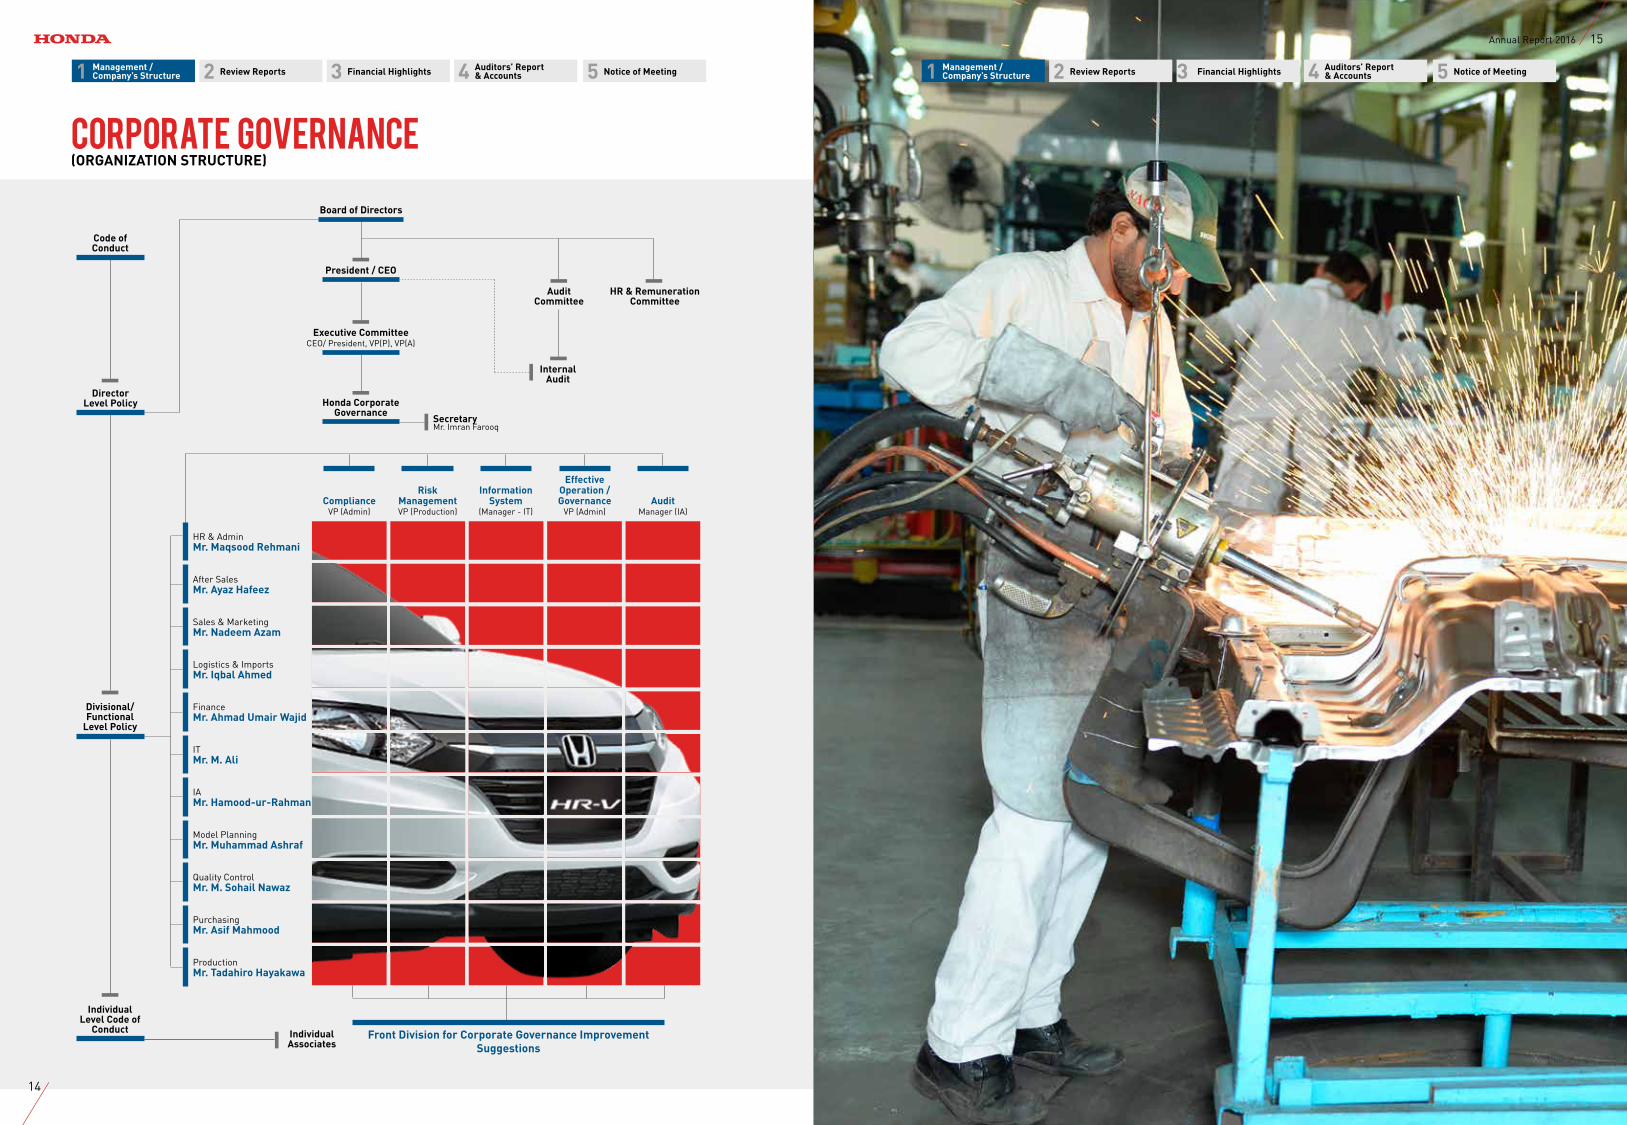
Corporate Governance(ORGANIZATION STRUCTURE)
11 22 33 55 44 Management /Company’s Structure
Management /Company’s Structure
Auditors’ Report & Accounts
Auditors’ Report & Accounts Review ReportsReview Reports Financial HighlightsFinancial Highlights Notice of MeetingNotice of Meeting
Sales & MarketingMr. Nadeem Azam
After SalesMr. Ayaz Hafeez
ITMr. M. Ali
Quality ControlMr. M. Sohail Nawaz
Front Division for Corporate Governance Improvement Suggestions
Logistics & ImportsMr. Iqbal Ahmed
IAMr. Hamood-ur-Rahman
PurchasingMr. Asif Mahmood
FinanceMr. Ahmad Umair Wajid
Model Planning Mr. Muhammad Ashraf
ProductionMr. Tadahiro Hayakawa
Board of Directors
HR & AdminMr. Maqsood Rehmani
President / CEO
AuditCommittee
Internal Audit
HR & RemunerationCommittee
Executive CommitteeCEO/ President, VP(P), VP(A)
SecretaryMr. Imran Farooq
Honda CorporateGovernance
Code ofConduct
DirectorLevel Policy
Divisional/Functional
Level Policy
IndividualLevel Code of
Conduct Individual Associates
ComplianceVP (Admin)
Risk ManagementVP (Production)
Information System
(Manager - IT)
EffectiveOperation /Governance
VP (Admin)Audit
Manager (IA)
14
15Annual Report 2016
CORPORATE PHILOSOPHYMaintaining a global viewpoint, we are dedicated to supplying products of the highest quality yet at a reasonable price for worldwide customers satisfaction.
MANAGEMENT POLICY1. Proceed always with ambition and youthfulness.
2. Respect sound theory, develop fresh ideas and make the most effective use of time.
3. Enjoy your work and encourage open communi-cations.
4. Strive constantly for a harmonious flow of work.
5. Be ever mindful of the value of research and endeavor.
CORPORATE PHILOSOPHY1. Dynamic manufacturing and marketing of prestigious
products to the entire satisfaction of customers.
2. Create ideal working environment for continuous development of products and personnel.
3. Provide adequate return to shareholders and fulfill corporate civic obligations.
MANAGEMENT POLICY1 Respect for all – man has priority over machine.
2. Man is the key in controlling i.e. machines, methods and materials.
3. Follow 3S spirit i.e. small, smart and speed.
4. Believe in 3A “Hands on Approach” i.e. be on Actual Spot, look at the Actual Spot and confront the Actual Situation.
5. Be a good corporate citizen; assume a responsible role in community.
PRIORITY STANDARDS OF CONDUCT1. Safety: There can be no production without safety.
2. Quality: To achieve complete customers satisfaction by focusing on smart teamwork, meeting all applicable legal and regulatory requirements & continually improving our strategies and goals.
3. Productivity: With safety and quality each of us will strive to excel the performance in all fields of our activities i.e Production, Model Planning, Quality Control, Purchasing, Sales & Marketing, After Sales, Finance, Import, Purchase & Logistics, IT, IA and Human Resources & Administration Division.
HUMAN RESOURCES AND SUCCESSION PLANHuman Resources Policy is to hire young, fresh, energetic and active associates to meet the existing and future workforce requirements and providing its associates maximum opportunities for internal mobility through personal training and development to enable them to take higher positions.
Human Resource Division has succession plan for each key job/area to make sure the continuity of operations in the relevant division and to fill the temporary/permanent vacancy.
QUALITY POLICYWe at Honda Atlas Cars (Pakistan) Limited, strive for supplying top quality Honda cars to get ultimate customers satisfaction accomplished by focusing on:
• Smart team work
• Meeting all applicable legal and regulatory require-ments
• Continually improving our strategies and goals
ENVIRONMENT POLICYHonda Atlas Cars (Pakistan) Limited, being a responsible member of society considers the preservation of the global environment as a crucial concern.
Our environmental philosophy is firmly based on the following principles:
1. Recognize the impacts of our activities, products and services on environment;
2. Formulate objectives and targets for pollution prevention, environmental impacts mitigation and resource conservation as far as technically feasible;
BUSINESS PRINCIPLES
11 22 33 55 44 Management /Company’s Structure
Management /Company’s Structure
Auditors’ Report & Accounts
Auditors’ Report & Accounts Review ReportsReview Reports Financial HighlightsFinancial Highlights Notice of MeetingNotice of Meeting
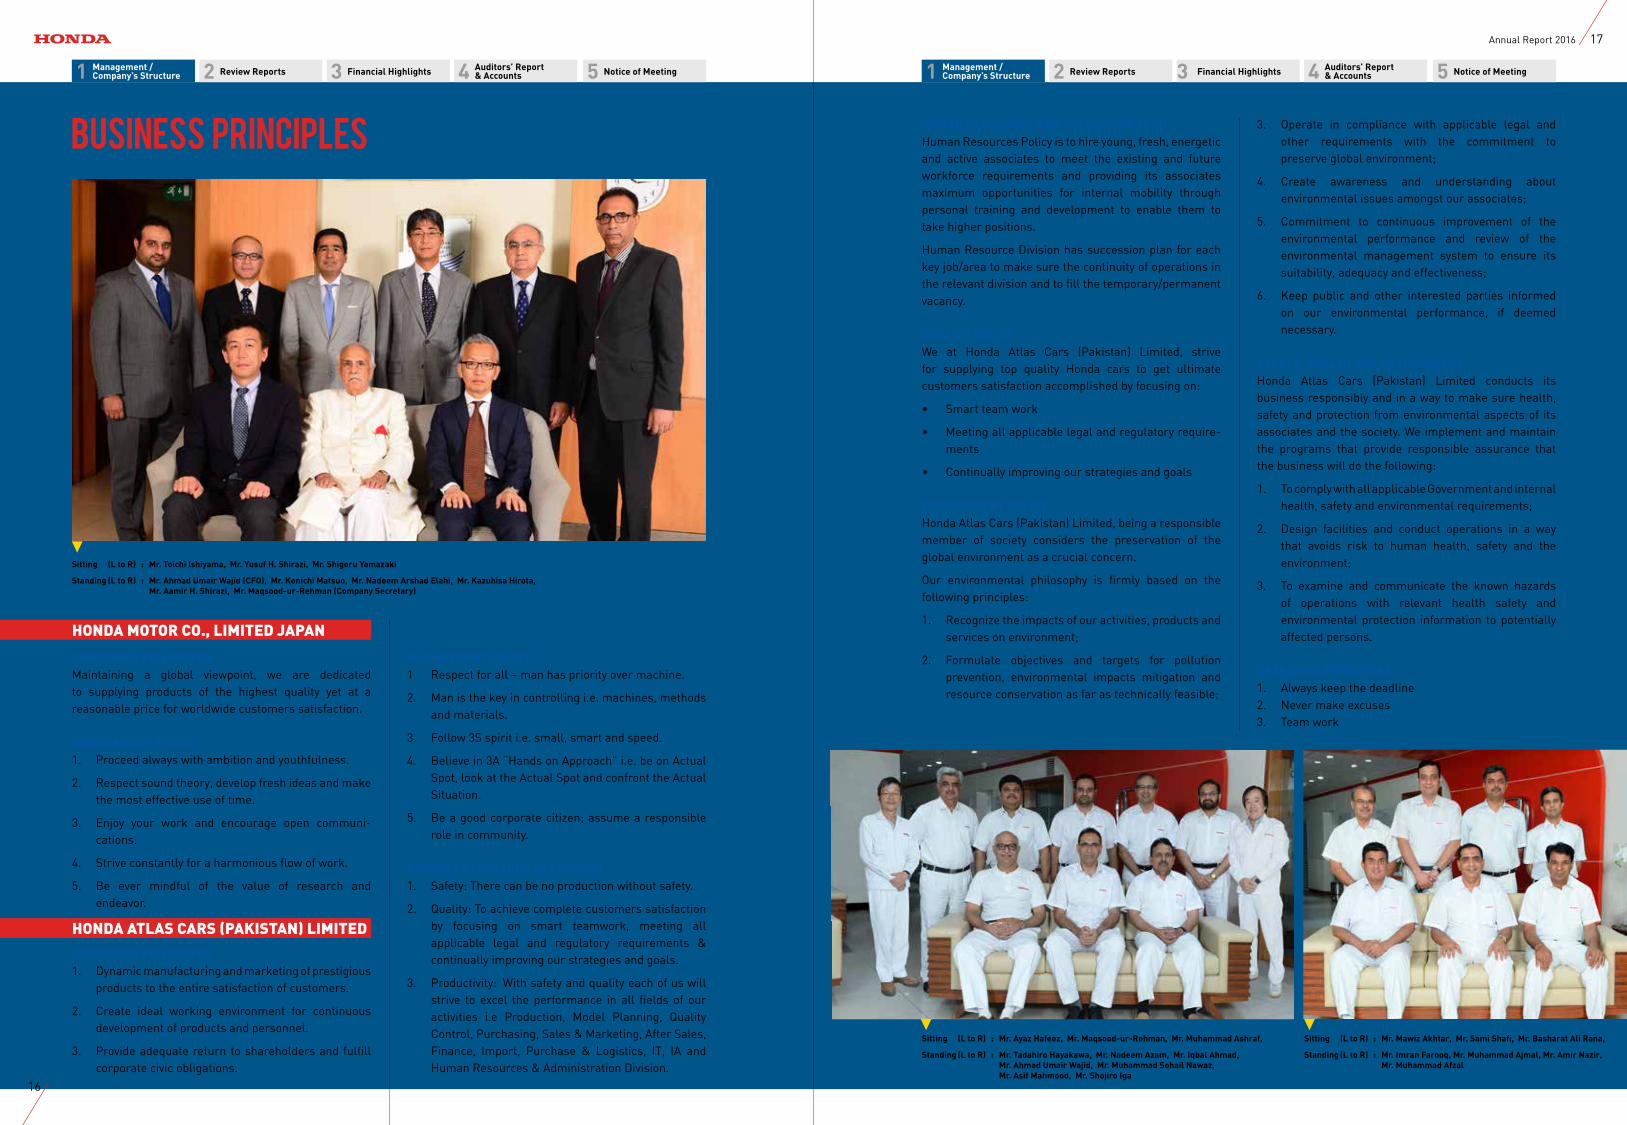
Sitting (L to R) : Mr. Toichi Ishiyama, Mr. Yusuf H. Shirazi, Mr. Shigeru Yamazaki
Standing (L to R) : Mr. Ahmad Umair Wajid (CFO), Mr. Kenichi Matsuo, Mr. Nadeem Arshad Elahi, Mr. Kazuhisa Hirota, Mr. Aamir H. Shirazi, Mr. Maqsood-ur-Rehman (Company Secretary)
Sitting (L to R) : Mr. Ayaz Hafeez, Mr. Maqsood-ur-Rehman, Mr. Muhammad Ashraf,
Standing (L to R) : Mr. Tadahiro Hayakawa, Mr. Nadeem Azam, Mr. Iqbal Ahmad, Mr. Ahmad Umair Wajid, Mr. Muhammad Sohail Nawaz, Mr. Asif Mahmood, Mr. Shojiro Iga
Sitting (L to R) : Mr. Mawiz Akhtar, Mr. Sami Shafi, Mr. Basharat Ali Rana,
Standing (L to R) : Mr. Imran Farooq, Mr. Muhammad Ajmal, Mr. Amir Nazir, Mr. Muhammad Afzal
HONDA MOTOR CO., LIMITED JAPAN
HONDA ATLAS CARS (PAKISTAN) LIMITED
3. Operate in compliance with applicable legal and other requirements with the commitment to preserve global environment;
4. Create awareness and understanding about environmental issues amongst our associates;
5. Commitment to continuous improvement of the environmental performance and review of the environmental management system to ensure its suitability, adequacy and effectiveness;
6. Keep public and other interested parties informed on our environmental performance, if deemed necessary.
SAFETY, HEALTH AND ENVIRONMENTHonda Atlas Cars (Pakistan) Limited conducts its business responsibly and in a way to make sure health, safety and protection from environmental aspects of its associates and the society. We implement and maintain the programs that provide responsible assurance that the business will do the following:
1. To comply with all applicable Government and internal health, safety and environmental requirements;
2. Design facilities and conduct operations in a way that avoids risk to human health, safety and the environment;
3. To examine and communicate the known hazards of operations with relevant health safety and environmental protection information to potentially affected persons.
OPERATING PRINCIPLES1. Always keep the deadline2. Never make excuses3. Team work
16
17Annual Report 2016
11 22 33 55 44 Management /Company’s Structure
Management /Company’s Structure
Auditors’ Report & Accounts
Auditors’ Report & Accounts Review ReportsReview Reports Financial HighlightsFinancial Highlights Notice of MeetingNotice of Meeting
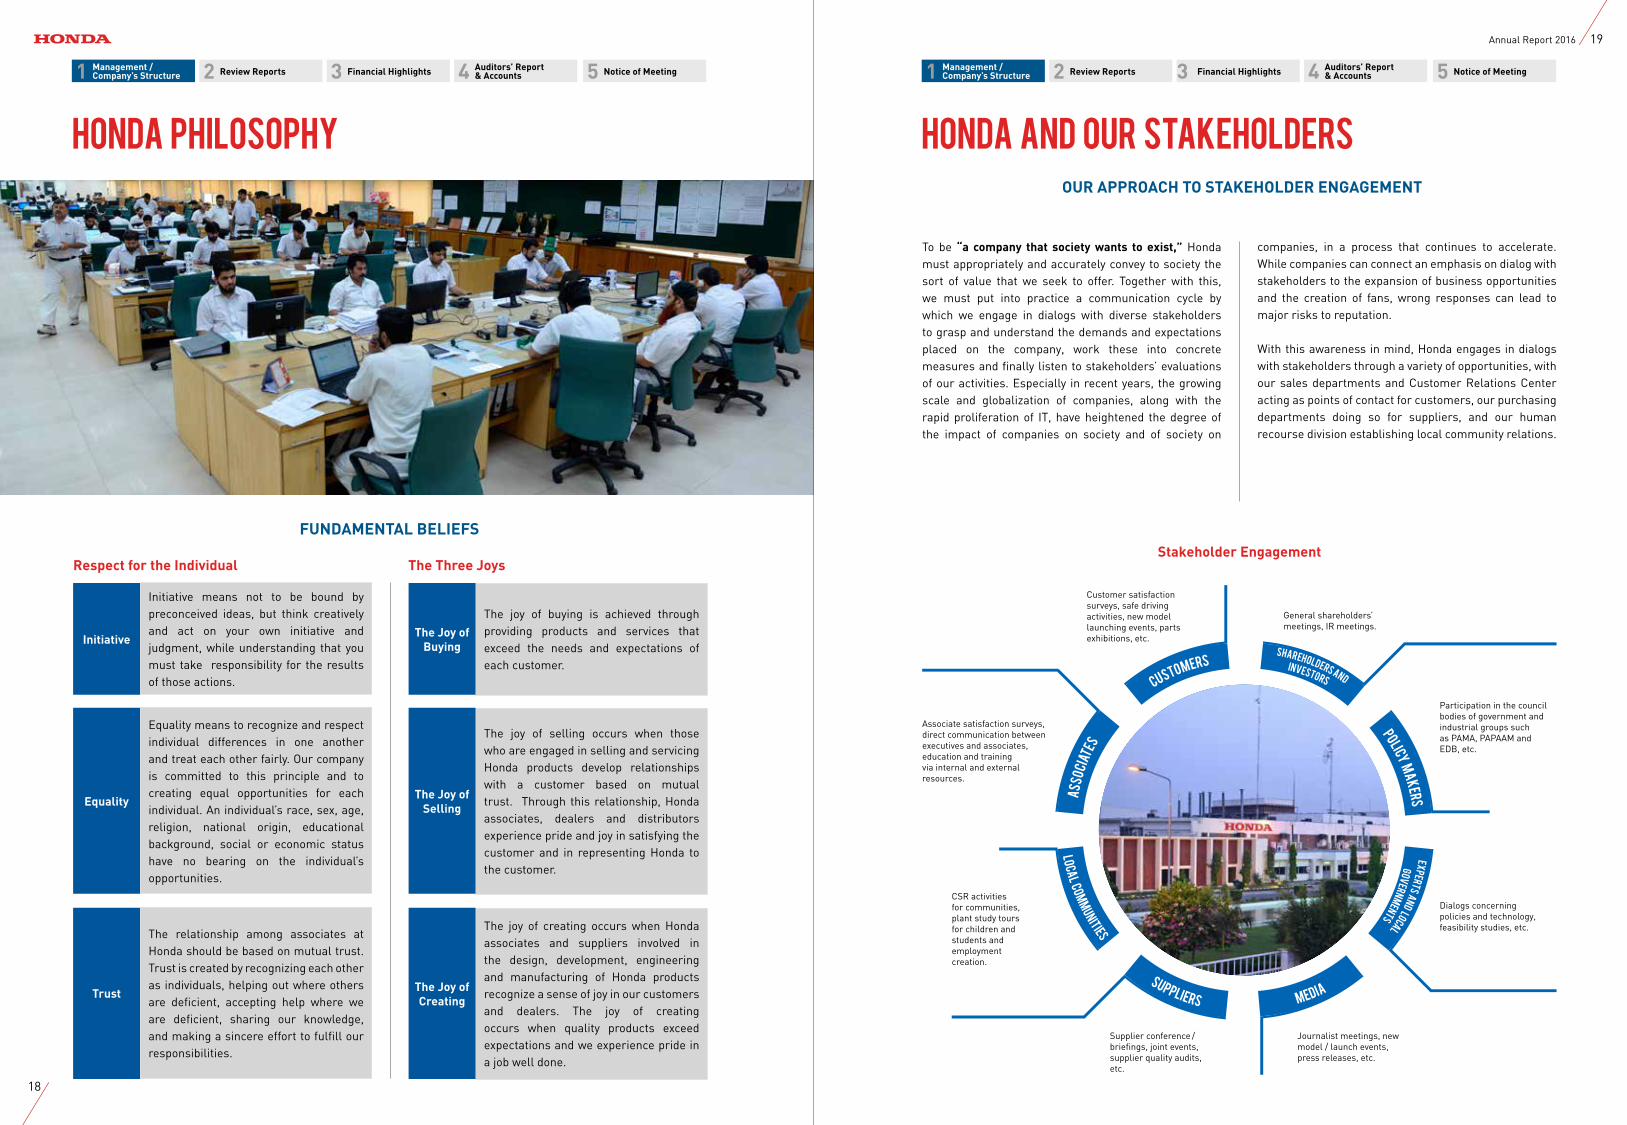
To be “a company that society wants to exist,” Honda must appropriately and accurately convey to society the sort of value that we seek to offer. Together with this, we must put into practice a communication cycle by which we engage in dialogs with diverse stakeholders to grasp and understand the demands and expectations placed on the company, work these into concrete measures and finally listen to stakeholders’ evaluations of our activities. Especially in recent years, the growing scale and globalization of companies, along with the rapid proliferation of IT, have heightened the degree of the impact of companies on society and of society on
companies, in a process that continues to accelerate. While companies can connect an emphasis on dialog with stakeholders to the expansion of business opportunities and the creation of fans, wrong responses can lead to major risks to reputation.
With this awareness in mind, Honda engages in dialogs with stakeholders through a variety of opportunities, with our sales departments and Customer Relations Center acting as points of contact for customers, our purchasing departments doing so for suppliers, and our human recourse division establishing local community relations.
Stakeholder Engagement
CSR activities for communities, plant study tours for children and students and employment creation.
General shareholders’ meetings, IR meetings.
Journalist meetings, new model / launch events, press releases, etc.
Customer satisfaction surveys, safe driving activities, new model launching events, parts exhibitions, etc.
Supplier conference / briefings, joint events, supplier quality audits, etc.
Participation in the council bodies of government and industrial groups such as PAMA, PAPAAM and EDB, etc.
Dialogs concerning policies and technology, feasibility studies, etc.
Associate satisfaction surveys, direct communication between executives and associates, education and training via internal and external resources.
Policy makers
Experts and local
Shareholders and
governments
investors
MediaSuppliers
Local comm
unities
A
ssocia
tes
Customers
Honda and our stakeholdersOUR APPROACH TO STAKEHOLDER ENGAGEMENT
Honda Philosophy
FUNDAMENTAL BELIEFS
Respect for the Individual The Three Joys
Initiative means not to be bound by preconceived ideas, but think creatively and act on your own initiative and judgment, while understanding that you must take responsibility for the results of those actions.
Equality means to recognize and respect individual differences in one another and treat each other fairly. Our company is committed to this principle and to creating equal opportunities for each individual. An individual’s race, sex, age, religion, national origin, educational background, social or economic status have no bearing on the individual’s opportunities.
The relationship among associates at Honda should be based on mutual trust. Trust is created by recognizing each other as individuals, helping out where others are deficient, accepting help where we are deficient, sharing our knowledge, and making a sincere effort to fulfill our responsibilities.
The joy of buying is achieved through providing products and services that exceed the needs and expectations of each customer.
The joy of selling occurs when those who are engaged in selling and servicing Honda products develop relationships with a customer based on mutual trust. Through this relationship, Honda associates, dealers and distributors experience pride and joy in satisfying the customer and in representing Honda to the customer.
The joy of creating occurs when Honda associates and suppliers involved in the design, development, engineering and manufacturing of Honda products recognize a sense of joy in our customers and dealers. The joy of creating occurs when quality products exceed expectations and we experience pride in a job well done.
Initiative
Equality
Trust
The Joy of Buying
The Joy of Selling
The Joy of Creating
18
19Annual Report 2016
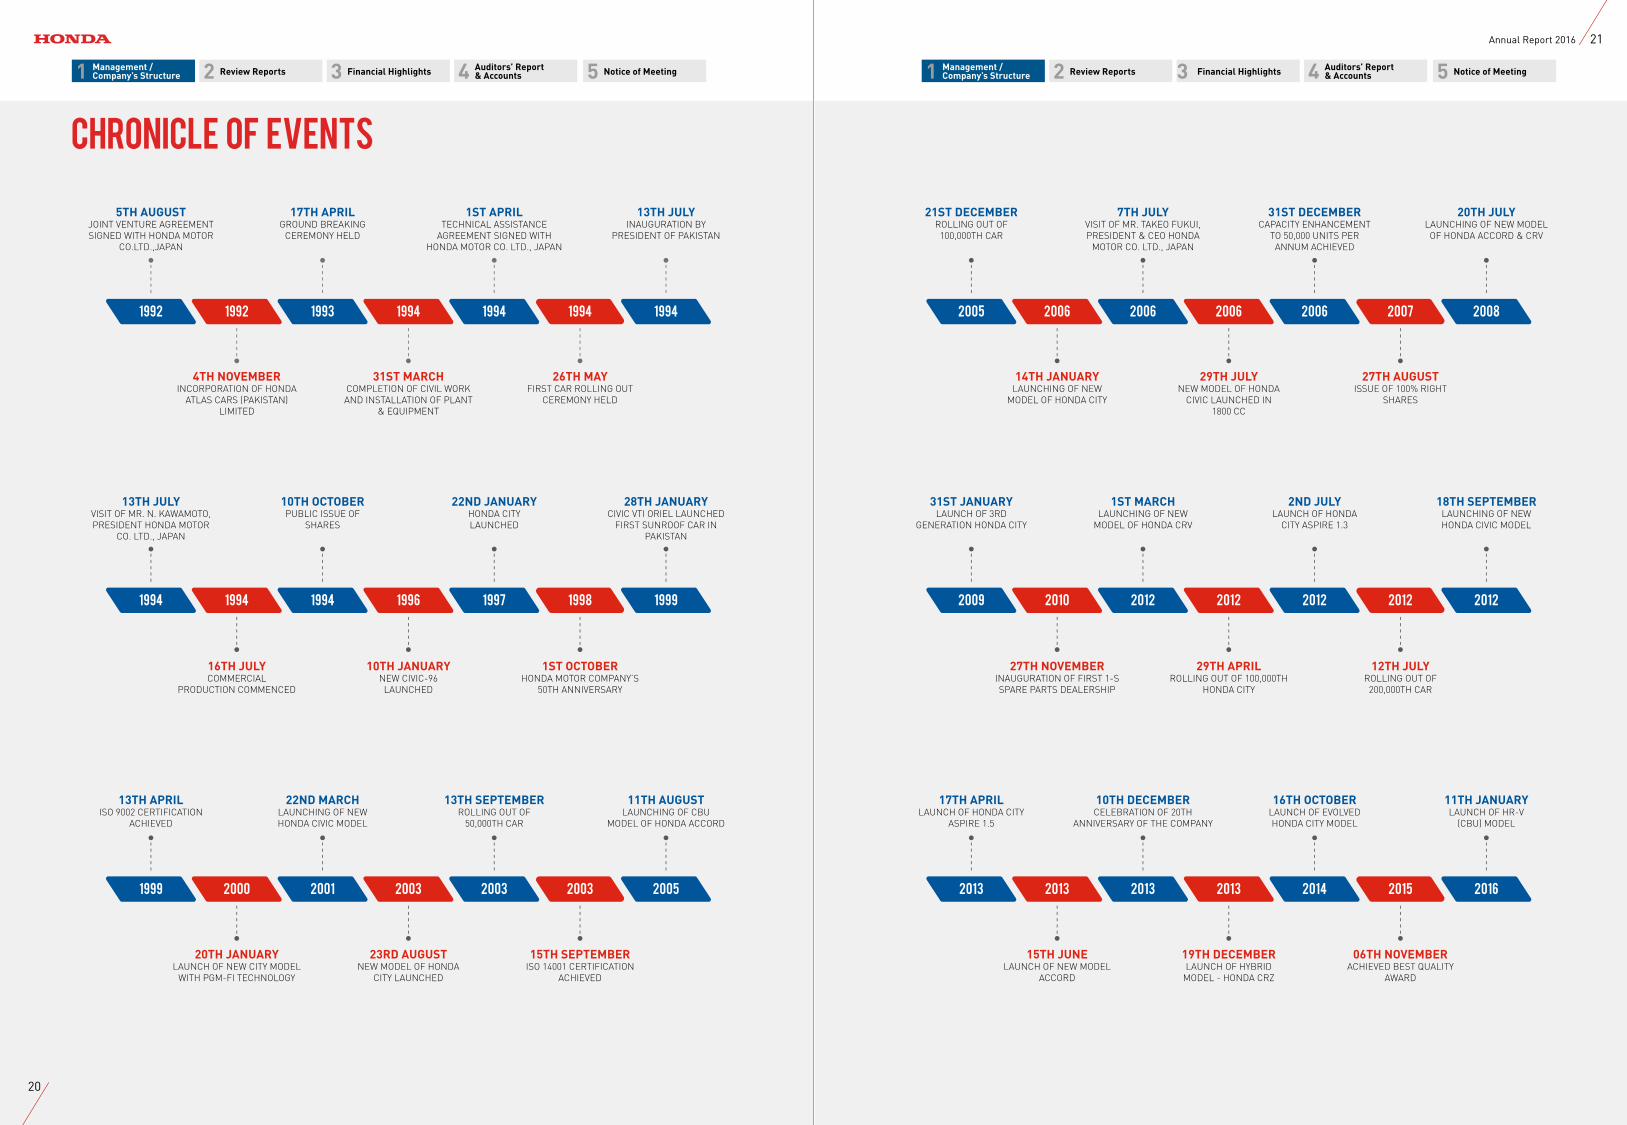
5TH AUGUSTJOINT VENTURE AGREEMENT SIGNED WITH HONDA MOTOR
CO.LTD.,JAPAN
17TH APRILGROUND BREAKING
CEREMONY HELD
1ST APRILTECHNICAL ASSISTANCE
AGREEMENT SIGNED WITH HONDA MOTOR CO. LTD., JAPAN
13TH JULYINAUGURATION BY
PRESIDENT OF PAKISTAN
4TH NOVEMBERINCORPORATION OF HONDA
ATLAS CARS (PAKISTAN) LIMITED
31ST MARCHCOMPLETION OF CIVIL WORK AND INSTALLATION OF PLANT
& EQUIPMENT
26TH MAYFIRST CAR ROLLING OUT
CEREMONY HELD
1992 1992 1993 1994 1994 1994 1994
13TH JULYVISIT OF MR. N. KAWAMOTO, PRESIDENT HONDA MOTOR
CO. LTD., JAPAN
10TH OCTOBERPUBLIC ISSUE OF
SHARES
22ND JANUARYHONDA CITY LAUNCHED
28TH JANUARYCIVIC VTI ORIEL LAUNCHED
FIRST SUNROOF CAR IN PAKISTAN
16TH JULYCOMMERCIAL
PRODUCTION COMMENCED
10TH JANUARYNEW CIVIC-96
LAUNCHED
1ST OCTOBERHONDA MOTOR COMPANY’S
50TH ANNIVERSARY
1994 1994 1994 1996 1997 1998 1999
13TH APRILISO 9002 CERTIFICATION
ACHIEVED
22ND MARCHLAUNCHING OF NEW HONDA CIVIC MODEL
13TH SEPTEMBERROLLING OUT OF
50,000TH CAR
11TH AUGUSTLAUNCHING OF CBU
MODEL OF HONDA ACCORD
20TH JANUARYLAUNCH OF NEW CITY MODEL
WITH PGM-FI TECHNOLOGY
23RD AUGUSTNEW MODEL OF HONDA
CITY LAUNCHED
15TH SEPTEMBERISO 14001 CERTIFICATION
ACHIEVED
1999 2000 2001 2003 2003 2003 2005
31ST JANUARYLAUNCH OF 3RD
GENERATION HONDA CITY
1ST MARCHLAUNCHING OF NEW
MODEL OF HONDA CRV
2ND JULYLAUNCH OF HONDA
CITY ASPIRE 1.3
18TH SEPTEMBERLAUNCHING OF NEW HONDA CIVIC MODEL
27TH NOVEMBERINAUGURATION OF FIRST 1-S SPARE PARTS DEALERSHIP
29TH APRILROLLING OUT OF 100,000TH
HONDA CITY
12TH JULYROLLING OUT OF 200,000TH CAR
2009 2010 2012 2012 2012 2012 2012
21ST DECEMBERROLLING OUT OF 100,000TH CAR
7TH JULYVISIT OF MR. TAKEO FUKUI, PRESIDENT & CEO HONDA
MOTOR CO. LTD., JAPAN
31ST DECEMBERCAPACITY ENHANCEMENT
TO 50,000 UNITS PER ANNUM ACHIEVED
20TH JULYLAUNCHING OF NEW MODEL
OF HONDA ACCORD & CRV
14TH JANUARYLAUNCHING OF NEW
MODEL OF HONDA CITY
29TH JULYNEW MODEL OF HONDA
CIVIC LAUNCHED IN 1800 CC
27TH AUGUSTISSUE OF 100% RIGHT
SHARES
2005 2006 2006 2006 2006 2007 2008
17TH APRILLAUNCH OF HONDA CITY
ASPIRE 1.5
10TH DECEMBERCELEBRATION OF 20TH
ANNIVERSARY OF THE COMPANY
16TH OCTOBERLAUNCH OF EVOLVED HONDA CITY MODEL
06TH NOVEMBERACHIEVED BEST QUALITY
AWARD
15TH JUNELAUNCH OF NEW MODEL
ACCORD
19TH DECEMBERLAUNCH OF HYBRID
MODEL - HONDA CRZ
11TH JANUARYLAUNCH OF HR-V
(CBU) MODEL
2013 2013 2013 2013 2014 2015 2016
Chronicle of Events
11 22 33 55 44 Management /Company’s Structure
Management /Company’s Structure
Auditors’ Report & Accounts
Auditors’ Report & Accounts Review ReportsReview Reports Financial HighlightsFinancial Highlights Notice of MeetingNotice of Meeting
20
21Annual Report 2016
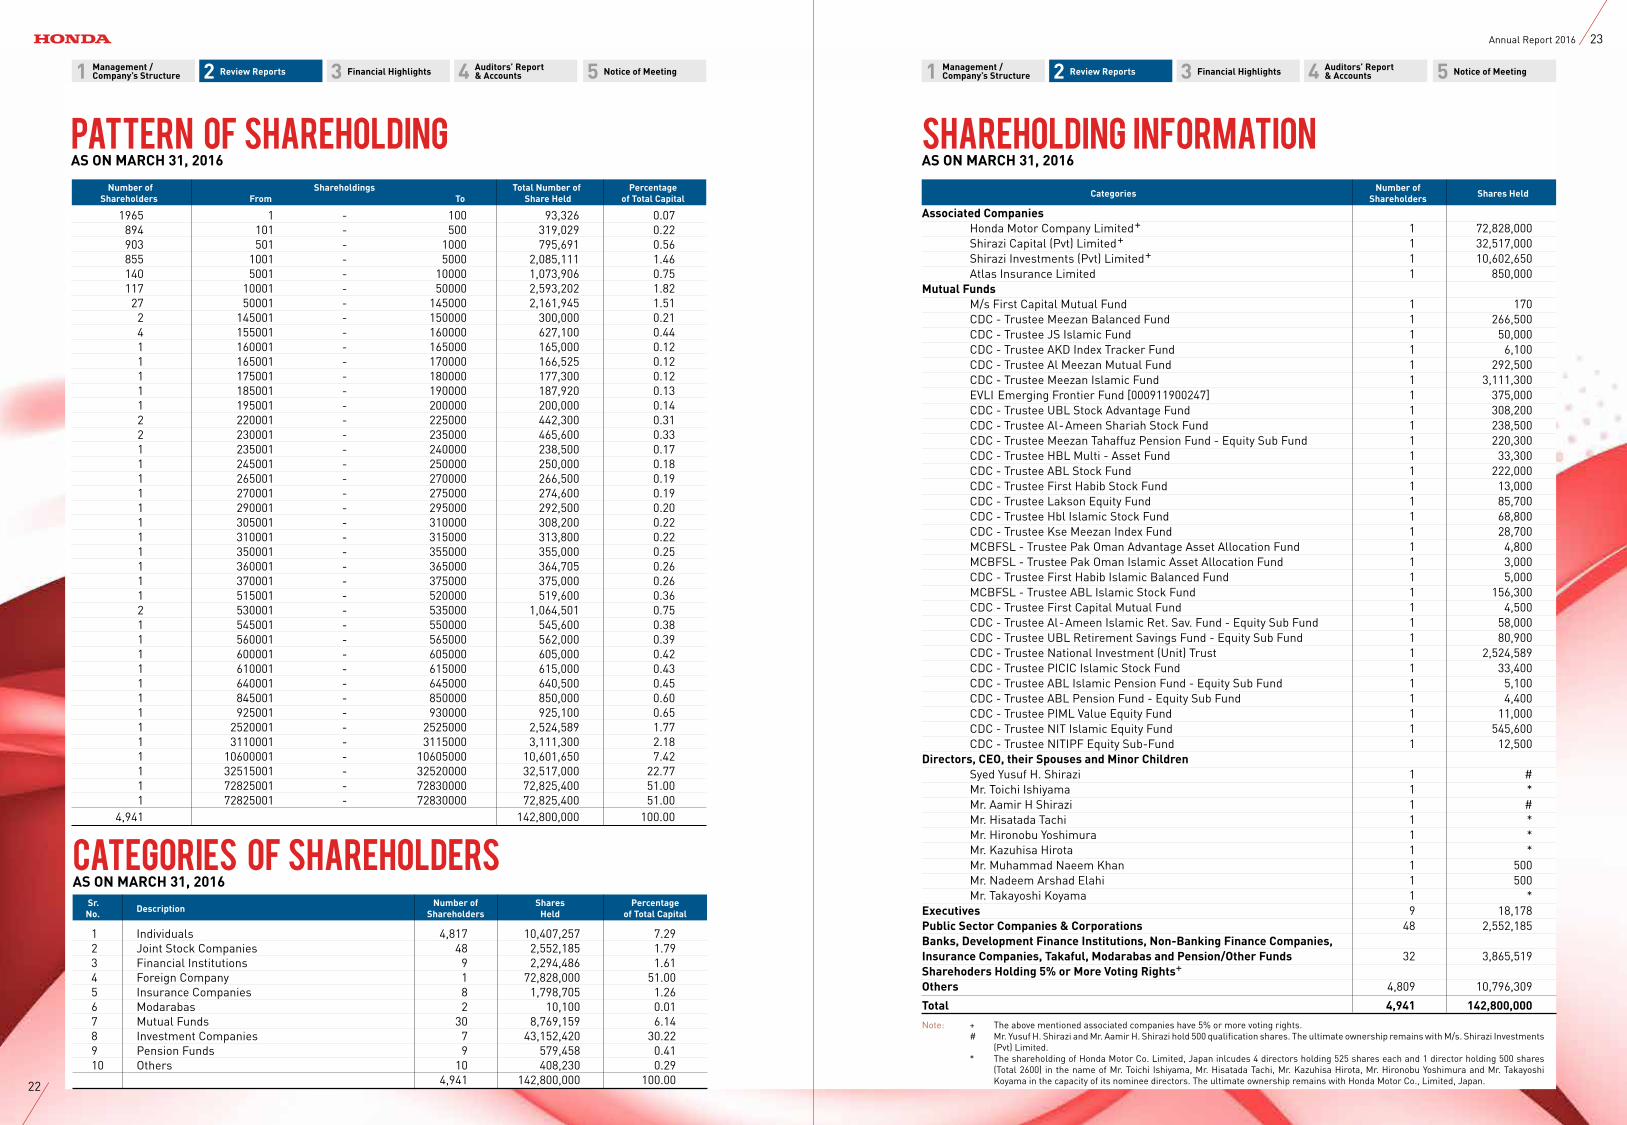
Number of Shareholdings Total Number of Percentage Shareholders From To Share Held of Total Capital
1965 1 - 100 93,326 0.07 894 101 - 500 319,029 0.22 903 501 - 1000 795,691 0.56 855 1001 - 5000 2,085,111 1.46 140 5001 - 10000 1,073,906 0.75 117 10001 - 50000 2,593,202 1.82 27 50001 - 145000 2,161,945 1.51 2 145001 - 150000 300,000 0.21 4 155001 - 160000 627,100 0.44 1 160001 - 165000 165,000 0.12 1 165001 - 170000 166,525 0.12 1 175001 - 180000 177,300 0.12 1 185001 - 190000 187,920 0.13 1 195001 - 200000 200,000 0.14 2 220001 - 225000 442,300 0.31 2 230001 - 235000 465,600 0.33 1 235001 - 240000 238,500 0.17 1 245001 - 250000 250,000 0.18 1 265001 - 270000 266,500 0.19 1 270001 - 275000 274,600 0.19 1 290001 - 295000 292,500 0.20 1 305001 - 310000 308,200 0.22 1 310001 - 315000 313,800 0.22 1 350001 - 355000 355,000 0.25 1 360001 - 365000 364,705 0.26 1 370001 - 375000 375,000 0.26 1 515001 - 520000 519,600 0.36 2 530001 - 535000 1,064,501 0.75 1 545001 - 550000 545,600 0.38 1 560001 - 565000 562,000 0.39 1 600001 - 605000 605,000 0.42 1 610001 - 615000 615,000 0.43 1 640001 - 645000 640,500 0.45 1 845001 - 850000 850,000 0.60 1 925001 - 930000 925,100 0.65 1 2520001 - 2525000 2,524,589 1.77 1 3110001 - 3115000 3,111,300 2.18 1 10600001 - 10605000 10,601,650 7.42 1 32515001 - 32520000 32,517,000 22.77 1 72825001 - 72830000 72,825,400 51.00 1 72825001 - 72830000 72,825,400 51.00 4,941 142,800,000 100.00
Sr. Number of Shares Percentage No. Description Shareholders Held of Total Capital
1 Individuals 4,817 10,407,257 7.29 2 Joint Stock Companies 48 2,552,185 1.79 3 Financial Institutions 9 2,294,486 1.61 4 Foreign Company 1 72,828,000 51.00 5 Insurance Companies 8 1,798,705 1.26 6 Modarabas 2 10,100 0.01 7 Mutual Funds 30 8,769,159 6.14 8 Investment Companies 7 43,152,420 30.22 9 Pension Funds 9 579,458 0.41 10 Others 10 408,230 0.29 4,941 142,800,000 100.00
categories of SHAREHOLDERSAS ON MARCH 31, 2016
Number of Categories Shareholders Shares Held
Associated Companies Honda Motor Company Limited+ 1 72,828,000 Shirazi Capital (Pvt) Limited+ 1 32,517,000 Shirazi Investments (Pvt) Limited+ 1 10,602,650 Atlas Insurance Limited 1 850,000 Mutual Funds M/s First Capital Mutual Fund 1 170 CDC - Trustee Meezan Balanced Fund 1 266,500 CDC - Trustee JS Islamic Fund 1 50,000 CDC - Trustee AKD Index Tracker Fund 1 6,100 CDC - Trustee Al Meezan Mutual Fund 1 292,500 CDC - Trustee Meezan Islamic Fund 1 3,111,300 EVLI Emerging Frontier Fund [000911900247] 1 375,000 CDC - Trustee UBL Stock Advantage Fund 1 308,200 CDC - Trustee Al-Ameen Shariah Stock Fund 1 238,500 CDC - Trustee Meezan Tahaffuz Pension Fund - Equity Sub Fund 1 220,300 CDC - Trustee HBL Multi - Asset Fund 1 33,300 CDC - Trustee ABL Stock Fund 1 222,000 CDC - Trustee First Habib Stock Fund 1 13,000 CDC - Trustee Lakson Equity Fund 1 85,700 CDC - Trustee Hbl Islamic Stock Fund 1 68,800 CDC - Trustee Kse Meezan Index Fund 1 28,700 MCBFSL - Trustee Pak Oman Advantage Asset Allocation Fund 1 4,800 MCBFSL - Trustee Pak Oman Islamic Asset Allocation Fund 1 3,000 CDC - Trustee First Habib Islamic Balanced Fund 1 5,000 MCBFSL - Trustee ABL Islamic Stock Fund 1 156,300 CDC - Trustee First Capital Mutual Fund 1 4,500 CDC - Trustee Al-Ameen Islamic Ret. Sav. Fund - Equity Sub Fund 1 58,000 CDC - Trustee UBL Retirement Savings Fund - Equity Sub Fund 1 80,900 CDC - Trustee National Investment (Unit) Trust 1 2,524,589 CDC - Trustee PICIC Islamic Stock Fund 1 33,400 CDC - Trustee ABL Islamic Pension Fund - Equity Sub Fund 1 5,100 CDC - Trustee ABL Pension Fund - Equity Sub Fund 1 4,400 CDC - Trustee PIML Value Equity Fund 1 11,000 CDC - Trustee NIT Islamic Equity Fund 1 545,600 CDC - Trustee NITIPF Equity Sub-Fund 1 12,500 Directors, CEO, their Spouses and Minor Children Syed Yusuf H. Shirazi 1 # Mr. Toichi Ishiyama 1 * Mr. Aamir H Shirazi 1 # Mr. Hisatada Tachi 1 * Mr. Hironobu Yoshimura 1 * Mr. Kazuhisa Hirota 1 * Mr. Muhammad Naeem Khan 1 500 Mr. Nadeem Arshad Elahi 1 500 Mr. Takayoshi Koyama 1 * Executives 9 18,178 Public Sector Companies & Corporations 48 2,552,185 Banks, Development Finance Institutions, Non-Banking Finance Companies, Insurance Companies, Takaful, Modarabas and Pension/Other Funds 32 3,865,519 Sharehoders Holding 5% or More Voting Rights+ Others 4,809 10,796,309
Total 4,941 142,800,000
Note: + The above mentioned associated companies have 5% or more voting rights. # Mr. Yusuf H. Shirazi and Mr. Aamir H. Shirazi hold 500 qualification shares. The ultimate ownership remains with M/s. Shirazi Investments
(Pvt) Limited. * The shareholding of Honda Motor Co. Limited, Japan inlcudes 4 directors holding 525 shares each and 1 director holding 500 shares
(Total 2600) in the name of Mr. Toichi Ishiyama, Mr. Hisatada Tachi, Mr. Kazuhisa Hirota, Mr. Hironobu Yoshimura and Mr. Takayoshi Koyama in the capacity of its nominee directors. The ultimate ownership remains with Honda Motor Co., Limited, Japan.
Pattern of ShareholdingAS ON MARCH 31, 2016
Shareholding INFORMATIONAS ON MARCH 31, 2016
1 2 3 54Management /Company’s Structure
Auditors’ Report & AccountsReview Reports Financial Highlights Notice of Meeting 1 2 3 54Management /
Company’s StructureAuditors’ Report & AccountsReview Reports Financial Highlights Notice of Meeting
22
23Annual Report 2016
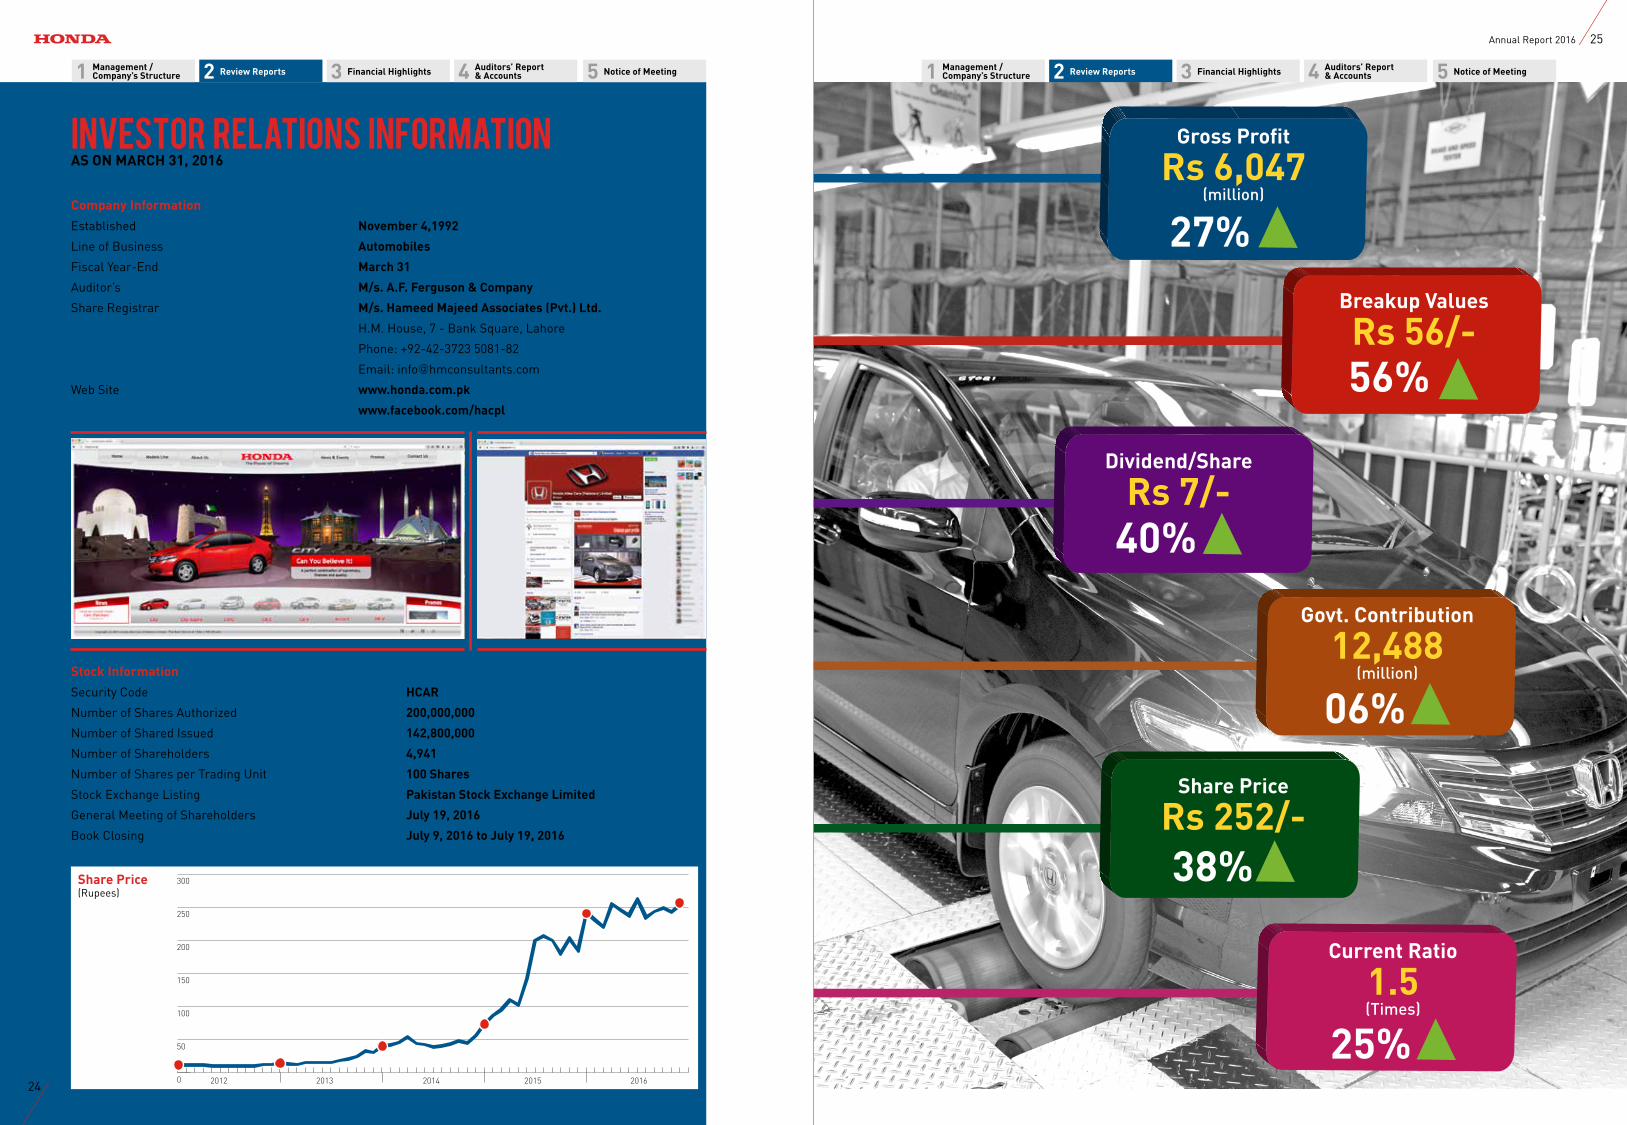
Company Information
Established November 4,1992
Line of Business Automobiles
Fiscal Year-End March 31
Auditor’s M/s. A.F. Ferguson & Company
Share Registrar M/s. Hameed Majeed Associates (Pvt.) Ltd.
H.M. House, 7 - Bank Square, Lahore
Phone: +92-42-3723 5081-82
Email: [email protected]
Web Site www.honda.com.pk
www.facebook.com/hacpl
Investor Relations InformationAS ON MARCH 31, 2016
Stock Information
Security Code HCAR
Number of Shares Authorized 200,000,000
Number of Shared Issued 142,800,000
Number of Shareholders 4,941
Number of Shares per Trading Unit 100 Shares
Stock Exchange Listing Pakistan Stock Exchange Limited
General Meeting of Shareholders July 19, 2016
Book Closing July 9, 2016 to July 19, 2016
27%
Gross Profit
Rs 6,047 (million)
25%
Current Ratio
1.5(Times)
38%
Share Price
Rs 252/-
06%
Govt. Contribution
12,488(million)
40%
Dividend/Share
Rs 7/-
56%
Breakup Values
Rs 56/-
1 2 3 54Management /Company’s Structure
Auditors’ Report & AccountsReview Reports Financial Highlights Notice of Meeting 1 2 3 54Management /
Company’s StructureAuditors’ Report & AccountsReview Reports Financial Highlights Notice of Meeting
0
50
100
150
200
250
300
2012 2013 2014 2015 2016
Share Price(Rupees)
24
25Annual Report 2016
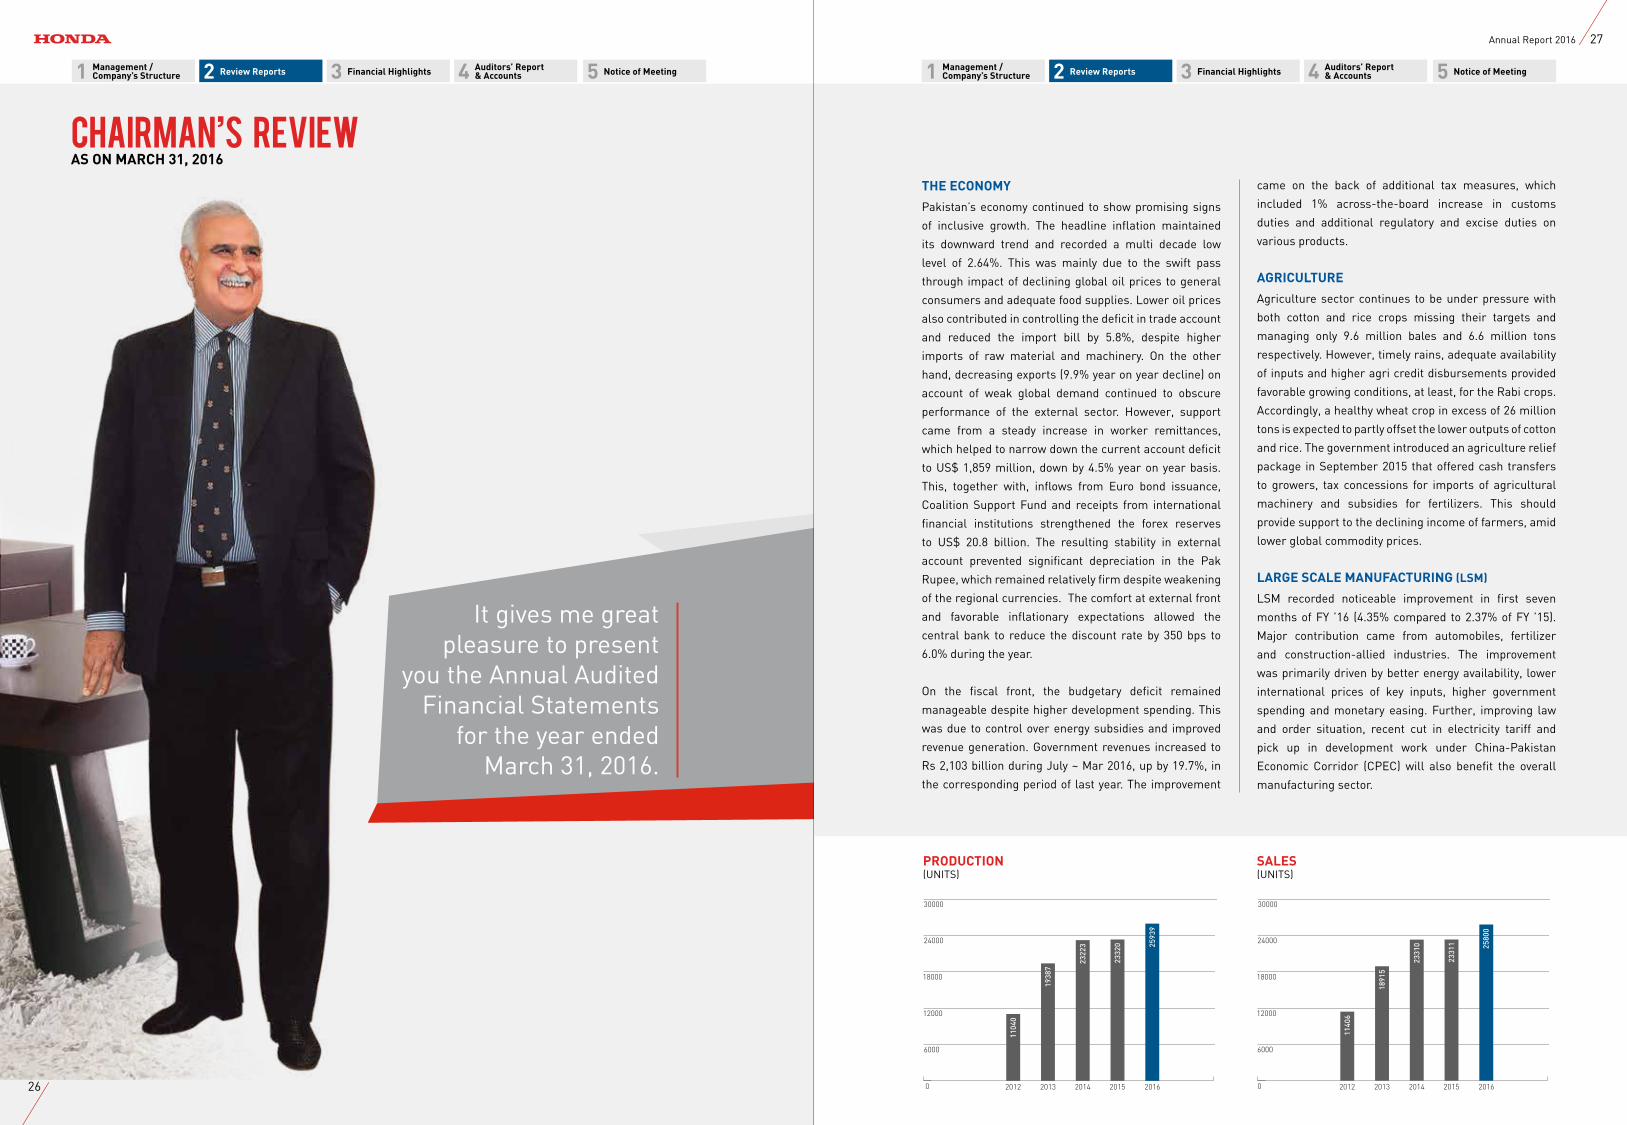
It gives me great pleasure to present
you the Annual Audited Financial Statements
for the year ended March 31, 2016.
THE ECONOMY
Pakistan’s economy continued to show promising signs
of inclusive growth. The headline inflation maintained
its downward trend and recorded a multi decade low
level of 2.64%. This was mainly due to the swift pass
through impact of declining global oil prices to general
consumers and adequate food supplies. Lower oil prices
also contributed in controlling the deficit in trade account
and reduced the import bill by 5.8%, despite higher
imports of raw material and machinery. On the other
hand, decreasing exports (9.9% year on year decline) on
account of weak global demand continued to obscure
performance of the external sector. However, support
came from a steady increase in worker remittances,
which helped to narrow down the current account deficit
to US$ 1,859 million, down by 4.5% year on year basis.
This, together with, inflows from Euro bond issuance,
Coalition Support Fund and receipts from international
financial institutions strengthened the forex reserves
to US$ 20.8 billion. The resulting stability in external
account prevented significant depreciation in the Pak
Rupee, which remained relatively firm despite weakening
of the regional currencies. The comfort at external front
and favorable inflationary expectations allowed the
central bank to reduce the discount rate by 350 bps to
6.0% during the year.
On the fiscal front, the budgetary deficit remained
manageable despite higher development spending. This
was due to control over energy subsidies and improved
revenue generation. Government revenues increased to
Rs 2,103 billion during July ~ Mar 2016, up by 19.7%, in
the corresponding period of last year. The improvement
came on the back of additional tax measures, which
included 1% across-the-board increase in customs
duties and additional regulatory and excise duties on
various products.
AGRICULTURE
Agriculture sector continues to be under pressure with
both cotton and rice crops missing their targets and
managing only 9.6 million bales and 6.6 million tons
respectively. However, timely rains, adequate availability
of inputs and higher agri credit disbursements provided
favorable growing conditions, at least, for the Rabi crops.
Accordingly, a healthy wheat crop in excess of 26 million
tons is expected to partly offset the lower outputs of cotton
and rice. The government introduced an agriculture relief
package in September 2015 that offered cash transfers
to growers, tax concessions for imports of agricultural
machinery and subsidies for fertilizers. This should
provide support to the declining income of farmers, amid
lower global commodity prices.
LARGE SCALE MANUFACTURING (LSM)
LSM recorded noticeable improvement in first seven
months of FY ’16 (4.35% compared to 2.37% of FY ’15).
Major contribution came from automobiles, fertilizer
and construction-allied industries. The improvement
was primarily driven by better energy availability, lower
international prices of key inputs, higher government
spending and monetary easing. Further, improving law
and order situation, recent cut in electricity tariff and
pick up in development work under China-Pakistan
Economic Corridor (CPEC) will also benefit the overall
manufacturing sector.
Chairman’s ReviewAS ON MARCH 31, 2016
0
6000
12000
18000
24000
30000
201420132012 2015 2016
11040
19387
23223
23320 25939
0
6000
12000
18000
24000
30000
201420132012 2015 2016
11406
18915
23310
23311 25800
PRODUCTION(UNITS)
SALES(UNITS)
1 2 3 54Management /Company’s Structure
Auditors’ Report & AccountsReview Reports Financial Highlights Notice of Meeting 1 2 3 54Management /
Company’s StructureAuditors’ Report & AccountsReview Reports Financial Highlights Notice of Meeting
26
27Annual Report 2016
AUTOMOBILE INDUSTRY
The automobile industry continued to show strong
growth during the year under review, amid favorable
economic conditions, rise in auto financing, launch of
new models and government’s Apna Rozgar Scheme.
Overall production increased by 35.3% and a total of
184,324 units were produced during the twelve months to
March 2016 against 161,191 units, in the corresponding
period of last year. Industry sales grew by 33.5% in line
with production and 182,996 units were sold during
the period. This marks the highest annual sedan cars
production & sales since 2006!
The industry has been growing continuously in the last
seven quarters since Jul~Sep 2014 where an average
quarterly growth of 31.5% has been maintained. During
last twelve months, the 800cc segment grew by 50.3%
mainly due to government financing to ‘Apna Rozgar
Scheme’ creating demand for more than 40,000 units.
The two other segments of 1000cc and 1300cc & above
posted a growth of 25.8% and 27.7% respectively.
NEW AUTO POLICY
A new auto policy affording a number of benefits for new
entrants and for closed units was announced in March
2016 after a wait of 3 years. It was hoped that a level-
playing field should have been ensured for existing
manufactures to compete with new entrants on the
same grounds. Nevertheless, the policy will bring new
investment in the country, help to expand the base of auto
industry and make it more competitive.
Pakistan is the only automobile producing country
allowing import of used cars under gift, baggage and
transfer of residence schemes, a gross misuse of which
has been causing huge losses to the industry. Thus OEMs
have not been able to fully utilize their installed capacity
for last many years. A complete ban, once for all, on used
cars imports could boost the automobile industry by
20%, apart from saving precious forex reserves, creating
new jobs opportunities, developing the vending &
ancillary industries and lower overhead unit costs by full
utilization of the production base. Current growth trends
indicate opportunities to boost production levels. A right
policy combination for existing and new players could
not only bring new investors in the auto-sector but also
encourage current OEMs to invest more to expand their
production capacity and develop their local infrastructure
to enhance competitive advantage.
SALES RESULTS
The Company consolidated its progress to date and
posted 11.2% growth over last year whereby a total of
25,939 units were produced against 23,320 units in 2014-
15. Sales also grew by 10.7% and 25,800 units were sold in
2015-16 against 23,311 units in the corresponding period
of last year, The Honda City variant recorded ever highest
units sales whereas the total sales units were second
highest for the Company in its 22 years of operations!
Honda City unit sales showed a growth of 30.8% over last
year, whereas Honda Civic declined by 25.3% mainly due
to the anticipated full model change. CBU unit sales of
Honda Accord and CRV, together with the newly launched
HR-V, also posted increase over last year.
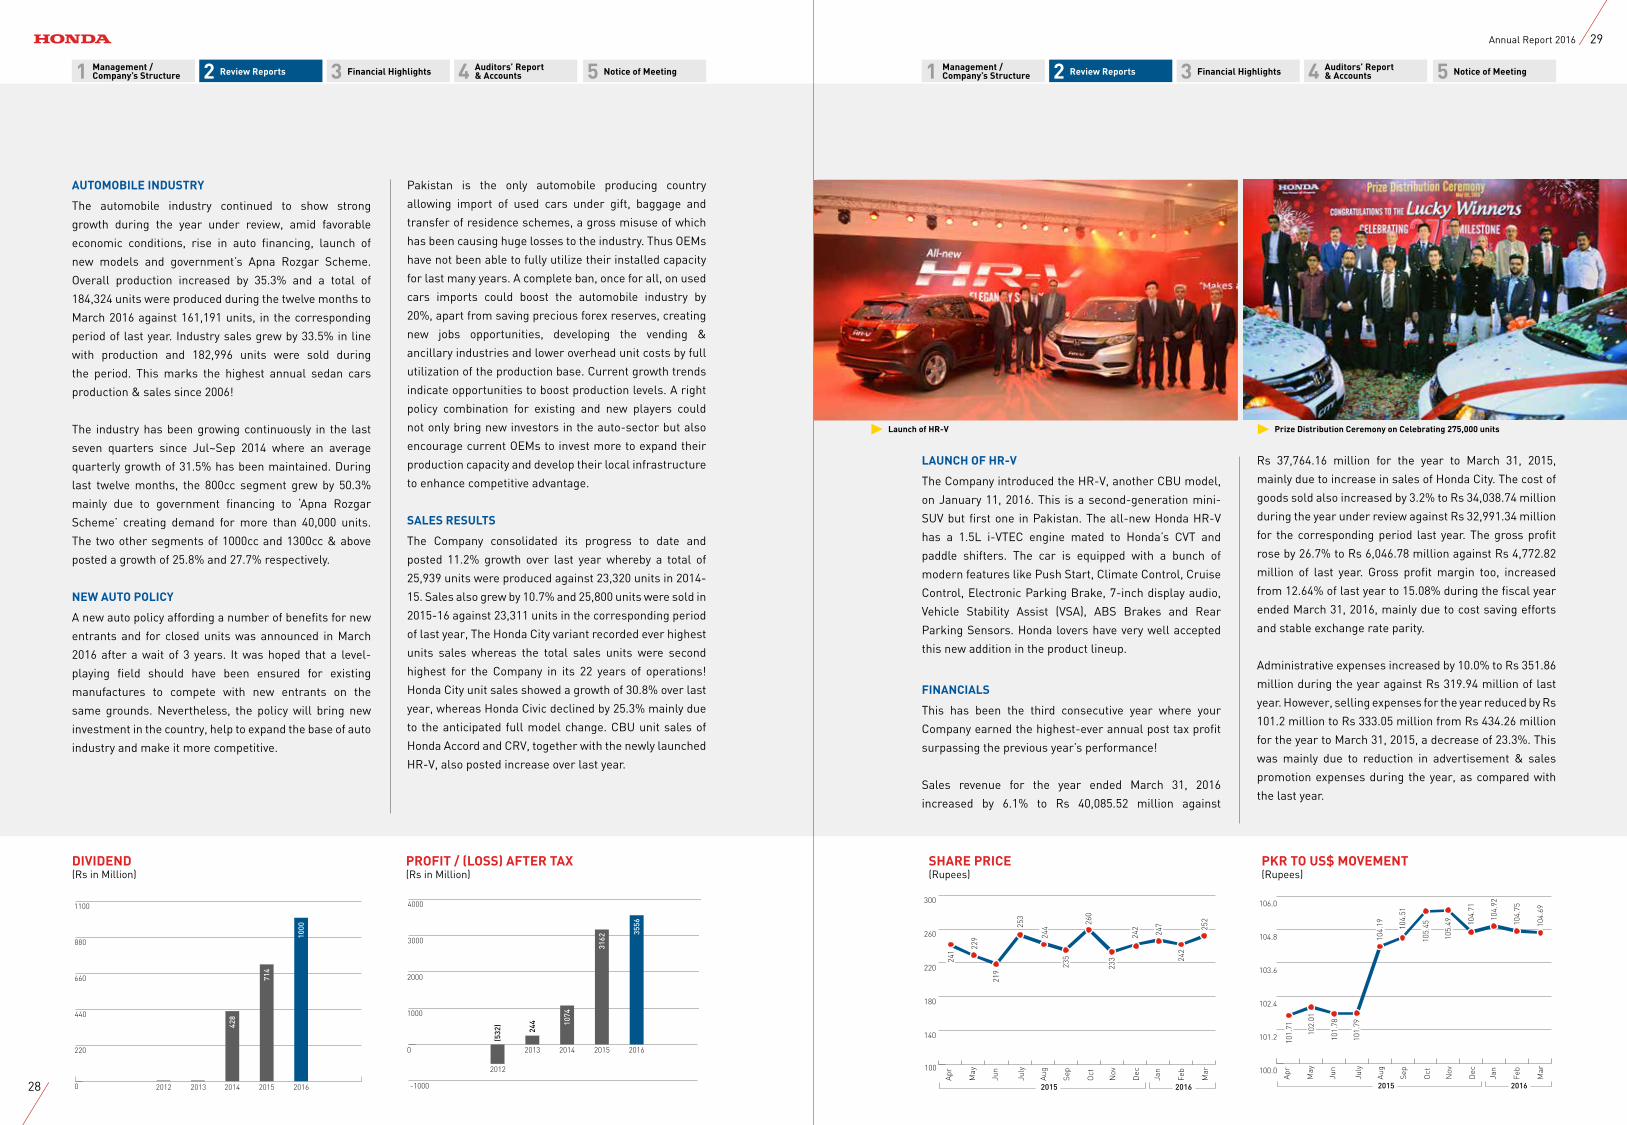
LAUNCH OF HR-V
The Company introduced the HR-V, another CBU model,
on January 11, 2016. This is a second-generation mini-
SUV but first one in Pakistan. The all-new Honda HR-V
has a 1.5L i-VTEC engine mated to Honda’s CVT and
paddle shifters. The car is equipped with a bunch of
modern features like Push Start, Climate Control, Cruise
Control, Electronic Parking Brake, 7-inch display audio,
Vehicle Stability Assist (VSA), ABS Brakes and Rear
Parking Sensors. Honda lovers have very well accepted
this new addition in the product lineup.
FINANCIALS
This has been the third consecutive year where your
Company earned the highest-ever annual post tax profit
surpassing the previous year’s performance!
Sales revenue for the year ended March 31, 2016
increased by 6.1% to Rs 40,085.52 million against
Rs 37,764.16 million for the year to March 31, 2015,
mainly due to increase in sales of Honda City. The cost of
goods sold also increased by 3.2% to Rs 34,038.74 million
during the year under review against Rs 32,991.34 million
for the corresponding period last year. The gross profit
rose by 26.7% to Rs 6,046.78 million against Rs 4,772.82
million of last year. Gross profit margin too, increased
from 12.64% of last year to 15.08% during the fiscal year
ended March 31, 2016, mainly due to cost saving efforts
and stable exchange rate parity.
Administrative expenses increased by 10.0% to Rs 351.86
million during the year against Rs 319.94 million of last
year. However, selling expenses for the year reduced by Rs
101.2 million to Rs 333.05 million from Rs 434.26 million
for the year to March 31, 2015, a decrease of 23.3%. This
was mainly due to reduction in advertisement & sales
promotion expenses during the year, as compared with
the last year.
0
220
440
660
880
1100
201420132012 2015 2016
428
714
1000
-1000
0
1000
2000
3000
4000
2012
2013 2014 2015 2016
3556
3162
1074
244
(532)
DIVIDEND(Rs in Million)
PROFIT / (LOSS) AFTER TAX(Rs in Million)
PKR TO US$ MOVEMENT(Rupees)
SHARE PRICE(Rupees)
Launch of HR-V Prize Distribution Ceremony on Celebrating 275,000 units
1 2 3 54Management /Company’s Structure
Auditors’ Report & AccountsReview Reports Financial Highlights Notice of Meeting 1 2 3 54Management /
Company’s StructureAuditors’ Report & AccountsReview Reports Financial Highlights Notice of Meeting
Apr
May
Jun
July
2015 2016
Aug
Sep
Oct
Nov
Dec
Jan
Feb
Mar
104.69
104.75
104.92
104.71
100.0
101.2
102.4
103.6
104.8
106.0
101.71
101.78
101.79
102.01
104.19 104.51
105.49
105.45
Apr
May
Jun
July
2015 2016
Aug
Sep
Oct
Nov
Dec
Jan
Feb
Mar100
140
180
220
260
300
229
219
253
260
241
244
235
233
242
247
242
252
28
29Annual Report 2016
Other income for the year improved by 41.5% to Rs 309.77
million against Rs 218.98 million for last year, due to
improved cash flow and better funds management. The
financial charges at Rs 6.99 million for the year against
Rs 18.67 million for last year were down by 62.6%, being
the lowest in the last 10 years. Other charges however,
increased by 7.5% on account of the higher profit to Rs
485.78 million for the year against Rs 451.90 million for
last year, mainly due to increase in provision for workers
Profit Participation Fund and Workers Welfare Fund. The
loss due to exchange rate fluctuation was substantially
reduced by 42.7% over last year due to stable exchange
rate prevailing throughout the year.
Thus, the Company earned profit before tax of Rs 5,178.88
million for the year ended March 31, 2016 against Rs
3,767.04 million in the preceding year, up by 37.5%. After
statutory tax provision for the year, the profit after tax
grew by 12.4% to Rs 3,555.78 million against Rs 3,162.38
million in the preceding year. Earnings per share for the
year rose to Rs 24.90 against Rs 22.15 of last year.
CONTRIBUTION TO GOVERNMENT REVENUE
During the year, the Company contributed a sum of
Rs 12.488 billion towards government revenue in the
shape of custom duty, sales tax, income tax and other
levies against Rs 11.758 billion in the corresponding
period, last year, an increase of 6%. In February 2016,
the Company was also awarded first position as ‘highest
tax payer’ in Punjab region by the Custom Authorities,
Lahore.
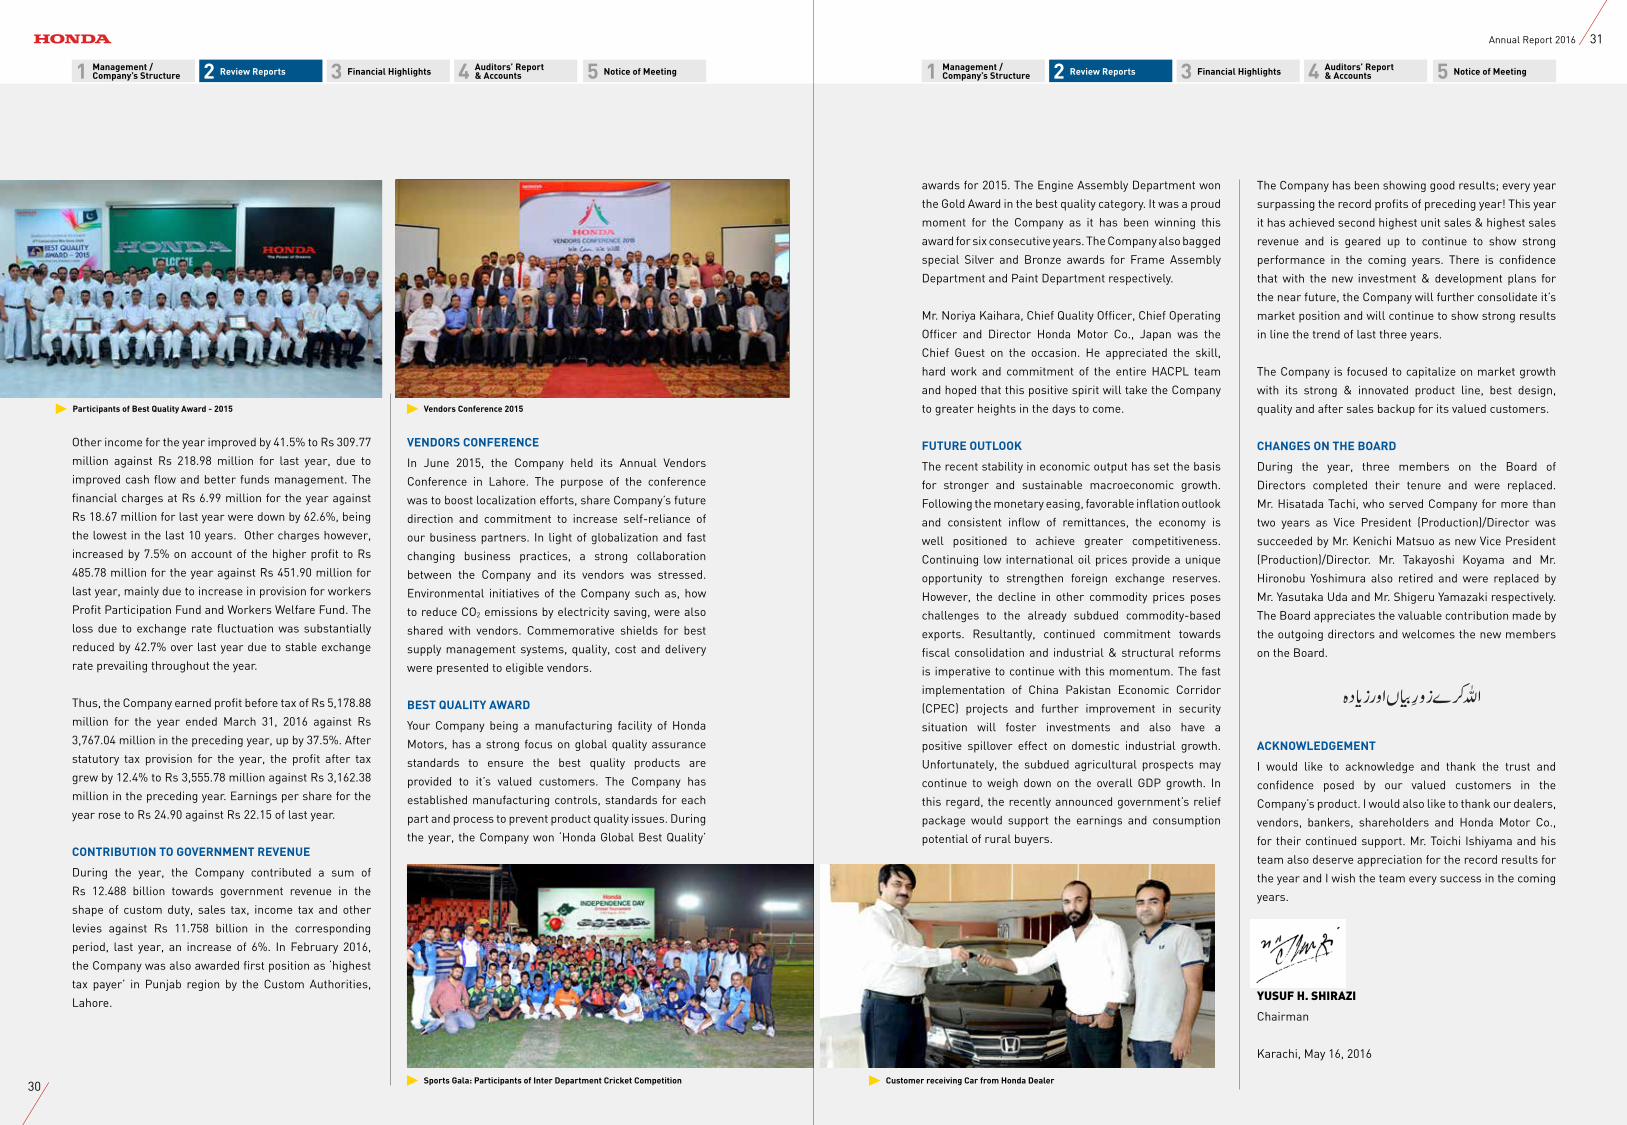
awards for 2015. The Engine Assembly Department won
the Gold Award in the best quality category. It was a proud
moment for the Company as it has been winning this
award for six consecutive years. The Company also bagged
special Silver and Bronze awards for Frame Assembly
Department and Paint Department respectively.
Mr. Noriya Kaihara, Chief Quality Officer, Chief Operating
Officer and Director Honda Motor Co., Japan was the
Chief Guest on the occasion. He appreciated the skill,
hard work and commitment of the entire HACPL team
and hoped that this positive spirit will take the Company
to greater heights in the days to come.
FUTURE OUTLOOK
The recent stability in economic output has set the basis
for stronger and sustainable macroeconomic growth.
Following the monetary easing, favorable inflation outlook
and consistent inflow of remittances, the economy is
well positioned to achieve greater competitiveness.
Continuing low international oil prices provide a unique
opportunity to strengthen foreign exchange reserves.
However, the decline in other commodity prices poses
challenges to the already subdued commodity-based
exports. Resultantly, continued commitment towards
fiscal consolidation and industrial & structural reforms
is imperative to continue with this momentum. The fast
implementation of China Pakistan Economic Corridor
(CPEC) projects and further improvement in security
situation will foster investments and also have a
positive spillover effect on domestic industrial growth.
Unfortunately, the subdued agricultural prospects may
continue to weigh down on the overall GDP growth. In
this regard, the recently announced government’s relief
package would support the earnings and consumption
potential of rural buyers.
The Company has been showing good results; every year
surpassing the record profits of preceding year! This year
it has achieved second highest unit sales & highest sales
revenue and is geared up to continue to show strong
performance in the coming years. There is confidence
that with the new investment & development plans for
the near future, the Company will further consolidate it’s
market position and will continue to show strong results
in line the trend of last three years.
The Company is focused to capitalize on market growth
with its strong & innovated product line, best design,
quality and after sales backup for its valued customers.
CHANGES ON THE BOARD
During the year, three members on the Board of
Directors completed their tenure and were replaced.
Mr. Hisatada Tachi, who served Company for more than
two years as Vice President (Production)/Director was
succeeded by Mr. Kenichi Matsuo as new Vice President
(Production)/Director. Mr. Takayoshi Koyama and Mr.
Hironobu Yoshimura also retired and were replaced by
Mr. Yasutaka Uda and Mr. Shigeru Yamazaki respectively.
The Board appreciates the valuable contribution made by
the outgoing directors and welcomes the new members
on the Board.
ACKNOWLEDGEMENT
I would like to acknowledge and thank the trust and
confidence posed by our valued customers in the
Company’s product. I would also like to thank our dealers,
vendors, bankers, shareholders and Honda Motor Co.,
for their continued support. Mr. Toichi Ishiyama and his
team also deserve appreciation for the record results for
the year and I wish the team every success in the coming
years.
YUSUF H. SHIRAZI
Chairman
Karachi, May 16, 2016
VENDORS CONFERENCE
In June 2015, the Company held its Annual Vendors
Conference in Lahore. The purpose of the conference
was to boost localization efforts, share Company’s future
direction and commitment to increase self-reliance of
our business partners. In light of globalization and fast
changing business practices, a strong collaboration
between the Company and its vendors was stressed.
Environmental initiatives of the Company such as, how
to reduce CO2 emissions by electricity saving, were also
shared with vendors. Commemorative shields for best
supply management systems, quality, cost and delivery
were presented to eligible vendors.
BEST QUALITY AWARD
Your Company being a manufacturing facility of Honda
Motors, has a strong focus on global quality assurance
standards to ensure the best quality products are
provided to it’s valued customers. The Company has
established manufacturing controls, standards for each
part and process to prevent product quality issues. During
the year, the Company won ‘Honda Global Best Quality’
Vendors Conference 2015
Sports Gala: Participants of Inter Department Cricket Competition Customer receiving Car from Honda Dealer
Participants of Best Quality Award - 2015
1 2 3 54Management /Company’s Structure
Auditors’ Report & AccountsReview Reports Financial Highlights Notice of Meeting 1 2 3 54Management /
Company’s StructureAuditors’ Report & AccountsReview Reports Financial Highlights Notice of Meeting
30
31Annual Report 2016
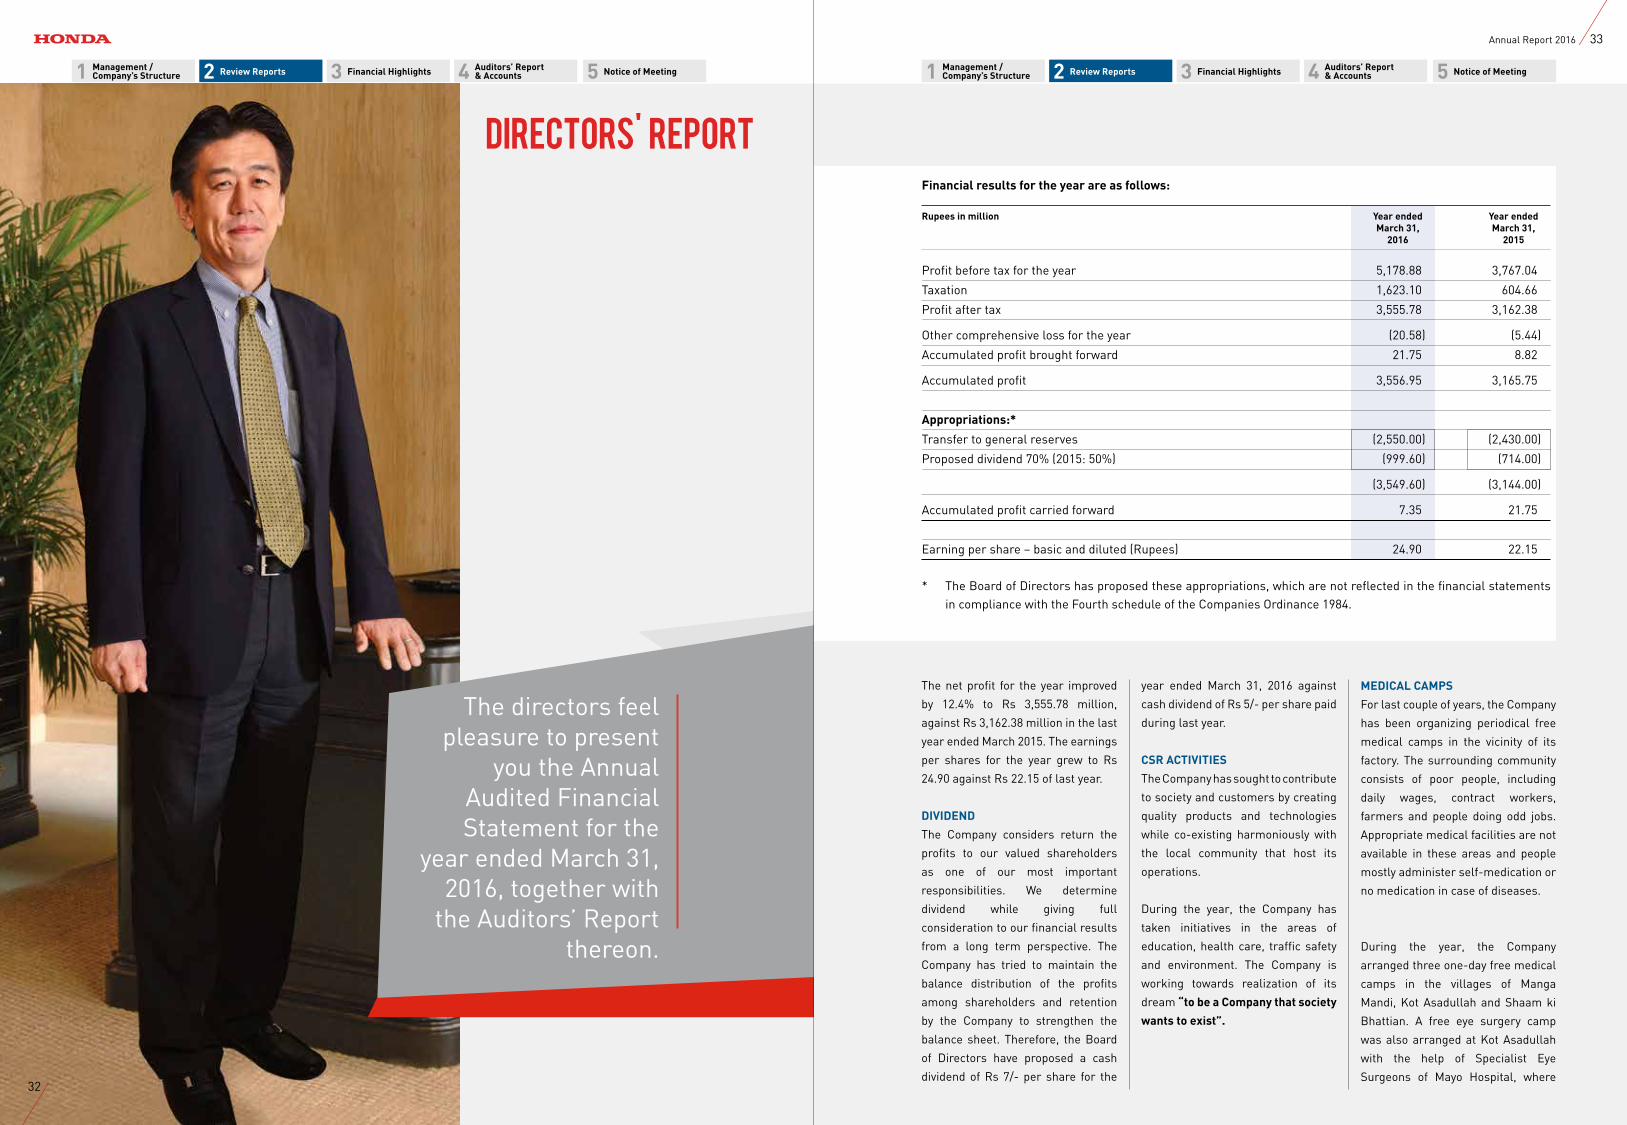
Directors' ReportFinancial results for the year are as follows:
Rupees in million Year ended Year ended March 31, March 31, 2016 2015
Profit before tax for the year 5,178.88 3,767.04
Taxation 1,623.10 604.66
Profit after tax 3,555.78 3,162.38
Other comprehensive loss for the year (20.58) (5.44)
Accumulated profit brought forward 21.75 8.82
Accumulated profit 3,556.95 3,165.75
Appropriations:*
Transfer to general reserves (2,550.00) (2,430.00)
Proposed dividend 70% (2015: 50%) (999.60) (714.00)
(3,549.60) (3,144.00)
Accumulated profit carried forward 7.35 21.75
Earning per share – basic and diluted (Rupees) 24.90 22.15
* The Board of Directors has proposed these appropriations, which are not reflected in the financial statements in compliance with the Fourth schedule of the Companies Ordinance 1984.
The net profit for the year improved
by 12.4% to Rs 3,555.78 million,
against Rs 3,162.38 million in the last
year ended March 2015. The earnings
per shares for the year grew to Rs
24.90 against Rs 22.15 of last year.
DIVIDEND
The Company considers return the
profits to our valued shareholders
as one of our most important
responsibilities. We determine
dividend while giving full
consideration to our financial results
from a long term perspective. The
Company has tried to maintain the
balance distribution of the profits
among shareholders and retention
by the Company to strengthen the
balance sheet. Therefore, the Board
of Directors have proposed a cash
dividend of Rs 7/- per share for the
MEDICAL CAMPS
For last couple of years, the Company
has been organizing periodical free
medical camps in the vicinity of its
factory. The surrounding community
consists of poor people, including
daily wages, contract workers,
farmers and people doing odd jobs.
Appropriate medical facilities are not
available in these areas and people
mostly administer self-medication or
no medication in case of diseases.
During the year, the Company
arranged three one-day free medical
camps in the villages of Manga
Mandi, Kot Asadullah and Shaam ki
Bhattian. A free eye surgery camp
was also arranged at Kot Asadullah
with the help of Specialist Eye
Surgeons of Mayo Hospital, where
The directors feel pleasure to present
you the Annual Audited Financial Statement for the
year ended March 31, 2016, together with
the Auditors’ Report thereon.
year ended March 31, 2016 against
cash dividend of Rs 5/- per share paid
during last year.
CSR ACTIVITIES
The Company has sought to contribute
to society and customers by creating
quality products and technologies
while co-existing harmoniously with
the local community that host its
operations.
During the year, the Company has
taken initiatives in the areas of
education, health care, traffic safety
and environment. The Company is
working towards realization of its
dream “to be a Company that society
wants to exist”.
1 2 3 54Management /Company’s Structure
Auditors’ Report & AccountsReview Reports Financial Highlights Notice of Meeting 1 2 3 54Management /
Company’s StructureAuditors’ Report & AccountsReview Reports Financial Highlights Notice of Meeting
32
33Annual Report 2016
for creating awareness, need and
importance of blood donation and
the ways in which their donation will
be utilized to save human lives. The
associates voluntarily participated
in this full day activity and donated
blood bottles to the foundation.
CORPORATE AND FINANCIAL REPORTING FRAMEWORK
In compliance with the provisions
of the listing regulations of Stock
Exchanges, the Board members
are pleased to place the following
statements on record:
• The financial statements for
the year ended March 31, 2016
present fairly its state of affairs,
the results of its operations,
cash flow and changes in equity;
• Proper books of accounts have
been maintained;
• Appropriate accounting policies
have been consistently applied
in preparation of financial
statements for the year
ended March 31, 2016 and
accounting estimates are based
on reasonable and prudent
judgment;
• International Financial
Reporting Standards, as
applicable in Pakistan, have
been followed in preparation of
financial statements;
• The systems of internal control
is sound in design and has been
effectively implemented and
monitored;
• There are no significant doubts
about the Company’s ability to
continue as a going concern;
• There has been no material
departure from the best practices
of corporate governance, as
detailed in listing regulations as
on March 31, 2016;
• The book values of investments
held by Employees Provident
Fund and Employees Gratuity
Fund as on March 31, 2016 were
Rs 334 million and Rs 244 million
respectively.
• The key operating and financial
data for last ten years is given on
page 42.
THE BOARD OF DIRECTORS
The Board of Directors is composed
of nine members, which includes
one independent director as required
under requirement of the Code of
Corporate Governance 2014. The
independent director was added
surgery of patients was carried
out. In all four medical camps, the
Company provided free medicines
and medical assistance to more than
2,000 peoples.
CAPACITY BUILDING AT LOCAL SCHOOL
The Company has been providing
needed assistance to the local school
to improve their infrastructure.
During the year, the Company build
a new class room in a girl’s school in
Manga Mandi. The boy’s school in the
same village was also improved with
concrete pathways and increase in
rest rooms.
SAFETY CAMPAIGNS
The Company have arranged two
traffic safety education and trainings
to Company associates and drivers
who uses coasters for pick and drop
of associates. These drivers were
provided specific training, before
start of winter season, to use safe
driving technique in foggy days for
their on safety and that of others on
the roads.
BLOOD DONATION CAMPS
For last three years, the Company
have been arranging blood donation
campaign in coordination with
the Fatmid Foundation, Lahore.
The Company provided necessary
education session with the associates
after approval in general meeting of
Shareholder in April last year.
The board is responsible for making
decisions with respect to important
management matters, including
the execution of important business
activities and other matters as
prescribed by law. These decisions
are made after deliberating such
matters according to the established
criteria, assessing risks and giving
such matters due consideration.
The board is also responsible for
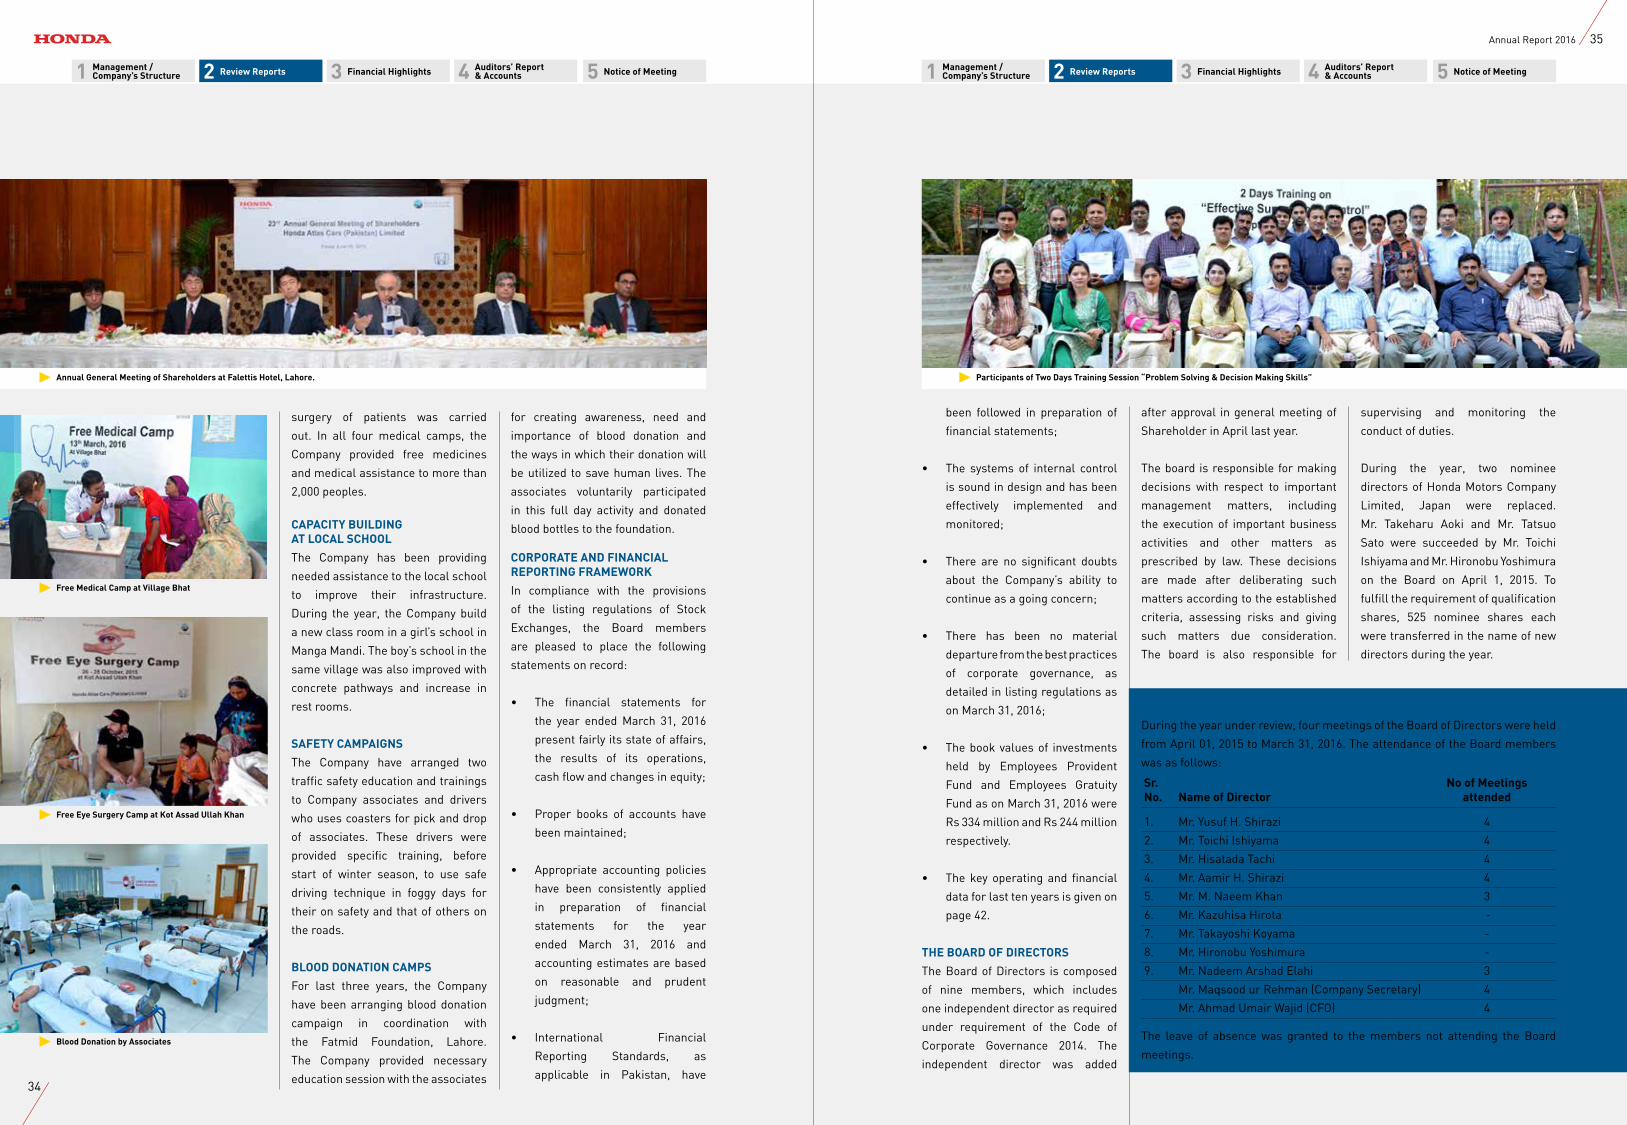
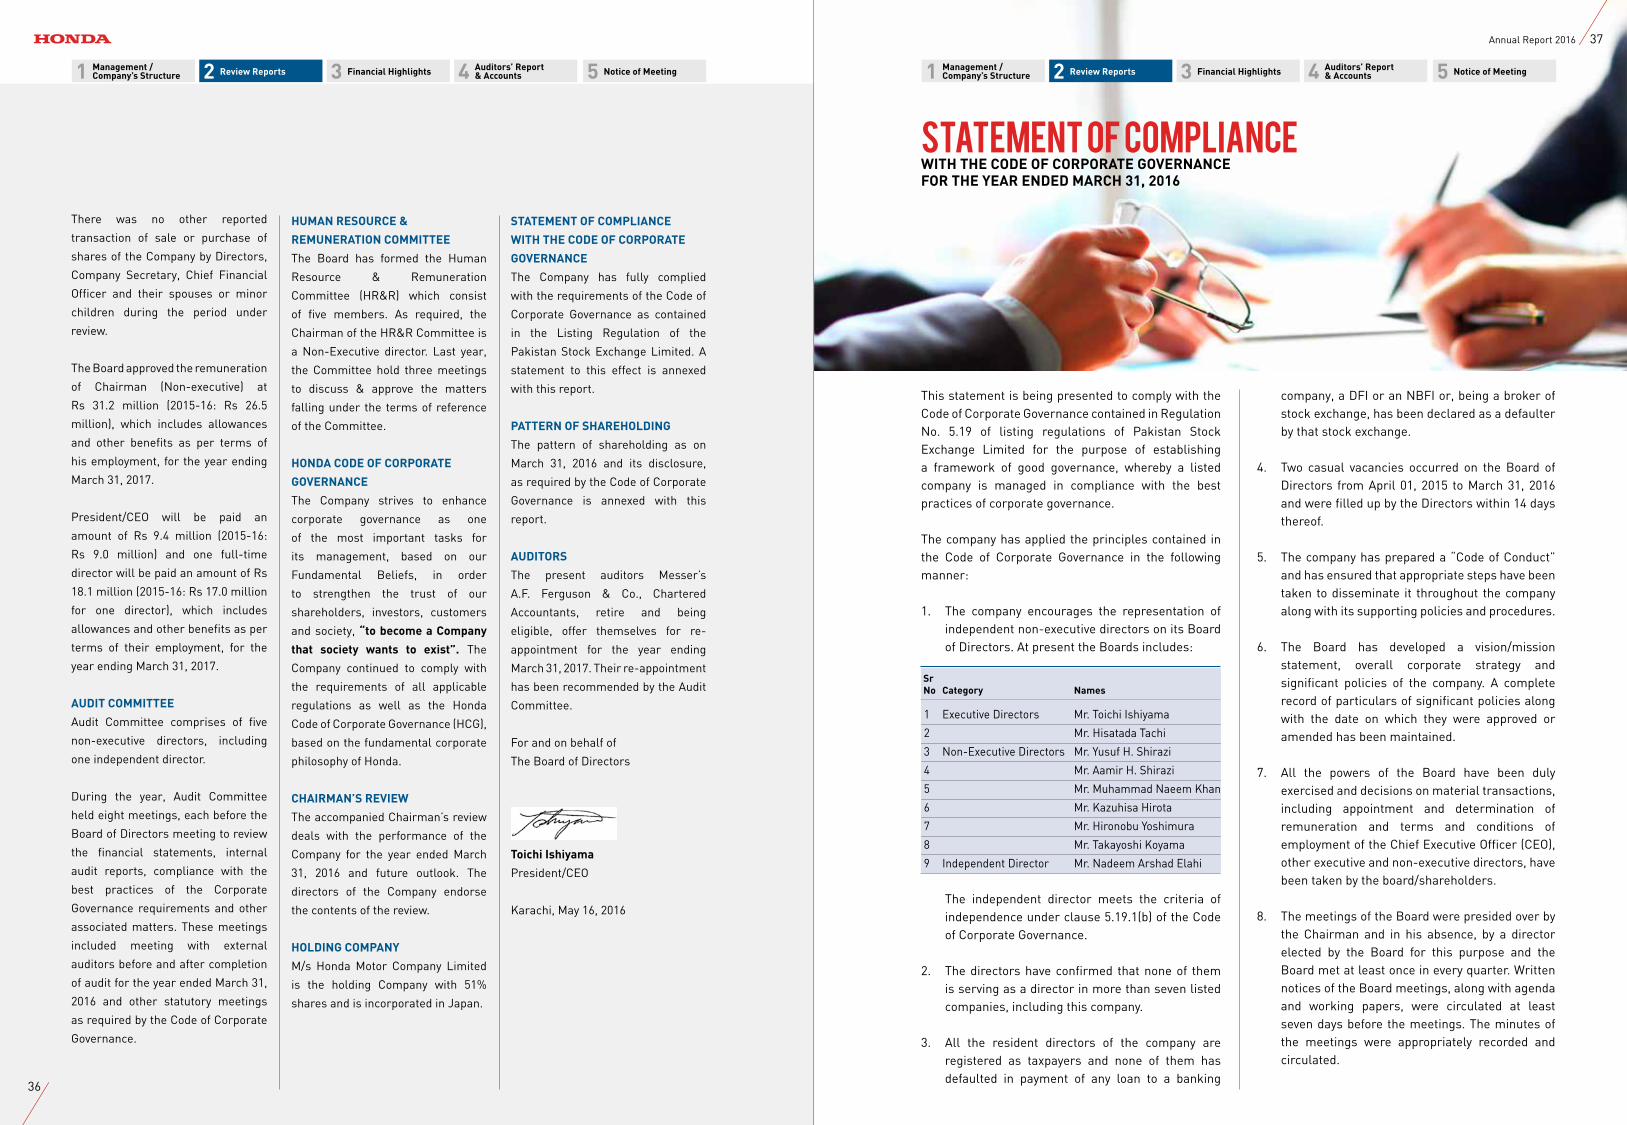
Annual General Meeting of Shareholders at Falettis Hotel, Lahore. Participants of Two Days Training Session “Problem Solving & Decision Making Skills”
Free Medical Camp at Village Bhat
Free Eye Surgery Camp at Kot Assad Ullah Khan
Blood Donation by Associates
supervising and monitoring the
conduct of duties.
During the year, two nominee
directors of Honda Motors Company
Limited, Japan were replaced.
Mr. Takeharu Aoki and Mr. Tatsuo
Sato were succeeded by Mr. Toichi
Ishiyama and Mr. Hironobu Yoshimura
on the Board on April 1, 2015. To
fulfill the requirement of qualification
shares, 525 nominee shares each
were transferred in the name of new
directors during the year.
1 2 3 54Management /Company’s Structure
Auditors’ Report & AccountsReview Reports Financial Highlights Notice of Meeting 1 2 3 54Management /
Company’s StructureAuditors’ Report & AccountsReview Reports Financial Highlights Notice of Meeting
BOARD MEETINGS
During the year under review, four meetings of the Board of Directors were held
from April 01, 2015 to March 31, 2016. The attendance of the Board members
was as follows:
Sr. No of Meetings No. Name of Director attended
1. Mr. Yusuf H. Shirazi 4
2. Mr. Toichi Ishiyama 4
3. Mr. Hisatada Tachi 4
4. Mr. Aamir H. Shirazi 4
5. Mr. M. Naeem Khan 3
6. Mr. Kazuhisa Hirota -
7. Mr. Takayoshi Koyama -
8. Mr. Hironobu Yoshimura -
9. Mr. Nadeem Arshad Elahi 3
Mr. Maqsood ur Rehman (Company Secretary) 4
Mr. Ahmad Umair Wajid (CFO) 4
The leave of absence was granted to the members not attending the Board
meetings.
34
35Annual Report 2016
STATEMENT OF COMPLIANCE
WITH THE CODE OF CORPORATE
GOVERNANCE
The Company has fully complied
with the requirements of the Code of
Corporate Governance as contained
in the Listing Regulation of the
Pakistan Stock Exchange Limited. A
statement to this effect is annexed
with this report.
PATTERN OF SHAREHOLDING
The pattern of shareholding as on
March 31, 2016 and its disclosure,
as required by the Code of Corporate
Governance is annexed with this
report.
AUDITORS
The present auditors Messer’s
A.F. Ferguson & Co., Chartered
Accountants, retire and being
eligible, offer themselves for re-
appointment for the year ending
March 31, 2017. Their re-appointment
has been recommended by the Audit
Committee.
For and on behalf of
The Board of Directors
Toichi Ishiyama
President/CEO
Karachi, May 16, 2016
There was no other reported
transaction of sale or purchase of
shares of the Company by Directors,
Company Secretary, Chief Financial
Officer and their spouses or minor
children during the period under
review.
The Board approved the remuneration
of Chairman (Non-executive) at
Rs 31.2 million (2015-16: Rs 26.5
million), which includes allowances
and other benefits as per terms of
his employment, for the year ending
March 31, 2017.
President/CEO will be paid an
amount of Rs 9.4 million (2015-16:
Rs 9.0 million) and one full-time
director will be paid an amount of Rs
18.1 million (2015-16: Rs 17.0 million
for one director), which includes
allowances and other benefits as per
terms of their employment, for the
year ending March 31, 2017.
AUDIT COMMITTEE
Audit Committee comprises of five
non-executive directors, including
one independent director.
During the year, Audit Committee
held eight meetings, each before the
Board of Directors meeting to review
the financial statements, internal
audit reports, compliance with the
best practices of the Corporate
Governance requirements and other
associated matters. These meetings
included meeting with external
auditors before and after completion
of audit for the year ended March 31,
2016 and other statutory meetings
as required by the Code of Corporate
Governance.
HUMAN RESOURCE &
REMUNERATION COMMITTEE
The Board has formed the Human
Resource & Remuneration
Committee (HR&R) which consist
of five members. As required, the
Chairman of the HR&R Committee is
a Non-Executive director. Last year,
the Committee hold three meetings
to discuss & approve the matters
falling under the terms of reference
of the Committee.
HONDA CODE OF CORPORATE
GOVERNANCE
The Company strives to enhance
corporate governance as one
of the most important tasks for
its management, based on our
Fundamental Beliefs, in order
to strengthen the trust of our
shareholders, investors, customers
and society, “to become a Company
that society wants to exist”. The
Company continued to comply with
the requirements of all applicable
regulations as well as the Honda
Code of Corporate Governance (HCG),
based on the fundamental corporate
philosophy of Honda.
CHAIRMAN’S REVIEW
The accompanied Chairman’s review
deals with the performance of the
Company for the year ended March
31, 2016 and future outlook. The
directors of the Company endorse
the contents of the review.
HOLDING COMPANY
M/s Honda Motor Company Limited
is the holding Company with 51%
shares and is incorporated in Japan.
Statement of ComplianceWITH THE CODE OF CORPORATE GOVERNANCEFOR THE YEAR ENDED MARCH 31, 2016
This statement is being presented to comply with the Code of Corporate Governance contained in Regulation No. 5.19 of listing regulations of Pakistan Stock Exchange Limited for the purpose of establishing a framework of good governance, whereby a listed company is managed in compliance with the best practices of corporate governance.
The company has applied the principles contained in the Code of Corporate Governance in the following manner:
1. The company encourages the representation of independent non-executive directors on its Board of Directors. At present the Boards includes:
Sr No Category Names
1 Executive Directors Mr. Toichi Ishiyama
2 Mr. Hisatada Tachi
3 Non-Executive Directors Mr. Yusuf H. Shirazi
4 Mr. Aamir H. Shirazi
5 Mr. Muhammad Naeem Khan
6 Mr. Kazuhisa Hirota
7 Mr. Hironobu Yoshimura
8 Mr. Takayoshi Koyama
9 Independent Director Mr. Nadeem Arshad Elahi
The independent director meets the criteria of independence under clause 5.19.1(b) of the Code of Corporate Governance.
2. The directors have confirmed that none of them is serving as a director in more than seven listed companies, including this company.
3. All the resident directors of the company are registered as taxpayers and none of them has defaulted in payment of any loan to a banking
company, a DFI or an NBFI or, being a broker of stock exchange, has been declared as a defaulter by that stock exchange.
4. Two casual vacancies occurred on the Board of Directors from April 01, 2015 to March 31, 2016 and were filled up by the Directors within 14 days thereof.
5. The company has prepared a “Code of Conduct” and has ensured that appropriate steps have been taken to disseminate it throughout the company along with its supporting policies and procedures.
6. The Board has developed a vision/mission statement, overall corporate strategy and significant policies of the company. A complete record of particulars of significant policies along with the date on which they were approved or amended has been maintained.
7. All the powers of the Board have been duly exercised and decisions on material transactions, including appointment and determination of remuneration and terms and conditions of employment of the Chief Executive Officer (CEO), other executive and non-executive directors, have been taken by the board/shareholders.
8. The meetings of the Board were presided over by the Chairman and in his absence, by a director elected by the Board for this purpose and the Board met at least once in every quarter. Written notices of the Board meetings, along with agenda and working papers, were circulated at least seven days before the meetings. The minutes of the meetings were appropriately recorded and circulated.
1 2 3 54Management /Company’s Structure
Auditors’ Report & AccountsReview Reports Financial Highlights Notice of Meeting 1 2 3 54Management /
Company’s StructureAuditors’ Report & AccountsReview Reports Financial Highlights Notice of Meeting
36
37Annual Report 2016
9. The Board arranged Directors’ Training Program for two directors during the year.
10. Company provided information to foreign resident directors of their duties and responsibilities. Other directors of the company, being directors of other local companies have adequate exposure of corporate matters and are already aware of their duties and responsibilities.
11. During the year, there was no change in the position of Company Secretary, Chief Financial Officer (CFO) & Head of Internal Audit.
12. The directors’ report for the year ended March 31, 2016 has been prepared in compliance with the requirements of the Code of Corporate Governance applicable as on March 31, 2016 and fully describes the salient matters required to be disclosed.
13. The financial statements of the company were duly endorsed by CEO and CFO before approval of the Board.
14. The directors, CEO and executives do not hold any interest in the shares of the company other than that disclosed in the pattern of shareholding.
15. The company has complied with all the corporate and financial reporting requirements of the Code of Corporate Governance.
16. The Board has formed an Audit Committee. It comprises of five members including one independent director and four non-executive directors including Chairman.
17. The meetings of the Audit Committee were held at least once every quarter prior to the approval of interim and final results of the company as required by the Code. The Board has already approved the terms of references of the committee & advised to the Committee for compliance.
18. The Board has formed a HR and Remuneration Committee. It comprises of five members, of whom three are non-executive directors and the
Chairman of the Committee is a Non-Executive director.
19. The board has set up an effective internal audit function manned by suitably qualified and experienced personnel who are conversant with the policies and procedures of the company and are involved in the internal audit function on full time basis.
20. The statutory auditors of the company have confirmed that they have been given a satisfactory rating under the quality control review program of the Institute of Chartered Accountants of Pakistan (ICAP), that they or any of the partners of the firm, their spouses and minor children do not hold shares of the company and that the firm and all its partners are in compliance with International Federation of Accountants (IFAC) guidelines on Code of ethics as adopted by Institute of Chartered Accountants of Pakistan (ICAP).
21. The statutory auditors or the persons associated with them have not been appointed to provide other services except in accordance with the listing regulations and the auditors have confirmed that they have observed IFAC guidelines in this regard.
22. The ‘closed period’, prior to the announcement of interim / final results and business decisions which may materially affect the market price of company’s securities, was determined and intimated to directors, employees and stock exchange(s).
23. Material/price sensitive information has been disseminated among all market participants at once through stock exchange(s).
24. We confirm that all other material principles enshrined in the Code of Corporate Governance 2012 have been complied with.
TOICHI ISHIYAMAPresident/CEO
Lahore, May 6, 2016
Auditors' Review Report to the MembersON STATEMENT OF COMPLIANCE WITH THE CODE OF CORPORATE GOVERNANCE
We have reviewed the enclosed Statement of Compliance with the best practices contained in the Code of Corporate Governance (the ‘Code’) prepared by the Board of Directors of Honda Atlas Cars (Pakistan) Limited (the ‘Company’) for the year ended March 31, 2016 to comply with the requirements of Listing Regulation No. 35 of the Pakistani Stock Exchange Limited where the Company is listed.
The responsibility for compliance with the Code is that of the Board of Directors of the Company. Our responsibility is to review, to the extent where such compliance can be objectively verified, whether the Statement of Compliance reflects the status of the Company’s compliance with the provisions of the Code and report if it does not and to highlight any non-compliance with the requirements of the Code. A review is limited primarily to inquiries of the Company’s personnel and review of various documents prepared by the Company to comply with the Code.
As a part of our audit of the financial statements we are required to obtain an understanding of the accounting and internal control systems sufficient to plan the audit and develop an effective audit approach. We are not required to consider whether the Board of Directors’ statement on internal control covers all risks and controls or to form an opinion on the effectiveness of such internal controls, the Company’s corporate governance procedures and risks.
The Code requires the Company to place before the Audit Committee, and upon recommendation of the Audit Committee, place before the Board of Directors for their review and approval its related party transactions distinguishing between transactions carried out on terms equivalent to those that prevail in arm’s length transactions and transactions which are not executed at arm’s length price and recording proper justification for using such alternate pricing mechanism. We are only required and have ensured compliance of this requirement to the extent of the approval of the related party transactions by the Board of Directors upon recommendation of the Audit Committee. We have not carried out any procedures to determine whether the related party transactions were undertaken at arm’s length price or not.
Based on our review, nothing has come to our attention which causes us to believe that the Statement of Compliance does not appropriately reflect the Company’s compliance, in all material respects, with the best practices contained in the Code as applicable to the Company for the year ended March 31, 2016.
A. F. FERGUSON & CO.Chartered Accountants
Lahore : May 16, 2016
Engagement Partner: Amer Raza Mir
1 2 3 54Management /Company’s Structure
Auditors’ Report & AccountsReview Reports Financial Highlights Notice of Meeting 1 2 3 54Management /
Company’s StructureAuditors’ Report & AccountsReview Reports Financial Highlights Notice of Meeting
38
39Annual Report 2016
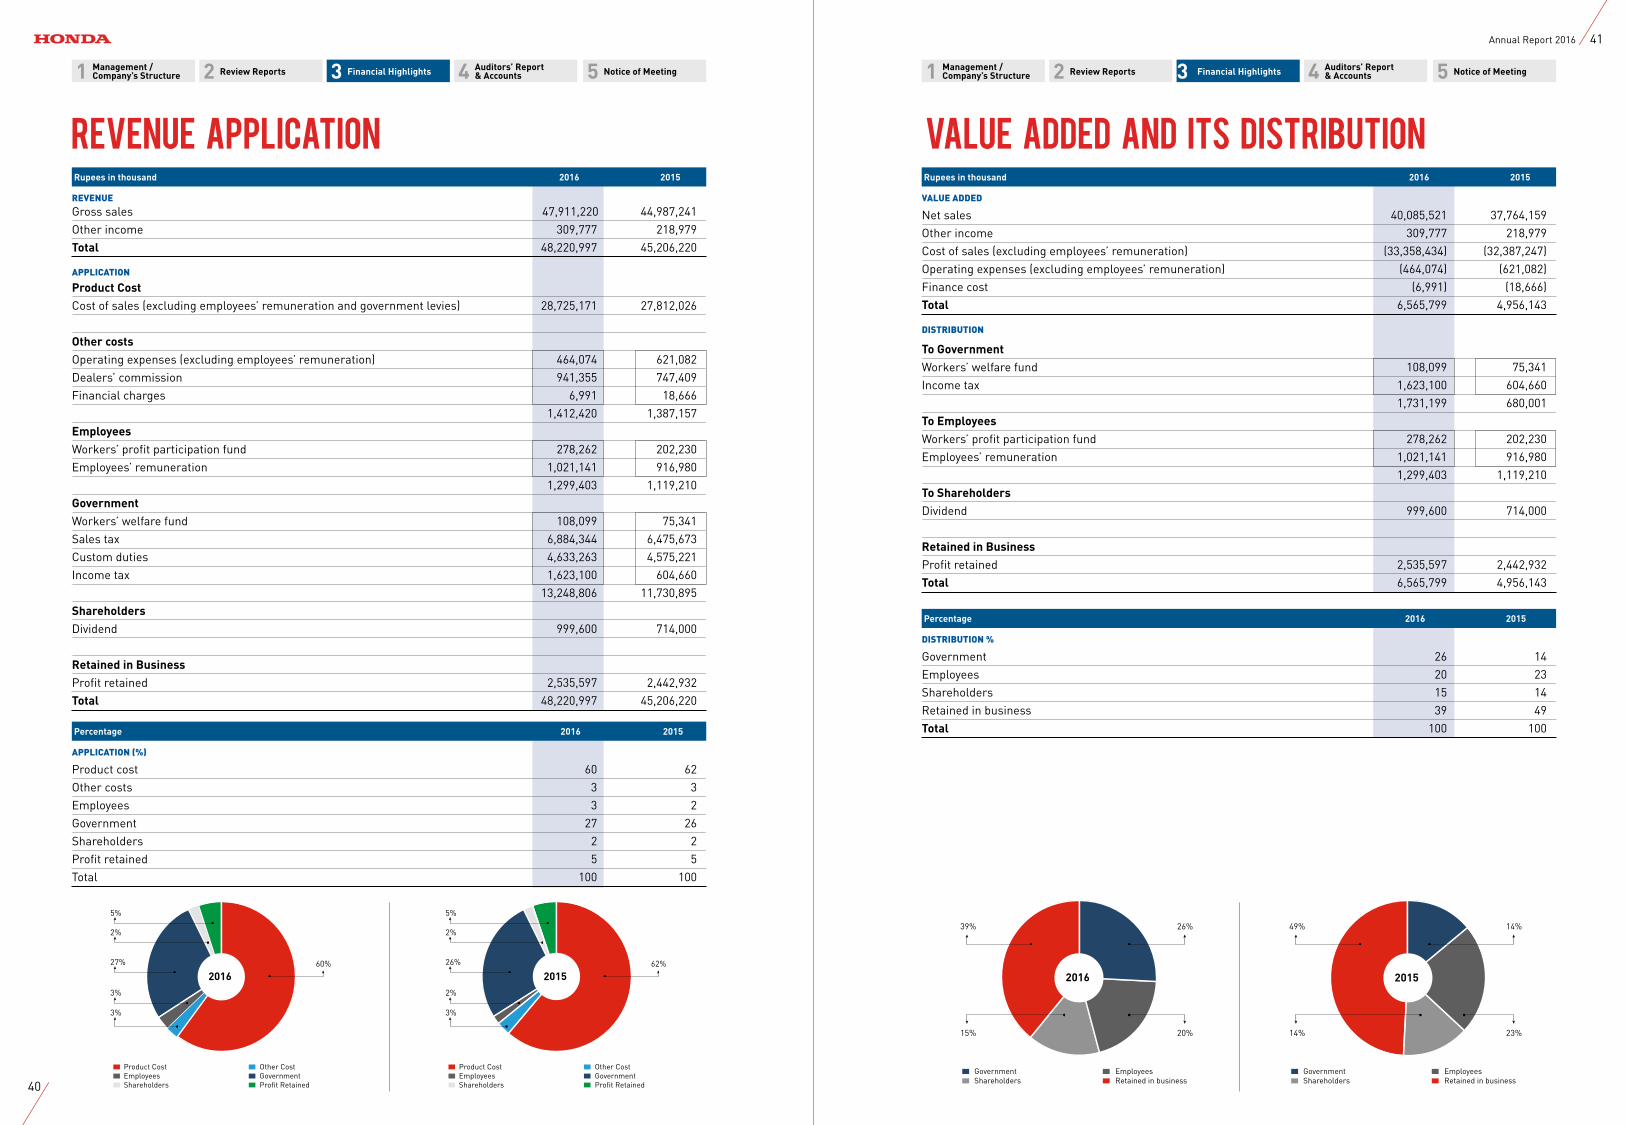
Rupees in thousand 2016 2015
REVENUE
Gross sales 47,911,220 44,987,241 Other income 309,777 218,979 Total 48,220,997 45,206,220
APPLICATION
Product Cost Cost of sales (excluding employees’ remuneration and government levies) 28,725,171 27,812,026
Other costs Operating expenses (excluding employees’ remuneration) 464,074 621,082 Dealers’ commission 941,355 747,409 Financial charges 6,991 18,666 1,412,420 1,387,157 Employees Workers’ profit participation fund 278,262 202,230 Employees’ remuneration 1,021,141 916,980 1,299,403 1,119,210 Government Workers’ welfare fund 108,099 75,341 Sales tax 6,884,344 6,475,673 Custom duties 4,633,263 4,575,221 Income tax 1,623,100 604,660 13,248,806 11,730,895 Shareholders Dividend 999,600 714,000
Retained in Business Profit retained 2,535,597 2,442,932 Total 48,220,997 45,206,220
Percentage 2016 2015
APPLICATION (%)
Product cost 60 62Other costs 3 3Employees 3 2Government 27 26Shareholders 2 2Profit retained 5 5Total 100 100
Value Added and its Distribution Rupees in thousand 2016 2015
VALUE ADDED
Net sales 40,085,521 37,764,159 Other income 309,777 218,979 Cost of sales (excluding employees’ remuneration) (33,358,434) (32,387,247)Operating expenses (excluding employees’ remuneration) (464,074) (621,082)Finance cost (6,991) (18,666)Total 6,565,799 4,956,143
DISTRIBUTION
To Government Workers’ welfare fund 108,099 75,341 Income tax 1,623,100 604,660 1,731,199 680,001 To Employees Workers’ profit participation fund 278,262 202,230 Employees’ remuneration 1,021,141 916,980 1,299,403 1,119,210 To Shareholders Dividend 999,600 714,000
Retained in Business Profit retained 2,535,597 2,442,932 Total 6,565,799 4,956,143
Percentage 2016 2015
DISTRIBUTION %
Government 26 14Employees 20 23Shareholders 15 14Retained in business 39 49Total 100 100
1 2 3 54Management /Company’s Structure
Auditors’ Report & AccountsReview Reports Financial Highlights Notice of Meeting1 2 3 54Management /
Company’s StructureAuditors’ Report & AccountsReview Reports Financial Highlights Notice of Meeting
Revenue Application
Government EmployeesShareholders Retained in business
26%39%
2016
20%15%
2015
Government EmployeesShareholders Retained in business
14%49%
23%14%
Product Cost Other CostEmployees Government Shareholders Profit Retained
60%
2016
5%
2%
27%
3%
3%
Product Cost Other CostEmployees Government Shareholders Profit Retained
62%
2015
5%
2%
26%
2%
3%
40
41Annual Report 2016
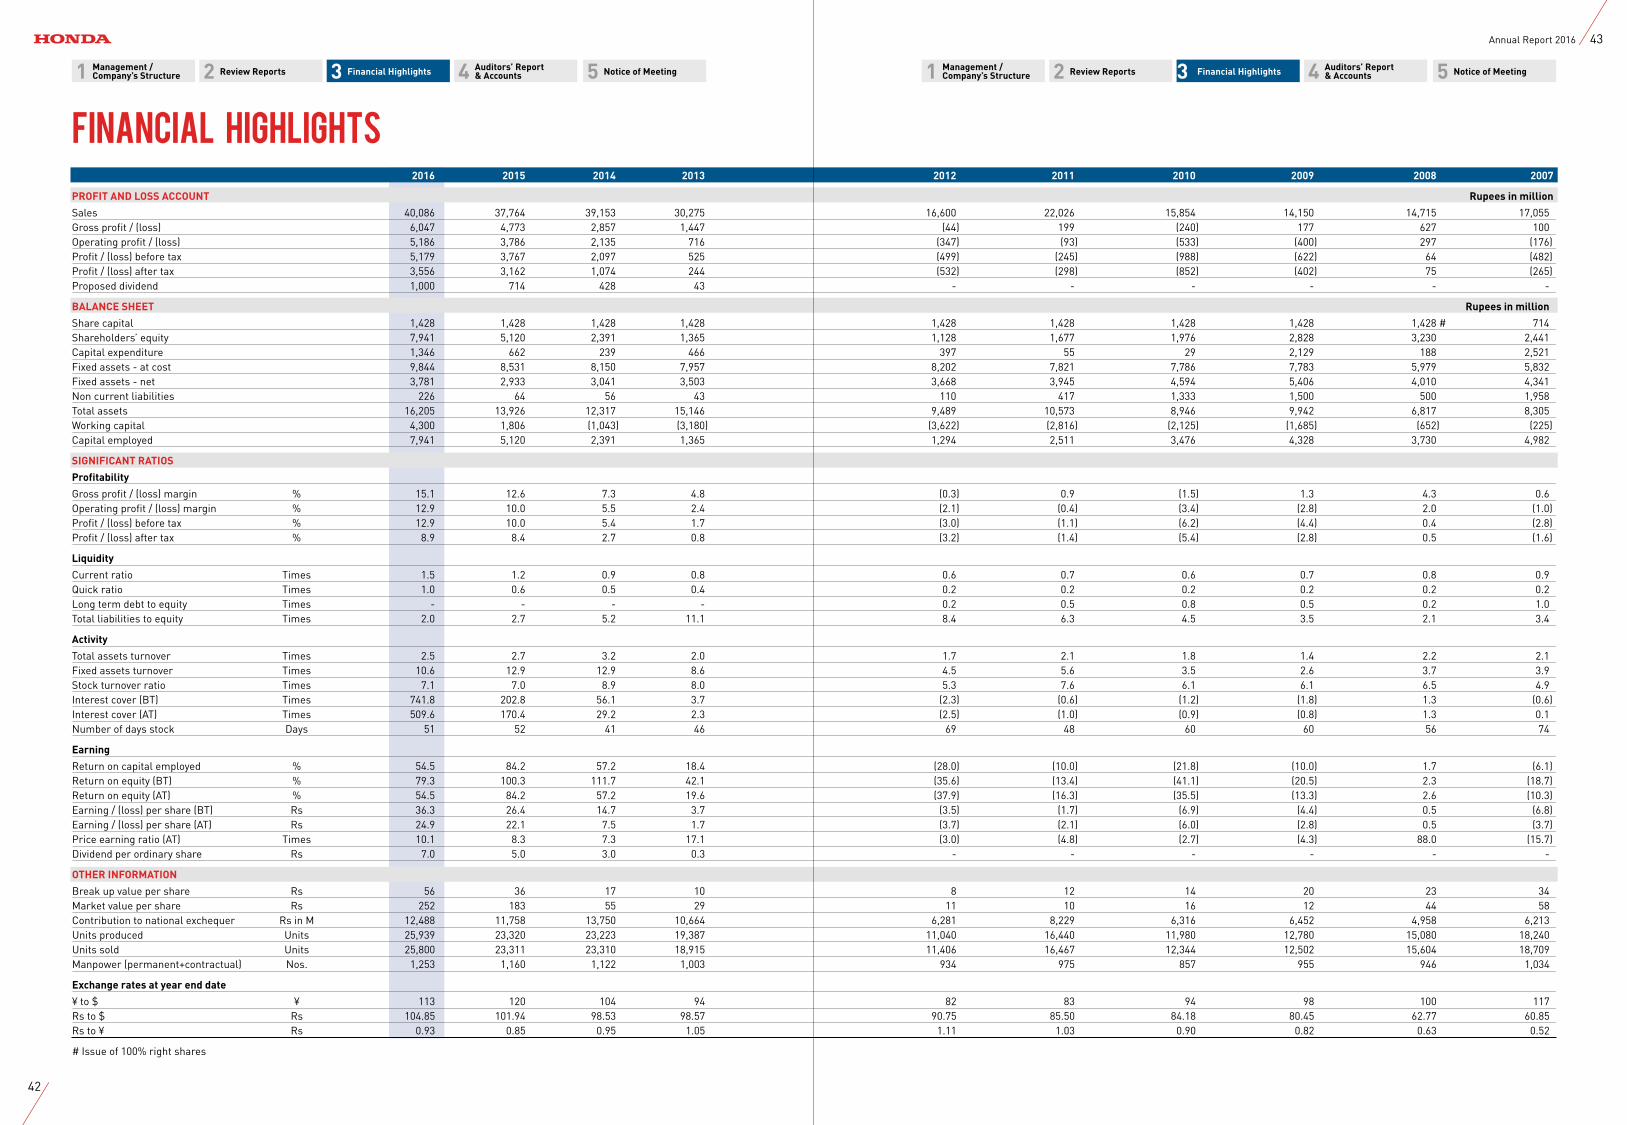
2016 2015 2014 2013 2012 2011 2010 2009 2008 2007
PROFIT AND LOSS ACCOUNT Rupees in million
Sales 40,086 37,764 39,153 30,275 16,600 22,026 15,854 14,150 14,715 17,055 Gross profit / (loss) 6,047 4,773 2,857 1,447 (44) 199 (240) 177 627 100 Operating profit / (loss) 5,186 3,786 2,135 716 (347) (93) (533) (400) 297 (176)Profit / (loss) before tax 5,179 3,767 2,097 525 (499) (245) (988) (622) 64 (482)Profit / (loss) after tax 3,556 3,162 1,074 244 (532) (298) (852) (402) 75 (265)Proposed dividend 1,000 714 428 43 - - - - - -
BALANCE SHEET Rupees in million
Share capital 1,428 1,428 1,428 1,428 1,428 1,428 1,428 1,428 1,428 # 714 Shareholders’ equity 7,941 5,120 2,391 1,365 1,128 1,677 1,976 2,828 3,230 2,441 Capital expenditure 1,346 662 239 466 397 55 29 2,129 188 2,521 Fixed assets - at cost 9,844 8,531 8,150 7,957 8,202 7,821 7,786 7,783 5,979 5,832 Fixed assets - net 3,781 2,933 3,041 3,503 3,668 3,945 4,594 5,406 4,010 4,341 Non current liabilities 226 64 56 43 110 417 1,333 1,500 500 1,958 Total assets 16,205 13,926 12,317 15,146 9,489 10,573 8,946 9,942 6,817 8,305 Working capital 4,300 1,806 (1,043) (3,180) (3,622) (2,816) (2,125) (1,685) (652) (225)Capital employed 7,941 5,120 2,391 1,365 1,294 2,511 3,476 4,328 3,730 4,982
SIGNIFICANT RATIOS
Profitability
Gross profit / (loss) margin % 15.1 12.6 7.3 4.8 (0.3) 0.9 (1.5) 1.3 4.3 0.6 Operating profit / (loss) margin % 12.9 10.0 5.5 2.4 (2.1) (0.4) (3.4) (2.8) 2.0 (1.0)Profit / (loss) before tax % 12.9 10.0 5.4 1.7 (3.0) (1.1) (6.2) (4.4) 0.4 (2.8)Profit / (loss) after tax % 8.9 8.4 2.7 0.8 (3.2) (1.4) (5.4) (2.8) 0.5 (1.6)
Liquidity
Current ratio Times 1.5 1.2 0.9 0.8 0.6 0.7 0.6 0.7 0.8 0.9 Quick ratio Times 1.0 0.6 0.5 0.4 0.2 0.2 0.2 0.2 0.2 0.2 Long term debt to equity Times - - - - 0.2 0.5 0.8 0.5 0.2 1.0 Total liabilities to equity Times 2.0 2.7 5.2 11.1 8.4 6.3 4.5 3.5 2.1 3.4
Activity
Total assets turnover Times 2.5 2.7 3.2 2.0 1.7 2.1 1.8 1.4 2.2 2.1 Fixed assets turnover Times 10.6 12.9 12.9 8.6 4.5 5.6 3.5 2.6 3.7 3.9 Stock turnover ratio Times 7.1 7.0 8.9 8.0 5.3 7.6 6.1 6.1 6.5 4.9 Interest cover (BT) Times 741.8 202.8 56.1 3.7 (2.3) (0.6) (1.2) (1.8) 1.3 (0.6)Interest cover (AT) Times 509.6 170.4 29.2 2.3 (2.5) (1.0) (0.9) (0.8) 1.3 0.1 Number of days stock Days 51 52 41 46 69 48 60 60 56 74
Earning
Return on capital employed % 54.5 84.2 57.2 18.4 (28.0) (10.0) (21.8) (10.0) 1.7 (6.1)Return on equity (BT) % 79.3 100.3 111.7 42.1 (35.6) (13.4) (41.1) (20.5) 2.3 (18.7)Return on equity (AT) % 54.5 84.2 57.2 19.6 (37.9) (16.3) (35.5) (13.3) 2.6 (10.3)Earning / (loss) per share (BT) Rs 36.3 26.4 14.7 3.7 (3.5) (1.7) (6.9) (4.4) 0.5 (6.8)Earning / (loss) per share (AT) Rs 24.9 22.1 7.5 1.7 (3.7) (2.1) (6.0) (2.8) 0.5 (3.7)Price earning ratio (AT) Times 10.1 8.3 7.3 17.1 (3.0) (4.8) (2.7) (4.3) 88.0 (15.7)Dividend per ordinary share Rs 7.0 5.0 3.0 0.3 - - - - - -
OTHER INFORMATION
Break up value per share Rs 56 36 17 10 8 12 14 20 23 34 Market value per share Rs 252 183 55 29 11 10 16 12 44 58 Contribution to national exchequer Rs in M 12,488 11,758 13,750 10,664 6,281 8,229 6,316 6,452 4,958 6,213 Units produced Units 25,939 23,320 23,223 19,387 11,040 16,440 11,980 12,780 15,080 18,240 Units sold Units 25,800 23,311 23,310 18,915 11,406 16,467 12,344 12,502 15,604 18,709 Manpower (permanent+contractual) Nos. 1,253 1,160 1,122 1,003 934 975 857 955 946 1,034
Exchange rates at year end date
¥ to $ ¥ 113 120 104 94 82 83 94 98 100 117 Rs to $ Rs 104.85 101.94 98.53 98.57 90.75 85.50 84.18 80.45 62.77 60.85 Rs to ¥ Rs 0.93 0.85 0.95 1.05 1.11 1.03 0.90 0.82 0.63 0.52
# Issue of 100% right shares
Financial Highlights
1 2 3 54Management /Company’s Structure
Auditors’ Report & AccountsReview Reports Financial Highlights Notice of Meeting1 2 3 54Management /
Company’s StructureAuditors’ Report & AccountsReview Reports Financial Highlights Notice of Meeting
42
43Annual Report 2016
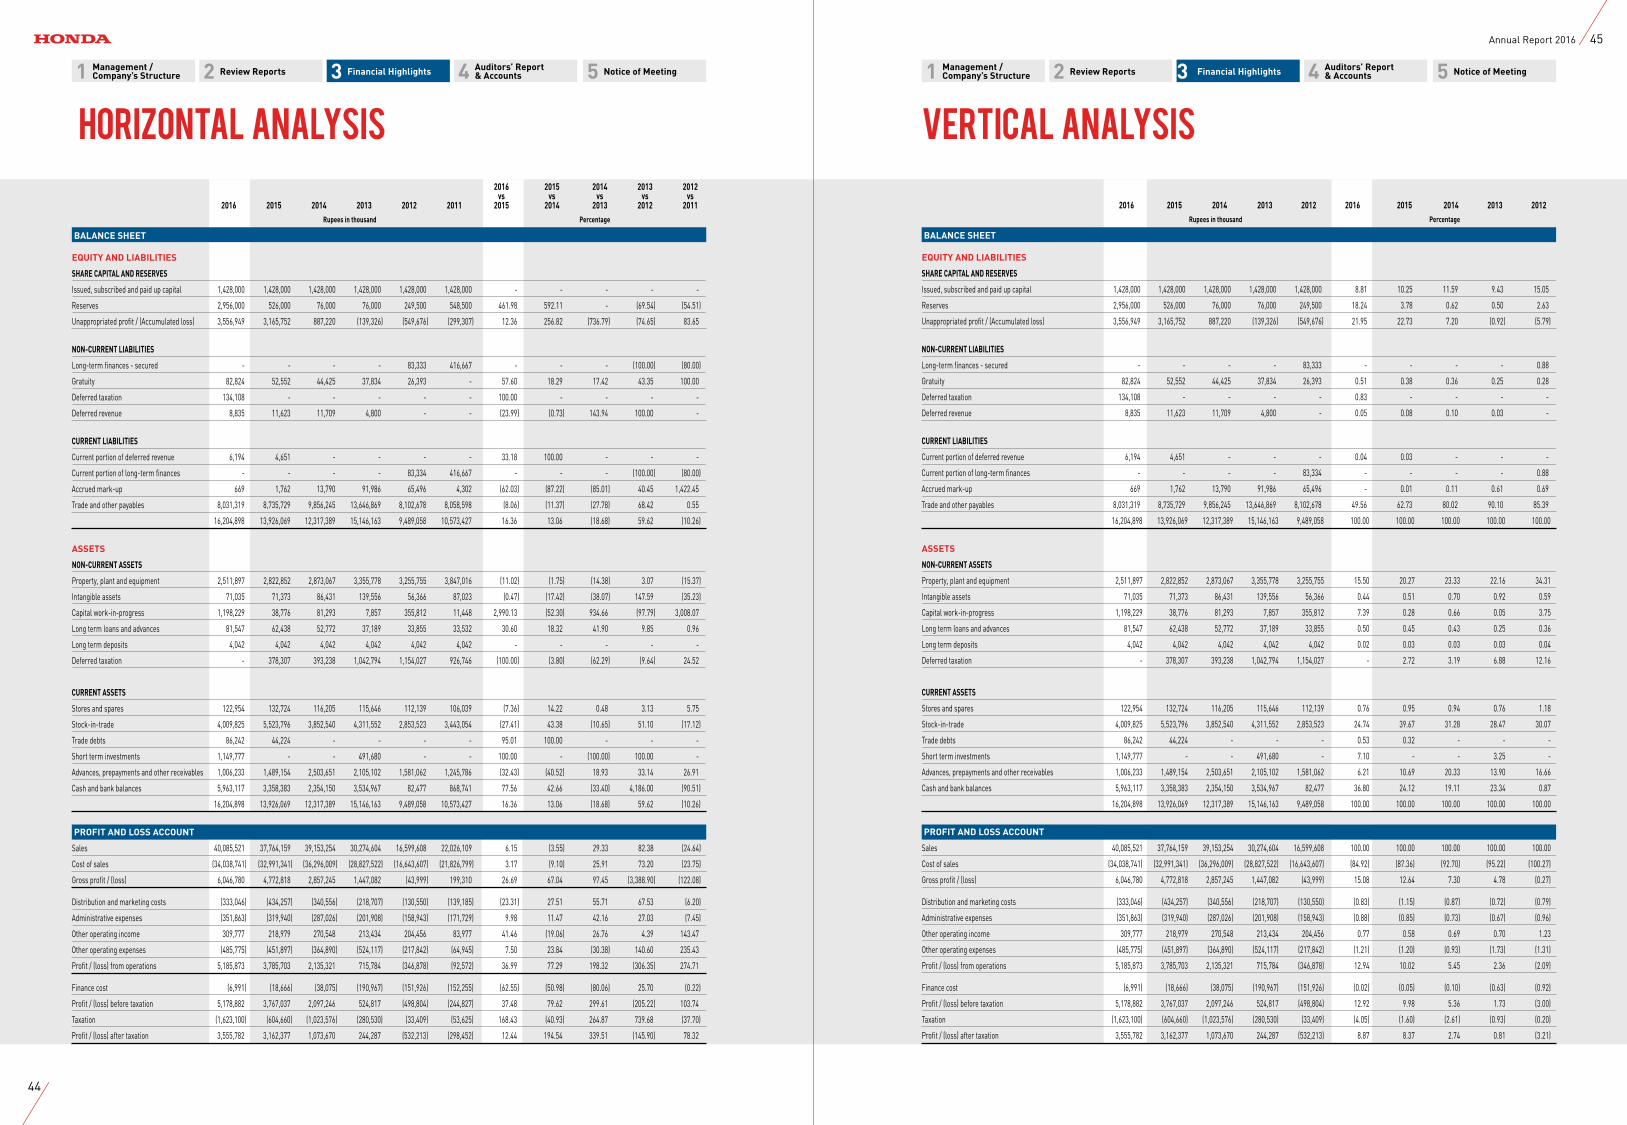
Vertical Analysis 2016 2015 2014 2013 2012 vs vs vs vs vs 2016 2015 2014 2013 2012 2011 2015 2014 2013 2012 2011 Rupees in thousand Percentage
BALANCE SHEET
EQUITY AND LIABILITIES
SHARE CAPITAL AND RESERVES
Issued, subscribed and paid up capital 1,428,000 1,428,000 1,428,000 1,428,000 1,428,000 1,428,000 - - - - -
Reserves 2,956,000 526,000 76,000 76,000 249,500 548,500 461.98 592.11 - (69.54) (54.51)
Unappropriated profit / (Accumulated loss) 3,556,949 3,165,752 887,220 (139,326) (549,676) (299,307) 12.36 256.82 (736.79) (74.65) 83.65
NON-CURRENT LIABILITIES
Long-term finances - secured - - - - 83,333 416,667 - - - (100.00) (80.00)
Gratuity 82,824 52,552 44,425 37,834 26,393 - 57.60 18.29 17.42 43.35 100.00
Deferred taxation 134,108 - - - - - 100.00 - - - -
Deferred revenue 8,835 11,623 11,709 4,800 - - (23.99) (0.73) 143.94 100.00 -
CURRENT LIABILITIES
Current portion of deferred revenue 6,194 4,651 - - - - 33.18 100.00 - - -
Current portion of long-term finances - - - - 83,334 416,667 - - - (100.00) (80.00)
Accrued mark-up 669 1,762 13,790 91,986 65,496 4,302 (62.03) (87.22) (85.01) 40.45 1,422.45
Trade and other payables 8,031,319 8,735,729 9,856,245 13,646,869 8,102,678 8,058,598 (8.06) (11.37) (27.78) 68.42 0.55
16,204,898 13,926,069 12,317,389 15,146,163 9,489,058 10,573,427 16.36 13.06 (18.68) 59.62 (10.26)
ASSETS
NON-CURRENT ASSETS
Property, plant and equipment 2,511,897 2,822,852 2,873,067 3,355,778 3,255,755 3,847,016 (11.02) (1.75) (14.38) 3.07 (15.37)
Intangible assets 71,035 71,373 86,431 139,556 56,366 87,023 (0.47) (17.42) (38.07) 147.59 (35.23)
Capital work-in-progress 1,198,229 38,776 81,293 7,857 355,812 11,448 2,990.13 (52.30) 934.66 (97.79) 3,008.07
Long term loans and advances 81,547 62,438 52,772 37,189 33,855 33,532 30.60 18.32 41.90 9.85 0.96
Long term deposits 4,042 4,042 4,042 4,042 4,042 4,042 - - - - -
Deferred taxation - 378,307 393,238 1,042,794 1,154,027 926,746 (100.00) (3.80) (62.29) (9.64) 24.52
CURRENT ASSETS
Stores and spares 122,954 132,724 116,205 115,646 112,139 106,039 (7.36) 14.22 0.48 3.13 5.75
Stock-in-trade 4,009,825 5,523,796 3,852,540 4,311,552 2,853,523 3,443,054 (27.41) 43.38 (10.65) 51.10 (17.12)
Trade debts 86,242 44,224 - - - - 95.01 100.00 - - -
Short term investments 1,149,777 - - 491,680 - - 100.00 - (100.00) 100.00 -
Advances, prepayments and other receivables 1,006,233 1,489,154 2,503,651 2,105,102 1,581,062 1,245,786 (32.43) (40.52) 18.93 33.14 26.91
Cash and bank balances 5,963,117 3,358,383 2,354,150 3,534,967 82,477 868,741 77.56 42.66 (33.40) 4,186.00 (90.51)
16,204,898 13,926,069 12,317,389 15,146,163 9,489,058 10,573,427 16.36 13.06 (18.68) 59.62 (10.26)
PROFIT AND LOSS ACCOUNT
Sales 40,085,521 37,764,159 39,153,254 30,274,604 16,599,608 22,026,109 6.15 (3.55) 29.33 82.38 (24.64)
Cost of sales (34,038,741) (32,991,341) (36,296,009) (28,827,522) (16,643,607) (21,826,799) 3.17 (9.10) 25.91 73.20 (23.75)
Gross profit / (loss) 6,046,780 4,772,818 2,857,245 1,447,082 (43,999) 199,310 26.69 67.04 97.45 (3,388.90) (122.08)
Distribution and marketing costs (333,046) (434,257) (340,556) (218,707) (130,550) (139,185) (23.31) 27.51 55.71 67.53 (6.20)
Administrative expenses (351,863) (319,940) (287,026) (201,908) (158,943) (171,729) 9.98 11.47 42.16 27.03 (7.45)
Other operating income 309,777 218,979 270,548 213,434 204,456 83,977 41.46 (19.06) 26.76 4.39 143.47
Other operating expenses (485,775) (451,897) (364,890) (524,117) (217,842) (64,945) 7.50 23.84 (30.38) 140.60 235.43
Profit / (loss) from operations 5,185,873 3,785,703 2,135,321 715,784 (346,878) (92,572) 36.99 77.29 198.32 (306.35) 274.71
Finance cost (6,991) (18,666) (38,075) (190,967) (151,926) (152,255) (62.55) (50.98) (80.06) 25.70 (0.22)
Profit / (loss) before taxation 5,178,882 3,767,037 2,097,246 524,817 (498,804) (244,827) 37.48 79.62 299.61 (205.22) 103.74
Taxation (1,623,100) (604,660) (1,023,576) (280,530) (33,409) (53,625) 168.43 (40.93) 264.87 739.68 (37.70)
Profit / (loss) after taxation 3,555,782 3,162,377 1,073,670 244,287 (532,213) (298,452) 12.44 194.54 339.51 (145.90) 78.32
2016 2015 2014 2013 2012 2016 2015 2014 2013 2012 Rupees in thousand Percentage
BALANCE SHEET
EQUITY AND LIABILITIES
SHARE CAPITAL AND RESERVES
Issued, subscribed and paid up capital 1,428,000 1,428,000 1,428,000 1,428,000 1,428,000 8.81 10.25 11.59 9.43 15.05
Reserves 2,956,000 526,000 76,000 76,000 249,500 18.24 3.78 0.62 0.50 2.63
Unappropriated profit / (Accumulated loss) 3,556,949 3,165,752 887,220 (139,326) (549,676) 21.95 22.73 7.20 (0.92) (5.79)
NON-CURRENT LIABILITIES
Long-term finances - secured - - - - 83,333 - - - - 0.88
Gratuity 82,824 52,552 44,425 37,834 26,393 0.51 0.38 0.36 0.25 0.28
Deferred taxation 134,108 - - - - 0.83 - - - -
Deferred revenue 8,835 11,623 11,709 4,800 - 0.05 0.08 0.10 0.03 -
CURRENT LIABILITIES
Current portion of deferred revenue 6,194 4,651 - - - 0.04 0.03 - - -
Current portion of long-term finances - - - - 83,334 - - - - 0.88
Accrued mark-up 669 1,762 13,790 91,986 65,496 - 0.01 0.11 0.61 0.69
Trade and other payables 8,031,319 8,735,729 9,856,245 13,646,869 8,102,678 49.56 62.73 80.02 90.10 85.39
16,204,898 13,926,069 12,317,389 15,146,163 9,489,058 100.00 100.00 100.00 100.00 100.00
ASSETS
NON-CURRENT ASSETS
Property, plant and equipment 2,511,897 2,822,852 2,873,067 3,355,778 3,255,755 15.50 20.27 23.33 22.16 34.31
Intangible assets 71,035 71,373 86,431 139,556 56,366 0.44 0.51 0.70 0.92 0.59
Capital work-in-progress 1,198,229 38,776 81,293 7,857 355,812 7.39 0.28 0.66 0.05 3.75
Long term loans and advances 81,547 62,438 52,772 37,189 33,855 0.50 0.45 0.43 0.25 0.36
Long term deposits 4,042 4,042 4,042 4,042 4,042 0.02 0.03 0.03 0.03 0.04
Deferred taxation - 378,307 393,238 1,042,794 1,154,027 - 2.72 3.19 6.88 12.16
CURRENT ASSETS
Stores and spares 122,954 132,724 116,205 115,646 112,139 0.76 0.95 0.94 0.76 1.18
Stock-in-trade 4,009,825 5,523,796 3,852,540 4,311,552 2,853,523 24.74 39.67 31.28 28.47 30.07
Trade debts 86,242 44,224 - - - 0.53 0.32 - - -
Short term investments 1,149,777 - - 491,680 - 7.10 - - 3.25 -
Advances, prepayments and other receivables 1,006,233 1,489,154 2,503,651 2,105,102 1,581,062 6.21 10.69 20.33 13.90 16.66
Cash and bank balances 5,963,117 3,358,383 2,354,150 3,534,967 82,477 36.80 24.12 19.11 23.34 0.87
16,204,898 13,926,069 12,317,389 15,146,163 9,489,058 100.00 100.00 100.00 100.00 100.00
PROFIT AND LOSS ACCOUNT
Sales 40,085,521 37,764,159 39,153,254 30,274,604 16,599,608 100.00 100.00 100.00 100.00 100.00
Cost of sales (34,038,741) (32,991,341) (36,296,009) (28,827,522) (16,643,607) (84.92) (87.36) (92.70) (95.22) (100.27)
Gross profit / (loss) 6,046,780 4,772,818 2,857,245 1,447,082 (43,999) 15.08 12.64 7.30 4.78 (0.27)
Distribution and marketing costs (333,046) (434,257) (340,556) (218,707) (130,550) (0.83) (1.15) (0.87) (0.72) (0.79)
Administrative expenses (351,863) (319,940) (287,026) (201,908) (158,943) (0.88) (0.85) (0.73) (0.67) (0.96)
Other operating income 309,777 218,979 270,548 213,434 204,456 0.77 0.58 0.69 0.70 1.23
Other operating expenses (485,775) (451,897) (364,890) (524,117) (217,842) (1.21) (1.20) (0.93) (1.73) (1.31)
Profit / (loss) from operations 5,185,873 3,785,703 2,135,321 715,784 (346,878) 12.94 10.02 5.45 2.36 (2.09)
Finance cost (6,991) (18,666) (38,075) (190,967) (151,926) (0.02) (0.05) (0.10) (0.63) (0.92)
Profit / (loss) before taxation 5,178,882 3,767,037 2,097,246 524,817 (498,804) 12.92 9.98 5.36 1.73 (3.00)
Taxation (1,623,100) (604,660) (1,023,576) (280,530) (33,409) (4.05) (1.60) (2.61) (0.93) (0.20)
Profit / (loss) after taxation 3,555,782 3,162,377 1,073,670 244,287 (532,213) 8.87 8.37 2.74 0.81 (3.21)
Horizontal Analysis
1 2 3 54Management /Company’s Structure
Auditors’ Report & AccountsReview Reports Financial Highlights Notice of Meeting1 2 3 54Management /
Company’s StructureAuditors’ Report & AccountsReview Reports Financial Highlights Notice of Meeting
44
45Annual Report 2016
Financial StatementsFOR THE YEAR ENDED MARCH 31, 2016
46
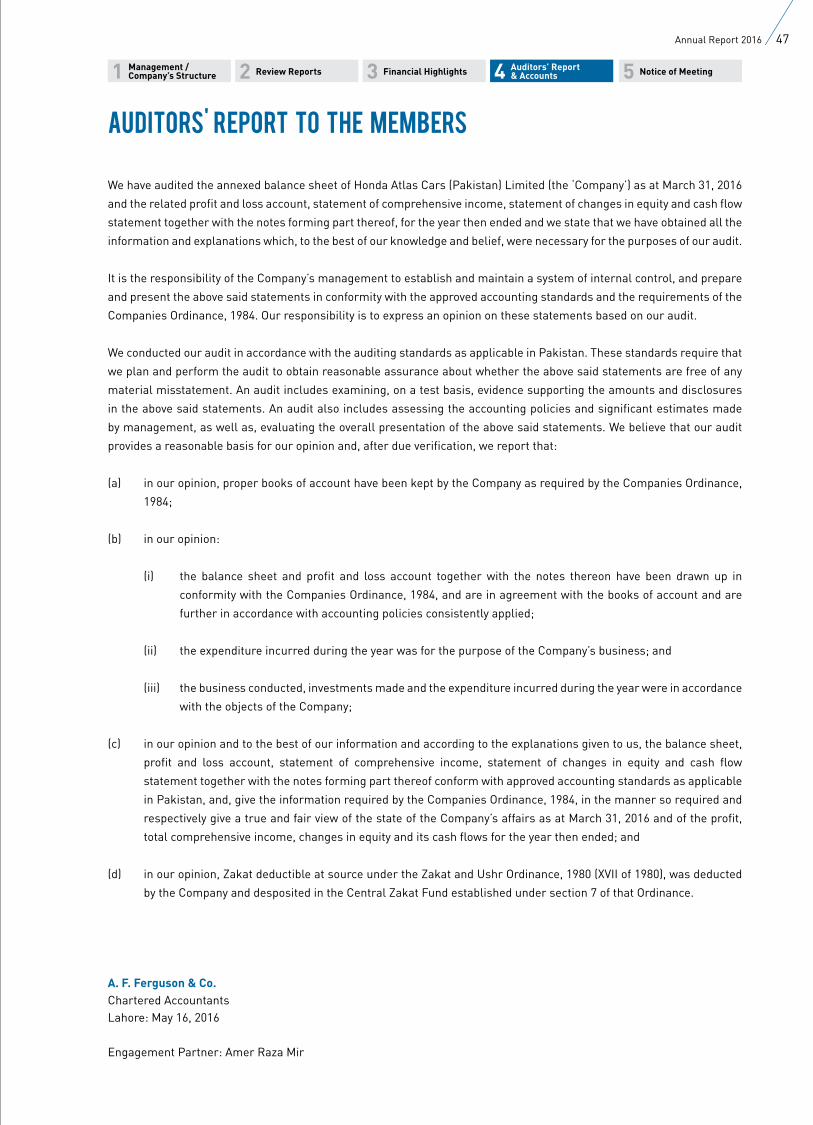
1 2 3 54Management /Company’s Structure
Auditors’ Report & AccountsReview Reports Financial Highlights Notice of Meeting
We have audited the annexed balance sheet of Honda Atlas Cars (Pakistan) Limited (the ‘Company’) as at March 31, 2016
and the related profit and loss account, statement of comprehensive income, statement of changes in equity and cash flow
statement together with the notes forming part thereof, for the year then ended and we state that we have obtained all the
information and explanations which, to the best of our knowledge and belief, were necessary for the purposes of our audit.
It is the responsibility of the Company’s management to establish and maintain a system of internal control, and prepare
and present the above said statements in conformity with the approved accounting standards and the requirements of the
Companies Ordinance, 1984. Our responsibility is to express an opinion on these statements based on our audit.
We conducted our audit in accordance with the auditing standards as applicable in Pakistan. These standards require that
we plan and perform the audit to obtain reasonable assurance about whether the above said statements are free of any
material misstatement. An audit includes examining, on a test basis, evidence supporting the amounts and disclosures
in the above said statements. An audit also includes assessing the accounting policies and significant estimates made
by management, as well as, evaluating the overall presentation of the above said statements. We believe that our audit
provides a reasonable basis for our opinion and, after due verification, we report that:
(a) in our opinion, proper books of account have been kept by the Company as required by the Companies Ordinance,
1984;
(b) in our opinion:
(i) the balance sheet and profit and loss account together with the notes thereon have been drawn up in
conformity with the Companies Ordinance, 1984, and are in agreement with the books of account and are
further in accordance with accounting policies consistently applied;
(ii) the expenditure incurred during the year was for the purpose of the Company’s business; and
(iii) the business conducted, investments made and the expenditure incurred during the year were in accordance
with the objects of the Company;
(c) in our opinion and to the best of our information and according to the explanations given to us, the balance sheet,
profit and loss account, statement of comprehensive income, statement of changes in equity and cash flow
statement together with the notes forming part thereof conform with approved accounting standards as applicable
in Pakistan, and, give the information required by the Companies Ordinance, 1984, in the manner so required and
respectively give a true and fair view of the state of the Company’s affairs as at March 31, 2016 and of the profit,
total comprehensive income, changes in equity and its cash flows for the year then ended; and
(d) in our opinion, Zakat deductible at source under the Zakat and Ushr Ordinance, 1980 (XVII of 1980), was deducted
by the Company and desposited in the Central Zakat Fund established under section 7 of that Ordinance.
A. F. Ferguson & Co.Chartered AccountantsLahore: May 16, 2016
Engagement Partner: Amer Raza Mir
AUDITORS' REPORT TO THE MEMBERS
47Annual Report 2016
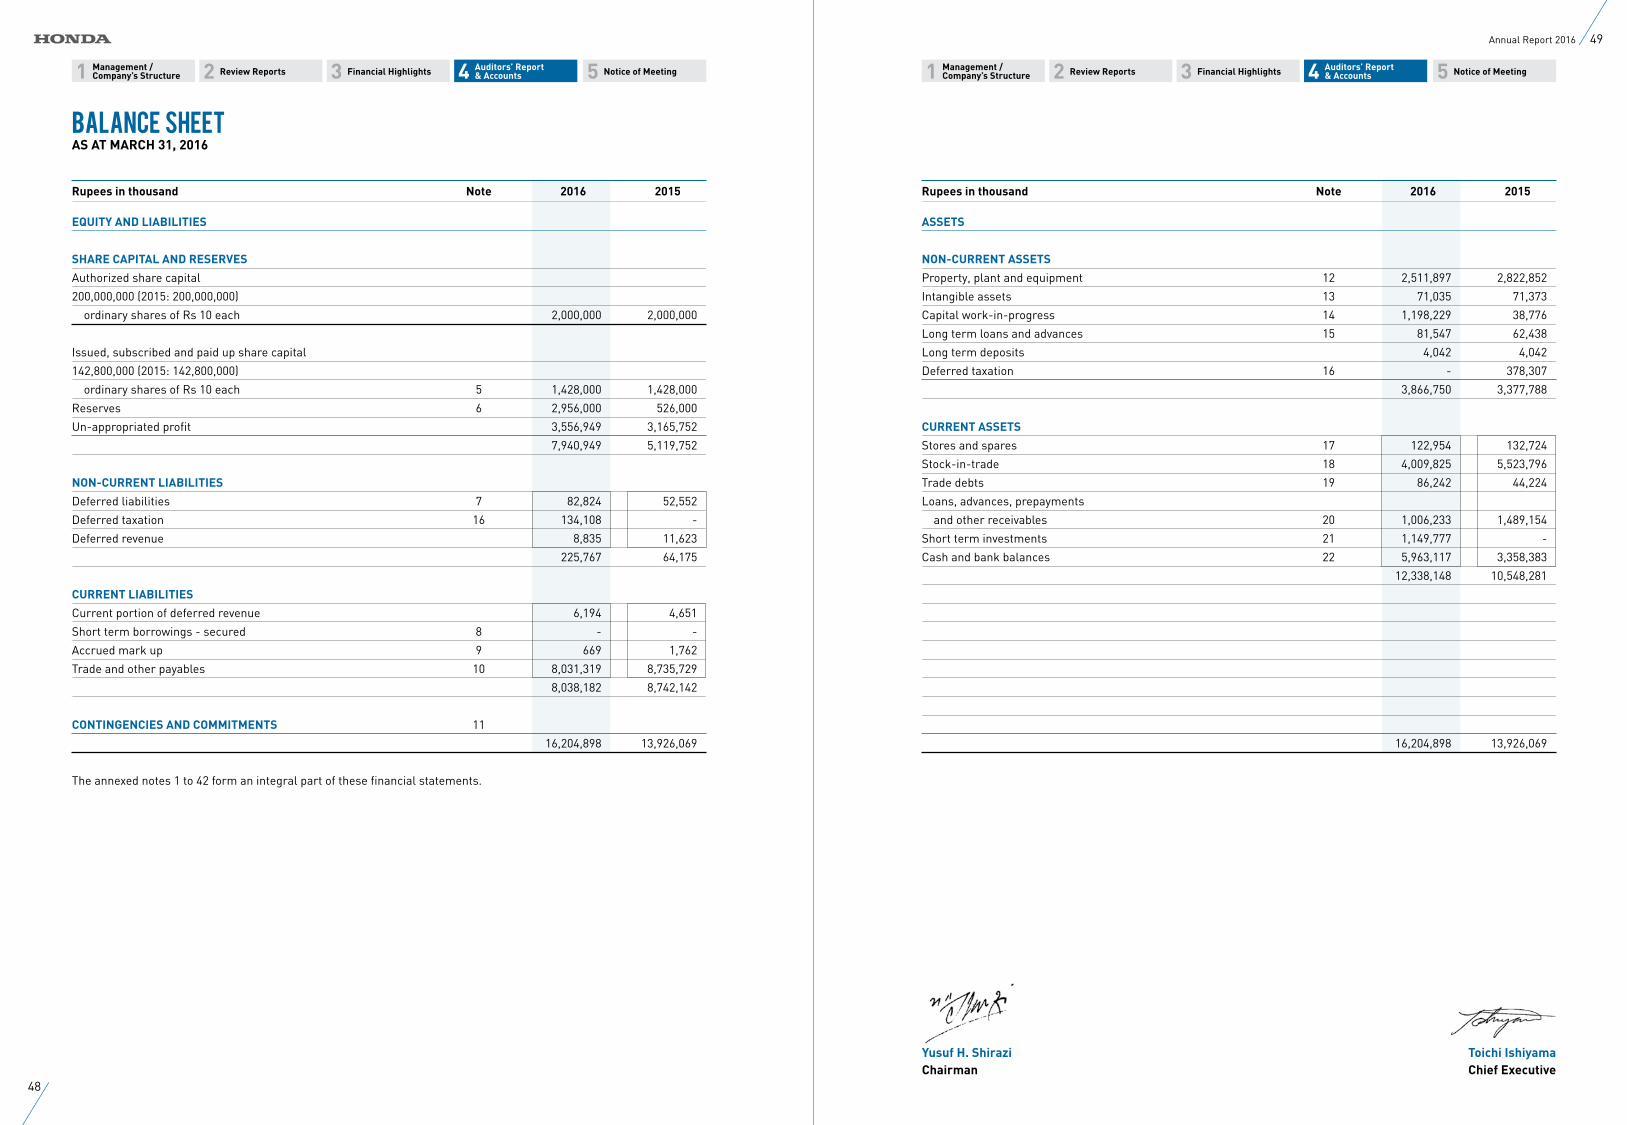
11 22 33 55 44 Management /Company’s Structure
Management /Company’s Structure
Auditors’ Report & Accounts
Auditors’ Report & Accounts Review ReportsReview Reports Financial HighlightsFinancial Highlights Notice of MeetingNotice of Meeting
Rupees in thousand Note 2016 2015
EQUITY AND LIABILITIES
SHARE CAPITAL AND RESERVES
Authorized share capital
200,000,000 (2015: 200,000,000)
ordinary shares of Rs 10 each 2,000,000 2,000,000
Issued, subscribed and paid up share capital
142,800,000 (2015: 142,800,000)
ordinary shares of Rs 10 each 5 1,428,000 1,428,000
Reserves 6 2,956,000 526,000
Un-appropriated profit 3,556,949 3,165,752
7,940,949 5,119,752
NON-CURRENT LIABILITIES
Deferred liabilities 7 82,824 52,552
Deferred taxation 16 134,108 -
Deferred revenue 8,835 11,623
225,767 64,175
CURRENT LIABILITIES
Current portion of deferred revenue 6,194 4,651
Short term borrowings - secured 8 - -
Accrued mark up 9 669 1,762
Trade and other payables 10 8,031,319 8,735,729
8,038,182 8,742,142
CONTINGENCIES AND COMMITMENTS 11
16,204,898 13,926,069
The annexed notes 1 to 42 form an integral part of these financial statements.
Rupees in thousand Note 2016 2015
ASSETS
NON-CURRENT ASSETS
Property, plant and equipment 12 2,511,897 2,822,852
Intangible assets 13 71,035 71,373
Capital work-in-progress 14 1,198,229 38,776
Long term loans and advances 15 81,547 62,438
Long term deposits 4,042 4,042
Deferred taxation 16 - 378,307
3,866,750 3,377,788
CURRENT ASSETS
Stores and spares 17 122,954 132,724
Stock-in-trade 18 4,009,825 5,523,796
Trade debts 19 86,242 44,224
Loans, advances, prepayments
and other receivables 20 1,006,233 1,489,154
Short term investments 21 1,149,777 -
Cash and bank balances 22 5,963,117 3,358,383
12,338,148 10,548,281
16,204,898 13,926,069
Yusuf H. Shirazi Toichi IshiyamaChairman Chief Executive
Balance SheetAS AT MARCH 31, 2016
48
49Annual Report 2016
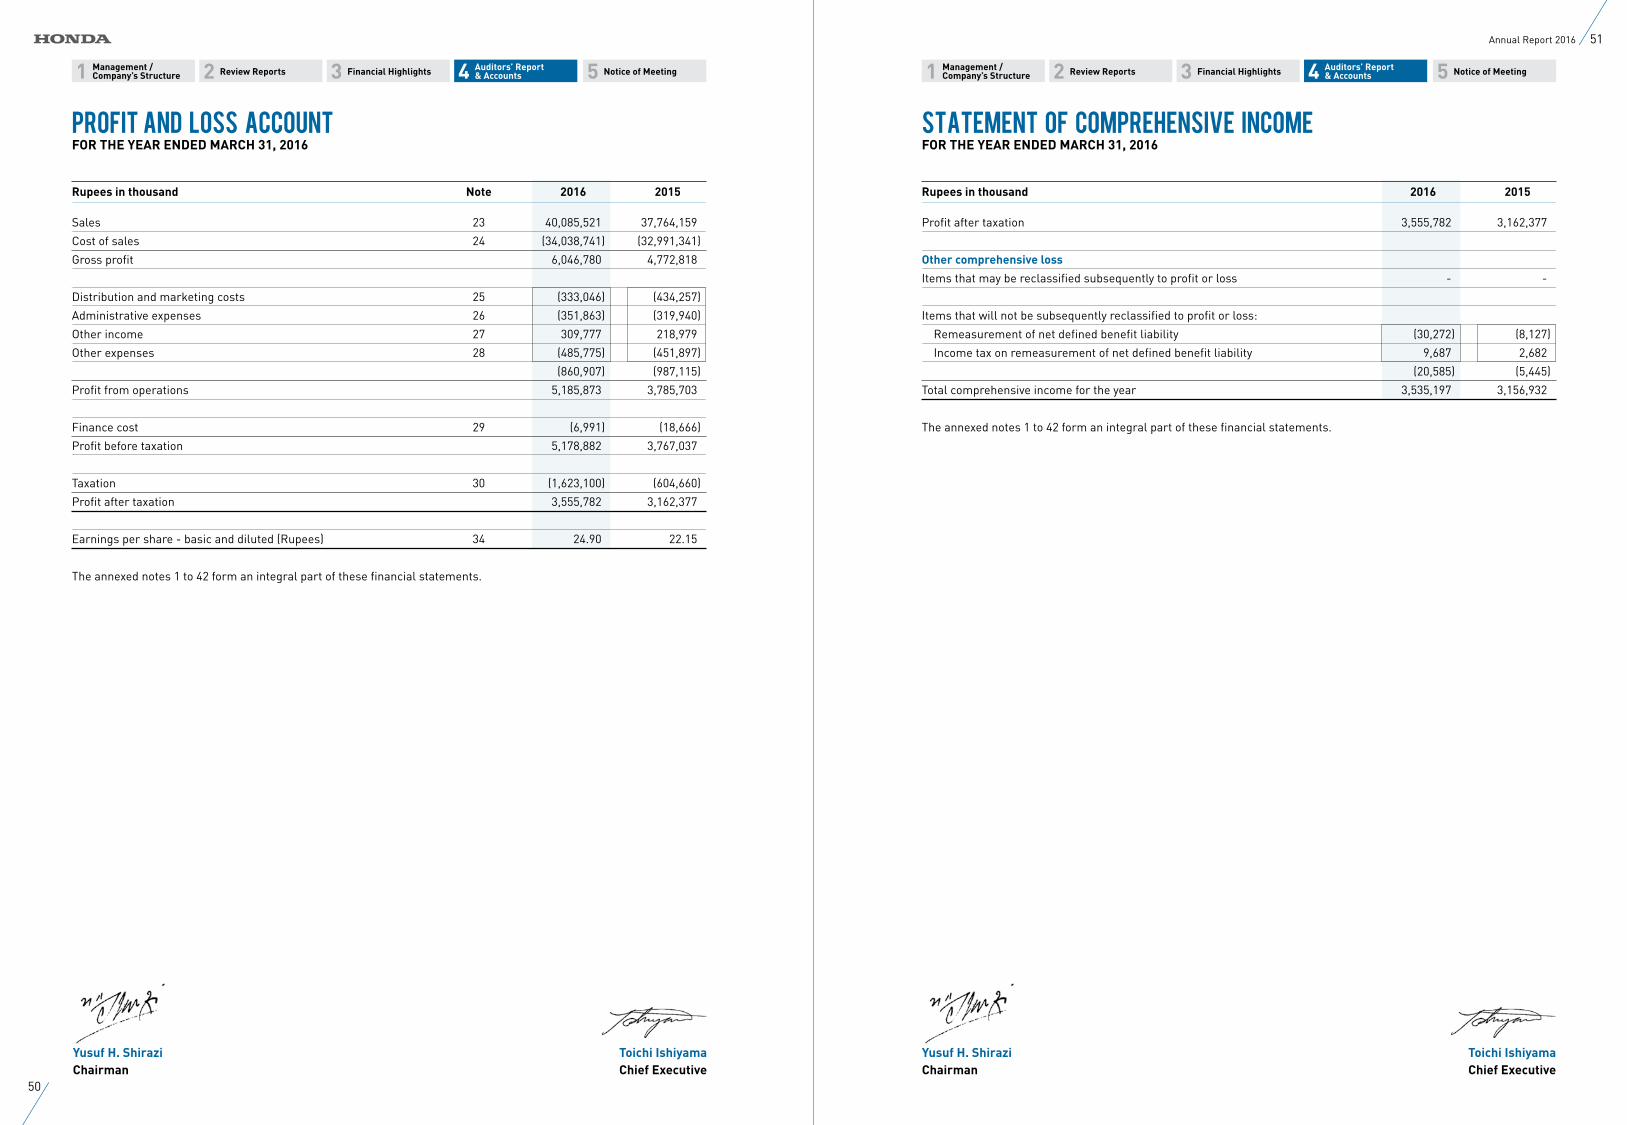
11 22 33 55 44 Management /Company’s Structure
Management /Company’s Structure
Auditors’ Report & Accounts
Auditors’ Report & Accounts Review ReportsReview Reports Financial HighlightsFinancial Highlights Notice of MeetingNotice of Meeting
Rupees in thousand Note 2016 2015
Sales 23 40,085,521 37,764,159
Cost of sales 24 (34,038,741) (32,991,341)
Gross profit 6,046,780 4,772,818
Distribution and marketing costs 25 (333,046) (434,257)
Administrative expenses 26 (351,863) (319,940)
Other income 27 309,777 218,979
Other expenses 28 (485,775) (451,897)
(860,907) (987,115)
Profit from operations 5,185,873 3,785,703
Finance cost 29 (6,991) (18,666)
Profit before taxation 5,178,882 3,767,037
Taxation 30 (1,623,100) (604,660)
Profit after taxation 3,555,782 3,162,377
Earnings per share - basic and diluted (Rupees) 34 24.90 22.15
The annexed notes 1 to 42 form an integral part of these financial statements.
Rupees in thousand 2016 2015
Profit after taxation 3,555,782 3,162,377
Other comprehensive loss
Items that may be reclassified subsequently to profit or loss - -
Items that will not be subsequently reclassified to profit or loss:
Remeasurement of net defined benefit liability (30,272) (8,127)
Income tax on remeasurement of net defined benefit liability 9,687 2,682
(20,585) (5,445)
Total comprehensive income for the year 3,535,197 3,156,932
The annexed notes 1 to 42 form an integral part of these financial statements.
Yusuf H. Shirazi Toichi IshiyamaChairman Chief Executive
Yusuf H. Shirazi Toichi IshiyamaChairman Chief Executive
Profit and Loss AccountFOR THE YEAR ENDED MARCH 31, 2016
Statement of Comprehensive IncomeFOR THE YEAR ENDED MARCH 31, 2016
50
51Annual Report 2016
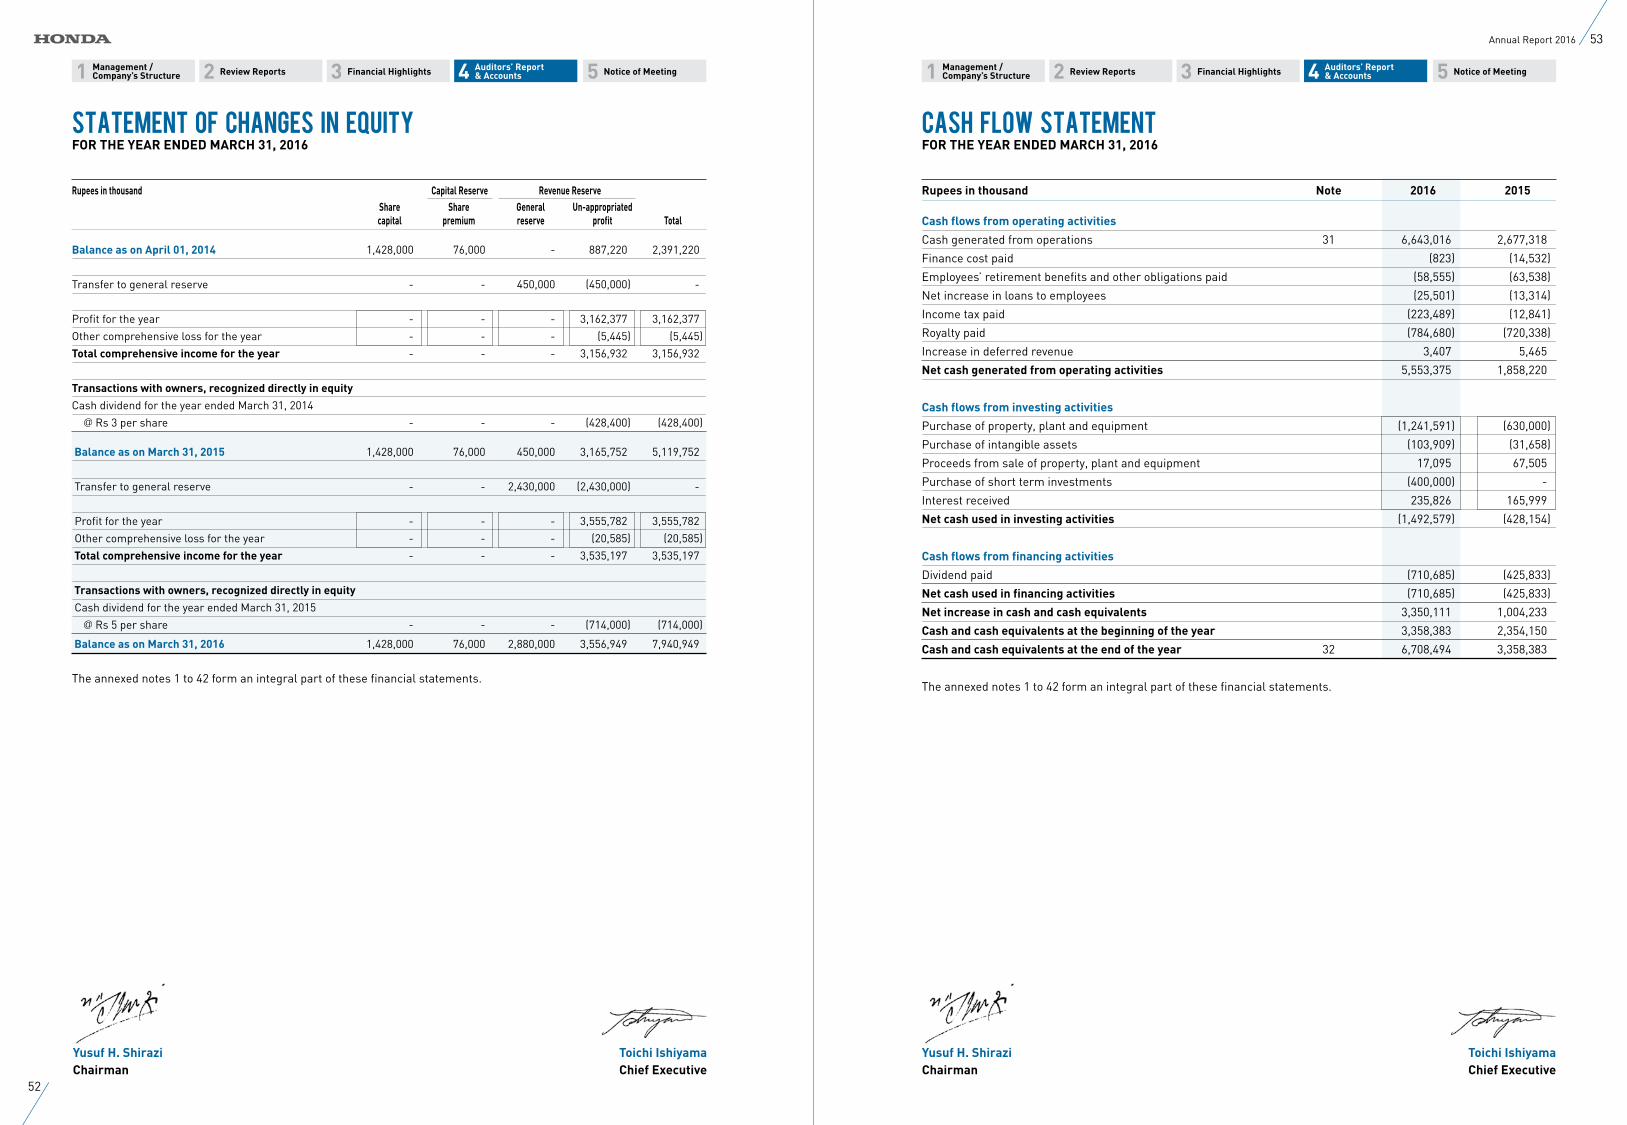
11 22 33 55 44 Management /Company’s Structure
Management /Company’s Structure
Auditors’ Report & Accounts
Auditors’ Report & Accounts Review ReportsReview Reports Financial HighlightsFinancial Highlights Notice of MeetingNotice of Meeting
Rupees in thousand Capital Reserve Revenue Reserve Share Share General Un-appropriated capital premium reserve profit Total
Balance as on April 01, 2014 1,428,000 76,000 - 887,220 2,391,220
Transfer to general reserve - - 450,000 (450,000) -
Profit for the year - - - 3,162,377 3,162,377
Other comprehensive loss for the year - - - (5,445) (5,445)
Total comprehensive income for the year - - - 3,156,932 3,156,932
Transactions with owners, recognized directly in equity
Cash dividend for the year ended March 31, 2014
@ Rs 3 per share - - - (428,400) (428,400)
Balance as on March 31, 2015 1,428,000 76,000 450,000 3,165,752 5,119,752
Transfer to general reserve - - 2,430,000 (2,430,000) -
Profit for the year - - - 3,555,782 3,555,782
Other comprehensive loss for the year - - - (20,585) (20,585)
Total comprehensive income for the year - - - 3,535,197 3,535,197
Transactions with owners, recognized directly in equity
Cash dividend for the year ended March 31, 2015
@ Rs 5 per share - - - (714,000) (714,000)
Balance as on March 31, 2016 1,428,000 76,000 2,880,000 3,556,949 7,940,949
The annexed notes 1 to 42 form an integral part of these financial statements.
Rupees in thousand Note 2016 2015
Cash flows from operating activities
Cash generated from operations 31 6,643,016 2,677,318
Finance cost paid (823) (14,532)
Employees’ retirement benefits and other obligations paid (58,555) (63,538)
Net increase in loans to employees (25,501) (13,314)
Income tax paid (223,489) (12,841)
Royalty paid (784,680) (720,338)
Increase in deferred revenue 3,407 5,465
Net cash generated from operating activities 5,553,375 1,858,220
Cash flows from investing activities
Purchase of property, plant and equipment (1,241,591) (630,000)
Purchase of intangible assets (103,909) (31,658)
Proceeds from sale of property, plant and equipment 17,095 67,505
Purchase of short term investments (400,000) -
Interest received 235,826 165,999
Net cash used in investing activities (1,492,579) (428,154)
Cash flows from financing activities
Dividend paid (710,685) (425,833)
Net cash used in financing activities (710,685) (425,833)
Net increase in cash and cash equivalents 3,350,111 1,004,233
Cash and cash equivalents at the beginning of the year 3,358,383 2,354,150
Cash and cash equivalents at the end of the year 32 6,708,494 3,358,383
The annexed notes 1 to 42 form an integral part of these financial statements.
Yusuf H. Shirazi Toichi IshiyamaChairman Chief Executive
Yusuf H. Shirazi Toichi IshiyamaChairman Chief Executive
Statement of Changes in EquityFOR THE YEAR ENDED MARCH 31, 2016
Cash Flow StatementFOR THE YEAR ENDED MARCH 31, 2016
52
53Annual Report 2016
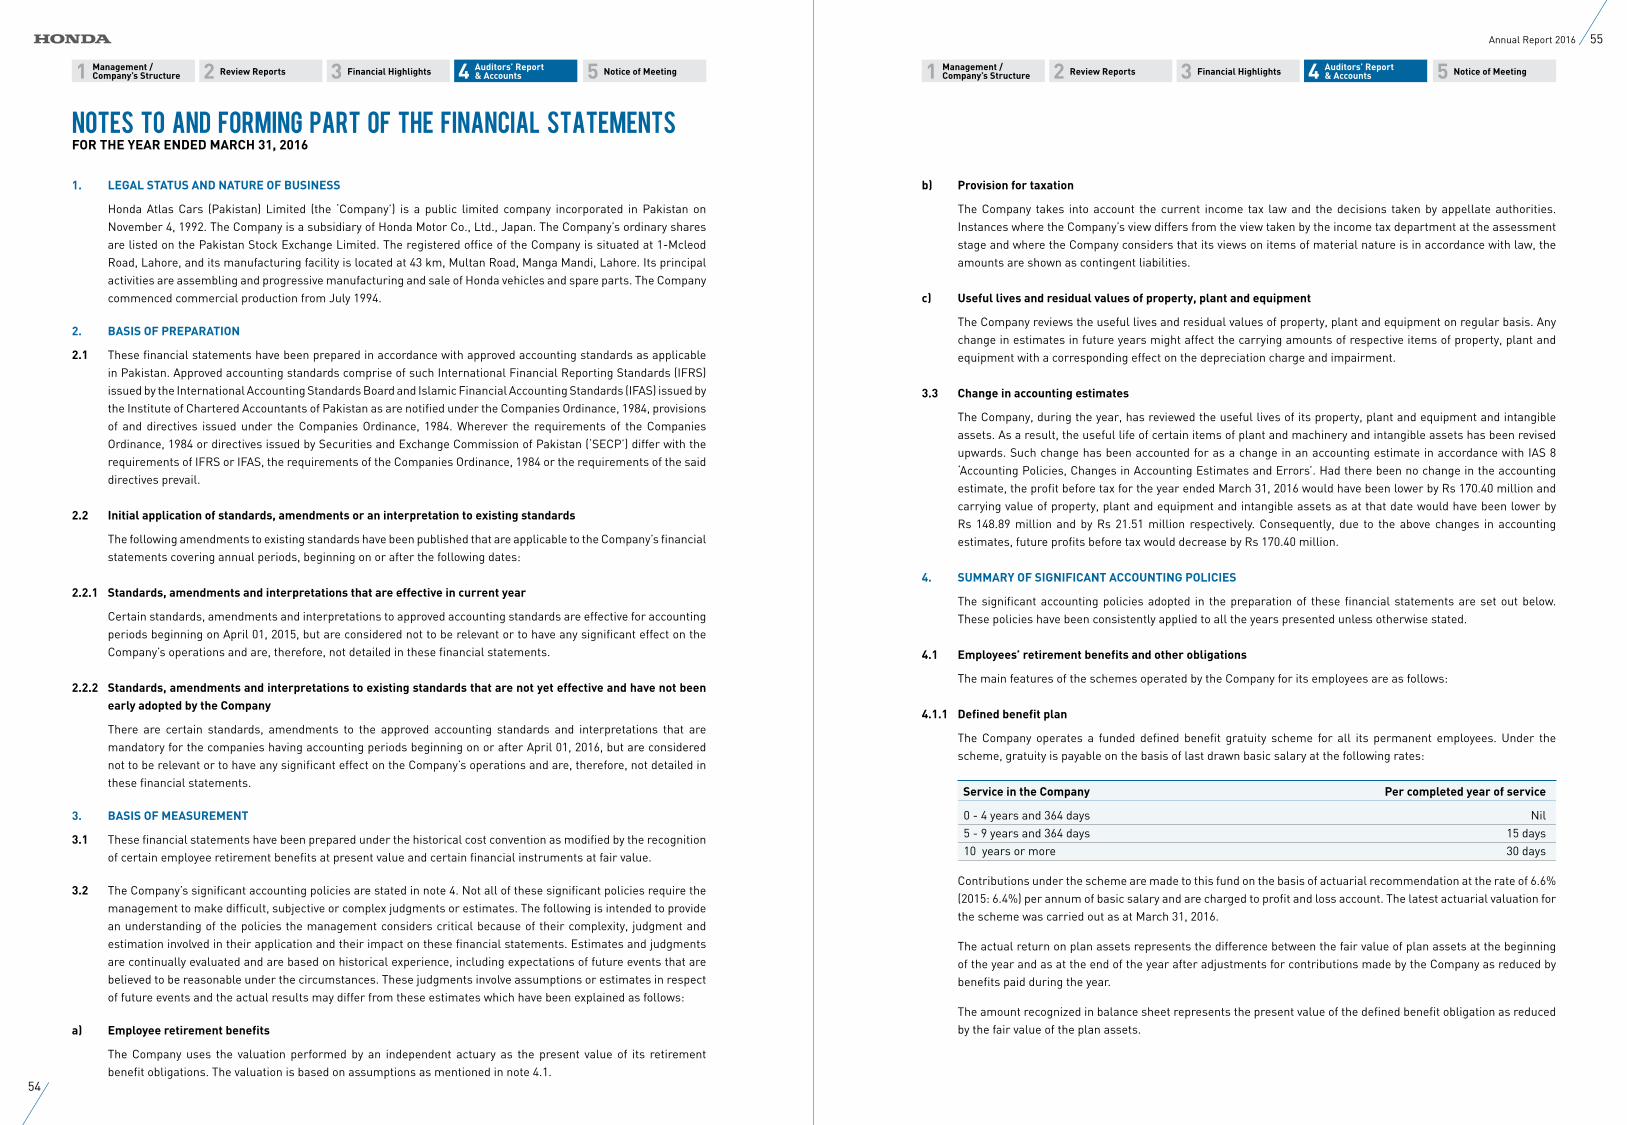
11 22 33 55 44 Management /Company’s Structure
Management /Company’s Structure
Auditors’ Report & Accounts
Auditors’ Report & Accounts Review ReportsReview Reports Financial HighlightsFinancial Highlights Notice of MeetingNotice of Meeting
1. LEGAL STATUS AND NATURE OF BUSINESS
Honda Atlas Cars (Pakistan) Limited (the ‘Company’) is a public limited company incorporated in Pakistan on November 4, 1992. The Company is a subsidiary of Honda Motor Co., Ltd., Japan. The Company’s ordinary shares are listed on the Pakistan Stock Exchange Limited. The registered office of the Company is situated at 1-Mcleod Road, Lahore, and its manufacturing facility is located at 43 km, Multan Road, Manga Mandi, Lahore. Its principal activities are assembling and progressive manufacturing and sale of Honda vehicles and spare parts. The Company commenced commercial production from July 1994.
2. BASIS OF PREPARATION
2.1 These financial statements have been prepared in accordance with approved accounting standards as applicable in Pakistan. Approved accounting standards comprise of such International Financial Reporting Standards (IFRS) issued by the International Accounting Standards Board and Islamic Financial Accounting Standards (IFAS) issued by the Institute of Chartered Accountants of Pakistan as are notified under the Companies Ordinance, 1984, provisions of and directives issued under the Companies Ordinance, 1984. Wherever the requirements of the Companies Ordinance, 1984 or directives issued by Securities and Exchange Commission of Pakistan (‘SECP’) differ with the requirements of IFRS or IFAS, the requirements of the Companies Ordinance, 1984 or the requirements of the said directives prevail.
2.2 Initial application of standards, amendments or an interpretation to existing standards
The following amendments to existing standards have been published that are applicable to the Company’s financial statements covering annual periods, beginning on or after the following dates:
2.2.1 Standards, amendments and interpretations that are effective in current year
Certain standards, amendments and interpretations to approved accounting standards are effective for accounting periods beginning on April 01, 2015, but are considered not to be relevant or to have any significant effect on the Company’s operations and are, therefore, not detailed in these financial statements.
2.2.2 Standards, amendments and interpretations to existing standards that are not yet effective and have not been early adopted by the Company
There are certain standards, amendments to the approved accounting standards and interpretations that are mandatory for the companies having accounting periods beginning on or after April 01, 2016, but are considered not to be relevant or to have any significant effect on the Company’s operations and are, therefore, not detailed in these financial statements.
3. BASIS OF MEASUREMENT
3.1 These financial statements have been prepared under the historical cost convention as modified by the recognition of certain employee retirement benefits at present value and certain financial instruments at fair value.
3.2 The Company’s significant accounting policies are stated in note 4. Not all of these significant policies require the management to make difficult, subjective or complex judgments or estimates. The following is intended to provide an understanding of the policies the management considers critical because of their complexity, judgment and estimation involved in their application and their impact on these financial statements. Estimates and judgments are continually evaluated and are based on historical experience, including expectations of future events that are believed to be reasonable under the circumstances. These judgments involve assumptions or estimates in respect of future events and the actual results may differ from these estimates which have been explained as follows:
a) Employee retirement benefits
The Company uses the valuation performed by an independent actuary as the present value of its retirement benefit obligations. The valuation is based on assumptions as mentioned in note 4.1.
b) Provision for taxation
The Company takes into account the current income tax law and the decisions taken by appellate authorities. Instances where the Company’s view differs from the view taken by the income tax department at the assessment stage and where the Company considers that its views on items of material nature is in accordance with law, the amounts are shown as contingent liabilities.
c) Useful lives and residual values of property, plant and equipment
The Company reviews the useful lives and residual values of property, plant and equipment on regular basis. Any change in estimates in future years might affect the carrying amounts of respective items of property, plant and equipment with a corresponding effect on the depreciation charge and impairment.
3.3 Change in accounting estimates
The Company, during the year, has reviewed the useful lives of its property, plant and equipment and intangible assets. As a result, the useful life of certain items of plant and machinery and intangible assets has been revised upwards. Such change has been accounted for as a change in an accounting estimate in accordance with IAS 8 ‘Accounting Policies, Changes in Accounting Estimates and Errors’. Had there been no change in the accounting estimate, the profit before tax for the year ended March 31, 2016 would have been lower by Rs 170.40 million and carrying value of property, plant and equipment and intangible assets as at that date would have been lower by Rs 148.89 million and by Rs 21.51 million respectively. Consequently, due to the above changes in accounting estimates, future profits before tax would decrease by Rs 170.40 million.
4. SUMMARY OF SIGNIFICANT ACCOUNTING POLICIES
The significant accounting policies adopted in the preparation of these financial statements are set out below. These policies have been consistently applied to all the years presented unless otherwise stated.
4.1 Employees’ retirement benefits and other obligations
The main features of the schemes operated by the Company for its employees are as follows:
4.1.1 Defined benefit plan
The Company operates a funded defined benefit gratuity scheme for all its permanent employees. Under the scheme, gratuity is payable on the basis of last drawn basic salary at the following rates:
Service in the Company Per completed year of service
0 - 4 years and 364 days Nil 5 - 9 years and 364 days 15 days 10 years or more 30 days
Contributions under the scheme are made to this fund on the basis of actuarial recommendation at the rate of 6.6% (2015: 6.4%) per annum of basic salary and are charged to profit and loss account. The latest actuarial valuation for the scheme was carried out as at March 31, 2016.
The actual return on plan assets represents the difference between the fair value of plan assets at the beginning of the year and as at the end of the year after adjustments for contributions made by the Company as reduced by benefits paid during the year.
The amount recognized in balance sheet represents the present value of the defined benefit obligation as reduced by the fair value of the plan assets.
Notes to and Forming Part of the Financial StatementsFOR THE YEAR ENDED MARCH 31, 2016
54
55Annual Report 2016
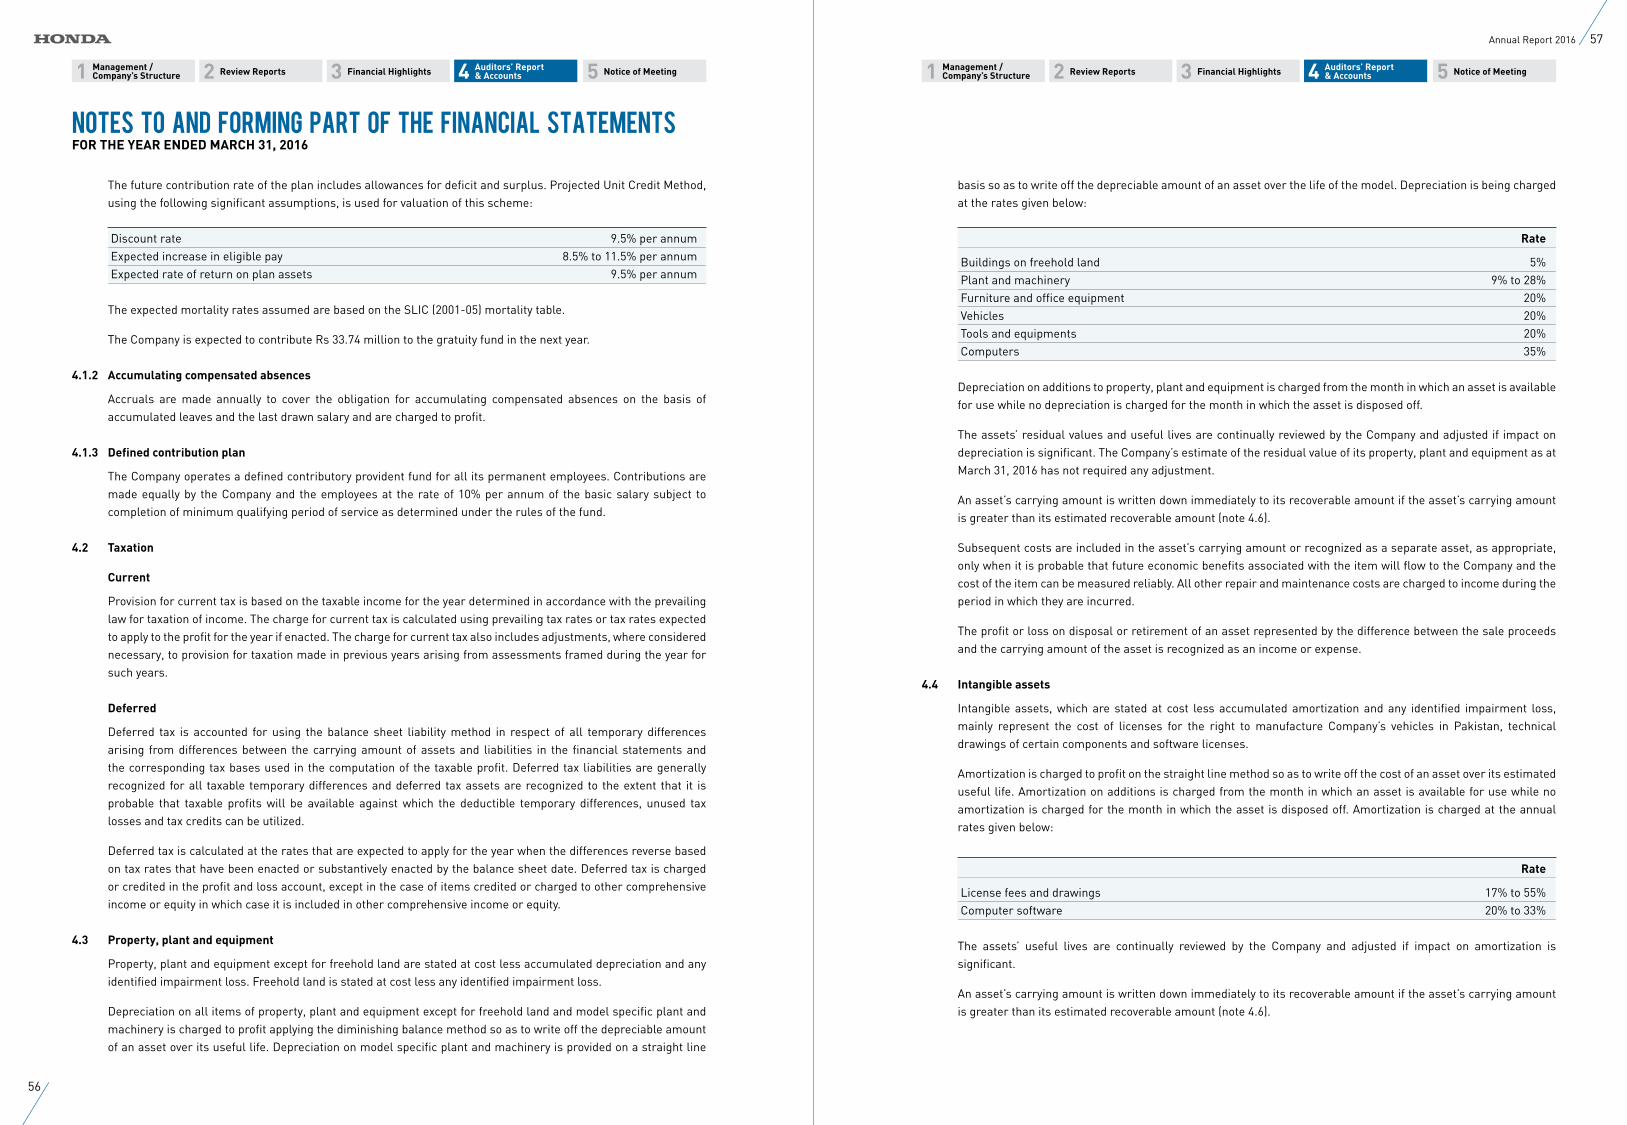
11 22 33 55 44 Management /Company’s Structure
Management /Company’s Structure
Auditors’ Report & Accounts
Auditors’ Report & Accounts Review ReportsReview Reports Financial HighlightsFinancial Highlights Notice of MeetingNotice of Meeting
The future contribution rate of the plan includes allowances for deficit and surplus. Projected Unit Credit Method, using the following significant assumptions, is used for valuation of this scheme:
Discount rate 9.5% per annum Expected increase in eligible pay 8.5% to 11.5% per annum Expected rate of return on plan assets 9.5% per annum
The expected mortality rates assumed are based on the SLIC (2001-05) mortality table.
The Company is expected to contribute Rs 33.74 million to the gratuity fund in the next year.
4.1.2 Accumulating compensated absences
Accruals are made annually to cover the obligation for accumulating compensated absences on the basis of accumulated leaves and the last drawn salary and are charged to profit.
4.1.3 Defined contribution plan
The Company operates a defined contributory provident fund for all its permanent employees. Contributions are made equally by the Company and the employees at the rate of 10% per annum of the basic salary subject to completion of minimum qualifying period of service as determined under the rules of the fund.
4.2 Taxation
Current
Provision for current tax is based on the taxable income for the year determined in accordance with the prevailing law for taxation of income. The charge for current tax is calculated using prevailing tax rates or tax rates expected to apply to the profit for the year if enacted. The charge for current tax also includes adjustments, where considered necessary, to provision for taxation made in previous years arising from assessments framed during the year for such years.
Deferred
Deferred tax is accounted for using the balance sheet liability method in respect of all temporary differences arising from differences between the carrying amount of assets and liabilities in the financial statements and the corresponding tax bases used in the computation of the taxable profit. Deferred tax liabilities are generally recognized for all taxable temporary differences and deferred tax assets are recognized to the extent that it is probable that taxable profits will be available against which the deductible temporary differences, unused tax losses and tax credits can be utilized.
Deferred tax is calculated at the rates that are expected to apply for the year when the differences reverse based on tax rates that have been enacted or substantively enacted by the balance sheet date. Deferred tax is charged or credited in the profit and loss account, except in the case of items credited or charged to other comprehensive income or equity in which case it is included in other comprehensive income or equity.
4.3 Property, plant and equipment
Property, plant and equipment except for freehold land are stated at cost less accumulated depreciation and any identified impairment loss. Freehold land is stated at cost less any identified impairment loss.
Depreciation on all items of property, plant and equipment except for freehold land and model specific plant and machinery is charged to profit applying the diminishing balance method so as to write off the depreciable amount of an asset over its useful life. Depreciation on model specific plant and machinery is provided on a straight line
basis so as to write off the depreciable amount of an asset over the life of the model. Depreciation is being charged at the rates given below:
Rate
Buildings on freehold land 5% Plant and machinery 9% to 28% Furniture and office equipment 20% Vehicles 20% Tools and equipments 20% Computers 35%
Depreciation on additions to property, plant and equipment is charged from the month in which an asset is available for use while no depreciation is charged for the month in which the asset is disposed off.
The assets’ residual values and useful lives are continually reviewed by the Company and adjusted if impact on depreciation is significant. The Company’s estimate of the residual value of its property, plant and equipment as at March 31, 2016 has not required any adjustment.
An asset’s carrying amount is written down immediately to its recoverable amount if the asset’s carrying amount is greater than its estimated recoverable amount (note 4.6).
Subsequent costs are included in the asset’s carrying amount or recognized as a separate asset, as appropriate, only when it is probable that future economic benefits associated with the item will flow to the Company and the cost of the item can be measured reliably. All other repair and maintenance costs are charged to income during the period in which they are incurred.
The profit or loss on disposal or retirement of an asset represented by the difference between the sale proceeds and the carrying amount of the asset is recognized as an income or expense.
4.4 Intangible assets
Intangible assets, which are stated at cost less accumulated amortization and any identified impairment loss, mainly represent the cost of licenses for the right to manufacture Company’s vehicles in Pakistan, technical drawings of certain components and software licenses.
Amortization is charged to profit on the straight line method so as to write off the cost of an asset over its estimated useful life. Amortization on additions is charged from the month in which an asset is available for use while no amortization is charged for the month in which the asset is disposed off. Amortization is charged at the annual rates given below:
Rate
License fees and drawings 17% to 55% Computer software 20% to 33%
The assets’ useful lives are continually reviewed by the Company and adjusted if impact on amortization is significant.
An asset’s carrying amount is written down immediately to its recoverable amount if the asset’s carrying amount is greater than its estimated recoverable amount (note 4.6).
Notes to and Forming Part of the Financial StatementsFOR THE YEAR ENDED MARCH 31, 2016
56
57Annual Report 2016
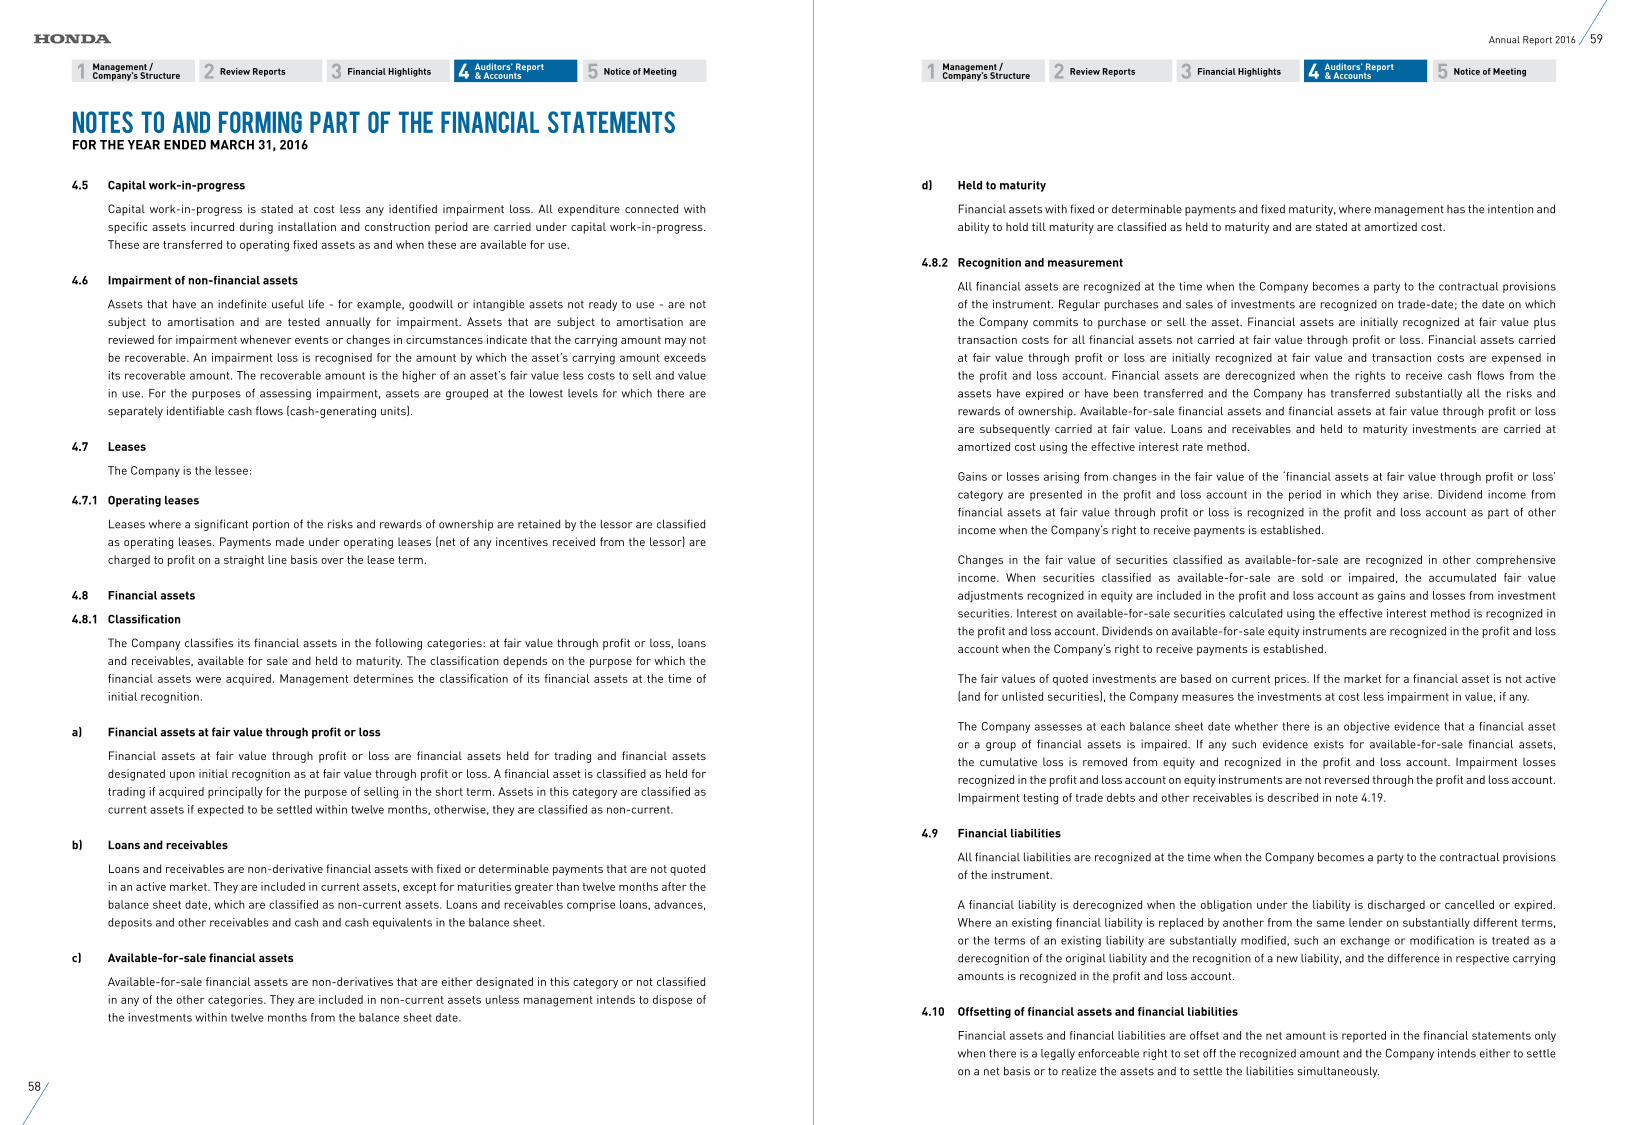
11 22 33 55 44 Management /Company’s Structure
Management /Company’s Structure
Auditors’ Report & Accounts
Auditors’ Report & Accounts Review ReportsReview Reports Financial HighlightsFinancial Highlights Notice of MeetingNotice of Meeting
4.5 Capital work-in-progress
Capital work-in-progress is stated at cost less any identified impairment loss. All expenditure connected with specific assets incurred during installation and construction period are carried under capital work-in-progress. These are transferred to operating fixed assets as and when these are available for use.
4.6 Impairment of non-financial assets
Assets that have an indefinite useful life - for example, goodwill or intangible assets not ready to use - are not subject to amortisation and are tested annually for impairment. Assets that are subject to amortisation are reviewed for impairment whenever events or changes in circumstances indicate that the carrying amount may not be recoverable. An impairment loss is recognised for the amount by which the asset’s carrying amount exceeds its recoverable amount. The recoverable amount is the higher of an asset’s fair value less costs to sell and value in use. For the purposes of assessing impairment, assets are grouped at the lowest levels for which there are separately identifiable cash flows (cash-generating units).
4.7 Leases
The Company is the lessee:
4.7.1 Operating leases
Leases where a significant portion of the risks and rewards of ownership are retained by the lessor are classified as operating leases. Payments made under operating leases (net of any incentives received from the lessor) are charged to profit on a straight line basis over the lease term.
4.8 Financial assets
4.8.1 Classification
The Company classifies its financial assets in the following categories: at fair value through profit or loss, loans and receivables, available for sale and held to maturity. The classification depends on the purpose for which the financial assets were acquired. Management determines the classification of its financial assets at the time of initial recognition.
a) Financial assets at fair value through profit or loss
Financial assets at fair value through profit or loss are financial assets held for trading and financial assets designated upon initial recognition as at fair value through profit or loss. A financial asset is classified as held for trading if acquired principally for the purpose of selling in the short term. Assets in this category are classified as current assets if expected to be settled within twelve months, otherwise, they are classified as non-current.
b) Loans and receivables
Loans and receivables are non-derivative financial assets with fixed or determinable payments that are not quoted in an active market. They are included in current assets, except for maturities greater than twelve months after the balance sheet date, which are classified as non-current assets. Loans and receivables comprise loans, advances, deposits and other receivables and cash and cash equivalents in the balance sheet.
c) Available-for-sale financial assets
Available-for-sale financial assets are non-derivatives that are either designated in this category or not classified in any of the other categories. They are included in non-current assets unless management intends to dispose of the investments within twelve months from the balance sheet date.
d) Held to maturity
Financial assets with fixed or determinable payments and fixed maturity, where management has the intention and ability to hold till maturity are classified as held to maturity and are stated at amortized cost.
4.8.2 Recognition and measurement
All financial assets are recognized at the time when the Company becomes a party to the contractual provisions of the instrument. Regular purchases and sales of investments are recognized on trade-date; the date on which the Company commits to purchase or sell the asset. Financial assets are initially recognized at fair value plus transaction costs for all financial assets not carried at fair value through profit or loss. Financial assets carried at fair value through profit or loss are initially recognized at fair value and transaction costs are expensed in the profit and loss account. Financial assets are derecognized when the rights to receive cash flows from the assets have expired or have been transferred and the Company has transferred substantially all the risks and rewards of ownership. Available-for-sale financial assets and financial assets at fair value through profit or loss are subsequently carried at fair value. Loans and receivables and held to maturity investments are carried at amortized cost using the effective interest rate method.
Gains or losses arising from changes in the fair value of the ‘financial assets at fair value through profit or loss’ category are presented in the profit and loss account in the period in which they arise. Dividend income from financial assets at fair value through profit or loss is recognized in the profit and loss account as part of other income when the Company’s right to receive payments is established.
Changes in the fair value of securities classified as available-for-sale are recognized in other comprehensive income. When securities classified as available-for-sale are sold or impaired, the accumulated fair value adjustments recognized in equity are included in the profit and loss account as gains and losses from investment securities. Interest on available-for-sale securities calculated using the effective interest method is recognized in the profit and loss account. Dividends on available-for-sale equity instruments are recognized in the profit and loss account when the Company’s right to receive payments is established.
The fair values of quoted investments are based on current prices. If the market for a financial asset is not active (and for unlisted securities), the Company measures the investments at cost less impairment in value, if any.
The Company assesses at each balance sheet date whether there is an objective evidence that a financial asset or a group of financial assets is impaired. If any such evidence exists for available-for-sale financial assets, the cumulative loss is removed from equity and recognized in the profit and loss account. Impairment losses recognized in the profit and loss account on equity instruments are not reversed through the profit and loss account. Impairment testing of trade debts and other receivables is described in note 4.19.
4.9 Financial liabilities
All financial liabilities are recognized at the time when the Company becomes a party to the contractual provisions of the instrument.
A financial liability is derecognized when the obligation under the liability is discharged or cancelled or expired. Where an existing financial liability is replaced by another from the same lender on substantially different terms, or the terms of an existing liability are substantially modified, such an exchange or modification is treated as a derecognition of the original liability and the recognition of a new liability, and the difference in respective carrying amounts is recognized in the profit and loss account.
4.10 Offsetting of financial assets and financial liabilities
Financial assets and financial liabilities are offset and the net amount is reported in the financial statements only when there is a legally enforceable right to set off the recognized amount and the Company intends either to settle on a net basis or to realize the assets and to settle the liabilities simultaneously.
Notes to and Forming Part of the Financial StatementsFOR THE YEAR ENDED MARCH 31, 2016
58
59Annual Report 2016
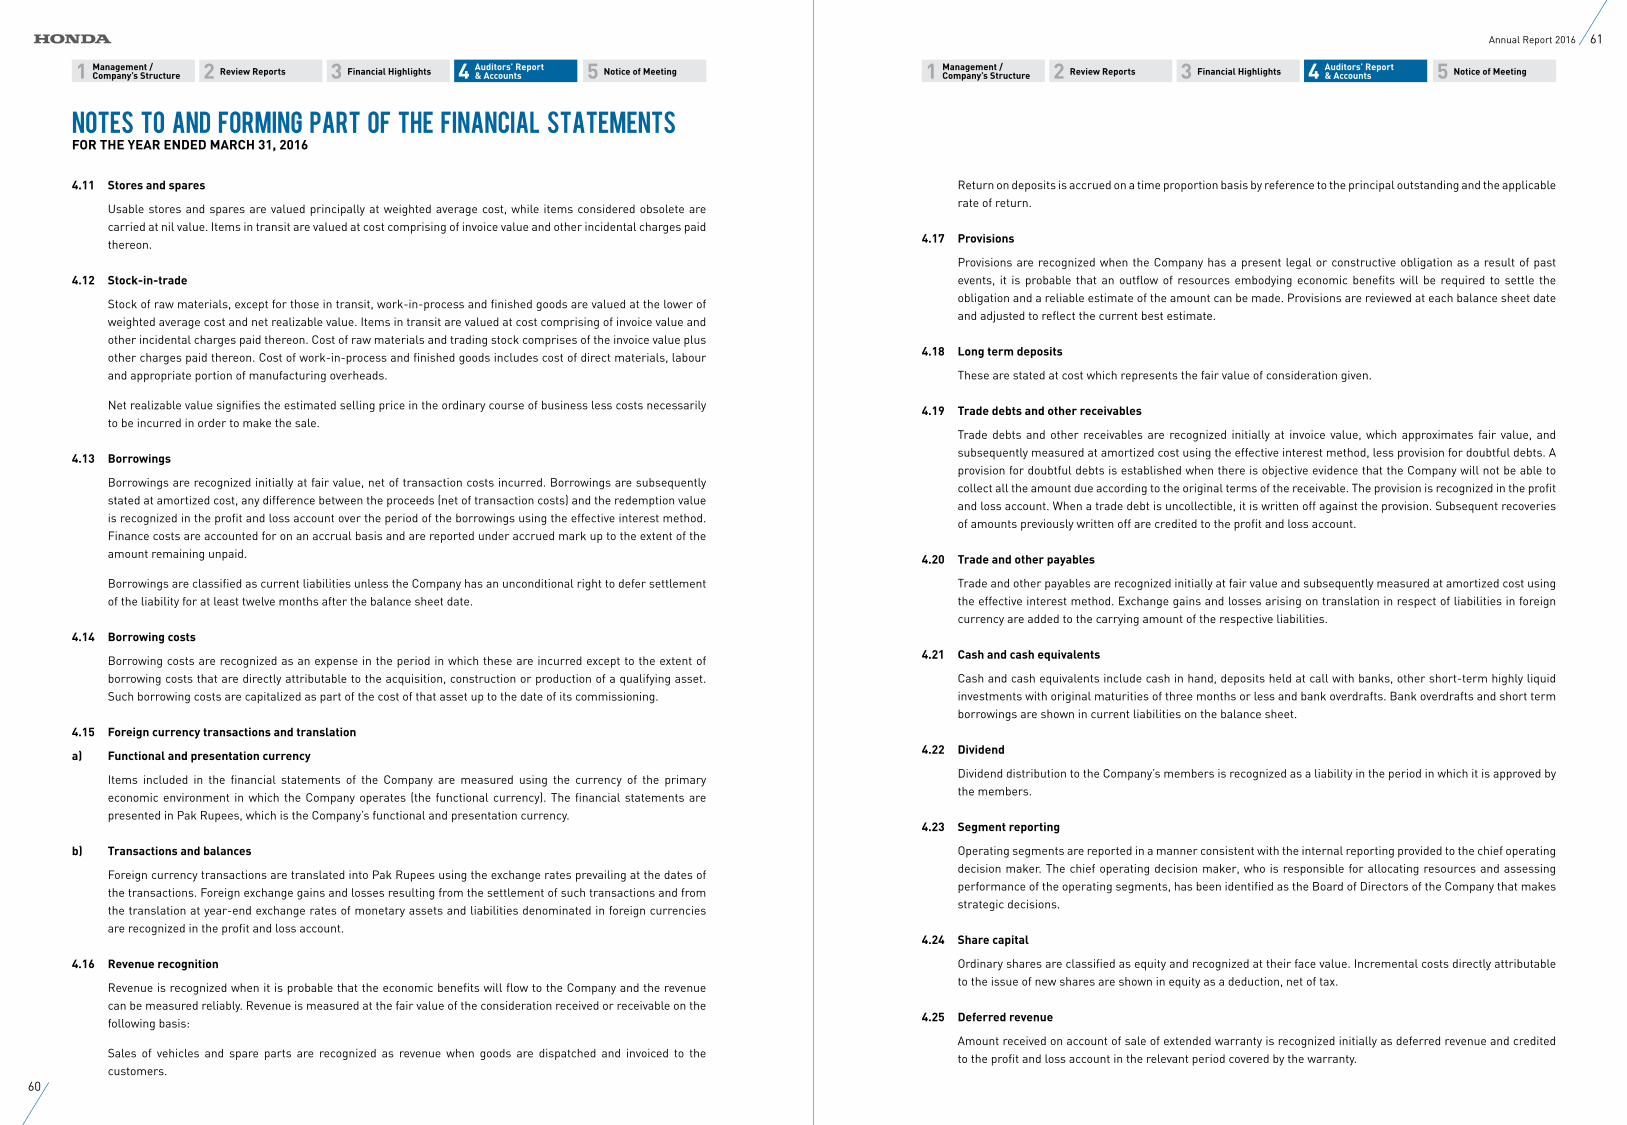
11 22 33 55 44 Management /Company’s Structure
Management /Company’s Structure
Auditors’ Report & Accounts
Auditors’ Report & Accounts Review ReportsReview Reports Financial HighlightsFinancial Highlights Notice of MeetingNotice of Meeting
4.11 Stores and spares
Usable stores and spares are valued principally at weighted average cost, while items considered obsolete are carried at nil value. Items in transit are valued at cost comprising of invoice value and other incidental charges paid thereon.
4.12 Stock-in-trade
Stock of raw materials, except for those in transit, work-in-process and finished goods are valued at the lower of weighted average cost and net realizable value. Items in transit are valued at cost comprising of invoice value and other incidental charges paid thereon. Cost of raw materials and trading stock comprises of the invoice value plus other charges paid thereon. Cost of work-in-process and finished goods includes cost of direct materials, labour and appropriate portion of manufacturing overheads.
Net realizable value signifies the estimated selling price in the ordinary course of business less costs necessarily to be incurred in order to make the sale.
4.13 Borrowings
Borrowings are recognized initially at fair value, net of transaction costs incurred. Borrowings are subsequently stated at amortized cost, any difference between the proceeds (net of transaction costs) and the redemption value is recognized in the profit and loss account over the period of the borrowings using the effective interest method. Finance costs are accounted for on an accrual basis and are reported under accrued mark up to the extent of the amount remaining unpaid.
Borrowings are classified as current liabilities unless the Company has an unconditional right to defer settlement of the liability for at least twelve months after the balance sheet date.
4.14 Borrowing costs
Borrowing costs are recognized as an expense in the period in which these are incurred except to the extent of borrowing costs that are directly attributable to the acquisition, construction or production of a qualifying asset. Such borrowing costs are capitalized as part of the cost of that asset up to the date of its commissioning.
4.15 Foreign currency transactions and translation
a) Functional and presentation currency
Items included in the financial statements of the Company are measured using the currency of the primary economic environment in which the Company operates (the functional currency). The financial statements are presented in Pak Rupees, which is the Company’s functional and presentation currency.
b) Transactions and balances
Foreign currency transactions are translated into Pak Rupees using the exchange rates prevailing at the dates of the transactions. Foreign exchange gains and losses resulting from the settlement of such transactions and from the translation at year-end exchange rates of monetary assets and liabilities denominated in foreign currencies are recognized in the profit and loss account.
4.16 Revenue recognition
Revenue is recognized when it is probable that the economic benefits will flow to the Company and the revenue can be measured reliably. Revenue is measured at the fair value of the consideration received or receivable on the following basis:
Sales of vehicles and spare parts are recognized as revenue when goods are dispatched and invoiced to the customers.
Return on deposits is accrued on a time proportion basis by reference to the principal outstanding and the applicable rate of return.
4.17 Provisions
Provisions are recognized when the Company has a present legal or constructive obligation as a result of past events, it is probable that an outflow of resources embodying economic benefits will be required to settle the obligation and a reliable estimate of the amount can be made. Provisions are reviewed at each balance sheet date and adjusted to reflect the current best estimate.
4.18 Long term deposits
These are stated at cost which represents the fair value of consideration given.
4.19 Trade debts and other receivables
Trade debts and other receivables are recognized initially at invoice value, which approximates fair value, and subsequently measured at amortized cost using the effective interest method, less provision for doubtful debts. A provision for doubtful debts is established when there is objective evidence that the Company will not be able to collect all the amount due according to the original terms of the receivable. The provision is recognized in the profit and loss account. When a trade debt is uncollectible, it is written off against the provision. Subsequent recoveries of amounts previously written off are credited to the profit and loss account.
4.20 Trade and other payables
Trade and other payables are recognized initially at fair value and subsequently measured at amortized cost using the effective interest method. Exchange gains and losses arising on translation in respect of liabilities in foreign currency are added to the carrying amount of the respective liabilities.
4.21 Cash and cash equivalents
Cash and cash equivalents include cash in hand, deposits held at call with banks, other short-term highly liquid investments with original maturities of three months or less and bank overdrafts. Bank overdrafts and short term borrowings are shown in current liabilities on the balance sheet.
4.22 Dividend
Dividend distribution to the Company’s members is recognized as a liability in the period in which it is approved by the members.
4.23 Segment reporting
Operating segments are reported in a manner consistent with the internal reporting provided to the chief operating decision maker. The chief operating decision maker, who is responsible for allocating resources and assessing performance of the operating segments, has been identified as the Board of Directors of the Company that makes strategic decisions.
4.24 Share capital
Ordinary shares are classified as equity and recognized at their face value. Incremental costs directly attributable to the issue of new shares are shown in equity as a deduction, net of tax.
4.25 Deferred revenue
Amount received on account of sale of extended warranty is recognized initially as deferred revenue and credited to the profit and loss account in the relevant period covered by the warranty.
Notes to and Forming Part of the Financial StatementsFOR THE YEAR ENDED MARCH 31, 2016
60
61Annual Report 2016
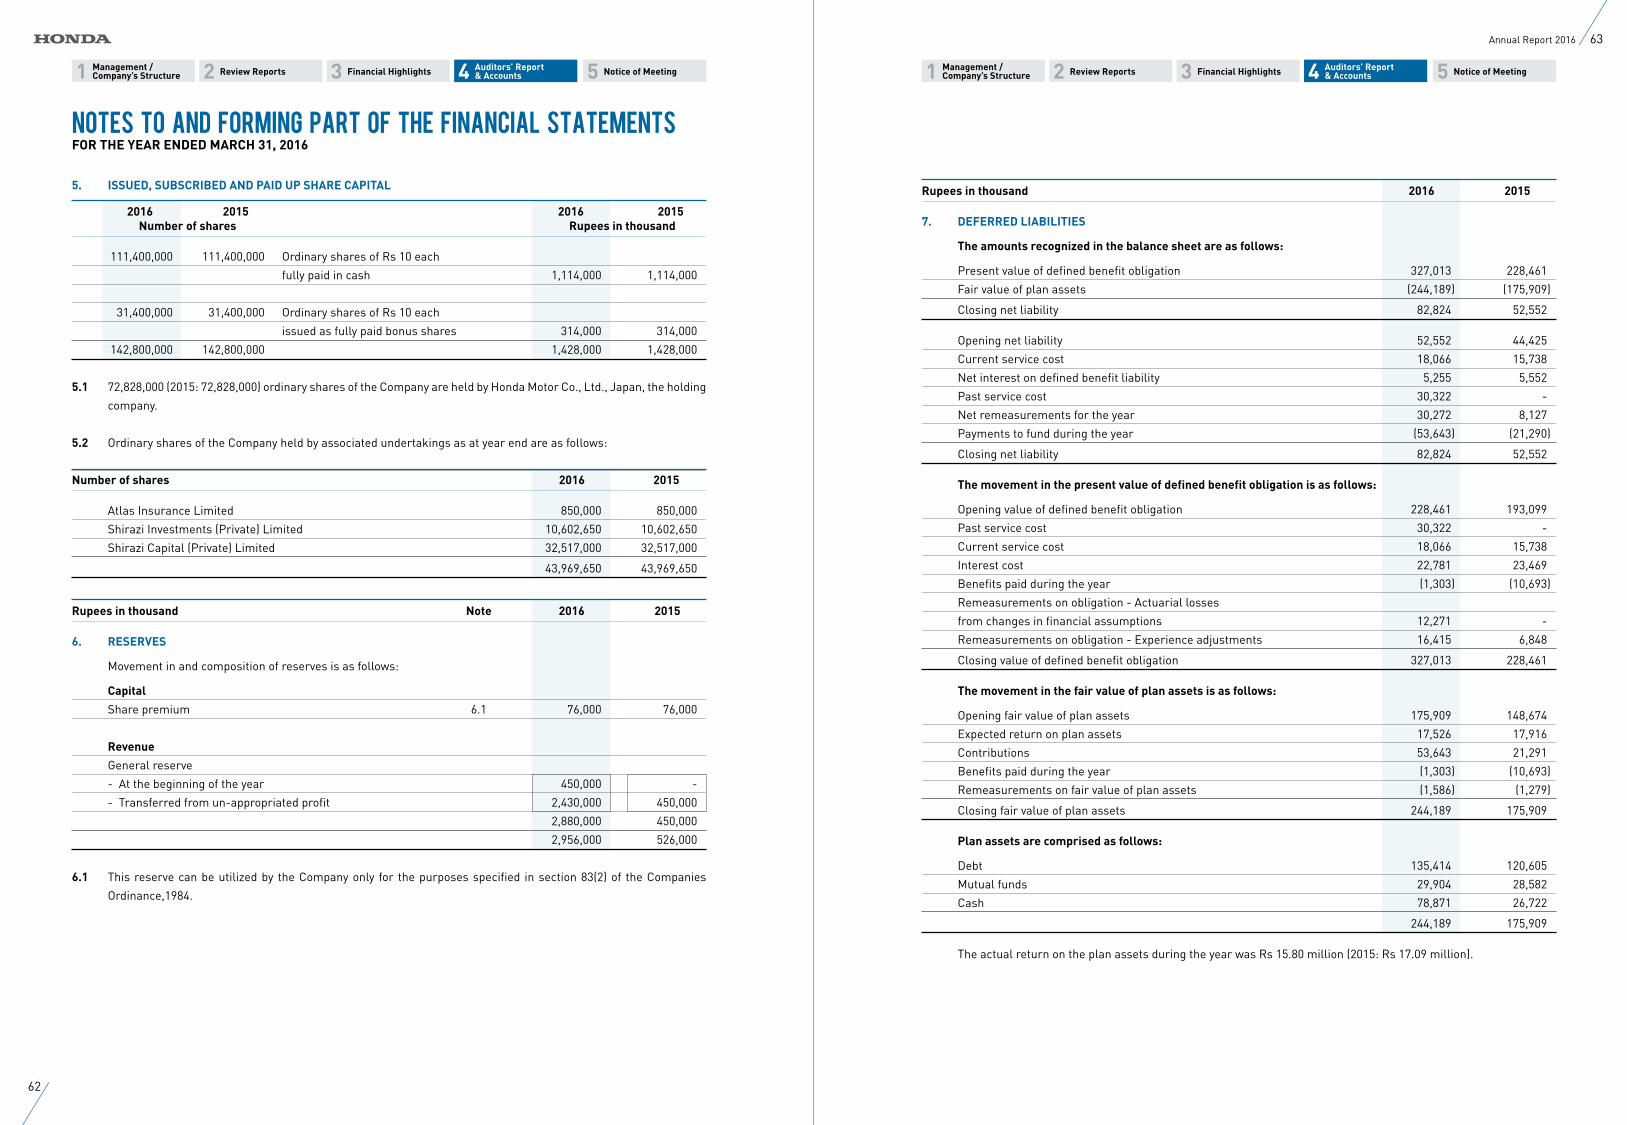
11 22 33 55 44 Management /Company’s Structure
Management /Company’s Structure
Auditors’ Report & Accounts
Auditors’ Report & Accounts Review ReportsReview Reports Financial HighlightsFinancial Highlights Notice of MeetingNotice of Meeting
5. ISSUED, SUBSCRIBED AND PAID UP SHARE CAPITAL
2016 2015 2016 2015 Number of shares Rupees in thousand
111,400,000 111,400,000 Ordinary shares of Rs 10 each
fully paid in cash 1,114,000 1,114,000
31,400,000 31,400,000 Ordinary shares of Rs 10 each
issued as fully paid bonus shares 314,000 314,000
142,800,000 142,800,000 1,428,000 1,428,000
5.1 72,828,000 (2015: 72,828,000) ordinary shares of the Company are held by Honda Motor Co., Ltd., Japan, the holding
company.
5.2 Ordinary shares of the Company held by associated undertakings as at year end are as follows:
Number of shares 2016 2015
Atlas Insurance Limited 850,000 850,000
Shirazi Investments (Private) Limited 10,602,650 10,602,650
Shirazi Capital (Private) Limited 32,517,000 32,517,000
43,969,650 43,969,650
Rupees in thousand Note 2016 2015
6. RESERVES
Movement in and composition of reserves is as follows:
Capital
Share premium 6.1 76,000 76,000
Revenue
General reserve
- At the beginning of the year 450,000 -
- Transferred from un-appropriated profit 2,430,000 450,000
2,880,000 450,000
2,956,000 526,000
6.1 This reserve can be utilized by the Company only for the purposes specified in section 83(2) of the Companies
Ordinance,1984.
Rupees in thousand 2016 2015
7. DEFERRED LIABILITIES
The amounts recognized in the balance sheet are as follows:
Present value of defined benefit obligation 327,013 228,461
Fair value of plan assets (244,189) (175,909)
Closing net liability 82,824 52,552
Opening net liability 52,552 44,425
Current service cost 18,066 15,738
Net interest on defined benefit liability 5,255 5,552
Past service cost 30,322 -
Net remeasurements for the year 30,272 8,127
Payments to fund during the year (53,643) (21,290)
Closing net liability 82,824 52,552
The movement in the present value of defined benefit obligation is as follows:
Opening value of defined benefit obligation 228,461 193,099
Past service cost 30,322 -
Current service cost 18,066 15,738
Interest cost 22,781 23,469
Benefits paid during the year (1,303) (10,693)
Remeasurements on obligation - Actuarial losses
from changes in financial assumptions 12,271 -
Remeasurements on obligation - Experience adjustments 16,415 6,848
Closing value of defined benefit obligation 327,013 228,461
The movement in the fair value of plan assets is as follows:
Opening fair value of plan assets 175,909 148,674
Expected return on plan assets 17,526 17,916
Contributions 53,643 21,291
Benefits paid during the year (1,303) (10,693)
Remeasurements on fair value of plan assets (1,586) (1,279)
Closing fair value of plan assets 244,189 175,909
Plan assets are comprised as follows:
Debt 135,414 120,605
Mutual funds 29,904 28,582
Cash 78,871 26,722
244,189 175,909
The actual return on the plan assets during the year was Rs 15.80 million (2015: Rs 17.09 million).
Notes to and Forming Part of the Financial StatementsFOR THE YEAR ENDED MARCH 31, 2016
62
63Annual Report 2016
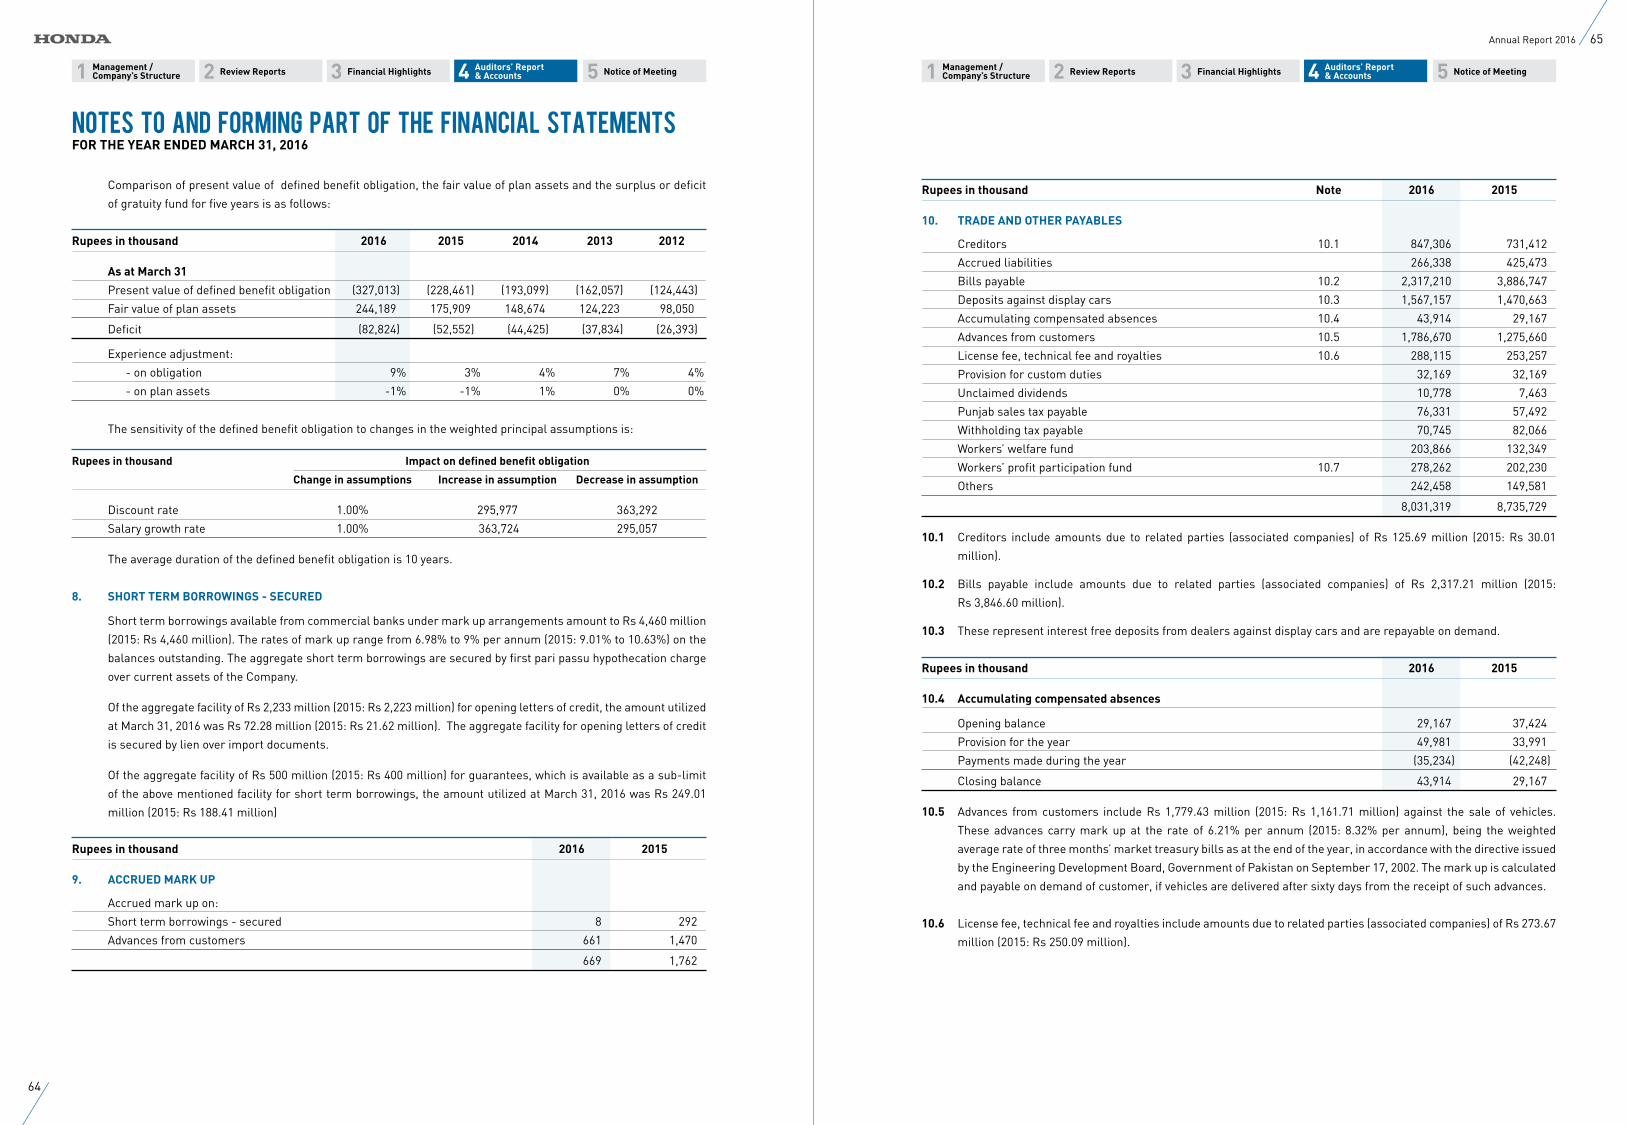
11 22 33 55 44 Management /Company’s Structure
Management /Company’s Structure
Auditors’ Report & Accounts
Auditors’ Report & Accounts Review ReportsReview Reports Financial HighlightsFinancial Highlights Notice of MeetingNotice of Meeting
Comparison of present value of defined benefit obligation, the fair value of plan assets and the surplus or deficit
of gratuity fund for five years is as follows:
Rupees in thousand 2016 2015 2014 2013 2012
As at March 31
Present value of defined benefit obligation (327,013) (228,461) (193,099) (162,057) (124,443)
Fair value of plan assets 244,189 175,909 148,674 124,223 98,050
Deficit (82,824) (52,552) (44,425) (37,834) (26,393)
Experience adjustment:
- on obligation 9% 3% 4% 7% 4%
- on plan assets -1% -1% 1% 0% 0%
The sensitivity of the defined benefit obligation to changes in the weighted principal assumptions is:
Rupees in thousand Impact on defined benefit obligation
Change in assumptions Increase in assumption Decrease in assumption
Discount rate 1.00% 295,977 363,292
Salary growth rate 1.00% 363,724 295,057
The average duration of the defined benefit obligation is 10 years.
8. SHORT TERM BORROWINGS - SECURED
Short term borrowings available from commercial banks under mark up arrangements amount to Rs 4,460 million
(2015: Rs 4,460 million). The rates of mark up range from 6.98% to 9% per annum (2015: 9.01% to 10.63%) on the
balances outstanding. The aggregate short term borrowings are secured by first pari passu hypothecation charge
over current assets of the Company.
Of the aggregate facility of Rs 2,233 million (2015: Rs 2,223 million) for opening letters of credit, the amount utilized
at March 31, 2016 was Rs 72.28 million (2015: Rs 21.62 million). The aggregate facility for opening letters of credit
is secured by lien over import documents.
Of the aggregate facility of Rs 500 million (2015: Rs 400 million) for guarantees, which is available as a sub-limit
of the above mentioned facility for short term borrowings, the amount utilized at March 31, 2016 was Rs 249.01
million (2015: Rs 188.41 million)
Rupees in thousand 2016 2015
9. ACCRUED MARK UP
Accrued mark up on:
Short term borrowings - secured 8 292
Advances from customers 661 1,470
669 1,762
Rupees in thousand Note 2016 2015
10. TRADE AND OTHER PAYABLES
Creditors 10.1 847,306 731,412
Accrued liabilities 266,338 425,473
Bills payable 10.2 2,317,210 3,886,747
Deposits against display cars 10.3 1,567,157 1,470,663
Accumulating compensated absences 10.4 43,914 29,167
Advances from customers 10.5 1,786,670 1,275,660
License fee, technical fee and royalties 10.6 288,115 253,257
Provision for custom duties 32,169 32,169
Unclaimed dividends 10,778 7,463
Punjab sales tax payable 76,331 57,492
Withholding tax payable 70,745 82,066
Workers’ welfare fund 203,866 132,349
Workers’ profit participation fund 10.7 278,262 202,230
Others 242,458 149,581
8,031,319 8,735,729
10.1 Creditors include amounts due to related parties (associated companies) of Rs 125.69 million (2015: Rs 30.01
million).
10.2 Bills payable include amounts due to related parties (associated companies) of Rs 2,317.21 million (2015:
Rs 3,846.60 million).
10.3 These represent interest free deposits from dealers against display cars and are repayable on demand.
Rupees in thousand 2016 2015
10.4 Accumulating compensated absences
Opening balance 29,167 37,424
Provision for the year 49,981 33,991
Payments made during the year (35,234) (42,248)
Closing balance 43,914 29,167
10.5 Advances from customers include Rs 1,779.43 million (2015: Rs 1,161.71 million) against the sale of vehicles.
These advances carry mark up at the rate of 6.21% per annum (2015: 8.32% per annum), being the weighted
average rate of three months’ market treasury bills as at the end of the year, in accordance with the directive issued
by the Engineering Development Board, Government of Pakistan on September 17, 2002. The mark up is calculated
and payable on demand of customer, if vehicles are delivered after sixty days from the receipt of such advances.
10.6 License fee, technical fee and royalties include amounts due to related parties (associated companies) of Rs 273.67
million (2015: Rs 250.09 million).
Notes to and Forming Part of the Financial StatementsFOR THE YEAR ENDED MARCH 31, 2016
64
65Annual Report 2016
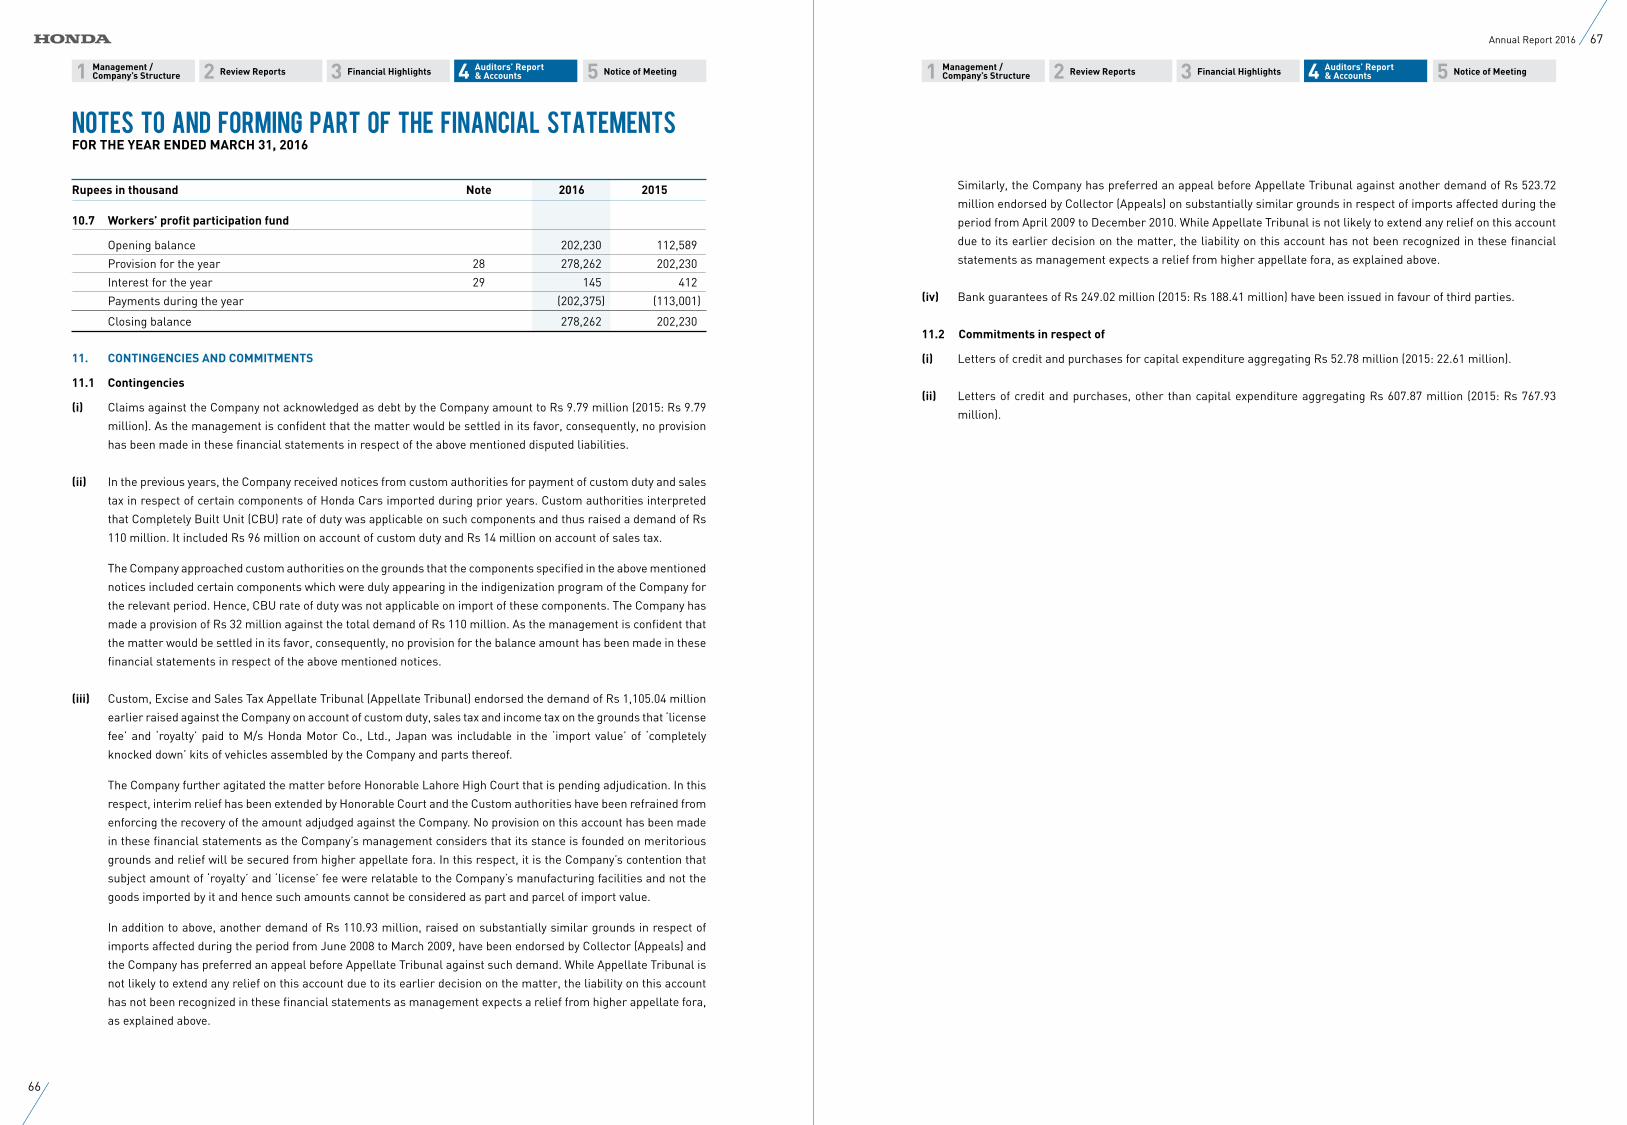
11 22 33 55 44 Management /Company’s Structure
Management /Company’s Structure
Auditors’ Report & Accounts
Auditors’ Report & Accounts Review ReportsReview Reports Financial HighlightsFinancial Highlights Notice of MeetingNotice of Meeting
Rupees in thousand Note 2016 2015
10.7 Workers’ profit participation fund
Opening balance 202,230 112,589
Provision for the year 28 278,262 202,230
Interest for the year 29 145 412
Payments during the year (202,375) (113,001)
Closing balance 278,262 202,230
11. CONTINGENCIES AND COMMITMENTS
11.1 Contingencies
(i) Claims against the Company not acknowledged as debt by the Company amount to Rs 9.79 million (2015: Rs 9.79
million). As the management is confident that the matter would be settled in its favor, consequently, no provision
has been made in these financial statements in respect of the above mentioned disputed liabilities.
(ii) In the previous years, the Company received notices from custom authorities for payment of custom duty and sales
tax in respect of certain components of Honda Cars imported during prior years. Custom authorities interpreted
that Completely Built Unit (CBU) rate of duty was applicable on such components and thus raised a demand of Rs
110 million. It included Rs 96 million on account of custom duty and Rs 14 million on account of sales tax.
The Company approached custom authorities on the grounds that the components specified in the above mentioned
notices included certain components which were duly appearing in the indigenization program of the Company for
the relevant period. Hence, CBU rate of duty was not applicable on import of these components. The Company has
made a provision of Rs 32 million against the total demand of Rs 110 million. As the management is confident that
the matter would be settled in its favor, consequently, no provision for the balance amount has been made in these
financial statements in respect of the above mentioned notices.
(iii) Custom, Excise and Sales Tax Appellate Tribunal (Appellate Tribunal) endorsed the demand of Rs 1,105.04 million
earlier raised against the Company on account of custom duty, sales tax and income tax on the grounds that ‘license
fee’ and ‘royalty’ paid to M/s Honda Motor Co., Ltd., Japan was includable in the ‘import value’ of ‘completely
knocked down’ kits of vehicles assembled by the Company and parts thereof.
The Company further agitated the matter before Honorable Lahore High Court that is pending adjudication. In this
respect, interim relief has been extended by Honorable Court and the Custom authorities have been refrained from
enforcing the recovery of the amount adjudged against the Company. No provision on this account has been made
in these financial statements as the Company’s management considers that its stance is founded on meritorious
grounds and relief will be secured from higher appellate fora. In this respect, it is the Company’s contention that
subject amount of ‘royalty’ and ‘license’ fee were relatable to the Company’s manufacturing facilities and not the
goods imported by it and hence such amounts cannot be considered as part and parcel of import value.
In addition to above, another demand of Rs 110.93 million, raised on substantially similar grounds in respect of
imports affected during the period from June 2008 to March 2009, have been endorsed by Collector (Appeals) and
the Company has preferred an appeal before Appellate Tribunal against such demand. While Appellate Tribunal is
not likely to extend any relief on this account due to its earlier decision on the matter, the liability on this account
has not been recognized in these financial statements as management expects a relief from higher appellate fora,
as explained above.
Similarly, the Company has preferred an appeal before Appellate Tribunal against another demand of Rs 523.72
million endorsed by Collector (Appeals) on substantially similar grounds in respect of imports affected during the
period from April 2009 to December 2010. While Appellate Tribunal is not likely to extend any relief on this account
due to its earlier decision on the matter, the liability on this account has not been recognized in these financial
statements as management expects a relief from higher appellate fora, as explained above.
(iv) Bank guarantees of Rs 249.02 million (2015: Rs 188.41 million) have been issued in favour of third parties.
11.2 Commitments in respect of
(i) Letters of credit and purchases for capital expenditure aggregating Rs 52.78 million (2015: 22.61 million).
(ii) Letters of credit and purchases, other than capital expenditure aggregating Rs 607.87 million (2015: Rs 767.93
million).
Notes to and Forming Part of the Financial StatementsFOR THE YEAR ENDED MARCH 31, 2016
66
67Annual Report 2016
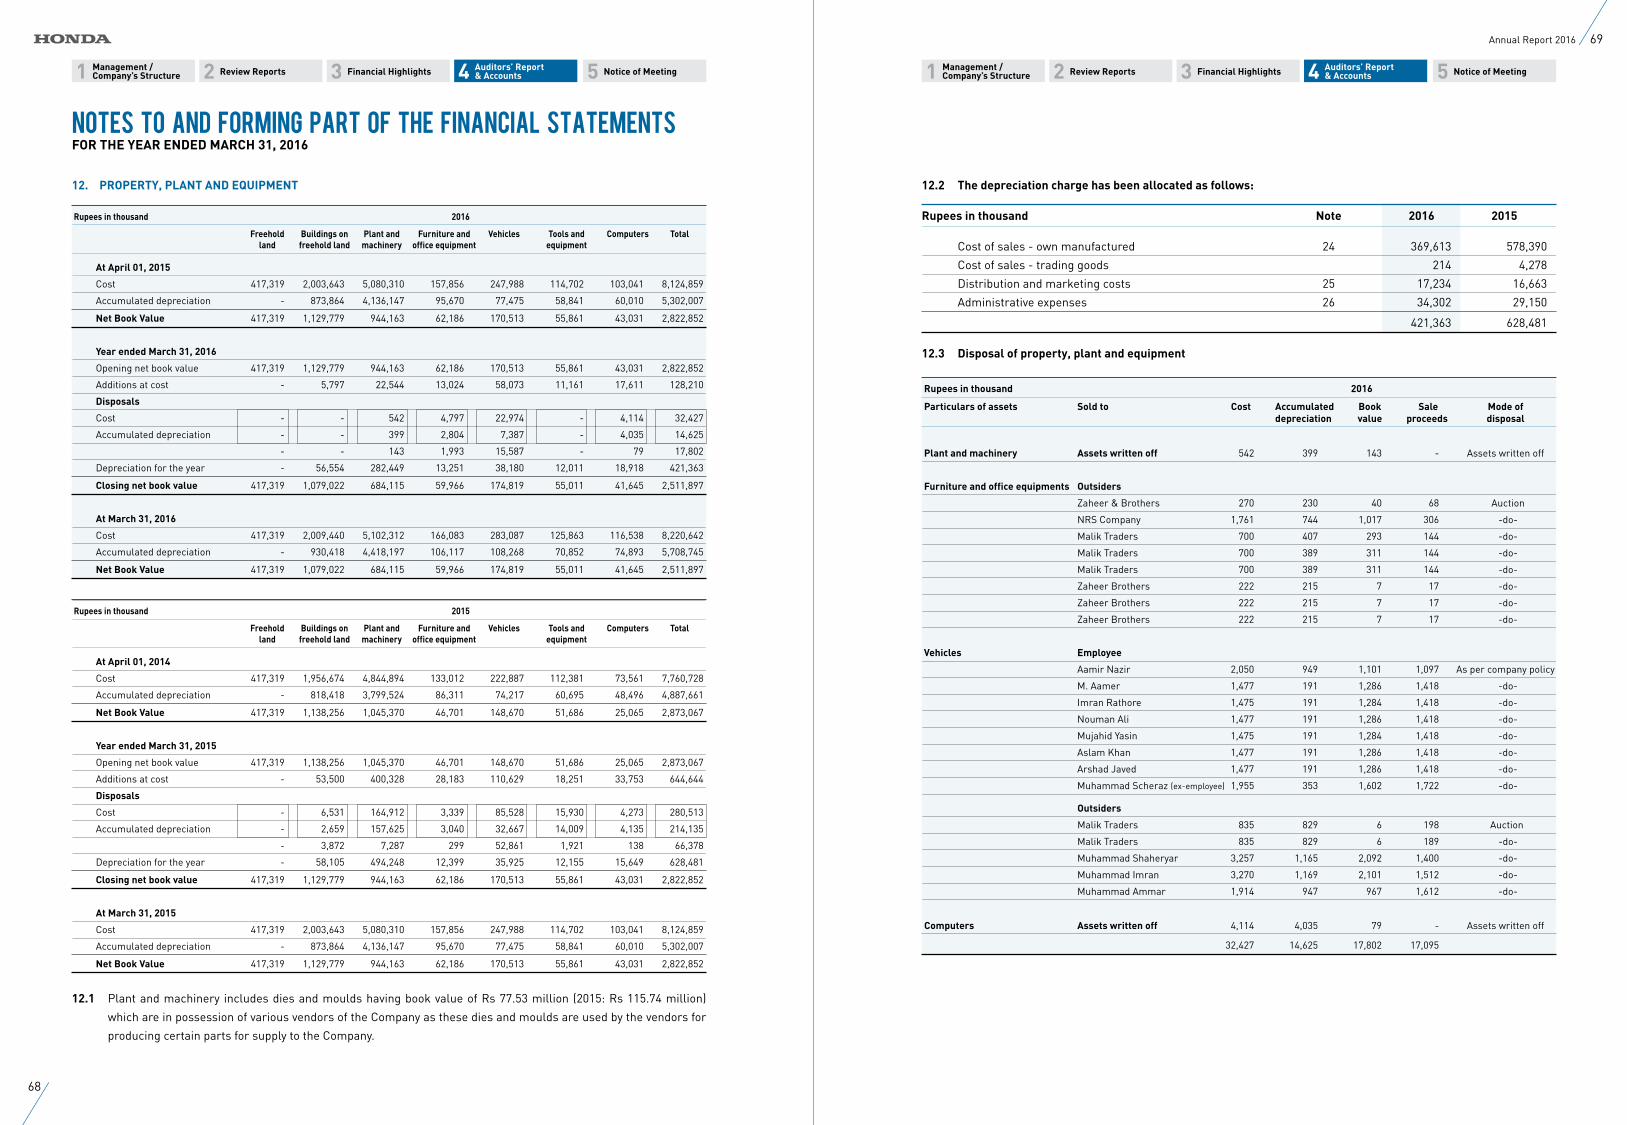
11 22 33 55 44 Management /Company’s Structure
Management /Company’s Structure
Auditors’ Report & Accounts
Auditors’ Report & Accounts Review ReportsReview Reports Financial HighlightsFinancial Highlights Notice of MeetingNotice of Meeting
12. PROPERTY, PLANT AND EQUIPMENT
Rupees in thousand 2016
Freehold Buildings on Plant and Furniture and Vehicles Tools and Computers Total land freehold land machinery office equipment equipment
At April 01, 2015
Cost 417,319 2,003,643 5,080,310 157,856 247,988 114,702 103,041 8,124,859
Accumulated depreciation - 873,864 4,136,147 95,670 77,475 58,841 60,010 5,302,007
Net Book Value 417,319 1,129,779 944,163 62,186 170,513 55,861 43,031 2,822,852
Year ended March 31, 2016
Opening net book value 417,319 1,129,779 944,163 62,186 170,513 55,861 43,031 2,822,852
Additions at cost - 5,797 22,544 13,024 58,073 11,161 17,611 128,210
Disposals
Cost - - 542 4,797 22,974 - 4,114 32,427
Accumulated depreciation - - 399 2,804 7,387 - 4,035 14,625
- - 143 1,993 15,587 - 79 17,802
Depreciation for the year - 56,554 282,449 13,251 38,180 12,011 18,918 421,363
Closing net book value 417,319 1,079,022 684,115 59,966 174,819 55,011 41,645 2,511,897
At March 31, 2016
Cost 417,319 2,009,440 5,102,312 166,083 283,087 125,863 116,538 8,220,642
Accumulated depreciation - 930,418 4,418,197 106,117 108,268 70,852 74,893 5,708,745
Net Book Value 417,319 1,079,022 684,115 59,966 174,819 55,011 41,645 2,511,897
Rupees in thousand 2015
Freehold Buildings on Plant and Furniture and Vehicles Tools and Computers Total land freehold land machinery office equipment equipment
At April 01, 2014
Cost 417,319 1,956,674 4,844,894 133,012 222,887 112,381 73,561 7,760,728
Accumulated depreciation - 818,418 3,799,524 86,311 74,217 60,695 48,496 4,887,661
Net Book Value 417,319 1,138,256 1,045,370 46,701 148,670 51,686 25,065 2,873,067
Year ended March 31, 2015
Opening net book value 417,319 1,138,256 1,045,370 46,701 148,670 51,686 25,065 2,873,067
Additions at cost - 53,500 400,328 28,183 110,629 18,251 33,753 644,644
Disposals
Cost - 6,531 164,912 3,339 85,528 15,930 4,273 280,513
Accumulated depreciation - 2,659 157,625 3,040 32,667 14,009 4,135 214,135
- 3,872 7,287 299 52,861 1,921 138 66,378
Depreciation for the year - 58,105 494,248 12,399 35,925 12,155 15,649 628,481
Closing net book value 417,319 1,129,779 944,163 62,186 170,513 55,861 43,031 2,822,852
At March 31, 2015
Cost 417,319 2,003,643 5,080,310 157,856 247,988 114,702 103,041 8,124,859
Accumulated depreciation - 873,864 4,136,147 95,670 77,475 58,841 60,010 5,302,007
Net Book Value 417,319 1,129,779 944,163 62,186 170,513 55,861 43,031 2,822,852
12.1 Plant and machinery includes dies and moulds having book value of Rs 77.53 million (2015: Rs 115.74 million)
which are in possession of various vendors of the Company as these dies and moulds are used by the vendors for
producing certain parts for supply to the Company.
12.2 The depreciation charge has been allocated as follows:
Rupees in thousand Note 2016 2015
Cost of sales - own manufactured 24 369,613 578,390
Cost of sales - trading goods 214 4,278
Distribution and marketing costs 25 17,234 16,663
Administrative expenses 26 34,302 29,150
421,363 628,481
12.3 Disposal of property, plant and equipment
Rupees in thousand 2016
Particulars of assets Sold to Cost Accumulated Book Sale Mode of depreciation value proceeds disposal
Plant and machinery Assets written off 542 399 143 - Assets written off
Furniture and office equipments Outsiders
Zaheer & Brothers 270 230 40 68 Auction
NRS Company 1,761 744 1,017 306 -do-
Malik Traders 700 407 293 144 -do-
Malik Traders 700 389 311 144 -do-
Malik Traders 700 389 311 144 -do-
Zaheer Brothers 222 215 7 17 -do-
Zaheer Brothers 222 215 7 17 -do-
Zaheer Brothers 222 215 7 17 -do-
Vehicles Employee
Aamir Nazir 2,050 949 1,101 1,097 As per company policy
M. Aamer 1,477 191 1,286 1,418 -do-
Imran Rathore 1,475 191 1,284 1,418 -do-
Nouman Ali 1,477 191 1,286 1,418 -do-
Mujahid Yasin 1,475 191 1,284 1,418 -do-
Aslam Khan 1,477 191 1,286 1,418 -do-
Arshad Javed 1,477 191 1,286 1,418 -do-
Muhammad Scheraz (ex-employee) 1,955 353 1,602 1,722 -do-
Outsiders
Malik Traders 835 829 6 198 Auction
Malik Traders 835 829 6 189 -do-
Muhammad Shaheryar 3,257 1,165 2,092 1,400 -do-
Muhammad Imran 3,270 1,169 2,101 1,512 -do-
Muhammad Ammar 1,914 947 967 1,612 -do-
Computers Assets written off 4,114 4,035 79 - Assets written off
32,427 14,625 17,802 17,095
Notes to and Forming Part of the Financial StatementsFOR THE YEAR ENDED MARCH 31, 2016
68
69Annual Report 2016
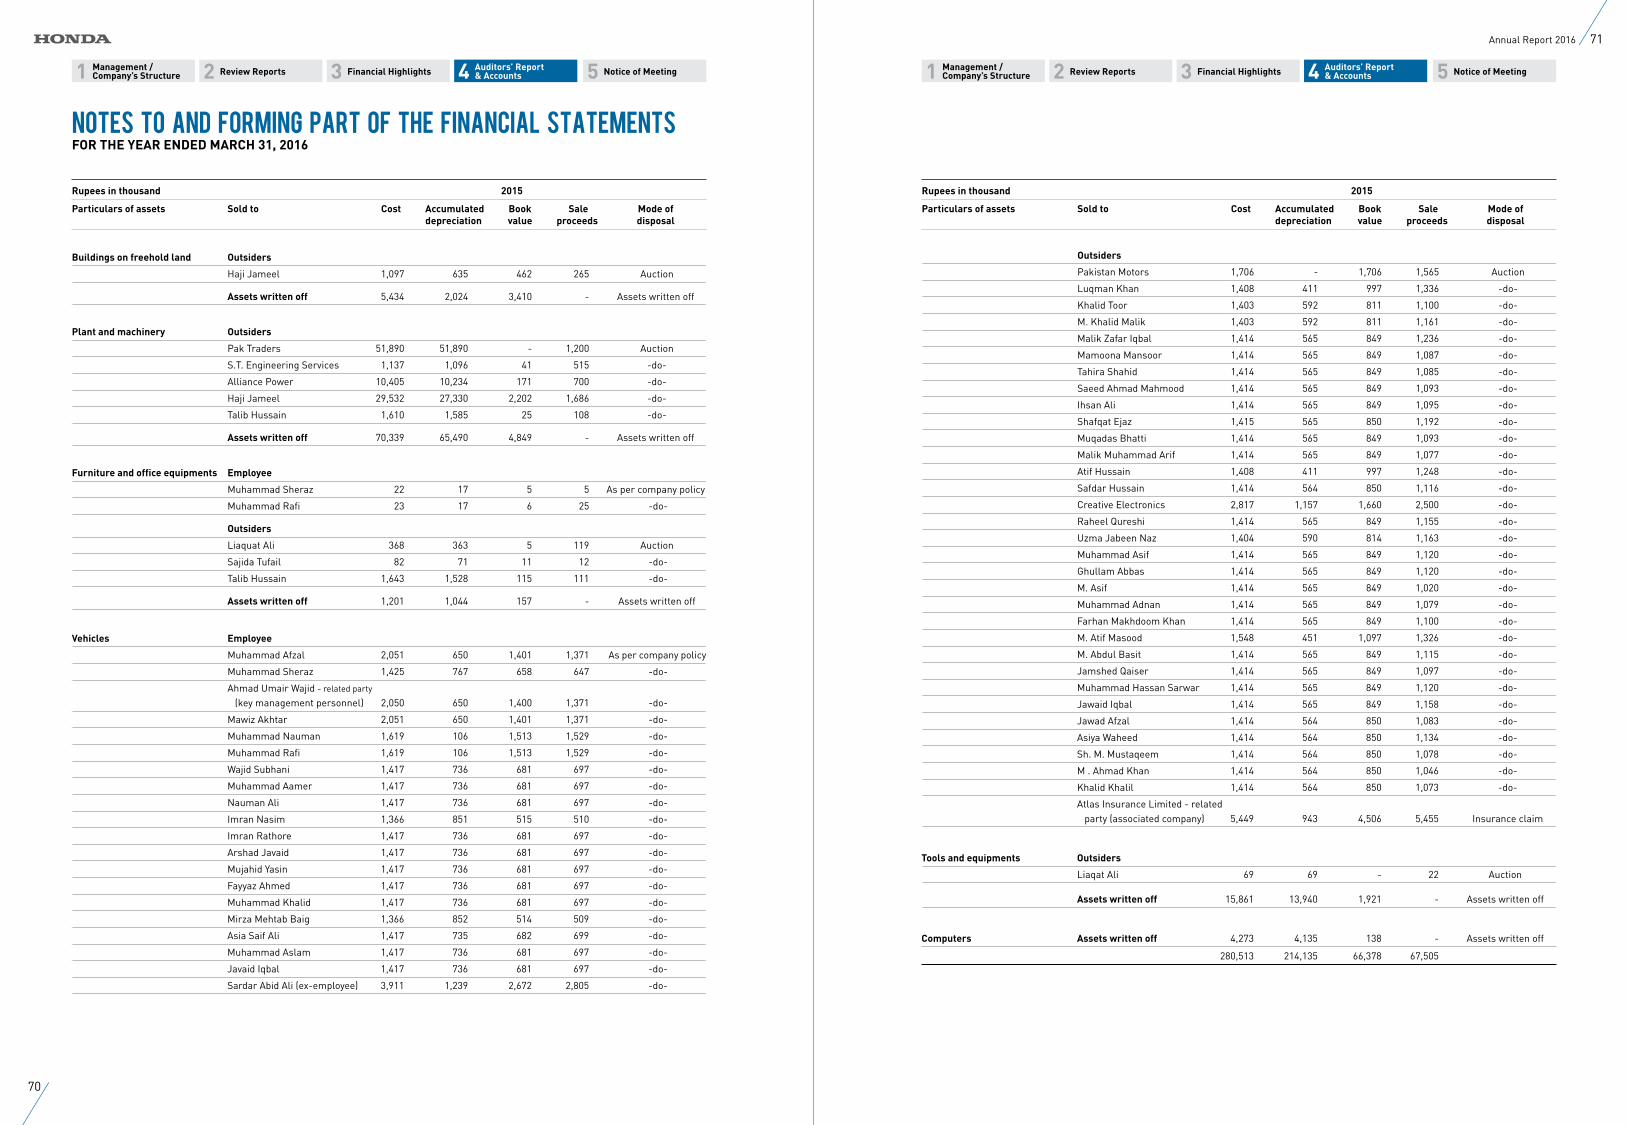
11 22 33 55 44 Management /Company’s Structure
Management /Company’s Structure
Auditors’ Report & Accounts
Auditors’ Report & Accounts Review ReportsReview Reports Financial HighlightsFinancial Highlights Notice of MeetingNotice of Meeting
Rupees in thousand 2015
Particulars of assets Sold to Cost Accumulated Book Sale Mode of depreciation value proceeds disposal
Buildings on freehold land Outsiders
Haji Jameel 1,097 635 462 265 Auction
Assets written off 5,434 2,024 3,410 - Assets written off
Plant and machinery Outsiders
Pak Traders 51,890 51,890 - 1,200 Auction
S.T. Engineering Services 1,137 1,096 41 515 -do-
Alliance Power 10,405 10,234 171 700 -do-
Haji Jameel 29,532 27,330 2,202 1,686 -do-
Talib Hussain 1,610 1,585 25 108 -do-
Assets written off 70,339 65,490 4,849 - Assets written off
Furniture and office equipments Employee
Muhammad Sheraz 22 17 5 5 As per company policy
Muhammad Rafi 23 17 6 25 -do-
Outsiders
Liaquat Ali 368 363 5 119 Auction
Sajida Tufail 82 71 11 12 -do-
Talib Hussain 1,643 1,528 115 111 -do-
Assets written off 1,201 1,044 157 - Assets written off
Vehicles Employee Muhammad Afzal 2,051 650 1,401 1,371 As per company policy
Muhammad Sheraz 1,425 767 658 647 -do-
Ahmad Umair Wajid - related party
(key management personnel) 2,050 650 1,400 1,371 -do-
Mawiz Akhtar 2,051 650 1,401 1,371 -do-
Muhammad Nauman 1,619 106 1,513 1,529 -do-
Muhammad Rafi 1,619 106 1,513 1,529 -do-
Wajid Subhani 1,417 736 681 697 -do-
Muhammad Aamer 1,417 736 681 697 -do-
Nauman Ali 1,417 736 681 697 -do-
Imran Nasim 1,366 851 515 510 -do-
Imran Rathore 1,417 736 681 697 -do-
Arshad Javaid 1,417 736 681 697 -do-
Mujahid Yasin 1,417 736 681 697 -do-
Fayyaz Ahmed 1,417 736 681 697 -do-
Muhammad Khalid 1,417 736 681 697 -do-
Mirza Mehtab Baig 1,366 852 514 509 -do-
Asia Saif Ali 1,417 735 682 699 -do-
Muhammad Aslam 1,417 736 681 697 -do-
Javaid Iqbal 1,417 736 681 697 -do-
Sardar Abid Ali (ex-employee) 3,911 1,239 2,672 2,805 -do-
Rupees in thousand 2015
Particulars of assets Sold to Cost Accumulated Book Sale Mode of depreciation value proceeds disposal
Outsiders
Pakistan Motors 1,706 - 1,706 1,565 Auction
Luqman Khan 1,408 411 997 1,336 -do-
Khalid Toor 1,403 592 811 1,100 -do-
M. Khalid Malik 1,403 592 811 1,161 -do-
Malik Zafar Iqbal 1,414 565 849 1,236 -do-
Mamoona Mansoor 1,414 565 849 1,087 -do-
Tahira Shahid 1,414 565 849 1,085 -do-
Saeed Ahmad Mahmood 1,414 565 849 1,093 -do-
Ihsan Ali 1,414 565 849 1,095 -do-
Shafqat Ejaz 1,415 565 850 1,192 -do-
Muqadas Bhatti 1,414 565 849 1,093 -do-
Malik Muhammad Arif 1,414 565 849 1,077 -do-
Atif Hussain 1,408 411 997 1,248 -do-
Safdar Hussain 1,414 564 850 1,116 -do-
Creative Electronics 2,817 1,157 1,660 2,500 -do-
Raheel Qureshi 1,414 565 849 1,155 -do-
Uzma Jabeen Naz 1,404 590 814 1,163 -do-
Muhammad Asif 1,414 565 849 1,120 -do-
Ghullam Abbas 1,414 565 849 1,120 -do-
M. Asif 1,414 565 849 1,020 -do-
Muhammad Adnan 1,414 565 849 1,079 -do-
Farhan Makhdoom Khan 1,414 565 849 1,100 -do-
M. Atif Masood 1,548 451 1,097 1,326 -do-
M. Abdul Basit 1,414 565 849 1,115 -do-
Jamshed Qaiser 1,414 565 849 1,097 -do-
Muhammad Hassan Sarwar 1,414 565 849 1,120 -do-
Jawaid Iqbal 1,414 565 849 1,158 -do-
Jawad Afzal 1,414 564 850 1,083 -do-
Asiya Waheed 1,414 564 850 1,134 -do-
Sh. M. Mustaqeem 1,414 564 850 1,078 -do-
M . Ahmad Khan 1,414 564 850 1,046 -do-
Khalid Khalil 1,414 564 850 1,073 -do-
Atlas Insurance Limited - related party (associated company) 5,449 943 4,506 5,455 Insurance claim
Tools and equipments Outsiders
Liaqat Ali 69 69 - 22 Auction
Assets written off 15,861 13,940 1,921 - Assets written off
Computers Assets written off 4,273 4,135 138 - Assets written off
280,513 214,135 66,378 67,505
Notes to and Forming Part of the Financial StatementsFOR THE YEAR ENDED MARCH 31, 2016
70
71Annual Report 2016
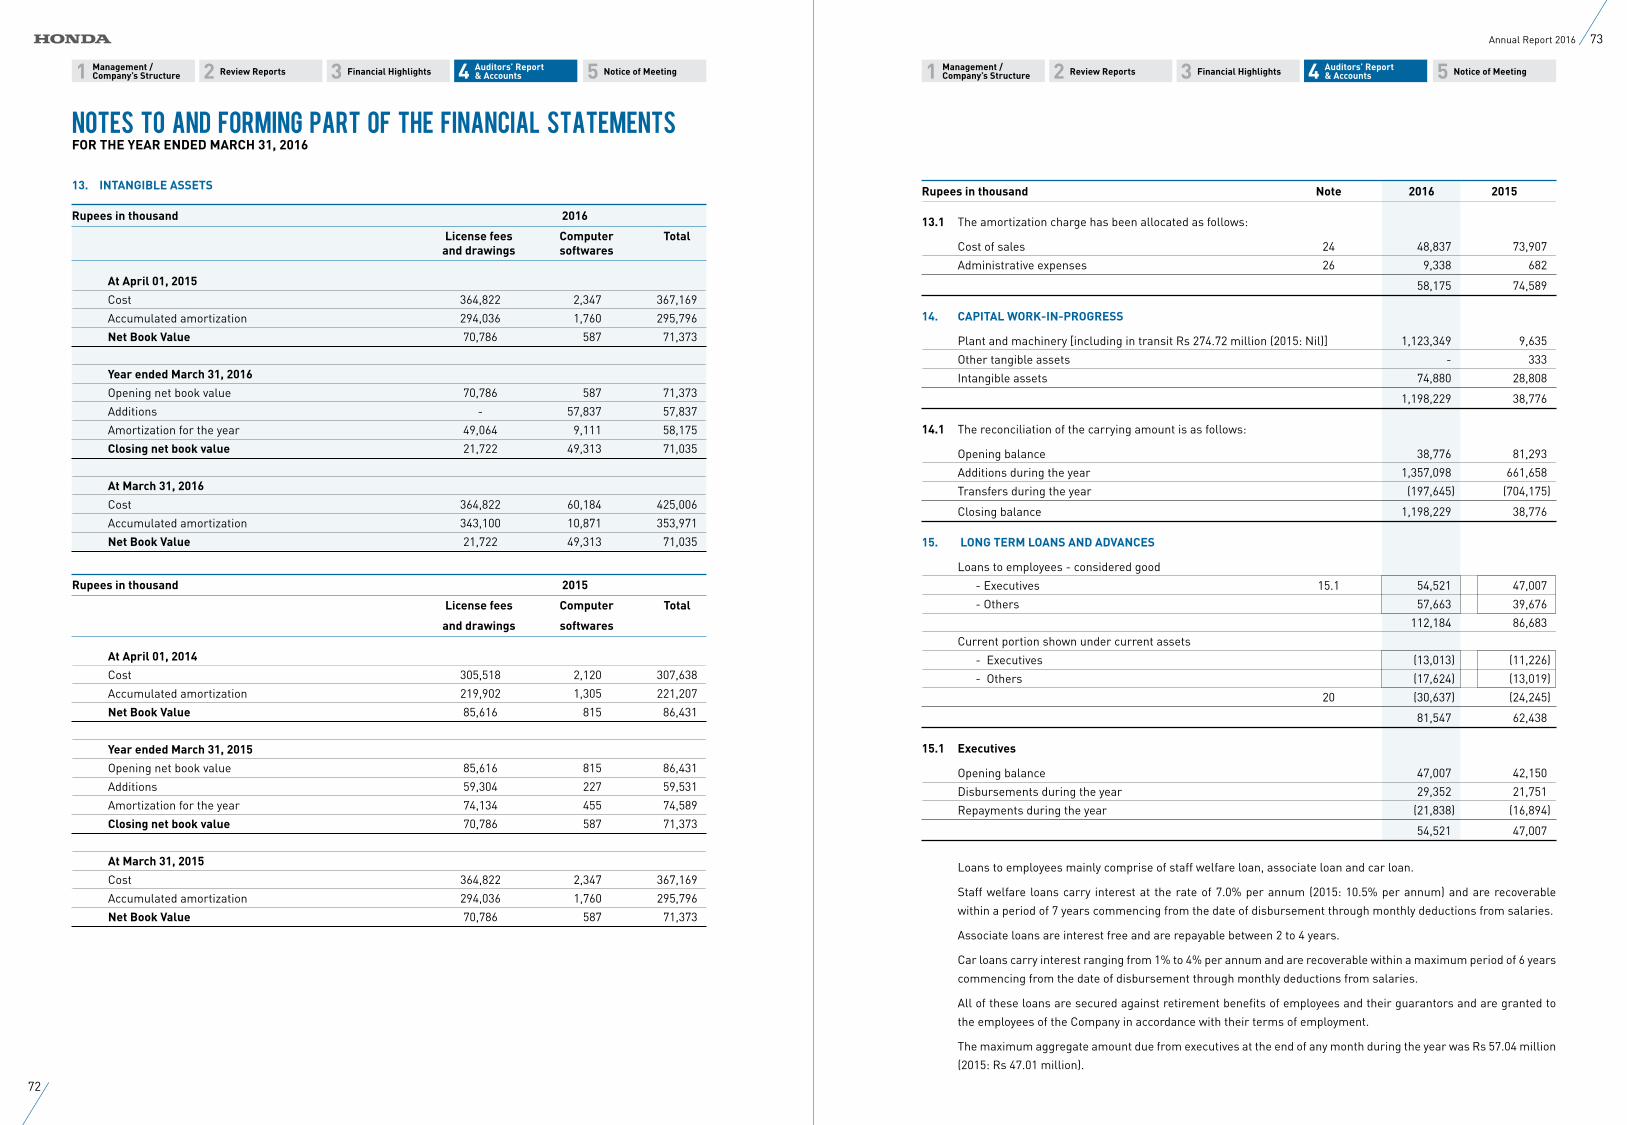
11 22 33 55 44 Management /Company’s Structure
Management /Company’s Structure
Auditors’ Report & Accounts
Auditors’ Report & Accounts Review ReportsReview Reports Financial HighlightsFinancial Highlights Notice of MeetingNotice of Meeting
13. INTANGIBLE ASSETS
Rupees in thousand 2016
License fees Computer Total and drawings softwares
At April 01, 2015
Cost 364,822 2,347 367,169
Accumulated amortization 294,036 1,760 295,796
Net Book Value 70,786 587 71,373
Year ended March 31, 2016
Opening net book value 70,786 587 71,373
Additions - 57,837 57,837
Amortization for the year 49,064 9,111 58,175
Closing net book value 21,722 49,313 71,035
At March 31, 2016
Cost 364,822 60,184 425,006
Accumulated amortization 343,100 10,871 353,971
Net Book Value 21,722 49,313 71,035
Rupees in thousand 2015
License fees Computer Total
and drawings softwares
At April 01, 2014
Cost 305,518 2,120 307,638
Accumulated amortization 219,902 1,305 221,207
Net Book Value 85,616 815 86,431
Year ended March 31, 2015
Opening net book value 85,616 815 86,431
Additions 59,304 227 59,531
Amortization for the year 74,134 455 74,589
Closing net book value 70,786 587 71,373
At March 31, 2015
Cost 364,822 2,347 367,169
Accumulated amortization 294,036 1,760 295,796
Net Book Value 70,786 587 71,373
Rupees in thousand Note 2016 2015
13.1 The amortization charge has been allocated as follows:
Cost of sales 24 48,837 73,907
Administrative expenses 26 9,338 682
58,175 74,589
14. CAPITAL WORK-IN-PROGRESS
Plant and machinery [including in transit Rs 274.72 million (2015: Nil)] 1,123,349 9,635
Other tangible assets - 333
Intangible assets 74,880 28,808
1,198,229 38,776
14.1 The reconciliation of the carrying amount is as follows:
Opening balance 38,776 81,293
Additions during the year 1,357,098 661,658
Transfers during the year (197,645) (704,175)
Closing balance 1,198,229 38,776
15. LONG TERM LOANS AND ADVANCES
Loans to employees - considered good
- Executives 15.1 54,521 47,007
- Others 57,663 39,676
112,184 86,683
Current portion shown under current assets
- Executives (13,013) (11,226)
- Others (17,624) (13,019)
20 (30,637) (24,245)
81,547 62,438
15.1 Executives
Opening balance 47,007 42,150
Disbursements during the year 29,352 21,751
Repayments during the year (21,838) (16,894)
54,521 47,007
Loans to employees mainly comprise of staff welfare loan, associate loan and car loan.
Staff welfare loans carry interest at the rate of 7.0% per annum (2015: 10.5% per annum) and are recoverable
within a period of 7 years commencing from the date of disbursement through monthly deductions from salaries.
Associate loans are interest free and are repayable between 2 to 4 years.
Car loans carry interest ranging from 1% to 4% per annum and are recoverable within a maximum period of 6 years
commencing from the date of disbursement through monthly deductions from salaries.
All of these loans are secured against retirement benefits of employees and their guarantors and are granted to
the employees of the Company in accordance with their terms of employment.
The maximum aggregate amount due from executives at the end of any month during the year was Rs 57.04 million
(2015: Rs 47.01 million).
Notes to and Forming Part of the Financial StatementsFOR THE YEAR ENDED MARCH 31, 2016
72
73Annual Report 2016
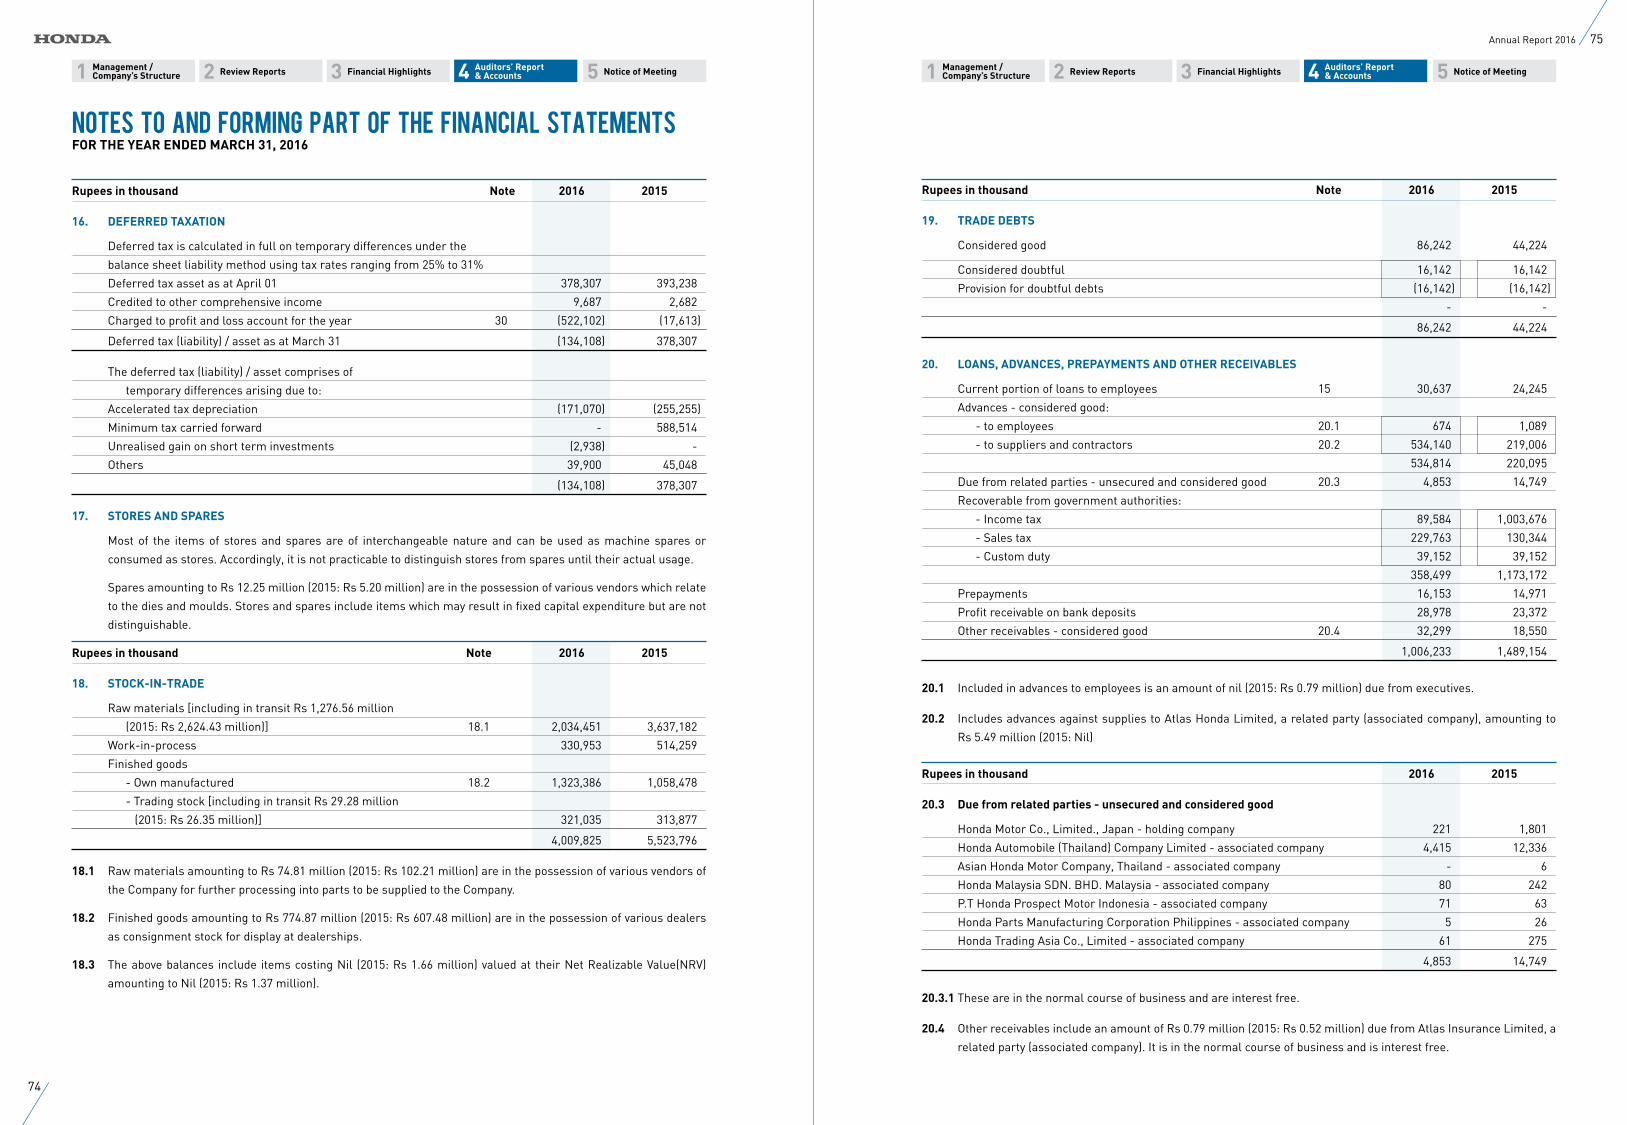
11 22 33 55 44 Management /Company’s Structure
Management /Company’s Structure
Auditors’ Report & Accounts
Auditors’ Report & Accounts Review ReportsReview Reports Financial HighlightsFinancial Highlights Notice of MeetingNotice of Meeting
Rupees in thousand Note 2016 2015
16. DEFERRED TAXATION
Deferred tax is calculated in full on temporary differences under the
balance sheet liability method using tax rates ranging from 25% to 31%
Deferred tax asset as at April 01 378,307 393,238
Credited to other comprehensive income 9,687 2,682
Charged to profit and loss account for the year 30 (522,102) (17,613)
Deferred tax (liability) / asset as at March 31 (134,108) 378,307
The deferred tax (liability) / asset comprises of
temporary differences arising due to:
Accelerated tax depreciation (171,070) (255,255)
Minimum tax carried forward - 588,514
Unrealised gain on short term investments (2,938) -
Others 39,900 45,048
(134,108) 378,307
17. STORES AND SPARES
Most of the items of stores and spares are of interchangeable nature and can be used as machine spares or
consumed as stores. Accordingly, it is not practicable to distinguish stores from spares until their actual usage.
Spares amounting to Rs 12.25 million (2015: Rs 5.20 million) are in the possession of various vendors which relate
to the dies and moulds. Stores and spares include items which may result in fixed capital expenditure but are not
distinguishable.
Rupees in thousand Note 2016 2015
18. STOCK-IN-TRADE
Raw materials [including in transit Rs 1,276.56 million
(2015: Rs 2,624.43 million)] 18.1 2,034,451 3,637,182
Work-in-process 330,953 514,259
Finished goods
- Own manufactured 18.2 1,323,386 1,058,478
- Trading stock [including in transit Rs 29.28 million
(2015: Rs 26.35 million)] 321,035 313,877
4,009,825 5,523,796
18.1 Raw materials amounting to Rs 74.81 million (2015: Rs 102.21 million) are in the possession of various vendors of
the Company for further processing into parts to be supplied to the Company.
18.2 Finished goods amounting to Rs 774.87 million (2015: Rs 607.48 million) are in the possession of various dealers
as consignment stock for display at dealerships.
18.3 The above balances include items costing Nil (2015: Rs 1.66 million) valued at their Net Realizable Value(NRV)
amounting to Nil (2015: Rs 1.37 million).
Rupees in thousand Note 2016 2015
19. TRADE DEBTS
Considered good 86,242 44,224
Considered doubtful 16,142 16,142
Provision for doubtful debts (16,142) (16,142)
- -
86,242 44,224
20. LOANS, ADVANCES, PREPAYMENTS AND OTHER RECEIVABLES
Current portion of loans to employees 15 30,637 24,245
Advances - considered good:
- to employees 20.1 674 1,089
- to suppliers and contractors 20.2 534,140 219,006
534,814 220,095
Due from related parties - unsecured and considered good 20.3 4,853 14,749
Recoverable from government authorities:
- Income tax 89,584 1,003,676
- Sales tax 229,763 130,344
- Custom duty 39,152 39,152
358,499 1,173,172
Prepayments 16,153 14,971
Profit receivable on bank deposits 28,978 23,372
Other receivables - considered good 20.4 32,299 18,550
1,006,233 1,489,154
20.1 Included in advances to employees is an amount of nil (2015: Rs 0.79 million) due from executives.
20.2 Includes advances against supplies to Atlas Honda Limited, a related party (associated company), amounting to
Rs 5.49 million (2015: Nil)
Rupees in thousand 2016 2015
20.3 Due from related parties - unsecured and considered good
Honda Motor Co., Limited., Japan - holding company 221 1,801
Honda Automobile (Thailand) Company Limited - associated company 4,415 12,336
Asian Honda Motor Company, Thailand - associated company - 6
Honda Malaysia SDN. BHD. Malaysia - associated company 80 242
P.T Honda Prospect Motor Indonesia - associated company 71 63
Honda Parts Manufacturing Corporation Philippines - associated company 5 26
Honda Trading Asia Co., Limited - associated company 61 275
4,853 14,749
20.3.1 These are in the normal course of business and are interest free.
20.4 Other receivables include an amount of Rs 0.79 million (2015: Rs 0.52 million) due from Atlas Insurance Limited, a
related party (associated company). It is in the normal course of business and is interest free.
Notes to and Forming Part of the Financial StatementsFOR THE YEAR ENDED MARCH 31, 2016
74
75Annual Report 2016
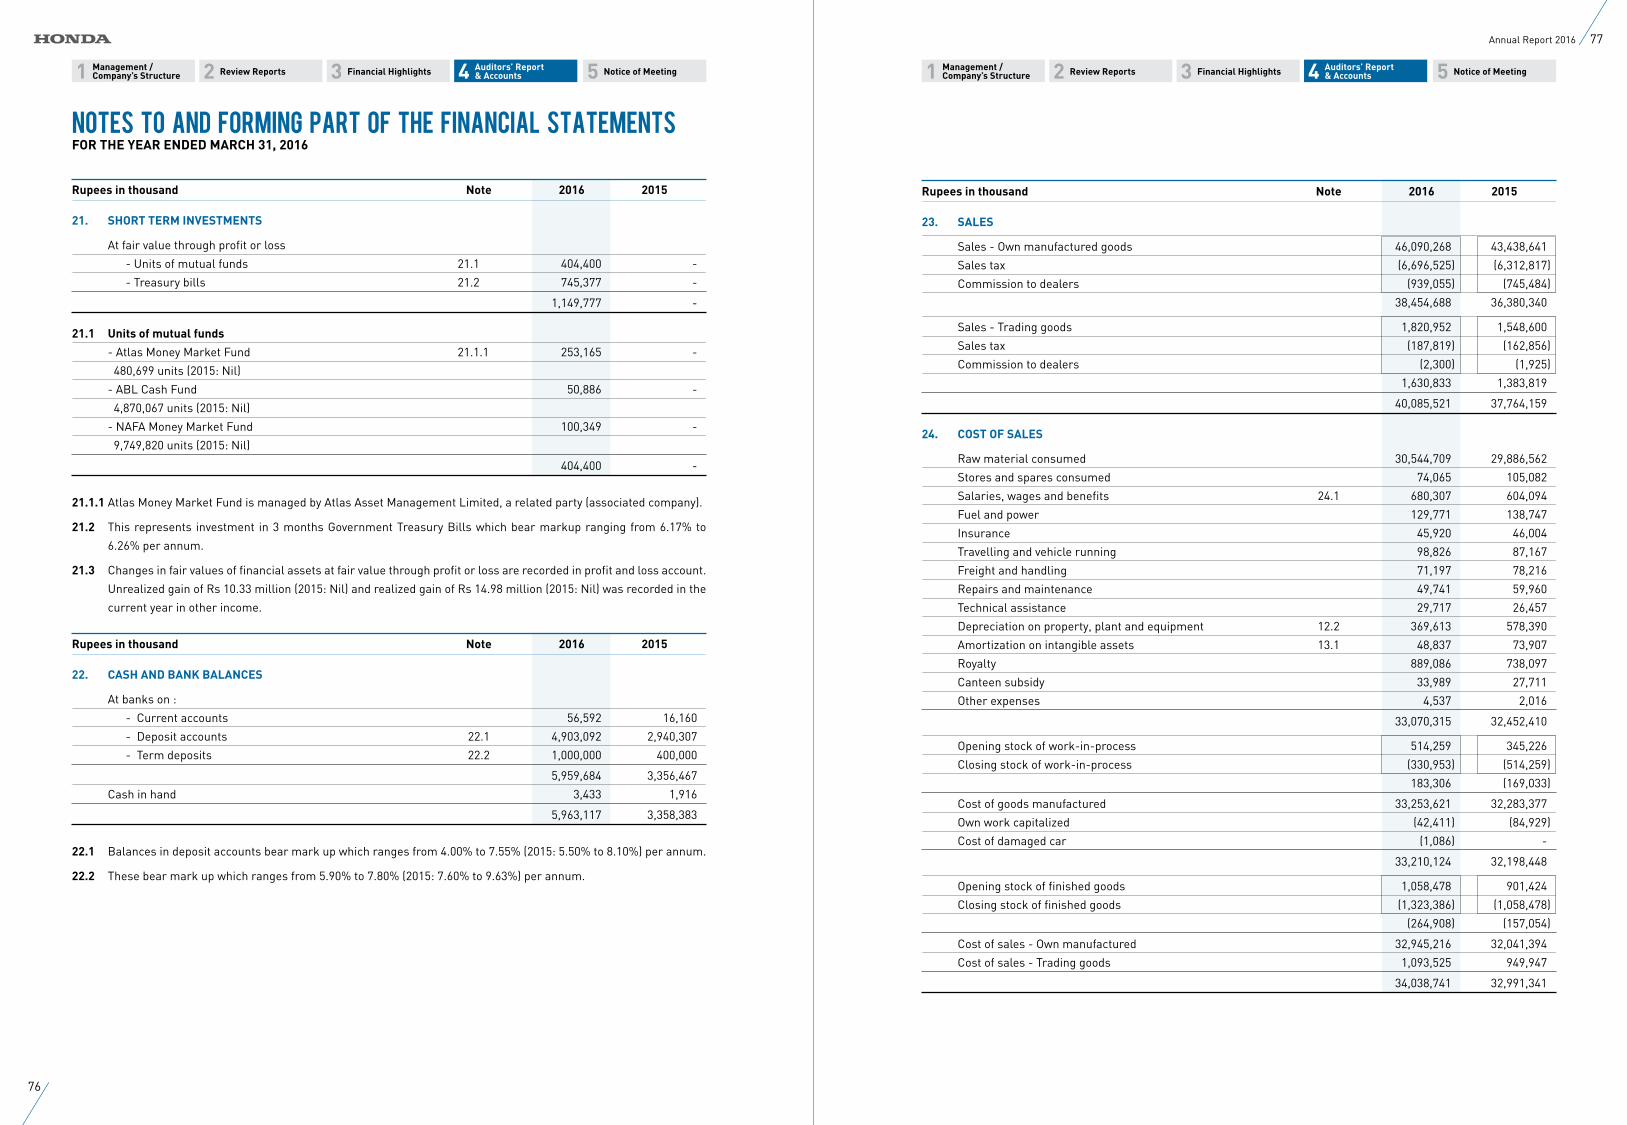
11 22 33 55 44 Management /Company’s Structure
Management /Company’s Structure
Auditors’ Report & Accounts
Auditors’ Report & Accounts Review ReportsReview Reports Financial HighlightsFinancial Highlights Notice of MeetingNotice of Meeting
Rupees in thousand Note 2016 2015
21. SHORT TERM INVESTMENTS
At fair value through profit or loss
- Units of mutual funds 21.1 404,400 -
- Treasury bills 21.2 745,377 -
1,149,777 -
21.1 Units of mutual funds
- Atlas Money Market Fund 21.1.1 253,165 -
480,699 units (2015: Nil)
- ABL Cash Fund 50,886 -
4,870,067 units (2015: Nil)
- NAFA Money Market Fund 100,349 -
9,749,820 units (2015: Nil)
404,400 -
21.1.1 Atlas Money Market Fund is managed by Atlas Asset Management Limited, a related party (associated company).
21.2 This represents investment in 3 months Government Treasury Bills which bear markup ranging from 6.17% to
6.26% per annum.
21.3 Changes in fair values of financial assets at fair value through profit or loss are recorded in profit and loss account.
Unrealized gain of Rs 10.33 million (2015: Nil) and realized gain of Rs 14.98 million (2015: Nil) was recorded in the
current year in other income.
Rupees in thousand Note 2016 2015
22. CASH AND BANK BALANCES
At banks on :
- Current accounts 56,592 16,160
- Deposit accounts 22.1 4,903,092 2,940,307
- Term deposits 22.2 1,000,000 400,000
5,959,684 3,356,467
Cash in hand 3,433 1,916
5,963,117 3,358,383
22.1 Balances in deposit accounts bear mark up which ranges from 4.00% to 7.55% (2015: 5.50% to 8.10%) per annum.
22.2 These bear mark up which ranges from 5.90% to 7.80% (2015: 7.60% to 9.63%) per annum.
Rupees in thousand Note 2016 2015
23. SALES
Sales - Own manufactured goods 46,090,268 43,438,641
Sales tax (6,696,525) (6,312,817)
Commission to dealers (939,055) (745,484)
38,454,688 36,380,340
Sales - Trading goods 1,820,952 1,548,600
Sales tax (187,819) (162,856)
Commission to dealers (2,300) (1,925)
1,630,833 1,383,819
40,085,521 37,764,159
24. COST OF SALES
Raw material consumed 30,544,709 29,886,562
Stores and spares consumed 74,065 105,082
Salaries, wages and benefits 24.1 680,307 604,094
Fuel and power 129,771 138,747
Insurance 45,920 46,004
Travelling and vehicle running 98,826 87,167
Freight and handling 71,197 78,216
Repairs and maintenance 49,741 59,960
Technical assistance 29,717 26,457
Depreciation on property, plant and equipment 12.2 369,613 578,390
Amortization on intangible assets 13.1 48,837 73,907
Royalty 889,086 738,097
Canteen subsidy 33,989 27,711
Other expenses 4,537 2,016
33,070,315 32,452,410
Opening stock of work-in-process 514,259 345,226
Closing stock of work-in-process (330,953) (514,259)
183,306 (169,033)
Cost of goods manufactured 33,253,621 32,283,377
Own work capitalized (42,411) (84,929)
Cost of damaged car (1,086) -
33,210,124 32,198,448
Opening stock of finished goods 1,058,478 901,424
Closing stock of finished goods (1,323,386) (1,058,478)
(264,908) (157,054)
Cost of sales - Own manufactured 32,945,216 32,041,394
Cost of sales - Trading goods 1,093,525 949,947
34,038,741 32,991,341
Notes to and Forming Part of the Financial StatementsFOR THE YEAR ENDED MARCH 31, 2016
76
77Annual Report 2016
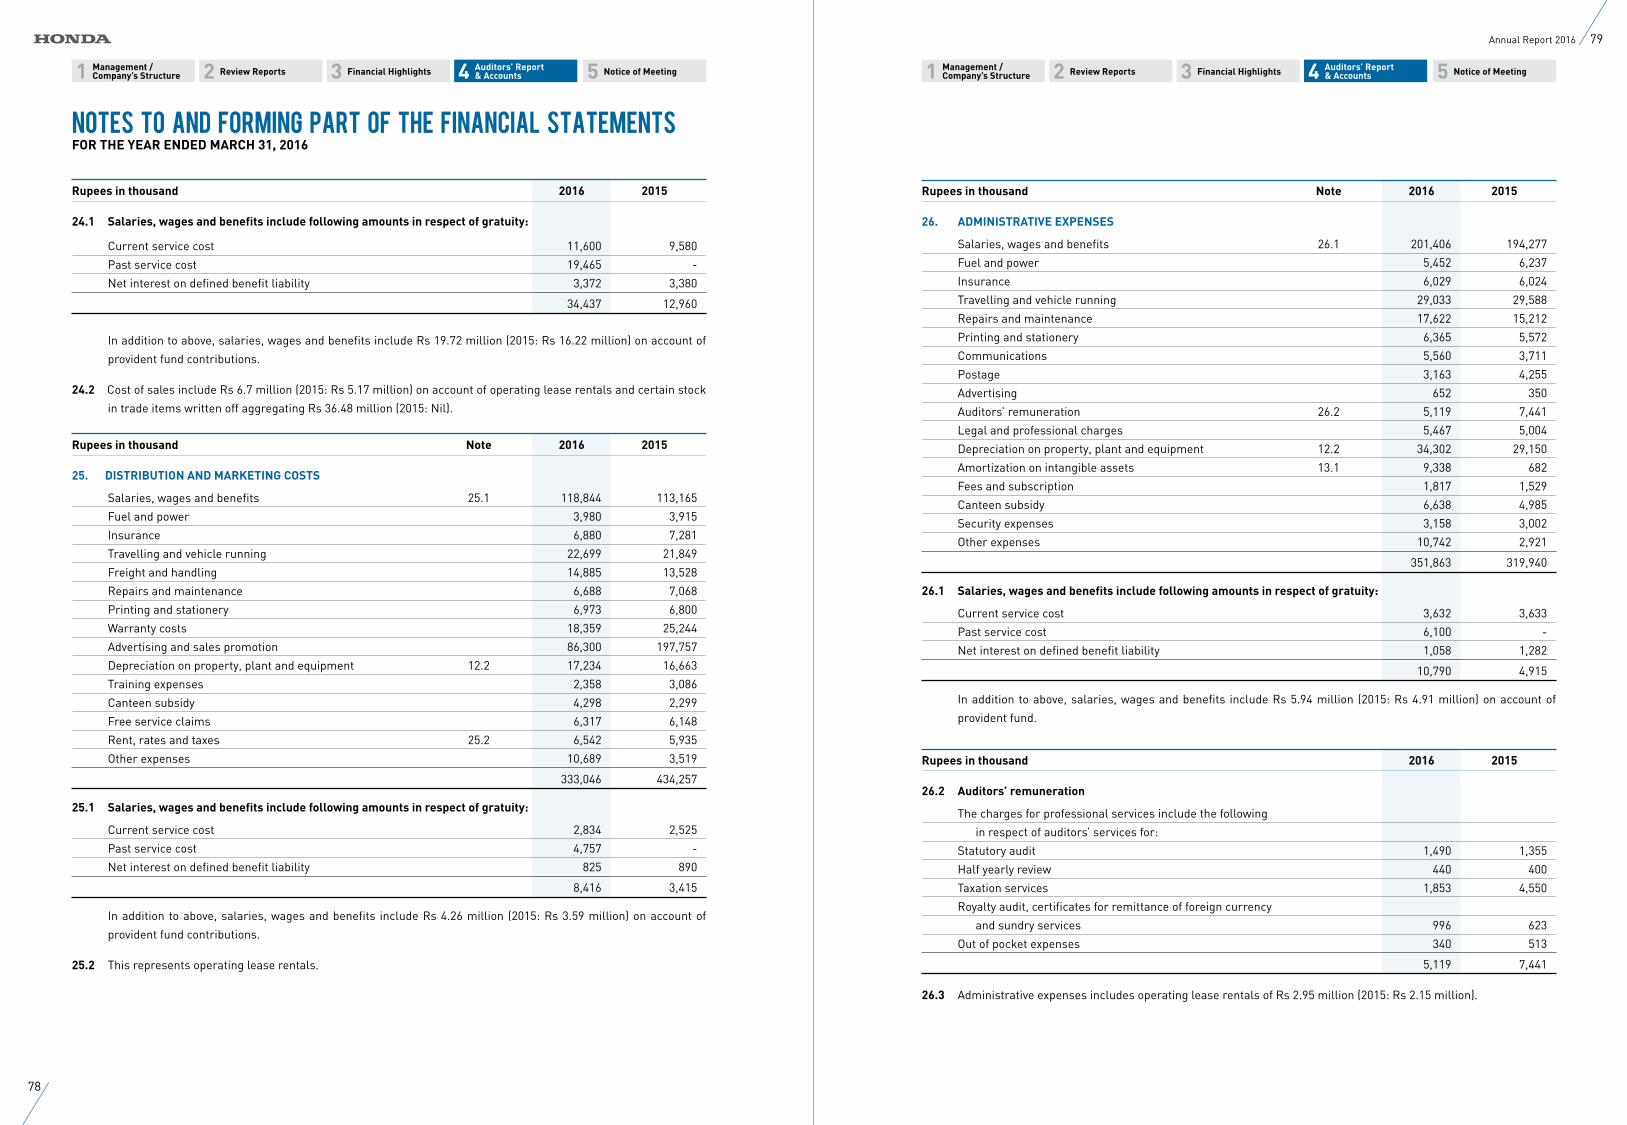
11 22 33 55 44 Management /Company’s Structure
Management /Company’s Structure
Auditors’ Report & Accounts
Auditors’ Report & Accounts Review ReportsReview Reports Financial HighlightsFinancial Highlights Notice of MeetingNotice of Meeting
Rupees in thousand 2016 2015
24.1 Salaries, wages and benefits include following amounts in respect of gratuity:
Current service cost 11,600 9,580
Past service cost 19,465 -
Net interest on defined benefit liability 3,372 3,380
34,437 12,960
In addition to above, salaries, wages and benefits include Rs 19.72 million (2015: Rs 16.22 million) on account of
provident fund contributions.
24.2 Cost of sales include Rs 6.7 million (2015: Rs 5.17 million) on account of operating lease rentals and certain stock
in trade items written off aggregating Rs 36.48 million (2015: Nil).
Rupees in thousand Note 2016 2015
25. DISTRIBUTION AND MARKETING COSTS
Salaries, wages and benefits 25.1 118,844 113,165
Fuel and power 3,980 3,915
Insurance 6,880 7,281
Travelling and vehicle running 22,699 21,849
Freight and handling 14,885 13,528
Repairs and maintenance 6,688 7,068
Printing and stationery 6,973 6,800
Warranty costs 18,359 25,244
Advertising and sales promotion 86,300 197,757
Depreciation on property, plant and equipment 12.2 17,234 16,663
Training expenses 2,358 3,086
Canteen subsidy 4,298 2,299
Free service claims 6,317 6,148
Rent, rates and taxes 25.2 6,542 5,935
Other expenses 10,689 3,519
333,046 434,257
25.1 Salaries, wages and benefits include following amounts in respect of gratuity:
Current service cost 2,834 2,525
Past service cost 4,757 -
Net interest on defined benefit liability 825 890
8,416 3,415
In addition to above, salaries, wages and benefits include Rs 4.26 million (2015: Rs 3.59 million) on account of
provident fund contributions.
25.2 This represents operating lease rentals.
Rupees in thousand Note 2016 2015
26. ADMINISTRATIVE EXPENSES
Salaries, wages and benefits 26.1 201,406 194,277
Fuel and power 5,452 6,237
Insurance 6,029 6,024
Travelling and vehicle running 29,033 29,588
Repairs and maintenance 17,622 15,212
Printing and stationery 6,365 5,572
Communications 5,560 3,711
Postage 3,163 4,255
Advertising 652 350
Auditors’ remuneration 26.2 5,119 7,441
Legal and professional charges 5,467 5,004
Depreciation on property, plant and equipment 12.2 34,302 29,150
Amortization on intangible assets 13.1 9,338 682
Fees and subscription 1,817 1,529
Canteen subsidy 6,638 4,985
Security expenses 3,158 3,002
Other expenses 10,742 2,921
351,863 319,940
26.1 Salaries, wages and benefits include following amounts in respect of gratuity:
Current service cost 3,632 3,633
Past service cost 6,100 -
Net interest on defined benefit liability 1,058 1,282
10,790 4,915
In addition to above, salaries, wages and benefits include Rs 5.94 million (2015: Rs 4.91 million) on account of
provident fund.
Rupees in thousand 2016 2015
26.2 Auditors’ remuneration
The charges for professional services include the following
in respect of auditors’ services for:
Statutory audit 1,490 1,355
Half yearly review 440 400
Taxation services 1,853 4,550
Royalty audit, certificates for remittance of foreign currency
and sundry services 996 623
Out of pocket expenses 340 513
5,119 7,441
26.3 Administrative expenses includes operating lease rentals of Rs 2.95 million (2015: Rs 2.15 million).
Notes to and Forming Part of the Financial StatementsFOR THE YEAR ENDED MARCH 31, 2016
78
79Annual Report 2016
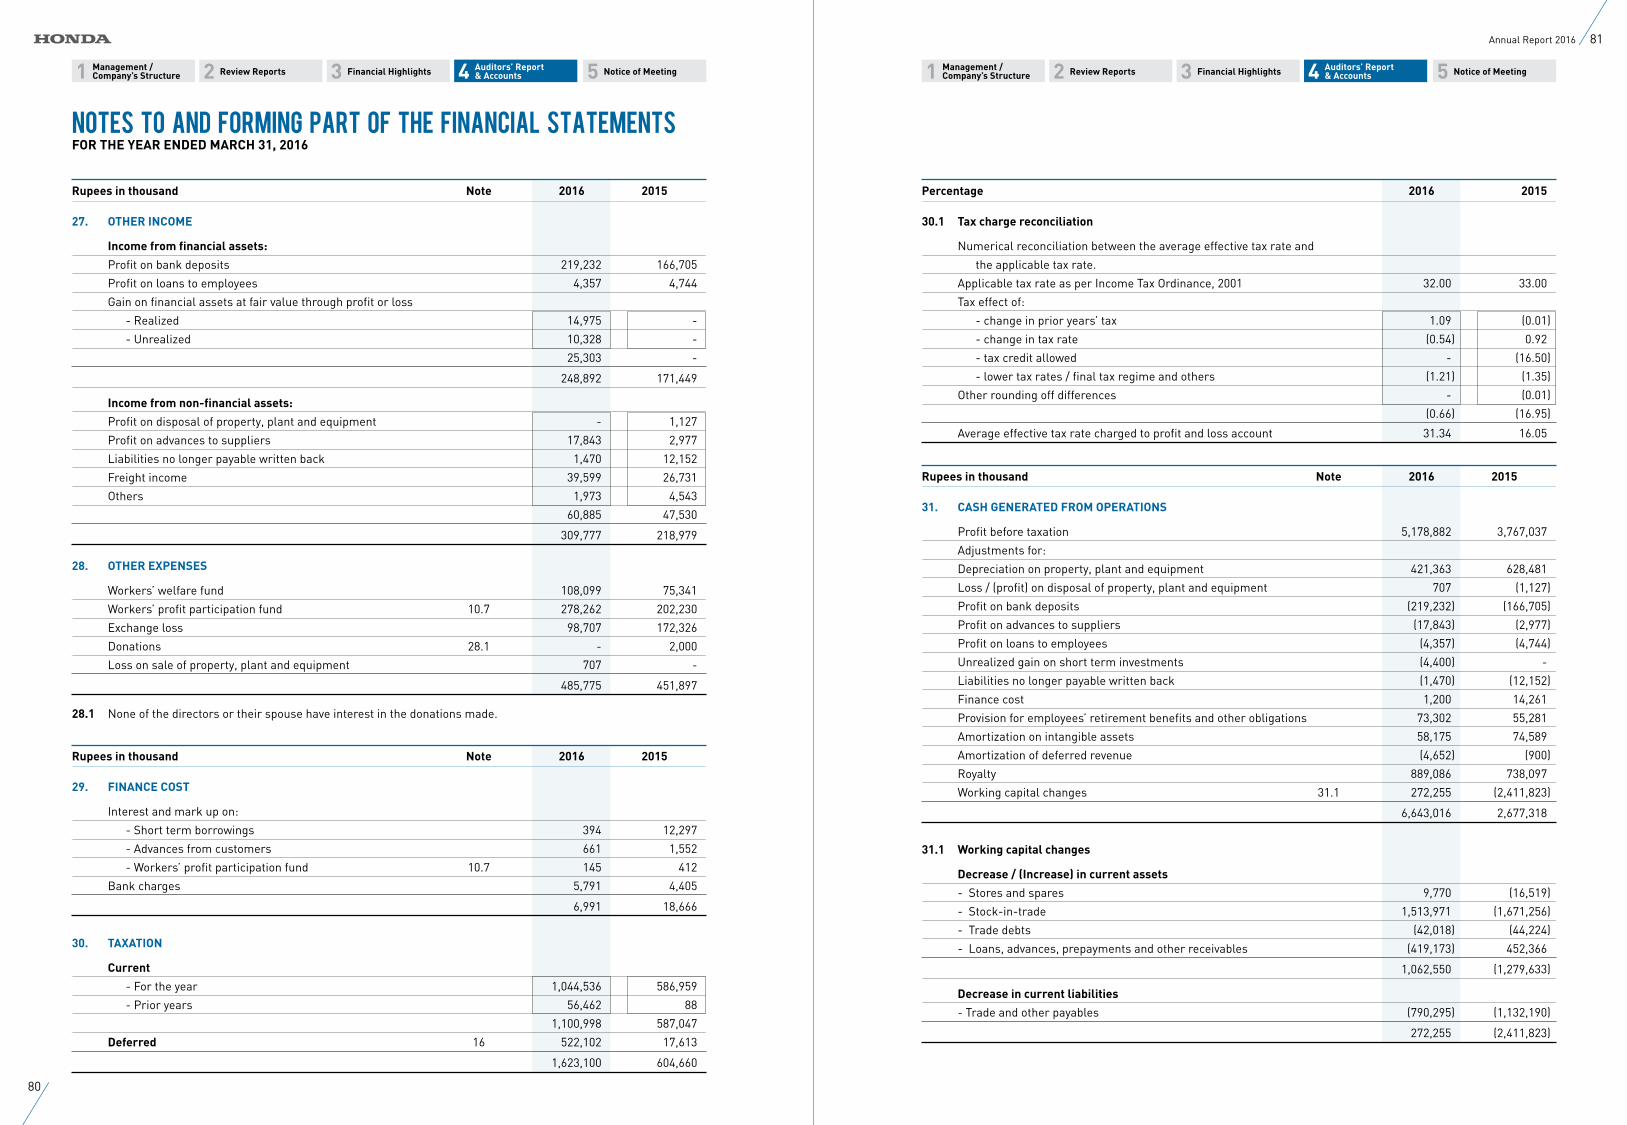
11 22 33 55 44 Management /Company’s Structure
Management /Company’s Structure
Auditors’ Report & Accounts
Auditors’ Report & Accounts Review ReportsReview Reports Financial HighlightsFinancial Highlights Notice of MeetingNotice of Meeting
Rupees in thousand Note 2016 2015
27. OTHER INCOME
Income from financial assets:
Profit on bank deposits 219,232 166,705
Profit on loans to employees 4,357 4,744
Gain on financial assets at fair value through profit or loss
- Realized 14,975 -
- Unrealized 10,328 -
25,303 -
248,892 171,449
Income from non-financial assets:
Profit on disposal of property, plant and equipment - 1,127
Profit on advances to suppliers 17,843 2,977
Liabilities no longer payable written back 1,470 12,152
Freight income 39,599 26,731
Others 1,973 4,543
60,885 47,530
309,777 218,979
28. OTHER EXPENSES
Workers’ welfare fund 108,099 75,341
Workers’ profit participation fund 10.7 278,262 202,230
Exchange loss 98,707 172,326
Donations 28.1 - 2,000
Loss on sale of property, plant and equipment 707 -
485,775 451,897
28.1 None of the directors or their spouse have interest in the donations made.
Rupees in thousand Note 2016 2015
29. FINANCE COST
Interest and mark up on:
- Short term borrowings 394 12,297
- Advances from customers 661 1,552
- Workers’ profit participation fund 10.7 145 412
Bank charges 5,791 4,405
6,991 18,666
30. TAXATION
Current
- For the year 1,044,536 586,959
- Prior years 56,462 88
1,100,998 587,047
Deferred 16 522,102 17,613
1,623,100 604,660
Percentage 2016 2015
30.1 Tax charge reconciliation
Numerical reconciliation between the average effective tax rate and
the applicable tax rate.
Applicable tax rate as per Income Tax Ordinance, 2001 32.00 33.00
Tax effect of:
- change in prior years’ tax 1.09 (0.01)
- change in tax rate (0.54) 0.92
- tax credit allowed - (16.50)
- lower tax rates / final tax regime and others (1.21) (1.35)
Other rounding off differences - (0.01)
(0.66) (16.95)
Average effective tax rate charged to profit and loss account 31.34 16.05
Rupees in thousand Note 2016 2015
31. CASH GENERATED FROM OPERATIONS
Profit before taxation 5,178,882 3,767,037
Adjustments for:
Depreciation on property, plant and equipment 421,363 628,481
Loss / (profit) on disposal of property, plant and equipment 707 (1,127)
Profit on bank deposits (219,232) (166,705)
Profit on advances to suppliers (17,843) (2,977)
Profit on loans to employees (4,357) (4,744)
Unrealized gain on short term investments (4,400) -
Liabilities no longer payable written back (1,470) (12,152)
Finance cost 1,200 14,261
Provision for employees’ retirement benefits and other obligations 73,302 55,281
Amortization on intangible assets 58,175 74,589
Amortization of deferred revenue (4,652) (900)
Royalty 889,086 738,097
Working capital changes 31.1 272,255 (2,411,823)
6,643,016 2,677,318
31.1 Working capital changes
Decrease / (Increase) in current assets
- Stores and spares 9,770 (16,519)
- Stock-in-trade 1,513,971 (1,671,256)
- Trade debts (42,018) (44,224)
- Loans, advances, prepayments and other receivables (419,173) 452,366
1,062,550 (1,279,633)
Decrease in current liabilities
- Trade and other payables (790,295) (1,132,190)
272,255 (2,411,823)
Notes to and Forming Part of the Financial StatementsFOR THE YEAR ENDED MARCH 31, 2016
80
81Annual Report 2016
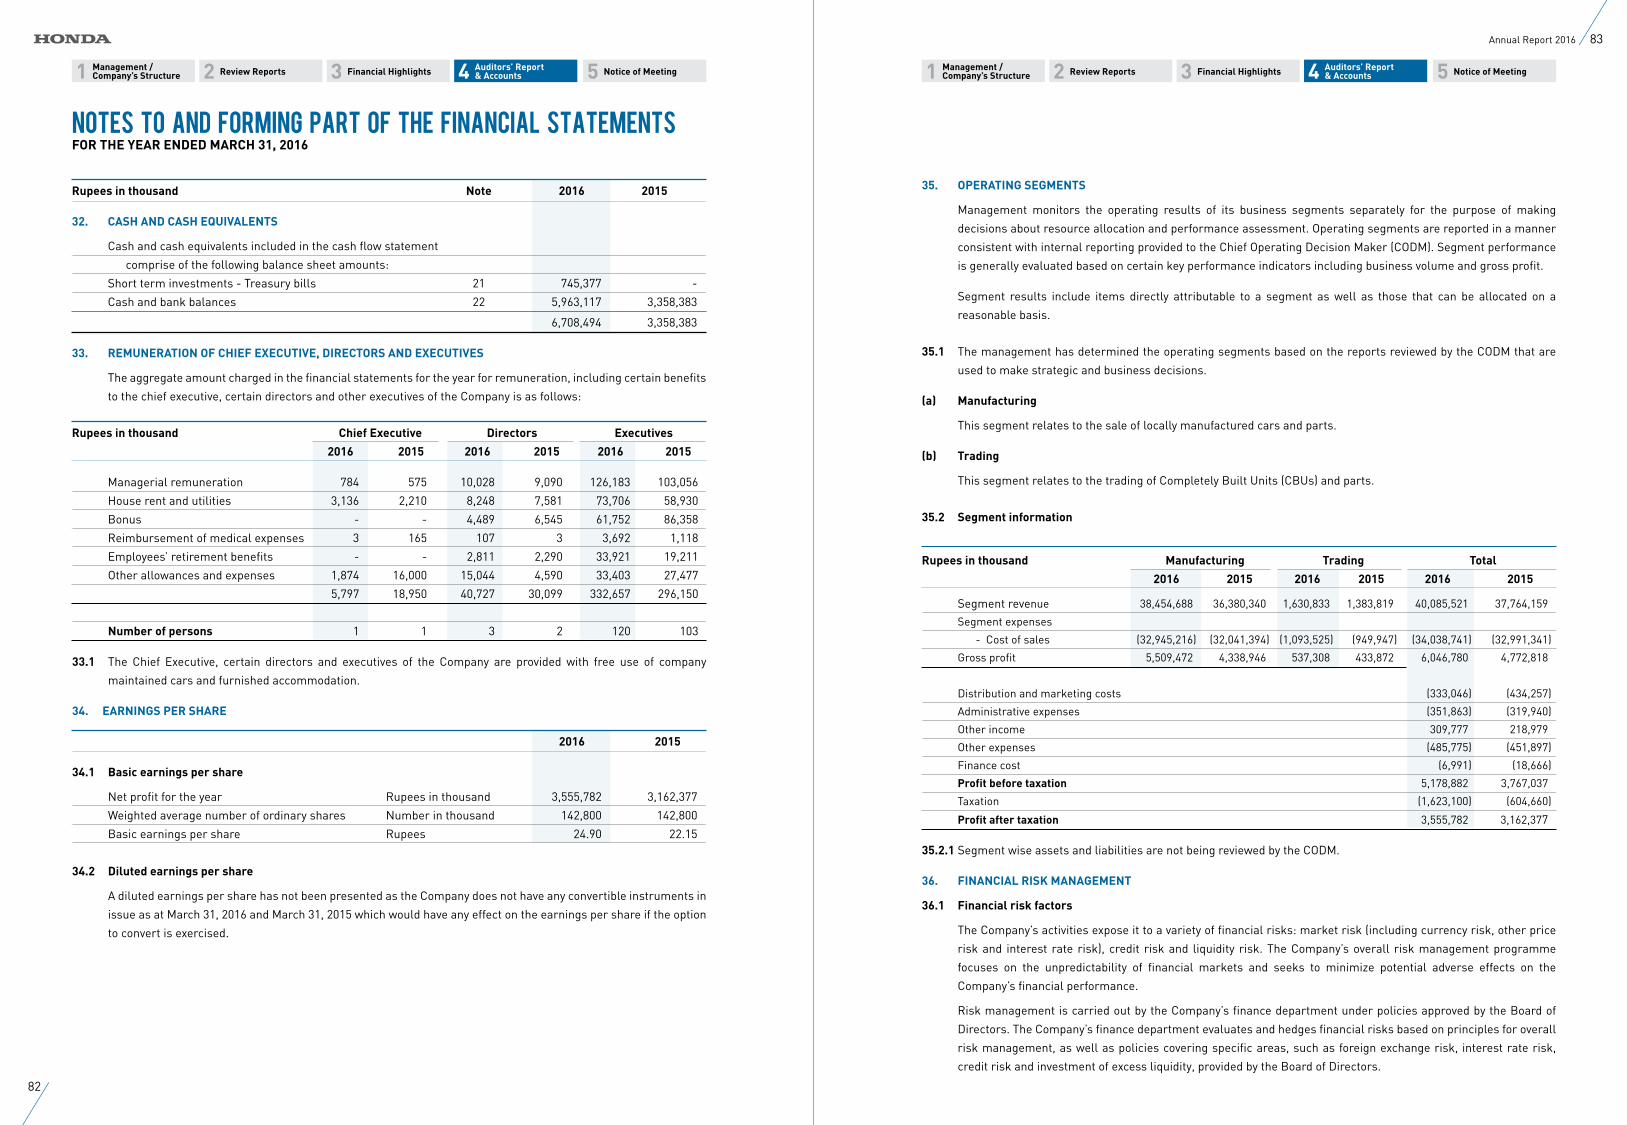
11 22 33 55 44 Management /Company’s Structure
Management /Company’s Structure
Auditors’ Report & Accounts
Auditors’ Report & Accounts Review ReportsReview Reports Financial HighlightsFinancial Highlights Notice of MeetingNotice of Meeting
Rupees in thousand Note 2016 2015
32. CASH AND CASH EQUIVALENTS
Cash and cash equivalents included in the cash flow statement
comprise of the following balance sheet amounts:
Short term investments - Treasury bills 21 745,377 -
Cash and bank balances 22 5,963,117 3,358,383
6,708,494 3,358,383
33. REMUNERATION OF CHIEF EXECUTIVE, DIRECTORS AND EXECUTIVES
The aggregate amount charged in the financial statements for the year for remuneration, including certain benefits
to the chief executive, certain directors and other executives of the Company is as follows:
Rupees in thousand Chief Executive Directors Executives
2016 2015 2016 2015 2016 2015
Managerial remuneration 784 575 10,028 9,090 126,183 103,056
House rent and utilities 3,136 2,210 8,248 7,581 73,706 58,930
Bonus - - 4,489 6,545 61,752 86,358
Reimbursement of medical expenses 3 165 107 3 3,692 1,118
Employees’ retirement benefits - - 2,811 2,290 33,921 19,211
Other allowances and expenses 1,874 16,000 15,044 4,590 33,403 27,477
5,797 18,950 40,727 30,099 332,657 296,150
Number of persons 1 1 3 2 120 103
33.1 The Chief Executive, certain directors and executives of the Company are provided with free use of company
maintained cars and furnished accommodation.
34. EARNINGS PER SHARE
2016 2015
34.1 Basic earnings per share
Net profit for the year Rupees in thousand 3,555,782 3,162,377
Weighted average number of ordinary shares Number in thousand 142,800 142,800
Basic earnings per share Rupees 24.90 22.15
34.2 Diluted earnings per share
A diluted earnings per share has not been presented as the Company does not have any convertible instruments in
issue as at March 31, 2016 and March 31, 2015 which would have any effect on the earnings per share if the option
to convert is exercised.
35. OPERATING SEGMENTS
Management monitors the operating results of its business segments separately for the purpose of making
decisions about resource allocation and performance assessment. Operating segments are reported in a manner
consistent with internal reporting provided to the Chief Operating Decision Maker (CODM). Segment performance
is generally evaluated based on certain key performance indicators including business volume and gross profit.
Segment results include items directly attributable to a segment as well as those that can be allocated on a
reasonable basis.
35.1 The management has determined the operating segments based on the reports reviewed by the CODM that are
used to make strategic and business decisions.
(a) Manufacturing
This segment relates to the sale of locally manufactured cars and parts.
(b) Trading
This segment relates to the trading of Completely Built Units (CBUs) and parts.
35.2 Segment information
Rupees in thousand Manufacturing Trading Total
2016 2015 2016 2015 2016 2015
Segment revenue 38,454,688 36,380,340 1,630,833 1,383,819 40,085,521 37,764,159
Segment expenses
- Cost of sales (32,945,216) (32,041,394) (1,093,525) (949,947) (34,038,741) (32,991,341)
Gross profit 5,509,472 4,338,946 537,308 433,872 6,046,780 4,772,818
Distribution and marketing costs (333,046) (434,257)
Administrative expenses (351,863) (319,940)
Other income 309,777 218,979
Other expenses (485,775) (451,897)
Finance cost (6,991) (18,666)
Profit before taxation 5,178,882 3,767,037
Taxation (1,623,100) (604,660)
Profit after taxation 3,555,782 3,162,377
35.2.1 Segment wise assets and liabilities are not being reviewed by the CODM.
36. FINANCIAL RISK MANAGEMENT
36.1 Financial risk factors
The Company’s activities expose it to a variety of financial risks: market risk (including currency risk, other price
risk and interest rate risk), credit risk and liquidity risk. The Company’s overall risk management programme
focuses on the unpredictability of financial markets and seeks to minimize potential adverse effects on the
Company’s financial performance.
Risk management is carried out by the Company’s finance department under policies approved by the Board of
Directors. The Company’s finance department evaluates and hedges financial risks based on principles for overall
risk management, as well as policies covering specific areas, such as foreign exchange risk, interest rate risk,
credit risk and investment of excess liquidity, provided by the Board of Directors.
Notes to and Forming Part of the Financial StatementsFOR THE YEAR ENDED MARCH 31, 2016
82
83Annual Report 2016
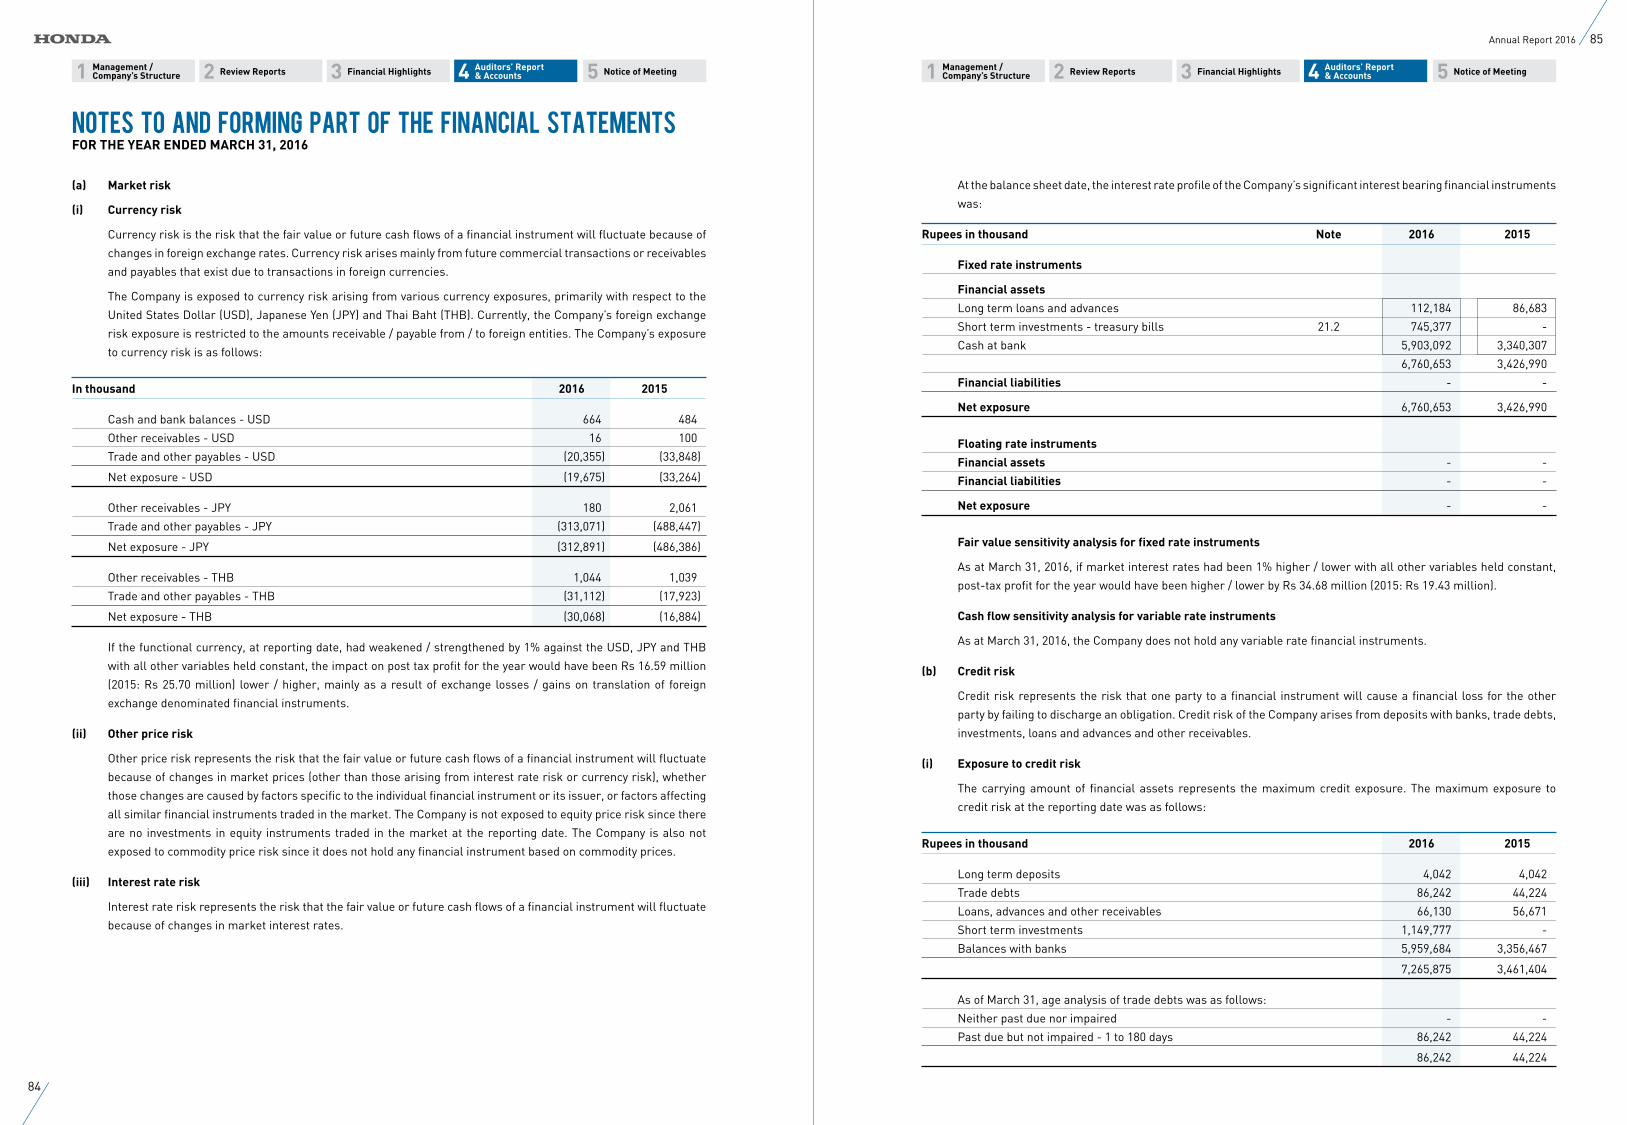
11 22 33 55 44 Management /Company’s Structure
Management /Company’s Structure
Auditors’ Report & Accounts
Auditors’ Report & Accounts Review ReportsReview Reports Financial HighlightsFinancial Highlights Notice of MeetingNotice of Meeting
(a) Market risk
(i) Currency risk
Currency risk is the risk that the fair value or future cash flows of a financial instrument will fluctuate because of
changes in foreign exchange rates. Currency risk arises mainly from future commercial transactions or receivables
and payables that exist due to transactions in foreign currencies.
The Company is exposed to currency risk arising from various currency exposures, primarily with respect to the
United States Dollar (USD), Japanese Yen (JPY) and Thai Baht (THB). Currently, the Company’s foreign exchange
risk exposure is restricted to the amounts receivable / payable from / to foreign entities. The Company’s exposure
to currency risk is as follows:
In thousand 2016 2015
Cash and bank balances - USD 664 484
Other receivables - USD 16 100
Trade and other payables - USD (20,355) (33,848)
Net exposure - USD (19,675) (33,264)
Other receivables - JPY 180 2,061
Trade and other payables - JPY (313,071) (488,447)
Net exposure - JPY (312,891) (486,386)
Other receivables - THB 1,044 1,039
Trade and other payables - THB (31,112) (17,923)
Net exposure - THB (30,068) (16,884)
If the functional currency, at reporting date, had weakened / strengthened by 1% against the USD, JPY and THB
with all other variables held constant, the impact on post tax profit for the year would have been Rs 16.59 million
(2015: Rs 25.70 million) lower / higher, mainly as a result of exchange losses / gains on translation of foreign
exchange denominated financial instruments.
(ii) Other price risk
Other price risk represents the risk that the fair value or future cash flows of a financial instrument will fluctuate
because of changes in market prices (other than those arising from interest rate risk or currency risk), whether
those changes are caused by factors specific to the individual financial instrument or its issuer, or factors affecting
all similar financial instruments traded in the market. The Company is not exposed to equity price risk since there
are no investments in equity instruments traded in the market at the reporting date. The Company is also not
exposed to commodity price risk since it does not hold any financial instrument based on commodity prices.
(iii) Interest rate risk
Interest rate risk represents the risk that the fair value or future cash flows of a financial instrument will fluctuate
because of changes in market interest rates.
At the balance sheet date, the interest rate profile of the Company’s significant interest bearing financial instruments
was:
Rupees in thousand Note 2016 2015
Fixed rate instruments
Financial assets
Long term loans and advances 112,184 86,683
Short term investments - treasury bills 21.2 745,377 -
Cash at bank 5,903,092 3,340,307
6,760,653 3,426,990
Financial liabilities - -
Net exposure 6,760,653 3,426,990
Floating rate instruments
Financial assets - -
Financial liabilities - -
Net exposure - -
Fair value sensitivity analysis for fixed rate instruments
As at March 31, 2016, if market interest rates had been 1% higher / lower with all other variables held constant,
post-tax profit for the year would have been higher / lower by Rs 34.68 million (2015: Rs 19.43 million).
Cash flow sensitivity analysis for variable rate instruments
As at March 31, 2016, the Company does not hold any variable rate financial instruments.
(b) Credit risk
Credit risk represents the risk that one party to a financial instrument will cause a financial loss for the other
party by failing to discharge an obligation. Credit risk of the Company arises from deposits with banks, trade debts,
investments, loans and advances and other receivables.
(i) Exposure to credit risk
The carrying amount of financial assets represents the maximum credit exposure. The maximum exposure to
credit risk at the reporting date was as follows:
Rupees in thousand 2016 2015
Long term deposits 4,042 4,042
Trade debts 86,242 44,224
Loans, advances and other receivables 66,130 56,671
Short term investments 1,149,777 -
Balances with banks 5,959,684 3,356,467
7,265,875 3,461,404
As of March 31, age analysis of trade debts was as follows:
Neither past due nor impaired - -
Past due but not impaired - 1 to 180 days 86,242 44,224
86,242 44,224
Notes to and Forming Part of the Financial StatementsFOR THE YEAR ENDED MARCH 31, 2016
84
85Annual Report 2016
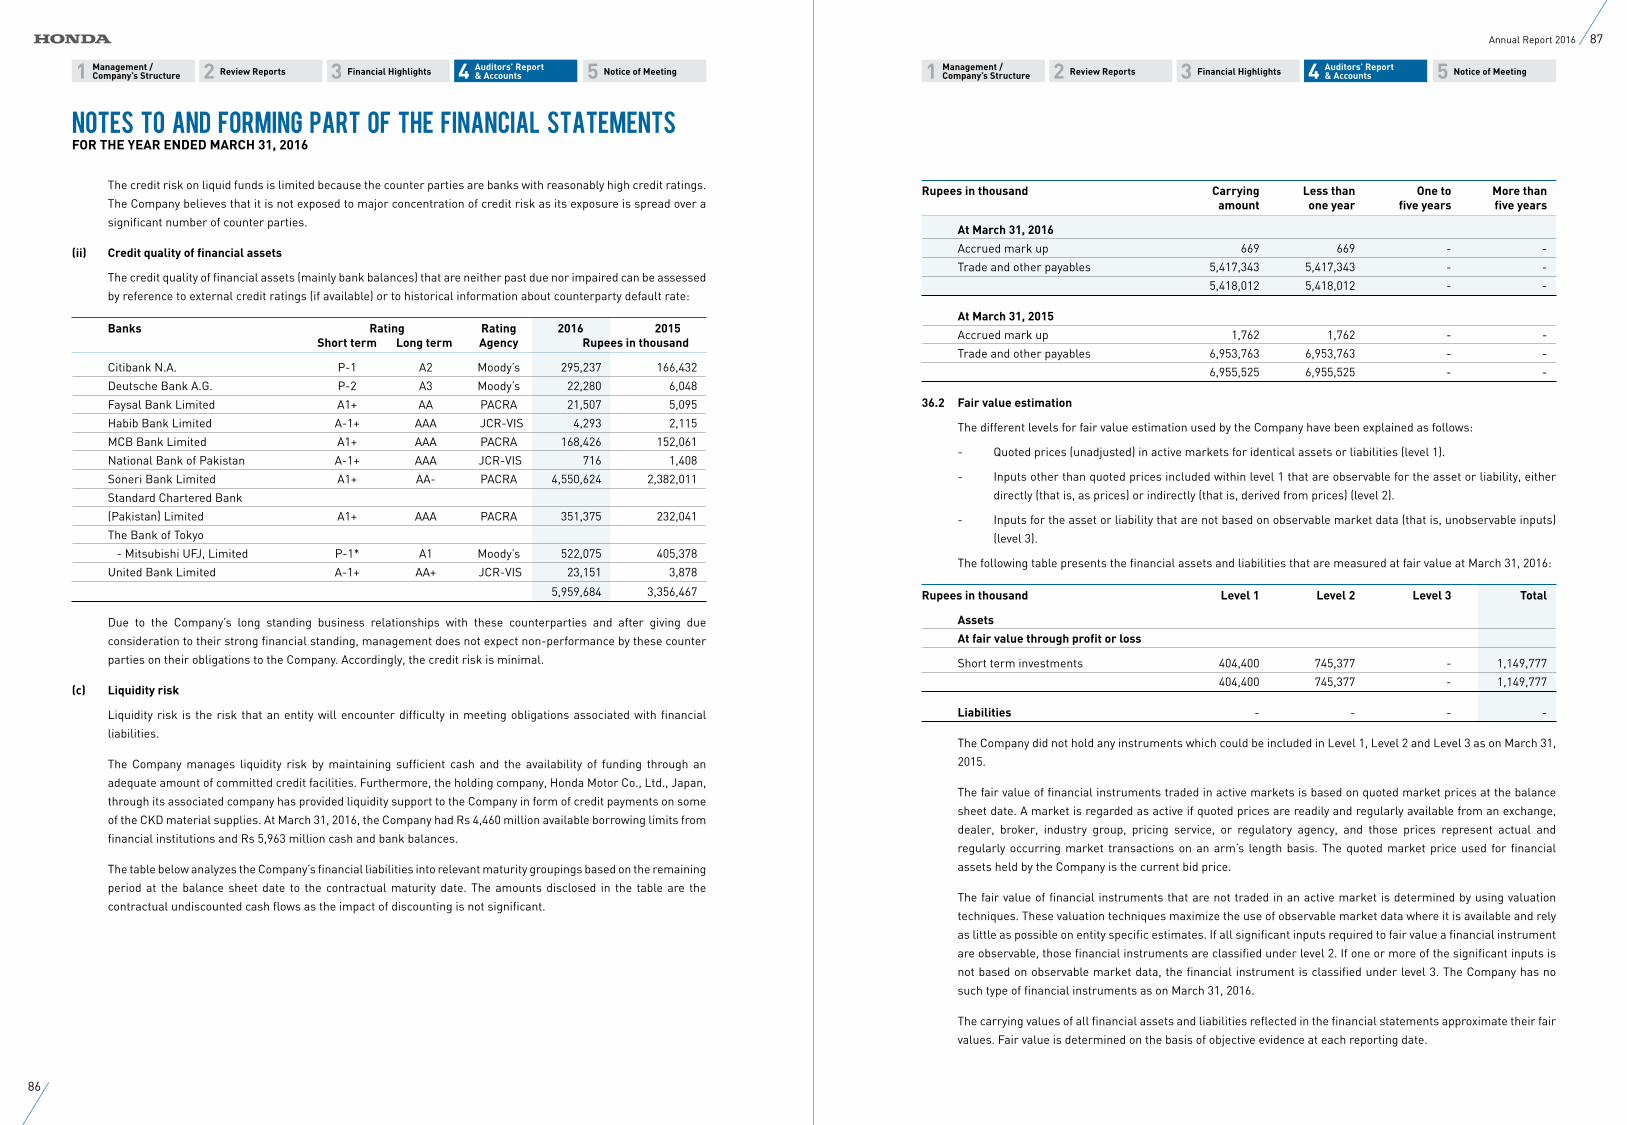
11 22 33 55 44 Management /Company’s Structure
Management /Company’s Structure
Auditors’ Report & Accounts
Auditors’ Report & Accounts Review ReportsReview Reports Financial HighlightsFinancial Highlights Notice of MeetingNotice of Meeting
The credit risk on liquid funds is limited because the counter parties are banks with reasonably high credit ratings.
The Company believes that it is not exposed to major concentration of credit risk as its exposure is spread over a
significant number of counter parties.
(ii) Credit quality of financial assets
The credit quality of financial assets (mainly bank balances) that are neither past due nor impaired can be assessed
by reference to external credit ratings (if available) or to historical information about counterparty default rate:
Banks Rating Rating 2016 2015 Short term Long term Agency Rupees in thousand
Citibank N.A. P-1 A2 Moody’s 295,237 166,432
Deutsche Bank A.G. P-2 A3 Moody’s 22,280 6,048
Faysal Bank Limited A1+ AA PACRA 21,507 5,095
Habib Bank Limited A-1+ AAA JCR-VIS 4,293 2,115
MCB Bank Limited A1+ AAA PACRA 168,426 152,061
National Bank of Pakistan A-1+ AAA JCR-VIS 716 1,408
Soneri Bank Limited A1+ AA- PACRA 4,550,624 2,382,011
Standard Chartered Bank
(Pakistan) Limited A1+ AAA PACRA 351,375 232,041
The Bank of Tokyo
- Mitsubishi UFJ, Limited P-1* A1 Moody’s 522,075 405,378
United Bank Limited A-1+ AA+ JCR-VIS 23,151 3,878
5,959,684 3,356,467
Due to the Company’s long standing business relationships with these counterparties and after giving due
consideration to their strong financial standing, management does not expect non-performance by these counter
parties on their obligations to the Company. Accordingly, the credit risk is minimal.
(c) Liquidity risk
Liquidity risk is the risk that an entity will encounter difficulty in meeting obligations associated with financial
liabilities.
The Company manages liquidity risk by maintaining sufficient cash and the availability of funding through an
adequate amount of committed credit facilities. Furthermore, the holding company, Honda Motor Co., Ltd., Japan,
through its associated company has provided liquidity support to the Company in form of credit payments on some
of the CKD material supplies. At March 31, 2016, the Company had Rs 4,460 million available borrowing limits from
financial institutions and Rs 5,963 million cash and bank balances.
The table below analyzes the Company’s financial liabilities into relevant maturity groupings based on the remaining
period at the balance sheet date to the contractual maturity date. The amounts disclosed in the table are the
contractual undiscounted cash flows as the impact of discounting is not significant.
Rupees in thousand Carrying Less than One to More than amount one year five years five years
At March 31, 2016
Accrued mark up 669 669 - -
Trade and other payables 5,417,343 5,417,343 - -
5,418,012 5,418,012 - -
At March 31, 2015
Accrued mark up 1,762 1,762 - -
Trade and other payables 6,953,763 6,953,763 - -
6,955,525 6,955,525 - -
36.2 Fair value estimation
The different levels for fair value estimation used by the Company have been explained as follows:
- Quoted prices (unadjusted) in active markets for identical assets or liabilities (level 1).
- Inputs other than quoted prices included within level 1 that are observable for the asset or liability, either
directly (that is, as prices) or indirectly (that is, derived from prices) (level 2).
- Inputs for the asset or liability that are not based on observable market data (that is, unobservable inputs)
(level 3).
The following table presents the financial assets and liabilities that are measured at fair value at March 31, 2016:
Rupees in thousand Level 1 Level 2 Level 3 Total
Assets
At fair value through profit or loss
Short term investments 404,400 745,377 - 1,149,777
404,400 745,377 - 1,149,777
Liabilities - - - -
The Company did not hold any instruments which could be included in Level 1, Level 2 and Level 3 as on March 31,
2015.
The fair value of financial instruments traded in active markets is based on quoted market prices at the balance
sheet date. A market is regarded as active if quoted prices are readily and regularly available from an exchange,
dealer, broker, industry group, pricing service, or regulatory agency, and those prices represent actual and
regularly occurring market transactions on an arm’s length basis. The quoted market price used for financial
assets held by the Company is the current bid price.
The fair value of financial instruments that are not traded in an active market is determined by using valuation
techniques. These valuation techniques maximize the use of observable market data where it is available and rely
as little as possible on entity specific estimates. If all significant inputs required to fair value a financial instrument
are observable, those financial instruments are classified under level 2. If one or more of the significant inputs is
not based on observable market data, the financial instrument is classified under level 3. The Company has no
such type of financial instruments as on March 31, 2016.
The carrying values of all financial assets and liabilities reflected in the financial statements approximate their fair
values. Fair value is determined on the basis of objective evidence at each reporting date.
Notes to and Forming Part of the Financial StatementsFOR THE YEAR ENDED MARCH 31, 2016
86
87Annual Report 2016
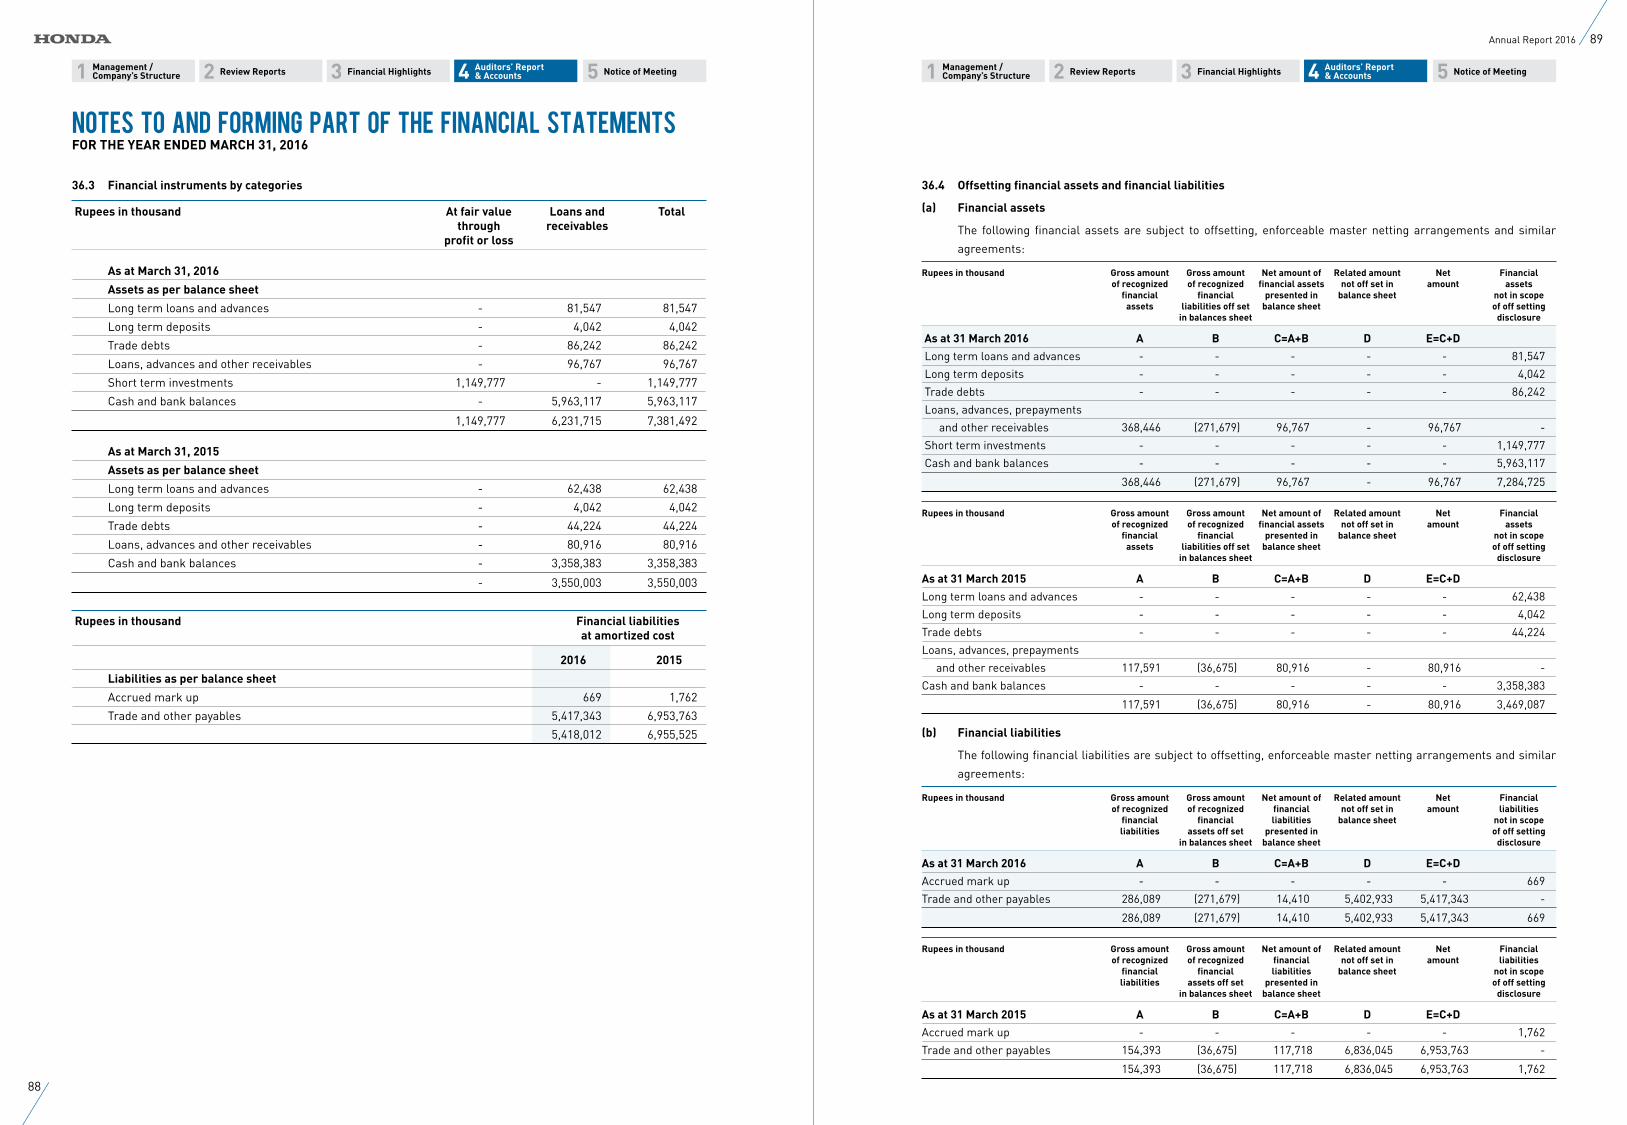
11 22 33 55 44 Management /Company’s Structure
Management /Company’s Structure
Auditors’ Report & Accounts
Auditors’ Report & Accounts Review ReportsReview Reports Financial HighlightsFinancial Highlights Notice of MeetingNotice of Meeting
36.4 Offsetting financial assets and financial liabilities
(a) Financial assets
The following financial assets are subject to offsetting, enforceable master netting arrangements and similar
agreements:
Rupees in thousand Gross amount Gross amount Net amount of Related amount Net Financial of recognized of recognized financial assets not off set in amount assets financial financial presented in balance sheet not in scope assets liabilities off set balance sheet of off setting in balances sheet disclosure
As at 31 March 2016 A B C=A+B D E=C+D
Long term loans and advances - - - - - 81,547
Long term deposits - - - - - 4,042
Trade debts - - - - - 86,242
Loans, advances, prepayments
and other receivables 368,446 (271,679) 96,767 - 96,767 -
Short term investments - - - - - 1,149,777
Cash and bank balances - - - - - 5,963,117
368,446 (271,679) 96,767 - 96,767 7,284,725
Rupees in thousand Gross amount Gross amount Net amount of Related amount Net Financial of recognized of recognized financial assets not off set in amount assets financial financial presented in balance sheet not in scope assets liabilities off set balance sheet of off setting in balances sheet disclosure
As at 31 March 2015 A B C=A+B D E=C+D
Long term loans and advances - - - - - 62,438
Long term deposits - - - - - 4,042
Trade debts - - - - - 44,224
Loans, advances, prepayments
and other receivables 117,591 (36,675) 80,916 - 80,916 -
Cash and bank balances - - - - - 3,358,383
117,591 (36,675) 80,916 - 80,916 3,469,087
(b) Financial liabilities
The following financial liabilities are subject to offsetting, enforceable master netting arrangements and similar
agreements:
Rupees in thousand Gross amount Gross amount Net amount of Related amount Net Financial of recognized of recognized financial not off set in amount liabilities financial financial liabilities balance sheet not in scope liabilities assets off set presented in of off setting in balances sheet balance sheet disclosure
As at 31 March 2016 A B C=A+B D E=C+D
Accrued mark up - - - - - 669
Trade and other payables 286,089 (271,679) 14,410 5,402,933 5,417,343 -
286,089 (271,679) 14,410 5,402,933 5,417,343 669
Rupees in thousand Gross amount Gross amount Net amount of Related amount Net Financial of recognized of recognized financial not off set in amount liabilities financial financial liabilities balance sheet not in scope liabilities assets off set presented in of off setting in balances sheet balance sheet disclosure
As at 31 March 2015 A B C=A+B D E=C+D
Accrued mark up - - - - - 1,762
Trade and other payables 154,393 (36,675) 117,718 6,836,045 6,953,763 -
154,393 (36,675) 117,718 6,836,045 6,953,763 1,762
36.3 Financial instruments by categories
Rupees in thousand At fair value Loans and Total through receivables profit or loss
As at March 31, 2016
Assets as per balance sheet
Long term loans and advances - 81,547 81,547
Long term deposits - 4,042 4,042
Trade debts - 86,242 86,242
Loans, advances and other receivables - 96,767 96,767
Short term investments 1,149,777 - 1,149,777
Cash and bank balances - 5,963,117 5,963,117
1,149,777 6,231,715 7,381,492
As at March 31, 2015
Assets as per balance sheet
Long term loans and advances - 62,438 62,438
Long term deposits - 4,042 4,042
Trade debts - 44,224 44,224
Loans, advances and other receivables - 80,916 80,916
Cash and bank balances - 3,358,383 3,358,383
- 3,550,003 3,550,003
Rupees in thousand Financial liabilities at amortized cost
2016 2015
Liabilities as per balance sheet
Accrued mark up 669 1,762
Trade and other payables 5,417,343 6,953,763
5,418,012 6,955,525
Notes to and Forming Part of the Financial StatementsFOR THE YEAR ENDED MARCH 31, 2016
88
89Annual Report 2016
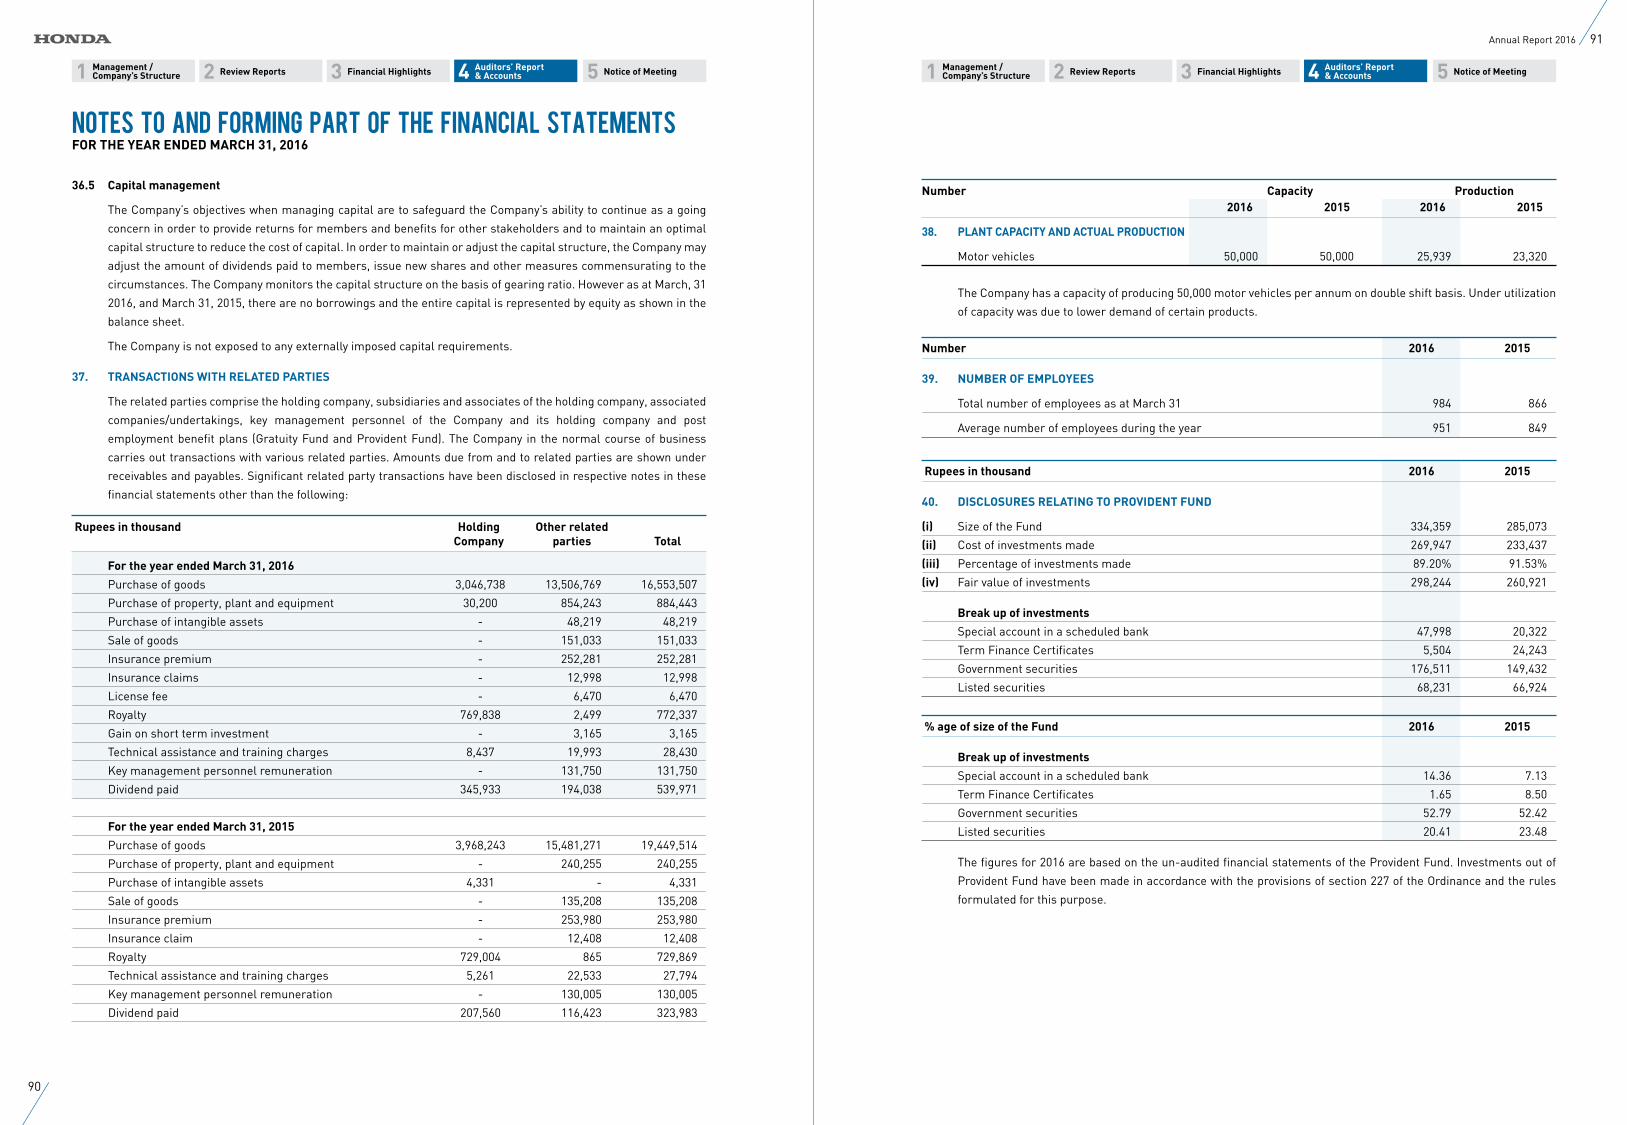
11 22 33 55 44 Management /Company’s Structure
Management /Company’s Structure
Auditors’ Report & Accounts
Auditors’ Report & Accounts Review ReportsReview Reports Financial HighlightsFinancial Highlights Notice of MeetingNotice of Meeting
36.5 Capital management
The Company’s objectives when managing capital are to safeguard the Company’s ability to continue as a going
concern in order to provide returns for members and benefits for other stakeholders and to maintain an optimal
capital structure to reduce the cost of capital. In order to maintain or adjust the capital structure, the Company may
adjust the amount of dividends paid to members, issue new shares and other measures commensurating to the
circumstances. The Company monitors the capital structure on the basis of gearing ratio. However as at March, 31
2016, and March 31, 2015, there are no borrowings and the entire capital is represented by equity as shown in the
balance sheet.
The Company is not exposed to any externally imposed capital requirements.
37. TRANSACTIONS WITH RELATED PARTIES
The related parties comprise the holding company, subsidiaries and associates of the holding company, associated
companies/undertakings, key management personnel of the Company and its holding company and post
employment benefit plans (Gratuity Fund and Provident Fund). The Company in the normal course of business
carries out transactions with various related parties. Amounts due from and to related parties are shown under
receivables and payables. Significant related party transactions have been disclosed in respective notes in these
financial statements other than the following:
Rupees in thousand Holding Other related Company parties Total
For the year ended March 31, 2016
Purchase of goods 3,046,738 13,506,769 16,553,507
Purchase of property, plant and equipment 30,200 854,243 884,443
Purchase of intangible assets - 48,219 48,219
Sale of goods - 151,033 151,033
Insurance premium - 252,281 252,281
Insurance claims - 12,998 12,998
License fee - 6,470 6,470
Royalty 769,838 2,499 772,337
Gain on short term investment - 3,165 3,165
Technical assistance and training charges 8,437 19,993 28,430
Key management personnel remuneration - 131,750 131,750
Dividend paid 345,933 194,038 539,971
For the year ended March 31, 2015
Purchase of goods 3,968,243 15,481,271 19,449,514
Purchase of property, plant and equipment - 240,255 240,255
Purchase of intangible assets 4,331 - 4,331
Sale of goods - 135,208 135,208
Insurance premium - 253,980 253,980
Insurance claim - 12,408 12,408
Royalty 729,004 865 729,869
Technical assistance and training charges 5,261 22,533 27,794
Key management personnel remuneration - 130,005 130,005
Dividend paid 207,560 116,423 323,983
Number Capacity Production 2016 2015 2016 2015
38. PLANT CAPACITY AND ACTUAL PRODUCTION
Motor vehicles 50,000 50,000 25,939 23,320
The Company has a capacity of producing 50,000 motor vehicles per annum on double shift basis. Under utilization
of capacity was due to lower demand of certain products.
Number 2016 2015
39. NUMBER OF EMPLOYEES
Total number of employees as at March 31 984 866
Average number of employees during the year 951 849
Rupees in thousand 2016 2015
40. DISCLOSURES RELATING TO PROVIDENT FUND
(i) Size of the Fund 334,359 285,073
(ii) Cost of investments made 269,947 233,437
(iii) Percentage of investments made 89.20% 91.53%
(iv) Fair value of investments 298,244 260,921
Break up of investments
Special account in a scheduled bank 47,998 20,322
Term Finance Certificates 5,504 24,243
Government securities 176,511 149,432
Listed securities 68,231 66,924
% age of size of the Fund 2016 2015
Break up of investments
Special account in a scheduled bank 14.36 7.13
Term Finance Certificates 1.65 8.50
Government securities 52.79 52.42
Listed securities 20.41 23.48
The figures for 2016 are based on the un-audited financial statements of the Provident Fund. Investments out of
Provident Fund have been made in accordance with the provisions of section 227 of the Ordinance and the rules
formulated for this purpose.
Notes to and Forming Part of the Financial StatementsFOR THE YEAR ENDED MARCH 31, 2016
90
91Annual Report 2016
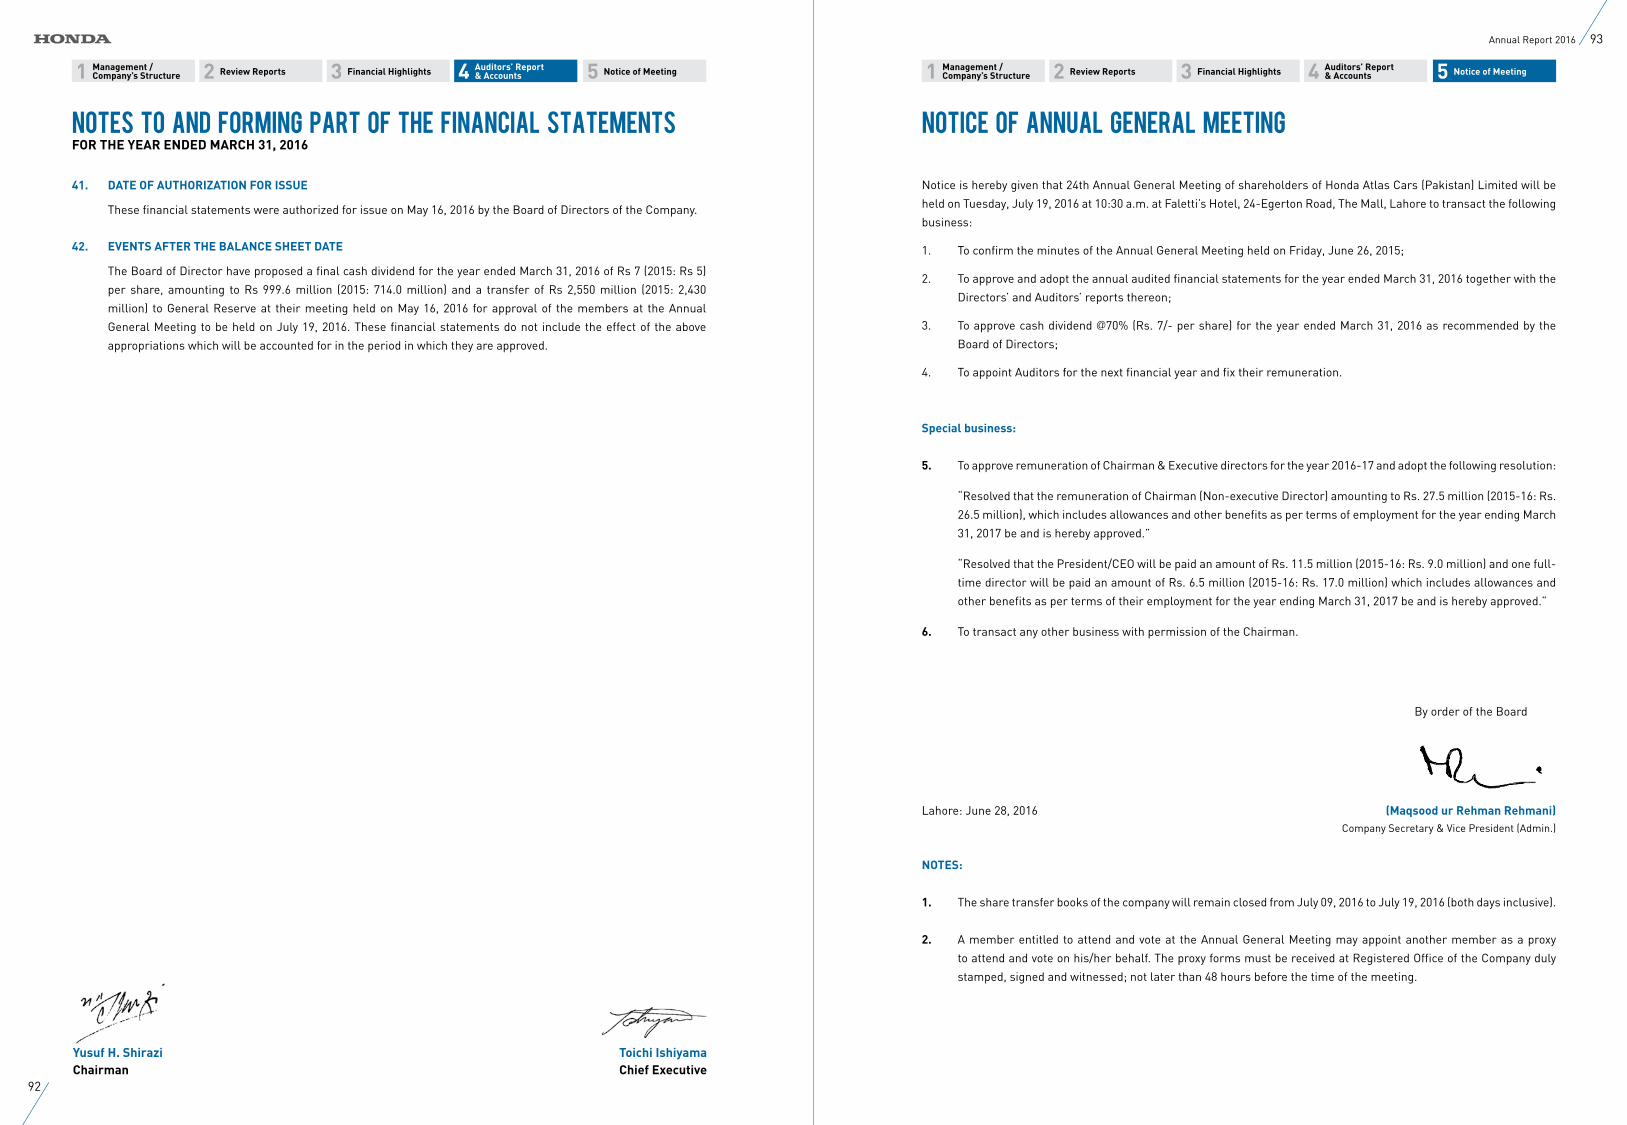
1 2 3 54Management /Company’s Structure
Auditors’ Report & AccountsReview Reports Financial Highlights Notice of Meeting 1 2 3 54Management /
Company’s StructureAuditors’ Report & AccountsReview Reports Financial Highlights Notice of Meeting
Notice is hereby given that 24th Annual General Meeting of shareholders of Honda Atlas Cars (Pakistan) Limited will be
held on Tuesday, July 19, 2016 at 10:30 a.m. at Faletti’s Hotel, 24-Egerton Road, The Mall, Lahore to transact the following
business:
1. To confirm the minutes of the Annual General Meeting held on Friday, June 26, 2015;
2. To approve and adopt the annual audited financial statements for the year ended March 31, 2016 together with the
Directors’ and Auditors’ reports thereon;
3. To approve cash dividend @70% (Rs. 7/- per share) for the year ended March 31, 2016 as recommended by the
Board of Directors;
4. To appoint Auditors for the next financial year and fix their remuneration.
Special business:
5. To approve remuneration of Chairman & Executive directors for the year 2016-17 and adopt the following resolution:
“Resolved that the remuneration of Chairman (Non-executive Director) amounting to Rs. 27.5 million (2015-16: Rs.
26.5 million), which includes allowances and other benefits as per terms of employment for the year ending March
31, 2017 be and is hereby approved.”
“Resolved that the President/CEO will be paid an amount of Rs. 11.5 million (2015-16: Rs. 9.0 million) and one full-
time director will be paid an amount of Rs. 6.5 million (2015-16: Rs. 17.0 million) which includes allowances and
other benefits as per terms of their employment for the year ending March 31, 2017 be and is hereby approved.”
6. To transact any other business with permission of the Chairman.
By order of the Board
Lahore: June 28, 2016 (Maqsood ur Rehman Rehmani) Company Secretary & Vice President (Admin.)
NOTES:
1. The share transfer books of the company will remain closed from July 09, 2016 to July 19, 2016 (both days inclusive).
2. A member entitled to attend and vote at the Annual General Meeting may appoint another member as a proxy
to attend and vote on his/her behalf. The proxy forms must be received at Registered Office of the Company duly
stamped, signed and witnessed; not later than 48 hours before the time of the meeting.
41. DATE OF AUTHORIZATION FOR ISSUE
These financial statements were authorized for issue on May 16, 2016 by the Board of Directors of the Company.
42. EVENTS AFTER THE BALANCE SHEET DATE
The Board of Director have proposed a final cash dividend for the year ended March 31, 2016 of Rs 7 (2015: Rs 5)
per share, amounting to Rs 999.6 million (2015: 714.0 million) and a transfer of Rs 2,550 million (2015: 2,430
million) to General Reserve at their meeting held on May 16, 2016 for approval of the members at the Annual
General Meeting to be held on July 19, 2016. These financial statements do not include the effect of the above
appropriations which will be accounted for in the period in which they are approved.
Yusuf H. Shirazi Toichi IshiyamaChairman Chief Executive
Notes to and Forming Part of the Financial StatementsFOR THE YEAR ENDED MARCH 31, 2016
Notice of Annual General Meeting
92
93Annual Report 2016
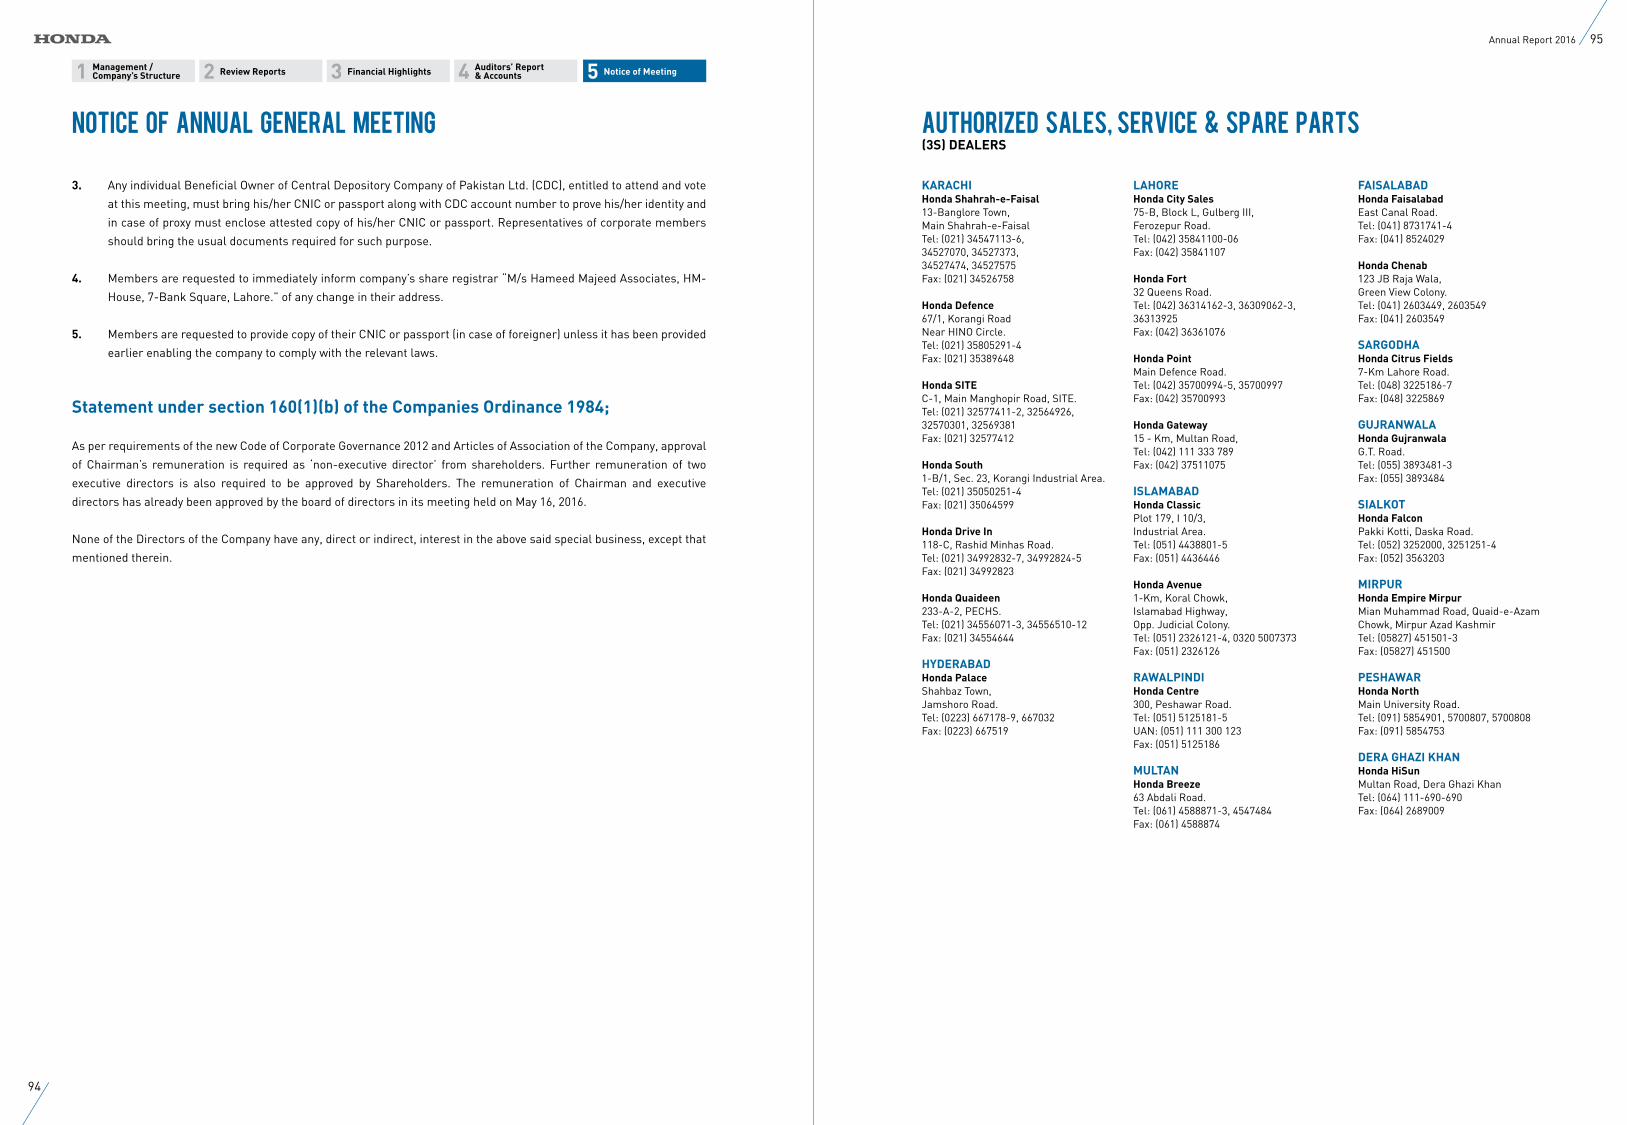
3. Any individual Beneficial Owner of Central Depository Company of Pakistan Ltd. (CDC), entitled to attend and vote
at this meeting, must bring his/her CNIC or passport along with CDC account number to prove his/her identity and
in case of proxy must enclose attested copy of his/her CNIC or passport. Representatives of corporate members
should bring the usual documents required for such purpose.
4. Members are requested to immediately inform company’s share registrar “M/s Hameed Majeed Associates, HM-
House, 7-Bank Square, Lahore.” of any change in their address.
5. Members are requested to provide copy of their CNIC or passport (in case of foreigner) unless it has been provided
earlier enabling the company to comply with the relevant laws.
Statement under section 160(1)(b) of the Companies Ordinance 1984;
As per requirements of the new Code of Corporate Governance 2012 and Articles of Association of the Company, approval
of Chairman’s remuneration is required as ‘non-executive director’ from shareholders. Further remuneration of two
executive directors is also required to be approved by Shareholders. The remuneration of Chairman and executive
directors has already been approved by the board of directors in its meeting held on May 16, 2016.
None of the Directors of the Company have any, direct or indirect, interest in the above said special business, except that
mentioned therein.
LAHOREHonda City Sales75-B, Block L, Gulberg III,Ferozepur Road.Tel: (042) 35841100-06Fax: (042) 35841107
Honda Fort32 Queens Road.Tel: (042) 36314162-3, 36309062-3, 36313925Fax: (042) 36361076
Honda PointMain Defence Road.Tel: (042) 35700994-5, 35700997Fax: (042) 35700993
Honda Gateway15 - Km, Multan Road,Tel: (042) 111 333 789Fax: (042) 37511075
ISLAMABADHonda ClassicPlot 179, I 10/3, Industrial Area.Tel: (051) 4438801-5Fax: (051) 4436446
Honda Avenue1-Km, Koral Chowk,Islamabad Highway,Opp. Judicial Colony. Tel: (051) 2326121-4, 0320 5007373Fax: (051) 2326126
RAWALPINDIHonda Centre300, Peshawar Road.Tel: (051) 5125181-5UAN: (051) 111 300 123Fax: (051) 5125186
MULTANHonda Breeze63 Abdali Road.Tel: (061) 4588871-3, 4547484Fax: (061) 4588874
KARACHIHonda Shahrah-e-Faisal13-Banglore Town,Main Shahrah-e-FaisalTel: (021) 34547113-6, 34527070, 34527373, 34527474, 34527575Fax: (021) 34526758
Honda Defence67/1, Korangi RoadNear HINO Circle.Tel: (021) 35805291-4Fax: (021) 35389648
Honda SITEC-1, Main Manghopir Road, SITE.Tel: (021) 32577411-2, 32564926, 32570301, 32569381Fax: (021) 32577412
Honda South1-B/1, Sec. 23, Korangi Industrial Area. Tel: (021) 35050251-4Fax: (021) 35064599
Honda Drive In118-C, Rashid Minhas Road.Tel: (021) 34992832-7, 34992824-5Fax: (021) 34992823
Honda Quaideen233-A-2, PECHS.Tel: (021) 34556071-3, 34556510-12Fax: (021) 34554644
HYDERABADHonda PalaceShahbaz Town,Jamshoro Road.Tel: (0223) 667178-9, 667032Fax: (0223) 667519
FAISALABADHonda FaisalabadEast Canal Road.Tel: (041) 8731741-4Fax: (041) 8524029
Honda Chenab123 JB Raja Wala,Green View Colony.Tel: (041) 2603449, 2603549Fax: (041) 2603549
SARGODHAHonda Citrus Fields7-Km Lahore Road.Tel: (048) 3225186-7Fax: (048) 3225869
GUJRANWALAHonda GujranwalaG.T. Road.Tel: (055) 3893481-3Fax: (055) 3893484
SIALKOTHonda FalconPakki Kotti, Daska Road.Tel: (052) 3252000, 3251251-4Fax: (052) 3563203
MIRPURHonda Empire MirpurMian Muhammad Road, Quaid-e-Azam Chowk, Mirpur Azad KashmirTel: (05827) 451501-3Fax: (05827) 451500
PESHAWARHonda NorthMain University Road. Tel: (091) 5854901, 5700807, 5700808Fax: (091) 5854753
DERA GHAZI KHANHonda HiSunMultan Road, Dera Ghazi Khan Tel: (064) 111-690-690Fax: (064) 2689009
Notice of Annual General Meeting Authorized Sales, Service & Spare Parts (3S) DEALERS
1 2 3 54Management /Company’s Structure
Auditors’ Report & AccountsReview Reports Financial Highlights Notice of Meeting
94
95Annual Report 2016
KARACHI Sugoi Sunset Parts CenterPlot No. 12-C, 12th Commercial Street,Phase II Extension D.H.ATel: (021) 35312766Fax: (021) 35312768
MULTAN Sugoi Multan Parts Center103/9 Iqbal Plaza Opp. RTO Office,Near Feasta Garden LMQ RoadTel: (061) 4586160-61Fax: (061) 4571962
LAHORE Sugoi Parts CenterShop No. 4-6, Shamyl Center,4-Montgomery Road.Tel: (042) 36370121 Fax: (042) 36375900
Sugoi Defence Parts CenterShop No. 1 Corner 26/26Main Walton Road.Tel: (042) 36626987 Fax: (042) 36626989
RAWALPINDI Sugoi Potohar Parts CenterState Life Building, Kashmir Road, SaddarTel: (051) 5580263-64Fax: (051) 5580266
Authorized Spare Parts (1S) DEALERS
KARACHINazimabad Honda1-J-8/B, Nazimabad No.1.Tel: 021-36603336-7Fax: 021-36606444
SUKKAR Clock Tower HondaHussaini Road, Near Gurdwara.Tel: 071-5617683
RAHIM YAR KHANPak Saudi MotorsAdda Khanpur, Near Shamim Petrolium Service.Tel: 068-5887300Fax: 068-5887363
BAHAWALPUR Horizon HondaMultan Road.Tel: 062-2886900, 062-2886900
MULTAN Prime Honda1 - Mushtaq Colony,Industrial Estate Highway.Tel: 0092-61-6538112, 6538113.0300-8631111Fax: 061-6536311
LAHORE Johar Town Honda892-R-1 Main Boulevard Johar Town.Tel: 042-35291712 , 35291771Fax: 042-35313366
Aabpara HondaAabpara Market, 16 Wahdat Road.Tel: 042-35866932 Fax: (042) 35912678
Samanabad HondaPlot No.29/30 - 21 Acre Scheme Samnabad.Tel: 042-37530563 , 375305790300-8880096Fax: 042-37522099
GUJRAT River Edge HondaNear Edhi Center, G.T. Road.Tel: (0533) 523511,53651103006202195,03144545450Fax: 053-3514511
FAISALABAD Jaranwala Road HondaJaranwala Road.Tel: 041-8710616 , 8541097Fax: 041-8738786
Civil Lines Honda21/1 Jail Road, Civil Lines Tel: 041-2641925 , 2409394Fax: 041-2641925
RAWALPINDI Three Star Motor WorkshopSitara Market ChaklalaScheme No.3, Tel: 051-5591219 , 5591599Fax; 051-5480990
Royal Honda445-Meherabad,Peshawar Road, Tel: 051-5462464Fax: 051-5480990
Authorized Service & Spare Parts (2S) DEALERS
96
97Annual Report 2016
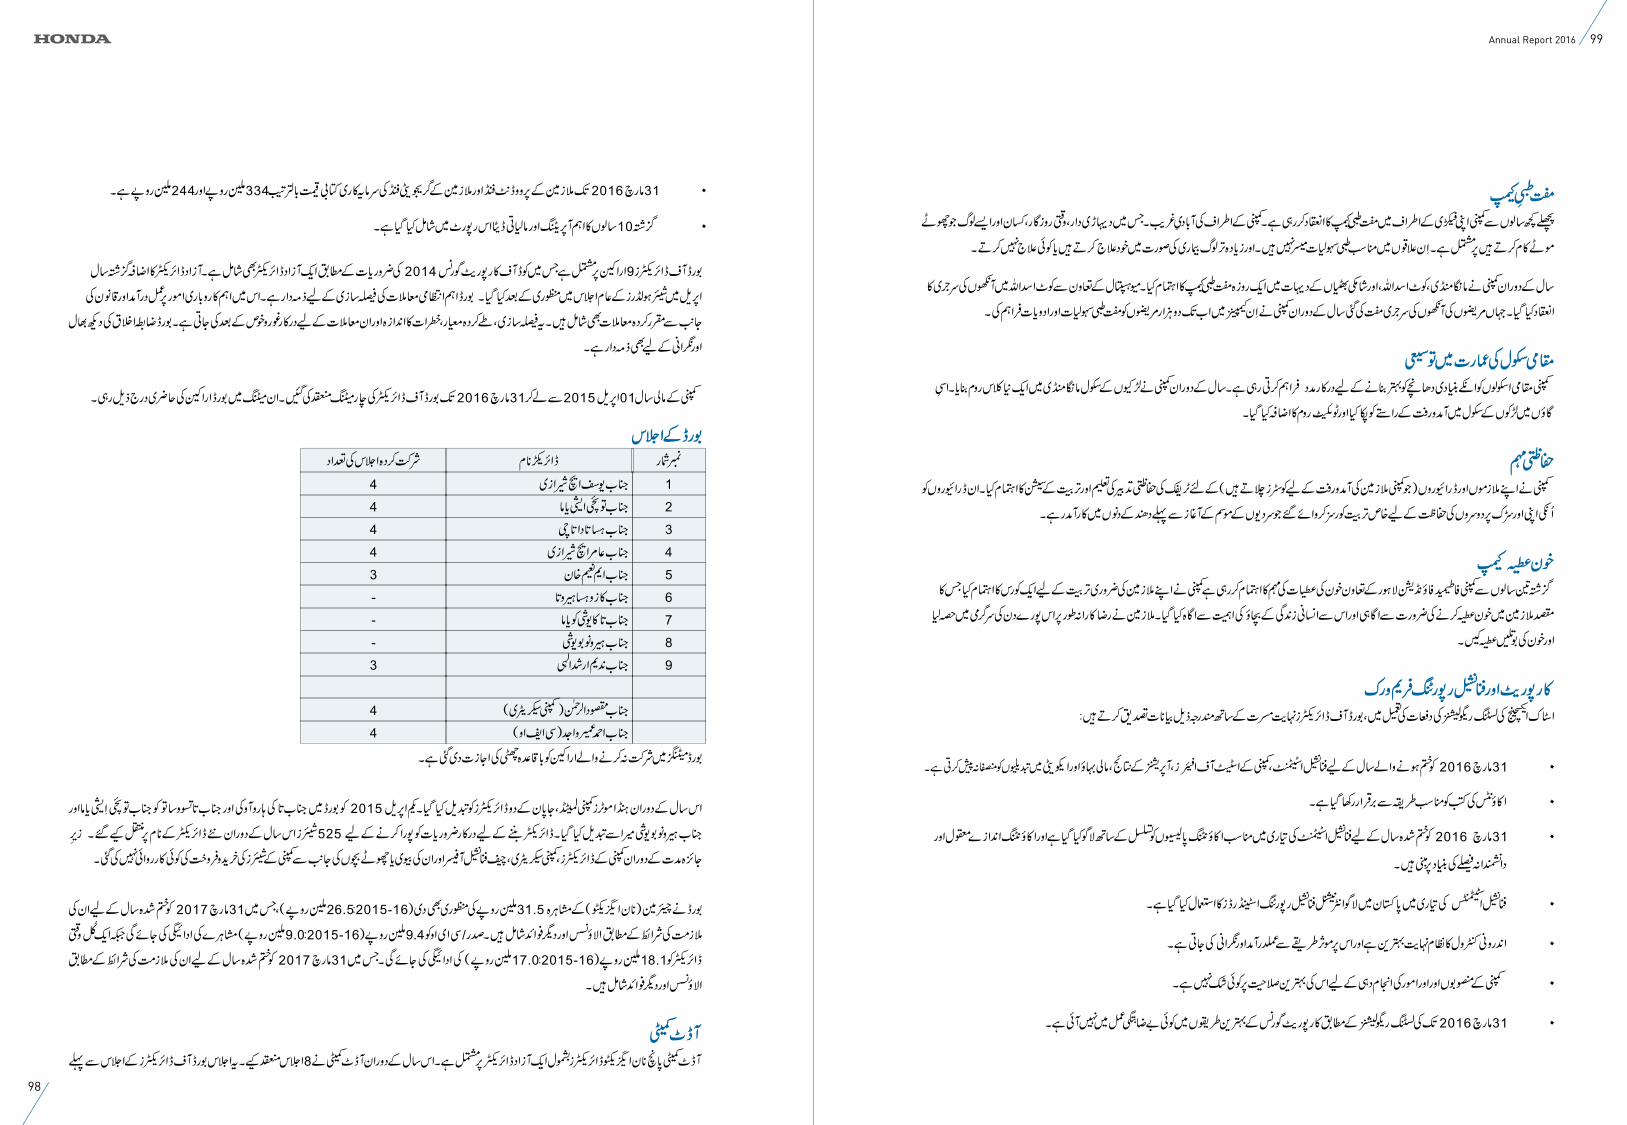
98
99Annual Report 2016
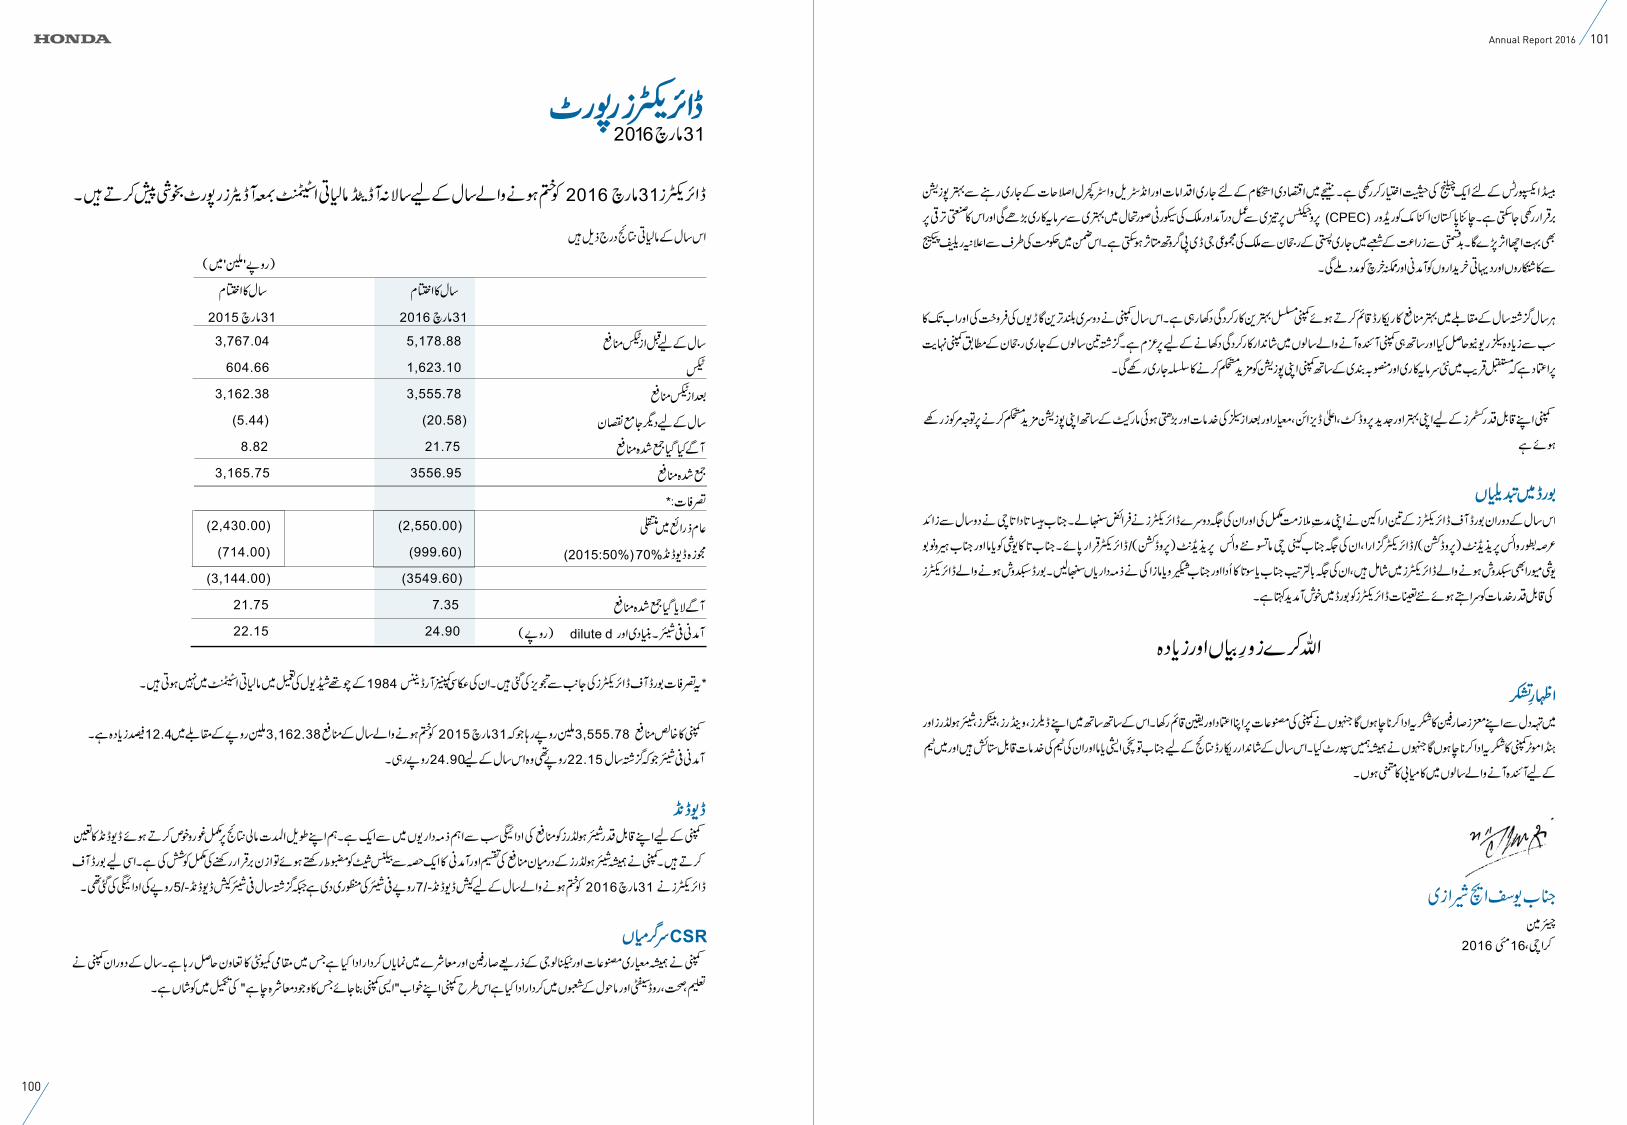
100
101Annual Report 2016
102
103Annual Report 2016
FORM OF PROXY FOR THE YEAR ENDED MARCH 31, 2016
Secretary,
Honda Atlas Cars (Pakistan) Ltd.,1-Mcleod Road, Lahore.
I/We of
being member(s) of Honda Atlas Cars (Pakistan) Ltd.,
having Folio No. / CDC Participant I.D No. and having number of shares, hereby appoint
Mr./Ms. of
who is also a member of the Company having Folio No. / CDC Participant I.D No and
number of shares, as my/our proxy in my/our absence to attend and vote for me/us on my/our behalf at the 24th Annual
General Meeting of the Company to be held on Tuesday, July 19, 2016 at 10:30 a.m. at Faletti’s Hotel, 24-Egerton Road,
The Mall, Lahore and at any adjournment thereof.
Signed this day of 2016.
Witness 1: Signature of Shareholder
Signed:
Name:
Address:
CNIC / Passport No.
Witness 2:
Signed:
Name:
Address:
CNIC / Passport No.
NOTES:
1. A member entitled to attend and vote at the Annual General Meeting of the Company is entitled to appoint a proxy
to attend and vote instead of his/her. No person shall act, as a proxy who is not a member of the Company except
that a corporation may appoint a person who is not a member.
2. The instrument appointing a proxy shall be in writing under the hand of the appointer or his constituted attorney or
if such appointer is a corporation or Company, under the common seal of such corporation or Company.
3. The Form of Proxy, duly completed, must be deposited at Company’s registered office, 1-Mcleod Road, not less
than 48 hours before the time of holding the meeting.
Affix Rs. 5/-
Revenue
Stamp here
Signature of shareholder should
match the specimen signature
registered with the Company
104
105Annual Report 2016
AFFIXCORRECTPOSTAGE
Secretary,Honda Alas Cars (Pakistan) Limited1-Mcleod Road,Lahore.
106
107Annual Report 2016
Dear Shareholder,
DIVIDEND MANDATE FORM
This is to inform you that under Section 250 of the Companies Ordinance, 1984 a shareholder may, if so desire, directs the Company to pay dividend through his/her/its bank account.
In pursuance of the directions given by the Securities and Exchange Commission of Pakistan vide Circular No. 18 of 2012 dated June 05, 2012, we request you, being the registered shareholder of Honda Atlas Cars (Pakistan) Limited, to hereby authorize the Company to directly credit your cash dividends if any, declared by the Company in future directly in your bank account.
PLEASE NOTE THAT THIS DIVIDEND MANDATE IS OPTIONAL AND NOT COMPULSORY, IN CASE YOU DO NOT WISH YOUR DIVIDEND TO BE DIRECTLY CREDITED INTO YOUR BANK ACCOUNT, THEN THE SAME SHALL BE PAID TO YOU THROUGH THE DIVIDEND WARRANT.
Do you wish the future cash dividend declared by the Company, if any, is directly credited in your bank account instead of issue of dividend warrants? Please tick “ 3 “ any of the following boxes:
YES NO
In case of “YES”, please provide the following information:
TRANSFEREE DETAIL
Title of Bank Account
Bank Account Number
Bank’s Name
Branch Code, Name & Address
Cell number of transferee
Landline number of transferee if any,
CNIC number (enclose attested copy also)
Passport No. (in case foreign shareholder)
It is stated that the above mentioned information is correct and confirmed, I shall immediately inform the changes in the above mentioned information to the Company and the concerned Share Registrar as soon as it occurs.
Signature of Shareholder
Name S/O, D/O, W/O
Folio - CDC A/c No.
NOTE: Shareholders having physical shares are requested to please submit the Dividend Mandate Form duly completed to the Share Registrar/Company. In case of CDC account holder, please submit this Mandate Form to the concerned Participant /Broker.
Honda Atlas Cars (Pakistan) Limited