Embed Size (px)
Citation preview
CONTENTS
Page
SECTION 8. PHYSICAL AND CHEMICAL PROPERTIES OF SEDIMENT
Physical Properties of Eroded Sediment-- L. D. Meyer, F. E. Photon and L. L. McDowell.....................
Sediment Particle Sizes from Low Slopes-- C. K. Mutchler and L. L. McDowell . . . . . . . . . . . . . . . . . . . . . . . . . . . . . . . .
Chemicals Associated with Lower Mississippi River Sediments-- Charles R. Demas and Philip B. Curwick . . . . . . . . . . . . . . . . . . . . . . . . . . .
CCA and FCP in Contaminated Forest Stream Sediments-- D. G. Neary, R. A. LaFayette, M. A. Callaham and P. B. Bush......
The Role of Sediment in Accelerated Eutrophication-- A. N. Sharpley . . . . . . . . . . . . . . . . . . . . . . . . . . . . . . . . . . . . . . . . . . . . . . . . . . .
Nutrient-Sediment Relations in Streamflow-- R. Edward Hickman . . . . . . . . . . . . . . . . . . . . . . . . . . . . . . . . . . . . . . . . . . . . . . . .
Nutrient Transport by Sediment from Pine Forests-- P. D. Duffy, J. D. Schreiber and S. J. Ursic . . . . . . ..*............
Water Quality Impacts from Sediment in the Southeast-- Alfred M. Duda . . . . . . . . . . . . . . . . . . . . . . . . . . . . . . . . . . . . . . . . . . . . . . . . . . .
8-l
8-10
8-17
8-27
8-37
8-48
8-57
8-66
Vi

SECTION 8
PHYSICAL AND CHEMICAL PROPERTIES OF SEDIMENT
PHYSICAL PROPERTIES OF ERODED SEDIMENT
By L. D. Meyer, Agricultural Engineer, F. E. Rhoton, Soil Scientist, and L. L. McDowell, Soil Scientist, USDA Sedimentation Laboratory, Agricultural Research Service, Oxford, Mississippi.
ABSTRACT
Sediment properties such as size distribution, density, and stability can greatly affect sediment transport and deposition. Sediment eroded from agricultural soils consists of primary sand, silt, and clay plus less-dense aggregates of these soil separates. Sediment size distributions vary widely among soils due to soil texture, aggregation, stability, and land use. Erosion of fine-textured soils often produces coarse sediment because much of the eroded material is in the form of large, stable aggregates that contain a high percentage of clay particles. Sediment from rills is generally coarser than that from interrill areas.
Knowledge acquired during field research was used to develop laboratory methods for predicting and further characterizing sediment properties. A procedure was developed to predict sediment size distributions using bulk samples of surface soil. about 2.0 g/cm3.
Eroding aggregates were found to have a density of Aggregates eroded by raindrop impact were stable during
transport by runoff. Knowledge of sediment properties is necessary for the development of predictive equations and models to describe the transport of eroded sediment.
INTRODUCTION
Erosion of agricultural soils is a major source of sediment in many parts of the United States and throughout the world. Physical properties of sediment such as size distribution, density, and stability can greatly affect the transportability of sediment by runoff, its capability to carry sorbed chemicals, and where it will deposit. Such sediment properties may be as important to evaluate as erosion rate.
Sediment from cohesive agricultural soils generally consists of both primary particles (sand, silt, and clay) and aggregates that often are much larger although somewhat less dense than the primary particles of which they are composed. A soil aggregate is "a naturally occurring cluster, or group, of soil particles in which the forces holding the particles together are much stronger than the forces between adjacent aggregates" (Martin et al., 1955). The extent and strength (stability) of aggregation for a specific soil depends primarily on its clay content and mineralogy, organic matter content, and content of iron and aluminum oxides (Hartman, 1979).
Soil aggregate stability affects sediment size and shape and consequently erosion rate. Stable aggregates withstand the erosive forces of raindrop impact and flowing runoff with relatively little breakdown, whereas unstable aggregates are subject to extensive dispersion. In addition to finer, more easily transported sediment, aggregate dispersion also leads to soil surface sealing and greater runoff.
8-1
Prior to the last decade, the size, density, and stability characteristics of eroding sediment were usually ignored in analyzing losses from agricultural land. HOWSVIX-, the erosion/sedimentation components of recent prediction models such as CREAMS (Foster et al., 1981) and ANSWERS (Dillaha and Beasley, 1983) use sediment size and density in their computations. Researchers have begun to assess the usefulness of available sediment transport relationships that consider such properties (Alonso et al., 1981) and have conducted experiments to evaluate the effect of sediment size and density on transport of sediment by agricultural runoff (Davis et al., 1983; Meyer et al., 1983).
Recent progress in understanding the effects of sediment properties on sediment movement and incorporating these findings into transport relationships has shown that pertinent data on sediment properties are urgently needed. This paper summarizes results of research designed to answer scme of these needs.
SEDIMENT SIZE DISTRIBUTION
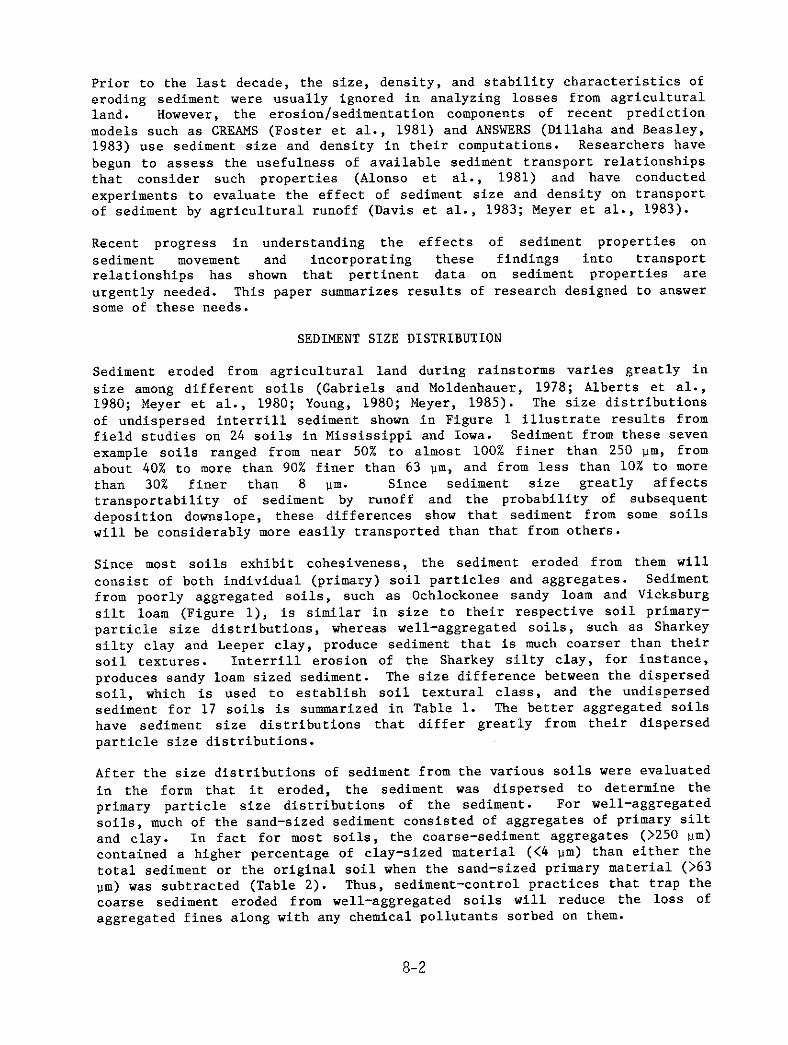
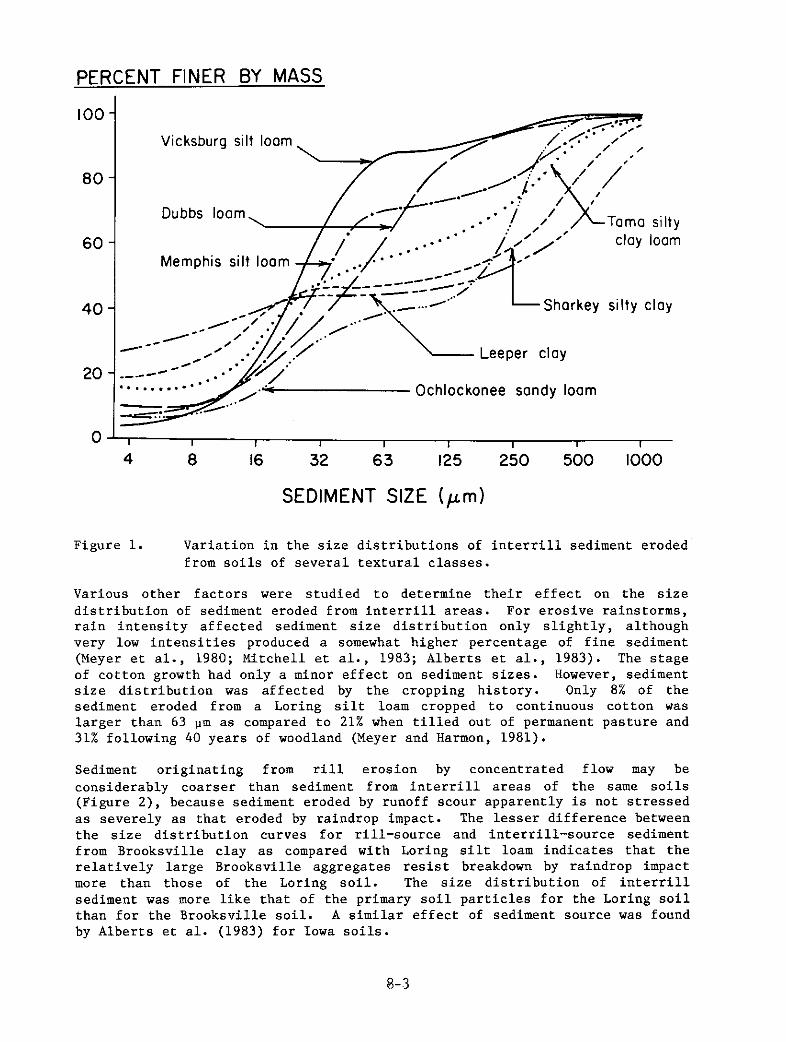
Sediment eroded from agricultural land during rainstorms varies greatly in size among different soils (Gabriels and Moldenhauer, 1978; Alberts et al., 1980; Meyer et al., 1980; Young, 1980; Meyer, 1985). The size distributions of undispersed interrill sediment shown in Figure 1 illustrate results from field studies on 24 soils in Mississippi and Iowa. Sediment from these seven example soils ranged from near 50% to almost 100% finer than 250 urn, from about 40% to more than 90% finer than 63 pm, and from less than 10% to more than 30% finer than 8 urn. Since sediment size greatly affects transportability of sediment by runoff and the probability of subsequent deposition downslope, these differences show that sediment from some soils will be considerably more easily transported than that from others.
Since most soils exhibit cohesiveness,, the sediment eroded from them will consist of both individual (primary) soil particles and aggregates. Sediment from poorly aggregated soils, such as Ochlockonee sandy loam and Vicksburg silt loam (Figure l), is similar in size to their respective soil primary- particle size distributions, whereas well-aggregated soils, such as Sharkey silty clay and Leeper clay, produce sediment that is much coarser than their soil textures. Interrill erosion of the Sharkey silty clay, for instance, produces sandy loam sized sediment. The size difference between the dispersed SOil, which is used to establish soil textural class, and the undispersed sediment for 17 soils is summarized in Table 1. The better aggregated soils have sediment size distributions that differ greatly from their dispersed particle size distributions.
After the size distributions of sediment from the various soils were evaluated in the form that it eroded, the sediment was dispersed to determine the primary particle size distributions of the sediment. For well-aggregated soils, much of the sand-sized sediment consisted of aggregates of primary silt and clay. In fact for most soils, the coarse-sediment aggregates 0250 urn) contained a higher percentage of clay-sized material (<4 pm) than either the total sediment or the original soil when the sand-sized primary material 063 pm) was subtracted (Table 2). Thus, sediment-control practices that trap the coarse sediment eroded from well-aggregated soils will reduce the loss of aggregated fines along with any chemical pollutants sorbed on them.
8-2
PERCENT FINER BY MASS
100
Vicksburg silt loom
80
60 Memphis silt loom
Shorkey silty clay
20 Ochlockonee sandy loam
O’, I 1 8 I I I I , 4 8 16 32 63 125 250 500 1000
SEDIMENT SIZE (pm)
Figure 1. Variation in the size distributions of interrill sediment eroded from soils of several textural classes.
Various other factors were studied to determine their effect on the size distribution of sediment eroded from interrill areas. For erosive rainstorms, rain intensity affected sediment size distribution only slightly, although very low intensities produced a somewhat higher percentage of fine sediment (Meyer et al., 1980; Mitchell et al., 1983; Albert6 et al., 1983). The stage of cotton growth had only a minor effect on sediment sizes. However, sediment size distribution was affected by the cropping history. Only 8% of the sediment eroded from a Loring silt loam cropped to continuous cotton was larger than 63 urn as compared to 21% when tilled out of permanent pasture and 31% following 40 years of woodland (Meyer and Harmon, 1981).
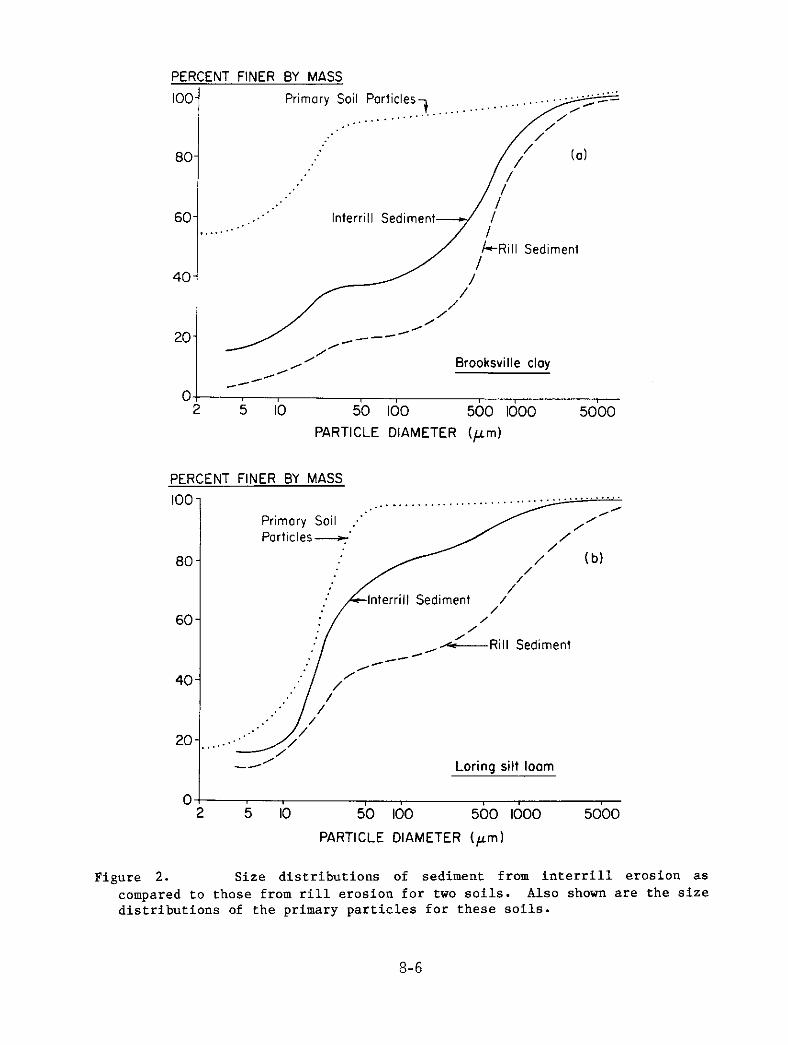
Sediment originating from rill erosion by concentrated flow may be considerably coarser than sediment from interrill areas of the same soils (Figure 2), because sediment eroded by runoff scour apparently is not stressed as severely as that eroded by raindrop impact. The lesser difference between the size distribution curves for rill-source and interrill-source sediment from Brooksville clay as compared with Loring silt loam indicates that the relatively large Brooksville aggregates resist breakdown by raindrop impact more than those of the Loring soil. The size distribution of interrill sediment was more like that of the primary soil particles for the Loring soil than for the Brooksville soil. A similar effect of sediment source was found by Albert6 et al. (1983) for Iowa soils.
8-3
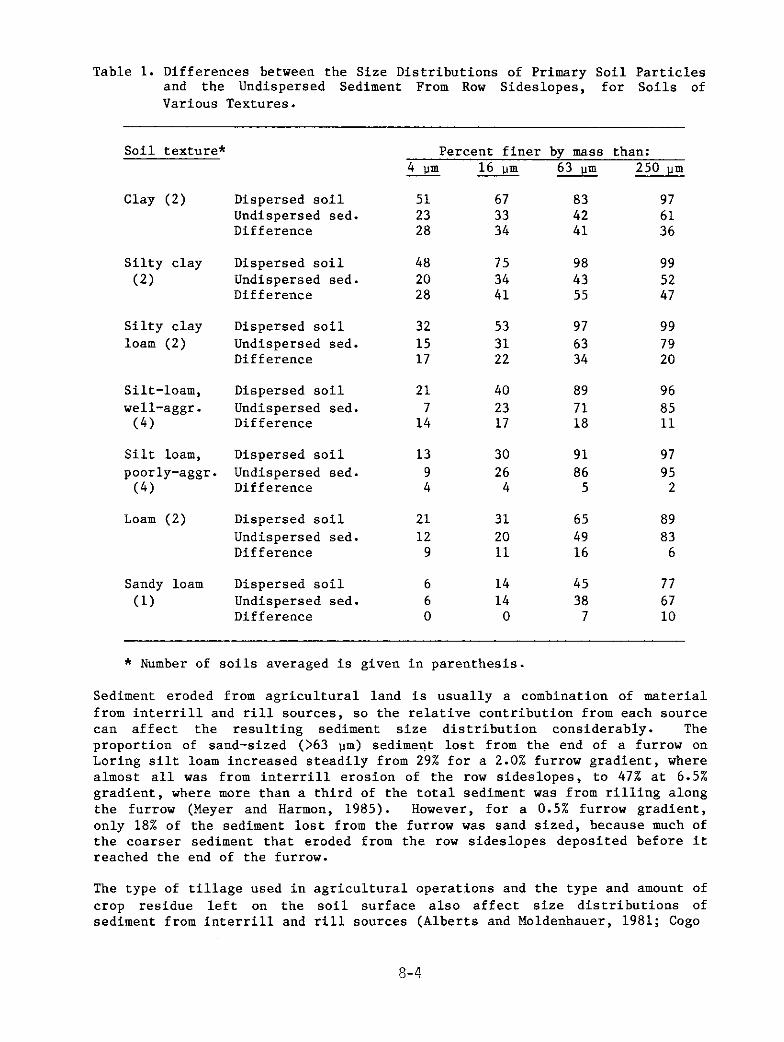
Table 1. Differences between the Size Distributions of Primary Soil Particles and the Undispersed Sediment From Row Sideslopes, for Soils of Various Textures.
Soil texture* Percent finer by mass than:
Clay (2)
Silty clay (2)
Silty clay loam (2)
Silt-loam, Dispersed soil 21 40 89 96 well-aggr. Undispersed sed. 7 23 71 85
(4) Difference 14 17 18 11
Silt loam, Dispersed soil 13 30 91 97 poorly-aggr. Undispersed sed. 9 26 86 95
(4) Difference 4 4 5 2
Loam (2) Dispersed soil Undispersed sed. Difference
21 12
9
31 20 11
14 14
0
65 89 49 83 16 6
Sandy loam (1)
Dispersed soil 51 67 83 97 Undispersed sed. 23 33 42 61 Difference 28 34 41 36
Dispersed soil 48 75 98 99 Undispersed sed. 20 34 43 52 Difference 28 41 55 47
Dispersed soil 32 53 97 99 Undispersed sed. 15 31 63 79 Difference 17 22 34 20
Dispersed soil 6 Undispersed sed. 6 Difference 0
45 77 38 67
7 10
* Number of soils averaged is given in parenthesis.
Sediment eroded from agricultural land is usually a combination of material from interrill and rill sources, so the relative contribution from each source can affect the resulting sediment size distribution considerably. The proportion of sand-sized 063 pm) sedimeqt lost from the end of a furrow on Loring silt loam increased steadily from 29% for a 2.0% furrow gradient, where almost all was from interrill erosion of the row sideslopes, to 47% at 6.5% gradient, where more than a third of the total sediment was from rilling along the furrow (Meyer and Harmon, 1985). However, for a 0.5% furrow gradient, only 18% of the sediment lost from the furrow was sand sized, because much of the coarser sediment that eroded from the row sideslopes deposited before it reached the end of the furrow.
The type of tillage used in agricultural operations and the type and amount of crop residue left on the soil surface also affect size distributions of sediment from interrill and rill sources (Alberts and Moldenhauer, 1981; Cogo
8-4
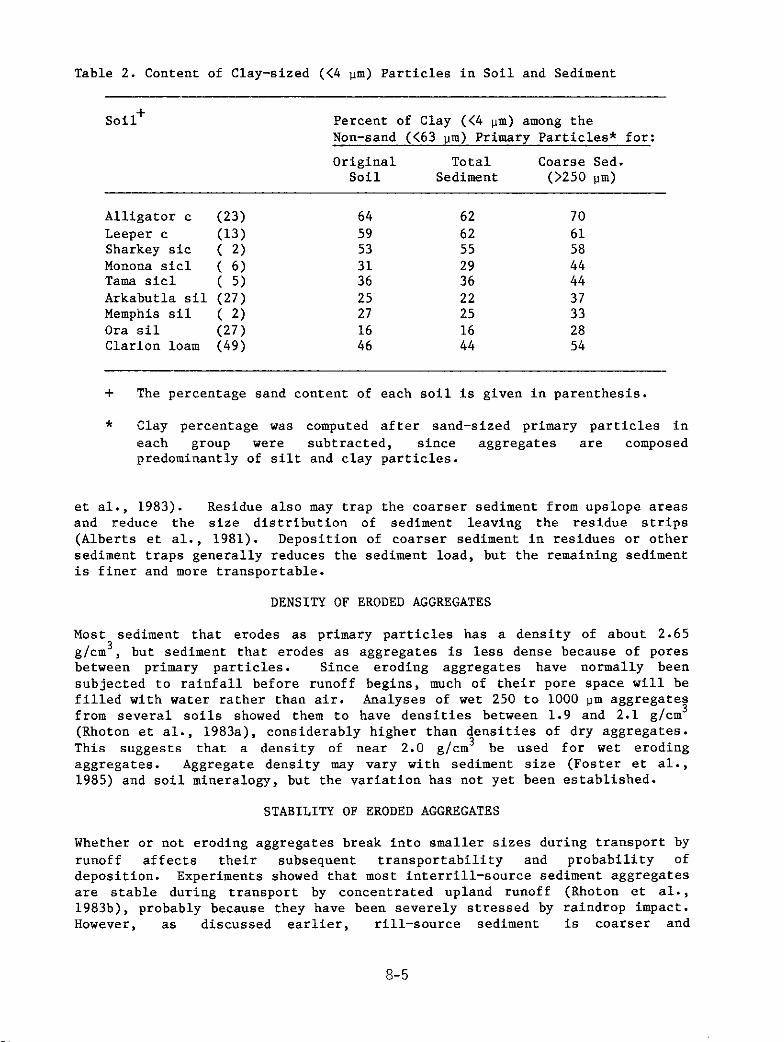
Table 2. Content of Clay-sized (<4 pm) Particles in Soil and Sediment
soil+ Percent of Clay (<4 ,,m) among the Non-sand (<63 urn) Primary Particles* for:
Original Total Coarse Sed. Soil Sediment 0250 pm)
Alligator c (23) 64 62 70 Leeper c (13) 59 62 61 Sharkey sic ( 2) 53 55 58 Monona sic1 ( 6) 31 29 44 Tama sic1 ( 5) 36 36 44 Arkabutla sil (27) 25 22 37 Memphis sil ( 2) 27 25 33 Ora sil (27) 16 16 28 Clarion loam (49) 46 44 54
+ The percentage sand content of each soil is given in parenthesis.
* Clay percentage was computed after sand-sized primary particles in each group were subtracted, since aggregates are composed predominantly of silt and clay particles.
et al., 1983). Residue also may trap the coarser sediment from upslope areas and reduce the size distribution of sediment leaving the residue strips (Alberts et al., 1981). Deposition of coarser sediment in residues or other sediment traps generally reduces the sediment load, but the remaining sediment is finer and more transportable.
DENSITY OF ERODED AGGREGATES
Most sediment that erodes as primary particles has a density of about 2.65 g/cm3, but sediment that erodes as aggregates is less dense because of pores between primary particles. Since eroding aggregates have normally been subjected to rainfall before runoff begins, much of their pore space will be filled with water rather than air. Analyses of wet 250 to 1000 pm aggregates from several soils showed them to have densities between 1.9 and 2.1 g/cm3 (Rhoton et al., 1983a), considerably higher than densities of dry aggregates. This suggests that a density of near 2.0 g/cm3 be used for wet eroding aggregates. Aggregate density may vary with sediment size (Foster et al., 1985) and soil mineralogy, but the variation has not yet been established.
STABILITY OF ERODED AGGREGATES
Whether or not eroding aggregates break into smaller sizes during transport by runoff affects their subsequent transportability and probability of deposition. Experiments showed that most interrill-source sediment aggregates are stable during transport by concentrated upland runoff (Rhoton et al., 1983b), probably because they have been severely stressed by raindrop impact. However, as discussed earlier, rill-source sediment is coarser and
8-5
PERCENT FINER BY MASS PERCENT FINER BY MASS
IOO- IOO- Primary Soil Particles Primary Soil Particles
: :’
BO- BO- :
lnterrill Sediment lnterrill Sediment
Sediment
/’ Brooksville clay
IO IO 50 50 100 100 500 500 1000 1000 5000 5000
PARTICLE DIAMETER (pm) PARTICLE DIAMETER (pm)
PERCENT FINER BY MASS PERCENT FINER BY MASS
100 - Primary Soil Primary Soil Particles-’ Particles-’
00-
Lorino silt loam Loring silt loom
2 5 IO 50 100 500 1000 5000
PARTICLE DIAMETER (pm)
Figure 2. Size distributions of sediment from interrill erosion as compared to those from rill erosion for two soils. Also shown are the size distributions of the primary particles for these soils.
8-6
consequently less stable; therefore, breakdown of such aggregates is more likely.
SEDIMENT SIZE PREDICTION
Field experiments to evaluate sediment size distributions are time consuming and costly, yet such distributions are needed for erosion/sedimentation models and other sediment transport analyses. A laboratory method was developed to predict sediment size distributions (Rhoton et al., 1982). An air-dry sample of surface soil is wetted under tension and shaken in an orbital shaker to simulate rainfall processes. The size distribution of the resulting "sediment" is then evaluated by standard sieving and pipetting procedures. The results are much better predictors of size distributions of sediment from interrill areas than are those indicated by soil texture or those determined by gentle agitation procedures such as conventional aggregate-index analyses.
Methods for mathematically predicting the portion of the total sediment in each of five rather broad size classes were developed to provide sediment size and density data for CREAMS (Foster et al., 1981; 1985). The percentages of sand, silt and clay in the soil are used to estimate the percentages of primary sand, primary silt, primary clay, large aggregates, and small aggregates in the sediment. As more data become available, more accurate predictions and additional size classes with narrower ranges should be possible.
NEEDED SEDIMENT PROPERTIES RESEARCH
Further knowledge concerning physical properties of sediment eroded from agricultural soils promises to result from several areas of research:
1. Continued field and laboratory studies to evaluate sediment size distributions from interrill and especially rill erosion for different soils at various conditions.
2. Efforts to statistically predict sediment properties from measurable soil and site characteristics, to complement data obtained from field experiments and laboratory tests.
3. Detailed studies designed to quantify the effects of soil chemical, physical, and mineralogical properties on characteristics of sediment from aggregated soils.
SUMMARY AND CONCLUSIONS
The physical properties of sediment eroded from agricultural soils may vary greatly with soil texture and aggregation. Fine-textured soils often produce sediment containing large aggregates that are much less transportable than the primary particles of which they are composed. These coarse aggregates frequently contain more clay than the bulk soil, so trapping them can greatly reduce the loss of aggregated fine soil particles and any sorbed chemical pollutants.
Sediment scoured by concentrated runoff is generally coarser than that eroded by raindrop impact from interrill areas on the same soil. Therefore, the
8-7
proportion of the total sediment from rill versus interrill sources can affect the net sediment size distribution. Deposition of sediment can also affect the size distribution of the remaining sediment, since the coarser and denser materials usually deposit first.
Coarse aggregates generally have a density of about 2.0 g/cm3 when in a wet, eroding state. Aggregates detached and eroded by rainfall are unlikely to be broken down further during transport by concentrated upland runoff.
The size distribution of sediment eroded by rainfall from aggregated soils can be estimated by laboratory procedures, starting with a sample of surface soil, and by equations that use the content of sand, silt, and clay of the soil. Further research is needed to improve estimates of sediment size, density, and stability from measurable soil characteristics.
REFERENCES
Alberts, E. E. and Moldenhauer. W. c., 1981, Nitrogen and Phosphorus Transported by Eroded Soil Aggregates, Soil sci. SOC. Amer. J. 45:391-396.
and Foster, G. R., 1980, Soil Aggregates and Primaxy'Particles Transporied in Rill and Interrill Flow, Soil Sci. sot. Amer. J. 44:590-595.
> Neibling, W. H., and Moldenhauer, W. C., 1981, Transport of Sediment Nitrogen and Phosphorus in Runoff Through Cornstalk Residue Strips, Soil Sci. Sot. Amer. J. 45: 1177-1184.
, Wendt, R. C., and Piest, R. F., 1983, Physical and Chemical Properties of Eroded Soil Aggregates, Trans. ASAE. 26~465-471.
Alonso, C. V., Neibling, W. H., and Foster, G. F., 1981, Estimating Sediment Transport Capacity in Watershed Modeling, Trans. ASAE 24:1211-1220, 1226.
cogo, N. P., Moldenhauer, W. C., and Foster, G. R., 1983, Effect of Crop Residue, Tillage-Induced Roughness, and Runoff Velocity on Size Distribution of Eroded Soil Aggregates, Soil sci. sot. Amer. J. 47:1005-1008.
Davis, S. S., Foster, G. R., and Huggins, L. F., 1983, Deposition of Nonuniform Sediment on Concave Slopes, Trans ASAB 26:1057-1063.
Dillaha, III, T. A. and Beasley, D. B., 1983, Distributed Parameter Modeling of Sediment Movement and Particle Size Distributions, Trans. ASAE 26~1766-1772, 1777.
Foster, G. R., Lane, L. J., Nowlin, 3. D., Laflen, J. M., and Young, R. A., 1981, Estimating Erosion and Sediment Yield on Field-sized Areas, Trans. ASAE 24:1253-1262.
Young, R. A., and Neibling, W. H., 1985, Sediment Composition for Nonpoint Source Pollution Analyses, Trans. ASAE 28:133-139, 146.
Gabriels, D. and Moldenhauer, W. C., 1978, Size Distribution of Eroded Material from Simulated Rainfall: Effect Over a Range of Texture, Soil Sci. Sot. Amer. J. 42:954-958.
Hartman, R., 1979, Aggregation. In The Encyclopedia of Soil Science, Part I, (R. W. Fairbridge and C. W. Fxkle, Jr. editors) Dowden, Hutchinson, and Ross, Stroudsburg, PA, pp. 24-27.
Martin, J. P., Martin, W. P., Page, J. P., Raney, W. A., and Demerit, J. D., 1955, Soil Aggregation, Advances in Agronomy 7~1-37.
8-8
Meyer, L. D., 1985, Interrill Erosion Rates and Sediment Characteristics. In Soil Erosion and Conservation (S. A. El-Swaify, W. C. Moldenhauer, and Ti; LO, ed.) Soil Conservation Society of America, Ankeny, IA, pp. 167-177.
, and Harmon, W. C., 1981, Soil Erosion and Sediment Characteristics in the Goodwin Creek Catchment, Appendix G, Report to the U. S. Army Corps of Engineers, USDA Sedimentation Laboratory, Oxford, MS, 64 PP.
, and , 1985, Sediment Losses From Cropland Furrows of Different Gradients, Trans. ASAE 28:448-453, 461.
from Crop'Row Sideslope:, and L. L. McDowell, 1980, Sediment Sizes Eroded
Trans. ASAE 23:891-898. , Zuhdi, B. A., Coleman, N. L., and Prasad, S. N., 1983, Transport
of Sand-sized Sediment Along Crop-row Furrows, Trans. ASAE 26:106-111. Mitchell, .J. K., Mostaghimi, S., and Pond, M. C., 1983, Primary Particle and
Aggregate Size Distribution of Eroded Soil from Sequenced Rainfall Events, Trans. ASAB 26~1773-1777.
Rhoton, F. E., Meyer, L. D., and Whisler, F. D., 1982, A Laboratory Method for Predicting the Size Distribution of Sediment Eroded from Surface Soils, Soil Sci. Sot. Amer. J. 46:1256-1263.
and Annresated )Sediment from Different Textured So;ls,
1983a, Densities of Wet Soil sci. SOC. Amer. -- -
J. 47~576-578. and
Sediment ;o Runoff Streises, 1983b, Response of Aggregated
Trans. ASAE ;6:1476-1478. Young, R. A., 1980, Characteristics of Eroded Sediment, Trans. ASAE
23:1139-1142, 1146.
8-9
SEDIMENT PARTICLE SIZES FROM LOW SLOPES
By C. K. Mutchler, Hydraulic Engineer and L. L. McDowell, Soil Scientist, USDA Sedimentation Laboratory, Oxford, MS
ABSTRACT
Knowledge of sediment sizes in runoff is needed to model the soil erosion process. This study, using simulated rainfall, determined sediment sizes from different slope lengths on a 0.2% slope. No statistical difference due to time during the storm, plot length, or dry and wet funs could be found in sediment size distributions from the plots. Enrichment ratios of sediments ranged from 1.4 for clay to 0.1 for sand. Over 70% of the sediment clay was transported in aggregates; D50 sizes of the non-dispersed sediment were 2 to 3 times as large as D50 of the dispersed sediment.
INTRODUCTION
Soil erosion is a combination of detachment, transport, and deposition pl?XCSSeS. Of these processes, transport and deposition particularly influence sediment sizes found at the end of a slope. Likewise, the amount of soil detached and transported from a slope is influenced by soil particle sizes, primary and aggregated, found in the soil matrix. Knowledge of these relationships is needed to improve mathematical modeling of soil erosion.
This report describes sediment sizes eroded from plots on a 0.2% slope with slope lengths of 23, 46, 91, and 183 meters. Data from the experiment are compared with the sediment size relationships used in CREAMS (Foster et al., 1980).
PROCEDURES
Two replications of each slope length were located on a Leeper silty clay loam (Vertic Haplaquepts) soil smoothed to a uniform slope of 0.2%. The entire plot area was tilled several times. Each plot was bedded with a disk hipper the day before testing to form 4 ridges 1 m apart and about 0.2 m high with two border rows on each side.
Simulated rainfall was applied at a rate of 76 mm/h in two l-h increments separated by about 5 h. The initial storm (dry run) was applied on the plot at the existing soil moisture. The following storm (wet run) was applied about 5 h later when the soil moisture was nearly equal for all the plots. A rainulator (Meyer, 1960) was used to simulate rainfall on the lower 23 m of each plot; a part-circle irrigation system up-slope from the rainulator was used on the upper parts of the three longer plots. Runoff was measured continuously using a flume and water stage recorder. Sediment concentration samples for determining soil loss were taken every 3 minutes.
The reader is referred to the earlier publication on this project by Mutchler and Greer (1980) for a more detailed description of the procedures used to determine measured application rate, runoff, and soil loss.
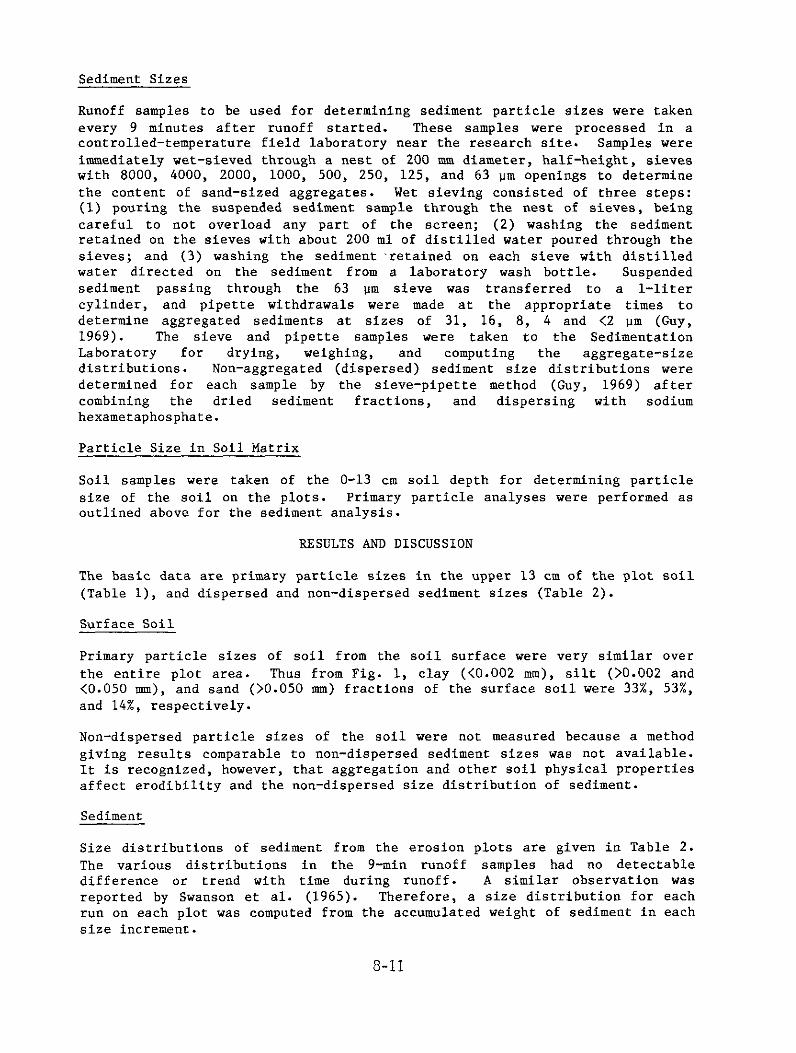
Sediment Sizes
Runoff samples to be used for determining sediment particle sizes were taken every 9 minutes after runoff started. These samples were processed in a controlled-temperature field laboratory near the research site. Samples were immediately wet-sieved through a nest of 200 mm diameter, half-height, sieves with 8000, 4000, 2000, 1000, 500, 250, 125, and 63 pm openings to determine the content of sand-sized aggregates. Wet sieving consisted of three steps: (I) pouring the suspended sediment sample through the nest of sieves, being careful to not overload any part of the screen; (2) washing the sediment retained on the sieves with about 200 ml of distilled water poured through the sieves; and (3) washing the sediment ,retained on each sieve with distilled water directed on the sediment from a laboratory wash bottle. Suspended sediment passing through the 63 pm sieve was transferred to a l-liter cylinder, and pipette withdrawals were made at the appropriate times to determine aggregated sediments at sizes of 31, 16, 8, 4 and <2 urn (Guy, 1969). The sieve and pipette samples were taken to the Sedimentation Laboratory for dW*g, weighing, and computing the aggregate-size distributions. Non-aggregated (dispersed) sediment size distributions were determined for each sample by the sieve-pipette method (Guy, 1969) after combining the dried sediment fractions, and dispersing with sodium hexametaphosphate.
Particle Size in Soil Matrix
Soil samples were taken of the O-13 cm soil depth for determining particle size of the soil on the plots. Primary particle analyses were performed as outlined above for the sediment analysis.
RESULTS AND DISCUSSION
The basic data are primary particle sizes in the upper 13 cm of the plot soil (Table l), and dispersed and non-dispersed sediment sizes (Table 2).
Surface Soil
Primary particle sizes of soil from the soil surface were very similar over the entire plot area. Thus from Fig. 1, clay (<0.002 mm), silt 00.002 and <0.050 mm), and sand (>0.050 mm) fractions of the surface soil were 33%, 53%, and 14%, respectively.
Non-dispersed particle sizes of the soil were not measured because a method giving results comparable to non-dispersed sediment sizes was not available. It is recognized, however, that aggregation and other soil physical properties affect erodibility and the non-dispersed size distribution of sediment.
Sediment
Size distributions of sediment from the erosion plots are given in Table 2. The various distributions in the 9-min runoff samples had no detectable difference or trend with time during runoff. A similar observation was reported by Swanson et al. (1965). Therefore, a size distribution for each run on each plot was computed from the accumulated weight of sediment in each size increment.
8-11
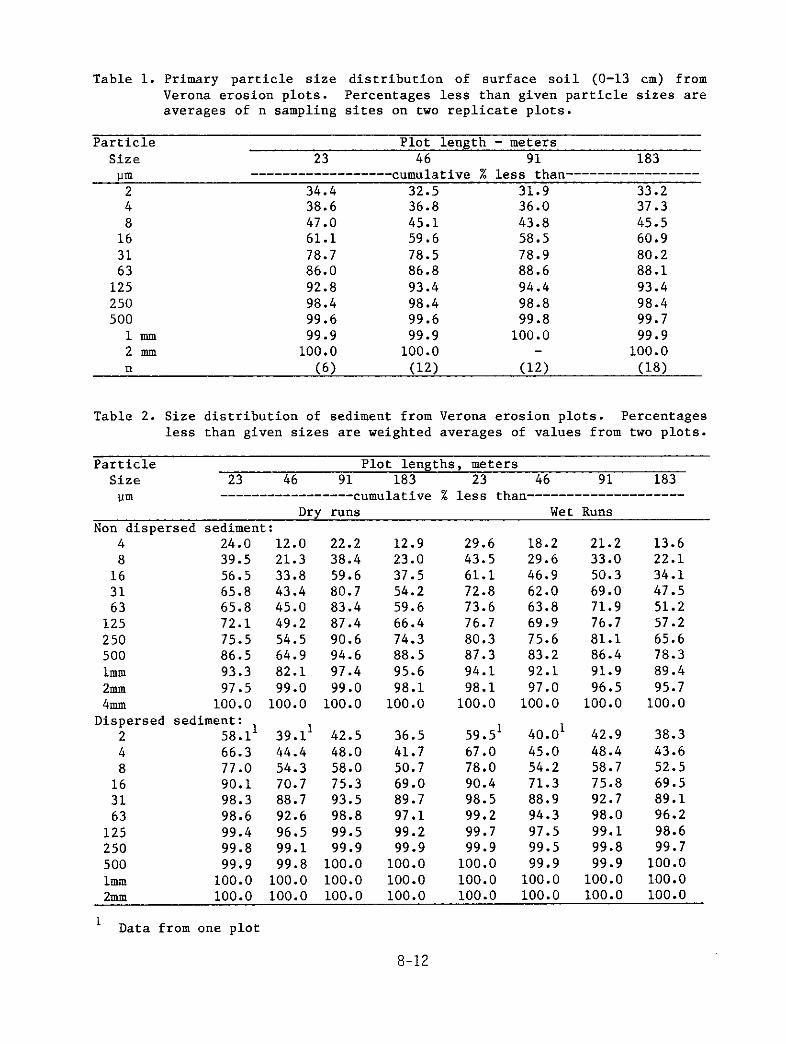
Table 1. Primary particle size distribution of surface soil (O-13 cm) from Verona erosion plots. Percentages less than given particle sizes are averages of n sampling sites on two replicate plots.
Particle Plot length - meters Size 23 46 91 183
Pm ------------------ cumulative % less than----------------- 2 34.4 32.5 31.9 33.2 4 38.6 36.8 8 47.0 45.1
lb 61.1 59.6 31 78.7 78.5 63 86.0 86.8
125 92.8 93.4 250 98.4 98.4 500 99.6 99.6
1W 99.9 99.9 2mm 100.0 100.0
36.0 43.8 58.5 78.9 88.6 94.4 98.8 99.8
100.0
(6) (12) (12)
37.3 45.5 60.9 80.2 88.1 93.4 98.4 99.7 99.9
100.0 (18)
Table 2. Size distribution of sediment from Verona erosion plots. Percentages less than given sizes are weighted averages of values from two plots.
Particle Size
w
Plot lengths, meters 23 46 91 183 23 46 91 183
----------------- cumulative % less than-------------------- Dry runs Wet Runs
Non dispersed sediment: 4 24.0 8 39.5
lb 56.5 31 65.8 63 65.8
125 72.1 250 75.5 500 86.5 1ULlD 93.3 2mm 97.5 4mm 100.0
Dispersed sediment: 2 58.11 4 66.3 8 77.0
lb 90.1 31 98.3 63 98.6
125 99.4 250 99.8 500 99.9 lm 100.0
12.0 22.2 12.9 21.3 38.4 23.0 33.8 59.6 37.5 43.4 80.7 54.2 45.0 83.4 59.6 49.2 87.4 66.4 54.5 90.6 74.3 64.9 94.6 88.5 82.1 97.4 95.6 99.0 99.0 98.1
100.0 100.0 100.0
29.6 18.2 21.2 43.5 29.6 33.0 61.1 46.9 50.3 72.8 62.0 69.0 73.6 63.8 71.9 76.7 69.9 76.7 80.3 75.6 81.1 87.3 83.2 86.4 94.1 92.1 91.9 98.1 97.0 96.5
100.0 100.0 100.0
59.51 40.01 42.9 67.0 45.0 48.4 78.0 54.2 58.7 90.4 71.3 75.8 98.5 88.9 92.7 99.2 94.3 98.0 99.7 97.5 99.1 99.9 99.5 99.8
100.0 99.9 99.9
13.6 22.1 34.1 47.5 51.2 57.2 65.6 78.3 89.4 95.7
100.0
39.11 42.5 44.4 48.0 54.3 58.0 70.7 75.3 88.7 93.5 92.6 98.8 96.5 99.5 99.1 99.9 99.8 100.0
100.0 100.0
36.5 41.7 50.7 69.0 89.7 97.1 99.2 99.9
100.0 100.0
38.3 43.6 52.5 69.5 89.1 96.2 98.6 99.7
100.0 100.0
2mm 100.0 100.0 100.0 100.0 100.0 100.0 100.0 100.0 100.0 100.0 100.0
1 Data from one plot
8-12
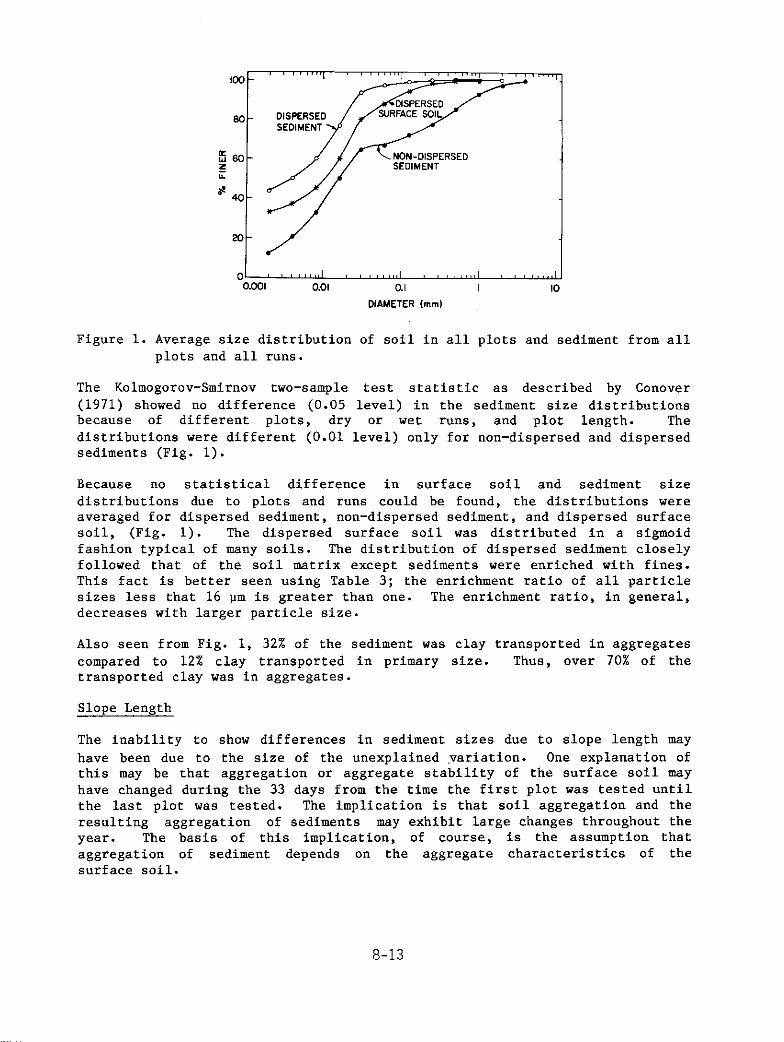
Figure 1. Average size distribution of soil in all plots and sediment from all plots and all runs.
The Kolmogorov-Smirnov two-sample test statistic as described by Conover (1971) showed no difference (0.05 level) in the sediment size distributions because of different plots, dry or wet runs, and plot length. The distributions were different (0.01 level) only for non-dispersed and dispersed sediments (Fig. 1).
Because no statistical difference in surface soil and sediment size distributions due to plots and runs could be found, the distributions were averaged for dispersed sediment, non-dispersed sediment, and dispersed surface soil, (Fig. 1). The dispersed surface soil was distributed in a sigmoid fashion typical of many soils. The distribution of dispersed sediment closely followed that of the soil matrix except sediments were enriched with fines. This fact is better seen using Table 3; the enrichment ratio of all particle sizes less that 16 urn is greater than one. The enrichment ratio, in general, decreases with larger particle size.
Also seen from Fig. 1, 32% of the sediment was clay transported in aggregates compared to 12% clay transported in primary size. Thus, over 70% of the transported clay was in aggregates.
Slope Length
The inability to show differences in sediment sizes due to slope length may have been due to the size of the unexplained variation. one explanation of this may be that aggregation or aggregate stability of the surface soil may have changed during the 33 days from the time the first plot was tested until the last plot was tested. The implication is that soil aggregation and the resulting aggregation of sediments may exhibit large changes throughout the YCXX. The basis of this implication, of course, is the assumption that aggregation of sediment depends on the aggregate characteristics of the surface soil.
8-13
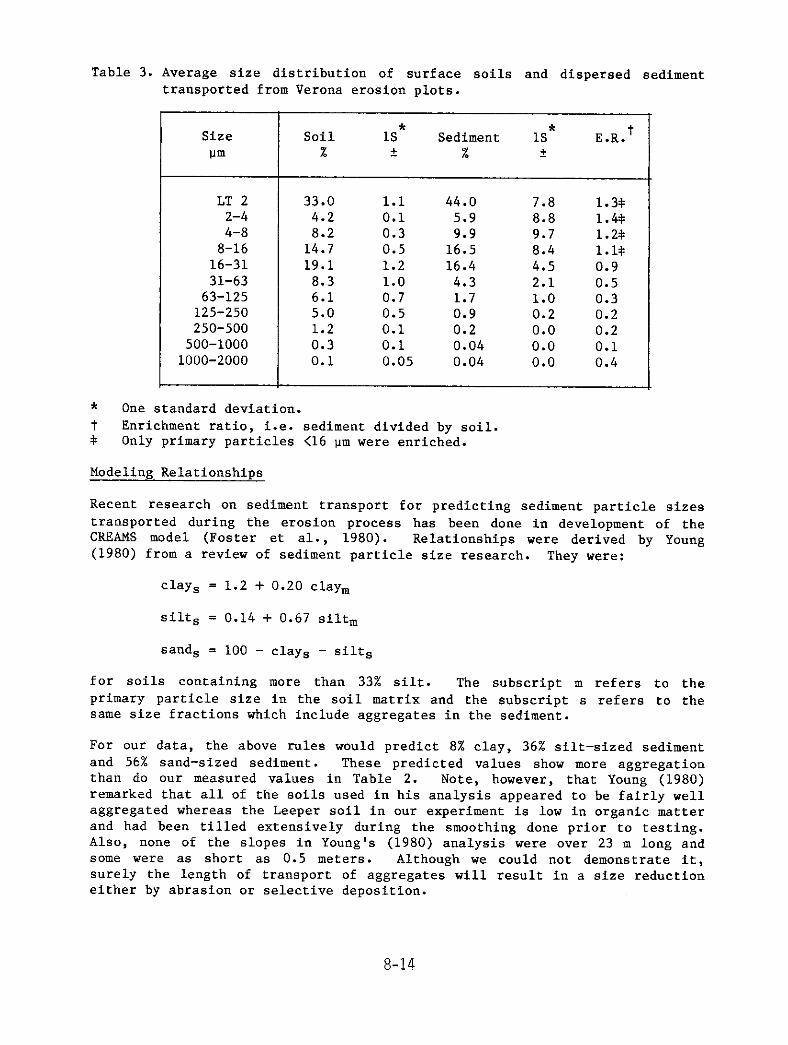
Table 3. Average size distribution of surface soils and dispersed sediment transported from Verona erosion plots.
Si2e Soil lS* Sediment lS* E.R.+ Ilm % ?: % f
LT 2 33.0 1.1 44.0 7.8 1.3* 2-4 4.2 0.1 5.9 8.8 1.4* 4-S 8.2 0.3 9.9 9.7 1.2*
8-16 14.7 0.5 16.5 8.4 1.1* 16-31 19.1 1.2 16.4 4.5 0.9
I 31-63 8.3 1.0 4.3 2.1 0.5 63-125 6.1 0.7 1.7 1.0 0.3
125-250 5.0 0.5 0.9 0.2 0.2 250-500 1.2 0.1 0.2 0.0 0.2
500-1000 0.3 0.1 0.04 0.0 0.1 1000-2000 0.1 0.05 0.04 0.0 0.4
* One standard deviation. t Enrichment ratio, i.e. sediment divided by soil. * Only primary particles <16 pm were enriched.
Modeling Relationships
Recent research on sediment transport for predicting sediment particle sizes transported during the erosion process has been done in development of the CREAMS model (Foster et al., 1980). Relationships were derived by Young (1980) from a review of sediment particle size research. They were:
clays = 1.2 + 0.20 clay,
silts = 0.14 + 0.67 silt,
sands = 100 - clays - silts
for soils containing more than 33% silt. The subscript m refers to the primary particle size in the soil matrix and the subscript s refers to the same size fractions which include aggregates in the sediment.
For our data, the above roles would predict 8% clay, 36% silt-sized sediment and 56% sand-sized sediment. These predicted values show more aggregation than do our measured values in Table 2. Note, however, that Young (1980) remarked that all of the soils used in his analysis appeared to be fairly well aggregated whereas the Leeper soil in our experiment is low in organic matter and had been tilled extensively during the smoothing done prior to testing. Also, none of the slopes in Young's (1980) analysis were over 23 m long and some were as short as 0.5 meters. Although we could not demonstrate it, surely the length of transport of aggregates will result in a size reduction either by abrasion or selective deposition.
8-14
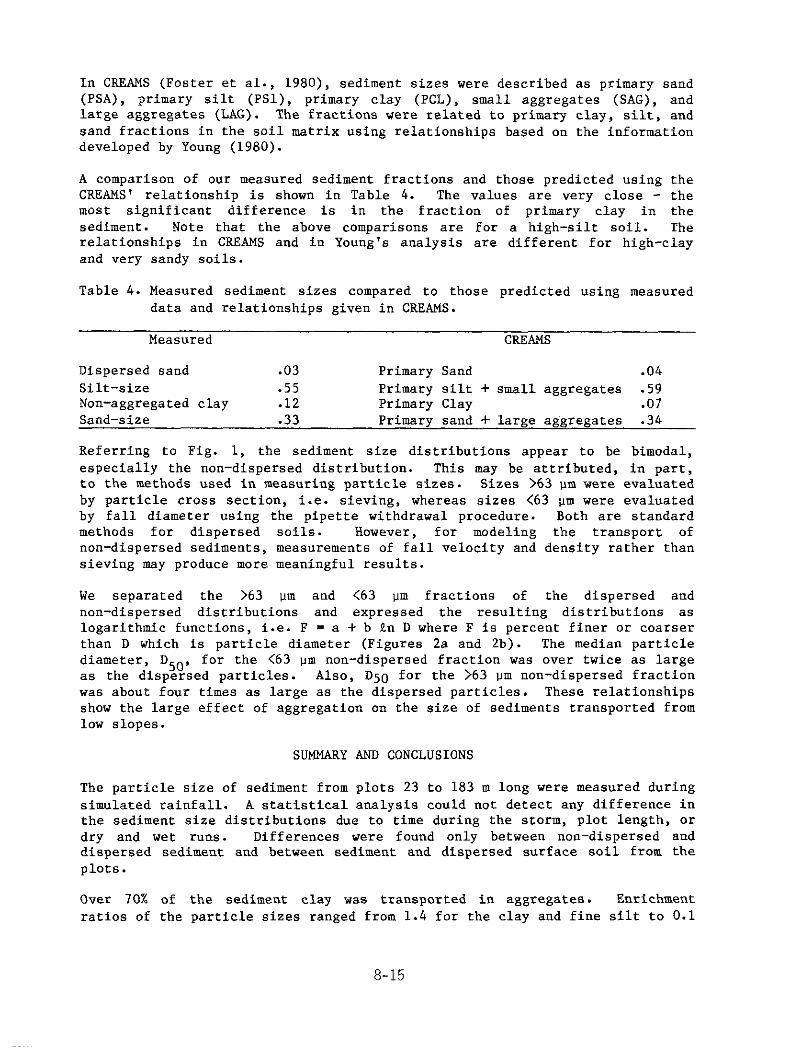
In CREAMS (Foster et al., 1980), sediment sizes were described as primary sand (PSA), primary silt (PSl), primary clay (PCL), small aggregates (SAG), and large aggregates (LAG). The fractions were related to primary clay, silt, and sand fractions in the soil matrix using relationships based on the information developed by Young (1980).
A comparison of our measured sediment fractions and those predicted using the CREAMS' relationship is shown in Table 4. The values are very close - the most significant difference is in the fraction of primary clay in the sediment. Note that the above comparisons are for a high-silt soil. The relationships in CREAMS and in Young's analysis are different for high-clay and very sandy soils.
Table 4. Measured sediment sizes compared to those predicted using measured data and relationships given in CREAMS.
Measured CREAMS
Dispersed sand Silt-size Non-aggregated clay Sand-size
.03 Primary Sand .04
.55 Primary silt + small aggregates .59
.12 Primary Clay .07
.33 Primary sand + large aggregates .34
Referring to Fig. 1, the sediment size distributions appear to be bimodal, especially the non-dispersed distribution. This may be attributed, in part, to the methods used in measuring particle sizes. Sizes >63 urn were evaluated by particle cross section, i.e. sieving, whereas sizes (63 urn were evaluated by fall diameter using the pipette withdrawal procedure. Both are standard methods for dispersed soils. However, for modeling the transport of non-dispersed sediments, measurements of fall velocity and density rather than sieving may produce more meaningful results.
We separated the >63 urn and (63 pm fractions of the dispersed and non-dispersed distributions and expressed the resulting distributions as logarithmic functions, i.e. F = a + b I?n D where F is percent finer or coarser than D which is particle diameter (Figures 2a and 2b). The median particle diameter, D5C, for the <63 urn non-dispersed fraction was over twice as large as the dispersed particles. Also, D50 for the >63 pm non-dispersed fraction was about four times as large as the dispersed particles. These relationships show the large effect of aggregation on the size of sediments transported from low slopes.
SUMMARY AND CONCLUSIONS
The particle size of sediment from plots 23 to 183 m long were measured during simulated rainfall. A statistical analysis could not detect any difference in the sediment size distributions due to time during the storm, plot length, or dry and wet runs. Differences were found only between non-dispersed and dispersed sediment and between sediment and dispersed surface soil from the plots.
Over 70% of the sediment clay was transported in aggregates. Enrichment ratios of the particle sizes ranged from 1.4 for the clay and fine silt to 0.1
8-15
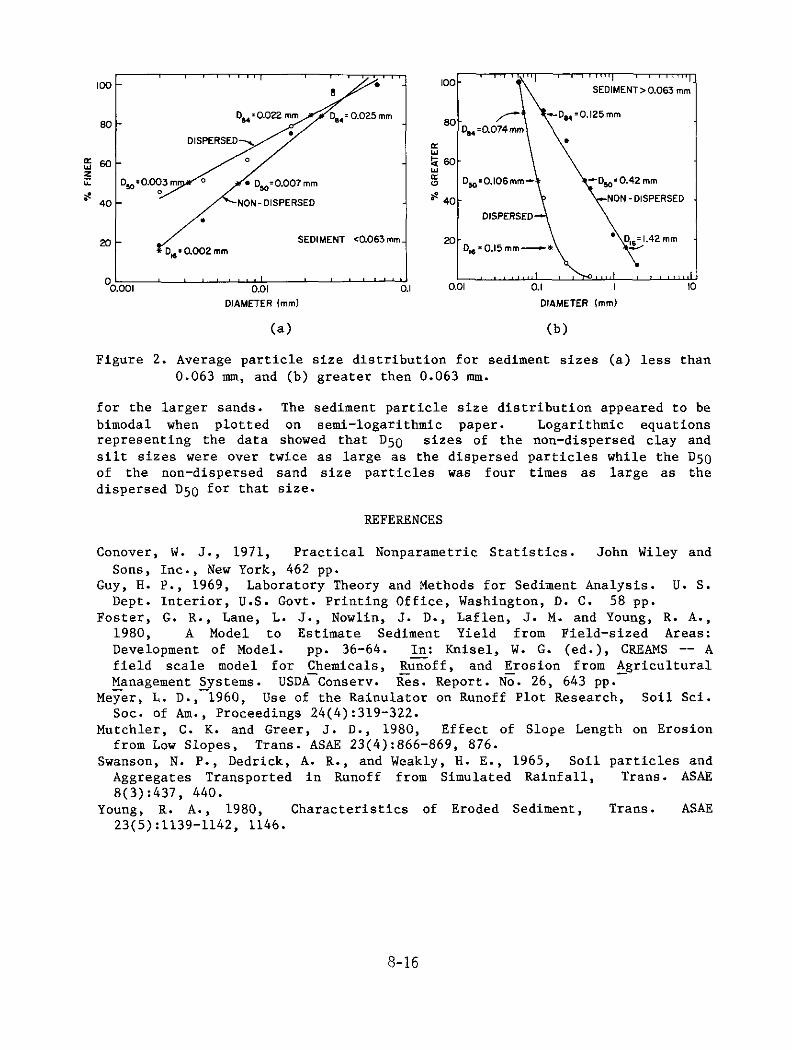
Figure 2. Average particle size distribution for sediment sizes (a) less than 0.063 mm, and (b) greater then 0.063 mm.
for the larger sands. The sediment particle size distribution appeared to be bimodal when plotted on semi-logarithmic paper. Logarithmic equations representing the data showed that D50 sizes of the non-dispersed clay and silt sizes were over twice as large as the dispersed particles while the D50 of the non-dispersed sand size particles was four times as large as the dispersed D50 for that size.
REFERENCES
Conover, W. J., 1971, Practical Nonparametric Statistics. John Wiley and sons, Inc., New York, 462 pp.
Guy, H. P., 1969, Laboratory Theory and Methods for Sediment Analysis. U. S. Dept. Interior, U.S. Govt. Printing Office, Washington, D. C. 58 PP.
Foster, G. R., Lane, L. J., Nowlin, J. D., Laflen, J. M. and Young, R. A., 1980, A Model to Estimate Sediment Yield from Field-sized Areas: Development of Model. pp. 36-64. In: Knisel, W. G. (ed.), CREAMS -- A field scale model for Chemicals, Runoff, and Erosion from Agricultural Management Systems. USDA-Conserv. I&. Report. No. 26, 643 pp.
Meyer, L. D.,-1960, Use of the Rainulator on Runoff Plot Research, Soil sci. Sot. of Am., Proceedings 24(4):319-322.
Mutchler, C. K. and Greer, 3. D., 1980, Effect of Slope Length on Erosion from Low Slopes, Trans. ASAE 23(4):866-869, 876.
Swanson, N. P., Dedrick, A. R., and Weakly, H. E., 1965, Soil particles and Aggregates Transported in Runoff from Simulated Rainfall, Trans. ASAE 8(3):437, 440.
Young, R. A., 1980, Characteristics of Eroded Sediment, Trans. ASAE 23(5):1139-1142, 1146.
8-16
CHEMICALS ASSOCIATED WITH LOWER MISSISSIPPI RIVER SEDIMENTS
By Charles R. Demas and Philip B. Curwick, Hydrologists, U.S. Geological Survey, Water Resources Division, Baton Rouge, La.
ABSTRACT
Suspended-sediment samples collected periodically from December 1982 to February 1985 at five sites on the lower Mississippi River from St. Francisville to Venice, Louisiana, were analyzed for selected minor elements and semi-volatile organic compounds. Chemical-quality and sedi- ment samples were collected monthly at six sites (including the above sites) during this same period. Minor-element concentrations from whole- and dissolved-water samples were statistically analyzed in relation to suspended-sediment particle-size distributions. Results from statistical analyses showed strong linear correlations (r>0.7) between total-recover- able and suspended (total-recoverable minus -dissolved) manganese, iron, and cobalt concentrations in water and the percent finer than 63 microns of suspended-sediment particle-size distribution. Strong linear correlations were not found for the greater than 63 or the less than 4 and less than 2 microns particle-size distributions of suspended sediment and total-recoverable or suspended minor elements. Many of the minor elements tested showed strong linear correlations with total-recoverable manganese and iron, indicating the importance of oxide coatings in the transport of minor elements in the lower Mississippi River. No significant correlations were observed between total organic carbon and minor elements.
Minor-element analyses of three suspended-sediment particle-size classes (>63 microns, ~63 to 30 microns, and <30 microns) confirmed the linear correlations beTween iron, manganese, ana suspended-sediment particle-size distributions indicated by the statistical analyses and, in addition, showed a positive relationship between decreasing suspended-sediment particle-size classes and several other minor elements not indicated by the statictical tests. Analyses of the three suspended-sediment particle-size classes showed increasing concentrations of total-recoverable aluminum, chromium, copper, iron, cadmium, manganese, nickel, and zinc with decreas- ing particle-size class. Highest concentrations of these elements were detected in the ~30 microns particle-size class and the lowest concentra- tions with the ?63 microns particle-size class. These analyses indicate that the smaller suspended-sediment particle-size classes play an important role in the transport of most minor elements by the lower Mississippi River. Therefore, impact of minor elements on wetlands receiving Missis- sippi River water can be minimized by restricting diversions of Mississippi River water during rising stages when suspended-sediment concentrations are highest and permitting diversions during falling stages when suspended- sediment concentrations are relatively lower.
No correlations were found between semi-volatile organic compounds and suspended-sediment particle-size classes. Analyses of the three particle- size classes showed no changes in concentrations. In all analyses but two, semi-volatile compounds occurred at concentrations below levels of detection, indicating little transport of these compounds associated with suspended sediment within the study area.
B-17
INTRODUCTION
Current literature has increasingly stressed the importance of sediment- chemical relationships in the transport of minor elements and organic compounds by riverine systems. Work by Gibbs (1977), Rinella and McKenzie (1982), deGroot and others (1982), and Horowitz (1984) have documented relationships between sediment particle size and chemical transport in South American and European rivers, storm runoff, and estuarine areas. The majority of previous work indicates that minor element and organic chemical concentrations increase with decreasing sediment particle size. Unfortunately, nothing similar to the above work has been attempted on the lower Mississippi River. This lack of knowledge, combined with increased interest in using the lower Mississippi River as a source of sediment and freshwater to help mitigate coastal erosion, points out the importance of such a study on the role of suspended sediment in the transport of minor elements and organic compounds. The potential impact of these sediment- associated chemicals on near-shore fishery and wildlife resources in areas of lower Mississippi River water diversion cannot be properly evaluated and managed until these mechanisms are better understood.
In an effort to better understand movement of minor elements and organic compounds through the lower Mississippi River, a study jointly funded by the U.S. Geological Survey and the Department of Transportation and Development, Office of Public Works, was undertaken in 1982 to determine the importance of suspended sediment in the transport of minor elements and organic compounds by the river.
STUDY AREA
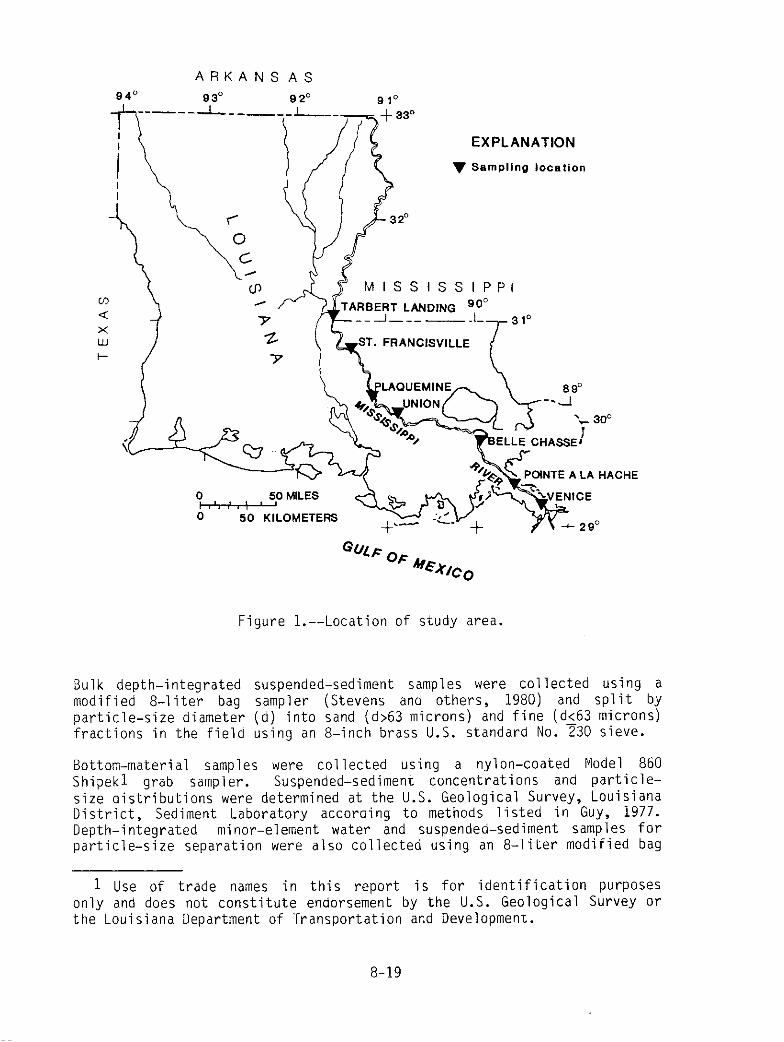
Chemical-quality and sediment samples were collected monthly from six sites along the lower Mississippi River, (fig. 1) from St. Francisville to Venice, La., encompassing a study reach of 265 river miles. The study area includes reaches with little or no industrialization (Tarbert Landing, Miss. to St. Francisville, La.), highly urbanized and industrialized areas (Baton Rouge to Belle Chasse, La.), and areas subjected to periodic salt- water intrusion (Pointe a la Hache to Venice, La.). Four to five of the above six sites also were sampled periodically for the determination of minor elements and organic compounds in different suspended- and bottom sediment size fractions.
METHODOLOGY
Two sets of data were collected for sediment and chemical analyses in this study. The first set of data was obtained from bulk samples that were collected each month. Selected chemical analyses, including minor elements and semi-volatile organics, were performed on bulk samples of the water column and bottom material. Sediment analyses, including concentration determinations and particle-size distributions, were also performed on bulk samples. The second set of data was obtained from samples of the water column and bed material that were physically separated into distinct sediment size fractions prior to chemical analyses. Chemical analyses were performed on sediment from each size fraction.
8-18
ARKANSAS
EXPLANATION
V Sampling location
MISSISSIPPI
. FRANCISVILLE
Figure l.--Location of study area.
Bulk depth-integrated suspended-sediment samples were collected using a modified 8-liter bag sampler (Stevens and others, 1980) and split by particle-size diameter (d) into sand (d>63 microns) and fine (dL63 microns) fractions in the field using an 8-inch brass U.S. standard No. 230 sieve.
Bottom-material samples were collected using a nylon-coated Model 860 Shipekl grab sampler. Suspended-sediment concentrations and particle- size distributions were determined at the U.S. Geological Survey, Louisiana District, Sediment Laboratory according to methods listed in Guy, 1977. Depth-integrated minor-element water and suspended-sediment samples for particle-size separation were also collected using an 8-liter modified bag
1 Use of trade names in this report is for identification purposes only and does not constitute endorsement by the U.S. Geological Survey or the Louisiana Department of Transportation and Development.
8-19
sampler. A wet-sieve technique was used to separate the suspended sediment into size fractions prior to chemical analysis. Suspended sediment for minor-element analyses was separated into three distinct size fractions, d>63 microns, d<63 microns to >30 microns, and dt30 microns, using acid- rinsed 8-inch PVC U.S. standard Nos. 230 and 500-NitexI sieves. The t30 microns size fractions consisted of a sediment-water mixture that was stored at 4°C until the sediment could be centrifuged using a large capacity DamonI centrifuge. All water and suspended-sediment samples for minor element analyses were treated, processed, and preserved in the field and subsequently analyzed at the U.S. Geological Survey, Central Laboratory, Atlanta, Ga., according to methods listed in Skougstad and others, 1979. All total-recoverable minor-element samples were digested using dilute hydrochloric acid.
Water samples for the determination of semi-volatile organics were collec- ted using an epoxy-coated P-63 sediment sampler. Bottom-material samples for semi-volatile organic analyses were collected using a nylon-lined Shipek grab sampler and separated into size fractions using an 8-inch brass U.S. standard No. 230 sieve and an 8-inch PVC U.S. standard No. 500 Nitex sieve. Bottom-material and water samples were analyzed for semi- volatile organic compounds at the U.S. Geological Survey, Central Laboratory using methods listed in Wershaw and others, 1983.
Semi-volatile acid and base-neutral extractable organic compounds were determined in whole- and filtered-water samples and bottom-material samples (including bulk and particle-size separated classes of bottom material on four separate occasions). Methylene chloride was the solvent used for extraction. Identification and quantification was accomplished using GC-MS (gas chromatography and mass spectrometry) techniques.
Duplicate bottom-material and water samples also were analyzed for methy- lene chloride extractable organic compounds using GC-FID (gas chromato- graphy and a flame ionization detector) methods. Individual compounds are not identified by this method, but their presence is indicated as a peak having a unique retention time on the chromatogram if they are present above a detection limit of about 0.1 microgram per liter. This screening method will indicate the presence of most of the priority pollutant organic compounds and thousands of other organic compounds.
Multiple correlation and factor analyses were performed on total-recover- able and suspended (total-recoverable minus dissolved) chemical data and bulk suspended-sediment data (concentration and size distribution) prior to actual chemical analysis of the three distinct suspended-sediment particle-size classes. These statistical comparisons between whole-water chemical concentrations and suspended-sediment particle-size distributions were used as a screening tool to select actual suspended-sediment particle- size classes to be analyzed. Minor elements and suspended-sediment particle-size distributions compared were: total-recoverable and suspended arsenic, barium, beryllium, cadmium, chromium, cobalt, copper, iron, lead, manganese, mercury, selenium, silver, and zinc with concentrations of sand, fines, and total sediment. The percent of suspended sediment finer by weight than 125, 63, 30, 16, 7, 4, and 2 microns also was determined in relation to minor elements. Minor elements and total organic carbon also were compared.
5-20
DISCUSSION
Minor Elements
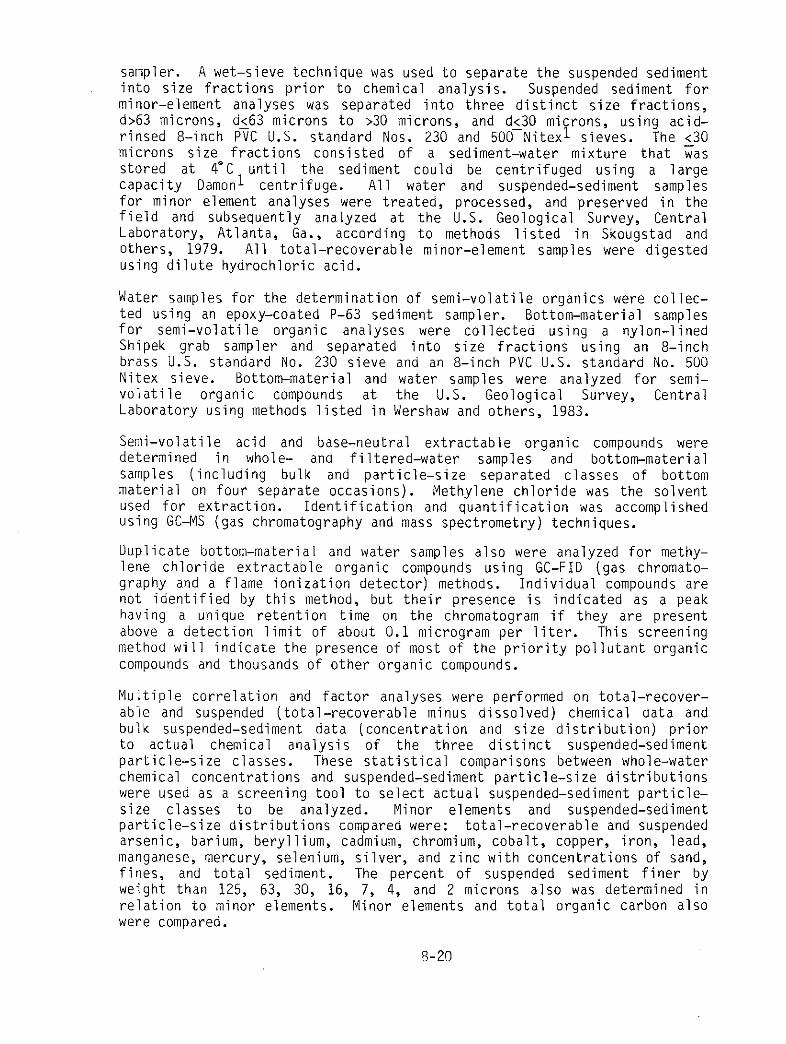
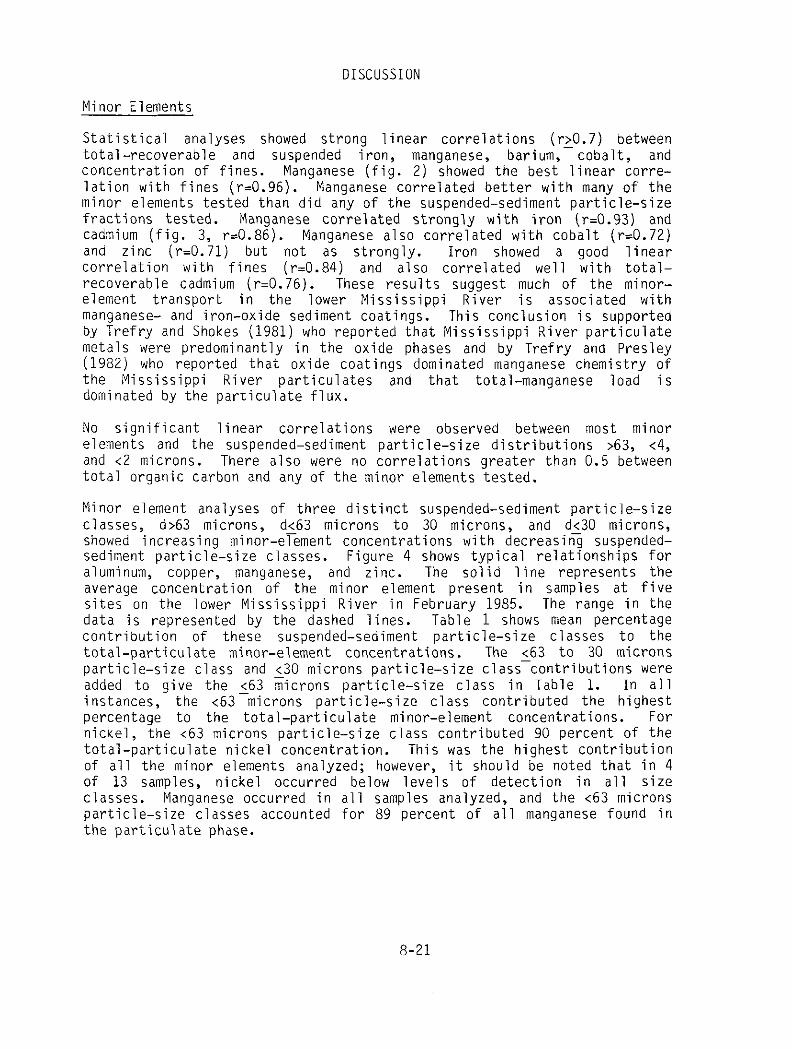
Statistical analyses showed strong linear correlations (rzO.7) between total-recoverable and suspended iron, manganese, barium, cobalt, and concentration of fines. Manganese (fig. 2) showed the best linear corre- lation with fines (r=0.96). Manganese correlated better with many of the minor elements tested than did any of the suspended-sediment particle-size fractions tested. Manganese correlated strongly with iron (rA.93) and cadmium (fig. 3, rz0.86). Manganese also correlated with cobalt (r=0.72) and zinc (i-=0.71) but not as strongly. Iron showed a good linear correlation with fines (i-=0.84) and also correlated well with total- recoverable cadmium (r=0.76). These results suggest much of the minor- element transport in the lower Mississippi River is associated with manganese- and iron-oxide sediment coatings. This conclusion is supported by Trefry and Shokes (1981) who reported that Mississippi River particulate metals were predominantly in the oxide phases and by Trefry and Presley (1982) who reported that oxide coatings dominated manganese chemistry of the Mississippi River particulates and that total-manganese load is dominated by the particulate flux.
No significant linear correlations were observed between most minor elements and the suspended-sediment particle-size distributions >63, t4, and <2 microns. There also were no correlations greater than 0.5 between total organic carbon and any of the minor elements tested.
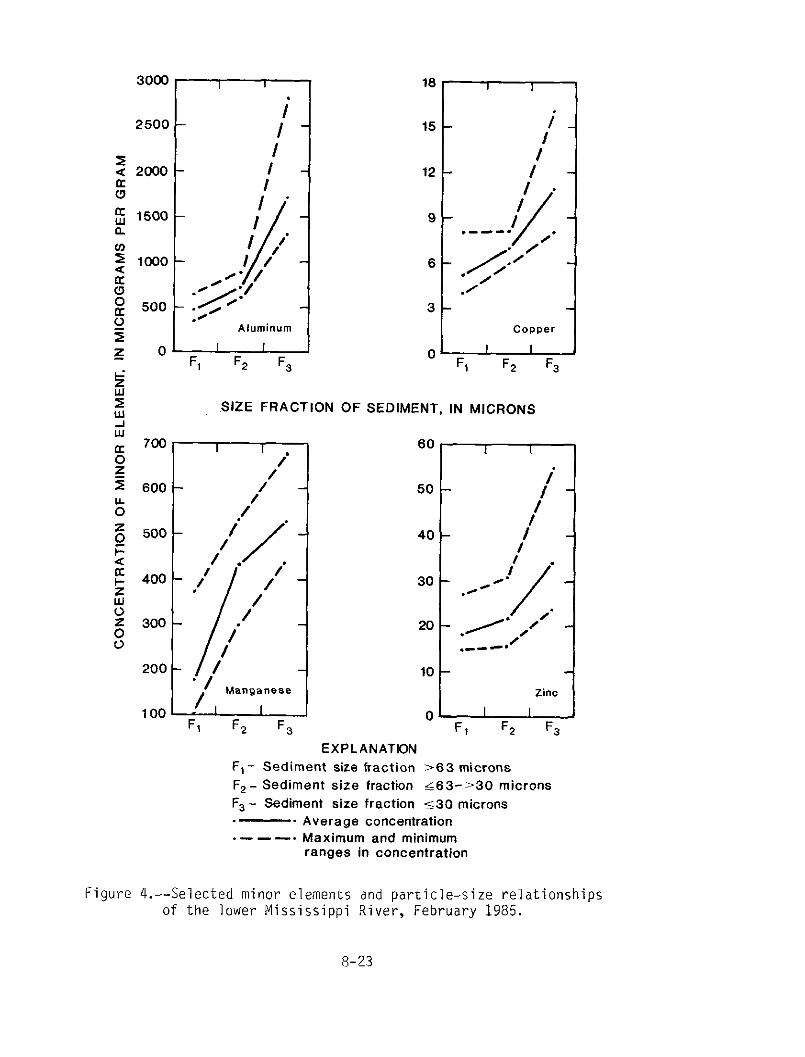
Minor element analyses of three distinct suspended-sediment particle-size classes, d>63 microns, dt63 microns to 30 microns, and d<30 microns, showed increasing minor-element concentrations with decreasing suspended- sediment particle-size classes. Figure 4 shows typical relationships for aluminum, cower, manganese, and zinc. The solid line represents the average concentration of the minor element present in samples at five sites on the lower Mississippi River in February 1985. The range in the data is represented by the dashed lines. Table 1 shows mean percentage contribution of these suspended-sediment particle-size classes to the total-particulate minor-element concentrations. The ~63 to 30 microns particle-size class and ~30 microns particle-size class-contributions were added to give the 563 microns particle-size class in Table 1. In all instances, the ~63 microns particle-size class contributed the highest percentage to the total-particulate minor-element concentrations. For nickel, the ~63 microns particle-size class contributed 90 percent of the total-particulate nickel concentration. This was the highest contribution of all the minor elements analyzed; however, it should be noted that in 4 of 13 samples, nickel occurred below levels of detection in all size classes. Manganese occurred in all samples analyzed, and the ~63 microns particle-size classes accounted for 89 percent of all manganese found in the particulate phase.
8-21
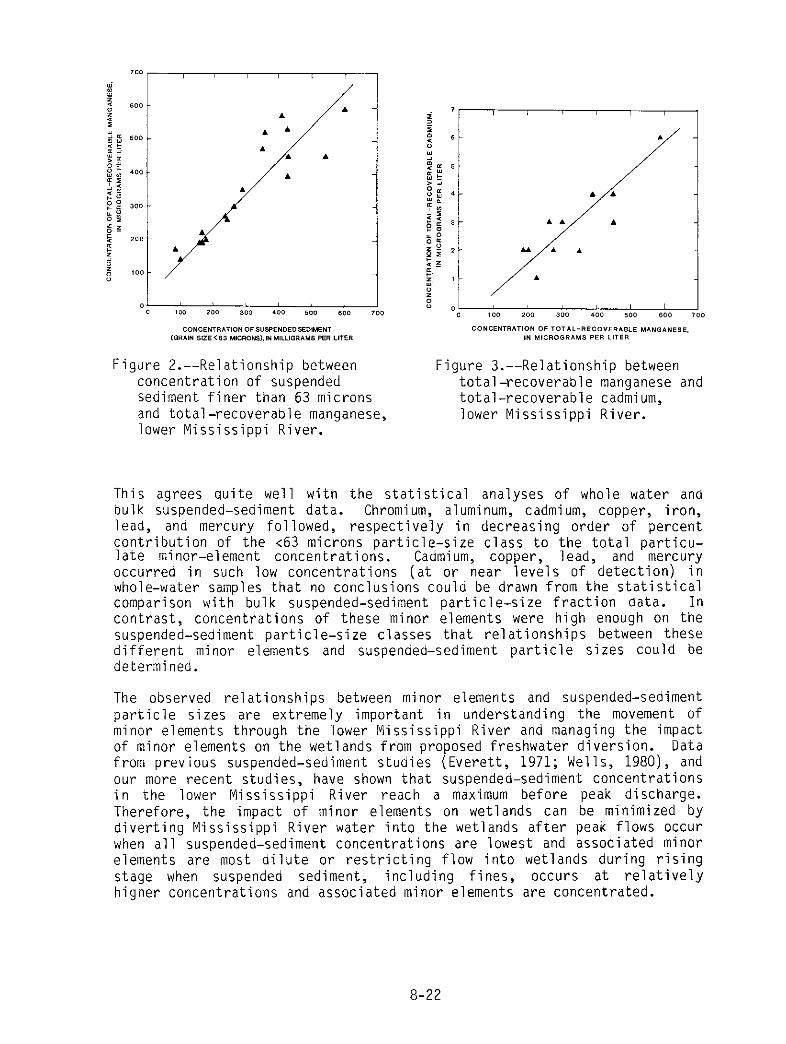
Figure P.--Relationship between concentration of suspended sediment finer than 63 microns and total-recoverable manganese, lower Mississippi River.
Figure 3.--Relationship between total-recoverable manganese and total-recoverable cadmium, lower Mississippi River.
This agrees quite well with the statistical analyses of whole water and bulk suspended-sediment data. Chromium, aluminum, cadmium, copper, iron, lead, and mercury followed, respectively in decreasing order of percent contribution of the ~63 microns particle-size class to the total particu- late minor-element concentrations. Cadmium, copper, lead, and mercury occurred in such low concentrations (at or near levels of detection) in whole-water samples that no conclusions could be drawn from the statistical comparison with bulk suspended-sediment particle-size fraction data. In contrast, concentrations of these minor elements were high enough on the suspended-sediment particle-size classes that relationships between these different minor elements and suspended-sediment particle sizes could be determined.
The observed relationships between minor elements and suspended-sediment particle sizes are extremely important in understanding the movement of minor elements through the lower Mississippi River and managing the impact of minor elements on the wetlands from proposed freshwater diversion. Data from previous suspended-sediment studies (Everett, 1971; Wells, 1980), and our more recent studies, have shown that suspended-sediment concentrations in the lower Mississippi River reach a maximum before peak discharge. Therefore, the impact of minor elements on wetlands can be minimized by diverting Mississippi River water into the wetlands after peak flows occur when all suspended-sediment concentrations are lowest and associated minor elements are most dilute or restricting flow into wetlands during rising stage when suspended sediment, including fines, occurs at relatively higher concentrations and associated minor elements are concentrated.
8-22
./ Aluminum
I I F, Fz F,
16 I I
15 - i-
//
12 - / *
s- // /- .-de. .
6 - g:” -
3-
COPPer
0 I I , Fl F2 F,
SIZE FRACTION OF SEDIMENT, IN MICRONS
700 I I i
600 - /I -
./I 500 -
/I. .
/ / --
400 -
300 -
200 -
100 Fl F2 F3
60 I I
50 -
40 -
I .
10 -
Zinc
0 I I Ft F2 F3
EXPLANAT!ON F, - Sediment size fraction >63 microns F, - Sediment size fraction &63-~30 microns Fs - Sediment size fraction 530 microns
. Average concentration .---. Maximum and minimum
ranges in concentration
Figure 4.--Selected minor elements and particle-size relationships of the lower Mississippi River, February 1985.
8-23
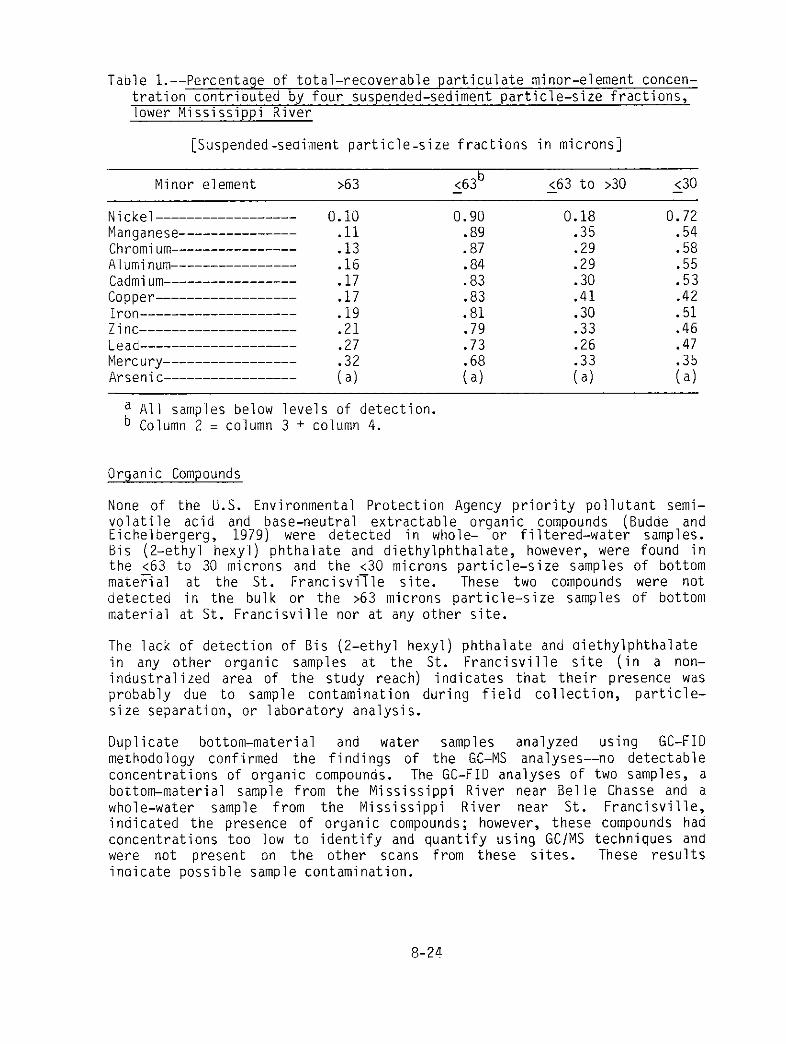
Table l.--Percentage of total-recoverable particulate minor-element concen- tration contributed by four suspended-sediment particle-size fractions, lower Mississippi River
[Suspended-sediment particle-size fractions in microns]
Minor element >63 <63b - 563 to >30 530
Nickel------------------
Manganese---------------
Chromium----------------
Aluminum----------------
Cadmium-----------------
Copper------------------
Iron--------------------
Zjnc--------------------
Lea&-w-v---------------
Mercury-----------------
Arsenic-----------------
0.10 .11 .13 .16 .17 .17 .19 .21 .27 .32 (a)
0.90 0.18 .89 .35 .87 .29 .84 .29 .83 .30 .83 .41 .81 .30 .79 .33 .73 .26 .68 .33 (4 (4
0.72 .54 .58 .55 .53 .42 .51 .46 .47 .35 (a)
a All samples below levels of detection. b Column z = column 3 + column 4.
Organic Compounds
None of the U.S. Environmental Protection Agency priority pollutant semi- volatile acid and base-neutral extractable organic compounds (Budde and Eichelbergerg, 1979) were detected in whole- or filtered-water samples. Bis (2-ethyl hexyl) phthalate and diethylphthalate, however, were found in the ~63 to 30 microns and the t30 microns particle-size samples of bottom matesal at the St. FrancisviTle site. These two compounds were not detected in the bulk or the >63 microns particle-size samples of bottom material at St. Francisville nor at any other site.
The lack of detection of Bis (2-ethyl hexyl) phthalate and diethylphthalate in any other organic samples at the St. Francisville site (in a non- industralized area of the study reach) indicates that their presence was probably due to sample contamination during field collection, particle- size separation, or laboratory analysis.
Duplicate bottom-material and water samples analyzed using GC-FID methodology confirmed the findings of the GC-MS analyses--no detectable concentrations of organic compounds. The GC-FID analyses of two samples, a bottom-material sample from the Mississippi River near Belle Chasse and a whole-water sample from the Mississippi River near St. Francisville, indicated the presence of organic compounds; however, these compounds had concentrations too low to identify and quantify using GC/MS techniques and were not present on the other scans from these sites. These results indicate possible sample contamination.
8-24
The lack of occurrence of organic compounds in both water and bottom- material samples makes it impossible to say what relation the different sediment size fractions play in the transport of organic compounds in the lower Mississippi River.
SUMMARY AND CONCLUSIONS
Chemical-quality and sediment data collected from December 1982 to February 1985 at six sites on the lower Mississippi River were analyzed statisti- cally. Results showed strong linear correlations (r-20.7) between concentra- tion of fines and total-recoverable and suspended manganese, iron, and cobalt in whole water samples. Strong linear correlations (rLO.7) were not found for sand or the <4 and t2 microns size distributions. Analyses of three distinct suspended-sediment particle-size classes confirmed these observations for manganese, iron, and cobalt and also showed increasing minor-element concentration with decreasing suspended-sediment particle size for aluminum, chromium, copper, cadmium, nickel, and zinc. Data indicate that manganese and iron oxide coatings may be a significant factor in the transport of minor elements and that fine sediments play a significant role in the transport of minor elements by the lower Mississippi River. There- fore, impact of minor elements on wetlands receiving Mississippi River water can be minimized by restricting diversions of Mississippi River water during rising stages when suspended-sediment concentrations are highest and permit- ting diversions during falling stages when suspended-sediment concentrations are relatively lower.
No correlations were found between semi-volatile organic compounds and suspended-sediment particle-size classes, indicating little transport of these compounds associated with suspended sediment within the study area.
REFERENCES CITED
Budde, W. L. and Eichelberger, J. W., 1979, Organics in Water, U.S. Envi- ronmental Protection Agency, EPA-600/J-79-117, 4 p.
deGroot, A., Zshuppe, K., and Salomons, W., 1982, Standardization of Methods of Analysis for Heavy Metals in Sediments, Hydrobiologia, v. 92, p. 689-695.
Everett, D. E., 1971, Hydrologic and Quality Characteristics of the Lower Mississippi River, Louisiana Department of Public Works Technical Report 5, 48 p.
Gibbs, R., 1977, Transport Phases of Transition Metals in the Amazon and Yukon Rivers, Geological Society of America Bulletin, v. 88, p. 829-843.
Guy, H. P., 1977, Laboratory Theory and Methods for Sediment Analysis, U.S. Geological Survey Techniques of Water-Resources Investigations, book 5, Laboratory Analysis, chap. Cl, 58 p.
Horowitz, A. J., 1984, A Primer on Trace Metal-Sediment Chemistry, U.S. Geological Survey Open-file Report 84-709, 82 p.
R-25
Rinella, 3. F. and McKenzie, S. W., 1982, Method for Relating Suspended- Chemical Concentrations to Suspended-Sediment Particle-Size Classes in Storm-Water Runoff, U.S. Geological Survey Water-Resources Investigations Report 82-39, 41 p.
Skougstad, M. W., Fishman, M. J., Friedman, L. C., Erdmann, D. E., and Duncan, S. S., eds., 1979, Methods for Determination of Inorganic Substances in Water and Fluvial Sediments, U.S. Geological Survey Techniques of Water-Resources Investigations, book 5, Laboratory Analysis, chap. Al, 626 p.
Stevens, H. H., Jr., Lutz, G. A., and Hubbell, D. W., 1980, Collapsible- Bag Suspended-Sediment Sampler, Journal of Hydraulic Engineering, ASCE, v. 106, no. 4, p. 611-616.
Trefry, J. H. and Presley, B. J., 1982, Manganese Fluxes from Mississippi Delta Sediments, Geochimica et Cosmochimicta Rcta, v. 46, no. 10, p. 1715-1726.
Trefry, J. H. and Shokes, R. R., 1981, History of Heavy-Metal Inputs to Mississippi Delta Sediments, in Geyer, R. A., ed., Marine Environmental Pollution 2, New-York, N.Y., Elseview Scientific Publishing Co., chap. 4, p. 193-208.
Wells, F. C., 1980, Hydrology and Water Quality of the Lower Mississippi River, Louisiana Department of Transportation and Development, Office of Public Works Water Resources Technical Report 21, 83 p.
Wershaw, R. L., Fishman, M. J., Grabbe, R. R., and Lowe, L. E., eds., 1983, Methods for the Determination of Organic Substances in Water and Fluvial Sediments, U.S. Geological Survey Techniques of Water-Resources Investigations, book 5, Laboratory Analysis, chap. A3, 173 p.
8-26
CCA AND PCP IN CONTAMINATED FOREST STREAM SEDIMENTS
D.G. Neary, Soil Scientist, USDA Forest Service, Southeastern Forest Exper- iment Station, University of Florida, Gainesville, FL; R.A. LaFayette, Hy- drologist, USDA Forest Service Region 3, Albuquerque, NM; M.A. Callaham, Chairman, Biology Department, North Georgia College, Dahlonega, GA; and P.B. Bush, Residue Chemist, Extension Poultry Science Department, Univer- sity of Georgia, Athens, GA.
ABSTRACT
Storm runoff from a wood-preservative plant transported copper chromium arsenic (CCA) and pentachlorophenol (PCP) into the head waters of a south- ern Appalachian stream system.' This stream flows into a major recreation area on the Chattahoochee National Forest of North Georgia. Bedload, pond bottom, and deltaic sediments were collected quarterly for 1 year to deter- mine seasonal levels, vertical, and horizontal distributions, and important transport processes. The stream system was sampled along a 5 km longitud- inal gradient which included reaches characterized by pools and riffles, sandy bottoms, beaver ponds, artificial ponds, and lake deltas. PCP levels in sediment were low (l-3 mg kg-l) in coarse bedload materials and high (10 -20 mg kg -1) in fine-textured pond bottom muds. CCA concentrations were similarly lower in stream bedload (< 50 mg kg -I) and higher (> 50 mg kg-l) in pond sediments. Both PCP and CCA were transient in normal stream reaches and accumulated in pond or deltaic sediments.
INTRODUCTION
Copper Chromium Arsenate (CCA) and Pentachlorophenol (PCP) are the two most connaon wood preservatives in the forest products industry. PCP and its sodium salt are broad spectrum biocides but are used primarily for the preservation of wood and fiber products. Recent United States use of PCP in wood product treatment approaches 20,000 metric tons with 61% used in the South (Cirelli, 1978). the main CCA formulation consists of 47.5% chromic acid (CrOs), 18.5% copper oxide (CuO), and 34.0% arsenic pentoxide (AszOs). Of the three component chemicals, AszOs and CrOs are very soluble in water and CuO is insoluble. Since 1970, CCA use has increased from '21% in 1970 to nearly equal that of PCP in 1978 (Maloney and Pagliai, 1978).
I This publication reports research involving pesticides. It does not con- tain recommendations for their use, nor does it imply that the uses discus- sed here have been registered. All uses of pesticides must be registered by appropriate state/federal agencies before they can be recommended.
CAUTION: Pesticides can be injurious to humans, domestic animals, desirable plants, and fish or wildlife--if they are not handled or applied properly. Use all pesticides selectively and carefully. Follow recommended practices for the disposal of surplus pesticides and pesticide containers.
3-27
The properties of PCP that make it particularly useful as a synthetic wood preservative include its low water solubility (140 mg mm3), high ther- mal stability, 1967).
and rather inert chemical properties (Bevenue and Beckman, PCP is subject to volatilization loss and photodegrades like other
chlorinated phenolic compounds (Munakata and Kuwahara, 1969). In the aqua- tic environment, PCP may be in solution, sorbed on to suspended solids or bottom sediments, or absorbed by aquatic organisms. The solubility and de- gree of adsorption of PCP on clay particles are determined by pH. Movement in aquatic ecosystems depends on current patterns, mixing, and sediment movement. Breakdown in aquatic ecosystems occurs by photodegradation, mi- crobial degradation or volatilization.
Soil provides an important pool for synthetic organic chemicals in ter- restrial ecosystems. In aquatic ecosystems, this pool is primarily in the form of anaerobic bottom sediments which are deposited in ponds and lakes but may be transported downstream during storm events. While PCP degrada- tion through volatilization in anaerobic soils is very low, 90% degradation generally occurs through other pathways in 3-4 weeks (Watanabe, 1973).
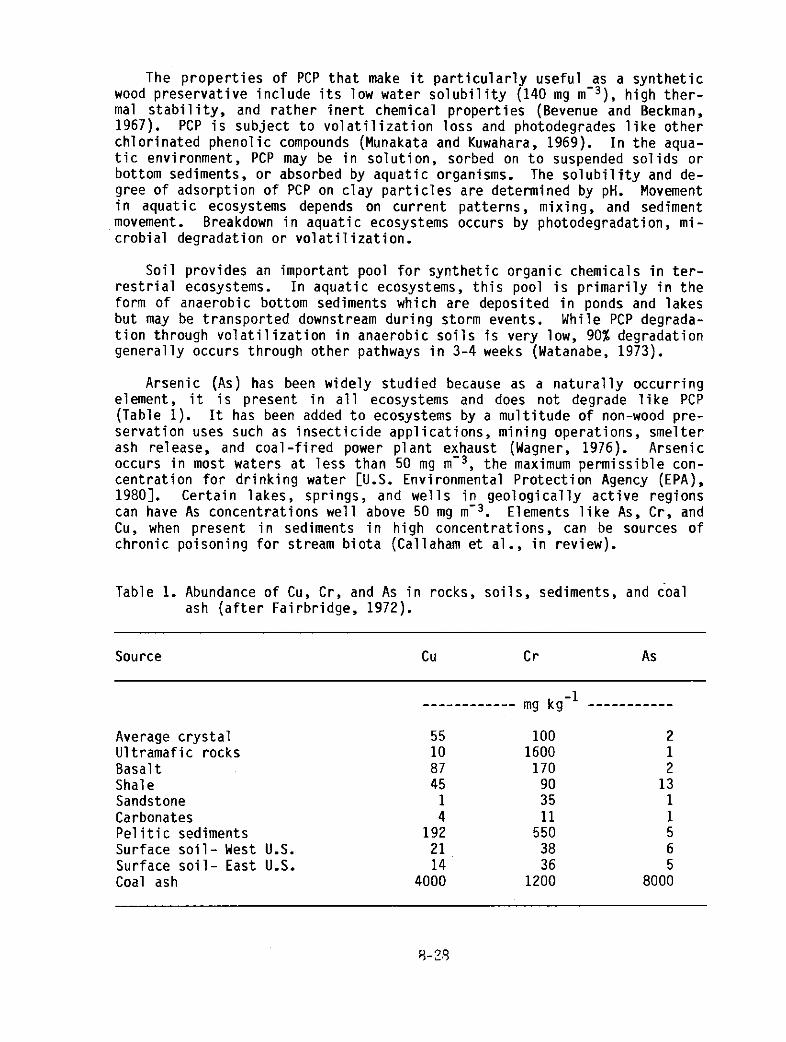
Arsenic (As) has been widely studied because as a naturally occurring element, it is present in all ecosystems and does not degrade like PCP (Table 1). It has been added to ecosystems by a multitude of non-wood pre- servation uses such as insecticide applications, mining operations, smelter ash release, and coal-fired power plant exhaust (Wagner, 1976). Arsenic occurs in most waters at less than 50 mg mw3, the maximum permissible con- ca;;';ation for drinking water [U.S. Environmental Protection Agency (EPA),
. Certain lakes, springs, and wells in geologically active regions can have As concentrations well above 50 mg mw3. Elements like As, Cr, and Cu, when present in sediments in high concentrations, can be sources of chronic poisoning for stream biota (Callaham et al., in review).
Table 1. Abundance of Cu, Cr, and As in rocks, soils, sediments, and coal ash (after Fairbridge, 1972).
Source cu Cr As
Average crystal Ultramafic rocks Basalt Shale Sandstone Carbonates Pelitic sediments Surface soil- West U.S. Surface soil- East U.S. Coal ash
____________ mg kg -1 -----------
55 10 a7 45
1 4
192 21 14
4000
100 2
1600 170 : 90 13 35 1 11
550 38
: 6
36 5 1200 8000
In water, As is quickly removed from solution by reaction or adsorption to sediments. Wilder (1972) noted in a study of As contamination of a creek by mill effluent that As moved mainly in the dissolved form during low flow and adsorbed to sediment during high flow. As levels actually concentrated in sediment downstream. Bedload sediments contained 35 mg kg-' As, and suspended sediments contained 500 mg kg-'.
Since copper (Cu) is ubiquitous in rocks and minerals of the earth's crust, it is found in all aquatic ecosystems (Table 1). Background levels in natural surface waters are usually less than 20 mg mm3. Higher concen- trations are commonly associated with pollution from pipe corrosion, indus- trial and sewage effluents, and aquatic algicides. In water, Cu occurs as soluble chlorides, nitrates, sulfates, precipitated carbonates, oxides, or sulfides which are readily adsorbed by sediments (Stiff, 1971).
Chromium (Cr) is also ubiquitous and occurs in tri or hexavalent states (Table 1). Hexavalent chromium is the more soluble form. Trivalent Cr tends to be found more in sediments. 10 mg me3
Average background levels are around (Kopp, 1966).
This paper reports on a study established in 1982 to obtain information on the movement, fate, and ecological impact of CCA and PCP after their ac- cidental introduction into a forest stream in the Southern Appalachian foothills. The objective of this paper is to examine the distribution of these substances in sediment and the stream transport processes involved.
Site METHODS
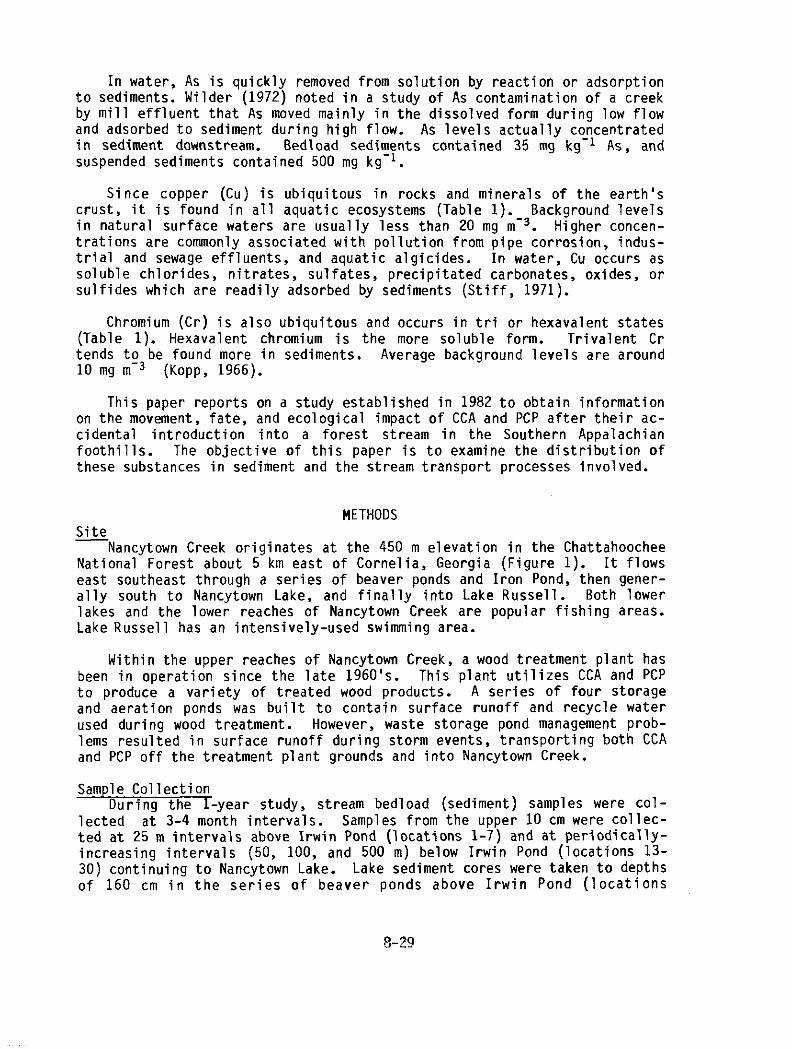
Nancytown Creek originates at the 450 m elevation in the Chattahoochee National Forest about 5 km east of Cornelia, Georgia (Figure 1). It flows east southeast through a series of beaver ponds and Iron Pond, then gener- ally south to Nancytown Lake, and finally into Lake Russell. Both lower lakes and the lower reaches of Nancytown Creek are popular fishing areas. Lake Russell has an intensively-used swimming area.
Within the upper reaches of Nancytown Creek, a wood treatment plant has been in operation since the late 1960’s. This plant utilizes CCA and PCP to produce a variety of treated wood products. A series of four storage and aeration ponds was built to contain surface runoff and recycle water used during wood treatment. However, waste storage pond management prob- lems resulted in surface runoff during storm events, transporting both CCA and PCP off the treatment plant grounds and into Nancytown Creek.
Sample Collection Durina the 1-vear studv. stream bedload (sediment) samples were col-
lected ai 3-4 month intervals. Samples from the upper 10 cm were collec- ted at 25 m intervals above Irwin Pond (locations l-7) and at periodically- increasing intervals (50, 100, and 500 m) below Irwin Pond (locations I3- 30) continuing to Nancytown Lake. Lake sediment cores were taken to depths of 160 cm in the series of beaver ponds above Irwin Pond (locations
8-29
ll-12), and on the Nancytown Lake delta (locations 31-32). Control sedi- ment samples (locations 33-37) came from the control stream with streamflow sampling station 811 (Figure 1). In the water and sediment samples, con- centrations of PCP were determined by gas chromatography (Thompson, 1977) and Cu, Cr, and As were quantified by standard atomic absorption spectro- photometry (American Public Health Association (APHA), 1975).
Figure 1. Upper Nancytown Creek drainage, Chattahoochee National Forest, Habersham County, Georgia.
8-33
RESULTS AND DISCUSSION
Bedload PCP Inputs of PCP and CCA into the Nancytown Creek stream system have been
episodic in terms of timing and concentrations. Pulses of PCP and CCA were affected by factors such as timing between storms, amount of runoff from the treatment plant, and mix of PCP and CCA being used to preserve wood. Concentrations in sediment during the study measured in runoff detention ponds located just below the wood treatment plant were 520, 120, 96, and 112 mg kg-' for PCP, Cu. Cr, and As, respectively. Normal background lev- els for streams in this region, based on samples from an uncontaminated control stream (locations 33-37), were < 0.02 (detection limit), 4.7, 6.4, and < 0.1 mg kg-' for PCP, Cu, Cr, and As, respectively.
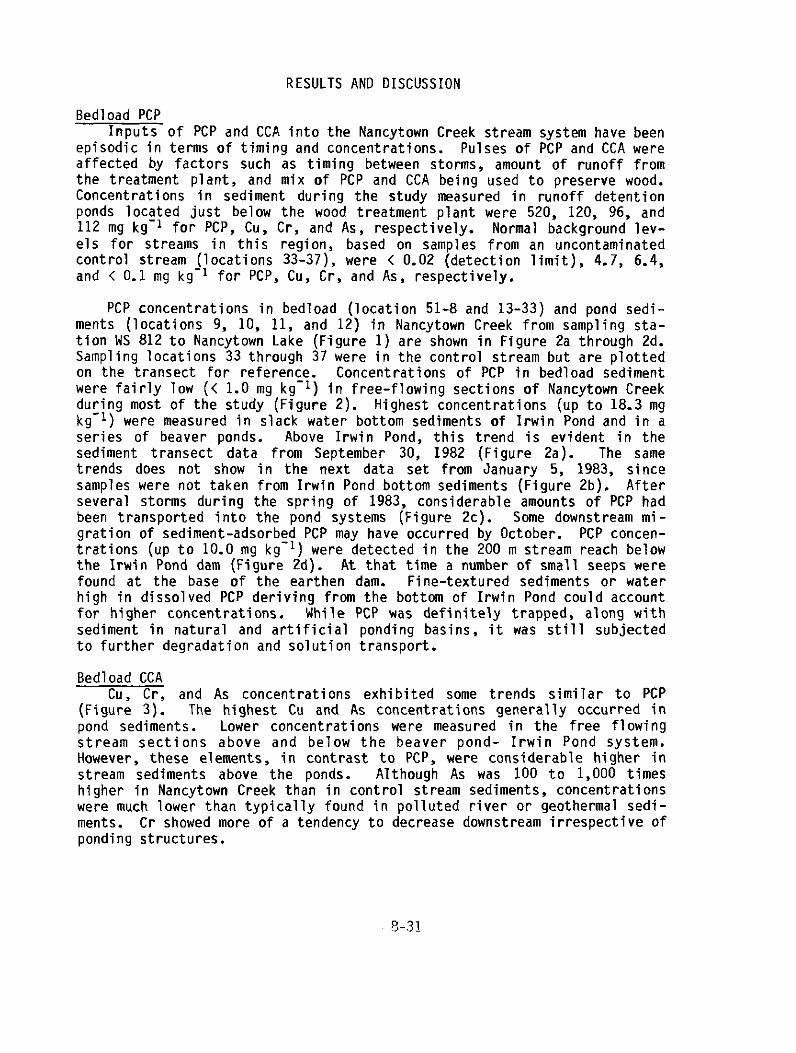
PCP concentrations in bedload (location 51-8 and 13-33) and pond sedi- ments (locations 9, 10, 11, and 12) in Nancytown Creek from sampling sta- tion WS 812 to Nancytown Lake (Figure 1) are shown in Figure 2a through 2d. Sampling locations 33 through 37 were in the control stream but are plotted on the transect for reference. Concentrations of PCP in bedload sediment were fairly low (< 1.0 mg kg-l) in free-flowing sections of Nancytown Creek during most of the study (Figure 2). Highest concentrations (up to 18.3 mg kg-') were measured in slack water bottom sediments of Irwin Pond and in a series of beaver ponds. Above Irwin Pond, this trend is evident in the sediment transect data from September 30, 1982 (Figure 2a). The same trends does not show in the next data set from January 5, 1983, since samples were not taken from Irwin Pond bottom sediments (Figure 2b). After several storms during the spring of 1983, considerable amounts of PCP had been transported into the pond systems (Figure 2~). Some downstream mi- gration of sediment-adsorbed PCP may have occurred by October. PCP concen- trations (up to 10.0 mg kg-') were detected in the 200 m stream reach below the Irwin Pond dam (Figure 2d). At that time a number of small seeps were found at the base of the earthen dam. Fine-textured sediments or water high in dissolved PCP deriving from the bottom of Irwin Pond could account for higher concentrations. While PCP was definitely trapped, along with sediment in natural and artificial ponding basins, it was still subjected to further degradation and solution transport.
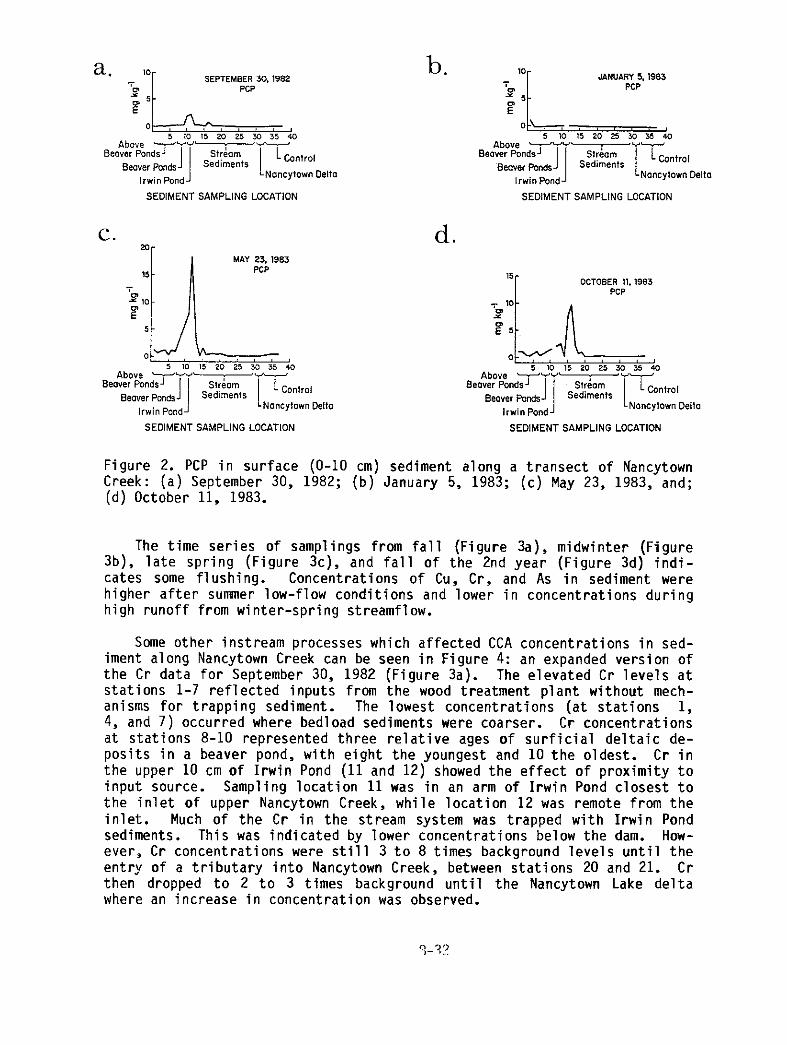
Bedload CCA Cu, Cr, and As concentrations exhibited some trends similar to PCP
(Figure 3). The highest Cu and As concentrations generally occurred in pond sediments. Lower concentrations were measured in the free flowing stream sections above and below the beaver pond- Irwin Pond system. However, these elements, in contrast to PCP, were considerable higher in stream sediments above the ponds. Although As was 100 to 1,000 times higher in Nancytown Creek than in control stream sediments, concentrations were much lower than typically found in polluted river or geothermal sedi- ments. Cr showed more of a tendency to decrease downstream irrespective of ponding structures.
8-31
d.
Figure 2. PCP in surface (O-10 cm) sediment along a transect of Nancytown Creek: (a) September 30, 1982; (b) January 5, 1983; (c) May 23, 1983, and; (d) October 11, 1983.
3b), The time series of samplings from fall (Figure 3a), midwinter (Figure
late spring (Figure 3c), and fall of the 2nd year (Figure 3d) indi- cates some flushing. Concentrations of Cu, Cr, and As in sediment were higher after Sumner low-flow conditions and lower in concentrations during high runoff from winter-spring streamflow.
Some other instream processes which affected CCA concentrations in sed- iment along Nancytown Creek can be seen in Figure 4: an expanded version of the Cr data for September 30, 1982 (Figure 3a). The elevated Cr levels at stations l-7 reflected inputs from the wood treatment plant without mech- anisms for trapping sediment. The lowest concentrations (at stations 1, 4, and 7) occurred where bedload sediments were coarser. Cr concentrations at stations 8-10 represented three relative ages of surficial deltaic de- posits in a beaver pond, with eight the youngest and 10 the oldest. Cr in the upper 10 cm of Irwin Pond (11 and 12) showed the effect of proximity to input source. Sampling location 11 was in an arm of Irwin Pond closest to the inlet of upper Nancytown Creek, while location 12 was remote from the inlet. Much of the Cr in the stream system was trapped with Irwin Pond sediments. This was indicated by lower concentrations below the dam. How- ever, Cr concentrations were still 3 to 8 times background levels until the entry of a tributary into Nancytown Creek, between stations 20 and 21. Cr then dropped to 2 to 3 times background until the Nancytown Lake delta where an increase in concentration was observed.
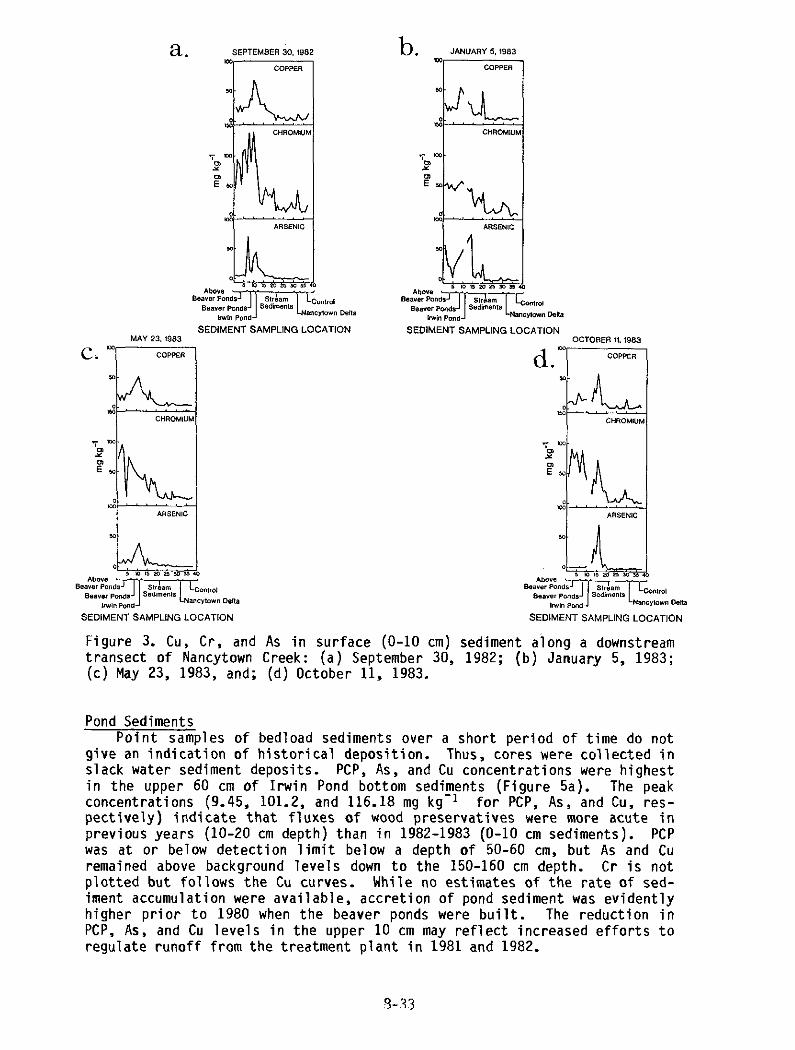
Figure 3. Cu, Cr, and As in surface (O-10 cm) sediment along a downstream transect of Nancytown Creek: (a) September 30, 1982; (b) January 5, 1983; (c) May 23, 1983, and; (d) October 11, 1983,
Pond Sediments Point samples of bedload sediments over a short period of time do not
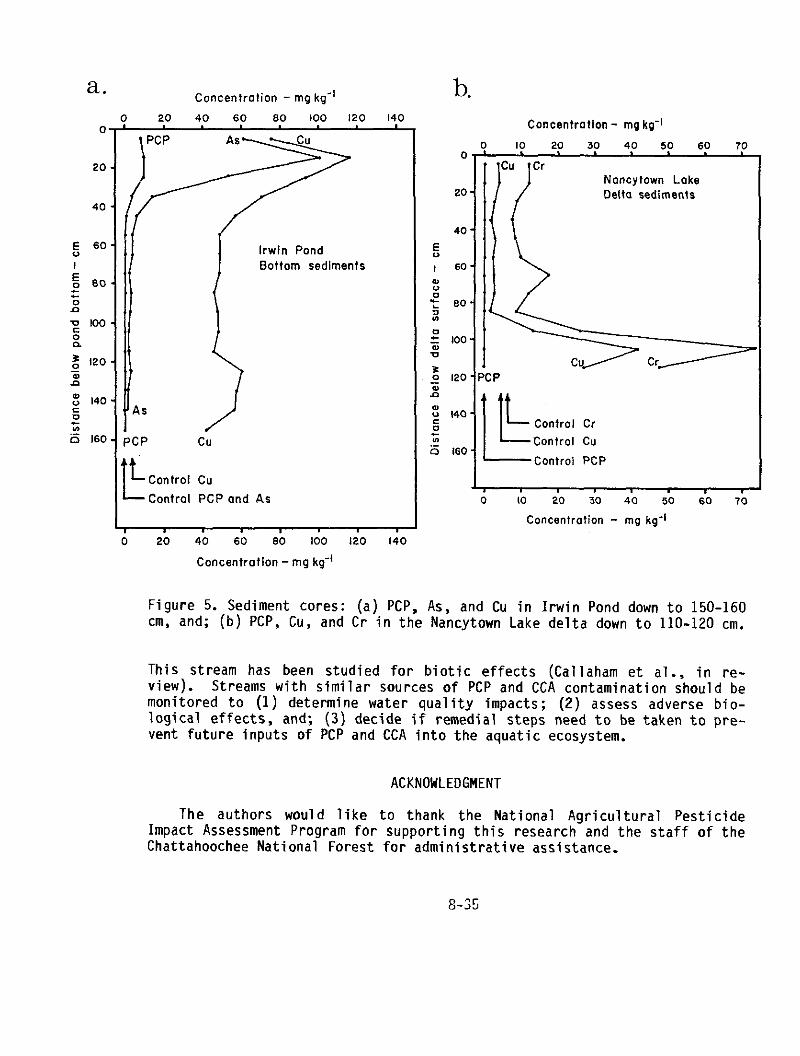
give an indication of historical deposition. Thus, cores were collected in slack water sediment deposits. PCP, As, and Cu concentrations were highest in the upper 60 cm of Irwin Pond bottom sediments (Figure 5a). concentrations (9.45, 101.2, and 116.18 mg kg-'
The peak for PCP, As, and Cu, res-
pectively) indicate that fluxes of wood preservatives were more acute in previous years (lo-20 cm depth) than in 1982-1983 (O-10 cm sediments). PCP was at or below detection limit below a depth of 50-60 cm, but As and Cu remained above background levels down to the 150-160 cm depth. Cr is not plotted but follows the Cu curves. While no estimates of the rate of sed- iment accumulation were available, accretion of pond sediment was evidently higher prior to 1980 when the beaver ponds were built. The reduction in PCP, As, and Cu levels in the upper 10 cm may reflect increased efforts to regulate runoff from the treatment plant in 1981 and 1982.
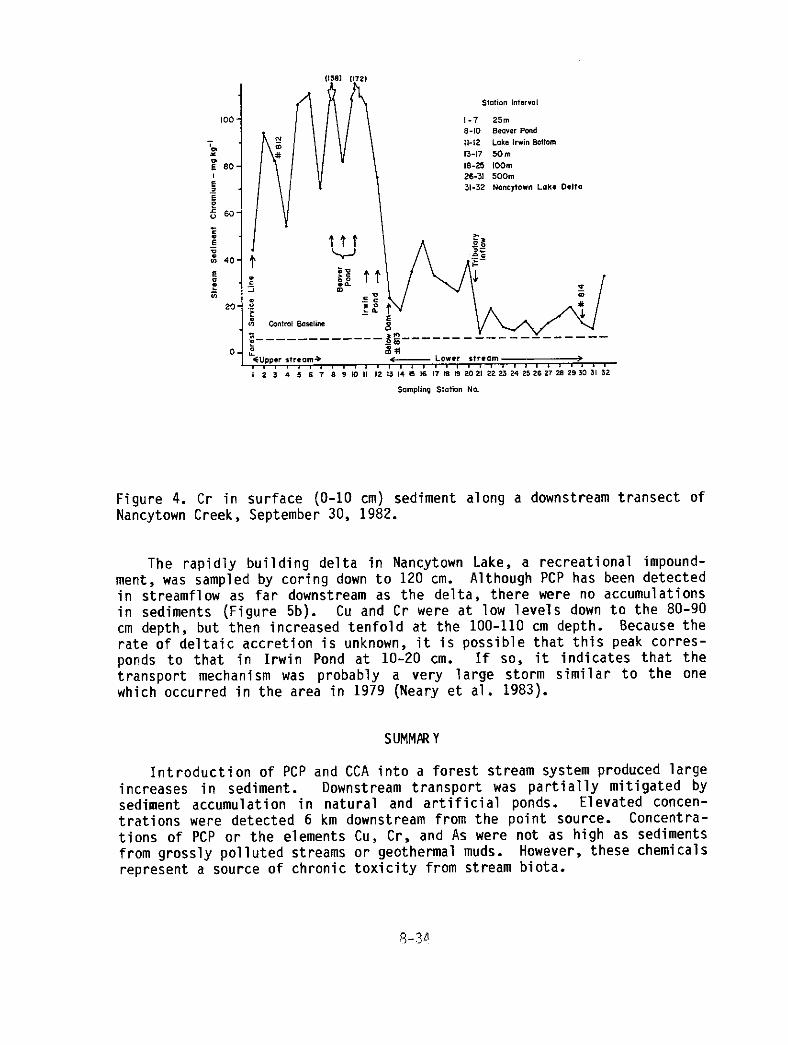
Figure 4. Cr in surface (O-10 cm) sediment along a downstream transect of Nancytown Creek, September 30, 1982.
The rapidly building delta in Nancytown Lake, a recreational impound- ment, was sampled by coring down to 120 cm. Although PCP has been detected in streamflow as far downstream as the delta, there were no accumulations in sediments (Figure 5b). Cu and Cr were at low levels down to the 80-90 cm depth, but then increased tenfold at the 100-110 cm depth. Because the rate of deltaic accretion is unknown, it is possible that this peak corres- ponds to that in Irwin Pond at lo-20 cm. If so, it indicates that the transport mechanism was probably a very large storm similar to the one which occurred in the area in 1979 (Neary et al. 1983).
SUMMARY
Introduction of PCP and CCA into a forest stream system produced large increases in sediment. Downstream transport was partially mitigated by sediment accumulation in natural and artificial ponds. Elevated concen- trations were detected 6 km downstream from the point source. Concentra- tions of PCP or the elements Cu, Cr, and As were not as high as sediments from grossly polluted streams or geothermal muds. However, these chemicals represent a source of chronic toxicity from stream biota.
‘7 7 I Irwin Pond
Bottom sedimenfs
L t Control cu Control PCP and As
3 20 40 60 80 100 120 140
Concentration - mg kg-’
b. Concentration - mgkg-'
Noocytown Lake Delta sediments
2 I 120 - PCP
B
6 t-
z ~40:L
Control Cr z 6 160
Control cu
Control PCP
J
0 10 20 30 40 50 60 70
Concentrofion - mg kg-’
Figure 5. Sediment cores: (a) PCP, As, and Cu in Irwin Pond down to 150-160 cm, and; (b) PCP, Cu, and Cr in the Nancytown Lake delta down to 110-120 cm.
This stream has been studied for biotic effects (Callaham et al., in re- view). Streams with similar sources of PCP and CCA contamination should be monitored to (1) determine water quality impacts; (2) assess adverse bio- logical effects, and; (3) decide if remedial steps need to be taken to pre- vent future inputs of PCP and CCA into the aquatic ecosystem.
ACKNOWLEDGMENT
The authors would like to thank the National Agricultural Pesticide Impact Assessment Program for supporting this research and the staff of the Chattahoochee National Forest for administrative assistance.

REFERENCES
American Public Health Association, 1975, Standard Methods for the Examin- ation of Water and Wastewater, 14th Ed. APHA, Washington, D.C. 1193 p.
Bevenue, A., and H. Beckman, 1967, Pentachlorophenol: A discussion of its properties and its occurrence as a residue in human and animal tissues. Residue Rev. 19:83-134.
Callaham, M.A., P.B. Bush, D.G. Neary, R.A. LaFayette, and J.W. Taylor, Jr., in review, Impact of copper, chromium arsenate, and pentachloro- phenol on aquatic organisms in north Georgia forest streams, Water Re- sources Bulletin.
Cirelli, D.P., 1978, Patterns of pentachorophenol usaqe in the United States of America--An overview. In': Pentachl'orophenol:Chemistry, Pharm- acology, and Environmental Toxicology (K.R. Rao, ed.), Plenum Press, New York.
Fairbridge, R.W., 1972. Encyclopedia of Geochemistry and Environmental Sci- ences, Dowden, Hutchinson, and Toss, Inc., Strondsberg, PA.
Kopp, J.F., 1966, The occurrence of trace elements in water. In: Trace Sub- stances in Environmental Health, III (D. Hemphill, ed.), Univ. of Mis- souri, Columbia.
Maloney, G.T., and M. Pagliai, 1978, Wood preservation statistics, Proc. Am. Wood Preservative Assoc. 74:285-303.
Munakata, K., and M. Kuwahara, 1969, Photochemical degradation products of pentachlorophenol, Residue Rev. 25:13-23.
Neary, D.G., P.B. Bush, and J.E. Douglass, 1983, Off-site movement of hex- azinone in stormflow and baseflow from forest watersheds, Weed Sci. 31: 543-551.
Stiff, M.J., 1971, The chemical states of copper in polluted fresh water and a scheme of analysis of differentiating them. Water Res. 5:585.
Thompson, J.F., 1977, A method for determination of pentachlorophenol, An- alysis of Pesticide Residues in Human and Environmental Samples, Section 5A3B, Manual of Analytical Methods, Pesticides, and Toxic Substances Ef- fects Lab., Research Triangle Park, NC.
U.S. Environmental Protection Agency, 1980, Ambient Water Quality Criteria for Arsenic, 1980, EPA 440/5-80-021.
Wagner, W.L., 1976, Sources of arsenic, monitoring the workplace, and problems involved. U.S. Dept. of Health, Education, and Welfare Publ. 76- 134.
Watanabe, I., 1973, Isolation of pentachlorophenol decomposing bacteria from soil. Soil Sci. Plant Nutr. (Tokyo) 19(2):109-116.
Wilder, H.B., 1972, Investigation of the occurrence and transport of ar- senic in the upper sugar creek watershed, Charlotte, NC, p. D205-D210, In: Geological Surv. Res., Ch. D, Geol. Survey Prof. Pap. 800-D. Sci. Note and Summ of Investigation in Geology, Hydrology, and Related Fields. U.S. Gov. Printing Off., Washington D.C.
8-36
THE ROLE OF SEDIMENT IN ACCELERATED EUTROPHICATION
by A. N. Sharpley, Soil Scientist, Oklahoma State University, Stillwater, Oklahoma
ABSTRACT
Due to atmospheric exchange of nitrogen and carbon with surface water, phosphorus often limits and is of prime importance in the control of accelerated eutrophication. Sediment is an integral part of this process. The bioavailability and reactivity of P, in terms of P sorption-desorption of eroded sediment, is greater than source soil due to the selective removal of fine material during runoff. Relationships between soil loss and the enrichment of sediment-bound P (particulate P) forms are presented, which allow the prediction of runoff losses and capacity of sediment to alter solution P concentration in streams and lakes. A literature survey showed that O-95% of particulate P in runoff and deposited sediments can be potentially bioavailable (utilized by algae), as measured by several chemical extractants and algal bioassays. There is need for development and standardization of a simple chemical extraction method to estimate bioavailable P, so that more information on a less site-specific basis can be obtained. Further research should be directed towards an improvement of models partitioning soluble and particulate P in runoff and water bodies.
INTRODUCTION
The transport of phosphorus (P) in runoff can result in a deterioration in water quality from accelerated eutrophication. Eutrophication of surface water leads to problems with its use for fisheries, recreation, industry or drinking due to the increase in growth of undesirable algae and aquatic weeds. In addition to P, nitrogen (N), and carbon (C) are also associated with these problems. However, control of accelerated eutrophication through limiting C and N inputs is restricted, due to the difficulty in controlling atmospheric exchanges of these elements. Thus, P is often the limiting element and its control is of prime importance in reducing the accelerated eutrophication of surface waters.
The transport of P in runoff can occur as either soluble or particulate P. The term particulate P encompasses all solid phase forms and includes P sorbed by soil particles and organic matter eroded during runoff and contributes the major proportion of P transported from agricultural land (Burwell et al., 1977; McDowell and McGregor, 1984) In runoff from grassland or forest soils, however, where soil erosion is minimal, the reverse may be true (Burwell et al., 1975; Singer and Rust, 1975). Although most soluble P forms found in runoff are biologically available, the bioavailability of particulate P from various sources differs greatly. In addition, transformation between soluble and particulate P can occur during transport.
This paper discusses the mechanisms involved in the detachment of sediment and particulate P and exchange between soluble and particulate P during transport, in addition to the various sources and bioavailability of particulate P in relation to the impact of sediment on accelerated eutrophication.
8-37
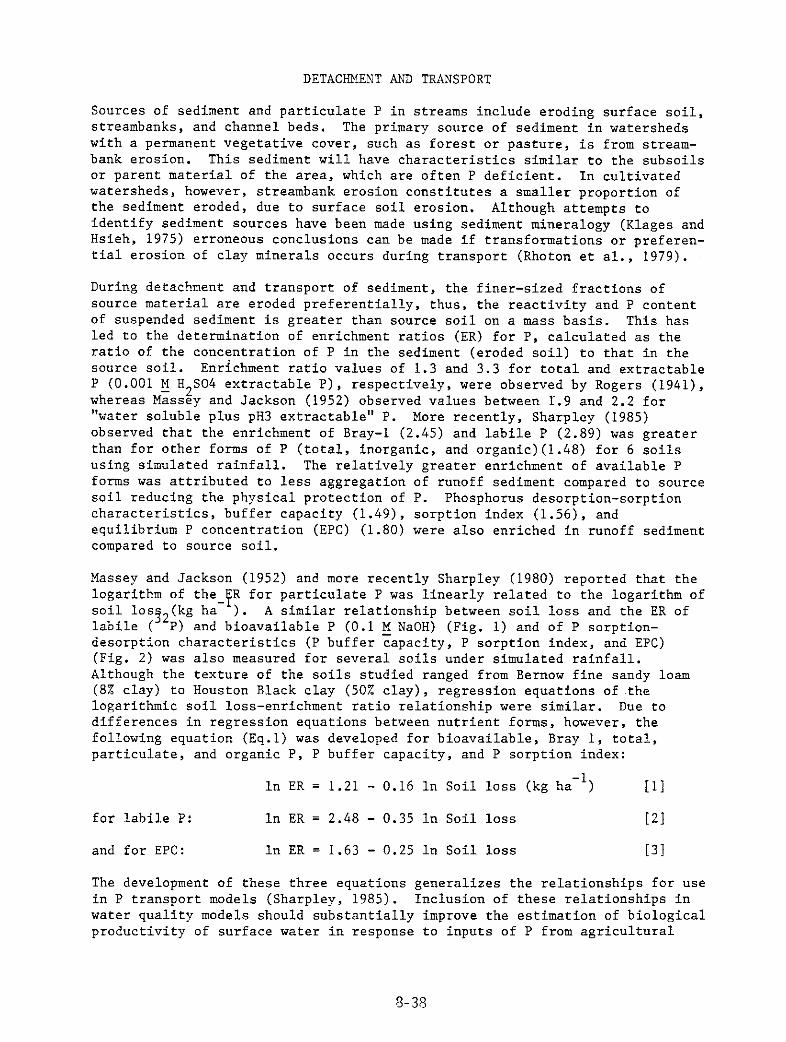
DETACHMENT AM) TRANSPORT
Sources of sediment and particulate P in streams include eroding surface soil, streambanks, and channel beds. The primary source of sediment in watersheds with a permanent vegetative cover, such as forest or pasture, is from stream- bank erosion. This sediment will have characteristics similar to the subsoils or parent material of the area, which are often P deficient. In cultivated watersheds, however, streambank erosion constitutes a smaller proportion of the sediment eroded, due to surface soil erosion. Although attempts to identify sediment sources have been made using sediment mineralogy (Klages and Hsieh, 1975) erroneous conclusions can be made if transformations or preferen- tial erosion of clay minerals occurs during transport (Rhoton et al., 1979).
During detachment and transport of sediment, the finer-sized fractions of .source material are eroded preferentially, thus, the reactivity and P content of suspended sediment is greater than source soil on a mass basis. This has led to the determination of enrichment ratios (ER) for P, calculated as the ratio of the concentration of P in the sediment (eroded soil) to that in the source soil. Enrichment ratio values of 1.3 and 3.3 for total and extractable P (0.001 E H2S04 extractable P), respectively, were observed by Rogers (1941), whereas Massey and Jackson (1952) observed values between I.9 and 2.2 for "water soluble plus pH3 extractable" P. More recently, Sharpley (1985) observed that the enrichment of Bray-l (2.45) and labile P (2.89) was greater than for other forms of P (total, inorganic, and organic)(l.48) for 6 soils using simulated rainfall. The relatively greater enrichment of available P forms was attributed to less aggregation of runoff sediment compared to source soil reducing the physical protection of P. Phosphorus desorption-sorption characteristics, buffer capacity (1.49), sorption index (1.56), and equilibrium P concentration (EPC) (1.80) were also enriched in runoff sediment compared to source soil.
Massey and Jackson (1952) and more recently Sharpley (1980) reported that the logarithm of the ER for particulate P was linearly related to the logarithm of soil los32(kg ha- ). A similar relationship between soil loss and the ER of labile ( P) and bioavailable P (0.1 g NaOH) (Fig. 1) and of P sorption- desorption characteristics (P buffer capacity, P sorption index, and EPC) (Fig. 2) was also measured for several soils under simulated rainfall. Although the texture of the soils studied ranged from Bernow fine sandy loam (8% clay) to Houston Black clay (50% clay), regression equations of the logarithmic soil loss-enrichment ratio relationship were similar. Due to differences in regression equations between nutrient forms, however, the following equation (Eq.1) was developed for bioavailable, Bray 1, total, particulate, and organic P, P buffer capacity, and P sorption index:
In ER = 1.21 - 0.16 In Soil loss (kg ha-') [II
for labile P: In ER = 2.48 - 0.35 In Soil loss [7-l
and for EPC: In ER = 1.63 - 0.25 In Soil loss [31
The development of these three equations generalizes the relationships for use in P transport models (Sharpley, 1985). Inclusion of these relationships in water quality models should substantially improve the estimation of biological productivity of surface water in response to inputs of P from agricultural
9-38
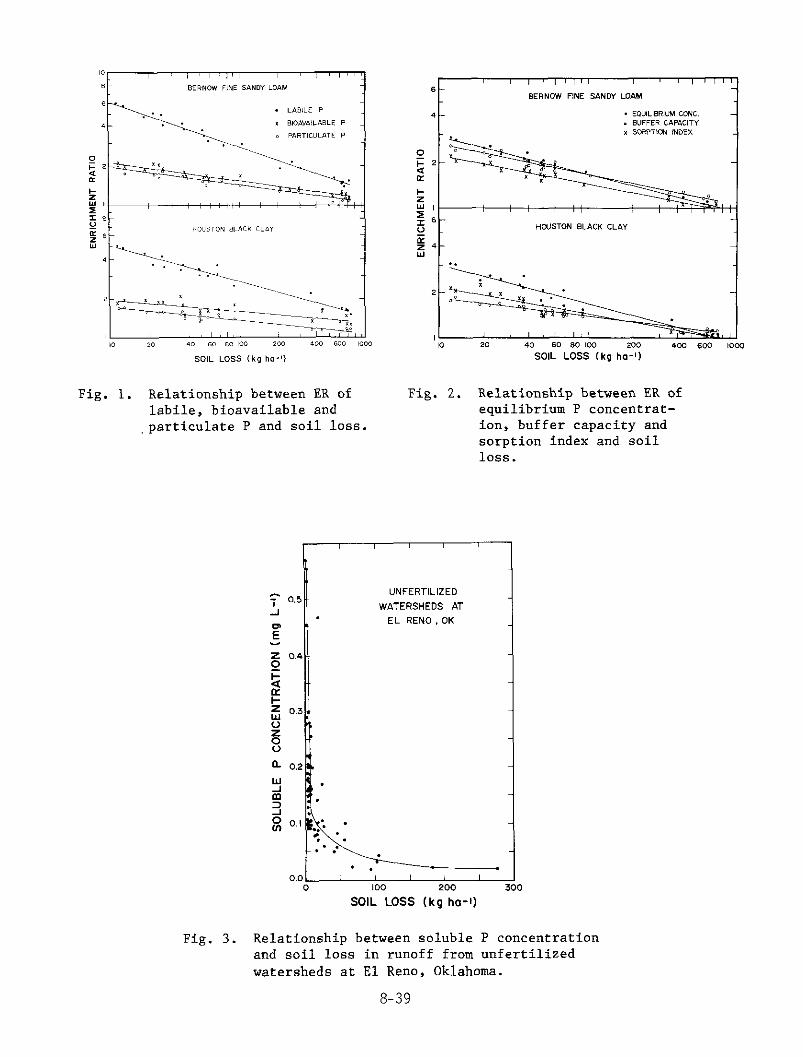
Fig. 1. Relationship between ER of labile, bioavailable and particulate P and soil loss.
Fig. 2. Relationship between ER of equilibrium P concentrat- ion, buffer capacity and sorption index and soil 1OSS.
Fig. 3. Relationship between soluble P concentration and soil loss in runoff from unfertilized watersheds at El Rem, Oklahoma.
8-39
response to inputs of nutrients from agricultural runoff and allow a better description of P-runoff sediment interactions. As bioavailable P and P buffer capacity, P sorption index, and EPC of surface runoff sediment have not been routinely monitored in field studies, field testing of these equations is not possible at the present time.
TRANSFORMATIONS DURING TRANSPORT
Interchange between soluble and the sorbed component of particulate P can occur during transport in stream flow. These transformations are accentuated by the selective transport of fine materials, which have a greater capacity to sorb or desorb P and will thus be important in determining the short term potential of runoff to increase algal growth. In addition, soluble P rnq be removed by stream macrophytes (McCall, 1974; Vincent and Dowries, 1980) and particulate P deposited or eroded from the stream bed with a change in stream flow velocity. Thus, the amounts of soluble and particulate P entering lakes and impoundments can be quite different from those entering stream flow.
For example, a decrease in soluble P concentration in runoff from several unfertilized watersheds under native grass (1.6 ha area) at El Rena, Oklahoma, during 1977 to 1983, was observed with an increase in soil loss (Fig. 3). It is suggested that for watersheds with a low surface soil- available P content, eroded soil can sorb P leached from the vegetative cover. In an earlier study, Sharpley et al. (1981) found that the magnitude of this sorption was more closely related to the sorptive capacity of runoff sediment than to surface soil material. With the application of P fertilizer and increase in surface soil-available P content, eroded soil may act as a source of soluble P to runoff.
The direction of the exchange between soluble and particulate forms will depend on the sediment and soluble P concentration of stream flow and EPC of the sediments contacted, which will include suspended sediment, stream bank, and bottom material. The distribution between soluble and particulate forms will also vary with factors such as temperature, ionic strength, and solution to soil ratio. The complexity of the situation is, thus, increased by the fact that EPC, commonly measured in O.OlM CaCl at a solution to soil ratio of 4O:l is not likely to be a quantitative estima a s of the value under field conditions. The extent of the exchange between soluble and particulate P will depend on the labile or desorbable P content of sediment material contacted and rate of stream flow. For example, if the soluble P concentration of runoff or stream flow falls below the EPC of the suspended or streambank material contacted, P will be desorbed from the material. If, however, the soluble P concentration increases above the EPC, P may be sorbed by the suspended or streambank material contacted. A decrease in the soluble P concentration during base stream flow where the sediment concentration was low has been obsefved (Gburek and Heald, to 0.13 mg L
1974). Soluble P concentrations of 0.29 of runoff from fertilized fields were reduced to 0.009 mg L
by sorption during movement downstream (Kunishi et al., 1972). It is apparent, therefore, that changes in bioavailability of P can occur between the point where it enters runoff flow and where it enters a lake or impoundment. Consequently, the extent to which transformations between soluble and particulate P occur during stream flow must be considered in terms of modeling P movement and the potential bioavailability of P in surface waters.
8-40
Pionke at al. (1985) recently developed a model capable of simulating changes in the concentration of soluble and particulate P in stream flow, from the combining of inflows from surface and/or subsurface sources, sediment desposition and resuspension, and the recharge of channel flow to groundwater. The model is based on a linear sorption isotherm, relating EPC in solution to labile P sorbed on sediment.
INPUT TO LAKES
The forms and amounts of P in lake systems are a function of the input of P from external sources, its output from the lake, and the interchange of P among the various sediment and water components. The interaction between soluble and particulate P forms is controlled by chemical, biochemical, and physical processes. Although soluble P is immediately available for algal uptake, particulate P may provide a long-term source of available P to algal growth through desorption to the surrounding lake water (Bjork, 1972; Larsen et al., 1981; Cooke et al., 1977). Thus, the processes controlling the bioavailability of particulate P must be considered in the implementation of programs to control accelerated eutrophication.
In oligotrophic and sometimes eutrophic waters where soluble P concentrations are gyplewd by vigorous algal growth, concentrations may be as low as 0.001 mg L (McCall, 1972). Under these conditions P may be desorbed from the suspended or deposited s~ediment material. In fact, Bannerman et al. (1975) :";;y ';;'q that approximately 10% of the external P loading of Lake Erie (1.3
hr) resulted in the desorption of P from lake sediments. Consequently, the capacity of sediment entering lakes to supply or remove P is important in an evaluation of importance of P in the aquatic environment.
The processes involved in the sorption and desorption of P by sediment material once in the lake are analogous to those occurring in stream flow discussed earlier. The direction of P movement will be governed by the soluble P concentration of the lake water and the desorbable P content or EPC of the sediment material. The rate and extent of P interchange between sediment P and the surrounding lake water is controlled by the forms of P contained in the sediment and soluble P concentration of the interstial water.
In addition to the chemical mobility of sediment material, its physical mobility will also affect the interchange between particulate and soluble P, and subsequently its bioavailability. The physical mobility of sediment entering a lake will be a function of its texture and lake water temperature and turbulence. As it enters the lake it will reduce the volume of the photic zone. Coarse textured sediments will settle rapidly into deep lakes and be available to algae in the photic zone for short periods only. In contrast, fine textured sediments will remain in the photic zone for a longer period of time. The bioavailability of this sediment will be higher on par unit mass basis as it will be enriched in P compared to coarser material. The relative densities and temperatures of the inflow and lake water will determine whether sediment enters the surface or bottom waters of the lake.
The solubility of P attached to sediment can increase as the sediment settles from the oxic photic zone into the deoxygenated hypolimnion. The desorbed P can then be redistributed during lake turnover when thermal stratification breaks down. In a study of the P dynamics of two shallow hypereutrophic lakes
8-41
in Indiana, Theis and McCabe (1978) found that during anaerobic periods P desorption increased the soluble P concentration of lake water and that during oxic periods sorption decreased concentrations.
BIOAVAILABILITY
The availability of P to algae can be determined by an algal culture test (EPA, 1971). Recently, however, more rapid chemical extraction procedures, which simulate algal removal, have been proposed for the routine determination of particulate P bioavailability. Chemical extractants that have been used to measure the biaavailability of particulate P are NaOH (Logan et al., 1979; Sagher et al., 1975), NH4F (Dorich et al., 1980; Porcella et al., 1970), ion exchange resins (Armstrong et al., 1979; Huettl et al., 1979) and citrate-dithionite-bicarbonate (CDB) (Logan et al., 1979). It is suggested that the weaker extractante and short-term resin extraction represent P that could be utilized by algae in the photic zone of lakes under aerobic conditions. In contrast, the more Severe extractants (CDB) represent P that might become available under reducing conditions found in the anoxic hypolimnion of stratified lakes.
The bioavailability of P attached to suspended sediment transported in tributaries to lakes and of sediment deposited in lakes is summarized in Table 1 for several recent studies. It is evident that a large variability in the bioavailability of particulate P exists, which reflects the dynamic nature of the physiochemical processes governing the transport, P mobility, and deposition of eroded soil material. The bioavailable P content of the deposited sediments is in general greater than that of the suspended sediments (Table 1). This may result from the incorporation of P from detrital material in the deposited sediments. Phosphorus associated with suspended sediment can be considered to be of short-term bioavailability due to sedimentation from the biotic zone. In contrast, P associated with deposited sediments is potentially bioavailable for a much longer period of time. Wildung et al. (1974) reported that the P content of the sediment in several lakes in Oregon was directly related to the biological productivity of surface waters, and served as a significant source of P to these waters, supporting increased biological growth. In the case of P availability for submerged macrophyte growth, Carignan and Kalff (1980) found that they depended overwhelmingly on sediments for their P supply. Even under hypereutrophic lake conditions, sediments contributed the major proportion (72%) of P utilized during growth. It has been suggested, moreover, that these aquatic plants may supply P to overlying waters by excretion during growth and upon senescence (Carignan and Kalff, 1980).
Caution must be exercised, however, in relating P bioavailability of sediment material determined by the above chemical extractions and the potential of the sediment to increase algal growth (Lee et al., 1979; Sonzogni et al., 1982). In many lakes the stratified surface zone may be relatively thin, due to wind or other current induced mixing, compared to the mixed layer above the thermocline or bottom. In addition, suspended sediment material often contains large amounts of silt-sized aggregates of clay, which will settle more rapidly from the photic zone than smaller sized particle, possibly reducing the actual availability of particulate P. Consequently, bioassays may produce erroneous estimates of available particulate P unless the physiochemical properties of the waterbody and sediment are considered in
8-42
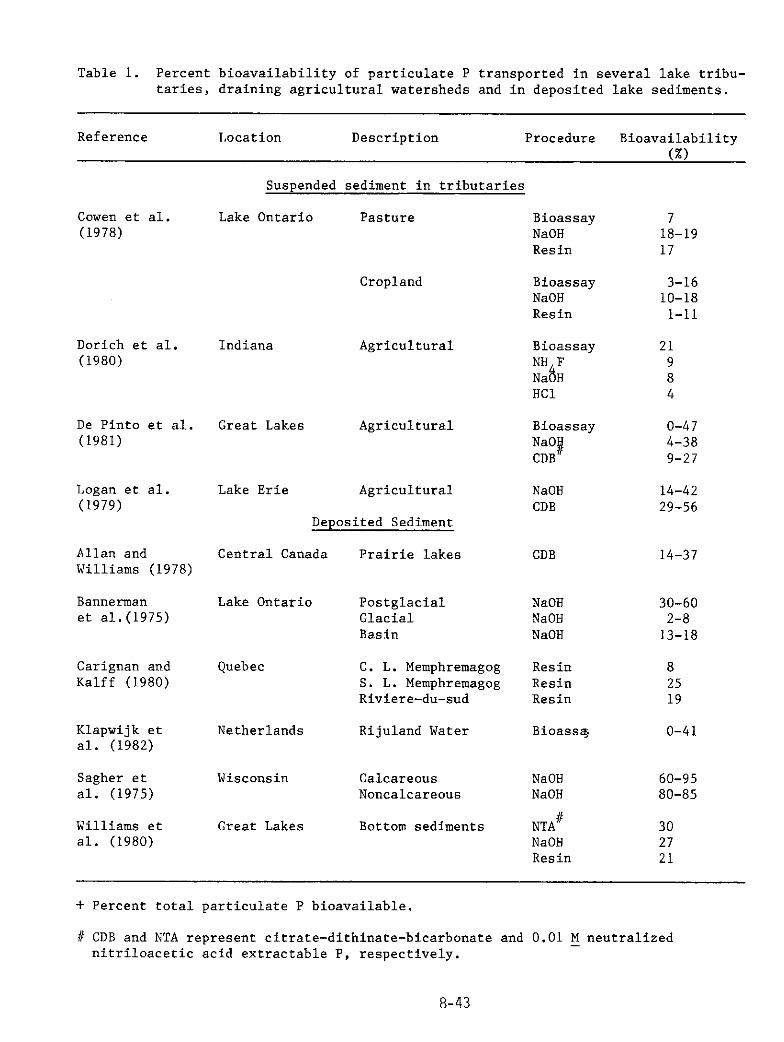
Table 1. Percent bioavailability of particulate P transported in several lake tribu- taries, draining agricultural watersheds and in deposited lake sediments.
Reference Location Description Procedure Bioavailability
Cowen et al. (1978)
Dorich et al. (1980)
De Pinto et al. (1981)
Logan et al. (1979)
Allan and Williams (1978)
BSTlIlS~Sll et a1.(1975)
Carignan and Kalff (1980)
Klapwijk et al. (1982)
Sagher et al. (1975)
Williams et al. (1980)
Suspended sediment in tributaries
Lake Ontario Pasture
Cropland
Indiana Agricultural
Great Lakes Agricultural
Lake Erie Agricultural
Deposited Sediment
Central Canada
Lake Ontario
Quebec
Netherlands
Wisconsin
Great Lakes
Prairie lakes CDB 14-37
Postglacial NaOH 30-60 Glacial NaOH 2-8 Basin NaOH 13-18
C. L. Memphremagog Resin 8 S. L. Memphremagog Resin 25 Riviere-du-sud RSSill 19
Rijuland Water Bioasq o-41
CalCaPSXLS NaOH 60-95 NOlN2dC.?.P2OllS NaOH 80-85
Bottom sediments NTA" NaOH Resin
30 27 21
Bioassay 7 NaOH 18-19 Resin 17
Bioassay NaOH Resin
3-16 lo-18
I-11
Bioassay 21 NH F 9 Na H b 8 HCl 4
Bioassay NaO CDB iI
NaOH CDB
o-47 4-38 V-27
14-42 29-56
+ Percent total particulate P bioavailable.
# CDB and NTA represent citrate-dithinate-bicarbonate and 0.01 M neutralized nitriloacetic acid extractable P, respectively.
8-43
determining the appropriate bioassay to be used. Although the above chemical extraction procedures have identified which particulate P fractions can be utilized by algae, there is no evidence that all of the chemically extracted P is algal-available (Hegemann et al., 1983). Thus, Hegemann et al., (1983) suggested that a quantitative assessment of algal-available particulate P will depend upon the development of long-term ( 100 day) algal assay procedures.
The water renewal time of a lake plays an important role in the dynamics and extent of P exchange in a lake. With a short residence time, outflow of water from a lake can be a more important route for P removal than sedimentation. When the residence time of a lake exceeds a few months, P becomes trapped in the lake. Because of this process, impoundments and small lakes have been used as efficient traps (especially for particulate P) to improve downstream water quality (Rausch and Schreiber, 1977). It is apparent, however, that the amounts of P stored in lakes can build up to unacceptable levels resulting in a permanent deterioration in water quality. In fact, a reduction in the external load of P upon the highly eutrophic Lake Trummen in Sweden, did not bring the desired improvement in water quality, until the upper layers of the P-rich sediment were removed (Bjork, 1972).
SUMMARY
It is apparent that sediment plays a major role in controlling the amounts of both soluble and particulate P in runoff and lakes and thus accelerated eutrophication. Adoption of minimum tillage practices may reduce total P loads but have little effect on, or even increase soluble and bioavailable P losses (McDowell and McGregor, 1984; Mueller et al., 1981). Consequently, management decisions aimed at reducing the impact of sediment on accelerated eutrophication must consider particulate P bioavailability.
Considerable research has been conducted to quantify the losses of soil and fertilizer P from various land management practices. However, we are still unable to relate the input of P to a lake or impoundment to a quantitative description of water quality. In addition, the effect of P concentrations on algal growth receives continued attention, while little information is available on how lake macrophytes are affected, even though macrophytes present a more serious economic problem in many lakes than algae.
Research should be directed towards an improvement of the partitioning models for soluble and particulate P transport in runoff and in lakes and impoundments, as initiated by Pionke et al. (1985). This should focus on the mechanisms of exchange between bioavailable or labile P and solution, and methods to routinely quantify amounts of desorbable P for various materials. Although it has been recbmmended that the quantitative assessment of algal-available particulate P will depend on the development of long-term algal assay procedures, a simpler, quicker chemical extraction of standarized methodology, is also warranted. This will allow more information on a less site-specific basis to be obtained.
ACKNOWLEDGEMENT
This study was United States Department of Agriculture - Agriculture Research Service (USDA-ARS) Cooperative Research supported under General Cooperative Agreement f58-7B30-2-416, and conducted at the USDA-ARS Water Quality and Watershed Research Laboratory, Durant, OK.
8-44
REFERENCES
Allan, R. .J., and Williams, J. D., 1978, Trophic status related to sediment chemistry of Canadian Prairie Lakes. J. Environ. Qual. 7, 99-106.
Armstrong, D.E., Perry, J. R., and Flatness, D., 1979, Availability of pollutants associated with suspended or settled river sediments, which gain access to the Great Lakes. Final Report, Wisconsin Water Res. Cent., Madison.
Bannerman, R. T., Armstrong, D. E., Harris, R. F., and Holdren, C. C., 1975, Phosphorus release and uptake by Lake Ontario sediments. Ecol. Res. Ser. EPA-660/3-75/--066, pp. 61.
Bjork, S., 1972, Swedish Lake restoration program gets results. Ambio. 1, 153-165.
Burwell, R. E., Timmons, D. R., and Halt, R. F., 1975, Nutrient transport in surface runoff as influenced by soil cover and seasonal periods. Soil Sci. sac. Am. Proc. 39, 523-528.
Burwell, R. E., Schuman, G. E., Heinemann, H. G., and Spomer, R. G., 1977, Nitrogen and phosphorus movement from agricultural watersheds. J. Soil and Water Conserv. 32, 226-230.
Carignan, R., and Kalff, J., 1980, Phosphorus sources for aquatic weeds: Water or sediments? Science 207, 987-989.
Carter, D. L., Bondurant, J. A., and Robbins, C. W., 1971, Water-soluble N03-nitrogen, PO4-phosphorus, and total salt balances on a large irrigation tract. Soil Sci. Sot. Am. Proc. 35, 331-335.
Cooke, G. D., McComas, M. R., Walker, D. W., and Kennedy, R. H., 1977, The occurrence of internal phosphorus loading in two small eutrophic glacial lakes in Northeastern Ohio. Hydrobiol. 56, 129-135.
Cowen, W. F., Sirisinha, K., and Lee, G. F., 1978, Nitrogen and phosphorus in Lake Ontario tributary waters. Water, Air and Soil Pollut. 10, 343-350.
De Pinto, J. V., Young, T. C., and Martin, S. C., 1981, Algal-available phosphorus in suspended sediments from lower Great Lakes tributaries. J. Great Lakes Res. 7, 311-325.
Dorich, R. A., Nelson, D. W., and Somers, L. E., 1980, Algal availability of sediment phosphorus in drainage water of the Black Creek watershed. J. Environ. Qual. 9, 557-568.
EPA, 1971, Algal assay procedure - Bottle Test. Nat. Eutrophication Res. Program, Pacific North West Laboratory, Corvallis, Oregon. pp. 82.
Gburek, W. J., and Heald, W. R., 1974, Soluble phosphate output of an agricultural watershed in Pennsylvania. Water Resour. Res. 10, 113-118.
Hegemann, D. A., Johnson, A. H., and Keenan, J. D., 1983, Determination of algae-available phosphorus on soil and sediment: A review and analysis J. Environ. Qual. 12, 12-16.
Huettl, P. J., Wendt, R. C., and Corey, R. B., 1979, Prediction of algal available phosphorus in runoff suspensions. J. Environ. Qual. 4, 541-548.
Klages, M. G., and Hsich, Y. P., 1975, Suspended solids carried by the Gallatin River of southwestern Montana: II. Using mineralogy for inferring sourcl?s. J. Environ. Qual. 4, 68-73.
Klapwijk, S. P., Kroon, J. M. W., and Meijer, M. L., 1982, Available phosphorus in lake sediments in the Netherlands. Hydrobiologia 92, 491-500.
Kunishi, H. M., Taylor, A. W., Heald, W. R., Gburek, W. J., and Weaver, R. N., 1972, Phosphate movement from an agricultural watershed during two rainfall periods. J. Agric. Food Chem. 20, 900-905.
Larsen, D. P., Schults, D. W., Malueg, K. W., 1981, Summer internal phosphorus supplies in Shagawa Lake, Minnesota. Limnol. Oceanogr. 26:740-753.
8-45
Lee, G. F., Jones, R. A., and Rast. W., 1979, Availability of phosphorus to phytoplankton and its implications for phosphorus management strategies. In. R. C. Loehr, C. S. Martin, and W. Rat. Strategies for Lakes. Ann Arbor Sci.
(eds.) Phosphorus Management 259-308.
Logan, T. J., Oloya, T. O., and Yaksich, S. M., 1979, Phosphate characteristics and bioavailability of suspended sediments from streams draining into Lake Erie. J. Great Lakes Res. 5, 112-123.
Massey, H. F., and Jackson, M. L., 1952, Selective erosion of soil fertility constituents. Soil Sci. Snc. Am. Proc. 16, 353-356.
McCall, R. H. S., 1972, Chemistry and trophic status of seven New Zealand lakes. N. Z. J. Marine and Freshwater Res. 6, 399-447.
McCall, R. H. S., 1974, Self-purification of small freshwater streams: Phosphate, nitrate and ammonia removal. N. Z. J. Mar. Freshwater Res. 8, 375-388.
McDowell, L. L. and McGregor, K. C., 1984, Plant nutrient losses in runoff from conservation tillage corn. Soil Tillage Res. 4, 79-81.
Mueller, D. H., Daniel, T. C., and Wendt, R.C., 1981, Conservation tillage: Best management practice for nonpoint runoff. Environ. Manage. 5, 33-53.
Pionke, H. B., Kunishi, H. M., Schnabel, R. R., DeAngelis, R. J., and Alonso, C. V., 1985, SWAM - The Chemical Models used in the Channel System. Proc. Natural Res. Modeling Symp. D. G. Decoursey (ed.) Oct. 1983.
Porcella, D. B., Kumagai, J. S., and Middlebrooks, E. J., 1970, Biological effects on sediment-water nutrient interchange. 3. Sanit. Eng. Div., Proc. Am. SIX. Civil Eng., SA4, 911-926.
Rausch, D. L., Schreiber, J. D., 1977, Callahan reservoir. I. Sediment and nutrient trap efficiency. Trans. of Am. Sot. Agric. Eng. 20, 281-290.
Rhoton, F. E., Smeck, N. E., and Wilding, L. P., 1979, Preferential clay mineral erosion from watersheds in the Maumee River Basin. J. Environ. QWl. 8, 547-550.
Rogers, M. T., 1941, Plant nutrient losses by erosion from a corn, wheat, clover rotation on Dunmore silt loam. Soil Sci. Sot. Am. Proc. 6, 263-271.
Sagher, A., Harris, R. F., and Armstrong, D. E., 1975, Availability of sediment phosphorus to microorganisms. Univ. of Wise. of Water Resourc. cent., Tech. Rept. WIG WRC 75-01. pp. 56.
Sharpley, A. N., 1980, The enrichment of soil phosphorus in runoff sediments. J. Environ. Qual. 9, 521-526.
1985, The selective erosion of plant nutrients in runoff. Soil Sci. So:. Am. J. 49 (in press).
Sharpley, A. N., Menzel, R. G., Smith, S. J., Rhoades, E. D., and Olness, A. E., 1981, The sorption of soluble phosphorus by soil material during transport in runoff from cropped and grassed watersheds. J. Environ. Qual. 10, 211-215.
Singer, M. J., Rust, R. H., 1975, Phosphorus in surface runoff from a deciduous forest. J. Environ. Qual. 4, 307-311.
Sonzogni, W. C., Chapra, S. C., Armstrong, D. E. and Logan, T. J., 1982, Bioavailability of phosphorus inputs to lakes. J. Environ. Qual. 11, 555-563.
Theis, T. L., McCabe, P. J., 1978, Phosphorus dynamics in hypereutrophic lake sediments. Water Res. 12, 677-685.
Vincent, W. G., and Dowries, M. T., 1980, Variation in nutrient removal from stream by water cress (Nasturtium Officinale R. BR.) Aquatic Bot. 9, 221-235.
Wildung, R. E., Schmidt, R. L., and Gahler, A. R., 1974, The phosphorus status of eutrophic lake sediments as related to changes in limnological conditions -- total, inorganic, and organic phosphorus. J. Environ. Qual. 3, 133-138.
8-46

Williams, J. D., Shear, H., and Thomas, R. L., 1980, Availability to Scenedesmus quadncauda of different forms of phosphorus in sedimentary materials from the Great Lakes. Limnol. Oceanogr. 25: 1-11.
8-47
NUTKIENT-SEDIMENT KELATIONS IN STKEAMFLOW
By K. Edward Hickman, U.S. Geological Survey, Mailstop 431 National Center, Keston, Virginia.
ABSTKACT
Streamflow in Kock Creek and the Northwest and Northeast Branches of the Anacostia Kiver was sampled for nutrients and suspended sediment during the 1979-81 water years. These streams are located within the Washington, D.C. metropolitan area and drain watersheds that are about half urbanized.
Concentrations of total phosphorus in all three streams increase with suspended-sediment concentration. The z-2 values of linear relations are 0.50 to 0.79, indicating that soil is an important source of phosphorus within the three watersheds. The proportion of total phosphorus made up by dissolved phosphorus decreases exponentially with suspended-sediment concentration. Linear relations between concentrations of particulate phosphorus and suspended sediment have r2 values 0.69 to 0.82, supporting the hypothesis that soil is an important source of phosphorus.
Concentrations of total Kjeldahl nitrogen in all three streams during the months August to March increase with suspended-sediment concentration. The r2 values of linear relations are 0.52 to 0.68, indicating that soil partycles are an important source of Kjeldahl nitrogen in these three watersheds. The proportion of total Kjeldahl nitrogen made up by the dissolved form shows no relation with suspended-sediment concentration for any of the streams. Some high concentrations of total Kjeldahl nitrogen in the Northeast and Northwest Branches indicate sources other than soil during the months April to July.
INTKODUCTION
Kock Creek and the Northeast and Northwest Branches of the Anacostia Kiver, three streams in the Washington, D.C. metropolitan area, were sampled during the 1979-81 water years (October 1978 to September 1981) in order to estimate the yields of suspended sediment, phosphorus, and Kjeldahl nitrogen during this period (Hickman, 1985). The purpose of this paper is to examine the relations between nutrient and suspended- sediment concentrations, and to interprete these relations with regard to nutrient sources within the watersheds.
STUDY AKEA
'The Northeast and Northwest Branches of the Anacostia Kiver (hereafter referred to as the Northeast and Northwest Branches) and Kock Creek are located in Maryland just north of Washington, D.C. and in the northern part of the city (fig. 1). The streams were sampled at U.S. Geological Survey stations at which streamflow is recorded (table 1). The watersheds draining to the sampling sites vary in size from 128 to 189 square kilometers, and are about half urbanized. The long-term mean annual streamflow as runoff varies from 325 to 402 millimeters. The mean annual runoff during the 1979-81 water years was up to 34 percent greater than Long-term means. There are no known large point-source discharges in the three watersheds.
6-48
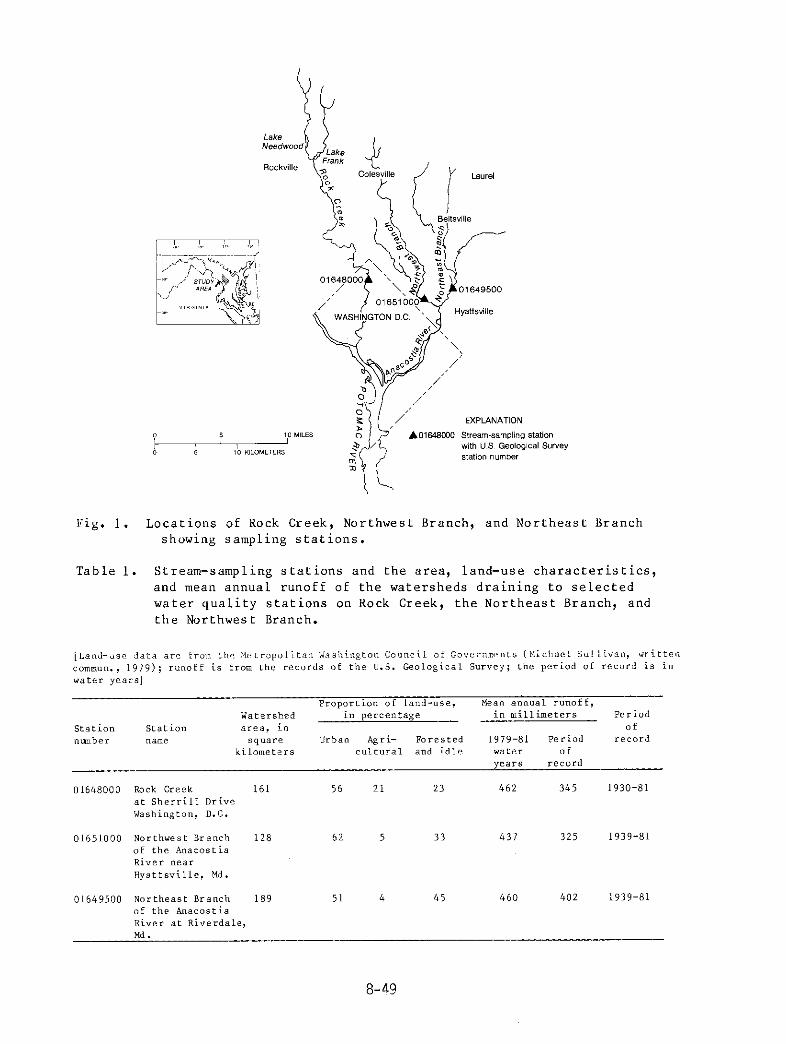
Fig. 1. Locations of Rock Creek, Northwest Branch, and Northeast Branch showing sampling stations.
Table 1. Stream-sampling stations and the area, land-use characteristics, and mean annual runoff of the watersheds draining to selected water quality stations on Kock Creek, the Northeast Branch, and the Northwest Branch.
8-49
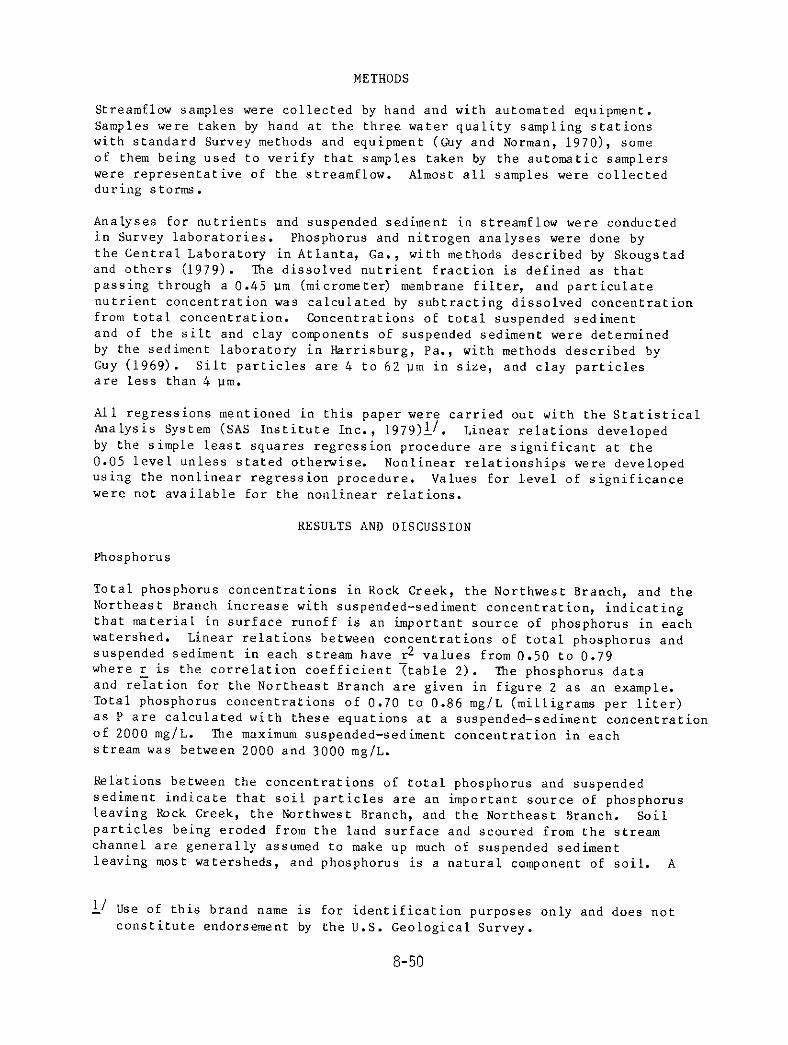
METHODS
Streamflow samples were collected by hand and with automated equipment. Samples were taken by hand at the three water quality sampling stations with standard Survey methods and equipment (Guy and Norman, 1970), some of the" being used to verify that samples taken by the automatic samplers were representative of the streamflow. Almost all samples were collected during storms.
Analyses for nutrients and suspended sediment in streamflow were conducted in Survey laboratories. Phosphorus and nitrogen analyses were done by the Central Laboratory in Atlanta, Ga., with methods described by Skougstad and others (1979). 'Ihe dissolved nutrient fraction is defined as that passing through a 0.45 pm (micrometer) membrane filter, and particulate nutrient concentration was calculated by subtracting dissolved concentration from total concentration. Concentrations of total suspended sediment and of the silt and clay components of suspended sediment were determined by the sediment laboratory in Harrisburg, Pa., with methods described by Guy (1969). Silt particles are 4 to 62 pm in size, and clay particles are less than 4 pm.
All regressions mentioned in this paper were carried out with the Statistical Analysis System (SAS Institute Inc., 1979)1/. Linear relations developed by the simple least squares regression procedure are significant at the 0.05 level unless stated otherwise. Nonlinear relationships were developed using the nonlinear regression procedure. Values for level of significance were not available for the nonlinear relations.
KESULTS AND DISCUSSION
Phosphorus
Total phosphorus concentrations in Rock Creek, the Northwest Branch, and the Northeast Branch increase with suspended-sediment concentration, indicating that material in surface runoff is an important source of phosphorus in each watershed. Linear relations between concentrations of total phosphorus and suspended sediment in each stream have r2 values from 0.50 to 0.79 where r is the correlation coefficient Ttable 2). The phosphorus data and relation for the Northeast Branch are given in figure 2 as an example. Total phosphorus concentrations of 0.70 to 0.86 mg/L (milligrams per liter) as P are calculated with these equations at a suspended-sediment concentration of 2000 mg/L. 'Ihe maximum suspended-sediment concentration in each stream was between 2000 and 3000 "g/L.
Relations between the concentrations of total phosphorus and suspended sediment indicate that soil particles are an important source of phosphorus leaving Rock Creek, the Northwest Branch, and the Northeast Branch. Soil particles being eroded from the land surface and scoured from the stream channel are generally assumed to make up much of suspended sediment leaving most watersheds, and phosphorus is a natural component of soil. A
11 Use of this brand name is for identification purposes only and does not constitute endorsement by the U.S. Geological Survey.
8-50
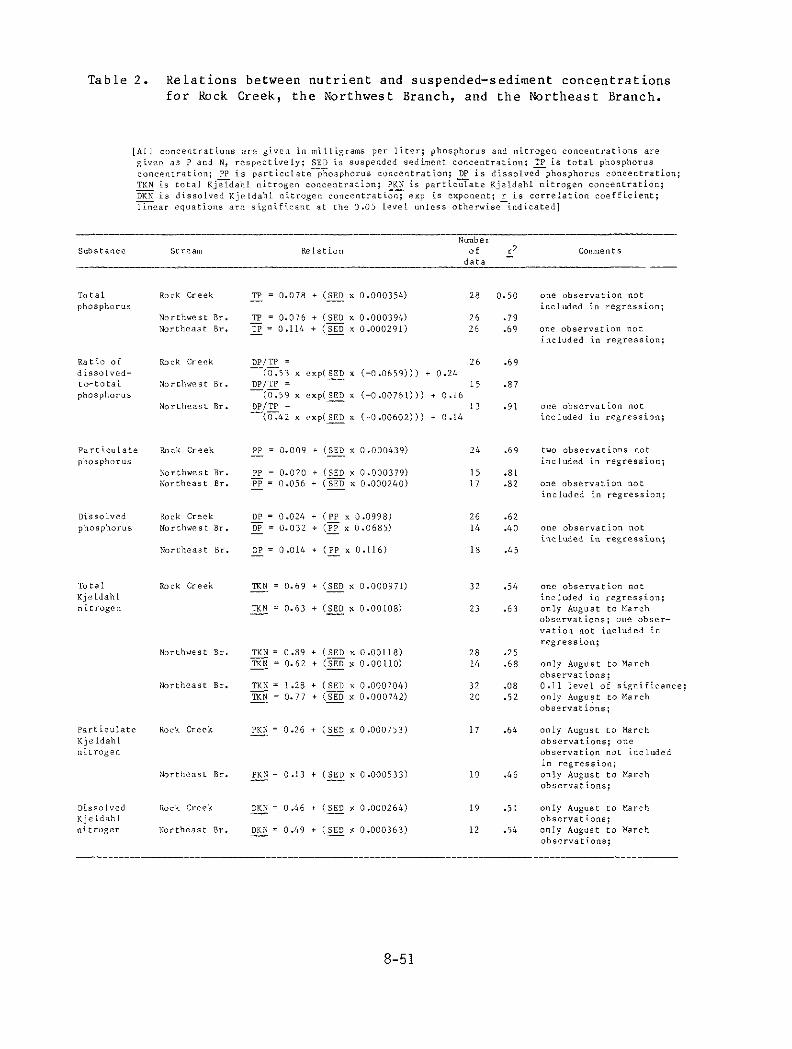
Table 2. Relations between nutrient and suspended-sediment concentrations for Kock Creek, the Northwest Branch, and the Northeast Branch.
1.50
.79
.69
49
.a7
.91
.69
.8L
.82
.62
.40
.45
.5&
.63
.21
.h8
.08
.52
.64
.46
.51
34
one obscrvafio” not included in regression;
one observation “OL included in regression;
one obscr”aLio” not included in regressio”;
two observations not included in regression;
one ObJervaLio” not iociudcd in regressio”;
0°C observation not incL”ded in ‘egression;
8-51
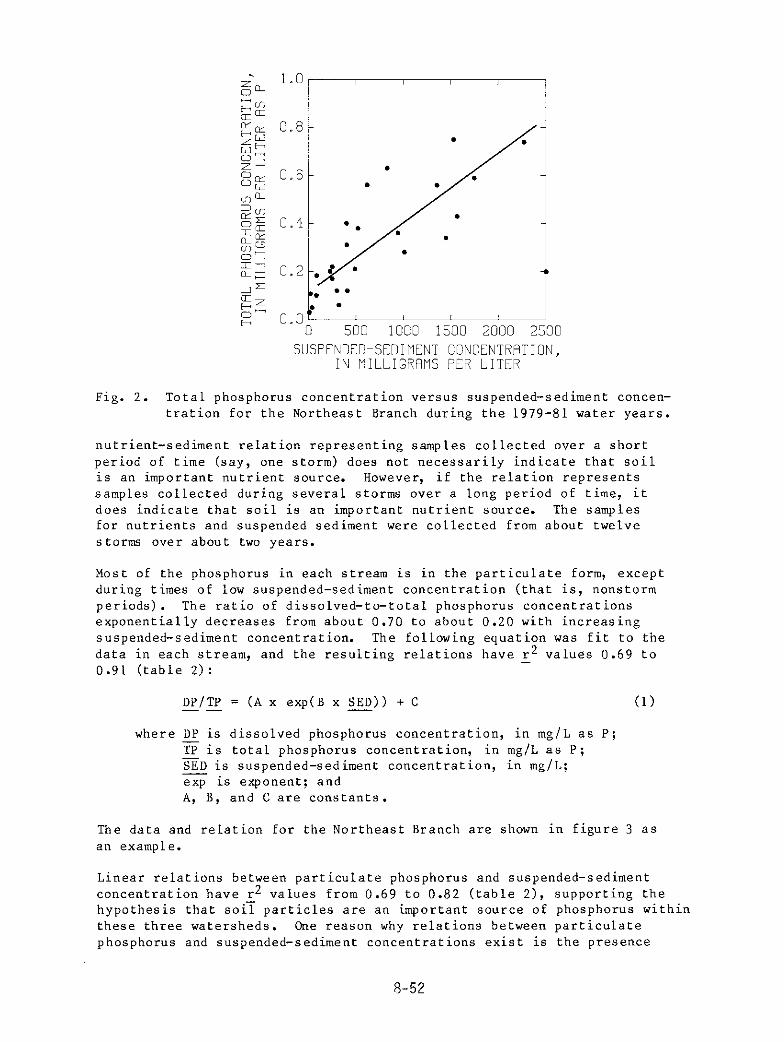
F+ 1.0,
1 ! / . .I . . . . II~
1 . l * . . . . 1
SUSPENDED~SEOIMENT CONCENTRATION, IN RILLIGRRMS PER LITER
Fig. 2. Total phosphorus concentration versus suspended-sediment concen- tration for the Northeast Branch during the 1979-81 water years.
nutrient-sediment relation representing samples collected over a short period of time (say, one storm) does not necessarily indicate that soil is an important nutrient source. HOWeVer, if the relation represents samples collected during several storms over a long period of time, it does indicate that soil is an important nutrient source. The samples for nutrients and suspended sediment were collected from about twelve storm over about two years.
Most of the phosphorus in each stream is in the particulate form, except during times of low suspended-sediment concentration (that is, nonstorm periods). The ratio of dissolved-to-total phosphorus concentrations exponentially decreases from about 0.70 to about 0.20 with increasing suspended-sediment concentration. The following equation was fit to the data in each stream, and the resulting relations have r2 values 0.69 to - 0.91 (table 2):
DP/TP = (A x exp(B x SED)) + C (1) -- -
where DP is dissolved phosphorus concentration, in mg/L as P; 5 is total phosphorus concentration, in mg/L as P; SD is suspended-sediment concentration, in mg/L; - exp is exponent; and A, 8, and C are constants.
The data and relation for the Northeast Branch are shown in figure 3 as an example.
Linear relations between particulate phosphorus and suspended-sediment concentration have r2 values from 0.69 to 0.82 (table 2), supporting the hypothesis that soii particles are an important source of phosphorus within these three watersheds. One reason why relations between particulate phosphorus and suspended-sediment concentrations exist is the presence
e-52
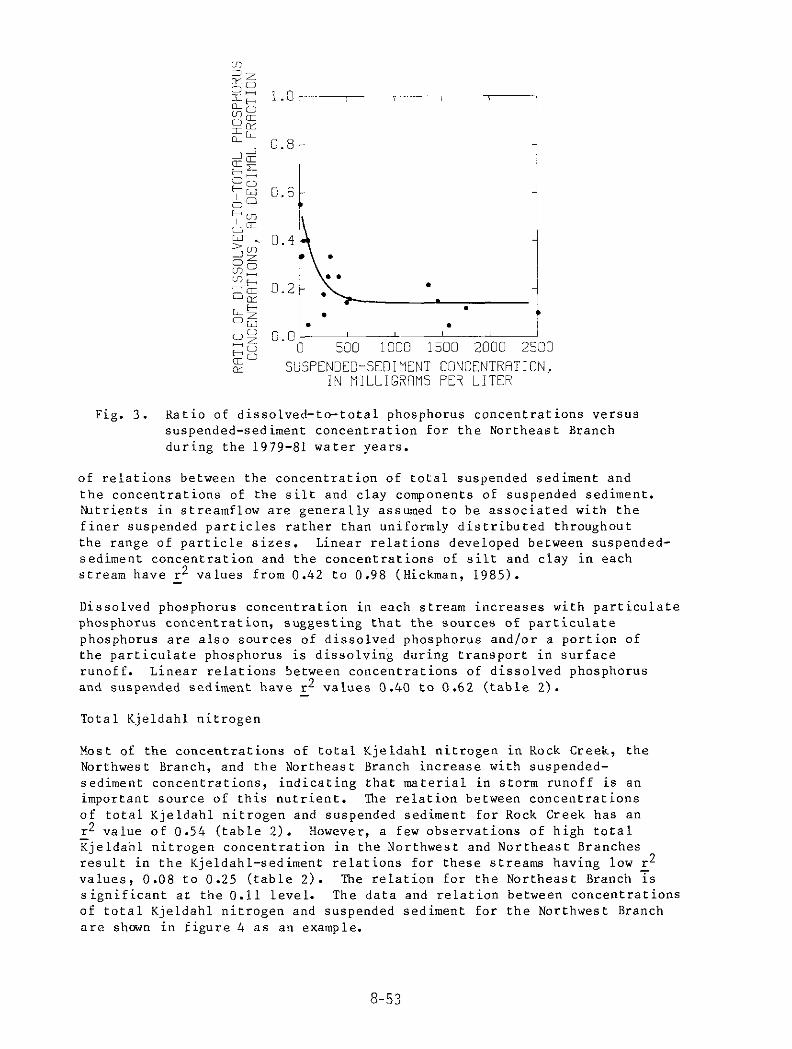
i, . *
-
-z E= 0 500 1000 1500 2000 2500
!x SUSPENDED-SEDIMENT CONCENTRATION, IN MILLIGRRMS PER LITER
Fig. 3. Ratio of dissolved-to-total phosphorus concentrations versus suspended-sediment concentration for the Northeast Branch during the 1979-81 water years.
of relations between the concentration of total suspended sediment and the concentrations of the silt and clay components of suspended sediment. Wtrients in streamflow are generally assumed to be associated with the finer suspended particles rather than uniformly distributed throughout the range of particle sizes. Linear relations developed between suspended- sediment concentration and the concentrations of silt and clay in each stream have r* _ values from 0.42 to 0.98 (Hickman, 1985).
Dissolved phosphorus concentration in each stream increases with particulate phosphorus concentration, suggesting that the sources of particulate phosphorus are also sources of dissolved phosphorus and/or a portion of the particulate phosphorus is dissolving during transport in surface runoff. Linear relations between concentrations of dissolved phosphorus and suspended sediment have r2 _ values 0.40 to 0.62 (table 2).
Total Kjeldahl nitrogen
Most of the concentrations of total KjeLdahL nitrogen in Rock Creek, the Northwest Branch, and the Northeast Branch increase with suspended- sediment concentrations, indicating that material in storm runoff is an important source of this nutrient. 'Ihe relation between concentrations of total KjeldahL nitrogen and suspended sediment for Kock Creek has an r2 value of 0.54 (table 2). However, a few observations of high total FjjeLdahl nitrogen concentration in the Northwest and Northeast Branches result in the Kjeldahl-sediment relations for these streams having low r2 values, 0.08 to 0.25 (table 2). The relation for the Northeast Branch 7s significant at the 0.11 level. The data and relation between concentrations of total KjeldahL nitrogen and suspended sediment for the Northwest Branch are shown in figure 4 as an example.
8-53
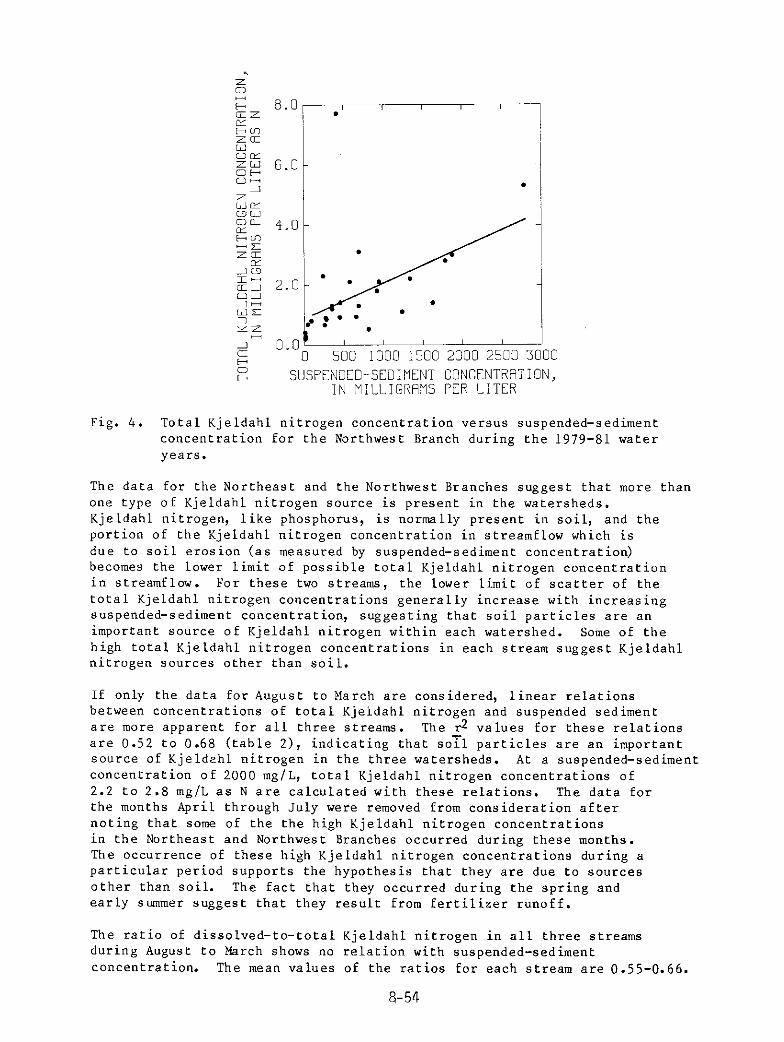
. 6 ;: E'
8.0, ! '
b c SUSPENDED-SEDIMENT CONCENTRRTION,
IN MILLIGRRMS PER LITER
Fig. 4. Total Kjeldahl nitrogen concentration versus suspended-sediment concentration for the Northwest Branch during the 1979-81 water years.
The data for the Northeast and the Northwest Branches suggest that more than one type of Kjeldahl nitrogen source is present in the watersheds. Kjeldahl nitrogen, like phosphorus, is normally present in soil, and the portion of the Kjeldahl nitrogen concentration in streamflow which is due to soil erosion (as measured by suspended-sediment concentration) becomes the lower limit of possible total Kjeldahl nitrogen concentration in streamflow. For these two streams, the Lower limit of scatter of the total Kjeldahl nitrogen concentrations generally increase with increasing suspended-sediment concentration, suggesting that soil particles are an important source of Kjeldahl nitrogen within each watershed. Some of the high total Kjeldahl nitrogen concentrations in each stream suggest Kjeldahl nitrogen sources other than soil.
If only the data for August to March are considered, linear relations between concentrations of total Kjeldahl nitrogen and suspended sediment are more apparent for all three streams. The r2 values for these relations are 0.52 to 0.68 (table 2), indicating that soT1 particles are an important source of Kjeldehl nitrogen in the three watersheds. At a suspended-sediment concentration of 2000 mg/L, total Kjeldahl nitrogen concentrations of 2.2 to 2.8 mg/L as N are calculated with these relations. The data for the months April through July were removed from consideration after noting that some of the the high Kjeldahl nitrogen concentrations in the Northeast and Northwest Branches occurred during these months. The occurrence of these high Kjeldahl nitrogen concentrations during a particular period supports the hypothesis that they are due to sources other than soil. The fact that they occurred during the spring and early summer suggest that they result from fertilizer runoff.
The ratio of dissolved-to-total Kjeldahl nitrogen in all three streams during August to March shows no relation with suspended-sediment concentration. The mean values of the ratios for each stream are 0.55-0.66.
8-54
Considering only the August to March data, p articulate Kjeldahl nitrogen concentrations in both Kock Creek and the Northeast Branch increase with suspended-sediment concentrations, supporting the idea that soil particles an important source of Kjeldahl nitrogen. The r2 values for these relations (0.46 to 0.64) are in the same range & those for the relations for total Kjeldahl nitrogen (table 2). The poor correlations between concentrations of suspended sediment and particulate Kjeldahl nitrogen (as compared to those for particulate phosphorus) may be the result of sources other than soil particles (during August to March) or a poor relation between the concentrations of suspended-sediment and the particle-size class with which particulate Kjeldahl nitrogen is associated. Particulate Kjeldahl nitrogen concentrations in the Northwest Branch show no relation with suspended-sediment concentration.
Considering only August to March data, dissolved Kjeldahl nitrogen concentrations in Kock Creek and the Northeast Branch increase with suspended-sediment concentration, suggesting that sources of sediment are important sources of dissolved Kjeldahl nitrogen. The r2 values for these relations are 0.51 to 0.54 (table 2). ‘Ihe data-for the Northwest Branch show no relation between concentrations of dissolved Kjeldahl nitrogen and suspended sediment.
SUMMAKY AND CONCLUSIONS
Relations between concentrations of suspended sediment and phosphorus and between suspended sediment and Kjeldahl nitrogen were developed from streamflow (mostly stormflow) samples taken from Kock Creek, the Northwest Branch, and the Northeast Branch during the 1979-81 water years. These relations were examined for information about nutrient sources within the three watersheds.
Linear relations for all three streams show increasing total phosphorus concentration with suspended-sediment concentration. These relations have r2 values 0.50 to 0.79 and indicate that soil particles are an important source of phosphorus within the three watersheds. At a concentration of 2000 milligrams per liter of suspended-sediment concentration, total phosphorus concentrations of 0.70 to 0.86 mg/L as P are calculated with these relations.
The proportion of total phosphorus in the dissolved form exponentially decreases from about 0.70 to about 0.20 with increasing suspended-sediment concentration. Kelations between the ratio of dissolved-to-total phosphorus concentrations and suspended-sediment concentration have r2 values 0.69 to 0.91. Linear relations between the concentration of particulate phosphorus and suspended sediment (r2 values 0.69 to 0.82) support the hypothesis that soil particles are an important source of phosphorus within the three watersheds. Dissolved phosphorus concentrations increase with particulate phosphorus concentrations, suggesting that sources of particulate phosphorus are also sources of dissolved phosphorus.
Total Kjeldahl nitrogen concentrations in all three streams during the months August to March increase with suspended-sediment concentration. Linear relations between concentrations of total Kjeldahl nitrogen and suspended sediment have r2 values 0.52 to 0.68, - indicating that soil particles
5-55
are an important source of Kjeldahl nitrogen. At a suspended-sediment concentration of 2000 mg/L, total Kjeldahl nitrogen concentrations of 2.2 to 2.8 mg/L as N are calculated with these relations. Some high total Kjeldahl nitrogen concentrations in the Northeast and Northwest Branches during April to July indicate other sources.
Considering only the August to March data, particulate and dissolved Kjeldahl nitrogen concentrations in Kock Creek and the Northeast Branch increase with suspended-sediment concentration. Linear relations between particulate Kjeldahl nitrogen and suspended sediment (r2 values 0.46 to 0.64) support the hypothesis that soil is an important-source of Kjeldahl nitrogen. Linear relations between dissolved Kjeldahl nitrogen and suspended sediment (r2 values 0.52 to 0.54) suggest that sources of suspended sediment are also sources of dissolved Kjeldahl nitrogen. The proportion of total Kjeldahl nitrogen in the dissolved form shows no relation with suspended-sediment concentration for any of the three streams.
KEFEKENCES
Guy, H. P., 1969, Laboratory theory and methods for sediment analysis, U.S. Geological Survey Techniques of Water-Resources Investigations, Book 5, Chapter Cl, 58 p.
Guy, H. P., and Norman, V. W., 1970, Field methods for measurement of fluvial sediment, U.S. Geological Survey Techniques of Water-Hesources Investigations, Book 2, chapter c2, 59 p.
Hickman, K. E., 1985, Loads of suspended sediment and nutrients from local nonpoint source to the tidal Potomac Kiver and Estuary, Maryland and Virginia, 1979-81 water years - a water quality study of the tidal Potomac Kiver and Estuary, U.S. Geological Survey Open-File &port 84-860, 82 p.
SAS Institute Inc., 1979, SAS user's guide, 1979 edition, Gary, N.C., 494 p. Skougstad, M. W., Fishman, M. J., Friedman, L. C., Erdmann, D. E., and Duncan,
S. S., eds., 1979, Methods for determination of inorganic substances in water and fluvial sediments, U.S. Geological Survey Techniques of Water- Hesources Investigations, Book 5, Chapter Al, 626 p.
8-56
NUTRIENT TRANSPORT BY SEDIMENT FROM PINE FORESTS
By P. D. Duffy, Soil Scientist, USDA-Forest Service, Southern Forest Experi- ment Station, Forest Hydrology Laboratory, Oxford, MS; J. D. Schreiber, Soil Scientist, USDA-Agricultural Research Service, Sedimentation Laboratory, Oxford, MS; and S. J. Ursic, Principal Hydrologist, USDA-Forest Service, Southern Forest Experiment Station, Forest Hydrology Laboratory, Oxford, MS.
ABSTRACT
Sediment transport of phosphorus (P) and nitrogen (N) was quantified fran two small-catchment studies in the uooer Coastal Plain. A studv in north Mississippi included five catchments (1.5 to 2.8 ha) of~undisturbed loblolly (Pinus taeda L.) and slash (Pinus elliottii Engelm.) pine plantations. Of 15 catchmemO. to 0.6 ha) inest Tennessee studv. 4 were undisturbed Dine. 8 clearcut and replanted with pine, and 3 were stripcut with natural . regeneration. Sediment P and N concentrations and yields were related to soil, sediment, and stormflow characteristics. These catchments of pine protect water quality and maintain site productivity by yielding only small amounts of sediment and associated nutrients. However, 40 percent or more of the N and 70 percent or more of the P in stonnflow were transported by sediment, demonstrating the need to maintain low sediment yields.
INTROLWTION
Sediment has a detrimental impact beyond that of degrading physical water quality (turbidity) and filling channels and reservoirs. Sediment increases nutrient loading and can reduce the chemical quality of surface waters. Furthermore, the loss of nutrients is a real concern in areas of eroded, nutrient-deficient soils. This paper describes factors that influence sediment phosphorus (P) and nitrogen (N) transport and the significance of sediment transport fraa forested catchments in the upper Coastal Plain.
PROCEDURES
Catchment Descriptions
Vegetation
Sediment transport of P and N was measured on two groups of catchments, one group near Coffeeville, Mississippi, and the other near Lexington, Tennessee. Five catchments, ranging fran 1.5 to 2.8 ha, at the Coffeeville location have been described in some detail (Duffy et al., 1978; Schreiber et al., 1976; Schreiber et al., 1980; Schreiber and Duffy, 1982; Ursic and Duffy, 1972). Fifteen catchments, ranging fran 0.2 to 0.6 ha, were at the Lexington location (McClurkin et al., 1985). All five catchments at Coffeeville and four of those at Lexington were covered by undisturbed pine plantations that ranged from 29 to 40 years old during the period of study. Most were loblolly pine (Pinus taeda L.), but slash pine (Pinus elliottii Engelm.) occupied portions ofeechments at Coffeeville. Pines were harvested on the remaining Lexington catchments about 5 months before measurements were initiated. On four of those catchments, all pines were cut except for three narrow strips
8-57
left on the contour to trap sediment and to provide seed to regenerate pine on the cut area. One catchment assigned to this treatment was atypical because it yielded large volumes of base flow between storms; therefore, only three catchments were used for these comparisons. Eight catchments were clearcut and replanted with pine; areas of bare soil on four catchments were fertilized and seeded to grass. Harvesting was done carefully to minimize soil disturbances.
Soils
At both locations, loessial silt loam soils (Typic Fragiudalfs, Typic Pal eudults, and Typic Hapludalfs) usually occupied the ridges and upper slopes of the catchments. Loams and sandy loams, developed in Coastal Plain sediments (Typic Paleudults), usually occupied the middle and lower slopes, but in a few cases, the silt loam soils occupied the entire catchment. All catchments had been severely eroded and gullied before the original planting of pines.
Hydrology
Flow from these small catchments normally occurs only during and for a few hours following rainfall and is almost entirely subsurface flow to defined channels (Beasley, 1976). Annual water yield is the sum of the individual stormflows, mostly occurring from December through May. At Coffeeville, the annual stormflow-to-rainfall ratio has been higher for catchments having larger portions of soil with drainage restrictions (Ursic and Duffy, 1972). Annual evapotranspiration is estimated at 89 cm for undisturbed pine plantations in north Mississippi and is probably slightly less in west Tennessee. Long-term mean annual rainfall is 135 cm in north Mississippi and 129 an in west Tennessee. About 40 to 46 cm is available for stormflow and deep-seepage; of this, about 80 percent, 33 to 36 cm, is estimated to be deep-seepage.
Sediment
Variability of sediment concentrations among undisturbed catchments is largely determined by differences in channel characteristics and presence of incompletely healed gullies. For example, at Coffeeville annual discharge-weighted sediment concentrations ranged from 49 mg ~-1 on Coffeeville 1, where channels do not have steep banks, to 228 mg ~-1 on Coffeeville 3, which has steep channel banks and an active gully and headcut (Table 1). Similar examples could be described for the Lexington catchments. Exposed banks are eroded by flows and contribute loose soil materials as a result of drying-wetting cycles and frost heaving. High discharge rates occasionally flush the channels, and these stormflows may produce higher sediment concentrations. Thus, sediment concentration for an individual stormflow is, in part, determined by the accumulation of sediment-producing materials within channels between events. Overall, however, sediment concentrations are independent of stormflow volumes. Consequently, the annual discharge-weighted concentration provides the best estimate of concentration.
8-58
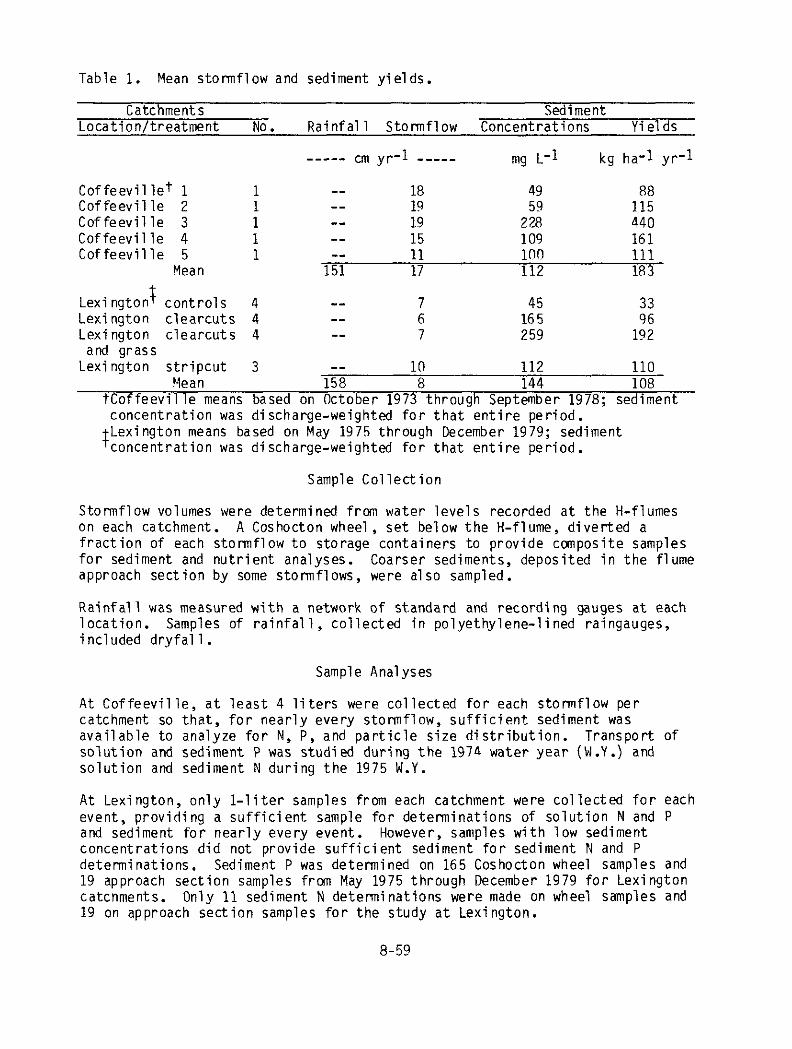
Table 1. Mean stormflow and sediment yields.
Catchments Sediment Location/treatment No. Rainfall Stormflow Concentrations Yields
_____ cm yr-1 _____ mg L-l kg ha-1 yr-1
Coffeevillet 1 1 -- 49 Coffeeville 2 : -- :: 59 17: Coffeeville 3 _- 19 228 440 Coffeeville 4 1 -- 15 109 161 Coffeeville 5 1 -- 11 100 111
Mean 151 17 112 183
T Lexington controls 4 -- 7 33 Lexington clearcuts 4 __ 6 Lexington clearcuts 4 -_ 7 259 19p26
and grass Lexington stripcut 3 -- 10 112 110
Mean 158 8 144 108 Koffeeville means based on October 1973 through September 1978; sediment
concentration was discharge-weighted for that entire period.
4 Lexington means based on May 1975 through December 1979; sediment concentration was discharge-weighted for that entire period.
Sample Collection
Stormflow volumes were determined from water levels recorded at the H-flumes on each catchment. A Coshocton wheel, set below the H-flume, diverted a fraction of each stormflow to storage containers to provide composite samples for sediment and nutrient analyses. Coarser sediments, deposited in the flume approach section by some stormflows, were also sampled.
Rainfall was measured with a network of standard and recording gauges at each location. Samples of rainfall, collected in polyethylene-lined raingauges, included dryfall.
Sample Analyses
At Coffeeville, at least 4 liters were collected for each stormflow per catchment so that, for nearly every stormflow, sufficient sediment was available to analyze for N, P, and particle size distribution. Transport of solution and sediment P was studied during the 1974 water year (W.Y.) and solution and sediment N during the 1975 W.Y.
At Lexington, only l-liter samples from each catchment were collected for each event, providing a sufficient sample for determinations of solution N and P and sediment for nearly every event. However, samples with low sediment concentrations did not provide sufficient sediment for sediment N and P determinations. Sediment P was determined on 165 Coshocton wheel samples and 19 approach section samples fron May 1975 through December 1979 for Lexington catcnments. Only 11 sediment N determinations were made on wheel samples and 19 on approach section samples for the study at Lexington.
8-59
All stormflow and rain samples were passed through 0.45~pm filters to sepa- rate the sediment and solution phases. Total phosphorus (TP) was determined for the sediment and solution phases fran both locations. In addition, organic and inorganic P were determined for Coffeeville sediment samples. Sediment total Kjeldahl nitrogen (TKN) was determined at both locations. Solution TKN was determined for Lexington stormflow and rain samples, while NH4-N and N03-N were determined at Coffeeville. Details on sample handling and analyses have been described in other papers (Duffy et al., 1978; McClurkin et al., 1985; Schreiber et al., 1976; Schreiber et al., 1980).
Data Analyses
Sediment-nutrient concentrations were expressed on a mass basis, in micrograms of nutrient per gram of sediment (pg g-I), and on a volumetric basis, in milligrams of nutrient per liter of stormflow (mg L-I). Sediment-weighted mass concentrations and discharge-weighted volumetric concentrations were computed based on all sediment-nutrient analyses for each catchment. For Coffeeville, weighted nutrient concentrations in the solution and sediment phases were based on samples of nearly every event. For Lexington, solution concentrations were based on nearly all events. Sediment P concentrations were based on determinations fran samples that represented about 50 percent of the total sediment yield for May 1975 through December 1979. However, the percentage varies considerably among the 15 catchments. A weighted sediment P concentration was applied to sediments to estimate total sediment P yields for the Lexington catchments. Because the sediment N concentrations were based on a very small percentage of the sediment yield, sediment N yields were not estimated at Lexington.
Variance among weighted concentrations was analyzed. Sediment-nutrient concentrations and yields were regressed on sediment concentrations and yields and stonflow volumes for individual storms. Tests of significance were made at the 0.05 level.
RESULTS AND DISCUSSION
Sediment
Sediment concentrations for the four undisturbed controls at Lexington and the five undisturbed Coffeeville catchments did not differ. While disturbances associated with flume installation may have elevated concentrations in the first year or two for the Lexington catchments (McClurkin et al., 1985), the total length of drainage channels was greater at Coffeeville. Although the annual discharge-weighted concentrations on harvested catchments seemed higher than on controls, they did not differ significantly. Variability for catchments treated alike was large and due to differences in gullying and length of channels. Within 2 to 3 years after treatments, sediment concentrations from harvested catchments fell below 60 mg L-I (McClurkin et al., 1985), the base line suggested for undisturbed catchments on the upper Coastal Plain (Ursic and Duffy, 1972).
Generally, sediment yields were greater at Coffeeville because of greater stormflow volumes. However, these yields (Table 1) were small canpared to those resulting fran other land uses. Sediment yields from small upper
8-69
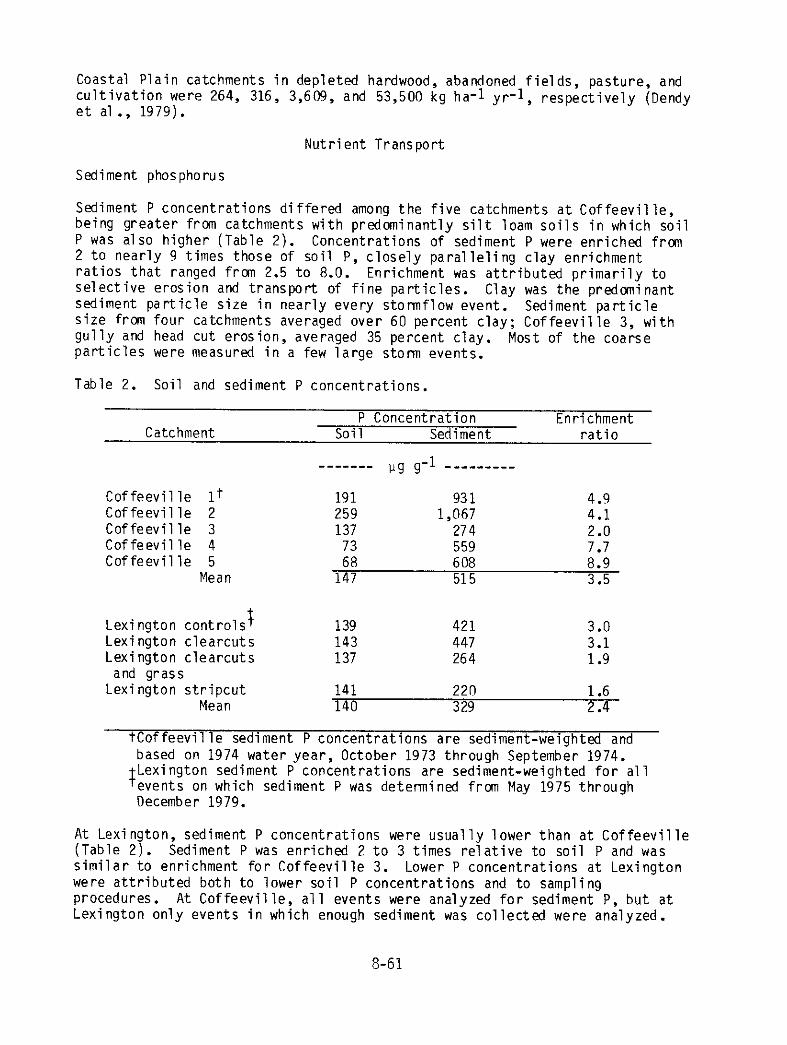
Coastal Plain catchments in depleted hardwood, abandoned fields, pasture, and cultivation were 264, 316, 3,609, and 53,500 kg ha-l yr-1, respectively (Dendy et al., 1979).
Nutrient Transport
Sediment phosphorus
Sediment P concentrations differed among the five catchments at Coffeeville, being greater fran catchments with predominantly silt loam soils in which soil P was also higher (Table 2). Concentrations of sediment P were enriched fran 2 to nearly 9 times those of soil P, closely paralleling clay enrichment ratios that ranged fran 2.5 to 8.0. Enrichment was attributed primarily to selective erosion and transport of fine particles. Clay was the predaninant sediment particle size in nearly every stormflow event. Sediment particle size frcm four catchments averaged over 60 percent clay; Coffeeville 3, with gully and head cut erosion, averaged 35 percent clay. Most of the coarse particles were measured in a few large storm events.
Table 2. Soil and sediment P concentrations.
P Concentration Enrichment Catchment Soil Sediment ratio
------- lig g-l ---__----
Coffeeville lt 191 931 4.9 Coffeeville 2 259 1,067 4.1 Coffeeville 3 137 274 2.0 Coffeeville 4 73 559 Coffeeville 5 68 608 El
Mean 147 515 3.5
Lexington controls 1 139 421 3.0 Lexington clearcuts 143 447 3.1 Lexington clearcuts 137 264 1.9
and grass Lexington stripcut 141 220
Mean 140 329 :::
tcoffeeville sediment P concentrations are sediment-weighted and based on 1974 water year, October 1973 through September 1974.
J Lexington sediment P concentrations are sediment-weighted for all events on which sediment P was determined fran May 1975 through December 1979.
At Lexington, sediment P concentrations were usually lower than at Coffeeville (Table 2). Sediment P was enriched 2 to 3 times relative to soil P and was similar to enrichment for Coffeeville 3. Lower P concentrations at Lexington were attributed both to lower soil P concentrations and to sampling procedures. At Coffeeville, all events were analyzed for sediment P, but at Lexington only events in which enough sediment was collected were analyzed.
8-61
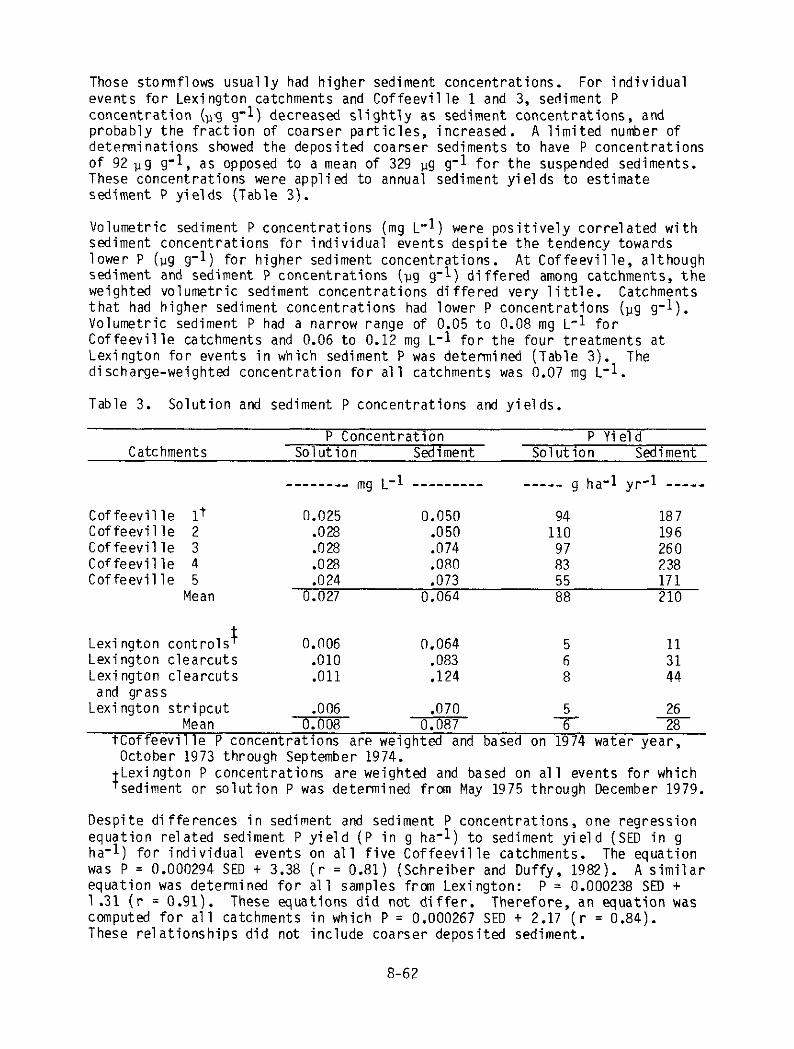
Those stormflows usually had higher sediment concentrations. For individual events for Lexington catchments and Coffeeville 1 and 3, sediment P concentration (U.g g-1) decreased slightly as sediment concentrations, and probably the fraction of coarser particles, increased. A limited number of determinations showed the deposited coarser sediments to have P concentrations of 92pg g-1, as opposed to a mean of 329 pg g-1 for the suspended sediments. These concentrations were applied to annual sediment yields to estimate sediment P yields (Table 3).
Volumetric sediment P concentrations (mg ~-1) were positively correlated with sediment concentrations for individual events despite the tendency towards lower P (pg g-1) for higher sediment concentrations. At Coffeeville, although sediment and sediment P concentrations (pg g-1) differed among catchments, the weighted volumetric sediment concentrations differed very little. Catchments that had higher sediment concentrations had lower P concentrations Volumetric sediment P had a narrow range of 0.05 to 0.08 mg ~-1 for
(pg g-l).
Coffeeville catchments and 0.06 to 0.12 mg ~-1 for the four treatments at Lexington for events in which sediment P was determined (Table 3). The discharge-weighted concentration for all catchments was 0.07 mg ~-1.
Table 3. Solution and sediment P concentrations and yields.
Catchments P Concentration P Yield
Solution Sediment Solution Sediment
--______ mg L-1 __---____ _____ g ha-1 yr-1 -----
Coffeeville It 0.025 0.050 94 187 Coffeeville 2 .028 .050 110 196 Coffeeville 3 .028 .074 97 260 Coffeeville 4 .028 .080 83 238 Coffeeville 5 .024 .073 55 171
Mean 0.027 0.064 88 210
Lexington controls 7 0.006 0.064 5 Lexington clearcuts .OlO ,083 Lexington clearcuts .Oll .124 z 44
and grass Lexington stripcut .006 .070 5
Mean 0.008 0.087 6 2 tcoffeeville P concentrations are weighted and based on 1974 water year,
October 1973 through September 1974.
1 Lexington P concentrations are weighted and based on all events for which sediment or solution P was detenined from May 1975 through December 1979.
Despite differences in sediment and sediment P concentrations, one regression equation related sediment P yield (P in g ha-l) to sediment yield (SED in g ha-l) for individual events on all five Coffeeville catchments. The equation was P = 0.000294 SED + 3.38 (r = 0.81) (Schreiber and Duffy, 1982). A similar equation was determined for all samples fran Lexington: P = 0.000238 SED + 1.31 (r = 0.91). These equations did not differ. Therefore, an equation was computed for all catchments in which P = 0.000267 SED + 2.17 (r = 0.84). These relationships did not include coarser deposited sediment.
8-62
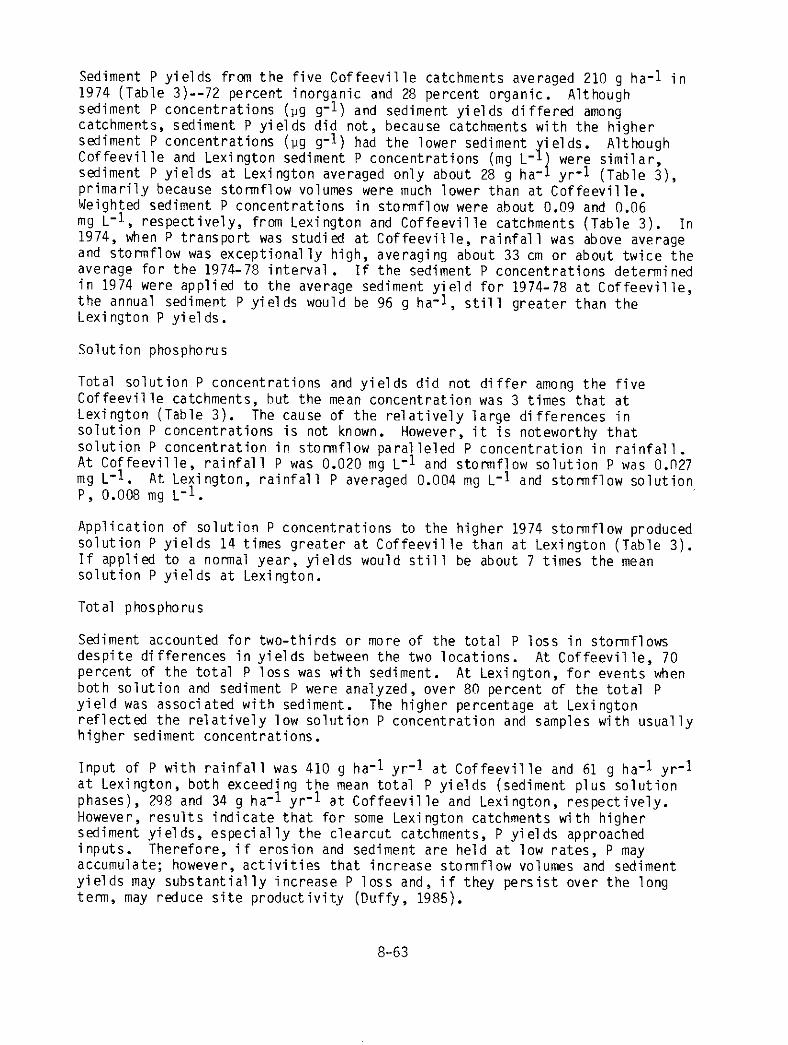
Sediment P yields from the five Coffeeville catchments averaged 210 g ha-l in 1974 (Table 3)--72 percent inorganic and 28 percent organic. Although sediment P concentrations (pg g-1) and sediment yields differed among catchments, sediment P yields did not, because catchments with the higher sediment P concentrations (Pg g-1) had the lower sediment ields. Coffeeville and Lexington sediment P concentrations (mg L-
'1
Although were similar,
sediment P yields at Lexington averaged only about 28 g ha- yr-1 (Table 3), primarily because stormflow volumes were much lower than at Coffeeville. Weighted sediment P concentrations in stormflow were about 0.09 and 0.06 mg L-1, respectively, from Lexington and Coffeeville catchments (Table 3). In 1974, when P transport was studied at Coffeeville, rainfall was above average and stotmflow was exceptionally high, averaging about 33 cm or about twice the average for the 1974-78 interval. If the sediment P concentrations determined in 1974 were applied to the average sediment yield for 1974-78 at Coffeeville, the annual sediment P yields would be 96 g ha-l, still greater than the Lexington P yields.
Solution phosphorus
Total solution P concentrations and yields did not differ among the five Coffeeville catchments, but the mean concentration was 3 times that at Lexington (Table 3). The cause of the relatively large differences in solution P concentrations is not known. However, it is noteworthy that solution P concentration in stormflow paralleled P concentration in rainfall. At Coffeeville, rainfall P was 0.020 mg ~-1 mg L-1.
and stormflow solution P was O.n27 At Lexington,
P, 0.008 mg L-l. rainfall P averaged 0.004 mg ~-1 and stormflow solution
Application of solution P concentrations to the higher 1974 stormflow produced solution P yields 14 times greater at Coffeeville than at Lexington (Table 3). If applied to a normal year, yields would still be about 7 times the mean solution P yields at Lexington.
Total phosphorus
Sediment accounted for two-thirds or more of the total P loss in stormflows despite differences in yields between the two locations. At Coffeeville, 70 percent of the total P loss was with sediment. At Lexington, for events when both solution and sediment P were analyzed, over 80 percent of the total P yield was associated with sediment. The higher percentage at Lexington reflected the relatively low solution P concentration and samples with usually higher sediment concentrations.
Input of P with rainfall was 410 g ha-l yr-1 at Coffeeville and 61 g ha-l yr-1 at Lexington, both exceeding the mean total P yields (sediment plus solution phases), 298 and 34 g ha-1 yr-l at Coffeeville and Lexington, respectively. However, results indicate that for some Lexington catchments with higher sediment yields, especially the clearcut catchments, P yields approached inputs. Therefore, if erosion and sediment are held at low rates, P may accumulate; however, activities that increase stormflow volumes and sediment yields may substantially increase P loss and, if they persist over the long term, may reduce site productivity (Duffy, 1985).
8-63
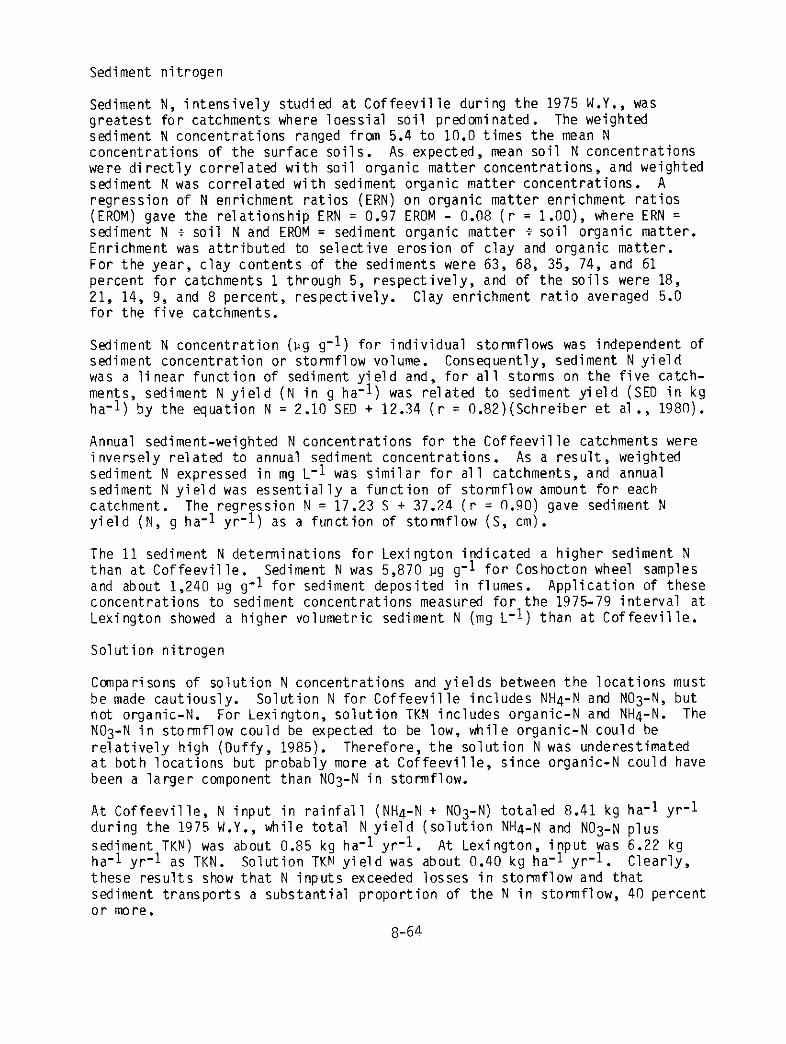
Sediment nitrogen
Sediment N, intensively studied at Coffeeville during the 1975 W.Y., was greatest for catchments where loessial soil predwninated. The weighted sediment N concentrations ranged from 5.4 to 10.0 times the mean N concentrations of the surface soils. As expected, mean soil N concentrations were directly correlated with soil organic matter concentrations, and weighted sediment N was correlated with sediment organic matter concentrations. A regression of N enrichment ratios (ERN) on organic matter enrichment ratios (EROM) gave the relationship ERN = 0.97 EROM - 0.08 (r = l.OO), where ERN = sediment N i soil N and EROM = sediment organic matter i soil organic matter. Enrichment was attributed to selective erosion of clay and organic matter. For the year, clay contents of the sediments were 63, 68, 35, 74, and 61 percent for catchments 1 through 5, respectively, and of the soils were 18, 21, 14, 9, and 8 percent, respectively. Clay enrichment ratio averaged 5.0 for the five catchments.
Sediment N concentration (ng g-l) for individual stormflows was independent of sediment concentration or stormflow volume. Consequently, sediment N yield was a linear function of sediment yield and, for all storms on the five catch- ments, sediment N yield (N in g ha-l) was related to sediment yield (SE0 in kg ha-l) by the equation N = 2.10 SE9 + 12.34 (r = 0.82)(Schreiber et al., 1980).
Annual sediment-weighted N concentrations for the Coffeeville catchments were inversely related to annual sediment concentrations. As a result, weighted sediment N expressed in mg ~-1 was similar for all catchments, and annual sediment N yield was essentially a function of stormflow amount for each catchment. The regression N = 17.23 S t 37.24 (r = 0.90) gave sediment N yield (N, g ha-l yr-1) as a function of stonnflow (S, cm).
The 11 sediment N determinations for Lexington indicated a higher sediment N than at Coffeeville. Sediment N was 5,870 ng g-1 for Coshocton wheel samples and about 1,240 ng g-1 for sediment deposited in flumes. Application of these concentrations to sediment concentrations measured for the 1975-79 interval at Lexington showed a higher volumetric sediment N (mg ~-1) than at Coffeeville.
Solution nitrogen
Ccmparisons of solution N concentrations and yields between the locations must be made cautiously. Solution N for Coffeeville includes NH4-N and N03-N, but not organic-N. For Lexington, solution TKN includes organic-N and NH4-N. The N03-N in stormflow could be expected to be low, while organic-N could be relatively high (Ouffy, 1985). Therefore, the solution N was underestimated at both locations but probably more at Coffeeville, since organic-N could have been a larger component than N03-N in stormflow.
At Coffeeville, N input in rainfall (NH4-N t N03-N) totaled 8.41 kg ha-l yr-l during the 1975 W.Y., while total N yield (solution NH4-N and NO3-N plus sediment TKN) was about 0.85 kg ha-l yr-l. At Lexington, input was 6.22 kg ha-1 yr-1 as TKN. Solution TKN yield was about 0.40 kg ha-l yr-l. Clearly, these results show that N inputs exceeded losses in stormflow and that sediment transports a substantial proportion of the N in stormflow, 40 percent or more.
S-64
SUMMARY AND CONCLUSIONS
This detailed examination of sediment characteristics on small catchments of pine shows that suspended sediment P was enriched fran 2 to 8 times that of soil P. Sediment P concentration in stonflow averaged 0.07 mg ~-1 for all catchments and did not differ among locations or treatments. Application of this concentration to runoff volumes provides estimates of sediment P yields for small pine-covered or carefully harvested catchments of pine in the upper Coastal Plain. Less information was available for sediment N, but similar conclusions are likely. Total transport of both sediment and solution forms of N and P was less than the input with rain, suggesting that pine plantations protect water quality and improve site productivity by accumulating N and P.
The results demonstrate the significant role of sediment in nutrient transport. Sediment P losses were at least twice the solution P losses, and sediment N losses about equaled solution N losses. Forestry activities that substantially increase erosion and sediment yields could reduce both water quality and site productivity.
REFERENCES
Beasley, R. S., 1976, Contribution of Subsurface Flow from the Slopes of Forested Watersheds to Channel Flow, Soil Sci. Sot. Am. J. 40(6): 955-957.
Dendy, F. E., Ursic, S. J., and Bowie, A. J., 1979, Sediment Sources and Yields fran Upland Watersheds in North Mississippi, p. 49-54, In: Proc., Mississippi Water Resour. Conf., State Univ.,
Jackson, MS, Sept. 24-25, 1979, Mississippi Mississippi State, MS.
Duffy, Paul D., 1985, Nutrient Gains and Losses for Loblolly Pine Plantations, p. 42-54, In: Blackman, B. G., ed., Proc., Mid-South Symp.,
Forestry and Water Quality: A Little Rock, AR, May 8-9, 1985, Univ. of Arkansas.
Duffy, P. D., Schreiber, J. D., McClurkin, D. C., and McDowell, L. L., 1978, Aqueous- and Sediment-Phase Phosphorus Yields from Five Southern Pine Watersheds, J. Environ. Qual. 7(l): 45-50.
McClurkin, D. C., Duffy, P. D., Ursic, S. J., and Nelson, N. S., 1985, Water Quality Effects of Clearcutting Upper Coastal Plain Loblolly Pine Plantations , J. Environ. Qual. 14(3): 329-332.
Schreiber, J. D., and Duffy, P. D., 1982, Sediment and Nutrient Transport from Pine Watersheds of the United States Southern Coastal Plain, p. 725-734, In: Hydrological Research Basins and their Use in Water Resources Planning, Sonderh, Landeshydrologie, Bern, Switzerland.
Schreiber, J. D., Duffy, P. D., and McClurkin, 0. C., 1976, Dissolved Nutrient Losses in Storm Runoff from Five Southern Pine Watersheds, J. Environ. Qual. 5(2): 201-205.
Schreiber, J. D., Duffy, P. D., and McClurkin, D. C., 1980, Aqueous- and Sediment-Phase Nitrogen Yields fran Five Southern Pine Watersheds, Soil Sci. Sot. Pm. J. 44(2): 401-407.
Ursic, S. J., and Duffy, P. D., 1972, Hydrologic Performance of Eroded Lands Stabilized with Pine, p. 203-216, In: Proc., Mississippi Water Resour. Conf., Jackson, MS, Apr. 11-12, 1972, Mississippi State Univ., Mississippi State, MS.
8-65
WATER QUALITY IHPACTS FROH SEDMENT IN THE SOUTHEAST
By Alfred H. Duda, Environmental Scientist, Environmental Quality Staff, Tennessee Valley Authority, Knoxville, Tennessee
ABSTRACT
The significance of water quality, aquatic biological, and economic damage from excessive sediment loading is examined in different physiographic areas of North Carolina and Tennessee. Investigations show sediment to be the primary water quality problem facing the two States, with widespread use impairment of waters in agricultural, mining, and urban areas. Suspended sediment yields range from S-10 metric tons (mt)/km2/yr in forested watersheds to 370 and 850 mt/km2/yeac in some agricultural and coal mined areas, respectively. Economic and public safety impacts occur as well, ranging from increased flooding, extensive dredging cequire- ments, decreased agricultural productivity, and filling of reservoirs to actual loss of human life associated with bridge collapses on unstable, channelized watec- ways. Impediments to achieving Clean Water Act goals include: the accelerated drainage and conversion of wetlands to cropland; failure to enact, enforce, or fund programs for soil erosion and nonpoint pollution control; lack of targeting of resources to the “hot spots” of sediment production; “loopholes” in Federal and State regulatory requirements; and increased storm runoff from mining, urban, and agricultural areas. Major policy changes in existing Federal and State programs and establishment of new programs (emphasizing the integration of land and water management, nonpoint pollution control, and rehabilitation of problem watersheds) are needed if sediment-related nonpoint pollution problems are to be remedied and billions of dollars in adverse economic impacts are to be reduced.
INTRODUCTION
It is now clear that the water quality goals set for our Nation by Congress will not be achieved without a major emphasis on the control of nonpoint source pollu- tion. Especially in the case of the most widespread nonpoint pollution problem, excessive loadings of sediment, significant environmental and economic damage is being caused across the country. In a national survey of fisheries conducted for the Environmental Protection Agency (EPA), poor water quality was found to be adversely affecting fish communities in almost 60 percent of the Nation’s waters (Judy, et al., 1984). The primacy cause of this damage was excessive levels of sediment or turbidity, with three times more miles being degraded by sediment than by point source discharges.
Significant economic damage is associated with these excessive levels of sediment in waterways, with estimates of over $6 billion in off-site damages being caused each year (Clark, et al., 1985). Despite such significant adverse environmental and economic impacts, many billions of dollars continue to be spent on the con- trol of point source discharges while the larger problem of nonpoint pollution is essentially ignored. The longer the Nation waits to establish effective programs for controlling sediment, the greater will be the extent of permanent damage and the more costly remedial actions will become for future generations. In order to provide a basis for addressing policy issues related to this subject, the following sections examine water quality, aquatic biological, and economic damage from sedi- ment in the Southeast.
8-66
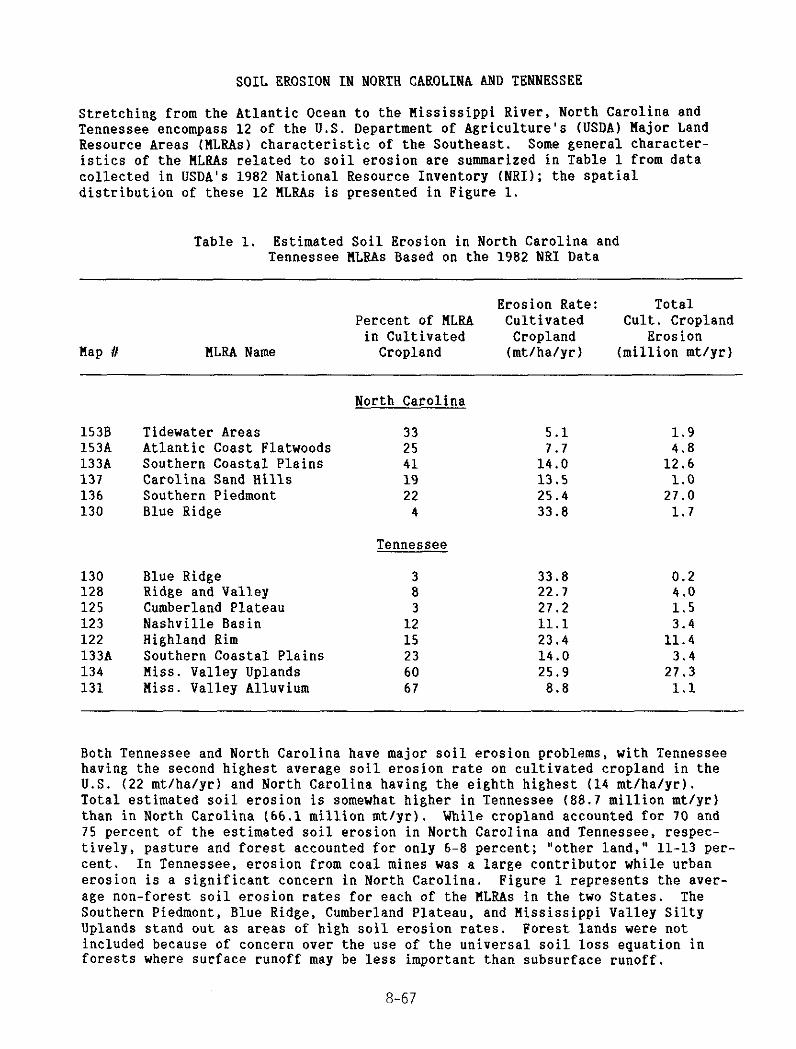
SOIL EROSION IN NORTH CAROLINA AND TENNESSEE
Stretching from the Atlantic Ocean to the Mississippi River, North Carolina and Tennessee encompass 12 of the U.S. Department of Agriculture’s (USDA) Major Land Resource Areas (HLRAs) characteristic of the Southeast. Some general character- istics of the HLRAs related to soil erosion are summarized in Table 1 from data collected in USDA’s 1982 National Resource Inventory (NRI); the spatial distribution of these 12 EL8As is presented in Figure 1.
Table 1. Estimated Soil Erosion in North Carolina and Tennessee ELRAs Based on the 1982 NRI Data
Hap # HLRA Name
Erosion Rate: Total Percent of EL8A Cultivated Cult. Cropland
in Cultivated Cropland Erosion Cropland (mtlha/yr) (million mt/yr)
153B Tidewater Areas 33 5.1 1.9 153A Atlantic Coast Flatwoods 25 7.7 4.8 133A Southern Coastal Plains 41 14.0 12.6 137 Carolina Sand Hills 19 13.5 1.0 136 Southern Piedmont 22 25.4 27.0 130 Blue Ridge 4 33.8 1.7
130 Blue Ridge 3 33.8 0.2 128 Ridge and Valley 8 22.1 4.0 125 Cumberland Plateau 3 27.2 1.5 123 Nashville Basin 12 11.1 3.4 122 Highland Rim 15 23.4 11.4 133A Southern Coastal Plains 23 14.0 3.4 134 Hiss. Valley Uplands 60 25.9 27.3 131 Hiss. Valley Alluvium 67 8.8 1.1
North Carolina
Tennessee
Both Tennessee and North Carolina have major soil erosion problems, with Tennessee having the second highest average soil erosion rate on cultivated cropland in the U.S. (22 mt/ha/yr) and North Carolina having the eighth highest (14 mt/ha/yr). Total estimated soil erosion is somewhat higher in Tennessee (88.7 million mt/yr) than in North Carolina (66.1 million mtlyr). While cropland accounted for 70 and 75 percent of the estimated soil erosion in North Carolina and Tennessee, respec- tively, pasture and forest accounted for only 6-8 percent; “other land,” 11-13 per- cent. In Tennessee, erosion from coal mines was a large contributor while urban erosion is a significant concern in North Carolina. Figure 1 represents the aver- age non-forest soil erosion rates for each of the l4LRAs in the two States. The Southern Piedmont, Blue Ridge, Cumberland Plateau, and Hississippi Valley Silty Uplands stand out as areas of high soil erosion rates. Forest lands were not included because of concern over the use of the universal soil loss equation in forests where surface runoff may be less important than subsurface runoff,
8-67
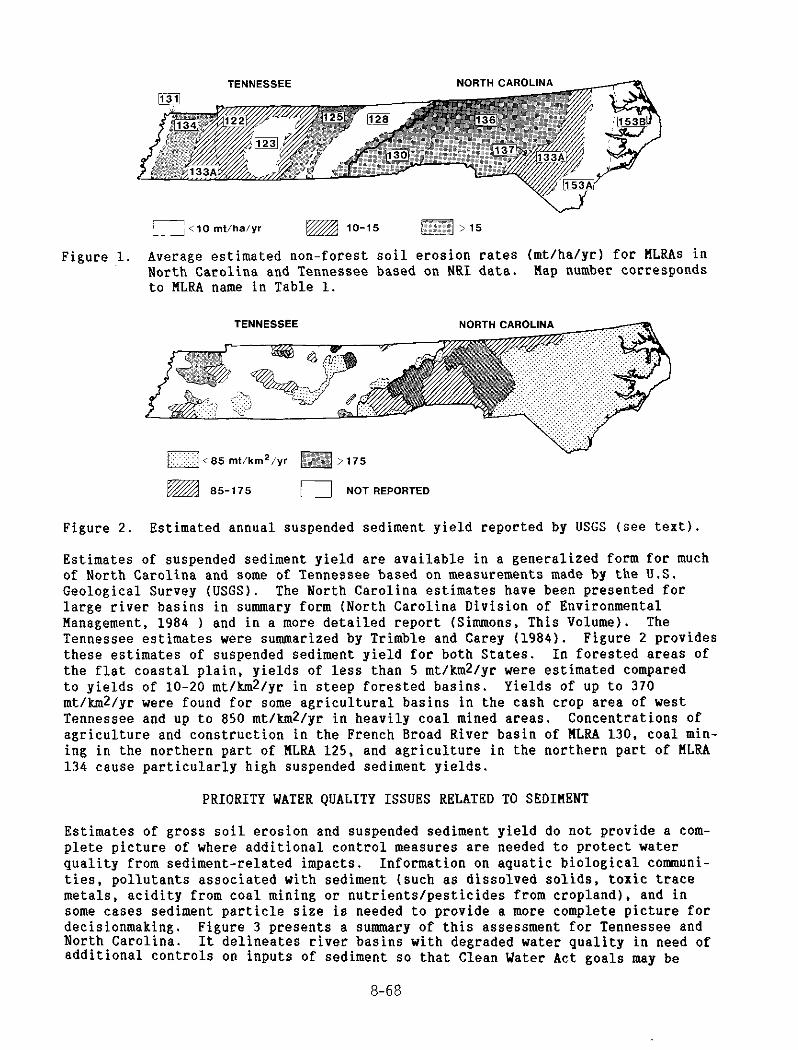
E <,o mt/lla/yr m IO-15 > 15
Figure 1. Average estimated non-forest soil erosion rates (mt/ha/yr) for HLRAs in North Carolina and Tennessee based on NRI data. Rap number corresponds to HLRA name in Table 1.
TENNESSEE NORTH CAROLINA
m 85-175 j NOT REPORTED
Figure 2. Estimated annual suspended sediment yield reported by USGS (see text).
Estimates of suspended sediment yield are available in a generalized form for much of North Carolina and some of Tennessee based on measurements made by the U.S. Geological Survey (USGS). The North Carolina estimates have been presented for large river basins in summary form (North Carolina Division of Environmental Management, 1984 ) and in a more detailed report (Simmons, This Volume). The Tennessee estimates were summarized by Trimble and Carey (1984). Figure 2 provides these estimates of suspended sediment yield for both States. In forested areas of the flat coastal plain, yields of less than 5 mt/km2/yr were estimated compared to yields of lo-20 mt/km2/yr in steep forested basins. Yields of up to 370 mt/km2/yr were found for some agricultural basins in the cash crop area of west Tennessee and up to 850 mt/km2/yr in heavily coal mined areas. Concentrations of agriculture and construction in the French Broad River basin of RLRA 130, coal min- ing in the northern part of BLRA 125, and agriculture in the northern part of HLRA 134 cause particularly high suspended sediment yields.
PRIORITY WATER QUALITY ISSUES RELATED TO SEDIHENT
Estimates of gross soil erosion and suspended sediment yield do not provide a com- plete picture of where additional control measures are needed to protect water quality from sediment-related impacts. Information on aquatic biological communi- ties, pollutants associated with sediment (such as dissolved solids, toxic trace metals, acidity from coal mining or nutrients/pesticides from cropland), and in some cases sediment particle size is needed to provide a more complete picture for decisionmaking. Figure 3 presents a summary of this assessment for Tennessee and North Carolina. It delineates river basins with degraded water quality in need of additional controls on inputs of sediment so that Clean Water Act goals may be
8-68
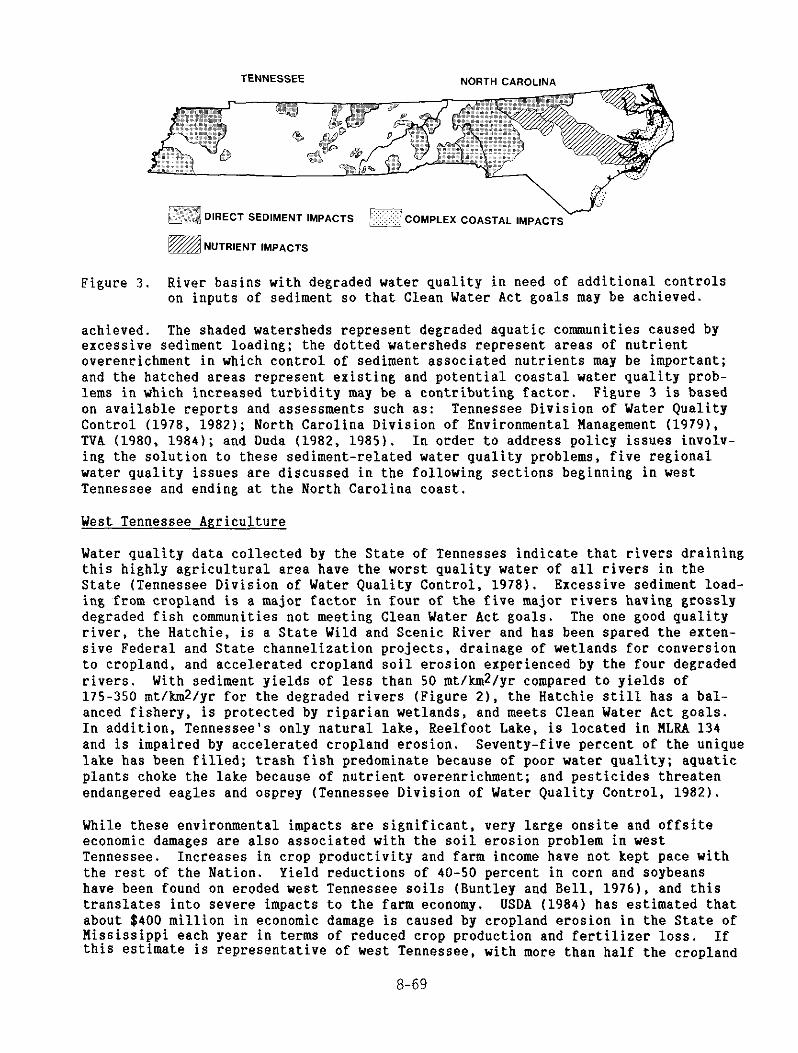
TENNESSEE NORTH CAROLlN
DIRECT SEDIMENT IMPACTS k.-.@
zs COMPLEX COASTAL ,,,,PACTS
NUTRIENT IMPACTS
Figure 3. River basins with degraded water quality in need of additional controls on inputs of sediment so that Clean Water Act goals may be achieved.
achieved. The shaded watersheds represent degraded aquatic communities caused by excessive sediment loading; the dotted watersheds represent areas of nutrient overenrichment in which control of sediment associated nutrients may be important; and the hatched areas represent existing and potential coastal water quality pcob- lems in which increased turbidity may be a contributing factor. Figure 3 is based on available reports and assessments such as: Tennessee Division of Water Quality Control (1978, 1982); North Carolina Division of Environmental Management (1979), TVA (1980, 1984); and Duda (1982, 1985). In order to address policy issues involv- ing the solution to these sediment-related water quality problems, five regional water quality issues ace discussed in the following sections beginning in west Tennessee and ending at the North Carolina coast.
West Tennessee Agriculture
Water quality data collected by the State of Tennesses indicate that rivers draining this highly agricultural area have the worst quality water of all rivers in the State (Tennessee Division of Water Quality Control, 1978). Excessive sediment load- ing ~from cropland is a major factor in four of the five major rivers having grossly degraded fish communities not meeting Clean Water Act goals. The one good quality river, the Hatchie, is a State Wild and Scenic River and has been spaced the exten- sive Federal and State channelization projects, drainage of wetlands for conversion to cropland, and accelerated cropland soil erosion experienced by the four degraded rivers. With sediment yields of less than 50 mt/km2/yr compared to yields of 175-350 mt/km2/yr for the degraded rivers (Figure 2), the Hatchie still has a bal- anced fishery, is protected by riparian wetlands, and meets Clean Water Act goals. In addition, Tennessee’s only natural lake, Reelfoot Lake, is located in I4LRA 134 and is impaired by accelerated cropland erosion. Seventy-five percent of the unique lake has been filled; trash fish predominate because of poor water quality; aquatic plants choke the lake because of nutrient overenrichment; and pesticides threaten endangered eagles and osprey (Tennessee Division of Water Quality Control, 1982).
While these environmental impacts ace significant, very large onsite and offsite economic damages ace also associated with the soil erosion problem in west Tennessee. Increases in crop productivity and farm income have not kept pace with the rest of the Nation. Yield reductions of 40-50 percent in corn and soybeans have been found on eroded west Tennessee soils (Buntley and Bell, 1976), and this translates into severe impacts to the farm economy. USDA (1984) has estimated that about $400 million in economic damage is caused by cropland erosion in the State of Hississippi each year in terms of reduced crop production and fertilizer loss. If this estimate is representative of west Tennessee, with more than half the cropland
8-69
erosion of all Mississippi and the same HLRAs, onsite economic damages would exceed $200 million/year. Offsite impacts are also extensive. In just the Obion and Forked Deer River basins, a conservative $74 million in damages (1974 dollars) is estimated to occur each year by USDA (19801. Upland cropland erosion averaging 99 mt/ha/yr has filled channelized rivers, raised water tables, increased floods, killed over 11,000 hectares of bottomland forests, and caused extensive damage to cropland, bridges, and forests. With the Federal share of soil conservation needs estimated at $100 million, with almost $300 million needed if flood control mea- sures are to be implemented (USDA, 19801, and with an ultimate cost of perhaps $100 million for a massive channel improvement project proposed by the U.S. Army Corps of Engineers (USACE), fixing the sediment-related problems of this area will contribute substantially to the Federal deficit.
Several impediments seem to stand in the way of achieving water quality goals in west Tennessee: (1) large scale channel instabilities and increased flooding from channel alterations, (2) government subsidies for drainage and conversion of wet- lands (tax code advantages, Federal agricultural policies, Federal and State chan- nel excavation projects), and (3) lack of wetland protection and water quality improvement requirements. In particular, changes in river gradient and increased flood flows from converted wetlands and channel modifications have accelerated bank erosion. This has not only increased sediment loading, but it has resulted in nine costly bridge failures involving six fatalities in west Tennessee the last decade (Hansur, 1983). Some landowners have lost valuable cropland as quiet, meandering channels a dozen meters wide have created hazards to public safety to a hundred meters in width. USGS attributes these bridge failures to channel alterations, and additional structures are threatened (Robbins and Simon, 1983). Permanent damage has likely occurred because the flow regime has been so drastically altered and channel erosion is not being adequately addressed.
Coal Ffining in Appalachia
Coal has been mined in most of the 22 counties in HLRA 125 for decades. Erosion from active mines, as well as abandoned mined land, contributes sediment and related pollutants (acidity and toxic metals) to Tennessee’s waters and is reported to degrade over 1,800 km of streams and rivers (Tennessee Division of Water Quality Control, 1978; TVA, 1980; 19841. FIany of the polluted waters delineated in Figure 3 for HLRA 125 were reported to be essentially devoid of significant aquatic life. These impacts extend far downstream from the coal mining, creating interstate pollu- tion problems and degraded water quality in TVA or USACE reservoirs. Up to 200-fold increases in sediment yield for small basins--but more commonly 40 fold increases in larger basins--have been found by the USGS in mined basins compared to forested watersheds in Tennessee (Osterkamp, et al., 19841. Large increases in peak flows were found by USGS to accompany the mining, and extensive channel widening from these flood flows increases sediment transport.
Once again, not only environmental damage but substantial threats to public health/safety and costly economic damages continue to occur in coal-mined areas. Degraded quality drinking water, filled-in water supplies, extra water treatment costs, and the need for alterantive water sources has been reported by the State of Tennessee--requiring up to $1.5 million to fix the damage (Tennessee Division of Water Quality Control, 1978). Of even more concern is the increased flooding that endangers lives and property downstream of mined areas. The buildup of debris and sediment in conjunction with the increase in peak storm flows have created the need for costly TVA and USACE channelization projects in some communities to protect human life; and periodic cleanouts have cost hundreds of thousands of dollars. In one town , a million dollars was expended on emergency relief to excavate deposits
a-70
from the waterway, over a million dollars has been spent on studies, and perhaps a million more will be needed for mined land reclamation.
With passage of the 1977 Federal surface mining act, the assumption has been that such sediment-related water quality and public health/safety problems have been solved. Unfortunately, several impediments to resolution of these problems exist: (1) regulations for protecting environmental quality and controlling sediment under the 1977 Federal law were weakened in the early 198Os, (2) concerns exist regarding whether sufficient enforcement of the law is taking place, and (3) the reclamation fund under Title IV of the law is inadequate and reclamation of abandoned lands affecting water quality and flooding is proceeding quite slowly. Of great concern are sweeping changes in the regulations made in the early 1980s that weakened pco- visions for controlling sediment and associated pollutants from coal mining. osn abandoned design criteria for nebulous performance standards (meaningless when per- formance is to be judged on compliance with water quality standards for constituents that most States have no standards for) and EPA relaxed effluent limits for sediment control ponds. Coupled with loopholes such as the “two acre” exemption from envi- ronmental protection requirements and existing haul roads being exempt from sediment control requirements, increases in muddy water have likely resulted in the coal- fields. In fact, some of the requirements are less stringent than those used by TVA in the 1960s as part of its coal purchase contracts prior to the Federal law.
There also seems to be a lack of information on whether Clean Water Act goals are really being achieved downstream of active mines. An examination of data from Illinois found that even with the old regulations, data collected by mining operat- ors were not adequate for making conclusions regarding effectiveness in protecting water quality (Lee and Terstriep, 1983). In addition, concerns exist about lax enforcement attitudes and a lack of resources being devoted by States to enforce mining laws--problems that can be brought about by interest group pressure. States may not have been ready to assume primacy from 0%. Indeed, Tennessee was one such State, and primacy was withdrawn in 1984 after an OSH (1983) analysis concluded that a lack of staff, inadequate setting of bonds, inadequate inspections, and inade- quate enforcement rendered the program ineffective. Coupled with OSR’s failure to collect hundreds of millions of dollars in enforcement penalties (identified in a lawsuit brought by a Tennessee public interest group), a case could be made that environmental protection is not a priority in the coalfields.
The greatest impediment, however, is the lack of a sufficient tax on coal production to provide enough funds for the Title IV abandoned mined land reclamation program. In Tennessee, only about 240 of thousands of hectares of abandoned lands have been reclaimed under Title IV since 1977. It is clear that water quality goals will not be met anytime soon in the coalfields, and potentially permanent damage may result from delays in establishing sufficient sediment control programs.
Mountain Develoument
The Blue Ridge, with its high mountains and magnificent forests, forms the boundary between the two States. Waters draining forested watersheds are of high quality in the RLRA. However, the rural, agricultural character of the region has changed the last decade with a boom in cons~truction activities associated with vacation homes and resorts on steep slopes. Water quality damage from excessive sediment loading in the Blue Ridge is identified as a priority problem because the trout and small- mouth bass waters are very sensitive to sediment inputs, and significent damage is occurring. Some long-standing sediment problems are also present related to agricultural soil erosion and sediment loading from feldspar, mica, and kaolin mining in western North Carolina. As noted by Duda (1985). 200-fold increases in suspended sediment concentrations--up to 15,000 mg/l--occurred downstream of active
8-71
mining operations during storm events, trout and smallmouth bass populations were degraded in 200 km of rivers in both States, and municipal water supply intakes were periodically clogged. In addition, the sediment has filled a TVA hydropower reservoir to the point that it has been abandoned for electric power generation, at a cost of millions of dollars to replace the lost power. The priority problem areas, as identified by State and Federal water quality agencies (North Carolina Division of Environmental Management, 1979; TVA, 1984; Duda, 1985) are delineated in Figure 3.
Heavy loading of sediment from road, resort, and home construction is the greatest threat to these sensitive waters, and fish and aquatic life have become impaired (North Carolina Division of Environmental Fianagement, 1979). Tennessee has no State erosion control legislation, while North Carolina has had a law since 1973. The erosion control program in North Carolina certainly helps to reduce sediment loading, but an analysis conducted by the State water quality agency found that the program was not meeting its potential to protect water quality because of poor enforcement, lack of staffing, and loopholes in the legislation (N.C. Division of Environmental Ranagement, 19791. The situation has worsened in the 1980s as con- struction of vacation and retirement communities has burgeoned, and area citizen groups have become vocal. The major impediments to achieving Clean Water Act goals in HLRA 130 seem to be institutional: lack of construction-related erosion control legislation in Tennessee, lack of effective enforcement of North Carolina’s con- struction erosion control and mining erosion control laws to protect water quality, and lack of a water quality oriented program to ensure that the agricultural sector employs nonpoint pollution control measures.
Piedmont Sedimentation
The sediment-laden waters of Piedmont HLRA 136 used to be much clearer in the 1800s before poor agricultural practices resulted in serious erosion of clay soils which impaired productivity of the land as well as water quality (Duda, et al., 19801. Agriculture remains the major source of muddy water in the Piedmont, although urban- ization provides significant sediment inputs. As reported in the North Carolina Water Quality idanagement Plan (N.C. Division of Environmental Hanagement, 1979), numerous rivers of the Piedmont have degraded fisheries populations because of sedi- ment inputs, and the most degraded watersheds are delineated in Figure 3. In addi- tion, eutrophication has become a major concern in several Piedmont and Coastal Plain river basins, as noted in Figure 3, and control of soil erosion is being used as a way of addressing nutrients which may move with eroded soils.
While effective programs for controlling agricultural and construction-related inputs of sediment are needed, another significant source of sediment seems to be streambank erosion downstream of urban areas. As described by Duda, et al. (19801, large increases in peak flows from urban areas compared to rural watersheds have caused accelerated flooding and streambank erosion, with urban streams in HLRA 136 being 3-6 times wider than rural ones of the same drainage area and having up to a ten-fold increase in cross-sectional area. As noted by the investigators, this problem was first publicized in urban areas of Ilaryland and Virginia and has caused damage to roads, riparian buildings, sewer lines, etc. in North Carolina. Expen- sive taxpayer supported programs have been enacted to stabilize these channels, with projects costing up to $lOO,OOO/km in RLRA 136 (Duda, et al., 1980). The 1973 Sedimentation Pollution Control Act in North Carolina contains a provision that could require urban stormwater management controls to protect downstream channels, reduce flooding, and reduce sediment transport. Unlike the Hacyland situation, this provision in North Carolina’s law was not implemented to protect downstream banks from erosion or to reduce urban flooding, and Tennessee does not have such legislation.
8-72
As noted in the North Carolina Water Quality Management Plan, a certain geological area of the Piedmont known as the “Slate Belt” (fine-grained metamorphic rocks such as phyllites) did not seem to have the serious aquatic biological impacts in agri- cultural watersheds that were found in similar areas of the Piedmont with acid igneous, coarse grained rocks and soils. One hypothesis explaining this might be as follows: Once eroded, the sand fractions of soils in the acid igneous Piedmont are not transported downstream as easily as the fine-grained soils of the “Slate Belt.” Consequently, aquatic communities are more disrupted (damaged) in the agri- cultural watersheds with sandy bedload, and higher gradient reaches can be degraded than in areas with fine-grained soils. The author suspects a similar phenomena to be occurring in the Tennessee Highland Rim and Nashville Basin HLRAs with their fine-grained soils. Huch agricultural erosion is taking place in certain basins, but fisheries are not reported to be degraded.
Coastal Wetland Conversion
The most intensively farmed areas of North Carolina are located in BLRAs 1338, 153A, and 153B in close proximity to sensitive estuacine waters. Loss of valuable nutri- ent and sediment-trapping wetlands has been severe with about 70 percent of cropland in the 17 coastal counties estimated to have been artificially drained (Duda, 1982). The channel alterations, conversion of wetlands to cropland, and lack of nonpoint pollution control measures have resulted in large increases in sediment and nutrient transport to coastal waters. Duda (1982) presented an analysis of data at six USGS gaging stations which demonstrated that ten-fold increases in suspended sediment transport occur in both small and large (500 km2) agricultural watersheds with extensive channel alterations compared to similar basins with intact riparian wet- lands. He also cited investigations of several dozen watersheds in these BLRAs with channel modifications which showed 90 percent reductions in game fish populations and no significant recovery even after 40 years. “Fishable” goals of the Clean Water Act are not being met in these turbid watersheds which have undergone publicly funded USDA PL. 566 and USACE flood control projects and subsequent agricultural development of wetlands.
Large corporate farms (up to 145,000 ha) have been developed in wet soils and swamps of eastern North Carolina near estuarine waters and proposals have been made for large-scale peat mining operations with reclamation consisting of conversion to cropland. State-funded research has found lo-20 fold increases in turbidity during storm events in estuarine waters draining these corporate “superfarms” compared to adjacent waters (Kirby-Smith and Barber, 1979). As noted by Duda (1982). very serious water quality problems are plaguing North Carolina coastal waters and many seem related to agricultural development: entire bays no longer support oysters (likely associated with 3-5 fold increases in peak stormflows from wetlands con- verted to agriculture as salinity is decreased and turbidity/siltation is increased); large kills of finfish and shellfish and reductions in fisheries seem to be associated with increased eutrophication and greater loadings of nutrients (some associated with eroded soils); shellfish waters are closed because of excessive amounts of bacteria (from eroded soils, livestock, and subsequent housing developments); and sensitive shrimp, oyster, finfish nursery areas, and submerged aquatic vegetation are threatened by degraded water quality, shading from increased turbidity, and siltation. During the last 30 years, increases in sediment transport (turbidity and siltation), as well as associated nutrients, have been implicated by EPA as the cause of the serious decline of Chesapeake Bay (Kemp, et al., 1984). Similar problems currently exist in portions of coastal North Carolina and will become more widespread if effective nonpoint pollution abatement programs are not implemented.
8-73

CONCLUSIONS
Very significant water quality, aquatic biological, and economic impacts are being caused by sediment and associated pollutants in mining, agricultural, and urban areas of the Southeast. Aquatic life has been degraded in many waters to the point that Clean Water Act goals for protecting balanced fisheries are not being met. In fact, these degraded fish populations are quite similar to the rough fish popula- tions caused by improperly treated point source discharges: rivers supporting bal- anced populations of bass and bream or trout become dominated by suckers or carp and minnows. In addition, extensive economic damage associated with accelerated soil loss and sediment loading is causing a significant drain on the Nation’s economy, with over $6 billion estimated in annual offsite damages and untold billions more in onsite impacts--especially to agriculture. Water quality impacts not withstanding, it makes sound fiscal sense to cost-effectively reduce sediment inputs rather than to continue spending billions of dollars in treating symptoms of sediment problems.
One thread common to most of these sediment-related problems is an increase in peak flows which results in flooding. Compared to natural conditions, these increases of 3- to S-fold in peak flows from flat coastal cropland to lo-fold increases from some urban areas and cropland in sloping loess hill areas (Piest, et al., 1976) have resulted in an increase in channel erosion, a greater hazard to public safety, and property damage associated with flooding. We will not solve the water quality prob- lems related to sediment until we address the flooding problem by using sound land management practices to control peak flow rates and soil erosion. We know that non- point pollution control measures reduce peak flows and control sediment loading. In the Piedmont, the State of North Carolina used the paired-watershed approach to demonstrate 98 percent decreases in sediment loading, 90 percent reductions in nutrient loading, and effective attenuation of peak flows from an agricultural watershed with nonpoint control measures compared to one without them (Atkins, 1982). Greater infiltration of water meant greater crop yields and smaller losses of nutrients. We also know that some of these sound management practices can be effective even during loo-year storm events in reducing sediment yield and peak flows (Hacrold and Edwards, 1972). What has been missing is the will to establish integrated land management and water quality/quantity management programs to address the related sediment and flooding problems.
Other institutional impediments exist to achieving effective control of sediment inputs and meeting water quality goals. They range from Federal agricultural poli- cies and government-subsidized wetland drainage projects to lack of enforcement/ loopholes in programs for controlling sediment inputs (from mining, construction, urbanization, or channel modifications1 and the lack of a national program cequic- ing implementation of nonpoint pollution control measures. These impediments must be overcome. Unfortunately, sediment problems will not disappear from some waters even after decades following cleanup. Higher gradient reaches will recover more quickly; lower gradient ones, less quickly. If our Nation’s waters are to meet Clean Water Act goals, an effective watershed rehabilitation program is needed to remedy the accumulation of sediment in channel systems, control peak storm flows through sound land management, and restore fisheries populations. The longer we wait to establish an integrated approach to land and water management, the more extensive will be the environmental and economic damage, the greater will be the extent of essentially permanent damage related to sediment and associated pollut- ants, and the more costly it will be for future generations to clean the polluted waters we leave them.
8-74
REFERENCES
Atkins, J. B., 1984, Agricultural Nonpoint Source Control Case Studies in North Carolina. North Carolina State Universitv. Raleigh. NC.
Buntley, G. J., and F. H. Bell, 1976, Yield.Estimaies for Major Crops Grown on Soils of West Tennessee, Bull _. 561, Tenn. Agric. Exp. Sta., Knoxville, TN.
Clack, E. i-i. II, et al., 1985, Eroding Soils: The Off-Farm Impacts, Conservation Foundation, Washington, D.C.
Duda, A. H., 1982, Municipal Point Source and Agricultural Nonpoint Source Contributions to Coastal Eutrophication, Water Res. Bulletin 18: 397-407.
Duda, A. H., 1985, Point and Nonpoint Source Abatement Needs for Improving Interstate Water Quality, Proceedings Symposium on Options for Achieving Water Quality Goals, American Water Res. Assn., Bethesda, MD., pp. 97-106.
Duda, A. H., et al., 1980, Susceptibility of Piedmont Stceambanbs to Erosion from Urban Storm Runoff, Proceedings of International Symposium on Urban Storm Runoff, University of Kentucky, Lexington, KY, pp. 211-218.
Harrold, L. L., and W. I!. Edwards, 1972, A Severe Rainstorm Test of No-Till Corn, Journal of Soil and Water Conservation, 27: 30.
Judy, R. D., et al., 1984, 1982 National Fisheries Survey, Vol. 1, Technical Report, U.S. Fish and Wildlife Service, FWSIOBS-84/06, Washington, D.C.
Kirby-Smith, W. W., and R. T. Barber, 1979, Water quality Ramifications in Estuaries of Converting Forest to Intensive Agriculture, Report #148, NC. Water Res. Institute, Raleigh, NC.
Kemp, W. Ii., et al., 1984, Submerged Aquatic Vegetation in Upper Chesapeake Bay: Studies Related to Possible Causes of the Recent Decline, EPA 600/3-84-015, EPA, Washington, D.C.
Lee, H. T., and H. L. Terstriep, 1983, Evaluation of Existing Data on Discharges from Active Coal nines in Illinois, Proceedings of 1983 Symposium on Surface Mining, Hydrology, and Sedimentology, Univ. of Kentucky, Lexington, KY, 331-335.
Wansur, M., 1983. Stream Work Heans Flood Expenses for Bridge Repair, Memphis Press-Scimitar, June 16, 1983, p. 1.
North Carolina Division of Environmental Hanagement, 1979, Water Quality Banagement Plan for North Carolina, Raleigh, NC.
Office of Surface Mining, 1983, First Annual Evaluation of the Tennessee Permanent Program, U.S. Department of the Interior, Knoxville, TN.
Osterkamp, W. R., et al., 1984, Hovement of Tractive Sediment from Disturbed Lands, Proceedings of Conference on Water for Resource Development, ASCE, New York, 59-63.
Piest, R. F., et al., 1976, Entrenchment of Drainage Systems in Western Iowa and Northwestern Eissouci, Proceedings, Third Federal Interagency Sedimentation Conference, Water Res. Council, Washington, D.C., pp. 5-48 to 5-60.
Robbins, C. H., and A. Simon, 1983, Ran-Induced Channel Adjustment in Tennessee Streams, WRI 82-4098, USGS, Nashville, TN.
Tennessee Division of Water Quality Control, 1978, Water Quality Management Plan for Tennessee, Nashville, TN.
Tennessee Division of Water Quality Control, 1982, Reelfoot Lake Summary Report, Nashville, TN.
Tennessee Valley Authority, 1980, Coal Hining and Water Quality, Water Quality Branch, Chattanooga, TN.
Tennessee Valley Authority, 1984, Preliminary Assessment of the Impact of Nonpoint Sources on Water Quality in the 201 County Region, Water Quality Branch, Chattanooga, TN.
Trimble, S. W.. and W. P. Carey, 1984, Sediment Characteristics of Tennessee Streams and Reservoirs, Open File Report 84-749, USGS, Nashville, TN.
U.S. Department of Agriculture, 1980, Obion-Forked Deer River Basin, Tennessee - Summary Report, Soil Conservation Service, Nashville, TN.
U.S. Department of Agriculture, 1984, Effects of Soil Erosion on Cropland in Hississippi, Soil Conservation Service, Jackson, ES.