Embed Size (px)
Citation preview
Philippine ANALYST February 2014
Contents
THE MONTH’S HIGHLIGHTS
WORD FOR WORD
COMMENTARY
SPECIAL REPORTS
POLITICAL
21 Gov’t, MILF sign fi nal peace pact
22 Philippines’ anti-corruption eff orts still wanting
THE ECONOMY
25 Updated PH Development Plan takes a diff erent tack
26 Joblessness rise in 4th Q, but whole year 2013 results still better than previous year
27 Economists support amendment to economic provisions of the Constitution
PHILIPPINE REGIONAL UPDATE BUSINESS
41 PH tourism misses 2013 target
Mining, Oil and Gas
43 Glencore remains committed to Tampakan dev’t
IT Update
44 BPO industry expected to create 124,000 additional jobs per year
45 Philippines a laggard in ICT development
BUSINESS CLIMATE INDEX
CORPORATE BRIEFS
INFRASTRUCTURE
53 DOE says power rate hike due to an ‘artifi cial shortage’ in WESM
54 ERC approved rules on Feed-in-Tariff collection
55 DOE eyes natural gas network
CONGRESSWATCH
59 Bill amending Anti-Graft Law fi led in Congress
60 BSP seeks to remove limit on foreign bank entry
61 Asia Pacifi c Executive Brief79 Asia Brief contributors
PUBLISHER: Peter Wallace
EDITOR - Bing Icamina
SENIOR- RESEARCH STAFF:
Joey Roi Bondoc
Francesca Rey
Steven Baria
Vanni Bertillo
Samantha Castro
Rachel Rodica
PRODUCTION–LAYOUT
Larry Sagun
Efs Salita
To read Philippine ANALYST online, go to http://www.wallacebusinessforum.com
For information, send an email to [email protected] or [email protected]
For publications, visit our website: wallacebusinessforum.com
Online
11
18
32
55
60
Philippine ANALYST
the month’s highlights 1
February 2014
Political
PAST DEVELOPMENTS
Gov’t, MILF sign fi nal peace pact The signing of the Comprehensive Agreement on the Bangsamoro (CAB) comes after 17 years of negotiations between the Philippine government and the Moro Islamic Liberation Front (MILF). In 1984, the MILF was formed to split away from the main body, the Moro National Liberation Front (MNLF), as they did not agree with the conditions of the Tripoli Agreement that provided merely “nominal autonomy for the Bangsamoro” as they saw it. The breakaway group was formed by members who were disgruntled over what they thought was the MNLF’s departure from its religious roots, its secularist mindset, and surrendering of demands for autonomy.(see story page on p21)
Philippines’ anti-corruption eff orts still wantingThe Philippines’ ranking in Transparency International’s (TI) Corruption Perceptions Index (CPI) has been improving under the Aquino administration. However, much remains to be done if the Philippines is to achieve its goal of breaking into the top one-third of all economies surveyed.(see story page on p22)
Economy
PAST DEVELOPMENTS
Updated PH Development Plan takes a diff erent tackSocio-economic Planning Secretary and National Economic and Development Authority (NEDA) Director General Arsenio Balisacan unveiled the Updated Philippine Development Plan covering the remaining 3 years of the original Plan, or 2014-2016, which stresses the urgency of addressing poverty and raising private investment in the most productive sectors – areas where the economy failed despite its rapid growth during the past 3 years. (see story page on p25)
Joblessness rise in 4th Q, but whole year 2013 results still better than previous year The number of jobless adults reached 12.1 million (27.5% of the adult labor force) in December (4th quarter) 2013 from 9.6 million (21.7%) in September (3rd quarter), the Fourth Quarter 2013 Social Weather Survey of the Social Weather Stations (SWS) disclosed. It was also worse than the 10.1 million (24.6%) recorded in 4Q12. (see story page on p26)
Economists support amendment to economic provisions of the ConstitutionThe Foundation for Economic Freedom (FEF) has expressed its support to the proposal in the House of Representatives to amend the economic provisions of the Constitution by inserting the phrase “unless provided by law” to the foreign ownership restrictions in the Constitution in public utilities, land, mass media and advertising, educational institutions, and development of natural resources.(see story page on p27)
Business
PAST DEVELOPMENTS
PH tourism misses 2013 targetThe country failed to meet its tourist arrival target for 2013. Despite this, the Tourism department is still optimistic that the Philippines will achieve its target of 10 million international tourists by 2016. The Philippines is trumped by its ASEAN neighbors in terms of tourist arrivals. Massive government support for the sector must be sustained if it is to remain as one of the country’s primary revenue and job generating sectors.(see story page on p41)
Mining, Oil and Gas
Glencore remains committed to Tampakan dev’tSagitarrius Mines, Inc. (SMI), the operator of the $6 billion Tampakan copper-gold project, said its major shareholder Glencore Xstrata is still committed to the development of the mine despite an earlier report that it is pulling out from the project. (see story page on p43)
IT Update
BPO industry expected to create 124,000 additional jobs per year The Philippines’ business process outsourcing (BPO) industry is expected to generate 124,000 jobs per annum from 2014 to 2016 as the industry grows by 8.6% annually. The BPO sector plays a critical role as one of the country’s primary employment-generating industries. (see story page on p44)
Philippines a laggard in ICT developmentDespite being the “texting” and “social networking” capital of the world, the Philippines still remains a laggard in terms of Information and Communications Technology (ICT) development.(see story page on p45)
Infrastructure
PAST DEVELOPMENTS
DOE says power rate hike due to an ‘artifi cial shortage’ in WESMThe energy department released a report on the power rate hike in December stating that an “artifi cial shortage” in power supply caused prices at the electricity spot market to rise during the 1-month maintenance shutdown of the Malampaya natural gas platform. The department has indicated that the shortage may have been the result of a violation of spot market rules or an outdated data on the actual capacity of listed power plants. (see story page on p53)
the month’s highlights 2
February 2014Philippine ANALYST
ERC approved rules on Feed-in-Tariff collectionAn additional cost of electricity may be imposed on top of consumers’ regular bill by 2015 as ERC approved the rules for collecting the Feed-in-Tariff Allowance, payable to renewable energy developers. (see story page on p54)
FUTURE DEVELOPMENTS
DOE eyes natural gas networkThe energy department is eyeing to build a natural gas pipeline network to increase utilization of natural gas in Metro Manila.(see story page on p55)
CongressWatch
Bill amending Anti-Graft Law fi led in CongressSenate President Franklin M. Drilon and Senator Aquilino “Koko” Pimentel III have endorsed a bill that aims to decongest the clogged dockets of the country’s anti-graft court, the Sandiganbayan. (see story page on p59)
BSP seeks to remove limit on foreign bank entryThe Bangko Sentral ng Pilipinas (central bank) said it will endorse a bill to Congress that will remove the limit on the number of foreign banks that may enter the country. The liberalization aims to attract more investments into the Philippines and is also in line with the ASEAN economic integration in 2015. (see story page on p60)

CORPORATE BRIEFS 3
February 2014Philippine ANALYST
“We never had an Internet [or] onIine libel. The position of the DOJ has been very consistent: Online libel is not needed. Cybercrime prevention has to do with core cybercrimes. What are these? Hacking, phishing, using it for child pornography. Those are the bigger cases, so that’s where we must divert our attention and resources,” DOJ Assistant Secretary Geronimo Sy in saying that online libel is unnecessary, given that it is still covered by libel penal provisions in the Revised Penal Code.
“We remain mindful of the potential challenges that may hamper our progress this year, especially with respect to providing quality education to Filipino students. The 2014 National Budget considers these possible setbacks—such as typhoons and calamities—so that emergencies don’t endanger our broader goal of establishing a robust public education system,”
Budget secretary Butch Abad on the need to prioritize public education funding in the 2014 national budget
“I hope they are able to show why the Constitution, the bedrock of our laws, should be amended. There will be disruption in the short term. Is the disruption worth the anticipated benefi ts?”
President Benigno Aquino III saying that proponents of the Charter change should demonstrate the “positive benefi ts” of amending the supposed restrictive economic provisions.
COMMENTARY
Philippine ANALYST
COMMENTARY4
February 2014
CCOOMMMMEENNTTAARRYYCOMMENTARY
Idon’t know what it takes to get politicians to recognize reality, they just seem incapable of taking their rose colored glasses off . The Philippines is NOT attracting foreign investment, that’s the factual reality. If you recognize that you react diff erently to how you would if you think all is going well. And going well is
what the President is told. With extreme reluctance the government is only now beginning to recognize that the impressive growth—the second best in Asia they crow—hasn’t created enough jobs, hasn’t lifted people out of poverty. The President was “surprised” that the growth hadn’t trickled down and called a far too rare all day cabinet meeting to fi nd out why— 3 years after he should have.
We, and many others have been telling him why for years: Lack of investment in job-creating business, particularly manufacturing which is needed to give the less educated a job. It has been more profi table to develop real estate (no long term jobs created) than a manufacturing plant (jobs created). I was struck by the number that over the past 25 years an investment in real estate would have grown 7 times, while in manufacturing the growth would only have been 3 times. If you wanted to make money, and who doesn’t, it’s pretty clear where you’d invest, 7 times versus 3 says it all.
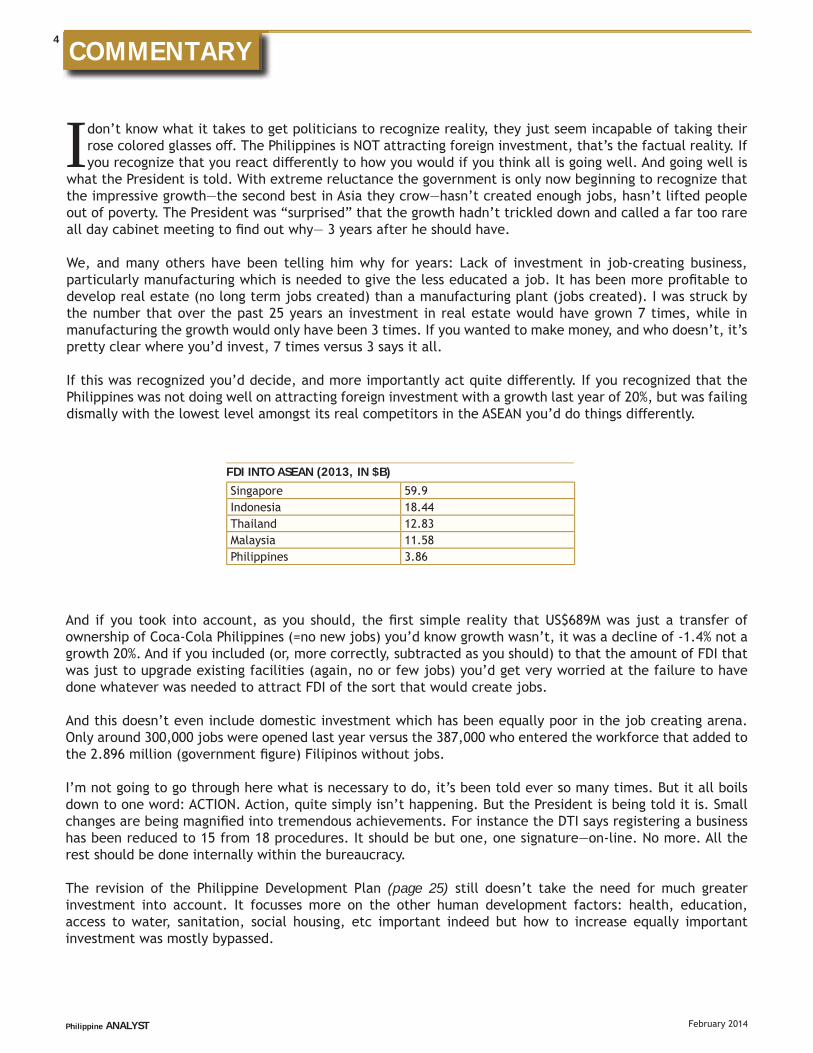
If this was recognized you’d decide, and more importantly act quite diff erently. If you recognized that the Philippines was not doing well on attracting foreign investment with a growth last year of 20%, but was failing dismally with the lowest level amongst its real competitors in the ASEAN you’d do things diff erently.
And if you took into account, as you should, the fi rst simple reality that US$689M was just a transfer of ownership of Coca-Cola Philippines (=no new jobs) you’d know growth wasn’t, it was a decline of -1.4% not a growth 20%. And if you included (or, more correctly, subtracted as you should) to that the amount of FDI that was just to upgrade existing facilities (again, no or few jobs) you’d get very worried at the failure to have done whatever was needed to attract FDI of the sort that would create jobs.
And this doesn’t even include domestic investment which has been equally poor in the job creating arena. Only around 300,000 jobs were opened last year versus the 387,000 who entered the workforce that added to the 2.896 million (government fi gure) Filipinos without jobs.
I’m not going to go through here what is necessary to do, it’s been told ever so many times. But it all boils down to one word: ACTION. Action, quite simply isn’t happening. But the President is being told it is. Small changes are being magnifi ed into tremendous achievements. For instance the DTI says registering a business has been reduced to 15 from 18 procedures. It should be but one, one signature—on-line. No more. All the rest should be done internally within the bureaucracy.
The revision of the Philippine Development Plan (page 25) still doesn’t take the need for much greater investment into account. It focusses more on the other human development factors: health, education, access to water, sanitation, social housing, etc important indeed but how to increase equally important investment was mostly bypassed.
Singapore 59.9Indonesia 18.44Thailand 12.83Malaysia 11.58Philippines 3.86
FDI INTO ASEAN (2013, IN $B)
Philippine ANALYST
COMMENTARY 5
February 2014
The Plan’s success will be measured in terms of effi ciency and eff ectiveness. Effi ciency is its ability to steer private activity into the direction laid out in the Plan. Eff ectiveness is the extent in which quality of life is improved. Quality of life needs a job, that will be the real measure of success of the plan. Even on paper it doesn’t look too good for the success needed.
****
The fi ght to change the constitution to further open up the economy is growing, and I sense the President’s opposition is softening. But there’ll still be much opposition, much controversy with the simple solution of adding “unless otherwise provided by law” opposed on the grounds it gives lawmakers too much power and could lead to capricious change under a diff erent administration in the future, even change that further restricts instead of opening up. And it could as change would not be constrained by a general policy/philosophy statement as a constitution would normally provide. This is a defi nite theoretical weakness of this approach, but I think in actual practice would not arise.
It becomes a “compromise constitution”, not a good thing, but better than leaving it as is. Making the more fundamental and better change of replacing all the specifi c strictures with a general policy would need the active leadership of Aquino. Something unlikely as it now stands.
The other opposition will be the usual emotional stuff based on a misunderstanding of nationalism and what “Filipino First” really means. Myopia will interpret it as what’s best for the Filipino businessman, not what’s best for the Filipino consumer and job seeker.
This is where time will be eaten up. This is where getting it through in the next year, or so is diffi cult. But the swift passage in the House so far, it’s already gone to plenary debate, gives some hope it just might pass early. Coincident with the mid-2016 elections is when a plebiscite could be most expected. Then, of course, the phrases in the constitution will have to be amended by law. That will add another year or three.
The next 6 months should defi ne the likelihood more clearly. Surprisingly, we’re hopeful (a word I promised myself never to use when discussing the Philippines).
SPECIAL REPORT6
February 2014Philippine ANALYST
Cons tu onal Change Isn’t Only Desirable,
It’s Essen al:
It IS Time to Change the Cons tu on
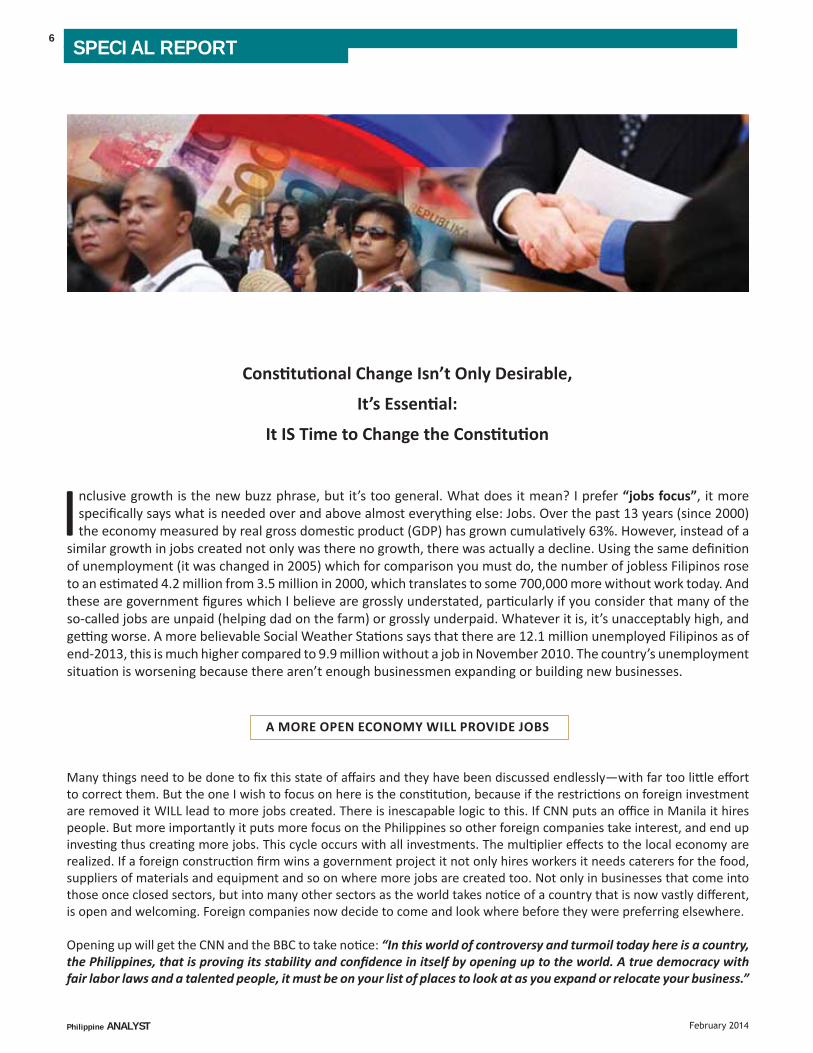
Inclusive growth is the new buzz phrase, but it’s too general. What does it mean? I prefer “jobs focus”, it more specifi cally says what is needed over and above almost everything else: Jobs. Over the past 13 years (since 2000) the economy measured by real gross domes c product (GDP) has grown cumula vely 63%. However, instead of a
similar growth in jobs created not only was there no growth, there was actually a decline. Using the same defi ni on of unemployment (it was changed in 2005) which for comparison you must do, the number of jobless Filipinos rose to an es mated 4.2 million from 3.5 million in 2000, which translates to some 700,000 more without work today. And these are government fi gures which I believe are grossly understated, par cularly if you consider that many of the so-called jobs are unpaid (helping dad on the farm) or grossly underpaid. Whatever it is, it’s unacceptably high, and ge ng worse. A more believable Social Weather Sta ons says that there are 12.1 million unemployed Filipinos as of end-2013, this is much higher compared to 9.9 million without a job in November 2010. The country’s unemployment situa on is worsening because there aren’t enough businessmen expanding or building new businesses.
Many things need to be done to fi x this state of aff airs and they have been discussed endlessly—with far too li le eff ort to correct them. But the one I wish to focus on here is the cons tu on, because if the restric ons on foreign investment are removed it WILL lead to more jobs created. There is inescapable logic to this. If CNN puts an offi ce in Manila it hires people. But more importantly it puts more focus on the Philippines so other foreign companies take interest, and end up inves ng thus crea ng more jobs. This cycle occurs with all investments. The mul plier eff ects to the local economy are realized. If a foreign construc on fi rm wins a government project it not only hires workers it needs caterers for the food, suppliers of materials and equipment and so on where more jobs are created too. Not only in businesses that come into those once closed sectors, but into many other sectors as the world takes no ce of a country that is now vastly diff erent, is open and welcoming. Foreign companies now decide to come and look where before they were preferring elsewhere.
Opening up will get the CNN and the BBC to take no ce: “In this world of controversy and turmoil today here is a country, the Philippines, that is proving its stability and confi dence in itself by opening up to the world. A true democracy with fair labor laws and a talented people, it must be on your list of places to look at as you expand or relocate your business.”
A MORE OPEN ECONOMY WILL PROVIDE JOBS
SPECIAL REPORT 7
February 2014Philippine ANALYST
There’s a huge inequality that exists today—79% of the popula on belong to the low-income group, while only 5% is in the high-income group, and the middle class is way too small at only 16%—that badly and urgently needs leveling. This can only be done through job crea on and good, well-paying jobs; there is no other way. And everything that will help create jobs must be done. It’s no good saying things are going well so we don’t need further change because even if it were only 100 people without a job it’s 100 people who shouldn’t be. And when the fact is that there are more jobless people today than 10 years ago, than 3 years ago everything that can create jobs must be tried. If opening the economy through cons tu onal change will only create a few thousand jobs, that’s a few thousand jobs, but I believe based on evidence elsewhere it will be hundreds of thousands of jobs, possibly millions.
JOB CREATION IS THE ONLY WAY TO SOLVE POVERTY.
President Aquino seemed to have recognized the need to create jobs when he said he wants to create a Daang Matuwid (straight path) where the economy is opened up, expanded, jobs created in a fair and honest manner. As we’ve seen in the past couple of decades Filipino businessmen have done a great job, however their capital is limited, the amount they can do is limited and too few of them capture too much in several key sectors where wider ownership could provide a more compe ve environment for be er products or services. So I’m at a complete loss to understand the president—if he’s correctly reported—as to why he doesn’t want to review the cons tu on, when it fi ts in with his overall vision.
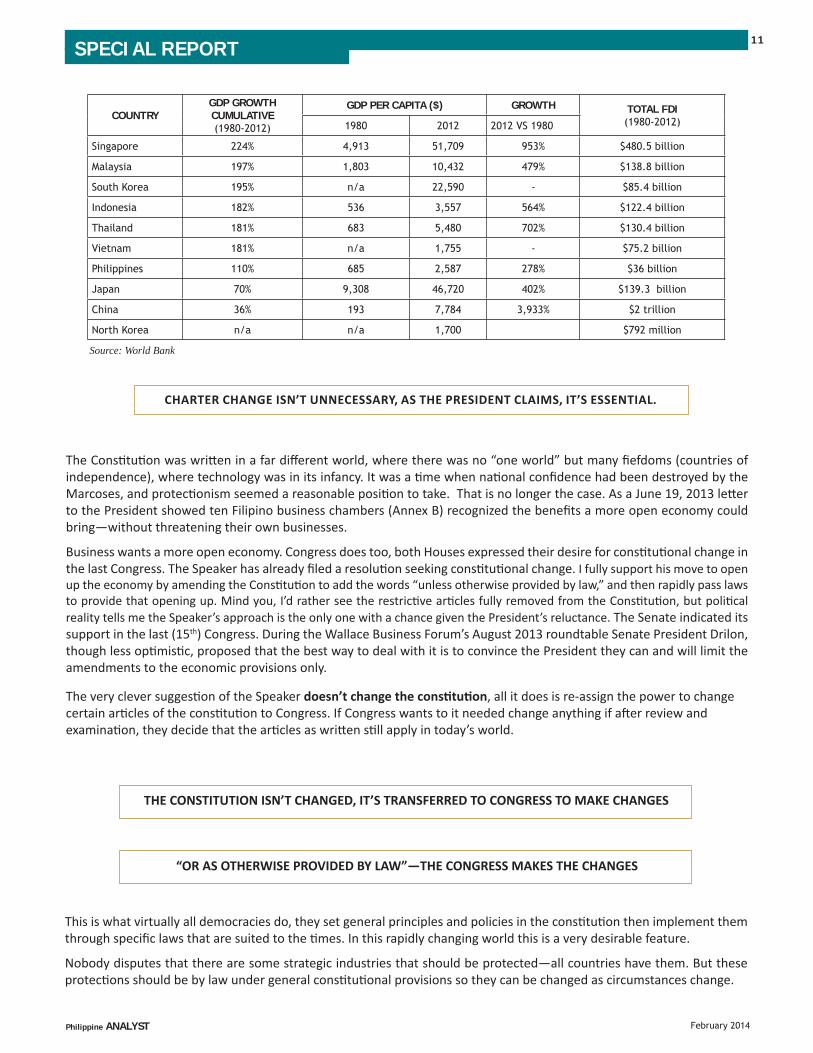
The president wants proof that foreign investment will benefi t Filipinos. He said: “Then with regards to our cons tu on, it’s important that it serves our interest, to make sure it serves our interest before the interest of foreigners”. I couldn’t agree more. It has been proven incontrover bly that foreign investment serves the interest of a country’s people more than it does the foreigner. The most drama c example nearby is China. China was a backwater (GDP per capita of $193 in 1980, the Philippines was a much higher $685) un l it opened up to foreign investment. US$2 trillion poured in (the Philippines received a measly $36 billion), it was the trigger to explosive growth, to a GDP per capita today of $7,784 P.A. or a 3,933% increase from the 1980 level. The Philippine GDP per capita grew by only 278% during the comparable period to reach an unacceptably low $2,587.
He added: “Nobody has demonstrated with absolute certainty that if we overhaul the Cons tu on, we’ll have corresponding economic gain,” Nothing is absolutely certain into the future (except death), but example a er example worldwide shows that open economies fare best, their people are be er off in an economy. The odds are very high that opening up the economy further will lead to more rapid growth in the Philippines. Noted, respected Philippine economists all support this change (the Founda on for Economic Freedom has come out openly and strongly in support), businessmen support this change (average of 90%) in three surveys we conducted (15 business chambers, Rotary Club of Maka West, and the Wallace Business Forum members, see Annex A). Congress supports this change, it was the fi rst bill fi led by the Speaker. The communist or le group that is vocal on issues where its stance opposes free market etc. is against it. That must tell you something. Look at the people that support versus those that oppose and decide which side you’d rather be on.
THE PRESIDENT’S REASONS FOR RELUCTANCE1. “The economy is doing well (it is consumption-led, enough jobs aren’t being created)”
2. Investment is pouring in “Prove to me we need it.” (FDI in the past 18 months $3.6B, Vietnam $14.2B).
3. It will distract Congress from passing laws
• It won’t, diff erent committee
• This is of equal or higher importance than most proposed laws.
• We have enough laws
4. Congress will open it up to change in the political structure
• He can control Congress
• The public can oppose it through an active internet (social media)
• A parliamentary system would be better anyway
SPECIAL REPORT8
February 2014Philippine ANALYST
OVER 80% OF BUSINESSMEN WANT AN OPEN CONSTITUTION
As the members of the highly respected Founda on for Economic Freedom (FEF) said: “We want our growth transformed from a consump on-driven one to an investment-driven one because only an investment-driven growth will grow jobs and reduce unemployment, increase produc ve capacity, improve compe veness, and put the country on a higher plane of sustainable growth,” They went on to say: “Timing is right because [Aquino] enjoys a high trust ra ng and there’s no fear he will use Cha-Cha to extend his power,” “Moreover, globaliza on has made liberalizing economic provisions in the Cons tu on more obvious and urgent.” And this is a point the President may have missed. The high GDP growth is not because of produc ve, job-crea ng ac vi es, but consump on. Consumer spending accounts for more than two thirds of Philippine GDP. That is not a sound base for an economy. In the three years Mr. Aquino has been in power unemployment has risen from 2.8 million in 2010 to 3 million today despite GDP growth breaching the 7% mark in 2010 and averaging 6% from 2010 to 2012. And these are offi cial fi gures, which have redefi ned a large numbers of jobless out of the labor force. Clearly GDP is not a good indicator of the well-being of a people. And it is the well-being of his people that I’m sure he’d be most concerned about.
GDP IS NOT A GOOD INDICATOR OF THE WELL BEING OF A PEOPLE.
Surely if these experts on studying the economy, who are Filipinos that care for their country, think a more open economy is desirable then they should be listened to.
FEF WANTS AN OPEN CONSTITUTION
The President wants facts to prove cons tu onal change is necessary. Well the facts are there, opening up an economy leads to rapid growth. Now it may not have been through cons tu onal change, as in most countries such changes are not needed, it can be done by law or execu ve fi at, but in the Philippines it is. Which in itself tells you the need to change the cons tu on—it’s out of step with other democracies. The cons tu on is restric ng FDI infl ows. There are other factors too to be addressed, oh most are being, but too slowly. And that’s the point, opening up the cons tu on is not a magic wand that solves all, it’s just one important factor amongst several that are necessary in an overall opening up and improving of the economy. But it is an important factor and should not be le out.
In country a er country foreign investment has led to much more rapid growth (look at Singapore and South Korea), and a wider ownership of the growth. Exports increase drama cally as the foreigner creates products for their own market that they know so well.
BENEFITS OF FDI
Quality employment creation
Transfer of technology, skills & know-how
Managerial capacity is enhanced
Infl ow of capital
Wider ownership of sectors
Greater access to world market

SPECIAL REPORT 9
February 2014Philippine ANALYST
SPECIAL REPORT10
February 2014Philippine ANALYST
THE OECD AND UNCTAD HAVE EMPHASIZED THE BENEFITS OF AN OPEN CONSTITUTION
As a well-researched paper says: “The overall benefi ts of FDI for developing countries’ economies are well documented. Given the appropriate host-country policies and a basic level of development, a preponderance of studies shows that FDI triggers technology spillovers, assists human capital forma on, contributes to interna onal trade integra on, helps create a more compe ve business environment and enhances enterprise development. All of these contribute to higher economic growth, which is the most potent tool for allevia ng poverty in developing countries. Moreover, beyond the strictly economic benefi ts, FDI may help improve environmental and social condi ons in the host country by, for example, transferring ‘cleaner’ technologies and leading to more socially responsible corporate policies.” (“Foreign Direct Investment for Development, Maximising Benefi ts, Minimising Costs,” OECD, 2002)
In another por on ci ng the United Na ons Conference on Trade and Development’s Midrand Declara on in 1996, the paper says: “[T]he Philippines expressly supported the proposi on that FDI is a driver of growth. Paragraph 36 of that Declara on states, ‘Foreign direct investment can play a key role in the economic growth and development process. The importance of FDI for development has drama cally increased in recent years. FDI is now considered to be an instrument through which economies are being integrated at the level of produc on into the globalizing world economy by bringing a package of assets, including capital, technology, managerial capaci es and skills, and access to foreign markets. It also s mulates technological capacity-building for produc on, innova on and entrepreneurship within the larger domes c economy through catalyzing backward and forward linkages.”
The paper says further: “Arguing that restric ons on foreign ownership are not a factor in aff ec ng FDI is illogical. If a foreign fi rm faces a nega ve list where investment cannot take place or is very restricted, then of course there can be no or only limited investment in those areas, immediately limi ng the range of prospects. Addi onally, it defi es logic to say that li ing restric ons will not open new doors as those doors are then open.”
There’s been some argument that foreign investment isn’t needed. I haven’t seen any research done that links FDI (Foreign Direct Investment) to economic (measured by GDP) growth, but I don’t think anyone would dispute but that China got rapidly and massively started to rise to number 2 in the world by foreign investment whilst the Philippines has been the slowest growing economy amongst its comparable neighbors, and has a racted the least foreign investment. And has the most foreign ownership restric ons. Surely that alone says it is needed. Or, at the very least is worth the try given the failure to provide enough jobs as the economy is currently structured. What a er all do you have to lose.
SPECIAL REPORT 11
February 2014Philippine ANALYST
COUNTRYGDP GROWTH CUMULATIVE(1980-2012)
GDP PER CAPITA ($) GROWTH TOTAL FDI(1980-2012)1980 2012 2012 VS 1980
Singapore 224% 4,913 51,709 953% $480.5 billion
Malaysia 197% 1,803 10,432 479% $138.8 billion
South Korea 195% n/a 22,590 - $85.4 billion
Indonesia 182% 536 3,557 564% $122.4 billion
Thailand 181% 683 5,480 702% $130.4 billion
Vietnam 181% n/a 1,755 - $75.2 billion
Philippines 110% 685 2,587 278% $36 billion
Japan 70% 9,308 46,720 402% $139.3 billion
China 36% 193 7,784 3,933% $2 trillion
North Korea n/a n/a 1,700 $792 million
Source: World Bank
CHARTER CHANGE ISN’T UNNECESSARY, AS THE PRESIDENT CLAIMS, IT’S ESSENTIAL.
The Cons tu on was wri en in a far diff erent world, where there was no “one world” but many fi efdoms (countries of independence), where technology was in its infancy. It was a me when na onal confi dence had been destroyed by the Marcoses, and protec onism seemed a reasonable posi on to take. That is no longer the case. As a June 19, 2013 le er to the President showed ten Filipino business chambers (Annex B) recognized the benefi ts a more open economy could bring—without threatening their own businesses.
Business wants a more open economy. Congress does too, both Houses expressed their desire for cons tu onal change in the last Congress. The Speaker has already fi led a resolu on seeking cons tu onal change. I fully support his move to open up the economy by amending the Cons tu on to add the words “unless otherwise provided by law,” and then rapidly pass laws to provide that opening up. Mind you, I’d rather see the restric ve ar cles fully removed from the Cons tu on, but poli cal reality tells me the Speaker’s approach is the only one with a chance given the President’s reluctance. The Senate indicated its support in the last (15th) Congress. During the Wallace Business Forum’s August 2013 roundtable Senate President Drilon, though less op mis c, proposed that the best way to deal with it is to convince the President they can and will limit the amendments to the economic provisions only.
The very clever sugges on of the Speaker doesn’t change the cons tu on, all it does is re-assign the power to change certain ar cles of the cons tu on to Congress. If Congress wants to it needed change anything if a er review and examina on, they decide that the ar cles as wri en s ll apply in today’s world.
THE CONSTITUTION ISN’T CHANGED, IT’S TRANSFERRED TO CONGRESS TO MAKE CHANGES
“OR AS OTHERWISE PROVIDED BY LAW”—THE CONGRESS MAKES THE CHANGES
This is what virtually all democracies do, they set general principles and policies in the cons tu on then implement them through specifi c laws that are suited to the mes. In this rapidly changing world this is a very desirable feature.
Nobody disputes that there are some strategic industries that should be protected—all countries have them. But these protec ons should be by law under general cons tu onal provisions so they can be changed as circumstances change.
SPECIAL REPORT12
February 2014Philippine ANALYST
SECTORS THAT NEED PROTECTION SHOULD BE PROTECTED BY LAW NOT A CONSTITUTION
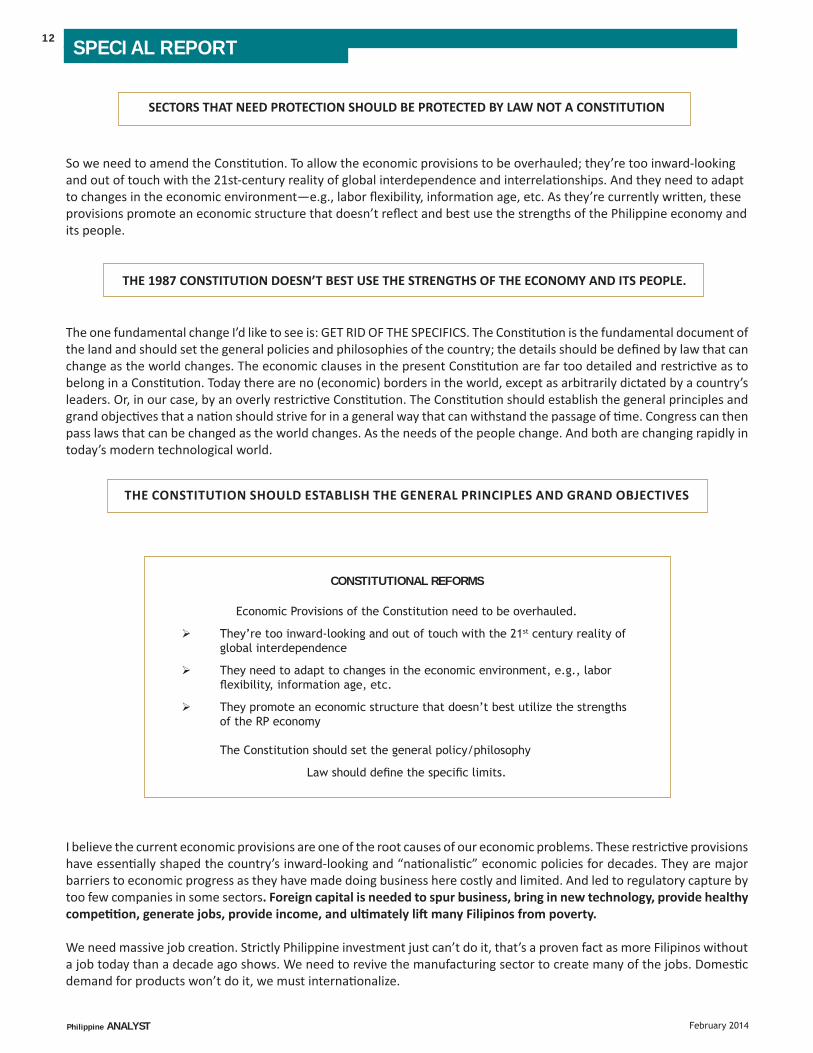
So we need to amend the Cons tu on. To allow the economic provisions to be overhauled; they’re too inward-looking and out of touch with the 21st-century reality of global interdependence and interrela onships. And they need to adapt to changes in the economic environment—e.g., labor fl exibility, informa on age, etc. As they’re currently wri en, these provisions promote an economic structure that doesn’t refl ect and best use the strengths of the Philippine economy and its people.
THE 1987 CONSTITUTION DOESN’T BEST USE THE STRENGTHS OF THE ECONOMY AND ITS PEOPLE.
The one fundamental change I’d like to see is: GET RID OF THE SPECIFICS. The Cons tu on is the fundamental document of the land and should set the general policies and philosophies of the country; the details should be defi ned by law that can change as the world changes. The economic clauses in the present Cons tu on are far too detailed and restric ve as to belong in a Cons tu on. Today there are no (economic) borders in the world, except as arbitrarily dictated by a country’s leaders. Or, in our case, by an overly restric ve Cons tu on. The Cons tu on should establish the general principles and grand objec ves that a na on should strive for in a general way that can withstand the passage of me. Congress can then pass laws that can be changed as the world changes. As the needs of the people change. And both are changing rapidly in today’s modern technological world.
THE CONSTITUTION SHOULD ESTABLISH THE GENERAL PRINCIPLES AND GRAND OBJECTIVES
I believe the current economic provisions are one of the root causes of our economic problems. These restric ve provisions have essen ally shaped the country’s inward-looking and “na onalis c” economic policies for decades. They are major barriers to economic progress as they have made doing business here costly and limited. And led to regulatory capture by too few companies in some sectors. Foreign capital is needed to spur business, bring in new technology, provide healthy compe on, generate jobs, provide income, and ul mately li many Filipinos from poverty.
We need massive job crea on. Strictly Philippine investment just can’t do it, that’s a proven fact as more Filipinos without a job today than a decade ago shows. We need to revive the manufacturing sector to create many of the jobs. Domes c demand for products won’t do it, we must interna onalize.
CONSTITUTIONAL REFORMS
Economic Provisions of the Constitution need to be overhauled.
They’re too inward-looking and out of touch with the 21st century reality of global interdependence
They need to adapt to changes in the economic environment, e.g., labor fl exibility, information age, etc.
They promote an economic structure that doesn’t best utilize the strengths of the RP economy
The Constitution should set the general policy/philosophy
Law should defi ne the specifi c limits.

SPECIAL REPORT 13
February 2014Philippine ANALYST
SPECIAL REPORT14
February 2014Philippine ANALYST
WE NEED GREATER COMPETITION, WIDER OWNERSHIP OF PUBLIC UTILITIES.
Building of public services can expand much, much more rapidly as more companies become available to provide them. One of my clients would like to help computerize government services (a growing essen al) as they have the exper se and experience of elsewhere, but they can’t because they can’t fi nd a 60% partner. A partner they don’t need, except the cons tu on mandates it.
One argument raised against opening up is the fear that if you allow foreigners to control businesses they’ll dominate them, and take all their profi ts out. They’ll gouge the country for their own gain. Not true. The fi gures from the Business World Top 1,000 Corpora ons show that in the last two to three years, mul na onal companies (MNCs) have made an average of about P80 billion annually in profi t, but Central Bank fi gures show that only 30-40 percent of it was remi ed overseas during that period. The rest was ploughed back into expansion — crea ng more jobs for Filipinos.
MNC’S RE-INVEST 60-70% OF THEIR EARNINGS BACK INTO THE COUNTRY.
PROTECTIONIST ECONOMIES QUITE SIMPLY DON’T WORK.
MNCs employ an es mated 1 million Filipinos directly, many, many more when you add the jobs they provide for subcontractors, suppliers, distributors, dealers, retailers, etc. In the BPO sector alone the entry and expansion of more US-based and European-based call centers and other services over the next few years could lead to direct employment by MNCs of up to 2 million Filipinos. And they pay at least 30 percent more than do most local companies.
Over 10 million Filipinos have had to leave their families, separate from their spouses to seek a living overseas. In many, many of those cases that living overseas is working for a foreign company. Wouldn’t it be far, far be er (and kinder to the family) to bring the companies here?
Protec onist economies quite simply don’t work, and I challenge those who think they do to give me some examples. I’ll give them just one to make my point: Korea. Open South Korea is one of the world’s most dynamic countries with a per capita GDP of $22,590. While protec onist North Korea is one of the world’s unmi gated disasters. No one knows its per capita GDP, or even if it has one. Some guess mates place North Korea’s GDP per head at $1,700 only. But it’s the same people, with the same ethnic background. South Korea a racted US$56 billion in FDI’s from 2000 to 2012. North Korea started allowing foreign investment in the mid-1980’s, but retained most of its restric ve policies. Despite opening up selected sectors to FDIs, the country of some 24 million people failed to a ract any major investment. According to World Bank, NoKor a racted a measly $560M from 2000 to 2012, accoun ng for a paltry 1% of South Korea’s FDIs during the period.
There is only one closed economy in the world today, North Korea the rest are open or semi-open economies. China is now obviously an open economy, having joined the WTO in 2001. And having taken off drama cally since it opened up. Vietnam is opening up too, and has been compe ng aggressively for FDI’s during the past 5-10 years. In the past 5 it garnered some $39 billion of FDI, the Philippines only one fourth of that at $11 billion.
It will soon overtake the Philippines the way it is going. Which all proves that a closed economy is an archaic concept that, quite simply and provably doesn’t work today.
“Simplifying procedures and providing incen ves” and “keeping a level playing fi eld” with “a determined push for good governance by the na onal leadership…” are indeed needed as the president rightly acknowledges. But they aren’t suffi cient; wider, more drama c change is needed.
SPECIAL REPORT 15
February 2014Philippine ANALYST
OPENING THE ECONOMY BY CONSTITUTIONAL CHANGE WILL GET GLOBAL HEADLINES, FIDDLING WITH LAWS WON’T.
The businessmen of the world need to be jolted into awareness and interest that the Philippines even exists. Fiddling with bits and pieces here and there is too nebulous, too incremental—you don’t no ce the changes. But a sudden: “We have fully opened our economy” brings instant interest. It will get global front page a en on: “Here’s a country worth looking at” that fi ddling with a few laws won’t do. CNN will report some good news on the Philippines for a change. The idea of changing laws to create greater openness won’t work anyway. There are areas where opening up with issuance of a law can’t be done. The cons tu on is very specifi c on what is not allowed, so no law can be created that violates the prohibi on. So to say change can be done “…without the need to amend the 1987 cons tu on” is just not possible.
THE IMF IS A DISINTERESTED THIRD PARTY, IT BELIEVES CONSTITUTIONAL CHANGE IS NEEDED
The IMF Execu ve Board in its report on consulta on with the Philippine government said (and I quote):
“Unemployment is around 6¾ percent—high from a regional perspec ve—and the poverty rate remains stubbornly elevated. The weak investment climate of poor infrastructure, limited compe on due to ght restric ons on foreign investment and concentrated ownership, and con nued red tape and corrup on are seen as contribu ng factors.”
The President is trying to fi ght corrup on (a Herculean task if ever there was one), has doubled the infrastructure budget and given importance to PPP, however reducing red tape is s ll only promised, too li le has actually been done, but at least it’s being a empted. Opening up the economy with cons tu onal change though is s ll being resisted by the President.
The IMF directors went on to say: “To catalyze private investment, directors encouraged the authori es to relax limits on foreign ownership, execute public-private partnership in a transparent manner, and strengthen the medium-term fi scal framework.”
The IMF has nothing to gain by these recommenda ons (there were more good ones, but not relevant to this discussion), it has no vested self-serving interests. It is a genuinely disinterested, impar al, knowledgeable third party. It believes cons tu onal change is necessary for faster and, importantly, wider growth of the economy.
AN OPEN ECONOMY WILL BE NEEDED TO JOIN TPP
In 2011, the broad framework for a Trans-Pacifi c Partnership (TPP) was developed, which aims to build a high-standard, comprehensive and ambi ous agreement that will enhance trade and investment, promote innova on, boost growth and create more jobs in TPP partner countries. Fourteen countries so far are ac ve par cipants in the TPP, including the U.S. and Asian countries specifi cally Brunei, Japan, Malaysia, Singapore and Vietnam. The goal is to further expand membership. Nego a ons on various issues such as compe on, coopera on, E-commerce, labor, cross border and legal issues are making substan al progress as par cipants are eager to conclude an agreement as soon as possible.
For the Philippines to be eligible to par cipate in this grand undertaking that is likely to emerge as the world’s most dynamic economic bloc it must ease foreign ownership restric ons on various areas of investment. The Philippine must belong to this partnership if it is to grow. But it won’t be able to if its cons tu on is not changed and con nues to protect.

SPECIAL REPORT16
February 2014Philippine ANALYST
PROVISIONS SALIENT POINTS PROPOSED CHANGES REASONS
Art II, Sec 17Priority to education, Science and Technology, to foster patriotism and nationalism…
Focus on the (educational) development of the individual; Allow foreign schools to establish branches in the Philippines
Education is the best way to lift people from poverty, so make it widely available. And give the widest possible range of choices.
Art II, Sec 19A self-reliant and independent national economy eff ectively controlled by Filipinos
DeleteWorld is becoming increasingly interrelated and interdependent. Even fully open Filipinos will control.
Art XII, Sec 1
Promotion of industrialization … based on sound agricultural development and agrarian reform
Needs to be re–written or better, just deleted
Industrialization and agricultural development should not be singled out. Other sectors (e.g., services—IT, which hardly existed in 1986) can also provide the development the economy needs.
The Admin can promote without the constitution telling it to.
Art XII, Sec 2 State may allow dev’t of natural resources by Filipinos
Allow majority or even full foreign ownership in the development of natural resources
The huge levels of capital needed and the technical expertise that goes with it are not fully available in the domestic market. As the mining industry began to show until halted by a tax review.
Art XII, Sec 3Restriction on the amount and type of land that can be owned, and who can own it
Remove restrictions, and allow foreigners to own land to build a factory, offi ce or house for their own use
Amount of land foreigners would own would be small, yet would provide an incentive, and also recognize a fair reciprocity – Filipinos can own land in other countries. Limit it to won use.
Art XII, Sec 9Establishment of an independent economic and planning agency
Not necessary to be in the Constitution
Organization of the Administration should be decided by the president, with Congress’ approval.
Other departments are not mandated.
Art XII, Sec 10 At least 60% Filipino ownership in certain areas of investments
Delete and remove any reference to “Preference for Filipinos”
Filipinos do not necessarily protect the National Patrimony better than foreigners.
The Admin can control
Art XII, Sec 11Franchises, etc. reserved to Filipinos or Filipino–owned companies
Allow full foreign ownershipFranchise sector is booming; huge potential for job & revenue generation. Filipinos can more than compete against any foreigner.
Art XII, Sec 12 Trade policy that serves the general welfare Unnecessary Simple commercial economics in an open market
will ensure this is the case.
Art XII, Sec 14 Practice of professions limited to Filipino citizens
Foreigners should be allowed to practice their professions
Would help accelerate technology transfer and development, create more jobs.
Not enough Filipinos in some professions.
Other countries allow Filipino professionals to practice.
Art XIII, Sec 3
Promotion of security of tenure of workers…
Entitlement of workers to a living wage
Delete
Needs to be better defi ned as a general policy – if in at all
It encourages mediocrity and is anti-worker.
Being confused by labor unions with minimum wage.
Art XIII, Sec 4 Mandate to undertake agrarian reform
Revise to allow both large and small plots
Agrarian reform has been a major inhibitor to agricultural dev’t; some crops need large land areas for competitive effi ciency and low cost.
Art XIV, Sec 6 Filipino as National language
Amend, to stress importance of learning English
Preferably to also learn in English (as it was 50 years ago)
English is now the world’s lingua franca, other countries are scrambling to learn English
Art XVI, Sec 11 (1) Mass media ownership limited to Filipinos
Delete
Foreign ownership should be allowed
Modern technology has made this restriction redundant – foreign media is already here
Art XVI, Sec 11 (2)Advertising industry open only to companies with at least 60% Filipino ownership
Delete Constitutions do not cover advertising period. It should be provided by law —if at all
SOME THINGS WE THINK NEED TO BE CHANGED…
SPECIAL REPORT 17
February 2014Philippine ANALYST
Some of these provisions weren’t wri en for the 1987 cons tu on. They were just extracted, with some minor amendments from the 79-year old 1935 cons tu on. This is the case par cularly on cons tu onal restric ons on land ownership; explora on, development, and u liza on of natural resources; and opera on and management of public u li es; and ownership of educa onal ins tu ons. (see Annex C).
The dream of many Filipinos is to gain a foreign educa on to add to what they’ve learnt here. They dream of going to Harvard, but the cost is prohibi ve. Why not bring Harvard here? What it will have to charge will, alone, be enough to make it no threat to local colleges. Anyway, do we want to protect colleges or open up opportuni es for students? Foreign colleges can bring research and new technologies to the Philippines, too, an area where we have been par cularly weak as a survey ranking universi es showed. Indonesia recently passed a law (it does not need cons tu onal change) to allow foreign ownership of educa onal establishments. The world has changed, changed drama cally, we cannot be trapped in history.
SOME ECONOMIC RESTRICTIONS ARE 79 YEARS OLD
PROTECT COLLEGES FROM COMPETITION OR GIVE STUDENTS THE WIDEST CHOICE
Interna onal news is on our LED screens at home, but they can’t have an offi ce. Interna onal news networks can’t operate and invest here because the cons tu on bans media 100%. A law can’t change that. A level playing fi eld, innumerable incen ves even good governance are of absolutely no relevance, CNN can’t come. Yet I watch it everyday, it’s in my home.
Twenty seven years ago, we didn’t have cellphones; today, we can’t leave the house without them. Imagine if the Cons tu on had banned mobile communica ons in the name of protec ng na onal security.
Technology has removed borders. Satellite communica ons, fi ber op c cables, digital technology were just emerging from the labs in 1987. They are a part of our lives today, so we may as well let the foreigners in as they’re already in.
Another prohibi on that makes no sense is to not allow foreigners to prac ce their profession. For law, I’d agree. We’ve got enough lawyers (I’m hesitant to say too many as I might upset some of my lawyer friends—and they might sue me). Why can’t a professional prac ce his profession here? Filipino professionals are excellent. A foreigner is no threat to them they can hold their own against anyone. Just ask all those Filipino professionals who prac ce their profession in someone else’s country. And there’s that same damning point: Filipinos can prac ce in another country, but that country’s professionals can’t prac ce here. That’s not fair. I suspect if you want Japanese to re re here they’ll want Japanese doctors to look a er them.
Mind you in this case the Cons tu on allows enabling laws to make exemp ons. I suggest our lawmakers move rapidly (a word they may wish to look up in the dic onary) to pass a law to open up all professions, not just a select few as the move to do this in congress may end up doing. There will not be a sudden fl ood of foreign professionals I can assure you. But a few gaps where need exists might be fi lled. And the exchange of exper se and experience could only further improve the already impressive creden als of Filipino professionals.
Where local knowledge is essen al, passing a local exam can be a necessary condi on. Lawyers, for instance must know local law. But there’s li le else where local knowledge is needed. All human bodies are pre y much the same (some just look be er than others) so as long as a doctor has passed an exam that is recognized in the Philippines he should be able to prac ce.
Even if all the wondrous promises of improvement of the investment scene were achieved, it wouldn’t ma er a foreigner can’t operate tollroads, railways, and telecom sta ons except as a minority partner. The cons tu on won’t allow it, and you can’t get around that if you are to operate honestly within the spirit and le er of the cons tu on. And we certainly need a lot more infrastructure.
SPECIAL REPORT18
February 2014Philippine ANALYST
INABILITY TO OWN LAND IS A DETERRENT TO INVESTMENT.
Maybe a 75-year lease on land seems enough, but would you want to be able to only lease the land for your house? No, you’d want to own it, passionately so. Well, foreigners don’t think in some strange foreign way; they want to own, too. Filipinos can, and do, own land in America and almost everywhere else, so why not here, at the very least on a reciprocal basis? For “own use” would be fair enough. The agrarian reform law has destroyed the ability to own agricultural land, so farmers are under no “threat.” And if limited to own use for house or factory, the amount of land taken would be infi nitesimal.
I’m willing to bet many of those who are against foreign ownership of land have rela ves who own land in other countries. So, apart from anything else, it would be only fair to have reciprocity. But that’s not so much the point. What is the point is that if we want to achieve more rapid growth, allowing foreigners to own land at least for their own house, offi ce or factory will help achieve that. As it is now, that inability to own land is seen as a deterrent to a rac ng investment.
OWN USE OWNERSHIP OF LAND WON’T TAKE LAND AWAY FROM FILIPINOS.
The preference given to Filipinos in the grant of concessions covering the na onal economy and patrimony should either be, preferably, deleted or amended to remove the “preference for Filipinos.” As the Manila Hotel case so amply demonstrated, Filipinos do not necessarily protect the na onal patrimony be er than foreigners might. But more importantly, dis nguishing between Filipinos and foreigners should no longer be an issue in today’s modern world. Whoever helps to provide jobs, to increase na onal wealth should be welcome. Laws can provide whatever specifi c protec on may be necessary.
Not in the economic sec on, but one area the cons tu on unreasonably protects is the judiciary, at least as related to business. Philippine courts, par cularly the Supreme Court, have almost unlimited discre on to interpret and decide on cases as they see it, too o en without being fully informed of the impact on business. Or even understanding the role of business. There have been a number of cases (e.g. SC ruled in 1991 that a naphtha cracker plant should be built in Bataan, as pe oned by a poli cian who wanted to have the project in his hometown, not in Batangas as the proponents preferred based on their business assessment. They le the country, as they certainly should) where business has been badly hurt to the detriment of society by decisions that didn’t appreciate all factors in conduc ng business.
Nothing could send a more drama c message than this. “We have truly opened our country to you to join us in our quest for a be er life for our people. Come, help us build a great country”.
The ideal way to review the Cons tu on is through a cons tu onal conven on. The argument that it costs more and takes more me is true, but we are talking about the Cons tu on, the fundamental document of the na on. You don’t consider the cost, which is small on the na onal scale of things, anyway.
A CONSTITUENT ASSEMBLY BY BOTH HOUSES IS THE WAY TO GO.
But the more prac cal way, given poli cal reali es, is for Congress as a cons tuent assembly to do the review, with both chambers vo ng separately before it goes to a plebiscite of the people. And don’t raise this nonsense that it’s not clear if both houses must meet jointly (which would make the Senate role meaningless) or separately, and then get together. Not making the dis nc on clear was an oversight of some not too bright lawyers in the 1986 con-con.There’s concern that

SPECIAL REPORT 19
February 2014Philippine ANALYST

SPECIAL REPORT20
February 2014Philippine ANALYST
The cons tu on should state general principles only and in a very general manner. A cons tu on should be wri en to last decades, even centuries in a fast-changing world.
Specifi cs should be by law or execu ve ac on. An open society provably works best.
the review would not be restricted to the economic provisions but would shi to the poli cal arena as well, and end up extending the terms of poli cians. Maybe, but it may also lead to a serious re-think of the whole system—something that I think is needed. For instance, a parliamentary system would be er suit Philippine culture. Having come from one, I think it’s a be er system, anyway. You don’t ques on, or disagree with, the boss just because he’s the boss. Well, I disagree with that. Rising to the top through a poli cal process does not make you a greater expert than everyone else. The fact that you need the president’s support if cons tu onal change is to be eff ected is a perfect example of this fundamental weakness in a presiden al system, Philippine-style. Think about it: Why should you need (as in this system you do) the President’s—one man’s—support for something to succeed? In a parliamentary system, the majority decides, the prime minister can’t override it. That’s as it should be. So I wouldn’t object if the style of government were included in the review.
CONGRESS CAN RESTRICT ITSELF TO REVIEW OF THE ECONOMIC PROVISIONS ONLY.
Whether the president agrees with it or not he shouldn’t disagree that bringing it into public debate now a er 27 years of phenomenal change in the world would be a healthy thing to do. And there are safeguards, it’s no easy task to change the cons tu on. It doesn’t require just the 50% plus one majority other laws need, it requires a 75% agreement in both houses, then 75% of a joint vote. Then a majority of all Filipinos vo ng in a plebiscite for any change to pass.
Some say, “Not now,” it’s too open to risk of poli cal machina on (to extend terms, for example). But if not now, when? With a President disinterested in a con nuance in power—something that’s unlikely to be ever repeated—this seems an ideal me. But if it’s too controversial and will derail eff orts to amend the economic sec ons only, let’s drop it. The President with the support of business and the public can easily control that the poli cal side doesn’t get included. He has strong majori es in both Houses. He can dictate (look at the examples in the last congress where he did). Whichever is agreed to—a full review, or just the economic sec ons—let’s do it now. We’ll never have a more favorable me. And let’s do it through a two-House cons tuent assembly that focuses on only the economic sec ons. It’s the most feasible op on for now.
THIS IS THE ONLY TIME IT CAN BE DONE.
It would be good if it could be done this year with a plebiscite at year’s end, but holding a plebiscite concurrent with the 2016 elec ons is an acceptable albeit less a rac ve, alterna ve. Either way, as long as it’s done. But the president may wish to consider that if done in 2014 he’s got almost two years of faster growth to his credit.
He’ll leave a country in be er shape than if it’s delayed to 2016, or worse nothing is done.
LET’S HAVE A 2 HOUSE CONSTITUENT ASSEMBLY NOW.
I have been a senior execu ve in business for over 50 years now. I’ve served Aussie companies, U.S. mul na onals (with a 6-year s nt as a regional manager for the Asia Pacifi c) and run my own successful business for 31 years analyzing the Philippines and its opera ng environment. I have nearly a hundred CEO’s who listen to my comments and advice. So it’s just possible I may know a li le about what investors fi nd a rac ve and necessary. They would more than welcome an opening of the Philippine cons tu on, even if the restric ons wouldn’t apply to their business. It would be a strong message of a dis nctly diff erent country that would now be worth a look.
IT’S TIME.
21POLITICAL
Philippine ANALYST February 2014
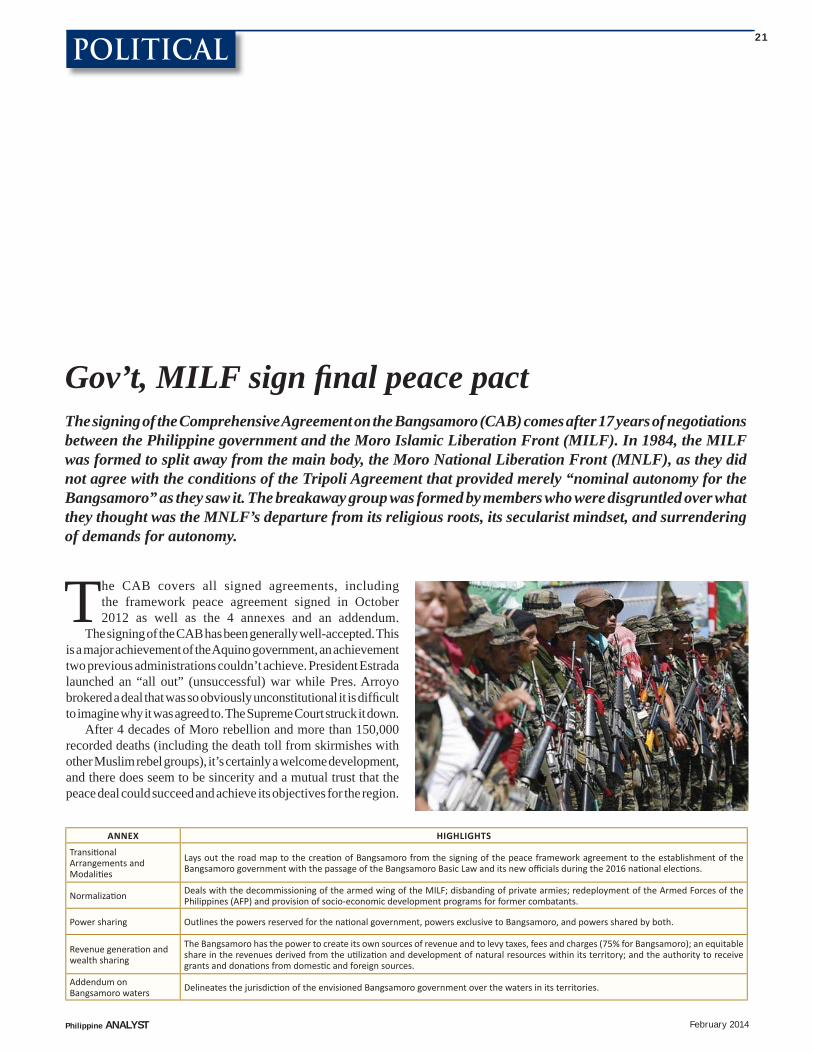
Gov’t, MILF sign fi nal peace pact The signing of the Comprehensive Agreement on the Bangsamoro (CAB) comes after 17 years of negotiations between the Philippine government and the Moro Islamic Liberation Front (MILF). In 1984, the MILF was formed to split away from the main body, the Moro National Liberation Front (MNLF), as they did not agree with the conditions of the Tripoli Agreement that provided merely “nominal autonomy for the Bangsamoro” as they saw it. The breakaway group was formed by members who were disgruntled over what they thought was the MNLF’s departure from its religious roots, its secularist mindset, and surrendering of demands for autonomy.
The CAB covers all signed agreements, including the framework peace agreement signed in October 2012 as well as the 4 annexes and an addendum.
The signing of the CAB has been generally well-accepted. This is a major achievement of the Aquino government, an achievement two previous administrations couldn’t achieve. President Estrada launched an “all out” (unsuccessful) war while Pres. Arroyo brokered a deal that was so obviously unconstitutional it is diffi cult to imagine why it was agreed to. The Supreme Court struck it down.
After 4 decades of Moro rebellion and more than 150,000 recorded deaths (including the death toll from skirmishes with other Muslim rebel groups), it’s certainly a welcome development, and there does seem to be sincerity and a mutual trust that the peace deal could succeed and achieve its objectives for the region.
ANNEX HIGHLIGHTS
Transi onal Arrangements and Modali es
Lays out the road map to the crea on of Bangsamoro from the signing of the peace framework agreement to the establishment of the Bangsamoro government with the passage of the Bangsamoro Basic Law and its new offi cials during the 2016 na onal elec ons.
Normaliza on Deals with the decommissioning of the armed wing of the MILF; disbanding of private armies; redeployment of the Armed Forces of the Philippines (AFP) and provision of socio-economic development programs for former combatants.
Power sharing Outlines the powers reserved for the na onal government, powers exclusive to Bangsamoro, and powers shared by both.
Revenue genera on and wealth sharing
The Bangsamoro has the power to create its own sources of revenue and to levy taxes, fees and charges (75% for Bangsamoro); an equitable share in the revenues derived from the u liza on and development of natural resources within its territory; and the authority to receive grants and dona ons from domes c and foreign sources.
Addendum on Bangsamoro waters Delineates the jurisdic on of the envisioned Bangsamoro government over the waters in its territories.
22 POLITICAL
Philippine ANALYST February 2014
Several groups are optimistic that the remaining crucial steps (e.g. endorsement and approval of the Bangsamoro Basic Law in Congress; holding of a plebiscite to ratify the law; and promulgation and ratifi cation of the statute) would be completed on time and the agreement could truly foster enduring peace in Mindanao.
But already there is a splinter group, the Bangsamoro Islamic Freedom Movement (BIFM) which said it won’t support the agreement. Also, Nur Misuari, the discredited leader of the MNLF, has long questioned it. This “infi ghting” within the MILF, like its rift with the MNLF, shows the limitations of a peace agreement in bringing actual peace and development to a confl ict zone.
The signing of the CAB is an important step. But more crucial now would be the implementation of various development efforts that would complement the fi nal peace accord. The delivery of basic social services (e.g. basic education, skills training, PhilHealth coverage) and access to microfi nancing must be expanded and improved. There must be strict enforcement of the law to keep the public safe. The disbursement of public funds must be transparent and social justice must be provided to all, regardless of socio-economic status.
If these elements are in place, insurgencies become irrelevant. But putting them in place will be quite a challenge, and will be the real test of the success of this peace deal.
Some groups might challenge the constitutionality of the peace accord (i.e. the existence of a ministerial system within a presidential one) in the Supreme Court. But the Philippine government is confident that the peace deal would be able to survive any legal challenge.
Perhaps the most important thing that will be achieved is to break the relationship with al-Qaeda and training for international terrorism. It is the primary reason other governments have come out so strongly in support of the agreement. Access for government troops into currently guarded Muslim encampments will be what will help achieve this.
Congress approval is needed and this will lead to much discussion and compromises to hammer out, taking much of this year to achieve. But the measure is likely to be approved before the end of the year, as President Aquino has already certifi ed the proposed Bangsamoro Basic Law as urgent. The measure can then be ratifi ed by early-2015.
However, approval of the bill in Congress might be challenged by some lawmakers. Power and wealth sharing does not sit well with some non-Muslim representatives from the South since the deal might diminish their clout in the region.
A very complex issue where high passions run has arrived at a remarkable breakthrough. One that, this time, looks likely to prevail. President Aquino can be given much credit for this as he added that level of trust that was missing in previous attempts.
It’s a fragile, complex situation with the implementation of the approved annexes among the major obstacles. Despite these challenges, there’s a level of optimism here that was absent before that gives the peace agreement a fair chance of success.
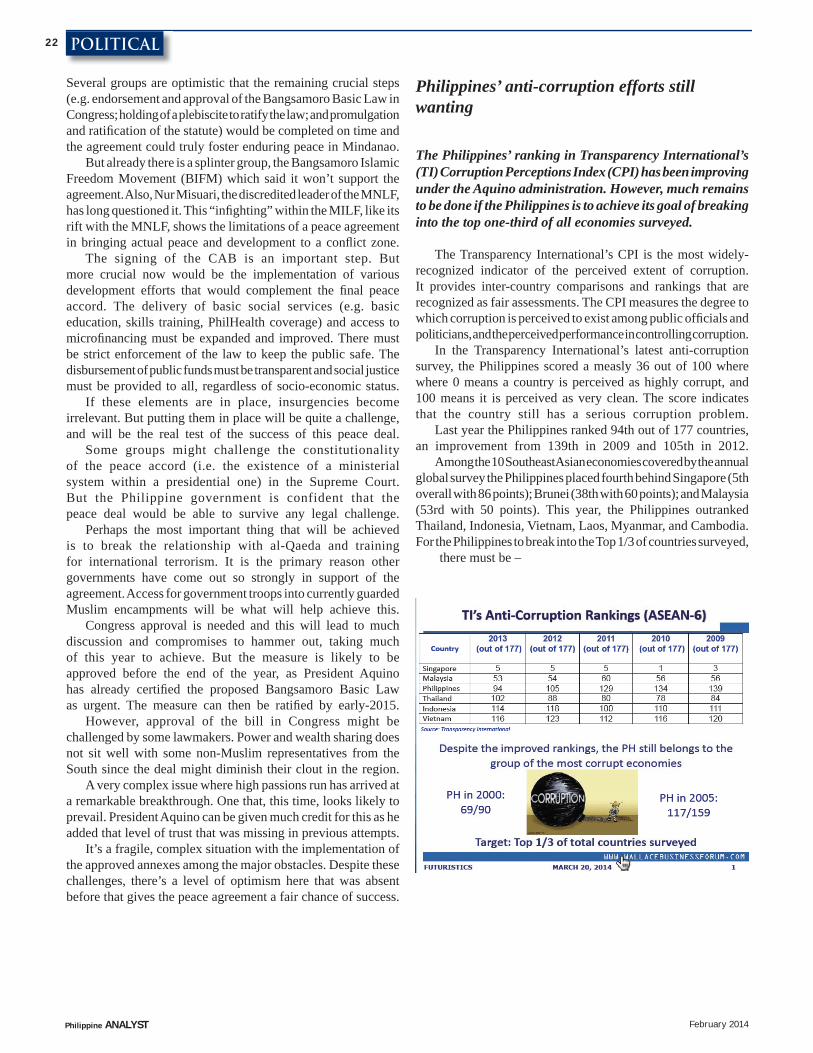
Philippines’ anti-corruption efforts still wanting
The Philippines’ ranking in Transparency International’s (TI) Corruption Perceptions Index (CPI) has been improving under the Aquino administration. However, much remains to be done if the Philippines is to achieve its goal of breaking into the top one-third of all economies surveyed.
The Transparency International’s CPI is the most widely-recognized indicator of the perceived extent of corruption. It provides inter-country comparisons and rankings that are recognized as fair assessments. The CPI measures the degree to which corruption is perceived to exist among public offi cials and politicians, and the perceived performance in controlling corruption.
In the Transparency International’s latest anti-corruption survey, the Philippines scored a measly 36 out of 100 where where 0 means a country is perceived as highly corrupt, and 100 means it is perceived as very clean. The score indicates that the country still has a serious corruption problem.
Last year the Philippines ranked 94th out of 177 countries, an improvement from 139th in 2009 and 105th in 2012.
Among the 10 Southeast Asian economies covered by the annual global survey the Philippines placed fourth behind Singapore (5th overall with 86 points); Brunei (38th with 60 points); and Malaysia (53rd with 50 points). This year, the Philippines outranked Thailand, Indonesia, Vietnam, Laos, Myanmar, and Cambodia. For the Philippines to break into the Top 1/3 of countries surveyed,
there must be –
232POLITICAL
Philippine ANALYST February 2014
1). Sincere, personal commitment of the country’s leaders to reducing corruption
President Aquino’s single-minded attack on corruption has happened at a level unimaginable in prior decades. His anti-corruption program has had some success: former president Arroyo is under hospital arrest, Chief Justice Corona was impeached while Ombudsman Gutierrez resigned.
The Offi ce of the Ombudsman has found probable cause to fi le plunder and graft charges against the lawmakers implicated in the pork barrel fund scam: Senators Juan Ponce Enrile, Jose “Jinggoy” Estrada and Ramon “Bong” Revilla Jr, as well as alleged mastermind Janet Lim-Napoles.
Also, graft cases against ex-military offi cials are being pursued; the Department of Public Works and Highways has been holding competitive biddings while national budgets were approved on time. Reenacted budgets are prone to corrupt practices.
Despite these measures, institutionalized corruption has not been addressed. Corruption among local government units (LGUs) is still widespread
2). Public awareness campaigns against corruption; prosecution of high-profi le corruption cases
The people can be a driving force, as the outrage over pork barrel showed. Also, social media has revolutionized public participation, and has made it an effective force.
A Freedom of Information (FOI) law is now needed if the President is truly serious about an honest government. Businessmen believe that a strong FOI law will signifi cantly reduce corruption (SWS survey). Despite this, President Aquino has been reluctant to certify the measure as urgent.
3). Strengthening of anti-corruption agencies such as the Offi ce of the Ombudsman
The Offi ce of the Ombudsman needs to increase its capacity to successfully prosecute erring offi cials in high-profi le cases. This will require beefi ng up and training its prosecutors and investigators. And be given proposer compensation. The proposed amendments to the Ombudsman Act (e.g. enabling the agency to look into bank accounts even prior to the fi ling of a case in court and issue freeze orders on unlawfully-acquired assets for 6 months) must be
4 Prosecution of a few high profi le anti-corruption cases The cases against lawmakers allegedly involved in the pork
barrel scam must be pursued aggressively. Previously, cases against high-level government offi cials were thrown out as prosecutors failed to build up strong cases. Will this happen to lawmakers and GOCC offi cials implicated in the pork barrel controversy? They must be held accountable if true reform is to happen. This is an ULTIMATE test. If President Aquino can do it it’s revolutionary
But the courts must co-operate
5). Enactment of economic reform bills The approval of economic reform measures is important to
enhance openness and competition, and reduce discretion. Among the pending bills in Congress that address these is the Anti-Trust or Fair Competition bill. The proposed measure aims to foster a more level playing fi eld in business and reduce monopolies, oligopolies, and anti-competitive behavior. In 2011, President Aquino designated DOJ as the competition Authority. The bill, despite being a priority of the House of Representatives, is still pending on 1st reading in both chambers of Congress. In the 15th Congress, the bill reached only 2nd reading in both Houses
6). Implementation of reforms in the governance of state-led fi rms
The GOCC Governance Act (RA 10149) was signed into law in 2011 but with limited power. The GOCC commission’s control over the state fi rms must be expanded amidst the pork barrel issue. State-led fi rms have been implicated as conduits of anomalous PDAF allocations
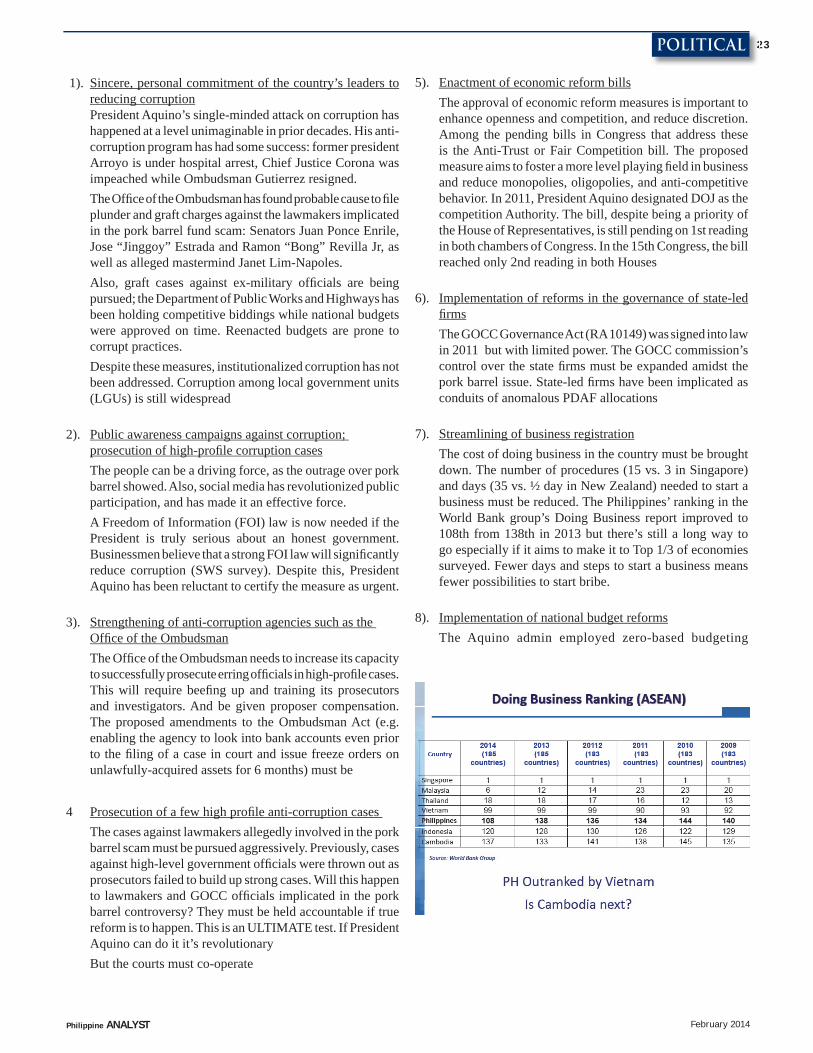
7). Streamlining of business registration The cost of doing business in the country must be brought
down. The number of procedures (15 vs. 3 in Singapore) and days (35 vs. ½ day in New Zealand) needed to start a business must be reduced. The Philippines’ ranking in the World Bank group’s Doing Business report improved to 108th from 138th in 2013 but there’s still a long way to go especially if it aims to make it to Top 1/3 of economies surveyed. Fewer days and steps to start a business means fewer possibilities to start bribe.
8). Implementation of national budget reforms The Aquino admin employed zero-based budgeting
24 POLITICAL
Philippine ANALYST February 2014
scheme from the beginning and terminated ineffi cient and questionable programs and increased funding for key initiatives. It also did away with re-enacted budgets, which were vulnerable to corrupt practices.
In that 2014 budget, the corruption-prone Special Allotment Release Order (SARO) system was abolished
9). Push for the enactment of the Freedom of Information bill and other anti-corruption measures.
The measure aims to promote transparency in government transactions. It has been pending in Congress for 22 years. The Senate has approved its version on 3rd and fi nal reading but the counterpart measure in the House of Representatives is still pending on 1st reading. President Aquino must certify the bill as urgent, like what he did with other landmark laws – the Reproductive Health and the Sin Tax Reform.
The Aquino administration must implement these measures if it wants to give the impression that it is serious in combatting corruption.
The Philippine government must seriously address corruption if it wants to attract more job-generating investments. Businessmen would be hesitant to transact with agencies riddled with corruption and with a government that is unable to prosecute corrupt offi cials. President Aquino’s anti-corruption agenda must be anchored with his goal of achieving ‘inclusive growth’ or economic growth that benefi ts the poor.
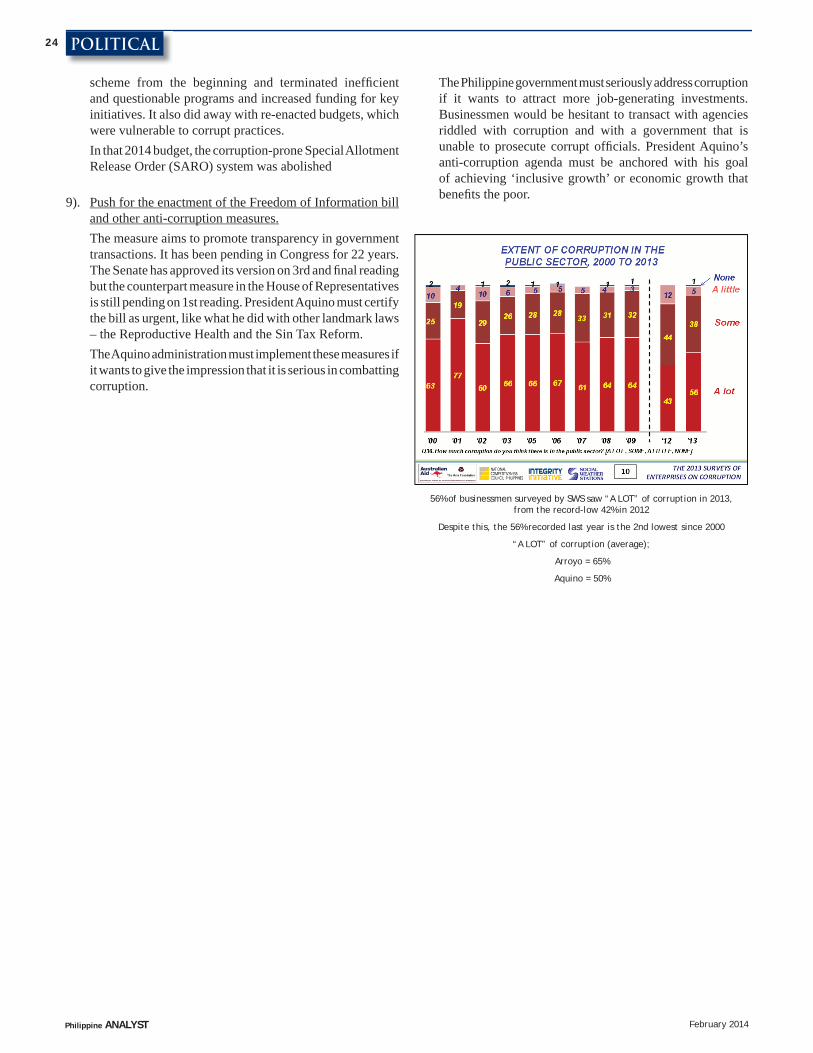
56% of businessmen surveyed by SWS saw “A LOT” of corruption in 2013, from the record-low 42% in 2012
Despite this, the 56% recorded last year is the 2nd lowest since 2000
“A LOT” of corruption (average);
Arroyo = 65%
Aquino = 50%
25ECONOMY
Philippine ANALYST February 2014
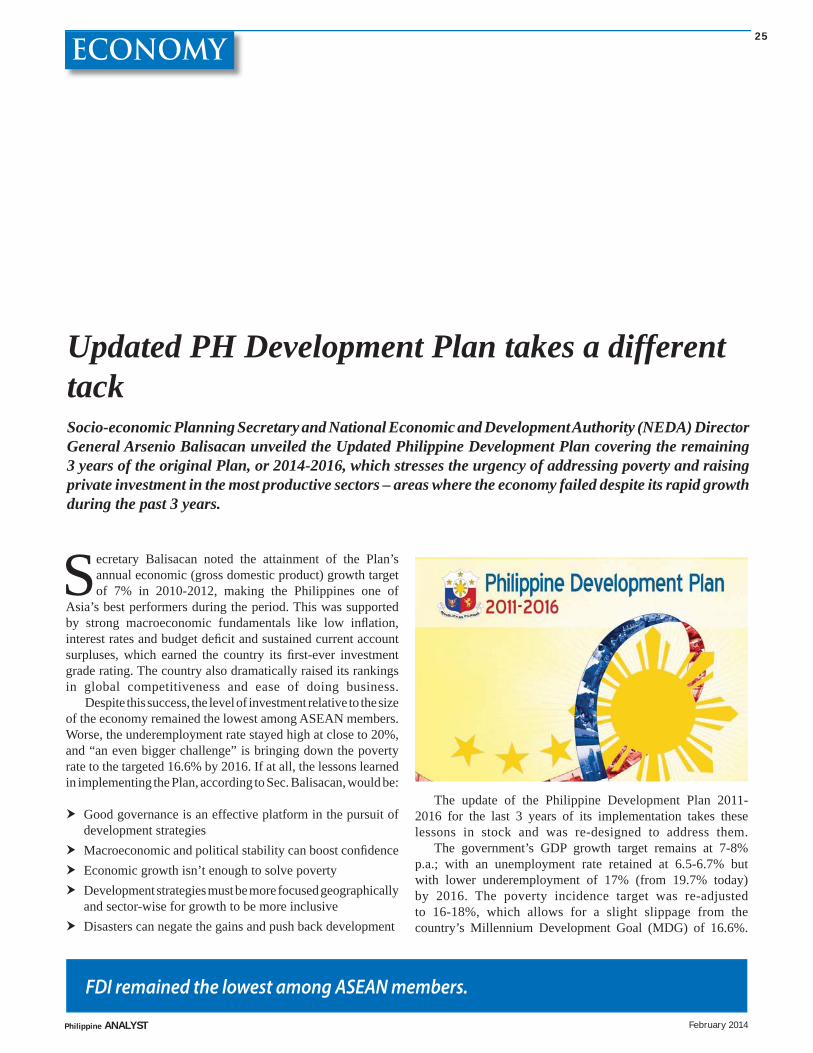
Updated PH Development Plan takes a different tackSocio-economic Planning Secretary and National Economic and Development Authority (NEDA) Director General Arsenio Balisacan unveiled the Updated Philippine Development Plan covering the remaining 3 years of the original Plan, or 2014-2016, which stresses the urgency of addressing poverty and raising private investment in the most productive sectors – areas where the economy failed despite its rapid growth during the past 3 years.
Secretary Balisacan noted the attainment of the Plan’s annual economic (gross domestic product) growth target of 7% in 2010-2012, making the Philippines one of
Asia’s best performers during the period. This was supported by strong macroeconomic fundamentals like low infl ation, interest rates and budget defi cit and sustained current account surpluses, which earned the country its fi rst-ever investment grade rating. The country also dramatically raised its rankings in global competitiveness and ease of doing business.
Despite this success, the level of investment relative to the size of the economy remained the lowest among ASEAN members. Worse, the underemployment rate stayed high at close to 20%, and “an even bigger challenge” is bringing down the poverty rate to the targeted 16.6% by 2016. If at all, the lessons learned in implementing the Plan, according to Sec. Balisacan, would be:
Good governance is an effective platform in the pursuit of development strategies
Macroeconomic and political stability can boost confi dence Economic growth isn’t enough to solve poverty Development strategies must be more focused geographically
and sector-wise for growth to be more inclusive Disasters can negate the gains and push back development
FDI remained the lowest among ASEAN members.
The update of the Philippine Development Plan 2011-2016 for the last 3 years of its implementation takes these lessons in stock and was re-designed to address them.
The government’s GDP growth target remains at 7-8% p.a.; with an unemployment rate retained at 6.5-6.7% but with lower underemployment of 17% (from 19.7% today) by 2016. The poverty incidence target was re-adjusted to 16-18%, which allows for a slight slippage from the country’s Millennium Development Goal (MDG) of 16.6%.
26 ECONOMY
Philippine ANALYST February 2014
A new feature of poverty targeting under the updated Plan is the focus on “multi-dimensional poverty incidence,” which looks at other dimensions of poverty – health, education, access to water, sanitation, social housing, etc. – rather than just the traditional income poverty concept on which the 16-18% target was set. Whilst the new concept may have its merits, it might divert some attention away from a likely shortfall in the income-based target, which is the basis in international poverty comparison and is in fact a key indicator in the MDG. An indicator like the Human Development Index (HDI) probably fi ts better in measuring multi-dimensional poverty, but no target has been set for this in the updated Plan.
Another innovation is implementing appropriate interventions to attain inclusive growth based on specifi c categories of geographic areas:
For Category 1 cities and provinces, which are growing rapidly but with large absolute number of poor (but not necessarily high percentage incidence of poor households) which are being left behind by the growth, the intervention will essentially consist of skills development and matching; promotion of industries where global competitiveness can be potentially developed for increased job creation (IT-BPO, tourism, construction, manufacturing and logistics); and providing other support social services for the poorest households. These provinces include Cebu, Pangasinan, Negros Occidental, Iloilo and Davao del Sur.
For Category 2 areas with slow economic progress and high poverty incidence, the approach will be to provide basic social services, promoting livelihood and small businesses, and improving access and connections to centers of opportunity. These provinces include Lanao del Sur, Maguindanao, Eastern Samar, Saranggani, North Cotabato, Masbate and Northern Samar.
For Category 3 which refer to those most vulnerable to major natural catastrophes, the objective is to make them resilient to the impact of disasters by updating geo-hazard maps, land use plans, training them for disaster response, and building more resilient and stronger structures. Thirty vulnerable provinces have been identifi ed to benefi t from these interventions.
For the whole country, the thrusts are for the government to establish a policy and regulatory framework that will catalyze private initiative and encourage effi ciency improvements. The government says it will intervene strategically where the private sector is unable to deliver the goods, services and facilities needed by the poor.The Plan’s success will be measured in terms of
efficiency and effectiveness. Efficiency is its ability to steer private activity into the direction laid out in the Plan. Effectiveness is the extent in which quality of life is improved.
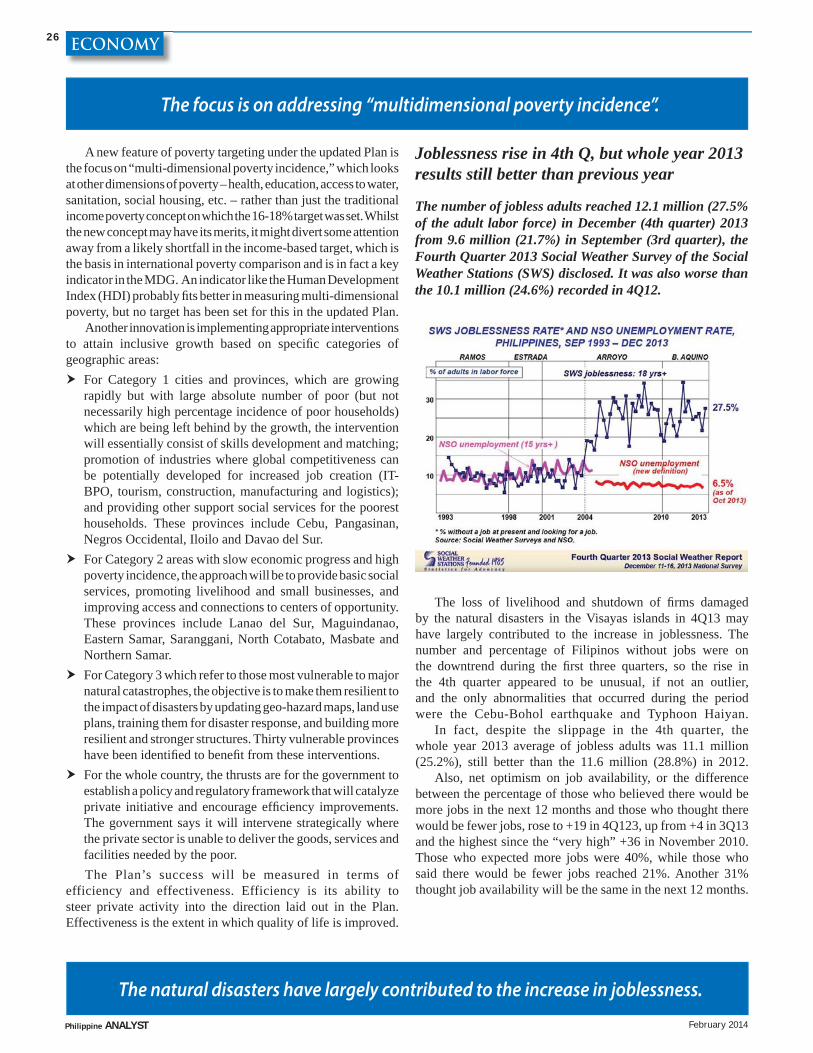
Joblessness rise in 4th Q, but whole year 2013 results still better than previous year
The number of jobless adults reached 12.1 million (27.5% of the adult labor force) in December (4th quarter) 2013 from 9.6 million (21.7%) in September (3rd quarter), the Fourth Quarter 2013 Social Weather Survey of the Social Weather Stations (SWS) disclosed. It was also worse than the 10.1 million (24.6%) recorded in 4Q12.
The focus is on addressing “multidimensional poverty incidence”.
The natural disasters have largely contributed to the increase in joblessness.
The loss of livelihood and shutdown of fi rms damaged by the natural disasters in the Visayas islands in 4Q13 may have largely contributed to the increase in joblessness. The number and percentage of Filipinos without jobs were on the downtrend during the fi rst three quarters, so the rise in the 4th quarter appeared to be unusual, if not an outlier, and the only abnormalities that occurred during the period were the Cebu-Bohol earthquake and Typhoon Haiyan.
In fact, despite the slippage in the 4th quarter, the whole year 2013 average of jobless adults was 11.1 million (25.2%), still better than the 11.6 million (28.8%) in 2012.
Also, net optimism on job availability, or the difference between the percentage of those who believed there would be more jobs in the next 12 months and those who thought there would be fewer jobs, rose to +19 in 4Q123, up from +4 in 3Q13 and the highest since the “very high” +36 in November 2010. Those who expected more jobs were 40%, while those who said there would be fewer jobs reached 21%. Another 31% thought job availability will be the same in the next 12 months.

272ECONOMY
Philippine ANALYST February 2014
The sharp rise in net optimism could be another indication that respondents saw the increase in joblessness in the 4th quarter as a temporary phenomenon, resulting from businesses that were forced to shut down due to damage to their facilities. When the facilities are repaired and normal operations resume, many respondents see a recovery in jobs.
Of the jobless in the 4th quarter, 13.5% voluntarily resigned, 10.4% were retrenched, and 3.5% were fi rst time jobseekers. Of those retrenched, 6.8% were due to non-renewal of contracts, 2% due to lay-offs, and 1.6% due to closure of business.
SWS defi nes joblessness as individuals 18 years old and older who are not working but are looking for a job. The government’s defi nition of unemployment (6.5% in 4Q13; 7.1% whole year 2013 average) covers those 15 years old and above who are without work, are looking for work, and are available for work. Unlike the government, SWS counts the job-seekers who are not available for work as jobless. According to SWS, those seeking work but not available for work was 5.6 million in the 4th quarter, the amount of “understatement” in the government’s unemployment fi gure among the 18 years old and above during the same quarter.
The 4th quarter survey was conducted nationwide on 11-16 December, with 1,550 adult respondents in face-to-face interviews. There were 300 respondents each from Metro Manila, Balance of Luzon and Mindanao, and 650 from Visayas. For the national percentages, the margin of error is +2.5%. For Metro Manila, Balance of Luzon and Mindanao, it is + 6%, and for Visayas the margin of error is 4%-points.
Economists support amendment to economic provisions of the Constitution
The Foundation for Economic Freedom (FEF) has expressed its support to the proposal in the House of Representatives to amend the economic provisions of the Constitution by inserting the phrase “unless provided by law” to the foreign ownership restrictions in the Constitution in public utilities, land, mass media and advertising, educational institutions, and development of natural resources.
The support is contained in the position paper entitled “Chacha Now!” the group publicly released on 3 February. FEF is a public advocacy organization that promotes political and economic liberty, secure and well-defi ned property rights, market-oriented reforms, consumer welfare and protection, the values of effi ciency and equity in an interdependent global economy, and good governance.
It counts among its members former and present economic managers, such as economic planning secretaries Gerardo Sicat, Cayetano Paderanga Jr., Felipe Medalla, Dante Canlas,
Romulo Neri and Arsenio Balisacan, and former fi nance secretaries Cesar E. A. Viarata, Roberto de Ocampo, Ernest Leung and Gary Teves; leading fi gures in the academe, such as Drs. Ernest Pernia, Epectitus Patalinghug and Mahar Mangahas; respected media personalities and opinion makers, including Claixto Chikiamco and Boo Chanco; and prominent members in the business community, including Peter Wallace, John Forbes, Simon Paterno and Victor Limlingan.
In January, the House fi led House Resolution No. 1, with Speaker Feliciano Belmonte as sponsor, proposing the amendment of the Constitution by inserting in its restrictive economic provisions the phrase “unless otherwise provided by law.” This means the present restrictions stay unless Congress lifts them, in part or in full, in a later law and the President agrees to the lifting.
According to Speaker Belmonte, other Charter change advocates in the House, especially those who preferred constitutional convention as mode for making the change, have agreed to rally behind his simpler amendment. He added that the resolution has the support of several groups of local and foreign businessmen. He expressed confi dence that it will be passed before the current session of Congress ends on 13 June 2014.
The Senate is said to be “keeping an open mind” on the proposal, and will act promptly as soon as the House approves it. Then it goes to Pres. Aquino for signing, where Speaker Belmonte said it’s up to the President whether to veto it or not1. Once cleared by both Congress and the Chief Executive, the amendment will be subjected to a national plebiscite.
FEF urged Pres. Aquino to reconsider his stand of status quo on amending the Constitution to allow the holding of a national plebiscite on the amendment by 2016, preferably earlier. The Foundation said that “vesting on Congress, rather than the Constitution, the power to determine the restrictions in foreign ownership will send a strong signal to foreign investors that the government will level the playing fi eld by opening up the economy as conditions permit.”
FEF believed opening up the economy to foreign investors will increase foreign direct investment (FDI) in the country, helping attain “inclusive growth” and signifi cant reduction of poverty. The Philippines is the lowest recipient of FDI amongst its neighbors. Despite the rapid growth for the 2nd straight year, FDI into the Philippines barely reached $4 billion, not even half of “low performers” Malaysia and Thailand, with each attracting more than $8 billion in 2013.
Respondents saw the increase in joblessness as a temporary phenomenon.
Insert the phrase “unless otherwise provided by law”
1 The President vetoing a bill passed by Congress with at least 2/3 of its members voting in favor of the bill will become a law if Congress approves the vetoed bill again with at least 2/3 votes.
28 ECONOMY
Philippine ANALYST February 2014
The economic restrictions being addressed by the proposed amendment are the 40% limit on foreign ownership in the development of natural resources, public utilities, educational institutions (except schools run by religious organizations) and areas recommended by the National Economic and Development Authority (NEDA) to be of national interest; 30% limit on foreign ownership in advertising; and the total ban on FDI in mass media and agricultural lands.
While admitting that the proposed change “will not immediately liberalize the economy,” FEF nonetheless sees the Belmonte proposal as the providing the means for making the changes as needed, and key to opening up the economy.
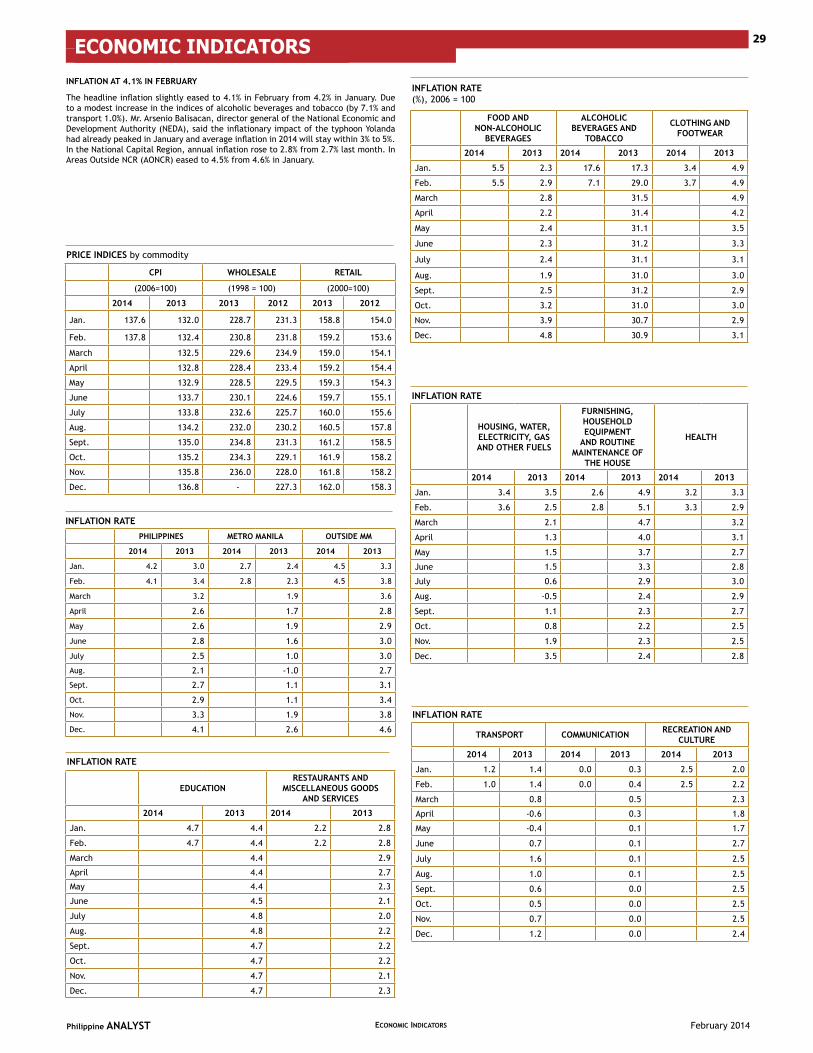
February 2014Philippine ANALYST ECONOMIC INDICATORS
ECONOMIC INDICATORS 29
inflation rate(%), 2006 = 100
price inDices by commodity
inflation rate
inflation rate
inflation rate
inflation rate
cpi WHolesale retail
(2006=100) (1998 = 100) (2000=100)
2014 2013 2013 2012 2013 2012
Jan. 137.6 132.0 228.7 231.3 158.8 154.0
Feb. 137.8 132.4 230.8 231.8 159.2 153.6
March 132.5 229.6 234.9 159.0 154.1
April 132.8 228.4 233.4 159.2 154.4
May 132.9 228.5 229.5 159.3 154.3
June 133.7 230.1 224.6 159.7 155.1
July 133.8 232.6 225.7 160.0 155.6
Aug. 134.2 232.0 230.2 160.5 157.8
Sept. 135.0 234.8 231.3 161.2 158.5
Oct. 135.2 234.3 229.1 161.9 158.2
Nov. 135.8 236.0 228.0 161.8 158.2
Dec. 136.8 - 227.3 162.0 158.3
Housing, Water, electricity, gas anD otHer fuels
furnisHing, HouseHolD equipment
anD routine maintenance of
tHe House
HealtH
2014 2013 2014 2013 2014 2013
Jan. 3.4 3.5 2.6 4.9 3.2 3.3
Feb. 3.6 2.5 2.8 5.1 3.3 2.9
March 2.1 4.7 3.2
April 1.3 4.0 3.1
May 1.5 3.7 2.7
June 1.5 3.3 2.8
July 0.6 2.9 3.0
Aug. -0.5 2.4 2.9
Sept. 1.1 2.3 2.7
Oct. 0.8 2.2 2.5
Nov. 1.9 2.3 2.5
Dec. 3.5 2.4 2.8
fooD anD non-alcoHolic
Beverages
alcoHolic Beverages anD
toBacco
clotHing anD footWear
2014 2013 2014 2013 2014 2013
Jan. 5.5 2.3 17.6 17.3 3.4 4.9
Feb. 5.5 2.9 7.1 29.0 3.7 4.9
March 2.8 31.5 4.9
April 2.2 31.4 4.2
May 2.4 31.1 3.5
June 2.3 31.2 3.3
July 2.4 31.1 3.1
Aug. 1.9 31.0 3.0
Sept. 2.5 31.2 2.9
Oct. 3.2 31.0 3.0
Nov. 3.9 30.7 2.9
Dec. 4.8 30.9 3.1
transport communication recreation anD culture
2014 2013 2014 2013 2014 2013
Jan. 1.2 1.4 0.0 0.3 2.5 2.0
Feb. 1.0 1.4 0.0 0.4 2.5 2.2
March 0.8 0.5 2.3
April -0.6 0.3 1.8
May -0.4 0.1 1.7
June 0.7 0.1 2.7
July 1.6 0.1 2.5
Aug. 1.0 0.1 2.5
Sept. 0.6 0.0 2.5
Oct. 0.5 0.0 2.5
Nov. 0.7 0.0 2.5
Dec. 1.2 0.0 2.4
eDucationrestaurants anD
miscellaneous gooDs anD services
2014 2013 2014 2013
Jan. 4.7 4.4 2.2 2.8
Feb. 4.7 4.4 2.2 2.8
March 4.4 2.9
April 4.4 2.7
May 4.4 2.3
June 4.5 2.1
July 4.8 2.0
Aug. 4.8 2.2
Sept. 4.7 2.2
Oct. 4.7 2.2
Nov. 4.7 2.1
Dec. 4.7 2.3
pHilippines metro manila outsiDe mm
2014 2013 2014 2013 2014 2013
Jan. 4.2 3.0 2.7 2.4 4.5 3.3
Feb. 4.1 3.4 2.8 2.3 4.5 3.8
March 3.2 1.9 3.6
April 2.6 1.7 2.8
May 2.6 1.9 2.9
June 2.8 1.6 3.0
July 2.5 1.0 3.0
Aug. 2.1 -1.0 2.7
Sept. 2.7 1.1 3.1
Oct. 2.9 1.1 3.4
Nov. 3.3 1.9 3.8
Dec. 4.1 2.6 4.6
inflation at 4.1% in feBruary
The headline inflation slightly eased to 4.1% in February from 4.2% in January. Due to a modest increase in the indices of alcoholic beverages and tobacco (by 7.1% and transport 1.0%). Mr. Arsenio Balisacan, director general of the National Economic and Development Authority (NEDA), said the inflationary impact of the typhoon Yolanda had already peaked in January and average inflation in 2014 will stay within 3% to 5%. In the National Capital Region, annual inflation rose to 2.8% from 2.7% last month. In Areas Outside NCR (AONCR) eased to 4.5% from 4.6% in January.
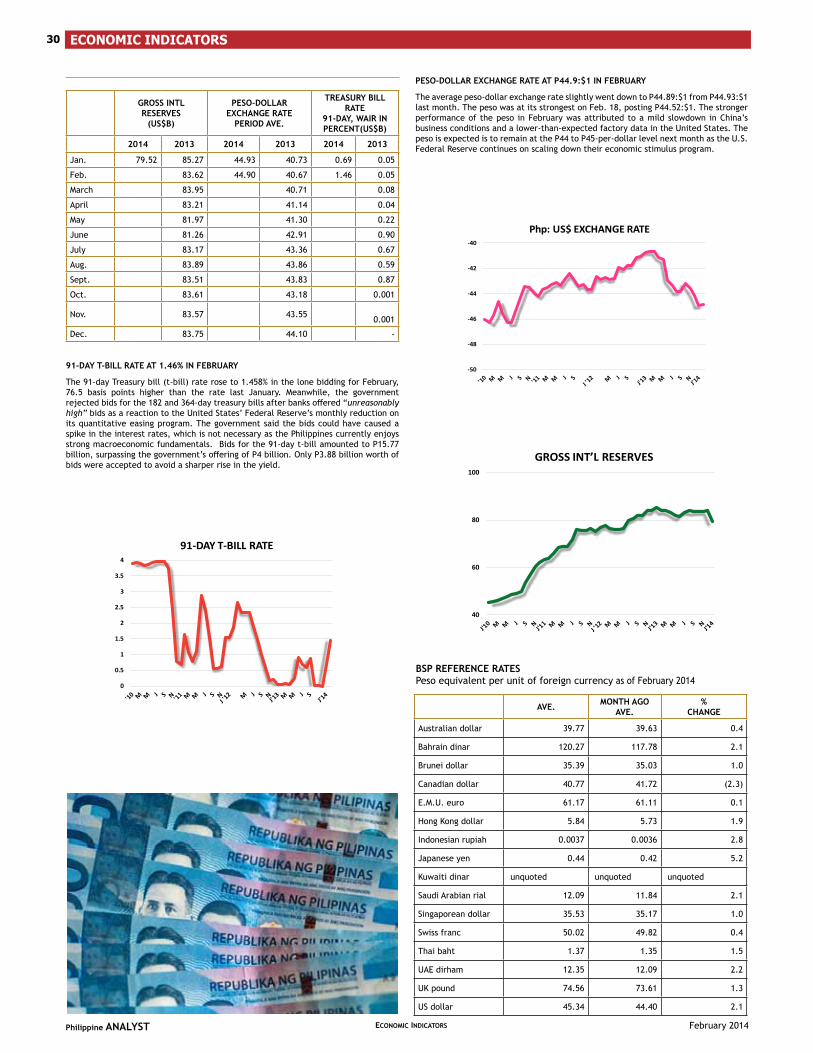
ECONOMIC INDICATORS30
February 2014Philippine ANALYST ECONOMIC INDICATORS
peso-Dollar eXcHange rate at p44.9:$1 in feBruary
The average peso-dollar exchange rate slightly went down to P44.89:$1 from P44.93:$1 last month. The peso was at its strongest on Feb. 18, posting P44.52:$1. The stronger performance of the peso in February was attributed to a mild slowdown in China’s business conditions and a lower-than-expected factory data in the United States. The peso is expected is to remain at the P44 to P45-per-dollar level next month as the U.S. Federal Reserve continues on scaling down their economic stimulus program.
Bsp reference rates Peso equivalent per unit of foreign currency as of February 2014
91-Day t-Bill rate at 1.46% in feBruary
The 91-day Treasury bill (t-bill) rate rose to 1.458% in the lone bidding for February, 76.5 basis points higher than the rate last January. Meanwhile, the government rejected bids for the 182 and 364-day treasury bills after banks offered “unreasonably high” bids as a reaction to the United States’ Federal Reserve’s monthly reduction on its quantitative easing program. The government said the bids could have caused a spike in the interest rates, which is not necessary as the Philippines currently enjoys strong macroeconomic fundamentals. Bids for the 91-day t-bill amounted to P15.77 billion, surpassing the government’s offering of P4 billion. Only P3.88 billion worth of bids were accepted to avoid a sharper rise in the yield.
gross intlreserves
(us$B)
peso-DollareXcHange rate
perioD ave.
treasury Bill rate
91-Day, Wair in percent(us$B)
2014 2013 2014 2013 2014 2013
Jan. 79.52 85.27 44.93 40.73 0.69 0.05
Feb. 83.62 44.90 40.67 1.46 0.05
March 83.95 40.71 0.08
April 83.21 41.14 0.04
May 81.97 41.30 0.22
June 81.26 42.91 0.90
July 83.17 43.36 0.67
Aug. 83.89 43.86 0.59
Sept. 83.51 43.83 0.87
Oct. 83.61 43.18 0.001
Nov. 83.57 43.55 0.001
Dec. 83.75 44.10 -
ave. montH agoave.
%cHange
Australian dollar 39.77 39.63 0.4
Bahrain dinar 120.27 117.78 2.1
Brunei dollar 35.39 35.03 1.0
Canadian dollar 40.77 41.72 (2.3)
E.M.U. euro 61.17 61.11 0.1
Hong Kong dollar 5.84 5.73 1.9
Indonesian rupiah 0.0037 0.0036 2.8
Japanese yen 0.44 0.42 5.2
Kuwaiti dinar unquoted unquoted unquoted
Saudi Arabian rial 12.09 11.84 2.1
Singaporean dollar 35.53 35.17 1.0
Swiss franc 50.02 49.82 0.4
Thai baht 1.37 1.35 1.5
UAE dirham 12.35 12.09 2.2
UK pound 74.56 73.61 1.3
US dollar 45.34 44.40 2.1
-50
-48
-46
-44
-42
-40
Php: US$ EXCHANGE RATE
0
0.5
1
1.5
2
2.5
3
3.5
4
91-DAY T-BILL RATE
40
60
80
100
GROSS INT’L RESERVES
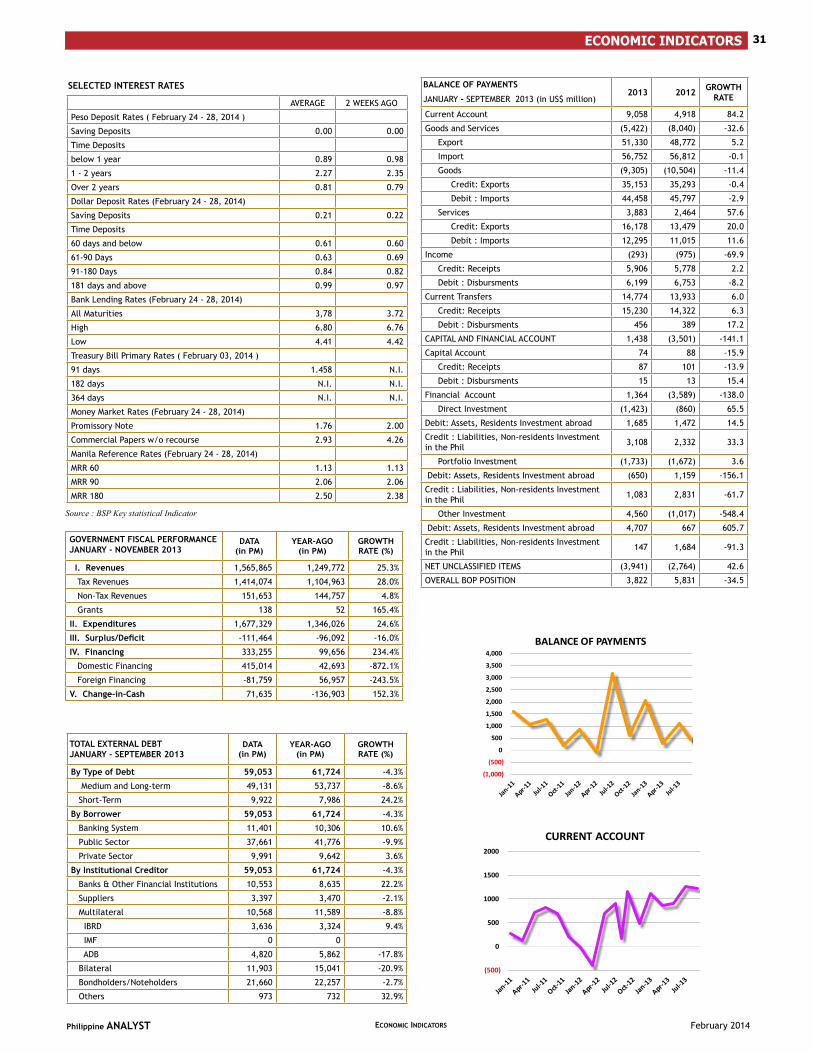
31ECONOMIC INDICATORS
February 2014Philippine ANALYST ECONOMIC INDICATORS
Data(in pm)
year-ago(in pm)
groWtHrate (%)
i. revenues 1,565,865 1,249,772 25.3%
Tax Revenues 1,414,074 1,104,963 28.0%
Non-Tax Revenues 151,653 144,757 4.8%
Grants 138 52 165.4%
ii. expenditures 1,677,329 1,346,026 24.6%
III. Surplus/Deficit -111,464 -96,092 -16.0%
IV. Financing 333,255 99,656 234.4%
Domestic Financing 415,014 42,693 -872.1%
Foreign Financing -81,759 56,957 -243.5%
V. Change-in-Cash 71,635 -136,903 152.3%
Data(in pm)
year-ago(in pm)
groWtHrate (%)
By type of Debt 59,053 61,724 -4.3%
Medium and Long-term 49,131 53,737 -8.6%
Short-Term 9,922 7,986 24.2%
By Borrower 59,053 61,724 -4.3%
Banking System 11,401 10,306 10.6%
Public Sector 37,661 41,776 -9.9%
Private Sector 9,991 9,642 3.6%
By institutional creditor 59,053 61,724 -4.3%
Banks & Other Financial Institutions 10,553 8,635 22.2%
Suppliers 3,397 3,470 -2.1%
Multilateral 10,568 11,589 -8.8%
IBRD 3,636 3,324 9.4%
IMF 0 0
ADB 4,820 5,862 -17.8%
Bilateral 11,903 15,041 -20.9%
Bondholders/Noteholders 21,660 22,257 -2.7%
Others 973 732 32.9%
2013 2012 groWtH rate
Current Account 9,058 4,918 84.2
Goods and Services (5,422) (8,040) -32.6
Export 51,330 48,772 5.2
Import 56,752 56,812 -0.1
Goods (9,305) (10,504) -11.4
Credit: Exports 35,153 35,293 -0.4
Debit : Imports 44,458 45,797 -2.9
Services 3,883 2,464 57.6
Credit: Exports 16,178 13,479 20.0
Debit : Imports 12,295 11,015 11.6
Income (293) (975) -69.9
Credit: Receipts 5,906 5,778 2.2
Debit : Disbursments 6,199 6,753 -8.2
Current Transfers 14,774 13,933 6.0
Credit: Receipts 15,230 14,322 6.3
Debit : Disbursments 456 389 17.2
CAPITAL AND FINANCIAL ACCOUNT 1,438 (3,501) -141.1
Capital Account 74 88 -15.9
Credit: Receipts 87 101 -13.9
Debit : Disbursments 15 13 15.4
Financial Account 1,364 (3,589) -138.0
Direct Investment (1,423) (860) 65.5
Debit: Assets, Residents Investment abroad 1,685 1,472 14.5
Credit : Liabilities, Non-residents Investment in the Phil 3,108 2,332 33.3
Portfolio Investment (1,733) (1,672) 3.6
Debit: Assets, Residents Investment abroad (650) 1,159 -156.1
Credit : Liabilities, Non-residents Investment in the Phil 1,083 2,831 -61.7
Other Investment 4,560 (1,017) -548.4
Debit: Assets, Residents Investment abroad 4,707 667 605.7
Credit : Liabilities, Non-residents Investment in the Phil 147 1,684 -91.3
NET UNCLASSIFIED ITEMS (3,941) (2,764) 42.6
OVERALL BOP POSITION 3,822 5,831 -34.5
government fiscal performance January - novemBer 2013
total eXternal DeBt January - septemBer 2013
selecteD interest rates
Source : BSP Key statistical Indicator
Balance of payments
JANUARY - SEPTEMBER 2013 (in US$ million)
(500)
0
500
1000
1500
2000
CURRENT ACCOUNT
(1,000)
(500)
0
500
1,000
1,500
2,000
2,500
3,000
3,500
4,000BALANCE OF PAYMENTS
AVERAGE 2 WEEKS AGO
Peso Deposit Rates ( February 24 - 28, 2014 )
Saving Deposits 0.00 0.00
Time Deposits
below 1 year 0.89 0.98
1 - 2 years 2.27 2.35
Over 2 years 0.81 0.79
Dollar Deposit Rates (February 24 - 28, 2014)
Saving Deposits 0.21 0.22
Time Deposits
60 days and below 0.61 0.60
61-90 Days 0.63 0.69
91-180 Days 0.84 0.82
181 days and above 0.99 0.97
Bank Lending Rates (February 24 - 28, 2014)
All Maturities 3,78 3.72
High 6.80 6.76
Low 4.41 4.42
Treasury Bill Primary Rates ( February 03, 2014 )
91 days 1.458 N.I.
182 days N.I. N.I.
364 days N.I. N.I.
Money Market Rates (February 24 - 28, 2014)
Promissory Note 1.76 2.00
Commercial Papers w/o recourse 2.93 4.26
Manila Reference Rates (February 24 - 28, 2014)
MRR 60 1.13 1.13
MRR 90 2.06 2.06
MRR 180 2.50 2.38
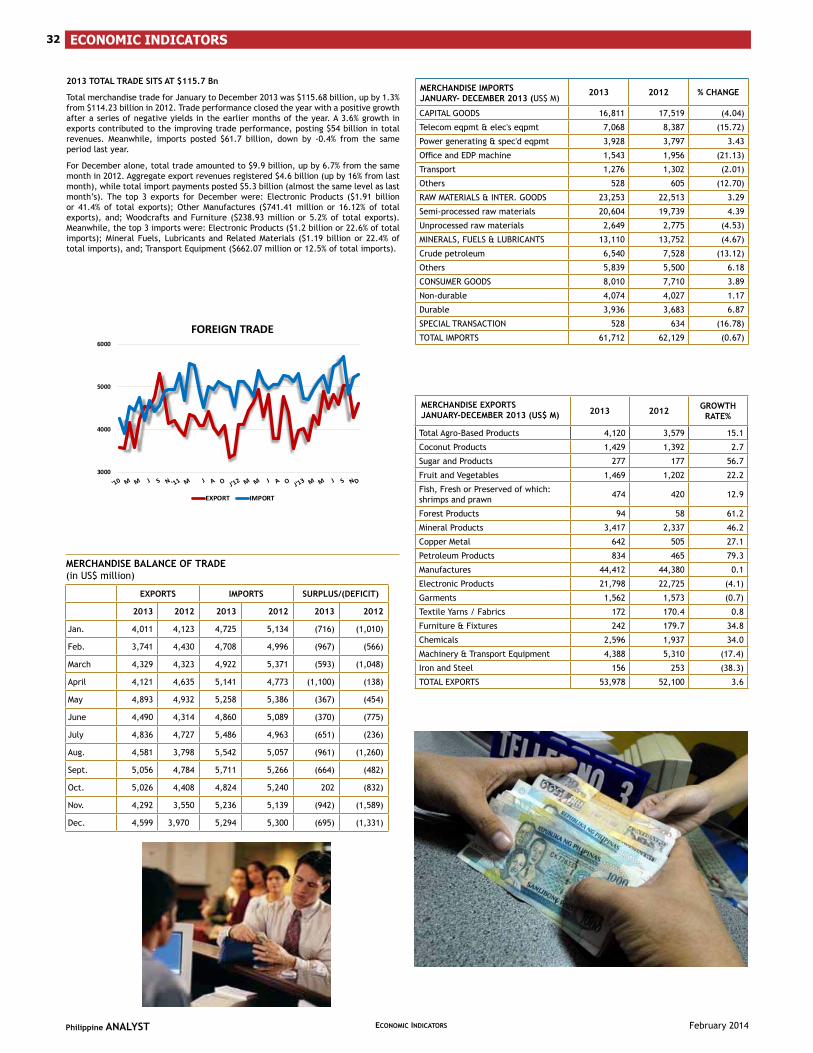
ECONOMIC INDICATORS32
February 2014Philippine ANALYST ECONOMIC INDICATORS
2013 2012 groWtH rate%
Total Agro-Based Products 4,120 3,579 15.1
Coconut Products 1,429 1,392 2.7
Sugar and Products 277 177 56.7
Fruit and Vegetables 1,469 1,202 22.2
Fish, Fresh or Preserved of which: shrimps and prawn 474 420 12.9
Forest Products 94 58 61.2
Mineral Products 3,417 2,337 46.2
Copper Metal 642 505 27.1
Petroleum Products 834 465 79.3
Manufactures 44,412 44,380 0.1
Electronic Products 21,798 22,725 (4.1)
Garments 1,562 1,573 (0.7)
Textile Yarns / Fabrics 172 170.4 0.8
Furniture & Fixtures 242 179.7 34.8
Chemicals 2,596 1,937 34.0
Machinery & Transport Equipment 4,388 5,310 (17.4)
Iron and Steel 156 253 (38.3)
TOTAL EXPORTS 53,978 52,100 3.6
2013 2012 % cHange
CAPITAL GOODS 16,811 17,519 (4.04)
Telecom eqpmt & elec's eqpmt 7,068 8,387 (15.72)
Power generating & spec'd eqpmt 3,928 3,797 3.43
Office and EDP machine 1,543 1,956 (21.13)
Transport 1,276 1,302 (2.01)
Others 528 605 (12.70)
RAW MATERIALS & INTER. GOODS 23,253 22,513 3.29
Semi-processed raw materials 20,604 19,739 4.39
Unprocessed raw materials 2,649 2,775 (4.53)
MINERALS, FUELS & LUBRICANTS 13,110 13,752 (4.67)
Crude petroleum 6,540 7,528 (13.12)
Others 5,839 5,500 6.18
CONSUMER GOODS 8,010 7,710 3.89
Non-durable 4,074 4,027 1.17
Durable 3,936 3,683 6.87
SPECIAL TRANSACTION 528 634 (16.78)
TOTAL IMPORTS 61,712 62,129 (0.67)
eXports imports surplus/(Deficit)
2013 2012 2013 2012 2013 2012
Jan. 4,011 4,123 4,725 5,134 (716) (1,010)
Feb. 3,741 4,430 4,708 4,996 (967) (566)
March 4,329 4,323 4,922 5,371 (593) (1,048)
April 4,121 4,635 5,141 4,773 (1,100) (138)
May 4,893 4,932 5,258 5,386 (367) (454)
June 4,490 4,314 4,860 5,089 (370) (775)
July 4,836 4,727 5,486 4,963 (651) (236)
Aug. 4,581 3,798 5,542 5,057 (961) (1,260)
Sept. 5,056 4,784 5,711 5,266 (664) (482)
Oct. 5,026 4,408 4,824 5,240 202 (832)
Nov. 4,292 3,550 5,236 5,139 (942) (1,589)
Dec. 4,599 3,970 5,294 5,300 (695) (1,331)
mercHanDise Balance of traDe (in US$ million)
mercHanDise eXports January-DecemBer 2013 (us$ m)
2013 total traDe sits at $115.7 Bn
Total merchandise trade for January to December 2013 was $115.68 billion, up by 1.3% from $114.23 billion in 2012. Trade performance closed the year with a positive growth after a series of negative yields in the earlier months of the year. A 3.6% growth in exports contributed to the improving trade performance, posting $54 billion in total revenues. Meanwhile, imports posted $61.7 billion, down by -0.4% from the same period last year.
For December alone, total trade amounted to $9.9 billion, up by 6.7% from the same month in 2012. Aggregate export revenues registered $4.6 billion (up by 16% from last month), while total import payments posted $5.3 billion (almost the same level as last month’s). The top 3 exports for December were: Electronic Products ($1.91 billion or 41.4% of total exports); Other Manufactures ($741.41 million or 16.12% of total exports), and; Woodcrafts and Furniture ($238.93 million or 5.2% of total exports). Meanwhile, the top 3 imports were: Electronic Products ($1.2 billion or 22.6% of total imports); Mineral Fuels, Lubricants and Related Materials ($1.19 billion or 22.4% of total imports), and; Transport Equipment ($662.07 million or 12.5% of total imports).
mercHanDise imports January- DecemBer 2013 (US$ M)
3000
4000
5000
6000
FOREIGN TRADE
EXPORT IMPORT
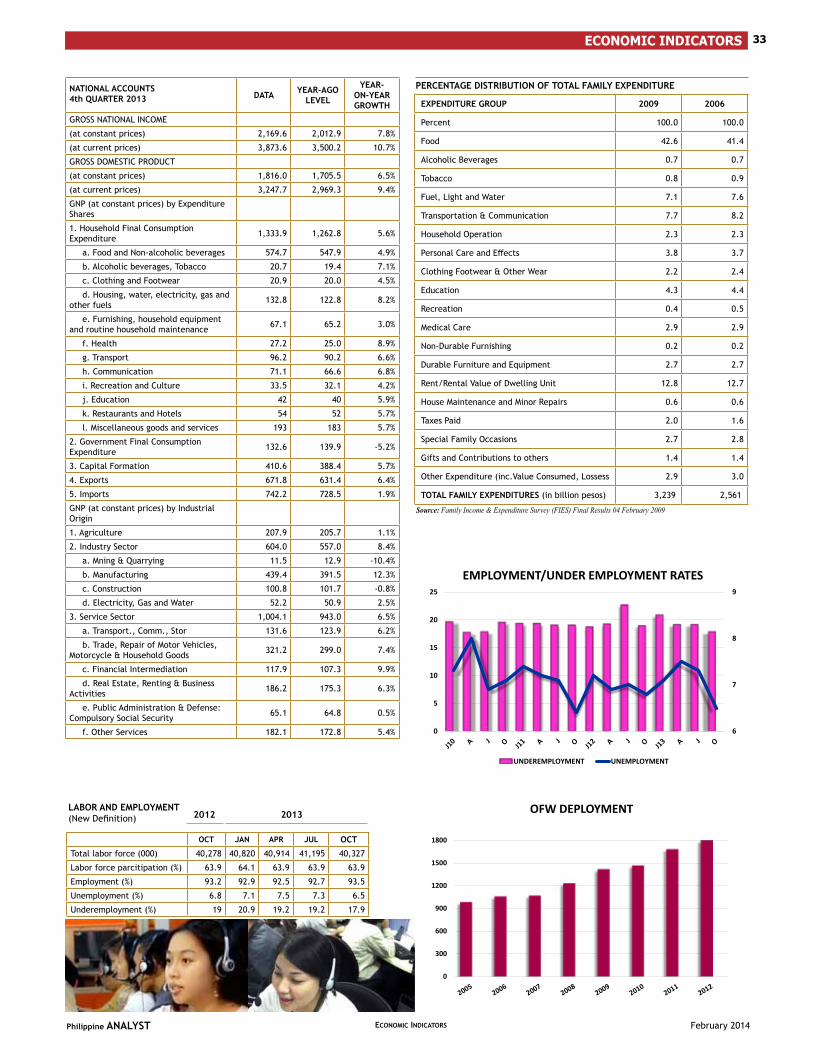
33ECONOMIC INDICATORS
February 2014Philippine ANALYST ECONOMIC INDICATORS
Data year-ago level
year-on-year groWtH
GROSS NATIONAL INCOME
(at constant prices) 2,169.6 2,012.9 7.8%
(at current prices) 3,873.6 3,500.2 10.7%
GROSS DOMESTIC PRODUCT
(at constant prices) 1,816.0 1,705.5 6.5%
(at current prices) 3,247.7 2,969.3 9.4%
GNP (at constant prices) by Expenditure Shares
1. Household Final Consumption Expenditure 1,333.9 1,262.8 5.6%
a. Food and Non-alcoholic beverages 574.7 547.9 4.9%
b. Alcoholic beverages, Tobacco 20.7 19.4 7.1%
c. Clothing and Footwear 20.9 20.0 4.5%
d. Housing, water, electricity, gas and other fuels 132.8 122.8 8.2%
e. Furnishing, household equipment and routine household maintenance 67.1 65.2 3.0%
f. Health 27.2 25.0 8.9%
g. Transport 96.2 90.2 6.6%
h. Communication 71.1 66.6 6.8%
i. Recreation and Culture 33.5 32.1 4.2%
j. Education 42 40 5.9%
k. Restaurants and Hotels 54 52 5.7%
l. Miscellaneous goods and services 193 183 5.7%
2. Government Final Consumption Expenditure 132.6 139.9 -5.2%
3. Capital Formation 410.6 388.4 5.7%
4. Exports 671.8 631.4 6.4%
5. Imports 742.2 728.5 1.9%
GNP (at constant prices) by Industrial Origin
1. Agriculture 207.9 205.7 1.1%
2. Industry Sector 604.0 557.0 8.4%
a. Mning & Quarrying 11.5 12.9 -10.4%
b. Manufacturing 439.4 391.5 12.3%
c. Construction 100.8 101.7 -0.8%
d. Electricity, Gas and Water 52.2 50.9 2.5%
3. Service Sector 1,004.1 943.0 6.5%
a. Transport., Comm., Stor 131.6 123.9 6.2%
b. Trade, Repair of Motor Vehicles, Motorcycle & Household Goods 321.2 299.0 7.4%
c. Financial Intermediation 117.9 107.3 9.9%
d. Real Estate, Renting & Business Activities 186.2 175.3 6.3%
e. Public Administration & Defense: Compulsory Social Security 65.1 64.8 0.5%
f. Other Services 182.1 172.8 5.4%
Source: Family Income & Expenditure Survey (FIES) Final Results 04 February 2009
percentage DistriBution of total family eXpenDiture national accounts 4th quarter 2013
laBor anD employment (New Definition) 2012 2013
eXpenDiture group 2009 2006
Percent 100.0 100.0
Food 42.6 41.4
Alcoholic Beverages 0.7 0.7
Tobacco 0.8 0.9
Fuel, Light and Water 7.1 7.6
Transportation & Communication 7.7 8.2
Household Operation 2.3 2.3
Personal Care and Effects 3.8 3.7
Clothing Footwear & Other Wear 2.2 2.4
Education 4.3 4.4
Recreation 0.4 0.5
Medical Care 2.9 2.9
Non-Durable Furnishing 0.2 0.2
Durable Furniture and Equipment 2.7 2.7
Rent/Rental Value of Dwelling Unit 12.8 12.7
House Maintenance and Minor Repairs 0.6 0.6
Taxes Paid 2.0 1.6
Special Family Occasions 2.7 2.8
Gifts and Contributions to others 1.4 1.4
Other Expenditure (inc.Value Consumed, Lossess 2.9 3.0
total family eXpenDitures (in billion pesos) 3,239 2,561
oct Jan apr Jul oct
Total labor force (000) 40,278 40,820 40,914 41,195 40,327
Labor force parcitipation (%) 63.9 64.1 63.9 63.9 63.9
Employment (%) 93.2 92.9 92.5 92.7 93.5
Unemployment (%) 6.8 7.1 7.5 7.3 6.5
Underemployment (%) 19 20.9 19.2 19.2 17.9
0
300
600
900
1200
1500
1800
OFW DEPLOYMENT
6
7
8
9
0
5
10
15
20
25
EMPLOYMENT/UNDER EMPLOYMENT RATES
UNDEREMPLOYMENT UNEMPLOYMENT
philippine regional update
February 2014Philippine ANALYST
34 philippine regional updatephilippine regional update
NCR – NATIONAL CAPITAL REGION (METRO MANILA)
M. Manila Skyway Stage 3 startsDevelopment of Metro Manila Skyway Stage 3, which will connect North Luzon Expressway (NLEX) to South Luzon Expressway (SLEX), will commence in April, Citra Central Expressway Corp. announced. The project consists of a 15-kilometer, 6-lane elevated expressway that extends the present Skyway from Buendia in Makati City to Balintawak in Quezon City. The P27 billion project is expected to be completed by April 2017. It aims to reduce travel time between NLEX and SLEX to 20 minutes from almost two hours.
NAIA-1 rehabilitation fi nally takes off The P1.64-billion of Ninoy Aquino International Airport Terminal 1 (NAIA-1) started in January, the Department of Transportation and Communications (DOTC) announced. The project involves structural retrofi tting; improvement of mechanical, electrical, plumbing and fi re protection facilities; and architectural works. It is expected to be completed in one year. Certain areas of the airport terminal will be closed for renovation, with the closures done in 6 phases of 60 days each.
MMDA, M. Manila Mayors OK 13 road projectsThe Metro Manila Regional Development Council (RDC) – a body composed of the Metropolitan Manila Development Authority (MMDA) and the 17 mayors of Metro Manila – approved 13 road and rail projects proposed by the Department of Transportation and Communications (DOTC) and Department of Public Works and Highways (DPWH) for construction till 2016. These projects include:
Light Rail Transit (LRT) Line 1 connection project with Metro Rail Transit (MRT) Line 3 in Quezon City
LRT 2 East Extension Project
Center link project connecting Bonifacio Global City to Ortigas Center
4-lane underpass on Gil Puyat Ave.
EDSA North-North Mindanao Interchange Project
NAIA elevated expressway
EDSA-Taft fl yover; and,
Skyway Stage 3
Construction of these road and rail projects will start within 2Q14 to 3Q14. Expect heavy traffi c for two years with the implementation of these projects.
Metro Manila world’s #2 in outsourcingTholons’ Top 100 Outsourcing Destinations for 2014 ranked Metro Manila as No. 2 after Bangalore, India, and edging out Mumbai, India which slipped to 3rd. The improvement in ranking was due to the notable increase in fi nance and accounting outsourced (FAO) services and other higher value processes in the information technology outsourcing (ITO), as well as in knowledge process outsourcing (KPO) spaces in Metro Manila during the past 2 years. Tholons also noted the sustained growth in the metropolis’ contact support services (call centers). Six other Philippine locations made it to Tholons’ list: Cebu (8th); Davao City (69th); Sta. Rosa in Laguna province (82nd); Bacolod (93rd); Iloilo (95th); and, Baguio (99th).
Manila City Council approves high-rise project near LunetaThe Manila City Council reversed its November 2013 ruling barring the construction of a high-rise residential project that would block the view of the revered Rizal Monument. The project was now allowed to proceed after developer DMCI has agreed to improve the design of the building façade to complement the monument’s sightline, and that it will plant two rows of tall trees to “protect the view”. The proposed condominium project consists of 49 fl oors, of which 41 fl oors are residential units, 4 fl oors are parking spaces, and the rest are for various amenities.
35philippine regional update
February 2014Philippine ANALYST
Region I – ILOCOS REGION
Wind farms being rushedAyala Corp.-controlled Northern Luzon UPC Asia Corp. and Lopez Group’s Energy Development Corp. (EDC) are rushing the completion of their separate wind farm projects to be the fi rst to avail of the feed-in tariff (FIT) incentive this year. The Department of Energy (DOE) said. The Ayala group is building the 81-megawatt (MW) Caparispisan wind project for $255 million in Pagudpud, Ilocos Norte, which is expected to be completed by September. EDC is constructing a 150-MW wind project worth $300 million in Burgos, Ilocos Norte, also to be fi nished in September.
CAR – CORDILLERA ADMINISTRATIVE REGION
P1.24B earmarked for Cordillera road projectsA total of P1.24 billion has been approved this year for road projects in Cordillera tourism areas, according to the Department of Public Works and Highways (DPWH). For Benguet, P336 million is allocated to roads leading to Mt. Pulag, Bulalacao Lakes, Mt. Tabeo, Mt. Kalugong Stone Church, Bahong Rose Gardens, Timbak caves and Mummy Anno. For Ifugao, P332 billion is programmed for roads leading to Julongan and Banawe Rice Terraces, Museum and World War II Shrine, Nahtoban and Bintakan caves, and O’phaw Mechancha Waterfalls. For Mountain Province, P340 million will go to roads to Sumaguing Cave, Hanging Coffi ns, Bokong Falls, Marcos Cave, Sagada Cave and Bontoc waterfalls.
Region III – CENTRAL LUZON
Lafarge expanding plant capacityLafarge Republic Inc. announced that it is acquiring a new grinding mill to expand its cement production capacity to 850,000 tons annually. The target commissioning date for the new grinding mill is 2Q15. The expansion plan aims to meet the anticipated increase in cement demand from public and private infrastructure projects.
Region VI – WESTERN VISAYAS
Iloilo power plant capacity to be expandedGlobal Business Power Corp. (GBPC) revealed that it is expanding its 164-megawatt coal-fi red power plant in Iloilo by another 150 MW on expectations of rising power demand due to the province’s robust growth. The new plant will start commercial operations in mid-2016. GBPC sees the increased demand coming from the development of the 75-hectare Iloilo Business Park, Iloilo Convention Center, luxury hotels, BPO offi ce buildings, and new hotels and resorts in Boracay Island.
Region VII – CENTRAL VISAYAS
Carmen Copper to commence operation of expanded processing plantCarmen Copper Corp. expects its expanded processing plant in Cebu to be fully operational by March after initial runs of the equipment in late January yielded satisfactory results in terms of copper recovery and grind size accuracy. The expansion program seeks to increase milling capacity by 50% to 60,000 tons per day from 40,000 presently. It involves the installation of 2 ball mills and 4 fl otation tanks, and a new auxiliary line for primary crushing with capacity of 30,000 tons per day.
36 philippine regional update
February 2014Philippine ANALYST
Region VIII – EASTERN VISAYAS
Leyte plants back in operation by 3Q14Energy Development Corp. (EDC) said the Typhoon Haiyan-damaged 650-megawatt (MW) Unifi ed Leyte Geothermal Power Plant complex and the 112.5-MW Tongonan geothermal will be back in full operation in the 3rd quarter. The Unifi ed Leyte complex consists of Upper Mahiao (125 MW), Malitbog (232 MW), Mahanagdong (180 MW) and Optimization plants (51 MW). Meanwhile, repair of another 75 MW unit of Malitbog plant was completed, bringing total generation from the plant to 150 MW as of mid-January.
Region IX – ZAMBOANGA PENINSULA (WESTERN MINDANAO)
TVI mine closed downTVI Pacifi c, Inc. stopped operations of its copper-zinc mine in Canatuan, Zamboanga del Norte in January after fully using up its remaining stockpile. The company is presently assessing the possibility of mine life extension and opportunities for expansion. Operations at the Canatuan mine ran for almost 6 years, within the expectation of 5-6 years, but actual mill throughput, at 3,500 tons per day, was higher than planned.
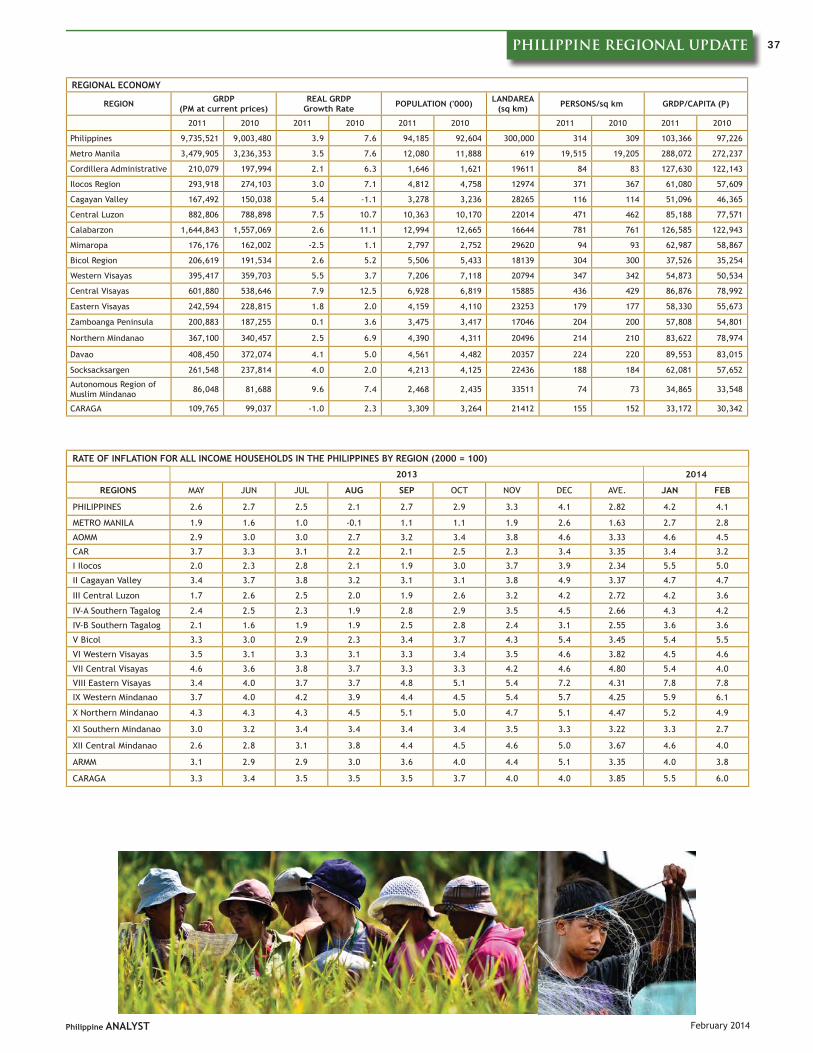
37philippine regional update
February 2014Philippine ANALYST
RATE OF INFLATION FOR ALL INCOME HOUSEHOLDS IN THE PHILIPPINES BY REGION (2000 = 100)
2013 2014
REGIONS MAY JUN JUL AUG SEP OCT NOV DEC AVE. JAN FEB
PHILIPPINES 2.6 2.7 2.5 2.1 2.7 2.9 3.3 4.1 2.82 4.2 4.1
METRO MANILA 1.9 1.6 1.0 -0.1 1.1 1.1 1.9 2.6 1.63 2.7 2.8
AOMM 2.9 3.0 3.0 2.7 3.2 3.4 3.8 4.6 3.33 4.6 4.5
CAR 3.7 3.3 3.1 2.2 2.1 2.5 2.3 3.4 3.35 3.4 3.2
I Ilocos 2.0 2.3 2.8 2.1 1.9 3.0 3.7 3.9 2.34 5.5 5.0
II Cagayan Valley 3.4 3.7 3.8 3.2 3.1 3.1 3.8 4.9 3.37 4.7 4.7
III Central Luzon 1.7 2.6 2.5 2.0 1.9 2.6 3.2 4.2 2.72 4.2 3.6
IV-A Southern Tagalog 2.4 2.5 2.3 1.9 2.8 2.9 3.5 4.5 2.66 4.3 4.2
IV-B Southern Tagalog 2.1 1.6 1.9 1.9 2.5 2.8 2.4 3.1 2.55 3.6 3.6
V Bicol 3.3 3.0 2.9 2.3 3.4 3.7 4.3 5.4 3.45 5.4 5.5
VI Western Visayas 3.5 3.1 3.3 3.1 3.3 3.4 3.5 4.6 3.82 4.5 4.6
VII Central Visayas 4.6 3.6 3.8 3.7 3.3 3.3 4.2 4.6 4.80 5.4 4.0
VIII Eastern Visayas 3.4 4.0 3.7 3.7 4.8 5.1 5.4 7.2 4.31 7.8 7.8
IX Western Mindanao 3.7 4.0 4.2 3.9 4.4 4.5 5.4 5.7 4.25 5.9 6.1
X Northern Mindanao 4.3 4.3 4.3 4.5 5.1 5.0 4.7 5.1 4.47 5.2 4.9
XI Southern Mindanao 3.0 3.2 3.4 3.4 3.4 3.4 3.5 3.3 3.22 3.3 2.7
XII Central Mindanao 2.6 2.8 3.1 3.8 4.4 4.5 4.6 5.0 3.67 4.6 4.0
ARMM 3.1 2.9 2.9 3.0 3.6 4.0 4.4 5.1 3.35 4.0 3.8
CARAGA 3.3 3.4 3.5 3.5 3.5 3.7 4.0 4.0 3.85 5.5 6.0
REGIONAL ECONOMY
REGION GRDP(PM at current prices)
REAL GRDPGrowth Rate POPULATION ('000) LANDAREA
(sq km) PERSONS/sq km GRDP/CAPITA (P)
2011 2010 2011 2010 2011 2010 2011 2010 2011 2010
Philippines 9,735,521 9,003,480 3.9 7.6 94,185 92,604 300,000 314 309 103,366 97,226
Metro Manila 3,479,905 3,236,353 3.5 7.6 12,080 11,888 619 19,515 19,205 288,072 272,237
Cordillera Administrative 210,079 197,994 2.1 6.3 1,646 1,621 19611 84 83 127,630 122,143
Ilocos Region 293,918 274,103 3.0 7.1 4,812 4,758 12974 371 367 61,080 57,609
Cagayan Valley 167,492 150,038 5.4 -1.1 3,278 3,236 28265 116 114 51,096 46,365
Central Luzon 882,806 788,898 7.5 10.7 10,363 10,170 22014 471 462 85,188 77,571
Calabarzon 1,644,843 1,557,069 2.6 11.1 12,994 12,665 16644 781 761 126,585 122,943
Mimaropa 176,176 162,002 -2.5 1.1 2,797 2,752 29620 94 93 62,987 58,867
Bicol Region 206,619 191,534 2.6 5.2 5,506 5,433 18139 304 300 37,526 35,254
Western Visayas 395,417 359,703 5.5 3.7 7,206 7,118 20794 347 342 54,873 50,534
Central Visayas 601,880 538,646 7.9 12.5 6,928 6,819 15885 436 429 86,876 78,992
Eastern Visayas 242,594 228,815 1.8 2.0 4,159 4,110 23253 179 177 58,330 55,673
Zamboanga Peninsula 200,883 187,255 0.1 3.6 3,475 3,417 17046 204 200 57,808 54,801
Northern Mindanao 367,100 340,457 2.5 6.9 4,390 4,311 20496 214 210 83,622 78,974
Davao 408,450 372,074 4.1 5.0 4,561 4,482 20357 224 220 89,553 83,015
Socksacksargen 261,548 237,814 4.0 2.0 4,213 4,125 22436 188 184 62,081 57,652
Autonomous Region of Muslim Mindanao 86,048 81,688 9.6 7.4 2,468 2,435 33511 74 73 34,865 33,548
CARAGA 109,765 99,037 -1.0 2.3 3,309 3,264 21412 155 152 33,172 30,342
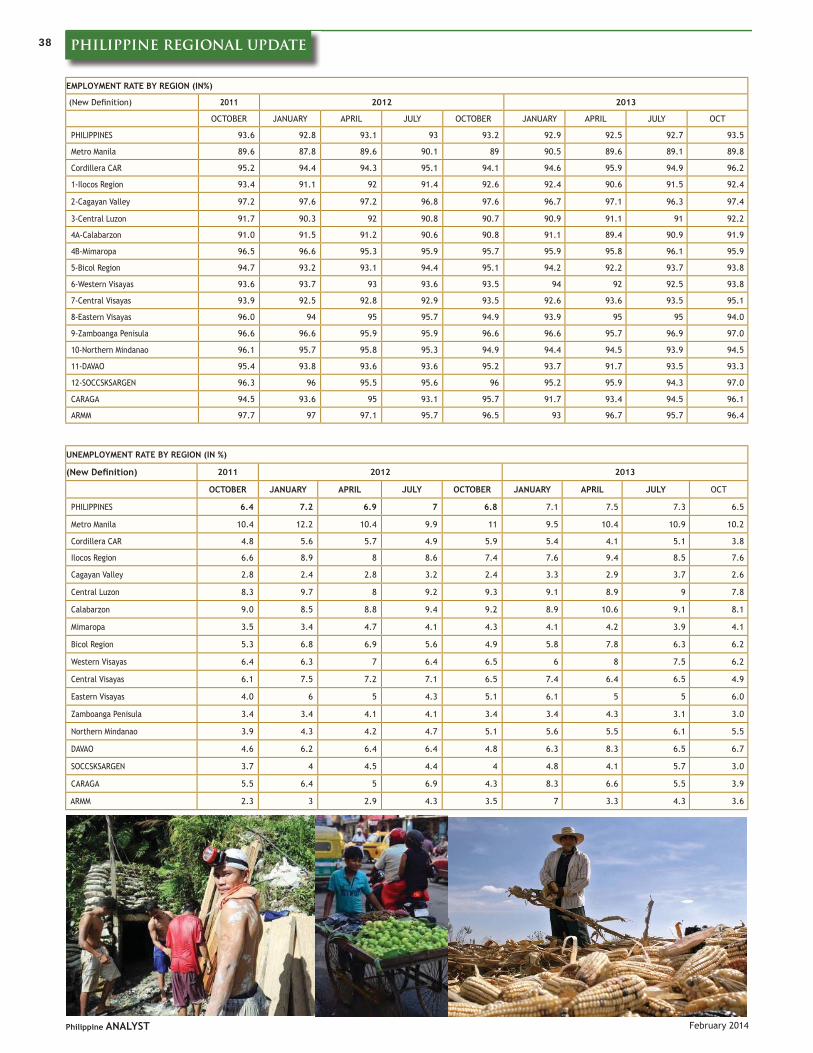
38 philippine regional update
February 2014Philippine ANALYST
EMPLOYMENT RATE BY REGION (IN%)
(New Defi nition) 2011 2012 2013
OCTOBER JANUARY APRIL JULY OCTOBER JANUARY APRIL JULY OCT
PHILIPPINES 93.6 92.8 93.1 93 93.2 92.9 92.5 92.7 93.5
Metro Manila 89.6 87.8 89.6 90.1 89 90.5 89.6 89.1 89.8
Cordillera CAR 95.2 94.4 94.3 95.1 94.1 94.6 95.9 94.9 96.2
1-Ilocos Region 93.4 91.1 92 91.4 92.6 92.4 90.6 91.5 92.4
2-Cagayan Valley 97.2 97.6 97.2 96.8 97.6 96.7 97.1 96.3 97.4
3-Central Luzon 91.7 90.3 92 90.8 90.7 90.9 91.1 91 92.2
4A-Calabarzon 91.0 91.5 91.2 90.6 90.8 91.1 89.4 90.9 91.9
4B-Mimaropa 96.5 96.6 95.3 95.9 95.7 95.9 95.8 96.1 95.9
5-Bicol Region 94.7 93.2 93.1 94.4 95.1 94.2 92.2 93.7 93.8
6-Western Visayas 93.6 93.7 93 93.6 93.5 94 92 92.5 93.8
7-Central Visayas 93.9 92.5 92.8 92.9 93.5 92.6 93.6 93.5 95.1
8-Eastern Visayas 96.0 94 95 95.7 94.9 93.9 95 95 94.0
9-Zamboanga Penisula 96.6 96.6 95.9 95.9 96.6 96.6 95.7 96.9 97.0
10-Northern Mindanao 96.1 95.7 95.8 95.3 94.9 94.4 94.5 93.9 94.5
11-DAVAO 95.4 93.8 93.6 93.6 95.2 93.7 91.7 93.5 93.3
12-SOCCSKSARGEN 96.3 96 95.5 95.6 96 95.2 95.9 94.3 97.0
CARAGA 94.5 93.6 95 93.1 95.7 91.7 93.4 94.5 96.1
ARMM 97.7 97 97.1 95.7 96.5 93 96.7 95.7 96.4
UNEMPLOYMENT RATE BY REGION (IN %)
(New Defi nition) 2011 2012 2013
OCTOBER JANUARY APRIL JULY OCTOBER JANUARY APRIL JULY OCT
PHILIPPINES 6.4 7.2 6.9 7 6.8 7.1 7.5 7.3 6.5
Metro Manila 10.4 12.2 10.4 9.9 11 9.5 10.4 10.9 10.2
Cordillera CAR 4.8 5.6 5.7 4.9 5.9 5.4 4.1 5.1 3.8
Ilocos Region 6.6 8.9 8 8.6 7.4 7.6 9.4 8.5 7.6
Cagayan Valley 2.8 2.4 2.8 3.2 2.4 3.3 2.9 3.7 2.6
Central Luzon 8.3 9.7 8 9.2 9.3 9.1 8.9 9 7.8
Calabarzon 9.0 8.5 8.8 9.4 9.2 8.9 10.6 9.1 8.1
Mimaropa 3.5 3.4 4.7 4.1 4.3 4.1 4.2 3.9 4.1
Bicol Region 5.3 6.8 6.9 5.6 4.9 5.8 7.8 6.3 6.2
Western Visayas 6.4 6.3 7 6.4 6.5 6 8 7.5 6.2
Central Visayas 6.1 7.5 7.2 7.1 6.5 7.4 6.4 6.5 4.9
Eastern Visayas 4.0 6 5 4.3 5.1 6.1 5 5 6.0
Zamboanga Penisula 3.4 3.4 4.1 4.1 3.4 3.4 4.3 3.1 3.0
Northern Mindanao 3.9 4.3 4.2 4.7 5.1 5.6 5.5 6.1 5.5
DAVAO 4.6 6.2 6.4 6.4 4.8 6.3 8.3 6.5 6.7
SOCCSKSARGEN 3.7 4 4.5 4.4 4 4.8 4.1 5.7 3.0
CARAGA 5.5 6.4 5 6.9 4.3 8.3 6.6 5.5 3.9
ARMM 2.3 3 2.9 4.3 3.5 7 3.3 4.3 3.6

39philippine regional update
February 2014Philippine ANALYST
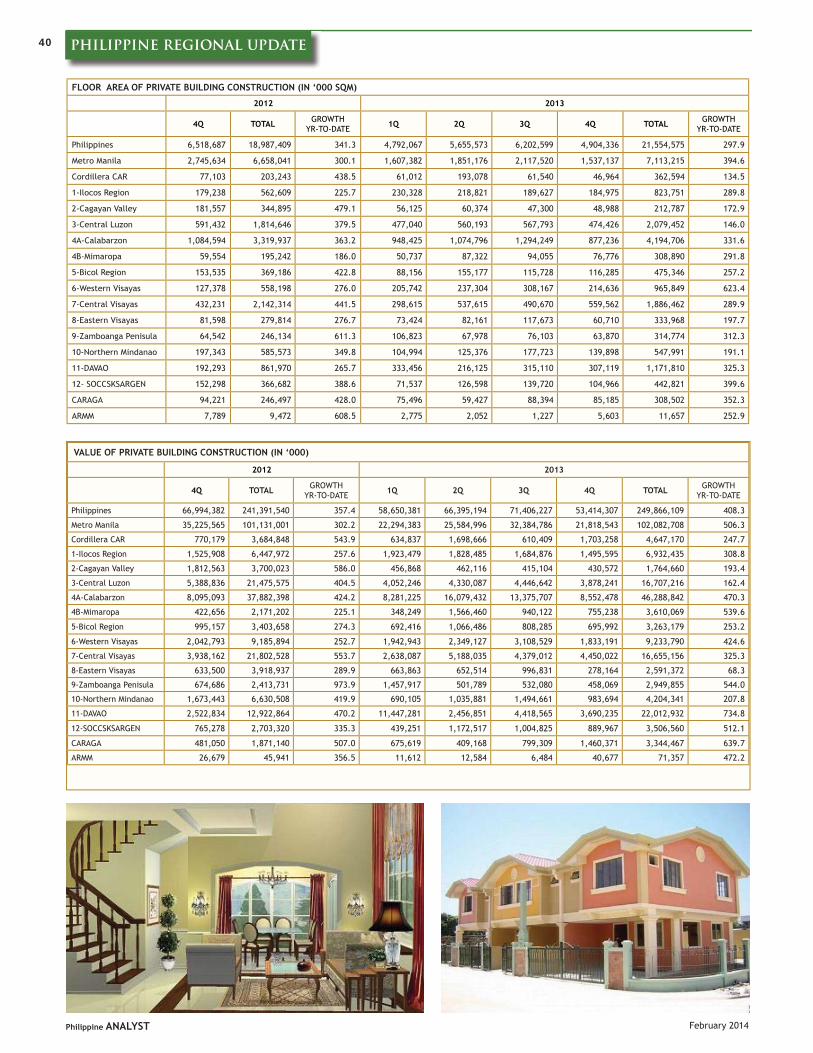
40 philippine regional update
February 2014Philippine ANALYST
FLOOR AREA OF PRIVATE BUILDING CONSTRUCTION (IN ‘000 SQM)
2012 2013
4Q TOTAL GROWTH YR-TO-DATE 1Q 2Q 3Q 4Q TOTAL GROWTH
YR-TO-DATE
Philippines 6,518,687 18,987,409 341.3 4,792,067 5,655,573 6,202,599 4,904,336 21,554,575 297.9
Metro Manila 2,745,634 6,658,041 300.1 1,607,382 1,851,176 2,117,520 1,537,137 7,113,215 394.6
Cordillera CAR 77,103 203,243 438.5 61,012 193,078 61,540 46,964 362,594 134.5
1-Ilocos Region 179,238 562,609 225.7 230,328 218,821 189,627 184,975 823,751 289.8
2-Cagayan Valley 181,557 344,895 479.1 56,125 60,374 47,300 48,988 212,787 172.9
3-Central Luzon 591,432 1,814,646 379.5 477,040 560,193 567,793 474,426 2,079,452 146.0
4A-Calabarzon 1,084,594 3,319,937 363.2 948,425 1,074,796 1,294,249 877,236 4,194,706 331.6
4B-Mimaropa 59,554 195,242 186.0 50,737 87,322 94,055 76,776 308,890 291.8
5-Bicol Region 153,535 369,186 422.8 88,156 155,177 115,728 116,285 475,346 257.2
6-Western Visayas 127,378 558,198 276.0 205,742 237,304 308,167 214,636 965,849 623.4
7-Central Visayas 432,231 2,142,314 441.5 298,615 537,615 490,670 559,562 1,886,462 289.9
8-Eastern Visayas 81,598 279,814 276.7 73,424 82,161 117,673 60,710 333,968 197.7
9-Zamboanga Penisula 64,542 246,134 611.3 106,823 67,978 76,103 63,870 314,774 312.3
10-Northern Mindanao 197,343 585,573 349.8 104,994 125,376 177,723 139,898 547,991 191.1
11-DAVAO 192,293 861,970 265.7 333,456 216,125 315,110 307,119 1,171,810 325.3
12- SOCCSKSARGEN 152,298 366,682 388.6 71,537 126,598 139,720 104,966 442,821 399.6
CARAGA 94,221 246,497 428.0 75,496 59,427 88,394 85,185 308,502 352.3
ARMM 7,789 9,472 608.5 2,775 2,052 1,227 5,603 11,657 252.9
VALUE OF PRIVATE BUILDING CONSTRUCTION (IN ‘000)
2012 2013
4Q TOTAL GROWTH YR-TO-DATE 1Q 2Q 3Q 4Q TOTAL GROWTH
YR-TO-DATE
Philippines 66,994,382 241,391,540 357.4 58,650,381 66,395,194 71,406,227 53,414,307 249,866,109 408.3
Metro Manila 35,225,565 101,131,001 302.2 22,294,383 25,584,996 32,384,786 21,818,543 102,082,708 506.3
Cordillera CAR 770,179 3,684,848 543.9 634,837 1,698,666 610,409 1,703,258 4,647,170 247.7
1-Ilocos Region 1,525,908 6,447,972 257.6 1,923,479 1,828,485 1,684,876 1,495,595 6,932,435 308.8
2-Cagayan Valley 1,812,563 3,700,023 586.0 456,868 462,116 415,104 430,572 1,764,660 193.4
3-Central Luzon 5,388,836 21,475,575 404.5 4,052,246 4,330,087 4,446,642 3,878,241 16,707,216 162.4
4A-Calabarzon 8,095,093 37,882,398 424.2 8,281,225 16,079,432 13,375,707 8,552,478 46,288,842 470.3
4B-Mimaropa 422,656 2,171,202 225.1 348,249 1,566,460 940,122 755,238 3,610,069 539.6
5-Bicol Region 995,157 3,403,658 274.3 692,416 1,066,486 808,285 695,992 3,263,179 253.2
6-Western Visayas 2,042,793 9,185,894 252.7 1,942,943 2,349,127 3,108,529 1,833,191 9,233,790 424.6
7-Central Visayas 3,938,162 21,802,528 553.7 2,638,087 5,188,035 4,379,012 4,450,022 16,655,156 325.3
8-Eastern Visayas 633,500 3,918,937 289.9 663,863 652,514 996,831 278,164 2,591,372 68.3
9-Zamboanga Penisula 674,686 2,413,731 973.9 1,457,917 501,789 532,080 458,069 2,949,855 544.0
10-Northern Mindanao 1,673,443 6,630,508 419.9 690,105 1,035,881 1,494,661 983,694 4,204,341 207.8
11-DAVAO 2,522,834 12,922,864 470.2 11,447,281 2,456,851 4,418,565 3,690,235 22,012,932 734.8
12-SOCCSKSARGEN 765,278 2,703,320 335.3 439,251 1,172,517 1,004,825 889,967 3,506,560 512.1
CARAGA 481,050 1,871,140 507.0 675,619 409,168 799,309 1,460,371 3,344,467 639.7
ARMM 26,679 45,941 356.5 11,612 12,584 6,484 40,677 71,357 472.2
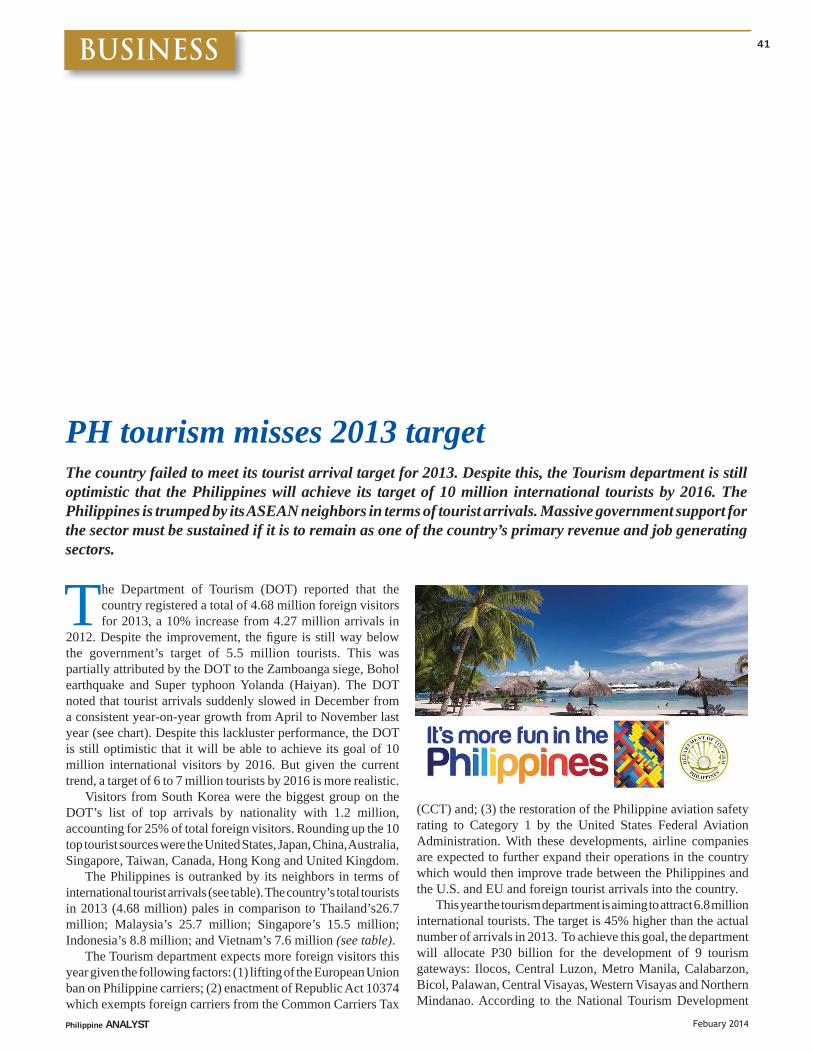
BUSINESS
Philippine ANALYST Febuary 2014
41BUBUBUBUSISISISINENENENESSSSSSSSBUSINESS
PH tourism misses 2013 targetThe country failed to meet its tourist arrival target for 2013. Despite this, the Tourism department is still optimistic that the Philippines will achieve its target of 10 million international tourists by 2016. The Philippines is trumped by its ASEAN neighbors in terms of tourist arrivals. Massive government support for the sector must be sustained if it is to remain as one of the country’s primary revenue and job generating sectors.
The Department of Tourism (DOT) reported that the country registered a total of 4.68 million foreign visitors for 2013, a 10% increase from 4.27 million arrivals in
2012. Despite the improvement, the fi gure is still way below the government’s target of 5.5 million tourists. This was partially attributed by the DOT to the Zamboanga siege, Bohol earthquake and Super typhoon Yolanda (Haiyan). The DOT noted that tourist arrivals suddenly slowed in December from a consistent year-on-year growth from April to November last year (see chart). Despite this lackluster performance, the DOT is still optimistic that it will be able to achieve its goal of 10 million international visitors by 2016. But given the current trend, a target of 6 to 7 million tourists by 2016 is more realistic.
Visitors from South Korea were the biggest group on the DOT’s list of top arrivals by nationality with 1.2 million, accounting for 25% of total foreign visitors. Rounding up the 10 top tourist sources were the United States, Japan, China, Australia, Singapore, Taiwan, Canada, Hong Kong and United Kingdom.
The Philippines is outranked by its neighbors in terms of international tourist arrivals (see table). The country’s total tourists in 2013 (4.68 million) pales in comparison to Thailand’s26.7 million; Malaysia’s 25.7 million; Singapore’s 15.5 million; Indonesia’s 8.8 million; and Vietnam’s 7.6 million (see table).
The Tourism department expects more foreign visitors this year given the following factors: (1) lifting of the European Union ban on Philippine carriers; (2) enactment of Republic Act 10374 which exempts foreign carriers from the Common Carriers Tax
(CCT) and; (3) the restoration of the Philippine aviation safety rating to Category 1 by the United States Federal Aviation Administration. With these developments, airline companies are expected to further expand their operations in the country which would then improve trade between the Philippines and the U.S. and EU and foreign tourist arrivals into the country.
This year the tourism department is aiming to attract 6.8 million international tourists. The target is 45% higher than the actual number of arrivals in 2013. To achieve this goal, the department will allocate P30 billion for the development of 9 tourism gateways: Ilocos, Central Luzon, Metro Manila, Calabarzon, Bicol, Palawan, Central Visayas, Western Visayas and Northern Mindanao. According to the National Tourism Development
42 BUSINESS
Philippine ANALYST Febuary 2014
PH TOURIST ARRIVALS APRIL-NOVEMBER 2012-2013 (IN THOUSAND)
Plan, P25 billion will be allocated to improve market access, connectivity and destination infrastructure (P15 billion for access roads, P10 billion for airports and P500 million for ports); P4.5 billion to boost the development and marketing of competitive destinations and products and; P5 billion to develop the tourism work force and improve the safety and security of tourists.
Massive government support for tourism must be sustained if it is to remain as one of the country’s economic growth drivers. The latest data from the National Statistical Coordination Board
ASEAN +6 TOUSIT ARRIVALS 2013
COUNTRY NUMBER OF VISITORS
Thailand 26.7 million
Malaysia 25.7 million
Singapore 15.5 million
Indonesia 8.8 million
Vietnam 7.6 million
Philippines 4.7 million
YEAR APRIL MAY JUNE JULY AUGUST SEPTEMBER OCTOBER NOVEMBER DECEMBER
2012 350 322 324 377 338 292 328 352 442
2013 378 362 369 397 368 318 346 350 427
% Change 8% 12% 14% 5% 9% 9% 6% -1% -3%
RANK COUNTRY JANUARY TO DECEMBER 2012 % SHARE JANUARY TO
DECEMBER 2013 % SHARE GROWTH RATE
1 Korea 1,031,155 24.13% 1,165,789 24.90% 13.06%
2 United States 652,626 15.27% 674,664 14.41% 3.36%
3 Japan 412,474 9.65% 433,705 9.26 5.15%
4 China 191,150 4.47% 426,352 9.11% 69.94%
5 Australia 191,150 4.47% 213,023 4.55% 11.44%
6 Singapore 148,215 3.47% 175,034 3.74% 18.09%
7 Taiwan 216,511 5.07% 139,099 2.97% -35.75%
8 Canada 123,699 2.90% 131,381 2.81% 6.21%
9 Hong Kong 118,666 2.78% 126,008 2.69% 6.19%
10 United Kingdom 113,282 2.65% 122,759 2.62% 8.37%
11 Malaysia 114,513 2.68% 109,437 2.34% -4.43%
12 Germany 67,023 1.57% 70,949 1.52% 5.86%
0
0.5
1
1.5
2
2.5
3
3.5
4
4.5
5
2009 2010 2011 2012 2013
TOURISM REVENUE GROWTH (2009-2013)In US$ Billion
(NSCB) shows that tourism industry contributed 6% to the country’s gross domestic product (GDP) in 2012. The sector generated 4 million jobs during the period. The DOT projects the tourism sector’s contribution to GDP to reach 10% by 2016.
Total revenues gained from foreign visitors in 2013 (see graph) was up by 15% to $4.4 billion from $3.8 billion in 2012. It has been on the rise for the past 5 years. Tourism revenues are expected to reach $6 million this year and $8 billion in 2016.
TOP 12 MARKETS BY VOLUME
Source: Department of Tourism (2014)
Source: Department of Tourism (2014)
43BUSINESS
Philippine ANALYST Febuary 2014
Glencore remains committed to Tampakan dev’t
Sagitarrius Mines, Inc. (SMI), the operator of the $6 billion Tampakan copper-gold project, said its major shareholder Glencore Xstrata is still committed to the development of the mine despite an earlier report that it is pulling out from the project.
Indophil Resources reported in January that Glencore has had plans of divesting its share in the Tampakan project. Indophil said Glencore’s divestment plan is consistent with the latter’s preference not to develop “greenfi eld” mines, as the Tampakan project is still pending for approval. A greenfi eld mining project pertains to a land property which was never tapped before and is newly subjected for development. But Indophil said no formal divestment process has started and the divestment plan will still be discussed. Glencore currently holds a 62.5% share in the project while Indophil holds the other 37.5%.
Sagitarrius Mines, Inc. said it is constantly in touch with Glencore and was given assurance that no divestment will happen. The Tampakan project was 1 of the 2 projects (the other one being the Las Bambas copper mine in Peru) being considered for sale as part of China’s requirement for Glencore’s takeover of mining company Xstrata. However, Glencore decided to sell the Las Bambas project and keep Tampakan. According to SMI, the Las Bambas sale will be fi nalized by September.
MINING, OIL, & GAS Meanwhile, the interagency working group (IAWG) crafting an action plan (see box) on the Tampakan project submitted its initial draft to the Mining Industry Coordinating Council (MICC) in January. The next discussion is planned in March, in which SMI was invited to join. Glencore is hoping to get the fi nal recommendations to obtain the declaration of mine project feasibility (DMPF). An approved DMPF is the fi nal requirement for the start of a mining project’s development and includes a fi nal rehabilitation plan for the venture and an environmental protection and enhancement program.
Once the project is approved, Alsons Consolidated Resources, Inc. will begin the construction of a 400-megawatt power plant which will supply the power requirements of the Tampakan mine. The power facility costs $892 million.
For 2014, capital expenditure for the Tampakan project was reduced to $1 million per month compared to the $4 million monthly allotment in 2013. SMI also cut its workforce from 1,000 to 60 employees. SMI said that the reduction of expenditure for Tampakan is part of a revised work plan that will focus on enhancing its relationship with the national government and and the local community to fi nally resolve the challenges facing the project. “The decision (to reduce current activity levels and expenditure) has not been taken lightly; however, we expect it will take some time to resolve these complex matters effectively before the project can again resume a path toward development,” SMI said in a statement.
The Tampakan site is considered as one of the world’s largest undeveloped copper and gold deposits. Over its 20-year life, the project has the potential to generate 12,000 jobs (10,000 during the peak of the construction phase and 2,000 during the operations phase), contribute P300 billion in taxes and charges to the national government and the local government of South Cotabato, and pay P40 billion in royalty and direct contributions to local communities and indigenous groups.
Sagitarrius Mines, Inc. said it is constantly in touch with Glencore and was given assurance that no divestment from the Tampakan project will happen.
The interagency working group (IAWG) was mandated by the Mining Industry Coordinating Council (MICC) to review the concerns raised by Sagittarius Mines, Inc. (SMI) regarding the Tampakan project. The IAWG solicited and considered the views of various stakeholders including the Offi ce of Solicitor General, the National Commission on Indigenous Peoples and the Union of Local Authorities of the Philippines in the formation of an action plan for the project. Central issues tackled were:
Confl icts between certifi cate of land ownership awards and Tampakan mining tenements
Potential liabilities for environmental damages arising from project operations
Open-pit mining ban in South Cotabato
Processing of free and prior informed consent of aff ected indigenous communities
THE TAMPAKAN INTERAGENCY WORKING GROUP (IAWG)
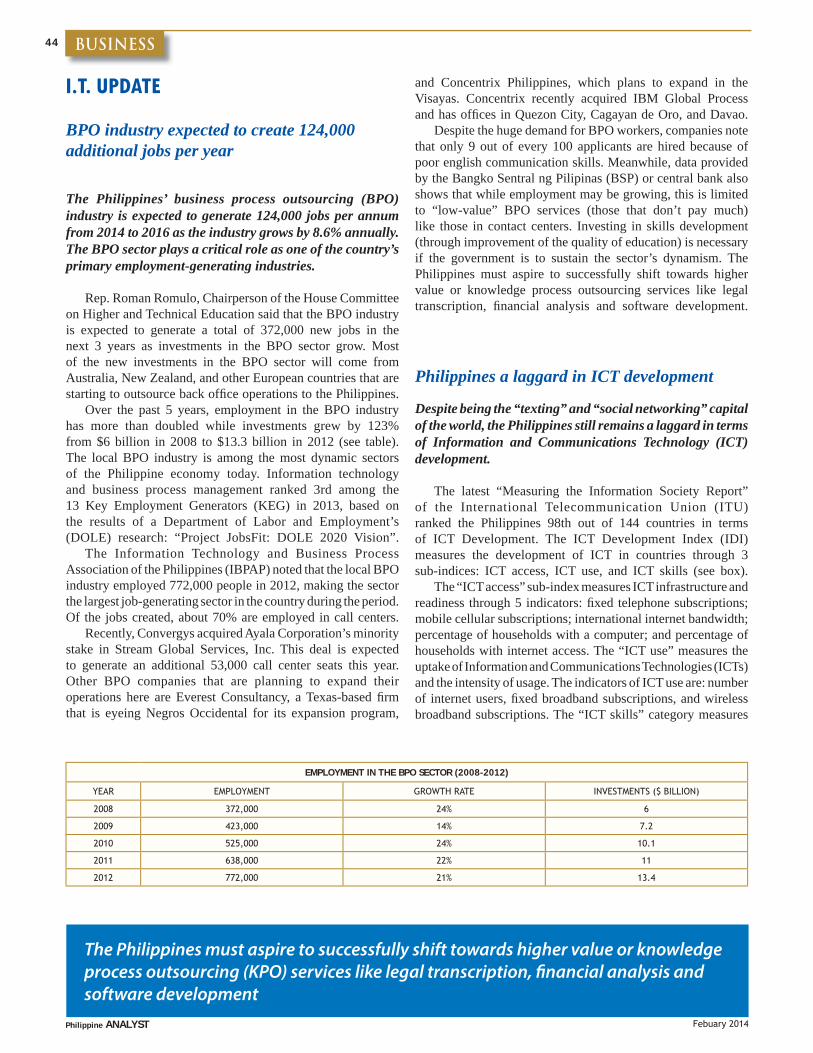
44 BUSINESS
Philippine ANALYST Febuary 2014
The Philippines must aspire to successfully shift towards higher value or knowledge process outsourcing (KPO) services like legal transcription, fi nancial analysis and software development
I.T. UPDATE
BPO industry expected to create 124,000 additional jobs per year
The Philippines’ business process outsourcing (BPO) industry is expected to generate 124,000 jobs per annum from 2014 to 2016 as the industry grows by 8.6% annually. The BPO sector plays a critical role as one of the country’s primary employment-generating industries.
Rep. Roman Romulo, Chairperson of the House Committee on Higher and Technical Education said that the BPO industry is expected to generate a total of 372,000 new jobs in the next 3 years as investments in the BPO sector grow. Most of the new investments in the BPO sector will come from Australia, New Zealand, and other European countries that are starting to outsource back offi ce operations to the Philippines.
Over the past 5 years, employment in the BPO industry has more than doubled while investments grew by 123% from $6 billion in 2008 to $13.3 billion in 2012 (see table). The local BPO industry is among the most dynamic sectors of the Philippine economy today. Information technology and business process management ranked 3rd among the 13 Key Employment Generators (KEG) in 2013, based on the results of a Department of Labor and Employment’s (DOLE) research: “Project JobsFit: DOLE 2020 Vision”.
The Information Technology and Business Process Association of the Philippines (IBPAP) noted that the local BPO industry employed 772,000 people in 2012, making the sector the largest job-generating sector in the country during the period. Of the jobs created, about 70% are employed in call centers.
Recently, Convergys acquired Ayala Corporation’s minority stake in Stream Global Services, Inc. This deal is expected to generate an additional 53,000 call center seats this year. Other BPO companies that are planning to expand their operations here are Everest Consultancy, a Texas-based fi rm that is eyeing Negros Occidental for its expansion program,
and Concentrix Philippines, which plans to expand in the Visayas. Concentrix recently acquired IBM Global Process and has offi ces in Quezon City, Cagayan de Oro, and Davao.
Despite the huge demand for BPO workers, companies note that only 9 out of every 100 applicants are hired because of poor english communication skills. Meanwhile, data provided by the Bangko Sentral ng Pilipinas (BSP) or central bank also shows that while employment may be growing, this is limited to “low-value” BPO services (those that don’t pay much) like those in contact centers. Investing in skills development (through improvement of the quality of education) is necessary if the government is to sustain the sector’s dynamism. The Philippines must aspire to successfully shift towards higher value or knowledge process outsourcing services like legal transcription, fi nancial analysis and software development.
Philippines a laggard in ICT development
Despite being the “texting” and “social networking” capital of the world, the Philippines still remains a laggard in terms of Information and Communications Technology (ICT) development.
The latest “Measuring the Information Society Report” of the International Telecommunication Union (ITU) ranked the Philippines 98th out of 144 countries in terms of ICT Development. The ICT Development Index (IDI) measures the development of ICT in countries through 3 sub-indices: ICT access, ICT use, and ICT skills (see box).
The “ICT access” sub-index measures ICT infrastructure and readiness through 5 indicators: fi xed telephone subscriptions; mobile cellular subscriptions; international internet bandwidth; percentage of households with a computer; and percentage of households with internet access. The “ICT use” measures the uptake of Information and Communications Technologies (ICTs) and the intensity of usage. The indicators of ICT use are: number of internet users, fi xed broadband subscriptions, and wireless broadband subscriptions. The “ICT skills” category measures
EMPLOYMENT IN THE BPO SECTOR (2008-2012)
YEAR EMPLOYMENT GROWTH RATE INVESTMENTS ($ BILLION)
2008 372,000 24% 6
2009 423,000 14% 7.2
2010 525,000 24% 10.1
2011 638,000 22% 11
2012 772,000 21% 13.4
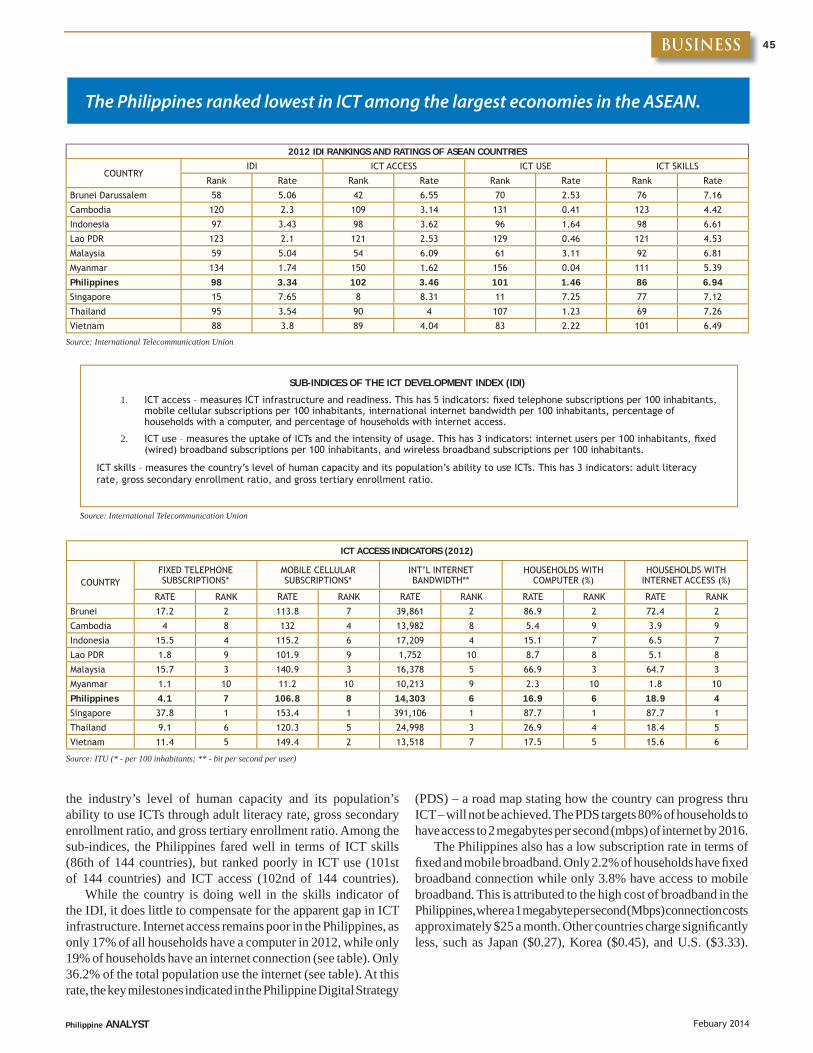
45BUSINESS
Philippine ANALYST Febuary 2014
2012 IDI RANKINGS AND RATINGS OF ASEAN COUNTRIES
COUNTRYIDI ICT ACCESS ICT USE ICT SKILLS
Rank Rate Rank Rate Rank Rate Rank Rate
Brunei Darussalem 58 5.06 42 6.55 70 2.53 76 7.16
Cambodia 120 2.3 109 3.14 131 0.41 123 4.42
Indonesia 97 3.43 98 3.62 96 1.64 98 6.61
Lao PDR 123 2.1 121 2.53 129 0.46 121 4.53
Malaysia 59 5.04 54 6.09 61 3.11 92 6.81
Myanmar 134 1.74 150 1.62 156 0.04 111 5.39
Philippines 98 3.34 102 3.46 101 1.46 86 6.94Singapore 15 7.65 8 8.31 11 7.25 77 7.12
Thailand 95 3.54 90 4 107 1.23 69 7.26
Vietnam 88 3.8 89 4.04 83 2.22 101 6.49
The Philippines ranked lowest in ICT among the largest economies in the ASEAN.
Source: International Telecommunication Union
SUB-INDICES OF THE ICT DEVELOPMENT INDEX (IDI)
1. ICT access – measures ICT infrastructure and readiness. This has 5 indicators: fi xed telephone subscriptions per 100 inhabitants, mobile cellular subscriptions per 100 inhabitants, international internet bandwidth per 100 inhabitants, percentage of households with a computer, and percentage of households with internet access.
2. ICT use – measures the uptake of ICTs and the intensity of usage. This has 3 indicators: internet users per 100 inhabitants, fi xed (wired) broadband subscriptions per 100 inhabitants, and wireless broadband subscriptions per 100 inhabitants.
ICT skills – measures the country’s level of human capacity and its population’s ability to use ICTs. This has 3 indicators: adult literacy rate, gross secondary enrollment ratio, and gross tertiary enrollment ratio.
Source: International Telecommunication Union
ICT ACCESS INDICATORS (2012)
COUNTRYFIXED TELEPHONE SUBSCRIPTIONS*
MOBILE CELLULAR SUBSCRIPTIONS*
INT’L INTERNET BANDWIDTH**
HOUSEHOLDS WITH COMPUTER (%)
HOUSEHOLDS WITH INTERNET ACCESS (%)
RATE RANK RATE RANK RATE RANK RATE RANK RATE RANK
Brunei 17.2 2 113.8 7 39,861 2 86.9 2 72.4 2
Cambodia 4 8 132 4 13,982 8 5.4 9 3.9 9
Indonesia 15.5 4 115.2 6 17,209 4 15.1 7 6.5 7
Lao PDR 1.8 9 101.9 9 1,752 10 8.7 8 5.1 8
Malaysia 15.7 3 140.9 3 16,378 5 66.9 3 64.7 3
Myanmar 1.1 10 11.2 10 10,213 9 2.3 10 1.8 10
Philippines 4.1 7 106.8 8 14,303 6 16.9 6 18.9 4Singapore 37.8 1 153.4 1 391,106 1 87.7 1 87.7 1
Thailand 9.1 6 120.3 5 24,998 3 26.9 4 18.4 5
Vietnam 11.4 5 149.4 2 13,518 7 17.5 5 15.6 6
Source: ITU (* - per 100 inhabitants; ** - bit per second per user)
the industry’s level of human capacity and its population’s ability to use ICTs through adult literacy rate, gross secondary enrollment ratio, and gross tertiary enrollment ratio. Among the sub-indices, the Philippines fared well in terms of ICT skills (86th of 144 countries), but ranked poorly in ICT use (101st of 144 countries) and ICT access (102nd of 144 countries).
While the country is doing well in the skills indicator of the IDI, it does little to compensate for the apparent gap in ICT infrastructure. Internet access remains poor in the Philippines, as only 17% of all households have a computer in 2012, while only 19% of households have an internet connection (see table). Only 36.2% of the total population use the internet (see table). At this rate, the key milestones indicated in the Philippine Digital Strategy
(PDS) – a road map stating how the country can progress thru ICT – will not be achieved. The PDS targets 80% of households to have access to 2 megabytes per second (mbps) of internet by 2016.
The Philippines also has a low subscription rate in terms of fi xed and mobile broadband. Only 2.2% of households have fi xed broadband connection while only 3.8% have access to mobile broadband. This is attributed to the high cost of broadband in the Philippines, where a 1 megabyte per second (Mbps) connection costs approximately $25 a month. Other countries charge signifi cantly less, such as Japan ($0.27), Korea ($0.45), and U.S. ($3.33).
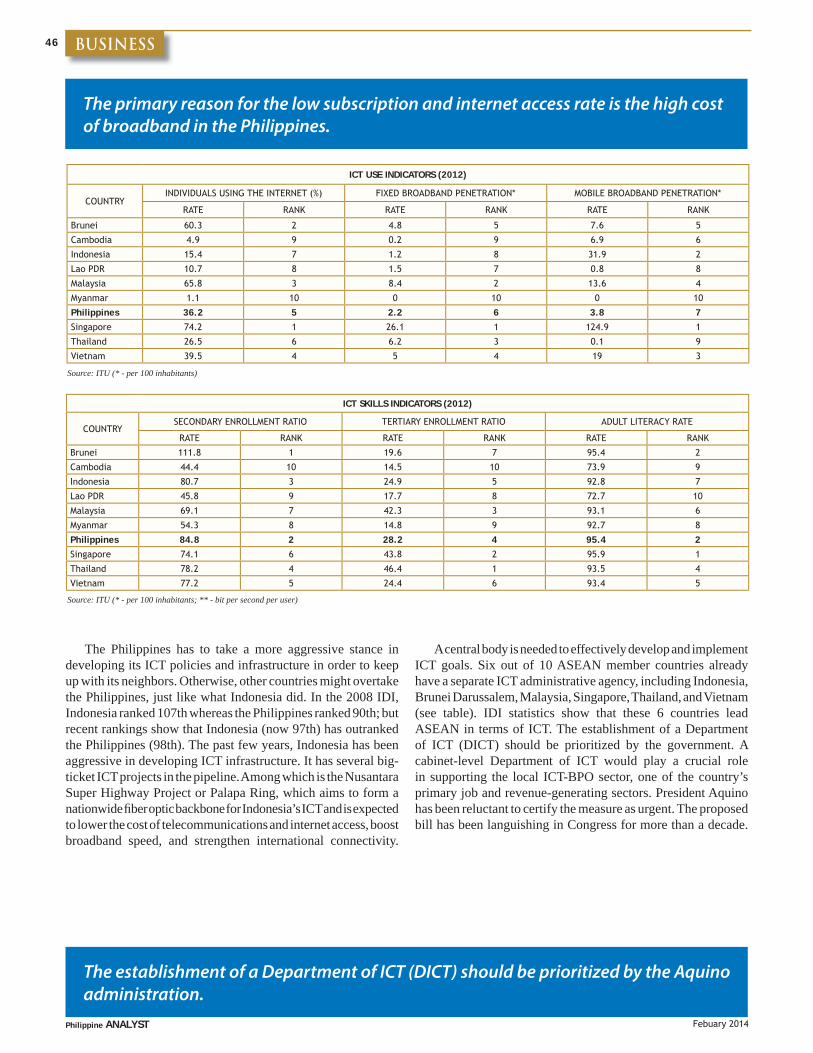
46 BUSINESS
Philippine ANALYST Febuary 2014
ICT USE INDICATORS (2012)
COUNTRYINDIVIDUALS USING THE INTERNET (%) FIXED BROADBAND PENETRATION* MOBILE BROADBAND PENETRATION*
RATE RANK RATE RANK RATE RANK
Brunei 60.3 2 4.8 5 7.6 5
Cambodia 4.9 9 0.2 9 6.9 6
Indonesia 15.4 7 1.2 8 31.9 2
Lao PDR 10.7 8 1.5 7 0.8 8
Malaysia 65.8 3 8.4 2 13.6 4
Myanmar 1.1 10 0 10 0 10
Philippines 36.2 5 2.2 6 3.8 7Singapore 74.2 1 26.1 1 124.9 1
Thailand 26.5 6 6.2 3 0.1 9
Vietnam 39.5 4 5 4 19 3
Source: ITU (* - per 100 inhabitants)
ICT SKILLS INDICATORS (2012)
COUNTRYSECONDARY ENROLLMENT RATIO TERTIARY ENROLLMENT RATIO ADULT LITERACY RATE
RATE RANK RATE RANK RATE RANK
Brunei 111.8 1 19.6 7 95.4 2
Cambodia 44.4 10 14.5 10 73.9 9
Indonesia 80.7 3 24.9 5 92.8 7
Lao PDR 45.8 9 17.7 8 72.7 10
Malaysia 69.1 7 42.3 3 93.1 6
Myanmar 54.3 8 14.8 9 92.7 8
Philippines 84.8 2 28.2 4 95.4 2Singapore 74.1 6 43.8 2 95.9 1
Thailand 78.2 4 46.4 1 93.5 4
Vietnam 77.2 5 24.4 6 93.4 5
Source: ITU (* - per 100 inhabitants; ** - bit per second per user)
The primary reason for the low subscription and internet access rate is the high cost of broadband in the Philippines.
The Philippines has to take a more aggressive stance in developing its ICT policies and infrastructure in order to keep up with its neighbors. Otherwise, other countries might overtake the Philippines, just like what Indonesia did. In the 2008 IDI, Indonesia ranked 107th whereas the Philippines ranked 90th; but recent rankings show that Indonesia (now 97th) has outranked the Philippines (98th). The past few years, Indonesia has been aggressive in developing ICT infrastructure. It has several big-ticket ICT projects in the pipeline. Among which is the Nusantara Super Highway Project or Palapa Ring, which aims to form a nationwide fi ber optic backbone for Indonesia’s ICT and is expected to lower the cost of telecommunications and internet access, boost broadband speed, and strengthen international connectivity.
A central body is needed to effectively develop and implement ICT goals. Six out of 10 ASEAN member countries already have a separate ICT administrative agency, including Indonesia, Brunei Darussalem, Malaysia, Singapore, Thailand, and Vietnam (see table). IDI statistics show that these 6 countries lead ASEAN in terms of ICT. The establishment of a Department of ICT (DICT) should be prioritized by the government. A cabinet-level Department of ICT would play a crucial role in supporting the local ICT-BPO sector, one of the country’s primary job and revenue-generating sectors. President Aquino has been reluctant to certify the measure as urgent. The proposed bill has been languishing in Congress for more than a decade.
The establishment of a Department of ICT (DICT) should be prioritized by the Aquino administration.
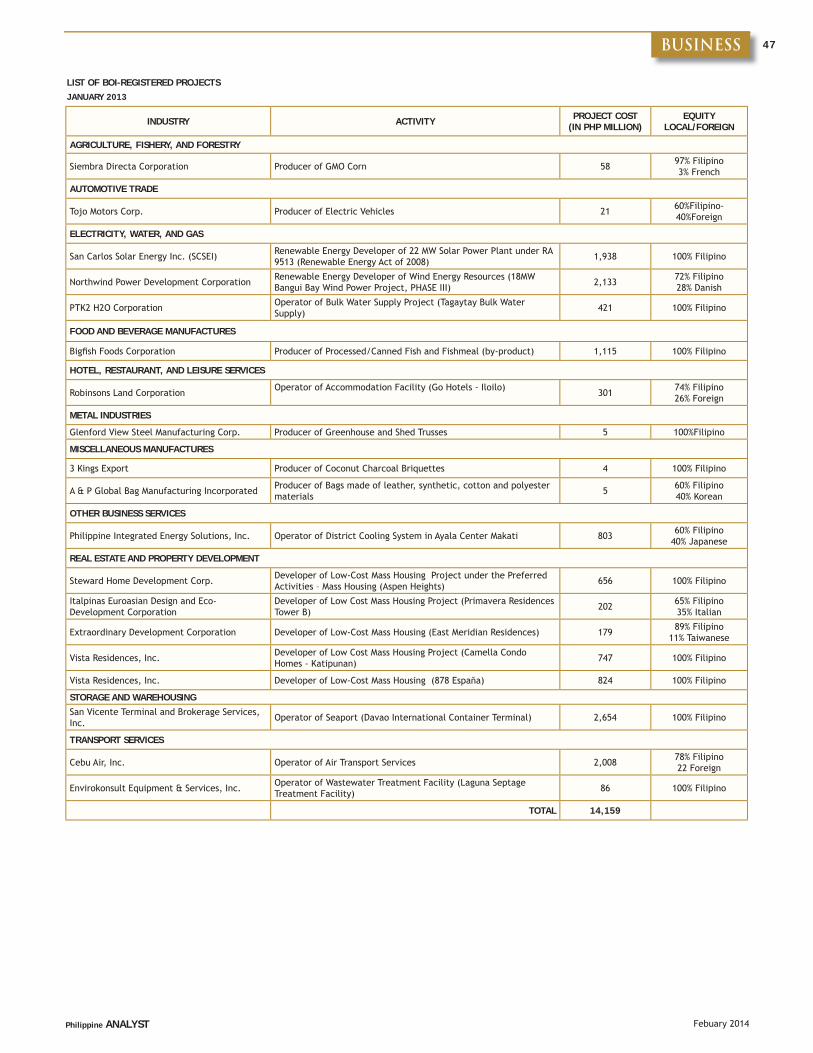
47BUSINESS
Philippine ANALYST Febuary 2014
LIST OF BOI-REGISTERED PROJECTS JANUARY 2013
INDUSTRY ACTIVITY PROJECT COST (IN PHP MILLION)
EQUITY LOCAL/FOREIGN
AGRICULTURE, FISHERY, AND FORESTRY
Siembra Directa Corporation Producer of GMO Corn 58 97% Filipino 3% French
AUTOMOTIVE TRADE
Tojo Motors Corp. Producer of Electric Vehicles 21 60%Filipino-40%Foreign
ELECTRICITY, WATER, AND GAS
San Carlos Solar Energy Inc. (SCSEI) Renewable Energy Developer of 22 MW Solar Power Plant under RA 9513 (Renewable Energy Act of 2008) 1,938 100% Filipino
Northwind Power Development Corporation Renewable Energy Developer of Wind Energy Resources (18MW Bangui Bay Wind Power Project, PHASE III) 2,133 72% Filipino
28% Danish
PTK2 H2O Corporation Operator of Bulk Water Supply Project (Tagaytay Bulk Water Supply) 421 100% Filipino
FOOD AND BEVERAGE MANUFACTURES
Bigfi sh Foods Corporation Producer of Processed/Canned Fish and Fishmeal (by-product) 1,115 100% Filipino
HOTEL, RESTAURANT, AND LEISURE SERVICES
Robinsons Land Corporation Operator of Accommodation Facility (Go Hotels - Iloilo) 301 74% Filipino 26% Foreign
METAL INDUSTRIES
Glenford View Steel Manufacturing Corp. Producer of Greenhouse and Shed Trusses 5 100%Filipino
MISCELLANEOUS MANUFACTURES
3 Kings Export Producer of Coconut Charcoal Briquettes 4 100% Filipino
A & P Global Bag Manufacturing Incorporated Producer of Bags made of leather, synthetic, cotton and polyester materials 5 60% Filipino
40% Korean
OTHER BUSINESS SERVICES
Philippine Integrated Energy Solutions, Inc. Operator of District Cooling System in Ayala Center Makati 803 60% Filipino 40% Japanese
REAL ESTATE AND PROPERTY DEVELOPMENT
Steward Home Development Corp. Developer of Low-Cost Mass Housing Project under the Preferred Activities – Mass Housing (Aspen Heights) 656 100% Filipino
Italpinas Euroasian Design and Eco-Development Corporation
Developer of Low Cost Mass Housing Project (Primavera Residences Tower B) 202 65% Filipino
35% Italian
Extraordinary Development Corporation Developer of Low-Cost Mass Housing (East Meridian Residences) 179 89% Filipino 11% Taiwanese
Vista Residences, Inc. Developer of Low Cost Mass Housing Project (Camella Condo Homes - Katipunan) 747 100% Filipino
Vista Residences, Inc. Developer of Low-Cost Mass Housing (878 España) 824 100% Filipino
STORAGE AND WAREHOUSINGSan Vicente Terminal and Brokerage Services, Inc. Operator of Seaport (Davao International Container Terminal) 2,654 100% Filipino
TRANSPORT SERVICES
Cebu Air, Inc. Operator of Air Transport Services 2,008 78% Filipino 22 Foreign
Envirokonsult Equipment & Services, Inc. Operator of Wastewater Treatment Facility (Laguna Septage Treatment Facility) 86 100% Filipino
TOTAL 14,159
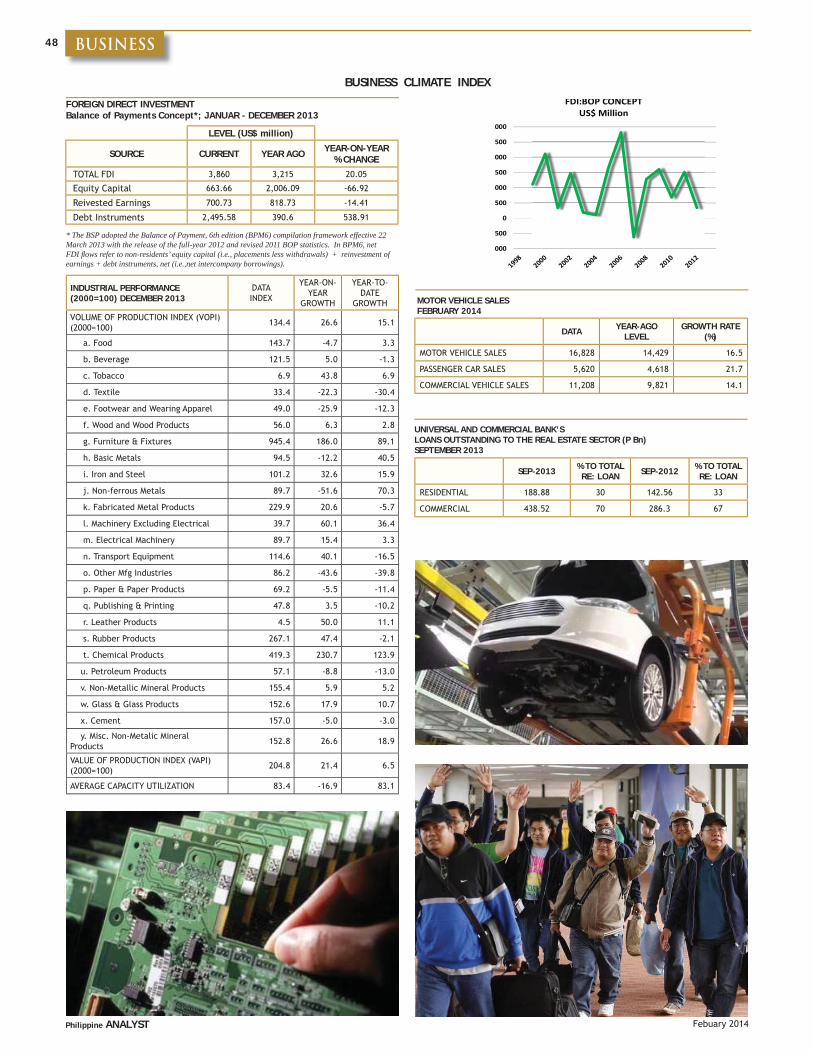
48 BUSINESS
Philippine ANALYST Febuary 2014
DATA INDEX
YEAR-ON-YEAR
GROWTH
YEAR-TO-DATE
GROWTH
VOLUME OF PRODUCTION INDEX (VOPI) (2000=100) 134.4 26.6 15.1
a. Food 143.7 -4.7 3.3
b. Beverage 121.5 5.0 -1.3
c. Tobacco 6.9 43.8 6.9
d. Textile 33.4 -22.3 -30.4
e. Footwear and Wearing Apparel 49.0 -25.9 -12.3
f. Wood and Wood Products 56.0 6.3 2.8
g. Furniture & Fixtures 945.4 186.0 89.1
h. Basic Metals 94.5 -12.2 40.5
i. Iron and Steel 101.2 32.6 15.9
j. Non-ferrous Metals 89.7 -51.6 70.3
k. Fabricated Metal Products 229.9 20.6 -5.7
l. Machinery Excluding Electrical 39.7 60.1 36.4
m. Electrical Machinery 89.7 15.4 3.3
n. Transport Equipment 114.6 40.1 -16.5
o. Other Mfg Industries 86.2 -43.6 -39.8
p. Paper & Paper Products 69.2 -5.5 -11.4
q. Publishing & Printing 47.8 3.5 -10.2
r. Leather Products 4.5 50.0 11.1
s. Rubber Products 267.1 47.4 -2.1
t. Chemical Products 419.3 230.7 123.9
u. Petroleum Products 57.1 -8.8 -13.0
v. Non-Metallic Mineral Products 155.4 5.9 5.2
w. Glass & Glass Products 152.6 17.9 10.7
x. Cement 157.0 -5.0 -3.0
y. Misc. Non-Metalic Mineral Products 152.8 26.6 18.9
VALUE OF PRODUCTION INDEX (VAPI) (2000=100) 204.8 21.4 6.5
AVERAGE CAPACITY UTILIZATION 83.4 -16.9 83.1
DATA YEAR-AGOLEVEL
GROWTH RATE (%)
MOTOR VEHICLE SALES 16,828 14,429 16.5
PASSENGER CAR SALES 5,620 4,618 21.7
COMMERCIAL VEHICLE SALES 11,208 9,821 14.1
BUSINESS CLIMATE INDEX
UNIVERSAL AND COMMERCIAL BANK’S LOANS OUTSTANDING TO THE REAL ESTATE SECTOR (P Bn)SEPTEMBER 2013
SEP-2013 % TO TOTALRE: LOAN SEP-2012 % TO TOTAL
RE: LOAN
RESIDENTIAL 188.88 30 142.56 33
COMMERCIAL 438.52 70 286.3 67
MOTOR VEHICLE SALESFEBRUARY 2014
000
500
0
500
000
500
000
500
000
FDI:BOP CONCEPT US$ Million
INDUSTRIAL PERFORMANCE (2000=100) DECEMBER 2013
FOREIGN DIRECT INVESTMENTBalance of Payments Concept*; JANUAR - DECEMBER 2013
LEVEL (US$ million)
SOURCE CURRENT YEAR AGO YEAR-ON-YEAR% CHANGE
TOTAL FDI 3,860 3,215 20.05
Equity Capital 663.66 2,006.09 -66.92
Reivested Earnings 700.73 818.73 -14.41
Debt Instruments 2,495.58 390.6 538.91
* The BSP adopted the Balance of Payment, 6th edition (BPM6) compilation framework effective 22 March 2013 with the release of the full-year 2012 and revised 2011 BOP statistics. In BPM6, net FDI fl ows refer to non-residents’ equity capital (i.e., placements less withdrawals) + reinvestment of earnings + debt instruments, net (i.e.,net intercompany borrowings).
49BUSINESS
Philippine ANALYST Febuary 2014
BUSINESS CLIMATE INDEX
LABOR STRIKES
VISITOR ARRIVALSJANUARY-DECEMBER 2013
SURVEY ON THE MONTHLY OCCUPANCY RATES & LENGTH OF STAY
HOTEL OCCUPANCY DECREASES TO 67% IN 2012
In 2012, average occupancy rate of hotels decreased to 67.25% from 69.26% in 2011. De Luxe hotels posted the highest occupancy rate with 71.49%, down by 0.93 percentage point from 2011. Standard hotels registered the 2nd highest occupancy rate at 64.82%, which also slipped by 3.48 percentage points. Meanwhile, First Class hotels outranked economy hotels with an average occupancy rate of 58.04%, lower by 4.1 percentage points. Economy hotels had the least occupancy at an average rate of 53.44%, down by 5.14 percentage points in 2011.
1 STRIKE IN JUNE
A strike was recorded in June 2013 which involved 400 workers equivalent to 1,200 man-days lost. Meanwhile, there is a total of 104 notices of strike/lockouts since January. In 2012, 3 strikes were recorded involving 209 workers, which is equivalent to 797 man-days lost. Meanwhile, 184 notices of strike were fi led that year.
2012 2011 2012/2011
JAN-DEC JAN-DEC GROWTH RATE
De Luxe Hotels
Occupancy Rates 71.49 72.36 -1.20
Length of Stay 2.92 3.02 -3.28
First Class Hotels
Occupancy Rates 58.05 61.04 -4.88
Length of Stay 2.30 2.46 -6.70
Standard Hotels
Occupancy Rates 64.82 66.87 -3.06
Length of Stay 2.38 2.35 1.06
Economy Hotels
Occupancy Rates 53.44 59.22 -9.76
Length of Stay 2.13 1.92 11.18
STRIKES DECLARED WORKERS INVOLVED MAN-DAYS LOST (000)
2013 2012 2013 2012 2013 2013
JAN 0 0 - - - -
FEB - - - - - -
MAR - - - - - -
APR - - - - - -
MAY - - - - - -
JUN 1.00 - 400 - 1,200 -
JUL - 1.00 - 20 - 160
AUG - - - - - -
SEP - - - - - -
OCT - 2.00 - 189 - 637
NOV - - - - - -
DEC - - - - - -
TOTAL 1 3 400 209 1,200 797
0
500
1000
1500
2000
2500
3000
3500
4000
MAN-DAYS LOST
0
2
4
6
8
10
12
STRIKES DECLARED
COUNTRY 2013 2012 % CHANGE RANK
KOREA 1,165,789 1,031,155 13.06 1
USA 674,564 652,626 3.36 2
JAPAN 433,705 412,474 5.15 3
CHINA 426,352 250,883 69.94 4
AUSTRALIA 213,023 191,150 11.44 5
SINGAPORE 175,034 148,215 18.09 6
TAIWAN 139,099 216,511 -35.75 7
CANADA 131,381 123,699 6.21 8
HONGKONG 126,008 118,666 6.19 7
UNITED KINGDOM 122,759 113,282 8.37 10
MALAYSIA 109,437 114,513 -4.43 11
GERMANY 70,949 67,023 5.86 12
OVERSEAS FILIPINO 203,612 215,943 -5.71
OTHERS 689,595 617,159 11.74
TOTAL 4,683,320 4,275,311 9.54
VISITOR ARRIVALS UP BY 5% IN JANUARY
Total visitor arrivals registered in January is 461,383 up by 5.80% from 436,079 in 2013. Of this total, 3.64% or 15,870 visitors are Filipinos residing abroad.
Korea remained the top source market in 2013 followed by the U.S. and China. Visitors coming from Korea amounted to 118,308 (25.64% share). The U.S. market placed 2nd with 71,042 visitors (15.40%) while the Chinese market ranked 3rd with 49,538 visitors (10.74%).
0
100
200
300
400
500
TOURISM ARRIVALS
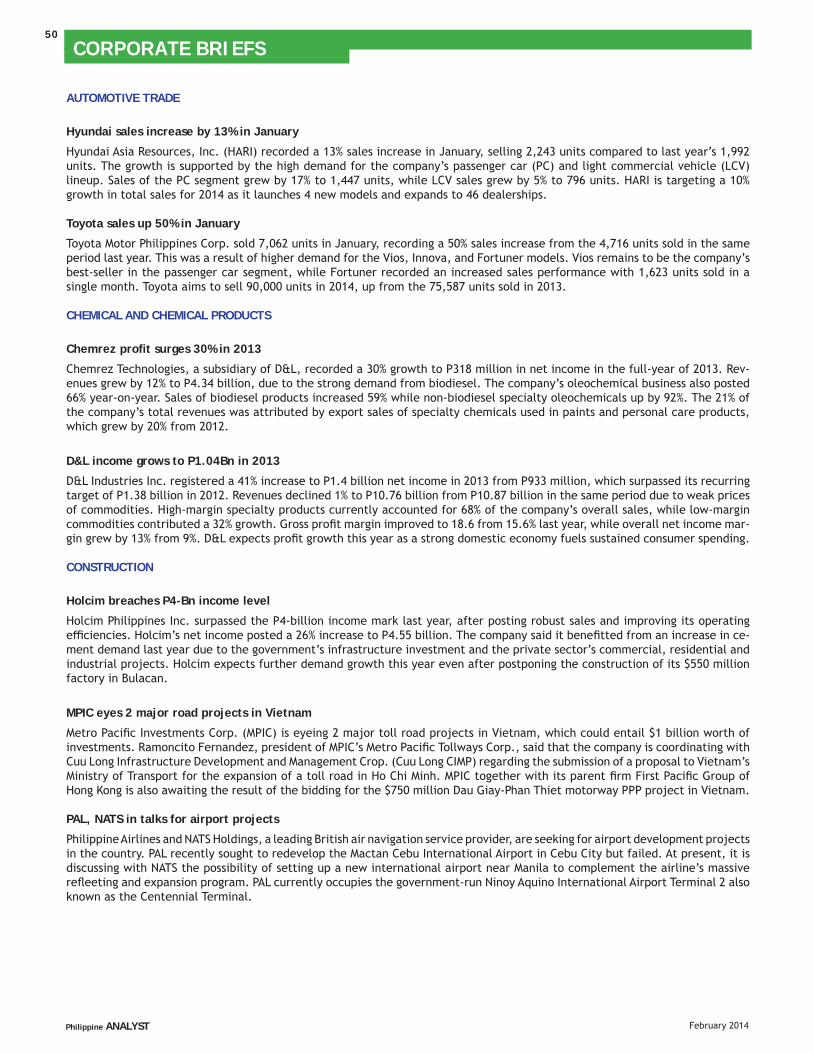
CORPORATE BRIEFS
Philippine ANALYST
CORPORATE BRIEFS50
February 2014
AUTOMOTIVE TRADE
Hyundai sales increase by 13% in January
Hyundai Asia Resources, Inc. (HARI) recorded a 13% sales increase in January, selling 2,243 units compared to last year’s 1,992 units. The growth is supported by the high demand for the company’s passenger car (PC) and light commercial vehicle (LCV) lineup. Sales of the PC segment grew by 17% to 1,447 units, while LCV sales grew by 5% to 796 units. HARI is targeting a 10% growth in total sales for 2014 as it launches 4 new models and expands to 46 dealerships.
Toyota sales up 50% in January
Toyota Motor Philippines Corp. sold 7,062 units in January, recording a 50% sales increase from the 4,716 units sold in the same period last year. This was a result of higher demand for the Vios, Innova, and Fortuner models. Vios remains to be the company’s best-seller in the passenger car segment, while Fortuner recorded an increased sales performance with 1,623 units sold in a single month. Toyota aims to sell 90,000 units in 2014, up from the 75,587 units sold in 2013.
CHEMICAL AND CHEMICAL PRODUCTS
Chemrez profi t surges 30% in 2013
Chemrez Technologies, a subsidiary of D&L, recorded a 30% growth to P318 million in net income in the full-year of 2013. Rev-enues grew by 12% to P4.34 billion, due to the strong demand from biodiesel. The company’s oleochemical business also posted 66% year-on-year. Sales of biodiesel products increased 59% while non-biodiesel specialty oleochemicals up by 92%. The 21% of the company’s total revenues was attributed by export sales of specialty chemicals used in paints and personal care products, which grew by 20% from 2012.
D&L income grows to P1.04Bn in 2013
D&L Industries Inc. registered a 41% increase to P1.4 billion net income in 2013 from P933 million, which surpassed its recurring target of P1.38 billion in 2012. Revenues declined 1% to P10.76 billion from P10.87 billion in the same period due to weak prices of commodities. High-margin specialty products currently accounted for 68% of the company’s overall sales, while low-margin commodities contributed a 32% growth. Gross profi t margin improved to 18.6 from 15.6% last year, while overall net income mar-gin grew by 13% from 9%. D&L expects profi t growth this year as a strong domestic economy fuels sustained consumer spending.
CONSTRUCTION
Holcim breaches P4-Bn income level
Holcim Philippines Inc. surpassed the P4-billion income mark last year, after posting robust sales and improving its operating effi ciencies. Holcim’s net income posted a 26% increase to P4.55 billion. The company said it benefi tted from an increase in ce-ment demand last year due to the government’s infrastructure investment and the private sector’s commercial, residential and industrial projects. Holcim expects further demand growth this year even after postponing the construction of its $550 million factory in Bulacan.
MPIC eyes 2 major road projects in Vietnam
Metro Pacifi c Investments Corp. (MPIC) is eyeing 2 major toll road projects in Vietnam, which could entail $1 billion worth of investments. Ramoncito Fernandez, president of MPIC’s Metro Pacifi c Tollways Corp., said that the company is coordinating with Cuu Long Infrastructure Development and Management Crop. (Cuu Long CIMP) regarding the submission of a proposal to Vietnam’s Ministry of Transport for the expansion of a toll road in Ho Chi Minh. MPIC together with its parent fi rm First Pacifi c Group of Hong Kong is also awaiting the result of the bidding for the $750 million Dau Giay-Phan Thiet motorway PPP project in Vietnam.
PAL, NATS in talks for airport projects
Philippine Airlines and NATS Holdings, a leading British air navigation service provider, are seeking for airport development projects in the country. PAL recently sought to redevelop the Mactan Cebu International Airport in Cebu City but failed. At present, it is discussing with NATS the possibility of setting up a new international airport near Manila to complement the airline’s massive refl eeting and expansion program. PAL currently occupies the government-run Ninoy Aquino International Airport Terminal 2 also known as the Centennial Terminal.
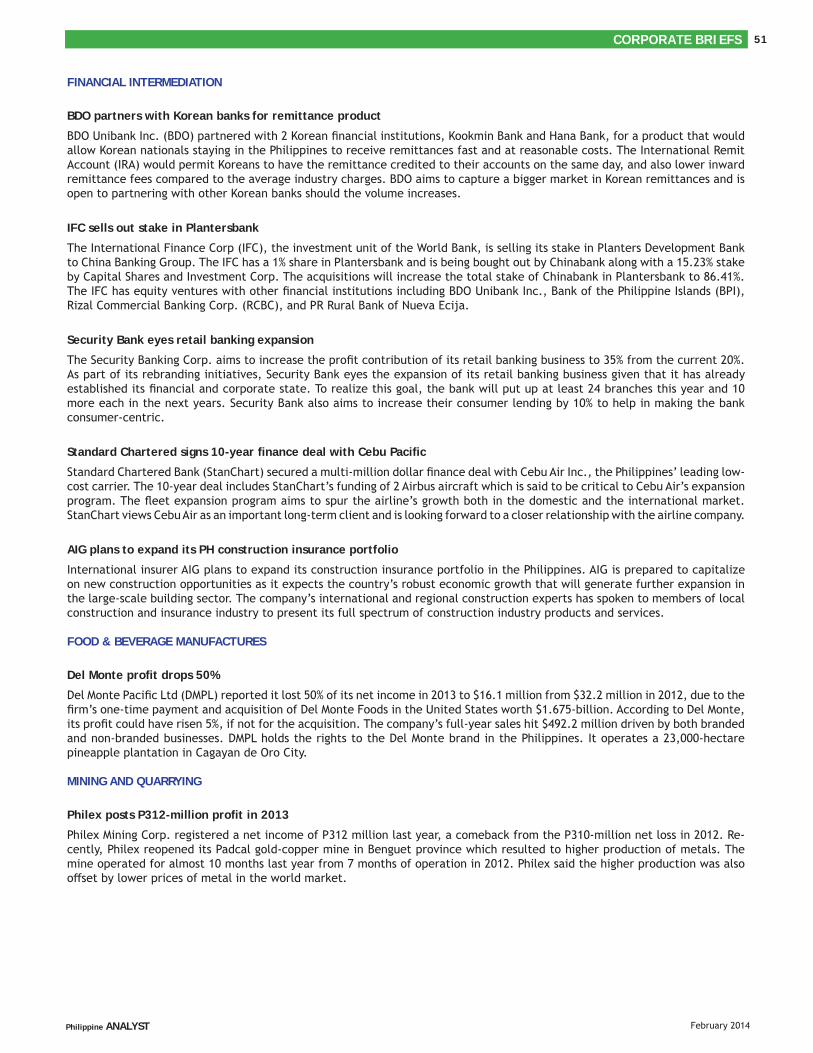
51CORPORATE BRIEFS
February 2014Philippine ANALYST
FINANCIAL INTERMEDIATION
BDO partners with Korean banks for remittance product
BDO Unibank Inc. (BDO) partnered with 2 Korean fi nancial institutions, Kookmin Bank and Hana Bank, for a product that would allow Korean nationals staying in the Philippines to receive remittances fast and at reasonable costs. The International Remit Account (IRA) would permit Koreans to have the remittance credited to their accounts on the same day, and also lower inward remittance fees compared to the average industry charges. BDO aims to capture a bigger market in Korean remittances and is open to partnering with other Korean banks should the volume increases.
IFC sells out stake in Plantersbank
The International Finance Corp (IFC), the investment unit of the World Bank, is selling its stake in Planters Development Bank to China Banking Group. The IFC has a 1% share in Plantersbank and is being bought out by Chinabank along with a 15.23% stake by Capital Shares and Investment Corp. The acquisitions will increase the total stake of Chinabank in Plantersbank to 86.41%. The IFC has equity ventures with other fi nancial institutions including BDO Unibank Inc., Bank of the Philippine Islands (BPI), Rizal Commercial Banking Corp. (RCBC), and PR Rural Bank of Nueva Ecija.
Security Bank eyes retail banking expansion
The Security Banking Corp. aims to increase the profi t contribution of its retail banking business to 35% from the current 20%. As part of its rebranding initiatives, Security Bank eyes the expansion of its retail banking business given that it has already established its fi nancial and corporate state. To realize this goal, the bank will put up at least 24 branches this year and 10 more each in the next years. Security Bank also aims to increase their consumer lending by 10% to help in making the bank consumer-centric.
Standard Chartered signs 10-year fi nance deal with Cebu Pacifi c
Standard Chartered Bank (StanChart) secured a multi-million dollar fi nance deal with Cebu Air Inc., the Philippines’ leading low-cost carrier. The 10-year deal includes StanChart’s funding of 2 Airbus aircraft which is said to be critical to Cebu Air’s expansion program. The fl eet expansion program aims to spur the airline’s growth both in the domestic and the international market. StanChart views Cebu Air as an important long-term client and is looking forward to a closer relationship with the airline company.
AIG plans to expand its PH construction insurance portfolio
International insurer AIG plans to expand its construction insurance portfolio in the Philippines. AIG is prepared to capitalize on new construction opportunities as it expects the country’s robust economic growth that will generate further expansion in the large-scale building sector. The company’s international and regional construction experts has spoken to members of local construction and insurance industry to present its full spectrum of construction industry products and services.
FOOD & BEVERAGE MANUFACTURES
Del Monte profi t drops 50%
Del Monte Pacifi c Ltd (DMPL) reported it lost 50% of its net income in 2013 to $16.1 million from $32.2 million in 2012, due to the fi rm’s one-time payment and acquisition of Del Monte Foods in the United States worth $1.675-billion. According to Del Monte, its profi t could have risen 5%, if not for the acquisition. The company’s full-year sales hit $492.2 million driven by both branded and non-branded businesses. DMPL holds the rights to the Del Monte brand in the Philippines. It operates a 23,000-hectare pineapple plantation in Cagayan de Oro City.
MINING AND QUARRYING
Philex posts P312-million profi t in 2013
Philex Mining Corp. registered a net income of P312 million last year, a comeback from the P310-million net loss in 2012. Re-cently, Philex reopened its Padcal gold-copper mine in Benguet province which resulted to higher production of metals. The mine operated for almost 10 months last year from 7 months of operation in 2012. Philex said the higher production was also off set by lower prices of metal in the world market.
CORPORATE BRIEFS52
February 2014Philippine ANALYST
REAL ESTATE AND PROPERTY DEVELOPMENT
ALI buys Mitsubishi’s stake in PhilEnergy
Ayala Land Inc. bought the 40% share of Mitsubishi Corp. in the Philippine Integrated Energy Solutions, Inc. (PhilEnergy) making it a wholly owned subsidiary of the company. PhilEnergy was formed as a 60-40 venture between Ayala Land, Inc. and Mitsubishi Corp. ALI said they invested in it in a bid to further enhance the competitiveness of the company’s properties. Meanwhile, ALI acknowledged Mitsubishi’s which served a critical role in PhilEnergy in providing technical support through its extensive network of affi liated energy-saving companies.
Global-Estate Resorts spends P10Bn to redevelop Southwoods City
Global-Estate Resorts Inc. said it will spend P10 billion over the next 10 years to transform Southwoods City into a new master-planned mixed-use development. Southwoods is a 561-hectare property located in Carmona, Cavite. It would feature a central business district, commercial and retail developments, schools, leisure facilities, medical facilities and transport hub. Global-Estate is the leading tourism estate developer in the country led by Mr. Andrew Tan.
Megaworld builds 6 BPO towers
Megaworld Corp., the biggest offi ce developer in the country, is building 6 new business process outsourcing (BPO) towers or a total of 112,000 square meters (sqm) of offi ce space. Two will be located in Uptown Bonifacio, 2 in Mactan Newtown, and 2 in Iloilo Business Park. The 6 buildings will bring Megaworld’s portfolio to 712,000 sqm of offi ce space by the end of the year. The company currently has 26 offi ce towers in the Philippines, located in Eastwood City, McKinley Hill, Newport City, and Mactan Newtown in Cebu.
Robinsons sells P15-billion bonds
Robinsons Land Corp. plans to sell between P10 billion to P15 billion in corporate bonds over the next few months to fi nance maturing debt and fi nance capital expenditures this year. Recently, Robinsons said it allocated P16 billion in capital expenditure for the fi scal year 2014 for new shopping malls, residential projects and land acquisition. It is currently operating 32 shopping malls and its residential projects are in various stages of development scheduled for completion in the next 1 to 5 years.
SMDC eyes P7-billion sales
SM Development Corp. expects to generate P7 billion in sales from its 4-tower Grace Residences, the company’s 1st mid-rise residential project in Taguig City. The project has over 3,600 residential units which is located in a 2.6-hectare property. Its con-struction is worth P3.2 billion. Its fi rst 2 towers were already sold out and would be turned over to buyers by 2016. Meanwhile, the 3rd tower is currently 30% sold ready for turnover by 2017. The 4th tower will be open for pre-selling starting July and is scheduled for completion by 2017.Units are currently being sold at P82,000 to P85,000 per square meter.
TELECOMMUNICATIONS
PLDT completes innovation lab in Baguio
Philippine Long Distance Telephone Co. (PLDT) has completed the construction of its 6th innovation lab (Innolab) in Baguio City, which is “a venue for developing and testing revolutionary ICT products and business solutions”. The Innolab contains a showroom and is a site for live demonstrations of PLDT products. It is now undergoing a dry-run and is expected to cater to customers in Baguio City and the rest of the Ilocos Region. The other Innolabs are located in Manila. Subic, Clark, Davao, and Cebu.

Philippine ANALYST February 2014
53
INFRASTRUCTURE
DOE says power rate hike due to an ‘artifi cial shortage’ in WESMThe energy department released a report on the power rate hike in December stating that an “artifi cial shortage” in power supply caused prices at the electricity spot market to rise during the 1-month maintenance shutdown of the Malampaya natural gas platform. The department has indicated that the shortage may have been the result of a violation of spot market rules or an outdated data on the actual capacity of listed power plants.
Initial results of the investigation conducted by the Department of Energy (DOE) showed that the P4.15 per kilowatt-hour (kWh) power rate increase in the Meralco bill in December
2013 would have been lower if enough power supply were offered and dispatched in the Wholesale Electricity Spot Market (WESM). DOE’s investigation is separate from the investigation being conducted by the ERC. DOE said, "It’s not P4.15 per kWh but also not zero. The ERC will release the actual price (of power generation in WESM) for the December bill soon. Of course, that follows the January billing too because it is under the same circumstances."
According to the DOE report submitted to the Supreme Court (SC), the data recorded during the Malampaya shutdown from November 11 to December 10 indicated that actual power supply in WESM was enough to meet the demand, but “substantial capacities were not offered in the market.” Thus, pushing market prices up. The department’s observations showed that missing capacities "ranged from 1,546 MW to 2,703 MW…thus the market cleared at a very high price."
As will be observed, there were 7 consecutive days (from Dec. 6 to Dec. 12) where some capacities available in the market were not offered (see box). In contrast, the load-weighted average price of electricity was extremely volatile, ranging between P1.70 per kWh and P65 per kWh (see chart).
Based on DOE’s investigation, 12 power plants - including the 650-MW Malaya Thermal power plant in Rizal - failed to comply with the real-time dispatch rule and must-offer rule of the WESM, resulting to the volatility in the prices. According to the 7.4.3 of the WESM rules, it would be considered as an anti-competitive behavior if the power plant physically withholds or refuses to offer to sell or schedule the maximum available output of reserve to the WESM by a facility available and capable of producing the output or reserve. The WESM’s Market Surveillance Committee is also investigating the incidents.
Price of electricity in WESM was extremely volatile, ranging between P1.70 per kWh and P65 per kWh.
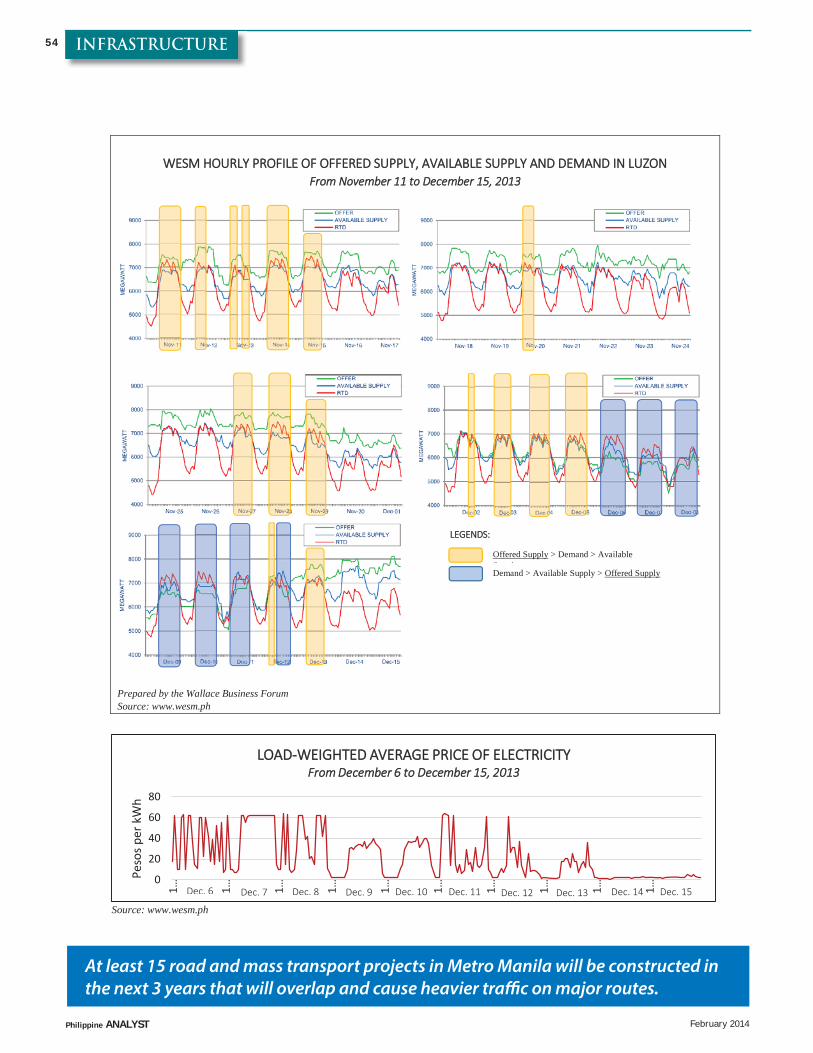
Philippine ANALYST February 2014
54 INFRASTRUCTURE
At least 15 road and mass transport projects in Metro Manila will be constructed in the next 3 years that will overlap and cause heavier traffi c on major routes.
WWESM HHOURLY PROFILE OF OFFERED SUPPLY, AVAILABLE SUPPLY AND DEMAND IN LUZON
FFrom November 11 to December 15, 2013
Prepared by the Wallace Business Forum Source: www.wesm.ph
Offered Supply > Demand > Available S lDemand > Available Supply > Offered Supply
LLEGENDS::
Source: www.wesm.ph
0
20
40
60
80
1… 1… 1… 1… 1… 1… 1… 1… 1… 1…
Peso
s per
kW
h
LLOAD-WWEIGHTED AVERAGE PRICE OF ELECTRICITYFrom December 6 to December 15, 2013
Dec. 6 Dec. 7 Dec. 8 Dec. 9 Dec. 10 Dec. 11 Dec. 12 Dec. 13 Dec. 14 Dec. 15
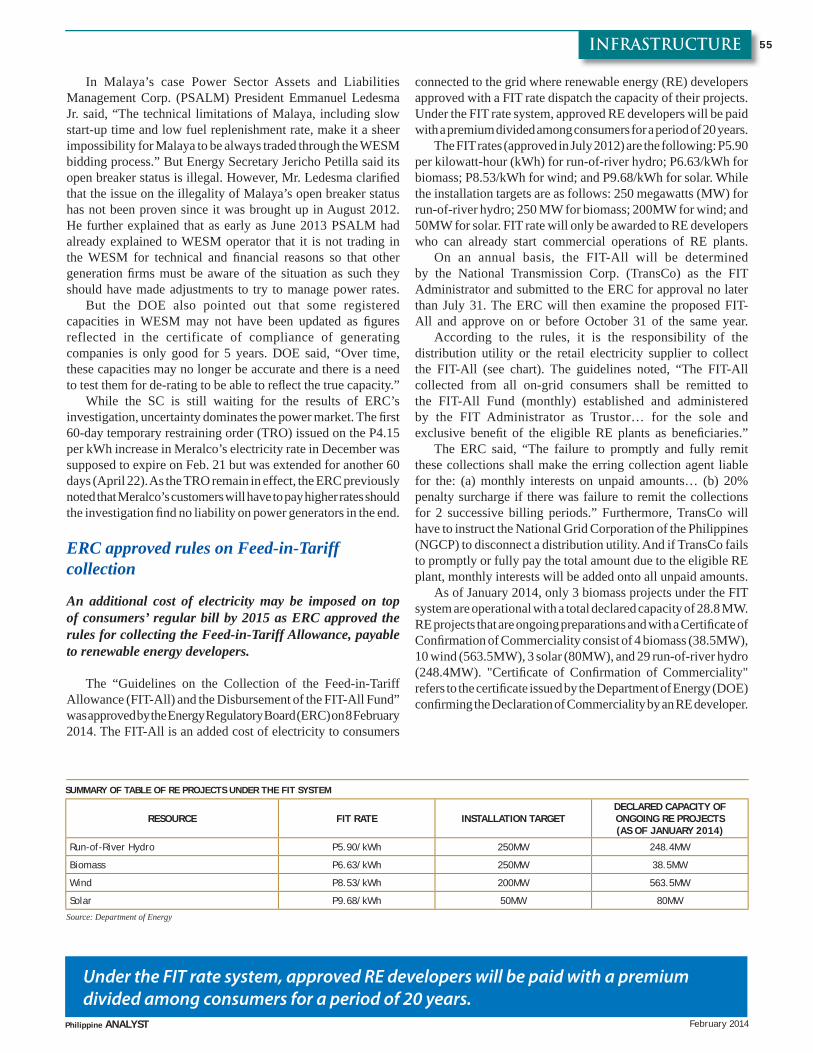
Philippine ANALYST February 2014
555INFRASTRUCTURE
In Malaya’s case Power Sector Assets and Liabilities Management Corp. (PSALM) President Emmanuel Ledesma Jr. said, “The technical limitations of Malaya, including slow start-up time and low fuel replenishment rate, make it a sheer impossibility for Malaya to be always traded through the WESM bidding process.” But Energy Secretary Jericho Petilla said its open breaker status is illegal. However, Mr. Ledesma clarifi ed that the issue on the illegality of Malaya’s open breaker status has not been proven since it was brought up in August 2012. He further explained that as early as June 2013 PSALM had already explained to WESM operator that it is not trading in the WESM for technical and fi nancial reasons so that other generation fi rms must be aware of the situation as such they should have made adjustments to try to manage power rates.
But the DOE also pointed out that some registered capacities in WESM may not have been updated as fi gures reflected in the certificate of compliance of generating companies is only good for 5 years. DOE said, “Over time, these capacities may no longer be accurate and there is a need to test them for de-rating to be able to refl ect the true capacity.”
While the SC is still waiting for the results of ERC’s investigation, uncertainty dominates the power market. The fi rst 60-day temporary restraining order (TRO) issued on the P4.15 per kWh increase in Meralco’s electricity rate in December was supposed to expire on Feb. 21 but was extended for another 60 days (April 22). As the TRO remain in effect, the ERC previously noted that Meralco’s customers will have to pay higher rates should the investigation fi nd no liability on power generators in the end.
ERC approved rules on Feed-in-Tariff collection
An additional cost of electricity may be imposed on top of consumers’ regular bill by 2015 as ERC approved the rules for collecting the Feed-in-Tariff Allowance, payable to renewable energy developers.
The “Guidelines on the Collection of the Feed-in-Tariff Allowance (FIT-All) and the Disbursement of the FIT-All Fund” was approved by the Energy Regulatory Board (ERC) on 8 February 2014. The FIT-All is an added cost of electricity to consumers
connected to the grid where renewable energy (RE) developers approved with a FIT rate dispatch the capacity of their projects. Under the FIT rate system, approved RE developers will be paid with a premium divided among consumers for a period of 20 years.
The FIT rates (approved in July 2012) are the following: P5.90 per kilowatt-hour (kWh) for run-of-river hydro; P6.63/kWh for biomass; P8.53/kWh for wind; and P9.68/kWh for solar. While the installation targets are as follows: 250 megawatts (MW) for run-of-river hydro; 250 MW for biomass; 200MW for wind; and 50MW for solar. FIT rate will only be awarded to RE developers who can already start commercial operations of RE plants.
On an annual basis, the FIT-All will be determined by the National Transmission Corp. (TransCo) as the FIT Administrator and submitted to the ERC for approval no later than July 31. The ERC will then examine the proposed FIT-All and approve on or before October 31 of the same year.
According to the rules, it is the responsibility of the distribution utility or the retail electricity supplier to collect the FIT-All (see chart). The guidelines noted, “The FIT-All collected from all on-grid consumers shall be remitted to the FIT-All Fund (monthly) established and administered by the FIT Administrator as Trustor… for the sole and exclusive benefi t of the eligible RE plants as benefi ciaries.”
The ERC said, “The failure to promptly and fully remit these collections shall make the erring collection agent liable for the: (a) monthly interests on unpaid amounts… (b) 20% penalty surcharge if there was failure to remit the collections for 2 successive billing periods.” Furthermore, TransCo will have to instruct the National Grid Corporation of the Philippines (NGCP) to disconnect a distribution utility. And if TransCo fails to promptly or fully pay the total amount due to the eligible RE plant, monthly interests will be added onto all unpaid amounts.
As of January 2014, only 3 biomass projects under the FIT system are operational with a total declared capacity of 28.8 MW. RE projects that are ongoing preparations and with a Certifi cate of Confi rmation of Commerciality consist of 4 biomass (38.5MW), 10 wind (563.5MW), 3 solar (80MW), and 29 run-of-river hydro (248.4MW). "Certifi cate of Confi rmation of Commerciality" refers to the certifi cate issued by the Department of Energy (DOE) confi rming the Declaration of Commerciality by an RE developer.
RESOURCE FIT RATE INSTALLATION TARGETDECLARED CAPACITY OF ONGOING RE PROJECTS (AS OF JANUARY 2014)
Run-of-River Hydro P5.90/kWh 250MW 248.4MW
Biomass P6.63/kWh 250MW 38.5MW
Wind P8.53/kWh 200MW 563.5MW
Solar P9.68/kWh 50MW 80MW
SUMMARY OF TABLE OF RE PROJECTS UNDER THE FIT SYSTEM
Source: Department of Energy
Under the FIT rate system, approved RE developers will be paid with a premium divided among consumers for a period of 20 years.
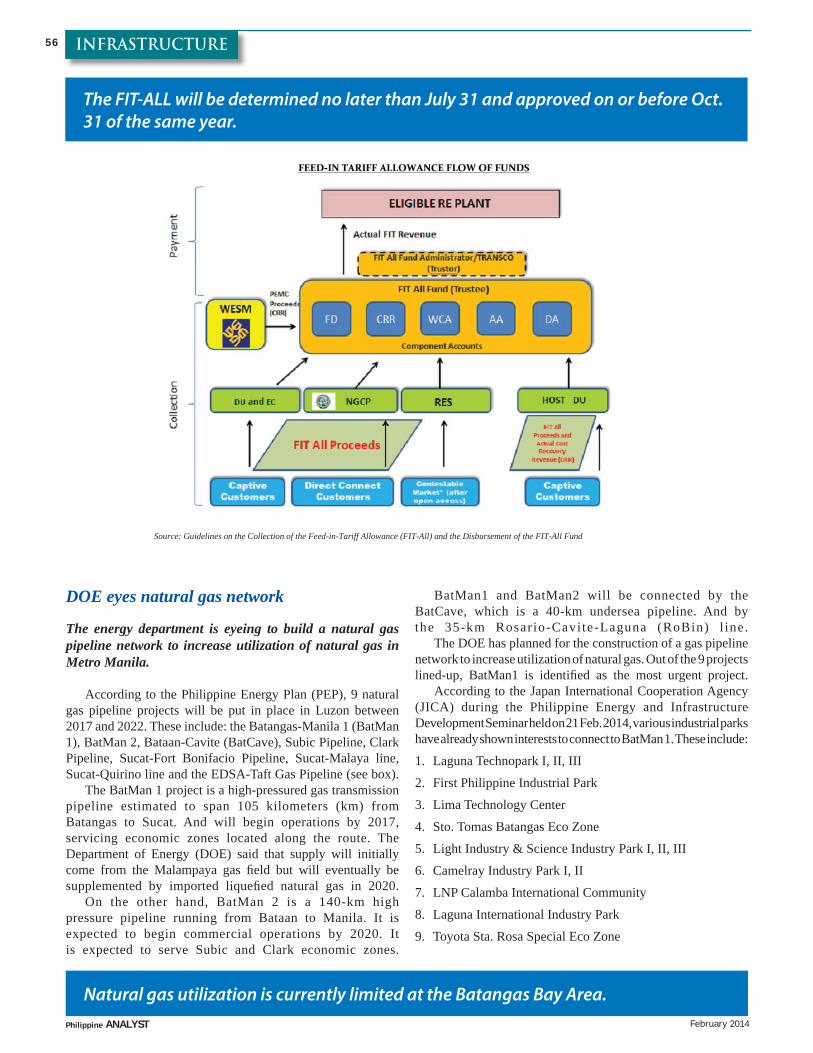
Philippine ANALYST February 2014
56 INFRASTRUCTURE
The FIT-ALL will be determined no later than July 31 and approved on or before Oct. 31 of the same year.
Source: Guidelines on the Collection of the Feed-in-Tariff Allowance (FIT-All) and the Disbursement of the FIT-All Fund
DOE eyes natural gas network
The energy department is eyeing to build a natural gas pipeline network to increase utilization of natural gas in Metro Manila.
According to the Philippine Energy Plan (PEP), 9 natural gas pipeline projects will be put in place in Luzon between 2017 and 2022. These include: the Batangas-Manila 1 (BatMan 1), BatMan 2, Bataan-Cavite (BatCave), Subic Pipeline, Clark Pipeline, Sucat-Fort Bonifacio Pipeline, Sucat-Malaya line, Sucat-Quirino line and the EDSA-Taft Gas Pipeline (see box).
The BatMan 1 project is a high-pressured gas transmission pipeline estimated to span 105 kilometers (km) from Batangas to Sucat. And will begin operations by 2017, servicing economic zones located along the route. The Department of Energy (DOE) said that supply will initially come from the Malampaya gas fi eld but will eventually be supplemented by imported liquefi ed natural gas in 2020.
On the other hand, BatMan 2 is a 140-km high pressure pipeline running from Bataan to Manila. It is expected to begin commercial operations by 2020. It is expected to serve Subic and Clark economic zones.
BatMan1 and BatMan2 will be connected by the BatCave, which is a 40-km undersea pipeline. And by the 35-km Rosario-Cavite-Laguna (RoBin) l ine.
The DOE has planned for the construction of a gas pipeline network to increase utilization of natural gas. Out of the 9 projects lined-up, BatMan1 is identifi ed as the most urgent project.
According to the Japan International Cooperation Agency (JICA) during the Philippine Energy and Infrastructure Development Seminar held on 21 Feb. 2014, various industrial parks have already shown interests to connect to BatMan 1. These include:1. Laguna Technopark I, II, III2. First Philippine Industrial Park3. Lima Technology Center4. Sto. Tomas Batangas Eco Zone5. Light Industry & Science Industry Park I, II, III6. Camelray Industry Park I, II7. LNP Calamba International Community8. Laguna International Industry Park9. Toyota Sta. Rosa Special Eco Zone
Natural gas utilization is currently limited at the Batangas Bay Area.
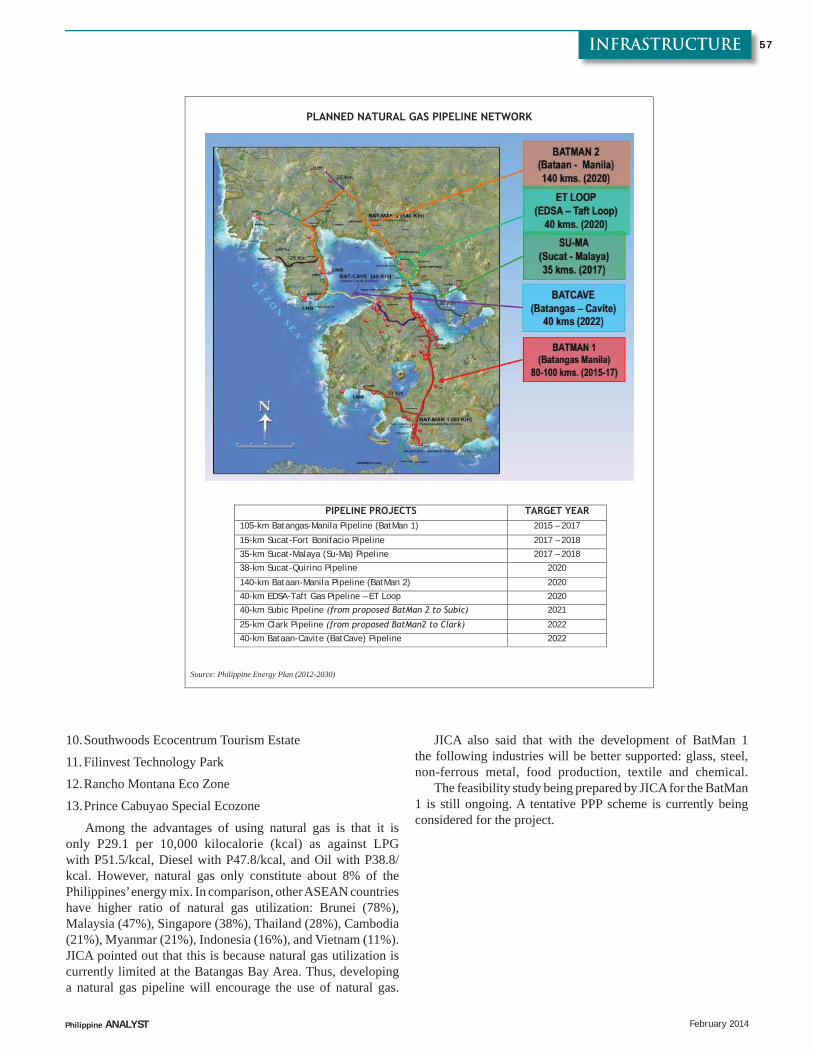
Philippine ANALYST February 2014
575INFRASTRUCTURE
PLANNED NATURAL GAS PIPELINE NETWORK
PIPELINE PROJECTS TARGET YEAR
105-km Batangas-Manila Pipeline (BatMan 1) 2015 – 2017
15-km Sucat-Fort Bonifacio Pipeline 2017 – 2018 35-km Sucat-Malaya (Su-Ma) Pipeline 2017 – 2018 38-km Sucat-Quirino Pipeline 2020
140-km Bataan-Manila Pipeline (BatMan 2) 2020 40-km EDSA-Taft Gas Pipeline – ET Loop 2020 40-km Subic Pipeline (from proposed BatMan 2 to Subic) 2021
25-km Clark Pipeline (from proposed BatMan2 to Clark) 2022 40-km Bataan-Cavite (BatCave) Pipeline 2022
Source: Philippine Energy Plan (2012-2030)
10. Southwoods Ecocentrum Tourism Estate11. Filinvest Technology Park12. Rancho Montana Eco Zone13. Prince Cabuyao Special Ecozone
Among the advantages of using natural gas is that it is only P29.1 per 10,000 kilocalorie (kcal) as against LPG with P51.5/kcal, Diesel with P47.8/kcal, and Oil with P38.8/kcal. However, natural gas only constitute about 8% of the Philippines’ energy mix. In comparison, other ASEAN countries have higher ratio of natural gas utilization: Brunei (78%), Malaysia (47%), Singapore (38%), Thailand (28%), Cambodia (21%), Myanmar (21%), Indonesia (16%), and Vietnam (11%). JICA pointed out that this is because natural gas utilization is currently limited at the Batangas Bay Area. Thus, developing a natural gas pipeline will encourage the use of natural gas.
JICA also said that with the development of BatMan 1 the following industries will be better supported: glass, steel, non-ferrous metal, food production, textile and chemical.
The feasibility study being prepared by JICA for the BatMan 1 is still ongoing. A tentative PPP scheme is currently being considered for the project.
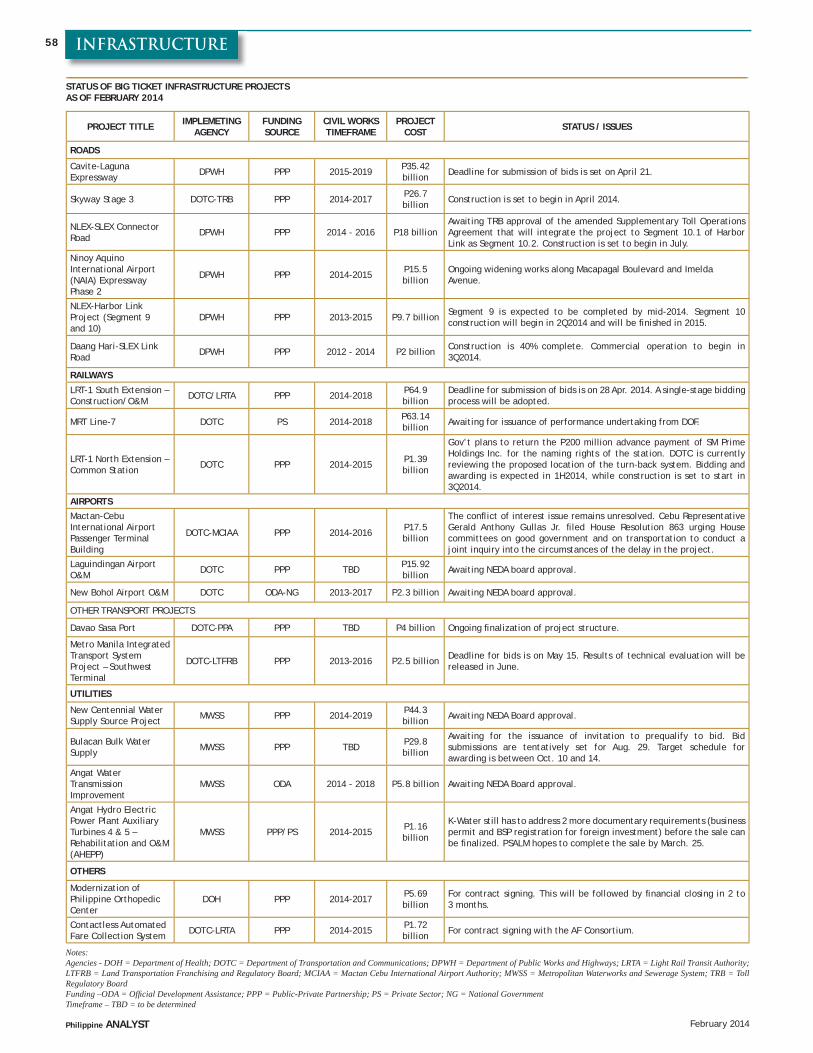
Philippine ANALYST February 2014
58 INFRASTRUCTURE
STATUS OF BIG TICKET INFRASTRUCTURE PROJECTS AS OF FEBRUARY 2014
PROJECT TITLE IMPLEMETING AGENCY
FUNDING SOURCE
CIVIL WORKS TIMEFRAME
PROJECT COST STATUS / ISSUES
ROADS
Cavite-Laguna Expressway DPWH PPP 2015-2019 P35.42
billion Deadline for submission of bids is set on April 21.
Skyway Stage 3 DOTC-TRB PPP 2014-2017 P26.7 billion Construction is set to begin in April 2014.
NLEX-SLEX Connector Road DPWH PPP 2014 - 2016 P18 billion
Awaiting TRB approval of the amended Supplementary Toll Operations Agreement that will integrate the project to Segment 10.1 of Harbor Link as Segment 10.2. Construction is set to begin in July.
Ninoy Aquino International Airport (NAIA) Expressway Phase 2
DPWH PPP 2014-2015 P15.5 billion
Ongoing widening works along Macapagal Boulevard and Imelda Avenue.
NLEX-Harbor Link Project (Segment 9 and 10)
DPWH PPP 2013-2015 P9.7 billion Segment 9 is expected to be completed by mid-2014. Segment 10 construction will begin in 2Q2014 and will be fi nished in 2015.
Daang Hari-SLEX Link Road DPWH PPP 2012 - 2014 P2 billion Construction is 40% complete. Commercial operation to begin in
3Q2014.
RAILWAYS
LRT-1 South Extension – Construction/O&M DOTC/LRTA PPP 2014-2018 P64.9
billionDeadline for submission of bids is on 28 Apr. 2014. A single-stage bidding process will be adopted.
MRT Line-7 DOTC PS 2014-2018 P63.14 billion Awaiting for issuance of performance undertaking from DOF.
LRT-1 North Extension – Common Station DOTC PPP 2014-2015 P1.39
billion
Gov’t plans to return the P200 million advance payment of SM Prime Holdings Inc. for the naming rights of the station. DOTC is currently reviewing the proposed location of the turn-back system. Bidding and awarding is expected in 1H2014, while construction is set to start in 3Q2014.
AIRPORTSMactan-Cebu International Airport Passenger Terminal Building
DOTC-MCIAA PPP 2014-2016 P17.5 billion
The confl ict of interest issue remains unresolved. Cebu Representative Gerald Anthony Gullas Jr. fi led House Resolution 863 urging House committees on good government and on transportation to conduct a joint inquiry into the circumstances of the delay in the project.
Laguindingan Airport O&M DOTC PPP TBD P15.92
billion Awaiting NEDA board approval.
New Bohol Airport O&M DOTC ODA-NG 2013-2017 P2.3 billion Awaiting NEDA board approval.
OTHER TRANSPORT PROJECTS
Davao Sasa Port DOTC-PPA PPP TBD P4 billion Ongoing fi nalization of project structure.
Metro Manila Integrated Transport System Project – Southwest Terminal
DOTC-LTFRB PPP 2013-2016 P2.5 billion Deadline for bids is on May 15. Results of technical evaluation will be released in June.
UTILITIES
New Centennial Water Supply Source Project MWSS PPP 2014-2019 P44.3
billion Awaiting NEDA Board approval.
Bulacan Bulk Water Supply MWSS PPP TBD P29.8
billion
Awaiting for the issuance of invitation to prequalify to bid. Bid submissions are tentatively set for Aug. 29. Target schedule for awarding is between Oct. 10 and 14.
Angat Water Transmission Improvement
MWSS ODA 2014 - 2018 P5.8 billion Awaiting NEDA Board approval.
Angat Hydro Electric Power Plant Auxiliary Turbines 4 & 5 – Rehabilitation and O&M (AHEPP)
MWSS PPP/PS 2014-2015 P1.16 billion
K-Water still has to address 2 more documentary requirements (business permit and BSP registration for foreign investment) before the sale can be fi nalized. PSALM hopes to complete the sale by March. 25.
OTHERS
Modernization of Philippine Orthopedic Center
DOH PPP 2014-2017 P5.69 billion
For contract signing. This will be followed by fi nancial closing in 2 to 3 months.
Contactless Automated Fare Collection System DOTC-LRTA PPP 2014-2015 P1.72
billion For contract signing with the AF Consortium.
Notes: Agencies - DOH = Department of Health; DOTC = Department of Transportation and Communications; DPWH = Department of Public Works and Highways; LRTA = Light Rail Transit Authority; LTFRB = Land Transportation Franchising and Regulatory Board; MCIAA = Mactan Cebu International Airport Authority; MWSS = Metropolitan Waterworks and Sewerage System; TRB = Toll Regulatory BoardFunding –ODA = Offi cial Development Assistance; PPP = Public-Private Partnership; PS = Private Sector; NG = National GovernmentTimeframe – TBD = to be determined
59
CONGRESSWATCH
Philippine ANALYST February 2014
Bill amending Anti-Graft Law fi led in CongressSenate President Franklin M. Drilon and Senator Aquilino “Koko” Pimentel III have endorsed a bill that aims to decongest the clogged dockets of the country’s anti-graft court, the Sandiganbayan.
Senate Bill (SB) No. 2138 seeks to introduce the following amendments to the current Anti-Graft court:
1. Incorporation of the concept of “Justice-Designate” that will allow one justice to hear receive evidence, and amend the quorum requirement from three justices in a division to two;
2. Transfer the jurisdiction over “minor cases” to the Regional Trial Courts; and
3. Modifi cation of the voting requirement for promulgation of judgment to allow the concurrence of at least two members of a division, instead of three, to render a decision.In a sponsorship speech, Senate President Drilon noted
the dismal disposition of graft cases at the ant-graft court: “The Sandiganbayan completes the proceedings of a case - from the filing of the information to promulgation of judgment - in about seven years. This sorry rate of disposition reflects the heavily clogged dockets of the court, given that the cases fi led before it has multiplied over the years. Such a drawn-out process of litigation is injustice itself.”
Sen. Pimentel, for his part, stressed that the proposed measure’s goal is to hasten the disposition in the Sandiganbayan, the country’s “specialized court tasked to effectively and swiftly resolve corruption cases against erring government offi cials and employees.”
SB 2138 allows an individual member of a Sandiganbayan division to hear and receive evidence on behalf of the two other members of his division. At present, the anti-graft court is composed of 5 divisions, with 3 justices each; and the presence of the three justices is required to receive evidence and try a case.
The bill also seeks to modify the voting requirement for promulgation of judgment, by allowing at least the concurrence of 2 members to render a judgment. The proposed measure amends Section 5 of the Sandiganbayan Law, which requires the unanimous vote of all 3 members in a division to render a fi nal order.
The original Sandiganbayan Law (Presidential Decree 1606) was twice amended through Republic Acts 7975 and 8249 that were enacted in 1995 and 1997, respectively.
Senate Bill 2138 is currently pending on second reading in the Upper Chamber. It is likely to be passed into law this 16th Congress.
The approval of the measure is crucial especially in the light of the pork barrel scam that implicated several lawmakers and offi cials of state-led corporations. The bill would play a crucial role in the speedy resolution of graft cases in the country. President Aquino must push for the speedy approval of the bill as it will complement his anti-corruption agenda.
60 CONGRESSWATCH
Philippine ANALYST February 2014
BSP seeks to remove limit on foreign bank entry
The Bangko Sentral ng Pilipinas (central bank) said it will endorse a bill to Congress that will remove the limit on the number of foreign banks that may enter the country. The liberalization aims to attract more investments into the Philippines and is also in line with the ASEAN economic integration in 2015.
Central Bank Governor Amado Tetangco, Jr. said that bills amending R.A. 7721 – the law governing the entry and operations of foreign banks in the Philippines enacted in May 1994 – have already been endorsed to Finance and Banking Committees of the Senate and House of Representatives. Senate Bill 2159 and House Bill 3984 introduced by Sen. Sergio Osmena III and Rep. Sonny Collantes, respectively, remove the limit on the number of foreign banks that may enter the Philippines. However, the 30% ceiling on assets of foreign banks will still be retained by the central bank because of the rapid growth of the domestic banks. This ceiling represents the maximum share of foreign banks in the total assets of the Philippine banking system. At present, foreign banks account for only 11% or P10.423 trillion. The foreign banks’ share peaked in the early 2000’s at 18%, but this eventually declined as domestic banks expanded their operations.
Under R.A. 7721, only 10 foreign banks are allowed to enter the Philippine market, and these banks need to be among the top 150 banks in the world or among the top 5 banks in their respective home countries. Foreign banks are also limited to only 6 branches here in the Philippines, where 3 locations can be chosen by the banks and the remaining 3 will be designated by the Monetary Board of the central bank. Currently, there are 14 foreign banks in the Philippines – 4 of which were already present when R.A. 7721 was passed in 1994.
Apart from the easing of restrictions in the number of foreign banks entering the country, the central bank is also proposing that the foreign banks be allowed to choose locations for all 6 branches. A provision allowing the Monetary Board to suspend further entry of foreign banks “as national interest warrants” is also included in the proposed amendments.
Senate President Franklin Drilon and Senator Koko Pimentel on Senate Bill 2138:
Senate President Drilon:"If we are to outrun graft and corruption, it is imperative that we resuscitate and recondition our existing prosecutorial and adjudicatory institutions against this opponent."Th e most potent deterrent against the spread of corruption is the certainty of punishment and expeditiousness of the proceedings, by boosting the structural capability of our anti-graft mechanisms.“With these cutting edge proposals, the Senate is confi dent that the Sandiganbayan will be able to catch up with the pace of graft and corruption in public institution.”Senator Pimentel:“It is imperative for us to introduce and make the necessary revisions in the Court’s structure to ensure that justice is delivered, with haste and without delay.”
The planned liberalization is expected to attract more foreign investments in the country. The measure also supports ASEAN economies’ efforts to create a single economic community. The Joint Foreign Chambers (JFC) of the Philippines is in favor of the bill’s passage, saying that it is in line with the central bank’s policy direction “to introduce reforms and make the industry responsive to the needs of the stakeholders and market conditions.”
The JFC added that “the passage of HB 3984 would prepare the Philippines for ASEAN fi nancial integration. It is consistent with the ASEAN Banking Integration Framework, under which so-called Qualifi ed ASEAN Banks can operate within ASEAN jurisdictions on equal terms as domestic banks of that jurisdiction subject to certain prudential and governance standards.”
Central Bank Deputy Governor Nestor Espenilla, Jr. said that foreign banks may target investors in their home country, thus attracting more foreign direct investments into the Philippines. The liberalization will also result in increased competition among foreign and domestic banks, hence, would compel local banks to operate more effi ciently.
61
CONTENTS Overviews Global Outlook
Regional Outlook
North Asia Japan
China
Hong Kong
Taiwan
South Korea
Southeast Asia Indonesia
Malaysia
Philippines
Singapore
Thailand
Vietnam
South Asia India
Australasia Australia
New Zealand
ww
w.im
aasi
a.co
m
CONFIDENTIAL
Asia Pacific Executive Brief February 2014 © IMA Asia
Editor: Richard Martin ([email protected]) Regional economist: Andrew Hordern ([email protected]) Consulting economist: Kostas Panagiotou ([email protected])
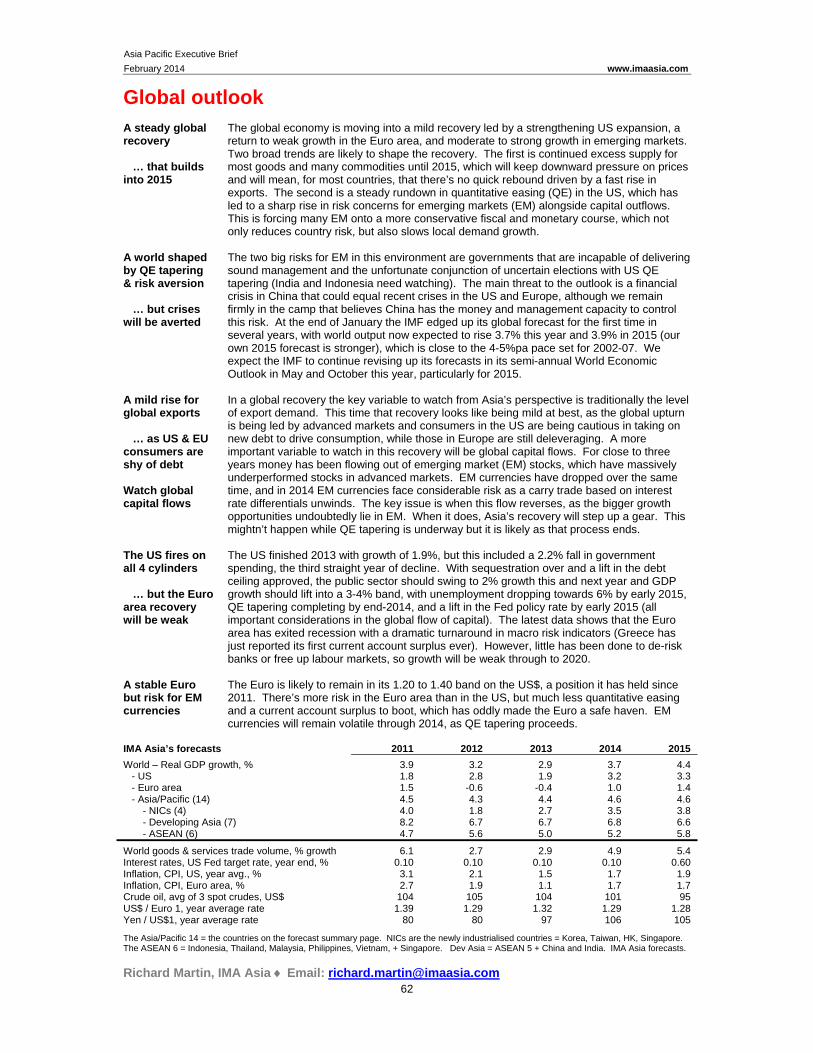
Asia Pacific Executive Brief
February 2014 www.imaasia.com
62
Global outlook A steady global recovery … that builds into 2015
The global economy is moving into a mild recovery led by a strengthening US expansion, a return to weak growth in the Euro area, and moderate to strong growth in emerging markets. Two broad trends are likely to shape the recovery. The first is continued excess supply for most goods and many commodities until 2015, which will keep downward pressure on prices and will mean, for most countries, that there’s no quick rebound driven by a fast rise in exports. The second is a steady rundown in quantitative easing (QE) in the US, which has led to a sharp rise in risk concerns for emerging markets (EM) alongside capital outflows. This is forcing many EM onto a more conservative fiscal and monetary course, which not only reduces country risk, but also slows local demand growth.
A world shaped by QE tapering & risk aversion … but crises will be averted
The two big risks for EM in this environment are governments that are incapable of delivering sound management and the unfortunate conjunction of uncertain elections with US QE tapering (India and Indonesia need watching). The main threat to the outlook is a financial crisis in China that could equal recent crises in the US and Europe, although we remain firmly in the camp that believes China has the money and management capacity to control this risk. At the end of January the IMF edged up its global forecast for the first time in several years, with world output now expected to rise 3.7% this year and 3.9% in 2015 (our own 2015 forecast is stronger), which is close to the 4-5%pa pace set for 2002-07. We expect the IMF to continue revising up its forecasts in its semi-annual World Economic Outlook in May and October this year, particularly for 2015.
A mild rise for global exports … as US & EU consumers are shy of debt Watch global capital flows
In a global recovery the key variable to watch from Asia’s perspective is traditionally the level of export demand. This time that recovery looks like being mild at best, as the global upturn is being led by advanced markets and consumers in the US are being cautious in taking on new debt to drive consumption, while those in Europe are still deleveraging. A more important variable to watch in this recovery will be global capital flows. For close to three years money has been flowing out of emerging market (EM) stocks, which have massively underperformed stocks in advanced markets. EM currencies have dropped over the same time, and in 2014 EM currencies face considerable risk as a carry trade based on interest rate differentials unwinds. The key issue is when this flow reverses, as the bigger growth opportunities undoubtedly lie in EM. When it does, Asia’s recovery will step up a gear. This mightn’t happen while QE tapering is underway but it is likely as that process ends.
The US fires on all 4 cylinders … but the Euro area recovery will be weak
The US finished 2013 with growth of 1.9%, but this included a 2.2% fall in government spending, the third straight year of decline. With sequestration over and a lift in the debt ceiling approved, the public sector should swing to 2% growth this and next year and GDP growth should lift into a 3-4% band, with unemployment dropping towards 6% by early 2015, QE tapering completing by end-2014, and a lift in the Fed policy rate by early 2015 (all important considerations in the global flow of capital). The latest data shows that the Euro area has exited recession with a dramatic turnaround in macro risk indicators (Greece has just reported its first current account surplus ever). However, little has been done to de-risk banks or free up labour markets, so growth will be weak through to 2020.
A stable Euro but risk for EM currencies
The Euro is likely to remain in its 1.20 to 1.40 band on the US$, a position it has held since 2011. There’s more risk in the Euro area than in the US, but much less quantitative easing and a current account surplus to boot, which has oddly made the Euro a safe haven. EM currencies will remain volatile through 2014, as QE tapering proceeds.
IMA Asia’s forecasts 2011 2012 2013 2014 2015
World – Real GDP growth, % 3.9 3.2 2.9 3.7 4.4 - US 1.8 2.8 1.9 3.2 3.3 - Euro area 1.5 -0.6 -0.4 1.0 1.4 - Asia/Pacific (14) 4.5 4.3 4.4 4.6 4.6 - NICs (4) 4.0 1.8 2.7 3.5 3.8 - Developing Asia (7) 8.2 6.7 6.7 6.8 6.6 - ASEAN (6) 4.7 5.6 5.0 5.2 5.8
World goods & services trade volume, % growth 6.1 2.7 2.9 4.9 5.4 Interest rates, US Fed target rate, year end, % 0.10 0.10 0.10 0.10 0.60 Inflation, CPI, US, year avg., % 3.1 2.1 1.5 1.7 1.9 Inflation, CPI, Euro area, % 2.7 1.9 1.1 1.7 1.7 Crude oil, avg of 3 spot crudes, US$ 104 105 104 101 95 US$ / Euro 1, year average rate 1.39 1.29 1.32 1.29 1.28 Yen / US$1, year average rate 80 80 97 106 105
The Asia/Pacific 14 = the countries on the forecast summary page. NICs are the newly industrialised countries = Korea, Taiwan, HK, Singapore. The ASEAN 6 = Indonesia, Thailand, Malaysia, Philippines, Vietnam, + Singapore. Dev Asia = ASEAN 5 + China and India. IMA Asia forecasts.
Richard Martin, IMA Asia Email: [email protected]
Asia Pacific Executive Brief
February 2014 www.imaasia.com
63
Regional outlook Summary of forecasts in this month’s Asia Brief GDP (Expenditure), real growth, % 2011 2012 2013 2014 2015
Japan -0.5 1.4 1.6 1.1 1.0 China 9.3 7.7 7.7 7.5 6.9 Hong Kong 4.9 1.5 3.0 3.6 4.5
Taiwan 4.2 1.5 2.2 3.0 3.5 South Korea 3.7 2.0 2.8 3.7 3.7 Indonesia 6.5 6.3 5.8 6.0 6.5
Malaysia 5.1 5.6 4.7 5.0 5.6 Philippines 3.6 6.8 7.2 6.5 5.5 Singapore 6.0 1.9 4.1 4.5 5.0
Thailand 0.1 6.5 2.9 2.5 5.3 Vietnam 6.2 5.2 5.4 6.0 6.0 India (CY) 7.7 3.8 4.2 5.4 6.2
Australia 2.6 3.6 2.5 3.0 2.2 New Zealand 1.2 2.9 3.1 3.8 3.6 Inflation, CPI year average, % 2011 2012 2013 2014 2015
Japan -0.3 0.0 0.2 2.4 1.5 China 5.4 2.7 2.6 2.9 3.0 Hong Kong (composite CPI) 5.3 4.1 4.4 3.7 3.6
Taiwan 1.4 1.9 0.8 1.3 2.0 South Korea 4.0 2.2 1.3 2.0 2.5 Indonesia 5.4 4.3 7.0 6.5 5.5
Malaysia 3.2 1.6 2.1 3.5 4.8 Philippines 4.6 3.2 3.0 4.1 4.7 Singapore 5.2 4.6 2.4 3.0 2.9
Thailand 3.8 3.0 2.2 2.5 3.3 Vietnam 18.7 9.1 6.6 6.0 6.5 India (CY CPI urban non-manual workers) 8.9 9.8 10.1 7.7 6.6
Australia 3.3 1.8 2.4 3.0 2.9 New Zealand 4.0 1.1 1.1 2.6 3.2 Exchange rate to US$1, year avg. 2011 2012 2013 2014 2015
Japan 80 80 97 106 105 China 6.46 6.31 6.20 6.07 6.02 Hong Kong 7.78 7.76 7.76 7.76 7.76
Taiwan 29.5 29.6 29.6 30.0 29.5 South Korea 1,108 1,125 1,095 1,071 1,053 Indonesia 8,776 9,384 10,460 11,750 11,400
Malaysia 3.06 3.09 3.15 3.33 3.40 Philippines 43.3 42.2 42.4 45.5 46.0 Singapore 1.26 1.25 1.25 1.28 1.31
Thailand 30.5 31.1 30.7 33.4 34.4 Vietnam 20,681 20,847 21,019 21,175 21,343 India (FY) 46.6 53.4 58.5 61.0 58.5
Australia 0.96 0.96 1.04 1.16 1.20 New Zealand 1.26 1.23 1.22 1.18 1.18 Sources: CEIC, central banks, and national statistics offices. Forecasts are by IMA Asia.
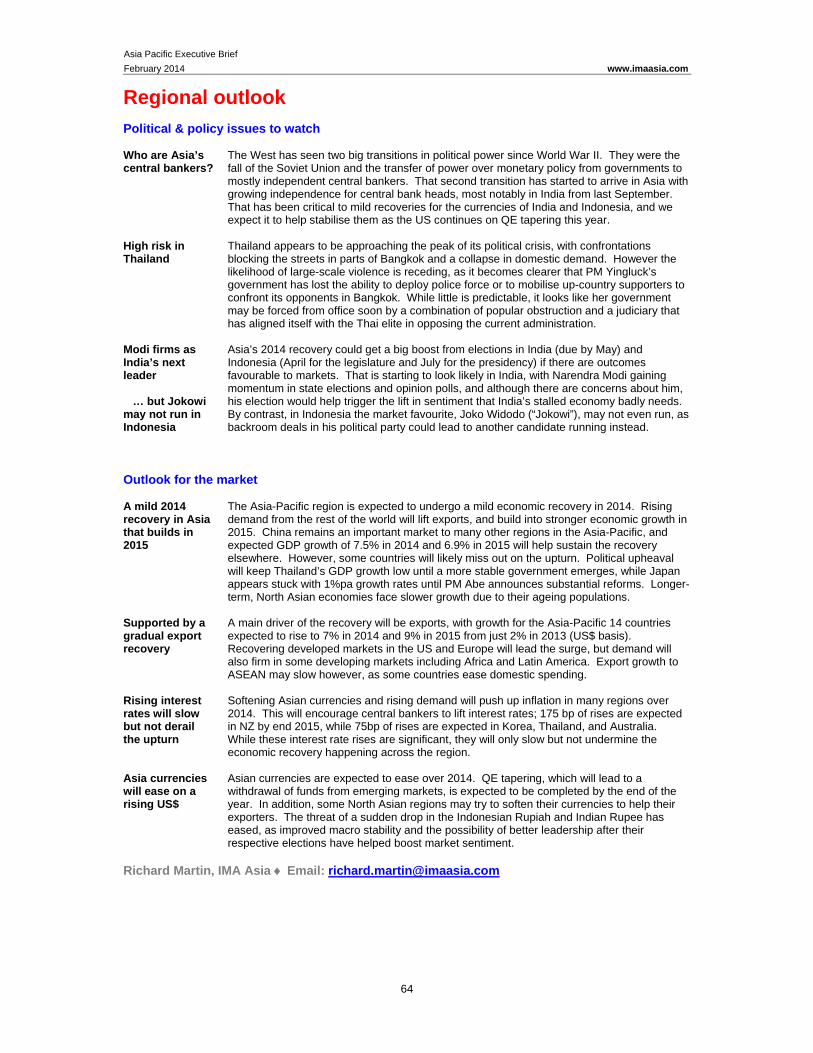
Asia Pacific Executive Brief
February 2014 www.imaasia.com
64
Regional outlook Political & policy issues to watch Who are Asia’s central bankers?
The West has seen two big transitions in political power since World War II. They were the fall of the Soviet Union and the transfer of power over monetary policy from governments to mostly independent central bankers. That second transition has started to arrive in Asia with growing independence for central bank heads, most notably in India from last September. That has been critical to mild recoveries for the currencies of India and Indonesia, and we expect it to help stabilise them as the US continues on QE tapering this year.
High risk in Thailand
Thailand appears to be approaching the peak of its political crisis, with confrontations blocking the streets in parts of Bangkok and a collapse in domestic demand. However the likelihood of large-scale violence is receding, as it becomes clearer that PM Yingluck’s government has lost the ability to deploy police force or to mobilise up-country supporters to confront its opponents in Bangkok. While little is predictable, it looks like her government may be forced from office soon by a combination of popular obstruction and a judiciary that has aligned itself with the Thai elite in opposing the current administration.
Modi firms as India’s next leader … but Jokowi may not run in Indonesia
Asia’s 2014 recovery could get a big boost from elections in India (due by May) and Indonesia (April for the legislature and July for the presidency) if there are outcomes favourable to markets. That is starting to look likely in India, with Narendra Modi gaining momentum in state elections and opinion polls, and although there are concerns about him, his election would help trigger the lift in sentiment that India’s stalled economy badly needs. By contrast, in Indonesia the market favourite, Joko Widodo (“Jokowi”), may not even run, as backroom deals in his political party could lead to another candidate running instead.
Outlook for the market A mild 2014 recovery in Asia that builds in 2015
The Asia-Pacific region is expected to undergo a mild economic recovery in 2014. Rising demand from the rest of the world will lift exports, and build into stronger economic growth in 2015. China remains an important market to many other regions in the Asia-Pacific, and expected GDP growth of 7.5% in 2014 and 6.9% in 2015 will help sustain the recovery elsewhere. However, some countries will likely miss out on the upturn. Political upheaval will keep Thailand’s GDP growth low until a more stable government emerges, while Japan appears stuck with 1%pa growth rates until PM Abe announces substantial reforms. Longer-term, North Asian economies face slower growth due to their ageing populations.
Supported by a gradual export recovery
A main driver of the recovery will be exports, with growth for the Asia-Pacific 14 countries expected to rise to 7% in 2014 and 9% in 2015 from just 2% in 2013 (US$ basis). Recovering developed markets in the US and Europe will lead the surge, but demand will also firm in some developing markets including Africa and Latin America. Export growth to ASEAN may slow however, as some countries ease domestic spending.
Rising interest rates will slow but not derail the upturn
Softening Asian currencies and rising demand will push up inflation in many regions over 2014. This will encourage central bankers to lift interest rates; 175 bp of rises are expected in NZ by end 2015, while 75bp of rises are expected in Korea, Thailand, and Australia. While these interest rate rises are significant, they will only slow but not undermine the economic recovery happening across the region.
Asia currencies will ease on a rising US$
Asian currencies are expected to ease over 2014. QE tapering, which will lead to a withdrawal of funds from emerging markets, is expected to be completed by the end of the year. In addition, some North Asian regions may try to soften their currencies to help their exporters. The threat of a sudden drop in the Indonesian Rupiah and Indian Rupee has eased, as improved macro stability and the possibility of better leadership after their respective elections have helped boost market sentiment.
Richard Martin, IMA Asia Email: [email protected]
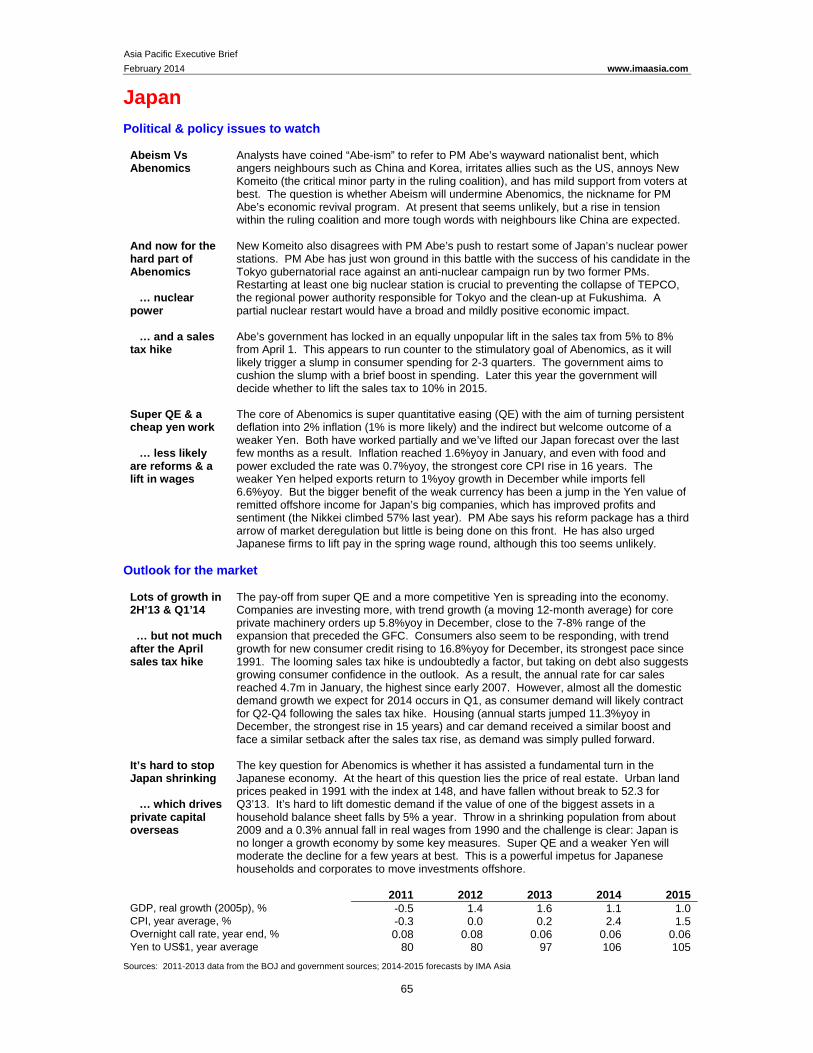
Asia Pacific Executive Brief
February 2014 www.imaasia.com
65
Japan Political & policy issues to watch
Abeism Vs Abenomics
Analysts have coined “Abe-ism” to refer to PM Abe’s wayward nationalist bent, which angers neighbours such as China and Korea, irritates allies such as the US, annoys New Komeito (the critical minor party in the ruling coalition), and has mild support from voters at best. The question is whether Abeism will undermine Abenomics, the nickname for PM Abe’s economic revival program. At present that seems unlikely, but a rise in tension within the ruling coalition and more tough words with neighbours like China are expected.
And now for the hard part of Abenomics … nuclear power
New Komeito also disagrees with PM Abe’s push to restart some of Japan’s nuclear power stations. PM Abe has just won ground in this battle with the success of his candidate in the Tokyo gubernatorial race against an anti-nuclear campaign run by two former PMs. Restarting at least one big nuclear station is crucial to preventing the collapse of TEPCO, the regional power authority responsible for Tokyo and the clean-up at Fukushima. A partial nuclear restart would have a broad and mildly positive economic impact.
… and a sales tax hike
Abe’s government has locked in an equally unpopular lift in the sales tax from 5% to 8% from April 1. This appears to run counter to the stimulatory goal of Abenomics, as it will likely trigger a slump in consumer spending for 2-3 quarters. The government aims to cushion the slump with a brief boost in spending. Later this year the government will decide whether to lift the sales tax to 10% in 2015.
Super QE & a cheap yen work … less likely are reforms & a lift in wages
The core of Abenomics is super quantitative easing (QE) with the aim of turning persistent deflation into 2% inflation (1% is more likely) and the indirect but welcome outcome of a weaker Yen. Both have worked partially and we’ve lifted our Japan forecast over the last few months as a result. Inflation reached 1.6%yoy in January, and even with food and power excluded the rate was 0.7%yoy, the strongest core CPI rise in 16 years. The weaker Yen helped exports return to 1%yoy growth in December while imports fell 6.6%yoy. But the bigger benefit of the weak currency has been a jump in the Yen value of remitted offshore income for Japan’s big companies, which has improved profits and sentiment (the Nikkei climbed 57% last year). PM Abe says his reform package has a third arrow of market deregulation but little is being done on this front. He has also urged Japanese firms to lift pay in the spring wage round, although this too seems unlikely.
Outlook for the market
Lots of growth in 2H’13 & Q1’14 … but not much after the April sales tax hike
The pay-off from super QE and a more competitive Yen is spreading into the economy. Companies are investing more, with trend growth (a moving 12-month average) for core private machinery orders up 5.8%yoy in December, close to the 7-8% range of the expansion that preceded the GFC. Consumers also seem to be responding, with trend growth for new consumer credit rising to 16.8%yoy for December, its strongest pace since 1991. The looming sales tax hike is undoubtedly a factor, but taking on debt also suggests growing consumer confidence in the outlook. As a result, the annual rate for car sales reached 4.7m in January, the highest since early 2007. However, almost all the domestic demand growth we expect for 2014 occurs in Q1, as consumer demand will likely contract for Q2-Q4 following the sales tax hike. Housing (annual starts jumped 11.3%yoy in December, the strongest rise in 15 years) and car demand received a similar boost and face a similar setback after the sales tax rise, as demand was simply pulled forward.
It’s hard to stop Japan shrinking … which drives private capital overseas
The key question for Abenomics is whether it has assisted a fundamental turn in the Japanese economy. At the heart of this question lies the price of real estate. Urban land prices peaked in 1991 with the index at 148, and have fallen without break to 52.3 for Q3’13. It’s hard to lift domestic demand if the value of one of the biggest assets in a household balance sheet falls by 5% a year. Throw in a shrinking population from about 2009 and a 0.3% annual fall in real wages from 1990 and the challenge is clear: Japan is no longer a growth economy by some key measures. Super QE and a weaker Yen will moderate the decline for a few years at best. This is a powerful impetus for Japanese households and corporates to move investments offshore.
2011 2012 2013 2014 2015 GDP, real growth (2005p), % -0.5 1.4 1.6 1.1 1.0 CPI, year average, % -0.3 0.0 0.2 2.4 1.5 Overnight call rate, year end, % 0.08 0.08 0.06 0.06 0.06 Yen to US$1, year average 80 80 97 106 105
Sources: 2011-2013 data from the BOJ and government sources; 2014-2015 forecasts by IMA Asia
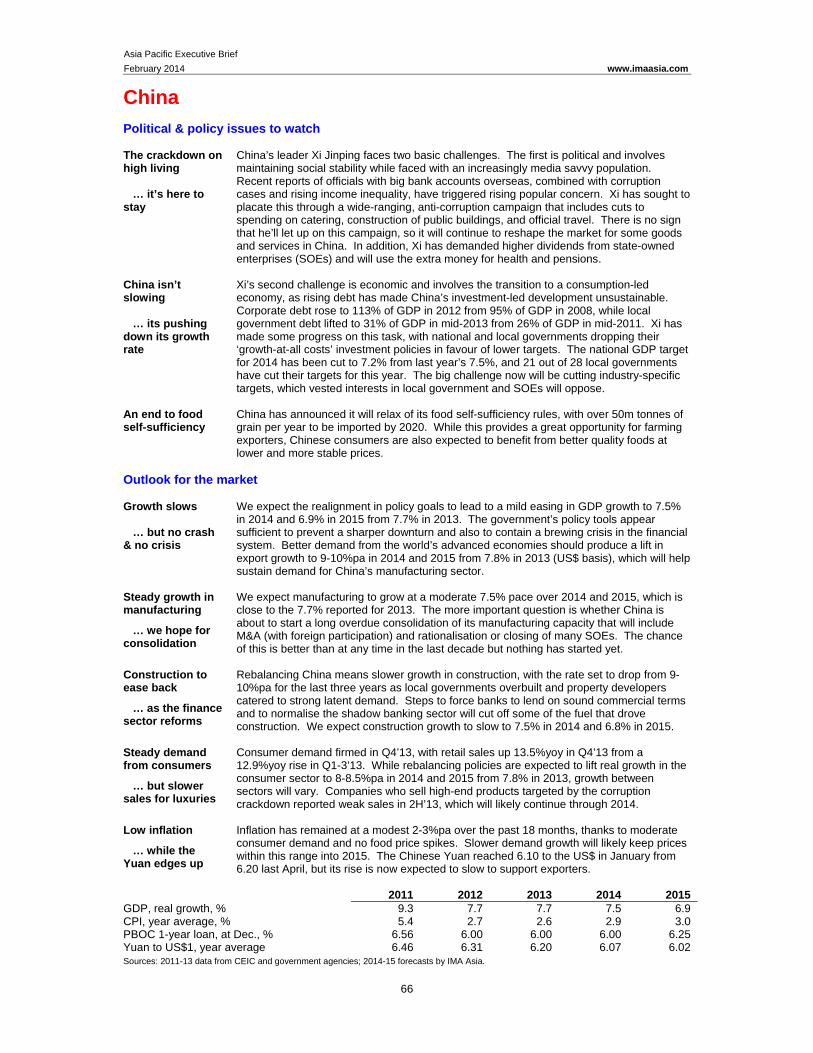
Asia Pacific Executive Brief
February 2014 www.imaasia.com
66
China Political & policy issues to watch The crackdown on high living … it’s here to stay
China’s leader Xi Jinping faces two basic challenges. The first is political and involves maintaining social stability while faced with an increasingly media savvy population. Recent reports of officials with big bank accounts overseas, combined with corruption cases and rising income inequality, have triggered rising popular concern. Xi has sought to placate this through a wide-ranging, anti-corruption campaign that includes cuts to spending on catering, construction of public buildings, and official travel. There is no sign that he’ll let up on this campaign, so it will continue to reshape the market for some goods and services in China. In addition, Xi has demanded higher dividends from state-owned enterprises (SOEs) and will use the extra money for health and pensions.
China isn’t slowing … its pushing down its growth rate
Xi’s second challenge is economic and involves the transition to a consumption-led economy, as rising debt has made China’s investment-led development unsustainable. Corporate debt rose to 113% of GDP in 2012 from 95% of GDP in 2008, while local government debt lifted to 31% of GDP in mid-2013 from 26% of GDP in mid-2011. Xi has made some progress on this task, with national and local governments dropping their ‘growth-at-all costs’ investment policies in favour of lower targets. The national GDP target for 2014 has been cut to 7.2% from last year’s 7.5%, and 21 out of 28 local governments have cut their targets for this year. The big challenge now will be cutting industry-specific targets, which vested interests in local government and SOEs will oppose.
An end to food self-sufficiency
China has announced it will relax of its food self-sufficiency rules, with over 50m tonnes of grain per year to be imported by 2020. While this provides a great opportunity for farming exporters, Chinese consumers are also expected to benefit from better quality foods at lower and more stable prices.
Outlook for the market Growth slows … but no crash & no crisis
We expect the realignment in policy goals to lead to a mild easing in GDP growth to 7.5% in 2014 and 6.9% in 2015 from 7.7% in 2013. The government’s policy tools appear sufficient to prevent a sharper downturn and also to contain a brewing crisis in the financial system. Better demand from the world’s advanced economies should produce a lift in export growth to 9-10%pa in 2014 and 2015 from 7.8% in 2013 (US$ basis), which will help sustain demand for China’s manufacturing sector.
Steady growth in manufacturing
… we hope for consolidation
We expect manufacturing to grow at a moderate 7.5% pace over 2014 and 2015, which is close to the 7.7% reported for 2013. The more important question is whether China is about to start a long overdue consolidation of its manufacturing capacity that will include M&A (with foreign participation) and rationalisation or closing of many SOEs. The chance of this is better than at any time in the last decade but nothing has started yet.
Construction to ease back
… as the finance sector reforms
Rebalancing China means slower growth in construction, with the rate set to drop from 9-10%pa for the last three years as local governments overbuilt and property developers catered to strong latent demand. Steps to force banks to lend on sound commercial terms and to normalise the shadow banking sector will cut off some of the fuel that drove construction. We expect construction growth to slow to 7.5% in 2014 and 6.8% in 2015.
Steady demand from consumers
… but slower sales for luxuries
Consumer demand firmed in Q4’13, with retail sales up 13.5%yoy in Q4’13 from a 12.9%yoy rise in Q1-3’13. While rebalancing policies are expected to lift real growth in the consumer sector to 8-8.5%pa in 2014 and 2015 from 7.8% in 2013, growth between sectors will vary. Companies who sell high-end products targeted by the corruption crackdown reported weak sales in 2H’13, which will likely continue through 2014.
Low inflation
… while the Yuan edges up
Inflation has remained at a modest 2-3%pa over the past 18 months, thanks to moderate consumer demand and no food price spikes. Slower demand growth will likely keep prices within this range into 2015. The Chinese Yuan reached 6.10 to the US$ in January from 6.20 last April, but its rise is now expected to slow to support exporters.
2011 2012 2013 2014 2015 GDP, real growth, % 9.3 7.7 7.7 7.5 6.9 CPI, year average, % 5.4 2.7 2.6 2.9 3.0 PBOC 1-year loan, at Dec., % 6.56 6.00 6.00 6.00 6.25 Yuan to US$1, year average 6.46 6.31 6.20 6.07 6.02 Sources: 2011-13 data from CEIC and government agencies; 2014-15 forecasts by IMA Asia.
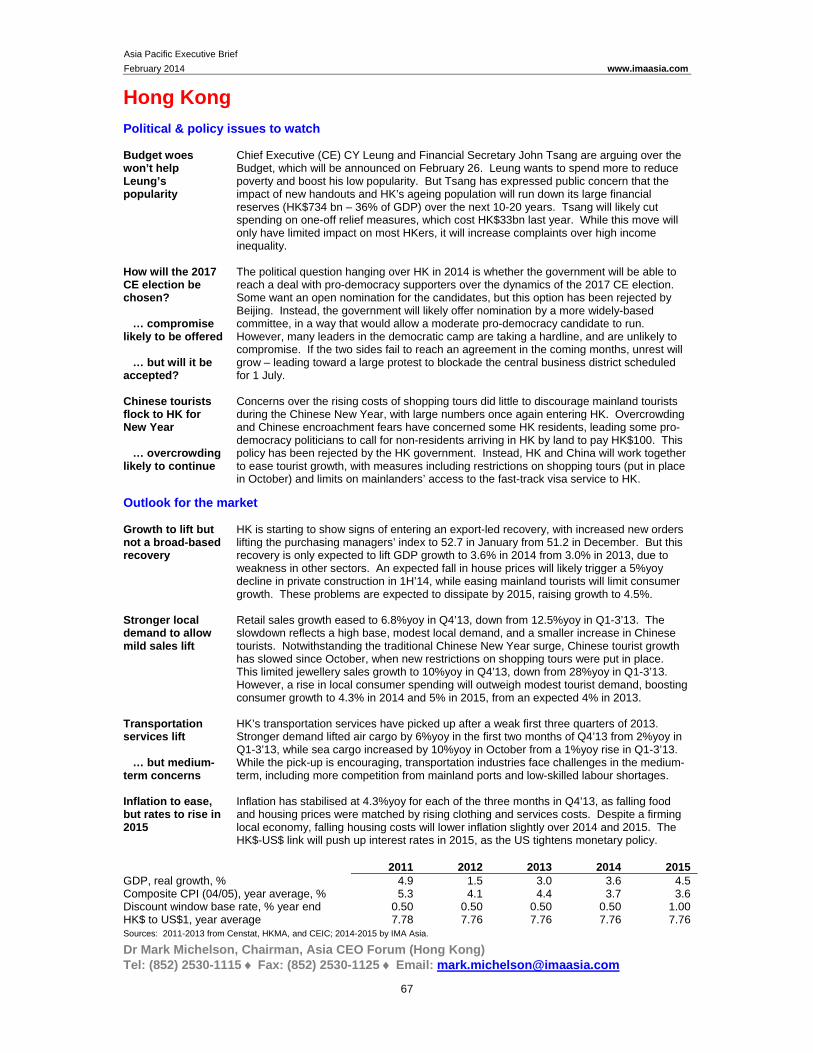
Asia Pacific Executive Brief
February 2014 www.imaasia.com
67
Hong Kong Political & policy issues to watch Budget woes won’t help Leung’s popularity
Chief Executive (CE) CY Leung and Financial Secretary John Tsang are arguing over the Budget, which will be announced on February 26. Leung wants to spend more to reduce poverty and boost his low popularity. But Tsang has expressed public concern that the impact of new handouts and HK’s ageing population will run down its large financial reserves (HK$734 bn – 36% of GDP) over the next 10-20 years. Tsang will likely cut spending on one-off relief measures, which cost HK$33bn last year. While this move will only have limited impact on most HKers, it will increase complaints over high income inequality.
How will the 2017 CE election be chosen? … compromise likely to be offered … but will it be accepted?
The political question hanging over HK in 2014 is whether the government will be able to reach a deal with pro-democracy supporters over the dynamics of the 2017 CE election. Some want an open nomination for the candidates, but this option has been rejected by Beijing. Instead, the government will likely offer nomination by a more widely-based committee, in a way that would allow a moderate pro-democracy candidate to run. However, many leaders in the democratic camp are taking a hardline, and are unlikely to compromise. If the two sides fail to reach an agreement in the coming months, unrest will grow – leading toward a large protest to blockade the central business district scheduled for 1 July.
Chinese tourists flock to HK for New Year … overcrowding likely to continue
Concerns over the rising costs of shopping tours did little to discourage mainland tourists during the Chinese New Year, with large numbers once again entering HK. Overcrowding and Chinese encroachment fears have concerned some HK residents, leading some pro-democracy politicians to call for non-residents arriving in HK by land to pay HK$100. This policy has been rejected by the HK government. Instead, HK and China will work together to ease tourist growth, with measures including restrictions on shopping tours (put in place in October) and limits on mainlanders’ access to the fast-track visa service to HK.
Outlook for the market Growth to lift but not a broad-based recovery
HK is starting to show signs of entering an export-led recovery, with increased new orders lifting the purchasing managers’ index to 52.7 in January from 51.2 in December. But this recovery is only expected to lift GDP growth to 3.6% in 2014 from 3.0% in 2013, due to weakness in other sectors. An expected fall in house prices will likely trigger a 5%yoy decline in private construction in 1H’14, while easing mainland tourists will limit consumer growth. These problems are expected to dissipate by 2015, raising growth to 4.5%.
Stronger local demand to allow mild sales lift
Retail sales growth eased to 6.8%yoy in Q4’13, down from 12.5%yoy in Q1-3’13. The slowdown reflects a high base, modest local demand, and a smaller increase in Chinese tourists. Notwithstanding the traditional Chinese New Year surge, Chinese tourist growth has slowed since October, when new restrictions on shopping tours were put in place. This limited jewellery sales growth to 10%yoy in Q4’13, down from 28%yoy in Q1-3’13. However, a rise in local consumer spending will outweigh modest tourist demand, boosting consumer growth to 4.3% in 2014 and 5% in 2015, from an expected 4% in 2013.
Transportation services lift … but medium-term concerns
HK’s transportation services have picked up after a weak first three quarters of 2013. Stronger demand lifted air cargo by 6%yoy in the first two months of Q4’13 from 2%yoy in Q1-3’13, while sea cargo increased by 10%yoy in October from a 1%yoy rise in Q1-3’13. While the pick-up is encouraging, transportation industries face challenges in the medium-term, including more competition from mainland ports and low-skilled labour shortages.
Inflation to ease, but rates to rise in 2015
Inflation has stabilised at 4.3%yoy for each of the three months in Q4’13, as falling food and housing prices were matched by rising clothing and services costs. Despite a firming local economy, falling housing costs will lower inflation slightly over 2014 and 2015. The HK$-US$ link will push up interest rates in 2015, as the US tightens monetary policy.
2011 2012 2013 2014 2015GDP, real growth, % 4.9 1.5 3.0 3.6 4.5 Composite CPI (04/05), year average, % 5.3 4.1 4.4 3.7 3.6 Discount window base rate, % year end 0.50 0.50 0.50 0.50 1.00 HK$ to US$1, year average 7.78 7.76 7.76 7.76 7.76 Sources: 2011-2013 from Censtat, HKMA, and CEIC; 2014-2015 by IMA Asia.
Dr Mark Michelson, Chairman, Asia CEO Forum (Hong Kong) Tel: (852) 2530-1115 Fax: (852) 2530-1125 Email: [email protected]

Asia Pacific Executive Brief
February 2014 www.imaasia.com
68
Taiwan
Political & policy issues to watch A good start to 2014 for President Ma … but legislation is still held up
President Ma Ying-Jeou and his KMT party have had a good start to 2014, after infighting damaged their popularity last year. The KMT has focused on rebuilding unity, with only small changes during the annual cabinet reshuffle. In addition, they have fielded strong candidates for the five main mayoral elections due later this year. The blend of electable candidates and a divided opposition in the key race for Taipei City gives the KMT a chance of retaining, if not improving on, the three mayoral seats it currently holds. But problems remain: the opposition DPP’s obstruction in the Legislative Yuan (LY) continues to stall policymaking, preventing the passage of bills on the China services pact and approval of the fourth nuclear plant. This is unlikely to change before the local elections.
Trying to push ahead on better ties with China
Mainland Affairs Council Minister Wang Yu-Chi went to China in mid-February for the first meeting in over 50 years between his agency and its mainland counterpart. While the press have focused on a possible Xi-Ma presidential meeting, the bigger story remains the success of better cross-strait economic ties in President Ma’s first term. But further progress in this area may be difficult without the LY’s ratification of the China services pact.
A slowdown in Chinese visitor arrivals … now it’s a critical issue
One of the benefits of better relations with China has been a surge in inbound tourism. Direct flights from major Chinese cities and increases in the China visitor quota have lifted the number of mainland tourists to 2.8 million in 2013 from basically zero in 2007. However, new Chinese government policies on tour groups slowed visitor growth to zero in Q4’13 from 15%yoy in Q1-3’13. Stronger growth in tourists from Japan (+13%yoy), Korea (+79%yoy), and the USA (+7%yoy) helped make up for the shortfall, but the big opportunity remains in mainland tourist arrivals and a revival will be critical for growth in 2014.
Outlook for the market Watch for a mild export lift to help GDP growth
Taiwan’s high trade dependency (exports are 75% of GDP) made the island vulnerable to the recent global slowdown. Weak global demand saw exports fall 3% in 2012 before a weak 1% rise in 2013 (US$ basis), which cut GDP growth to 1.5% and 2.2% respectively, about half the 4.5% average growth rate set over 2001-11. Better global demand should lift exports by 4% in 2014 and 6% in 2015, pushing GDP growth up to 3-3.5%.
… as more production moves offshore
Hints of better global demand emerged in Q4’13, with the HSBC purchasing managers’ index (PMI) rising to 53.9 from 50.2 in Q3’13. However, most new orders for Taiwan’s firms were filled by their overseas factories (mostly in China), with the overseas production ratio rising to 53.6% of all orders received from 51.4%.
A mild upturn for consumers
The consumer sector appears to be entering a mild recovery. Wages rose 3.6%yoy in the first two months of Q4’13, up from a 0.2%yoy fall in Q1-3’13. This boosted sentiment, increasing retail trade by 3.0%yoy in Q4’13 from 0.4%yoy in Q1-3’13, and catering services by 1.5%yoy in Q4’13 from 0.5%yoy. While a consumer upturn will likely continue in 2014 and 2015, weak population growth will limit the rise to 2.5%pa from 1.5% in 2013.
A weak 2013 lift in construction may stall
US quantitative easing (QE) lifted Taiwan’s asset markets in 2013, with the stock market rising by 12% and property prices by 15% (the surge in Chinese tourists was also a big plus for local property markets). This flowed into a mild 1% rise in construction in 2013, reversing a 2% decline in 2012. With QE tapering underway in the US and Chinese inbound tourism slowing, the construction outlook is weaker for 2014.
Little inflation and a soft NT$
There’s little sign of inflation and we don’t expect an interest rate rise until 2015. That has contributed to a 3% fall for the NT$ on the US$ since November as the US Fed has started QE tapering. However, the downside for the NT$ is limited, with a weak lift likely in 2015.
2011 2012 2013 2014 2015GDP, real growth, % 4.2 1.5 2.2 3.0 3.5 CPI, year average, % 1.4 1.9 0.8 1.3 2.0 Official discount rate, year end, % 1.88 1.88 1.88 1.88 2.00 NT$ to US$1, year average 29.5 29.6 29.6 30.0 29.5
Sources: 2011-2013 government data and CEIC; 2014-2015 forecasts by IMA Asia. The above forecast is by IMA Asia. Companies seeking local advice and forecasts should contact:
Michael Boyden, Managing Director, Taiwan Asia Strategy Consulting Tel: (886 2) 8789 0978 Fax: (886 2) 8789 0877 Email: [email protected]
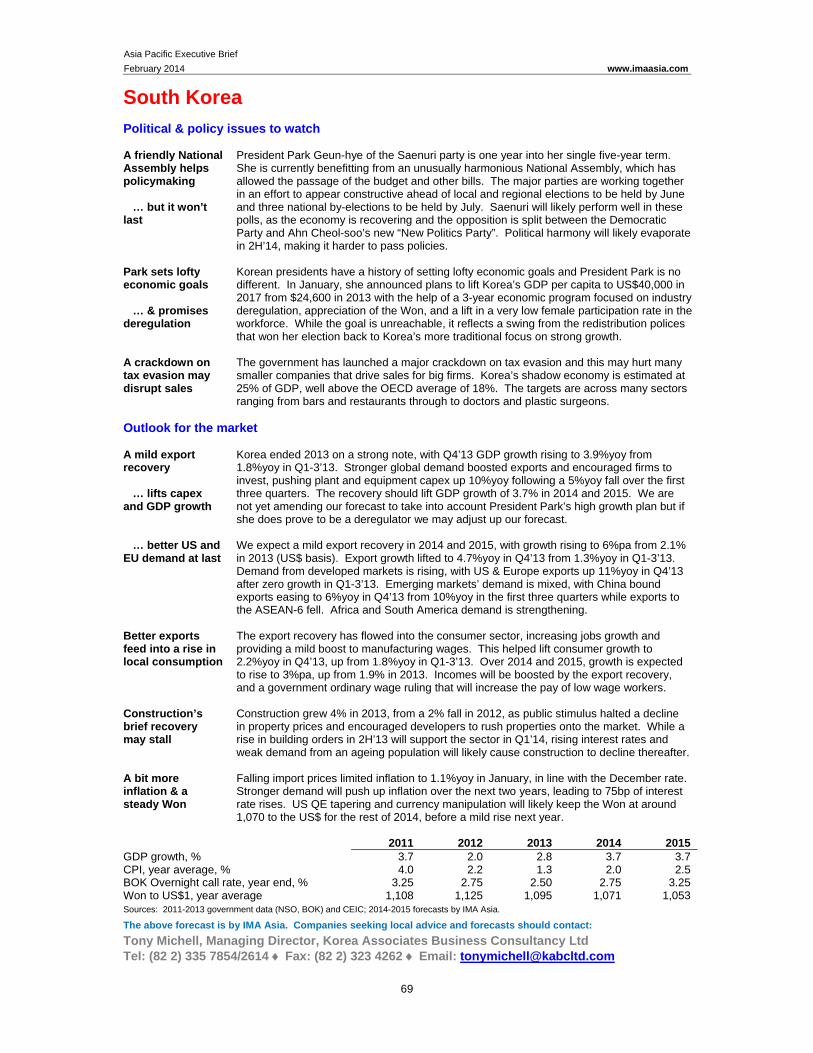
Asia Pacific Executive Brief
February 2014 www.imaasia.com
69
South Korea Political & policy issues to watch A friendly National Assembly helps policymaking … but it won’t last
President Park Geun-hye of the Saenuri party is one year into her single five-year term. She is currently benefitting from an unusually harmonious National Assembly, which has allowed the passage of the budget and other bills. The major parties are working together in an effort to appear constructive ahead of local and regional elections to be held by June and three national by-elections to be held by July. Saenuri will likely perform well in these polls, as the economy is recovering and the opposition is split between the Democratic Party and Ahn Cheol-soo’s new “New Politics Party”. Political harmony will likely evaporate in 2H’14, making it harder to pass policies.
Park sets lofty economic goals … & promises deregulation
Korean presidents have a history of setting lofty economic goals and President Park is no different. In January, she announced plans to lift Korea’s GDP per capita to US$40,000 in 2017 from $24,600 in 2013 with the help of a 3-year economic program focused on industry deregulation, appreciation of the Won, and a lift in a very low female participation rate in the workforce. While the goal is unreachable, it reflects a swing from the redistribution polices that won her election back to Korea’s more traditional focus on strong growth.
A crackdown on tax evasion may disrupt sales
The government has launched a major crackdown on tax evasion and this may hurt many smaller companies that drive sales for big firms. Korea’s shadow economy is estimated at 25% of GDP, well above the OECD average of 18%. The targets are across many sectors ranging from bars and restaurants through to doctors and plastic surgeons.
Outlook for the market A mild export recovery … lifts capex and GDP growth
Korea ended 2013 on a strong note, with Q4’13 GDP growth rising to 3.9%yoy from 1.8%yoy in Q1-3’13. Stronger global demand boosted exports and encouraged firms to invest, pushing plant and equipment capex up 10%yoy following a 5%yoy fall over the first three quarters. The recovery should lift GDP growth of 3.7% in 2014 and 2015. We are not yet amending our forecast to take into account President Park’s high growth plan but if she does prove to be a deregulator we may adjust up our forecast.
… better US and EU demand at last
We expect a mild export recovery in 2014 and 2015, with growth rising to 6%pa from 2.1% in 2013 (US$ basis). Export growth lifted to 4.7%yoy in Q4’13 from 1.3%yoy in Q1-3’13. Demand from developed markets is rising, with US & Europe exports up 11%yoy in Q4’13 after zero growth in Q1-3’13. Emerging markets’ demand is mixed, with China bound exports easing to 6%yoy in Q4’13 from 10%yoy in the first three quarters while exports to the ASEAN-6 fell. Africa and South America demand is strengthening.
Better exports feed into a rise in local consumption
The export recovery has flowed into the consumer sector, increasing jobs growth and providing a mild boost to manufacturing wages. This helped lift consumer growth to 2.2%yoy in Q4’13, up from 1.8%yoy in Q1-3’13. Over 2014 and 2015, growth is expected to rise to 3%pa, up from 1.9% in 2013. Incomes will be boosted by the export recovery, and a government ordinary wage ruling that will increase the pay of low wage workers.
Construction’s brief recovery may stall
Construction grew 4% in 2013, from a 2% fall in 2012, as public stimulus halted a decline in property prices and encouraged developers to rush properties onto the market. While a rise in building orders in 2H’13 will support the sector in Q1’14, rising interest rates and weak demand from an ageing population will likely cause construction to decline thereafter.
A bit more inflation & a steady Won
Falling import prices limited inflation to 1.1%yoy in January, in line with the December rate. Stronger demand will push up inflation over the next two years, leading to 75bp of interest rate rises. US QE tapering and currency manipulation will likely keep the Won at around 1,070 to the US$ for the rest of 2014, before a mild rise next year.
2011 2012 2013 2014 2015GDP growth, % 3.7 2.0 2.8 3.7 3.7 CPI, year average, % 4.0 2.2 1.3 2.0 2.5 BOK Overnight call rate, year end, % 3.25 2.75 2.50 2.75 3.25 Won to US$1, year average 1,108 1,125 1,095 1,071 1,053 Sources: 2011-2013 government data (NSO, BOK) and CEIC; 2014-2015 forecasts by IMA Asia. The above forecast is by IMA Asia. Companies seeking local advice and forecasts should contact:
Tony Michell, Managing Director, Korea Associates Business Consultancy Ltd Tel: (82 2) 335 7854/2614 Fax: (82 2) 323 4262 Email: [email protected]
Asia Pacific Executive Brief
February 2014 www.imaasia.com
70
Indonesia Political & policy issues to watch The 2014 race for the presidency … may depend on backroom deals … rather than popularity
Despite opinion polls making Jakarta Governor Joko Widodo (“Jokowi”) the dominant - although undeclared - candidate for the 2014 elections the outcome remains uncertain. Jokowi belongs to PDIP, yet party head Megawati Sukarnoputri shows little interest in nominating him. Instead, PDIP’s campaign is focusing on Mega and her daughter, Puan, suggesting that PDIP’s old guard wants to stick with the family of Indonesia’s first president (Sukarno, president 1945-67), his daughter (Mega, president 2001-04), and his granddaughter. PDIP may be the only party that wins at least 20% of parliament seats or 25% of popular votes in the April legislative poll, allowing it to independently nominate a candidate for the July presidential race. Even Golkar, a once dominant party, looks like it will need to form a coalition with one or more parties to cross that hurdle. Jakarta is, as a result, witnessing a frenzy of deal-making as contenders with weak popular support – such as Golkar’s Bakrie, Gita Wirjawan (who has just stepped down as industry minister so he can run), and Gerindra’s Prabowo – offer deals to other parties for their support. 2014 may see a presidential race in which such leading contenders as Jokowi and Prabowo are relegated to the vice-president slot or don’t even stand.
Which may lead to weak leadership
The confused presidential race suggests that the next administration will be based on a rainbow coalition, similar to the dysfunctional array that President Yudhoyono was forced to rely on during his two terms. Such governments can aspire to a veneer of political stability, but largely at the expense of administrative effectiveness. Moreover, they have little capacity to rein in surging economic nationalism in the legislature.
A swing to protectionism
Early February saw passage of a Trade Law to protect local industry by allowing the government to curb imports of finished goods and exports of raw materials. Together with a controversial mineral ore export ban and the state’s push into the resources ownership (the Inalum smelter acquisition and the prospect of Pertamina taking over Total’s Mahakam block) this hints at the kind of nationalism - populism mix that has damaged Argentina.
Outlook for the market Growth slowed in 2013 … with a mild lift in 2014 on local demand & exports
Indonesia reported 5.7%yoy growth in Q4’13, its third straight quarter of sub-6% growth after 10 quarters of 6-6.5%yoy growth. In line with the weaker GDP result, Q4 saw a swing back to a net trade surplus, as imports fell 6.9%yoy on weak local demand, while exports grew 3.4%yoy (US$ terms) after falling for six straight quarters. While industrial production weakened in Q4 (to just 0.1%yoy growth), we expect close to 6% growth this year and 6.5% in 2015 from 5.6% for full 2013. Exports and local consumption should be key drivers in 2014 and could lift GDP growth above our 6% forecast.
Election spending should help local demand … capex may edge up
The start of the election campaign on January 11 means thousands of candidates for the national and local legislatures have started spending to win votes. We expect this to lift real consumer growth from 5.3% last year to 5.5% this year with 5.7% in 2015. Fixed investment slowed to 4.7% growth in 2013 from 9.7% in 2012, but we expect a lift to 6.3% this year and 8-10% in 2015. Critical to this will be how industry responds to the mineral ore ban, which forces domestic processing, and the swing in legislation in favour of local production. We’ll also need to see if Taiwanese IT firm Foxconn follows through on its plans for US$1bn investment in electronics assembly, as it moves capacity out of China.
Inflation should ease from 8% … with a steadier Rupiah
January was the third straight month with inflation just above 8%yoy, but with 175 basis point lift in the central bank policy rate in 2013 and another 25bp lift likely soon, inflation should ease by Q2’14. The Rupiah has stabilised around Rp12,000 to US$1, backed by positive global investor sentiment (January saw net buying by overseas investors of US$200m+ after $2.1bn net selling in 2013). This should help large Indonesian corporates tap global funds at a reasonable price through 2014.
2011 2012 2013 2014 2015 GDP, real growth, % 6.5 6.3 5.8 6.0 6.5 CPI, year average, (2007=100), % 5.4 4.3 7.0 6.5 5.5 Central bank policy rate (O/N rate) at Dec % 6.00 5.75 7.50 7.50 6.75 Rupiah to US$1, year average 8,776 9,384 10,460 11,750 11,400 Sources: 2011-2013 government data (BPS, BI) and CEIC; 2014-2015 forecasts by IMA Asia
The above forecast is by IMA Asia. Companies seeking local advice and forecasts should contact:
James Castle, Chairman, CastleAsia Tel: (62 21) 2902 1641 Fax: (62 21) 2902 1648 Email: [email protected]
Asia Pacific Executive Brief
February 2014 www.imaasia.com
71
Malaysia Political & policy issues to watch A tough year ahead for PM Razak … facing internal party challenges … & sliding popularity
PM Najib Razak is under attack from the Malay nationalist wing (led by ex-PM Mahathir) of his UMNO party, and is increasingly unpopular with the public due to rising prices after cuts to fuel and food subsidies, alongside growing racial and religious tension. The rise in tension is mostly due to government’s own efforts to appease Malay hardliners in UMNO and win back the support of urban, middle class Malays who voted for the opposition in the 2013 election. Abandoned by the Chinese ethnic minority (about a quarter of the population) and many urban Malays, the UNMO-led coalition lost the popular vote in 2013, but secured government thanks to a favourable gerrymandering of seats. PM Najib’s hold on power is good for the moment, but we should watch for the rise of a rival in UMNO backed by Mahathir. Given that UMNO has been in power since the first election in 1959, we don’t expect it to be toppled by the opposition in its new 5-year term.
Opening the car market to foreign manufacturers
Malaysia has decided to relax restrictions on foreign automakers, after three decades of trying to develop a competitive national car industry behind high tariff walls. From January 2014, foreign firms will be allowed to produce energy-efficient cars with engines of 1.8 litres or less, without the need for domestic investment partners, and will qualify for incentives such as tax breaks. Malaysia’s auto sector has lagged those of neighbouring Thailand and Indonesia, both of which have bigger markets and more favourable policies. In 2012, Malaysia produced 570,000 cars, compared to Thailand’s 2.4m and Indonesia’s 1.1m. Despite the policy shift, Malaysia is likely to remain a distant third in ASEAN auto production, with continued questions over the viability of local production.
Outlook for the market Mild growth continues … as exports rise and local demand cools
GDP rose 5.1%yoy in Q4’13, roughly in line with Q3’13, and faster than the 4.3%yoy increase of 1H’13. Local demand growth eased to 6.4%yoy from 8.3%yoy in Q3’13, reflecting slower growth in consumption (both private and government) and fixed investment. The latter slowed to 5.8%yoy from 9.2%yoy in Q1-Q3’13, as capex spending on construction and on equipment eased. Net exports were more supportive, falling 11.2%yoy compared to a massive 39%yoy decline in 1H’13. External demand is set to become a more important growth driver in 2014, as the pace of domestic spending slows due to budget constraints facing households and the government. Within local demand fixed investment is likely to be prominent, as the government pushes forward with a big program of major projects (worth US$444bn to 2020). Together with a mild export recovery, this should lift GDP growth from 4.7% in 2013 to 5.0% in 2014 and 5.6% in 2015.
… which helps lower macro risks
Malaysian exports have started responding to the pickup of global demand, with a 5.0%yoy increase in Q4’13, following a 1.3%yoy decline in Q1-Q3’13. Import growth also quickened to 6.4%yoy from 4.3%yoy. The overall current account surplus rose to 6.1% of GDP from a recent low of 2.9% in Q1-Q3’13, lowering the risk of an external deficit emerging alongside the government’s chronic budget deficit. The upswing in export demand is timely, as Malaysia’s highly geared households have started to cut their spending in response to rising cost of living. The darkening household mood was reflected in the MIER index of consumer sentiment, which hit a 5-year low in Q4’13.
More inflation … watch the April 2015 GST … & a soft M$
Inflation accelerated to 3.2%yoy in December from 1.3%yoy a year earlier on the back of higher electricity tariffs, and reduced food and fuel subsidies. The central bank will tolerate higher inflation, as long as it reflects one-off factors, such as subsidy cuts and the introduction of a 6% goods & services tax in April 2015. If inflation stayed high the central bank would certainly lift its policy rate, but that isn’t certain yet. A weak M$ - down 11% on the US$ since May 2013 - has added to inflationary pressures, but the currency appears to be stabilising although it will remain soft into 2015.
2011 2012 2013 2014 2015GDP, real growth, % 5.1 5.6 4.7 5.0 5.6 CPI, year average (2010=100), % 3.2 1.6 2.1 3.5 4.8 Central bank overnight policy rate, Dec, % 3.00 3.00 3.00 3.25 3.50 Ringgit to US$1, year average 3.06 3.09 3.15 3.33 3.40
Sources: 2011-2013 government, Bank Negara, & CEIC; 2014-2015 forecasts by IMA Asia.
The above forecast is by IMA Asia. Companies seeking local advice and forecasts should contact:
Datuk Paddy Bowie, Managing Director, Paddy Schubert Sdn. Bhd. Tel: (60 3) 2078 4031 Fax: (60 3) 2078 7034 Email: [email protected]
Asia Pacific Executive Brief
February 2014 www.imaasia.com
72
Philippines
Political & policy issues to watch No more reform under Pres. Aquino … wait until the next president in 2H’16
With two and a half years remaining in his single 6-year term, President Aquino’s reform momentum has slowed considerably. In part, he has been side-tracked by the “pork-barrel” funding scandal, involving high-profile senators from the opposition and some of his own allies. Aquino will likely focus on consolidating his existing reforms (in the judiciary, anti-corruption, fiscal sustainability, and the Mindanao peace agreement), rather than embarking on new ones. A lot more needs to be done to make the country attractive to foreign and local investors, but this may have to wait for the next administration, which takes over in mid-2016.
Government and the courts hinder investment … yes, PPP stands for Power Point Projects
Red tape and erratic policy decisions continue to undermine the investment climate. Recent examples include a court decision that FedEx’s operating permit is unconstitutional, a Supreme Court decision to prohibit Manila Electric from raising tariffs, and the government ordering Manila Water to lower rates after a planned increase. Chaotic mining regulations have stalled mining investment, while a US$9bn public-private partnership (PPP) program that the Aquino administration rolled out in 2010 (aiming to improve the country’s infrastructure) has been moving at a painfully slow pace. Only one of the 51 PPP projects is nearing completion (the construction of 9,300 classrooms in Luzon). Projects have been delayed by wrangling over terms and inadequate risk-reward ratios for investors. The authorities aim to finalise bidding for two PPP projects by April 2014, the US$1.3bn LRT-1 extension, and the US$790m Cative-Laguna Expressway.
Two good engines drive growth … BPO and OFWs
Two growth drivers have been unaffected by official obstacles to investment: the business process outsourcing (BPO) industry, and the inflow of remittances from 9.5m overseas Filipino workers (OFWs, 10% of the country’s population). In the year to September 2013, BPO exports grew to a record US$12bn (4.5% of GDP) from $1.8bn (1.3% of GDP) in the year to September 2007. The industry is expected to generate about 124,000 new well-paid jobs annually over 2014-16. OFW remittances, which account for 8.5% of GDP, grew by 7.9%yoy in Q4’13, up from 5.8%yoy in Q1-Q3’13, as OFWs sent more money home after the typhoon Haiyan disaster last November.
Outlook for the market Growing at capacity … with a mild slow down ahead
The super typhoon Haiyan failed to make a major dent on GDP, which rose by a better-than-expected 6.5%yoy in Q4’13, compared to 6.9%yoy in Q3’13 and 7.7%yoy in 1H’13. The pace of domestic activity eased to 5.1%yoy from 7.2%yoy in Q3’13, with slower private consumption and fixed investment (5.6%yoy and 7.0%yoy respectively), plus a 5.2%yoy decline in government consumption. The fast-rising supply of residential units in Metro-Manila has put a break on construction activity, which fell 0.8%yoy in Q4’13, after rising 17%yoy in Q1-Q3’13, and 15.7% in full 2012. Lower domestic spending was partly countered by faster inventory accumulation and a strong lift in external demand, as export growth overtook that of imports (6.4%yoy versus 1.9%yoy) for the first time since Q4’12. We expect a combination of slower domestic and faster external demand to result in GDP growth of 6.5% in 2014 and 5.5% in 2015 from an unusually strong 7.2% in 2013.
Rising inflation and interest rates, with a soft Peso
The CPI accelerated to 4.2%yoy in January from a recent low of 2.1%yoy in August 2013, with the core-CPI up 3.2%yoy from 1.9%yoy. With the economy operating close to capacity, and the Peso losing 9% against the US$ since March 2013, inflationary pressures are on rise. We expect the central bank to lift its policy interest rate from the current record low of 3.5% to 4.5% by end-2015. Tighter monetary policy could ease the Peso’s decline, but global fund flows driven by the timing and intensity of US QE tapering will have a greater influence on the Peso’s direction.
2011 2012 2013 2014 2015GDP growth, % 3.6 6.8 7.2 6.5 5.5 CPI, annual average, % 4.6 3.2 3.0 4.1 4.7 Central bank reverse rep. rate, year end 4.50 3.50 3.50 4.00 4.50 Peso to US$1, annual average 43.3 42.2 42.4 45.5 46.0
Sources: 2011-2013 BSP data and CEIC; 2014-2015 forecasts by IMA Asia.
The above forecast is by IMA Asia. Companies seeking local advice and forecasts should contact:
Peter Wallace, Managing Director, The Wallace Business Forum Tel: (63 2) 810 9606 Fax 810 9610 Email: [email protected]
Asia Pacific Executive Brief
February 2014 www.imaasia.com
73
Singapore Political & policy issues to watch The government’s deal with voters … don’t sink home prices
Singapore’s government has started easing curbs on residential property prices, which had been phased in from 2009, as the housing market has turned down. More tweaking of these measures is likely as prices ease and the 2016 elections approach. Some 90% of households own their home, which means that the government will be keen to engineer a soft landing for house prices. They’ll have to take into account a jump in household debt (to 77% of GDP in 2013 from 64% in 2007), a likely rise in interest rates by 2015, and the prospect of some 66,000 new private residential units entering the market in the next three years.
Unhappy workers … sensing changes that won’t help them
A survey by recruiting firm Randstad found that Singapore workers are Asia’s least satisfied, despite living in an affluent city with world-class amenities, and virtual full employment (the resident unemployment rate was 2.7% in Q4’13). Anxiety about an impending housing downturn, high inward immigration, and the rising cost of living appear to have affected workers’ sentiment. Their downbeat mood was partly reflected in (ex-car) retail sales growth slipping to zero in Q4’13 from a 9.6%yoy peak in Q2’11. Retail sales also suffered from a 2.2%yoy decline of tourist arrivals in Q4’13, following nearly uninterrupted double digit growth since 2010.
The hiring market becomes more complicated … with pay for new local hires rising
Popular dissatisfaction with high inward migration has seen the government trim back on favourable rules for bringing foreign labour into Singapore, with areas like construction being especially targeted. All companies will also have to contend with the government’s new Fair Consideration Framework, which comes into effect on August 1. It requires all firms with 25 or more employees who are hiring for positions paying up to S$12,000 a month to post the job on a government web site for 14 days (they can continue their search by other channels as well). Although this doesn’t sound too onerous, there is uncertainty about how it will operate, and firms have reported a lift in pay demands from well-qualified Singaporean candidates as the August start date approaches.
Outlook for the market Exports will lift growth … but local demand growth will be mild
GDP rose 5.5%yoy in Q4’13 from 3.6%yoy in Q1-Q3’13, despite a noticeable slowdown of domestic spending to 0.4%yoy from 2.4%yoy. Top-line growth was boosted by a 37.8%yoy jump in net exports. Weak local demand kept real import growth at 2.5%yoy, while exports grew 6.1%yoy. A 13.9%yoy rise in government consumption did little to offset a slide to 1.9%yoy growth in private consumption and a 6.3%yoy fall in fixed investment. The boost from surging net exports highlights Singapore’s sensitivity to international trade. Falling housing prices and growing caution by over-geared households suggests modest growth in consumer spending in 2014-15. However, stronger export demand should help lift Singapore’s GDP growth to 4.5% in 2014 and 5.0% in 2015 from 4.1% in 2013.
A rebound for manufacturing … capped by labour shortages
Under normal circumstances, Singapore’s GDP would surge well above 5% on an upswing in global demand. However, some exporters may be unable to meet rising orders due to labour shortages arising from recent restrictions on inward immigration. This is forcing manufacturing firms to invest in labour-saving technologies or move to cheaper locations in SE Asia. Despite this, we expect manufacturing output to rebound to 5.5% in 2014 and 7.5% in 2015, from a weak 1.7% in 2013.
A mild rise for the S$ continues … aiming to limit inflation
Inflation eased to 1.5%yoy in December from 2.6%yoy in November, contributing to 2013 inflation of 2.4% from 4.6% in 2012 and 5.3% in 2011. The slower CPI has yet to persuade the MAS, Singapore’s central bank, to soften its moderately tight monetary policy, which involves placing the S$ on a mild upward slope against a basket of currencies. The central bank is concerned about the inflationary potential of a tight labour market, which will tighten further after recent immigration curbs. The S$ has risen against regional currencies since May 2013, staying in a narrow range of 1.2-1.3 on the rising greenback.
2011 2012 2013 2014 2015 GDP, real growth, % 6.0 1.9 4.1 4.5 5.0 CPI, year average, % 5.2 4.6 2.4 3.0 2.9 3 month interbank interest rate, Dec, % 0.38 0.38 0.40 0.55 1.00 S$ to US$1, year average 1.26 1.25 1.25 1.28 1.31 Sources: 2011-2013 government data and CEIC; forecasts for 2014-2015 by IMA Asia.
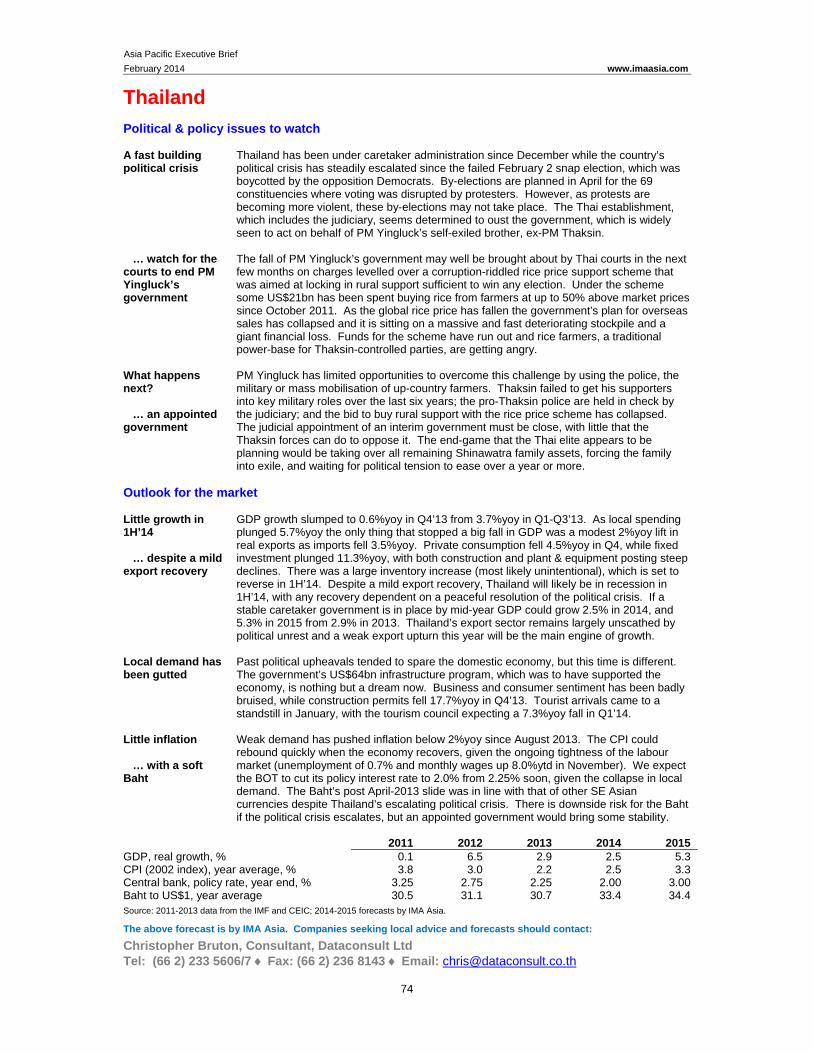
Asia Pacific Executive Brief
February 2014 www.imaasia.com
74
Thailand Political & policy issues to watch A fast building political crisis
Thailand has been under caretaker administration since December while the country’s political crisis has steadily escalated since the failed February 2 snap election, which was boycotted by the opposition Democrats. By-elections are planned in April for the 69 constituencies where voting was disrupted by protesters. However, as protests are becoming more violent, these by-elections may not take place. The Thai establishment, which includes the judiciary, seems determined to oust the government, which is widely seen to act on behalf of PM Yingluck’s self-exiled brother, ex-PM Thaksin.
… watch for the courts to end PM Yingluck’s government
The fall of PM Yingluck’s government may well be brought about by Thai courts in the next few months on charges levelled over a corruption-riddled rice price support scheme that was aimed at locking in rural support sufficient to win any election. Under the scheme some US$21bn has been spent buying rice from farmers at up to 50% above market prices since October 2011. As the global rice price has fallen the government’s plan for overseas sales has collapsed and it is sitting on a massive and fast deteriorating stockpile and a giant financial loss. Funds for the scheme have run out and rice farmers, a traditional power-base for Thaksin-controlled parties, are getting angry.
What happens next? … an appointed government
PM Yingluck has limited opportunities to overcome this challenge by using the police, the military or mass mobilisation of up-country farmers. Thaksin failed to get his supporters into key military roles over the last six years; the pro-Thaksin police are held in check by the judiciary; and the bid to buy rural support with the rice price scheme has collapsed. The judicial appointment of an interim government must be close, with little that the Thaksin forces can do to oppose it. The end-game that the Thai elite appears to be planning would be taking over all remaining Shinawatra family assets, forcing the family into exile, and waiting for political tension to ease over a year or more.
Outlook for the market Little growth in 1H’14 … despite a mild export recovery
GDP growth slumped to 0.6%yoy in Q4’13 from 3.7%yoy in Q1-Q3’13. As local spending plunged 5.7%yoy the only thing that stopped a big fall in GDP was a modest 2%yoy lift in real exports as imports fell 3.5%yoy. Private consumption fell 4.5%yoy in Q4, while fixed investment plunged 11.3%yoy, with both construction and plant & equipment posting steep declines. There was a large inventory increase (most likely unintentional), which is set to reverse in 1H’14. Despite a mild export recovery, Thailand will likely be in recession in 1H’14, with any recovery dependent on a peaceful resolution of the political crisis. If a stable caretaker government is in place by mid-year GDP could grow 2.5% in 2014, and 5.3% in 2015 from 2.9% in 2013. Thailand’s export sector remains largely unscathed by political unrest and a weak export upturn this year will be the main engine of growth.
Local demand has been gutted
Past political upheavals tended to spare the domestic economy, but this time is different. The government’s US$64bn infrastructure program, which was to have supported the economy, is nothing but a dream now. Business and consumer sentiment has been badly bruised, while construction permits fell 17.7%yoy in Q4’13. Tourist arrivals came to a standstill in January, with the tourism council expecting a 7.3%yoy fall in Q1’14.
Little inflation … with a soft Baht
Weak demand has pushed inflation below 2%yoy since August 2013. The CPI could rebound quickly when the economy recovers, given the ongoing tightness of the labour market (unemployment of 0.7% and monthly wages up 8.0%ytd in November). We expect the BOT to cut its policy interest rate to 2.0% from 2.25% soon, given the collapse in local demand. The Baht’s post April-2013 slide was in line with that of other SE Asian currencies despite Thailand’s escalating political crisis. There is downside risk for the Baht if the political crisis escalates, but an appointed government would bring some stability.
2011 2012 2013 2014 2015GDP, real growth, % 0.1 6.5 2.9 2.5 5.3 CPI (2002 index), year average, % 3.8 3.0 2.2 2.5 3.3 Central bank, policy rate, year end, % 3.25 2.75 2.25 2.00 3.00 Baht to US$1, year average 30.5 31.1 30.7 33.4 34.4 Source: 2011-2013 data from the IMF and CEIC; 2014-2015 forecasts by IMA Asia.
The above forecast is by IMA Asia. Companies seeking local advice and forecasts should contact:
Christopher Bruton, Consultant, Dataconsult Ltd Tel: (66 2) 233 5606/7 Fax: (66 2) 236 8143 Email: [email protected]
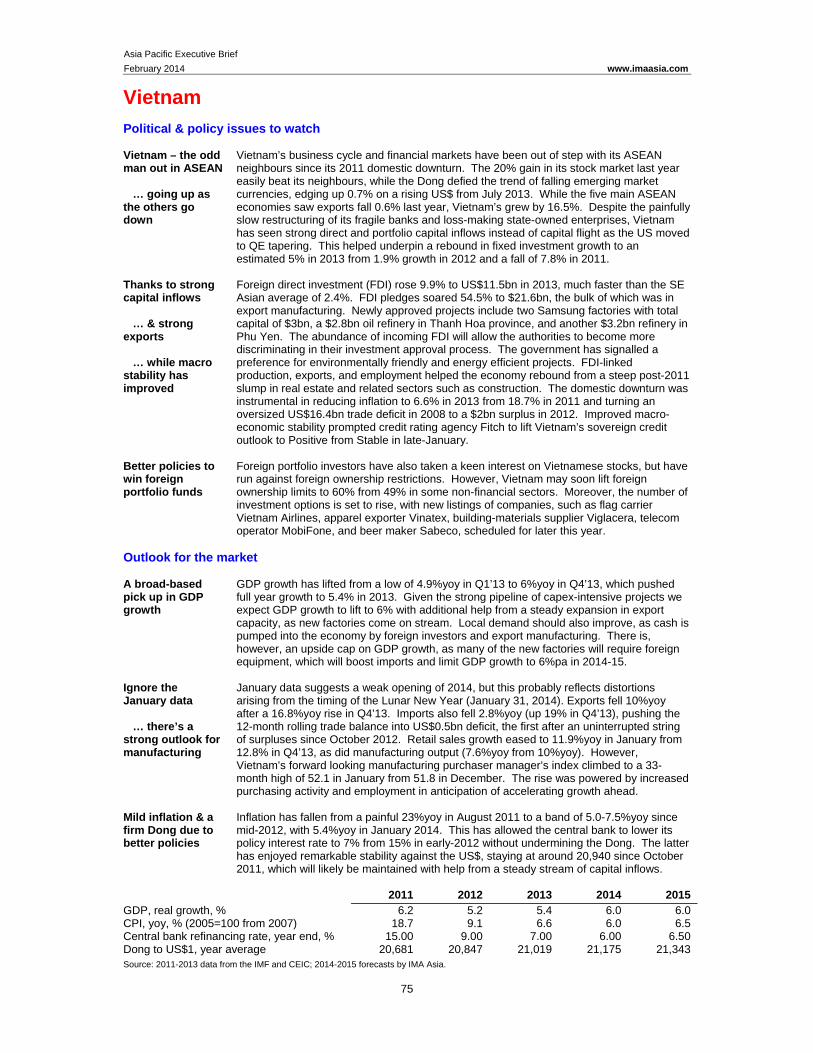
Asia Pacific Executive Brief
February 2014 www.imaasia.com
75
Vietnam Political & policy issues to watch Vietnam – the odd man out in ASEAN … going up as the others go down
Vietnam’s business cycle and financial markets have been out of step with its ASEAN neighbours since its 2011 domestic downturn. The 20% gain in its stock market last year easily beat its neighbours, while the Dong defied the trend of falling emerging market currencies, edging up 0.7% on a rising US$ from July 2013. While the five main ASEAN economies saw exports fall 0.6% last year, Vietnam’s grew by 16.5%. Despite the painfully slow restructuring of its fragile banks and loss-making state-owned enterprises, Vietnam has seen strong direct and portfolio capital inflows instead of capital flight as the US moved to QE tapering. This helped underpin a rebound in fixed investment growth to an estimated 5% in 2013 from 1.9% growth in 2012 and a fall of 7.8% in 2011.
Thanks to strong capital inflows … & strong exports … while macro stability has improved
Foreign direct investment (FDI) rose 9.9% to US$11.5bn in 2013, much faster than the SE Asian average of 2.4%. FDI pledges soared 54.5% to $21.6bn, the bulk of which was in export manufacturing. Newly approved projects include two Samsung factories with total capital of $3bn, a $2.8bn oil refinery in Thanh Hoa province, and another $3.2bn refinery in Phu Yen. The abundance of incoming FDI will allow the authorities to become more discriminating in their investment approval process. The government has signalled a preference for environmentally friendly and energy efficient projects. FDI-linked production, exports, and employment helped the economy rebound from a steep post-2011 slump in real estate and related sectors such as construction. The domestic downturn was instrumental in reducing inflation to 6.6% in 2013 from 18.7% in 2011 and turning an oversized US$16.4bn trade deficit in 2008 to a $2bn surplus in 2012. Improved macro-economic stability prompted credit rating agency Fitch to lift Vietnam’s sovereign credit outlook to Positive from Stable in late-January.
Better policies to win foreign portfolio funds
Foreign portfolio investors have also taken a keen interest on Vietnamese stocks, but have run against foreign ownership restrictions. However, Vietnam may soon lift foreign ownership limits to 60% from 49% in some non-financial sectors. Moreover, the number of investment options is set to rise, with new listings of companies, such as flag carrier Vietnam Airlines, apparel exporter Vinatex, building-materials supplier Viglacera, telecom operator MobiFone, and beer maker Sabeco, scheduled for later this year.
Outlook for the market A broad-based pick up in GDP growth
GDP growth has lifted from a low of 4.9%yoy in Q1’13 to 6%yoy in Q4’13, which pushed full year growth to 5.4% in 2013. Given the strong pipeline of capex-intensive projects we expect GDP growth to lift to 6% with additional help from a steady expansion in export capacity, as new factories come on stream. Local demand should also improve, as cash is pumped into the economy by foreign investors and export manufacturing. There is, however, an upside cap on GDP growth, as many of the new factories will require foreign equipment, which will boost imports and limit GDP growth to 6%pa in 2014-15.
Ignore the January data … there’s a strong outlook for manufacturing
January data suggests a weak opening of 2014, but this probably reflects distortions arising from the timing of the Lunar New Year (January 31, 2014). Exports fell 10%yoy after a 16.8%yoy rise in Q4’13. Imports also fell 2.8%yoy (up 19% in Q4’13), pushing the 12-month rolling trade balance into US$0.5bn deficit, the first after an uninterrupted string of surpluses since October 2012. Retail sales growth eased to 11.9%yoy in January from 12.8% in Q4’13, as did manufacturing output (7.6%yoy from 10%yoy). However, Vietnam’s forward looking manufacturing purchaser manager’s index climbed to a 33-month high of 52.1 in January from 51.8 in December. The rise was powered by increased purchasing activity and employment in anticipation of accelerating growth ahead.
Mild inflation & a firm Dong due to better policies
Inflation has fallen from a painful 23%yoy in August 2011 to a band of 5.0-7.5%yoy since mid-2012, with 5.4%yoy in January 2014. This has allowed the central bank to lower its policy interest rate to 7% from 15% in early-2012 without undermining the Dong. The latter has enjoyed remarkable stability against the US$, staying at around 20,940 since October 2011, which will likely be maintained with help from a steady stream of capital inflows.
2011 2012 2013 2014 2015 GDP, real growth, % 6.2 5.2 5.4 6.0 6.0 CPI, yoy, % (2005=100 from 2007) 18.7 9.1 6.6 6.0 6.5 Central bank refinancing rate, year end, % 15.00 9.00 7.00 6.00 6.50 Dong to US$1, year average 20,681 20,847 21,019 21,175 21,343 Source: 2011-2013 data from the IMF and CEIC; 2014-2015 forecasts by IMA Asia.
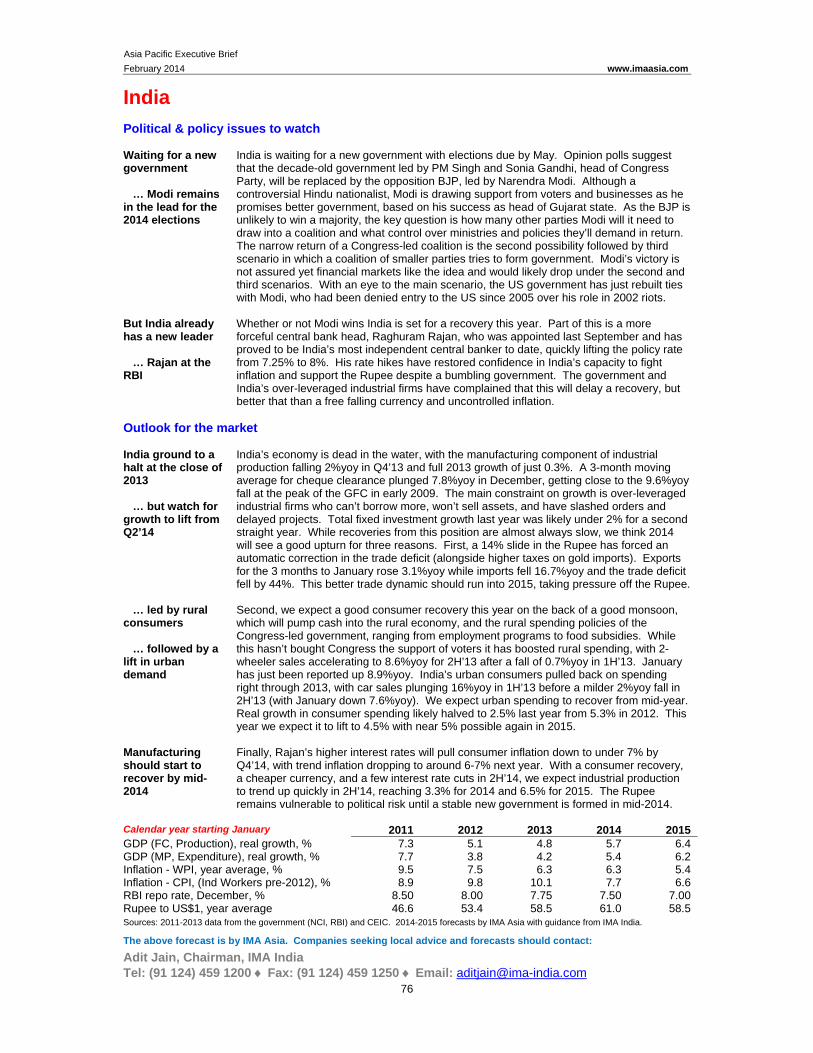
Asia Pacific Executive Brief
February 2014 www.imaasia.com
76
India Political & policy issues to watch Waiting for a new government … Modi remains in the lead for the 2014 elections
India is waiting for a new government with elections due by May. Opinion polls suggest that the decade-old government led by PM Singh and Sonia Gandhi, head of Congress Party, will be replaced by the opposition BJP, led by Narendra Modi. Although a controversial Hindu nationalist, Modi is drawing support from voters and businesses as he promises better government, based on his success as head of Gujarat state. As the BJP is unlikely to win a majority, the key question is how many other parties Modi will it need to draw into a coalition and what control over ministries and policies they’ll demand in return. The narrow return of a Congress-led coalition is the second possibility followed by third scenario in which a coalition of smaller parties tries to form government. Modi’s victory is not assured yet financial markets like the idea and would likely drop under the second and third scenarios. With an eye to the main scenario, the US government has just rebuilt ties with Modi, who had been denied entry to the US since 2005 over his role in 2002 riots.
But India already has a new leader … Rajan at the RBI
Whether or not Modi wins India is set for a recovery this year. Part of this is a more forceful central bank head, Raghuram Rajan, who was appointed last September and has proved to be India’s most independent central banker to date, quickly lifting the policy rate from 7.25% to 8%. His rate hikes have restored confidence in India’s capacity to fight inflation and support the Rupee despite a bumbling government. The government and India’s over-leveraged industrial firms have complained that this will delay a recovery, but better that than a free falling currency and uncontrolled inflation.
Outlook for the market India ground to a halt at the close of 2013 … but watch for growth to lift from Q2’14
India’s economy is dead in the water, with the manufacturing component of industrial production falling 2%yoy in Q4’13 and full 2013 growth of just 0.3%. A 3-month moving average for cheque clearance plunged 7.8%yoy in December, getting close to the 9.6%yoy fall at the peak of the GFC in early 2009. The main constraint on growth is over-leveraged industrial firms who can’t borrow more, won’t sell assets, and have slashed orders and delayed projects. Total fixed investment growth last year was likely under 2% for a second straight year. While recoveries from this position are almost always slow, we think 2014 will see a good upturn for three reasons. First, a 14% slide in the Rupee has forced an automatic correction in the trade deficit (alongside higher taxes on gold imports). Exports for the 3 months to January rose 3.1%yoy while imports fell 16.7%yoy and the trade deficit fell by 44%. This better trade dynamic should run into 2015, taking pressure off the Rupee.
… led by rural consumers … followed by a lift in urban demand
Second, we expect a good consumer recovery this year on the back of a good monsoon, which will pump cash into the rural economy, and the rural spending policies of the Congress-led government, ranging from employment programs to food subsidies. While this hasn’t bought Congress the support of voters it has boosted rural spending, with 2-wheeler sales accelerating to 8.6%yoy for 2H’13 after a fall of 0.7%yoy in 1H’13. January has just been reported up 8.9%yoy. India’s urban consumers pulled back on spending right through 2013, with car sales plunging 16%yoy in 1H’13 before a milder 2%yoy fall in 2H’13 (with January down 7.6%yoy). We expect urban spending to recover from mid-year. Real growth in consumer spending likely halved to 2.5% last year from 5.3% in 2012. This year we expect it to lift to 4.5% with near 5% possible again in 2015.
Manufacturing should start to recover by mid-2014
Finally, Rajan’s higher interest rates will pull consumer inflation down to under 7% by Q4’14, with trend inflation dropping to around 6-7% next year. With a consumer recovery, a cheaper currency, and a few interest rate cuts in 2H’14, we expect industrial production to trend up quickly in 2H’14, reaching 3.3% for 2014 and 6.5% for 2015. The Rupee remains vulnerable to political risk until a stable new government is formed in mid-2014.
Calendar year starting January 2011 2012 2013 2014 2015 GDP (FC, Production), real growth, % 7.3 5.1 4.8 5.7 6.4 GDP (MP, Expenditure), real growth, % 7.7 3.8 4.2 5.4 6.2 Inflation - WPI, year average, % 9.5 7.5 6.3 6.3 5.4 Inflation - CPI, (Ind Workers pre-2012), % 8.9 9.8 10.1 7.7 6.6 RBI repo rate, December, % 8.50 8.00 7.75 7.50 7.00 Rupee to US$1, year average 46.6 53.4 58.5 61.0 58.5 Sources: 2011-2013 data from the government (NCI, RBI) and CEIC. 2014-2015 forecasts by IMA Asia with guidance from IMA India.
The above forecast is by IMA Asia. Companies seeking local advice and forecasts should contact:
Adit Jain, Chairman, IMA India Tel: (91 124) 459 1200 Fax: (91 124) 459 1250 Email: [email protected]
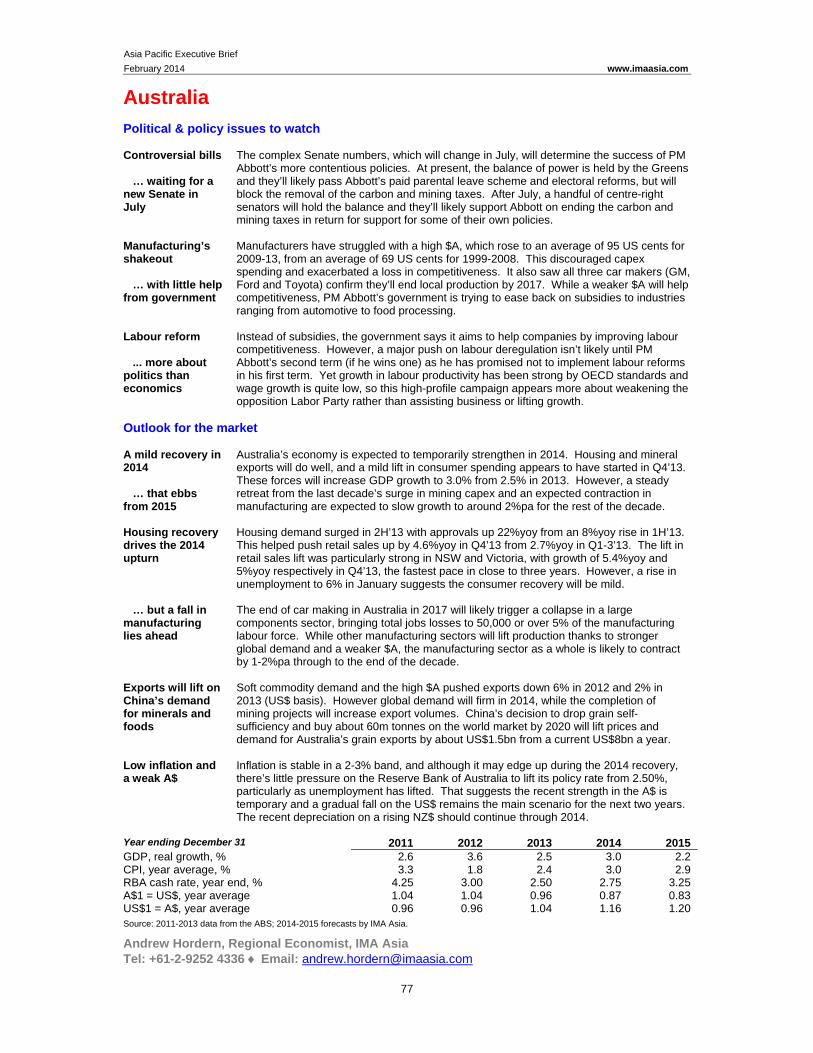
Asia Pacific Executive Brief
February 2014 www.imaasia.com
77
Australia Political & policy issues to watch Controversial bills … waiting for a new Senate in July
The complex Senate numbers, which will change in July, will determine the success of PM Abbott’s more contentious policies. At present, the balance of power is held by the Greens and they’ll likely pass Abbott’s paid parental leave scheme and electoral reforms, but will block the removal of the carbon and mining taxes. After July, a handful of centre-right senators will hold the balance and they’ll likely support Abbott on ending the carbon and mining taxes in return for support for some of their own policies.
Manufacturing’s shakeout … with little help from government
Manufacturers have struggled with a high $A, which rose to an average of 95 US cents for 2009-13, from an average of 69 US cents for 1999-2008. This discouraged capex spending and exacerbated a loss in competitiveness. It also saw all three car makers (GM, Ford and Toyota) confirm they’ll end local production by 2017. While a weaker $A will help competitiveness, PM Abbott’s government is trying to ease back on subsidies to industries ranging from automotive to food processing.
Labour reform ... more about politics than economics
Instead of subsidies, the government says it aims to help companies by improving labour competitiveness. However, a major push on labour deregulation isn’t likely until PM Abbott’s second term (if he wins one) as he has promised not to implement labour reforms in his first term. Yet growth in labour productivity has been strong by OECD standards and wage growth is quite low, so this high-profile campaign appears more about weakening the opposition Labor Party rather than assisting business or lifting growth.
Outlook for the market A mild recovery in 2014 … that ebbs from 2015
Australia’s economy is expected to temporarily strengthen in 2014. Housing and mineral exports will do well, and a mild lift in consumer spending appears to have started in Q4’13. These forces will increase GDP growth to 3.0% from 2.5% in 2013. However, a steady retreat from the last decade’s surge in mining capex and an expected contraction in manufacturing are expected to slow growth to around 2%pa for the rest of the decade.
Housing recovery drives the 2014 upturn
Housing demand surged in 2H’13 with approvals up 22%yoy from an 8%yoy rise in 1H’13. This helped push retail sales up by 4.6%yoy in Q4’13 from 2.7%yoy in Q1-3’13. The lift in retail sales lift was particularly strong in NSW and Victoria, with growth of 5.4%yoy and 5%yoy respectively in Q4’13, the fastest pace in close to three years. However, a rise in unemployment to 6% in January suggests the consumer recovery will be mild.
… but a fall in manufacturing lies ahead
The end of car making in Australia in 2017 will likely trigger a collapse in a large components sector, bringing total jobs losses to 50,000 or over 5% of the manufacturing labour force. While other manufacturing sectors will lift production thanks to stronger global demand and a weaker $A, the manufacturing sector as a whole is likely to contract by 1-2%pa through to the end of the decade.
Exports will lift on China’s demand for minerals and foods
Soft commodity demand and the high $A pushed exports down 6% in 2012 and 2% in 2013 (US$ basis). However global demand will firm in 2014, while the completion of mining projects will increase export volumes. China’s decision to drop grain self-sufficiency and buy about 60m tonnes on the world market by 2020 will lift prices and demand for Australia’s grain exports by about US$1.5bn from a current US$8bn a year.
Low inflation and a weak A$
Inflation is stable in a 2-3% band, and although it may edge up during the 2014 recovery, there’s little pressure on the Reserve Bank of Australia to lift its policy rate from 2.50%, particularly as unemployment has lifted. That suggests the recent strength in the A$ is temporary and a gradual fall on the US$ remains the main scenario for the next two years. The recent depreciation on a rising NZ$ should continue through 2014.
Year ending December 31 2011 2012 2013 2014 2015GDP, real growth, % 2.6 3.6 2.5 3.0 2.2 CPI, year average, % 3.3 1.8 2.4 3.0 2.9 RBA cash rate, year end, % 4.25 3.00 2.50 2.75 3.25 A$1 = US$, year average 1.04 1.04 0.96 0.87 0.83 US$1 = A$, year average 0.96 0.96 1.04 1.16 1.20 Source: 2011-2013 data from the ABS; 2014-2015 forecasts by IMA Asia.
Andrew Hordern, Regional Economist, IMA Asia Tel: +61-2-9252 4336 Email: [email protected]
Asia Pacific Executive Brief
February 2014 www.imaasia.com
78
New Zealand Political & policy issues to watch A tight election in late 2014
PM John Key of the National party faces a tight election in late 2014, with his party trailing the combined Labour/Green opposition by 45% to 46% in opinion polls. In recent months, both parties have stepped up populist campaigns to win votes. Labour have pledged to improve housing affordability through a capital gains tax on secondary homes, a ban on foreign home buyers, and plans for state-funded building of 10,000 homes per year. The Nationals have attacked Labour’s plans to lift the retirement age and are considering holding a referendum on NZ’s flag on election day. Strong growth should win Key a second term but New Zealanders are strongly attached to the social causes and state ownership of assets championed by both Labour and the Greens.
Steps to counter population ageing … working until 67 & migrant workers
Some key policies in the next few years will focus on NZ’s ageing population. The latest census found that population growth had slowed to 0.7%pa over 2006-13 from 1.5%pa in 2001-06, while NZ’s 65+ population had risen to 14.3% in 2013 from 12.3% in 2006. Labour’s plan to lift the retirement age to 67 years from 65 would help if it wins office, while a new working holiday visa program with the Philippines should boost foreign workers. In addition, the strong NZ economy over the next five years might encourage some overseas workers to return home.
Moderate policy tightening as growth rises
Strong growth this year will help the government achieve its targeted 2014/15 budget surplus from a deficit of 4.9% of GDP in 2010/11 without dampening growth. While the central bank will come under pressure to lift its policy rate by 175 basis points over the next two years to curb inflation, this should moderate rather than halt the current expansion.
Outlook for the market NZ economy speeding up further
NZ’s economy has entered a strong expansion that should run several more years with the help of a strong construction sector and rising dairy exports. The strength of these two sectors will boost most other sectors of the economy.
Dairy export boom, meat strong … rest soft
Exports surged 19%yoy in Q4’13 (US$ terms) following a mild 1%yoy rise in Q1-3’13. Much of the rebound was driven by farm exports, with the help of an end to a drought and a 50%yoy jump in milk powder prices. High milk prices are likely to persist and provide most of the impetus for growth in exports in 2014 and 2015. Growth for other exports may be muted by a rising NZ$.
Construction boom goes on
NZ’s property sector boomed in 2013, with strong demand in urban centres pushing up house prices 10%yoy in December. Housing consents rose by 28% in 2013 and this should keep the construction sector growing by 6-7%pa in 2014 and 2015. The prospect of rising interest rates is starting to concern banks, who have stepped up stress tests of home loans to prevent defaults.
Consumption firming … except Chinese tourists
Growth in consumer demand should lift to 3.8% in 2014 from an estimated 3.6% in 2013 as employment conditions improve. The unemployment rate fell to 6.0% in Q4’13 from 6.8% in Q4’12 and should trend lower into 2015. The lift in consumer confidence is apparent in a rise in growth for electronic card transactions to 6%yoy in 2H’13, up from 5%yoy in 1H’13. While Chinese government restrictions caused their visitor arrivals to NZ to fall 13%yoy in Q4’13, a recent lift in US and EU visitors will help the tourism sector.
Inflation and NZ$ to rise
Higher food and construction costs raised prices by 1.5%yoy in 2H’13, up from 0.8%yoy in 1H’13. Capacity constraints in the construction sector are likely to push inflation higher over 2014 and 2015, and with interest rates rising, the NZ$ will lift with the US$ on the A$.
Calendar years 2011 2012 2013 2014 2015 GDP(Expenditure), real growth, % 1.2 2.9 3.1 3.8 3.6 GDP(Production), real growth, % 1.9 2.6 3.0 3.6 3.5 CPI, year average, % 4.0 1.1 1.1 2.6 3.2 Official cash rate, year end, % 2.50 2.50 2.50 3.50 4.25 NZ$1 = US$, year average 0.79 0.81 0.82 0.85 0.85 US$1 = NZ$, year average 1.26 1.23 1.22 1.18 1.18 NZ$1 = A$. year average 1.32 1.28 1.17 1.02 0.98
Source: 2011-2013 data from Statistics NZ; 2014-2015 forecasts by IMA Asia.
Andrew Hordern, Regional Economist, IMA Asia Tel: +61-2-9252 4336 Email: [email protected]
Asia Pacific Executive Brief
February 2014 www.imaasia.com
79
Asia Brief contributors The Asia Pacific Executive Brief is produced by a unique network of in-country experts who run briefing and advisory programs that are designed to help senior executives monitor and anticipate critical business developments through timely insights and analysis. Further information on the markets and the peer group briefing programs is available from the Country Directors listed below. Asia & Global
Singapore: Richard Martin, Managing Director, IMA Asia Web: www.imaasia.com Mob: (65) 9023 9642 Email: [email protected]
Australia
Sydney: Katie Tucker, Client Support Manager, IMA Asia Web: www.imaasia.com Tel: (61 2) 9252 4336 Fax: (61 2) 9252 4339 Email: [email protected]
China
Shanghai: James Loudon, China Representative, IMA Asia Tel: (86) 186 2153 7602 Email: [email protected]
Hong Kong Hong Kong: Mark Michelson, Chairman, Asia CEO Forum, Hong Kong Tel: (852) 2530 1115 Fax: (852) 2530 1125 Email: [email protected]
India New Delhi: Adit Jain, Chairman, IMA India Web: www.ima-india.com Tel: (91124) 459 1251 Fax: (91124) 459 1250 Email: [email protected]
Indonesia Jakarta: James Castle, Chairman, CastleAsia Web: www.castleasia.com Tel: (62 21) 2902 1641 Fax: (62 21) 2902 1648 Email: [email protected]
Japan Canberra: Chris Nailer, Associate Director, IMA Asia & Director MBA program, ANU Tel: (61 2) 9252 4336 Fax: (61 2) 9252 4339 Email: [email protected]
Malaysia Kuala Lumpur: Datuk Paddy Bowie, Managing Director, Paddy Schubert Sdn. Bhd. Tel: (60 3) 2078 4031 Fax: (60 3) 2078 7034 Email: [email protected]
Pakistan Karachi: Babar Ayaz, Managing Director, Mediators (Pvt) Ltd Tel: (92 21) 565 6113 Fax: (92 21) 565 6112 Email: [email protected]
Philippines Manila: Peter Wallace, President, The Wallace Business Forum Web: www.dataphil.com Tel: (63 2) 810 9606 Fax 810 9610 Email: [email protected]
South Korea
Seoul: Tony Michell, Managing Director, Korea Associates Business Consultancy Tel: (82 2) 335 2614 Fax: (82 2) 323 4262 Web: www.kabcltd.com Email: [email protected]
Singapore Singapore: Richard Martin, Managing Director, IMA Asia Web: www.imaasia.com Tel: (65) 6332 0166 Fax: (65) 6332 0170 Email: [email protected]
Taiwan Taipei: Michael Boyden, Managing Director, TASC Taiwan Asia Strategy Consulting Tel: (886 2) 8789 0978 Email: [email protected] Web: www.tasc-taiwanasia.com
Thailand
Bangkok: Christopher Bruton, Managing Director, Dataconsult Ltd Tel: (66 2) 233 5606/7 Fax: (66 2) 236 8143 Email: [email protected]
Vietnam
Bangkok: Christopher Bruton, Managing Director, Dataconsult Ltd Tel: (66 2) 233 5606/7 Fax: (66 2) 236 8143 Email: [email protected]
![GRP-MILF Rizal Buendia[2]2eprints.soas.ac.uk/4430/1/GRP-MILF_Rizal_Buendia.pdf · Title: Microsoft Word - GRP-MILF Rizal Buendia[2]2 Author: rgb Created Date: 3/17/2008 7:54:22 AM](https://img.pdfslide.net/doc/110x75/605a24548b3ab24c49769c9b/grp-milf-rizal-buendia2-title-microsoft-word-grp-milf-rizal-buendia22-author.jpg)