Embed Size (px)
Citation preview
Copyright© 2016 by The President and Fellows of Harvard College
All rights reserved Printed in the United States of America
First printing
Library of Congress Cataloging-in-Publication Data
Names: Milanovic, Branko, author. Title: Global inequality: a new approach for the age of globalization I Branko Milanovic.
Description: Cambridge, Massachusetts : The Belknap Press of Harvard University
Press, 2016. I Includes bibliogr_aphical references and index.
Identifiers: LCCN 2015043601 I ISBN 9780674737136 (alk. paper) Subjects: LCSH: Equality. I Income distribution. I Globalization-Social aspects. I
Globalization-Economic aspects. Classification: LCC HM821 .M555 2016 I DDC 305-dc23 LC record available at
http://lccn.loc.gov/2015043601
Contents
Acknowledgments .......................................... vii
Introduction ........................................ . 1
1. The Rise of the Global Middle Class and Global Plutocrats ................................... . 10
2. Inequality within Countries ........................... 46 Introducing Kuznets Waves to Explain J.,ong-Term Trends in Inequality ·
3. Inequality among Countries ......................... 118 .
From Karl Marx to Frantz Fanon, and Then Back to Marx?
4. Global Inequality in This Century and the Next . ....... . 155
5. What Next? ......................................... 212
Ten Short Reflections on the Future of Income Inequality and Globalization
THE BELKNAP PRESS
OF HARVARD UNIVERSITY PRESS
Cambridge, Massachusetts London, England 2016
Introduction
This is a book about global inequality. Throughout the book, I look
at both income inequality and political issues related to inequality
from a global perspective. Because the world is not united under a single government, however, we cannot dispense with the need to
look at individual nation-states. On the contrary, many global issues
are played out politically at the level of the nation-state. Thus, greater openness (commercial interchange between individuals from dif
ferent countries) will have political consequences not at some imagi
nary worldwide level but within actual countries where the people
who are affected by trade live. As a consequence of globalization, for example, Chinese workers might ask for free-trade-union rights from
their government, and US workers might ask for protective duties from their government.
Although individual nation-state economies are important, and almost all political action takes place at this level, globalization is an ever
stronger force affecting everything from our income levels, our employment prospects, and the extent of our knowledge and information,
to the costs of the goods we buy daily and the availability of fresh fruit in the middle of winter. Globalization also introduces new rules of the game through the nascent process of global governance, whether through the World Trade Organization, limits on C0
2 emis
sions, or crackdowns on international tax evasion. It is therefore time to look at income inequality not as a national
phenomenon only, as has been done for the past century, but as a global one. One reason to do so is simply out of curiosity (a trait much appreciated by Adam Smith)-our abiding interest in how other people, outside our own country, live. But in addition to "mere" curiosity, information about the lives and incomes of others may also serve more pragmatic purposes: it may help us in evaluating what to buy or sell and where, in learning ways to do things better and more efficiently, in making decisions about where to migrate. Or we may use the knowledge acquired from how things are done else
where in the world to renegotiate our salary with the boss, to complain about too much cigarette smoke, or to ask the waiter for a doggy bag (a custom that has spread from one country to another).
A second reason to focus on global inequality is that we now have the ability to do so: in the past decade or so, the data required to assess and compare income levels of all individuals in the world have
become available for the first time in human history. But the most important reason, as I believe the reader of this book
will appreciate, is that a s,tudy of global inequality over the past two centuries, and especially during the past twenty-five years, allows us to see how the world has changed, often in fundamental ways. Shifts in global inequality reflect the economic (and frequently political) rise, stagnation, and decline of countries, changes in inequality levels within countries, and transitions from one social system or political regime to another. The rise of western Europe and North America following the Industrial Revolution has left its imprint on global inequality, driving it up. More recently, the fast growth of several Asian
2 GLOBAL INEQUALITY
countries has had an equally significant impact, pushing global in
equality back down. And national inequality levels; whether increasing in England during the early industrial period or increasing in China and the United States during recent decades, have also had global implications. Reading about global inequality is nothing less than reading about the economic history of the world.
This book opens with the description and analysis of the most significant changes in income distributions that have occurred globally since 1988, using data from household surveys. The year 1988 is a convenient starting point because it coincides almost exactly with th~ fall of the Berlin Wall and reintegration of the then-communist economies into the world economic system. This event was preceded, just a few years earlier, by a similar reintegration of China. These two political changes are not unrelated to the increased availability of household surveys, which are the key source from which we can
glean information about changes in global inequality. Chapter 1 documents in particular (1) the rise of what may be called the "global middle class," most of whom are located in China and other countries in "resurgent Asia," (2) the stagnation of the groups in the rich
world that are globally well-off but nationally middle- or lowermiddle class, and (3) the emergence of a global plutocracy. These three salient phenomena of the past quarter century open up several important political questions about the future of democracy, which I address in Chapter 4. But before thinking about the future, we return to the past to understand how global inequality has evolved in the long run.
Global inequality, that is, income inequality among the citizens of the world, can be formally considered as the sum of all national inequalities plus the sum of all gaps in mean incomes among countries. The first component deals with inequality in incomes between rich and poor Americans, rich and poor Mexicans, and so on. The second component deals with income gaps between the United States and
Introduction 3
Mexi<:;o;?pain and Morocco, and so on for all countries in the world. In Chapt~~,2 we consider within-nation inequalities, and in Chapter 3, among.,~ation inequalities.
ln C)'iapter 2, I use long-term historical data on income in-equa,lit'yi gqiqg back in some cases to the Middle Ages, to reformu
. late,~he Kuznets hypothesis, the workhorse of inequality economics. ;Jniht hypothesis, formulated by Nobel Prize-winning economist Shnon Kuznets in the 1950s, states that as countries industrialize and average incomes grow, inequality will at first increase and then decrease, resulting in an inverted-U-shaped curve when one plots inequality level against income. The Kuznets hypothesis has recently been found wanting because of its inability to explain a new phenomenon in the United States and other rich countries: income inequality, which had been decreasing through much of the twentieth century, has recently been on an upswing. This is difficult to recon
cile with the Kuznets hypothesis as originally defined: the increase of inequality in the rich world should not have happened.
To explain this recent upswing in inequality, as well as shifts in inequality in the past, going back to the period before the Industrial Revolution, I introduce the concept of Kuznets waves or cycles. Kuznets waves can not only satisfactorily explain the most recent spell of increasing inequality but can also be used to predict inequality's future course in rich countries like the United States or in middle-income countries like China and Brazil. I distinguish between Kuznets cycles as they apply to countries with stagnant incomes (before the Industrial Revolution). and as they apply to countries with
steadily rising mean incomes (the modern era). I distinguish between two kinds of forces that drive inequality down: "malign" forces (wars, natural catastrophes, epidemics) and "benign" forces (more widely accessible education, increased social transfers, progressive taxation). I also emphasize the role of wars, which in some instances may be caused by high domestic inequality, insufficient aggregate demand,
4 GLOBAL INEQUALITY
and search for new sources of profits that require control of other countries. Wars can lead to declines in inequality but also, unfortunately, and more importantly, to declines in mean incomes.
In Chapter 3, the focus is on the differences in mean incomes among countries. Here we face the interesting situation that now, for the first time since the Industrial Revolution two centuries ago, global inequality is not being driven by rising gaps among countries. With the increases of mean incomes in Asian countries, the gaps between countries have actually been narrowing. If this trend of economic convergence continues, not only will it lead to shrinking global inequality but it will, indirectly, also give relatively greater salience to inequalities within nations. In fifty years or so, we might return to the situation that existed in the early nineteenth century, when most
of global inequality was due to income differences between rich and poor Britons, rich and poor Russians, or rich and poor Chinese, and not so much to the fact that mean incomes in the West were greater than mean incomes in Asia. Such a world would be very familiar to any reader of Karl Marx, and indeed to any reader of the canonic European literature from the nineteenth century. But we are not there yet. Our world today is still a world in which the place where we were born or where we live matters enormously, determining perhaps as much as two-thirds of our lifetime income. The advantage that people born in wealthier countries possess is what I call "citizenship rent." I discuss at the end of Chapter 3 its significance, its political philosophy implications, and its direct consequence: pressure to migrate from one country to another in search of higher income.
After having looked at the separate components of global inequality, we can return to considering it as a whole. In Chapter 4, I discuss the likely evolution of global inequality in this century and the next. I avoid the seemingly exact projections of global inequality, because in reality they are treacherous: we know that even much more elementary projections of countries' GDPs per capita are most
Introduction 5
of the time not worth the paper they are written on. It is better, I believe, to try to isolate the key forces (income convergence and Kuznets waves) that are driving nations' and individuals' incomes today and to see where they might lead us in the future. We must remember, though, that in making these predictions, we are often on
speculative ground. While writing Chapter 4, I went back to some of the popular books
of the 1970s and 1980s that were trying to predict the future by extrapolating from current trends. I was struck by how time-bound they were, as if imprisoned not only in their space (the place or country where they were written) but even more so in their time.
At the end of A la recherche du temps perdu, Proust marvels at how old people seem to touch, in their own personas, very different ep
ochs through which they have lived. Or as Nirad Chaudhuri writes in the second volume of his beautiful autobiography (Thy Hand, Great Anarch!), it is not impossible to have seen, in one's lifetime,
both the peak and the nadir of a civilization-Roman glory at the time of Marcus Aurelius, and the moment when the Forum was abandoned to grass-grazing sheep. Perhaps with age we acquire some wisdom and the ability to compare different epochs that might allow us to better see the future. Yet that wisdom was not evident to me in the writings of the important authors from thirty or forty years ago. It seemed to me that some authors who wrote a century or more ago were more prescient of our dilemmas today than those who were much closer to us in time. Was it because the world dramatically
changed in the late 19S0s with the rise of China (which nobody writing in the 1970s foresaw) and the end of communism (which similarly was never envisaged)? Can we rule out similarly unexpected events in the next several decades? I do not think so. Yet I hope, though I am far from being certain, that this wisdom of which Proust and Chaudhuri speak and which is acquired with age may be more in evidence to the reader of this book thirty or forty years hence.
6 GLOBAL INEQUALITY
I end Chapter 4 with a discussion of three important political dilemmas that face us today: (1) How will China deal with the rising participatory and democratic expectations of its population? (2) How will rich countries manage perhaps several decades of no growth among their middle classes? and (3) Will the rise of the top onepercenters nationally and globally lead to political regimes of plutocracy or, in an attempt to placate the "losers" of globalization,
populism? In the last chapter, I review the main points of the book, distilling
its key lessons and making proposals that I believe will be crucial for reducing domestic and global inequalities in this century and the next. For within-national inequalities, I argue for a much greater focus on equalizing endowments (ownership of capital and level of education) rather than on taxation of current income. For global inequality, I argue in favor of faster growth of poorer countries (a rather uncontroversial position) and in favor oflower obstacles to migration (somewhat more controversially). The chapter is divided into ten re
flections on globalization and inequality that are more speculative and, unlike the rest of the book, draw more on my opinions than on
specific data. Perhaps the best way to understand the organization of the book
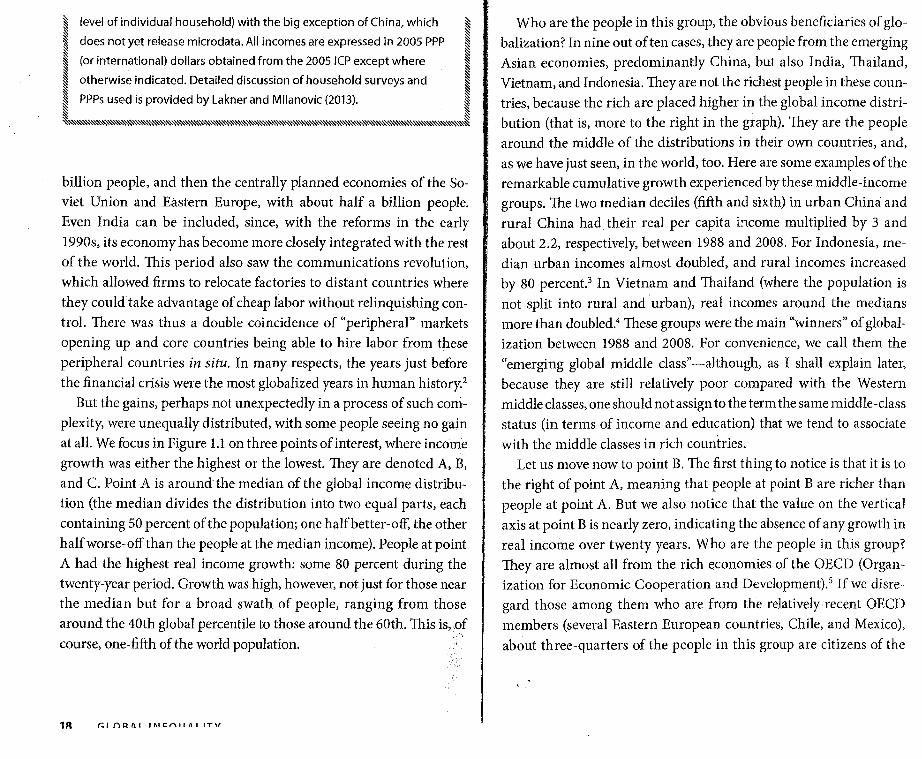
and appreciate its symmetry is by means of a schematic chart of its major chapters (Figure I.1).
As the reader can easily see (if she holds a print copy of the book, or if she looks at the total number of words in an electronic copy), this is a relatively short book. It has quite a few graphs, but I hope that they are easy to understand and will help the reader visualize the main points. It is a book that, I believe, can be read with equal appreciation and ease by specialists and by members of the general public, whether well-informed or less-well-informed (even if it is doubtful that anyone would place himself or herself into that last category).
Introduction 7
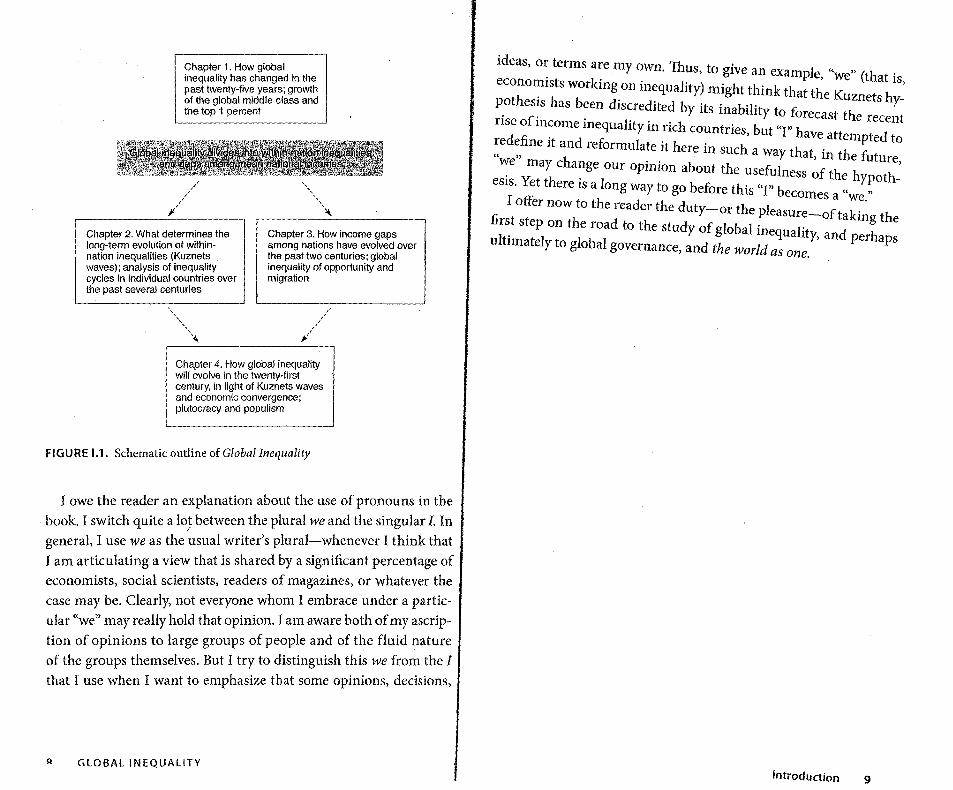
Chapter 1. How global inequality has changed in the past twenty-five years; growth ot the global middle class and the top 1 percent
Chapter 2. What determines the long-term evolution of withinnation inequalities (Kuznets waves); analysis of inequality cycles in individual countries over the past several centuries
Chapter 3. How income gaps among nations have evolved over the past two centuries; global inequality of opportunity and migration
;:' ' '
Chapter 4. How global inequality will evolve in the twenty-first century, in light of Kuznets waves and economic convergence; plutocracy and populism
FIGURE 1.1. Schematic outline of Global Inequality
I owe the reader an explanation about the use of pronouns in the book. I switch quite a lo,t between the plural we and the singular I. In general, I use we as the usual writer's plural-whenever I think that I am articulating a view that is shared by a significant percentage of economists, social scientists, readers of magazines, or whatever the case may be. Clearly, not everyone whom I embrace under a particular "we" may really hold that opinion. I am aware both of my ascription of opinions to large groups of people and of the fluid nature of the groups themselves. But I try to distinguish this we from the I that I use when I want to emphasize that some opinions, decisions,
Q GLOBAL INEQUALITY
ideas, or terms are my ow Th . n. us, to give an example "we" (th t .
economists working on inequality) might think that th, K a is, P th · h b . e uznets hy
o es1s as een discredited by its inability t £ rise f . . o orecast the recent
o mcome mequality in rich countries but "I" h d fi · ' ave attempted t
re e ne It and reformulate it here in such a way th t . h f o " " h a , In t e uture
w_e may c ange our opinion about the usefulness of th h h, esrs. Yet there is a long way to go before this "I" b e ypot -
ecomes a "we " I offer now to the reader the duty-or the pl .
fi easure-of taking th rst step on the road to the study of global inequality d h e
ultimately to global governance, and the world as one. , an per aps
Introduction 9
1 The Rise of the Global Middle Class and Global Plutocrats
Intercourse between nations spans the whole globe to such an extent that one may almost say all the world is but a single city in which a permanent fair comprising all commodities is held, so that
by means of money all the things produced by the land, animals . and human industry can be acquired and enjoyed by any person Ill
his own home. -GEMINIANO MONTANARI (1683)
Who Has Gained from Globalization?
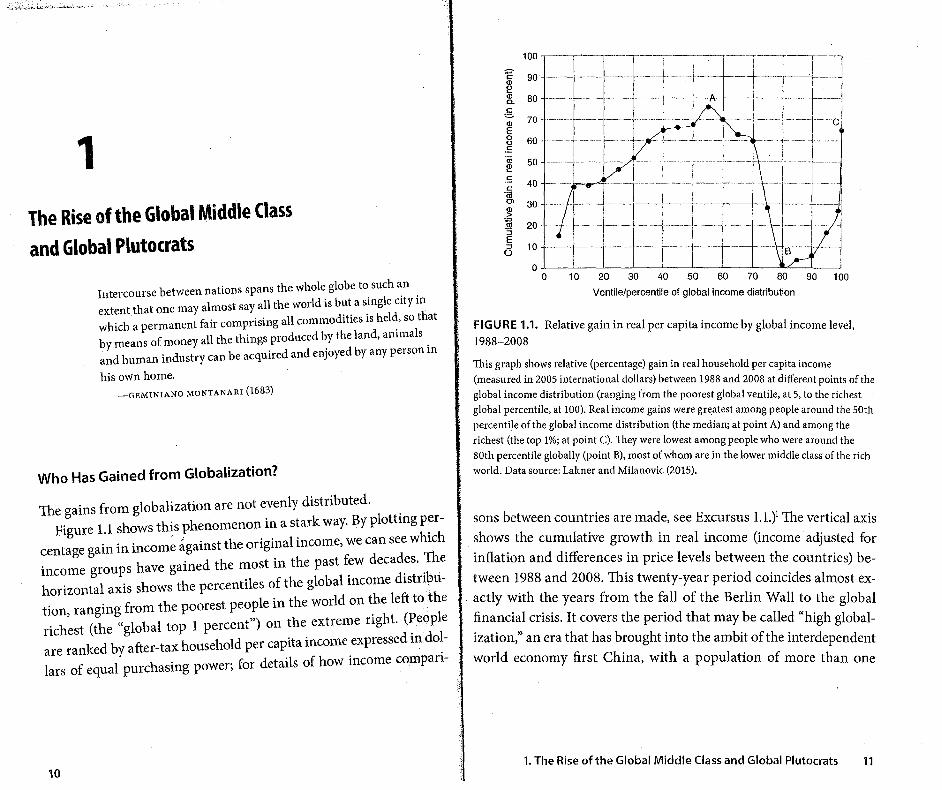
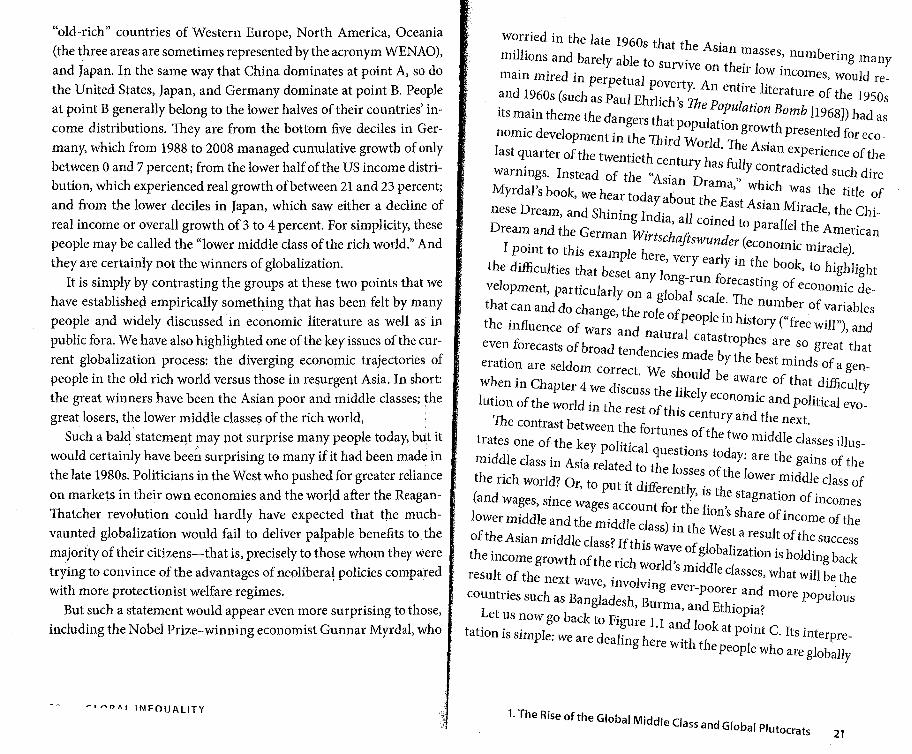
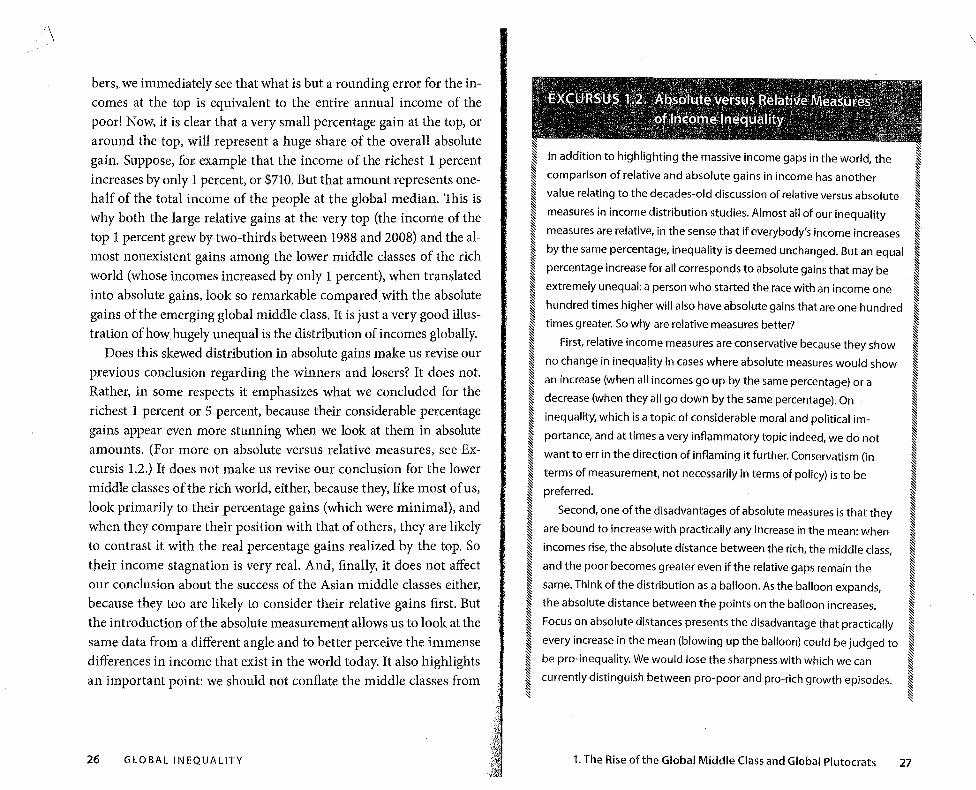
The gains from globalization are not evenly distributed. Figure 1.1 shows this phenomenon in a stark way. By plotting p~r
centage gain in income against the original income, we can see which income groups have gained the most in the past few decades. The horizontal axis shows the percentiles of the global income distribution, ranging from the poorest people in the world on the left to the richest (the "global top 1 percent") on the extreme right. (People are ranked by after-tax household per capita income expressed in dollars of equal purchasing power; for details of how income compari-
10
'E (])
~ (]) 0.
§. (])
E 0 0 .!: <ii l!: .!: c
'(ij O>
~ ~ '5 E ::> ()
100
90
80
70
60
50
40
30
20
10
0
.----,-'·---,-------.-----~--------~-- ------,------~-
0 ~ w oo m oo oo 100
Ventile/percentile of global income distribution
FIGURE 1.1. Relative gain in real per capita income by global income level,
1988-2008
This graph shows relative (percentage) gain in real household per capita income
(measured in 2005 international dollars) between 1988 and 2008 at different points of the global income distribution (ranging from the poorest global ventile, at 5, to the richest global percentile, at 100). Real income gains were gre.atest among people around the 50th
p.ercentile of the global income distribution (the median; at point A) and among the nchest (the top 1 %; at point C). They were lowest among people who were around the
80th percentile globally (point B), most of whom are in the lower middle class of the rich world. Data source: Lakner and Milanovic (2015).
sons between countries are made, see Excursus 1.1.)1 The vertical axis shows the cumulative growth in real income (income adjusted for inflation and differences in price levels between the countries) be
tween 1988 and 2008. This twenty-year period coincides almost exactly with the years from the fall of the Berlin Wall to the global financial crisis. It covers the period that may be called "high globalization," an era that has brought into the ambit of the interdependent world economy first China, with a population of more than one
1. The Rise of the Global Middle Class and Global Plutocrats 11
EXCURSUS 1.1. Where Do the Data for Globallncome
Distributions Come From? , > >
~ § There is no global household survey of individual incomes in the world. ~
~ ~ ~
§ ~ ~ ~ ~ ~ ~ ~ ~ ~ ~ ~ § ~ ~ ~ ~ § ~ ~ ~ ~ ~ ~ ~ § ~ ~ ~ § ~ § ~ § ~ § ~ ~ §
~ § ~ ~ ~ ~ ~ ~ ~ ~ ~ ~ ~ ~ ~ ~ ~
The only way to create a global income distribution is to combine as many ~ ~ ~ national household surveys as possible. Such household surveys select
a random sample of households and ask a number of questions on
demographics (age, gender, and other characteristics of respondents)
and location (where the household lives, including what province,
whether in a rural or urban area, and so on), and, for our purposes the
most important, questions about the sources and amounts of
household income and consumption. Income data include wages,
self-employment income, income from ownership of assets (interest,
dividends, rental of property), income from production for the
household's own consumption (very common in poorer and less
monetized economies where households produce their own food),
social transfers (government-provided pensions, unemployment
benefits), and income deductions such as direct taxes. Consumption
data cover money spent on everything from food and housing to
entertainment and restaurant services.
Household surveys are the only source of such individualized,
detailed information on incomes and expenditures that cover the entire
distribution, from the very poor to the very rich. By contrast, data from
fiscal sources, such as tax records, generally include only the
households of better-off people, that is, those paying income taxes.
There are many such households in the United States, but very few in
India. Thus, fiscal data cannot be used to generate a worldwide
distribution of income.
The size of household surveys varies. Some are large because the
country is large: the Indian National Sample Survey includes more than
100,000 households, or more than half a million individuals; the US
~ §
~ ~ § ~ ~ ~ ~ ~ ~ ~ ~ ~ § ~ ~ ~ ~ ~ §
~ § ~ ~ ~ ~ ~ § §
~ ~ ~ § § ~ ~ ~ ~ ~ ~ ~ § ~ ~ ~ ~ ~ ~ § ~
~ § § § § § § § ~ § § § § § § § § § § § § ~ § ~ § § § § § § § ~ § § § ~ § § ~ § § § ~ ~ § § §
~ § § § § ~ § ~ § § § § § § ~ ~ § § § ~ § § § § § § § ~ § § § § ~ § § § § § § § § § ~ ~ § §
~ ~ ~ § § ~ ~
Current Population Survey includes more than 200,000 individuals. ~ ~
Many surveys are small, with about 10,000-15,000 people. Such survey § ~ §
data, while never easily available, have recently become more acces- § ~ §
sible to researchers. For example, in the 1970s and 1980s, not only did § ~
relatively few countries conduct surveys, but it was very rare that §
~ § researchers could get access to "microdata" (that is, individual §
§ ~
household data, anonymized to preserve confidentiality). Income § ~
distributions were estimated using the government-published fractiles § § § ~
of income recipients (e.g., so many households with incomes between ~ §
$x and $y). More recently, with greater openness of statistical offices §
~ §
and improvements in the processing of large data sets, almost all data, ~ §
with the notable exception of China, are available at the micro level. This § §
~ presents significant advantages to researchers: they can redefine §
§ §
income or consumption so as to be comparable across countries or ~ §
produce inequality measures that are based on households, individuals, ~ § ~
or what are called "equivalent units" (adjusting for the fact that larger § § § §
households enjoy some economies of scale; that is, they do not need a § ~
proportional increase in income to be as well-off as smaller households). ~ § § ~
None of these adjustments is possible without access to the microdata. ~ §
The main sources of such microdata are the Luxembourg Income § § ~
Study (LIS), which includes harmonized survey data (i.e., definitions of § ~ §
income variables that are made as comparable as possible between the § § ~
countries), mostly from rich countries; the World Bank, which has § ~ §
extensive country coverage and makes some surveys available to § § ~
outside researchers while other data are available only to World Bank § § ~
staff; the Social and Economic Database for Latin America and the § § ~
Caribbean (SEDLAC), located at Universidad de la Plata in Buenos Aires; § §
~ and the Economic and Research Forum (ERF), located in Cairo, which §
§
includes surveys from the Middle East. All of these sources can be easily ~ § §
found on the Internet, but often access to the microdata is restricted to ~ § ~
noncommercial uses and "bona fide" researchers, or access is difficult § § ~
because of the need to know how to download massive databases and § ~ § § ~
, ply statistical prograrr;:i~/ln addition, for a number of countries (e.g., ~ ~ generally have lower price levels. Put in simpler terms, it is less c..,_
I India, Indonesia, ancl"(h~lland), although the data can be accessed ~ attain a given standard of living in a poorer than in a richer country: ten §
~ directly from st1:;1~l$tl~al offices, that process requires clearance and long ~ dollars will buy more food in India than in Norway. This second building ~ § ~ ,·, .·· .. ~ § ~ ~ waiting periods.:s() while access to data is becoming much better, it is ~
§ block relies on an exercise called the International Comparison Project § §
~ ~ ~ § ~ ~ still.not~ci~y; It Is also important to realize that even if all the data were ~ (ICP) that is conducted at irregular intervals (the last three rounds ~ § ~ § ~
suqdenly to become easily accessible, factors such as the sheer size of ~ ~ ~ ~ § were done in 1993, 2005, and 2011) and whose objective is to collect
~ ~ ~ § ~ theftles, complicated definitions of the variables, and comparability
§ price data in all countries of the world and to use these data to calculate ~ § § ~
~ § §
~ ~ §
~ Issues mean that income distribution data would never be as simple to § § countries' price levels. § ~ § ~ §
~ use as much more aggregated statistics like Gross National Product. ~ ~ The ICP is the single most massive empirical exercise ever conducted ~ ~
§ ~ ~ ~ ~ Now, if each country were to conduct such surveys annually, we § in economics. Its final products are the so-called PPP (purchasing power ~ § § ~ ~ ~ §
~ ~ could, by collating them, obtain annual estimates of global income § ~ parity) exchange rates. The PPP exchange rate is the exchange rate ~ I §
~ ~ ~ ~ distribution. Only rich and middle-income countries have regular § between, say, the US dollar and the Indian rupee, such that at that § ~ ·~ ~ ~ § annual surveys, however, and even among these countries, annual § exchange rate a person could buy the same amount of goods and ~ § ~ ~ ~ § ·~ ~
~ surveys are something of a novelty. And in many poor countries, § services in India as in the United States. To give an example, consider the ~ § § § § ~ ~ ~ ~ especially in Africa, household surveys are done at irregular intervals, ~ § results for 2011. The market exchange rate was 46 Indian rupees for 1 us ~ ~ ~
~ ~ ~ ~ on average every three or four years. There are also numerous countries ~ dollar. But the estimated PPP exchange rate was 15 rupees per dollar. In ~ § § ~ ~ § ~ ~ that do surveys only at very long intervals, either because they have no ~ § other words, if you lived in India, you needed only 15 rupees to buy the ~ § ~
~ ~ ~ ~ money or technical expertise to field them or because they are at war, ~· ~ same amount of goods and services as a person living in the United ~ ~ ~' ~ ~ § civil or foreign. This is the reason why global data can be put together ~' States could have bought with 1 dollar. The reason why you needed only ~
~ § ~ ~ §' ~· § ~ ~ only at approximately five-year intervals (as in this chapter) and are ~ 15 rupees (and not 46) is because the price level in India was lower; we § :§ ~ § ~· ~ ~
~ centered around one year, called the "benchmark year," which includes ~·, can say that it was about one-third (15/46) of the US price level. ~ ~ § ~ § ~ ~ ~ ~ surveys from that year and one or two surrounding years. ~. ~ It is by applying these PPP exchange rates to the incomes from § ~· ~ ~ National household surveys represent the first building block for ~· ~ national household surveys that incomes are converted into ppp (or ~
~· ~ § ~ ~ ~ I determining the global income distribution. The second building block ~ § international) dollars and made comparable across countries. This ~ § ~ ~
~ is conversion of such income or consumption data from local currencies ~ ~ conversion then enables us to calculate global income distribution. We ~ ~ ~ § ~
into a global currency that should in principle have the same pur-~
can see, then, that global income distribution is impossible to calculate ~ § § ~ ~ § ~ § ,. ~
~ chasing power everywhere. Why is this important? Because to assess ~ ~ without two enormous empirical exercises: hundreds of national ~ ~ ~ ~
~ people's incomes and make them comparable, we have to allow for the ~ household surveys, and individual price data that are aggregated into ~ § § ~ ~ ~ ~ ~ ~ fact that price levels differ between countries. Thus, to express the real ~· ~ national price indexes. ~
~ standard of living of people who live in very different environments ~ ~ However, such massive exercises have their own problems. For ~ ~ § ~ ~ ~ ~ §
I (countries), not only do we need to convert their incomes into a single ~ ~ household surveys, the most important problem is the imperfect ~ l!1 ~ I currency, but we also have to account for the fact that poorer countries ~ ,
inclusion of people at both ends of the income distribution: the very ~ §
~ ~ ~ ~ ~
14 GLOBAL INEQUALITY 1. The Rise of the Global Middle Class and Global Plutocrats 15
~ poor and the very rich. The very poor are omitted becau~e household ~ ~ solution, is the trade-off between (a) the "sameness" of the baskets of § ~ § § ~ § § surveys choose households randomly based on place of residence. §
~ goods and services that are used to measure prices in different § § ~ ~ § ~ ~ §
Homeless people and institutionalized populations (soldiers, prisoners, § ~ countries, and (b) the representativeness of such baskets. To measure ~ ~ § § § § § ~ § and students or workers who live in dormitories) are thus not included,. §
I differences in price levels, we would ideally like to include the same § ~ ~ ~ § ~ § and these people are generally poor. At the other end of the spectrum, §
goods in the "baskets" in all countries. But if we make the baskets § § § ~ ~ § § §
~ exactly the same, we lose representativeness because the staple goods ~ the rich tend to underreport their incomes (especially their income § § §
~ § § §
~ § from property) and, more alarmingly for researchers analyzing income ~ are not the same in all countries. We could achieve identity of baskets § § § § § ~ ~ ~ §
data, sometimes refuse to participate in surveys altogether. The effect § ~ by comparing the prices of wine, bread, and beef in all countries, for § § § ~ ~ §
~ of such refusals on income distribution is difficult to prove directly § example, but such a comparison would have little meaning for
§ § § ~ ~ § ~ ~ (because one obviously does not know the income of a household that § countries where these items are not widely consumed (e.g., where ~ § § § § § §
~ §
has refused to be interviewed) but can be estimated from where those § § people consume beer, rice, and fish instead). §
I § § § § § § § § who refuse to participate live. It has been estimated that US income §
It is difficult to find the best solution for this problem, and the ICP at § ~ § § § ~ § § inequality might be underestimated by as much as 10 percent because
§ § times seems to err in one direction only to then overcompensate by
§ § ~ ~ § § § § ~ ~ ~ of such non participation (Mistiaen and Ravallion 2006). §
erring in the opposite direction. This produces too much variability in § § § ~ ~ § § § § § §
These problems are similar or even more serious in other countries § § the estimated price levels (see the excellent discussion by Deaton § ~ § ~ § ~ § § ~ § and are reflected in two discrepancies between household surveys and § § [2005] and Deaton and Aten [20141). This variability was especially ~ § § § § § § § §
macrodata: first, income and consumption reported from household § evident for the Asian countries in the last two ICP exercises, in 2005 ~ ~ § §
§ § § ~ § § ~
§ surveys do not fully match household private income and consumption § §
and 2011. When Chinese or Indian price levels compared to the us price ~ § § § ~ § § ~ calculated from national accounts (that is, from GDP calculations), and § level vary by 20 to 30 percentage points between different rounds of ~
§ § § § § § § § § § §
second, statistical discrepancies (called errors and omissions) occur in § § ICP, this produces either much higher or much lower PPP incomes for § li'! § § § ~
~ § § § those countries and thus large swings in the estimates of global
§ balance of payments data because of, among other things, money § § § li'! § § § li'! ~ ~ ~ li'! transferred to tax havens (see Zucman 2013, 2015), which, for obvious ~ § inequality. Fortunately for our purposes here, such volatility affects § li'! § § § li'! li'! § ~ § reasons, is unlikely to be reported in surveys. It is therefore safe to say §
estimated levels of global inequality much more than it affects changes ~ § § § ~ § § §
~ § that household surveys underestimate the number of people who are § §
in inequality (up or down) over time. § § § ·§ § § ~ ~
poor (whatever the definitiorl of poverty) and the number of people § ~
The data used in this chapter come from more than 600 household ~ § § § § § § § ~ ~ §
who are rich, and their incomes. Lakner and Milanovic (2013) try to § ~ surveys covering about 120 countries and more than 90 percent of § § ~ § § ~ § § § § adjust globally for the latter, but any such adjustment, while useful, § § the world's population over the period 1988-2011. (Most of the data § ~ ~ § ~ § § § ~ § contains a very large degree of arbitrariness due to the simple fact that § ~ are available on my website: https://www.gc.cuny.edu/Page § ~ § ~ § ~ § ~ we know next to nothing about people who refuse to participate in ~ -Elements /Academics-Research-Centers-Initiatives/Centers-and ~ ~ ~ ~ §
~ ~ § § -lnstitutes/Luxembourg-lncome-Study-Center/Branko-Milanovic ~
§ surveys. § § § § § ~ § § li'! f § § The International Comparison Project also suffers from several § ~ -Senior-Scholar/Datasets.) In the more recent period, after the year § § § § § ~ ~ § § 2000, all household survey data are available at the micro level (the
§ problems. The most well-known, to which there is no theoretical § li'! § ~ § li'! ~ § ~ ~ ~ ~ ~
r J n n A I 11\I CA It f\ I ITV 1. The Rise of the Global Middle Class and Global Plutocrats 17
~ level of individual household) with the big exception of China, which ~ § ~ ~ does not yet release microdata. All incomes are expressed in 2005 PPP ~ ~ § ~ (or international) dollars obtained from the 2005 ICP except where ~ ~ ~ ~ otherwise indicated. Detailed discussion of household surveys and ~ ~ ~ ~ PPPs used is provided by Lakner and Milanovic (2013). ~ ~ ~ ~ ~
~"'"''""'""''"'"'"'"''''"''''"'''"''"'""'''''"''''"'"''''"'"''''''''''''"'''''''"'''''"'''''''"'''"'''''""'"''''"'~
billion people, and then the centrally planned economies of the Soviet Union and Eastern Europe, with about half a billion people. Even India can be included, since, with the reforms in the early
1990s, its economy has become more closely integrated with the rest of the world. This period also saw the communications revolution, which allowed firms to relocate factories to distant countries where
they could take advantage of cheap labor without relinquishing control. There was thus a double coincidence of "peripheral" markets opening up and core countries being able to hire labor from these
peripheral countries in situ. In many respects, the years just before the financial crisis were the most globalized years in human history.2
But the gains, perhaps not unexpectedly in a process of such complexity, were unequally distributed, with some people seeing no gain at all. We focus in Figure 1.1 on three points of interest, where income growth was either the highest or the lowest. They are denoted A, B, and C. Point A is around· the median of the global income distribution (the median divides the distribution into two equal parts, each containing 50 percent of the population; one half better-off, the other half worse-off than the people at the median income). People at point A had the highest real income growth: some 80 percent during the twenty-year period. Growth was high, however, not just for those near the median but for a broad swath of people, ranging from those around the 40th global percentile to those around the 60th. This is, .of course, one-fifth of the world population.
1R r..I ()R.111 if\.ICAlll\1 IT\f
Who are the people in this group, the obvious beneficiaries of glo-1 balization? In nine out of ten cases, they are people from the emerging
Asian economies, predominantly China, but also India, Thailand, Vietnam, and Indonesia. They are not the richest people in these coun
tries, because the rich are placed higher in the global income distribution (that is, more to the right in the graph). They are the people around the middle of the distributions in their own countries, and, as we have just seen, in the world, too. Here are some examples of the remarkable cumulative growth experienced by these middle-income groups. The two median deciles (fifth and sixth) in urban China and rural China had their real per capita bcome multiplied by 3 and about 2.2, respectively, between 1988 and 2008. For Indonesia, median urban incomes almost doubled, and rural incomes increased by 80 percent.3 In Vietnam and Thailand (where the population is not split into rural and urban), real incomes around the medians more than doubled.4 These groups were the main "winners" of globalization between 1988 and 2008. For convenience, we call them the "emerging global middle class" -although, as I shall explain later, because they are still relatively poor compared with the Western middle classes, one should not assign to the term the same middle-class status (in terms of income and education) that we tend to associate with the middle classes in rich countries.
Let us move now to point B. The first thing to notice is that it is to the right of point A, meaning that people at point B are richer than people at point A. But we also notice that the value on the vertical axis at point B is nearly zero, indicating the absence of any growth in
real income over twenty years. Who are the people in this group? They are almost all from the rich economies of the OECD (Organization for Economic Cooperation and Development). 5 If we disregard those among them who are from the relatively recent OECD members (several Eastern European countries, Chile, and Mexico),
about three-quarters of the people in this group are citizens of the
. . North America, Oceania "old-rich" countries of Western Europe, WENAO), . resented by the acronym
(the three areas are sometimes rep . d . ates at point A, so do that Chma omm
and Japan. In the same way d minate at point B. People . d S J an and Germany o . , .
the Umte tates, ap ' h 1
of their countries m-11 b I t the lower a ves
at point B genera y e ong o h b ttom five deciles in Ger-. "b · Tuey are from t e 0
1 come d1stri utlons. d ulative growth of on y
88 t 2008 manage cum many, which from 19 o h lf fthe US income distri-
t· f m the lower a o between 0 and 7 percen ' ro h f between 21 and 23 percent; bution, which experienced real growt oh" h saw either a decline of
d ·1 iQ Japan, w ic and from the lower ec1 es t For simplicity, these
11 th f 3 to 4 percen . real income or overa gr~w o . ddle class of the rich world." And People may be called the lower m1 . .
h · ners of globalization. they are certainly not t e w111 t these two points that we
t . g the groups a It is simply by contras m . h b felt by many . . 11 ethmg that as een
have established empmca y s~m . literature as well as in "d 1 d · d 111 economlC
people and w1 e y iscusse . d f the key issues of the cur-h 1 h" hhghte one o
public fora. We ave a so ig . . onomic tra1"ectories of . . . the d1vergmg ec
rent globahzat10n process. h . urgent Asia. In short: Id . h Id versus t ose 111 res People in the o ric wor . d · ddle classes; the
b th Asian poor an m1 the great winners have een e . h Id . ddl lasses of the ric wor '
great losers, the lower m1 e c . a11y people today, but it · t y pot surprise m
Such a bald stateme~ ma "f "t had been made in b , rprising to many l l
would certainly have een su h hed for greater reliance 1. · · · the West w opus
the late 1980s. Po iticians 111 Id fter the Reagan-h . onomies and the wor. a
on markets in t e1r own ec ted that the much-. Id h dly have expec ·
Thatcher revolution cou ar. d i· palpable benefits to. the . . Id fail to e iver
vaunted globalization wou . . l t th se whom they were . . . that is precise Y o 0
majority of theu citizens- ' f liberal policies compared trying to convince of the advantage~ o neo .
with more protectionist welfare regimes. re surprising to those, ld appear even mo But such a statement wou . G ar Myrdal, who · · economist unn including the Nobel Prize-wmmng
-·ADA! lf\IFOUALITY
worried in the late 1960s that the Asian masses, numbering many millions and barely able to survive on their low incomes, would remain mired in perpetual poverty. An entire literature of the 1950s and 1960s (such as Paul Ehrlich's The Population Bomb [1968]) had as its main theme the dangers that population growth presented for eco
nomic development in the Third World. The Asian experience of the last quarter of the twentieth century has fully contradicted such dire
warnings. Instead of the ''Asian Drama," which was the title of Myrdal's book, we hear today about the East Asian Miracle, the Chinese Dream, and Shining India, all coined to parallel the American Dream and the German Wirtschaftswunder (economic miracle).
I point to this example here, very early in the book, to highlight the difficulties that beset any long-run forecasting of economic de
velopment, particularly on a global scale. The number of variables that can and do change, the role of people in history ("free will"), and
the influence of wars and natural catastrophes are so great that even forecasts of broad tendencies made by the best minds of a generation are seldom correct. We should be aware of that difficulty when in Chapter 4 we discuss the likely economic and political evolution of the world in the rest of this century and the next.
The contrast between the fortunes of the two middle classes illustrates one of the key political questions today: are the gains of the middle class in Asia related to the losses of the lower middle class of the rich world? Or, to put it differently, is the stagnation of incomes (and wages, since wages account for the lion's share of income of the lower middle and the middle class) in the West a result of the success of the Asian middle class? If this wave of globalization is holding back the income growth of the rich world's middle classes, what will b~ the result of the next wave, involving ever-poorer and more populous countries such as Bangladesh, Burma, and Ethiopia?
Let us now go back to Figure 1.1 and look at point C. Its interpretation is simple: we are dealing here with the people who are globally
1. The Rise of the Global Middle Class and Global Plutocrats 21
very rich (the global top 1 percent) and whose real incomes have
risen substantially between 1988 and 2008. They too are the winners of globalization, almost as much as (and as we shall see in a moment, in absolute terms even more than) the Asian middle classes.
People who belong to the global top 1 percent are overwhelmingly from the rich economies. The United States dominates there: half of the people in the global top 1 percent are American. (This means that approximately 12 percent of Americans are part of the global top 1 percent.)6 The rest are almost entirely from Western Europe, Japan, and Oceania. Of the remainder, Brazil, South Africa, and
Russia each contribute 1 percent of their populations. We can call those in group C the "global plutocrats."
Comparison of groups B and C allows us to address another
important cleavage. We have seen that group B, with zero or negligible gains from globalization, consists mainly of the lower middle class and the poorer segments of the rich countries' populations. In contrast, group C, the winners of globalization, consists of the richer
classes from these same countries. An obvious implication is that the income gaps between the top and bottom have widened in the rich world, and that globalization has favored those in the rich countries
who were already better-off. This too is not entirely surprising, since it is generally acknowledged that within-nation inequalities in the rich world have increased during the past twenty-five to thirtyyears.7
TI1is is the topic we shall address in Chapter 2. But what is important, and rewarding in an epistemological sense, is to see that these effects are observable when we look at the world as a whole, too.
Figure 1.1 displays only a very rough image of the winners apd losers of globalization. Many additional ways to look at these data ~re possible: we could look in much more minute detail at the horizontal axis (splicing the world's population into smaller "fractiles" of, say, 1 percent), or we could look at how given income groups (such as the
poorest 10 percent of people in China versus the poorest 10 percent
22 GLOBAL INEQUALITY
of people in Argentina) have fared over the same twenty years, or we
could define income gains in standard exchange-rate dollars rather than adjusting them to take into account different pric:e levels in different countries. But whatever adjustment we make, the essential
shape of the gains and losses shown here does not change: it always appears as a reclining S curve (or what some people have called an "elephant curve," because it resembles an elephant with a raised
tr~nk). The p~rcentage gains are always the strongest among the middle classes rn emerging economies and the global 1 percent; they are ~lways the least among people situated around the 75-90th percentile of the global income distribution, in other words, the middle and lower middle classes in OECD countries. s
TI1is shape, with a trough at the position of the relatively well-off percentiles, is very unusual in the case of individual countries. Nor
mally, graphs such as these, which are called growth incidence curves (GIC), either rise more or less continuously, indicating that the rich have gained more than the poor, or, on the contrary, slope downward continuously, demonstrating the reverse. A reclining s curve shows that the changes in income have been such that the rich and the
middle class 4ave benefited more than those in between. Within an individual country, such changes are not likely because they would
imply that either economic policies or technological change had been
"calibrate~" in such a way as to benefit the top l percent or 5 percent, to go agamst the interests of those placed immediately below, and
t~en to benefit ~hose furthe~ down. Such discontinuities are not very likely to occur m the way either new technologies or new economic
policies help or hamper various income groups. For example, it is not probable that a policy that cut marginal tax rates for the top s percent
would be accompanied by another policy that increased taxes on those !ust b~low the top 5 percent level. Here, however, we are dealing not with a smgle country distribution but with a global distribution that is the product of several factors: (a) the differences in countries'
1. The Rise of the Global Middle Class and Global Plutocrats 23
growth rates (or to be more specific: China's faster growth rate in
comparison with that of the United States), (b) countries' original
positions in the global income distribution in 1988 (when China was so much poorer than the United States), and finally (c) changes
in the countries' own income distributions, which are affected not
only by domestic policies but by globalization (principally by China
exporting cheap goods to the United States). These factors explain how such unusually shaped curves, like the reclining S curve, are
possible. What do we expect the shape of the global incidence curve
to look like in the next thirty years? We shall address this issue in
Chapter4. A very important caveat regarding the interpretation of "win-
ners" and "losers" and of the meaning of the reclining S curve is that
so far we have dealt only with relative gains across the global income
distribution. The vertical axis in Figure 1.1 shows the cumulative per
centage change in real income between 1988 and 2008. How would the results look if instead of relative change (percentage gain) we con
sidered absolute change (number of dollars gained)? As we shall see,
this change in perspective alters the results in a rather dramatic way.
Absolute Income Gains along the Global
Income Distribution
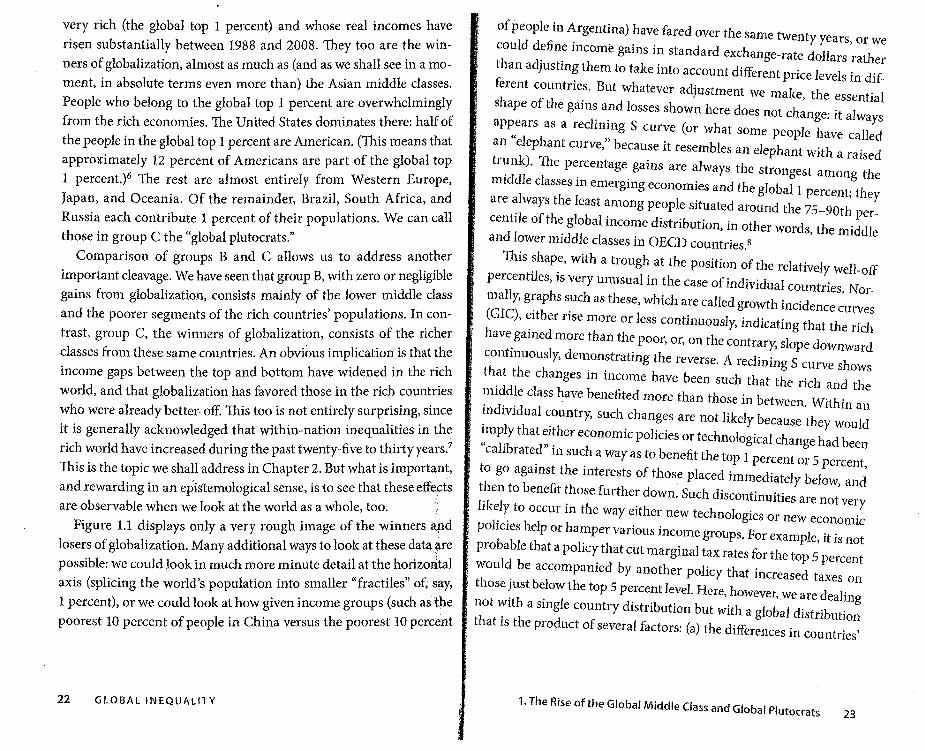
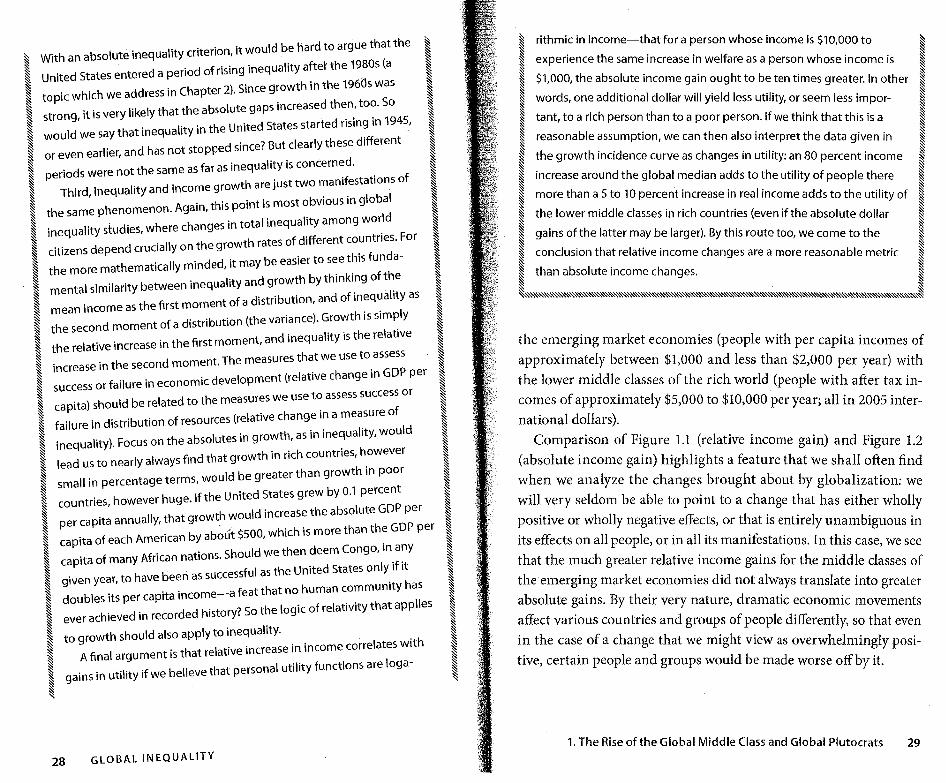
Suppose that we take the entire increment in global income between 1988 and 2008 and call it 100: Figure 1.2 shows that 44 percent of the
absolute gain has gone into the hands of the richest 5 percent of .
people globally, with almost one-fifth of the total increment re
ceived by the top 1 percent.9 In contrast, people whom we have termed the main beneficiaries of the current era of globalization, the
"emerging global middle class" have only received (by ventile) be
tween 2 and 4 percent of the increase in the global pie, or in total
about 12-13 percent.
24 GLOBAL INEQUALITY
30 ------··-···- ·-·······-···· --·-·····-·····--··· ······- ....... --·-··-·· ... .
25 -·-··-·--·------·----·---·--·--·---·---·-·----····-·---- top ~ 25 -·-·--2-5%·----~. ---
!OP ........ 19 .. 1%
16
·······-·-· . -· ····-·-----··· ---·--8-·
5 .. ·····--. ---··--- -----------··-·2· ·3·A
0 0 0 1 1 1 1 1 1 2 2
o+--,..._,,....,.....,BL,-J.,.1L,11L,B1,-,._,111,~.1i,-A1,JL,.Jl,.JILJ1.JL.L 5 10 15 20 25 30 35 40 45 50 55 60 65 70 75 80 85 90 95 99100
Ventile/percentile of global income distribution
FIGURE 1.2. Percentage of absolute gain in real per capita income received, by global income level, 1988-2008
This graph shows the percentage of total absolute gain in real household per capita
income (measured in 2005 international dollars) between 1988 and 2008 received by
groups at different points of the global income distribution. We take the increase in total
world real income as 100 and calculate how much of it was received by different ventiles (groups of 5% of the population) or percentiles of the global income distribution. Tue
graph shows that the absolute gains in income went mostly to the richest 5% of the world
population. 'TI1e top 1% got 19% of the total global income increase. Data source: Lakner
and Milanovic (2015).
How is this possible, and does this distribution of absolute gains
invalidate our previous point regarding the winners and losers? It is
possible simply because of the enormous gaps in real income that
exist between the top, the median, and the bottom of the global income distribution. In 2008, the average per capita disposable
(after-tax) income of the global top 1 percent was just over $71,000
per year, income at the median was around $1,400, and people who
were in the poorest global decile had annual incomes under $450 (all figures are in 2005 international dollars). In looking at these num-
1. The Rise of the Global Middle Class and Global Plutocrats 25
\ \
bers, we immediately see that what is but a rounding error for the incomes at the top is equivalent to the entire annual income of the poor! Now, it is clear that a very small percentage gain at the top, or
around the top, will represent a huge share of the overall absolute
gain. Suppose, fo11 example that the income of the richest 1 percent increases by only 1 percent, or $710. But that amount represents onehalf of the total income of the people at the global median. This is
why both the large relative gains at the very top (the income of the top 1 percent grew by two-thirds between 1988 and 2008) and the almost nonexistent gains among the lower middle classes of the rich
world (whose incomes increased by only 1 percent), when translated
into absolute gains, look so remarkable compared with the absolute gains of the emerging global middle class. It is just a very good illustration of how hugely unequal is the distribution of incomes globally.
Does this skewed distribution in absolute gains make us revise our
previous conclusion regarding the winners and losers? It does not. Rather, in some respects it emphasizes what we concluded for the
richest 1 percent or 5 percent, because their considerable percentage
gains appear even more stunning when we look at them in absolute amounts. (For more on absolute versus relative measures, see Excursis 1.2.) It does not make us revise our conclusion for the lower
middle classes of the rich world, eithe1; because they, like most of us,
look primarily to their percentage gains (which were minimal), and when they compare their position with that of others, they are likely to contrast it with the real percentage gains realized by the top. So
their income stagnation is very real. And, finally, it does not affect our conclusion about the success of the Asian middle classes either, because they too are likely to consider their relative gains first. But
the introduction of the absolute measurement allows us to look at the
same data from a different angle and to better perceive the immense differences in income that exist in the world today. It also highlights an important point: we should not conflate the middle classes from
26 GLOBAL INEQUALITY
";'., + , , '~ ~ ~ ·:~~ , ; ( ~ ~,h ::, ~ ,-\ . , : ',' , ~i_:, ''",{?'"-~1~!tfB .. "
:-" EXCl.JRSU,S 1 ~;2~ ·~osolute versus Relative Measures . ": [1711 ,; ·;
.~»· . ' : " '()f:fneo~~ lnequalit~ · · , , ,· · . :~·.~, ~,~:;~1 ·~~'' r ~ 1 J<~",":,~·:~~: • r ~~ ,,-'.~~ __ :--,~.:~~~~[~~?~>~~
comparison of relative and absolute gains in income has another
value relating to the decades-old discussion of relative versus absolute
measures in income distribution studies. Almost all of our inequality
~ ~ ~ ~ ~ ~ ~ ~ ~ ~
measures are relative, in the sense that if everybody's income increases ~· ~ by the same percentage, inequality is deemed unchanged. But an equal ~
~ ~
percentage increase for all corresponds to absolute gains that may be
extremely unequal: a person who started the race with an income one
hundred times higher will also have absolute gains that are one hundred ~ ~ ~
times greater. So why are relative measures better?
First, relative income measures are conservative because they show
no change in inequality in cases where absolute measures would show
an increase (when all incomes go up by the same percentage) or a
decrease (when they all go down by the same percentage). On
inequality, which is a topic of considerable moral and political im-
portance, and at times a very inflammatory topic indeed, we do not
want to err in the direction of inflaming it further. Conservatism (in
terms of measurement, not necessarily in terms of policy) is to be
preferred.
Second, one of the disadvantages of absolute measures is that they
are bound to increase with practically any increase in the mean: when
incomes rise, the absolute distance between the rich, the middle class,
and the poor becomes greater even if the relative gaps remain the
same. Think of the distribution as a balloon. As the balloon expands,
the absolute distance between the points on the balloon increases.
Focus on absolute distances presents the disadvantage that practically
every increase in the mean (blowing up the balloon) could be judged to
be pro-inequality. We would lose the sharpness with which we can
currently distinguish between pro-poor and pro-rich growth episodes.
1. The Rise of the Global Middle Class and Global Plutocrats
~ ~ ~ ~ ~ ~ ~ ~
~ ~ ~ ~ ~ ~ ~ ~ ~
I ~ ~ ~ ~ ~ ~ ~ ~ ~
~ ~ ~ ~ ~ !;§ ~ ~ ~ ~ ~
27
\
. . Id b hard to argue that the With an absolute inequality criterion, it wou .e
f . . · equality after the 1980s (a U ·t d States entered a period o nsmg in .
ni e . th ih the 196ds was topic which we address in Chapter 2). Smee ~row o strong, it is very likely that the absolute gaps increased th~n., to~. S
would we say that inequality in the United States started nsm~ in 1945,
or even earlier, and has not stopped since? But clearly these different
Periods were not the same as far as inequality is concerned. . f
h · st two manifestations o Third, inequality and income growt are JU . .
h non Again this point is most obvious m global the same p enome . , Id inequality studies, where changes in total inequality amohg wor.
citizens depend crucially on the growth rates of different co~ntn~. For
the more mathematically minded, it may be easier to s~e t~1s fun a-. d th by thmkmg of the
mental similarity between inequality an grow . . . the first moment of a distribution, and of inequality as
mean income as . . 1 d moment of a distribution (the variance). Growth is s1m~ y the secon d . e uality is the relative the relative increase in the first moment, an m q increase in the second moment. The measures that we use to.assess
success or failure in economic development (relative change in GDP per
capita) should be related to the measures we use to assess successf or
I . h ge in a measure o failure in distribution of resources (re at1ve c an . Id inequality). Focus on the absolutes in growth, as in ine:uality, wou
I lways find that growth in rich countries, however lead us to near ya . small in percentage terms, would be greater than growth in poor
countries however huge. If the United States grew by 0.1 percent
er ca pit~ annually, that growt~ would increase the absolute GDP per P . b bout $500 which is more than the GDP per capita of each American Ya ' .
Id th deem Congo, many capita of many African nations. Shou we en ·f.
given year, to have been as successful as the United States only.1 ith h t human community as
doubles its per capita income-a feat t a no . . . s . . d d history? So the logic of relat1v1ty that apphe
ever achieved m recor e · to growth should also apply to inequality. .
A final argument is that relative increase in income. correlates w~th gains in utility if we believe that personal utility functions are loga
28 GLOBAL INEQUALITY
~ rithmic in income-that for a person whose income is $10,000 to ~ ~ ~ § experience the same increase in welfare as a person whose income is § § § ~ § ~ $1,000, the absolute income gain ought to be ten times greater. In other § I words, one additional dollar will yield less utility, or seem less impor- i § § ~ tant, to a rich person than to a poor person. If we think that this is a ~ § § ~ reasonable assumption, we can then also interpret the data given in ~
~ the growth incidence curve as changes in utility: an 80 percent income ~ ~ ~ ~ increase around the global median adds to the utility of people there ~ § § ~ more than a 5 to 10 percent increase in real income adds to the utility of ~ § § I the lower middle classes in rich countries (even if the absolute dollar ~ § I ) h h § ~ gains of the latter may be arger. By t is route too, we come tot e ~ ! conclusion that relative income changes are a more reasonable metric i ~ than absolute income changes. ~ ~ ~ ~~'''''~'~'~'~~''''~'''''''''''''''''''''~'''~~''''''''''~''''~'''~'''~~\.~\.\.\.'l-.\.''''''''''~''''~'~'''''~~'''''''~'l-."\'\.''~
the emerging market economies (people with per capita incomes of
approximately between $1,000 and less than $2,000 per year) with
the lower middle classes of the rich world (people with after tax incomes of approximately $5,000 to $10,000 per year; all in 2005 inter
national dollars).
Comparison of Figure 1.1 (relative income gain) and Figure 1.2
(absolute income gain) highlights a feature that we shall often find when we analyze the changes brought about by globalization: we
will very seldom be able to point to a change that has either wholly
positive or wholly negative effects, or that is entirely unambiguous in its effects on all people, or in all its manifestations. In this case, we see
that the much greater relative income gains for the middle classes of
the emerging market economies did not always translate into greater absolute gains. By their very nature, dramatic economic movements
affect various countries and groups of people differently, so that even
in the case of a change that we might view as overwhelmingly posi
tive, certain people and groups would be made worse off by it.
1. The Rise of the Global Middle Class and Global Plutocrats 29
It is this fundamentally ambivalent nature of globalization that I hope to bring out in this book. The reader needs to be constantly aware that globalization is a force both for good and bad. Ideally, he or she, even when reading about some aspects that seem "good," should be on alert for thinking about what drawbacks or "bad" effects may lurk behind them (and conversely, when reading about "bad" effects). Our ability to comprehend and include all the "goods" and all the "bads" and to give them a subjective weighting will, in the
last analysis, determine how we feel about globalization. But it is precisely this ambivalence, combined with the fact that our personal weighting schemes are by necessity different-not only because we might believe in different things, but because we ourselves or people we care about may be affected positively or negatively by globalization-that will make unanimity about the effects of globalization forever elusive.
The Effects of the Financial Crisis
We have so far discussed the changes between 1998 and 2008 because they best represent the effects of"high globalization" and because our data for that period have been well organized and made as comparable as possible. But new data and information from 2008 to 2011
are now available. In most respects, this last short period-which comes just after the financial crisis-is a continuation and even an acceleration of the globftl.ization trends described above; but it con-
tinues the trends with a twist. ~;
A trend that became even stronger in 2008-2011 was the growth·}~ of the global middle class, fueled during these three years, as inl:.
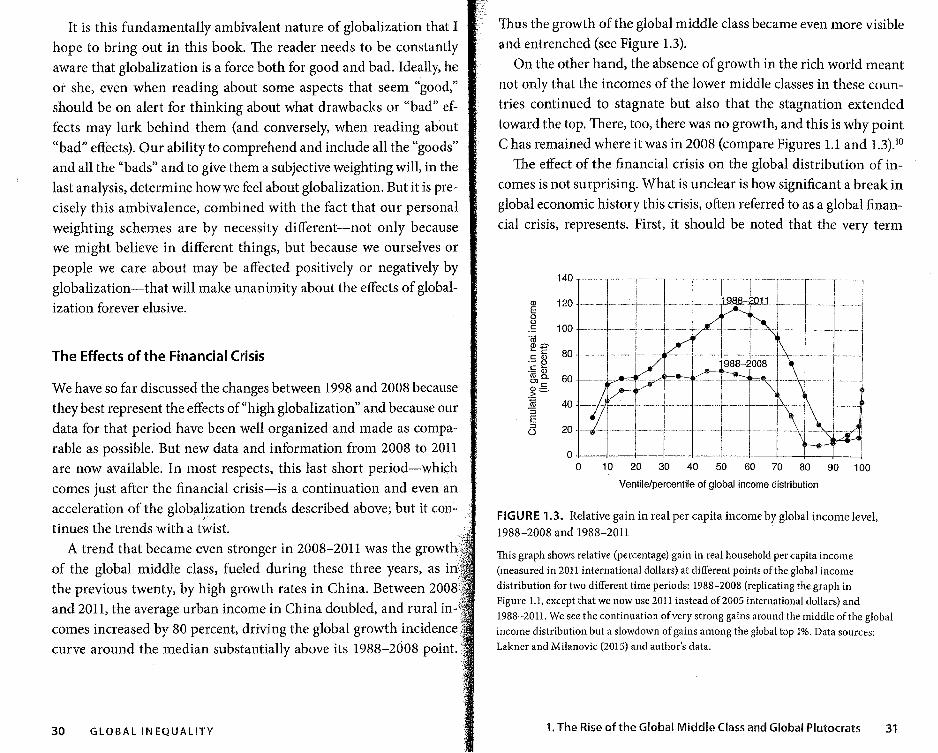
the previous twenty, by high growth rates in China. Between 2008 '~. and 2011, the average urban income in China doubled, and rural in-J comes increased by 80 percent, driving the global growth incidence '!~. curve around the median substantially above its 1988-2008 point.·~
30 GLOBAL INEQUALITY
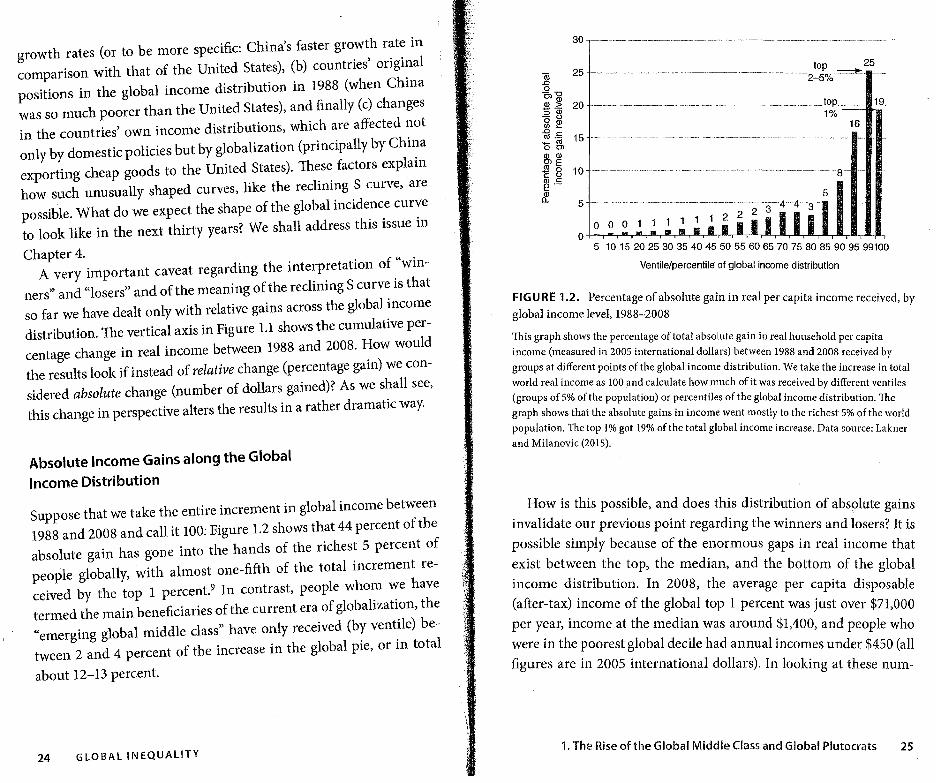
Thus the growth of the global middle class became even more visible and entrenched (see Figure 1.3).
On the other hand, the absence of growth in the rich world meant not only that the incomes of the lower middle classes in these countries continued to stagnate but also that the stagnation extended toward the top. There, too, there was no growth, and this is why point Chas remained where it was in 2008 (compare Figures 1.1and1.3).10
The effect of the financial crisis on the global distribution of incomes is not surprising. What is unclear is how significant a break in global economic history this crisis, often referred to as a global financial crisis, represents. First, it should be noted that the very term
140 -·-·--r--·T----r- ·r i ····-·r· .... ·1
:: ~~=r--1
- r-t r It :t•J i I l I '1 I
80 .
60
I 1 j : --F1 ______ Jll- -1-- I l c i 0 I ' ' I I
0 10 20 30 40 50 60 70 80 90 100
Ventile/percentile of global income distribution
FIGURE 1.3. Relative gain in real per capita income by global income level, 1988-2008 and 1988-2011
This graph shows relative (percentage) gain in real household per capita income
(measured in 2011 international dollars) at different points of the global income distribution for two different time periods: 1988-2008 (replicating the graph in
Figure 1.1, except that we now use 2011 instead of 2005 international dollars) and
1988-2011. We see the continuation of very strong gains around the middle of the global
income distribution but a slowdown of gains among the global top 1%. Data sources: Lakner and Milanovic (2015) and author's data.
1. The Rise of the Global Middle Class and Global Plutocrats 31
"global" is a misnomer because the slowdown (or the recession) af
fected, at first, only the rich economies. It should more properly be labeled a recession among the Atlantic economies. Second, the longterm evolution of incomes at the level of nations, that is, the rebalancing of economic activity in favor of Asia and away from Europe and North America, was not interrupted but rather was reinforced .· by the crisis. Thus, the crisis represented not a break in this trend, but rather the reverse: reinforcement of an already existing trend. Third, the rebalancing has a counterpart in the distribution of personal incomes worldwide in the sense that it changed the shape of the global income distribution from being strongly twin-peaked (having many people at very low incomes, then practically nobody in the middle, and finally more people at very high income levels) to being fuller in the middle, such that the global income distribution is now beginning to look like the distribution of a single country. We are, of course, still far from that point, but we are certainly closer to it in 2011 (or today) than we were in 1988. This trend, too, was merely reinforced during the crisis.
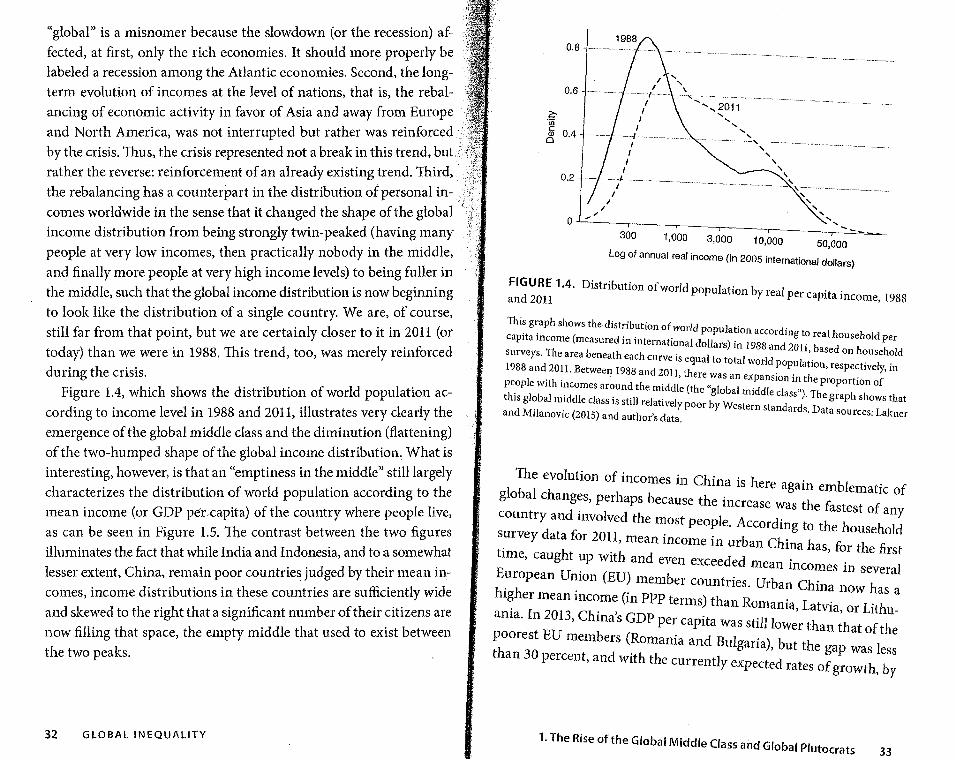
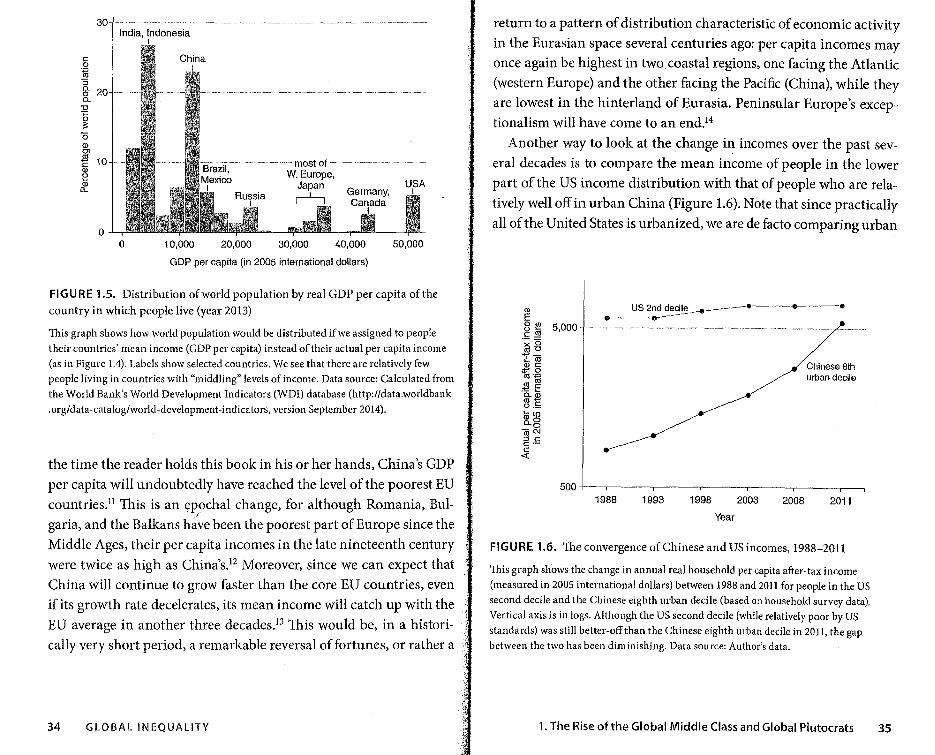
Figure 1.4, which shows the distribution of world population according to income level in 1988 and 2011, illustrates very clearly the emergence of the global middle class and the diminution (flattening) of the two-humped shape of the global income distribution'. What is interesting, however, is that an "emptiness in the middle" still largely characterizes the distribution of world population according to the mean income (or GDP percapita) of the country where people live, as can be seen in Figure 1.5. 'The contrast between the two figures illuminates the fact that while India and Indonesia, and to a somewhat lesser extent, China, remain poor countries judged by their mean incomes, income distributions in these countries are sufficiently wide and skewed to the right that a significant number of their citizens are now filling that space, the empty middle that used to exist between the two peaks.
32 GLOBAL INEQUALITY
0.8 -
0.6 -
. .£; UJ c ~ 0.4
0.2
0 /
.......... ·-, .
300
............ 2011 .... .... .... ....
' .. ___ ,_ .. __
' ' ' '---"~~',
' .... ·-- ··-·--· .,·--··-··- ----··--
' ' ' ' .... .... --1,000 3,000 10,000 50,000
Log of annual real income (in 2005 international dollars)
FIGURE 1.4. Distribution of world I . b and 2011 popu at1on y real per capita income, 1988
This graph shows the distribution of world population acco d. capita income (measured in international dollars) in 1988 a~d'~~lt~ ~al household per surveys. The area beneath each curve is e ual to total '. ased on household 1988 and 2011. Between 1988 and 201 I t~ world population, respectively, in
, ere was an expansion in the r . people with incomes around the middle (the" l b 1 .ddl p oportion of l . g o a m1 e class") Th . I h
t us global middle class is still relative! b W · e giap 1 s ows that . Y poor Y estern standards D t .
and M1Janovic (2015) and author's d t · a a sou1ces: Lakner a a.
The evolution of incomes in China is here aga1·n bl . 1 b 1 h em ematic of
g o a c anges, perhaps because the increase was the fastest f country and involved the most people. According to the hou:h:~: survey data for 2011, mean income in urban China has c . th fi f h · , 101 e rst ime, caug t ~p with and even exceeded mean incomes in several
European Urnon (EU) member countries Urban Ch" h h · h · · ma now as a 1~ er mean income (in PPP terms) than Romania Latvia o L "th
arna. In 2013, China's GDP per capita was still low:r than ;h:t o1f t:~ poorest EU members (Romania and Bulgaria), but the gap was less than 30 percent, and with the currently expected rates of growth, by
1. The Rise of the Global Middle Class and Global Plutocrats 33
30
c 0
~ :; 0. 20 0 0. 'O "§ :;: 0 Q) OJ
~ 10 Q) e Q)
CL
0
India, Indonesia
0
China I
10,000
··· ·· ·············most of···-···- ·······-···· -W. Europe,
Japan ,--1-,
20,000 30,000
Germany, Canada
I
,1 40,000
GDP per capita (in 2005 international dollars)
USA
I 50,000
FIGURE 1.5. Distribution of world population by real GDP per capita of the country in which people live (year 2013)
This graph shows how world population would be distributed if we assigned to people
their countries' mean income (GDP per capita) instead of their actual per capita income
(as in Figure 1.4). Labels show selected countries. We see that there are relatively few people living in countries with "middling" levels of income. Data source: Calculated from
the World Bank's World Development Indicators (WDI) database (http://data.worldbank
.org/data-catalog/world-development-indicators, version September 2014).
the time the reader holds this book in his or her hands, China's GDP
per capita will undoubtedly have reached the level of the poorest EU countries. 11 This is an ~pochal change, for although Romania, Bulgaria, and the Balkans h~~e been the poorest part of Europe since the Middle Ages, their per capita incomes in the late nineteenth century were twice as high as China's.12 Moreover, since we can expect that China will continue to grow faster than the core EU countries, even if its growth rate decelerates, its mean income will catch up with the EU average in another three decades.13 This would be, in a historically very short period, a remarkable reversal of fortunes, or rather a 4
34 GLOBAL INEQUALITY
return to a pattern of distribution characteristic of economic activity in the Eurasian space several centuries ago: per capita incomes may once again be highest in two coastal regions, one facing the Atlantic (western Europe) and the other facing the Pacific (China), while they are lowest in the hinterland of Eurasia. Peninsular Europe's exceptionalism will have come to an end.14
Another way to look at the change in incomes over the past several decades is to compare the mean income of people in the lower part of the US income distribution with that of people who are relatively well off in urban China (Figure 1.6). Note that since practically all of the United States is urbanized, we are de facto comparing urban
US 2nd decile_. ______ ___. ____ .. ____ •
o-----------·
1988 1993 1998
Year
2003 2008
Chinese 8th urban decile
2011
FIGURE 1.6. The convergence of Chinese and US incomes, 1988-2011
This graph shows the change in annual real household per capita after-tax income
(measured in 2005 international dollars) between 1988 and 2011 for people in the US second decile and the Chinese eighth urban decile (based on household survey data).
Vertical axis is in logs. Although the US second decile (while relatively poor by US
standards) was still better-off than the Chinese eighth urban decile in 2011, the gap between the two has been diminishing. Data source: Author's data.
1. The Rise of the Global Middle Class and Global Plutocrats 35
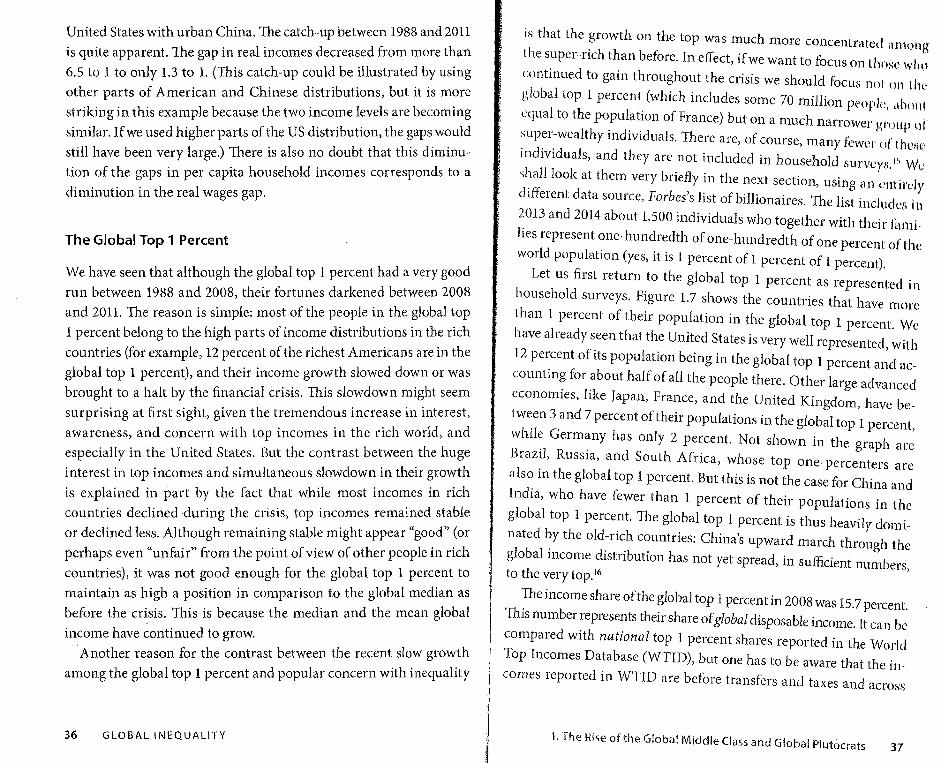
United States with urban China. The catch-up between 1988 and 2011
is quite apparent. The gap in real incomes decreased from more than 6.5 to 1 to only 1.3 to 1. (This catch-up could be illustrated by using
other parts of American and Chinese distributions, but it is more striking in this example because the two income levels are becoming
similar. If we used higher parts of the US distribution, the gaps would
still have been very large.) There is also no doubt that this diminu
tion of the gaps in per capita household incomes corresponds to a
diminution in the real wages gap.
The Global Top 1 Percent
We have seen that although the global top 1 percent had a very good
run between 1988 and 2008, their fortunes darkened between 2008
and 2011. The reason is simple: most of the people in the global top
1 percent belong to the high parts of income distributions in the rich
countries (for example, 12 percent of the richest Americans are in the
global top 1 percent), and their income growth slowed down or was brought to a halt by the financial crisis. This slowdown might seem
surprising at first sight, given the tremendous increase in interest,
awareness, and concern with top incomes in the rich world, and especially in the United States. But the contrast between the huge
interest in top incomes and simultaneous slowdown in their growth
is explained in part by the fact that while most incomes in rich
countries declined during the crisis, top incomes remained stable or declined less. Although remaining stable might appear "good" (or
perhaps even "unfair" from the point of view of other people in rich countries), it was not good enough for the global top 1 percent to
maintain as high a position in comparison to the global median as
before the crisis. This is because the median and the mean global
income have continued to grow.
Another reason for the contrast between the recent slow growth
among the global top 1 percent and popular concern with inequality
36 GLOBAL INEQUALITY
is that the growth on the top was much more concentrated among
the super-rich than before. In effect, if we want to focus on those who continued to gain throughout the crisis we should focus not on t lit global top 1 percent (which includes some 70 million people, abrnil
equal to the population of France) but on a much narrower group ol super-wealthy individuals. There are, of course, many fewer of' tlw~w individuals, and they are not included in household surveys."' We sl~a111ook at them very briefly in the next section, using an entirely different data source, Forbes's list of billionaires. The list includes in
2013 and 2014 about 1,500 individuals who together with their fomj,. lies represent one-hundredth of one-hundredth of one percent of the world population (yes, it is 1 percent of 1 percent of 1 percent).
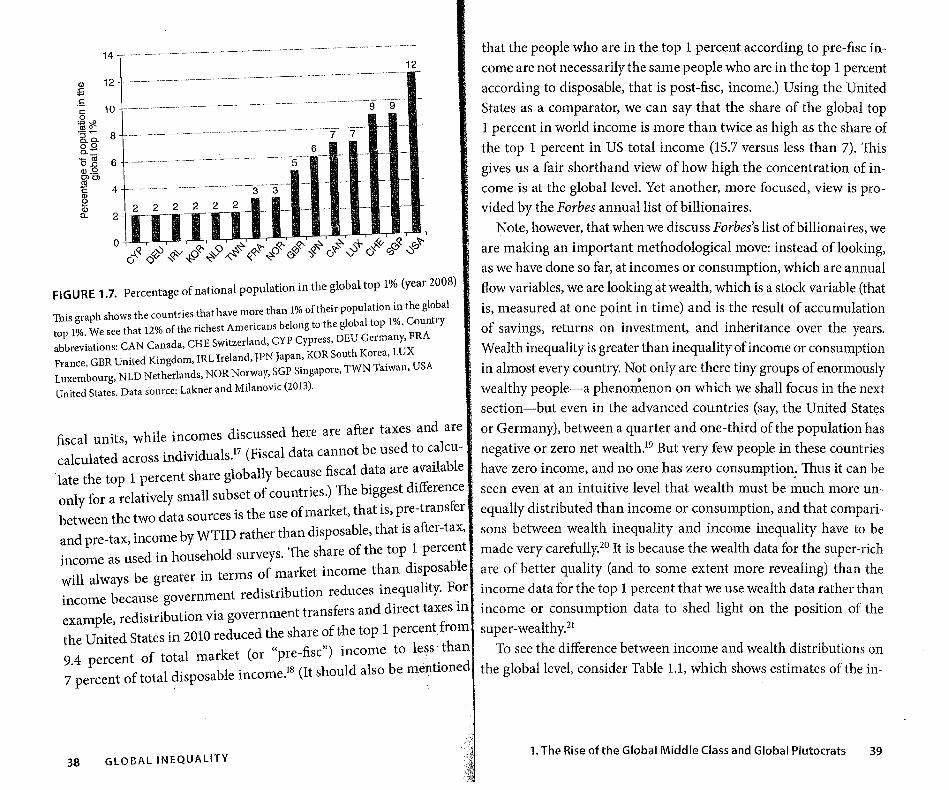
Let us first return to the global top 1 percent as represented in household surveys. Figure 1.7 shows the countries that have more than 1 percent of their population in the global top 1 percent. We
have already seen that the United States is very well represented, with
l 2 percent of its population being in the global top I percent and ac
counting for about half of all the people there. Other large advanced economies, like Japan, France, and the United Kingdom, have be
tween 3 and 7 percent of their populations in the global top 1 percent, while Germany has only 2 percent. Not shown in the graph are
Brazil, Russia, and South Africa, whose top one-percenters are also in the global top 1 percent. But this is not the case for China and
India, who have fewer than 1 percent of their populations in the
global top 1 percent. The global top I percent is thus heavily dominated by the old-rich countries: China's upward march through the
global income distribution has not yet spread, in sufficient numbers, to the very top. 16
The income share of the global top 1 percent in 2008 was 15.7 percent. 111is number represents their share of global disposable income. It ca
11 be
compared with national top 1 percent shares reported in the World
Top Incomes Database (WTID), but one has to be aware that the in
comes reported in WTID are before transfers and taxes and across
1. The Hise ofthe Global Middle Class and Global Plutocrats 37
. -········· ...... ···•······•·······•···········•··············· ···········
14
ID 12~-----------------------------------
:E .s c 10 0 ~~ g_ ';;_ 8 J_ -··-·-··-·-· --·----- ·- -------------·--·---·-------·---·-·--·-·------ --·-·-·-- ------ -----·- --,,----7-00 Cl.~
a2 6 ID 0
~Ci 4
e 8'-. 2
6 5
3 3
2 2 2
12
that the people who are in the top l percent according to pre-fisc in
come are not necessarily the same people who are in the top 1 percent according to disposable, that is post-fisc, income.) Using the United
States as a comparator, we can say that the share of the global top 1 percent in world income is more than twice as high as the share of the top 1 percent in US total income (15.7 versus less than 7). This
gives us a fair shorthand view of how high the concentration of income is at the global level. Yet another, more focused, view is provided by the Forbes annual list of billionaires.
Note, however, that when we discuss Forbes's list of billionaires, we
are making an important methodological move: instead of looking, as we have done so far, at incomes or consumption, which are annual
flow variables, we are looking at wealth, which is a stock variable (that
is, measured at one point in time) and is the result of accumulation
FIGURE 1.7. Percentage of national population in the global top 1% (year 2008)
This graph shows the countries that have more than 1 % of their population in the global
top 1%. We see that 12% of the richest Americans belong to the global top 1%. Country
abbreviations: CAN Canada, CHE Switzerland, CYP Cypress, DEU Germany, FRA
France, GBR United Kingdom, IRL Ireland, JPN Japan, KOR South Kore~, LUX Luxembourg, NLD Netherlands, NOR Norway, SGP Singapore, TWN Taiwan, USA
1 of savings, returns on investment, and inheritance over the years.
United States. Data source: Lakner and Milanovic (2013).
fiscal units, while incomes discussed here are after taxes and are
calculated across individuals.17 (Fiscal data cannot be used to calculate the top 1 percent share globally because fiscal data are available
only for a relatively small subset of countries.) The big~est difference between the two data sources is the use of market, that ts, pre-transfer . and pre-tax, income by WTID rather than disposable, that is after-tax, .
income as used in household surveys. The share of the top l percent will always be greater in terms of market income than disposable
income because government redistribution reduces inequality. For
example, redistribution via government transfers and direct taxes in
the United States in 2010 reduced the share of the top l percent from 9.4 percent of total market (or "pre-fisc") income to less. than
7 percent of total ~isposable income.18 (It should also be mentioned
38 GLOBAL INEQUALITY
Wealth inequality is greater than inequality of income or consumption
in almost every country. Not only are there tiny groups of enormously
wealthy people-a pheno~enon on which we shall focus in the next section-but even in the advanced countries (say, the United States
or Germany), between a quarter and one-third of the population has
negative or zero net wealth.19 But very few people in these countries have zero income, and no one has zero consumption: Thus it can be seen even at an intuitive level that wealth must be much more un-
equally distributed than income or consumption, and that comparisons between wealth inequality and income inequality have to be
made very carefully.20 It is because the wealth data for the super-rich
are of better quality (and to some extent more revealing) than the income data for the top 1 percent that we use wealth data rather than
income or consumption data to shed light on the position of the
super-wealthy. 21
To see the difference between income and wealth distributions on
the global level, consider Table 1.1, which shows estimates of the in-
1. The Rise of the Global Middle Class and Global Plutocrats 39
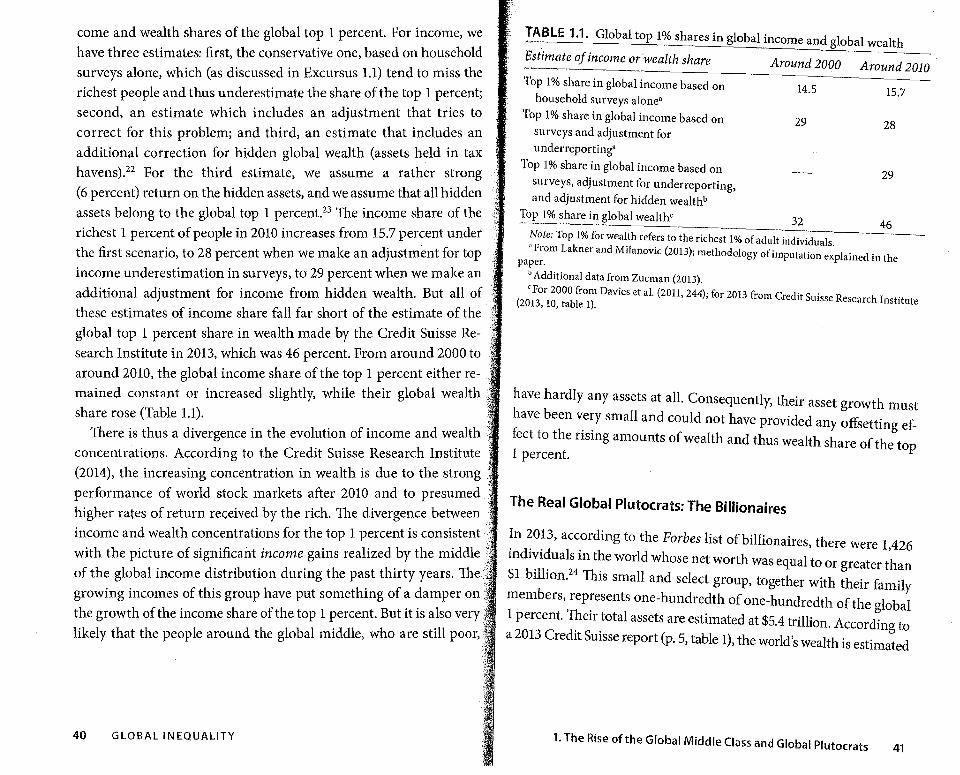
come and wealth shares of the global top 1 percent. For income, we have three estimates: first, the conservative one, based on household surveys alone, which (as discussed in Excursus 1.1) tend to miss the richest people and thus underestimate the share of the top 1 percent; second, an estimate which includes an adjustment that tries to correct for this problem; and third, an estimate that includes an additional correction for hidden global wealth (assets held in tax havens).22 For the third estimate, we assume a rather strong (6 percent) return on the hidden assets, and we assume that all hidden assets belong to the global top 1 percent.23 The income share of the richest 1 percent of people in 2010 increases from 15.7 percent under the first scenario, to 28 percent when we make an adjustment for top income underestimation in surveys, to 29 percent when we make an additional adjustment for income from hidden wealth. But all of :; these estimates of income share fall far short of the estimate of the (J global top 1 percent share in wealth made by the Credit Suisse Re- ;? search Institute in 2013, which was 46 percent. From around 2000 to around 2010, the global income share of the top 1 percent either remained constant or increased slightly, while their global wealth { share rose (Table 1.1). '.
' There is thus a divergence in the evolution of income and wealth f concentrations. According to the Credit Suisse Research Institute (2014), the increasing concentration in wealth is due to the strong performance of world stock markets after 2010 and to presumed higher rates of return received by the rich. The divergence between ,. income and wealth concentrations for the top 1 percent is consistent
with the picture of significant income gains realized by the middle of the global income distribution during the past thirty years. The· growing incomes of this group have put something of a damper on the growth of the income share of the top 1 percent. But it is also likely that the people around the global middle, who are still poor,
40 GLOBAL INEQUALITY
!~BLE 1.1. Global top 1% shares in global income and global wealth
Bslimate of income or wealth share Around 2000 Around 2010
Top 1% share in global income based on household surveys alone•
Top 1 % share in global income based on surveys and adjustment for underreporting"
Top 1 % share in global income based on surveys, adjustment for underreporting, and adjustment for hidden wea!thb
'.~op 1% share in global weaJthc
14.5
29
32
15.7
28
29
46 Note: Top 1 % for wealth refers to the richest 1 % of adult individuals. "From Lakner and Milanovic (2013); methodology of imputation explained in the
paper.
b Additional data from Zucman (2013).
'For 2000 from Davies et al. (2011, 244); for 2013 from Credit Suisse Research Institute (2013, 10, table 1).
have hardly any assets at all. Consequently, their asset growth must
have been very small and could not have provided any offsetting effect to the rising amounts of wealth and thus wealth share of the top 1 percent.
The Real Global Plutocrats: The Billionaires
In 2013, according to the Forbes list of billionaires, there were 1,426 individuals in the world whose net worth was equal to or greater than
$1 billion.24
This small and select group, together with their family members, represents one-hundredth of one-hundredth of the global 1 percent. Their total assets are estimated at $5.4 trillion. According to a 2013 Credit Suisse report (p. 5, table 1), the world's wealth is estimated
1. The Rise of the Global Middle Class and Global Plutocrats 41
~ §. d hat a number such as one billion ~ ~ It is very difficult to comprehen w . al ex erience of ~ ~ A billion dollars is so far outside the usu p ~ I ;r:l~i:~l:n:~erybody on earth thatt_h~ very q~:~~::::~~~;~:::\t I ~ easily understood-other than that it is a very ose that a good ~ ~ . ht help to think of it in the following manner. Supp ~ § m1g h d How much time would elapse ~ ~ f . ve you one dollar eac secon . § ~ airy ga . . d then $1 billion? For the former, you ~ ~ before you collected $1 m1ll1on, an . Or look at ~ § Id need 11.4 days; for the latter, almost thirty-two year~. . $1 ~ ~ wou w that you inherited either ~ § tion side Suppose no l:\ § it from the consump · d It would take ~ ~ million or $1 billion, and that you spent $1,00~ eve? ay. . the first ~ , ~ through your mhentance m ~
I you less ~h;:::~:~:~;~~oy~~~s (that is, the time that separates us frhom I ~ case, an . . d case. or take t e ~ I Homer's Iliad) to blow your inhentance m the s~~~:n in $100 bills ~ § blem faced by drug lords. To transport $1 m1 ~ ~ pro . s a medium-sized briefcase. To ferry $1 billion in the same d ~ ~ ~ require . h d uch briefcases. Even if you use a ~ ~ ~ banknotes would require a t ousan s f h And ~ :~ ~ . would need about five hundred o t em. . ~ .. · ~ big ~ollefir-bahg~~~~ed suitcases would attract attention that you might ~ § buying ve ~ ~ . ~ § prefer to avoid. §
l''*'"''"''"'''*''"''*'"'''*''"'"'''"''''"''*'''''"''"''"''"''*'''*'"''*''*'''"'"''"''"'''''*'''"'"''"'''''"''"'"''"'''"''""''''"'"''"'''''*''~
· oup of individuals >': . . Th" eans that this super-tmy gr . } at $241 tnlhon. ism ent of world wealth. To put it , and their families control~ about 2 pe~c uch wealth as exists in ;; differently, these billionaires own twice as m •!
all of Africa. . h changed during glo-~ How much has the wealth of the super-nc . te means!
, 11. . e us a good approx1ma l b l' t' n? Forbess annua ists giv h t . .
a iza IO • . is im ortant to realize, however, t a m. to answer that question'. It. p b 1 te level of wealth that gradu-. such lists, the cut-off po mt is an a so u
42 GLOBAL INEQUALITY
ally declines in real terms if there is inflation. Thus, a registered in
crease in the number of such individuals is in part spurious, due simply to the lowering of the real threshold. Methodologically, this "wealth line" is identical to the poverty line: in principle, we would like to fix the poverty (or wealth) line in real terms and then check to see if the number of individuals, or their share in the total popu
lation, has gone up or down. This is indeed what we routinely do for poverty lines. Here, we have to do the same for the wealth line. In order to fix the wealth line in real terms, we use the US Consumer Price Index (CPI). Very conveniently, it turns out that the wealth line of $1 billion in 1987, when Forbes started publishing its global wealth lists, is equivalent in real terms to a wealth line of $2 billion in 2013 (the US price index having exactly doubled over this period). For simplicity's sake, let's call the people above that constant real level ($1 billion in 1987 prices) the hyper-wealthy or the
hyper-rich. Until 1992, Forbes published two separate lists: one of the four
hundred richest Americans (which began in 1982), and another of global billionaires (started in 1987). In 1987, there were 49 billionaires in the United States and 96 billionaires in the rest of the world (thus in total there were 145 such individuals). Forbes did not calculate their combined wealth, but it may be estimated at $450 billion. 25
'These two numbers (145 hyper-wealthy people and $450 billion) from
1987 are what we will use to compare with the number and wealth of bi-billionaires (that is, people with net wealth in excess of $2 billion) in 2013. Conveniently, these two dates (1987 and 2013) bracket almost the same period from which we have hot1sehold survey data (1988 to 2011) and thus allow us to look at what happened both on the income and the wealth sides.
In 2013, the number of bi-billionaires was 735, and their total wealth was $4.5 trillion (equivalent to $2.25 trillion in 1987 prices). 'Thus, both the number of hyper-wealthy people and their combined
1. The Rise of the Global Middle Class and Global Plutocrats 43