Embed Size (px)
Citation preview

American University in Cairo American University in Cairo
AUC Knowledge Fountain AUC Knowledge Fountain
Theses and Dissertations Student Research
6-1-2012
Context-aware goal-oriented business process modeling Context-aware goal-oriented business process modeling
Mariam Armia Keriakos Sawers
Follow this and additional works at: https://fount.aucegypt.edu/etds
Recommended Citation Recommended Citation
APA Citation Keriakos Sawers, M. (2012).Context-aware goal-oriented business process modeling [Master's Thesis, the American University in Cairo]. AUC Knowledge Fountain. https://fount.aucegypt.edu/etds/1203
MLA Citation Keriakos Sawers, Mariam Armia. Context-aware goal-oriented business process modeling. 2012. American University in Cairo, Master's Thesis. AUC Knowledge Fountain. https://fount.aucegypt.edu/etds/1203
This Master's Thesis is brought to you for free and open access by the Student Research at AUC Knowledge Fountain. It has been accepted for inclusion in Theses and Dissertations by an authorized administrator of AUC Knowledge Fountain. For more information, please contact [email protected].

1
The American University in Cairo
School of Science and Engineering
Context-Aware Goal-Oriented Business Process Modeling
A Thesis Submitted to
Department of Computer Science and Engineering
in partial fulfillment of the requirements for
the degree of Master of Science
by Mariam Armia Keriakos Sawers
B.Sc. Computer Science, AUC, February 2007
under the supervision of
Dr. Hoda M. Hosny, Professor
and
Dr. Sherif G. Aly, Associate Professor
May 2012

2
Acknowledgements I would like to thank all the people who helped me in order to bring this research to light with their advice,
guidance, contribution, technical and business consultation, support or criticism. There were many people who were
involved in this research work. From AUC, my advisors: Dr. Hoda Hosny and Dr. Sherif Gamal Aly, who made a
major and significant contribution to this work. Their guidance, ideas and suggestions have been invaluable
throughout this challenging research journey. They supplied me with unlimited support and were very generous with
their time and devotion to this project. The internal reviewers Dr. Sherif El-Kassas and Dr. Awad Khalil, provided
valuable criticism in the proposal and in validating the research idea. From the University of Copenhagen, Denmark:
Dr. Jackob Bardram and Mr. Stanzo Karolly who helped in understanding the Java Context-awareness Framework
developed by Dr.Bardram and extending it. From the University of Queensland, Australia: Dr.Michael Rosemann
and Mr. Karsten Ploesser who shared with me their thoughts and contemporary research work in conceptualizing
business process context.
I would like to thank my friend and my manager Sylvana Mounir for her cooperation and consideration of my work
commitments during the write-up period of this thesis and also for her continuous support and consultation on how
to evaluate the success of business decisions and business strategies. I would like to thank all my family members:
my mother, Enas Azmy, my father, Armia Keriakos Sawers , my grandmother, Nadia Nessim and my late
grandfather, Azmy Mancy. They provided me with invaluable and unlimited moral support without which this final
moment would not have been possible. Thanks are also due to Mrs. Mervat El Alfy (Head of British Airways office
in Egypt) and Mr. Jerome Fromager (Head of Innovation and Technology in Orange group) for providing their
domain expertise on the runs of the contextual cases and their valuable opinions and advices on the business process
alternative decisions.

3
Abstract
University Name: The American University in Cairo
Thesis Title: Context-Aware Goal-Oriented Business Process Modeling
By: Mariam Armia Keriakos Sawers
Supervisors: Dr. Hoda M. Hosny, Professor and Dr. Sherif G.Aly, Associate Professor
Informed decision making and flexibility have grown to be important standard requirements in the field of business
process modeling and design due to the emergence of intrinsically complex variables within the business
environment. Traditionally, researches on business process modeling and informed decision making have focused on
the configurability of business process models. Our review of literature made us realize that researchers in this field
have considerably neglected the main drivers of flexibility and decision-making which have an extensive impact on
business process flow. Such drivers form, in our opinion, cross cutting concerns that need to be extracted from
within the context of the business process. Context can include, but is not limited to, work force availability, work
force experience, system failures, weather conditions, environmental hazards, and financial constraints. In this
research we present a new general purpose methodology for aspectized modeling of the context of business
processes within the different business domains and also for modeling business processes as goal-oriented finite
state machines. Being dependent on context-awareness and goal-orientation, our method deduces recommendations
for improving the business process flow. We envisioned how context may be conceptualized, how contextual
elements may be distributed across business operational levels according to the goals of the business process, and
how business process flow recommendations based on the aspectized contextual facts may materialize. We managed
to make our vision concrete by implementing all this into a prototypical framework that made the methodology both
usable and testable. We tested our framework within the Airlines and Telecom business domains. The experimental
results showed significant improvement in the financial costs and execution time. The results proved the importance
of integrating context-awareness, context-modeling and goal-orientation in the field of business process modeling as
well as configuration and decision making. By adopting context-awareness based on modern technology we believe
that this research is a contribution in the field of intelligent business environments and that it opens the door for
more challenging extensions on more complex goal-oriented business processes.

4
Table of Contents Acknowledgements ....................................................................................................................................................... 2
Abstract.......................................................................................................................................................................... 3
Chapter 1: Introduction ................................................................................................................................................ 10
1.1. Related Research Disciplines ..................................................................................................................... 11
1.1.1. Business Process Modeling ............................................................................................................... 11
1.1.2. Context-awareness ............................................................................................................................. 12
1.1.3. Aspect Orientation ............................................................................................................................. 13
1.2. Research Problem and Motivation ............................................................................................................. 14
1.3. Thesis Statement ........................................................................................................................................ 15
1.4. Highlights of our Solution Approach ......................................................................................................... 16
Chapter 2: Research background ................................................................................................................................. 17
2.1. Aspect Orientation ..................................................................................................................................... 17
2.1.1. Aspectization Techniques .................................................................................................................. 17
2.1.2. Open Aspects ..................................................................................................................................... 18
2.1.3. Aspect Oriented Modeling Based on Behavior Context .................................................................... 19
2.1.4. Aspects as Libraries ........................................................................................................................... 19
2.1.5. Aspect Oriented Paradigm and Business Process Modeling ............................................................. 19
2.2. Context-awareness: State of the Art ........................................................................................................... 20
2.2.1. Disciplines of Context-awareness ............................................................................................................. 20
2.2.2. Context-awareness Frameworks ............................................................................................................... 21
2.2.3. Context Description & Structure ............................................................................................................... 24
2.2.4. Different Context Modeling Techniques ........................................................................................... 27
2.2.5. Context Modeling Using UML ......................................................................................................... 30
2.3. Business Process Configuration Models .................................................................................................... 31
2.4. Previous Case Studies ................................................................................................................................ 33
Chapter 3: Solution Methodology and Framework Specifications .............................................................................. 34
3.1. The Solution Methodology ........................................................................................................................ 34
3.1.1. Context Sensation, Identification and Modeling ............................................................................... 34
3.1.2. Context Classification ....................................................................................................................... 36
3.1.3. Business Goals Definition ................................................................................................................. 41
3.1.4. Business Process Modeling and Configuration ................................................................................. 41
3.1.5. System Architecture .......................................................................................................................... 45
3.2. Framework Specifications .......................................................................................................................... 48
3.2.1. Knowledge Base ................................................................................................................................ 48

5
3.2.2. Knowledge Base Architecture ........................................................................................................... 63
3.2.3. Context Detection and Business Process Configuration .................................................................... 67
3.2.4. Simulation ....................................................................................................................................... 103
3.2.5. Example ........................................................................................................................................... 107
3.2.6. Tools Used in building the prototypical framework ........................................................................ 108
3.3. Sources of Flexibility in the Solution Methodology ................................................................................ 108
3.4. Challenges Faced ..................................................................................................................................... 109
Chapter 4: Results and Analysis ................................................................................................................................ 111
4.1. The Evaluation Methodology ................................................................................................................... 111
4.2. The Evaluation Criteria ............................................................................................................................ 113
4.2.1. Financial Cost of the Business Process ........................................................................................... 114
4.2.2. Performance of the Business Process (Time/Throughput) .............................................................. 115
4.2.3. Measuring the Overall Effectiveness of the Solution Methodology ................................................ 116
4.3. Effectiveness Guarantee ........................................................................................................................... 117
4.4. Experimental Results and Analysis .......................................................................................................... 118
4.4.1. Airlines Industry Experiments ......................................................................................................... 118
4.4.2. Airlines Industry Experiments Results Summary and Analysis ...................................................... 136
4.4.3. The Telecom Industry Experiments ................................................................................................ 143
4.4.4. Telecom Experimental Results Summary and Analysis .................................................................. 157
Chapter 5: Summary and Conclusion ........................................................................................................................ 172
5.1. Summary of the Research ........................................................................................................................ 172
5.1.1. Context Sensation, Identification and Modeling ............................................................................. 172
5.1.2. Context Classification ..................................................................................................................... 172
5.1.3. Business process modeling and configuration ................................................................................. 173
5.2. Summary of Experimental Results ........................................................................................................... 175
5.3. Challenges Faced ..................................................................................................................................... 176
5.4. The Research Contributions ..................................................................................................................... 177
5.5. Future Work ............................................................................................................................................. 179
Appendices ................................................................................................................................................................ 182
Appendix I ............................................................................................................................................................. 182
Appendix II ........................................................................................................................................................... 183
Appendix III .......................................................................................................................................................... 184
Appendix IV .......................................................................................................................................................... 186
Appendix V ........................................................................................................................................................... 208
Appendix VI .......................................................................................................................................................... 241

6
References ................................................................................................................................................................. 246
Tables
Table 1, Company Goals Matrix ................................................................................................................................. 57 Table 2, an Example of a Company Goals Matrix ....................................................................................................... 66 Table 3, Generic Context Item Class Attributes .......................................................................................................... 69 Table 4, Generic Context Item Class Methods ............................................................................................................ 70 Table 5, Contextual Aspects and Layers Matrix .......................................................................................................... 74 Table 6, Context Classifier Class Attributes ................................................................................................................ 76 Table 7, Context Classifier Class Methods .................................................................................................................. 77 Table 8, Company Class Attributes ............................................................................................................................. 79 Table 9, Company Class Methods ............................................................................................................................... 80 Table 10, Goals Matrix Template ................................................................................................................................ 82 Table 11, Goals Matrix Class Attributes ..................................................................................................................... 82 Table 12, Goals Matrix Class Methods ....................................................................................................................... 82 Table 13, Goal Class Attributes ................................................................................................................................... 83 Table 14, Goal Class Methods ..................................................................................................................................... 83 Table 15, Business Process Class Attributes ............................................................................................................... 85 Table 16, Business Process Class Methods ................................................................................................................. 86 Table 17, Step State Class Attributes........................................................................................................................... 91 Table 18, Step State Class Methods ............................................................................................................................ 92 Table 19, Condition Class Attributes ........................................................................................................................... 93 Table 20, Condition Class Methods ............................................................................................................................. 93 Table 21, Transitional Condition Class Attributes ...................................................................................................... 95 Table 22, Transitional Condition Class Methods ........................................................................................................ 96 Table 23, Cost Class Attributes ................................................................................................................................... 97 Table 24, Cost Class Methods ..................................................................................................................................... 97 Table 25, Business Process Goals.............................................................................................................................. 133 Table 26, Business Process Definition & Recommendations Example ..................................................................... 133 Table 27, Business Process Cost ............................................................................................................................... 135 Table 28, Check-in Process Results Summary .......................................................................................................... 137 Table 29, Pay Bill Process Cost ................................................................................................................................. 156 Table 30, Pay Bill Experimental Results Summary ................................................................................................... 158 Table 31, Context Case 1 .......................................................................................................................................... 209 Table 32, Run 1 Case 1 Outcome .............................................................................................................................. 210 Table 33, Case 1 Run 2 Results ................................................................................................................................. 211 Table 34, Case Two Contextual Situation ................................................................................................................. 213 Table 35, Run 1 Case 2 Results ................................................................................................................................ 213 Table 36, Run 2 Case 2 Results ................................................................................................................................ 214 Table 37, Contextual Situation 3 ............................................................................................................................... 216 Table 38, Run 1 Case 3 Results ................................................................................................................................ 217 Table 39, Case 4 Contextual Situation....................................................................................................................... 219 Table 40, Run 1 Case 4 Results ................................................................................................................................. 219 Table 41, Contextual Situation Case 5 ....................................................................................................................... 221 Table 42, Run 1 Case 5 Results ................................................................................................................................. 222

7
Table 43, Case 5 Run 2 Results ................................................................................................................................ 223 Table 44, Run 3 Case 5 Results ................................................................................................................................. 223 Table 45, Contextual Situation 6 .............................................................................................................................. 226 Table 46, Run 1 Case 6 Results ................................................................................................................................ 226 Table 47, Run 2 Case 6 Results ................................................................................................................................. 227 Table 48, Contextual Case 7 ...................................................................................................................................... 229 Table 49, Run 1 Case 7 Results ................................................................................................................................ 229 Table 50, Contextual Case 8 ..................................................................................................................................... 230 Table 51, Run 1 Case 8 Results ................................................................................................................................. 231 Table 52, Run 2 Case 8 ............................................................................................................................................. 232 Table 53, Run 3 Case 8 Results ................................................................................................................................. 233 Table 54, Contextual Case 9 ..................................................................................................................................... 234 Table 55, Run 1 Case 9 Results ................................................................................................................................ 235 Table 56, Contextual Situation 10 ............................................................................................................................. 236 Table 57, Run 1 Case 10 Results .............................................................................................................................. 237 Table 58, Run 2 Case 10 Results ............................................................................................................................... 238 Table 59, Run 3 Case 10 Results ............................................................................................................................... 239 Table 60 , Run 4 Case 10 Results .............................................................................................................................. 240 Table 61, Bill Payment Business Process Recommendations Details ....................................................................... 245

8
Figures
Figure 1: Context-aware Frameworks Comparison (Adapted from Baldauf , 2007 [43]) ........................................... 22 Figure 2: JCAF Runtime Infrastructure (Adapted from Jakob E. Bardram , 2005 ([28]))........................................... 24 Figure 3:Onion Model for identifying BP Context (Adapted from Rosemann et al., 2008 [55]) ................................ 25 Figure 4:Procedure for context identification (Adapted from Rosemann et al., 2008 [55]) ........................................ 28 Figure 5: The Meta model for RBPM (Adapted from Nurcan et al., 2009 [47]) ......................................................... 29 Figure 6:Onion Model for identifying BP Context (Adapted from Rosemann et al., 2008 [55]) ................................ 37 Figure 7: Industry Repository ...................................................................................................................................... 39 Figure 8: Business Process Repository ........................................................................................................................ 40 Figure 9: Check-in Business Process Example ............................................................................................................ 42 Figure 10: The Prototypical Framework Architecture ................................................................................................. 45 Figure 11: Industry Definition Initial Form ................................................................................................................. 49 Figure 12: Industry Context Classification .................................................................................................................. 49 Figure 13: Industry Contextual Variables ................................................................................................................... 50 Figure 14: Company Initial Definition ........................................................................................................................ 52 Figure 15: Company Strategic Goals Definition ......................................................................................................... 52 Figure 16: Company Operational Goals Definition ..................................................................................................... 53 Figure 17: Company Strategic Goals Definition ......................................................................................................... 53 Figure 18: Ability to re-use predefined goals .............................................................................................................. 54 Figure 19: Goals to Contextual Layers Association .................................................................................................... 54 Figure 20: Company General Structure ....................................................................................................................... 55 Figure 21: Company Example ..................................................................................................................................... 56 Figure 22: Check-in Business Process as Finite State Machine .................................................................................. 59 Figure 23: Business Process Definition - Goals Stage ................................................................................................. 60 Figure 24: Business Process Definition - Steps Stage ................................................................................................. 61 Figure 25: Business Process Transitional Conditions Definition ................................................................................ 62 Figure 26: Knowledge Base Structure ......................................................................................................................... 64 Figure 27: GenericContextItem Class .......................................................................................................................... 68 Figure 28 : Context Aspect Example ........................................................................................................................... 72 Figure 29: Contextual Layers Relationships ................................................................................................................ 72 Figure 30: Company General Structure ....................................................................................................................... 78 Figure 31: Graphical Representation of the Goals Matrix ........................................................................................... 81 Figure 32: Business Process as Finite State Machine .................................................................................................. 84 Figure 33: Contextual Transition Condition Definition ............................................................................................... 90 Figure 34: Industry Knowledge ................................................................................................................................... 99 Figure 35: Company Goals Matrix ............................................................................................................................ 100 Figure 36: Relationship between Context and Goals ................................................................................................. 101 Figure 37: Business Process and Transitions ............................................................................................................. 102 Figure 38: JCAF Architecture (Adapted from Bardram, 2005 [28]) ......................................................................... 105 Figure 39: Context Acquisition in JCAF Architecture (Adapted from Bardram, 2005 [28]) .................................... 105 Figure 40: Entity and Context Relationship in JCAF Architecture (Adapted from Bardram, 2005 [28]) ................. 106 Figure 41: Business Process Configuration Example ................................................................................................ 107 Figure 42: Knowledge Definition Process ................................................................................................................. 111 Figure 43: Business Process Simulation .................................................................................................................... 112 Figure 44: Context Aspects Classification ................................................................................................................ 119 Figure 45: Immediate Context Layer Tree ................................................................................................................ 120 Figure 46: Internal Context Layer Tree ..................................................................................................................... 121 Figure 47: External Context Layer Tree .................................................................................................................... 122

9
Figure 48: Environmental Context Layer Tree .......................................................................................................... 123 Figure 49: Company Goals Matrix ............................................................................................................................ 125 Figure 50: Immediate Context Goals ......................................................................................................................... 126 Figure 51: Internal Context Goals ............................................................................................................................. 127 Figure 52: External Context Goals ............................................................................................................................ 128 Figure 53: Environmental Context Goals .................................................................................................................. 129 Figure 54: Business Process Goals ............................................................................................................................ 130 Figure 55: Check-in Business Process ....................................................................................................................... 131 Figure 56: Airlines Cost Reduction Results Summary .............................................................................................. 139 Figure 57: Airlines Industry Time Saving Results .................................................................................................... 141 Figure 58: Telecom Industry Context ........................................................................................................................ 144 Figure 59: Telecom Industry- Immediate Context Layer Items ................................................................................. 145 Figure 60: Telecom Industry- Internal Context Layer Aspects and Elements ........................................................... 146 Figure 61: Telecom Industry- External Context Aspects and Elements .................................................................... 147 Figure 62: Telecom Industry Environmental Context Aspects and Elements ........................................................... 148 Figure 63: Telecom Company Goals Matrix ............................................................................................................. 149 Figure 64: Telecom Immediate Context Goals .......................................................................................................... 150 Figure 65: Telecom Internal Context Goals .............................................................................................................. 151 Figure 66: Telecom External Context Goals ............................................................................................................. 152 Figure 67: Telecom Environmental Context Goals ................................................................................................... 153 Figure 68: Bill Payment Business Process ................................................................................................................ 155 Figure 69: Telecom Business Process Cost Variance Summary ............................................................................... 167 Figure 70: Telecom Business Process Execution Time Variance Summary ............................................................. 169

10
Chapter 1: Introduction Business process modeling has been an important area of research for a number of years due to the need for
simulating and automating business processes in the software industry. The flexibility of business processes has
been a strong motivation for many researches as it offers a means to make business process models both
configurable and adaptive. Flexibility is defined as the capability to change without loss of identity [53]. The need
for business process flexibility stems from the variance in the context of application of the same business process.
The context of a process is basically defined as the surrounding conditions of a business process that cause alteration
in its behavior [55]. These surrounding conditions or “context” in our view is a collection of cross cutting concerns
which affect the decisions that should be taken and hence directly affect the business process flow and may enforce
certain key decisions or customizations on the business model. The changes that are made throughout the process
lifecycle can be wider than just changes in the process flow. Changes can be classified according to the handling
procedures which are divided into substitution, adaptation and evolution of business processes/sub processes
[32][21][31]. Adopting context-awareness and advanced context-modeling; representing context in terms of aspects
as well a goal driven modeling of business processes are therefore critical for process change strategies. Despite, the
growing importance of the business process context and the advantages of its aspectization, it has not yet drawn
researchers’ attention. Most researches involving context-awareness focused on pervasive systems and mobile
computing. So far neither the aspectization of business process nor contextual business items in general have been
considered. In this research we focus on modeling business process context (as aspects) within the business
processes and on modeling the goals of business processes. Our research aim is to enrich the field of business
process modeling by taking advantage of context-modeling, aspectization and goal-orientation for more effective
decision-making within the business processes.
In the rest of this introductory chapter we first brief the reader about the different research domains that our
research overlaps with which are business process modeling, context-awareness and aspect oriented development.
We then briefly explain our research idea and the motivation behind it to give the reader a basic understanding of
what we are aiming at.

11
1.1. Related Research Disciplines
1.1.1. Business Process Modeling
Business process modeling has lately become an active area of research. The definition of business process varied
between two main definitions the first is that a business process is a collection of activities that takes one or more
kinds of inputs and creates an output that is of value to the customer [20] and the other definition is a chain of
activities whose final aim is the production of a specific output for a particular customer or market [8] . Since the
emergence of the business process definition, the idea of business process modeling emerged and many techniques
emerged to model business processes [31].
Business process modeling is defined as the activity of representing processes of an enterprise, so that the current
process may be analyzed and improved in the future [9]. It addresses the process aspects as business architecture,
thus leading to an all-encompassing enterprise architecture. Business process modeling is integral to business
process management and re-engineering of a business process could achieve higher business efficiency [9].
Many languages and notations emerged in the last few years. One of these languages is business process modeling
notation (BPMN) which is a graphical representation for specifying business processes in a workflow [38]. The aim
behind BPMN was to provide a notation that is readily understandable. BPMN is also supported with an internal
model that enables the generation of executable code called BPEL (which bridges the gap between BP design and
implementation). BPMN defines a business process diagram (BPD), which is based on a flowcharting technique , a
business process model, is a network of graphical objects, which are activities (i.e., work tasks) and the flow
controls that define their order of performance. BPMN is usually used in representing collaborative (public)
business to business processes and internal (private) business processes [37].
Another language for business process modeling which supports configurability of business processes is Event
Driven Process Chains (EPC). EPC is a BPM technique used for analyzing processes for the purpose of Enterprise
Resource Planning (ERP) implementation. EPCs are directed graphs, which visualize the control flow and consist of
events, functions and connectors [13].
The most famous language for business process modeling is the Unified Modeling Language (UML). UML is used
to specify, visualize, modify, construct and document the artifacts of an Object Oriented software intensive system
under development. UML supports different kinds of diagrams that can represent various aspects of a business

12
process representation. It supports using structure diagrams (class, component, and deployment diagrams), behavior
diagrams (Activity, state machine and use case diagrams), and interaction diagrams (Sequence, Timing and
Communication diagrams) [13].
In our solution methodology we used the concept of UML state machines. The business process is represented as a
sequence of states and the flow from one state to another depends on transitional conditions between states. The
transitional condition depends on the output of the state and the contextual surroundings affecting the current step.
Each step is tightly bound to goals to make our solution goal-oriented and according to the goals of the step we
identify which contextual surroundings needs to be considered within this step’s transitional condition.
1.1.2. Context-awareness
Context is simply defined as implicit situational information[3]. The concept of context consideration stems from
the ancient idea of processing language or understanding what a certain human being is saying within its context.
The idea of the need to use context for a better design of applications and the context-awareness term were coined
by Schilit and Theimer [59] as approaches for incorporating contextual factors into various systems, such as in the
area of Mobile applications. Schilit and Theimer[59] considered context as location, identities of nearby people and
objects and changes happening to those objects. They typically focus on users and their interaction with the systems
[10] [59].
There are other definitions of context which perceive the context as elements of the user environment which a
computer can detect or have knowledge of [14]. Hull et al [22] perceive the context to be the aspects of a current
situation. The definitions of context are numerous, however within our research we consider the context as all the
surroundings of a business process from direct resources required to execute it, to company strategy in which it runs
to industry and country regulations affecting it and we represent context in terms of aspects.
Context-awareness exists in many other disciplines other than business process modeling and has received much
attention in these areas e.g. Web-based systems [33][19][12], Mobile applications [39] and conceptual modeling[2]
[55]. They typically focus on users and their interaction with the systems [10] [59]. Existing frameworks (such as
the ECOIN framework [16]) attempt to represent context as properties that can be interpretation-based either on the
inbuilt framework structures or based on a generic ontology that has no structure prior to design time. Almost all

13
context-aware frameworks currently available in the market and even developed for research purpose were coined
within the field of pervasive systems and its applications (e.g. smart hospitals and smart homes). The main problem
with most of these context-aware frameworks is that they are focused on pervasive systems and mobile entities, that
they lack customization for context of business processes and that they are not open source so their usage or
extension should be under the supervision of their developers.
1.1.3. Aspect Orientation
Aspect oriented software development (AOSD) is a relatively new emerging technology and methodology [5] [65].
The general purpose of AOSD is the modularization and separation of crosscutting concerns in software. AOSD
allows multiple concerns to be expressed separately and automatically unified into working systems. The focus of
Aspect-Oriented Software Development (AOSD) is in the investigation and implementation of new structures for
software modularity that provide support for explicit abstractions to modularize concerns. Aspect-Oriented
Programming approaches provide explicit abstractions for the modular implementation of concerns in design, code,
documentation, or other artifacts developed during the software life-cycle. These modularized concerns are
called aspects, and aspect-oriented approaches provide methods to compose them. Various approaches provide
different flexibility with respect to composition of aspects. Away from the field of computer science and
programming aspects could be thought as a mindset or a methodology for thinking of different variables in terms of
cross cutting concerns that affect different processes in life. For example, within the business processes domain you
can think of quality as an aspect of business processes because quality assurance is a cross cutting concern that
affects all the business processes of an organization. Another example, in a software program you can think of
security as an aspect of the program as it is a cross cutting concern that affects all the functionalities and classes
within the program. Despite the intuitiveness of representing business process surroundings (context) in terms of
cross cutting concerns (aspects), research in AOSD focused mainly on concerns related to logging, tracing,
debugging, security and program verification [18][40][41] and little research was done on aspectization of scenario
based requirements modeling[67]. Other crucial areas of research like business process modeling and context-
awareness which incorporate cross cutting concerns have yet to be discovered and this is one important contribution
of our research work.

14
1.2. Research Problem and Motivation With the growing number of variables and concerns involved in the decision-making process of any sizable
business, designing and adapting business processes is becoming a very complicated task. Within the business
domain, concerns surrounding the environment where the processes are being executed give indications that are
essential for a business process-related decision. For example if a certain airline company knows that there is a high
probability of weather problems on a specific day, this would normally affect the business processes of take-off and
landing and if there is a problem in check-in counters, this would very likely change the behavior of the check-in
process. If the context of a business process is aspectized and modeled efficiently, this will provide a stronger cause-
effect relationship between the demands for process flexibility and their impact on processes and vice versa[55].
Hence, the business processes would be able to automatically change their behavior as if the decision makers were
present to analyze the situation and give an immediate solution. For more complex problems where human
intervention is a must, knowing the aspects that are affected would help decision-makers better analyze the situation
and take important decisions which would save time, effort and money. Representing context variables as aspects is
an important addition to the world of business process modeling and context-awareness for the following reasons:
1) Modularization of contextual elements/items allows for reuse of the same context elements in different kinds of
business process and in different business domains.
2) The dynamic nature offered by the open Aspects concept of the adaptation model. This allows the weaving of
events and advices/actions to take place at run time which is most appropriate for the dynamic environments in
which most business processes run.
3) The concept of aspects/cross cutting concerns is more appealing to business people and business process experts
than the idea of a process, in business process management, away from the world of computing and software.
Business decision-makers always consider aspects before making a decision but the term and idea of context is
more distant from the business world.
Today many business process modeling and management frameworks/tools exist, but they do not adequately
support the context-based definition and configuration of business process variants. As a result, the process of
adaptation of business processes in such tools is time consuming and error prone [21]. In the current business
process modeling tools, the process models are disconnected from the relevant context in which they are valid and
there is often no traceability to the situation in which the process should take place [55].

15
As a result, the decisions related to changes in the flow of a business process are taken manually and usually at a
late stage after identifying a major contextual variance in the environment of the business process. This could lead to
faulty decision-making due to contextual ignorance or right decision-making at a late stage, and in both cases, the
outcome is degraded efficiency in the business process management and consequently unnecessary financial costs
which could be avoided. In this research work, we propose a new methodology that enables business process experts
to model context-aware, aspectized and configurable goal-driven business processes which change their flow and
decision according to contextual information obtained from the ambient surrounding of the business process
environment. Our solution approach is to extend an existing context-awareness framework by adding Aspects for
business contextual elements apriori then use the aspectual facts modeled as decision making criteria for business
process modelers to add contextual intelligence to the modelers. The main drivers of our research idea in addition to
business process flexibility for large scale business decision making is pioneering in the field of using context-
awareness in the field of intelligent business process configuration based on a tight goals connection. Moreover, we
try to provide a generalized solution approach that is extensible and generic enough to fit a variety of business
domains.
1.3. Thesis Statement Our objective from this research work is introducing a solution methodology for customizable context-aware, goal-
oriented business process models. Our work extends on the existing framework built to detect context-awareness for
mobile computing and represents the following contextual aspects:
a. Non human resource utilization
b. Human resource utilization
c. Human resource experience level
d. Organizational strategies (The strategies of the organization in which the business process is running (e.g.
whether the strategy is cost cutting or quality focused)
e. The risk factors associated with a process
f. Industry regulations and practices affecting a process
g. Timing/Season of process execution

16
We translate the above aspects into appropriate configuration decisions related to the business process which would
have to be affected by these contextual aspects. The relationship between a business process and context is based on
common goals that the context might affect leading to a totally goal-oriented model of context and business
processes. This goal-orientation helps us to assess the effectiveness of the solution methodology. We developed a
prototypical implementation of the framework as a proof of concept for the validity of our new solution
methodology.
1.4. Highlights of our Solution Approach
In this research work we developed a solution methodology based on sensation and identification of the different
types of business contextual elements. The solution models the contextual elements related to different business
domains by building a library of aspects for each business domain inside one of the existing context-awareness
frameworks namely the Java Context-awareness Framework (JCAF). The output of the extended Context-awareness
framework is a set of apsectized contextual elements related to business processes for a specific industry. The
aspectized contextual facts are utilized as triggers to configure the affected business processes. The business
processes are modeled as goal driven finite state machines that take goals and context into consideration to decide
on the next best state (business process step to move to). This leads to intelligent decision-making based on
appropriate modeling of context of the business processes and their goals which are dynamically updated by
business process experts to match with the dynamic nature of business environments [30]. Our methodology of
aspectized context-awareness for business processes is explained in details in the solution methodology chapter.
The rest of the thesis is organized as follows: chapter 2 discusses the research background, chapter 3 describes the
solution methodology and the specifications for the proof of concept framework, chapter 4 illustrates our
experimental results and their analysis, chapter 5 concludes the thesis by highlighting the research contributions and
pointing out some future work.

17
Chapter 2: Research background
Our research contribution is mainly directed to two major research domains, namely: Aspect oriented software
development (AOSD) and context-awareness. We integrate with another area of research which is business process
modeling and configuration by introducing aspectized context-awareness. We are not the first to discuss the idea of
context within business process modeling as it has been discussed before as a high level concept by Rosemann et al.
in 2008[55] but we do introduce the idea of conceptualizing business process context in terms of aspects and we
define a detailed framework that extends on existing frameworks of both context-awareness and business process
modeling to realize the new approach of aspectized context-aware business processes. In this chapter we summarize
the theories, approaches, tools and concepts which served as the basis for our work
2.1. Aspect Orientation
Aspect oriented software development (AOSD) is a relatively new emerging technology and methodology [5] [65].
The general purpose of AOSD is the modularization of crosscutting concerns. However, earlier researches in AOSD
have focused mainly on concerns related to logging, tracing, debugging, security and program verification
[2][56][59] and little research was done on aspectization of scenario based requirements modeling[67]. Other crucial
areas of research like business process modeling and context-awareness which incorporate cross cutting concerns
have yet to be discovered.
2.1.1. Aspectization Techniques
There are various techniques for aspectization and several tools emerged in the last decade to support AOSD.
AspectJ is an aspect oriented extension to Java. It extends the Java language to enable it to support two categories of
cross cutting implementations [20]:
1) Dynamic cross cutting concerns which define additional implementation to run at certain well- defined points
(join points) during the execution of a program.
2) Static cross cutting concerns which define new operations on existing types.
AspectJ enables modularization through aspects. The composition between a base and an aspect is defined in terms
of base related join points. Cross cutting behavior can be weaved before, after or around join points. The idea of the

18
order around the aspect is resolved in two ways implicitly (before, after or around) or explicitly (Domain clause) [5]
[65].
HyperJ is a tool that supports advanced, multi- dimensional separation and integration of concerns in standard
JavaTM
software [26] [5]. This facilitates adaptation, composition, integration and modularized of Java software
components [65]. The cross cutting concerns are represented as a hyper-slice which is a set of modules where all the
code is dedicated for a given concern. Hyper-J allows the definition of various composition rules.
2.1.2. Open Aspects
Open Aspects is a new approach for mitigating unplanned changes in systems based on aspect-oriented composition
at run time [23]. Open aspects support the so called adaptation models system change events being observed and the
corresponding corrective actions to be taken. The main motivation behind open aspects is the flexibility to change, at
runtime, the aspect composition according to the base system and the set of aspects that it is applied to. There is a
clear separation of base, aspect and adaptation models. In open aspects the weaver derives a model of the running
base system needed for making the aspect model effective (both marked with a ‘start’ tag). While doing so, the
weaver examines an adaptation model (also marked with a ‘start’ tag) detailing all involved system change events to
be observed and all corrective actions to be taken in correspondence to the system elements involved.
Open AspectS which is an extension to AspectS, was formulated to examine the open aspects concept. Initially
AspectS provided developers with a framework to construct the proper runtime structure of aspect instances. Once
instantiated, an aspect instance refers to its associated advice objects which maintain all information about what
additional code (Computation, an instance of Block Context) has to be performed, where (Point cut, an instance of
Block Context, to compute all shadow join-points to instrument) and when (described through Advice Qualifier
attributes). Open AspectS was implemented by Hirschfeld et. al. [23] as a prototype of Open Aspects and it is
considered an extension to AspectS. They mainly added an active point cut (Active Point Cut) system element
associated with each advice. An active point cut object records the set of join-point descriptors that were associated
with that aspect when the installed aspect gets woven into the system. Hence, the set of join-point shadows are
obtained by executing the point cut expression (point-cut) associated with the respective advice.

19
2.1.3. Aspect Oriented Modeling Based on Behavior Context
Shuoping et. Al. [68] introduced a new approach for Aspect Oriented Development which they named Aspect-
Oriented Modeling based on Behavior Context (AOMBC) Aspect-Oriented Software Development (AOSD). The
main idea behind AOMBC is enabling the software engineer to model the system actions symmetrically. To
collaborate with other behavior nodes, behavior context is used to describe their relationships. With the behavior
context, the equitable behavior nodes are asymmetrically wrapped with core behavior or crosscutting-behavior and
they get weaved together [68]. Thus, AOMBC helps the software engineers build more effective and reusable
models[68].
2.1.4. Aspects as Libraries
Another interesting approach that Microsoft has adopted in dealing with cross cutting concerns is the idea of having
libraries for the most common cross cutting concerns. Microsoft has identified authentication, authorization,
caching, communication, configuration management, exception management, logging and instrumentation, state
management, and validation as the most common cross cutting concerns that software developers face [56]. Hence,
Microsoft built its Enterprise library which is a collection of reusable software components (application blocks)
designed to assist software developers with common enterprise development cross-cutting concerns (such as
logging, validation, data access, exception handling, and many others). Application blocks are a type of guidance;
provided as source code, test cases, and documentation that can be used "as is," extended, or modified by developers
to use on complex, enterprise-level line-of-business development projects [59]. The enterprise library is built for .net
applications and uses Inversion of Control and Dependency Injection. We found the idea of building and
maintaining an aspects library quite inspiring and adopted it within our proposed solution.
2.1.5. Aspect Oriented Paradigm and Business Process Modeling
Although the aspect-oriented (AO) paradigm’s initial goal was to help in programming modularity and reusability
yet in 2010 Machado et al [44], researched the concept of the application of Aspect oriented concept to the design of
business processes to improve their usability and understandability of process models. The research introduced the
idea of cross cutting composition to have the common concerns of a business process (such as quality check
procedures) modularized into an aspect that could be used by all business processes. The research claimed that the
application of AO concepts to the design of BPs is important in the consideration of usability and understandability

20
[44]. However, the research focused on the business process usability and reusability in terms of aspects but there
were no researches or even indications in the future works for using aspects to model the context of a business
process [44].In 2011 Machado et al [44] discussed variability in business process and proposed an approach to
manage such a variability. The management of variability is based on a compositional and parametric approach with
Aspect-Orientation [66]. It leverages and extends an existing tool to address variability in a specific domain yet it
was not validated nor was its effectiveness evaluated . Again here the focus is to model common components as
aspects and identify variability at the different aspect joint points and start working on the flow yet the idea of
representing context of a business process in terms of aspects was neither mentioned nor proposed in the future
work of this research.
2.2. Context-awareness: State of the Art
J. Coutaz et al. [7] define context as “not simply the state of a predefined environment with a fixed set of interaction
resources. It is part of a process of interacting with an ever changing environment composed of reconfigurable,
migratory, distributed, and multi scale resources.” In this section we define the context-awareness disciplines,
techniques and latest researches.
2.2.1. Disciplines of Context-awareness
Context-awareness exists in many disciplines other than business process modeling and has received better research
focus in these areas e.g. Web systems [33][19][12], Mobile applications research [42] and conceptual modeling [2]
[56], indoor presence, smart household and energy saving [66][62], healthcare and patient monitoring[4] ,
knowledge management[50][25] as well as requirements engineering[12]. In the IS discipline, the term ‘context-
aware’ was coined by Schilit and Theimer [59] as approaches to incorporating contextual factors into information
systems, such as in the area of Mobile applications. They typically focus on the users and their interaction with the
systems [10], [59].Context in this area of research is often reduced to the notion of locality (e.g. what is the closest
restaurant? How can I disable incoming phone calls if I am in a meeting room?), and user characteristics (e.g. what
type of food does the user of the mobile application like?). Existing frameworks such as the ECOIN framework [16]
attempt to represent context as properties that can be interpretation-based either on the inbuilt framework structures
or based on very generic ontologies that have no structure prior to design time.

21
2.2.2. Context-awareness Frameworks
Almost all context-aware frameworks currently available in the market and even developed for research purpose
were coined within the field of pervasive systems and its applications (e.g. smart hospitals and smart homes).
According to Matthias Baldauf in his survey of context-aware systems [43] context can be sensed in many
different ways like applying sensors, network information, device status and browsing user profiles or some
other repositories of data. Most of these types of context sensation means have been put into consideration in
most of the context-aware frameworks developed for pervasive systems.
The following are the different architectures for context-aware frameworks [43]:
A. Direct Sensor Access: This architecture is based on sensors that are built-in within the framework and
information is extracted through direct interaction with the sensors. This is not suitable for distributed
systems as they do not have capabilities for managing simultaneous sensor accesses.
B. Middleware Infrastructure: This architecture is based on encapsulation of low-level sensing details in the
middleware, and is more extensible than the direct sensor access
C. Context Server: This architecture allows a number of clients to access remote data sources. It is the
distributed version of the middleware approach. The entire sensor gathering data is within the context
server and clients start requesting data from the context sensors. The overhead is the communication
protocol, network performance and quality of service parameters
D. Blackboard model: This architecture is based on the blackboard idea and SOA, all sensors post their
information on blackboard and entities interested in some information on the blackboard register their
interest in this information so that whenever these information is updated, the interested parties are notified
(event based notification model). The main overhead of this architecture is the necessity of having a
centralized server to host the blackboard.

22
The table in figure 1 summarizes the existing frameworks that were examined by Baldauf in his survey and the
main features and characteristics of their architecture.
Architecture Sensing Context
Model
Context
Processing
Resource
Discovery
Historical
Context
Data
Security Privacy
CASS Centralised
Middleware
Sensor
nodes
Relational
data model
Interference
engine and
knowledge
base
n.a. Available n.a.
CoBra Agent
based
Context
Acquisition
Model
Ontologies
(OWL)
Inference
engine and
knowledge
base
n.a. Available Rei Policy
language
Context
Management
Framework
Blackboard
based
Resource
servers
Ontologies
(RDF)
Context
recognition
service
Resource
servers +
subscription
mechanism
n.a. n.a.
Context
Toolkit
Widget
based
Context
widgets
Attribute-
value
tuples
Context
interpretation
and
aggregation
Discoverer
component
Available Context
ownership
CORTEX Sentient
object
model
Context
component
framework
Relational
data model
Service
discovery
framework
Resource
management
component
framework
Available n.a.
Gaia MVC
(extended)
Context
providers
4-arg
predicates
(DAML +
OIL)
Context-
service
module
(first-order
logic)
Discovery
service
Available Supported
(e.g.
secure
tracking)
Hydrogen Three
layered
architecture
Adapters
for various
context
types
Object
oriented
Interpretation
and
aggregation
of raw data
only
n.a. n.a. n.a.
SOCAM Distributed
with
centralized
system
Context
providers
Ontologies
(OWL)
Context
reasoning
engine
Service
locating
service
Available n.a.
Figure 1: Context-aware Frameworks Comparison (Adapted from Baldauf , 2007 [43])
Another set of context-awareness tools was introduced by Zhao et al in 2012 [57] whose main purpose is to cater
for the increasing number of devices that are invisibly embedded into our surrounding environment as well as the
proliferation of wireless communication and sensing technologies which are the basis for visions like in ambient-
intelligence, ubiquitous and pervasive computing [57]. This research builds on the pervasive Computing in
Embedded Systems (PECES) project which developed the technological basis to enable the global cooperation of

23
embedded devices residing in different smart spaces in a context-dependent, secure and trustworthy manner [57]. It
focuses on providing tools for application developers to build and test context-aware applications based on context
ontology that is related mainly to pervasive and mobile computing and not directed to the field of business process
modeling by any means.
The main problem with the above context-aware frameworks is that they are focused on pervasive systems and
mobile entities, that they lack customization for context of business processes and that they are not open source so
their usage or extension must be under the supervision of the entities developing them. The problem of closed source
doesn’t exist for the JCAF which stands for Java Context-awareness Framework. The JCAF as described by Jakob
Bardram in his paper about design implementation and evaluation of the JCAF [28] is an open source tool that is
based on the Java programming language and utilizes the concept of java interfaces for context-awareness within
pervasive systems for which it was developed. The background for JCAF was a research into a context-awareness
infrastructure in hospitals [28].The JCAF is built on the following main pillars [28];
1) Context Service: A service receives, manages, stores, and distributes context information for entities.
2) Entities: An entity models something that you want to manage context information for(e.g. A Person, A
Patient)
3) Context Item: Something that an entity uses (e.g. PC), the relationship between the entity and the context
item is important (e.g. A person uses a PC)
4) Context Clients
o Context Monitors: Context clients that specialize in sensing, resolving, and submitting context
information
o Context Actuators: Context clients which are specialized in using context information
5) Context Events: A context service allows special context clients (entity listeners) to register interest in
events in specific entities and to receive a notification of the occurrence of such an event.
The main useful thing related to JCAF is its being open source and the idea of context services which can
convert the context information that is sensed to XML format. This would make it possible, with the
addition of some classes, to extract the sensed XML into some repository that can be accessed within the

24
new framework. We will further introduce the JCAF and explain it in details in the methodology section of
this document. Figure 2 represents the JCAF infrastructure.
Figure 2: JCAF Runtime Infrastructure (Adapted from Jakob E. Bardram , 2005 ([28]))
2.2.3. Context Description & Structure
Context structuring and linking to real causes is a prerequisite to context conceptualization within the business
process modeling discipline. This is why a significant part of the research background section of this thesis is
dedicated to context structuring.
Regarding approaches for structuring and describing context, it was found that in the area of context modeling a
substantial amount of research has already been conducted, for example in the form of context ontology [6]. For
instance, the Context Ontology Language [60] is designed to accommodate selected aspects of context such as
temperature, scales, the relative strengths of aspects and further metadata. It is designed to relate measurements back
to the semantics expressed in a system. In terms of limitations for the process flexibility discussion, however, it
lacks linkages to causes, both in terms of guiding goals and environmental stimuli.
Rosemann [55] identifies an interesting onion model for structuring context elements related to a business process.
Rosemann widens the scope of context elements consideration to include environmental context related to the
economy or the general environment where the business process operates as well as immediate context elements
which directly affect the flow of a business process. The Rosemann onion model will be the basis of the context
model structure that we adopted in this thesis and hence it will be discussed in details.

25
Rosemann [55] divides the context into four disjoint categories as indicated in the model shown in figure
3
Figure 3:Onion Model for identifying BP Context (Adapted from Rosemann et al., 2008 [55])
As the Meta model shows, Rosemann [55] proposes a taxonomy that divides the different facets of context into four
concentric layers of an onion model:
The Immediate Layer:
The immediate context of a business process includes those elements that go beyond the constructs that constitute
the pure control flow, and covers those elements that directly facilitate the execution of a process. Due to this central
role, elements there tend to be already well-considered in existing business process modeling techniques such as
EPC, BPMN, etc. The elements of an immediate context are typically essential to the understanding and execution

26
of a business process (e.g. what data do I require? Which organizational resource is in charge of the next activity?
What application supports this process step?).
The Internal Layer:
The immediate system (viz. the process) is embedded in the wider system of an organization. Various elements of an
organization have indirect influence on a business process and we call this second layer, the internal context. The
internal system of an organization incorporates elements such as resources, norms and values, concerns and
interests, strategy, structure and culture. These categories cover, for example, the corporate strategy (enterprise plan)
and related process objectives. A change from a quality-focused strategy to a cost-cutting strategy, for instance, will
have an impact on a broad range of business processes (e.g., elimination of quality control activities and scaling
down of special resources) [55]. As can be seen, the internal context captures all elements that are part of the
organizational system in which a process is embedded. Consequently, typical further examples for internal context
variables are the main internal stakeholders in an organization and their risk perceptions, communication and
logistical infrastructures (e.g. regional distribution of factories) as well as financial and other resources (legal
experts, R&D) [55]. For collaborative business processes that span multiple organizations the internal context would
be the sum of the involved organizations.
The External Layer:
The external context compromises the elements that are outside the organization control but reside within the
business network where the organization operates. These might not affect the minute steps of a business process but
will definitely have an impact on the overall design of the business process. The elements of an external context
include the following:
1. Elements related to suppliers, competitors, investors and customers. External context variables can be
further identified from frameworks such as the Five Forces model [49]
2. Factors related to a specific industry (e.g. overall demand for the services of an industry, technological
innovations) and regulations such as industry-specific practices (e.g. supply chain management practices)
In general, external context elements need to be considered to achieve conformance objectives in addition, or
substitution, to performance objectives [48].

27
The Environmental Layer:
This is the outermost layer and it captures the overall environment as a system with comprehensive boundaries.
These elements includes items like environmental variables /factors such as weather (e.g. increasing call volume
during storm season), time (e.g. different business operating models on Sundays or before Christmas) and workforce
related factors (e.g. overall shortage or strike)
The four layers described above are intersecting and may affect one another leading to direct impact on the business
process. Rosemann [55] identifies examples such as:
1. An element on the same or more inward context layer can mediate the impact of a context element.
Mediation is about one context element leading to an alleviated effect of another context element
2. An element on the same or more inward context layer can moderate the impact of a context element.
Moderation is about one context element controlling the effect of another context element (i.e. makes it
more or less significant)
3. An element on the same or more inward context layer can mitigate the impact of a context element.
Mitigating is about one context element reducing the significance/impact of another context element
A similar onion model has been used earlier by Alexander et al [1] in the process modeling area to identify, and
display, the relationships between different types of stakeholder roles relevant to the business process fit.
2.2.4. Different Context Modeling Techniques
Rolland et al [56] for instance, suggest a context-oriented procedure based on objectives to identify requirements
chunks in goal-based modeling. The basic idea for determining goals and relevant context in a model is centered on
the notion of a requirement chunk, which is a pair < Goal, Scenario > and denotes a potential way of achieving a
goal in a given scenario (i.e. one instantiation of the process).
Yu et al [69] use the i* framework to capture rationales behind processes relating to goals, tasks, resources and
actors. Their framework allows for the explicit articulation of the interdependencies between a process and (some
parts) of its environments, mainly the stakeholders and related environmental resources.
Rosemann et al [55] define a goal-oriented process modeling approach to be able to identify relevant contextual
elements (figure 4). The granularity and scope of a business process model is closely linked to the goals of the
depicted process. By examining why a process exists and what the objectives and goals of the process are, the

28
context factors that pose relevance to the process can be predetermined and modeled at a formal level over and
above the typical description levels of organization, data, resource and IT [28] [57].
Figure 4:Procedure for context identification (Adapted from Rosemann et al., 2008 [55])
Selmin Nurcan et al [47] introduced a context model for BPM (CM4BPM) and a role-based business process model
(RBPM), and presented an approach allowing enacting processes with respect to the context. Nurcan presents an
approach for business process (BP) modeling which supports the explicit definition of the context related knowledge
in order to make instance adaptations "context-aware". The approach consists of using contextual knowledge in
order to enhance the adequacy and the coherence of the assignments during the enactment of the business processes,
for instance, actor-to-role or process-to role assignments. In order to efficiently use the contextual information in
business process enactment rules, the context related knowledge (CRK) should be formally defined (figure 5).

29
Figure 5: The Meta model for RBPM (Adapted from Nurcan et al., 2009 [47])
Ioan Salomie,[27] uses a context model based on representing actors, resources and policies from the real world and
uses BDI (Believes Desires Intentions) agents for context management and processing. The basic context model is
defined as a triple C = <R, A, P> where: R is a set of context resources; A is a set of actors which interact with
context resources; and P is a set of real context related policies. The context model is mapped onto different real
contexts by populating the sets with real context specific elements. The mapping result is a specific context model
CS = <RS, AS, PS >. The relationships between the context model’s elements are represented by using is-a type
relations in a general purpose context ontology core.
Castelli et al [70] proposed the four « W » model. Their research starts from the consideration that any elementary
data atom or any higher-level piece of contextual knowledge, in the end, represents a “fact” which has occurred.
Hence, the model accounts for those facts and any data/knowledge atom can be represented as 4 fields’ tuple (Who,
What, Where, and When) : “someone or something (Who) does/did some activity (What) in a certain place (Where)
at a specific time (When)” [70].
The four-field tuple structure was designed to deal with information coming from various data sources.

30
. Users and services, from everywhere, can retrieve knowledge atoms via a simple API[70]. The W4 Model was an
interesting idea at the time it emerged,. Huifang et al [24] worked on depicting the context information of the mobile
workers' shipment business process. The research summarized the context ingredients of the mobile workers'
business process and analyzed the relationships between them [24]. The context model introduced in the research is
a post context model that illustrates the context of a business process after it has been run for the purpose of process
redesign and reallocation of resources and not in real time to alter the behavior of the business process. The context
model in this research focuses on resources contained within a business process and the status of the business
process regardless of whether it is running or not running.
2.2.5. Context Modeling Using UML
In this section we describe the context modeling experience in UML. We will go into details of the model to show
how already existing UML diagrams and class diagrams can visually model the context of a business process.
Christof et al [61] described Context Modeling Profile (CMP), a lightweight UML extension, as a visual language
for context models in mobile distributed systems. The resulting models visualize Meta information of the context,
i.e. source and validity of context information, and reflect privacy restrictions. The profile provides several well-
formedness rules for context models. A case study of meeting room context is used to illustrate the approach as
shown in figure 7.
As depicted in the above figure context can be modeled using a UML class diagram. It is also possible to denote the
characteristics of context, e. g. the access rights, in the context model by using comments. Derivation rules can be
specified by adding constraints to model elements and derived context items can be notated in the UML way with a
preceding ”/”, like the derived activity of a person in the meeting system[61].
Sheng et al [51] define syntax for Context UML, including a Meta model and a notation (figure 8). The Meta model
defines abstract syntax of the language, while the notation defines the concrete format used to represent the language
(also called concrete syntax). Sheng introduces the abstract syntax of Context UML proving that UML presents a
rich modeling language for context modeling and this idea supports the choice of UML for context modeling in our
research work.

31
2.3. Business Process Configuration Models This section describes early and recent studies on different models that cater for business process configuration.
Various organizations, even within the same industry, have various ways and rules that affect the way they perform
their different business processes since flexibility of business process is an inevitable goal for every organization.
The concept of business process flexibility, variability and configuration of business process especially within
specific organization has been discussed extensively in the literature.
One way of handling business process flexibility is utilizing the Software Product Lines (SPL) perspective.
Schnieders et al [64] described extensions for business process modeling languages allowing the construction of
process families. However, they did not consider appropriate modeling of business process context [63].
Montero et al [45] discussed another SPL conceptual methodology that used feature models and business process
models to cater for business process flexibilities; they produced a process that generates business process instances
using the SPL perspective [63].
La Rose et al [36] introduced a configurable model for modeling business process that is based on a questionnaire
approach to cater for business process model configuration. In their research, the answers for the questionnaires
provide the method to select the best configuration of a business process.
Hallerbach et al [21] presented a context-based approach for configuring and managing process variants The
research allows for configuration of process variants through applying a context dependent set of well-defined
change operations to a base process.- The context in this research is confined to only two context variables: the
implementation cost and quality of the process. Their research introduced the approach and stressed that there is a
need for integration of context-awareness to manage business process variance but does not discuss how this need
can be achieved.
Rosemann et al [35] introduced the concept of having context-aware taxanomies and through mining algorithm and
extraction of certain knowledge from those taxanomies the business process could be configured. However, the
research did not detail how the configuration is done as it was merely an expression of a new idea.
De La Vara et al. [37] describe an approach to include contextualization within business process models . Their
research incorporates the concepts of context as facts and statements to represent contextual information [63]. The

32
research describes a process to introduce contextualization into business process models through context analysis.
The context analysis allows the derivation of the conceptual model that can be monitored at run-time [37]. The
approach consists of four stages: modeling of initial business process, analysis of business process context, analysis
of context variants and modeling of contextualized business process [37]. First, an initial version of the business
process that needs to express its context is modeled. Next, the rest of stages have to be carried out while relevant
context variations (changes) are found and they are not represented in the business process model. Relevant context
variations influence the business process and imply that business process execution has to change.
If a context variation is found, then the business process context is analyzed to find the context properties that allow
process participants to know if a context variant holds. A context analysis model is created, and the context variants
of the business process are then analyzed. Finally, a contextualized business process model is created on the basis of
the final context variants and their effect on the business process [37].
Business process context is analyzed in the second stage of the approach. This stage aims to understand context, to
reason about it and to discover the context properties that influence a business process. In this research the context
is specified as a formula of word predicates. Word predicates can be facts (they can be verified by a process
participant) or statements (they cannot be) [37]. The research does not show any empirical evidence of the
effectiveness of such a way in business process configuration but puts forward a theory that needs to be verified.
Santos el at [63] introduced the idea of building a new model for business process configuration based on
nonfunctional requirements of a business process associated with context. The research uses a methodology similar
to Vara et al’s [37] methodology in representing context and configuring the business process yet adds the factor of
representing non-functional requirements as one of the pillars that determine the business process path. The
research introduces the concept and the process outline with no details about the related steps and the formal
definition of context and non-functional requirements. In addition, it does not provide any actual experimental work
or results to prove it.

33
2.4. Previous Case Studies This section describes earlier case studies conducted in the field of context modeling for business processes that are
based on Rosemann’s onion model. Karsten et al [34] conducted a case study about claim processing business
processes in an Australian insurance company in the financial services sector. The study identified relevant context
elements and placed them in a matrix then classified conceptual categories according to their impact on the business
process. The last step was using internal feedback structures to take feedback from certain context elements that,
according to the process perspective, affect the enhanced process [34]. The case study asserts that context and
context change requires different response strategies in process design. They suggest that certain context elements
can be mapped to a rule-based system to govern the variability in claims processing. This is not only applicable to
the case study but to any framework or research that involves extending context-awareness for business processes
[34].
Rosemann et al [32] examined the Australian airlines check-in processes using the onion model discussed earlier.
Rosemann concludes his case study by emphasizing that through appropriate context modeling that takes into
consideration the different context layers, wise configuration decisions can be taken as described above. In addition,
process flexibility and process contextualization is still in the explorative stages and extensive studies must be done
to enhance the context model proposed and prove its effectiveness [32].

34
Chapter 3: Solution Methodology and Framework Specifications
3.1. The Solution Methodology In this research work we introduce a solution methodology based on sensation and identification of the
different types of business contextual elements. The solution models the contextual elements related to
different business domains by building a library of aspects that could be tailored and used for various
business domains within an existing context-awareness framework. The framework we selected is the Java
Context-awareness Framework (JCAF). The output of the extended Context-awareness framework is a set
of apsectized contextual elements related to business processes for a specific industry. The aspectized
contextual facts are represented as triggers to configure the affected business processes. The business
processes are modeled as goal driven finite state machines that take goals and context into consideration
when deciding on the next best state (business process step to move to). This leads to an intelligent
decision-making process which is sensitive to the context of the business processes and their goals. The
later become dynamically updatable by business process experts to incorporate the constant changes in
business environments. Our methodology of aspectizing context-awareness for business processes is
summarized in the following steps and sub steps (which will be explained later in full details throughout the
rest of this chapter):
3.1.1. Context Sensation, Identification and Modeling
Since our solution and methodology are focused on context-aware business processes then the first two
basic questions that come to mind; 1) How do we get to sense and identify the context of business
processes? 2) What are the contextual aspects that should be taken into consideration?
Based on our literature search and business experience our main focus will be on the following
contextual aspects; Non human resource utilization, Human resource utilization, Human resource
experience level, Organizational strategies (The strategies of the organization on which the business
process is running (e.g. whether the strategy is cost cutting or quality focused), The risk factors associated
with a process, Industry regulations and practices affecting a process, Timing, Season, and Location

35
However, the methodology explained is extensible to cater for any other contextual aspects and so is the
design of the prototypical framework which is developed to prove the solution methodology proposed in
this research.
The above contextual aspects are different. Some of them are physical, others are virtual and logical.
Hence, the context sensed by our context-aware framework is divided into the following three major types:
Physical Context: which is sensed through physical sensors (e.g. location, light, sound, movement,
touch, temperature and air pressure) [43].
Virtual Context: This is information that is not related to any physical sensation. It could be
retrieved from databases or induced from non-physical resources (e.g. the user interaction with a
system, the tasks pending on someone, the employee experience) [43].
Logical context: which is the information deduced from the combination of physical and virtual
contextual facts. For example, a logical contextual piece of information could be an employee’s
current position which is deduced by analyzing logins at desktop PCs and a database mapping of
devices to location information [43].
The framework takes in low level contextual data from physical and virtual sensors and converts them to
high level contextual variables using the Logical sensors. Hence, the logical sensors are the ones feeding
the contextual variable information to the framework.
In our solution methodology we focus on contextual aspects that are not predictable i.e. that need to be
continuously sensed and accordingly instant changes in the flow of business processes need to take place.
Predictable contextual aspects (e.g. the increase in the number of Airlines passengers on a specific holiday
season) are already identified in advance and their handling process is well-defined.
From our review of literature and research on context-aware systems which were mostly developed for the
sake of pervasive systems and ubiquitous computing, we discovered several existing frameworks that deal
with the types of context and sensors described earlier. We found the most convenient one of them to be the
JCAF for the following reasons;
JCAF is an extensible Open Source tool

36
It supports the extraction of context information from the different types of context sensors
(physical, virtual and logical context sensors)
It allows the addition of new libraries of aspects which makes it possible to model contextual
concerns as aspects/cross cutting concerns related to the business process entity
It provides easy ways to add classes representing different types of entities
It provides easy ways to add new packages
It takes the quality of context (QoC) aspect into consideration. It has a get_Accuracy and
Secure methods within the JCAF Context Item class and these methods can be overridden to
specify the combination of quality guarantees for the context items [28]
The exact steps for extending the JCAF framework to support the representation of context of a business process in
terms of aspects are described later in this chapter.
Context variables are represented as aspects and we perceive this as an important addition to the world of business
process modeling and context-awareness for the following reasons:
Modularization of contextual elements/items to allow for reuse of the same context elements in different kinds
of business processes and in different business domains.
The dynamic nature offered by the aspects concept and their adaptation model. This allows the weaving of
events and advices/actions to happen at run time which is most appropriate for the dynamic environments in
which most business processes run.
The concept of aspects/cross cutting concerns is more appealing to business people and business process experts
than the idea of a process, in business process management, away from the world of computing and software.
Business decision-makers always consider aspects before making a decision but the term and idea of context is
more distant from the business world.
3.1.2. Context Classification
After appropriately extracting and sensing contextual information in terms of aspects, the contextual data is
classified into the four contextual layers defined by Rosemann [55]: Immediate, Internal, External and

37
Environmental layers.
Figure 6:Onion Model for identifying BP Context (Adapted from Rosemann et al., 2008 [55])
Immediate Context: includes those elements that go beyond the constructs that constitute the pure control flow,
and covers those elements that directly facilitate the execution of a process. Due to this central role, elements
tend to be well-grounded in existing business process modeling techniques such as Enterprise Process Chains
(EPC), Business Process Modeling Notation (BPMN), etc. The elements of an immediate context are typically
essential to the understanding and execution of a business process (e.g. what data do I require? Which
organizational resource is in charge for the next activity? What application supports this process step?).
Internal Context: The immediate system (viz. the process) which is embedded in the wider system of an
organization. Various elements of an organization have indirect influence on a business process. The internal
system of an organization incorporates elements such as resources, norms and values, concerns and interests,
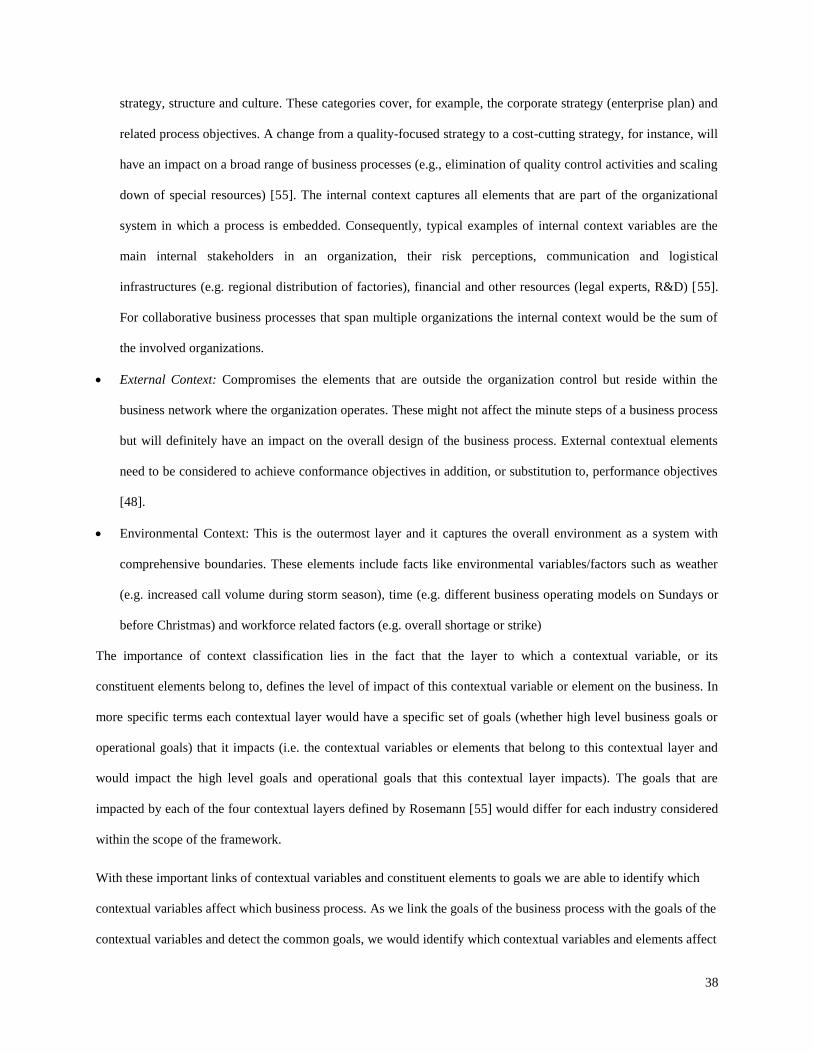
38
strategy, structure and culture. These categories cover, for example, the corporate strategy (enterprise plan) and
related process objectives. A change from a quality-focused strategy to a cost-cutting strategy, for instance, will
have an impact on a broad range of business processes (e.g., elimination of quality control activities and scaling
down of special resources) [55]. The internal context captures all elements that are part of the organizational
system in which a process is embedded. Consequently, typical examples of internal context variables are the
main internal stakeholders in an organization, their risk perceptions, communication and logistical
infrastructures (e.g. regional distribution of factories), financial and other resources (legal experts, R&D) [55].
For collaborative business processes that span multiple organizations the internal context would be the sum of
the involved organizations.
External Context: Compromises the elements that are outside the organization control but reside within the
business network where the organization operates. These might not affect the minute steps of a business process
but will definitely have an impact on the overall design of the business process. External contextual elements
need to be considered to achieve conformance objectives in addition, or substitution to, performance objectives
[48].
Environmental Context: This is the outermost layer and it captures the overall environment as a system with
comprehensive boundaries. These elements include facts like environmental variables/factors such as weather
(e.g. increased call volume during storm season), time (e.g. different business operating models on Sundays or
before Christmas) and workforce related factors (e.g. overall shortage or strike)
The importance of context classification lies in the fact that the layer to which a contextual variable, or its
constituent elements belong to, defines the level of impact of this contextual variable or element on the business. In
more specific terms each contextual layer would have a specific set of goals (whether high level business goals or
operational goals) that it impacts (i.e. the contextual variables or elements that belong to this contextual layer and
would impact the high level goals and operational goals that this contextual layer impacts). The goals that are
impacted by each of the four contextual layers defined by Rosemann [55] would differ for each industry considered
within the scope of the framework.
With these important links of contextual variables and constituent elements to goals we are able to identify which
contextual variables affect which business process. As we link the goals of the business process with the goals of the
contextual variables and detect the common goals, we would identify which contextual variables and elements affect
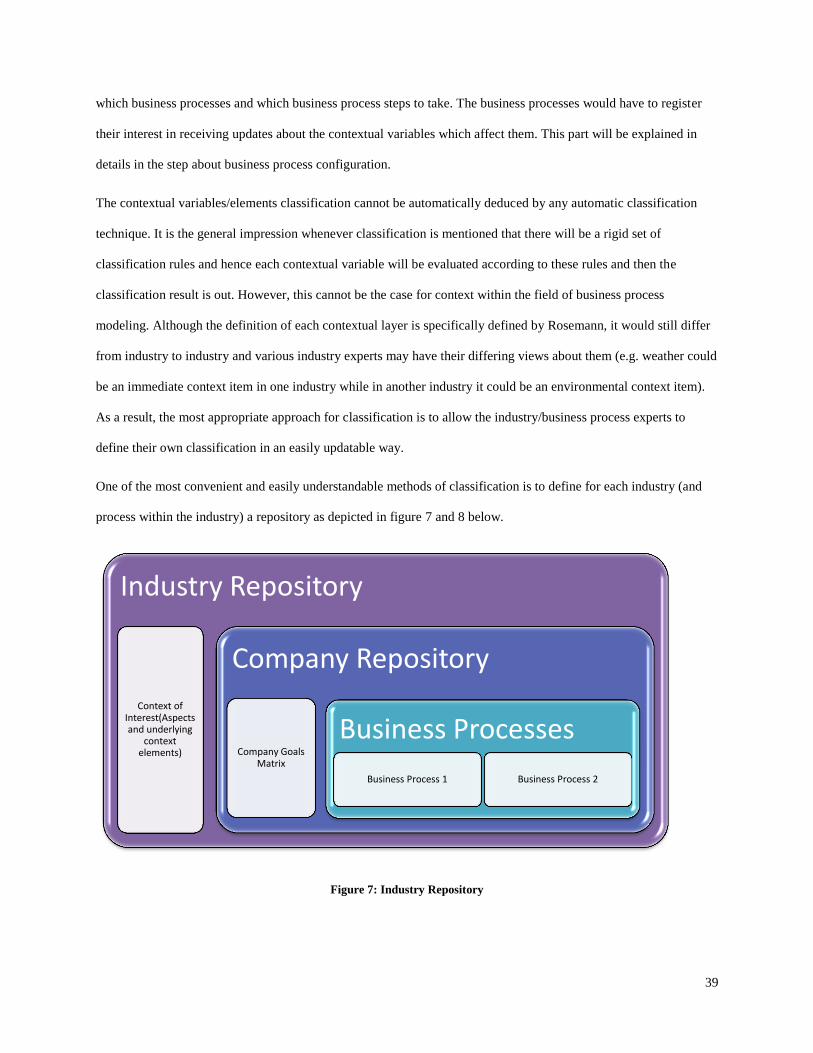
39
which business processes and which business process steps to take. The business processes would have to register
their interest in receiving updates about the contextual variables which affect them. This part will be explained in
details in the step about business process configuration.
The contextual variables/elements classification cannot be automatically deduced by any automatic classification
technique. It is the general impression whenever classification is mentioned that there will be a rigid set of
classification rules and hence each contextual variable will be evaluated according to these rules and then the
classification result is out. However, this cannot be the case for context within the field of business process
modeling. Although the definition of each contextual layer is specifically defined by Rosemann, it would still differ
from industry to industry and various industry experts may have their differing views about them (e.g. weather could
be an immediate context item in one industry while in another industry it could be an environmental context item).
As a result, the most appropriate approach for classification is to allow the industry/business process experts to
define their own classification in an easily updatable way.
One of the most convenient and easily understandable methods of classification is to define for each industry (and
process within the industry) a repository as depicted in figure 7 and 8 below.
Figure 7: Industry Repository
Industry Repository
Context of Interest(Aspects and underlying
context elements)
Company Repository
Company Goals Matrix
Business Processes
Business Process 1 Business Process 2

40
Figure 8: Business Process Repository
The industry repository should include the following:
Contextual Repository. This is an XML file containing the four contextual layers defined by Rosemann and the
link of each contextual layer to contextual aspects that are of interest to this industry. This XML file is read and
converted to aspectized contextual layer objects within our framework. Of course, this file is defined for the
first time through a simple graphical user interface that is easily understandable to business domains experts.
Contextual Variables Repository. Within the same XML file mentioned above we define (in our framework and
could be any kind of database in any other framework) the different contextual variables that lie under the
different contextual aspects related to this specific industry in particular. This file is defined for the first time
through a simple graphical user interface that is easily understandable to business domains experts.
The XML file is converted into an aspectized contextual variable object which carries the contextual elements, their
contextual aspects and their contextual layer classification inside it. It is to be used within the next step of matching
context to goals and eventually to affect the relevant business processes.
By following the above methodology, contextual items of interest to an industry are easily identified and updated by
business experts and the classification is easily done as well as the links between the contextual layers and
Business Process
Process Goals
Process Related Context
Each Step
Step definition
Step precondition/s
Step postcondition/s
Step transitional condition/s
Step Transitional Condition
Contextual Values Best Next Step

41
contextual aspects and the variables which will prove to be extremely important within the next step of business
process configuration (step 1.1.4) according to the contextual input.
3.1.3. Business Goals Definition
After appropriately sensing the context by utilizing JCAF and classifying contextual elements, we need to identify
the goals related to the company being examined so that we can model and configure the business processes related
to this company in a goal-driven context-aware manner which is the main point of our research.
After examining the goals within different business domains we realized that the goals are not unified across an
industry. In fact, the goals vary for each company. Hence, the goals definition will need to be done on a company
level under the industry and it will be defined by business experts in an easily updatable format. Strategic goals are
to be defined first then operational goals under each strategic goal.
The framework has companies’ repositories, where each company expert defines the company goals. The company
repository consists of the following:
Goals Repository; This is an XML file (in our framework and could be any kind of database in any other
framework) containing the list of strategic goals of the company and the sub-goals (operational goals of
each strategic goals)
Business Process Repository; these are XML files (in our framework and could be any kind of database in
any other framework) each file representing a Business process under this company. The exact method of
modeling business processes will be explained within the step 1.1.4.
Goals to Contextual Layer Repository; This is an XML file that defines the relationship between the four
contextual layers (Immediate, Internal, External, Environmental) and the goals of the company.
3.1.4. Business Process Modeling and Configuration
In this solution methodology, we found that an appropriate way for modeling the business processes would be in
terms of finite state machines as depicted in the following example (figure 9);

42
Check In Process
Standing at Business Counter
Standing at Economic Counter
Standing at Luggage Counter
Business
Passenger(Normal Check
In)
Economic
Passenger(Normal Check
In)
Web Check In
Identity Check Other Documents Validation
Counter AvailableCounter Busy
Valid
Not Valid
Go to Passport Security
Seat Choice
Valid
Not Valid
Weighting Luggage
Seat Chosen
Issue Weight Fine
Overweight
Issue Luggage Tags
Handover Passegner Boarding Pass and Luggage Tags
Normal Weight
Boarding Pass Issued
Fine Payed
Standing at Fine Counter
Fine IssuedCounter Busy
Counter Busy
Counter Available
Kiosk Check In Counter
Passenger Kiosk Check In
Counter Busy
Auto Docs Validation
Auto Boarding Pass Issuance
Scan Documents
Valid Documents
Boarding Pass Issued
Weighting Luggage
Issue Weight Fine
Overweight
Issue Luggage Tags & Take luggage
Normal Weight
Standing at Fine Counter
Fine Issued
Counter Busy
Figure 9: Check-in Business Process Example

43
The business process is a sequence of states. Moving from one state to another happens through identifying certain
conditions and according to these conditions the business process moves to the next best state. For the business
process configuration to happen based on the context of the business process and its goals, the following steps take
place:
1) Identifying which aspectized contextual variables/ elements affect which business processes and which steps to
take within these processes. This is achieved by identifying the goals of the business process under
investigation. It comes by studying the business behind the process and the wider picture that the business
process fits in, which comes from the understanding of the overall business domain. As mentioned above, the
goals of the company will be placed in a goals repository within a certain industry repository. For each
company repository that we have business processes defined under, and for which the definition incorporates
the goals of the process, the states (business process steps), the goals of each state (business process step), the
preconditions of entering this state (business process step) , the post conditions when exiting from this state
(business process step) and the conditions to jump from one state to another (these conditions are related to the
context of the process and the post conditions of the step) are defined. These definitions are made through a
simple graphical interface and are updatable by business experts.
2) Comparing the goals of the business process to the goals of the different aspects of contextual elements that are
of interest to the company under which the business process lies and detecting any common goals. If common
goals are found then the business process is affected by the context and through common goals we are able to
identify which business process steps are affected.
3) For the contextual elements that are affecting a certain business process according to the goals matching, the
systems asks the business process expert, while defining the recommendations ( transitional conditions) of
moving from one state (business process step) to the next best state, to incorporate these contextual elements in
the definition of the recommendation based on ranges of values for these contextual elements.
4) The business process registers its interest in contextual aspects of common goals and this happens through
existing functionalities in JCAF. The business process runs and is triggered by changes in the contextual aspects
it registered in. According to the changes in values of the contextual aspects and the conditions for jumping

44
from one state/business process step to another (as per the business process definition), the business process
decides on the best sequence of steps/states to take given a certain contextual input at a specific instance in time.
It is through the above four main steps that we applied our methodology of modeling context of business processes
in terms of aspects and closely coupling them to industry goals. We model business processes as finite state
machines. They are goal-driven so that we can achieve flexibility of business process modeling and configuration
based on aspectized context-awareness and goal orientation. This combination helps us arrive at flexible,
configurable and fully aware business processes, which in turn helps decision makers and business domain experts
save tremendous business efforts and costs.

45
3.1.5. System Architecture
The architecture of the prototypical framework is shown in figure 10.
Figure 10: The Prototypical Framework Architecture

46
As depicted in the system architecture diagram, the system interfaces the users through simple graphical java forms.
The core engine of the system which we developed as an extension to JCAF consists of the following main modules:
a. Knowledge Base Definition Module: this module is responsible for enabling the business experts to:
i. Define information about their industry(industry name, the contextual aspects of interest to
the industry, the classification of the contextual aspects on the different contextual layers and
the context elements under each contextual aspect (e.g. Material utilization aspect belongs to
the immediate layer and has the check-in counters number as a context element under it)
ii. Define information about their company (company name, the parent industry, the company
goals matrix, the relationship between those and the different contextual layers)
iii. Define information about their business processes (business process name, the parent
company, the parent industry, the business process goals, the business process steps and
alternative paths)
b. Context Aspectization Module: this module models the different context items related to a specific
industry in terms of Aspects for the sake of reusability across the different industries
c. Context Classification Module: this module classifies the contextual aspects related to a specific
industry and consequently the contextual items under these aspects into the four main contextual layers
identified in the solution methodology (immediate, internal, external and environmental context). The
classification is retrieved from the knowledge base of the industry and is already defined by the
industry expert at the industry definition phase.
d. Business Process Modeling Module: this module models the business process in terms of a finite state
machine that can cater for concurrent finite state machines running together and can take more than
one contextual event at a time as an input to do its configuration based on those events.
e. Business Process Simulation Module: this module generates a certain contextual case and simulates
how the business process will alter its path according to the given contextual situation. The business
process listens through JCAF listeners to the contextual items of interest to this business process and
according to the contextual state the most appropriate recommendation, which is modeled as a finite
state machine transitional condition, is chosen. The link between the context items and a business
process is a goal-oriented link. During the industry definition the industry expert defines the contextual

47
items that are related to his/her industry and identifies the contextual aspect and contextual layer to
which they belong (e.g. check-in counters items belong to the material utilization aspect under the
immediate layer) and during the company definition phase the company expert links the contextual
layers with company goals through these two links. A context item can be directly linked to a specific
goal. Hence, the context items that the business process listens to and according to which takes its
decision are the ones related to the goals that the business process contributes in achieving.
f. Knowledge Base Management Module: is responsible for retrieving, updating and deleting all the data
in the knowledge base of an industry, a company or a specific business process
The default JCAF part of the system is responsible for sensation of context through different types of
context sensors. We added to this set some additional readers to read from the knowledge bases of the
different industries, companies and business processes.
The system can be integrated with different types of back-ends shown in the diagram above which
currently provide, or may provide in the future, important data for any application that will implement our
solution methodology.
48
3.2. Framework Specifications
This section details the specification of the Context-aware Aspectized Goal Driven Business Process Modeler
Framework which was developed in this research as a proof of concept for the solution methodology that was
described in the above section. The main features and design elements of the framework are listed below.
3.2.1. Knowledge Base
This section describes how the framework entails accumulating knowledge about new industries, new companies,
new business processes, and new contextual aspects so that it can apply the idea of modeling context of business
processes in terms of aspects and goal-driven modeling of business processes and configuration as described in the
solution methodology. The knowledge accumulation incorporates the following;
Industry Definition
Industry Contextual Aspects and Variable Definition
Industry Contextual Classification Suggestion
Company Definition
o Company Goal Matrix Definition
o Company Goals and Context Association
o Business Processes Definition
3.2.1.1. Industry Definition
The business process expert can simply define a new industry through a simple graphical user
interface (depicted in figures 11, 12 and 13)

49
Home | New Industry
Create New Industry
Industry Definition
Context Elements Definition
Cancel
Industry Definition
Contextual Aspects
Save & Next
* Industry Name
Kindly select the contextual aspects that are related to your industry
Material Utilization Human Resource Utilization
Human Resource Experience Level Organization strategies
Risk Factors
Industry Regulations
Timing/Season
Location
Context Classification
Figure 11: Industry Definition Initial Form
Home | New Industry
Create New Industry
Industry Definition
Context Elements Definition
Cancel
Context Classification
Save & Next
* Industry Name
Kindly select for each contextual aspect the context layer that fits it in your industry
Material Utilization
Location
Context Classification Airlines
Contextual Aspect Contextual Layer
Back
Figure 12: Industry Context Classification

50
Home | New Industry
Create New Industry
Industry Definition
Context Elements Definition
Cancel
Context Elements Definition
Context Elements
Save & Next
* Industry Name
Kindly enter the context variables important for your industry under
the relevant contextual aspect
Material Utilization Aspect
Timing/Season Aspect
Location Aspect
Airlines
Back
Context Variable Name
Context Threshold
Max Value
Min Value
The Threshold defines the boundaries of these contextual elements
to be within normal value
Location Aspect
Context Variable Name
Context Threshold
Max Value
Min Value
The Threshold defines the boundaries of these contextual elements
to be within normal value
Context Classification
Figure 13: Industry Contextual Variables
First the business expert just enters the industry name and this action triggers the creation of an industry folder
which will allow all the data files related to this industry to be loaded whenever the system runs a business process
related to this industry.
3.2.1.2. Industry Contextual Aspects Definition
The second step is defining the contextual aspects that are relevant to this industry. From our study of business
processes and our business modeling experience we identified the contextual aspects that are relevant to the industry
and hence are generally relevant for all companies within the industry. This is why we ask the business expert to
define the relevant contextual aspects on an industry level and not a company level as per the form in figure 11. The
implemented framework focuses on certain contextual aspects as described earlier yet it is flexible and can apply to

51
more contextual aspects. Once this step is completed we move to the next step which is defining exact contextual
variables under the above mentioned contextual aspects as depicted in figure 13. For example if in the airlines
industry the business expert chose the material utilization aspect as an important contextual aspect for the industry,
s/ he can define contextual variables like Check-In Counters, Luggage Loaders as contextual variables under this
contextual aspect. The framework requests the business expert to enter threshold values (minimum and maximum
values) for those context variables so that whenever the contextual sensors that sense the items detect out-of-
boundaries values they trigger an alteration that needs to apply to the business process and in that case, it shouldn’t
flow in the normal flow scenario.
3.2.1.3. Industry Context Classification
The classification of the industry contextual aspects into the four layers of Rosemann is important to identify the
level at which the contextual aspects affect the business processes for a specific company under the defined industry.
As explained earlier in the solution methodology section, this cannot be an automatic classification as it varies with
industry so only the industry experts are the ones allowed to define this classification on the form depicted in figure
12 above.
3.2.1.4. Company Definition
The company definition is the process of adding companies that have specific goals and specific business processes
under a specific industry that is already defined by the business experts. The company is simply composed of a
name, goals list (i.e. list of strategic goals, e.g. Increase profit) along with their sub goals (operational goals that will
increase profit) and a list of goal-oriented business processes. The company definition is reached by accumulating
the above mentioned knowledge through a series of graphical user interfaces (depicted in figures 14, 15, 16, 17, 18,
and 19);

52
Home | New Company
Create New Company
Cancel
Company Goals Definition
Strategic Goal Definition
Save & Next
* Industry Name
Kindly define the strategic goals of your business
Airlines
Back
Goal
Priority
Company Definition
Company Business Processes
Company Goals
* Company Name British Airways
Target Value
(e.g. Profit Maximization)
(e.g. 1 Million)
Time Interval for Target (e.g. Select Number of Years)
(Note: One is highest priority)
Define Another Strategic Goal
Figure 14: Company Initial Definition
Home | New Company
Create New Company
Cancel
Company Goals Definition
Strategic Goal Definition
Save & Next
* Industry Name
Kindly define the strategic goals of your business
Airlines
Back
Goal Profit Maximization
Priority
1 Million
Company Definition
Company Business Processes
Company Goals
* Company Name British Airways
Target Value
(e.g. Profit Maximization)
(e.g. 1 Million)
Time Interval for Target (e.g. Select Number of Years)1
1 (Note: One is highest priority)
Define Another Strategic Goal
Strategic Goal Definition Kindly define the strategic goals of your business
Goal
Priority
Target Value
(e.g. Profit Maximization)
(e.g. 1 Million)
Time Interval for Target (e.g. Select Number of Years)
(Note: One is highest priority)
Define Another Strategic Goal
Figure 15: Company Strategic Goals Definition

53
Home | New Company
Create New Company
Cancel
Company Goals Definition
Operational Goals
Save & Next
* Industry Name
Kindly define the operational goals sub goals for each strategic goal defined
Airlines
Back
Strategic Goal : Profit Maximization
Company Definition
Company Business Processes
Company Goals
* Company Name British Airways
Select From an Existing Goal Create New Goal
Figure 16: Company Operational Goals Definition
Home | New Company
Create New Company
Cancel
Company Goals Definition
Operational Goals
Save & Move to Next Strategic Goal
* Industry Name
Kindly define the operational goals sub goals for each strategic goal defined
Airlines
Back
Strategic Goal : Profit Maximization
Priority
Company Definition
Company Business Processes
Company Goals
* Company Name British Airways
Target Value
Time Interval for Target(Note: Select Number of months)
(Note: a priority of sub goal cannot exceed the priority of its parent goals)
Define Another Operational Goal Under Strategic Goal
Operational Goal
Create New Goal
Operational Goals Kindly define the operational goals sub goals for each strategic goal defined
Strategic Goal : Profit Maximization
Priority
Target Value
Time Interval for Target(Note: Select Number of months)
(Note: a priority of sub goal cannot exceed the priority of its parent goals)
Define Another Operational Goal Under Strategic Goal
Operational Goal
Create New Goal
Save Last Goal
Figure 17: Company Strategic Goals Definition

54
Home | New Company
Create New Company
Cancel
Company Goals Definition
Operational Goals
Save & Move to Next Strategic Goal
* Industry Name
Kindly define the operational goals sub goals for each strategic goal defined
Airlines
Back
Strategic Goal : Profit Maximization
Company Definition
Company Business Processes
Company Goals
* Company Name British Airways
Define Another Operational Goal Under Strategic Goal
Operational Goal
Select Existing Goal
Operational Goals Kindly define the operational goals sub goals for each strategic goal defined
Strategic Goal : Profit Maximization
Priority
Target Value
Time Interval for Target(Note: Select Number of months)
(Note: a priority of sub goal cannot exceed the priority of its parent goals)
Define Another Operational Goal Under Strategic Goal
Operational Goal
Create New Goal
Save Last Goal
Figure 18: Ability to re-use predefined goals
Home | New Company
Create New Company
Cancel
Company Goals – Context Layer Association
Save & Go to Steps Definition
* Industry Name Airlines
Back
Company Definition
Company Business Processes
Company Goals
* Company Name British Airways
Business Process Goals
Strategic Goals : Profit Maximization
Kindly define which goals are affected by which contextual layers
Maximize Profit Maximize Quality of Service Face Competition
Increase Customers
Lower Operational Goals
Lower Employment Costs
Increase Customer Satisfaction
Increase Flexibility
Increase Partnerships
X
X
X
X X
X
X
Immediate
Immediate
Immediate
Immediate
Immediate
Immediate
Immediate
Immediate
Immediate
Immediate
Immediate
Immediate
Immediate
Immediate Immediate
Immediate
Immediate
Immediate
Figure 19: Goals to Contextual Layers Association

55
3.2.1.5. Company Structure Architecture
The company knowledge structure architecture is represented in figure 20 and a specific example is shown in figure
21.
Industry
Company A Company B Company C
Goals Matrix (Strategic-
Operational Goals)
Business Process A
Business Process B
Business Process C
Figure 20: Company General Structure

56
Airlines
British Airways
Goals Business Processes
Check In ProcessMaximize Profit Quality of Service Beat Competition
Attract More
Customers
Lower
Operational
Cost
Lower
Employment
Cost
Increase
Customer
Satisfaction
Increase
Flexibility with
Passengers
Increase
Customer
Satisfaction
Increase
Partnerships
Operational
Goal
Strategic Goal
Figure 21: Company Example
The company structure should consist of the following;
Parent Industry; it is essential that a company belongs to one of the predefined industries in the
framework so that we can identify the contextual aspects, layers and variables that will be considered
and monitored for the business processes running for this company
Company name; this is just a company identification that should be unique within each industry

57
Company Goals Matrix; this matrix shows the strategic goals important to a company and the
operations that achieve them. It is represented in our framework as 2 dimensional matrixes as depicted
in Table 1.
Table 1, Company Goals Matrix
Strategic Goals/
Operational Goals
Maximize Profit Quality of Service Face Competition
Increase customers √
Lower Operational
Costs
√
Lower Employment
Costs
√
Increase Customer
Satisfaction
√ √
Increase Flexibility
with Passengers
√
Increase Partner√
ships
√
In real business the relationship between the goals and other goals is many to many, however in our framework and
for simplicity, we identify the sub operational goals that can contribute to more than one strategic goal. But we do
not model the relationship between the strategic goals and each other (i.e. a strategic goal cannot be a sub goal to
another strategic goal) and we maintain the goals at two levels of depth while in real business they can go to endless
levels.
For each goal whether strategic or operational the company expert should define a target over time for the goal as
well as for the goal priority. The target over the time is not currently utilized further in our framework but it should
help future research work in an advanced assessment of the solution methodology’s effectiveness. It could identify
how appropriate modeling of context of business processes as aspects and binding them to other business processes

58
through goals-matching contributes to the achievement of targets. Goal priority is important as in some cases the
contextual facts would reflect a perplexing situation where a certain business process recommendation/configuration
maximizes a certain goal yet harms another goal. Hence, the decision in this case should be taken based on the
priority of the goals. A logical constraint in our goal matrix model is that the priority of a sub goal should be equal
or less than the priority of its parent goal.
Goals to Contextual Layers Association;
This association is essential as it defines which goals are associated with which contextual layers so the
immediate layer that should be concerned with context related to the direct flow of the business
processes would affect certain goals in the company goals matrix that fall on this level which affects
the direct flow of the process. The association is done on this level also to identify the amount of
impact the context would have on the business as probably more external goals related to industry new
regulations might have a cross sectional impact of adding steps to all business process while immediate
context would be most probably related to operational goals. Hence, linking the goals matrix to the
contextual layers level is the easiest way for the business domain expert and for the framework to
determine the level of impact that the aspects under this contextual layer would have on the different
business processes.
Company Business Processes;
Now the last part of the company representation is the list of business processes under the company. The
business processes are represented in our framework in terms of a finite state machine as shown in the figure 22.

59
Check In Process
Standing at Business Counter
Standing at Economic Counter
Standing at Luggage Counter
Business
Passenger(Normal Check
In)
Economic
Passenger(Normal Check
In)
Web Check In
Identity Check Other Documents Validation
Counter AvailableCounter Busy
Valid
Not Valid
Go to Passport Security
Seat Choice
Valid
Not Valid
Weighting Luggage
Seat Chosen
Issue Weight Fine
Overweight
Issue Luggage Tags
Handover Passegner Boarding Pass and Luggage Tags
Normal Weight
Boarding Pass Issued
Fine Payed
Standing at Fine Counter
Fine IssuedCounter Busy
Counter Busy
Counter Available
Kiosk Check In Counter
Passenger Kiosk Check In
Counter Busy
Auto Docs Validation
Auto Boarding Pass Issuance
Scan Documents
Valid Documents
Boarding Pass Issued
Weighting Luggage
Issue Weight Fine
Overweight
Issue Luggage Tags & Take luggage
Normal Weight
Standing at Fine Counter
Fine Issued
Counter Busy
Figure 22: Check-in Business Process as Finite State Machine

60
The business processes are defined by business process experts inside the company through the following graphical
user interfaces depicted in figures 23, 24 and 25
Home | New Company
Create New Company
Cancel
Business Process Definition
Save & Go to Steps Definition
* Industry Name Airlines
Back
Company Definition
Company Business Processes
Company Goals
* Company Name British Airways
Business Process Goals
Strategic Goals : Profit Maximization
Kindly pick up from the list of previously defined for the Company
* Business Process Name
Maximize Profit Maximize Quality of Service Face Competition
Increase Customers
Lower Operational Goals
Lower Employment Costs
Increase Customer Satisfaction
Increase Flexibility
Increase Partnerships
Related
Related
Related
Related Related
Related
Related
Figure 23: Business Process Definition - Goals Stage
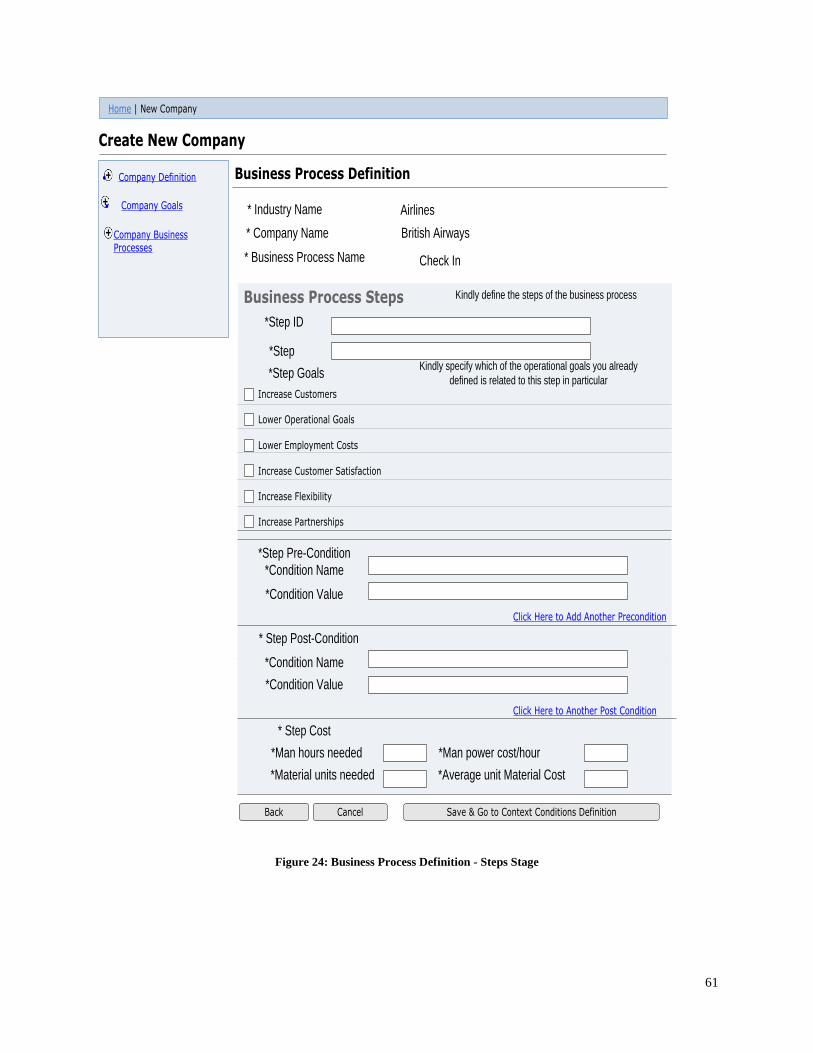
61
Home | New Company
Create New Company
Cancel
Business Process Definition
Save & Go to Context Conditions Definition
* Industry Name Airlines
Back
Company Definition
Company Business Processes
Company Goals
* Company Name British Airways
Business Process Steps Kindly define the steps of the business process
* Business Process Name
Increase Customers
Lower Operational Goals
Lower Employment Costs
Increase Customer Satisfaction
Increase Flexibility
Increase Partnerships
Check In
*Step
*Step GoalsKindly specify which of the operational goals you already
defined is related to this step in particular
*Step ID
*Step Pre-Condition
*Condition Name
*Condition Value
* Step Post-Condition
*Condition Name
*Condition Value
Click Here to Add Another Precondition
Click Here to Another Post Condition
* Step Cost
*Man hours needed *Man power cost/hour
*Material units needed *Average unit Material Cost
Figure 24: Business Process Definition - Steps Stage

62
Home | New Company
Create New Company
Cancel
Business Process Definition
Save & Define Next Transition
* Industry Name Airlines
Back
Company Definition
Company Business Processes
Company Goals
* Company Name British Airways
Business Process Steps Transition
Kindly define the transitions of steps of the business process
* Business Process Name Check In
*Step *Step ID
*Step Transitional Condition
*Condition Element Maximum Value
Click Here to Add Another Contextual Condition
1 Start
The contextual elements we suggest for you
are a result of comparison between the step goals
and the goals to context map of your company Context Element
Step post-condition Valid Traveler
AndLogical connector
Click Here to Add Another Post ConditionClick Here to Add Another Contextual Condition
Contextual Condition
Check In Counters
*Condition Element Minimum Value
Logical connector And
*Next Best Step
Given the Above Conditions What is the Next Best Step to go to
Kiosk Login In
Save & Go to Next Step
Figure 25: Business Process Transitional Conditions Definition
We have a goals matrix for each business process and for each step within the business process we define its
relevant goals as well as its preconditions and post conditions, i.e. The conditions required before moving into this
step and the conditions with which we exit the step, respectively. In addition, we define for each business process
step, a cost parameter (which consists of the human resources cost and material cost needed for this business process
step to execute properly). After defining all the steps we start the transition conditions definition phase, the transition

63
condition is used to define the post conditions and contextual situation under which the business process would
move from one state to another state and it has a value and the next step identifier to define the next best move and
in this way we incorporate the different possible alternative paths of a process based on the steps’ goal-orientation
and different contextual situations that could take place. [For example, in the check- in process on the condition that
the passenger visa is not valid then the next step would be “validate with passport control” while if the condition
value is valid, the business process would move into the next step of seat choice]. For the transition conditions, the
system compares the business step goals and the contextual layers, aspects and elements related to these goals and
for each contextual element the business process expert is asked to define ranges of values for it and the next best
move in case of each range and this is defined in the form of a transitional condition as depicted in figure 25above.
3.2.2. Knowledge Base Architecture
The previous section described how the knowledge base is defined by business experts in an easily updatable
format. This section describes how the framework saves the knowledge base of industries, companies, business
processes and contextual aspects as well as their structure.
The overall structure can be best described through figure 26;

64
Industry
Company A
Goals
Business Processes
Process 1
Strategic Goal 1 Strategic Goal2
Operational
Sub Goal 1
Operational Sub
Goal 2
Operational
Sub Goal 1
Company B Company C
Operational Sub
Goal 2
Process 2
Immediate
Context
Internal
Context
External
Context
Environme
ntal
Context
Contextual
Aspect 1
Contextual
Aspect 2
Contextual
Aspect 3
Contextual
Aspect 4
Contextual
Aspect 5
Context
Element/
Variable 2
Context
Element/
Variable 3
Context
Element/
Variable 1
Context
Element/
Variable 4
Context
Element/
Variable 5
Context
Element/
Variable 6
Figure 26: Knowledge Base Structure

65
3.2.2.1. Industry Repository
Each Industry defined by business domain experts will have a repository (a folder) created for it by the
industry name. The industry folder shall have the following constituents;
The Contextual definition XML file defines for each layer of the four layers of contextual layers
(Immediate, Internal, External and Environmental Context), the list of contextual aspects that are under
this layer. Each contextual aspect can belong to one and only one contextual layer. The contextual aspects
that we focus in our solution methodology are as follows;
o Non human resource utilization.
o Human resource utilization.
o Human resource experience level.
o Organizational strategies (The strategies of the organization on which the business process is
running (e.g. whether the strategy is cost cutting or quality focused).
o The risk factors associated with a process.
o Industry regulations and practices affecting a process.
o Timing/Season
Each contextual variable under the contextual aspect is defined as explained earlier in the solution methodology.
Hence, the non-human resource utilization can include a machine counter variable under it and the variables
represent the measurable items that will be continuously monitored as they affect the different business processes
under the defined industry. The contextual knowledge definition is saved in an XML file under the industry
repository folder. The structure of the contextual knowledge XML file is described in Appendix I.
3.2.2.2. Company Repository
Companies folders; whenever the business domain experts define a new company under a specific
industry a company repository which is basically a company folder is created for this company; the
company will have a number of constituents:
o Company Goals Matrix; which is basically the list of strategic and operational goals and their
associations with each other as well as what level of contextual layer should affect each goal

66
o The goals matrix XML file structure is described in Appendix II.
o Company Business Processes: which are basically XML files each XML file representing
one of the business processes of the company
Table 2, an Example of a Company Goals Matrix
Strategic Goals/
Operational Goals
Maximize
Profit
Quality of
Service
Face Competition Contextual layer
Increase customers √ Immediate, Internal
Lower Operational
Costs
√ Internal
Lower
Employment Costs
√ External
Increase Customer
Satisfaction
√ √ Immediate, Internal,
External
Increase Flexibility
with Passengers
√ Internal
Increase Partner√
ships
√ External, Environmental
3.2.2.3. Company Business Processes Repository
Company Business Processes ; each company will have a repository of business processes which is a
folder for company business processes and inside it each business process will have an XML file defining
the details of the business process in terms of its goals and the steps that can be retrieved later on for
running this business process. The Business process XML file structure is described in Appendix III.
3.2.2.4. Flexibility of the Knowledge base architecture
The way the knowledge base is structured in the form of repositories and XML files defining industries, companies,
goals, contextual aspects and business processes makes it easy to add any new industry or company or goal or
contextual aspects. Anything from industry definition to steps’ transitional conditions could be edited at any point in

67
time through simple editing in the well-structured XML files described below or through requesting to edit from the
graphical user interface provided for the business domain experts as an easy knowledge base definition and editing
tool. According to the user’s choice the appropriate information is fetched and presented in forms similar to the
ones depicted earlier in the knowledge base definition section. Yet the forms are preloaded with the data that is
already in the knowledge base and they are displayed in an editable format to allow the business experts to change
them whenever they like as change is inevitable in today’s business especially when related to company goals and
business processes.
3.2.3. Context Detection and Business Process Configuration
So far the definition, structuring and update of the knowledge base that will enable us to model the context of
business processes in terms of aspects and business processes in terms of configurable finite state machines that
register their interest in certain context variables (according to a goal matching technique then alter their behavior
according to contextual updates), were discussed. In this section we discuss in more details how the prototypical
framework we built as a proof of concept caters for context detection and modeling, then business process modeling
and configuration, in a manner that demonstrates the solution methodology discussed in the first part of this chapter.
1.2.3.1. Context Detection and Modeling
The context modeling and detection was implemented through JCAF (the Java Context-aware Framework). The
JCAF has a generic context item class which represents the contextual items that can be detected through the JCAF
monitor classes. The JCAF monitor and listener classes are classes that represent the different kinds of context
monitors whether physical monitors (e.g. sensors monitoring temperatures, machines reading bar codes, etc….) or
virtual monitors (e.g. monitors reading information from databases). New context monitors can be added to extend
the abstract context monitor classes to detect any type of context and the listener classes to listen to specific
contextual events. Within our framework we use the default monitors and simulate them as if these monitors are
actually connected to sensors and databases by adding a randomly generated event feeding input into the context
listener objects.

68
3.2.3.1.1. Context Detection
JCAF also has a context item abstract class which can be extended by adding new context item types to the
context item package. Hence, our implemented framework extends the context item and defines the Context Item
Generic class (depicted in figure 27) which can carry a contextual variable as defined in our knowledge base.
GenericContextItem
AbstractContextItem(JCAF Class) ContextItem(JCAF Interface)
XMLSerializable
Figure 27: GenericContextItem Class
The new GenericContextItem class main functionality is to represent any contextual item that might be of interest to
the industry as defined by the industry experts (For example in the airlines industry an object of the context could
represent the check-in counter, another could represent luggage loaders, another could represent a certain airlines
strategy). Hence, the class should have attributes flexible so that its instances can represent the various context
items.
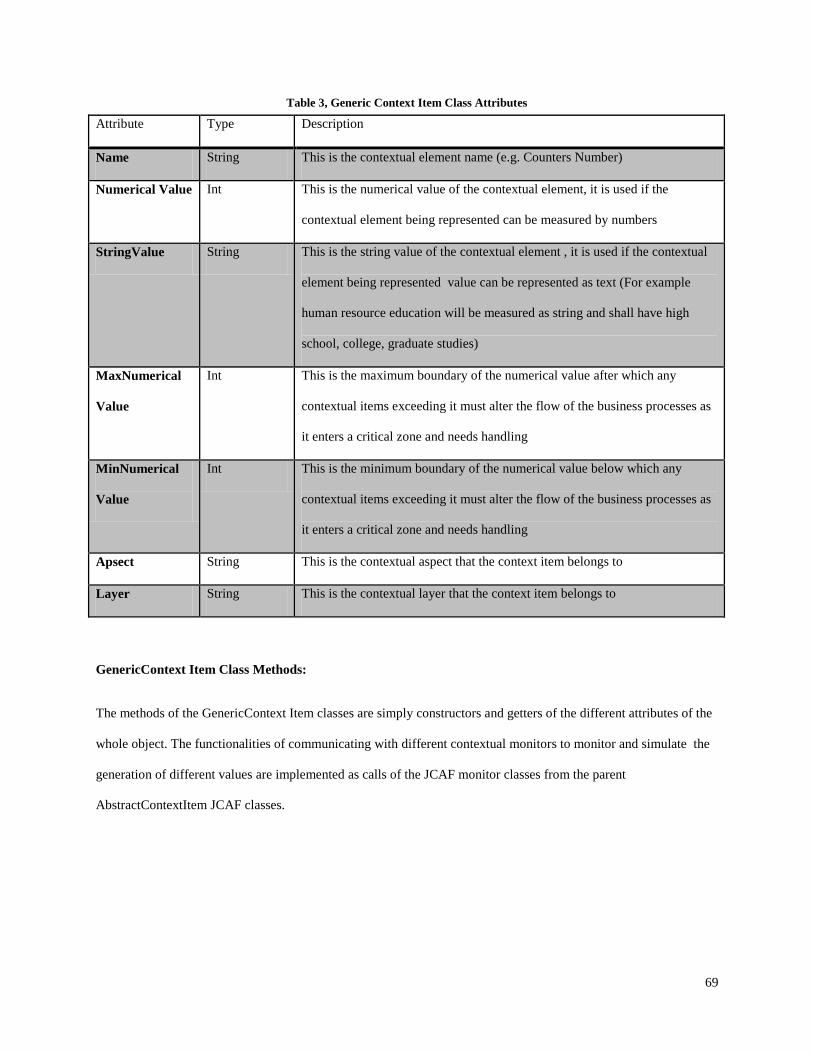
69
Table 3, Generic Context Item Class Attributes
Attribute Type Description
Name String This is the contextual element name (e.g. Counters Number)
Numerical Value Int This is the numerical value of the contextual element, it is used if the
contextual element being represented can be measured by numbers
StringValue String This is the string value of the contextual element , it is used if the contextual
element being represented value can be represented as text (For example
human resource education will be measured as string and shall have high
school, college, graduate studies)
MaxNumerical
Value
Int This is the maximum boundary of the numerical value after which any
contextual items exceeding it must alter the flow of the business processes as
it enters a critical zone and needs handling
MinNumerical
Value
Int This is the minimum boundary of the numerical value below which any
contextual items exceeding it must alter the flow of the business processes as
it enters a critical zone and needs handling
Apsect String This is the contextual aspect that the context item belongs to
Layer String This is the contextual layer that the context item belongs to
GenericContext Item Class Methods:
The methods of the GenericContext Item classes are simply constructors and getters of the different attributes of the
whole object. The functionalities of communicating with different contextual monitors to monitor and simulate the
generation of different values are implemented as calls of the JCAF monitor classes from the parent
AbstractContextItem JCAF classes.

70
Table 4, Generic Context Item Class Methods
Method Return Description
getName String This returns the contextual element name (e.g. Counters Number)
getNumericalValue Int This returns the numerical value of the contextual element, it is used if
the contextual element being represented can be measured by numbers
getStringValue String This gets the string value of the contextual element , it is used if the
contextual element being represented value can be represented as text
(For example human resource education will be measured as string and
shall have high school, college, graduate studies)
getMaxNumerical
Value
Int This gets the maximum boundary of the numerical value after which any
contextual items exceeding it must alter the flow of the business
processes as it enters a critical zone and needs handling
getMinNumerical
Value
Int This gets the minimum boundary of the numerical value below which any
contextual items exceeding it must alter the flow of the business
processes as it enters a critical zone and needs handling
getAspect String This gets the contextual aspect that the context item belongs to
getLayer String This gets the contextual layer that the context item belongs to
GenericContextItem Void This is the constructor of the objects of the class
toXML String Returns the object value in form of XML
GetAccuracy Double Returns the accuracy level of the monitor sensing this contextual item,
this a JCAF functionality inherited from the parent class. It is quite
important to disregard the contextual item whose monitors have a low
accuracy

71
3.2.3.1.2. Context Modeling
The contextual items in our framework are aspectized (i.e. represented in terms of aspects) which is our extension to
JCAF. In our framework we use AJDT (AspectJ Java Development Tool) which is an add-on to java eclipse to
support aspect development. Under the JCAF context items package we define the following nine aspects;
Human Resources Experience Level
Human Resources Utilization
Industry Regulations
Location
Material Utilization
Organization Strategy
Risks
Season
Timing
The framework is extensible to add more aspects whenever needed. The aspect is simply associated with an
industry, and the contextual layer it affects as well as a list of Generic Context Item objects which represents the
contextual elements under this layer are included. For example the material utilization aspect belongs to the Airlines
industry. It is classified (as per the industry knowledge base defined by business experts and described in the
knowledge base section of this chapter) and has contextual items which are check-in counters and luggage loaders.
The aspect enables us to do calculations on the context item values and weighting averages for their values on the
point cut of calling the context event listeners. These are called from the main simulation class (Context Tester
class) which simulates the running of this framework. The context aspect class is depicted in figure 28 below.

72
-Industry
-Contextual Layer
-GenericContextItems
<<Aspect>> HRUtilization
Figure 28 : Context Aspect Example
3.2.3.2. Context Classification
The classification of the contextual items depends on the industry and is defined by industry experts as per
the knowledge base definition as depicted in figure 29. Thus, for every industry there is a different
contextual classification instance. The connection between contextual layers and the goals take place on the
company level as the goals and priorities matrix of each company vary. Hence, the second link of
contextual layers to goals takes place as a part of the company modeling which will be described in the
following sections;
Contextual Layer
Aspect
Aspect
Aspect
Goal
Goal
Goal
Contextual Variable
Contextual Variable
Figure 29: Contextual Layers Relationships
The nine contextual aspects (Human Resources Experience Level, Human Resources Utilization, Industry
Regulations, Location, Material Utilization, Organization Strategy, Risks, Season, and Timing) that our
prototype is focused on are distributed among the four contextual layers (Immediate, Internal, External and
Environmental). The relationship between contextual aspects and contextual layers is many to many (i.e.

73
one contextual aspect can belong to more than one contextual layer and the contextual layer can be related
to more than one contextual aspect) as shown in table 5 below;

74
Table 5, Contextual Aspects and Layers Matrix
Immediate Layer Internal Layer External Layer Environmental Layer
Material
Utilization
Aspect
√ √
Human
Resource
Utilization
aspect
√ √
Human
Resource
Experience
Aspect
√
Organizational
Strategies
Aspect
√
Risks Aspect √ √
Industry
Regulations
Aspect
√
Timing Aspect √
Season Aspect √
Location
Aspect

75
The relationship between contextual layers and goals is defined by business process experts as per the
knowledge base definition and is a many to many relationship (i.e. one contextual layer might affect many
business goals and one business goal can be affected by many contextual layers).
The context classification class is not the normal automatic classifier class that has one of the known
classification algorithms. The classification class has a much simpler algorithm which is as follows;
1. Read from contextual aspect XML file the relationship between layers , aspects and contextual items
under aspects
2. These are accumulated into lists in the classification class, thus we have four lists in the classification
o Immediate Context List; consists of a list of aspects under immediate context layer and each
aspect in the list consists of the list of contextual elements under this aspect as per the contextual
aspect file which exists under the industry folder of the industry currently being examined as
depicted in table 6 which represents the context classifier class attributes.
o Internal Context List; consists of a list of aspects under the internal context layer and each aspect
in the list consists of the list of contextual elements under this aspect as per the contextual aspect
file which exists under the industry folder of the industry currently being examined as depicted in
table 6 which represents the context classifier class attributes.
o External Context List; consists of a list of aspects under the external context layer and each aspect
in the list consists of the list of contextual elements under this aspect as per the contextual aspect
file which exists under the industry folder of the industry currently being examined as depicted in
table 6 which represents the context classifier class attributes.
o Environmental Context List; consists of a list of aspects under the environmental context layer
and each aspect in the list consists of the list of contextual elements under this aspect as per the
contextual aspect file which exists under the industry folder of the industry currently being
examined as depicted in table 6 and 7 which represents the context classifier class attributes and
methods.

76
Table 6, Context Classifier Class Attributes
Attribute Type Description
Industry String This is simply the name of the industry that this context classification
represent
Immediate
Context
List of Strings This is list of the names of the contextual aspects related to the immediate
context layer as per Rosemann Onion model described in the solution
methodology section
Internal Context List of Strings This is list of the names of the contextual aspects related to the internal
context layer as per Rosemann Onion model described in the solution
methodology section
External
Context
List of Strings This is list of the names of the contextual aspects related to the external
context layer as per Rosemann Onion model described in the solution
methodology section
Environmental
Context
List of String This is list of the names of the contextual aspects related to the
environmental context layer as per Rosemann Onion model described in the
solution methodology section

77
Table 7, Context Classifier Class Methods
Method Return Type Input Description
GetImmediate
Context
List of Strings Industry Name Returns list of the names of contextual aspects
related to the immediate context layer as per
Rosemann Onion model described in the solution
methodology section
GetInternal Context List of Strings Industry Name Returns list of the names of contextual aspects
related to the internal context layer as per
Rosemann Onion model described in the solution
methodology section
GetExternal Context List of Strings Industry Name Returns list of the names contextual aspects
related to the external context layer as per
Rosemann Onion model described in the solution
methodology section
GetEnvironmental
Context
List of Strings Industry Name Returns list of the names contextual aspects
related to the environmental context layer as per
Rosemann Onion model described in the solution
methodology section
ContextClassifier Constructor Industry Name This is the constructor of the class, which reads
the XML file parse it and set it to the different
class attributes
getContextClassifier ContextClassifier
Object
Industry Name Return the whole context classifier object
3.2.3.3. Company Structure and Goals Modeling

78
The company under a specific industry should be well structured and modeled in our prototypical framework as it
acts as the container for the business processes as well as the business goals which are the back bones of our
business process modeling methodology. The company structure is depicted in figure 30 below.
Industry
Company
Goals Business Processes
Process 1Strategic Goal Strategic Goal Strategic Goal
Operational
Sub Goal
Operational
Sub Goal
Operational
Sub Goal
Operational
Sub Goal
Operational
Sub Goal
Operational
Sub Goal
Operational
Sub Goal
Step
Step
Step
Transition
Condition
Transition
Condition
Transition
Condition
End
Transition
Condition
Figure 30: Company General Structure
In the prototypical framework that we designed, and in accordance with our solution methodology described earlier
in this chapter, we have the following classes;
Company Class
The company class represents a specific company under a specific industry. It is a container that has other
objects so that an instance of this class would represent the company with all its needed information. The
information is available so that when we simulate a business process related to these companies all
information related to the company would be there to help take the right decision related to the business
process configuration. Table 8 and Table 9 below represents the company class attributes and methods.

79
Table 8, Company Class Attributes
Attribute Type Description
Company Name String This is the company name
Industry Name String This is the industry name, it will be used to retrieve the contextual layers and
aspects related to this industry by calling the context classifier method and
giving these methods the industry name as an input
Goal Matrix A List of
objects of the
Goal Matrix
Class
This represent the list of strategic goals and under them the operational sub
goals of the industry
Business
Processes
List of
Business
Processes
List of objects of type business processes which represent the business
processes under this company

80
Table 9, Company Class Methods
Method Return Type Description
Company None This is the default constructor which parse the company repository, reads
the company’s goal matrix xml file and fill the goal matrix object and
parse each business process xml file and populate the business processes
object with the data accordingly
Company None This another constructor which takes the attributes as an input to its
methods
getCompanyName String Returns the company name
getIndustry Name String Returns the industry name, it will be used to retrieve the contextual layers
and aspects related to this industry by calling the context classifier method
and giving these methods the industry name as an input
getGoal Matrix An instance of
the Goal
Matrix Class
Returns list of strategic goals and under them the operational sub goals of
the industry
getBusiness
Processes
List of
Business
Processes
Returns List of objects of type business processes which represent the
business processes under this company
Goals Matrix Class
The goals matrix class represents the strategic goals and their operational sub goals and the relationships
between the goals and each other. For simplicity reasons the prototype focuses on one type of relationship
between goals which is the parent child relationship and only one depth level of goals. The specific
company under a specific industry is a container that has other objects so that an instance of this class
would represent the company with all its needed information. This information is available so that when we
simulate a business process related to these companies all the information related to the company would be

81
there to help take the right decision related to business process configuration. Figure 31 represents the goals
matrix. Table 11 and Table 12 below represents the goal matrix class attributes and methods.
Goals
Strategic Goal Strategic Goal Strategic Goal
Operational
Sub Goal
Operational
Sub Goal
Operational
Sub Goal
Operational
Sub Goal
Operational
Sub Goal
Operational
Sub Goal
Operational
Sub Goal
Figure 31: Graphical Representation of the Goals Matrix

82
Table 10, Goals Matrix Template
Strategic Goals/
Operational Goals
Strategic Goal 1 Strategic Goal 2 Strategic Goal 3
Operational Goal 1 √
Operational Goal 2 √
Operational Goal 3 √
Operational Goal4 √ √
Table 11, Goals Matrix Class Attributes
Attribute Type Description
Company String This attribute represents the company to which this goals matrix belongs to
MainGoal Goal This represents the strategic goal
Related goals List of Goals This represents the operational goals under the strategic main goal
From the goals structure we realize that each company will have a list of goal matrix objects and each goal matrix
represents only one strategic goal and its operational sub goals as depicted in table 10 above.
Table 12, Goals Matrix Class Methods
Method Return Type Description
GoalsMatrix None This is a constructor that parse XML files and get the objects
GoalsMatrix None This is a constructor that takes the attributes as input items to it
getGoalsMatrix Goals Matrix
object
This method returns the whole goals matrix

83
Goal Class
The Goal class simply represents one goal whether strategic or operational goals and is the basic element of
the Goal Matrix Class. Tables 13 and 14 represent the goal class attributes and methods.
Table 13, Goal Class Attributes
Attribute Type Description
isStrategic Boolean This attribute defines whether the goal is strategic goal or operational goal
Id Int A unique identifier for the goal
Goal Name String This represents the goal (e.g. Increase profile)
Target Int This represents the target in a numerical value for simplicity
Time Int The time to achieve the target
Priority Int This represents the priority of the goal so that if we have conflicting goals
we consider the higher priority one and try to achieve it
Table 14, Goal Class Methods
Method Return Type Description
Goal None This is a constructor
getGoal Goal Returns the whole goal
getId Int A unique identifier for the goal
Goal Name String This gets the goal name (e.g. Increase profile)
Target Int This gets the target in a numerical value for simplicity
Time Int This gets time to achieve the target
Priority Int This gets the priority of the goal so that if we have conflicting goals we
consider the higher priority one and try to achieve it

84
Business Process Class
The Business Process Class represents the business process under a specific company under a specific
industry. The business processes are tightly coupled to goals and are represented as finite state machines to
make the simulation of the different alternative flows of a business process easy enough. We discuss in
more details the business process modeling in the next section.
3.2.3.4. Business Process Modeling
The business process in our solution methodology within the prototypical framework that was developed as a proof
of concept, is modeled as a finite state machine as depicted in figure 32.
Process
State 1
State 4
Transition Condition
State 2
State 3
ValidTransition Condition
Transition Condition
Transition Condition
Transition Condition
Transition Condition
Transition Condition
Transition Condition
Figure 32: Business Process as Finite State Machine

85
The benefits of modeling a business process as a finite state machine in our solution methodology and framework
may be stated as follows:
Steps can be mapped directly as states in the finite state machine
Transitional conditions to move from one step to another can be directly mapped to step pre-conditions and
post conditions. In addition it makes it easy to define all the different alternative passes for the business
process
Transitional conditions can also incorporate contextual item values and thus depend on certain contextual
item values as we move from one step to another
The Business Process Modeling Classes are as follows:
Business Process Class
This is a typical finite state machine representation, the only addition is having a goals matrix which will be
used in the goals matching process to identify which contextual elements affect which process according to
common goals to achieve the idea of context-aware goal-driven business process flexibility which is the
core benefit behind our solution methodology. Tables 15 and 16 represent the business process class
attributes and methods.
Table 15, Business Process Class Attributes
Attribute Type Description
BusinessProcessName String This is simply the name of the business process
Goals Matrix List Each Goals Matrix list represent a strategic goal related to the business
process and the operational sub goals under it
Step State List of Step
State Objects
This is a list of step objects that represent all the steps that form the
business process.

86
Table 16, Business Process Class Methods
Method Return Type Description
BusinessProcess None This is simply the default constructor of the business process and it
takes as an input Business Process Name , Industry name and
company name and parse the relevant XML file to generate the
required Business Process object
BusinessProcess None Another constructor which takes the attributes of the business
process object as input parameters
runBusinessProcess List of step ids
representing the
sequence of
steps taken in
the run
This is the function that shall be called from the simulation class to
run the business process given certain contextual evidence and it
produces the best sequence of steps for which the business process
is run. The algorithm and the input based on which the best
sequence of steps is decided will be described in detailed in section
V about Business Process Configuration
getBusinessProcess BusinessProcess This is a function that returns the business process instance
getBusinessProcessName String This is the function that retrieves the business process name
getGoal_Matrix Goal_Matrix This is the function that retrieves the goals matrix of the business
process
getSteps List of Business
Process Steps
This is the function that returns a list of all the steps of the business
process
contextChanged ContextEvent This is an override of the context change function in JCAF. The
functionality is overridden to make objects of type business process
listen to changes in Generic Context Items related to their goals as
per the JCAF methodology of monitoring context of an entity.

87
Step State Class
This class represents the individual step within a business process. It is implemented as a typical state of the
finite state machine. Each step has a name which also identifies what the step is about (e.g. Check
Passenger Identity). Each step is tightly bound to one or more of the operational goals that were defined to
be process goals. This is done to extend the goal orientation even on the step level to form a totally goal
driven business process model. For each step there are three important conditions defined as follows:
A Precondition: It is a condition or list of conditions that must be true before step execution. It is used
to double check that the transition was a correct transition (For example in the Check Passenger
Identity, it could be that counter personnel are available)
A Post-condition: It is a condition or list of conditions that becomes true after the step execution (For
example in the Check Passenger Identity, it could be that the passenger identity is valid)
A transition condition: It is list of conditions that is defined according to the current context
surrounding the step execution and the step post conditions to determine the next best step that the
finite state machine should move to. The definition of the transition condition is the trickiest part as it
involves the context of the business process. The definition of the transition condition goes according
to the following algorithm:
1) After defining the list of steps that constitute a business process
2) The system compares the goals of the business process step and the goals of the different
contextual layers through a simple comparison function specifically designed for that purpose
3) The system identifies the contextual aspects and elements affecting this step
4) The system asks the business process expert to determine the transitional conditions for every
step
5) The system allows the business process expert to create several possible transitions for every
step
6) The systems asks the business process expert to choose one or more post condition to relate it
to the transition

88
7) The system asks the business process expert to define the logical relationship between the
different post conditions (they are either ANDed or ORed together or some conditions are
ANDed and other conditions are ORed)
8) After finishing the choice of the post conditions that affect the transition, the system asks the
user to define the contextual conditions that should be incorporated in this transition
9) The systems displays to the user the list of contextual items that are related to the step
according to the goals comparison of step 2 of the algorithm
10) The business process expert can choose any subset of the contextual elements, give them
ranges and/or add them to the transition conditions
11) The system asks the business process expert to define the logical relationship between the
different contextual conditions ( they may be ANDed or ORed together or some conditions
may be ANDed and other conditionsmay be ORed)
12) After finishing the contextual conditions definition, the system asks the business process
expert to set the ANDing or ORing on the post conditions and the transitional conditions.
13) The system displays the list of conditions that s/he has chosen to be the constituents of the
transitions (e.g. The passenger document is valid and the check-in counters are from 1 to
200) for validation
14) The business process expert can edit the conditions during the validation step or directly
confirm the condition
15) Finally given that condition, the system asks the user to choose from the list of steps that
constitute the business process, the next best step to move to if the transitional condition turns
out to be true
16) The system allows the user to define several transitional conditions for the same step
17) The system ensures that the user defines at least one transitional condition for every business
process step with the exception of the terminal steps as the terminal steps cannot have any
transitional conditions as they are final states
18) Each transitional condition is given a priority which is by default is equivalent to the average
of the priorities of the goals that the contextual element that the condition is evaluating was

89
connected to. However, the business process expert can override this default value if s/he
wishes with another priority. The importance of this step will be described in the next section
when describing the business process configuration but it is mainly in case of conflicting
recommendations from the transitional conditions that we take the transitional condition with
the highest priority.
The algorithm is summarized in figure 33 below and the step state attributes and methods are
described in details in tables 17 and 18 below.

90
Retrieve Step Goals
Compare to Contextual Layers Goals of the Industry
List context elements for common goals
Let the User Define Ranges for Contextual Elements
Choose from the business process steps the next best step
Allow user to define related post conditions and their relation
Let the User connect post conditions to context conditions
Validate the Conditions
Automatically Calculate the Transition Priority yet allow user override
Figure 33: Contextual Transition Condition Definition

91
Table 17, Step State Class Attributes
Attribute Type Description
Step name String This is simply the name of the step and it also defines its description as
we handle descriptions in a simple way in the prototypical framework
(e.g. Check the Passenger Documents)
IsInitial Boolean This is simply an identifier for the initial state
IsTerminal Boolean This is simply an identified for the terminal state
Step id Int This is a unique identifier of the step (unique per business process)
Step goals List of goals This is a list of operational goals related to this step in particular, must
be a subset of the goals associated with the whole business process
Step Precondition A List of type
condition
The class condition will be described in details shortly, however it is
defining something that must be true before executing the step
Step Post condition A List of type
condition
The class condition will be described in details shortly, however it is
defining something that must be true after executing the step
Step Transitional
conditions
List of
transitional
conditions
This is a list of objects of type transitional conditions, the class
transitional condition will be defined shortly, however the transitional
conditions are related to contextual facts and ranges and according to
their values incorporating within the business condition and context the
next best step is defined
Step Cost An object of
type cost
This is an object of type cost defining the overall cost (financial cost
and execution time as well) of the step

92
Table 18, Step State Class Methods
Method Return Type Description
Step None Constructor that reads the step information from XML file and load
them to a step object
Step None Constructor that takes the step information and attributes as input to the
constructor method
isInitial Boolean Returns true if this is an initial state/step
isTerminal Boolean Returns true if this is a terminal state/step
getStep Step State Returns the step object with all its information
getStepName String Returns the name of the step
getStepId Int Returns the id of the step
getStepPrecondition A List of type
condition
Returns the step precondition
getStepPostcondition A List of type
condition
Returns the step post condition
getStepTransitional
conditions
List of
transitional
conditions
Returns list of objects of type transitional conditions, the class
transitional condition will be defined shortly, however the transitional
conditions are related to contextual facts and ranges and according to
the values incorporated within the business condition and context the
next best step is defined
getCost Cost Object Returns the overall cost (financial cost and execution time as well) of
the step

93
Condition Class
This class is used to represent the pre-conditions and post conditions of execution of a business process
step. It represents some non-contextual facts that must be true or false either before executing the business
process step in case of pre-condition or after execution of a business process step in case of post-condition.
A precondition of one step must be the post condition of its previous step for the transition from one step to
another to be correct. The details of the class are depicted in tables 19 and 20 which describe the class
attributes and methods.
Table 19, Condition Class Attributes
Attribute Type Description
Condition name String This is simply the name of the condition and it also defines its
description as we handle conditions in a simple way in our prototype
Condition State Boolean This is whether the condition is now true or false
isPrecondition Boolean This is used to define whether this is a precondition or a post condition
Table 20, Condition Class Methods
Method Return Type Description
Condition None This is the condition constructor, it takes the attributes as an input to it
getConditionName String Returns the condition name
Condition State Boolean Returns the condition state
getConditionType String Returns whether the condition is pre-condition or post condition
getCondition Condition Returns the whole condition object
Transitional Condition Class
This class is quite important as it represents the transitional facts that allow a business process step to move
to the best next step. As previously stated the business processes are defined as finite state machines to
define all the alternatives of movement from one step to another so a business process is a collection of

94
steps/states. For the business process to determine the best sequence of steps to follow at a given contextual
instance the process at each step must evaluate the surrounding conditions and decide on the next step and
this is done by defining a list of transitional conditions at each step. One transitional condition is a
composite of step post conditions (e.g. the traveler documents are valid) and contextual elements defined
within a specific range (e.g. the checks in counters are from 4 to 6) the post conditions and contextual
elements ranges are either Anded or Ored or a combination of both (some conditions Anded together then
Ored with the rest of the conditions) then a best next step is defined. For example a transition condition
could be representing the following situation:
If the traveler documents are valid (condition) and the check- in counters (contextual elements) are from 4
to 6 counters (range of values for contextual elements) go to step 10. The transitional condition is given a
priority which is equivalent to the average of the priorities of the goals that are related to the contextual
elements incorporated within the condition , yet the business process expert can still override this default
priority if s/he wishes. The main benefit of the priorities happens in case the business process step is
affected by more than one contextual element. If the contextual element values impose contradicting next
step recommendations; we follow the next step whose transitional condition has the highest priority. The
detailed attributes and methods of the transitional condition class are depicted in tables 21 and 22 below.

95
Table 21, Transitional Condition Class Attributes
Attribute Type Description
List of PostConditions Condition
object
This is the post condition, (e.g. the documents are valid)
List of PostCondition
Logical connector
String This string takes a value of either “and” or “or” and it represents the
relationship of this post conditions with the next post condition
List of Contextual
Elements
Generic
Context
Element
This is the contextual elements associated to this condition
List of Contextual
Element Max Value
int This is the upper boundary of the range of the contextual elements we
want to associated with the transitional condition
Contextual Element Min
Value
int This is the lower boundary of the range of the contextual elements we
want to associated with the transitional condition
ContextConditionLogical
Connector
String This string contains a value of either “and” or “or” and it represents
the relationship between this the contextual condition and the next
conditions condition in the list
TransitionalCondition
Logical Connector
String This string contains a value of either “and” or “or” and it represents
the relationship between all the post conditions and all the contextual
conditions (e.g. if the value coming out of all the post conditions
evaluation (for example true) should be anded or ored with the value
coming out of all the contextual conditions (for example false)
Next Step Id int This represents the next best step to go to given the current
transitional condition
Priority int This is the priority of the transitional condition and it is equivalent to
the average of the priorities of the goals that is related to the
contextual elements associated with the current instance of the
transitional condition and it can be overridden by the business process
expert

96
Table 22, Transitional Condition Class Methods
Method Return Type Description
Transitional Condition None This is the constructor class of the transitional condition
Get Transitional
Condition
Transitional
Condition
This returns the whole transitional condition object
Get Priority int This returns the priority of the transitional condition and it is equivalent
to the priority of the goal that is related to the contextual element
associated with the current instance of the transitional condition
Get Next Step Id int This returns the next best step to go to given the current transitional
condition
Cost Class
This cost class is a simple class that holds the different types of costs associated with a business process
step and also the step execution time as a temporal cost. It was created with the purpose of having some
measures that enable us to evaluate the effectiveness of our solution from cost and temporal perspectives.
The detailed attributes and methods of the cost class are depicted in tables 23 and 24 below.

97
Table 23, Cost Class Attributes
Attribute Type Description
Man_hour_cost double This attribute represents the cost of man hour for human resources
involved in this step
Hours_number double This attribute represents the time needed from the human resource to
execute the step
Material_amount double This attribute represents the amount of all material in units required
to execute the business process step
Material_cost_per_unit double This attribute represents the average cost of material per unit
Step_execution time double This attribute represents the total time a step takes to execute
Total_Financial cost double This attribute represents the total cost of the business process which
is calculated as the (Man_hour_cost *Hours number) + (Material
amount * Cost of Material per unit)
Table 24, Cost Class Methods
Attribute Type Description
Cost none This is the constructor class for the cost
getMan_hour_cost double Returns the cost of man hour for human resources involved in this
step
getHours_number double Returns the time needed from the human resource to execute the step
getMaterial_amount double Returns the amount of all material in units required to execute the
business process step
getMaterial_cost_per_unit double Returns the average cost of material per unit
getStep_execution time double Returns the total time a step takes to execute
calculateTotalFinancialCost double Returns the total cost of the business process which is calculated as
the (Man_hour_cost *Hours number) + (Material amount * Cost of
Material per unit)

98
3.2.3.5. Business Process Configuration
The business process configuration is one of the most crucial stages of our solution methodology and prototypical
framework. The business process configuration stage is where a specific business process running within a specific
context starts taking certain alternative paths to maximize the business process goals according to the contextual
facts at hand. The configuration algorithm goes as follows:
1. The business process expert chooses the business processes under the selected company and selected
industry to simulate
2. The system loads the industry related information which are the contextual layers, contextual aspects and
contextual elements related to the defined industry as depicted in figures 34 and 35. (Note: the industry
knowledge is accumulated by business domain experts using easily updatable graphical user interfaces and
XML files as described earlier in this chapter in the knowledge base section).

99
Figure 34: Industry Knowledge

100
3. The system loads the company related information which are the company goals matrix and the business
process/es that will be simulated
Figure 35: Company Goals Matrix

101
4. The system loads the business process related information which are :
a. The business process goals
b. The business process steps ; each step is associated with goal
5. The system compares the goals of the business process and the goal associated with each contextual layer
and creates a list of contextual elements that are of interest to the business process and to each process step.
The relationship between contextual layers, aspects and variables and the business goals is depicted below
in figure 36.
Contextual Layer
Aspect
Aspect
Aspect
Goal
Goal
Goal
Contextual Variable
Contextual Variable
Figure 36: Relationship between Context and Goals
6. The system asks the user to define transitional conditions to move from one step to another and the
transitional conditions of every step should incorporate the step’s post conditions and ranges of values for
the context items of interest Anded or Ored together
7. The system asks the business process expert to define a next best step for each transitional condition
8. The system models the business process as a finite state machine carrying all the alternatives of flow for the
business process and the different transitions that might take place from one step to another as depicted in
figure 37. (Note: the transitions are tightly bound to the business processes context elements and their
values)
9. The system calculates the total financial cost of the business process alternative path taken versus the
default path as well as the execution time of the business process alternative path taken versus the default
path (the default path of the business process is the normal path without any configuration as if context-
awareness doesn’t exist in the model). This step is done for evaluation purpose and will be more clear in
the results and analysis chapter.

102
Process
State 1
State 4
Transition Condition 1
State 2
State 3
ValidTransition Condition 2
Transition Condition 8
Transition Condition 7
Transition Condition 3
Transition Condition 5
Transition Condition 4
Transition Condition 9
Figure 37: Business Process and Transitions
10. The system registers the interest of the running business process in the relevant contextual elements
through the created JCAF entity listeners for each of the contextual elements
11. Entities (in our case business processes) in the context service simulation are notified when changes occur
within their context. The entity container calls the contextChanged JCAF method
12. The changes in context are aggregated in a context event which has the values of contextual elements at a
specific point in time
13. The system uses the run method that is defined in the business process class. The run method starts with the
first step of the business process and for each move to the next step; the transition conditions are evaluated
(i.e. the value of the post conditions and the value of the contextual condition is retrieved from the context
event and compared to the ranges defined by the business process experts and accordingly the next step is
determined)
In case the evaluation of two transitional conditions result in conflicting recommendations for the next
best step to move to, we take the recommendation of the transitional condition with the highest priority

103
( Note: the priority of a transitional condition is the priority of the goals that the context of the
condition is related to)
14. The run method keeps evaluating the next best step to move to until it reaches the final step of the business
process. It then returns a list of the best steps sequence at this point in time which is a sequence of id of
business process steps
Example: For Check-in Business Process given the current context state; Step 1, Step 15, Step 16, Step 17,
end
By using the above algorithm, the business process configuration takes place based on two pillars;
Appropriate representation of business process context in terms of aspects
Appropriate modeling of goal driven business process in terms of finite state machines
All configuration decisions are goals and context-aware conditions which should lead to better configuration and
decision making regarding business processes flow and this what we proved in the results and analysis chapter.
i. Simulation
The simulation of a certain business process or business processes under a specific industry as a configurable goal
and context driven finite state machine takes place in the ContextTester.java class which is the main simulation class
that has the main loading functionalities of JCAF.
First, within the main function (the main running thread of the application) the system asks the user which business
processes under which company and which industry he would like to run and set configurations.
Second, the load method of JCAF ContextTester class is used to add all the relevant simulation entities that will be
used, namely:
The industry entity with its contextual layers, aspects and elements which are initially input by the business
domain experts as described in the knowledge base definition
The company entity with its goals matrix and business process under inspection

104
Third, within test functionality which will be the service URI the business process goals and context goals are
accumulated to decide on which contextual items the business process entity needs to listen to. It defines new
instances of the different JCAF listener objects required to listen to the contextual items of interest. Then adds those
listeners to the business process entity that needs to listen to them through the add entity listener JCAF functionality.
Fourth, the ContextTester constructor class passes the service URI as a test , adds appropriate listeners and uses the
contextChanged JCAF functionality to make the business process entity listen to changes in the context values of its
interest and calls the run method of the business process class to find the best configuration, given the contextual
values of the listener. In this constructor class we add our simulation of contextual instance generator which feeds
random values into a list of different contextual items of interest to the business process and whenever a new
generation of the values list occurs the listener monitors this change and alerts the business process with the next
context so that it can run accordingly and give us the best sequence of steps for the generated contextual instance.
The context matrix generation is only done for the sake of the simulation and because this is a prototypical
framework. In real life the APIs of the different sensors and databases that the context reads from should be
connected to the JCAF monitors and real time data and the changes in them should be the trigger to a contextual
event which in turn triggers a new business process run.
From the main class (main running thread call ContextTester construction and given test as service URI) the
simulation will run as desired and as depicted in figures 38, 39 and 40.

105
Figure 38: JCAF Architecture (Adapted from Bardram, 2005 [28])
Figure 39: Context Acquisition in JCAF Architecture (Adapted from Bardram, 2005 [28])
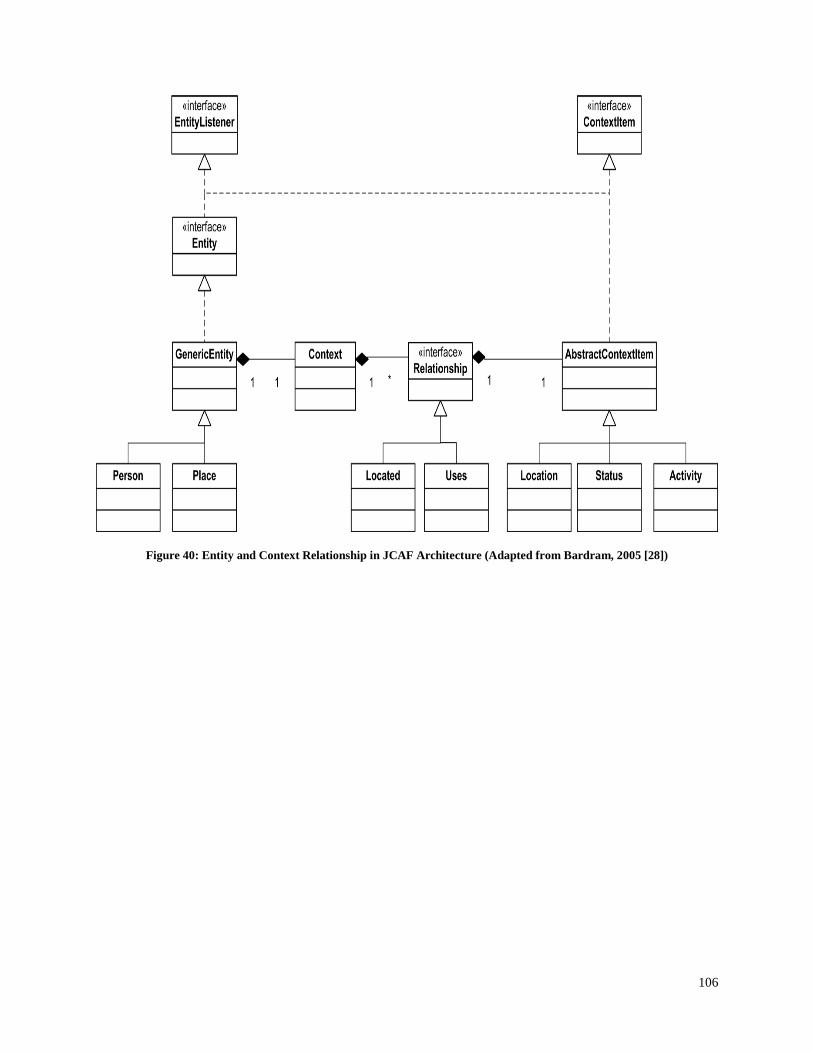
106
Figure 40: Entity and Context Relationship in JCAF Architecture (Adapted from Bardram, 2005 [28])

107
ii. Example
Figure 41 presents an example of the airlines check-in business process configuration steps which could take place using the above explained
methodology.
Check In - Business Process Configuration
Re
co
mm
en
da
t
ion
s
Ge
ne
ra
tio
n
Co
nte
xt
Cla
ss
ific
ati
on
Co
nte
xt
Se
ns
ing
an
d
Mo
de
lin
g
Classify the Contextual Facts
into Different Contextual Layers
(Immediate, Intermediate,
External, Evironmental)
Compare Goals of
Contextual layers with
Different Industry
Business Process Goals
According to the Aspects Values
Fetch recommendations from the Check In
Business Process Repository filled by
Business Process Expert
Sense Different Airlines
Industry Context
Variables Using JCAF
Represent Context
Variables as Aspects/Cross
Cutting Concerns Using
Aspects added to JCAF
Get Value of Season Aspects
and Check In Aspect
Result: Recommendations are:
1. Skip the check at step 1 for business verses
economic tickets (i.e. avail all counters for every
body)
2. Skip step 3 of the process which is passenger
choose his seat and replace it with automatic
seating done by system on
Result: Season Aspect is
Christmas (High Season),
30 % of Check In
Counters are not
operational
Result: The Check In Business
Process Has Common Goals
with Season Aspect and Check
In Counter Aspects as per
Context Classification
Compare Goals of the
Steps of the Check In
Business Process with
Contextual Aspects
Goals
Result: Step 1 (Ticket Category
Validation) & Step 3
(Passenger Seating) are the
steps that have common goals
with these Contextual Aspects
Figure 41: Business Process Configuration Example

108
In the above example the JCAF senses different contextual variables related to the airlines industry and
represents them as open aspects. Classification of the contextual aspects takes place in the four contextual
layers (immediate, internal, external, and environmental) defined earlier. According to this classification
goals matching is done using additional goal matching classes added to JCAF and we discover that the
season and number of check-in counters aspects affects step 1(Ticket Category Validation) and step 3
(Passenger Seating Choice) of the Check-In Business Process. The values of these two aspects are
computed and recommendations for the ranges of values of these aspects are fetched from the business
process repository (defined by the business process experts). The framework recommends skipping step 1
(thus availing all counters to everyone), skipping step 3 and making passengers seating automatic to speed
up the process and avoid bottlenecks which resulted from the current contextual situation. This is just a
simplified example, detailed examples and results are in our experimental work in the results and analysis
chapter.
iii. Tools Used in building the prototypical framework
The following development tools were used in building the framework;
JCAF: Java Context-aware Framework was used to detect and model context
Eclipse 3.7 as the main development environment
AJDT aspect j development tool added on Eclipse 3.7 to cater for modeling of context in terms of aspects
JForm Builder : An add on for building forms in Eclipse 3.7
b. Sources of Flexibility in the Solution Methodology The main source of the extensibility is finding an easy way for industry/business process experts to update
information related to the business goals of the industry, its context variables, their classification as well as the
different business processes and alternatives under the industry and their associated goals. This is achieved
through a set of graphical user interfaces that enable the user to define a robust knowledge base for industries
and companies and their business processes and the hierarchy of repositories and XML files that define the
knowledge base. The business experts can easily use the framework for defining new industries and for defining
their business goals, contextual layers and contextual variables and their associated list of business processes.

109
For each business process they can also define the business process and the recommendations according to
contextual variables’ threshold values that are defined by business process experts and advices to actions or best
mitigation within each range of thresholds of contextual variables values. The solution methodology and
framework are easily updatable by the knowledge of business expert which is a key source for strengthening the
logic of the business processes decision-making as we incorporate all the human experience of experts using
this methodology. In addition, driving contextual variables as aspects makes it easy in the future to apply after
and before aspect advices complex reusable calculations about the contextual variables/elements values, to give
them weighted averages and work more on the priority of context variables. Also, the weights could be related
to the accuracy of context sensors sensing the contextual variables and this could be a separate research track
within this area. Last but not least, having all the business processes and their steps tightly bound to business
goals and the goals being prioritized makes it extremely easy to solve conflicting situations in which the
contextual facts provide different recommendations. Also being goal-driven makes us sure that the
configuration is tightly bound to achieving the business goals and maximizing their benefits.
c. Challenges Faced We were faced by a number of challenges while working on our newly proposed methodology of aspectizing
contextual elements, and the construction of the framework. Some of these have been addressed and some are still in
progress. The main challenges were;
Understanding the tools to be extended and changing their logic. This was resolved through cooperation
with the owners of these tools.
Extending JCAF to include aspectization especially that the JCAF framework never included in their
roadmap the idea of aspects and their relation to contextual items. This was understandable as there is no
substantial research in the area of aspectization of contextual elements.
Researching and understanding about Aspect oriented development and how it could be merged with JCAF
Finding an AspectJ development tool that could incorporate the normal JCAF java implementations and
the aspect implementation and compile them in a homogenous manner

110
Find a way to solve conflicting contextual situations where the input of one contextual item suggests a
certain action while the input of another item that is also affecting the business process being simulated
suggests another action.

111
Chapter 4: Results and Analysis In this chapter we discuss the experimental work that we conducted on the prototypical framework developed as a
proof of concept for our solution methodology on context-aware aspectized goal driven business process modeling.
In this chapter we report on the experimental results, and analyze them and draw conclusions about them.
4.1. The Evaluation Methodology Our evaluation methodology is depicted in the figures below. Figure 42 explains the knowledge definition process.
Figure 43 explains the simulation of the defined business process and the evaluation of the effectiveness of context-
awareness and goal orientation.
Figure 42: Knowledge Definition Process
Define Industry
Define Industry Context
Define Company
Define Company
Goals
Define Business
Process (As Finite State
Machines with Alternative
flows)

112
Figure 43: Business Process Simulation
In the first place the business expert defines the industry and the company information for the business process to be
simulated. The industry is defined in terms of its name and the contextual aspects and elements under those aspects
that are integral to the industry. The business expert also defines the classification of the different contextual aspects
into the four contextual layers; immediate, internal, external or environmental according to the level of impact on the
business under this industry. Secondly, the business process expert defines the goals of the company under which
the prospective business process should run, and finally defines the business process itself as a finite state machine.
The system guides the business expert through the business process definition by comparing the business goals of
the process and the goals of the different contextual layers and guides the user to which contextual aspects and
elements affect the process and guides him/her to define different contextual situations and the best decision per
situation as explained earlier in the solution methodology chapter 3.
For the sake of evaluating the solution methodology, once the knowledge base is ready the system allows the
business expert/user to pick any business process and to choose to simulate it. The system generates a hypothetical
contextual situation using a contextual events generator that is added to the JCAF classes as explained earlier in the
solution methodology, chapter 3. Then the business process is run and at every step the system evaluates the next
Choose a Business
Process to Simulate
Create an Event with
Hypothetical Contextual conditions
Run Simulation
with context ual
awareness
Run Simulation
without contextual awareness
Compare Simulations According to Evaluation
Criteria

113
best step to move to according to the contextual elements in the contextual event generated. Hence, we have an
output of a certain contextual situation with certain values of contextual elements and a sequence of steps which the
business process decided to be the best sequence of steps to take given the current contextual situation. We run the
business process simulation once more disregarding the contextual situation as if contextual awareness and
modeling of business process context in terms of aspects doesn’t exist and we record the sequence of steps that the
business process flows into. We evaluate the effectiveness of the solution methodology by comparing the two
simulations according to the evaluation criteria discussed in the next section of this chapter. For a single business
process we simulate the process against a variant of contextual events and monitor the process configuration against
each instance.
4.2. The Evaluation Criteria
One of the controversial areas in this research was finding a methodology through which the effectiveness of
modeling the context of business processes can be evaluated. The evaluation is not easy and could be considered in
more details in a separate research on its own. In general, business decisions may be evaluated on two levels: the
ability to maximize profit on the long run and the ability to maximize profit on the short run. Several business
decisions that are aimed at maximizing profit on the long run might increase costs and decrease profit on a short
term. For example taking cost measures (discounts, very high level quality of service) to gain a wider customer base
so that eventually on the long run the profit would be maximized. Such cases are valid in business and these cases
make the evaluation of the business decision a harder process. However, there are business practices that make the
evaluation of whether a certain business decision is on the right rack or not. One of these practices is making a short
term audit to ensure that an indication of slight maximization of profit is happening in a certain time interval (short
run). Hence, business decision makers are sure in the targeted time interval (long run) that the goal of profit
maximization will be achieved to the extent they had planned to reach. We chose our evaluation criteria for the
efficiency and correctness of business process configuration decisions based on the concept that for a measure to
maximize a business profit in the long run it must at least provide slight profit maximization in the short run.
The purpose of our evaluation is to prove that appropriate context modeling and goal orientation enhanced the
business process configurations and decision making. This is not a focal point nor a core part of the research but
rather a preliminary step into trying to evaluate the effectiveness of context modeling and goal orientation within the

114
business process modeling domain from a cost perspective. It opens the door for future researches to further
evaluate and investigate the effectiveness of context modeling and goal orientation within the business process
modeling domain and its relation to cost. We proved this effectiveness by providing experimental evidence that the
costs of business processes were reduced. Of course, measuring the effectiveness of context modeling is a more
complicated task that goes beyond cost. As mentioned above, in some cases cost might increase after context
modeling but there is more customer satisfaction or the cost increases now and decreases in the long run. There are
many parameters and the process of measuring effectiveness should be a research project on its own, yet what was
done in the course of this research is collecting simple and direct measures that can act as primary indicators of the
effectiveness of context modeling in relation to business processes .
In our experimental work we established our evaluation criteria to be based on the following two types of cost:
4.2.1. Financial Cost of the Business Process
This aspect measures the cost of the business process if context wasn’t taken into consideration versus the cost of the
business process when context was modeled and accordingly certain configuration decisions were taken which
modified the business process flow. The following calculation steps were taken to measure the financial cost aspect.
1) FC =HRC +MRC----------> (equation 1)
Where
FC is the financial cost of business process step
HRC is the human resource cost calculated as the man hour cost multiplied by the number of
hours spent on the process step
MRC is the material resources cost to execute a step calculated as the material resources units
multiplied by the cost of the material unit
The cost of man power and resources, are configurable and defined by industry experts.
2) TFC= ∑FC---------------------> (equation 2)
Where
TFC is the Financial cost of the whole business process

115
The cost of the business process is being calculated as the total cost of the number of steps that it
includes. The steps vary according to the configuration decisions taken based on the contextual
information provided (e.g. according to contextual element X being modeled, the configurable
business process will take step M instead of step N) and this is where the cost variance comes from.
The cost variance is calculated as follows;
3) FCV = (BPNC-BPCC)/BPNC ----------------------------------------------------------> (equation 3)
Where
FCV is the financial cost variance
BPNC is the cost of the business process when contextual facts are not taken into consideration
while making the decision (calculated as per equation2)
BPCC is the cost of business process when contextual facts are taken into consideration while
making the decision (calculated as per equation 2)
4.2.2. Performance of the Business Process (Time/Throughput)
This aspect measures the cost of a business process in terms of time. It can be measured as the time
taken to complete a business process without contextual consideration versus the time taken to
complete a business process with context appropriately modeled. The following calculation steps are
taken to measure the performance aspect.
1) BPT= ∑ST-----------------------------------------------------> (equation 4)
Where
BPT is the time of a business process
ST is the total time of a step in a business process
The steps of a business process may vary according to the configuration decisions taken based on the
context model and this will be the source of the time variance.

116
2) Time variance = (BPTNC-BPTC)/BPTNC --------------------------------------> (equation 5)
Where
BPTNC is the time of a business process without context modeling (equation 4)
BPTC is the time of business process after context modeling (equation 4)
The time of every business process step is configurable so that the end user of the framework can
change it and see the variance if s/he wants.
4.2.3. Measuring the Overall Effectiveness of the Solution Methodology
The evaluation criteria of the solution methodology adopted in this research includes the various aspects as
described in the previous section. Now comes the important question which is : how can these different aspects
and concepts of quality and effectiveness be combined to reach one measure that could be the basis of judging
the overall quality and effectiveness of context models produced by this research? The answer is a combination
of the above mentioned aspects which will be based on a weighted summation that gives each aspect a variable
weight depending on its relative importance. The degree of importance depends on the industry/business domain in
which the context model will be examined.
4.2.3.1. Calculation Method
Let Financial Cost Variance = F
Let Time Variance = TV
Let Number of Business Processes = N
Each of the above quality parameters is evaluated according to the business domain under investigation
and is given a weight which ranges between 0 and 1 (a 0 means insignificant quality parameter and 1
means the most significant quality parameter). The summation of all the weights given should be equal to
1. The quality and effectiveness of a context model produced will be calculated as follows:
Quality/Effectiveness of the context model = (∑F/ N) * Weight of F + (∑TV/ N) * Weight of TV-------->
(equation 6)

117
The quality/effectiveness of the context model produced is proportional to the result of equation 6. The
more the result moves near to 1 the better is the context modeling affecting the business goals and
maximizing profit on the short run.
4.3. Effectiveness Guarantee The main guarantee for the effectiveness of the solution is that the configuration decision is a result of the business
process expert’s recommendations and is not randomly generated by the framework. The identification of the best
sequence of steps is based on the context of the business process and its goals. The following are the steps that take
place:
1) Identifying which aspectized contextual variables/ elements affect which business processes and which steps to
take within these processes. This is achieved by identifying the goals of the business process under
investigation. It comes by studying the business behind the process and the wider picture that the business
process fits in, which comes from the understanding of the overall business domain. As mentioned earlier, the
goals of the company are placed in a goals repository within a certain industry repository. For each company
repository that we have business processes defined under, the definition incorporates the goals of the process,
the states (business process steps), the goals of each state (business process step) and the conditions to jump
from one state to another (the conditions are of course related to the context of the process). These definitions
are made through a simple graphical interface and are updatable by business experts.
2) Comparing the goals of the business process to the goals of the different aspects of contextual elements that are
of interest to the company under which the business process falls and detecting any common goals. If common
goals are found then the business process is affected by the context and through common goals we are able to
identify which business process steps are affected.
3) For the contextual elements that are affecting a certain business process according to the goals matching, the
business process experts must define a recommendation for the next best step based on ranges of values of these
contextual elements
4) The business process registers its interest in contextual aspects of common goals and this is achieved through
existing functionalities in JCAF. The business process runs and is triggered by changes in the contextual aspects

118
it is registered in. According to the changes in values of the contextual aspects and the conditions of jumping
from one state/business process step to another (as per the business process definition), the business process
decides on the best sequence of steps/states to take given a certain contextual input at a specific instance in time.
Hence, the business process expert is the main decision maker and the decisions are made based on business
experience, as well as appropriate contextual sensation and modeling. The reason we try to calculate the
financial and time cost effectiveness of the solution is to simulate an audit that would otherwise have been done
by business process experts in real life, away from any simulation or software aids, to decide if their decisions
were the right ones and in the direction of maximizing the business profit or not. If they found out that they are
not in the right direction they can easily re-define the business process decision and the next best steps to move
to according to their goals and the results would vary.
4.4. Experimental Results and Analysis In this section we discuss the experiments done on the prototypical framework which prove the concept behind our
solution methodology, the results of the experiments and our interpretation of these results.
4.4.1. Airlines Industry Experiments
These experiments were related to the Airlines Industry and in particular the check- in business process was chosen
to be the business process to be experimented on from the Airlines industry. Its various contextual aspects which
belong to various layers (immediate, internal, external and environmental) do affect this business process and it has
a variety of configuration decision that can be taken. In addition, it is well known to researchers and readers from
different backgrounds so the logic behind the configuration can be easily analyzed and criticized.

119
4.4.1.1. The Experimental Procedures
1. Industry Knowledge Definition
The following contextual knowledge about the Airlines industry was defined by the industry expert through a simple graphical interface. The industry expert
defined the contextual aspect classification on the different contextual layers as well as the different elements related to the airlines industry under each aspect.
Figures 44-48 depict the aspects at the various layers for the industry.
Figure 44: Context Aspects Classification
AirLines Industry
Immediate Context Layer
Material Utilization Aspect
Human Resource Utilization Aspect
Human Resource Experience Aspect
Timing
Season
Internal Context Layer
Human Resource Experience Aspect
Ogranization Strategy
External Context Layer
Risk Factors
Industry Regulations
Environmental Context Layer
Force Major

120
Figure 45: Immediate Context Layer Tree
Immeidate Contextual Layer
Material Utilization Aspect
Check-in Counters Number
Luggage Loaders Number
Boarding Pass Printing Machines
Number
Human Resource Utilization Aspect
Total Number of Staff available
Human Resource Experience Level
Aspect
Number of High Experience Staff
Number of Medium
Experience Staff
Number of Novice Staff
Timing Aspect
Is It Morning
Season Aspect
Is It Holiday
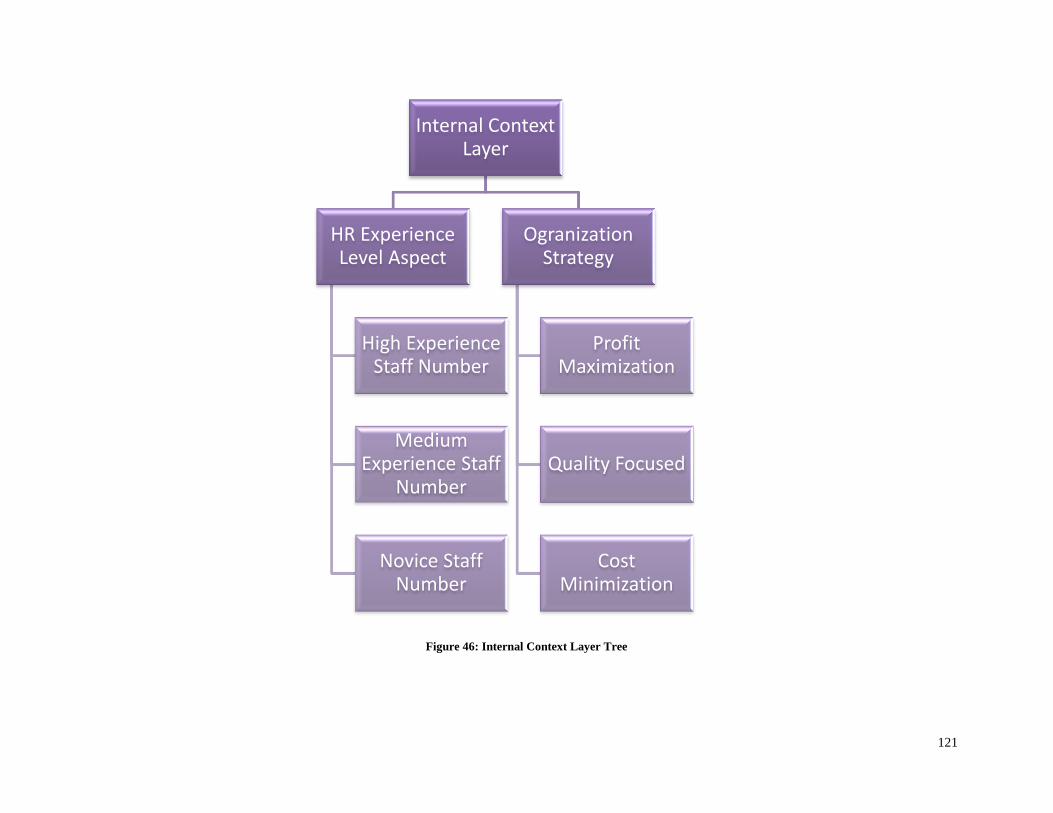
121
Figure 46: Internal Context Layer Tree
Internal Context Layer
HR Experience Level Aspect
High Experience Staff Number
Medium Experience Staff
Number
Novice Staff Number
Ogranization Strategy
Profit Maximization
Quality Focused
Cost Minimization

122
Figure 47: External Context Layer Tree
External Context Layer
Risks Aspect
Check-in Counters Failure
Luggage Loaders Failure
Boarding Pass Printing
Machines Failure
Industry Regulations
Aspect
Max Luggage Regulations
Monopoly Regulations

123
Figure 48: Environmental Context Layer Tree
Environmental Context Layer
Force Major
General Strike

124
2. Company Knowledge Base Definition
The company expert defined the company knowledge base starting with the company goals matrix (strategic goals
and their operational sub goals) and for each goal a priority was defined as depicted in figure 49.
Priority 1 indicates the highest priority goals. Prioritization of goals is quite an important step in our solution
methodology as it forms the focal point of conflict resolution whenever the business process is running in a
controversial contextual situation where the values of some contextual elements under some contextual aspects
suggest a certain path and configuration of business process steps and the other values of other contextual elements
under other contextual aspects suggest another configuration. Such a situation is resolved by taking the
recommendation of the contextual aspects that are related to goals (through contextual layers segmentation) with the
highest priority.
P1 indicates the goal is of highest priority. Each strategic goal has a priority and its operational sub-goals have a
priority, the priority of a sub goal should be as high as the priority of the strategic parent goal or less , however, it
should not exceed the priority of the parent goal. All the priorities are defined by business experts and the logic
behind the ratio between the sub-goals and parent goals is that the sub-goals help in achieving the parent goals so
their priority should be according to how much they contribute to achieve the parent goal and thus can’t be higher
than the parent goal. For goals that have a fractional priority like p 1.5 this means the goal contributes to achieving a
parent goal of priority 1 but its contribution is not that major. This is why its range is at 1.5. The same goes for goals
given priority 2.5.

125
Figure 49: Company Goals Matrix
Company Goals
Maximize Profit (p1)
Attract More Customers (P1)
Cut on Operating Costs(P1)
Cost Effective Employment(P1.5)
Maximize Prices(P1.5)
Maximize Quality of Service (P2)
Increase Customer Satisfaction(P2)
Increase Flexibility with Passengers(P2.5)
Face Competition(P2)
Higher Customer Satisfaction (P2)
Increase Partnerships and Associations (P2)

126
The company expert also defined the association between the different company goals and the four contextual layers (immediate, internal, external and
environmental layers) as depicted below in figures 50, 51, 52, and 53, respectively.
Figure 50: Immediate Context Goals
Immediate Context Goals
Maximize Profit
Cut on Operational
Costs
Cost Effective Employement
Maximize Quality of
service
Increase Flexibility with
Passengers
Increase Customers Satisfaction
Face Competition
Increase Customers Satisfaction

127
Figure 51: Internal Context Goals
Internal Context Goals
Maximize Profit
Attract More Customers
Cut on Operational
Cost
Cost Effective Employment
Face Competition
Increase Customer
Satisfaction

128
Figure 52: External Context Goals
External Context Goals
Maximize Quality of
service
Increase Flexibility with
Passengers
Face Competition
Increase Partnerships and
Associations
Maximize Profit
Cut on Operational Cost
Maximize Price

129
Figure 53: Environmental Context Goals
Environmental Context Goals
Maximize Quality of Service
Customer Satisfaction
Maximize Profit
Cut on oeprational cost increase during
force major time

130
The goals and their associated contextual layers are defined at the company level as goals that vary per company even if there are common company goals
between companies operating within the same industry.
3. Business Process Definition
The business process expert defined the business process with the assistance of the system. First the business process goals which are a subset of the overall
company goals were defined and they were as depicted in figure 54.
Figure 54: Business Process Goals
Business Process Goals
Maximize Profit
Cut On Operational Cost
Cost Effective Employment
Maximize Price
Maximize Quality of Service
Increase Customer
Satisfaction
Increase Flexibility with
Passegners

131
The business process expert defined the business process alternative flows in terms of a finite state machine as depicted in figure 55.
Check In Process
Wait For Normal Check In(2)
Check-in at Automated Kiosks (5)
Valid Traveler & Normal
Check-In
Valid Traveler & Kiosk
Check-In
Drop Luggage at Special Luggage Counter (12)
Valid Traveler & Web
Check-In
Present Traveler Documents at Business Counter (3)
Present Traveler Documents at Economy Counter (4)
Ready to Check-In As
Business Class
Ready to Check-In As
Economy Class
Choose Seat Through Agent(8)
Valid Documents
Valid Documents
Handle at Airport Resolution Office (6)
Invalid Documents
Invalid Documents Go to 6
Automatic Scan of Documents(7)
Invalid Documents Go to 6
Choose Seat at Kiosk by Passenger(11)
Valid Documents
Normal Luggage Registration at Normal Counter (9)
Seat Chosen
Seat Chosen
Issue Boarding Pass(10)
Pay Overweight(13)
Overweight
Overweight
Fine Paid
Within Weight
Within Weight
Start 1
Figure 55: Check-in Business Process

132
The business process flow shown in figure 55 represents the direct flow of the contextual process (with pre and post
conditions) and steps as finite state machine states. In addition to the above definition the business process expert
defined (with the guidance of the system) how to reach different contextual situations by skipping steps or changing
the flow. The guidance of the system is achieved through the following steps:
1. The system asks the user to choose a subset of the overall goals of the company to be selected as process
goals
2. The system asks the user to define the business process steps
2.1. For every step the system asks the user to choose a subset of the business process goals to be the step
goals (i.e. the goals that the business process is expected to achieve)
2.2. The system compares the goals of the step and the goals of the different contextual layers and
identifies the context aspects and elements under them which should be considered while executing
this step and moving to the next step , skip it or go for an alternative one.
2.3. The system helps the user to define the conditions to move to the next best step by enabling him to
define different kinds of conditions logically Anded or Ored together and their next best step. For
example in Step 2 while waiting for normal check- in, if the number of economy counters is small or
there is a shortage in staff and the passenger is an economy passenger open next step is 4 (open for the
passengers the business counters till the bottleneck gets better).
3. The user defines all the steps and marks if they are initial or terminal states

133
Table 25 represents the business process goals and sub-goals while Table 26 represents the definition of step 1 of the
check-in business process.
Table 25, Business Process Goals
Goals Parent Goal Sub Goal/s Priority
Maximize Profit This is the parent goal Cut on Operational Cost
Maximize Price
Cost Effective
Employment
1
Cut on Operational
Cost
Maximize Profit This is the sub goal 1
Maximize Price Maximize Profit This is the sub goal 1.5
Cost Effective
Employment
Maximize Profit This is the sub goal 1.5
Maximize Quality of
Service
This is the parent goal Increase Customer
Satisfaction
Increase Flexibility with
Passengers
2
Increase Customer
Satisfaction
Maximize Quality of
Service
This is the sub goal 2
Increase Flexibility
with Passengers
Maximize Quality of
Service
This is the sub goal 2.5
Table 26, Business Process Definition & Recommendations Example
Step ID Step Name Goals Pre-
Conditions
Post
Conditions
Recommendations
1 Start Profit- Attract
More
Customers,
Profit – Cut on
operational
cost,
Quality of
Service-Higher
Customer
Satisfaction,
Face
Competition-
Higher
Customer
Satisfaction
Have E-
Ticket, Have
Been Checked
at the gate,
Is not a
banned
traveler
Valid Traveler
& Normal
Check-in,
Valid Traveler
& Kiosk
Check-in ,
Valid Traveler
& Web Check-
in
If Valid Traveler & Normal
Check-in &
[Number of Check-in
Counters is small (1 to 200)
Or
Total staff is small (1 to
200)
Or
Experiences staff ratio to
novice staff ratio (<50 %)
Or
The season is Holiday
Season
Or
The Timing is a Morning
Time
Or
A Portion of staff is on

134
As depicted in Table 26 the start step’s goals were to maximize profit, attract more customers, cut on operational
costs and increase quality of service and thus customer satisfaction. The step’s pre-conditions and post-conditions
are available in addition to the transitional recommendation conditions as shown in the recommendations column:
if the traveler is a valid traveler and s/he is awaiting normal check-in
and the number of check-in counters is small
or the staff number is small or novice or the strategy is a cost cutting focus
and the number of kiosk check-in counters is sufficient
Then the recommendation is to redirect passengers to the kiosk check-in. We note here that the recommendation has
a priority which is equivalent to the priorities of the goals that the context elements in the recommendation condition
are associated to.
For the details of the rest of the check-in business process steps, their goals, their pre-conditions, their post
conditions and recommendations refer to Appendix IV.
Strike
Or
Strategy is Profit
maximization and cost
cutting then
Go to Step 5 Kiosk Check-in
]
Priority=1.64
If Valid Traveler & Normal
Check-in&
[ Enough counters, &staff &
normal season & quality
maximization strategy
Go to Step 2
]
Priority=1.64

135
4. Business Process Cost definition
Table 27 shows the details of the cost definition for all the business process steps as defined by the business expert.
Table 27, Business Process Cost
Step Id Step Name Man Power
Cost/$
Material
Cost/$
Total Financial
Cost/$
Total
Execution/hour
1 Start 0 0 0 0.16
2 Wait for Normal Check-
in
0 0 0 0.42
3 Present Documents at
Business Counter
(0.13
time*10$
labor
cost)=1.3
(3 resources
number *5$
average cost
of different
resources)
=15
16.5 0.13
4 Present Documents at
Economy Counter
(0.2 time*10$
labor cost)=2
3 resources
number *5$
average cost
of different
resources)
=15
17 0.2
5 Check-in at Kiosk 0 2 resources
*6$=12
12 0.1
6 Handel Problem at
Airport Security Office
(1 time* 20
$)=20
(3 resources
number *5$
average cost
of different
resources)
=15
35 1
7 Automatic Scan of
Documents
0 1 resource * 7 7 0.08
8 Choose your Seat by an
Agent
(0.15 time
*$10)=1.5
1 resource *5
average
cost=5
6.5 0.15
9 Register Luggage at
Normal Luggage
Loaders
(0.17 time *
$15)=2.55
2 resources*
5 average
cost =10
12.55 0.17
10 Issue Boarding Pass
(normal )
(0.1 time *
10)= 1
1 resource *5
average
cost=5
6 0.1
10’ Issue Boarding Pass
Kiosk
0 1 resource *
*5 average
cost=5
5 0.08
11 Choose your Seat
Automatically at Kiosk
by Yourself
0 1 resource * 5
average
cost=5
5 0.1
12 Drop Luggage at
Separate Web Check-in
Luggage Loaders
0 2 resources*
5 average
cost =10
10 0.11
13 Pay Overweight Fine (0.25 hour*10
cost)=2.5
2 resources*
5 average
cost =10
12.5 0.25

136
5. Recommendations and Priority definition
All the business process definition and recommendations is done by the business process expert. The
recommendation for the next step is done as a combination of post conditions and contextual conditions related to
the step goals (as per the goals to context layer connection defined by the business expert as well). For every
recommendation the business process expert must assign a priority to the recommendation to avoid the case where
controversial contextual values put the system in a condition where there are two conflicting next steps. The system
calculates by default the priority of one recommendation to be the average of the priorities of the goals connected to
the contextual elements within that condition, however the system allows the business process expert to override this
priority by a better value if s/he wishes.
4.4.2. Airlines Industry Experiments Results Summary and Analysis
This section illustrates the summary of the results done on various contextual cases and conditions of the Check-In
business process under the airlines industry. For the details of the runs that were tested on our system and their exact
output refer to appendix V.
The financial cost reduction for each of the 10 contextual cases is depicted in table 28 and the bar charts in figures
56 and 57 below summarize the cost reduction and time savings, respectively.
Benchmarking:
The benchmarking in our experiments is done through a contextual case where all the contextual conditions are
within normal boundaries. Hence, the business process flows according to its default paths without any changes in
flow due to any recommendations related to contextual conditions. We therefore take the financial cost and the
execution time of the business process under this contextual case as the benchmark. We compare the cost of the
different runs that take different alternative paths (according to the context-awareness and goal-orientation
conditions) with this benchmark to identify the financial cost variance and the execution time variance.
Within this set of experiments on the Check-In business process the benchmark case is case 10.

137
Table 28, Check-in Process Results Summary
Context Case Run Situation Financial Cost
Reduction
Execution
Time
Reduction
The first case represents a high
season while all other
conditions are normal. The
strategy is maximizing quality
of service on the top of
everything.
Run 1 (Economy Passenger with valid
documents and luggage within normal limit
wishing to check-in)
Run 2(Business Passenger with valid
documents and luggage within normal limit
wishing to log in):
Run1 (16.6%)
Run 2 (12.0 %)
Run 1(18.3%)
Run 2 (47.8%)
The second case represents a
high season while all other
conditions are normal yet the
strategy is cost cutting and
profit maximization.
Run 1 (Economy Passenger with valid
documents and luggage within normal limit
wishing to check-in)
Run 2(Kiosk Passenger with valid documents
and luggage within normal limit wishing to
check-in)
Run 1 (30 %)
Run 2 (18.2%)
Run 1 (70 %)
Run 2 (47.8 %)
The third case represents a high
season, deficiency in overall
staff number and experienced
staff and the strategy is cost
cutting and profit maximization.
Run 1 (Economy Passenger with valid
documents and luggage within normal limit
wishing to check-in)
Run 1 (30 %) Run 1 (70%)
The fourth case represents a
normal season, deficiency in
overall staff number and the
economy check-in counters and
web-check-in counters, the
strategy is quality focus
strategy.
Run 1 (Economy Passenger with valid
documents and luggage within normal limit
wishing to check-in)
Run 1 (16.6%) Run 1(18.3%)
The fifth case represents a high
season, deficiency experience
staff and the economy check-in
counters and the business
check-in counters and web
check-in counters and the
strategy is cost cutting strategy.
Run 1(Business Passenger with valid
documents and luggage within normal limit
wishing to check-in)
Run 2(Economy Passenger with valid
documents and luggage within normal limit
wishing to check-in)
Run 3(Web Check-in Passenger with valid
documents and luggage within normal limit
wishing to check- in)
Run 1 (12.0 %)
Run 2(13.0%)
Run 3 (-20.0%)
Run 1 (47.8%)
Run 2 (50.8%)
Run 3 (53.0%)
The Sixth case represents a high
season, deficiency in overall
staff number, deficiency in
business counters and kiosk
counters the strategy is cost
cutting strategy.
Run 1(Kiosk Passenger with valid documents
and luggage within normal limit wishing to
log in)
Run 2(Business Passenger with valid
documents and luggage within normal limit
wishing to log in)
Run 1 (18.2%)
Run 2 (7%)
Run 1 (47.8%)
Run 2 (68.14
%)
The seventh case represents a
high season, deficiency in
economy counters, the strategy
is cost cutting strategy and there
is a risk of strike of employees
Run 1(Economy Passenger with valid
documents and luggage within normal limit
wishing to check-in)
Run 1 (13 %) Run 1 (50.8%)

138
so all employees who are
working are novice.
The eighth case represents a
high season; deficiency in
economy and business and
kiosk counters, the strategy is
quality focus.
Run 1 (Economy Passenger with valid
documents and luggage within normal limit
wishing to check-in)
Run 2(Business Passenger with valid
documents and luggage within normal limit
wishing to check-in)
Run 3(Kiosk Passenger with valid documents
and luggage within normal limit wishing to
check-in)
Run 1(30%)
Run 2(7%)
Run 3 (18.2)
Run 1 (70%)
Run 2(68.14%)
Run 3(47.8%)
The ninth case represents a high
season; deficiency in normal
luggage loaders, the strategy is
cost cutting focus.
Run 1(Economy Passenger with valid
documents and luggage within normal limit
wishing to check-in)
Run 1 (6%) Run 1 (5%)
The tenth case represents a
normal situation where there is
no deficiency in any resource
and it is not a high season and it
will be used as the benchmark
for the default business process
path verse the alternative paths
take to cater for certain
contextual situations
Run 1 (Economy Passenger with valid
documents and luggage within normal limit
wishing to check-in)
Run 2(Business Passenger with valid
documents and luggage within normal limit
wishing to check-in)
Run 3(Web Check-in Passenger with valid
documents and luggage within normal limit
wishing to log in)
Run 4(Kiosk Check-in Passenger with valid
documents and luggage within normal limit
wishing to log in

139
Figure 56: Airlines Cost Reduction Results Summary
-30.00%
-20.00%
-10.00%
0.00%
10.00%
20.00%
30.00%
40.00%
Case 1 Case 2 Case 3 Case 4 Case 5 Case 6 Case 7 Case 8 Case 9 Case 10
Cost Reduction Run 1
Cost Reduction Run 2
Cost Reduction Run 3

140
In figure 56 we summarize the cost reduction results of the major runs simulated for the airlines check-in business
process (the detailed runs are included in Appendix V). Not all the contextual cases were tested on 3 runs as
sometimes the contextual situation would lead to the same recommendation whether the passenger is an economy
passenger or a business passenger or a passenger who prefers a kiosk check-in so in these cases we only simulated
one run like in case 4 (where the contextual situation that was tested on the check- in business process represented a
normal season, deficiency in overall staff number and the economy check -in counters and web check- in counters,
the selected strategy is the quality focus strategy). In case 4 it was sufficient to make only one run which was for an
economy passenger as it would have been the same recommendation even if it is for a business passenger or kiosk
passenger) .
Case 10 shows zero cost reduction as this is the benchmark case where there is no context-awareness of any kind
being simulated.
For the financial cost reduction we see a strong fluctuation from an improvement of cost as high as 30% to an
increase in cost of about 20%. However the run case that produced an increase in cost of about 20% was a case
where there was a problem in the web check- in counters which is the cheapest kind of check-in within our
simulation. So, in order to maintain the service quality which was the company strategy at this contextual instance,
we had to substitute the web-check-in with another type of check- in which was using the kiosk check-in luggage
loaders. This is more expensive but it was inevitable, so in some contextual situations according to the limitation of
resources, the next best choice might move the expenses up. However, if we exclude these cases we find that the
average of cost enhancements on the short run is 23 % which is a significant figure for cost enhancement given the
millions of check-in business process runs taking place in one airport in one day.

141
Figure 57: Airlines Industry Time Saving Results
0.00%
10.00%
20.00%
30.00%
40.00%
50.00%
60.00%
70.00%
80.00%
Case 1 Case 2 Case 3 Case 4 Case 5 Case 6 Case 7 Case 8 Case 9 Case 10
Time Saved Run 1
Time Saved Run 2
Time Saved Run 3

142
In figure 57 we summarize the time saving results of the major runs simulated for the airlines check-in business
process (the details of the runs are in Appendix V). Not all the contextual cases were tested on 3 runs as sometimes
the contextual situation would lead to the same recommendation whether the passenger is an economy passenger or
business passenger or a passenger who prefers the kiosk check-in. So, in these cases we only simulated one run like
in case 4 (where the contextual situation that was tested on the check-in business process represented a normal
season, deficiency in overall staff number and in the economy check-in counters and web check-in counters. The
selected strategy is the quality focus strategy. In case 4 it was sufficient to make only one run which was for an
economy passenger as it would have been the same recommendation even if it is for a business passenger or kiosk
passenger .
Case 10 shows zero time saving as this is the benchmark case where there is no context-awareness of any kind being
simulated.
For the execution time reduction we see an even better improvement than the financial cost reduction where the time
of execution of the business process runs were enhanced at a higher rate. In some case it is as high as 70 % and in
some case the enhancement is as small as 6%. But the latter are minor cases and the reason is again the resource
limitations. If there is a situation where all the contextual variables are at crucial levels (risk of strike, novice people
on counters, small counters numbers (economy, web check- in and kiosk counters) whatever could be done will still
be slow or improve the execution time at a slight percentage like 6%. However, these cases, as compared to other
less complex cases, form a small proportion in daily business life. Hence, gaining an average of 34 % time
reduction for the check- in business process means maximizing the throughput for such a business process and
maximizing the profit of the company that utilizes the context-aware goal-oriented business process modeler.
The General Average of Financial Cost Reduction of all the runs = Summation of Cost Reductions of all
runs/number of runs = 12 %
The General Average of Execution time saved in all runs = Summation of Execution times Reductions of all
runs/number of runs=34%
The Overall Quality/Effectiveness of the model as per equation 6 in section 1.1.3 (Evaluation Criteria) =

143
(Summation of Financial cost reduction/ the number of business processes runs that Financial cost
reduction was calculated for) * Weight of F
+ (Summation of Time reduction/ the number of business processes that Time reduction was calculated for)
* Weight of TV
Assuming the we give equal weight to the financial cost as well as the time cost (each 0.5 as the total of all weights
should be one), the overall results of the model is that given the tests done on the Airlines check–in process, it
improved the effectiveness of decision-making based on goal-orientation and appropriate modeling of context by
(12%*0.5+34%*0.5) = 23 % . This is a significant percentage given that in real life and across the airports of the
world, the check- in process executions takes place millions of times every day so an enhancement of 23% means
millions of savings only on the short run.
From the above results we tend to appreciate the appropriate sensation and modeling of a business process context in
terms of contextual aspects segmented into contextual layers. Each layer has a business-oriented goal and models a
business process in the form of a finite state machine that decides on the best next move according to
recommendations defined by business process experts and related to context of the step. The step goals have a
significant positive effect on reducing the financial cost of the business processes and enhancing the throughput (the
number of business process that could be executed within certain time period or time frame).
From both results of financial cost reduction and execution time reduction on the short run, we see promising results
for the context-aware goal-oriented business process modeler on the long run. Definitely, there are more complex
and detailed ways of measuring the effectiveness of the proposed solution methodology but this is quite diversified
and needs a detailed study on its own.
4.4.3. The Telecom Industry Experiments
These experiments were related to the Telecom Industry and in particular the business process of payment of cellular
phones postpaid plans (the postpaid plans are mobile tariff plans that allow the subscriber first to use the service then
gets charged at the end of the month after actually using the service) bills. This business process from this industry
was chosen due to my experience in the Telecom Industry and because it is a business processes that is affected by
various contextual aspects belonging to various layers (immediate, internal, external and environmental). It has a
variety of configuration decisions that can be taken. In addition, it is well known to researches and readers from
different backgrounds so the logic behind the configuration can be more easily analyzed and criticized.

144
4.4.3.1. The Experimental Procedures
1. Industry Knowledge Definition
The contextual knowledge about the Telecom industry was defined by the industry expert through a simple graphical interface. The industry expert defined the
contextual aspect classification on the different contextual layers as well as the different elements related to the Telecom industry under each aspect. Figures 58-
62 represent the defined aspects for each of the respective layers.
Figure 58: Telecom Industry Context
Telecom Industry
Immediate Context Layer
Material Utilization Aspect
Human Resource Utilization Aspect
Human Resource Experience
Aspect
Timing
Internal Context Layer
Human Resource Experience
Aspect
Ogranization Strategy
External Context Layer
Risk Factors
Industry Regulations
Environmental Context Layer
Force Major

145
Figure 59: Telecom Industry- Immediate Context Layer Items
Immeidate Contextual Layer
Material Utilization Aspect
Payment Counters
Equiped Self Payment Counters
Ticket for Turn Printing Counter
Credit Card Machine
Receipt Printers
Bill Printers
Human Resource Utilization Aspect
Total Number of Staff available
Timing Aspect
Is It Morning

146
Figure 60: Telecom Industry- Internal Context Layer Aspects and Elements
Internal Context Layer
HR Experience Level Aspect
High Experience Staff Number
Medium Experience Staff
Number
Novice Staff Number
Ogranization Strategy
Profit Maximization
Quality Focused
Cost Minimization

147
Figure 61: Telecom Industry- External Context Aspects and Elements
External Context Layer
Risks Aspect
Credit Card Machines Hack
Industry Regulations
Aspect
Maximum Bill Limit
Monopoly Regulations
Bill Format
Receipt delivery of Bills

148
Figure 62: Telecom Industry Environmental Context Aspects and Elements
Environmental Context Layer
Force Major
General Strike
Major Loss of Connection

149
2. Company Knowledge Base Definition
The company expert defined the company knowledge base starting with the company goals matrix (strategic goals and their operational sub goals) and for each
goal a priority was defined as depicted in figure 63.
Figure 63: Telecom Company Goals Matrix
The company expert also defined the association between the different company goals and the four contextual layers (immediate, internal, external and
environmental layers) as depicted below in figures 64, 65, 66 and 67.
Company Goals
Maximize Profit (p1)
Increase Customer Base (P1)
Reduce Churn (P1.5)
Cut On Costs (P1.5)
Maximize Quality of Service (P2)
Increase Customer Satisfaction(P2)
Face Competition(P2)
Higher Customer Satisfaction (P2)
Mergers & Aquisitions(P2.5)
Innvotion in New Tariff plans (P2.5)

150
Figure 64: Telecom Immediate Context Goals
Immediate Context Goals
Maximize Profit
Cut on Costs
Maximize Quality of
service
Increase Customers Satisfaction
Face Competition
Increase Customers Satisfaction

151
Figure 65: Telecom Internal Context Goals
Internal Context Goals
Maximize Profit
Increase Customer Base
Reduce Customer Churn
Quality of Service
Increase Customer
Satisfaction
Face Competition
Increase Customer
Satisfaction

152
Figure 66: Telecom External Context Goals
External Context Goals
Maximize Quality of
service
Increase Customer
Satisfaction
Face Competition
Increase Customer
Satisfaction

153
Figure 67: Telecom Environmental Context Goals
Environmental Context Goals
Maximize Quality of
Service
Increase Customer
Satisfaction
Face Competition
Increase Customer
Satisfaction
Maximize Profit
Cut on Costs

154
4. Business Process Definition
The business process expert defined the business process with assistance from the system. After defining the
business process goals which in this case were similar to the company goals matrix listed earlier (excluding the
innovation and merger goals), the business process expert defined the business process alternative flows which were
represented in terms of a finite state machine (FSM) as depicted in figure 68.

155
Pay Bill Process
Issue Ticket for Customer Turn (2)
Check Bill at the Device(8)
Wait to pay for a person at
normal payment counter
Pay at Auto Touch Payment
Counter Devices
Get a Print Out of the Bill (3)Number is displayed on the
turn screen
Correct Bill
Go to Complaints Department(11)
Problem with Bill
Start 1
Problem with Bill go to
Step 11
Enter Credit Card at the Machine (9)
Correct Bill
Receive Receipt (10)Payment Completed
Pay by Credit Card (5)
Choose Payment Method (4)
Pay by Cheque (7)
Pay Cash(6)
Choose Credit Card
Choose Cheque
Choose Cash
Payment Completed
Figure 68: Bill Payment Business Process

156
The FSM is based on the pay bill business process steps and associated recommendations outlined in the pay bill
business process definition table in Appendix VI.
6. Telecom Business Process Cost definition
Table 29 details the associated cost definition of all the business process steps in the pay bill finite state machine as
defined by the business expert.
Table 29, Pay Bill Process Cost
Table 37: Telecom Business Process Cost
Step ID Step Name Man Power/$ Material
Cost/$
Total
Financial
Cost/$
Total Execution time/hour
1 Start 0 0 0 0.17
2 Issue Turn
Number
0 (1resources
number *5$)
=5
5 0.02
2’ Wait for
your Turn
0 (2resource * 5
$ average cost
of different
resources
10 0.5
3 Get a print
out of the
bill
(0.17 time *
man hour rate
10)=1.7
2resource * 7
$ average cost
of different
resources
14 0.25
4 Choose
Payment
Method
(0.17 time *
man hour rate
10)=1.7
0 1.7 0.17
5 Credit Card
Payment
(0.2 time * man
hour rate 10)=2
1resource * 8
$=8
10 0.2
6 Cash
Payment
(0.15 time *
man hour rate
10)=1.5
0 0 0.15
7 Wait at
Cheque
counter for
validation
(0.3 time * man
hour rate 10) =
3
2 resources *
8=16
19 0.3
8 Check Bill at
Self Service
Device
0 1 resource * 7 7 0.08
9 Enter Credit
Card at Self
Service
Machine &
Pay
0 1resource * 8
$=8
8 0.2
10 Receive
Receipt
(0.2* $10)=2 (1 resource *
8)
10 0.2
11 Go to
Complaints
Department
(1 * $10) =10 (2 resource *
8)
16 26

157
4.4.4. Telecom Experimental Results Summary and Analysis
In this section we illustrate the different contextual situations that the system automatically generated to simulate
real life ones. For each contextual situation we show how the business process flows as well as the financial cost
and time saved in each case. Table 30 summarizes the results from the 7 experiments (cases).
Benchmarking:
The benchmarking in our experiments is done through having a contextual case where all the contextual conditions
are within normal boundaries. Hence, the business process flows according to its default paths without any changes
in flow due to any recommendations related to contextual conditions. We therefore take the financial cost and the
execution time of the business process under this contextual case as the benchmark. We compare the cost of the
different runs that take different alternative paths (according to the context-awareness and goal-orientation
conditions) with this benchmark to identify the financial cost variance and the execution time variance.
Within this set of experiments on the Pay Bill business process the benchmark case is case 7.

158
Table 30, Pay Bill Experimental Results Summary
Context Case Run Situation Recommended
Business Process
Execution path
Financial Cost
Reduction (%)
Execution
Time
Reduction
(%)
The first case
represents a small
number of
counters while all
other conditions
are normal. The
strategy is
maximizing
quality of service
on the top of
everything.
Run 1 (A user who wanted to
start a normal payment to a
person , no self-service
device is waiting, his bill is
valid and he was intending to
pay using credit card)
Start (1), Redirect to
Bill Self Payment
Device (8), Enter
Credit Card at
Machine (9), Receive
Payment Receipt (10)
The main
recommendation was
redirecting bill self-
service counters
Run 1 Cost with
Context-awareness=
$ 25
Run 1 Cost Without
Context-awareness
= $ 50.7
Cost Reduction = 50
%
Run 1
Execution
Time with
Context-
awareness=0.
65 hour
Run 1
Execution
Time without
Context-
awareness=
1.51 hour
Execution
Time
Reduction =
60%
The second case
represents a cost
cutting strategy
and a crowded
while everything
Run 1 (A user who wanted to
start a normal payment to a
person , no self-service
device is waiting, his bill is
valid and he was intending to
Start (1), Redirect to
Bill Self Payment
Device (8), Enter
Credit Card at
Machine (9), Receive
Run 1 Cost with
Context-awareness=
$ 25
Run 1 Cost Without
Run 1
Execution
Time with
Context-
awareness=0.
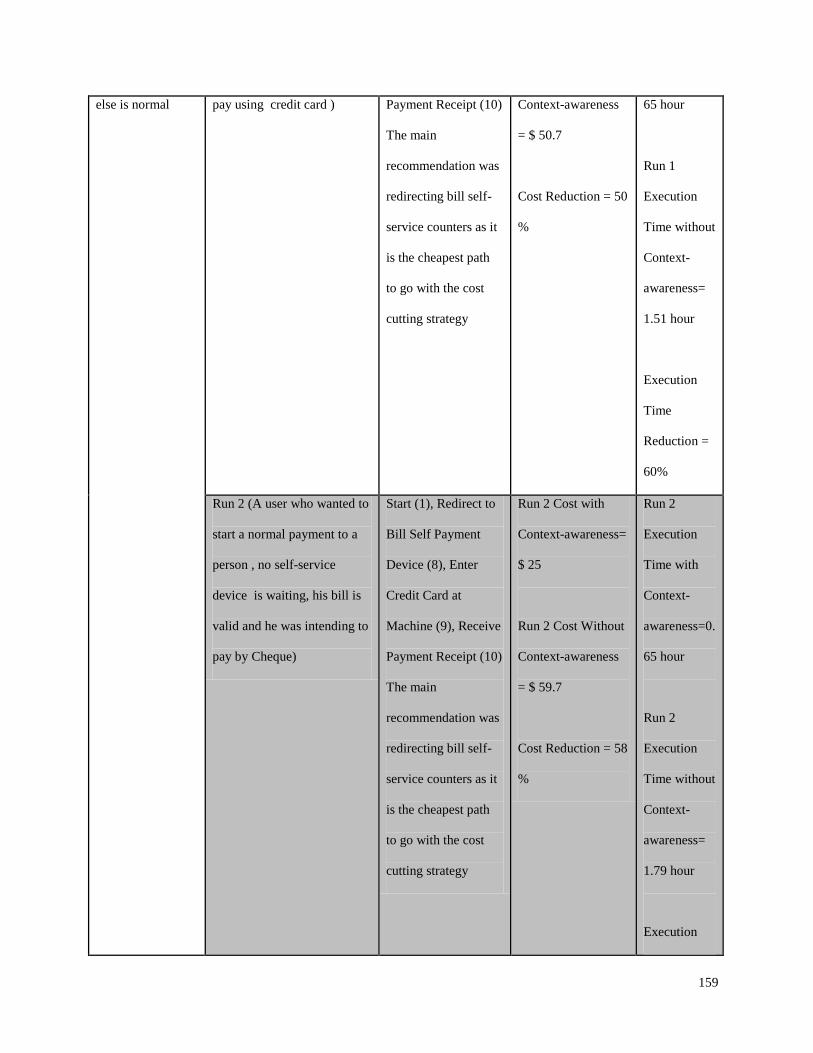
159
else is normal pay using credit card )
Payment Receipt (10)
The main
recommendation was
redirecting bill self-
service counters as it
is the cheapest path
to go with the cost
cutting strategy
Context-awareness
= $ 50.7
Cost Reduction = 50
%
65 hour
Run 1
Execution
Time without
Context-
awareness=
1.51 hour
Execution
Time
Reduction =
60%
Run 2 (A user who wanted to
start a normal payment to a
person , no self-service
device is waiting, his bill is
valid and he was intending to
pay by Cheque)
Start (1), Redirect to
Bill Self Payment
Device (8), Enter
Credit Card at
Machine (9), Receive
Payment Receipt (10)
The main
recommendation was
redirecting bill self-
service counters as it
is the cheapest path
to go with the cost
cutting strategy
Run 2 Cost with
Context-awareness=
$ 25
Run 2 Cost Without
Context-awareness
= $ 59.7
Cost Reduction = 58
%
Run 2
Execution
Time with
Context-
awareness=0.
65 hour
Run 2
Execution
Time without
Context-
awareness=
1.79 hour
Execution

160
Time
Reduction =
63.7%
The third case
represents a
conditions were all
resources are
abundant and it is
a crowded evening
yet all human
resources are
novice
Run 1 (A user who wanted to
start a normal payment to a
person , no self-service
device is waiting, his bill is
valid and he was intending to
pay using credit card )
Start (1), Redirect to
Bill Self Payment
Device (8), Enter
Credit Card at
Machine (9), Receive
Payment Receipt (10)
The main
recommendation was
redirecting bill self-
service counters.
Run 1 Cost with
Context-awareness=
$ 25
Run 1 Cost Without
Context-awareness
= $ 50.7
Cost Reduction = 50
%
Run 1
Execution
Time with
Context-
awareness=0.
65 hour
Run 1
Execution
Time without
Context-
awareness=
1.51 hour
Execution
Time
Reduction =
60%
Run 2 (A user who wanted to
start a normal payment to a
person , no self-service
device is waiting, his bill is
valid and he was intending to
pay by Cheque)
Start (1), Redirect to
Bill Self Payment
Device (8), Enter
Credit Card at
Machine (9), Receive
Payment Receipt (10)
The main
Run 2 Cost with
Context-awareness=
$ 25
Run 2 Cost Without
Context-awareness
= $ 59.7
Run 2
Execution
Time with
Context-
awareness=0.
65 hour

161
recommendation was
redirecting bill self-
service counters .
Cost Reduction = 58
%
Run 2
Execution
Time without
Context-
awareness=
1.79 hour
Execution
Time
Reduction =
63.7%
Case 3
Continuation
Run 3 (A user who wanted to
start a normal payment to a
person , no self-service
device is waiting, his bill is
valid and he was intending to
pay in Cash)
Start (1), Redirect to
Bill Self Payment
Device (8), Enter
Credit Card at
Machine (9), Receive
Payment Receipt (10)
The main
recommendation was
redirecting bill self-
service counters .
Run 2 Cost with
Context-awareness=
$ 25
Run 2 Cost Without
Context-awareness
= $ 40.7
Cost Reduction =
38.6%
Run 2
Execution
Time with
Context-
awareness=0.
65 hour
Run 2
Execution
Time without
Context-
awareness=
1.46 hour
Execution
Time
Reduction =

162
55.5%
The fourth case is
a crowded
evening, with
everything normal
except that some
credit card
machines are
down
Run 1 (A user who wanted to
start a normal payment to a
person , no self-service
device is waiting, his bill is
valid and he was intending to
pay using credit card )
Start (1), Issue Turn
Number (2) , Get a
Bill copy (3),
Use Credit Card
Machine of Self
Service Counter (9)
Receive Payment
Receipt (10)
The main
recommendation was
using the credit card
machines embedded
in the bill self-service
devices
Run 1 Cost with
Context-awareness=
$ 48.7
Run 1 Cost Without
Context-awareness
= $ 50.7
Cost Reduction = 4
%
Run 1
Execution
Time with
Context-
awareness=0.
65 hour
Run 1
Execution
Time without
Context-
awareness=
0.65 hour
Execution
Time
Reduction =
0%
The fifth case is a
crowded evening,
with everything
normal except that
some bill printing
machines are done
Run 1 (A user who wanted to
start a normal payment to a
person , no self-service
device is waiting, his bill is
valid and he was intending to
pay using credit card )
Start (1), Issue Turn
Number (2) , See Bill
at Self Service
Counter (8),
Pay using Credit
Card (5)
Receive Payment
Receipt (10)
The main
Run 1 Cost with
Context-awareness=
$ 43.7
Run 1 Cost Without
Context-awareness
= $ 50.7
Cost Reduction = 14
Run 1
Execution
Time with
Context-
awareness=0.
48 hour
Run 1
Execution

163
recommendation was
check the bill at the
self-service device
then come back to the
normal payment
process
% Time without
Context-
awareness=
0.65 hour
Execution
Time
Reduction =
26%
Continuation of
Case 5
Run 2 (A user who wanted to
start a normal payment to a
person , no self-service
device is waiting, his bill is
valid and he was intending to
pay in Cash)
Start (1), Issue Turn
Number (2) , See Bill
at Self Service
Counter (8),
Pay in Cash (6)
Receive Payment
Receipt (10)
The main
recommendation was
check the bill at the
self-service device
then come back to the
normal payment
process
Run 2 Cost with
Context-awareness=
$ 33.7
Run 2 Cost Without
Context-awareness
= $ 40.7
Cost Reduction =
14%
Run 2
Execution
Time with
Context-
awareness=1.
29 hour
Run 2
Execution
Time without
Context-
awareness=
1.46 hour
Execution
Time
Reduction =
26%
Continuation of Run 3 (A user who wanted to Start (1), Issue Turn Run 2 Cost with Run 2

164
Case 5 start a normal payment to a
person , no self-service
device is waiting, his bill is
valid and he was intending to
pay in Cheque
Number (2) , See Bill
at Self Service
Counter (8),
Pay in Cheque (7)
Receive Payment
Receipt (10)
The main
recommendation was
check the bill at the
self-service device
then come back to the
normal payment
process
Context-awareness=
$ 52.7
Run 2 Cost Without
Context-awareness
=$ 59.7
Cost Reduction =
14%
Execution
Time with
Context-
awareness=1.
62 hour
Run 2
Execution
Time without
Context-
awareness=
1.79 hour
Execution
Time
Reduction =
26%
The sixth case is
the company
adopting cost
cutting strategy, a
crowded evening
and self-service
payment devices
are few
Run 1 (A user who wanted to
start a normal payment to a
person , no self-service
device is waiting, his bill is
valid and he was intending to
pay in Cheque
Start (1), Issue Turn
Number (2) , Get Bill
Print out (3),
Pay in Cash (6)
Receive Payment
Receipt (10)
The main
recommendation is
enforcing people to
pay cash to avoid
extra cost and time or
Cost with context-
awareness= $ 40.7
Cost without
context-awareness=
$ 59.7
Cost
Reduction=31.8%
Execution
time with
context-
awareness=1.
46 hour
Execution
time without
context-
awareness=
1.79 hour
Time
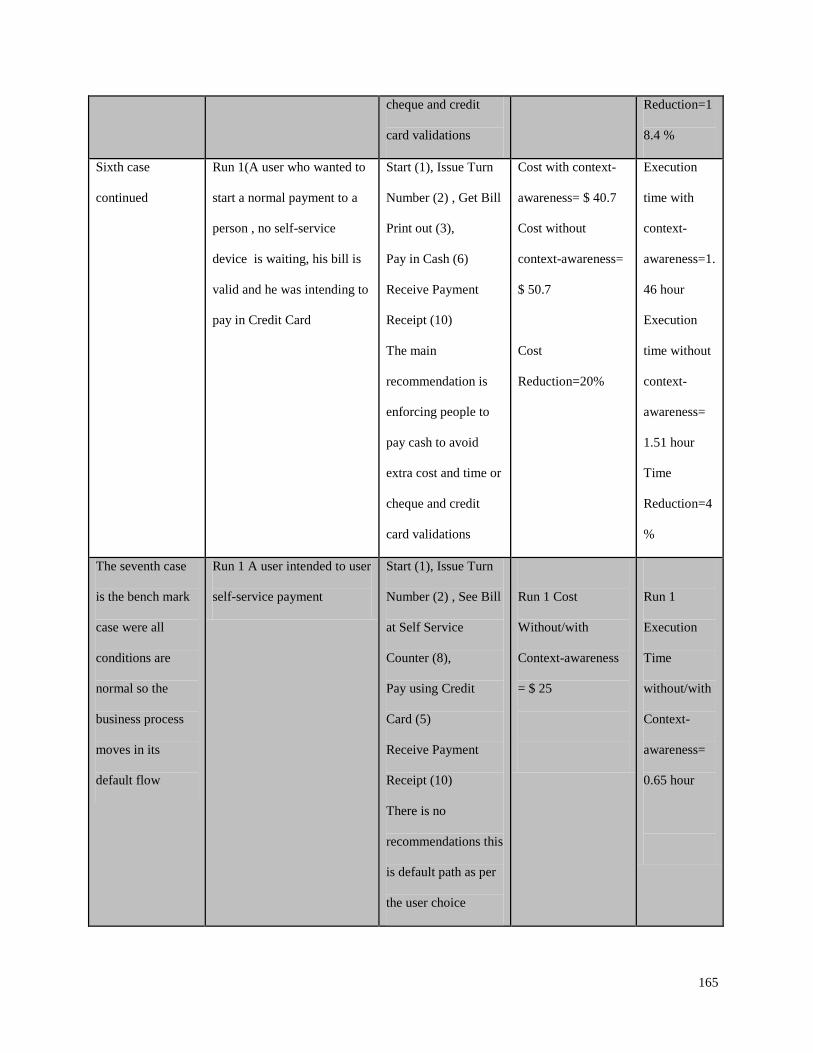
165
cheque and credit
card validations
Reduction=1
8.4 %
Sixth case
continued
Run 1(A user who wanted to
start a normal payment to a
person , no self-service
device is waiting, his bill is
valid and he was intending to
pay in Credit Card
Start (1), Issue Turn
Number (2) , Get Bill
Print out (3),
Pay in Cash (6)
Receive Payment
Receipt (10)
The main
recommendation is
enforcing people to
pay cash to avoid
extra cost and time or
cheque and credit
card validations
Cost with context-
awareness= $ 40.7
Cost without
context-awareness=
$ 50.7
Cost
Reduction=20%
Execution
time with
context-
awareness=1.
46 hour
Execution
time without
context-
awareness=
1.51 hour
Time
Reduction=4
%
The seventh case
is the bench mark
case were all
conditions are
normal so the
business process
moves in its
default flow
Run 1 A user intended to user
self-service payment
Start (1), Issue Turn
Number (2) , See Bill
at Self Service
Counter (8),
Pay using Credit
Card (5)
Receive Payment
Receipt (10)
There is no
recommendations this
is default path as per
the user choice
Run 1 Cost
Without/with
Context-awareness
= $ 25
Run 1
Execution
Time
without/with
Context-
awareness=
0.65 hour
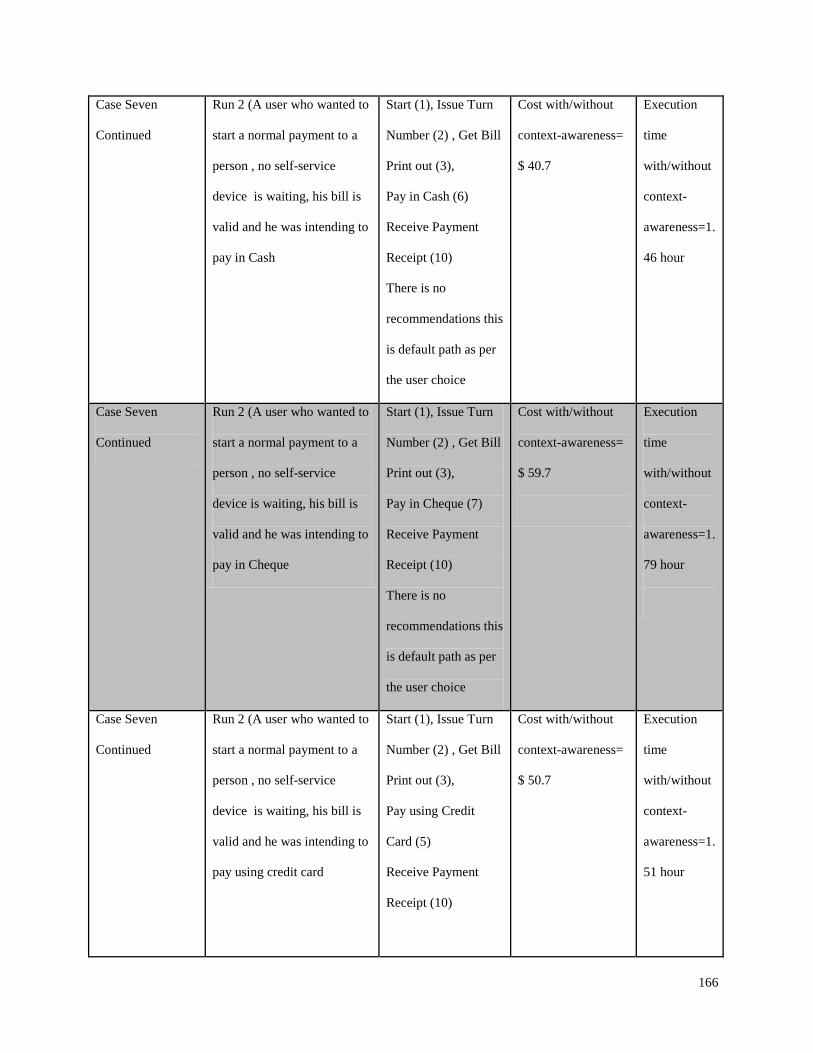
166
Case Seven
Continued
Run 2 (A user who wanted to
start a normal payment to a
person , no self-service
device is waiting, his bill is
valid and he was intending to
pay in Cash
Start (1), Issue Turn
Number (2) , Get Bill
Print out (3),
Pay in Cash (6)
Receive Payment
Receipt (10)
There is no
recommendations this
is default path as per
the user choice
Cost with/without
context-awareness=
$ 40.7
Execution
time
with/without
context-
awareness=1.
46 hour
Case Seven
Continued
Run 2 (A user who wanted to
start a normal payment to a
person , no self-service
device is waiting, his bill is
valid and he was intending to
pay in Cheque
Start (1), Issue Turn
Number (2) , Get Bill
Print out (3),
Pay in Cheque (7)
Receive Payment
Receipt (10)
There is no
recommendations this
is default path as per
the user choice
Cost with/without
context-awareness=
$ 59.7
Execution
time
with/without
context-
awareness=1.
79 hour
Case Seven
Continued
Run 2 (A user who wanted to
start a normal payment to a
person , no self-service
device is waiting, his bill is
valid and he was intending to
pay using credit card
Start (1), Issue Turn
Number (2) , Get Bill
Print out (3),
Pay using Credit
Card (5)
Receive Payment
Receipt (10)
Cost with/without
context-awareness=
$ 50.7
Execution
time
with/without
context-
awareness=1.
51 hour

167
Figure 69: Telecom Business Process Cost Variance Summary
0.00%
10.00%
20.00%
30.00%
40.00%
50.00%
60.00%
70.00%
Case 1 Case 2 Case 3 Case 4 Case 5 Case 6 Case 7
Cost Reduction Run 1
Cost Reduction Run 2
Cost Reduction Run 3

168
In figure 69 we summarize the cost reduction results of the major runs simulated for the Telecom pay bill business
process. Not all the contextual cases were tested on 3 runs as sometimes the contextual situation would lead to the
same recommendation whether the subscriber intended initially to pay in cash or cheque or by credit card like in
case 1 (where the contextual situation that was tested on the pay bill business process represents a small number of
counters while all other conditions are normal. The strategy is maximizing quality of service on top of everything.).
In case 1 it was sufficient to make only one run which was for a user who wanted to start a normal payment to a
person, i.e. no self-service device is waiting, his bill is valid and he was intending to pay using credit card.
Case 7 shows zero time saving as this is the benchmark case where there is no context-awareness of any kind being
simulated.
For the financial cost reduction we note a strong fluctuation from an improvement of cost as high as 67% to only
4%. The reason is that in the case where there is a limitation of resources we have a limited number of alternative
paths to take. So if we only apply a minor alteration to the process (whether we only need this minor alteration to
achieve the process goals or whether we are limited because of resources or a complex contextual situation) we will
get a small improvement like 4 %. Whereas when we decide on a major alteration such as redirecting the users to
self -service payment devices we get a much higher cost reduction. However, even a 4 % reduction in cost given that
this business process is repeated in different payment stores thousands of times a day, a 4 % means saving millions
in the short run and of course more benefits on the long run.

169
Figure 70: Telecom Business Process Execution Time Variance Summary
0.00%
10.00%
20.00%
30.00%
40.00%
50.00%
60.00%
70.00%
Case 1 Case 2 Case 3 Case 4 Case 5 Case 6
Time Saved Run 1
Time Saved Run 2
Time Saved Run 3

170
In figure 70 we summarize the time saving results of the major runs simulated for the Telecom pay bill business
process. Not all the contextual cases were tested on 3 runs as sometimes the contextual situation would lead to the
same recommendation whether the subscriber intended initially to pay in cash or cheque or by credit card like in
case 1 (where the contextual situation that was tested on the pay bill business process represents a small number of
counters while all other conditions are normal). The strategy is maximizing quality of service on the top of
everything.. In case 1 it was sufficient to make only one run which was for a user who wanted to start a normal
payment to a person, no self-service device is available, his bill is valid and he was intending to pay by credit card.
Case 7 shows zero time saving as this is the benchmark case where there is no context-awareness of any kind being
simulated.
For the execution time reduction we note the same kind of fluctuation this time from 63 % to 0%. And the reason
why we have extremely low or even no reduction in the execution time is that sometimes we are just solving a
problem (e.g. lack of kiosk counters) but the alternative path does not save us time. It might be our only option or
might save us some other financial cost or material cost but not time as in the contextual case four of our
experimental results. Of course, the higher reduction in time which in many cases was around 60 % proves that the
throughput would increase and the Telecom bill payment can take place with the contextual awareness and goal
orientation of business process models. This in turn would also save millions and maximize the business profit in the
short run and consequently on the long run.
The General Average of Financial Cost Reduction of all the runs = Summation of Cost Reductions of all
runs/number of runs = 33.4 %
The General Average of Execution time saved in all runs = Summation of Execution times Reductions of all
runs/number of runs=38.5%
The Overall Quality/Effectiveness of the model as per equation 6 in section 1.1.3 (Evaluation Criteria) =
(Summation of Financial cost reduction/ the number of business processes runs that Financial cost
reduction was calculated for) * Weight of F
+ (Summation of Time reduction/ the number of business processes that Time reduction was calculated for)
* Weight of TV
Assuming the we give equal weight to the financial cost as well as the time cost (0.5 each as the total of all weights
should be one), the overall results of the model from the tests done on the Telecom bill payment–process showed

171
improvement in the effectiveness of the decision making based on goal orientation and appropriate modeling of
context by (33.4%*0.5+38.5%*0.5) = 35.9 %. This is a significant percentage given that in real life and across
different payment points in the process executions for millions of times every day an enhancement of 35.9% means
millions of savings only on the short run.
Our experiments gave promising results with the appropriate sensation and modeling of a business process context
in terms of contextual aspects segmented into contextual layers. When each layer has a well-defined business-
oriented goal and models a business process in terms of a finite state machine that decides on the best next move
(according to recommendations defined by business process experts and related to context of the step) the net result
is a significant positive effect on reducing the financial cost of business processes and enhancement of the
throughput (i.e. the number of business processes that get executed within a certain time period or time frame). The
goal-oriented business process experimental results also show that our solution methodology proves to be a generic
one (that is, not tailored for a specific business process or business processes within a certain industry) but that it can
be adopted by any business process within any industry and that it can create significant enhancements in terms of
cost and execution time as a result of the business process adaptation based on context-awareness and goal-
orientation.
From both the financial cost reduction and execution time reduction on the short run and in various business
processes from various industries, we foresee promising results for context-aware goal-oriented business process
modelers on the long run. There are definitely more complex and detailed ways of measuring the effectiveness of the
proposed solution methodology but that needs a detailed research on its own.

172
Chapter 5: Summary and Conclusion
5.1. Summary of the Research In this research we proposed a methodology for sensation and identification of the different types of business
contextual elements. Our solution models the contextual elements related to different business domains by building
a library of aspects for each business domain embedded within an existing context-awareness framework. The
framework we selected is the Java Context-awareness Framework (JCAF). The output of the extended Context-
awareness framework is a set of apsectized contextual elements related to business processes for a specific industry.
The aspectized contextual facts are represented as triggers to configure the affected business processes. The business
processes themselves are modeled as goal driven finite state machines that take both goals and context into
consideration when deciding on the next best state (business process step to move to). This leads to an intelligent
decision-making process which is sensitive to the context of the business processes and their goals. The latter
become dynamically updatable by business process experts to incorporate the constant changes in business
environments. Our methodology of aspectizing context-awareness for business processes could be summarized in
the following tasks:
5.1.1. Context Sensation, Identification and Modeling
Initially we focused on the following contextual aspects: Non human resource utilization, human resource
utilization, human resource experience level, organizational strategies (i.e. the strategies of the organization
on which the business process is running e.g. whether the strategy is cost cutting or quality focused), the
risk factors associated with a process, industry regulations and practices affecting a process, timing, season,
and location. Yet we designed our solution methodology to be extensible to cater for any other contextual
aspects. We used the JCAF framework and extended it to support the representation of business process
context in terms of aspects.
5.1.2. Context Classification
After appropriately extracting and sensing contextual information, we classify the contextual data on the
four contextual layers: Immediate, internal, external and environmental.
The importance of context classification lies in the fact that the layer to which a contextual variable, or its
constituent elements belong, defines the level of impact of this contextual variable or element on the
173
business. In more specific terms, each contextual layer would have a specific set of known goals (whether
high level business goals or operational goals) that it impacts (i.e. the contextual variables or elements that
belong to this contextual layer and would in turn impact the high level goals and operational goals that this
contextual layer impacts). The goals that are impacted by each of the four contextual layers are defined but
would differ for each industry considered within the scope of our framework. It is through these important
links between the contextual variables and constituent elements and goals that we are able to identify which
contextual variables affect which business process. As we link the goals of the business process with the
goals of the contextual variables and detect the common goals, we identify which contextual variables and
elements affect which business processes and consequently which business process steps to take.
The contextual variables/elements classification is not done automatically as it would differ from one
industry to another and various industry experts may have their different views about them (e.g. weather
could be an immediate context item in one industry while in another industry it could be an environmental
context item). As a result, the most appropriate approach for classification that was adopted is to involve
the industry (domain)/business process experts by allowing them to define their own classification in an
easily updatable way. Hence we have two repositories, a repository for each industry/ business domain
(where the business domain experts define in a near natural language syntax or using simple graphical
forms the industry goals, the most important context elements related to the industry, the business processes
under this industry) and another business process repository defined by business process experts (which
stores the information related to the business process steps and alternatives, the business process specific
goals as well as possible recommendations for the business process flow ).
5.1.3. Business process modeling and configuration
The business process is represented in our framework as a sequence of states. Moving from one state to
another is done by identifying certain conditions and according to these conditions the business process
moves to the next best state. For the business process configuration to take place based on the context of
the business process and its goals, the following steps are taken:
1) Identifying which aspectized contextual variables/ elements affect which business processes and which
steps to take within these processes. This is achieved by identifying the goals of the business process
under investigation. It comes by studying the business behind the process and the wider picture that the

174
business process fits in, which comes from the understanding of the overall business domain. As
mentioned above, the goals of the company are to be placed in a goals repository within a certain industry
repository. For each company repository that we have business processes defined for, the definition
incorporates the goals of the process, the states (business process steps), the goals of each state (business
process step) and the conditions needed to move from one state to another (these conditions are of course
related to the context of the process). These definitions are made through a simple graphical interface and
are updatable by business experts.
2) Comparing the goals of the business process to the goals of the different aspects of contextual elements
that are of interest to the company under which the business process falls and detecting any common
goals. If common goals are found then the business process is affected by the context and through
common goals we are able to identify which business process steps are affected.
3) Matching the contextual elements that are affecting a certain business process according to the goals.
The business process experts must define a recommendation for the next best step based on ranges of
values of these contextual elements.
4) Registering the business process interest in contextual aspects of common goals and this takes place
through existing functionalities in JCAF. The business process runs and is triggered by changes in the
contextual aspects it registered in. According to the changes in values of the contextual aspects and the
conditions of jumping from one state/business process step to another (as per the business process
definition), the business process decides on the best sequence of steps/states to take given a certain
contextual input at a specific instance in time.

175
5.2. Summary of Experimental Results For the sake of proving our concept and the effectiveness of our solution methodology we created a prototypical
framework extending the classes of JCAF on eclipse 3.7 and we tested the framework on two business processes
coming from two different industries which are the check-in business process from the airlines industry and the
cellular phone bill payment business process from the Telecom industry. The results were very promising.
For the check-in business process from the airlines industry the average financial cost reduction of all runs was
around 12 % and the average reduction in execution time was around 34 % and the summation of the weighted
reduction in all types of costs was around 23 %. These percentages are significant given that in real life and across
world airports, the check -in process execution is done millions of times every day so an enhancement of 23%
means millions of monetary unit savings only on the short run.
For the bill payment business process from the telecom industry the average financial cost reduction of all runs was
around 33.4 % and the average reduction in execution time was around 38.5% and the summation of the weighted
reduction in all types of costs was around 35.9% which is a significant percentage given that in real life and across
different payment points in the process, executions are done for millions of times every day so an enhancement of
35.9% means millions of monetary unit savings only on the short run.
From the obtained results we deduce that the appropriate sensation and modeling of a business process context in
terms of contextual aspects segmented into contextual layers is a very promising advancement in the field of
business process modeling. By letting each layer have business oriented goals and modeling a business process in
terms of a finite state machine that decides on the best next move (according to recommendations defined by
business process experts and related to context of the step) we arrive at a significant positive effect on reducing the
financial cost of business processes and enhancing the throughput (the number of business process that could be
executed within a certain time period or time frame). In addition, we can deduce from experimental results that our
solution methodology is a generic one as it is not tailored for a specific business process or business processes
within a certain industry but can be adopted by any business process within any industry and it can create significant
enhancements in terms of cost and execution time as a result of the informed business process adaptation that is both
context-aware and goal-oriented.
176
5.3. Challenges Faced In the course of this research we faced a number of challenges with our solution methodology, framework and
testing results.
The first challenge was on how to represent the next best move from one state to another in our finite state machine.
We solved this by enabling the business process expert to define transitional conditions as a combination of logically
“anded” and “ored” post state conditions and contextual conditions (the contextual conditions are related to the
context item related to the step goals as described above in section 5.1).
The second challenge was on how to handle controversial contextual situations that would create a perplexing
situation where a certain business process recommendation/configuration maximizes a certain goal yet harms
another goal. We addressed this challenge by placing a priority for every goal and this priority is configurable by the
business process expert and hence whenever a controversial decision arises we resolve it by taking the
recommendation that is related to the higher priority goals. If we have more than one goal at the same priority level,
we take a weighted average of the goals and then take the recommendation in favor of the highest weighted average
of the priority of goals.
The third type of challenge was related to the implementation details of our proof of concept framework. These may
be summarized as follows:
Understanding the tools to be extended and adapting their logic. This was resolved in cooperation with the
owners of these tools.
Extending JCAF to include aspectization especially that the JCAF framework never included in their
roadmap the idea of aspects and their relation to contextual items. This was understandable as there is no
substantial research in the area of aspectization of contextual elements yet.
Researching and understanding about Aspect oriented development and how it could be merged with JCAF
Finding an AspectJ development tool that could incorporate the normal JCAF java implementations and
the aspect implementation and compiling them in a homogenous manner
The fourth and probably the most challenging part in this research was finding a methodology through which
the effectiveness of modeling the context of business processes and modeling the business process as a goal

177
driven finite state machine and linking context to goals (to define which context affects which business
decisions) could be measured. The evaluation was not easy and could be considered in more details in a
separate research on its own. We believe that different business decisions can be evaluated on two levels: the
ability to maximize profit on the long run and the ability to maximize profit on the short run. In our
experimental work we relied on the fact that any measure that is taken even for the short run should have its
impact assessed even if it is very mild on the short run. Hence, we established our evaluation criteria to two
types of cost: the financial cost which is the human resource and material cost of a business process, and the
execution time of the business process. We also added a third measure which is a weighted average of those two
measures where each measure is given a weight (from 0 to 1) according to its relevance to the business and thus
we end up with a single absolute number to measure the effectiveness of our model. In our case, we do not
make the decision as the business process expert is the one who defines the recommendations however we do
provide a tool for the business process expert to find out if his/her recommendations were in the right direction
or not.
5.4. The Research Contributions In this research we presented a new general purpose methodology for aspectized modeling of the context of business
processes within the different business domains and also for modeling business processes as goal-oriented finite
state machines. We envisioned how context may be conceptualized, how contextual elements may be distributed
across business operational levels according to the goals of the business process, and how business process flow
recommendations based on the aspectized contextual facts may materialize. We designed our methodology in a way
that is practically usable, easily understandable and updatable by business domain experts. We designed a prototype
framework as a proof of concept by extending the JCAF framework to allow us to take an experimental approach.
We tested our framework within the Airlines and Telecom business domains and showed that higher business profits
may be achieved by reducing financial cost and increasing throughput. The experimental results using this
framework indicate the direction to be very promising and the framework itself to be a starting contribution to
intelligent business decision making that is based on context-awareness and goal-orientation. In fact, the results
assert the importance of further investigations in integrating context-awareness, context modeling and goal-
orientation in the field of business process modeling as well as configuration and decision making. We summarize
our major research contributions as follows:
178
Conceptualizing the use of context-awareness within the field of business process modeling
Extending the currently existing java context-awareness framework to cater for modeling of business
processes context
Making use of the advancement in context sensation and awareness research in a new field which is
business process context-awareness
Modeling context of the business process as aspects (cross cutting concerns) for the first time in aspect
oriented research and applications
Introducing a goal-oriented business process modeling technique that tightly bounds the business process
context to the business goals and hence utilizes the context-awareness in achieving the different business
goals according to their priority
Defining a generic solution methodology and framework for context-aware goal-oriented modeling that
could be easily adopted by various business/industrial domains
Building our solution methodology on a business knowledge base that is fully defined by business experts
and enabling business experts to update this business knowledge base in a simple manner
Establishing a preliminary evaluation method for our solution methodology and framework. In this
evaluation method the evaluation criteria are based on various aspects of financial cost as well as business
process execution time which are among the main business profitability drivers.
We see this research as an addition to the adoption of context-awareness methodologies and modern technologies in
business process modeling and we believe that it opens the door for more research in the area of intelligent business
environments. We also foresee that there are more interesting research topics in this area that need the attention of
the research community. Some of these research topics are listed below in the next section.

179
5.5. Future Work
The idea of aspectizing context-awareness within business processes and tightly binding the business process
configurations to business goals and business context is a fairly new area of research and based on our literature
review, very few researches were in fact conducted in this area. Hence, there are several future directions to go
further. The most important future extensions to this research may be summarized as follows:
In real business the relationship between goals is many to many. In our framework we identify a sub-
operational goal that can contribute to more than one strategic goal but for simplicity, we do not model
the relationship between the strategic goals and themselves (i.e. a strategic goal cannot be a sub-goal to
another strategic goal) and we maintain the goals at two levels of depth while in real business they could
go to endless levels. The goals’ depth level and relationship to each other is an important area for future
enhancement and research to make the solution methodology capable of simulating real complex
business environments.
The relationship between contextual aspects and each other and how they impact each other was not
included in our investigations, yet in real business environments there may be a variety of relationships
between the different contextual aspects. This is another area that needs further research.
The prioritization of contextual aspects and their conflict resolution in association with the business
goals is another part that needs further investigation in our framework. We handle it in a simple way and
give priority to contextual aspects related to goals of higher priority but in real business environments
the situation might be more complex to achieve a more robust, goal-oriented, context-aware
prioritization scheme.
The knowledge base for industries, companies and business processes information in our proposed
solution methodology relies on the industry and company experts input and their updates. An important
future direction is to develop this knowledge base to be a self -learning knowledge base that
accumulates previous knowledge and learns from various cases and this could be done using neural
networks or other artificial intelligence techniques. In this case the knowledge base will not only rely on
the input from the industry and company experts but it will have its own guidelines for every industry so
that it can even suggest decisions and guide the experts.

180
Our solution methodology and prototypical framework concentrated on nine contextual aspects
(Material utilization, Human resource utilization, Human resource experience level, Timing, Season,
Strategy, Risk factors, and Industry regulation) and it provided an easy way to add new aspects An
interesting area of research could be providing the business users with questions that help them identify
the exact contextual aspects that they need to consider for their business in addition to those nine
aspects.
Our solution methodology classifies the contextual aspects into the four main contextual layers
(immediate, internal, external and environmental) at the industry level. However, in some very special
business cases the business process expert might need to re-define this classification on the business
process level. Studying the impact of defining the contextual aspects classification on the business
process level versus the industry level is an interesting future area of research.
In our prototypical framework, the business process is modeled in terms of finite state machines. The
modeling of more complex business processes could use petri-nets to represent the concurrently running
objects as concurrency is sometimes considered an important requirement within the area of business
process modeling.
Our solution methodology focused on non-predictable contextual aspects that need to be sensed and
accordingly the business process flow could change. However, there is an important set of predictable
contextual aspects that are expected at certain timings or seasons. Hence, another future area of research
could be analyzing those predictable contextual aspects for every industry and embedding pre-defined
recommendations for business process flow that may be followed when those predictions become true.
The evaluation methods in our proposed solution methodology could also pave the way for a separate
track of future work. The first step in this research could be finding normalization criteria for the
different types of costs of a business process. Also, discovering the correct measures and statistics of
business improvement is a research area on its own. The future research needs to show detailed
evidence that appropriate context modeling enhances the business process configurations and decision
making. This was not a core part of the research as what we have done is only a preliminary step into
trying to evaluate the effectiveness of context modeling within the business process modeling domain
from a cost-effectiveness perspective. However, it opens the door for further work to evaluate and

181
investigate the effectiveness of context modeling within the business process modeling domain and
relating it to financial cost. Of course, measuring the effectiveness of context modeling is a fairly
complicated task that goes beyond cost. As in some cases cost might increase after context modeling
but there is more customer satisfaction or it might be that the cost increases now and decreases in the
long run. There are many parameters involved and the process of measuring their effectiveness might
require more than one research effort on its own.

182
Appendices
Appendix I In this appendix we show the structure of the contextual knowledge XML file that is available for each industry
examined within our framework.
<Ontology xmlns:xsi="http://www.w3.org/2001/XMLSchema-instance"
xsi:schemaLocation="http://www.cs.aucegypt.edu /Context Definition
http://www.cs.aucegypt.edu/OntologySchema.xsd"
xmlns="http://www.cs.aucegypt.edu /Context VariablesValuesSchema"
elementFormDefault="qualified" attributeFormDefault="unqualified">
<!—Contextual Knowledge -->
<Industry>Airlines </Industry>
<Immediate Layer>
<Context Aspect name=”Human Resource Utilization”>
<Context Variable>
< name> Employee Number </name>
<max>10<max>
<min> 1<min>
<Context Variable>
</Context Aspect>
<Context Aspect name= “Season”>
<Context Aspect name=”Material Utilization”>
<Context Variable>
< name> Counters </name>
<max>10<max>
<min> 1<min>
<Context Variable>
</Context Aspect>
</Immediate Layer>
<Internal Layer>
<Context Aspect name=”Risk Factors”>
<Context Variable>
< name>Counters Failure </name>
<max>10<max>
<min> 1<min>
<Context Variable>
</Internal Layer>

183
Appendix II In this appendix we show the structure of the company goals matrix XML file that is available for each industry
examined within our framework.
<Ontology xmlns:xsi="http://www.w3.org/2001/XMLSchema-instance"
xsi:schemaLocation="http://www.cs.aucegypt.edu /Context GoalsSchema
http://www.cs.aucegypt.edu/OntologySchema.xsd"
xmlns="http://www.cs.aucegypt.edu /Context GoalsSchema"
elementFormDefault="qualified" attributeFormDefault="unqualified">
<!—Context Layers Definition -->
<Industry>Airlines </Industry>
<Company> British Airways </Company>
<Strategic goal>
<goal name> Increase Profile</goal name>
<goal target> 1 million </goal target>
<goal time frame> 1 year </goal time frame>
<goal priority > 1 </goal priority>
<Operational goals list>
<Operational goal>
<goal name> Attract More Customers</goal name>
<goal target> 1 million </goal target>
<goal time frame> 4 months </goal time frame>
<goal priority > 1 </goal priority>
<goal layer> Immediate </goal layer>
</Operation goal>
<Operational goal>
<goal name> Cut on Operational costs</goal name>
<goal target> 1 million </goal target>
<goal time frame> 5 months </goal time frame>
<goal priority > 1 </goal priority>
<goal layer> Immediate </goal layer>
<goal layer> Internal </goal layer>
</Operation goal>
</Operational goals list>
</Strategic goal>

184
Appendix III In this appendix we show the structure of the business process XML file that is available for each industry examined
within our framework.
<Ontology xmlns:xsi="http://www.w3.org/2001/XMLSchema-instance"
xsi:schemaLocation="http://www.cs.aucegypt.edu /BusinessProcessSchema
http://www.cs.aucegypt.edu/OntologySchema.xsd"
xmlns="http://www.cs.aucegypt.edu /BusinessProcess Schema"
elementFormDefault="qualified" attributeFormDefault="unqualified">
<!—Business Process Definition -->
<Industry>Airlines </Industry>
<business process name> Check-in </business process name>
<business process goals>
<Strategic goal>
<goal name> Increase Profit</goal name>
<goal target> 1 million </goal target>
<goal time frame> 1 year </goal time frame>
<goal priority > 1 </goal priority>
<Operational goals list>
<Operational goal>
<goal name> Attract More Customers</goal name>
<goal target> 1 million </goal target>
<goal time frame> 4 months </goal time frame>
<goal priority > 1 </goal priority>
<goal layer> Immediate </goal layer>
</Operation goal>
<Operational goal>
<goal name> Cut on Operational costs</goal name>
<goal target> 1 million </goal target>
<goal time frame> 5 months </goal time frame>
<goal priority > 1 </goal priority>
<goal layer> Immediate </goal layer>
<goal layer> Internal </goal layer>
</Operation goal>
</Operational goals list>
</Strategic goal>
</business process goals>
<business process steps>
<step>
<step id>1 </step id>
<step name> Check Traveler Id</step name>
< step goals>
<Operational goal>
<goal name> Cut on Operational costs</goal name>
<goal target> 1 million </goal target>
<goal time frame> 5 months </goal time frame>
<goal priority > 1 </goal priority>
<goal layer> Immediate </goal layer>
<goal layer> Internal </goal layer>
</Operation goal>
</step goals>
<Step PreCondition>

185
<Condition name> <Condition name>
<Condition value> <Condition value>
</Step PreCondition>
<Step Transition>
<Condition>
<Condition name> <Condition name>
<Condition value> <Condition value>
<next step> 11</next step>
</Condition>
<Condition>
<Condition name> <Condition name>
<Condition value> <Condition value>
<next step> 15</next step>
</Condition>
</Step Transition>
</step>
</business process steps>
</step>

186
Appendix IV The table in this appendix represents the full definition of the Airlines Check-In Process with all its steps, their pre-
conditions, their post-conditions, their goals and the transitional recommendation conditions.
Step ID Step Name Goals Pre-
Conditions
Post
Conditions
Recommendations
1 Start Profit- Attract
More
Customers,
Profit – Cut on
operational
cost,
Quality of
Service-Higher
Customer
Satisfaction,
Face
Competition-
Higher
Customer
Satisfaction
Have E-
Ticket, Have
Been Checked
at the gate,
Is not a
banned
traveler
Valid Traveler
& Normal
Check-in,
Valid Traveler
& Kiosk
Check-in ,
Valid Traveler
& Web Check-
in
If Valid Traveler & Normal
Check-in &
[Number of Check-in
Counters is small (1 to 200)
Or
Total staff is small (1 to
200)
Or
Experiences staff ratio to
novice staff ratio (<50 %)
Or
The season is Holiday
Season
Or
The Timing is a Morning
Time
Or
A Portion of staff is on
Strike
Or
Strategy is Profit

187
maximization and cost
cutting then
Go to Step 5 Kiosk Check-in
]
Priority=1.64
If Valid Traveler & Normal
Check-in&
[ Enough counters, &staff &
normal season & quality
maximization strategy
Go to Step 2
]
Priority=1.64
If Valid Traveler & Kiosk
Check-in &
[Number of Kiosk Counters
is small (1 to 50)
Or
The season is Holiday
Season
Or
The Timing is a Morning
Time
Or
Strategy is Profit
maximization and cost
cutting then

188
Go to Step 12 Web Check-in
(Cheapest kind of check-in)
]
Priority=1.64
If Valid Traveler & Normal
Check-in &
[Luggage Loaders are few (1
to 200)
Go to Step 12 Web Check-
in]
If Valid Traveler & Kiosk
Check-in&
[ Enough counters, &normal
season & quality
maximization strategy
Go to Step 5
]
Priority=2
If Valid Traveler & Web
Check-in &
[Luggage Loaders for web
check are few (1 to 50)
&

189
Kiosk Counters are abundant
>50]
Go to Step 5 Kiosk Check-
in]
Priority=1.64
If Valid Traveler & Web
Check-in&
[ Enough counters, &normal
season & quality
maximization strategy
Go to Step12
]
Priority=2
2 Wait For
Normal
Check-in
Quality of
Service-
Increase
Customer
Satisfaction,
Face
Competition-
Increase
Customer
Satisfaction,
Valid
Traveler
Ready to
Check-in as
Economy
Class,
Ready to
Check-in as
Business Class
If Ready to Check-in As
Economy Passenger
&
[Number of Economy
Check-in Counters is small
(50 to 150)
Or
Total staff is small (1 to
200)
Or

190
Quality of
Service-
Increase
Flexibility with
Passengers
Experiences staff ratio to
novice staff ratio (10 %-50
%)
Or
The season is Holiday
Season
Or
The Timing is a Morning
Time
Or
A Portion of staff is on
Strike
Or
Strategy is Profit
maximization and cost
cutting then
Go to Step 4 redirect
economy passengers to
business counter (if business
counters are abundant) till
the bottle neck gets better,
else go to step 5 (Kiosk log
in) or 12 (Web log in)
]
Priority=1.64
If Ready to Check-in As
Economy Passenger
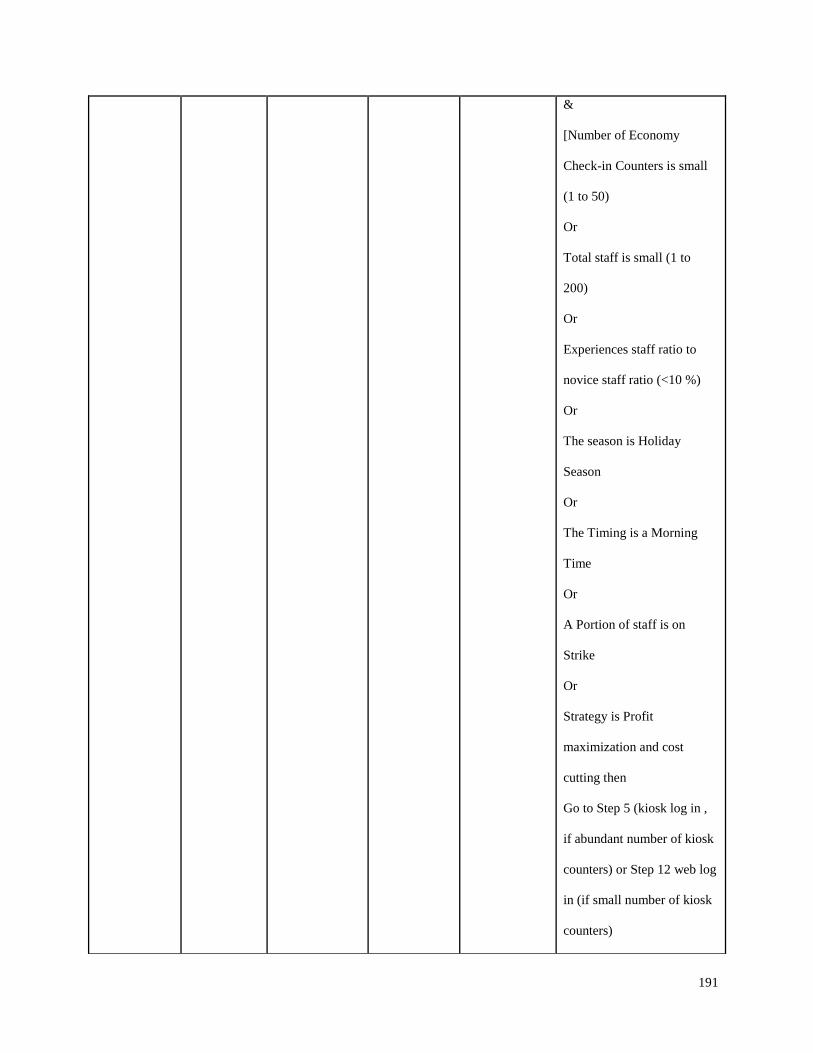
191
&
[Number of Economy
Check-in Counters is small
(1 to 50)
Or
Total staff is small (1 to
200)
Or
Experiences staff ratio to
novice staff ratio (<10 %)
Or
The season is Holiday
Season
Or
The Timing is a Morning
Time
Or
A Portion of staff is on
Strike
Or
Strategy is Profit
maximization and cost
cutting then
Go to Step 5 (kiosk log in ,
if abundant number of kiosk
counters) or Step 12 web log
in (if small number of kiosk
counters)

192
]
Priority=1.64
If Ready to Check-in As
Economy &
[ Enough counters, &staff &
normal season & quality
maximization strategy
Go to Step 4
]
Priority=1.64
If Ready to Check-in As
Business Passenger
&
[Number of Business Check-
in Counters is small (1 to
50)
Or
Total staff is small (1 to
200)
Or
Experiences staff ratio to
novice staff ratio (<50 %)
Or
The season is Holiday
Season
Or

193
The Timing is a Morning
Time
Or
A Portion of staff is on
Strike
Or
Strategy is Profit
maximization and cost
cutting then
Go to Step 5 (kiosk log in ,
if abundant number of kiosk
counters) or Step 12 web log
in (if small number of kiosk
counters)
]
Priority=1.64
If Ready to Check-in As
Business &
[ Enough counters, &staff &
normal season & quality
maximization strategy
Go to Step 3
]
Priority=1.64
3 Present Quality of Ready to Either Valid If Invalid documents redirect

194
Papers at
Business
Counter
service-
Increase
Customer
Satisfaction,
Face
Competition-
Increase
Customer
Satisfaction,
Maximize
Profit-Cut on
operation cost,
Maximize
Profit-Cost
Effective
Employment
Check-in as
Business
Passenger
documents or
invalid
documents
to step 6 –(Resolve the
problem at Airport security
office)
If valid documents &
[
Number of Business Check-
in Counters is small (1 to
50)
Or
Total staff is small (1 to
200)
Or
Experiences staff ratio to
novice staff ratio (<50 %)
Or
The season is Holiday
Season
Or
The Timing is a Morning
Time
Or
A Portion of staff is on
Strike
Or
Strategy is Profit
maximization and cost
cutting then

195
Go to Step 9(luggage
registration)i.e. skip the seat
choice step
]
Priority=1.5
If valid documents &
[
Number of Business Check-
in Counters is small (1 to
50)
Or
Total staff is small (1 to
200)
Or
Experiences staff ratio to
novice staff ratio (<50 %)
Or
The season is Holiday
Season
Or
The Timing is a Morning
Time
Or
A Portion of staff is on
Strike
Or
Strategy is Profit

196
maximization and cost
cutting then
&
Luggage Loaders are
few(<50)
Go to Step 12(direct the
passengers to luggage
loaders of web check-in
]
Priority=1.4
If valid documents &
[
Counters, staff are abundant
& staff is experienced &
normal season & strategy is
maximize quality of service)
Go to Step 8(Choose Seat
Through Agent)
]
Priority=1.6
4 Present
Papers at
Economic
Quality of
service-
Increase
Ready to
Check-in as
Economy
Either Valid
documents or
invalid
If Invalid documents redirect
to step 6 –(Resolve the
problem at Airport security

197
Counter Customer
Satisfaction,
Face
Competition-
Increase
Customer
Satisfaction,
Maximize
Profit-Cut on
operation cost,
Maximize
Profit-Cost
Effective
Employment
Passenger documents office)
If valid documents &
[
Number of Economy Check-
in Counters is small (1 to
150)
Or
Total staff is small (1 to
200)
Or
Experiences staff ratio to
novice staff ratio (<50 %)
Or
The season is Holiday
Season
Or
The Timing is a Morning
Time
Or
A Portion of staff is on
Strike
Or
Strategy is Profit
maximization and cost
cutting then
Go to Step 9(luggage
registration)i.e. skip the seat

198
choice step
]
Priority=1.5
If valid documents &
[
Number of Economy Check-
in Counters is small (1 to
150)
Or
Total staff is small (1 to
200)
Or
Experiences staff ratio to
novice staff ratio (<50 %)
Or
The season is Holiday
Season
Or
The Timing is a Morning
Time
Or
A Portion of staff is on
Strike
Or
Strategy is Profit
maximization and cost
cutting then

199
&
Luggage Loaders are
few(<50)
Go to Step 12(direct the
passengers to luggage
loaders of web check-in
]
Priority=1.4
If valid documents &
[
Counters, staff are abundant
& staff is experienced &
normal season & strategy is
maximize quality of service)
Go to Step 8(Choose Seat
Through Agent)
]
Priority=1.6
5 Check-in at
Kiosk
Profit- Cut on
operation costs,
Profit-Cost
effective
employment,
Valid
Traveler
Ready for
Automatic
document scan
If Invalid documents redirect
to step 6 –(Resolve the
problem at Airport security
office)

200
Quality-
Increase
Customer
satisfaction,
Face
Competition-
Increase
Customer
satisfaction
If valid documents &
[
The season is Holiday
Season
Or
The Timing is a Morning
Time
Or
Strategy is Profit
maximization and cost
cutting then
&
Web Check-in Counters Are
Abundant>50
Go to Step 12(Skip Seat
Choice & luggage
registration at check-in
counters)
]
Priority=1.4
If valid documents &
[
The season is Holiday
Season
Or
The Timing is a Morning
Time
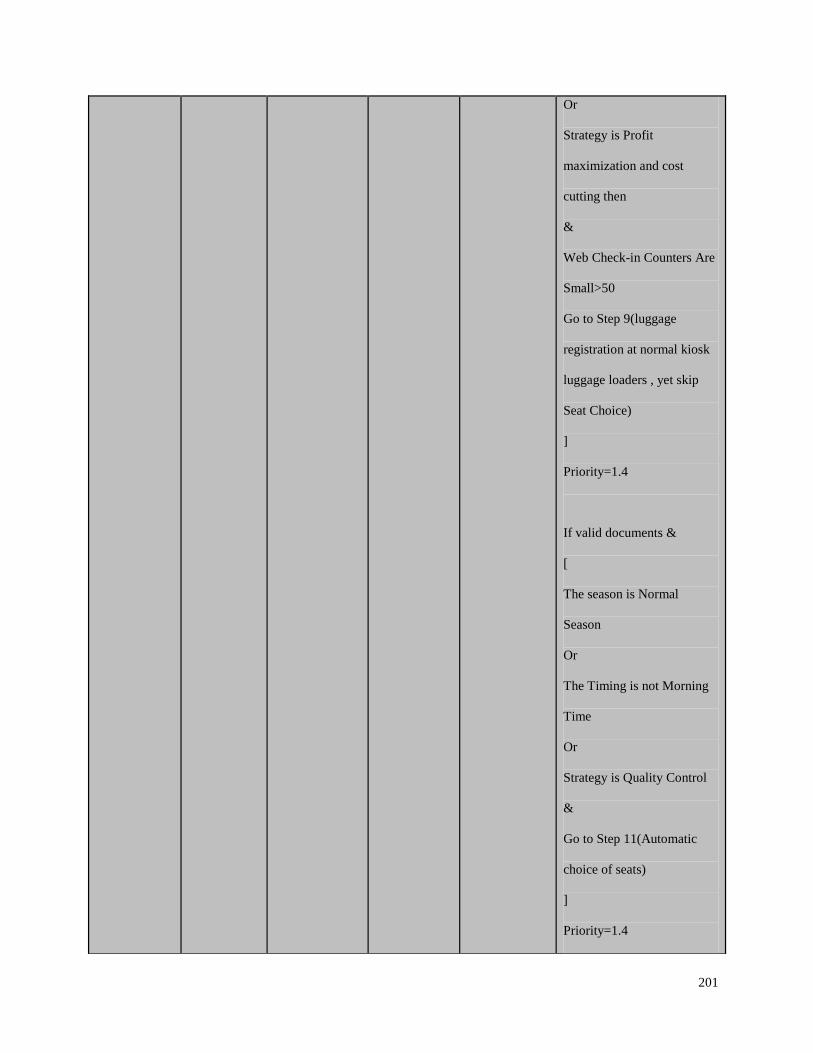
201
Or
Strategy is Profit
maximization and cost
cutting then
&
Web Check-in Counters Are
Small>50
Go to Step 9(luggage
registration at normal kiosk
luggage loaders , yet skip
Seat Choice)
]
Priority=1.4
If valid documents &
[
The season is Normal
Season
Or
The Timing is not Morning
Time
Or
Strategy is Quality Control
&
Go to Step 11(Automatic
choice of seats)
]
Priority=1.4

202
6 (Terminal
Step)
Handle
Invalid
documents at
Airport
Security
Office
Invalid
passenger
documents
Invalid
Passenger
No recommendations as this
is a terminal step
7 Automatic
Scan of
Documents
at Kiosk
Quality of
service-
Increase
Customer
Satisfaction,
Face
Competition-
Increase
Customer
Satisfaction,
Maximize
Profit-Cut on
operation cost,
Maximize
Profit-Cost
Effective
Employment
Ready for
Automatic
Document
Scan
Either Valid
documents or
invalid
documents
If Invalid documents redirect
to step 6 –(Resolve the
problem at Airport security
office)
If valid documents &
[
Number of Kiosk counters
small (1 to 50)
Or
The season is Holiday
Season
Or
The Timing is a Morning
Time
Or
Strategy is Profit
maximization and cost
cutting then
&
Web Check-in Counters>50

203
Go to Step 12(skip seat
choice, and register luggage
at web check-in loaders)
]
Priority=1.7
If valid documents &
[
Number of Kiosk counters
small (1 to 50)
Or
The season is Holiday
Season
Or
The Timing is a Morning
Time
Or
Strategy is Profit
maximization and cost
cutting then
&
Web Check-in Counters<50
Go to Step 9(skip seat
choice)
]
Priority=1.7

204
If valid documents &
[
Counters, staff are abundant
& staff is experienced &
normal season & strategy is
maximize quality of service)
Go to Step 11(Choose Seat
Through Kiosk Machines)
]
Priority=1.7
8 Choose Seat
through
Agent
Profit-Cut On
Operation Cost,
Profit-Cost
Effective
employment,
Quality of
Service- Higher
Flexibility with
Passengers,
Quality of
Service-
Increase
Customer
Satisfaction
Valid
documents
Seat Chosen If Seat Chosen &
[
Number of counters small (1
to 200)
Or
The season is Holiday
Season
Or
Total staff is small (1 to
200)
Or
Experiences staff ratio to
novice staff ratio (<50 %)
Or

205
The Timing is a Morning
Time
Or
Strategy is Profit
maximization and cost
cutting then
&
Web Check-in Counters>50
Go to Step 12(register
luggage at web check-in
loaders)
]
Priority=1.6
Otherwise, the only choice is
to go to step 9(Normal
luggage registration)
9 Normal
Luggage
Registration
at Counter
Quality of
Service-
Increase
Customer
Satisfaction,
Face
Competition,
Increase
Customer
Satisfaction
Seat Chosen Overweight
Fine Ticket
Issued, or
Luggage
within weight
&Loaded
If Overweight, go to step 13
(Pay fine)
Else If Luggage within
weight & Loaded , go to step
10 (Issue Boarding Pass)

206
10(Terminal) Issue
Boarding
Path
Luggage
Loaded
Boarding Pass
Issued &
Check-in
Process Ended
No recommendations this is
a terminal step
11 Choose Seat
Your Self at
Kiosk
Maximize
Profit- Cut on
operational
costs,
Maximize
Profit-Cost
Effective
employment,
Maximize
Quality of
service-High
Flexibility with
Passengers,
Face
Competition-
High Flexibility
with
Passengers,
Quality of
service-
Increase
Customer
Satisfaction
Valid
documents
Seat Chosen If Seat Chosen &
[
Number of kiosk counters
small (1 to 50)
Or
The season is Holiday
Season
Or
The Timing is a Morning
Time
Or
Strategy is Profit
maximization and cost
cutting then
&
Web Check-in Counters>50
Go to Step 12(register
luggage at web check-in
loaders)
]
Priority=1.8
Otherwise, the only choice is
to go to step 9(Normal

207
luggage registration)
12 Drop
luggage at
web check-in
special
counters (for
luggage
only)
Quality of
Service-
Increase
Customer
Satisfaction,
Face
Competition,
Increase
Customer
Satisfaction
The passenger
did web
check-in
Overweight
and Fine
issued, or
within weight
and luggage
loader
If Overweight go to step 13
to pay fine
Else If within weight go to
step 10 to issue boarding
pass
13 Pay
overweight
fine
Maximize
Profit-
Maximize Price
Overweight Fine paid If fine paid go to step 10 to
issue boarding pass

208
Appendix V In this appendix we illustrate the different contextual situations that the system automatically generates to simulate
what takes place in real life and we show for each contextual situation how the business process flows as well as the
financial cost and time saved in each case. We show all the major runs that we tested on our system and their output.
Contextual Case One
The following table describes the first contextual situation that was tested on the check-in business process. The first
case represents a high season while all other conditions are normal. The strategy is maximizing quality of service on
the top of everything else.
Context Element Context Aspect Context Layer Context Value
Economy Check-in
Counters
Material Utilization Immediate 300
Business Check-in
Counters
Material Utilization Immediate 55
Kiosk Check Counters Material Utilization Immediate 55
Web Check-in Luggage
Counters
Material Utilization Immediate 55
Boarding Pass Printing
Machines
Material Utilization Immediate 355
Luggage Loaders Material Utilization Immediate 55
Total Number of Staff Human Resource
Utilization
Immediate 355
Number of High
Experience Staff
Human Resource
Utilization
Immediate-Internal 155
Number of Medium
Experience Staff
Human Resource
Utilization
Immediate 100
Number of Novice staff Human Resource
Utilization
Immediate-Internal 100

209
Ratio of Experience Staff
to Novice Staff
Human Resource
Utilization
Immediate-Internal 0.71 / 71 %
Timing Timing Immediate Morning
Season Season Immediate Winter-Christmas
Holiday
Is Profit Maximization Organization Strategy Internal No
Is Cost Cutting Organization Strategy Internal No
Is Quality Focused Organization Strategy Internal Yes
Check-in Counter failure Risks Internal None
Luggage Loader failure Luggage Loader failure Internal None
Maximum Luggage and
weight
Industry Regulations External 1 piece on board-20 kg
Strike Force Major Environmental No
Table 31, Context Case 1
Given the contextual situation described above in table 3, the business process’ optimal flow suggested by the
system is as follows:
Run 1 (Economy Passenger with valid documents and luggage within normal limit wishing to log in):
The steps sequence and cost are shown in table 32:
Step Id Step Name Man Power
Cost/$
Material
Cost/$
Total Financial
Cost/$
Total
Execution/hour
1 Start 0 0 0 0.16
2 Wait for Normal Check-
in
0 0 0 0.42
3 Present Documents at
Business Counter
(0.13
time*10$
labor
cost)=1.3
(3 resources
number *5$
average cost
of different
resources)
=15
16.5 0.13
9 Register Luggage at
Normal Luggage
Loaders
(0.17 time *
$15)=2.55
2 resources*
5 average
cost =10
12.55 0.17
10 Issue Boarding Pass
(normal )
(0.1 time *
10)= 1
1 resource *5
average
cost=5
6 0.1

210
Table 32, Run 1 Case 1 Outcome
The main recommendations in this case were to open business counters for economy passengers’ and to let the
system automatically choose the seat for the passenger.
The total financial cost of business process with context-awareness= $ 35.05
The total financial cost of business process without context-awareness (calculated as the cost default flow of steps) =
$ 42.05
The financial cost reduction =( (42.05-35.05)/42.05)*100= 16.6%
The total execution time of the business process with context-awareness=0.98 hour
The total execution time of the business process without context-awareness (calculated as the time of the default
flow of steps) =1.2 hour
The execution time reduction =( (1.2-0.98)/1.2)*100= 18.3%
Run 2(Business Passenger with valid documents and luggage within normal limit wishing to check-in):
The steps sequence and cost are shown in table 33:
Step Id Step Name Man Power
Cost/$
Material
Cost/$
Total Financial
Cost/$
Total
Execution/hour
1 Start 0 0 0 0.16
5 Check-in at Kiosk 0 2 resources
*6$=12
12 0.1
7 Automatic Scan of
Documents
0 1 resource * 7 7 0.08
9 Register Luggage at
Normal Loaders
(0.17 time *
$15)=2.55
2 resources*
5 =10
12.55 0.17
10’ Issue Boarding Pass
Kiosk
0 1 resource *
*5 average
cost=5
5 0.08
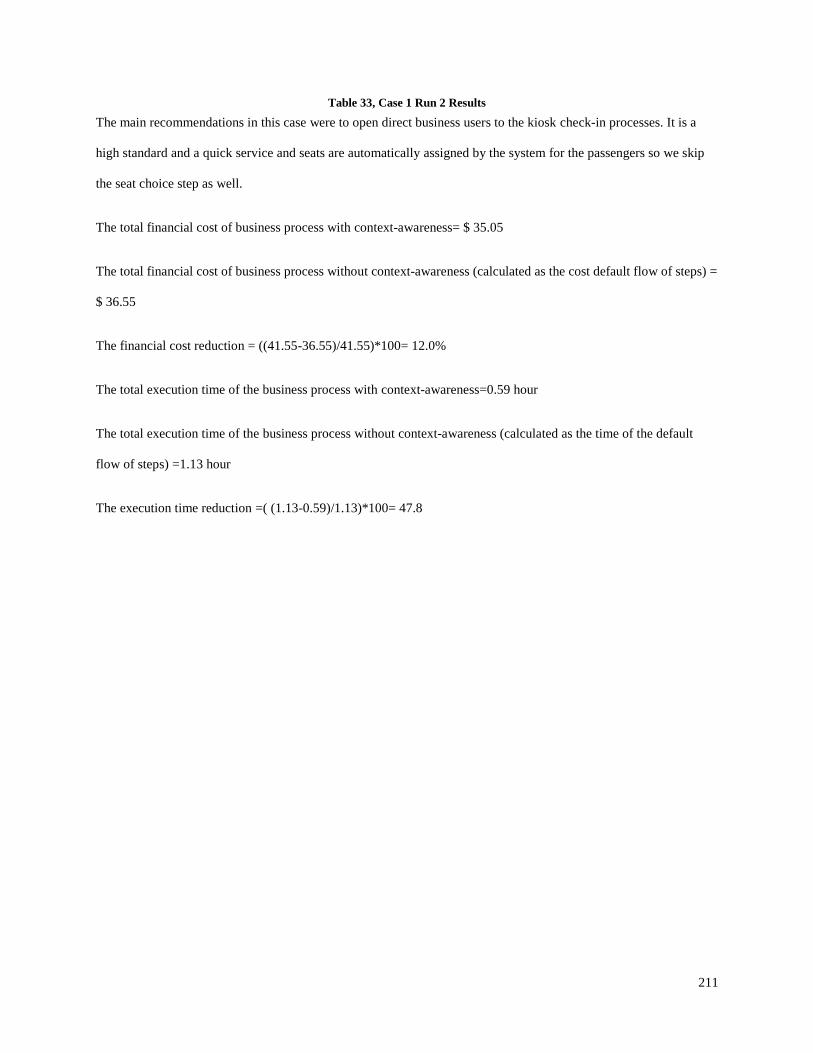
211
Table 33, Case 1 Run 2 Results
The main recommendations in this case were to open direct business users to the kiosk check-in processes. It is a
high standard and a quick service and seats are automatically assigned by the system for the passengers so we skip
the seat choice step as well.
The total financial cost of business process with context-awareness= $ 35.05
The total financial cost of business process without context-awareness (calculated as the cost default flow of steps) =
$ 36.55
The financial cost reduction = ((41.55-36.55)/41.55)*100= 12.0%
The total execution time of the business process with context-awareness=0.59 hour
The total execution time of the business process without context-awareness (calculated as the time of the default
flow of steps) =1.13 hour
The execution time reduction =( (1.13-0.59)/1.13)*100= 47.8

212
Contextual Case Two
Table 34 describes the second contextual situation that was tested on the check-in business process. This second
case represents a high season while all other conditions are normal yet the priority strategy is cost cutting and profit
maximization.
Context Element Context Aspect Context Layer Context Value
Economy Check-in
Counters
Material Utilization Immediate 300
Business Check-in
Counters
Material Utilization Immediate 55
Kiosk Check Counters Material Utilization Immediate 55
Web Check-in Luggage
Counters
Material Utilization Immediate 55
Boarding Pass Printing
Machines
Material Utilization Immediate 355
Luggage Loaders Material Utilization Immediate 55
Total Number of Staff Human Resource
Utilization
Immediate 355
Number of High
Experience Staff
Human Resource
Utilization
Immediate-Internal 155
Number of Medium
Experience Staff
Human Resource
Utilization
Immediate 100
Number of Novice staff Human Resource
Utilization
Immediate-Internal 100
Ratio of Experience Staff
to Novice Staff
Human Resource
Utilization
Immediate-Internal 0.71 / 71 %
Timing Timing Immediate Morning
Season Season Immediate Winter-Christmas

213
Holiday
Organization Strategy Organization Strategy Internal Yes
Organization Strategy Organization Strategy Internal Yes
Organization Strategy Organization Strategy Internal No
Check-in Counter failure Risks Internal None
Luggage Loader failure Risks Internal None
Maximum Luggage and
weight
Industry Regulations External 1 piece on board-20 kg
Strike Force Major Environmental No
Table 34, Case Two Contextual Situation
Run 1 (Economy Passenger with valid documents and luggage within normal limit wishing to check-in):
The steps sequence and cost are shown in table 35:
Step Id Step Name Man Power
Cost/$
Material
Cost/$
Total Financial
Cost/$
Total
Execution/hour
1 Start 0 0 0 0.16
10’ Web Check-in At
Available Laptops at
Airport & print boarding
pass
0 1 resource * 7 7 0.09
12 Drop Luggage at
Separate Web Check-in
Luggage Loaders
0 2 resources*
5 average
cost =10
10 0.11
Table 35, Run 1 Case 2 Results
The main recommendation was to redirect the passengers to the web-check-in as it is the cheapest kind of check- in.
The total financial cost of the business process with context-awareness= $ 17 (cost of process running) + $17 per
process per time for availing extra laptops and their depreciation

214
The total financial cost of the business process without context-awareness (calculated as the cost default flow of
steps) = $ 42.05
The financial cost reduction = ( (42.05-34)/42.05)*100=30%
The total execution time of the business process with context-awareness=0.36 hour
The total execution time of the business process without context-awareness (calculated as the time taken by the
default flow of steps) =1.2 hour
The total execution time variance= (1.2-0.36/1.2)*100= 70%
Run 2(Kiosk Passenger with valid documents and luggage within normal limit wishing to check-in):
The steps sequence and cost are shown in table 36:
Step Id Step Name Man Power
Cost/$
Material
Cost/$
Total
Financial
Cost/$
Total
Execution/hour
1 Start 0 0 0 0.16
10’ Web Check-in At
Available Laptops at
Airport & print
boarding pass
0 1 resource *
7
7 0.09
12 Drop Luggage at
Separate Web Check-in
Luggage Loaders
0 2 resources*
5 average
cost =10
10 0.11
Table 36, Run 2 Case 2 Results
The main recommendation was to redirect the passenger to web check-in as it is the cheapest kind of check-in.
The total financial cost of the business process with context-awareness=$ 17 (cost of process running) + $17 per
process per time for availing extra laptops and their depreciation

215
The total financial cost of business process without context-awareness (calculated as the cost default flow of steps) =
$ 41.55
The financial cost reduction = ( (41.55-34)/41.55)*100=18.2%
The total execution time of the business process with context-awareness=0.36 hour
The total execution time of the business process without context-awareness (calculated as the time taken by the
default flow of steps) =0.69 hour
The total execution time variance= (0.69-0.36/0.69)*100= 47.8%
Contextual Case Three
Table 37 describes the third contextual situation that was tested on the check-in business process. The third case
represents a high season, deficiency in overall staff number and experienced staff and the strategy is cost cutting and
profit maximization.
Context Element Context Aspect Context Layer Context Value
Economy Check-in
Counters
Material Utilization Immediate 300
Business Check-in
Counters
Material Utilization Immediate 55
Kiosk Check Counters Material Utilization Immediate 55
Web Check-in Luggage
Counters
Material Utilization Immediate 55
Boarding Pass Printing
Machines
Material Utilization Immediate 355
Luggage Loaders Material Utilization Immediate 55
Total Number of Staff Human Resource
Utilization
Immediate 150

216
Number of High
Experience Staff
Human Resource
Utilization
Immediate-Internal 20
Number of Medium
Experience Staff
Human Resource
Utilization
Immediate 30
Number of Novice staff Human Resource
Utilization
Immediate-Internal 100
Ratio of Experience Staff
to Novice Staff
Human Resource
Utilization
Immediate-Internal 0.33- 33 %
Timing Timing Immediate Morning
Season Season Immediate Winter-Christmas
Holiday
Is Profit Maximization Organization Strategy Internal Yes
Is Cost Cutting Organization Strategy Internal Yes
Is Quality Focused Organization Strategy Internal No
Check-in Counter failure Risks Internal None
Luggage Loader failure Risks Internal None
Maximum Luggage and
weight
Industry Regulations External 1 piece on board-20 kg
Strike Force Major Environmental No
Table 37, Contextual Situation 3
Run 1 (Economy Passenger with valid documents and luggage within normal limit wishing to check-in):
The steps sequence and cost are shown in table 38:

217
Table 38, Run 1 Case 3 Results
Step Id Step Name Man Power
Cost/$
Material
Cost/$
Total
Financial
Cost/$
Total
Execution/hour
1 Start 0 0 0 0.16
10’ Web Check-in At
Available Laptops at
Airport & print
boarding pass
0 1 resource *
7
7 0.09
12 Drop Luggage at
Separate Web Check-in
Luggage Loaders
0 2 resources*
5 average
cost =10
10 0.11
The main recommendation was to redirect the passenger to the web check-in as it is the cheapest kind of check-in
and doesn’t need any staff interaction.
The total financial cost of the business process with context-awareness= $17 (cost of process running) + $17 per
process per time for availing extra laptops and their depreciation
The total financial cost of business process without context-awareness (calculated as the cost default flow of steps) =
$42.05
The financial cost reduction = ( (42.05-34)/42.05)*100=30%
The total execution time of the business process with context-awareness=0.36 hour
The total execution time of the business process without context-awareness (calculated as the time taken by the
default flow of steps) =1.2 hour
The total execution time variance= (1.2-0.36/1.2)*100= 70%

218
Contextual Case Four
Table 39 describes the fourth contextual situation that was tested on the check- in business process. The fourth case
represents a normal season, deficiency in overall staff number and the economy check -in counters and web check-
in counters, the selected strategy is the quality focus strategy.
Context Element Context Aspect Context Layer Context Value
Economy Check-in
Counters
Material Utilization Immediate 150
Business Check-in
Counters
Material Utilization Immediate 55
Kiosk Check Counters Material Utilization Immediate 55
Web Check-in Luggage
Counters
Material Utilization Immediate 30
Boarding Pass Printing
Machines
Material Utilization Immediate 355
Luggage Loaders Material Utilization Immediate 55
Total Number of Staff Human Resource
Utilization
Immediate 150
Number of High
Experience Staff
Human Resource
Utilization
Immediate-Internal 50
Number of Medium
Experience Staff
Human Resource
Utilization
Immediate 50
Number of Novice staff Human Resource
Utilization
Immediate-Internal 50
Ratio of Experience Staff
to Novice Staff
Human Resource
Utilization
Immediate-Internal 66 %
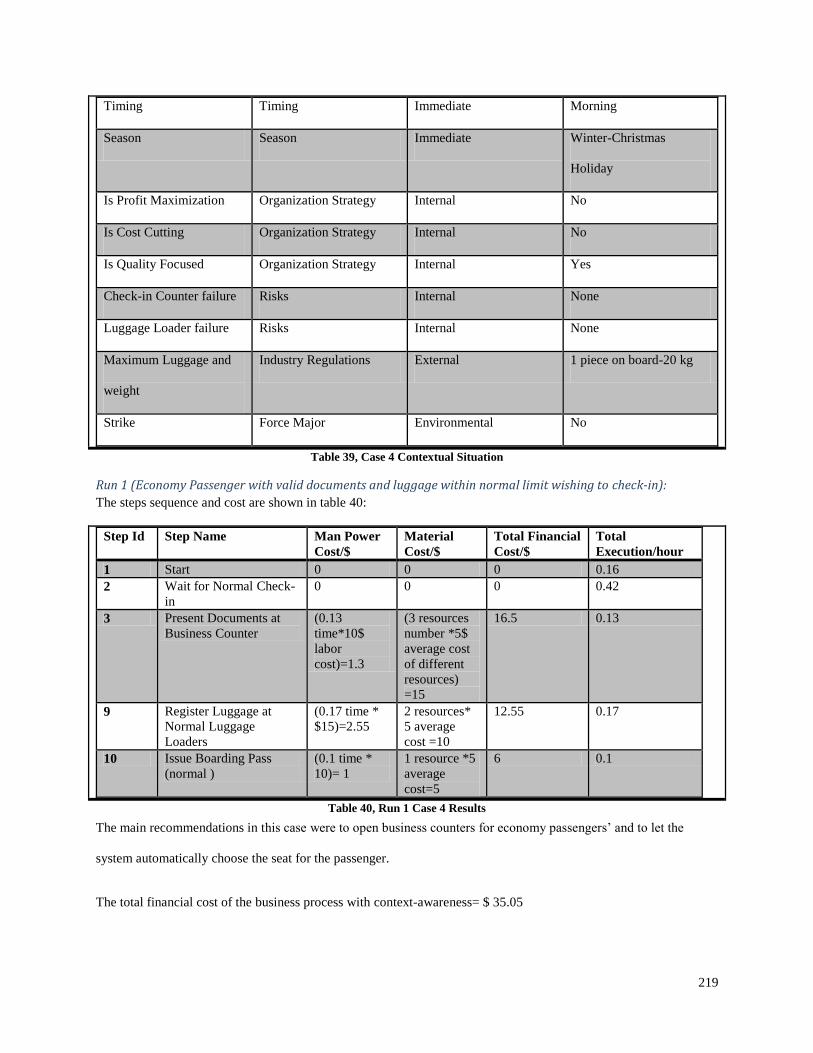
219
Timing Timing Immediate Morning
Season Season Immediate Winter-Christmas
Holiday
Is Profit Maximization Organization Strategy Internal No
Is Cost Cutting Organization Strategy Internal No
Is Quality Focused Organization Strategy Internal Yes
Check-in Counter failure Risks Internal None
Luggage Loader failure Risks Internal None
Maximum Luggage and
weight
Industry Regulations External 1 piece on board-20 kg
Strike Force Major Environmental No
Table 39, Case 4 Contextual Situation
Run 1 (Economy Passenger with valid documents and luggage within normal limit wishing to check-in):
The steps sequence and cost are shown in table 40:
Step Id Step Name Man Power
Cost/$
Material
Cost/$
Total Financial
Cost/$
Total
Execution/hour
1 Start 0 0 0 0.16
2 Wait for Normal Check-
in
0 0 0 0.42
3 Present Documents at
Business Counter
(0.13
time*10$
labor
cost)=1.3
(3 resources
number *5$
average cost
of different
resources)
=15
16.5 0.13
9 Register Luggage at
Normal Luggage
Loaders
(0.17 time *
$15)=2.55
2 resources*
5 average
cost =10
12.55 0.17
10 Issue Boarding Pass
(normal )
(0.1 time *
10)= 1
1 resource *5
average
cost=5
6 0.1
Table 40, Run 1 Case 4 Results
The main recommendations in this case were to open business counters for economy passengers’ and to let the
system automatically choose the seat for the passenger.
The total financial cost of the business process with context-awareness= $ 35.05

220
The total financial cost of the business process without context-awareness (calculated as the cost default flow of
steps) = $ 42.05
The financial cost reduction =( (42.05-35.05)/42.05)*100= 16.6%
The total execution time of the business process with context-awareness=0.98 hour
The total execution time of the business process without context-awareness (calculated as the time taken by the
default flow of steps) =1.2 hour
The execution time reduction =( (1.2-0.98)/1.2)*100= 18.3%
Contextual Case Five
Table 41 describes the fifth contextual situation that was tested on the check-in business process. The fifth case
represents a high season, deficiency experience staff and the economy check- in counters and the business check- in
counters and web check-in counters and the selected strategy is the cost cutting strategy.
Context Element Context Aspect Context Layer Context Value
Economy Check-in
Counters
Material Utilization Immediate 150
Business Check-in
Counters
Material Utilization Immediate 30
Kiosk Check Counters Material Utilization Immediate 55
Web Check-in Luggage
Counters
Material Utilization Immediate 30
Boarding Pass Printing
Machines
Material Utilization Immediate 355
Luggage Loaders Material Utilization Immediate 55
Total Number of Staff Human Resource
Utilization
Immediate 200

221
Number of High
Experience Staff
Human Resource
Utilization
Immediate-Internal 50
Number of Medium
Experience Staff
Human Resource
Utilization
Immediate 0
Number of Novice staff Human Resource
Utilization
Immediate-Internal 150
Ratio of Experience Staff
to Novice Staff
Human Resource
Utilization
Immediate-Internal 33 %
Timing Timing Immediate Morning
Season Season Immediate Winter-Christmas
Holiday
Is Profit Maximization Organization Strategy Internal Yes
Is Cost Cutting Organization Strategy Internal Yes
Is Quality Focused Organization Strategy Internal No
Check-in Counter failure Risks Internal None
Luggage Loader failure Risks Internal None
Maximum Luggage and
weight
Industry Regulations External 1 piece on board-20 kg
Strike Force Major Environmental No
Table 41, Contextual Situation Case 5

222
Run 1(Business Passenger with valid documents and luggage within normal limit wishing to check-in):
The steps sequence and cost are shown in table 42:
Step Id Step Name Man Power
Cost/$
Material
Cost/$
Total Financial
Cost/$
Total
Execution/hour
1 Start 0 0 0 0.16
5 Check-in at Kiosk 0 2 resources
*6$=12
12 0.1
7 Automatic Scan of
Documents
0 1 resource * 7 7 0.08
9 Register Luggage at
Normal Luggage
Loaders
(0.17 time *
$15)=2.55
2 resources*
5 average
cost =10
12.55 0.17
10’ Issue Boarding Pass
Kiosk
0 1 resource *
*5 average
cost=5
5 0.08
Table 42, Run 1 Case 5 Results
The main recommendation in this case is to direct business users to the kiosk check-in process. It is a high standard
and a quick service and seats assigns automatically for the passengers so we skip the seat choice step as well.
The total financial cost of the business process with context-awareness= $ 35.05
The total financial cost of the business process without context-awareness (calculated as the cost default flow of
steps) = $36.55
The financial cost reduction = ((41.55-36.55)/41.55)*100= 12.0%
The total execution time of the business process with context-awareness=0.59 hour
The total execution time of the business process without context-awareness (calculated as the time taken by the
default flow of steps) =1.13 hour
The execution time reduction =( (1.13-0.59)/1.13)*100= 47.8%

223
Run 2(Economy Passenger with valid documents and luggage within normal limit wishing to check-in):
The steps sequence and cost are shown in table 43:
Step Id Step Name Man Power
Cost/$
Material
Cost/$
Total Financial
Cost/$
Total
Execution/hour
1 Start 0 0 0 0.16
5 Check-in at Kiosk 0 2 resources
*6$=12
12 0.1
7 Automatic Scan of
Documents
0 1 resource * 7 7 0.08
9 Register Luggage at
Normal Luggage
Loaders
(0.17 time *
$15)=2.55
2 resources*
5 average
cost =10
12.55 0.17
10’ Issue Boarding Pass
Kiosk
0 1 resource *
*5 average
cost=5
5 0.08
Table 43, Case 5 Run 2 Results
The main recommendations in this case are to redirect to kiosk log in as well as automatically assigning seats by the
system for the passengers so we skip the seat choice step as well.
The total financial cost of the business process with context-awareness=$ 35.05
The total financial cost of the business process without context-awareness (calculated as the cost default flow of
steps) = $36.55
The financial cost reduction = ((42.05-36.55)/ 42.05)*100= 13 %
The total execution time of the business process with context-awareness=0.59 hour
The total execution time of the business process without context-awareness (calculated as the time of the default
flow of steps) =1.2 hour
The execution time reduction =( (1.2-0.59)/1.2)*100= 50.8%
Run 3(Web Check-in Passenger with valid documents and luggage within normal limit wishing to check- in):
The steps sequence and cost are shown in table 44:
Step Id Step Name Man Power
Cost/$
Material
Cost/$
Total Financial
Cost/$
Total
Execution/hour
1 Start 0 0 0 0.16
9 Register Luggage at
Luggage Loaders of
Kiosks
(0.17 time *
$15)=2.55
2 resources*
5 average
cost =10
12.55 0.17
Table 44, Run 3 Case 5 Results

224
The main recommendation is to use the kiosk luggage loaders instead of the web check -in luggage loaders counters
to load the luggage. There are no more steps as the user had already done all the steps online 24 hours before hand at
the company website.
The total financial cost of the business process with context-awareness= $12.55
The total financial cost of business process without context-awareness (calculated as the cost of the default flow of
steps) = $ 10
The financial cost decrease = ((-2/ 42.05)*10= -20 % (Here the cost has increased but we can’t help it as there isn’t
enough web check- in counters)
The total execution time of the business process with context-awareness=0.33 hour
The total execution time of the business process without context-awareness (calculated as the time taken by the
default flow of steps) =0.2 + Extra Weight time due to lack of counter 0.5 hour
The execution time reduction = ( (0.7-0.33)/0.7)*100= 53%
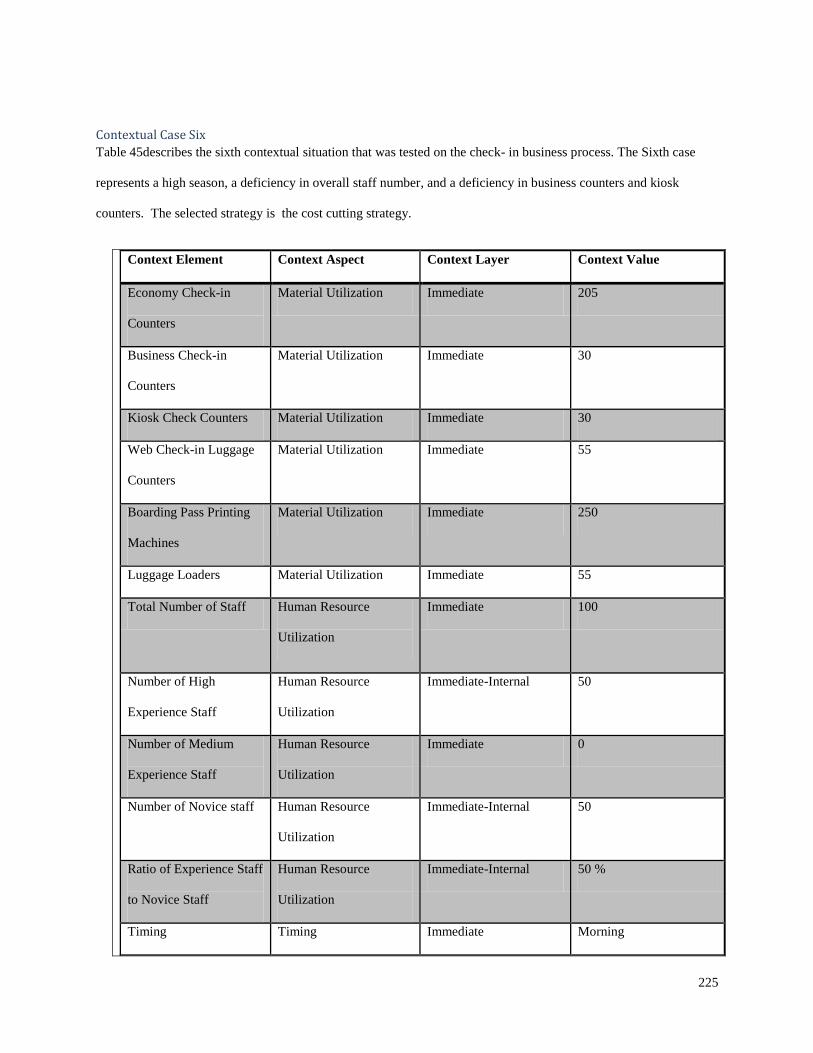
225
Contextual Case Six
Table 45describes the sixth contextual situation that was tested on the check- in business process. The Sixth case
represents a high season, a deficiency in overall staff number, and a deficiency in business counters and kiosk
counters. The selected strategy is the cost cutting strategy.
Context Element Context Aspect Context Layer Context Value
Economy Check-in
Counters
Material Utilization Immediate 205
Business Check-in
Counters
Material Utilization Immediate 30
Kiosk Check Counters Material Utilization Immediate 30
Web Check-in Luggage
Counters
Material Utilization Immediate 55
Boarding Pass Printing
Machines
Material Utilization Immediate 250
Luggage Loaders Material Utilization Immediate 55
Total Number of Staff Human Resource
Utilization
Immediate 100
Number of High
Experience Staff
Human Resource
Utilization
Immediate-Internal 50
Number of Medium
Experience Staff
Human Resource
Utilization
Immediate 0
Number of Novice staff Human Resource
Utilization
Immediate-Internal 50
Ratio of Experience Staff
to Novice Staff
Human Resource
Utilization
Immediate-Internal 50 %
Timing Timing Immediate Morning

226
Season Season Immediate Summer- Holiday
Is Profit Maximization Organization Strategy Internal Yes
Is Cost Cutting Organization Strategy Internal Yes
Is Quality Focused Organization Strategy Internal No
Check-in Counter failure Risks Internal None
Luggage Loader failure Risks Internal None
Maximum Luggage and
weight
Industry Regulations External 1 piece on board-20 kg
Strike Force Major Environmental No
Table 45, Contextual Situation 6
Run 1(Kiosk Passenger with valid documents and luggage within normal limit wishing to log in):
The steps sequence and cost are shown in table 46:
Step Id Step Name Man Power
Cost/$
Material
Cost/$
Total Financial
Cost/$
Total
Execution/hour
1 Start 0 0 0 0.16
10’ Web Check-in At
Available Laptops at
Airport & print boarding
pass
0 1 resource * 7 7 0.09
12 Drop Luggage at
Separate Web Check-in
Luggage Loaders
0 2 resources*
5 average
cost =10
10 0.11
Table 46, Run 1 Case 6 Results
The main recommendation was to redirect the passengers to the web check-in as it is the cheapest kind of check-in
and since there is a deficiency in Kiosk counters.
The total financial cost of the business process with context-awareness= $17 (cost of process running) + $17 per
process per time for availing extra laptops and their depreciation
The total financial cost of the business process without context-awareness (calculated as the cost default flow of
steps) = $ 41.55
The financial cost reduction = ( (41.55-34)/41.55)*100=18.2%

227
The total execution time of the business process with context-awareness=0.36 hour
The total execution time of the business process without context-awareness (calculated as the time taken by the
default flow of steps) =0.69 hour
The total execution time variance= (0.69-0.36/0.69)*100= 47.8%
Run 2(Business Passenger with valid documents and luggage within normal limit wishing to log in):
The steps sequence and cost shall be as follows are shown in table 47.
Step Id Step Name Man Power
Cost
Material
Cost
Total Financial
Cost
Total Execution
1 Start 0 0 0 0.16
10’ Web Check-in At
Available Laptops at
Airport & print boarding
pass
0 1 resource * 7 7 0.09
12 Drop Luggage at
Separate Web Check-in
Luggage Loaders
0 2 resources*
5 average
cost =10
10 0.11
Table 47, Run 2 Case 6 Results
The main recommendations in this case were to direct the passengers to web check -in.
The total financial cost of the business process with context-awareness= $17 (cost of process running) + $17 per
process per time for availing extra laptops and their depreciation
The total financial cost of the business process without context-awareness (calculated as the cost default flow of
steps) = $ 36.55
The financial cost reduction = ((36.55-34)/36.55)*100=7%
The total execution time of the business process with context-awareness=0.36 hour
The total execution time of the business process without context-awareness (calculated as the time of the default
flow of steps) =1.13 hour
The execution time reduction = ( (1.13-0.36)/1.13)*100= 68.14%

228
Contextual Case Seven
Table 48 describes the seventh contextual situation that was tested on the check -in business process. The seventh
case represents a high season and deficiency in economy counters. The strategy selected is the cost cutting strategy
and there is a risk of a strike of employees so all employees who are working are novice.
Context Element Context Aspect Context Layer Context Value
Economy Check-in
Counters
Material Utilization Immediate 250
Business Check-in
Counters
Material Utilization Immediate 55
Kiosk Check Counters Material Utilization Immediate 55
Web Check-in Luggage
Counters
Material Utilization Immediate 55
Luggage Loaders Material Utilization Immediate 55
Boarding Pass Printing
Machines
Material Utilization Immediate 305
Total Number of Staff Human Resource
Utilization
Immediate 300
Number of High
Experience Staff
Human Resource
Utilization
Immediate-Internal 0
Number of Medium
Experience Staff
Human Resource
Utilization
Immediate 0
Number of Novice staff Human Resource
Utilization
Immediate-Internal 300
Ratio of Experience Staff
to Novice Staff
Human Resource
Utilization
Immediate-Internal 0
Timing Timing Immediate Morning

229
Season Season Immediate Summer- Holiday
Is Profit Maximization Organization Strategy Internal Yes
Is Cost Cutting Organization Strategy Internal Yes
Is Quality Focused Organization Strategy Internal No
Check-in Counter failure Risks Internal None
Luggage Loader failure Risks Internal None
Maximum Luggage and
weight
Industry Regulations External 1 piece on board-20 kg
Strike Force Major Environmental Yes
Table 48, Contextual Case 7
Run 1(Economy Passenger with valid documents and luggage within normal limit wishing to check-in):
The steps sequence and cost are shown in table 49.
Step Id Step Name Man Power
Cost/$
Material
Cost/$
Total Financial
Cost/$
Total
Execution/hour
1 Start 0 0 0 0.16
5 Check-in at Kiosk 0 2 resources
*6$=12
12 0.1
7 Automatic Scan of
Documents
0 1 resource * 7 7 0.08
9 Register Luggage at
Normal Luggage
Loaders
(0.17 time *
$15)=2.55
2 resources*
5 average
cost =10
12.55 0.17
10’ Issue Boarding Pass
Kiosk
0 1 resource *
*5 average
cost=5
5 0.08
Table 49, Run 1 Case 7 Results
The main recommendations in this case are to redirect the passengers to kiosk check-in as well as automatically
assign seats by the system for the passengers so we skip the seat choice step as well.
The total financial cost of the business process with context-awareness= $ 35.05
The total financial cost of business process without context-awareness (calculated as the cost of the default flow of
steps) =$ 36.55
The financial cost reduction = ((42.05-36.55)/ 42.05)*100= 13 %
The total execution time of the business process with context-awareness=0.59 hour

230
The total execution time of the business process without context-awareness (calculated as the time taken by the
default flow of steps) =1.2 hour
The execution time reduction =( (1.2-0.59)/1.2)*100= 50.8%
Contextual Case Eight
Table 50 describes the eighth contextual situation that was tested on the check-in business process. The eighth case
represents a high season and a deficiency in the economy, business and kiosk counters. The strategy is quality
focus.
Context Element Context Aspect Context Layer Context Value
Economy Check-in
Counters
Material Utilization Immediate 100
Business Check-in
Counters
Material Utilization Immediate 30
Kiosk Check Counters Material Utilization Immediate 30
Web Check-in Luggage
Counters
Material Utilization Immediate 80
Boarding Pass Printing
Machines
Material Utilization Immediate 200
Luggage Loaders Material Utilization Immediate 55
Total Number of Staff Human Resource
Utilization
Immediate 150
Number of High
Experience Staff
Human Resource
Utilization
Immediate-Internal 70
Number of Medium
Experience Staff
Human Resource
Utilization
Immediate 30
Number of Novice staff Human Resource
Utilization
Immediate-Internal 50
Ratio of Experience Staff
to Novice Staff
Human Resource
Utilization
Immediate-Internal 66%
Timing Timing Immediate Morning
Season Season Immediate Summer- Holiday
Is Profit Maximization Organization Strategy Internal No
Is Cost Cutting Organization Strategy Internal No
Is Quality Focused Organization Strategy Internal Yes
Check-in Counter failure Risks Internal None
Luggage Loader failure Risks Internal None
Maximum Luggage and
weight
Industry Regulations External 1 piece on board-20 kg
Strike Force Major Environmental No
Table 50, Contextual Case 8

231
Run 1 (Economy Passenger with valid documents and luggage within normal limit wishing to check-in):
The steps sequence and cost are shown in table 51.
Step Id Step Name Man Power
Cost
Material
Cost
Total
Financial Cost
Total Execution
1 Start 0 0 0 0.16
10’ Web Check-in At
Available Laptops at
Airport & print boarding
pass
0 1 resource *
7
7 0.09
12 Drop Luggage at
Separate Web Check-in
Luggage Loaders
0 2 resources*
5 average
cost =10
10 0.11
Table 51, Run 1 Case 8 Results
The main recommendation is to redirect the passengers to web check-in as it is the cheapest kind of check-in and it
could be availed as there is a deficiency in all other types of counters.
The total financial cost of the business process with context-awareness= $17 (cost of process running) + $17 per
process per time for availing extra laptops and their depreciation
The total financial cost of the business process without context-awareness (calculated as the cost of the default flow
of steps) = $ 42.05
The financial cost reduction = ( (42.05-34)/42.05)*100=30%
The total execution time of the business process with context-awareness=0.36 hour
The total execution time of the business process without context-awareness (calculated as the time taken by the
default flow of steps) =1.2 hour
The total execution time variance= (1.2-0.36/1.2)*100= 70%

232
Run 2(Business Passenger with valid documents and luggage within normal limit wishing to check-in):
The steps sequence and cost are shown in table 52.
Step Id Step Name Man Power
Cost/$
Material
Cost/$
Total
Financial
Cost/$
Total
Execution/$
1 Start 0 0 0 0.16
10’ Web Check-in At
Available Laptops at
Airport & print boarding
pass
0 1 resource *
7
7 0.09
12 Drop Luggage at
Separate Web Check-in
Luggage Loaders
0 2 resources*
5 average
cost =10
10 0.11
Table 52, Run 2 Case 8
The main recommendation in this case is to direct the passengers to web check-in.
The total financial cost of the business process with context-awareness= $ 17 (cost of process running) + $17 per
process per time for availing extra laptops and their depreciation
The total financial cost of business process without context-awareness (calculated as the cost of the default flow of
steps) = $ 36.55
The financial cost reduction = ((36.55-34)/36.55)*100=7%
The total execution time of the business process with context-awareness=0.36 hour
The total execution time of the business process without context-awareness (calculated as the time taken by the
default flow of steps) =1.13 hour
The execution time reduction = ( (1.13-0.36)/1.13)*100= 68.14%

233
Run 3(Kiosk Passenger with valid documents and luggage within normal limit wishing to check-in):
The steps sequence and cost are shown in table 53:
Step Id Step Name Man Power
Cost/$
Material
Cost/$
Total
Financial
Cost/$
Total
Execution/hour
1 Start 0 0 0 0.16
10’ Web Check-in At
Available Laptops at
Airport & print
boarding pass
0 1 resource *
7
7 0.09
12 Drop Luggage at
Separate Web Check-in
Luggage Loaders
0 2 resources*
5 average
cost =10
10 0.11
Table 53, Run 3 Case 8 Results
The main recommendation was to redirect the passengers to the web check-in as it is the cheapest kind of check-in
and it is the one where we can avail counters now.
The total financial cost of the business process with context-awareness= $ 17 (cost of process running) + $17 per
process per time for availing extra laptops and their depreciation
The total financial cost of business process without context-awareness (calculated as the cost of the default flow of
steps) = $ 41.55
The financial cost reduction = ( (41.55-34)/41.55)*100=18.2%
The total execution time of the business process with context-awareness=0.36 hour
The total execution time of the business process without context-awareness (calculated as the time taken by the
default flow of steps) =0.69 hour
The total execution time variance= (0.69-0.36/0.69)*100= 47.8%

234
Contextual Case Nine
Table 54 describes the ninth contextual situation that was tested on the check-in business process. The ninth case
represents a high season and a deficiency in normal luggage loaders. The strategy is cost cutting focus.
Context Element Context Aspect Context Layer Context Value
Economy Check-in
Counters
Material Utilization Immediate 205
Business Check-in
Counters
Material Utilization Immediate 55
Kiosk Check Counters Material Utilization Immediate 55
Web Check-in Luggage
Counters
Material Utilization Immediate 55
Boarding Pass Printing
Machines
Material Utilization Immediate 200
Luggage Loaders Material Utilization Immediate 55
Luggage Loaders Material Utilization Immediate 30
Total Number of Staff Human Resource
Utilization
Immediate 200
Number of High
Experience Staff
Human Resource
Utilization
Immediate-Internal 70
Number of Medium
Experience Staff
Human Resource
Utilization
Immediate 30
Number of Novice staff Human Resource
Utilization
Immediate-Internal 100
Ratio of Experience Staff
to Novice Staff
Human Resource
Utilization
Immediate-Internal 50%
Timing Timing Immediate Morning
Season Season Immediate Summer- Holiday
Is Profit Maximization Organization Strategy Internal Yes
Is Cost Cutting Organization Strategy Internal Yes
Is Quality Focused Organization Strategy Internal Yes
Check-in Counter failure Risks Internal No
Luggage Loader failure Risks Internal None
Maximum Luggage and
weight
Industry Regulations External 1 piece on board-20 kg
Strike Force Major Environmental No
Table 54, Contextual Case 9
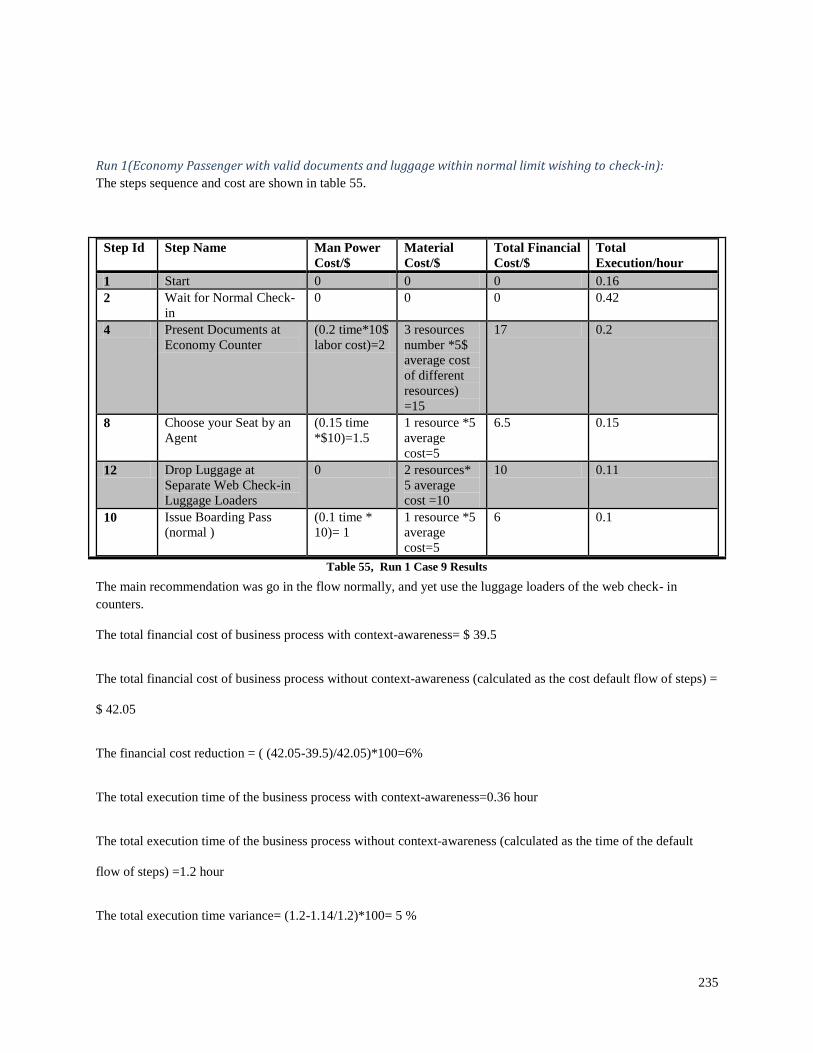
235
Run 1(Economy Passenger with valid documents and luggage within normal limit wishing to check-in):
The steps sequence and cost are shown in table 55.
Step Id Step Name Man Power
Cost/$
Material
Cost/$
Total Financial
Cost/$
Total
Execution/hour
1 Start 0 0 0 0.16
2 Wait for Normal Check-
in
0 0 0 0.42
4 Present Documents at
Economy Counter
(0.2 time*10$
labor cost)=2
3 resources
number *5$
average cost
of different
resources)
=15
17 0.2
8 Choose your Seat by an
Agent
(0.15 time
*$10)=1.5
1 resource *5
average
cost=5
6.5 0.15
12 Drop Luggage at
Separate Web Check-in
Luggage Loaders
0 2 resources*
5 average
cost =10
10 0.11
10 Issue Boarding Pass
(normal )
(0.1 time *
10)= 1
1 resource *5
average
cost=5
6 0.1
Table 55, Run 1 Case 9 Results
The main recommendation was go in the flow normally, and yet use the luggage loaders of the web check- in
counters.
The total financial cost of business process with context-awareness= $ 39.5
The total financial cost of business process without context-awareness (calculated as the cost default flow of steps) =
$ 42.05
The financial cost reduction = ( (42.05-39.5)/42.05)*100=6%
The total execution time of the business process with context-awareness=0.36 hour
The total execution time of the business process without context-awareness (calculated as the time of the default
flow of steps) =1.2 hour
The total execution time variance= (1.2-1.14/1.2)*100= 5 %

236
Here we see the variance is minimal as we just replaced one step with another and all the flow is almost the same for
the sake of lack of availability of luggage loaders. It will be almost the same case and variance for business
passengers’.
Contextual Case Ten
Table 56 describes the tenth contextual situation that was tested on the check-in business process. The tenth case
represents a normal situation where there is no deficiency in any resource and it is not a high season and it will be
used as the benchmark for the default business process path. All the alternative paths taken to cater for certain
contextual situations are compared to this benchmark.
Context Element Context Aspect Context Layer Context Value
Economy Check-in
Counters
Material Utilization Immediate 205
Business Check-in
Counters
Material Utilization Immediate 55
Kiosk Check Counters Material Utilization Immediate 55
Web Check-in Luggage
Counters
Material Utilization Immediate 55
Boarding Pass Printing
Machines
Material Utilization Immediate 200
Luggage Loaders Material Utilization Immediate 55
Luggage Loaders Material Utilization Immediate 30
Total Number of Staff Human Resource
Utilization
Immediate 200
Number of High
Experience Staff
Human Resource
Utilization
Immediate-Internal 70
Number of Medium
Experience Staff
Human Resource
Utilization
Immediate 70
Number of Novice staff Human Resource
Utilization
Immediate-Internal 60
Ratio of Experience Staff
to Novice Staff
Human Resource
Utilization
Immediate-Internal 70%
Timing Timing Immediate Evening
Season Season Immediate Winter-Non Holiday
Is Profit Maximization Organization Strategy Internal Yes
Is Cost Cutting Organization Strategy Internal No
Is Quality Focused Organization Strategy Internal No
Check-in Counter failure Risks Internal Yes
Luggage Loader failure Risks Internal None
Maximum Luggage and
weight
Industry Regulations External 1 piece on board-20 kg
Strike Force Major Environmental No
Table 56, Contextual Situation 10

237
Run 1 (Economy Passenger with valid documents and luggage within normal limit wishing to check-in):
The steps sequence and cost are shown in table 57.
Step Id Step Name Man Power
Cost/$
Material
Cost/$
Total Financial
Cost/$
Total
Execution/hour
1 Start 0 0 0 0.16
2 Wait for Normal Check-
in
0 0 0 0.42
4 Present Documents at
Economy Counter
(0.2 time*10$
labor cost)=2
3 resources
number *5$
average cost
of different
resources)
=15
17 0.2
8 Choose your Seat by an
Agent
(0.15 time
*$10)=1.5
1 resource *5
average
cost=5
6.5 0.15
9 Register Luggage at
Normal Luggage
Loaders
(0.17 time *
$15)=2.55
2 resources*
5 average
cost =10
12.55 0.17
10 Issue Boarding Pass
(normal )
(0.1 time *
10)= 1
1 resource *5
average
cost=5
6 0.1
Table 57, Run 1 Case 10 Results
There are no recommendations in this case based on contextual variance as this is the bench mark case where all
conditions are normal and there is no need to change the path of the business process.
The total financial cost of the business process (calculated as the cost of the default flow of steps) =$ 42.05
The total execution time of the business process (calculated as the time taken by the default flow of steps) =1.2 hour

238
Run 2(Business Passenger with valid documents and luggage within normal limit wishing to check-in):
The steps sequence and cost are shown in table 58.
Step Id Step Name Man Power
Cost/$
Material
Cost/$
Total Financial
Cost/$
Total
Execution/hour
1 Start 0 0 0 0.16
2 Wait for Normal Check-
in
0 0 0 0.42
3 Present Documents at
Business Counter
(0.13
time*10$
labor
cost)=1.3
(3 resources
number *5$
average cost
of different
resources)
=15
16.5 0.13
8 Choose your Seat by an
Agent
(0.15 time
*$10)=1.5
1 resource *5
average
cost=5
6.5 0.15
9 Register Luggage at
Normal Luggage
Loaders
(0.17 time *
$15)=2.55
2 resources*
5 average
cost =10
12.55 0.17
10 Issue Boarding Pass
(normal )
(0.1 time *
10)= 1
1 resource *5
average
cost=5
6 0.1
Table 58, Run 2 Case 10 Results
There are no recommendations in this case based on contextual variance as this is the bench mark case where all
conditions are normal and there is no need to change the path of the business process.
The total financial cost of the business process without context-awareness (calculated as the cost of the default flow
of steps) = $ 36.55
The total execution time of the business process (calculated as the time taken by the default flow of steps) =1.13
hour

239
Run 3(Web Check-In Passenger with valid documents and luggage within normal limit wishing to log in):
The steps sequence and cost are shown in table 59.
Step Id Step Name Man Power
Cost/$
Material
Cost/$
Total Financial
Cost/$
Total
Execution/hour
1 Start 0 0 0 0.16
10’ Web Check-in At
Available Laptops at
Airport & print boarding
pass
0 1 resource * 7 7 0.09
12 Drop Luggage at
Separate Web Check-in
Luggage Loaders
0 2 resources*
5 average
cost =10
10 0.11
Table 59, Run 3 Case 10 Results
There are no recommendations in this case based on contextual variance as this is the bench mark case where all
conditions are normal and there is no need to change the path of the business process.
The total financial cost of the business process without context-awareness (calculated as the cost default flow of
steps) = $ 17
The total execution time (without context-awareness) =0.36 hour

240
Run 4(Kiosk Check-in Passenger with valid documents and luggage within normal limit wishing to log in):
The steps sequence and cost are shown in table 60.
Step Id Step Name Man Power
Cost/$
Material
Cost/$
Total Financial
Cost/$
Total
Execution/hour
1 Start 0 0 0 0.16
5 Check-in at Kiosk 0 2 resources
*6$=12
12 0.1
7 Automatic Scan of
Documents
0 1 resource * 7 7 0.08
11 Choose your Seat
Automatically at Kiosk
by Yourself
0 1 resource * 5
average
cost=5
5 0.1
9 Register Luggage at
Normal Luggage
Loaders
(0.17 time *
$15)=2.55
2 resources*
5 average
cost =10
12.55 0.17
10’ Issue Boarding Pass
Kiosk
0 1 resource *
*5 average
cost=5
5 0.08
Table 60 , Run 4 Case 10 Results
There are no recommendations in this case based on contextual variance as this is the bench mark case where all
conditions are normal and there is no need to change the path of the business process.
The total financial cost of the business process without context-awareness (calculated as the cost of the default flow
of steps) =$ 36.55
The total execution time of the business process (calculated as the time taken by the default flow of steps) =0.6 9
hour

241
Appendix VI The table in this appendix represents the full definition of the Telecom Pay Bill Process with all its steps, their pre-
conditions, their post-conditions, their goals and the transitional recommendation conditions.
Step ID Step Name Goals Pre-
Conditions
Post
Conditions
Recommendations
1 Start Profit- Cut On
Costs
Profit- Reduce
Churn
Face
Competition –
Increase
Customer
Satisfaction
Quality –
Increase
Customer
Satisfaction
Competition
Have Postpaid
Line
Ready to Pay
for Person,
Ready to Pay
at Self Service
Device
If Ready to Pay to Person &
[Counters for Payment is
small (1 to6)
Or
Total staff is small (1 to6)
And
Experiences staff ratio to
novice staff ratio (<50 %)
Or
The Timing is Evening Time
Or
A Portion of staff is on
Strike
Or
Strategy is Profit
maximization and cost
cutting then
Or
Issue Turn Machines is
down
&
Self Service Device >3
Go to Step 8 Self Service
Payment
]
Priority=1.5
If Ready to Use Self Service
Device &
[Self Service Device <3
&
Timing = Event
Go to Step 2 Wait for
Normal Counters]
Priority=1.5
Otherwise go for Step 2
Priority =1.6
2 Issue Turn
Number
Profit- Cut On
Costs
Face
Competition–
Increase
Customer
Satisfaction
Chose to pay
to person
Turn Ticket
Issued
If Turn Ticket Issued &
[Counters for Payment is
small (1 to6)
Or
Total staff is small (1 to6)
And
Experiences staff ratio to

242
Quality –
Increase
Customer
Satisfaction
Competition
novice staff ratio (<50 %)
Or
The Timing is Evening Time
Or
A Portion of staff is on
Strike
Or
Strategy is Profit
maximization and cost
cutting then
&
Self Service Device >3
Go to Step 8 Self Service
Payment
]
Priority=1.5
Otherwise go for Step 2’
Priority =1.6
2’ Wait for
your Turn
Profit- Cut On
Costs
Face
Competition–
Increase
Customer
Satisfaction
Quality –
Increase
Customer
Satisfaction
Competition
Have a Ticket Ticket Number
is Displayed
and Counter is
Ready
If Counter is Ready &
[Billing printing machines
are few (1 to6)
Or
Strategy is Cost Cutting
&
Self Service Device >3
Go to Step 8 Check the Bill
at the Device
]
Priority=1.5
Otherwise go for Step 3
Priority =1.6
3 Get a print
out of the
bill
Face
Competition–
Increase
Customer
Satisfaction
Quality –
Increase
Customer
Satisfaction
Competition
At Person
payment
counter
Bill is printed
out
If Not Valid Go to Step 11
(Complaints Department)
If Valid
Go step 4
4 Choose
Payment
Method
Profit- Cut on
Costs
Face
Competition–
Increase
Customer
Satisfaction
Quality –
Increase
Customer
Satisfaction
Competition
Bill is printed
out
Payment
method chosen
(Cash, Credit
Card or
Cheque)
If Cash Payment Chosen go
to Step 10(Receive Payment
Receipt)
If Cheque Payment Chosen
&
[
Total staff is small (1 to6)
And
Experiences staff ratio to
novice staff ratio (<50 %)
Or
The Timing is Evening Time

243
Or
A Portion of staff is on
Strike
Or
Strategy is Profit
maximization and cost
cutting then
Go to Step 6 Enforce Cash
Payment
]
Priority=1.25
If Cheque is chosen and
none of the above conditions
is true go to Step 7
Priority=1.25
If Credit Card Payment
Chosen
&
[
Credit Card Machines are
small <3)
And
The Timing is Evening Time
And
Strategy is Profit
maximization and cost
cutting then
Go to Step 6 Enforce Cash
Payment
]
Priority=1.25
If Credit Card Payment
Chosen
&
[
Credit Card Machines are
small <3)
Go to Step 9 Use Credit
Card Machines of the Self
Service Devices
]
Priority=1.5
If Credit Card is chosen and
none of the above conditions
is true go to Step 5
Priority=1.25
5 Credit Card
Payment
Profit- Cut on
Costs
Face
Competition–
Credit Card
Chosen
Payment is
Done
Go to Step 10 (Terminal step
to receive receipt)
]

244
Increase
Customer
Satisfaction
Quality –
Increase
Customer
Satisfaction
Competition
6 Cash
Payment
Profit- Cut on
Costs
Face
Competition–
Increase
Customer
Satisfaction
Quality –
Increase
Customer
Satisfaction
Competition
Cash Chosen Payment Done
Go to Step 10 (Terminal step
to receive receipt)
]
7 Wait at
Cheque
counter
Profit- Cut on
Costs
Face
Competition–
Increase
Customer
Satisfaction
Quality –
Increase
Customer
Satisfaction
Competition
Cheque
Chosen
Cheque Valid Go to Step 10 (Terminal step
to receive receipt)
]
8 Check Bill at
Self Service
Device
Profit- Cut on
Costs
Face
Competition–
Increase
Customer
Satisfaction
Quality –
Increase
Customer
Satisfaction
Competition
Self Service
Chosen
Bill Valid or
Invalid
If In Valid Bill Go to Step
11 (to Complaints
Department)
If Valid &
[Credit Card Machines are
few(1 to 3) of down go to
Step 6 (enforce Cash
collection ]
Priority 1.2
Otherwise go to step 9
(Enter credit and its info)
9 Enter Credit
Card at Self
Service
Machine &
Pay
Face
Competition–
Increase
Customer
Satisfaction
Quality –
Increase
Bill Valid Credit Card
Payment
Successful or
failure
If Credit Card Payment is
Successful go to terminal
step 10 to print receipt
If Payment is failure redirect
to Step 6 (Cash Collection

245
Table 61, Bill Payment Business Process Recommendations Details
Customer
Satisfaction
Competition
10 Receive
Receipt
Payment
Successful
Process Ended
with Payment
Success
No Recommendations as
this is a terminal step
11 Go to
Complaints
Department
Invalid Bill Process Ended
without
Payment due
to Complaint
No Recommendations as
this is a terminal step

246
References [1] Alexander, I.F. 2004 .A better fit - characterizing the stakeholders. CAiSE Workshops Volume 2. Faculty of
Computer Science and Information Technology, Riga, Latvia, pp.215–223.
[2] Analyti, A., Theodorakis, M., Spyratos, N. and Constantopoulos. 2007 .Contextualization as an independent
abstraction mechanism for conceptual modeling. Journal of Information Systems, Vol. 32, No. 1, pp.24–60.
[3] Anind K., Dey D., and Gregory Abowd .1999. Towards a Better Understanding of Context and Context-
Awareness. Graphics, Visualization and Usability Center and College of Computing, Georgia Institute of
Technology, Atlanta, GA, USA 30332-0280
[4] Antonio Coronato, and Alessandro Testa . 2012. Long-Term Monitoring of Vital Signs for Mobile Patients.
Institute of High Performance Computing and Networking (ICAR).Napoli, Italy
[5] Chavez C., Alessandro G, and Carlos L. 2001. Some insights on the use of AspectJ and HyperJ. Publications of
the Computer Science Department, University of Brazil.
[6] Chen, H., Finin, T. and Joshi, A. 2003. An ontology for context-aware pervasive computing environment. The
Knowledge Engineering Journal, Vol. 18, No. 3, pp.197–207.
[7] Coutaz J., Crowley J., Dobson S., Garlan D. 2005. Context is the key. Communications of the ACM, Vol. 48, No
3, 2005.
[8] Davenport T. 1993. Process Innovation: Reengineering Work through Information Technology. Boston, MA:
Harvard Business School Press.
[9] Dufresne Thomas, and James Martin .2003. Process Modeling for E-Business. INFS 770 Methods for
Information Systems Engineering: Knowledge Management and E-Business.
[10]Dey, A.K.. 2001. Understanding and using context. Journal of Personal and Ubiquitous Computing, Vol. 5, No.
1, pp.4–7.
[11] Dalpiaz F., Ali R., F., and Giorgini P. 2010. A goal-based framework for contextual requirements modeling and
analysis. Journal of Requirements Engineering, Vol. 15, pp. 439–458.
[12] El Safty Aisha, Sherif G. Aly, and Sameh A. 2007. The Context Oriented Architecture: An Augmentation of
Context-awareness and Reactivity into Web Services. Springer Studies in Computational Intelligence: Advances
in Semantic Media Adaptation and Personalization, Vol. 93, pp. 199-219.
[13] Ferdian .2001. A Comparison of Event-driven Process Chains and UML Activity Diagram for Denoting
Business Processes. Project Work submitted by Ferdian Information and Communication Systems Master’s
Program
[14] Franklin, D., Flaschbart, J. All Gadget .1998. No Representation Makes Jack a Dull Environment. Spring
Symposium on Intelligent Environments, Technical Report SS-98-02 pp. 155-160.
[15] France B., Ray I., Georg G., and Ghosh S.2004. An aspect oriented approach to design modeling. IEEE
Proceedings - Software, Special Issue on Early Aspects: Aspect-Oriented Requirements Engineering and
Architecture Design.
[16] Firat, A., Madnick, S. and Manola, F. 2005. Multidimensional ontology views via contexts in the ecoin semantic
interoperability framework. Papers from the 2005 AAAI Workshop, Volume WS-05-01 of Technical Report,
Menlo Park, CA: AAAI Press, pp.1–8.
[17] Georg G., Reddy R., and France R. 2004. Specifying crosscutting requirements concerns. Proceedings of the
International Conference on the UML.
[18] Gregor Kiczales.2001. Discussing Aspects of AOP. Communication of ACM Vol. 44 No 11.
[19] Hafez Dina, Sherif G. Aly, and Sameh A..2011. A Context and Service-Oriented Architecture with Adaptive
Quality of Service Support. The International Journal of Computers and their Applications, Vol 18, no. 1, pp. 37-
51.
[20] Hammer M., and Champy J. 1993. Reengineering the Corporation: A Manifesto for Business Revolution.
Business Horizons Vol .36 Issue : 5 pp.90-91.
[21] Hallerbach, A., Bauer, T., & Reichert, M. 2008. Context-Based Configuration of Process Variants. 3rd Int.
Workshop on Context-Aware Business Process Management (TCoB’08), Barcelona, Spain. pp. 31-40
[22] Hull, R., Neaves, P., and Bedford-Roberts, 1997.Towards Situated Computing. 1st International Symposium on
Wearable Computers pp. 146-153

247
[23] Hirschfeld R. and Stefan Hanen berg. 2006. Open Aspects. Computer Languages, Systems and Structures
Journal.
[24]Huifang Wang, Tao Lu . 2010. Modeling Context Information in Mobile Business Process. IEEE Proceedings
on Software Engineering
[25] Hyung Jun Ahn, Hong Joo Lee, Kyehyun Cho, Sung Joo Park .2004. Utilizing knowledge context in virtual
collaborative work. Graduate School of Management, Korea Advanced Institute of Science and Technology
(KAIST), Cheongryangri, Dongdaemungu, Seoul 130-722, South Korea NeoWiz Corporation, Seoul 135-090,
South Korea Available online.
[26] IBM Researchers. 2000.Overview on Hyper/J. IBM. Last Accessed on the 3rd
of March 2012.
http://www.alphaworks.ibm.com/tech/hyperj
[27] Ioan Salomie, Tudor Cioara, Ionut Anghel, Mihaela Dinsoreanu. 2008. RAP . A Basic Context-awareness
Model. IEEE Proceedings on Software Engineering
[28] Jakob E. Bardram. 2005. Design, Implementation, and Evaluation of the Java Context-awareness Framework
(JCAF). Centre for Pervasive Healthcare Department of Computer Science, University of Aarhus Aabogade 34,
8200 °Arhus N, Denmark.
[29] Jablonski, S., and Bussler, C. 1996. Workflow Management. Modeling Concepts, Architecture and
Implementation. London, UK: International Thomson Computer Press
[30]Keriakos Mariam, Hoda M.Hosny, Sherif G. Aly.2012. Context-aware business process aspect modeler.
Proceedings of the 2nd
Conference on Pervasive and Embedded Computing and Communication Systems
[31]Kostas Vergidis, Ashutosh Tiwari , and Basim Majeed . 2008. Business Process Analysis and Optimization:
Beyond Reengineering. IEEE Proceedings on Software Engineering
[32] Karsten Ploesser, Jan Recker and Michael Rosemann. 2008. Towards a Classification and Lifecycle of Business
Process Change. Business Process Management Group Queensland University of Technology
[33]Kaltz, J.W., Ziegler, J. and Lohmann, S. 2005.Context-aware web engineering: modeling and applications.
Revue d’Intelligence Artificielle, Vol. 19, No. 3, pp.439–458.
[34] Karsten Ploesser, Jan Recker, Michael Rosemann . 2010. Building a methodology for context-aware processes:
Insights from an exploratory case study. Proceedings of the 18th European Conference on Information Systems.
[35]Karsten Ploesser, M. Peleg, P. Soffer, M. Rosemann, and J. Recker. 2009 .Learning from Context to Improve
Business Processes. Proceedings of the18th European Conference on Information Systems pp. 1–7.
[36]La Rosa M., Der Aalst, Dumas M., and Hofstede A. 2009. Questionnaire-based variability modeling for system
configuration. Software and Systems Modeling Journal, Vol. 8, No. 2, pp. 251–274.
[37]La Vara D., Ali R., Dalpiaz F., Sánchez J., and Giorgini P., 2010. Business Processes Contextualisation via
Context Analysis. in Proceedings of the ER 2010, 2010, pp. 1–6.
[38]Martin Ownen and Joe Raj .2003. BPMN and Business Process Management Introduction to the New Business
Process Modeling Standard. Popkin Software , 2003. Last Accessed 1st of May 2012
http://www.omg.org/bpmn/Documents/6AD5D16960.BPMN_and_BPM.pdf
[39] Mikalsen, M. and Kofod-Petersen, A. 2004. Representing and reasoning about context in a mobile
environment. Proceedings of the 1st International Workshop on Modeling and Retrieval of Context, Germany
Vol.114 pp.25–35.
[40]Micosoft Researchers. 2011. Chapter 17 -Cross Cutting Concerns. MSDN Library. Last accessed on the 18th
of
November 2011 http://msdn.microsoft.com/en-us/library/ee658105.aspx
[41]Micosoft Researchers. 2011. Microsoft Enterprise Library. MSDN Library
Last accessed on the 18th
of November 2011. http://msdn.microsoft.com/en-us/library/cc467894.aspx
[42]Mikalsen, M. and Kofod-Petersen, 2005. Advanced Enterprise Middleware. 2nd International Workshop on
Modeling and Retrieval of Context, Germany, Vol.115, pp.25–35.
[43]Matthias Baldauf . 2007. A survey on context-aware systems. International Journal of Ad Hoc and Ubiquitous
Computing, Vol. 2, No. 4.
[44]Machado I.,Rodrigo Bonifacio,Vander Alves, Lucinéia Turnes and Giselle Machado . 2011. Managing
Variability in Business Processes: An Aspect-Oriented Approach. ACM Publications
[45]I. Montero, J. Peña, and A. Ruiz-Cortés .2008. Representing Runtime Variability in Business-Driven
Development Systems. Proceedings of the Seventh International Conference on Composition-Based Software
Systems.IEEE Computer Society Press , pp. 605–608
[46]Nafees Qamar . 2009. Composition Analysis of Multiple Aspects in Aspect-oriented Programs. Software
Engineering Conference.APSEC '09. Asia-Pacific
[47]Nurcan Selmin, and Saidani Oumaima .2009. Context-Awareness for Adequate Business Process Modelling.
IEEE Proceedings on Software Engineering
248
[48]Parkinson, M.J.A. and Baker, N.J.. 2005. IT and enterprise governance. Information Systems Control Journal,
Vol. 3, pp.17–21.
[49]Porter, M.E.1979. How Competitive Forces Shape Strategy. Harvard Business Review, Vol. 57, No. 2, pp.137–
145
[50]Pan Xuwei, Zhu Xiyong, Wang Shixiong .2008. Integrate Context into Knowledge Management. IEEE
Proceedings on Software Engineering.
[51]Quan Z. Sheng and Boualem Benatallah . 2006. ContextUML: A UML-Based Modeling Language for Model-
Driven Development of Context-Aware Web Services.IEEE Proceedings on Software Engineering.
[52]Raduescu, C., Tan, H.M., Jayaganesh, M., Bandara, W., zur Muehlen, M. and Lippe, S.2006. A framework of
issues in large process modeling project. in J. Ljungberg and A. Magnus (Eds). Proceedings of the14th
European Conference on Information Systems, Goeteborg, Sweden, Association for Information Systems,
pp.1594–1605
[53]Regev, G., Bider, I. and Wegmann, A .2007. Defining business process flexibility with the help of invariants.
Software Process: Improvement and Practice, Vol. 12, No. 1, pp.65–79.
[54]Robinson D . 2006. An Introduction to Aspect Oriented Programming. IEEE Proceedings on Software
Engineering.
[55]Rosemann M., Jan Recker, Chrisitan Flender. 2008. Contextualization of business processes International
Journal of Business Process Integration and Management, Vol. 3, No. 1
[56]Rolland, C., Souveyet, C. and Ben Achour, C. 1998. Guiding goal modeling using scenarios. IEEE Transactions
on Software Engineering, Vol. 24, No. 12, pp.1055–1071.
[57]Ran Zhao, Kirusnapillai Selvarajah and Neil Speirs .2012. Tools for Building Context-aware and Secure
Pervasive Computing Applications. Proceedings of the 2nd
Conference on Pervasive and Embedded Computing
and Communications Systems .
[58]Scheer,A-W.2000. ARIS – Business Process Modeling. 3rd edition, Berlin, Germany: Springer
[59]Schilit, B.N. and Theimer, M.M. 1994. Disseminating active map information to mobile hosts. IEEE Network,
Vol. 8, No. 5, pp.22–32.
[60]Strang, T., Linnhoff-Popien, C. and Frank, K. .2003. COOL: a context ontology language to enable contextual
interoperability. Distributed Applications and Interoperable Systems –DAIS 2003, Volume 2893 of Lecture
Notes in Computer Science, Paris, France: Springer, pp.236–247.
[61]Christof Simons .2007. CMP: A UML Context Modeling Profile for Mobile Distributed Systems. Proceedings of
the 40th Annual Hawaii International Conference on System Sciences (HICSS'07).
[62]Sita Ramakrishnan and Subramania Ramakrishnan . 2012. A Web of Things (WOT) Approach to Smart
Household Energy Management for Sustainable Living. Proceedings of the 2nd
Conference on Pervasive and
Embedded Computing and Communications Systems .
[63]Santos E., João Pimentel, Diego Dermeval, Jaelson Castro, and Oscar Pastor .2011. Using NFR and Context to
Deal with Adaptability in Business Process Models. IEEE Proceedings on Software Engineering
[64]Schnieders A. and Puhlmann F. 2006. Variability Mechanisms in E-Business Process Families.Proceedings of
the 9th International Conference on Business Information Systems, BIS
[65]Tarr P. and Ossher H. 2000. Hyper/J User and Installation Manual. IBM Corporation
[66]Tuan Anh Nguyen and Marco Aiello. 2012. Beyond Indoor Presence Monitoring with Simple Sensors
.Proceedings of the 2nd
Conference on Pervasive and Embedded Computing and Communications Systems.
[67]Whittle J. and Araujo J. 2004. Scenario Modeling with Aspects. IEEE Proceedings on Software Engineering,
Vol. 151, No. 4.
[68]Wang Shuoping, Wu Minghui. 2010. Aspect-Oriented Modeling based on Behavior Context: A bridge from
asymmetric to symmetric. WASE International Conference on Information Engineering
[69]Yu, E.S.K. and Mylopoulos, J. 1994.Using goals, rules, and methods to support reasoning in business process
re-engineering. 27th Annual Hawaii International Conference on System Sciences, Vol. 4,IEEE Computer
Society, pp.234–243
[70]Zie Franco, Castelli Gabriella, and Marco M.2008 .Engineering contextual knowledge for autonomic pervasive
services[J]. Journal of Information and Software Technology,pp. 36-50.