Embed Size (px)
Citation preview
Continuation of BRAC non-formal school graduates of
1995 in formal school education
Samir R Nath Research Statistician
May 2000
________________________________________________________________________ BRAC
Research and Evaluation Division 75 Mohakhali, Dhaka 1212, Bangladesh

1
Contents
Page List of tables and figures 2 Summary 4 Introduction 6 Objectives 8 Methodology 8 Study population and sample 9 Results 10 Socio-economic characteristics of the graduates 10 The scenario of continuation and dropout 11 Continuation of education according to socio-economic characteristics 19 Discussion 22 Acknowledgements 25 References 26 Annex tables 27
2
List of Tables and figures
Page
Tables Table 1 Study population and the sample 10 Table 2 Socio-economic characteristics of the graduates as per 1995 survey 11 Table 3 Enrolment rate of the BRAC school graduates of 1995 in formal schools
by time and sex 12 Table 4 Enrolment rate of the BRAC school graduates of 1995 in formal schools
by time and type of BRAC school 13 Table 5 Percentage distribution of the graduates of 1995 by grade and year of enrolment in formal schools 14 Table 6 Distribution of the graduates of 1995 by years of schooling completed 15 Table 7 Percentage distribution of the graduates of 1995 who enrolled in formal
schools after graduating from BRAC schools by grade of enrolment and year of dropout 16
Table 8 Percentage distribution of currently enrolled graduates by type of school
and year 17 Table 9 Percentage distribution of the graduates of BRAC schools of 1995 by
enrolment status at different time period 17 Table 10 Percentage distribution of graduates who were not found currently enrolled
in school during last survey by causes of non-enrolment/dropping out 18 Table 11 Enrolment rate of the BRAC school graduates in formal schools at different time by age (during 1995) of the graduates 19 Table 12 Enrolment rate of the BRAC school graduates in formal schools at different time by mothers level of education 20 Table 13 Enrolment rate of the BRAC school graduates in formal schools at different time by fathers level of education 20 Table 14 Enrolment rate of the BRAC school graduates in formal schools at different

3
time by yearly food security status 21 Table 15 Enrolment rate of the BRAC school graduates in formal schools at different time by eligibility status for BRAC rural development programme 21 Figures Figure 1 Survival rate of the BRAC school graduates of 1995 in formal schools by sex 12 Figure 2 Survival rate of the BRAC school graduates of 1995 in formal schools by school type 13 Figure 3 Percentage of graduates of 1995 by grades in October 1999 15
4
Summary The education programme of BRAC not only provides quality basic education to its learners it also put emphasis on their enrolment in formal schools for further education. The Research and Evaluation Division of BRAC started a tracer study on the graduates of BRAC non-formal schools in 1995. This article, based on the data generated from the tracer study, explores the continuation of education of the graduates of BRAC non-formal schools in formal schools. Three types of schools were considered. These are BRAC operated Non-Formal Primary Education (NFPE) and Basic Education for Older Children (BEOC), and NFPE under Education Support Programme (ESP). A representative sample of 1,259 graduates of 1995, who completed three years course in BRAC schools, was followed up and surveyed in 1995, 1997 and 1999 to collect various information including their schooling status. However, in this third survey 1,106 could be traced. The following are the major findings from the third survey round: 1. After graduating from BRAC schools in 1995, 90% children were enrolled in formal
schools for further education (90.4% for boys and 89.9% for girls). 2. On average, around 10% of the graduates dropped out from the formal systems per year.
Highest dropout occurred during the second year of formal schooling (16.6%). Up to October 1999, 39.6% of the graduates were continuing education in different formal schools.
3. There was no gender gap at the time of entering the formal schooling but boys dropout
increased from the second year. In October 1999, 33% of the boys and 42.3% of the girls was continuing education in formal schools.
4. A higher proportion of children of NFPE continued education in formal schools than
children of BEOC and NFPE-ESP. 5. The children who graduated from NFPE generally enrolled in Class IV or V, and the
graduates of BEOC mostly enrolled in Class V or VI. Some children enrolled in Class III even they completed three years curriculum in BRAC schools.
6. Over three-quarters of the graduates of 1995 completed five-year cycle of primary
education by 1998 (69.1% for boys and 79% for girls). School-wise 78.2% of NFPE, 70.4% of BEOC and 65.2% of NFPE-ESP completed primary cycle.
7. The relationship between survival rate and grade of entry in formal schools was negative.
The survival rate was highest among those enrolled in Class IV (50.6%), less among those enrolled in Class V (42.2%) and least among those enrolled in Class VI or more (33.1%).
8. After graduating from BRAC schools the children mostly got enrolled in government
primary schools (70.7%) and non-government high schools (17.5%). After about four
5
years of their graduation, among the children who survived in formal schools up to early 1999 85.6% were found in non-government high schools.
9. Proportion of graduates enrolled in Madrassas was 4.5% in 1995. Among the children
who survived up to early 1999, 11.4% were in such type of schools. 10. Two major causes of dropout was ‘scarcity of money’ (39.1%) and ‘marriage’ (40.1%).
For boys dropout, the major reasons were ‘scarcity of money’ (65.3%), ‘disliking for school’ (16.4%), and ‘has to work at home or outside’ (12%). For girls two major reasons included ‘marriage’ (59.2%) and ‘scarcity of money’ (26.5%).
11. Demographic and socio-economic characteristics played significantly important role in
continuation of education. Younger children were more likely to continue for longer period than older children. Parental education has significant positive relationship with survival rate. The survival rate decreased from 83.3% in early 1995 to 24.6% in October 1999 among the children came from the households eligible for BRAC rural development programme. However, these rates were respectively 93.7% and 47.4% among those came from non-eligible households.

6
Introduction The non-formal education has been considered as an academic activity outside the structural
frame of formal education. Identifying the difference between two forms of education it is
said that the formal provision is a ‘hierarchically structured’ and ‘chronologically graded’
system, whereas the non-formal one is for a special target group towards specific learning
objectives. The learning area covered under non-formal education is obviously much wider
and the system is very flexible compared to the formal system. The concept of non-formal
education is not new. This provision was widely used to tackle the educational crisis after
the World War II. Under the names of ‘community development’, ‘community education’
and ‘functional literacy’ UNESCO also dealt with similar concept in the 1950’s and 1970’s.
In the declaration of the latest World Conference on Education for All (WCEFA), held in
Jomtien in 1990, the provision of non-formal education got much importance to meet the
basic educational needs of the countries (WCEFA, 1990).
Like many other developing countries the education system in Bangladesh is no exception.
The literacy rate for all population increased only 6.3 percentage points from 1961 to 1991
(BBS, 1994). The first education commission of Bangladesh, formed by the government
immediately after the birth of the nation, advocated wide use of non-formal education
methods to eradicate mass illiteracy from the country. However, no serious government
initiative was taken in this regard for long time. On the other hand, the non-governmental
development organisations have taken a leading role to run non-formal education
programmes for children, youths and adults. The primary education has been made
compulsory for children aged 6-10 years since 1993. Not all school-aged children go to
school and overall quality of education is poor. About 77% of primary school aged children
are currently enrolled and less than 30% of the children aged 11-12 qualify criteria for basic
education (Chowdhury et al., 1999). Although the enrolment rate was higher for boys than
girls in recent past, the gender gap has been reduced recently. The gross enrolment ratio of
the girls is higher than that of boys in some areas. On the other hand, enrolment rate at
secondary level is less than primary level, about two-thirds of the secondary school-aged
children do not go to school. The government started scholarship programme for girls to
7
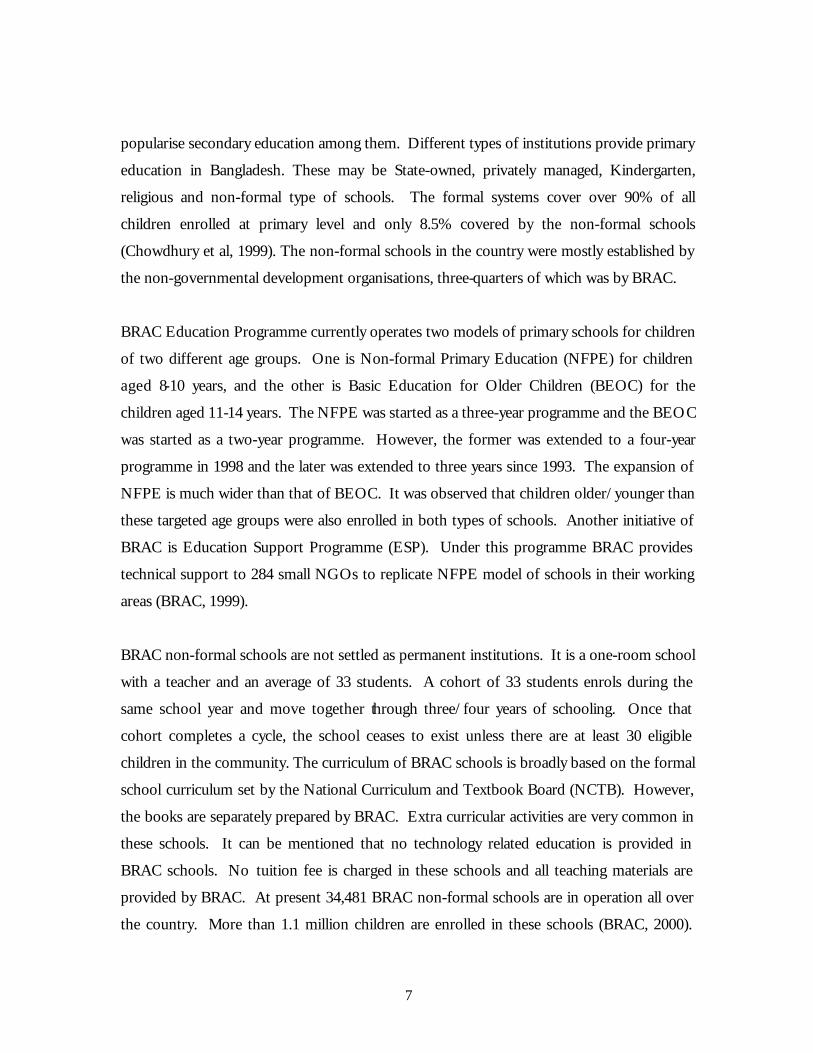
popularise secondary education among them. Different types of institutions provide primary
education in Bangladesh. These may be State-owned, privately managed, Kindergarten,
religious and non-formal type of schools. The formal systems cover over 90% of all
children enrolled at primary level and only 8.5% covered by the non-formal schools
(Chowdhury et al, 1999). The non-formal schools in the country were mostly established by
the non-governmental development organisations, three-quarters of which was by BRAC.
BRAC Education Programme currently operates two models of primary schools for children
of two different age groups. One is Non-formal Primary Education (NFPE) for children
aged 8-10 years, and the other is Basic Education for Older Children (BEOC) for the
children aged 11-14 years. The NFPE was started as a three-year programme and the BEOC
was started as a two-year programme. However, the former was extended to a four-year
programme in 1998 and the later was extended to three years since 1993. The expansion of
NFPE is much wider than that of BEOC. It was observed that children older/younger than
these targeted age groups were also enrolled in both types of schools. Another initiative of
BRAC is Education Support Programme (ESP). Under this programme BRAC provides
technical support to 284 small NGOs to replicate NFPE model of schools in their working
areas (BRAC, 1999).
BRAC non-formal schools are not settled as permanent institutions. It is a one-room school
with a teacher and an average of 33 students. A cohort of 33 students enrols during the
same school year and move together through three/four years of schooling. Once that
cohort completes a cycle, the school ceases to exist unless there are at least 30 eligible
children in the community. The curriculum of BRAC schools is broadly based on the formal
school curriculum set by the National Curriculum and Textbook Board (NCTB). However,
the books are separately prepared by BRAC. Extra curricular activities are very common in
these schools. It can be mentioned that no technology related education is provided in
BRAC schools. No tuition fee is charged in these schools and all teaching materials are
provided by BRAC. At present 34,481 BRAC non-formal schools are in operation all over
the country. More than 1.1 million children are enrolled in these schools (BRAC, 2000).
8
Over 66% of the students are girls and among the teachers 97% are female. Up to the end
of 1999, the total number of children graduated from BRAC schools reached over 1.5
million.
Generally, it is thought that the non-formal way of schooling is very much effective to teach
a specific curriculum to a specially targeted group of people. In many cases continuation of
education of these learners have not been considered. Thus, non-formal schooling for the
youths and adults ultimately went on to programmes eradicating illiteracy. BRAC not only
provides quality basic education to the poorer children in Bangladesh, it also prepares them
for further education through formal schooling. It might be interesting to see how long
these poorer children continue their educational life. This paper aims to explore the
continuation of education of a cohort of graduates of BRAC non-formal education
programme in formal schools.
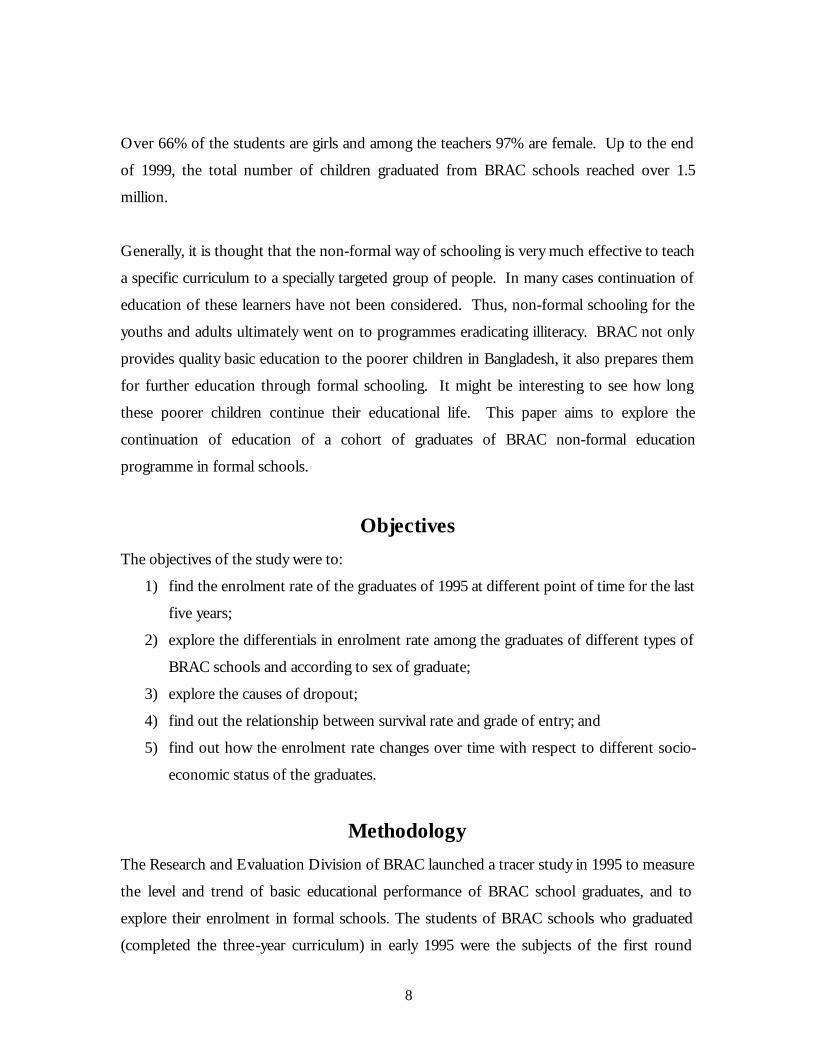
Objectives The objectives of the study were to:
1) find the enrolment rate of the graduates of 1995 at different point of time for the last
five years;
2) explore the differentials in enrolment rate among the graduates of different types of
BRAC schools and according to sex of graduate;
3) explore the causes of dropout;
4) find out the relationship between survival rate and grade of entry; and
5) find out how the enrolment rate changes over time with respect to different socio-
economic status of the graduates.
Methodology The Research and Evaluation Division of BRAC launched a tracer study in 1995 to measure
the level and trend of basic educational performance of BRAC school graduates, and to
explore their enrolment in formal schools. The students of BRAC schools who graduated
(completed the three-year curriculum) in early 1995 were the subjects of the first round
9
survey of the project. The survey for the tracer study is conducted every alternative year.
The 1995 graduates were surveyed thrice between 1995 and 1999. Information on current
enrolment status, grade and type of school of the currently enrolled children, month and
year of leaving of the dropped out children, and causes of that was collected in each survey.
The 1999 survey verified the previously collected information and updated the changes made
after 1997 survey. Besides, information on age and sex of children, parental education, and
self perceived yearly food security status of household was collected in 1995. Information
were collected through interviewing the respective graduates and their parents/guardians.
Study population and sampling
Three groups of children who completed three years non-formal curriculum under BRAC
Education Programme in early 1995 were considered as target population for this study.
These are the graduates of NFPE and BEOC directly operated by BRAC, and NFPE
operated under ESP. All schools considered for the study were located in rural areas. For
administrative purpose, BRAC operated schools are clustered in teams, where each team
looks after around 50 schools. ESP schools are operated by other small NGOs, five schools
each. A total of 3,993 schools completed three-year BRAC curriculum in 1995, of which
3,008 were NFPE, 856 were BEOC and 129 were NFPE-ESP. From these schools
approximately 119,790 students were graduated in 1995.
Separate samples were drawn from each of the three categories of schools. It was calculated
that for a precision level of 7% and with 95% confidence limit 196 graduates are needed for
a single estimate. As cluster-sampling procedure was applied the size of the sample was
doubled in order to reduce intra cluster correlation affect. For BRAC operated schools, 30
teams were randomly selected. From each selected team (here cluster), one school was
selected randomly and another one was chosen adjacent to it. However, for ESP schools
thirty schools (from the list of 129) were randomly selected and another 30 were chosen
among those NGOs from which the first 30 schools came. From the list of the graduates of
each pair of schools two lists were produced according to sex. Fourteen graduates (seven
boys and seven girls) from each of 30 random clusters were selected for each type of school.
10
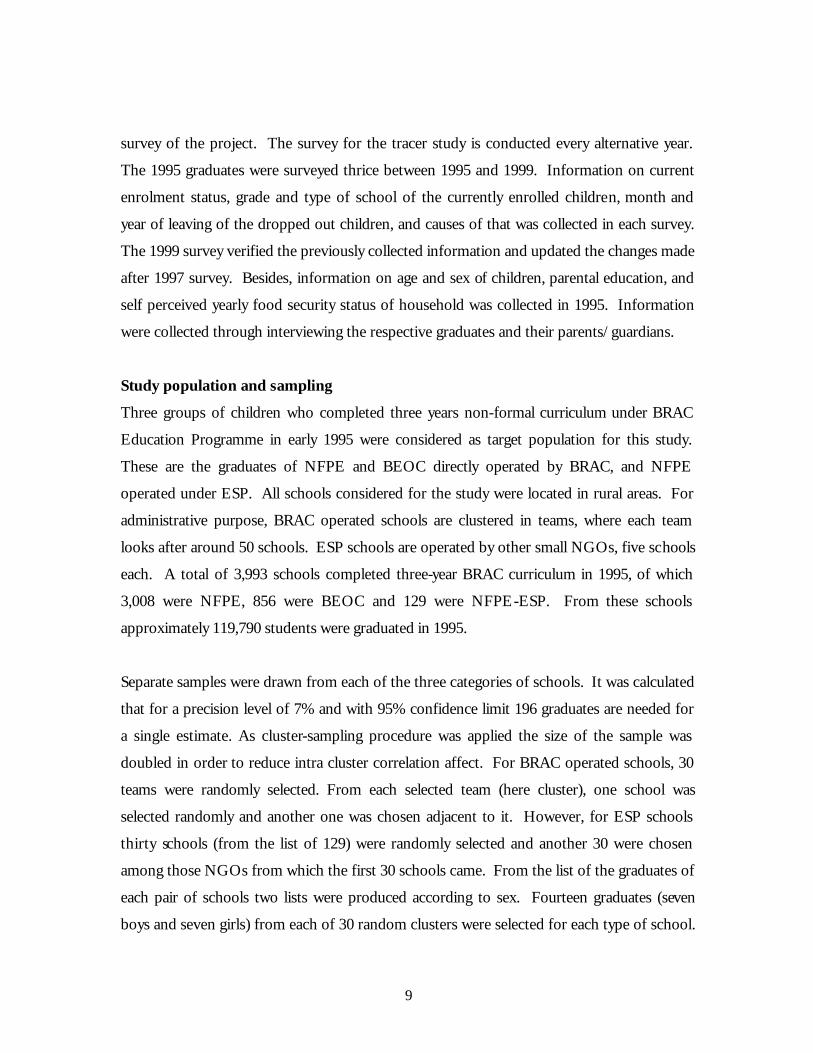
Instead of 1,260 (14 x 30 x 3) graduates 1,259 were interviewed during first survey in 1995.
All the above graduates were attempted to trace during the survey of 1997 and 1999.
However, some could not be located due to shift of family from the area, and information of
some could not be collected due to lake of memory of the graduates and the family
members. Complete information of 1,106 graduates were available from three surveys, of
which 360 from NFPE, 360 from BEOC and 386 from NFPE-ESP (Table 1).
Table 1 Study population and the sample ______________________________________________________________________________ Type of No. of No. of No. of graduates selected No. of children traced School schools students for first survey in 1995 in third survey in 1999 completed graduated ______________________________ _____________________________ Boys Girls Both Boys Girls Both ______________________________________________________________________________ NFPE 3,008 90,240 210 210 420 185 175 360 BEOC 856 25,680 207 213 420 180 180 360 NFPE-ESP 129 3,870 191 228 419 179 207 386 All 3,993 119,790 608 651 1,259 544 562 1,106 ______________________________________________________________________________
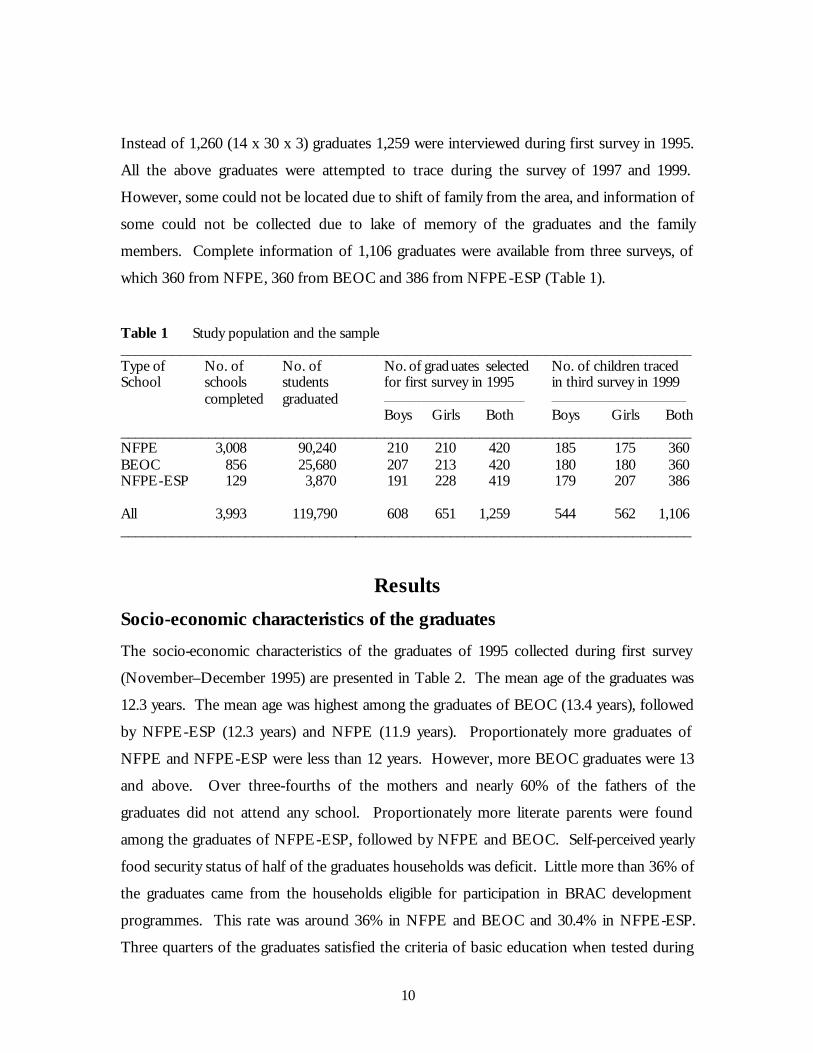
Results Socio-economic characteristics of the graduates
The socio-economic characteristics of the graduates of 1995 collected during first survey
(November–December 1995) are presented in Table 2. The mean age of the graduates was
12.3 years. The mean age was highest among the graduates of BEOC (13.4 years), followed
by NFPE-ESP (12.3 years) and NFPE (11.9 years). Proportionately more graduates of
NFPE and NFPE-ESP were less than 12 years. However, more BEOC graduates were 13
and above. Over three-fourths of the mothers and nearly 60% of the fathers of the
graduates did not attend any school. Proportionately more literate parents were found
among the graduates of NFPE-ESP, followed by NFPE and BEOC. Self-perceived yearly
food security status of half of the graduates households was deficit. Little more than 36% of
the graduates came from the households eligible for participation in BRAC development
programmes. This rate was around 36% in NFPE and BEOC and 30.4% in NFPE-ESP.
Three quarters of the graduates satisfied the criteria of basic education when tested during

11
the first survey. Separately, 75% of the NFPE, 76.1% of the BEOC and 74% of the NFPE-
ESP graduates qualified in the test.
Table 2 Socio-economic characteristics of the graduates as per 1995 survey ______________________________________________________________________________ Characteristics NFPE BEOC NFPE-ESP All ______________________________________________________________________________ Mean age 11.9 13.9 12.3 12.3 Age distribution (%) 9 – 10 y 20.0 3.0 11.4 16.1 11 – 12 y 47.7 21.5 46.4 42.1 13 – 14 y 28.0 39.8 35.9 30.8 15+ y 4.3 35.7 6.2 11.0
Mothers education (%) Nil 76.9 77.6 72.6 76.8 I – V 18.5 19.2 20.4 18.7 VI+ 4.7 3.2 7.0 4.5
Fathers education (%) Nil 58.4 59.8 54.5 58.5 I – V 18.8 22.1 24.9 19.7 VI+ 22.8 18.1 20.6 21.7
Yearly food security status of household (%) Always in deficit 20.6 19.2 21.3 20.3 Sometimes in deficit 32.5 28.7 30.5 31.6 Balance 32.8 37.4 32.4 33.8 Surplus 14.1 14.6 15.8 14.3
Household eligible for participation in BRAC programme (%) 36.4 36.1 30.4 36.1
Qualified in basic competency test (%) 75.0 76.1 74.0 75.2 ______________________________________________________________________________ Source: First round tracer study in 1995
The scenario of continuation and dropout
Table 3 presents enrolment rate of the BRAC school graduates of 1995 in formal schools
during early 1995 to October 1999. After graduating from BRAC schools 90% of the
graduates enrolled in formal schools in early 1995, this rate was 90.4% for the boys and
89.9% for the girls. The overall enrolment rate significantly decreased to 80.3% by early
1996, 63.7% by early 1997, 53.5% by early 1998, 44.3% by early 1999 and 39.6% by October
1999. Although there was no statistically significant gender difference in the enrolment of
12
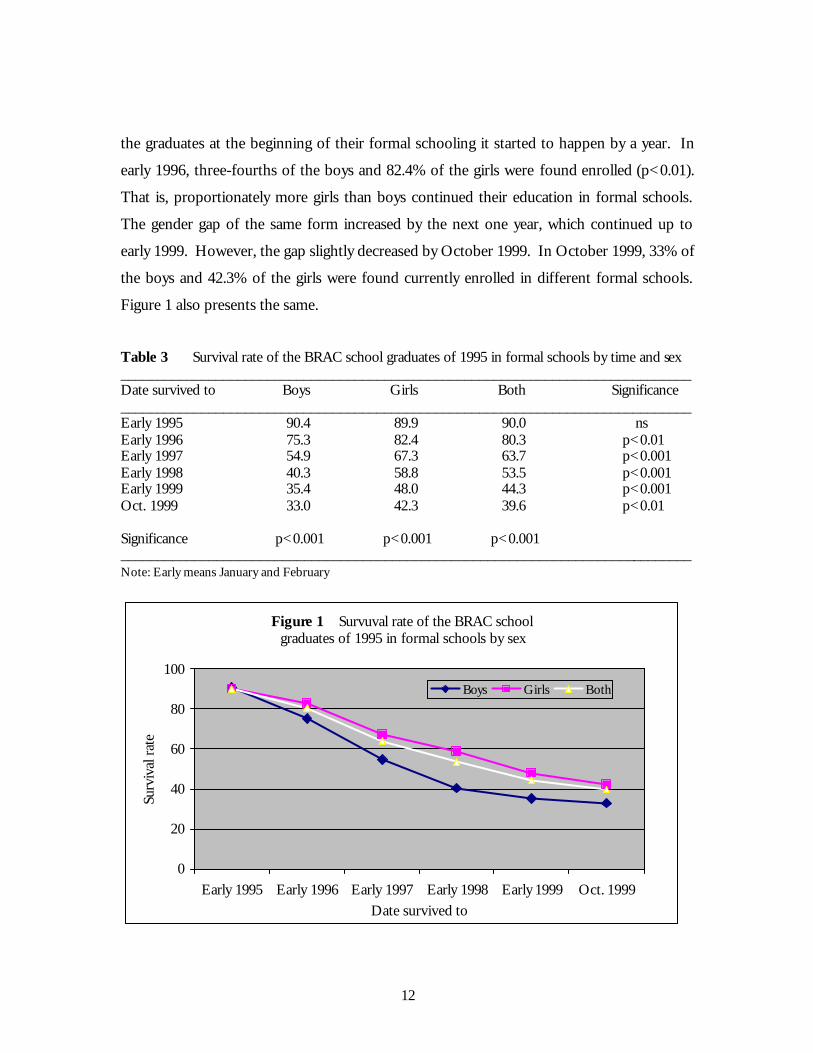
the graduates at the beginning of their formal schooling it started to happen by a year. In
early 1996, three-fourths of the boys and 82.4% of the girls were found enrolled (p<0.01).
That is, proportionately more girls than boys continued their education in formal schools.
The gender gap of the same form increased by the next one year, which continued up to
early 1999. However, the gap slightly decreased by October 1999. In October 1999, 33% of
the boys and 42.3% of the girls were found currently enrolled in different formal schools.
Figure 1 also presents the same.
Table 3 Survival rate of the BRAC school graduates of 1995 in formal schools by time and sex ______________________________________________________________________________ Date survived to Boys Girls Both Significance ______________________________________________________________________________ Early 1995 90.4 89.9 90.0 ns Early 1996 75.3 82.4 80.3 p<0.01 Early 1997 54.9 67.3 63.7 p<0.001 Early 1998 40.3 58.8 53.5 p<0.001 Early 1999 35.4 48.0 44.3 p<0.001 Oct. 1999 33.0 42.3 39.6 p<0.01 Significance p<0.001 p<0.001 p<0.001 ______________________________________________________________________________ Note: Early means January and February
Figure 1 Survuval rate of the BRAC school graduates of 1995 in formal schools by sex
0
20
40
60
80
100
Early 1995 Early 1996 Early 1997 Early 1998 Early 1999 Oct. 1999Date survived to
Surv
ival
rate
Boys Girls Both
13
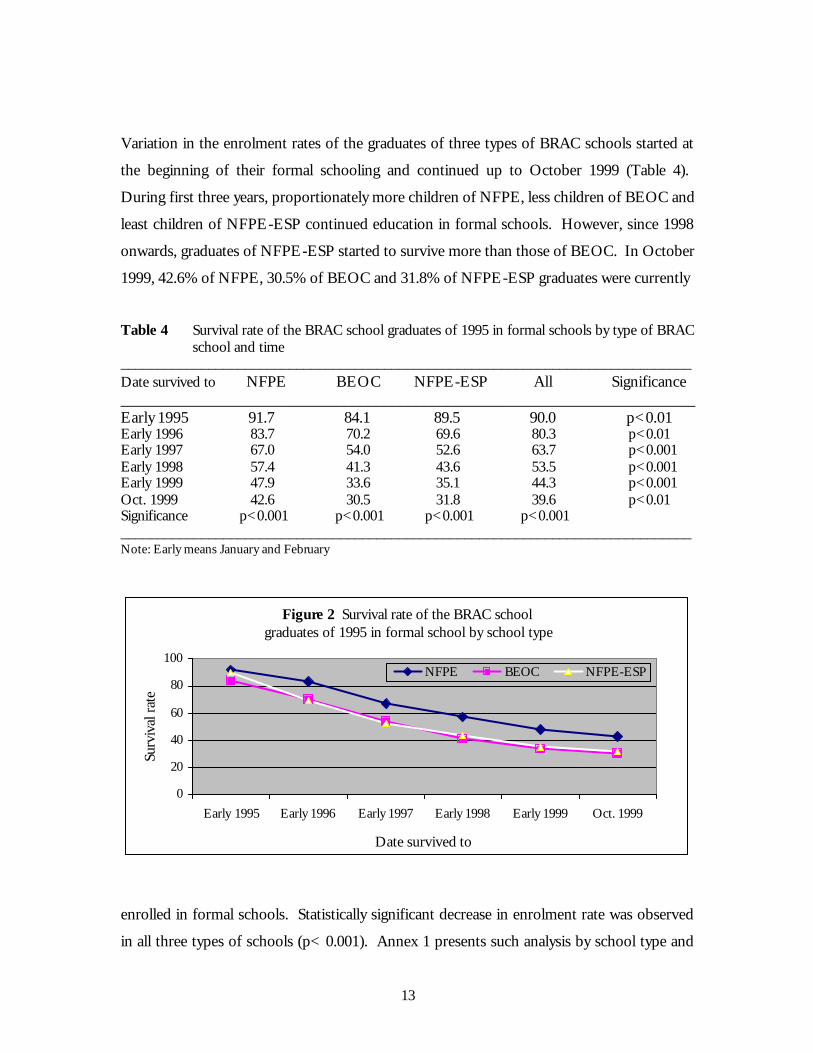
Variation in the enrolment rates of the graduates of three types of BRAC schools started at
the beginning of their formal schooling and continued up to October 1999 (Table 4).
During first three years, proportionately more children of NFPE, less children of BEOC and
least children of NFPE-ESP continued education in formal schools. However, since 1998
onwards, graduates of NFPE-ESP started to survive more than those of BEOC. In October
1999, 42.6% of NFPE, 30.5% of BEOC and 31.8% of NFPE-ESP graduates were currently
Table 4 Survival rate of the BRAC school graduates of 1995 in formal schools by type of BRAC
school and time ______________________________________________________________________________ Date survived to NFPE BEOC NFPE-ESP All Significance ________________________________________________________________________ Early 1995 91.7 84.1 89.5 90.0 p<0.01 Early 1996 83.7 70.2 69.6 80.3 p<0.01 Early 1997 67.0 54.0 52.6 63.7 p<0.001 Early 1998 57.4 41.3 43.6 53.5 p<0.001 Early 1999 47.9 33.6 35.1 44.3 p<0.001 Oct. 1999 42.6 30.5 31.8 39.6 p<0.01 Significance p<0.001 p<0.001 p<0.001 p<0.001 ______________________________________________________________________________ Note: Early means January and February
enrolled in formal schools. Statistically significant decrease in enrolment rate was observed
in all three types of schools (p< 0.001). Annex 1 presents such analysis by school type and
Figure 2 Survival rate of the BRAC school graduates of 1995 in formal school by school type
0
20
40
60
80
100
Early 1995 Early 1996 Early 1997 Early 1998 Early 1999 Oct. 1999
Date survived to
Surv
ival
rate
NFPE BEOC NFPE-ESP
14
sex. This Annex shows that gender gap was least among the graduates of NFPE-ESP.
Figure 2 presents survival rate at different time by school type.
The graduates of BRAC schools enrolled in different classes in formal schools (Table 5).
Most popular classes were IV and V, where over three-fourths of the graduates enrolled. Of
the graduates who enrolled in formal schools, 49.6% enrolled in class IV and 26.3% enrolled
in class V. Nearly 20% of the children enrolled in class VI and 0.7% enrolled in class VII.
Children enrolled in Class VII were mostly from BEOC. It was also observed that 3.8% of
the graduates enrolled in class III or bellow, although, they completed three years curriculum
in BRAC schools. It can be expected that those enrolled in class III and IV in 1995 would
be in classes VII and VIII in 1999, if they do not repeat in the same class for more than a
year. Table 5 shows that in 1999, the proportion of graduates against class VII and bellow
increased by 6.4 percentage points and the proportion against class IX decreased by 5.4
percentage points. Proportion of the children, who enrolled in class VII in 1995 and were
suppose to be in class XI in 1999, were also decreased. Similar trend would be found among
those enrolled in class V in 1995 and are suppose to be in class IX in 1999. The above
results indicate that very few graduates of BRAC schools repeated more than a year in the
same class in formal schools. Over three-fourths of the enrolled children were in class VII or
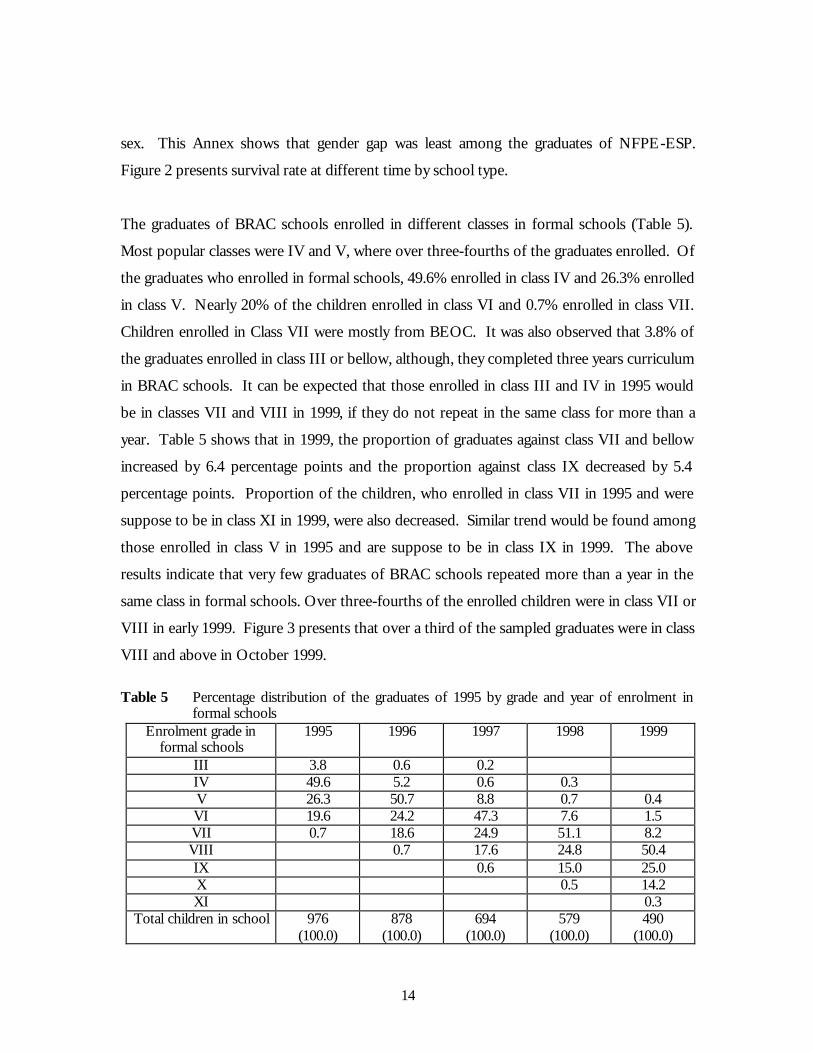
VIII in early 1999. Figure 3 presents that over a third of the sampled graduates were in class
VIII and above in October 1999. Table 5 Percentage distribution of the graduates of 1995 by grade and year of enrolment in
formal schools Enrolment grade in
formal schools 1995 1996 1997 1998 1999
III 3.8 0.6 0.2 IV 49.6 5.2 0.6 0.3 V 26.3 50.7 8.8 0.7 0.4 VI 19.6 24.2 47.3 7.6 1.5 VII 0.7 18.6 24.9 51.1 8.2 VIII 0.7 17.6 24.8 50.4 IX 0.6 15.0 25.0 X 0.5 14.2 XI 0.3
Total children in school 976 (100.0)
878 (100.0)
694 (100.0)
579 (100.0)
490 (100.0)
15
Table 6 presents distribution of the graduates by years of schooling completed. As the data were last
collected before the end of 1999, this Table reflects completion rate by December 1998. On average,
17.4% of the graduates could not go beyond what they taught in BRAC schools and 6.4% taught one
more year in formal schools. The five-year primary cycle completion rate was 76.2%, 69.1% for boys
and 79% for girls. School-wise analysis shows that 78.2% of NFPE, 70.4% of BEOC and 65.1% of
NFPE-ESP graduates completed five or more years of schooling.
Table 6 Distribution of the graduates of 1995 by years of schooling completed ______________________________________________________________________________ Years of Type of school Sex schooling ____________________________ ____________ completed NFPE BEOC NFPE-ESP Boys Girls All ______________________________________________________________________________ III 14.6 26.8 22.1 22.7 15.3 17.4 IV 7.1 2.7 12.1 8.2 5.7 6.4 V 13.5 5.9 19.0 17.9 9.8 12.1 VI 14.1 13.5 12.6 13.4 14.1 13.9 VII 35.2 14.3 15.5 25.6 31.8 30.0 VIII 13.3 14.4 14.3 8.4 15.7 13.6 IX 2.2 21.9 4.1 3.7 7.5 6.4 X - 0.6 0.1 0.1 0.1 0.1 V+ 78.2 70.4 65.1 69.1 79.0 76.2 ______________________________________________________________________________
Figure 3 Percentage of graduates of 1995 by grades in October 1999
60.4
0.7 3.6
20.19.8
5.30.1
01020304050607080
Dropout V-VI VII VIII IX X XIGrades
% o
f gra
duat
es
16
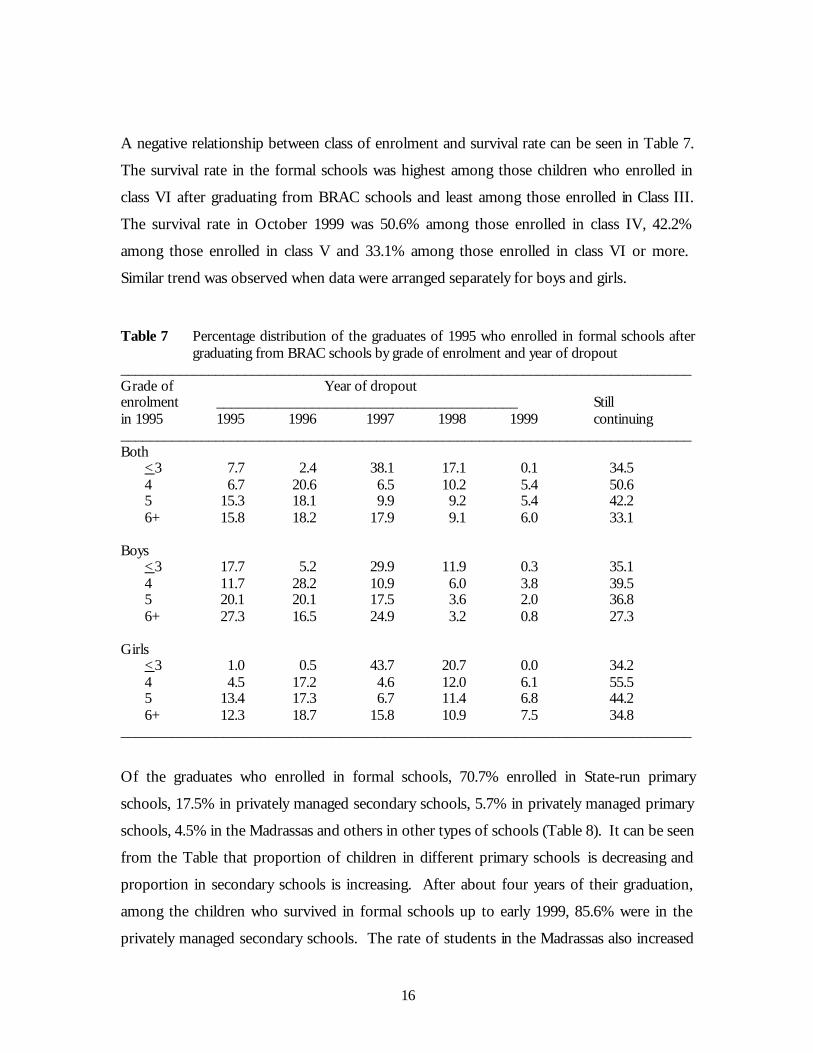
A negative relationship between class of enrolment and survival rate can be seen in Table 7.
The survival rate in the formal schools was highest among those children who enrolled in
class VI after graduating from BRAC schools and least among those enrolled in Class III.
The survival rate in October 1999 was 50.6% among those enrolled in class IV, 42.2%
among those enrolled in class V and 33.1% among those enrolled in class VI or more.
Similar trend was observed when data were arranged separately for boys and girls. Table 7 Percentage distribution of the graduates of 1995 who enrolled in formal schools after
graduating from BRAC schools by grade of enrolment and year of dropout ______________________________________________________________________________ Grade of Year of dropout enrolment _________________________________________ Still in 1995 1995 1996 1997 1998 1999 continuing ______________________________________________________________________________ Both <3 7.7 2.4 38.1 17.1 0.1 34.5
4 6.7 20.6 6.5 10.2 5.4 50.6 5 15.3 18.1 9.9 9.2 5.4 42.2 6+ 15.8 18.2 17.9 9.1 6.0 33.1 Boys <3 17.7 5.2 29.9 11.9 0.3 35.1 4 11.7 28.2 10.9 6.0 3.8 39.5 5 20.1 20.1 17.5 3.6 2.0 36.8 6+ 27.3 16.5 24.9 3.2 0.8 27.3 Girls <3 1.0 0.5 43.7 20.7 0.0 34.2 4 4.5 17.2 4.6 12.0 6.1 55.5 5 13.4 17.3 6.7 11.4 6.8 44.2 6+ 12.3 18.7 15.8 10.9 7.5 34.8 ______________________________________________________________________________
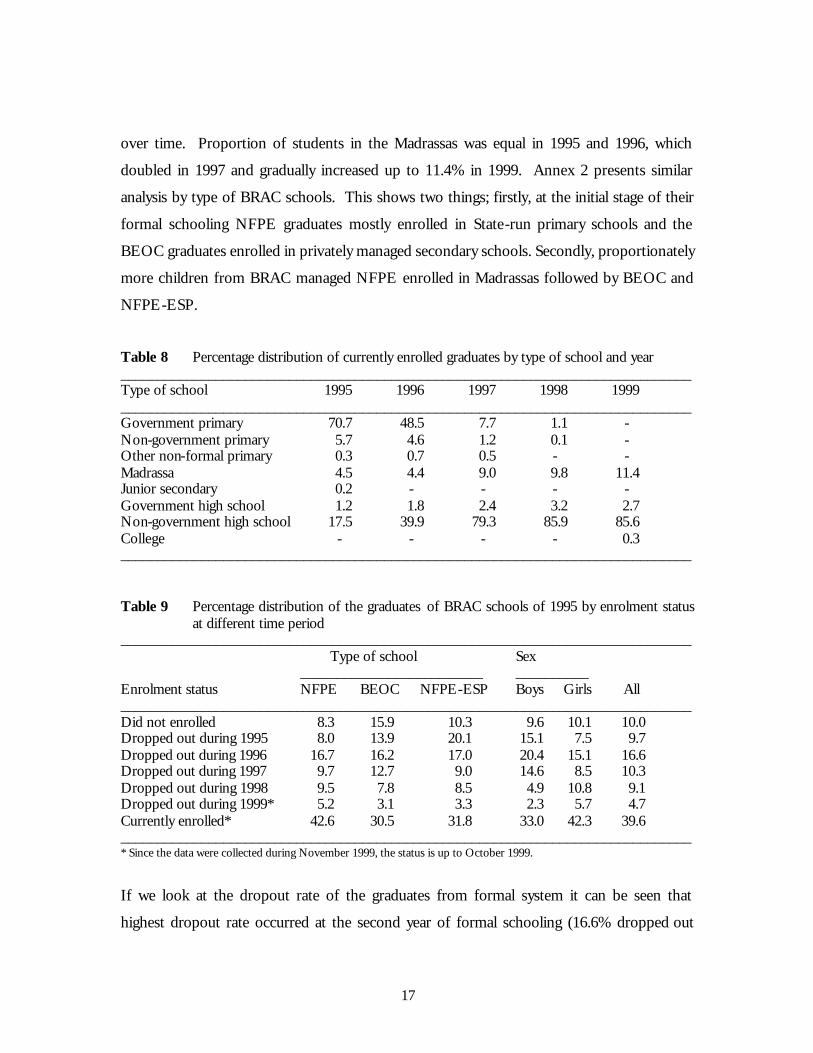
Of the graduates who enrolled in formal schools, 70.7% enrolled in State-run primary
schools, 17.5% in privately managed secondary schools, 5.7% in privately managed primary
schools, 4.5% in the Madrassas and others in other types of schools (Table 8). It can be seen
from the Table that proportion of children in different primary schools is decreasing and
proportion in secondary schools is increasing. After about four years of their graduation,
among the children who survived in formal schools up to early 1999, 85.6% were in the
privately managed secondary schools. The rate of students in the Madrassas also increased
17
over time. Proportion of students in the Madrassas was equal in 1995 and 1996, which
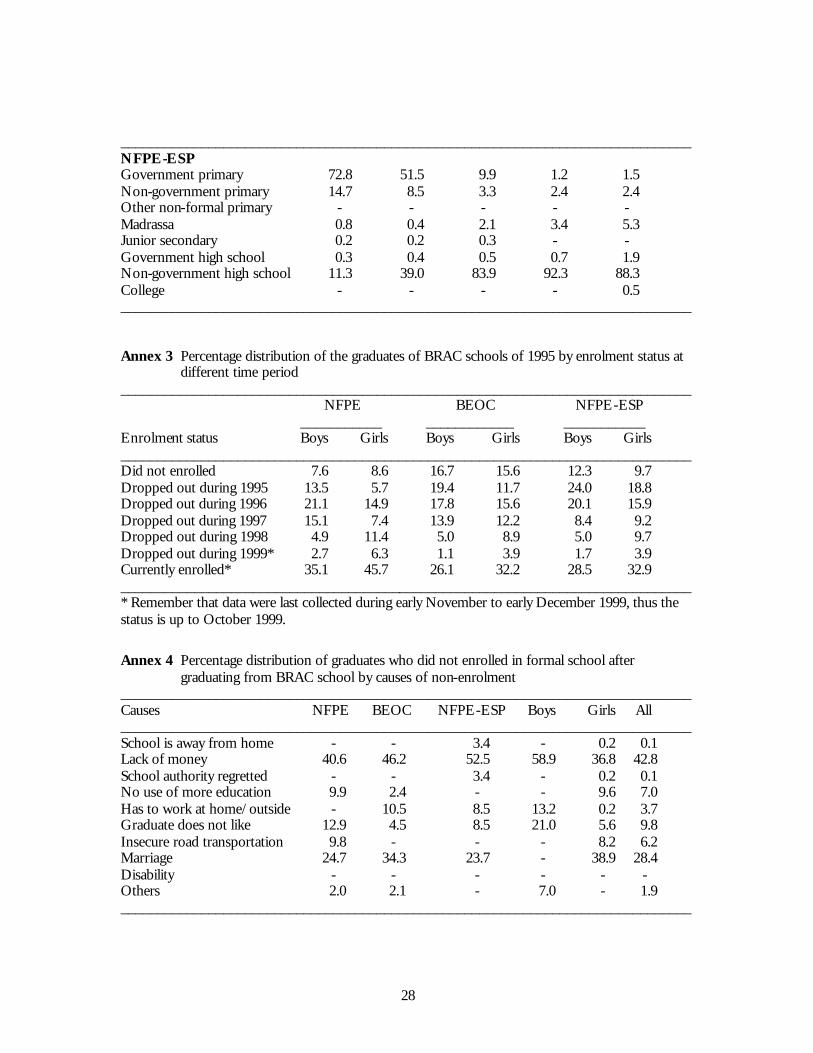
doubled in 1997 and gradually increased up to 11.4% in 1999. Annex 2 presents similar
analysis by type of BRAC schools. This shows two things; firstly, at the initial stage of their
formal schooling NFPE graduates mostly enrolled in State-run primary schools and the
BEOC graduates enrolled in privately managed secondary schools. Secondly, proportionately
more children from BRAC managed NFPE enrolled in Madrassas followed by BEOC and
NFPE-ESP.
Table 8 Percentage distribution of currently enrolled graduates by type of school and year ______________________________________________________________________________ Type of school 1995 1996 1997 1998 1999 ______________________________________________________________________________ Government primary 70.7 48.5 7.7 1.1 - Non-government primary 5.7 4.6 1.2 0.1 - Other non-formal primary 0.3 0.7 0.5 - - Madrassa 4.5 4.4 9.0 9.8 11.4 Junior secondary 0.2 - - - - Government high school 1.2 1.8 2.4 3.2 2.7 Non-government high school 17.5 39.9 79.3 85.9 85.6 College - - - - 0.3 ______________________________________________________________________________
Table 9 Percentage distribution of the graduates of BRAC schools of 1995 by enrolment status
at different time period ______________________________________________________________________________ Type of school Sex _________________________ __________ Enrolment status NFPE BEOC NFPE-ESP Boys Girls All ______________________________________________________________________________ Did not enrolled 8.3 15.9 10.3 9.6 10.1 10.0 Dropped out during 1995 8.0 13.9 20.1 15.1 7.5 9.7 Dropped out during 1996 16.7 16.2 17.0 20.4 15.1 16.6 Dropped out during 1997 9.7 12.7 9.0 14.6 8.5 10.3 Dropped out during 1998 9.5 7.8 8.5 4.9 10.8 9.1 Dropped out during 1999* 5.2 3.1 3.3 2.3 5.7 4.7 Currently enrolled* 42.6 30.5 31.8 33.0 42.3 39.6 ______________________________________________________________________________ * Since the data were collected during November 1999, the status is up to October 1999.
If we look at the dropout rate of the graduates from formal system it can be seen that
highest dropout rate occurred at the second year of formal schooling (16.6% dropped out
18
during 1996) (Table 9). During that period the dropout rate was 20.4% for boys and 15.1%
for girls. The dropout rate increased from 1995 to 1996 and then gradually decreased.
Analysis of data by type of school shows that highest proportion of NFPE-ESP graduates
dropped out at their initial year in formal schools and then gradually decreased over time.
Annex 3 presents similar analysis with more details.
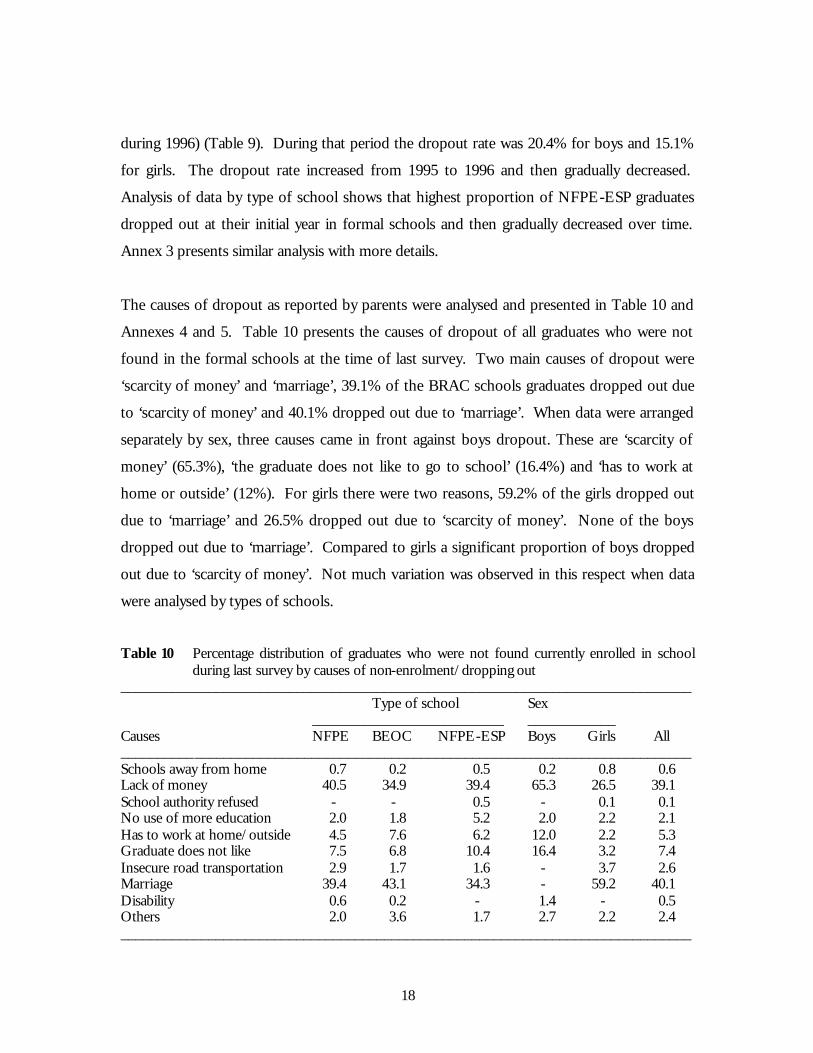
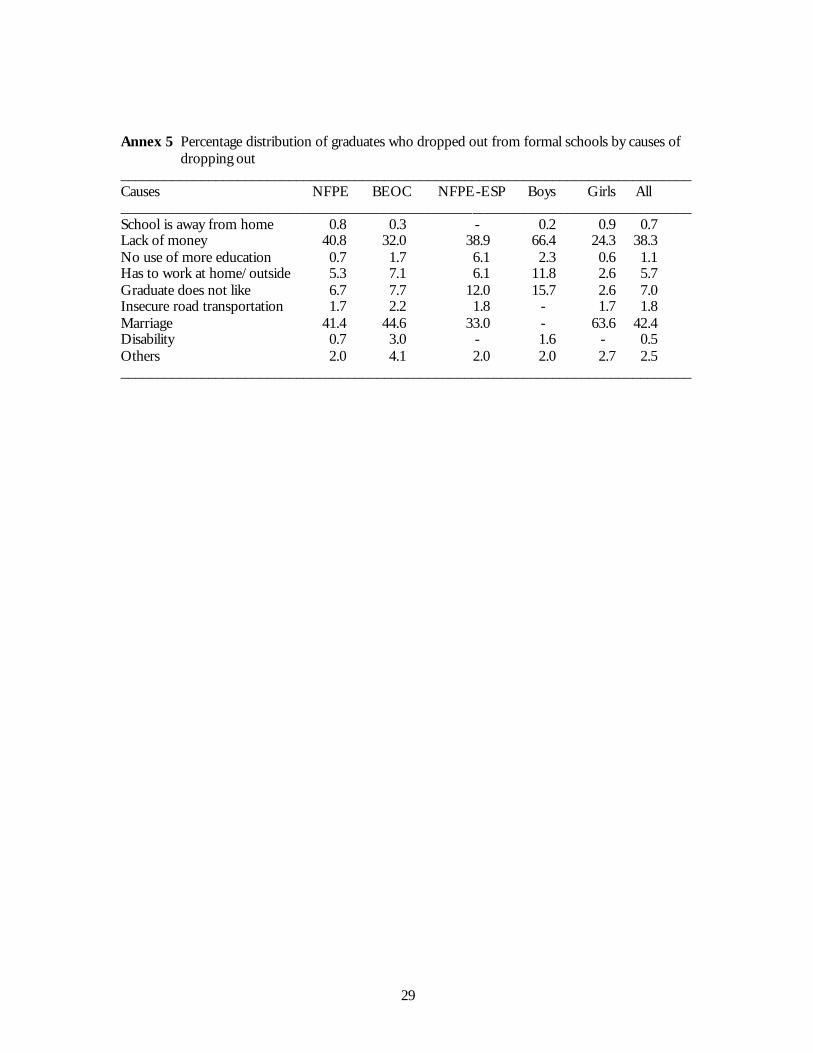
The causes of dropout as reported by parents were analysed and presented in Table 10 and
Annexes 4 and 5. Table 10 presents the causes of dropout of all graduates who were not
found in the formal schools at the time of last survey. Two main causes of dropout were
‘scarcity of money’ and ‘marriage’, 39.1% of the BRAC schools graduates dropped out due
to ‘scarcity of money’ and 40.1% dropped out due to ‘marriage’. When data were arranged
separately by sex, three causes came in front against boys dropout. These are ‘scarcity of
money’ (65.3%), ‘the graduate does not like to go to school’ (16.4%) and ‘has to work at
home or outside’ (12%). For girls there were two reasons, 59.2% of the girls dropped out
due to ‘marriage’ and 26.5% dropped out due to ‘scarcity of money’. None of the boys
dropped out due to ‘marriage’. Compared to girls a significant proportion of boys dropped
out due to ‘scarcity of money’. Not much variation was observed in this respect when data
were analysed by types of schools.
Table 10 Percentage distribution of graduates who were not found currently enrolled in school
during last survey by causes of non-enrolment/dropping out ______________________________________________________________________________ Type of school Sex __________________________ ____________ Causes NFPE BEOC NFPE-ESP Boys Girls All ______________________________________________________________________________ Schools away from home 0.7 0.2 0.5 0.2 0.8 0.6 Lack of money 40.5 34.9 39.4 65.3 26.5 39.1 School authority refused - - 0.5 - 0.1 0.1 No use of more education 2.0 1.8 5.2 2.0 2.2 2.1 Has to work at home/outside 4.5 7.6 6.2 12.0 2.2 5.3 Graduate does not like 7.5 6.8 10.4 16.4 3.2 7.4 Insecure road transportation 2.9 1.7 1.6 - 3.7 2.6 Marriage 39.4 43.1 34.3 - 59.2 40.1 Disability 0.6 0.2 - 1.4 - 0.5 Others 2.0 3.6 1.7 2.7 2.2 2.4 ______________________________________________________________________________

19
Continuation of education according to socio-economic characteristics
Younger children are more likely to enrol in formal schools after graduation from BRAC
schools (Table 11). Over 97% of the graduates aged 9-10 years were enrolled in formal
schools in 1995; this rate was 93.4% among children aged 11-12 years, 88.3% among
children aged 13-14 years and 71.4% among children aged 15 years and more. The
enrolment rate gradually decreased for the children of all ages. Among the children who
were 9-10 years old in 1995, 69.2% were found currently enrolled in October 1999. The
current enrolment was found 41.3% among the children aged 11-12 years, 28.7% among 13-
14 years and 21.2% among 15+ years.
Table 11 Enrolment rate of the BRAC school graduates in formal schools at different time by age
(during 1995) of the graduates ______________________________________________________________________________ Age (in year) _________________________________ Date survived to 9-10 11-12 13-14 15+ Significance ______________________________________________________________________________ Early 1995 97.2 93.4 88.3 71.4 p<0.001 Early 1996 94.1 83.9 76.3 57.9 p<0.001 Early 1997 86.9 66.7 54.6 43.6 p<0.001 Early 1998 78.0 56.9 45.2 28.1 p<0.001 Early 1999 72.6 47.6 32.8 23.4 p<0.001 October 1999 69.2 41.3 28.7 21.2 p<0.001 Significance p<0.001 p<0.001 p<0.001 p<0.001 ______________________________________________________________________________ Information on age was collected during first survey at the end of 1995
Parental education also played significant role in the continuation of education of the
graduates (Tables 12 and 13). Children of the parents with more education are more likely
to enrol in formal schools after graduation from BRAC schools and also to survive for a
longer period in the formal schools. Although it was observed that survival rate in the
formal schools of the children with any level of parental education has significantly
decreased over time. However, the rate of decrease was less among the children of educated
parents compared to that of the children of non-educated parents.

20
Table 12 Enrolment rate of the BRAC school graduates in formal schools at different time by mothers level of education
______________________________________________________________________________ Mothers level of education ______________________________ Date survived to Nil I-V VI+ Significance (847) (208) (51) ______________________________________________________________________________ Early 1995 88.7 93.3 99.7 p<0.01 Early 1996 78.5 84.8 92.5 p<0.01 Early 1997 60.6 75.0 70.6 p<0.001 Early 1998 50.5 64.1 60.4 p<0.001 Early 1999 40.6 58.3 51.1 p<0.001 October 1999 35.1 55.8 50.7 p<0.001 Significance p<0.001 p<0.001 p<0.001 _____________________________________________________________________ Table 13 Enrolment rate of the BRAC school graduates in formal schools at different time by
fathers level of education ______________________________________________________________________________ Fathers level of education ______________________________ Date survived to Nil I-V VI+ Significance (646) (242) (218) ______________________________________________________________________________ Early 1995 86.2 93.6 97.2 p<0.001 Early 1996 75.5 81.8 91.9 p<0.001 Early 1997 59.0 65.9 74.5 p<0.001 Early 1998 46.9 54.5 70.0 p<0.001 Early 1999 36.4 45.9 64.3 p<0.001 October 1999 31.1 40.5 61.9 p<0.001 Significance p<0.001 p<0.001 p<0.001 ______________________________________________________________________________
A significant positive relationship between yearly food security status of the household and
continuation of education of the children was observed (Table 14). Although the enrolment
rate significantly decreased in each group of households, compared to the households with
‘balanced’ or ‘surplus’ economy the rate of decrease was much in the households with deficit
food security status. Thus, the gap between the groups increased over time.

21
Table 14 Enrolment rate of the BRAC school graduates in formal schools at different time by yearly food security status
______________________________________________________________________________ Yearly food security status ____________________________________________ Date Always Sometimes survived in deficit in deficit Balanced Surplus Significance to (228) (336) (373) (162) ______________________________________________________________________________ Early 1995 84.1 89.5 91.5 96.3 p<0.001 Early 1996 74.7 79.4 81.7 87.0 p<0.02 Early 1997 60.1 58.9 66.5 72.8 p<0.01 Early 1998 47.1 48.6 57.5 63.7 p<0.001 Early 1999 37.5 38.0 49.4 55.9 p<0.001 October 1999 33.3 36.3 42.0 50.7 p<0.001 Significance p<0.001 p<0.001 p<0.001 p<0.001 ______________________________________________________________________________ Information on food security status was collected during first survey at the end of 1995 Table 15 Enrolment rate of the BRAC school graduates in formal schools at different time by
eligibility status for BRAC rural development programme ______________________________________________________________________________ Eligibility status of household ____________________________ Date survived to Eligible Not eligible Significance (393) (703) ______________________________________________________________________________ Early 1995 83.3 93.7 p<0.001 Early 1996 72.3 84.9 p<0.001 Early 1997 52.1 70.1 p<0.001 Early 1998 39.7 60.8 p<0.001 Early 1999 29.0 52.4 p<0.001 October 1999 24.6 47.4 p<0.001 Significance p<0.001 p<0.001 ______________________________________________________________________________ Eligible = Households with less than 50 decimals of land and at least one person sell labour more than 100 days a year; Non-eligible = others. Information on labour sale status and land was collected during first survey at the end of 1995
An attempt was taken to see the continuation rate of the children according to the
household’s eligibility status to the BRAC rural development programme (Table 14). The
children of non-eligible households were more likely to enrol in formal schools compared to
those of the eligible households. Here also the gap increased over time. Over 83% of the
children of the eligible households enrolled in formal schools after graduating from BRAC
schools in early 1995, which reduced to 24.6% by October 1999. On the other hand, the

22
enrolment rate of the children of non-eligible households reduced from 93.7% in early 1995
to 47.4% in October 1999.
Discussion Most of the non-formal education programmes run with a specific objective to teach a
specific curriculum to a specific target group. These programmes prepare the learners for
everyday life with some meaningful literacy. It is widely recognised that the non-formal
education programmes are supportive to the national literacy programmes. Thus, a general
trend is not to think about further education of the learners of these programmes. BRAC, a
Bangladeshi non-governmental organisation established a large-scale non-formal education
programme to provide quality basic education to the children of Bangladesh and to prepare
them for further education in formal schools. Studies showed that a higher proportion of
the learners of BRAC schools receive quality basic education each year (Nath et al., 1996,
1998; Nath 2000). Sometimes the performance of these schools was found better than the
formal primary schools (Nath et al., 1999). This paper explores continuation of education of
the BRAC non-formal schools graduates in formal schools. To do this a cohort of the
graduates of 1995 was observed for five years and information on enrolment and dropout
was collected. It should be mentioned that these children completed three-year curriculum
in BRAC schools established in rural Bangladesh.
The BRAC schools generally complete the course at the beginning of calendar year. After
completion of the course the respective programme organisers took the graduates to the
head teachers of the nearer formal schools to enrol them for further education. The
programme reports show that after completing three-year curriculum in BRAC schools
around 90% of the graduates do enrol in formal schools (BRAC 2000, 1997). This study
also observed similar enrolment rate among the graduates of 1995. It was observed that
equal proportion of boys and girls enrolled in schools at the beginning of their formal
schooling. This may happen because the programme organisers tried to enrol all the
graduates irrespective of sex. No gender discrimination was observed at entry level in
formal schools. However, it actually depends on other factors rather than BRAC how these
23
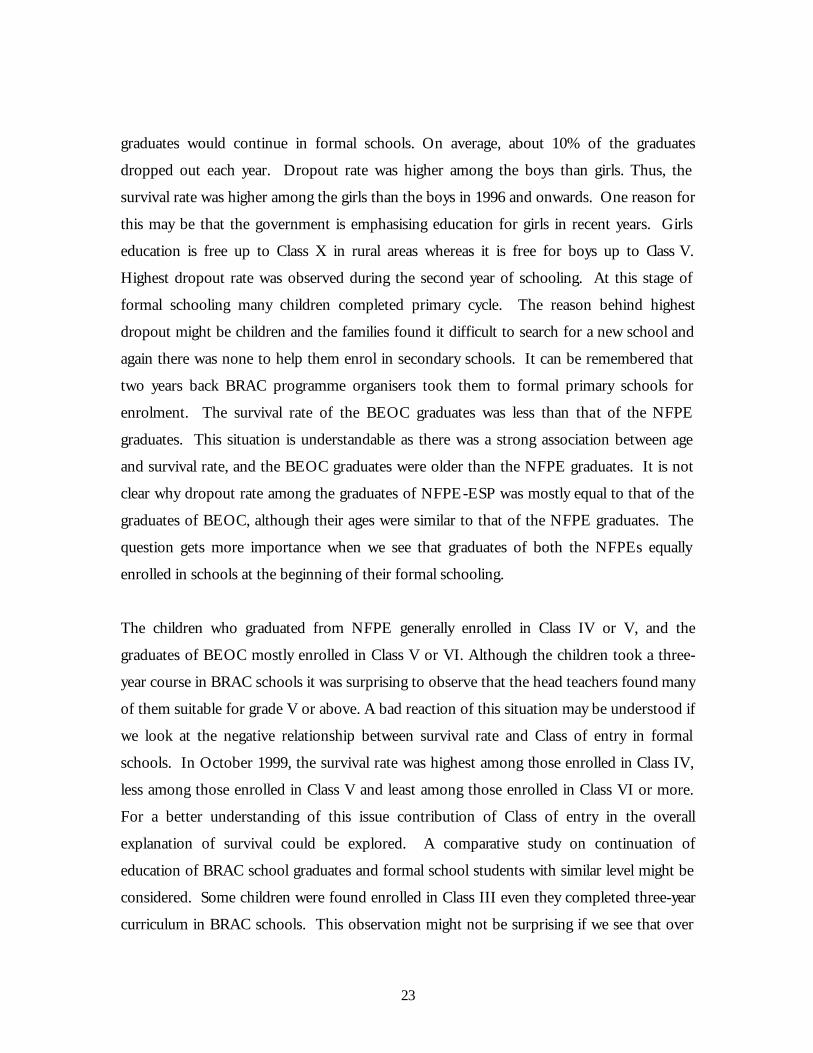
graduates would continue in formal schools. On average, about 10% of the graduates
dropped out each year. Dropout rate was higher among the boys than girls. Thus, the
survival rate was higher among the girls than the boys in 1996 and onwards. One reason for
this may be that the government is emphasising education for girls in recent years. Girls
education is free up to Class X in rural areas whereas it is free for boys up to Class V.
Highest dropout rate was observed during the second year of schooling. At this stage of
formal schooling many children completed primary cycle. The reason behind highest
dropout might be children and the families found it difficult to search for a new school and
again there was none to help them enrol in secondary schools. It can be remembered that
two years back BRAC programme organisers took them to formal primary schools for
enrolment. The survival rate of the BEOC graduates was less than that of the NFPE
graduates. This situation is understandable as there was a strong association between age
and survival rate, and the BEOC graduates were older than the NFPE graduates. It is not
clear why dropout rate among the graduates of NFPE-ESP was mostly equal to that of the
graduates of BEOC, although their ages were similar to that of the NFPE graduates. The
question gets more importance when we see that graduates of both the NFPEs equally
enrolled in schools at the beginning of their formal schooling.
The children who graduated from NFPE generally enrolled in Class IV or V, and the
graduates of BEOC mostly enrolled in Class V or VI. Although the children took a three-
year course in BRAC schools it was surprising to observe that the head teachers found many
of them suitable for grade V or above. A bad reaction of this situation may be understood if
we look at the negative relationship between survival rate and Class of entry in formal
schools. In October 1999, the survival rate was highest among those enrolled in Class IV,
less among those enrolled in Class V and least among those enrolled in Class VI or more.
For a better understanding of this issue contribution of Class of entry in the overall
explanation of survival could be explored. A comparative study on continuation of
education of BRAC school graduates and formal school students with similar level might be
considered. Some children were found enrolled in Class III even they completed three-year
curriculum in BRAC schools. This observation might not be surprising if we see that over

24
30% of the BRAC school graduates do not achieve minimum level of basic education (Nath,
2000). Probably the head teachers of formal schools did not find these children suitable for
Class IV. Let us have a look at the five-year primary cycle completion rate of the BRAC
school graduates. It was seen that 76.2% of the graduates passed at least grade five by
December 1998. Comparing this finding with national rate (72.7%) (Chowdhury et al.,
1999) it can be said that more children from BRAC schools do complete five-year cycle of
primary education than their peers in the country. After graduating from BRAC schools
nearly 5% of the graduates enrolled in Madrassas, the religious schools. It might be
interesting to see how these children cope with Madrassa situation after BRAC school
environment. Because, Madrassas put more emphasis on religious (Islamic) education,
whereas, BRAC schools bear relatively secular and progressive thoughts.
Like national survey on primary education this study also observed that ‘scarcity of money’
was one of the main causes of dropout of the BRAC school graduates. It was more
significant among the boys. Boys also dropped out due to demand of their labour for
family’s survival. Both of the causes are due to poverty. Children from poorer families
normally enrol in BRAC schools and many of them can’t continue for longer period due to
poverty. The girls did not have to face poverty so deeply because they utilised the scope of
free education policy of the government. However, many girls had to surrender to the social
norms, values and culture. Nearly 60% of the girls dropped out due to ‘marriage’. Some
girls had to face such situation immediately after completing the course in BRAC schools
and many faced it during the last five years. It can be seen in the data that many of these
girls got married before 18 years of age, the minimum legal age at marriage. At least,
schooling with BRAC could not make any impact on attitudinal change of these girls or their
families in this regard. This study also observed that socio-economic characteristics of the
graduates play significant role in their survival in formal schools. Children with lower
parental education and poorer economic background are more likely to dropout from
schools earlier than others. Similar findings also reported in a national study where children
from all walks of life were considered (Chowdhury et al., 1999).

25
Considering the underdeveloped socio-economic conditions of Bangladesh, it can be said
that a good number of BRAC school learners do enrol in formal schools after completing
BRAC course. The survival rate over the years was not so bad. However, in this study it
was not possible to see these children’s situation compared to children of other systems.
Although BRAC has little or no role to play for its graduates survival in education unless the
formal schools take right policies in this regard. Positive influence of government’s free
education policy for the girls has rightly been reflected through survival of more girls for
longer period. BRAC can help (financially or by providing textbooks and other stationaries)
those children, specially the boys who dropped out due to poverty. This may protect their
early dropout.
Acknowledgements
The author is grateful to Dr Sudhir C Sarker, Mr Sunil K Ghosh and Mr. ZA Chowdhury for
their kind help in providing valuable information on the programme. Thanks to the field
investigators for their hard work and the children and their parents for their time and co-
operation. Thank to Drs AMR Chowdhury and Sanat K Ghosh for their comments on an
earlier draft of this report and to Mr Hasan Shareef Ahmed for editorial support.
26
References
BRAC (1999). Education support programme (ESP): forming partnership in education. Dhaka: BRAC. BRAC (2000). BRAC annual report. Dhaka: BRAC. BBS (1994). Census 1991 analytical report. Vol 1. Dhaka: Bangladesh Bureau of Statistics. BRAC (1997). Annual report NFPE 1997. Dhaka: BRAC. Chowdhury AMR., Choudhury RK., Nath SR. (Eds.), (1999). Hope not complacency- state of
primary education in Bangladesh 1999. Dhaka: Campaign for Popular Education and University Press Limited.
Nath SR., Chowdhury AMR (1996). Basic competencies of the graduates of BRAC schools
of 1995. Dhaka: BRAC. Nath SR., Imam SR., Chowdhury AMR (1998). Levels of basic competencies of the BRAC
school graduates of 1995 and 1997. Dhaka: BRAC. Nath SR., Sylva K, Grimes J (1999). Raising basic education levels in rural Bangladesh: the
impact of a non-formal education programme. International Review of Education, 45, 5-26. Nath SR (2000). Basic competencies of the graduates of BRAC’s non-formal schools: levels
and trends from 1995 to 1999. Dhaka: BRAC. World Conference on Education for All (WCEFA), 1990. World declaration on education for all
and framework for action to meet basic learning needs. The Inter-Agency Commission for the World Conference on Education for All, New York.

27
Annex Tables Annex 1 Enrolment rate of the BRAC school graduates of 1995 in formal school by time and type
of BRAC school and sex ______________________________________________________________________________ BFPE BEOC NFPE-ESP Time ________________ ________________ ________________ Boys Girls Sig. Boys Girls Sig. Boys Girls Sig. ______________________________________________________________________________ Early 1995 92.4 91.4 ns 83.3 84.4 ns 87.7 90.3 ns Early 1996 78.9 85.7 ns 63.9 72.8 ns 63.7 71.5 ns Early 1997 57.8 70.9 p<0.05 46.1 57.2 p<0.05 43.6 55.6 p<0.05 Early 1998 42.7 63.4 p<0.001 32.2 45.0 p<0.01 35.2 46.4 ns Early 1999 37.8 52.0 p<0.05 27.2 36.1 ns 30.2 36.7 ns Oct. 1999 35.1 45.7 ns 26.1 32.2 ns 28.5 22.9 ns Significance p<0.001 p<0.001 p<0.001 p<0.001 p<0.001 p<0.001 ______________________________________________________________________________ Annex 2 Percentage distribution of currently enrolled graduates by type of school and year ______________________________________________________________________________ Type of school 1995 1996 1997 1998 1999 ______________________________________________________________________________ NFPE Government primary 81.0 57.7 9.0 1.3 0.3 Non-government primary 6.2 5.3 1.3 - - Other non-formal primary 0.4 0.9 0.6 - - Madrassa 5.0 4.7 10.4 10.8 12.1 Junior secondary - - - - - Government high school 0.5 1.2 2.1 3.2 2.5 Non-government high school 7.1 30.3 76.5 84.8 85.1 College - - - - - BEOC Government primary 30.8 9.0 1.3 - - Non-government primary 2.0 0.8 - - - Other non-formal primary - - - - - Madrassa 3.5 4.5 3.7 6.4 8.8 Junior secondary 0.9 - - - - Government high school 4.4 4.8 4.1 3.7 4.0 Non-government high school 58.4 80.9 90.8 89.9 85.5 College - - - - 1.7 ______________________________________________________________________________
Cont … … …
28
______________________________________________________________________________ NFPE-ESP Government primary 72.8 51.5 9.9 1.2 1.5 Non-government primary 14.7 8.5 3.3 2.4 2.4 Other non-formal primary - - - - - Madrassa 0.8 0.4 2.1 3.4 5.3 Junior secondary 0.2 0.2 0.3 - - Government high school 0.3 0.4 0.5 0.7 1.9 Non-government high school 11.3 39.0 83.9 92.3 88.3 College - - - - 0.5 ______________________________________________________________________________ Annex 3 Percentage distribution of the graduates of BRAC schools of 1995 by enrolment status at
different time period ______________________________________________________________________________ NFPE BEOC NFPE-ESP ___________ ____________ ___________ Enrolment status Boys Girls Boys Girls Boys Girls ______________________________________________________________________________ Did not enrolled 7.6 8.6 16.7 15.6 12.3 9.7 Dropped out during 1995 13.5 5.7 19.4 11.7 24.0 18.8 Dropped out during 1996 21.1 14.9 17.8 15.6 20.1 15.9 Dropped out during 1997 15.1 7.4 13.9 12.2 8.4 9.2 Dropped out during 1998 4.9 11.4 5.0 8.9 5.0 9.7 Dropped out during 1999* 2.7 6.3 1.1 3.9 1.7 3.9 Currently enrolled* 35.1 45.7 26.1 32.2 28.5 32.9 ______________________________________________________________________________ * Remember that data were last collected during early November to early December 1999, thus the status is up to October 1999.
Annex 4 Percentage distribution of graduates who did not enrolled in formal school after graduating from BRAC school by causes of non-enrolment
______________________________________________________________________________ Causes NFPE BEOC NFPE-ESP Boys Girls All ______________________________________________________________________________ School is away from home - - 3.4 - 0.2 0.1 Lack of money 40.6 46.2 52.5 58.9 36.8 42.8 School authority regretted - - 3.4 - 0.2 0.1 No use of more education 9.9 2.4 - - 9.6 7.0 Has to work at home/outside - 10.5 8.5 13.2 0.2 3.7 Graduate does not like 12.9 4.5 8.5 21.0 5.6 9.8 Insecure road transportation 9.8 - - - 8.2 6.2 Marriage 24.7 34.3 23.7 - 38.9 28.4 Disability - - - - - - Others 2.0 2.1 - 7.0 - 1.9 ______________________________________________________________________________
29
Annex 5 Percentage distribution of graduates who dropped out from formal schools by causes of dropping out
______________________________________________________________________________ Causes NFPE BEOC NFPE-ESP Boys Girls All ______________________________________________________________________________ School is away from home 0.8 0.3 - 0.2 0.9 0.7 Lack of money 40.8 32.0 38.9 66.4 24.3 38.3 No use of more education 0.7 1.7 6.1 2.3 0.6 1.1 Has to work at home/outside 5.3 7.1 6.1 11.8 2.6 5.7 Graduate does not like 6.7 7.7 12.0 15.7 2.6 7.0 Insecure road transportation 1.7 2.2 1.8 - 1.7 1.8 Marriage 41.4 44.6 33.0 - 63.6 42.4 Disability 0.7 3.0 - 1.6 - 0.5 Others 2.0 4.1 2.0 2.0 2.7 2.5 ______________________________________________________________________________