Embed Size (px)
Citation preview
Continued Process Verification : An industry position paper with example plan©BioPhorum Operations Group Ltd | April 2020 1
CONNECT COLLABORATE
ACCELERATE TMTM
CONTINUED PROCESS VERIFICATION AN INDUSTRY
POSITION PAPER WITH EXAMPLE PLAN

©BioPhorum Operations Group Ltd | April 2020 Continued Process Verification : An industry position paper with example plan 2
ContributorsThe following people were lead contributors to the content of this document, writing sections, editing and liaising with colleagues to ensure that the messages it contains are representative of current thinking across the biopharmaceutical industry. This document is a consensus view of a model CPV Plan, but it does not represent fully, the internal policies of the contributing companies.
AbbVie Mike Doremus
AstraZeneca Cynthia Ball
Baxter Joerg Gampfer
Bayer John Grunkemeier
Gallus Madeline Roche
Genzyme Lada Laenan
AstraZeneca Ranjit Deschmukh
Genentech/Roche Mark Smith
Merck Beth Junker
Novartis Christelle Pradines
GSK Dan Baker
Lonza Rajesh Beri
Merck Julia O’Neill
Novartis Abe Germansderfer
Pfizer Jeff Fleming
Regeneron Jenny McNay
Pfizer Eric Hamann Paul McCormac
Regeneron Rajesh Ahuja
Shire Bert Frohlich
Additionally, excellent editorial support and constructive criticism was provided by:
The work was facilitated by Darren Whitman and Robin Payne of BioPhorum Operations Group.
Though this paper is issued under copyright, © 2014, Biophorum Operations Group, it is intended to be readily accessed
across the industry, free of charge and can be accessed from the BioPhorum website at the following address:
www.biophorum.com/download/cvp-case-study-interactive-version/
When citing this paper, please use the following form:
BioPhorum, 2014, Continued Process Verification: An Industry Position Paper with Example Plan
© 2014, Biophorum Operations Group
Redesigned in line with new brand guidelines April 2020
©BioPhorum Operations Group Ltd | April 2020 Continued Process Verification : An industry position paper with example plan 3
SUMMARY
Executive summaryThis paper is a response to US Food and Drug Administration (FDA) 2011 process validation guidance on Stage 3, ‘Process Validation: General Principles and Practices’5. It describes the approach commonly referred to as ‘Continued Process Verification’ (CPV). As one might expect, manufacturers in the biopharmaceutical sector all wish to respond to this guidance appropriately. A group of 20+ companies felt it would be valuable to work on this topic together, using the facilitation services of the BioPhorum Operations Group (BPOG) (www.biophorum.com). This paper is one of the results of the collaborative effort. It is written as a consensus view of an acceptable CPV program, but it does not fully represent the internal policies of the contributing companies. It is a basis upon which to build and share knowledge further across the industry. The authors believe this is one of the first comprehensive papers on this topic.
The paper seeks to provide practical developments on the themes: what is CPV, why is it
important, and how might it be implemented. It offers some specific recommendations on the
content of a CPV Plan, along with associated rationale. These recommendations are based on
a typical cell culture production process for making a fictitious monoclonal antibody product,
described in the ‘A-Mab Case Study’3. Consequently, not all of the details contained in this
paper are going to apply directly to actual products or processes. The authors recognize that
the A-Mab Case Study represents only one industry archetype, and that there are a number
of others that are important. However, the concepts and principles upon which the content
of this paper was derived should help with CPV implementation for a real product. Some of
the complications of implementation are addressed, with recommended approaches, but the
issue of information technology (IT) systems is not dealt with directly here. The case for IT
systems, their design and introduction, is the subject of other collaborative efforts facilitated
by BPOG and some of the results of that work may be published in the future.

©BioPhorum Operations Group Ltd | April 2020 Continued Process Verification : An industry position paper with example plan 4
CPV is fundamentally a formal means by which a
commercial manufacturing process is monitored to
ensure product quality. It encompasses a written plan for
monitoring a licensed biopharmaceutical manufacturing
process, as well as regular reporting and actions based
on the results of monitoring the process. CPV reporting
provides a basis from which to improve process
understanding, risk assessment, the control strategy
(CS) [9], and ultimately the process itself. In general, the
nature and extent of CPV is aligned with the outcomes of
process qualification. Whilst a CPV Plan is likely to include
data related to Batch Release (BR), and so may be useful
in supporting BR decisions, CPV operates independently
from the BR process and is not expected to have any
impact on batches that have been previously released.
Adopting or building on an existing system of monitoring
manufacturing process performance means more data
will be collected over the lifetime of the product. CPV
execution may involve examination of existing process
control measurements and improved methods for data
tracking and analysis. Enhanced monitoring of process
performance provides the opportunity to identify and
control sources of variation and hence improve process
robustness, offering the major benefit of reliable supply to
the market.
One of the main technical issues to resolve when
implementing CPV relates to the quantity of data required
before product commercialization. In a sense, CPV
complements the ‘Quality by Design’ (QbD) framework
that manufacturers have developed to license and
commercialize the product, though a CPV Plan may be
constrained to data available in manufacturing. It should
be noted that not all products will have a QbD framework
but all need a CPV Plan. Also, at the time of commercial
product introduction, there is unlikely to be a statistically
robust set of data at the scale of commercial manufacture.
To manage this situation in practice, it is recommended
that short term control criteria are set initially, based on
prior process experience and including data acquired at
the laboratory and clinical scales of manufacture. This
initial period of production would then be used to establish
longer term criteria that are more statistically appropriate.
The implementation and ongoing execution of a CPV
Plan is likely to require additional effort, beyond what is
typically needed to prepare for the Annual Product Review
(APR), because significant amounts of additional data
are collected and analyzed to improve understanding of
process variability. However, it is likely that the benefits
accruing from the improved information available for
process improvement will outweigh any additional costs.
The actual additional cost depends on the amount of data
to be analysed which in turn depends on the outcomes
of quality risk assessments that define data collection
scope and frequency. The frequency of collection depends
on several factors, including: whether production is
campaigned or continuous; the extent of variability
apparent in the process; whether risks to product quality
(and thus product disposition) and process consistency are
sufficiently mitigated, and the intended use of the reported
data (for example, use in continuous improvement may
mean collecting and analyzing certain data on a daily
basis).
Given the importance of CPV in both compliance and
process improvement terms, the authors encourage
executives to read and share this paper with their
colleagues. The authors also welcome any comments or
questions arising which can be submitted via the following
email address: [email protected].

©BioPhorum Operations Group Ltd | April 2020 Continued Process Verification : An industry position paper with example plan 5
ContentsContents ............................................................................................................................................................................................................ 5
1.0 Purpose ................................................................................................................................................................................................ 7
2.0 Scope .................................................................................................................................................................................................... 9
3.0 Roles and responsibilities..............................................................................................................................................................10
4.0 CPV plan references .....................................................................................................................................................................12
5.0 Product and process description ................................................................................................................................................13
5.1 Brief description of the general approach used in the A-Mab case study ................................................................... 14
5.2 Parameters to be included in CPV .......................................................................................................................................... 15
5.3 Upstream process overview ..................................................................................................................................................... 16
5.4 Downstream process overview ............................................................................................................................................... 17
5.5 Identification of CQAs and acceptance ranges ................................................................................................................... 18
5.6 Process parameter characterization ...................................................................................................................................... 20
5.7 Control strategy CQAs and CPPS ........................................................................................................................................... 22
6.0 Developing a monitoring strategy ..............................................................................................................................................23
6.1 Rationale and background ........................................................................................................................................................ 23
6.2 Hypothetical scenarios and planned process changes ...................................................................................................... 24
7.0 CPV plan recommendations for the A-Mab process ..............................................................................................................28
7.1 Step 1, seed culture expansion in disposable vessels – CPV recommendations ....................................................... 29
7.2 Step 2, Seed Culture Expansion in Bioreactors – CPV Recommendations ................................................................ 30
7.3 Step 3, Production Culture Bioreactor – CPV Recommendations ............................................................................... 31
7.4 Step 4, Clarification (centrifugation and depth filtration) – CPV recommendations .............................................. 35
7.5 Step 5, Protein A Chromatography – CPV recommendations ........................................................................................ 36
7.6 Step 6, Low pH treatment – CPV recommendations ......................................................................................................... 37
7.7 Step 7, Cation Exchange Chromatography (CEX) – CPV recommendations ............................................................. 39
7.8 Step 8, Anion Exchange Chromatography (AEX) – CPV recommendations ............................................................... 40
7.9 Step 9, Small Virus Retentive Filtration (SVRF) – CPV recommendations ................................................................. 42
7.10 Step 10, Ultrafiltration and Diafiltration (UF/DF) – CPV recommendations ............................................................. 43
7.11 Step 11, Final Filtration and Freezing of BDS – CPV recommendations ..................................................................... 45
7.12 Bulk Drug Substance Lot Data – CPV recommendations ................................................................................................. 47
8.0 Frequency and scope of CPV analysis .......................................................................................................................................49
8.1 Scope of CPV Analysis .............................................................................................................................................................. 49
8.2 Frequency of Analysis ................................................................................................................................................................. 50
9.0 Establishing control limits ...........................................................................................................................................................51

©BioPhorum Operations Group Ltd | April 2020 Continued Process Verification : An industry position paper with example plan 6
10.0 Example CPV execution plan for drug substance ...................................................................................................................53
10.1 Step 1, Seed culture expansion in disposable vessels – CPV variables ....................................................................... 57
10.2 Step 2, Seed culture expansion in bioreactors – CPV variables .................................................................................... 58
10.3 Step 3, Production culture bioreactor – CPV variables .................................................................................................... 59
10.4 Step 4, centrifugation and depth filtration – CPV variables ........................................................................................... 62
10.5 Step 5, Protein A chromatography – CPV variables .......................................................................................................... 63
10.6 Step 6, Low pH treatment – CPV variables .......................................................................................................................... 64
10.7 Step 7, Cation exchange chromatography – CPV variables ............................................................................................ 65
10.8 Step 8, Anion exchange chromatography – CPV variables .............................................................................................. 66
10.9 Step 9, Small virus retentive filtration – CPV variables ................................................................................................... 68
10.10 Step 10, Ultrafiltration and diafiltration – CPV variables ................................................................................................ 68
10.11 Step 11, Final filtration/Bulk fill and freezing of BDS – CPV variables ........................................................................ 70
10.12 CPV monitoring of bulk drug substance lot data ................................................................................................................ 71
11.0 CPV sampling plan ..........................................................................................................................................................................73
11.1 Template for specific process steps ...................................................................................................................................... 76
12.0 How data will be analyzed ...........................................................................................................................................................80
12.1 Identifying software .................................................................................................................................................................... 80
12.2 Description of tools to trend and evaluate data ................................................................................................................. 81
12.3 Process capability index ............................................................................................................................................................ 82
12.4 Control charts ............................................................................................................................................................................... 84
12.5 Multivariate data analysis ......................................................................................................................................................... 86
12.6 Responses to shifts and trends ................................................................................................................................................. 87
12.7 Establishing initial limits ............................................................................................................................................................ 88
12.8 Establishing long-term limits .................................................................................................................................................... 88
12.9 Finding signals of special cause variation ............................................................................................................................. 89
13.0 Change management ....................................................................................................................................................................90
14.0 Dataverification ..............................................................................................................................................................................93
Discretionary elements of a CPV program .............................................................................................................................................95
References ......................................................................................................................................................................................................96
Glossary ...........................................................................................................................................................................................................97

©BioPhorum Operations Group Ltd | April 2020 Continued Process Verification : An industry position paper with example plan 7
1.0
PurposeThis document is written with the aim of providing a technical, non-binding, industry consensus response to regulatory guidance. It is not in itself guidance. The objective of this paper is to provide:
(1) an example of key portions of a Continued Process Verification (CPV) plan for a biologics process; (2) relevant industry thinking on CPV plan development and implementation.
This document is different from others on this subject1, 2
because it is specific to a biologics manufacturing process
and provides a comprehensive case-study lifecycle
view that leverages antibody manufacturing process
development, as described in the A-Mab Quality-by-
Design case study3. It is worth the reader being familiar
with the A-Mab case study and perhaps having a copy
available for reference. It should be recognised that
the monoclonal antibody process is just one archetype
in the industry, though it is a useful one upon which to
demonstrate principles, as it is known to many.
The example of a CPV plan shown in this paper describes
how to meet expectations5 for routine monitoring
of critical process parameters (CPPs), critical quality
attributes (CQAs), key process attributes (KPAs) and key
process parameters (KPPs) to demonstrate the state of
control over the manufacturing process. N.B. at the time
of writing, the European Medicines Agency (EMA) draft
guidance on Process Validation is out for consultation,
referring to KPAs as 'performance indicators'. The thought
processes and examples presented in this document
are backed by biotech industry experience with, subject
matter expertise in process monitoring for monoclonal
antibody and similar manufacturing processes.
Furthermore, this document describes the thought
processes that determine the content for a CPV plan. The
plan serves as the procedure governing document for the
implementation and maintenance of CPV for a licensed
manufacturing process. Various parts of the plan are
described in the following sections of the document, as
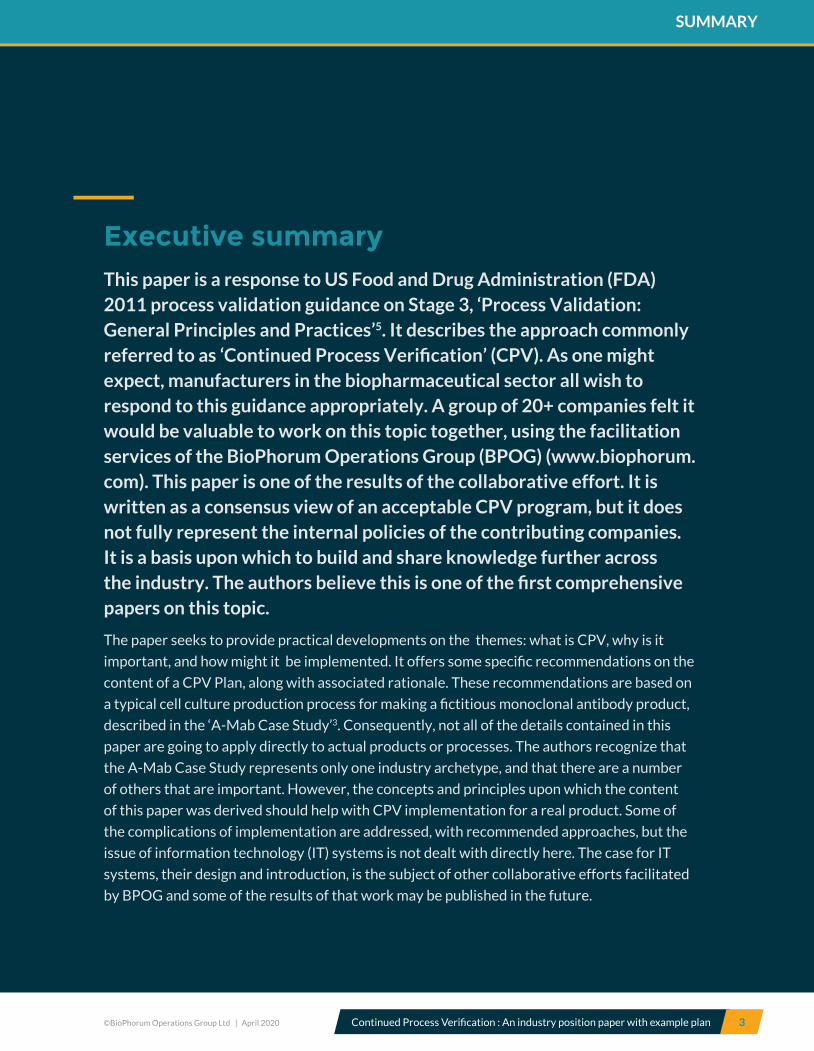
noted in Table 1.1 overleaf:
©BioPhorum Operations Group Ltd | April 2020 Continued Process Verification : An industry position paper with example plan 8
General topic section Section
number/title
Description
Manufacturing Process 5 Summary of the A-Mab manufacturing process and the A-Mab product description.
6 Selection of the process monitoring sampling plan backed by the process validation Phase I and II
data and the updated risk assessment.
7 The rationale for classification of quality-linked process parameters summarized in the A-Mab
case study is reviewed and summarized in the table that presents process performance
consistency and robustness. Rationale for what to include in CPV is provided, based on a
review and analysis of quality-linked process parameters from the A-Mab case study that
affect process performance, consistency and robustness.
Verification process 8 The frequency of CPV data analysis and trend review is discussed. The concept of an initial
or short-term CPV phase is introduced, where sufficient process experience is collected
to establish the manufacturing control limits for the process attributes identified during
validation. A subsequent phase of CPV implementation; that of steady state or long-term
process monitoring is also discussed.
9 Statistical and general methods for establishing CPV trend limits are presented.
10 The summary of the monitored attributes and parameters within the scope of the CPV program
are presented. The monitoring method and periodicity associated with specific attributes and
parame ters are also specified.
11 The sampling plan derivation with tabulated examples.
12 Aspects of data analysis and evaluation of results are discussed in this section. The emphasis is on
the possible outcomes of routine monitoring.
13 Change management and the impact of CPV on this process.
14 The specific need for data verification.
15 Elements of CPV that are considered discretionary.
Table 1.1: Plan parts referenced by section number

©BioPhorum Operations Group Ltd | April 2020 Continued Process Verification : An industry position paper with example plan 9
2.0
ScopeConsistent with the FDA’s 2011 Process Validation guidance document5 describing three stages of the product lifecycle, CPV implementation discussed in this paper is limited to Stage 3, commercial manufacture of a drug substance, following process design (Stage 1) and process qualification and qualification of the equipment and the facility (PQ, Stage 2, see FDA 2011 Guidance Stage 24) 12.
Note: Whilst this paper focuses on the drug substance
manufacturing process, CPV should be applied all areas of
Operations including formulation, fill and finish.
The application of the principles discussed in this
document BioPhorum is initiating collaborative work,
specifically focused for new products relies on product
and process development on CPV for established, licensed
(or legacy) products and the and characterization studies
(Stage 1) to define the scope resulting recommendations
may be published in the future. of the CPV program. This
document is based on the CS An ISPE group produced an
article covering this broadened presented in the A-Mab
bioprocess development case scope in 201224; here we
believe we address a reduced study and is primarily
focused on the commercialization of scope in greater
detail, providing deeper development of a a new product.
However, the proposed approach for CPV model CPV
Plan. implementation is also applicable to legacy products
where quality attributes and parameters for monitoring
can be determined based on a combination of process
knowledge and historical performance data.
BioPhorum is initiating collaborative work, specifically
focused on CPV for established, licensed (or legacy)
products and the resulting recommendations may be
published in the future. An ISPE group produced an article
covering this broadened scope in 201224; here we believe
we address a reduced scope in greater detail, providing
deeper development of a model CPV Plan.
©BioPhorum Operations Group Ltd | April 2020 Continued Process Verification : An industry position paper with example plan 10
3.0
Roles and responsibilitiesThe roles and responsibilities suggested here as examples, are based upon a typical organizational structure of a biopharmaceutical manufacturing company (Table 3.1.).
Several primary functional areas have important
responsibilities required to successfully execute the CPV
program. These areas are: Development, Validation,
Operations, Quality Control, Quality Engineering and
Quality Assurance. Operations, a function which may also
be known as Technical Operations, is assumed to contain
Manufacturing as well as Manufacturing Science and
Technology personnel. Mathematical sciences or
non-clinical statistics support is of paramount importance
in achieving sound data interpretation. Each functional
area has responsibility for specific activities, as shown in
Table 3.1.
Outputs of the CPV program can be used by the
Regulatory Affairs and Quality organizations for annual
agency updates, such as the Annual Product Review (APR)
and Product Quality Review (PQR). Terminology for each
function may vary by organization.
Note: The responsibilities for continued process monitoring
should be clearly defined within the organization and recorded
in the CPV Plan. Responsibilities can be tailored to a specific
organizational structure, given its maturity and size.

©BioPhorum Operations Group Ltd | April 2020 Continued Process Verification : An industry position paper with example plan 11
Table 3.1: Roles and Responsibilities for a CPV Program:
Functional area Responsibility
Management • Ensure that adequate resources are available to carry out the CPV program and to regularly
perform a review of CPV plan summaries or reports.
Development • Provide documentation that defines current process knowledge, quality attributes, process
parameters and elements of the overall CS that forms the basis for the CPV program.
• Provide documented scientific justification for parameters, limits, ranges and elements of the
CS, based upon development studies or other prior knowledge.
• Provide technical input to develop response actions, including input in prioritization of
continuous improvement activities.
• Consider application of CPV outcomes to new processes in development.
Validation/ Quality functions • Provide internal advice on current validation principles and ensure that validation protocols,
interim and final reports meet applicable standards.
• Participate in cross-functional teams to review production and QC data as part of the CPV
program.
• Review the data, pursue appropriate investigations and make decisions on how to proceed.
• May generate CPV plans and summary reports.
• Review and approve CPV plan, CPV reports and any changes to the CPV plan.
Operations/Manufacturing
Science and Technology
(N.B. It is not unusual for a Manufacturing Science
and Technology function to be independent
of Operations and Quality organisations. An
alternative arrangement may be
reporting into Process Sciences.)
• Own the manufacturing process and take responsibility to ensure that it is maintained in a
state of control throughout the product lifecycle in manufacturing.
• Ensure that all required production and process data are collected as part of executing the
CPV plan for the product.
• Performs continued process monitoring activities, including collecting, entering, verifying,
reviewing and analyzing process data.
• Generate control charts and document CPV analysis for process data.
• Regularly participate in cross-functional teams in order to review production and QC data
as part of the CPV program.
• Maintain the process commercial master batch production and control records up to date,
capturing continuous improvements resulting from CPV in documentation as necessary.
Quality Control • Perform quality control testing and document results that are used in CPV evaluations.
• Perform continued process monitoring activities, including collecting, entering, verifying, reviewing
and analyzing QC data.
• Generate control charts and document CPV analysis for QC data.
• Participate in cross-functional teams to review production and QC data as part of the CPV program.
Quality Engineering/Mathematical Sciences/
Non Clinical Statistics
• Provide internal advice on statistical analyses needed to successfully complete CPV activities.
• Act as a Subject Matter Expert (SME) and train personnel in other groups on statistical data
analysis techniques used in CPV.
• Provide internal advice on how to develop the data collection plan and help select suitable
statistical methods and procedures that are used to measure and evaluate the process
stability and capability.
• Generate procedures that define the way statistical tools and approaches are to be used in
routine process monitoring.
• Provide guidance on how to set control limits and define and interpret signal criteria.
Quality Assurance • Review and approve CPV plans and reports.
• Review and approve the list of attributes and parameters to be monitored, and control
chart limits.
• Participate in cross-functional data review to review production and QC data as part of
the CPV program.
• Review CPV reports and establish where signals require formal non-conformance
investigations.
• Coordinate assembly of CPV program reports.

©BioPhorum Operations Group Ltd | April 2020 Continued Process Verification : An industry position paper with example plan 12
4.0
CPV plan references The following references are expected to be created in the quality management system and are important when constructing a CPV plan, providing background and critical internal interpretation of regulatory guidance. They should be referenced accurately in a CPV Plan document. Note, a CPV Plan is expected to be product and process specific. It may be advantageous to develop corporate policies and this forms the basis for some of the list of references that follows.
• Quality Policy, Manual or Master Plan on CPV
• Company Standard/Guideline for CPV
(requirements for CPV, for e.g. timing, relationship
to APRs, etc)
• SOP on CPV (Definitions, Abbreviations, responses
to deviations, report generation, etc)
• SOP on Statistical Methods for trending, statistical
analysis and identifying special cause variations
• Template for CPV Plan
• Template for CPV Charts & Graphs
• Template for CPV Report
• Manufacturing process description
• Control Strategy for the process (version number)
• Process risk assessment (version number)
• Applicable Risk assessment(s) (version number)
providing basis for rationale of CPV monitoring
selection
• Previous annual product report(s) if available,
otherwise consider evidence for a similar product*.
Technical references relevant to the detailed sections of
this paper are provided in section 16. References 1 to 9 are
recommended as initial texts when creating or updating a
CPV plan.
*The authors recognize that the plan illustrated in this paper
is written largely with CPV for new products in mind and that
there would not be APRs available at the point of product
licensure. This bullet point is included as a reminder that
historic APRs would provide data for the creation of a CPV plan
where established, licensed or legacy products are concerned.

©BioPhorum Operations Group Ltd | April 2020 Continued Process Verification : An industry position paper with example plan 13BPOG Continued Process Verification: An Industry Position Paper With Example Plan – Page 13
5.0
Product and process description The A-Mab case study describes a model Quality by Design (QbD) approach for development of a monoclonal antibody (A-Mab)3,6. Considering the FDA process validation guideline5, the case study includes work covered during Stage 1 (Process Design) but does not include information on Stage 2, Process Performance Qualification (PPQ)5.
In preparing this CPV example plan, it is assumed that
Stage 2, was completed successfully for the A-Mab
process. The plan described applies to Stage 3 of the
process validation lifecycle.
Note: Whilst a QbD approach could be said to provide was
completed successfully for the A-Mab process. The plan
advantages in terms of process understanding, it is not an
described applies to Stage 3 of the process validation lifecycle.
approach that has to be applied. However, it is necessary to
have a CPV Plan for each product, even if a QbD approach has
not been applied.

©BioPhorum Operations Group Ltd | April 2020 Continued Process Verification : An industry position paper with example plan 14
PPQ CPV CPV
TTP QTTP CQA CCP
EQ
ProvenAcceptable
Ranges(Design Space)
Covered in A-Map Study
Short-termPlan
Long-termPlanDevelopment of Control Strategy
PV Stage 2 PV Stage 3PV Stage 1
Figure 5.1.2. Process flow of a QbD based product development according to ICH Q8, 9, 10, 11 and FDA PV guideline January 2011.
Principles outlined in the ICH guidelines Q8, Q9, Q10 and
Q117-9, 22 provide the basis for the methodology used for
this case study, even though Q11 was published after the
A-Mab case study.
One principle of a QbD approach is to develop a Target
Product Profile (TPP). As a natural extension of a TPP, a
Quality Target Product Profile (QTPP) is built to describe
quality characteristics (attributes) of the drug product.
The process of systematic development follows a general
roadmap that includes the following steps:
• Identification of Quality Attributes (QA)
based on a QTPP;
• Risk Evaluation to identify CQAs;
• Upstream/ downstream/ drug substance and
product development;
• Risk based approaches and potentially,
multivariate analyses25 (see Section 12.5 for a
description of multivariate analysis), to classify
process parameters and other variables linked
to product quality (e.g. identification of Critical
Process Parameters, CPPs);
5.1 Brief description of the general approach used in the A-Mab case study
• Univariate and multivariate approaches to define
Proven Acceptable Range (PARs) or limits;
• Rational approach to define a CS that reflects
product/ process knowledge and risk mitigation;
• Process (and Equipment) Performance
Qualification to verify the CS established in Stage 1
of development.
• Facility design qualification of Stage 25.
In creating this CPV plan it is assumed that all deliverables
up to establishment of a CS and PQ are available based on
the work described in the A-Mab study (see Figure 5.1.2 /
green boxes). For the A-Mab process, it is assumed that
PPQ was completed successfully, after investigating and
resolving deviations.
PPQ and Equipment Qualification (EQ) are part of Stage
2 and are therefore presumed to have been completed
before Stage 3 where CPV guidance applies. They are a
pre-requisite for Stage 3 CPV. See guidance for Industry5.

©BioPhorum Operations Group Ltd | April 2020 Continued Process Verification : An industry position paper with example plan 15
5.2 Parameters to be included in CPVAll types of parameters should be considered for inclusion
in CPV. Typically those included will be weighted more in
favor of CPPs and WC-CPPs because of their importance
to the control strategy, but non-critical “key” and general
parameters should not be overlooked if they are indicative
of process performance and/or measurably impact process
variation. Parameters to be included should be based on
the current understanding of the manufacturing process
and may be subject to change over time.
Parameter types described in A-Mab study are as follows: (1) Critical Process Parameter (CPP) and (2) Well-
Controlled Critical Process Parameter (WC-CPP): CPPs
and WC-CPPs are process parameters whose variability
impact a critical quality attribute and should be monitored
or controlled to ensure the process achieves the required
product quality.
• A WC-CPP has a lower risk of falling outside the
specified limits.
• A CPP has a higher risk of falling outside the
specified limits.
The assessment of risk is based on a combination of factors
that include severity of impact to quality, equipment
design considerations, process control capability
and complexity, the size and reliability of the proven
acceptable range and/or design space, ability to detect/
measure a parameter deviation, etc.
(3) Key Process Parameter (KPP): An adjustable
parameter (variable) of the process that ensures
operational reliability when maintained within a
narrow range. A key process parameter does not affect
critical product quality attributes but rather impacts
process consistency.
(4) General Process Parameter (GPP): An adjustable
parameter (variable) of the process that does not have
a meaningful impact on product quality or process
performance.
Typically the parameters included in CPV will be weighted
more in favor of CPP and WC-CPP because of their
importance to the control strategy. But, non-critical “key”
and general parameters should not be overlooked as
they may be indicative of process performance and/or
measurably impact process variation. Definitions of A-Mab
terms used to define categories of process parameter are
provided in a Glossary at the end of this document.
Note: Throughout this paper the A-Mab classification of
process parameters is used for consistency with the structure
of that case study, but it must be recognised this is not the
only scheme used in the industry; a situation arising in part
no standard approach is recommended by the regulators.
Consistency with ICH Q8 and Q11, where definitions exist
seems prudent. A recent informal communication by FDA/
EMA counseled against using “key parameter” for describing
lower levels of criticality in formal submissions and stated that:
‘all parameters potentially impacting product quality should be
classified as critical process parameters’23. The use of KPPs in
internal systems and documentation seems not to contravene
this statement.
In general, it is the responsibility of the biopharm company
to establish a categorization and nomenclature fitting with
their development approach and risk evaluation tools. The
company’s approach should be clearly explained and followed
over the life cycle of the product.

©BioPhorum Operations Group Ltd | April 2020 Continued Process Verification : An industry position paper with example plan 16
5.3 Upstream process overviewThe upstream commercial manufacturing process for A-Mab comprises 4 steps and is summarized below and in Figure 5.4.
The A-Mab cell culture process uses a proprietary, chemically defined, basal medium formulation. The medium is essentially
protein free with recombinant human insulin (1 mg/mL) being the only protein component added. The growth medium also
contains 1 g/L pluronic and 50 nM methotrexate, which are added up to the N-2 seed bioreactor. The N-1 and production
bioreactor steps do not contain methotrexate.
Figure 5.4: Upstream process flow diagram. [Adapted from A-Mab case study, Page 62 (Figure 3.1)]
ThawWorking Cell Bank
Seed Culture Expansionin disposable shake flasks
and/or bags
Seed Culture Expansionin fixed stirred tank reactors
N-1 Seed Culture Bioreactor3000L WV
Production Bioreactor15,000 L WV
HarvestCentrifugation & Depth Filtration
Clarified bulk
Step 4
Step 3
Step 2
Step 1
Nutrient feed
Glucose feeds
Seedmaintenance
Seedmaintenance
Seed cultures are expanded through multiple passagesby increasing the volume and/or number of disposableculture vessels. Seed cultures may be maintained foradditional culture passages or used to generateadditional inoculums trains.
Additional seed expansion in fixed stirred tankbioreactors. Cultures obtained from Step 1 areexpanded to increase the volume of culture to meet thetarget initial cell density for the production bioreactor.
Production bioreactor is inoculated with the seedculture prepared in Step 2 to achieve an initial ViableCell Concentration (VCC) and is cultivated atcontrolled conditions for temperature, pH anddissolved oxygen (DO). A bolus addition of nutrientfeed (NF-1) and multiple discrete glucose feeds areused to maintain the glucose concentration at > 1.0g/L. Antifoam solution is used for foam control ofthe agitated mixture. VCC, culture viability andresidual glucose concentration are monitoredperiodically. The fermentation reaction produces amixture containing the A-Mab drug substance.
Cultures are clarified by a primary continuouscentrifugation step using a disk-stack centrifuge toremove the bulk of suspended cells and cell debris.A secondary clarification using a depth filtrationsystem removes remnant solids and smaller debris toprovide a clarified bulk solution of A-Mab.

©BioPhorum Operations Group Ltd | April 2020 Continued Process Verification : An industry position paper with example plan 17
5.4 Downstream process overviewThe downstream manufacturing process for A-Mab comprises 7 steps which are summarized in Figure 5.5.
The downstream process captures A-Mab from the clarified bulk and purifies the antibody by a combination
of chromatography unit operations11. Also included in the process are two orthogonal steps dedicated to virus
inactivation and removal. The antibody is formulated through an Ultra-Filtration/Dia-Filtration (UF/DF) step
to a composition and concentration suitable for drug product manufacturing. The formulated product is 0.2 μm
filtered, filled into the appropriate storage containers and stored frozen.
Figure 5.5: Downstream process flow diagram. [Adapted from A-Mab case study, Pages 113 (Figure 4.1) and 114 (Table 4.1)]
Step 5Protein A Affinity Chromatography
Step 6Low pH Incubation
Step 7Cation Exchange Chromatography
Step 8Anion Exchange Chromatography
Step 9Small Virus Retentive Filtration
Step 11Final Filtration, Fill and Freeze
Clarified Purpose
Purpose of step
• Capture monoclonal antibody from clarified harvest liquid• Removal of process-related impurities (HCP, DNA and small molecules)
Step 10Formulation:
Ultrafiltration and Diafiltration A
A-Mab drug substance
• Inactivate enveloped viruses that are potentially present in therapeutic protein products derived from mammalian cell culture
• Reduce aggregate to acceptable levels for drug substance• Reduce HCP to acceptable levels for subsequent processing by AEX chromatography
• Remove HCP, DNA, Protein A and endotoxins to levels that meet drug substance acceptance criteria• Virus removal
• Removal of small parvoviruses such as minute virus of mice (MVM) and larger viruses such as murine leukemia virus (MuLV), potentially present in product derived from mammalian cell culture
• Formulation and concentration of mAb to drug substance specifications (e.g. 75 g A-Mab/L)
• Sterilize filtration and dispensing for drug substance storage

©BioPhorum Operations Group Ltd | April 2020 Continued Process Verification : An industry position paper with example plan 18
5.5 Identification of CQAs and acceptance rangesTable 5.6.1 provides the QTPP of the A-Mab drug product, as defined in the A-Mab case study. The QTPP describes
quality characteristics (attributes) that the drug product should possess in order to reproducibly deliver the therapeutic
benefit promised in the label. Attributes in the red box are determined during Drug Substance (DS) manufacturing.
Therefore, these attributes guide determination of DS CQAs22 relevant for establishing a CPV strategy.
Table 5.6.1: QTPP for A-Mab (reference 3, Page 180). DS relevant product attributes are marked with a red box
Product attribute Target
Dosage form Liquid, single use
Protein content per vial 500mg
Dose 10mg/kg
Concentration 25mg/mL
Mode of administration IV, diluted with isotonic saline or dextrose
Viscosity Acceptable for manufacturing, storage and delivery without the use of special devices (for example, less
than 10 cP at room temperature
Container 20R type 1 borosilicate glass vials, fluro-resin laminated stopper
Shelf life ≥ 2 years at 2–8°C
Compatibility with manufacturing process Minimum 14 days at 25°C and subsequent 2 years at 2–8°C, soluble at higher concentration
during UF/DF
Biocompatibility Acceptable toleration on infusion
Degradants and impurites Below safety threshold, or qualified
Pharmacopeial compliance Meets pharmacopoeial requirements for parental dosage forms, colorless to slightly yellow, practically
free of visible particles and meets USP criteria for sub-visiable particles
Aggregate 0–5%
Fucose conent 2–13%
Galactosylation (%G1+%G2) 10–40%
HCP 0-100 ng/mg
The DS QAs related to the QTPP are identified as summarized in Table 5.6.2. Criticality Analysis was performed using a risk
ranking approach (as in ICH Q98) and CQAs were identified as attributes of high or very high risk regarding their potential
impact on patient safety.

©BioPhorum Operations Group Ltd | April 2020 Continued Process Verification : An industry position paper with example plan 19
The product quality attributes and the points where they are impacted in the A-Mab drug substance process are
summarized in the Table 5.6.2 below.
Table 5.6.2: A-Mab drug substance Product Quality Attributes and the points where they are impacted in the process (see A-Mab Case Study (3), Section 2.3.2,
Page 29). BDS is Bulk Drug Substance, DP Drug Product and IPC in-process control.
“Pro
du
ct Q
ual
ity
Att
rib
ute
s”
Raw Material
Controls
Steps 1 & 2: Seed
Culture Expansion
Step 3: Production
Bioreactor
Step 4:
Centrifugation and
Clarification
Step 5: Protein A
chromatography
Step 6: Low pH
treatment
Step 7: CEX
chromatography
Step 8: AEX
chromatography
Step 9: Nano-
filtration (SVRF)
Step 10: Ultra-
filtration (UF/DF)
Step 11: Final
filtration and
freezing
BDS or DP testing for
this CQA?
Iden
tity
Form
Form
BD
S, D
P
Pro
tein
co
nce
ntr
atio
nFo
rmA
lter
Alt
erA
lter
Alt
erA
lter
DP
IPC
AD
CC
act
ivit
yFo
rmD
P
SEC
mo
no
mer
Form
BD
S, D
P
SEC
Agg
rega
tes
Form
Rem
ove
Form
Rem
ove
Rem
ove
Form
Form
Form
BD
S, D
P
Co
lor
Intr
od
uce
Alt
erA
lter
DP
Cla
rity
& s
ub
-vis
ible
par
ticl
esIn
tro
du
ceA
lter
Rem
ove
Rem
ove
DP
Dea
mid
ated
iso
form
sFo
rmR
emov
eR
emov
eR
emov
eB
DS,
DP
oth
er A
cid
ic v
aria
nts
Form
Rem
ove
Rem
ove
Rem
ove
BD
S, D
P
Ch
arge
var
ian
tsFo
rmR
emov
eR
emov
eR
emov
eB
DS,
DP
“Olig
osa
cch
arid
es:
afu
cosy
late
d g
lyca
ns
gala
cto
syla
ted
gly
can
s”
Form
“Gly
cosy
lati
on
rel
ated
:
sial
ic a
cid
co
nte
nt,
man
no
se c
on
ten
t,
no
n-g
lyco
syla
ted
hea
vy c
hai
n”
Form
Osm
ola
lity
Alt
erD
P IP
C
pH
Alt
erA
lter
Alt
erA
lter
Alt
erA
lter
DP
IPC
Met
ho
trex
ate
Intr
od
uce
Intr
od
uce
Rem
ove
Rem
ove
Rem
ove
no
n-
rou
tin
e
An
tifo
am C
Intr
od
uce
Intr
od
uce
Rem
ove
Rem
ove
no
n-
rou
tin
e
Pro
tein
A li
gan
dIn
tro
du
ceIn
tro
du
ceR
emov
eR
emov
eR
emov
e
Ho
st C
ell P
rote
in (H
CP
)Fo
rmFo
rmR
emov
eR
emov
eR
emov
eR
emov
en
on
-
rou
tin
e
DN
AFo
rmFo
rmR
emov
eR
emov
e
Bio
bu
rden
Intr
od
uce
Intr
od
uce
Intr
od
uce
Intr
od
uce
Intr
od
uce
Intr
od
uce
Intr
od
uce
Intr
od
uce
Intr
od
uce
Rem
ove
DP
En
do
toxi
nIn
tro
du
ceIn
tro
du
ceIn
tro
du
ceIn
tro
du
ceIn
tro
du
ceIn
tro
du
ceIn
tro
du
ceIn
tro
du
ceB
DS,
DP
“Ad
ven
titi
ou
s vi
ral a
gen
ts
(AV
A)”
Intr
od
uce
Intr
od
uce
Intr
od
uce
Inac
tiva
tio
nR
emov
eR
emov
e
step
3
IPC
, BD
S
rele
ase
imp
acte
d b
y C
PP
=
imp
acte
d b
y W
C-C
PP
=
imp
acte
d b
y K
PP
=
no
key
imp
act
clai
med
=
en
try
test
or
pre
p c
on
tro
l=
©BioPhorum Operations Group Ltd | April 2020 Continued Process Verification : An industry position paper with example plan 20
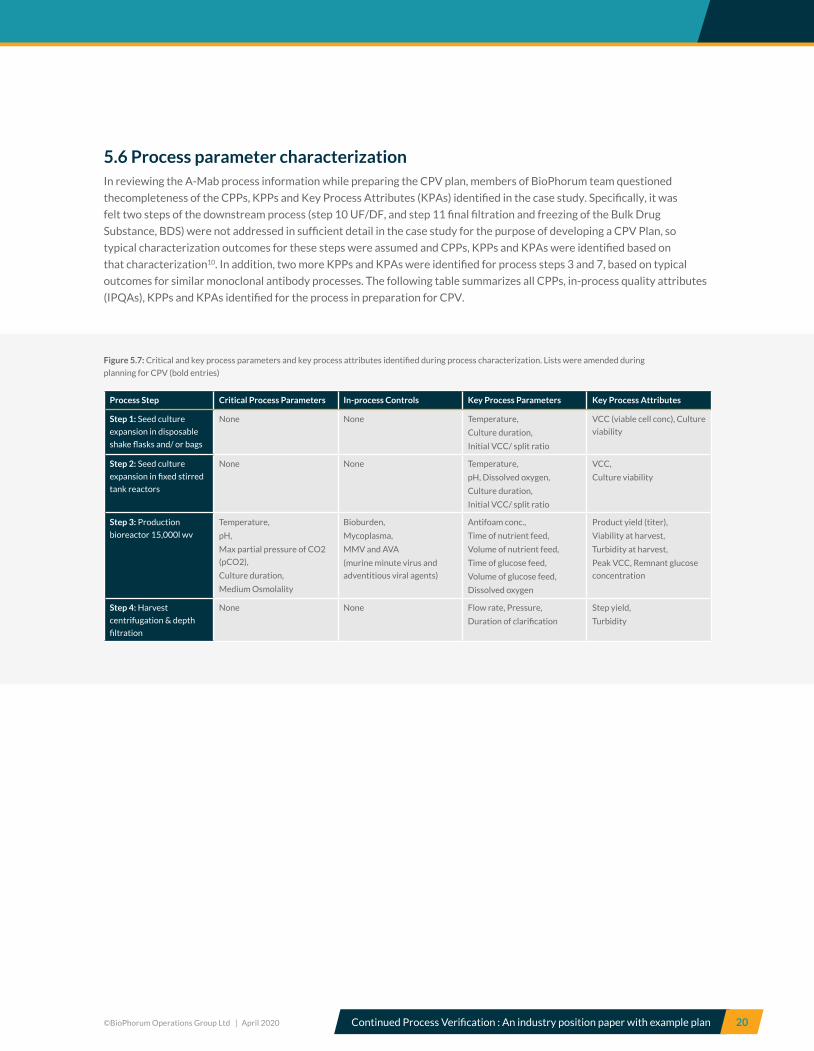
5.6 Process parameter characterizationIn reviewing the A-Mab process information while preparing the CPV plan, members of BioPhorum team questioned
thecompleteness of the CPPs, KPPs and Key Process Attributes (KPAs) identified in the case study. Specifically, it was
felt two steps of the downstream process (step 10 UF/DF, and step 11 final filtration and freezing of the Bulk Drug
Substance, BDS) were not addressed in sufficient detail in the case study for the purpose of developing a CPV Plan, so
typical characterization outcomes for these steps were assumed and CPPs, KPPs and KPAs were identified based on
that characterization10. In addition, two more KPPs and KPAs were identified for process steps 3 and 7, based on typical
outcomes for similar monoclonal antibody processes. The following table summarizes all CPPs, in-process quality attributes
(IPQAs), KPPs and KPAs identified for the process in preparation for CPV.
Figure 5.7: Critical and key process parameters and key process attributes identified during process characterization. Lists were amended during
planning for CPV (bold entries)
Process Step Critical Process Parameters In-process Controls Key Process Parameters Key Process Attributes
Step 1: Seed culture
expansion in disposable
shake flasks and/ or bags
None None Temperature,
Culture duration,
Initial VCC/ split ratio
VCC (viable cell conc), Culture
viability
Step 2: Seed culture
expansion in fixed stirred
tank reactors
None None Temperature,
pH, Dissolved oxygen,
Culture duration,
Initial VCC/ split ratio
VCC,
Culture viability
Step 3: Production
bioreactor 15,000l wv
Temperature,
pH,
Max partial pressure of CO2
(pCO2),
Culture duration,
Medium Osmolality
Bioburden,
Mycoplasma,
MMV and AVA
(murine minute virus and
adventitious viral agents)
Antifoam conc.,
Time of nutrient feed,
Volume of nutrient feed,
Time of glucose feed,
Volume of glucose feed,
Dissolved oxygen
Product yield (titer),
Viability at harvest,
Turbidity at harvest,
Peak VCC, Remnant glucose
concentration
Step 4: Harvest
centrifugation & depth
filtration
None None Flow rate, Pressure,
Duration of clarification
Step yield,
Turbidity

©BioPhorum Operations Group Ltd | April 2020 Continued Process Verification : An industry position paper with example plan 21
Figure 5.7: Critical and key process parameters and key process attributes identified during process characterization. Lists were amended during planning for CPV
(bold entries)
Process Step Critical Process Parameters In-process Controls Key Process Parameters Key Process Attributes
Step 5: Protein a affinity
chromatography
Protein load ratio,
Elution buffer pH
Bioburden,
Endotoxin
End collection,
Step duration
Step yield
Step 6: Low ph incubation pH,
Time,
Temperature
Bioburden,
Endotoxin
Quantity of acid added
Step 7: Cation exchange
chromatography
Protein load ratio,
Wash conductivity,
Elution pH,
Elution stop collect
Bioburden,
Endotoxin
Step duration Step yield,
Eluate volume
Step 8: Anion exchange
chromatography
Equilibration/ Wash1
buffer conductivity,
Protein load ratio,
Load conductivity,
Load pH,
Flow rate
Bioburden,
Endotoxin
Step duration Step yield
Step 9: Small virus
retentive filtration
Operating pressure,
Filtration volume
Bioburden,
Endotoxin
None Step yield
Step 10: formulation:
ultrafiltration and
diafiltraion
Number of
dia-volumes,
pH,
Step processing time,
Protein conc. prior to fill
Bioburden,
Endotoxin
Protein conc. prior to
Diafiltration,
Recirculation flow rate
Step yield,
Permeate flow rate
Step 11: final filtration, fill
and freeze
None Bioburden,
Endotoxin
Filtration volume,
Filtration time,
Maximum (inlet) pressure
Bulk fill step yield

©BioPhorum Operations Group Ltd | April 2020 Continued Process Verification : An industry position paper with example plan 22
5.7 Control strategy CQAs and CPPS Risk-based criticality assessment, along with process
characterization studies, allows a CS to be established
which is subsequently verified during PPQ. Table 5.7
summarizes the CS established for the A-Mab upstream
and downstream process steps for A-Mab production.
The CS consists of CPPs and WC-CPPs, KPPs, KPAs and
IPQAs. The CS should ensure required product quality and
a consistent and robust process.
Here, CPPs must be controlled within limits and in-process
controls (specifically microbial and viral safety) must be
within specified ranges to ensure drug safety and efficacy.
Although KPPs and KPAs have been shown not to impact
product quality, they are included in the CS because
their monitoring and control ensures that the process
is operated in a consistent and predictable manner. The
control of KPPs and KPAs also ensures that commercial
success criteria such as cycle time and yield are met.
Product quality and safety are ensured by controlling all
quality-linked process parameters (CPPs and WCCPPs)
within the limits. Process consistency is ensured by
controlling KPPs within established limits and by
monitoring relevant process attributes.
©BioPhorum Operations Group Ltd | April 2020 Continued Process Verification : An industry position paper with example plan 23
6.0
Developing a monitoring strategy
6.1 Rationale and background CPV is a formal activity enabling the detection of variation in the manufacturing process that might have an impact on the product quality or process consistency. CPV should evaluate whether the process consistently delivers product with acceptable QAs and continues to operate robustly, within the validated state. It should also identify any new sources of variability in the process that may have arisen since the initial Stage 2 PQ was performed. For this case study it has been determined that PPQ batches will be included in CPV data collection and analysis; indeed, all appropriate batches should be considered. CPV efforts should, where appropriate, also focus on areas that have proved challenging or may have shifted since the initial validation. A risk based approach to process monitoring should be used to direct these efforts. For products with a legacy history, a defined time period or number of batches should be set to determine how much of the historical experience will be considered. The assessment interval chosen should be sufficient to establish a solid production history and also reflect the frequency of production. For example a product that is produced frequently may permit a shorter time period to be used relative to a product that is produced infrequently.
In general, the points in the process to be monitored
during CPV should be comparable to, but not necessarily
include all of those selected during the initial validation.
If limited data results are available at the time of PPQ
completion, prior to execution of the CPV plan, a short
term sampling plan may be established to continue
sampling based on the PPQ protocol until sufficient data
results are gathered in preparation for CPV. Additional
considerations that influence the determination of which
points in the process are monitored during a CPV exercise
are summarized below.
(1) The final classification of attributes should be revisited.
(2) The process risk assessment, which is typically
performed prior to the initial PPQ, should be revisited
and updated to develop the CPV plan. The revised risk
assessment should reflect learning obtained during
PPQ, any additional laboratory process characterization
information, and key findings from historical
manufacturing experience. In revisiting the process
risk assessment prior to commercial manufacture, late
stage clinical manufacturing knowledge is particularly
important. Levels of risk, and indeed the range of risks,
that apply in the manufacturing environment might be
quite different to those anticipated from the early stage
development environment.
(3) The control strategy should be updated as necessary
and hence the CPV Plan.
The selection of points in the manufacturing process
that are to be monitored for CPV purposes may be
either a subset of those selected during PPQ or include
additional monitoring points beyond those included in
the initial PPQ to reflect new learning obtained since
the initial validation was conducted.
This includes but is not limited to:
• New CS elements
• Process elements that have proved challenging
but may not have been covered during the initial
process validation
• Changed or additional analytical capabilities,
including the availability of online data
collection systems and improvements in assay
or instrument capabilities
• If a parameter has been shown to have good
control and consistency, it may not be necessary to
continue monitoring this parameter in subsequent
CPV evaluations.
©BioPhorum Operations Group Ltd | April 2020 Continued Process Verification : An industry position paper with example plan 24
(4) CPPs, WC-CPPs, KPPs and GPPs should be clearly
specified. These parameters and established release
specifications, additional product characterization
testing, and KPAs should be appropriately considered
during CPV. Any changes since the initial validation
should be explained and justified.
(5) All changes implemented should be assessed in
the context of potential impact on process validation.
Process changes which may have occurred after the
PPQ, such as vendor initiated change in a raw material,
should be handled a change control process including
but not limited to data trending and risk assessments,
to determine if the change has any impact on process
performance and/ or product quality. These changes
may potentially require additional testing beyond that
performed as part of PPQ to ensure full characterization.
Such testing may be incorporated as part of CPV or may
be handled separately as part of the company’s change
control process, depending on the nature of the change
and the potential for product impact.
(6) Appropriate regulatory reporting of CPV outcomes,
such as inclusion in the Annual Product Review (APR),
must be made for any conclusions related to process
assessment conducted during CPV. The CPV reports
should be consistent with regulatory reporting
standards, so that CPV charts may be copied and pasted
directly into the regulatory submissions or included
as an attachment. The regulatory submissions then
provide context and unify the information presented in
the attached CPV reports.
(7) Other elements of Good Manufacturing Practice
(GMP) applicable to biopharmaceutical production
operations are assumed to be handled by appropriate
quality systems and are therefore outside the scope
of this document, and will not be discussed further
in the context of process validation. In particular,
acceptable microbial control is a critical element for any
biopharmaceutical process and is typically demonstrated
via initial validation efforts and then monitored as part of
routine operations.
6.2 Hypothetical scenarios and planned process changes
Five hypothetical scenarios and planned changes are
provided below to illustrate how the CPV monitoring
plan might be affected by events encountered during
commercialization of a product such as A-Mab. In this
example it is assumed that the PPQ campaign proceeded
smoothly and that the expected results were achieved.
6.2 Hypothetical scenarios and planned process changesFive hypothetical scenarios and planned changes are provided below to illustrate how the CPV monitoring plan might be affected by events encountered during commercialization of a product such as A-Mab. In this example it is assumed that the PPQ campaign proceeded smoothly and that the expected results were achieved. In particular, CPPs, WC-CPPs, KPPs and GPP are defined and achievable and the process CS is appropriately established. The process CS is assumed to include input raw material controls, procedural controls, process parameter controls and monitoring, in-process testing, and product specification testing (see Figure 5.1.1). These scenarios are accounted for in the CPV plan:
Scenario 1: Supplier change notification - culture medium change.
A supplier converted to a new process to manufacture a cell
culture medium ingredient that may alter its performance
in the A-Mab process without impacting the material
procurement specifications. No intentional changes to
composition, test requirements or certificate of analysis
were made. The following justification for the change was
provided:
(1) Improved control of temperature during blending reduces
potential for degradation of the heat labile components;
(2) Equipment cleaning will use robust validated cycles to
reduce ingredient carryover risks;
(3) Equipment is located in an Animal Origin Free area to
reduce cross contamination risks.
©BioPhorum Operations Group Ltd | April 2020 Continued Process Verification : An industry position paper with example plan 25
The following strategy was employed to introduce the revised
cell culture medium:
• Determining process and quality impact for the material
change through the change control process was electively
agreed to by process experts and quality representatives
via verification testing of culture performance and the
ability to operate within the established parameters and
attributes;
• A study was thus completed in the small-scale model
from thaw through the production bioreactor to provide
additional process characterization data and establish
confidence in expectations of process control when the
new material lot is introduced into the commercial scale
process;
• Minor but statistically significant differences for KPPs
normal operating ranges and attributes (e.g. VCC, and cell
density, titer and turbidity at the end of the bioreactor
production) were identified at small scale;
• Medium qualification attributes should be assessed in
the change control evaluation to determine if/ how these
attributes may be impacted. The supplier was requested
to demonstrate if a detectable mean shift in any of their
output tests could be identified with respect to their
change.
Small scale production bioreactor material was purified
downstream. No structural modifications to the protein,
or shifts in CQAs were observed. Based on the outcome
of the small scale studies, a comparison should be made to
evaluate the product quality obtained at full scale, to verify
that no unexpected quality change has occurred and to
provide further verification of process control ranges and
performance outcomes.
A CPV plan is expected to take account of this type of
scenario, providing the internal policies and procedures upon
which decisions related to changes in process verification
should be based. The change described in this scenario can be
addressed through the change management system and does
not require additional sampling in the CPV plan, as routine
sampling is already in place to monitor the upstream cell
growth impact of this scenario (Tables 7.1, 7.2, 7.3 and 10.1,
10.2, 10.3). Potential downstream impact could be included
in the monitoring plan, e.g. the KPAs of inlet pressure to
depth filters and duration of the broth clarification, which are
suggested as optional items for CPV in Tables 7.4, 10.4.
Note: Attributes should only be considered optional after their
impact on the process has been risk assessed and any lack of
monitoring fully justified.
Scenario 2: High Protein A leachate observed in chromatography eluate, Step 5.
A PPQ batch contained 123 mg of protein A/g A-Mab in the
Protein A pool, which exceeded the control limit for this
process-related impurity. Investigation revealed that:
• Protein A ligand released from the chromatography resin
(‘Resin A’ from Supplier A) and entered the process stream
during product elution. R&D and Supplier A confirmed
that elevated amounts of Protein A can leach from the
bead surface during an initial elution after extended
resin storage, even when storing under recommended
conditions;
• Extended storage can cause increased Protein A leaching
in the next use cycle. The resin storage time of more
than 12 months between the last clinical manufacturing
batch and first PPQ batch was longer than previously
experienced and was not represented in small scale trials
used to establish PPQ limits;
• In-process testing of the Protein A clearance will be
performed to further demonstrate downstream process
capability of control of this product quality attribute (AEX
Table 7.8, 10.8);
• The level measured in the Protein A step eluate for the
batch implicated by this scenario was orders of magnitude
below the impurity safety limit for final drug product.
Also, at full scale in the affected PPQ batch, downstream
clearance of Protein A below the detectable level was
demonstrated which is consistent with small-scale
observations that the subsequent chromatography steps
are capable of removing Protein A (The possibility that
limits or controls on extended storage time, conditions,
and/ or resin treatments may need to be considered if
data indicates the clearance capability of the process is
not sufficiently high enough for the reader’s situation).
An additional Design of Experiments (DOE) study was
conducted after PPQ to determine the potential for Protein
A leaching relative to storage time, resin age (use cycles) and
storage conditions. Spiking study confirmation of clearance
capabilities in the downstream process steps was achieved
and is discussed in the amended CS revision completed
after the PPQ experience, where the new CPPs to control
clearance are clearly identified. Within CPV, results will
be monitored to detect any departures from the expected
behavior observed during development; monitoring tools
such as ‘tool wear charts’ or ‘residuals charts’ may be useful,
and consultation with a statistician is recommended. These
tools are mentioned again in Section 12.4.

©BioPhorum Operations Group Ltd | April 2020 Continued Process Verification : An industry position paper with example plan 26
Scenario 3: High elution volume from CEX, Step 7.
Because of resin capacity limitations, elution of the
product stream through the CEX resin requires processing
a batch in multiple portions (sub-batches). The column
eluate streams are then pooled. With one PPQ batch,
an unexpected additional volume of buffer solution was
required to complete the elution of A-Mab from the CEX
column resin for one sub-batch. The prior wash of process
impurities from Cation Exchange (CEX) Chromatography
resin proceeded without incident but there was a delay
while the additional elution buffer was prepared (during
which the product loaded column was idle) before
proceeding to complete the product elution operation to
recover all the A-Mab from the resin.
• No impact on A-Mab quality was detected, which
involved a deviation for a KPA (elution buffer
volume);
• The investigation did not reveal a definitive root
cause. Performance of the flow meter was not
implicated as a cause of the unusual observation
from review of GPPs and instrument calibration
checks;
• Flow channeling through the resin was the initial
suspected cause, but no similar observation was
made during earlier or later PPQ sub-batches;
• Delay in starting the elution operation may have
played a role, but this could not be confirmed
because it had not been specifically studied, nor did
delays after load prior to elution occur in historical
small-scale studies;
• Similar incidents have not been observed with
other A-Mab batches at any scale studied; A
change in the buffer (e.g. conductivity which is not
a CPP, or pH which is a CPP) as a result of the delay
has not been conclusively eliminated as a cause,
but no deviation associated with the buffer was
apparent from careful scrutiny of the batch record
(BRc) and interview with process operators.
Investigation of elution buffer stability data is also
suggested. If insufficient hold time and buffer attribute
data exists to determine the potential for buffer stability
to be a contributing cause, this may be pursued as an
independent study, rather than including buffer chemical
stability in the CPV Plan. Tracking of buffer volume used
to elute A-Mab from the CEX column is included in the
CPV recommendations for this step (see Tables 7.7,
10.7) because it has demonstrated variability and there
is a theoretical potential for increased aggregates with
extended processing time (not observed in any studies as
of yet) that may result from the need for additional elution
to recover A-Mab from the CEX resin.
Scenario 4: UF/DF measurements exceeded action limits.
During preparation of one PPQ batch, the starting UF/
DF concentration measurements did not meet the PPQ
control limits and step yield was above the expected PPQ
range. The starting UF/DF concentration has not been
classified as a KPA in the A-Mab case study.
• A change prior to PPQ revised the in-process UV
absorbance (A280) test method, which led to an
apparent upward shift in yield results. While a
bridging study was conducted to determine the
suitability of the revised test method, evaluation
of the change did not consider the impact to the
limits used during PPQ that were calculated based
on earlier experience. Limits in place during
PPQ were based on measurements from the
previous version of the method used for in-process
monitoring.
• Change control improved the accuracy of the
measurement and also removed a bias error
when compared to the final bulk drug substance
concentration which uses a different method
performed in the QC release testing laboratory.
• The implemented change in the test method
involved improvements to both the precision and
accuracy of the in-process measurement system;
there has been no change to the UF/DF process.
Analytical SME’s decided it would be inappropriate
to compare new results to a set of limits based
on data measured using a different/ altered
procedure, or simply adjust previous results for a
fixed bias correction (due to potential proportional
variance, see section 12.4).
• The corrective action being implemented will
supersede the original PPQ limits with new CPV
limits calculated using data from the revised test
method procedure.
No monitoring recommendations for CPV are proposed
as a result of this scenario. Care should be taken not to
include data generated prior to the method change in
calculating long-term limits.
©BioPhorum Operations Group Ltd | April 2020 Continued Process Verification : An industry position paper with example plan 27
Scenario 5: Environmental monitoring during Bulk Drug Substance (BDS) fill, Step 11.
During environmentally controlled open system filling
of one BDS batch, the routine sentinel plates indicated
environmental monitoring (EM) bioburden was above the
PPQ action limits. Investigation determined that:
• Based on organism identification, the likely source
was skin flora shed by an operator who conducted
the final filtration and filling of the BDS;
• The bioburden samples of each post-filtration
product container (for the PPQ) met the
acceptance criteria with results of 0 CFU/ 10 mL.
This confirmed that the 0.2 μ m filtered BDS was
not impacted and the routine criteria were met for
batch release (BR);
• Following the filling operation, BDS is frozen
within 24 hrs, and once thawed, the material is
pooled, mixed, and sampled for bioburden prior
to sterile filtration when initiating drug product
manufacturing;
• Corrective and preventive actions have been
implemented, including a review of personnel
practices, skills and training, and changes to
operating procedures to alert operators to
use appropriate practices when working in the
controlled filling environment.
No additional monitoring recommendations for CPV
are proposed as a result of this scenario because, even
with this incident, no impact to the BDS was found and
corrective actions have been implemented to prevent
its recurrence. Routine monitoring is sufficient. No
addition to the enhanced monitoring plan is needed
because it is not reasonable to expect from a single
incident that there will be variability in bioburden results
due to the processing of this step. Note: Whilst attributes
and parameters that are included in a CPV Plan are likely
to include some that are relevant to BR, a CPV program
is expected to operate independently of BR processes and
procedures. Analysis of data within the CPV program is
not expected to have an impact on product that has been
previously released. The release of batches compares batch
quality and performance to a specific set of pre-determined
specifications and other measures. In contrast, the focus
of CPV is to reveal trends and sources of variation in
batch quality and performance that already fall within the
predetermined criteria for BR.
©BioPhorum Operations Group Ltd | April 2020 Continued Process Verification : An industry position paper with example plan 28
7.0
CPV plan recommendations for the A-Mab process This section describes, for each of the A-Mab process steps, what to include in the CPV plan and the justification for its conclusion. This justification is primarily based on process knowledge and process experience. A table is provided for each step to summarize the recommendations for CPV. Discretionary items are also included that may be needed in a CPV program depending on the assurance of process understanding or that provide additional depth to the monitoring plan.
No recommendation for including in-process product
pool hold times in CPV is proposed, because the hold
times were validated as part of the basis for controls
within the Master BRc. In the event that a hold time is
exceeded this one-off event would trigger a deviation
within the Quality System, under which impact to
product quality would be determined.
In the steps with elution of product from resin beds
(i.e. steps 5 and 7), several resin loading/ elution cycles
are used to process each batch. No controls have been
identified for resin regeneration operations in either of
these steps. For these steps, concurrent validation of
the resin use lifetime includes periodic sample testing of
appropriate quality attributes for continued verification
of packed resin effectiveness during its use lifetime.
Effectiveness of resin regeneration conditions is included
in the ongoing resin use validations. Therefore monitoring
of CQAs for this purpose need not be included in the CPV
plan. Continued monitoring, and further verification of
effective process controls, should be considered for CPV
when resin use lifetime monitoring ceases, if further data
are needed for understanding of impurity clearance.
No recommendation for including in-process hold times
in CPV is proposed because ongoing study of hold times
during commercial manufacturing is conducted using a
separate hold time qualification study.
Steps that have in-process quality attributes related to
microbial control (bioburden, endotoxin) are sampled and
tested as routine in-process controls. The nature of test
results in this case (approximately 0 cfu/ sample, and ≤
Limit of Quantification, LOQ, respectively) do not permit
meaningful Statistical Process Control (SPC) analysis in
CPV. QC microbiology laboratory review of these results
against action and alert limits will provide appropriate
monitoring for drift in microbial control of the process and
management of deviations, so monitoring, data analysis
and any response to bioburden and endotoxin results are
not included under this CPV plan.
Note: It could be seen as best practice that the quality system
for bioburden and endotoxin monitoring and the CPV system
are connected, so that any deviations would be reflected in
CPV Reports.
Statistical criteria that may be applied to analyses of data
are discussed in section 12.
The A-Mab case study did not identify any critical raw
materials or address CS or risk assessment for input
material controls. However, as a result of a hypothetical
culture medium change described in section 6, one
monitoring recommendation related to material variability
is provided as a recommendation for the CPV plan.
Additional monitoring of materials used in the bulk drug
formulation is also included as an option.
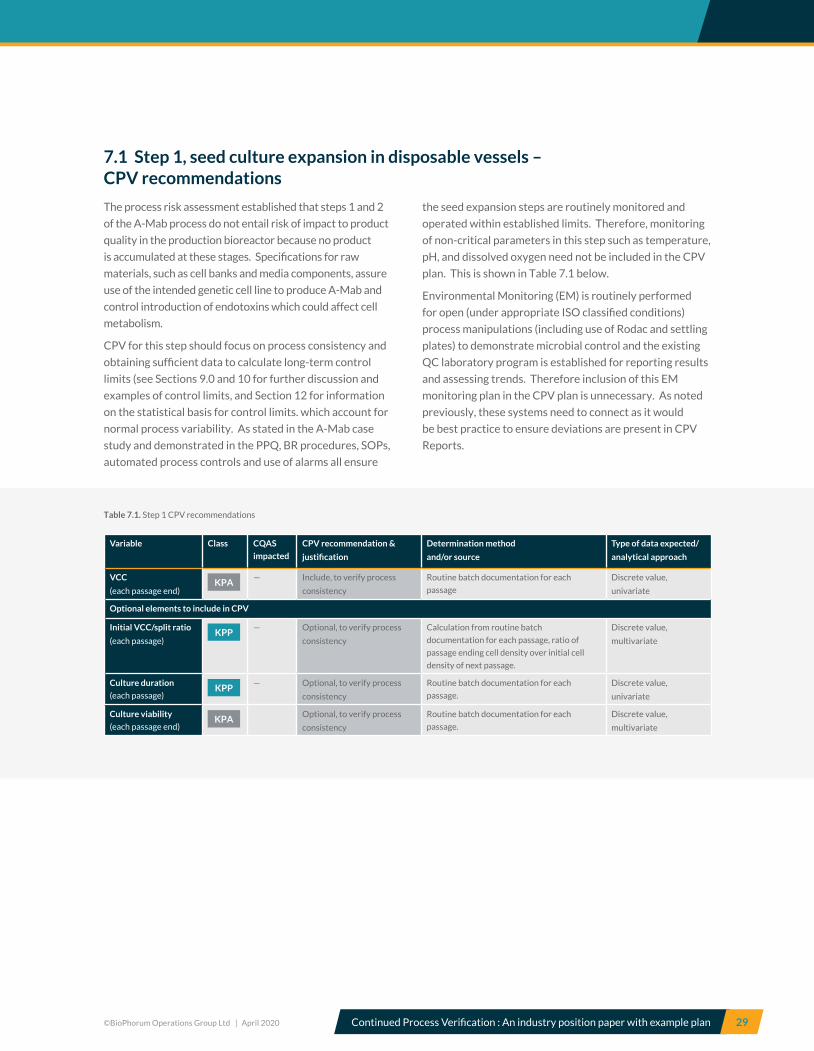
©BioPhorum Operations Group Ltd | April 2020 Continued Process Verification : An industry position paper with example plan 29
7.1 Step 1, seed culture expansion in disposable vessels – CPV recommendations
Table 7.1. Step 1 CPV recommendations
Variable Class CQAS
impacted
CPV recommendation &
justification
Determination method
and/or source
Type of data expected/
analytical approach
VCC
(each passage end)KPA
— Include, to verify process
consistency
Routine batch documentation for each
passage
Discrete value,
univariate
Optional elements to include in CPV
Initial VCC/split ratio
(each passage)KPP
— Optional, to verify process
consistency
Calculation from routine batch
documentation for each passage, ratio of
passage ending cell density over initial cell
density of next passage.
Discrete value,
multivariate
Culture duration
(each passage)KPP
— Optional, to verify process
consistency
Routine batch documentation for each
passage.
Discrete value,
univariate
Culture viability
(each passage end)KPA
Optional, to verify process
consistency
Routine batch documentation for each
passage.
Discrete value,
multivariate
The process risk assessment established that steps 1 and 2
of the A-Mab process do not entail risk of impact to product
quality in the production bioreactor because no product
is accumulated at these stages. Specifications for raw
materials, such as cell banks and media components, assure
use of the intended genetic cell line to produce A-Mab and
control introduction of endotoxins which could affect cell
metabolism.
CPV for this step should focus on process consistency and
obtaining sufficient data to calculate long-term control
limits (see Sections 9.0 and 10 for further discussion and
examples of control limits, and Section 12 for information
on the statistical basis for control limits. which account for
normal process variability. As stated in the A-Mab case
study and demonstrated in the PPQ, BR procedures, SOPs,
automated process controls and use of alarms all ensure
the seed expansion steps are routinely monitored and
operated within established limits. Therefore, monitoring
of non-critical parameters in this step such as temperature,
pH, and dissolved oxygen need not be included in the CPV
plan. This is shown in Table 7.1 below.
Environmental Monitoring (EM) is routinely performed
for open (under appropriate ISO classified conditions)
process manipulations (including use of Rodac and settling
plates) to demonstrate microbial control and the existing
QC laboratory program is established for reporting results
and assessing trends. Therefore inclusion of this EM
monitoring plan in the CPV plan is unnecessary. As noted
previously, these systems need to connect as it would
be best practice to ensure deviations are present in CPV
Reports.
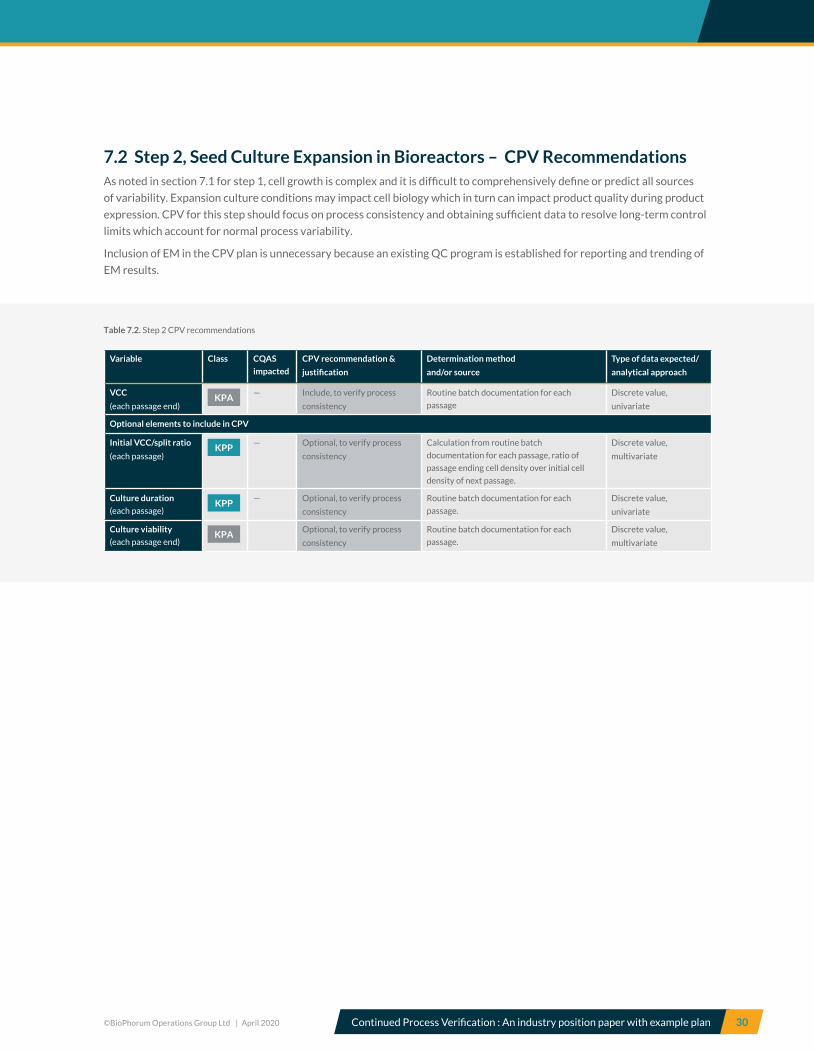
©BioPhorum Operations Group Ltd | April 2020 Continued Process Verification : An industry position paper with example plan 30
7.2 Step 2, Seed Culture Expansion in Bioreactors – CPV RecommendationsAs noted in section 7.1 for step 1, cell growth is complex and it is difficult to comprehensively define or predict all sources
of variability. Expansion culture conditions may impact cell biology which in turn can impact product quality during product
expression. CPV for this step should focus on process consistency and obtaining sufficient data to resolve long-term control
limits which account for normal process variability.
Inclusion of EM in the CPV plan is unnecessary because an existing QC program is established for reporting and trending of
EM results.
Table 7.2. Step 2 CPV recommendations
Variable Class CQAS
impacted
CPV recommendation &
justification
Determination method
and/or source
Type of data expected/
analytical approach
VCC
(each passage end)KPA
— Include, to verify process
consistency
Routine batch documentation for each
passage
Discrete value,
univariate
Optional elements to include in CPV
Initial VCC/split ratio
(each passage)KPP
— Optional, to verify process
consistency
Calculation from routine batch
documentation for each passage, ratio of
passage ending cell density over initial cell
density of next passage.
Discrete value,
multivariate
Culture duration
(each passage)KPP
— Optional, to verify process
consistency
Routine batch documentation for each
passage.
Discrete value,
univariate
Culture viability
(each passage end)KPA
Optional, to verify process
consistency
Routine batch documentation for each
passage.
Discrete value,
multivariate
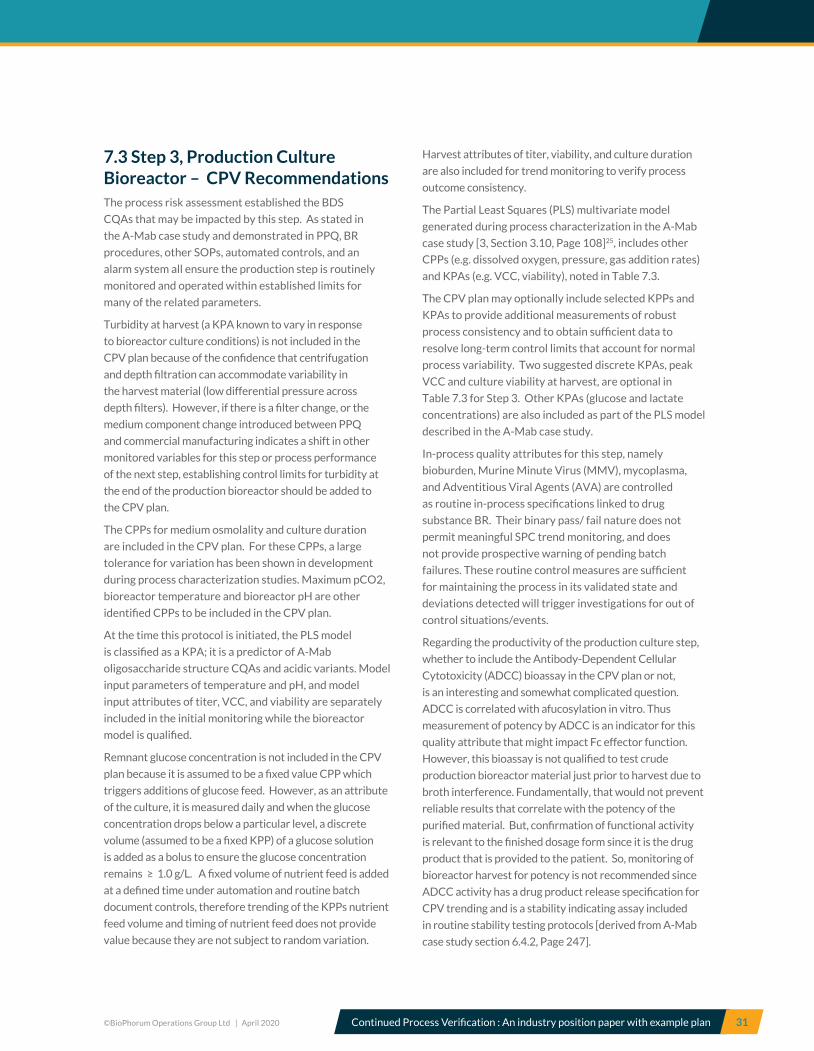
©BioPhorum Operations Group Ltd | April 2020 Continued Process Verification : An industry position paper with example plan 31
7.3 Step 3, Production Culture Bioreactor – CPV RecommendationsThe process risk assessment established the BDS
CQAs that may be impacted by this step. As stated in
the A-Mab case study and demonstrated in PPQ, BR
procedures, other SOPs, automated controls, and an
alarm system all ensure the production step is routinely
monitored and operated within established limits for
many of the related parameters.
Turbidity at harvest (a KPA known to vary in response
to bioreactor culture conditions) is not included in the
CPV plan because of the confidence that centrifugation
and depth filtration can accommodate variability in
the harvest material (low differential pressure across
depth filters). However, if there is a filter change, or the
medium component change introduced between PPQ
and commercial manufacturing indicates a shift in other
monitored variables for this step or process performance
of the next step, establishing control limits for turbidity at
the end of the production bioreactor should be added to
the CPV plan.
The CPPs for medium osmolality and culture duration
are included in the CPV plan. For these CPPs, a large
tolerance for variation has been shown in development
during process characterization studies. Maximum pCO2,
bioreactor temperature and bioreactor pH are other
identified CPPs to be included in the CPV plan.
At the time this protocol is initiated, the PLS model
is classified as a KPA; it is a predictor of A-Mab
oligosaccharide structure CQAs and acidic variants. Model
input parameters of temperature and pH, and model
input attributes of titer, VCC, and viability are separately
included in the initial monitoring while the bioreactor
model is qualified.
Remnant glucose concentration is not included in the CPV
plan because it is assumed to be a fixed value CPP which
triggers additions of glucose feed. However, as an attribute
of the culture, it is measured daily and when the glucose
concentration drops below a particular level, a discrete
volume (assumed to be a fixed KPP) of a glucose solution
is added as a bolus to ensure the glucose concentration
remains ≥ 1.0 g/L. A fixed volume of nutrient feed is added
at a defined time under automation and routine batch
document controls, therefore trending of the KPPs nutrient
feed volume and timing of nutrient feed does not provide
value because they are not subject to random variation.
Harvest attributes of titer, viability, and culture duration
are also included for trend monitoring to verify process
outcome consistency.
The Partial Least Squares (PLS) multivariate model
generated during process characterization in the A-Mab
case study [3, Section 3.10, Page 108]25, includes other
CPPs (e.g. dissolved oxygen, pressure, gas addition rates)
and KPAs (e.g. VCC, viability), noted in Table 7.3.
The CPV plan may optionally include selected KPPs and
KPAs to provide additional measurements of robust
process consistency and to obtain sufficient data to
resolve long-term control limits that account for normal
process variability. Two suggested discrete KPAs, peak
VCC and culture viability at harvest, are optional in
Table 7.3 for Step 3. Other KPAs (glucose and lactate
concentrations) are also included as part of the PLS model
described in the A-Mab case study.
In-process quality attributes for this step, namely
bioburden, Murine Minute Virus (MMV), mycoplasma,
and Adventitious Viral Agents (AVA) are controlled
as routine in-process specifications linked to drug
substance BR. Their binary pass/ fail nature does not
permit meaningful SPC trend monitoring, and does
not provide prospective warning of pending batch
failures. These routine control measures are sufficient
for maintaining the process in its validated state and
deviations detected will trigger investigations for out of
control situations/events.
Regarding the productivity of the production culture step,
whether to include the Antibody-Dependent Cellular
Cytotoxicity (ADCC) bioassay in the CPV plan or not,
is an interesting and somewhat complicated question.
ADCC is correlated with afucosylation in vitro. Thus
measurement of potency by ADCC is an indicator for this
quality attribute that might impact Fc effector function.
However, this bioassay is not qualified to test crude
production bioreactor material just prior to harvest due to
broth interference. Fundamentally, that would not prevent
reliable results that correlate with the potency of the
purified material. But, confirmation of functional activity
is relevant to the finished dosage form since it is the drug
product that is provided to the patient. So, monitoring of
bioreactor harvest for potency is not recommended since
ADCC activity has a drug product release specification for
CPV trending and is a stability indicating assay included
in routine stability testing protocols [derived from A-Mab
case study section 6.4.2, Page 247].

©BioPhorum Operations Group Ltd | April 2020 Continued Process Verification : An industry position paper with example plan 32
The CS categorized the antifoam ingredient to be a
critical raw material (CRM), probably because it is a
process residual CQA. However, there is no particular
critical material attribute (CMA) that requires enhanced
monitoring. The addition of antifoam varies as needed up
to a maximum 100 mg/L concentration (section 5). As a
single antifoam lot is used for multiple bioreactor batches,
lot change points in the batch genealogy will be traceable
to correlate with any process shifts in trends for this step,
the clarification step, or the Protein A chromatography
step (steps 3, 4 and 5 in the process). Because only one
lot of antifoam was introduced in the PPQ, three BDS
batches during the initial CPV period, which employ
different antifoam lots in the upstream process, are tested
to provide evidence of robust clearance of the process
residual. Due to the low turnover in antifoam lots, routine
but periodic batches being tested for stability may also
be selected for this extra testing in BDS, i.e. at ‘time zero’.
This does not suggest that clearance of antifoam is a
stability indicating attribute.
The oligosaccharide profile (a CQA) is solely influenced
by the production bioreactor. Input material and
procedural controls are in place to ensure the quality of
raw materials and the cell line. Control of step 3 CPPs
(temperature, pH, dissolved carbon dioxide, culture
duration, and medium osmolarity) within their limits
ensures consistent glycosylation. No process clearance
or further glycan modification occurs in downstream
processing, and the oligosaccharide profile is not regarded
as stability indicating. Routine testing is not part of
the drug substance lot release specification based on
the development process design history, process risk
assesments, CS, and PPQ. The risk that exists is that no
process clearance or further modification is expected in
downstream processing. An oligosaccharide profiling
method utilizing Capillary Electrophoresis-Laser Induced
Fluorescence (CE-LIF) was developed and qualified for
characterization of the oligosaccharide profile. There
is also an in vitro cell-based bioassay qualified to enable
collection of biological activity data related to ADCC
functions, as a means to assess Fc-oligosaccharide
structure-function relationships.
CPV trend monitoring of afucosylated and galactosylated
glycans in the bioreactor for step 3 is recommended to
build confidence in process consistency (see Table 7.12,
10.12). Note that sialylation, high mannose content (also
afucosylated) and non-glycosylated heavy chain were
also determined to be CQAs but recommended only as
optional elements to include in CPV monitoring (see Table
7.12, 10.12). The frequency of lifecycle monitoring of
glycans will be reviewed and adjusted based on trends.
Characterization of the oligosaccharide profile will be
conducted to confirm comparability when needed to
support process changes [derived from A-Mab case study
section 6.4.5, Page 250 and section 6.6.1, Page 251-253].
The mechanism and conditions conducive to formation
of deamidated isoforms are widely known and well
understood. This knowledge, in conjunction with the
level of risk associated with the quality attribute in the
post-PPQ risk assessment, negates the need for in-process
CPV testing. Process control includes testing with a
routine CEX HPLC method at lot release, of both drug
substance and drug product, to confirm the identity of
A-Mab, monitor charge heterogeneity and detect shifts
in deamidated isoforms [derived from A-Mab case study
section 6.6.4, Page 259]. The method separates the main
charged isoforms of A-Mab that are considered to be
product-related substances as defined in ICH Q6B. The
resulting chromatographic profile is specific to A-Mab and
unambiguously distinguishes it from other monoclonal
antibodies. The spectrum of isoforms contained in the
reference chromatogram for A-Mab represents acidic and
basic isoforms. The chromatogram is inspected to ensure
a consistent profile with the reference standard and the
absence of any new peaks. A quantitative definition of
new peaks is included in the CEX test method. Charged
isoforms of A-Mab do not increase when stored at
recommended conditions; therefore, the attribute is not
monitored on stability [derived from A-Mab case study
section 6.4.2, Page 247].
The KPA of titer (yield) is included in CPV for trend
monitoring for process consistency.
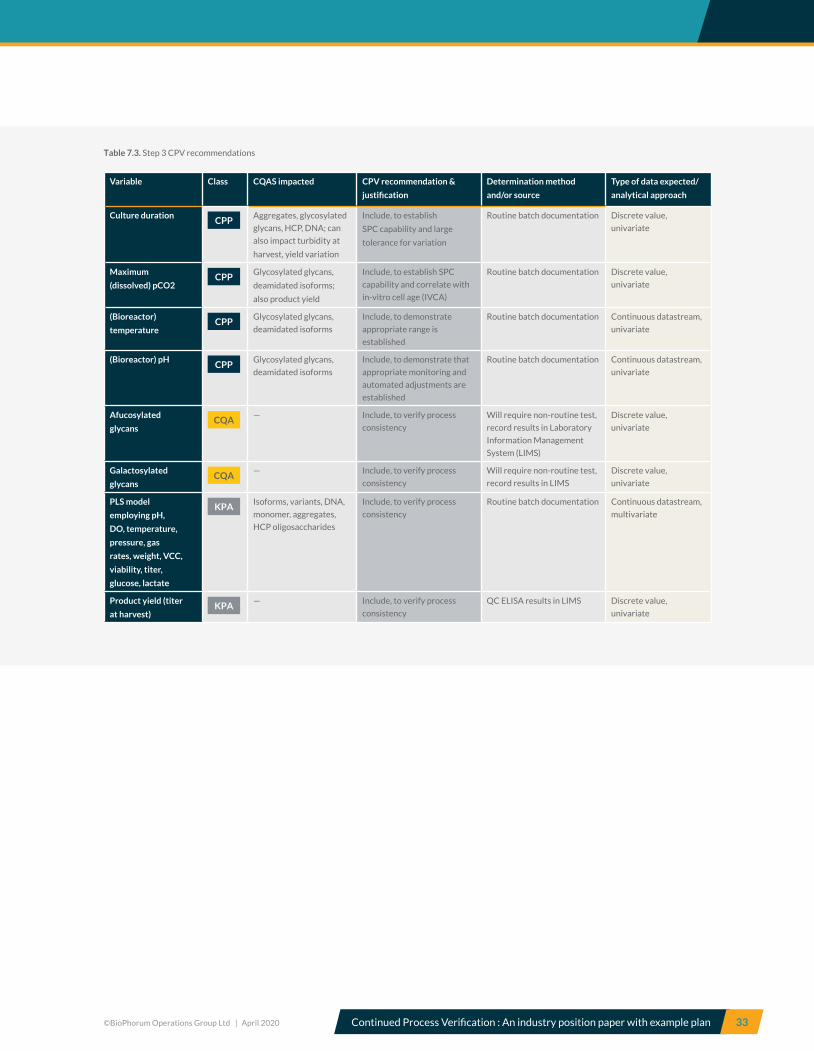
©BioPhorum Operations Group Ltd | April 2020 Continued Process Verification : An industry position paper with example plan 33
Table 7.3. Step 3 CPV recommendations
Variable Class CQAS impacted CPV recommendation &
justification
Determination method
and/or source
Type of data expected/
analytical approach
Culture durationCPP
Aggregates, glycosylated
glycans, HCP, DNA; can
also impact turbidity at
harvest, yield variation
Include, to establish
SPC capability and large
tolerance for variation
Routine batch documentation Discrete value,
univariate
Maximum
(dissolved) pCO2CPP
Glycosylated glycans,
deamidated isoforms;
also product yield
Include, to establish SPC
capability and correlate with
in-vitro cell age (IVCA)
Routine batch documentation Discrete value,
univariate
(Bioreactor)
temperatureCPP
Glycosylated glycans,
deamidated isoforms
Include, to demonstrate
appropriate range is
established
Routine batch documentation Continuous datastream,
univariate
(Bioreactor) pHCPP
Glycosylated glycans,
deamidated isoforms
Include, to demonstrate that
appropriate monitoring and
automated adjustments are
established
Routine batch documentation Continuous datastream,
univariate
Afucosylated
glycansCQA
— Include, to verify process
consistency
Will require non-routine test,
record results in Laboratory
Information Management
System (LIMS)
Discrete value,
univariate
Galactosylated
glycansCQA
— Include, to verify process
consistency
Will require non-routine test,
record results in LIMS
Discrete value,
univariate
PLS model
employing pH,
DO, temperature,
pressure, gas
rates, weight, VCC,
viability, titer,
glucose, lactate
KPAIsoforms, variants, DNA,
monomer, aggregates,
HCP oligosaccharides
Include, to verify process
consistency
Routine batch documentation Continuous datastream,
multivariate
Product yield (titer
at harvest)KPA
— Include, to verify process
consistency
QC ELISA results in LIMS Discrete value,
univariate
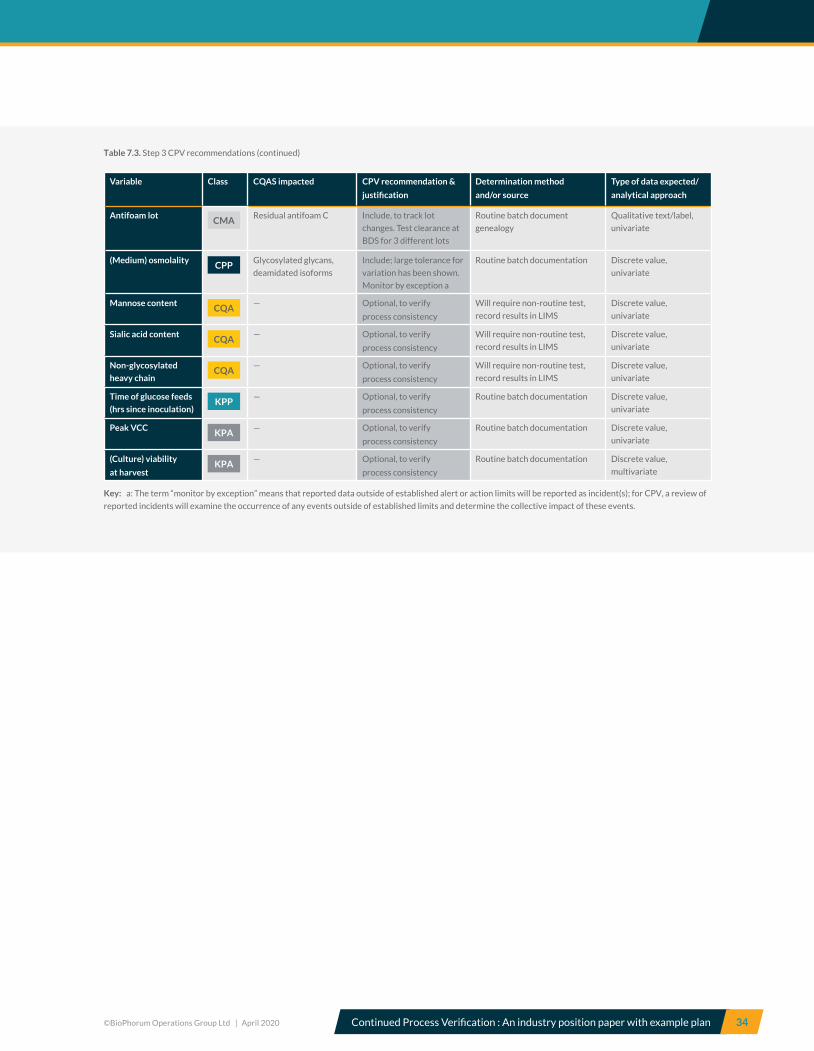
©BioPhorum Operations Group Ltd | April 2020 Continued Process Verification : An industry position paper with example plan 34
Table 7.3. Step 3 CPV recommendations (continued)
Variable Class CQAS impacted CPV recommendation &
justification
Determination method
and/or source
Type of data expected/
analytical approach
Antifoam lotCMA
Residual antifoam C Include, to track lot
changes. Test clearance at
BDS for 3 different lots
Routine batch document
genealogy
Qualitative text/label,
univariate
(Medium) osmolalityCPP
Glycosylated glycans,
deamidated isoforms
Include; large tolerance for
variation has been shown.
Monitor by exception a
Routine batch documentation Discrete value,
univariate
Mannose contentCQA
— Optional, to verify
process consistency
Will require non-routine test,
record results in LIMS
Discrete value,
univariate
Sialic acid contentCQA
— Optional, to verify
process consistency
Will require non-routine test,
record results in LIMS
Discrete value,
univariate
Non-glycosylated
heavy chainCQA
— Optional, to verify
process consistency
Will require non-routine test,
record results in LIMS
Discrete value,
univariate
Time of glucose feeds
(hrs since inoculation)KPP
— Optional, to verify
process consistency
Routine batch documentation Discrete value,
univariate
Peak VCCKPA
— Optional, to verify
process consistency
Routine batch documentation Discrete value,
univariate
(Culture) viability
at harvestKPA
— Optional, to verify
process consistency
Routine batch documentation Discrete value,
multivariate
Key: a: The term “monitor by exception” means that reported data outside of established alert or action limits will be reported as incident(s); for CPV, a review of
reported incidents will examine the occurrence of any events outside of established limits and determine the collective impact of these events.

©BioPhorum Operations Group Ltd | April 2020 Continued Process Verification : An industry position paper with example plan 35
7.4 Step 4, Clarification (centrifugation and depth filtration) – CPV recommendationsThe process risk assessment established that the clarification step is unlikely to impact product quality. Monitoring for CPV
is limited to process consistency for the purpose of examining data to establish long-term control limits that account for
normal process variability (per statistical confidence criteria stated in section 12). Therefore, the KPA of yield is included in
CPV for trend monitoring as a process performance indicator. One KPA, turbidity of filtrate, is also recommended to confirm
process consistency following the culture medium change (see section 6.2, scenario 1).
The PPQ demonstrated that BR procedures, SOPs, automated process controls and alarming ensure the centrifuge and
filtration step are routinely monitored and operate within established limits. Temperature, centrifuge feed rate and rpm, and
filter flow rate are not CPPs and are tightly controlled engineering or fixed design parameters that are not subject to random
variation and therefore do not merit inclusion in CPV.
Evaluation of a change in the manufacturing method of the culture medium used upstream (see Section 6, Scenario 1) could
include additional monitoring of downstream KPAs of inlet pressure to depth filters and duration of the broth clarification,
which are noted in the Table 7.4 as optional items for CPV. The small scale model evaluation of new lots of the medium
material showed that product quality attributes of Host Cell Protein (HCP), DNA, and product structural characteristics are
not impacted, so monitoring of these KPAs is not included in the CPV recommendations. The decisions not to include these
KPAs in CPV could be re-examined pending the results of the change management evaluation of the culture medium change.
Table 7.4. Step 4 CPV recommendations
Variable Class CQAS impacted CPV recommendation &
justification
Determination method
and/or source
Type of data expected/
analytical approach
Turbidity (of filtrate)KPA
Glycosylated glycans,
deamidated isoforms
Include, to confirm process
consistency following medium
change
Non-routine testing needed Discrete value,
univariate
Step yield
(product in filtrate)KPP
— Include, to verify process
consistency
QC ELISA test results in LIMS Discrete value,
univariate
Optional elements to include in CPV
Duration of broth
clarificationKPP
— Optional, to confirm process
consistency following medium
change
Routine batch documentation,
elapsed time from start of
harvest (opening of bioreactor
bottom valve) to end of
filtration (closing or filtrate
vessel inlet valve)
Discrete value,
univariate
Inlet Pressure to
filtersKPP
— Optional, to confirm process
consistency following medium
change
Routine batch documentation Continuous datastream
or discrete value,
univariate
©BioPhorum Operations Group Ltd | April 2020 Continued Process Verification : An industry position paper with example plan 36
7.5 Step 5, Protein A Chromatography – CPV recommendationsThe process risk assessment established that protein
A purification may impact product quality (aggregate;
charge variants; leached Protein A; clearance of HCP,
DNA, and methotrexate) and links to performance of
chromatography steps 7 and 8 (CEX and AEX). Platform
and prior process knowledge negate the need for specific
process studies except as noted below for HCP and
leached Protein A.
CPV for step 5 (the first of the downstream DS process
steps) should focus on process consistency to obtain
sufficient data to establish long-term control limits that
account for normal process variability (see section 12 for
statistical confidence criteria). Variables recommended
for inclusion in the CPV plan are shown in the Table 7.5
below, including CPPs identified for this step (protein load
ratio and elution buffer pH). Elution buffer pH is closely
controlled by batch procedure and buffer is not released
for use if pH is out of range. This variable is included in the
CPV plan to monitor the extent of buffer pH variability
incorporated in the HCP model prediction. Step duration,
a KPP, is included in the CPV recommendations to
establish capability on processing time for this step.
The key process attribute of yield is included in
the CPV recommendations for trend monitoring of
process consistency.
CPV need not include monitoring of flow rate through
the resin, nor the end collection point (column volume or
A280 absorbance) for the eluate because the PPQ verified
the expected control and minimal variation for these key
parameters. Operating temperature and other GPPs
were shown in characterization studies to not impact
product quality or process consistency when controlled
within easily achieved design ranges. The automated
continuous process controls and alarm system, as well
as BR sequencing and SOPs, ensure the step is routinely
monitored and operated within its established limits.
A linkage model study was proposed in the A-Mab case
study to examine HCP levels at different points within
the process (after each chromatography step – steps 5, 7
and 8). This is included in the CPV plan and involves non-
routine analysis to provide data on measured HCP levels
at the final point in the process covered by the multivariate
model (after AEX chromatography, step 8) against the
predicted outcome.
Storage of the Protein A resin (section 6, scenario 2) is
expected to potentially introduce a variable amount of
leached Protein A into the product stream. This will be
monitored via residual protein A (leached from the resin)
testing and trending of the results to establish process
capability for controlling this CQA.
Process control deviations for this step should evaluate
the case-by-case potential impact on these attributes
(and viral clearance), as process streams continue
further downstream for purification. For deviation
investigations, it may be appropriate to review the risk
assessment justification for any low risk CPPs. Note that
the process has high Impurity Safety Factor (ISF) (for a
definition, see A-Mab Case Study3 Section 4.10.3, Page
167) clearance (>5x10⁴) for all process related impurities
for normal processing.

©BioPhorum Operations Group Ltd | April 2020 Continued Process Verification : An industry position paper with example plan 37
Table 7.5. Step 4 CPV recommendations
Variable Class CQAS impacted CPV recommendation &
justification
Determination method
and/or source
Type of data expected/
analytical approach
Protein load (ratio)
(in HCP model), each
sub-batch
CPPHCP, DNA, process
impurities
Include, to establish SPC
capability
Routine batch documentation,
calculated using packed resin
volume
Discrete value,
univariate
Elution buffer pH (in
HCP model)CPP
HCP, DNA, process
impurities
Include, to verify process
consistency
Routine batch documentation Discrete value,
univariate
Residual Protein A in
eluate poolCQA
Protein A Include, to establish SPC
capability
Non-routine testing needed,
results recorded in LIMIS
Discrete value,
univariate
Step durationKPP
— Include, to verify that
process can capably control
this CQA
Routine batch documentation,
elapsed time from closing of
vessel inlet valve to eluate
pooling is completed
Discrete value,
univariate
Step yieldKPA
— Include, to confirm process
consistency
Routine batch documentation,
calculation using in-process
A280 test result
Discrete value,
multivariate likely
to exhibit normal
distribution
7.6 Step 6, Low pH treatment – CPV recommendationsThe process risk assessment established that the low pH
treatment step for viral inactivation impacts two product
CQAs (aggregate and viral inactivation). There is no claim
for removal of process related impurities (HCP, DNA,
methotrexate or leached Protein A) but some incidental
reduction in these impurities may be achieved in this
step, which includes precipitation and downstream filter
clearance. In general, CPV for this step should focus on
obtaining sufficient data to resolve long-term control
limits related to viral inactivation, so CPPs for inactivation
time and pH should be included in CPV. The viral safety
risk CQA (inactivation of particular AVA) for the A-Mab
process has been validated in the small scale model during
stage 1 process validation. Inactivation time and pH are
readily controlled within desired limits for the process
as shown by PPQ. However, inclusion of both these
parameters in CPV is recommended, because they are
manually controlled and susceptible to variation within
their PARs. One additional test, for aggregates, is also
recommended for CPV to establish process capability for
this CQA.
CPV need not include inactivation temperature and
agitation mixing because PPQ verified the expected
control and minimal variation for these key parameters.
BR sequencing, automated process controls and the alarm
system will ensure the step is routinely monitored and
operated within its established limits for these parameters.
The limit for maximum protein concentration in the
Protein A pool is bound by the pH inactivation step
requirements, but trending of the protein concentration
is not recommended as the information will provide little
benefit in process understanding. However, a related
optional inclusion for CPV is to trend the amount of acid
added, to ensure the A-Mab process does not drift or shift
toward the edge of the qualified conditions of the platform
process without this being recognised.

©BioPhorum Operations Group Ltd | April 2020 Continued Process Verification : An industry position paper with example plan 38
Step yield is not included as a CPV recommendation because yield is not expected to be impacted at this point in the
process and variability around the expected 100% has been associated with measurement uncertainty rather than process
variability, therefore it does not merit CPV trending or monitoring. The basis for yield for the next step (7, CEX) begins from
the eluate pool of the previous step (5, Protein A).
Table 7.6. Step 6 CPV recommendations
Variable Class CQAs
impacted
CPV Recommendation &
Justification
Determination Method and/
or source
Type of data expected/
Analytical approach
pH (during inactivation)CPP
AVA,
aggregates
Include, to confirm process
consistency
Routine batch documentation,
integrated average of online pH
values during inactivation time
Continuous datastream,
univariate
Post-inactivation
aggregatesCQA
— Include, to establish SPC
capability
Non-routine testing needed,
results recorded in LIMS
Discrete, multivariate
Optional elements to include in CPV
(Inactivation) timeCPP
AVA Optional, to establish SPC
capability
Routine batch documentation,
calculate from completion
of acid addition to start of
titration
Discrete value, univariate
Quantity of acid addedKPP
— Optional, to establish SPC
capability
Routine batch documentation,
change in supply vessel weight
Discrete value, univariate

©BioPhorum Operations Group Ltd | April 2020 Continued Process Verification : An industry position paper with example plan 39
Table 7.7. Step 7 CPV recommendations
7.7 Step 7, Cation Exchange Chromatography (CEX) – CPV recommendationsThe process risk assessment established that the CEX
step primarily impacts two product CQAs, aggregate
and residual HCP. Characterization studies showed that
DNA and protein A clearance were not impacted by this
step, and there is no claim of viral clearance for this step.
Trending of CPPs identified as potentially impacting
these CQAs are included as recommendations for CPV.
CQAs for HCP (as supporting evidence for the linkage
model prediction) and aggregate are included in CPV
to establish process capability, and the KPA of yield
is included in CPV for trend monitoring as a process
performance indicator.
Univariate monitoring is not required for flow rate
through the resin, elution buffer pH, load buffer pH,
wash buffer pH, re-equilibration buffer pH, eluate
volume, nor the starting or end collection point
(A280/A320) for the eluate because PPQ verified
the expected control and minimal variation for
these key parameters. BR sequencing, automated
process controls, and the alarm system will ensure
the step is routinely monitored and operated within
its established limits for the independent parameters.
Development studies concluded a wide operating
temperature range had no impact on product quality
or performance/ process consistency, so monitoring
of temperature beyond that routinely done for each
batch is not included in CPV recommendations.
CEX eluate volume (each sub-batch) is included in CPV
to determine a higher confidence range of the normal
variation due to the special cause event that occurred
during PPQ (see section 6.2). Data obtained will be used to
show process consistency with respect to this parameter.
The basis for yield for this step begins from the step 5
eluate pool.
Variable Class CQAS impacted
CPV recommendation & justification
Determination method and/or source
Type of data expected/ analytical approach
Protein load (ratio) (in
HCP model)CPP
Aggregates,
HCP
Include, to establish SPC
capability
Routine batch documentation,
calculation using packed resin
volume
Discrete value, multivariate
Wash conductivity (in
HCP model)CPP
HCP Include, to confirm process
consistency
Routine batch documentation Discrete value, univariate
Elution pHCPP
HCP, DNA,
Protein A,
aggregates
Include, to confirm process
consistency
Routine batch documentation Continuous datastream,
univariate
Aggregates in CEX eluate
poolCQA
– Include, to verify process
performance
Will require non-routine in-
process test, results recorded
in LIMS
Discrete value, multivariate

©BioPhorum Operations Group Ltd | April 2020 Continued Process Verification : An industry position paper with example plan 40
7.8 Step 8, Anion Exchange Chromatography (AEX) – CPV recommendationsThe process risk assessment established that the AEX
step impacts several CQAs (viral clearance, aggregate,
endotoxin, and clearance of protein A, charge variants,
HCP, DNA, and methotrexate). Trending of three CPPs
identified as potentially impacting these CQAs (protein
load ratio, equilibration buffer conductivity and load pH)
are included as recommendations for CPV.
Monitoring of other CQAs impacted by this step is not
recommended because trending for HCP and Protein A are
sufficient to represent the performance and establish the
capability of this step. Since the step 5, 7, 8 linkage model
(see Section 12) is for predicting an impurity CQA (residual
HCP), the output of the model is classified as a KPA, and
is also included for monitoring against CPV control limits
(not BR acceptance criteria).
Monitoring of step duration (a KPP) is suggested as an
optional inclusion for measuring process capability.
Inclusion of other process parameters including flow
rate (a CPP) and KPPs such as starting or end collection
UV for the eluate, or pH of the prepared equilibration/
wash 1 buffer are not suggested because PPQ verified
the expected control and minimal variation for these
parameters. BR sequencing, automated process controls,
and the alarm system will ensure the step is routinely
monitored and operated within its established limits for
these independent parameters. Development studies
concluded that a wide protein concentration range had
no impact on product quality or performance/process
consistency, so trending of protein concentration is also
not included in CPV recommendations.
Monitoring of step yield will serve as an indicator of any
drift in process control for this step.
Table 7.7. Step 7 CPV recommendations
Variable Class CQAS impacted
CPV recommendation & justification
Determination method and/or source
Type of data expected/ analytical approach
HCP content in CEX
eluate poolCQA
– Include, to verify process
performance
Will require non-routine
in-process test, record results
in LIMS
Discrete value, univariate
CEX eluate volume (each
sub-batch)KPA
– Include, to confirm process
consistency
Routine batch documentation Discrete value, univariate
Step yieldKPA
– Include, to confirm SPC
capability
Routine batch document
calculation using field A280
test result
Discrete value, multivariate
Optional elements to include in CPV
Step durationKPP
– Optional, to confirm SPC
capability
Routine batch documentation;
elapsed time from end of step 6
(vessel inlet valve closes)
Discrete value,
univariate

©BioPhorum Operations Group Ltd | April 2020 Continued Process Verification : An industry position paper with example plan 41
Table 7.8. Step 8 CPV recommendations
Variable Class CQAS impacted
CPV recommendation & justification
Determination method and/or source
Type of data expected/ analytical approach
Protein load (ratio)CPP
HCP, viral
clearance
Include, to establish SPC
capability
Routine batch documentation,
calculation using packed resin
volume
Discrete value, univariate
Load conductivityCPP
Viral
clearance
Include, to confirm process
consistency
Routine sample and test for
buffer use
Discrete value, univariate
Load pH (in HCP model)CPP
HCP, viral
clearance
Include, to confirm process
consistency
Routine batch documentation,
sample test
Discrete value, univariate
Equilibrium/ Wash 1
buffer conductivity (in
HCP model)
CPPHCP, viral
clearance
Include, to verify process
performance
Routine sample and test for
buffer use
Discrete value, multivariate
Linkage model output
for HCP content in AEX
eluate (predicted)
KPA– Include as outcome of HCP
linkage model, to demonstrate
understanding of HCP
clearance through multiple
processing steps
Calculated from six variable
terms logged in batch
documents for step 5,7,8
Discrete value, multivariate
HCP content in AEX
eluate (measured)CQA
– Verify model of HCP clearance
through multiple processing
steps
Non-routine test, results
recorded in LIMS
Discrete value, univariate
Residual Protein A in
eluateCQA
– Include, to confirm process
consistency
Will require non-routine
in-process test, record results
in LIMS
Discrete value, univariate
Step yieldKPA
– Include, to confirm SPC
capability
Routine batch document
calculation using field A280
test result
Discrete value, multivariate
Optional elements to include in CPV
Step durationKPP
– Optional, to confirm SPC
capability
Routine batch documentation;
elapsed time from end of step 7
(vessel inlet valve closes)
until product elution completed
in step 8
Discrete value, univariate
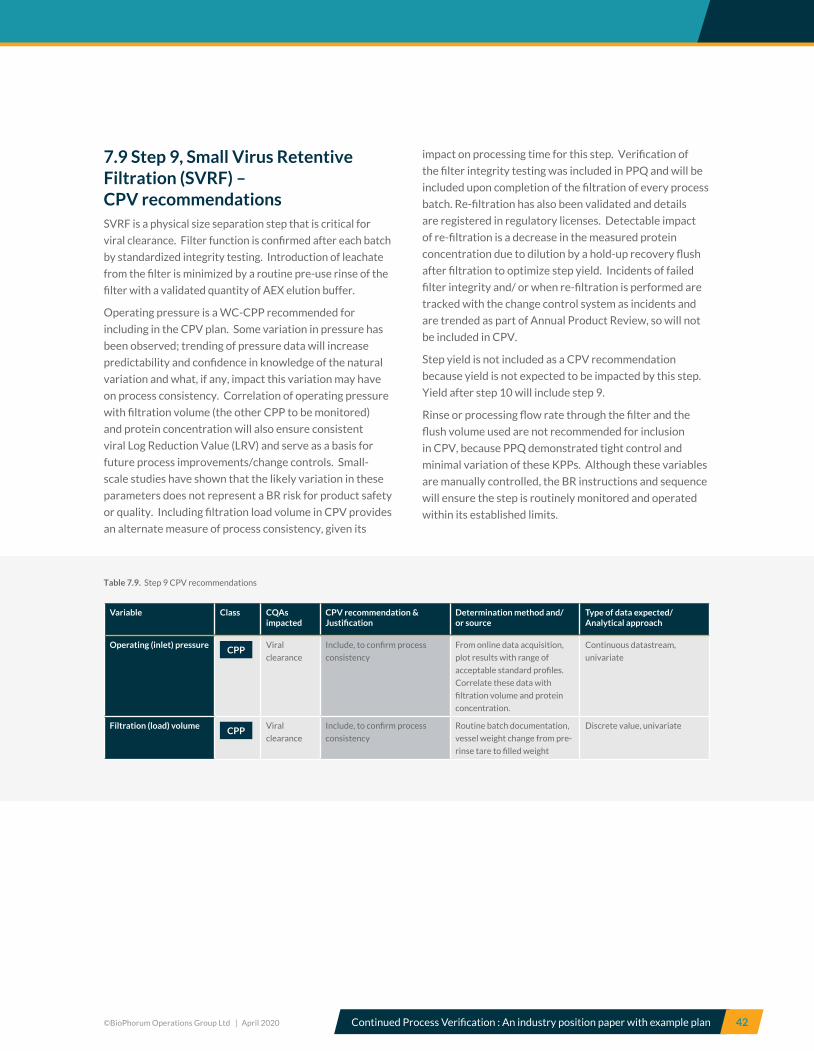
©BioPhorum Operations Group Ltd | April 2020 Continued Process Verification : An industry position paper with example plan 42
Table 7.9. Step 9 CPV recommendations
7.9 Step 9, Small Virus Retentive Filtration (SVRF) – CPV recommendationsSVRF is a physical size separation step that is critical for
viral clearance. Filter function is confirmed after each batch
by standardized integrity testing. Introduction of leachate
from the filter is minimized by a routine pre-use rinse of the
filter with a validated quantity of AEX elution buffer.
Operating pressure is a WC-CPP recommended for
including in the CPV plan. Some variation in pressure has
been observed; trending of pressure data will increase
predictability and confidence in knowledge of the natural
variation and what, if any, impact this variation may have
on process consistency. Correlation of operating pressure
with filtration volume (the other CPP to be monitored)
and protein concentration will also ensure consistent
viral Log Reduction Value (LRV) and serve as a basis for
future process improvements/change controls. Small-
scale studies have shown that the likely variation in these
parameters does not represent a BR risk for product safety
or quality. Including filtration load volume in CPV provides
an alternate measure of process consistency, given its
impact on processing time for this step. Verification of
the filter integrity testing was included in PPQ and will be
included upon completion of the filtration of every process
batch. Re-filtration has also been validated and details
are registered in regulatory licenses. Detectable impact
of re-filtration is a decrease in the measured protein
concentration due to dilution by a hold-up recovery flush
after filtration to optimize step yield. Incidents of failed
filter integrity and/ or when re-filtration is performed are
tracked with the change control system as incidents and
are trended as part of Annual Product Review, so will not
be included in CPV.
Step yield is not included as a CPV recommendation
because yield is not expected to be impacted by this step.
Yield after step 10 will include step 9.
Rinse or processing flow rate through the filter and the
flush volume used are not recommended for inclusion
in CPV, because PPQ demonstrated tight control and
minimal variation of these KPPs. Although these variables
are manually controlled, the BR instructions and sequence
will ensure the step is routinely monitored and operated
within its established limits.
Variable Class CQAs impacted
CPV recommendation & Justification
Determination method and/or source
Type of data expected/ Analytical approach
Operating (inlet) pressureCPP
Viral
clearance
Include, to confirm process
consistency
From online data acquisition,
plot results with range of
acceptable standard profiles.
Correlate these data with
filtration volume and protein
concentration.
Continuous datastream,
univariate
Filtration (load) volumeCPP
Viral
clearance
Include, to confirm process
consistency
Routine batch documentation,
vessel weight change from pre-
rinse tare to filled weight
Discrete value, univariate

©BioPhorum Operations Group Ltd | April 2020 Continued Process Verification : An industry position paper with example plan 43
7.10 Step 10, Ultrafiltration and Diafiltration (UF/DF) – CPV recommendationsThe A-Mab case study does not provide sufficient detail
to trace CPV rationale back to a CS, risk assessment, or
process development for this step. Therefore, six well
known process parameters typical for the operations of a
UF/DF step are considered for CPV:
• Trans-Membrane Pressure (TMP);
• Temperature of the product containing stream;
• Permeate and recirculation flow rates;
• Number of dia-volumes to complete the
buffer exchange;
• Product concentration (prior to and after
buffer exchange);
• Step processing time.
Platform knowledge was leveraged to define an initial
membrane life limit controlled via batch documentation
and equipment logbooks. A specific membrane lifetime
monitoring protocol is expected to be in place alongside
the CPV plan, to verify filter performance.
Flow rates are response variables that automatically
adjust to maintain a fixed TMP set point (pressure
controlled operation). Because flow rate profiles tend
to vary over the re-use lifetime of the membranes,
an optional choice for CPV includes monitoring of
permeate and recirculation flow rates via a trajectory
profile of the continuous dynamic data. Reference
standard profiles (3SD tunnels, i.e. control charts with + 3
standard deviation acceptability limits) will be shown for
comparison (sourced from the initial use cycles for the
membrane and from the PPQ batches).
It is assumed that PPQ demonstrated that BR procedures,
automated process controls, and alarming ensure
the UF/DF step is routinely monitored and operated
within established limits characterized in small scale
development DOE studies. Therefore temperature and
TMP are dismissed as non-CPPs and are not recommended
for inclusion in CPV.
The number of dia-volumes needed to complete the buffer
exchange, pH of the AEX eluate solution to be processed
in this step, and UF/DF processing time are additional
CPPs to include in CPV, because of their potential impact
on product concentration and dia-volumes (affects
osmolality), the potential formation of aggregate (from
lengthy processing time and/or incorrect pH), and because
process validation has not yet provided sufficient data to
demonstrate process capability for these parameters.
It is assumed that a risk assessment established that
the UF/DF step has potential to affect various product
quality attributes. Variation in protein concentration
prior to BDS freeze and fill (step 11, post-filtration)
may affect downstream drug product manufacturing
controls/ capability, so trending of this CQA is included
in CPV recommendations. These data will also provide
evidence for any correlation with other variables (e.g.
dia-volumes needed for buffer exchange). Optionally, CPV
may include selected product CQAs, chosen because of
knowledge that they may reveal the impact of variability
in the process or provide useful information about process
capability. The product solution identity, composition, and
aggregation could be altered by either post-diafiltration
pH or osmolality (or by a trace contaminant in compendial
grade raw material), so inclusion of these CQAs should
be considered for CPV. The A-Mab case study CS
established that impurity clearance capability for residual
methotrexate is very high and does not require further
verification. The genealogy link between the culture media
used in the upstream process batches (impurity clearance
of antifoam and methotrexate) and the UF/DF membrane
lot will be logged in the enterprise resource planning
system for use in investigations.
Protein concentration prior to diafiltration is suggested as
an option for inclusion in CPV, to provide data linking this
in-process CQA measure to the final protein concentration
at completion of this step. Another suggested option is to
trend aggregates in the final retentate with the intent of
providing additional data to trend this step for ability to
control formation of this process-related impurity.
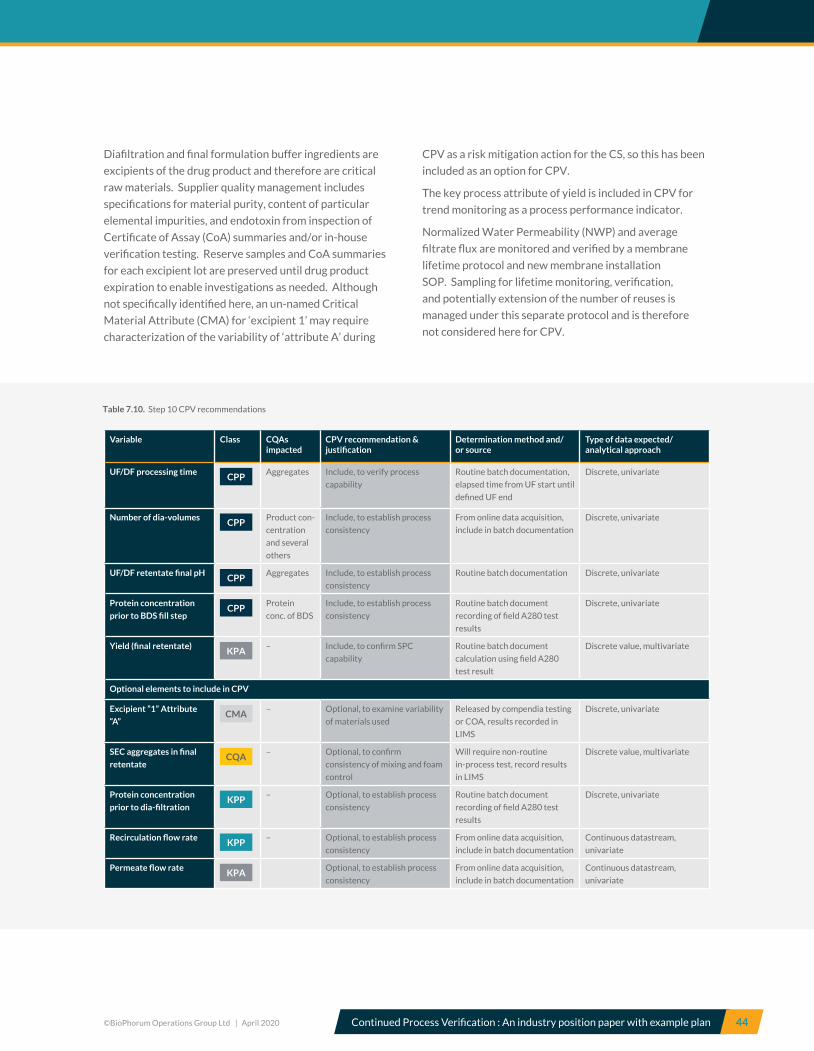
©BioPhorum Operations Group Ltd | April 2020 Continued Process Verification : An industry position paper with example plan 44
Diafiltration and final formulation buffer ingredients are
excipients of the drug product and therefore are critical
raw materials. Supplier quality management includes
specifications for material purity, content of particular
elemental impurities, and endotoxin from inspection of
Certificate of Assay (CoA) summaries and/or in-house
verification testing. Reserve samples and CoA summaries
for each excipient lot are preserved until drug product
expiration to enable investigations as needed. Although
not specifically identified here, an un-named Critical
Material Attribute (CMA) for ‘excipient 1’ may require
characterization of the variability of ‘attribute A’ during
CPV as a risk mitigation action for the CS, so this has been
included as an option for CPV.
The key process attribute of yield is included in CPV for
trend monitoring as a process performance indicator.
Normalized Water Permeability (NWP) and average
filtrate flux are monitored and verified by a membrane
lifetime protocol and new membrane installation
SOP. Sampling for lifetime monitoring, verification,
and potentially extension of the number of reuses is
managed under this separate protocol and is therefore
not considered here for CPV.
Variable Class CQAs impacted
CPV recommendation & justification
Determination method and/or source
Type of data expected/ analytical approach
UF/DF processing timeCPP
Aggregates Include, to verify process
capability
Routine batch documentation,
elapsed time from UF start until
defined UF end
Discrete, univariate
Number of dia-volumesCPP
Product con-
centration
and several
others
Include, to establish process
consistency
From online data acquisition,
include in batch documentation
Discrete, univariate
UF/DF retentate final pHCPP
Aggregates Include, to establish process
consistency
Routine batch documentation Discrete, univariate
Protein concentration
prior to BDS fill stepCPP
Protein
conc. of BDS
Include, to establish process
consistency
Routine batch document
recording of field A280 test
results
Discrete, univariate
Yield (final retentate)KPA
– Include, to confirm SPC
capability
Routine batch document
calculation using field A280
test result
Discrete value, multivariate
Optional elements to include in CPV
Excipient ”1” Attribute
“A”CMA
– Optional, to examine variability
of materials used
Released by compendia testing
or COA, results recorded in
LIMS
Discrete, univariate
SEC aggregates in final
retentateCQA
– Optional, to confirm
consistency of mixing and foam
control
Will require non-routine
in-process test, record results
in LIMS
Discrete value, multivariate
Protein concentration
prior to dia-filtrationKPP
– Optional, to establish process
consistency
Routine batch document
recording of field A280 test
results
Discrete, univariate
Recirculation flow rateKPP
– Optional, to establish process
consistency
From online data acquisition,
include in batch documentation
Continuous datastream,
univariate
Permeate flow rateKPA
Optional, to establish process
consistency
From online data acquisition,
include in batch documentation
Continuous datastream,
univariate
Table 7.10. Step 10 CPV recommendations
©BioPhorum Operations Group Ltd | April 2020 Continued Process Verification : An industry position paper with example plan 45
7.11 Step 11, Final Filtration and Freezing of BDS – CPV recommendationsFinal filtration performed while filling sterile containers
provides assurance of microbial control of the drug
substance intermediate, but is otherwise unlikely to
impact product quality. No provisions are assumed for a
validated re-filtration option. Filter function is confirmed
after each batch by standardized filter integrity testing.
Introduction of filter leachates are minimized by process
design and leachable studies, which include a pre-use
rinse of the filter with a qualified fixed amount of final
formulation buffer.
The KPA of yield was chosen for monitoring this step in
CPV, because trend monitoring of yield will provide a good
process performance indicator.
Although it is not a CPP, maximum inlet pressure (filter
pressure) is known to exhibit product specific batch
variation from platform process knowledge and so is
suggested as an optional inclusion in CPV. Filtration
volume is another KPP that would be a reasonable
optional choice for CPV, providing a different measure
for assessing processing capability. Correlation of filter
pressure with filtration volume, protein concentration,
and filtration time are other optional considerations that
could be included in the CPV plan, to characterize normal
performance and variation for the A-Mab process for
future predictability.

©BioPhorum Operations Group Ltd | April 2020 Continued Process Verification : An industry position paper with example plan 46
The BDS freezing rate profile and container seal integrity
has been validated at commercial scale and the freezing
time and conditions are well controlled and documented
to support any investigations. The freezing equipment
is included in the periodic validation maintenance and
instrument preventative maintenance programs. CPV
monitoring is not proposed for several related operating
variables because PPQ demonstrated tight control and
minimal variation of these variables, including: bulk
mixing after UF/DF and during the fill, the fixed flow rate
through the filter, the flush volume used, verification
of the filter integrity testing and product intermediate
freezing temperature. BR sequence and instructions,
automation monitoring and alarm systems will ensure
the step is routinely monitored and operated within its
established limits. The time the intermediate is stored
frozen prior to shipment for drug product manufacturing,
could be considered as a means of identifying any potential
correlation with data from the stability program, but this is
not included in the CPV recommendations here.
EM is a supporting quality system subject to periodic
monitoring, so it is not included in CPV recommendations,
despite a related incident report for this step (see Section
6, scenario 5).
Table 7.11. Step 10 CPV recommendations
Variable Class CQAs
impacted
CPV recommendation &
justification
Determination Method and/
or source
Type of data expected/
Analytical approach
Bulk Fill step yieldKPA
– Include, to establish process
consistency
Routine batch document
determination using field A280
test result
Discrete value, multivariate
Optional elements to include in CPV
Filtration volumeKPP
– Optional, to verify process
capability
From online data acquisition,
include in batch documentation
Discrete value, univariate
Maximum (inlet) pressureKPP
– Optional, to establish process
consistency
Routine batch documentation,
max. inlet pressure from online
data acquisition during fill
Discrete value, univariate
Filtration time
documentation, elapsed
time
KPP– Optional, to define normal
range
Routine batch Discrete value, univariate

©BioPhorum Operations Group Ltd | April 2020 Continued Process Verification : An industry position paper with example plan 47
7.12 Bulk Drug Substance Lot Data – CPV recommendationsThe QC group ensures each drug substance batch
meets specifications for lot release to drug product
manufacturing. Some specifications, such as the identity
attribute of consistency with reference standard and
inspection for new peaks, are not amendable to trend
analysis for CPV. The QC microbiology laboratory
monitors all drug substance lot data for endotoxin and
bioburden against alert and action limits to provide
appropriate monitoring of the process and management of
microbial control deviations.
In the A-Mab case study, routine BR specifications
proposed for the drug substance were intentionally
minimized to show a potential application of QbD
development for process validation Stage 1. Endotoxin
testing, a BDS and drug product release requirement is
reviewed as per the QC laboratory SOP, with SPC based
alert limits which are assessed for suitability during each
annual product review. For the CPV plan, additional
BDS CQAs were selected for continued verification and
enhanced monitoring, to demonstrate consistency over a
longer period during which more process variation may be
observed. Content of various oligosaccharide structures
were selected as high risk CQA examples from the A-Mab
case study (refer to section 7.3 and 10.3). Control limits
are set inside the claimed acceptable range (see section
5) based on statistical analysis of data to provide early
warning during trend monitoring.
Some additional process and product related impurity
parameters are included in the CPV plan for this process
step. For example, monitoring of antifoam C rather than
methotrexate clearance was chosen. Antifoam additions
vary batch-to-batch to control foam and clearance is
combined over steps 4 and 5. In contrast, methotrexate is
a fixed addition prior to the N-1 seed bioreactor, resulting
in significant dilution as the process scales up to 15,000L
and a high log reduction factor was demonstrated for the
Protein A step 5 alone. HCP is not included for CPV at
BDS because it is monitored for CPV at step 8 (AEX), as
both a special sample test with a control limit well inside
the 0 to 100 ng/mg acceptable range (based on the similar
X-mAb process) and via the multivariate model for linked
chromatography parameters25. No particular deamidated
isoforms (which incidentally, were not designated as
CQAs) or other charge variants are required for CPV
monitoring. The routine drug substance specification
confirmation of A-Mab identity includes a CEX HPLC
method which separates isoforms (product-related
substances as defined by ICH Q6B) and both a consistent
profile with the reference standard and absence of new
peaks are part of the acceptance criteria, so this would not
be included in the plan.
It is recommended for CPV, that the routine lot release
Size Exclusion Chromatography (SEC) results for percent
monomer and aggregates be trended and long-term
control (alert) limits defined within their release and
stability specifications. The data for these parameters
will not form a normal distribution, so control will involve
QC review of the results against action and alert limits.
Note that samples for SEC testing are collected from
the product intermediate prior to bulk freezing and the
effect of freezing, storage, and shipping conditions on
aggregation should be considered for inclusion in CPV as
inputs to the DP process.
Additional CQAs are listed here as optional for inclusion
in the CPV plan. Those CQAs that should perhaps be
included in trending more often than annually for the
Annual Product Review, as a result of relatively frequent
manufacture, should be included in CPV. Content of
three oligosaccharide structures (sialic acid, mannose
and non-glycosylated heavy chain) and two process
impurities (DNA and methotrexate) were selected as
options for CQAs to be added to CPV trending. As noted
earlier, trending of results for two other oligosaccharide
structures will be done at step 3. Methotrexate is a raw
material used in steps 1 and 2 and there are no specific
controls for its removal but since there is a high safety
clearance limit for this residual process impurity, testing
for it in the BDS is optional.
Shipping of the drug substance has been validated.
Monitoring of in-shipment time and maximum
temperature during shipment is routinely verified to be
within qualified limits. Trending of shipping conditions
should be considered for monitoring of the shipping
process, though these parameters are considered out of
scope for Stage 3 CPV, so they are not included in the plan.

©BioPhorum Operations Group Ltd | April 2020 Continued Process Verification : An industry position paper with example plan 48
Table 7.12. Step 10 CPV recommendations
Variable Class CQAs impacted
CPV recommendation & justification
Determination method and/or source
Type of data expected/ analytical approach
Monomer (by SEC)CQA
– Include, to establish SPC LIMS results from routine
testing of BDS
Discrete value, univariate
Aggregates (by SEC)CQA
– Include, to establish SPC LIMS results from routine
testing of BDS
Discrete value, multivariate
Galactose contentCQA
– Include, to establish SPC LIMS results from routine
testing of BDS
Discrete value
AfucosylationCQA
– Include, to establish SPC LIMS results from routine
testing of BDS
Discrete value
Optional elements to include in CPV
DNACQA
Include, to establish SPC LIMS results from routine
testing of BDS
Discrete value
Methotrexate and/or
antifoam CCQA
Include, to establish SPC LIMS results from routine
testing of BDS
Discrete value
Sialic acid contentCQA
Include, to establish SPC LIMS results from routine
testing of BDS
Discrete value
Mannose contentCQA
Include, to establish SPC LIMS results from routine
testing of BDS
Discrete value
Non-glycosylated heavy
chainCQA
Include, to establish SPC LIMS results from routine
testing of BDS
Discrete value
©BioPhorum Operations Group Ltd | April 2020 Continued Process Verification : An industry position paper with example plan 49
8.0
Frequency and scope of CPV analysis
CPV analysis commences with commercial production, following successful completion of the PPQ batches. The start of data collection and analysis begins with the first representative commercial batches produced at the commercial scale facility. Due to potential scale and facility differences, as well as modifications in the process control or adjustments to test methods prior to PPQ, CPV monitoring will not include data from clinical batches, though experience gained in these project phases are likely to help in assigning initial control limits. As a result, the amount of directly relevant data available to set appropriate monitoring limits will be limited at this point. This poses a problem, at least until significant quantities of data have been gathered.
8.1 Scope of CPV Analysis To address the problem of limited data when commercial
production starts, it is recommended that CPV analysis
is performed in two phases, the initial CPV phase and the
long-term CPV phase.
Phase 1: Initial CPV Phase
The initial CPV phase is considered pre-SPC and provides
the ability to analyze process performance based on
a limited data set to gain understanding of the normal
process variability in the commercial facility. This phase
should include enough batches to provide data to reflect
the range of potential variability and allow statistical
process ranges to be established. During this phase, charts
are run using the specifications based on PPQ, clinical and
process characterization information. Data collected will
be used to identify possible trends and to demonstrate
that the process remains in a state of control. For A-Mab,
the initial CPV phase will continue until at least 30 batches
have been produced (this is assuming one upstream cell
culture batch feeds one downstream purification batch).
It is worth noting that, though 30 batches are suggested
as the minimum number to form a representative data set,
this should not be regarded as a ‘magic number’. Many
introductory statistical texts cite 30 as a reasonable
start for independent data that fit approximately the
description of a Normal distribution. But, the actual
sample size needed to establish variation with a good level
of confidence could involve a larger number of batches.
It is recommended that a statistician is consulted in the
context of a particular data set.
At the conclusion of the initial CPV phase, alert limits for
the monitored parameters should be established where
applicable, if they do not already exist, or to justify the
alert limits that have been set. Additionally, the risk
assessment performed following completion of the PPQ
batches should be reviewed to determine whether the
additional process experience has changed the risk score
for the monitored parameters. Trends in process related
non-conformances should also be included in the review
of the risk assessment, and this should involve considering
whether parameters not originally included in the plan
for the initial CPV phase ought to be added. Should there
be an increase or decrease in risk for the monitored
parameters, or a noted non-conformance trend for a
parameter which was not previously monitored for CPV
analysis, the plan may be revised to reflect the updated
process understanding and risk analysis prior to initiation
of the long-term CPV phase.
©BioPhorum Operations Group Ltd | April 2020 Continued Process Verification : An industry position paper with example plan 50
Phase 2: Long-term CPV Phase
The long-term CPV phase is the statistical process control
phase. This phase has the following objectives:
• Ongoing verification of the process over the
lifetime of the product to demonstrate the process
remains in control;
• Identify trends which may be within the normal
process variability, but indicate a potential to trend
outside the alert limits;
• Continue to build understanding of the sources of
variability in the process and their impact.
Section 10 provides detail proposing how monitored items
fit into the plans for short-term and long-term CPV.
8.2 Frequency of AnalysisA documented analysis and conclusion as to whether
the process remains in a state of control (a CPV Report)
may be performed based on the production schedule.
For example, the CPV plan might include the following
conditions for a particular product like A-Mab:
• Campaign (< 10 batches) – Minimally at the
conclusion of the campaign;
• Campaign (> 10 batches) – Minimally every 10
batches, and at the conclusion of the campaign, or
at a predetermined time interval (e.g. quarterly);
• Continuous – Minimally every 10 batches, or at a
predetermined time interval;
• A frequency preference of every 10 batches
has been selected to enable trend identification
via typical tests for special causes of variation
in control charts. Note that analysis will be
performed as described in section 9 per the
requirements of the phase of CPV analysis.
Frequency of documented analysis and conclusion
may be increased when greater than desired
process variability is noted or if conclusions are
needed to support product disposition.
It is important to note that these statements are given as
an example for a product like A-Mab, being manufactured
at a frequency of the order of two to ten batches a month.
Even so, formal CPV Reports are only likely to be created
up to four times a year. For products where the frequency
of batch manufacture is low e.g. once a year, it wouldn’t
make sense to have more than one CPV Report a year.
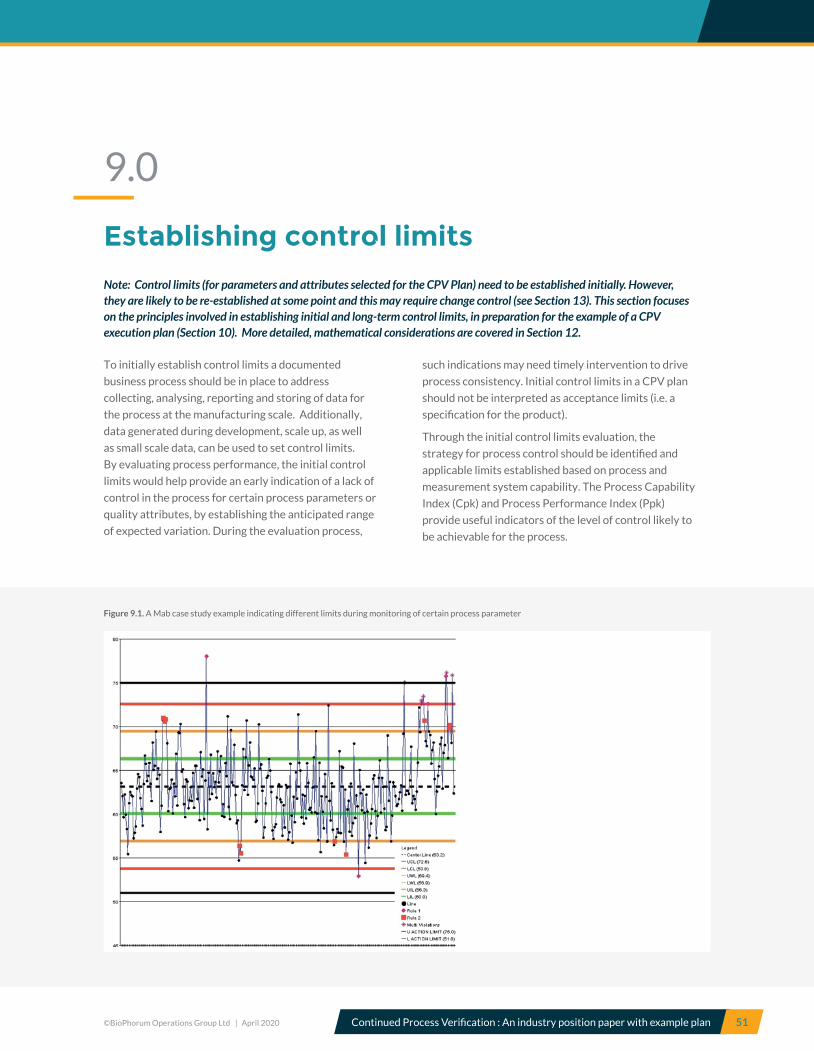
©BioPhorum Operations Group Ltd | April 2020 Continued Process Verification : An industry position paper with example plan 51
Figure 9.1. A Mab case study example indicating different limits during monitoring of certain process parameter
9.0
Establishing control limits
Note: Control limits (for parameters and attributes selected for the CPV Plan) need to be established initially. However, they are likely to be re-established at some point and this may require change control (see Section 13). This section focuses on the principles involved in establishing initial and long-term control limits, in preparation for the example of a CPV execution plan (Section 10). More detailed, mathematical considerations are covered in Section 12.
To initially establish control limits a documented
business process should be in place to address
collecting, analysing, reporting and storing of data for
the process at the manufacturing scale. Additionally,
data generated during development, scale up, as well
as small scale data, can be used to set control limits.
By evaluating process performance, the initial control
limits would help provide an early indication of a lack of
control in the process for certain process parameters or
quality attributes, by establishing the anticipated range
of expected variation. During the evaluation process,
such indications may need timely intervention to drive
process consistency. Initial control limits in a CPV plan
should not be interpreted as acceptance limits (i.e. a
specification for the product).
Through the initial control limits evaluation, the
strategy for process control should be identified and
applicable limits established based on process and
measurement system capability. The Process Capability
Index (Cpk) and Process Performance Index (Ppk)
provide useful indicators of the level of control likely to
be achievable for the process.

©BioPhorum Operations Group Ltd | April 2020 Continued Process Verification : An industry position paper with example plan 52
The means of establishing SPC limits for an initial period
and for the long-term, is described in detail in Section
12.4. Additionally, an SPC chart showing different limits:
upper and lower control limits (UCL, LCL), being the
most commonly used and arguably important for many
data sets, is presented in the Figure 9-1. If insufficient
data are available, either with a new process or after a
major process/assay change, initial, temporary limits
may be proposed, based on available development,
initial small scale data and process knowledge. If so,
small scale models should be appropriately developed
and qualified in order to guarantee the scale process is
representative and predictable.
Statistical and scientific rationale should pre-determine
what data set is required. Once sufficient at-scale data are
available long-term SPC limits can be established.
Understanding which elements (e.g. raw materials,
operators, facility etc.) contribute to common-cause
variation may depend on the relevance and knowledge
of the specific process, and will help to set relevant
and appropriate SPC limits. This requires the inclusion
of sufficient data (initially determined or statistically
relevant) to capture long-term common-cause variation.
Factors that may lead to variation include for example:
pack-to-pack variation in chromatography columns,
measurement system recalibrations, raw material lot-to-
lot variability, etc.
The calculation of control limits depends on an assumption
that data is normally distributed and each datum point is
independent. This may not always be the case, and data
transformation can be helpful in making data meet the
assumptions of normality. Process knowledge may help
in transforming data to a more SPC-amenable form. For
example when a known and codified relationship exists
between process parameters and QAs, normalizing the
data (taking into account the available process knowledge)
can lead to a more relevant and reliable value for trending.
Data distribution should be considered when selecting
analysis tools. The method of reporting each data set
should be defined and approved in applicable GMP
documentation. All excursions outside approved
documentation should be further investigated, justified
and documented in appropriate GMP documentation.
When more data are available, calculated SPC limits
can be identified. The SPC limits should be periodically
reviewed to capture process variability and be brought
into line with any new regulatory or quality guidance or
additional CPV Plan requirements. Established SPC limits
should be reviewed in light of process changes to confirm
their continuing validity and may be adjusted in response
to generation of additional data. The process monitoring
procedure, as well as process capability review, should
be established in applicable documentation (e.g. the
CPV Plan). With a given frequency of analysis, further
statistical examination is required to determine if the
results suggest a potential impact on the product.
This is described further in Section 10. Multiple data
sources and applicable analysis should be organized and
integrated in appropriate process data analysis tools.
Subsequent statistical tools should be appropriate for the
data to be analyzed (see Section 12).
©BioPhorum Operations Group Ltd | April 2020 Continued Process Verification : An industry position paper with example plan 53
SECTION 10.0
10.0
Example CPV execution plan for drug substance After completion of the PPQ, continued process verification should demonstrate that the process is in control. In the words of the FDA guidance from 2011, it should offer: ‘assurance that the process is reasonably protected against sources of variability that could affect production output, cause supply problems, and negatively affect public health’5. A monitoring and trending program for the A-Mab drug substance process parameters and attributes is outlined in this section, but the reader should view the discussion and content of the tables as recommendations and ensure that the parameters and values they use are appropriate for their product and process. It is applicable for both initial and long-term monitoring of the drug substance manufacturing process. Selection of variables for monitoring is based on information and rationale in Sections 5 and 7.
Note: This plan sub-section is neither a minimalistic nor
comprehensive listing of variables expected for CPV
monitoring. Rather we attempt to maintain a reasonable
consistency with the A-Mab case study to provide an example
of likely CPV variables associated with a product launch
(where in this case, understanding of variability is not evident
immediately after completing a platform-based Process
Validation (PV) Stage 2 PPQ with only two commercial scale
batches of the particular A-Mab molecule). This is meant to
demonstrate reliable process control and ability to detect
process drift. Commercial scale process data for legacy
processes would likely be available and may justify a smaller
set of CPV monitored variables. It is emphasized that this is
an untested example package for consideration, not general
guidance or proven best practice approach.
Continued assurance of consistent process performance
and identification of potential out of trend results is
achieved by applying SPC rules and capability analysis
(Ppk) as discussed in Section 12. CPV datasets enable
process capability predictions with higher confidence,
deepen process understanding, and improve process
robustness by increasing the likelihood of detecting
sources of process variability before they cause batch
failures. The CS is updated based upon reviews of related
risk assessments, as a part of assessing accumulated CPV
data in summary CPV Reports. CPV should be integrated
into the organization’s development process and quality
system. A CPV Master Plan may be used across a
corporation, to guide development of product specific CPV
procedures including the incorporation of outputs from
Stage 1 and Stage 2 (e.g., CQA, CPP). CPV output (from the
executed plan) will be documented and summarized at a
frequency defined by the plan. Figure 10.1 is a schematic
showing the continuity of review in the product lifecycle.

©BioPhorum Operations Group Ltd | April 2020 Continued Process Verification : An industry position paper with example plan 54
Figure 10.1: Continued review as part of the product lifecycle.
Process UnderstandingCPP/CQA’s
Risk Assessment ReviewProcess Knowledge Report
Process AnalysisInitial Process Performance
Evaluation Acceptance & ReleaseOngoing Process Monitoring
CpK Statistics DatabaseAnnual Product Review
ContinuousQuality
Monitoringand Feedback
Process Control Strategy
Batch Record DataSpecifications
ContinuousProcess
ImprovementChange
ManagementDocumentation
ProductQuality
12
34

©BioPhorum Operations Group Ltd | April 2020 Continued Process Verification : An industry position paper with example plan 55
The A-Mab case study (and assumed post-PPQ CS)
contains information on the linkage between product
quality attributes and CPPs across the eleven process
steps. These relationships and the relationships between
KPPs and KPAs are specific to each step. Therefore, this
section is divided into tables for each (Steps 1 through
11, plus BDS) in order to list process parameters and
attributes to be monitored to verify process control over
the entire lifetime of manufacturing the drug substance.
Non-routine sampling and specific data gathering will
augment routine sampling and data recording to generate
the data for trending and monitoring under this CPV plan.
For the tables presented in this section, CPV process
variables and their classification are listed in Columns
A and B, as recommended earlier in Section 7. Column
C includes information on any data treatment required
before graphing to monitor trends. ‘Unadjusted’ raw data
are measurement results (source data) that are directly
charted. ‘Converted’ data indicate that monitoring the
process variable involves treatment of measured results
and either combining with other process data (e.g. yield is
a ratio of combined raw data) or standardizing to match
the intent of control limits (e.g. weight measurements
converted to volume or converting totalized flow
through volume to column volumes). Raw (or converted)
data that is mathematically ‘transformed’ is a third type
of data treatment that may be required before charting
for trend monitoring.
Column D specifies the recommended SPC tool for
monitoring performance trends against control limits.
The tool listed is selected based on subject matter expert
experience with the process development history. The
chosen tool provides a means to visually review the data
and may be revised when the nature of the data is better
understood. The options included in the plan include:
‘individual run chart’ for data without initial control limits;
‘individual measurement chart‘ (a control chart) for data
that can be plotted with an expected fixed mean and
proposed control limits; ‘EWMA chart’ (Exponentially
Weighted Moving Average control chart) (see Section
12 for application); ‘3SD tunnel’ (a control chart with
+3 standard deviation control limits) for data that has a
dynamically changing mean during the batch processing
time (such as a VCC profile, UV chromatogram, or UF/DF
flow rate); or ‘exception flag’ which uses routine process
monitoring for process parameters and reporting of any
out of range result (exception). Any custom correlations
that are developed during CPV would also be shown in this
column (e.g. VCC versus dCO2, or step processing time
versus step yield).
Column E identifies plan monitoring requirements for
an initial short-term CPV period of manufacturing which
follows completion of PPQ in order to obtain sufficient
data to set long-term control limits (unless limits already
exist with sufficient confidence and understanding of the
expected long-term normal variation). This period is based
on a minimum number of independent batch experiences,
e.g. 30 as mentioned in Section 8.1 (with a reminder to
consider that raw material lot impact experience may
lag process lot experience), or achieving a target Ppk for
the variable’s range of control. Proposed initial control
limits to use when starting CPV baseline monitoring are
given in column F and are based on assumed PPQ criteria
for A-Mab, or a fictitious control range proposed after
completing the process validation Stage 2 effort. See
Section 9 for more information on establishing initial
control limits.
Note: Due to various strategies for combining batches in
manufacturing, 30 completed batches may not necessarily
be sourced from 30 independent vial thaws; or use 30
uniquely prepared lots of the involved solutions; or employ
30 different raw material lots (which could be sub-lots
of fewer supplier bulk lots); or may not produce 30 drug
substance or drug product batches. Awareness and
tracking of different lot counts for different variables is
important information during CPV.
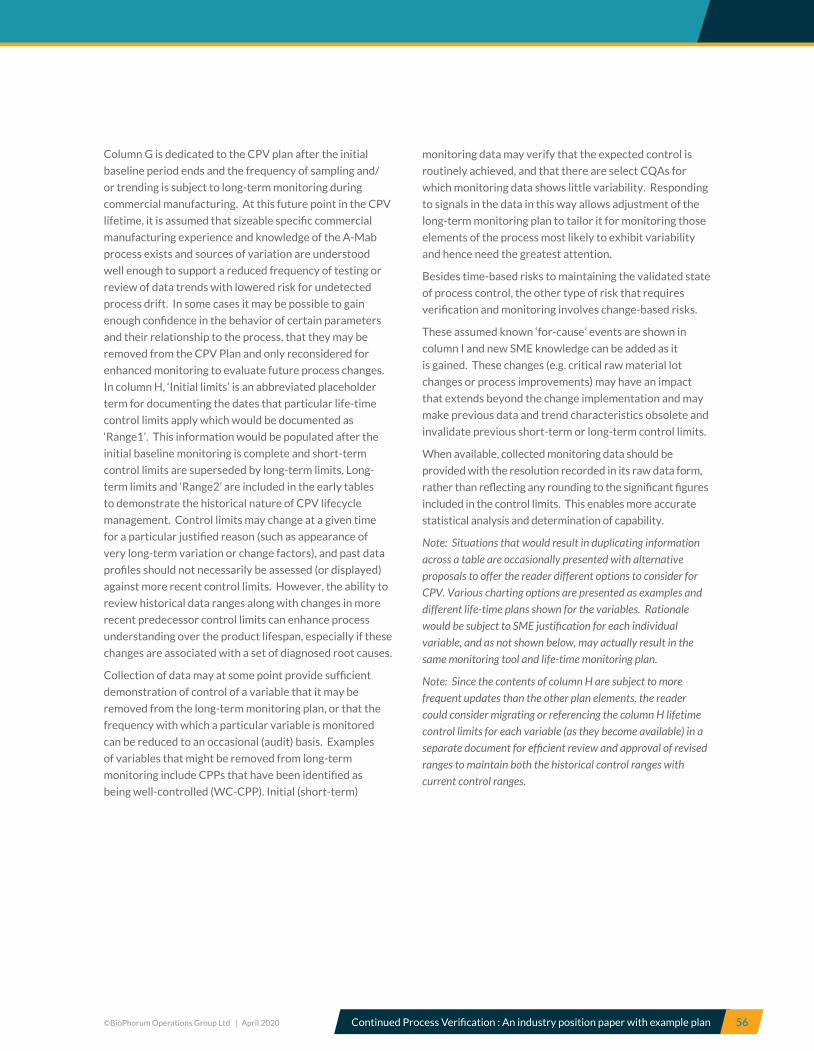
©BioPhorum Operations Group Ltd | April 2020 Continued Process Verification : An industry position paper with example plan 56
Column G is dedicated to the CPV plan after the initial
baseline period ends and the frequency of sampling and/
or trending is subject to long-term monitoring during
commercial manufacturing. At this future point in the CPV
lifetime, it is assumed that sizeable specific commercial
manufacturing experience and knowledge of the A-Mab
process exists and sources of variation are understood
well enough to support a reduced frequency of testing or
review of data trends with lowered risk for undetected
process drift. In some cases it may be possible to gain
enough confidence in the behavior of certain parameters
and their relationship to the process, that they may be
removed from the CPV Plan and only reconsidered for
enhanced monitoring to evaluate future process changes.
In column H, ‘Initial limits’ is an abbreviated placeholder
term for documenting the dates that particular life-time
control limits apply which would be documented as
‘Range1’. This information would be populated after the
initial baseline monitoring is complete and short-term
control limits are superseded by long-term limits. Long-
term limits and ‘Range2’ are included in the early tables
to demonstrate the historical nature of CPV lifecycle
management. Control limits may change at a given time
for a particular justified reason (such as appearance of
very long-term variation or change factors), and past data
profiles should not necessarily be assessed (or displayed)
against more recent control limits. However, the ability to
review historical data ranges along with changes in more
recent predecessor control limits can enhance process
understanding over the product lifespan, especially if these
changes are associated with a set of diagnosed root causes.
Collection of data may at some point provide sufficient
demonstration of control of a variable that it may be
removed from the long-term monitoring plan, or that the
frequency with which a particular variable is monitored
can be reduced to an occasional (audit) basis. Examples
of variables that might be removed from long-term
monitoring include CPPs that have been identified as
being well-controlled (WC-CPP). Initial (short-term)
monitoring data may verify that the expected control is
routinely achieved, and that there are select CQAs for
which monitoring data shows little variability. Responding
to signals in the data in this way allows adjustment of the
long-term monitoring plan to tailor it for monitoring those
elements of the process most likely to exhibit variability
and hence need the greatest attention.
Besides time-based risks to maintaining the validated state
of process control, the other type of risk that requires
verification and monitoring involves change-based risks.
These assumed known ‘for-cause’ events are shown in
column I and new SME knowledge can be added as it
is gained. These changes (e.g. critical raw material lot
changes or process improvements) may have an impact
that extends beyond the change implementation and may
make previous data and trend characteristics obsolete and
invalidate previous short-term or long-term control limits.
When available, collected monitoring data should be
provided with the resolution recorded in its raw data form,
rather than reflecting any rounding to the significant figures
included in the control limits. This enables more accurate
statistical analysis and determination of capability.
Note: Situations that would result in duplicating information
across a table are occasionally presented with alternative
proposals to offer the reader different options to consider for
CPV. Various charting options are presented as examples and
different life-time plans shown for the variables. Rationale
would be subject to SME justification for each individual
variable, and as not shown below, may actually result in the
same monitoring tool and life-time monitoring plan.
Note: Since the contents of column H are subject to more
frequent updates than the other plan elements, the reader
could consider migrating or referencing the column H lifetime
control limits for each variable (as they become available) in a
separate document for efficient review and approval of revised
ranges to maintain both the historical control ranges with
current control ranges.
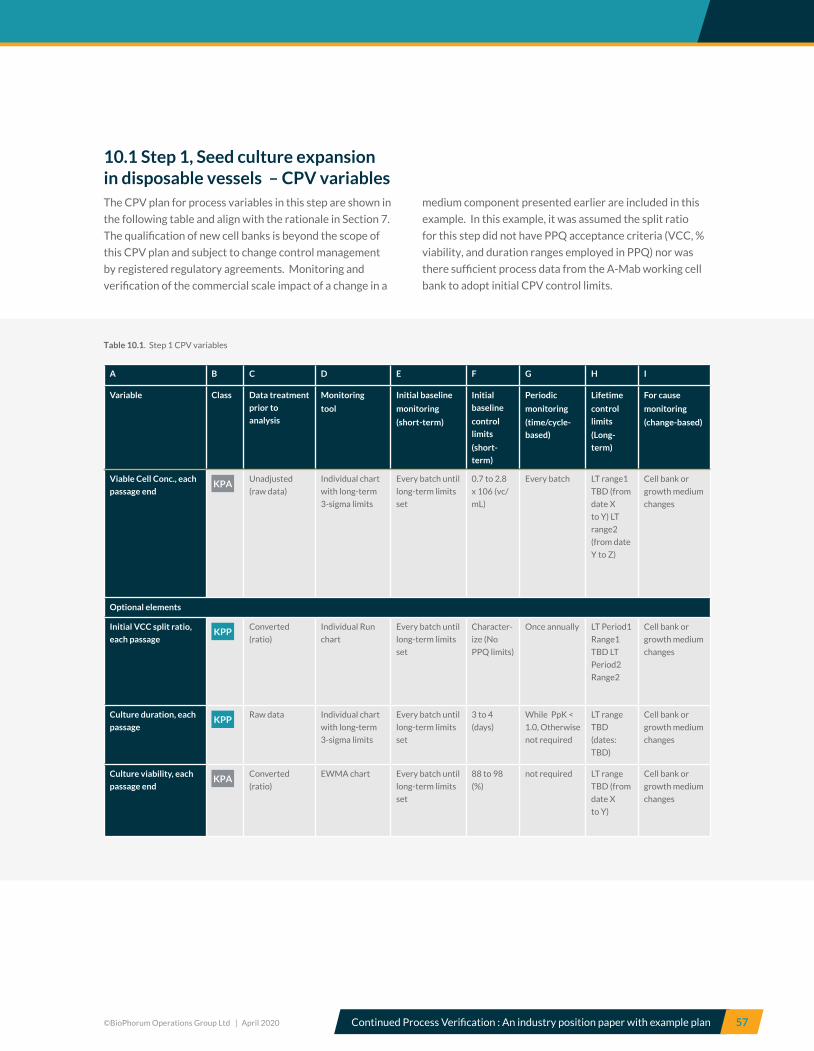
©BioPhorum Operations Group Ltd | April 2020 Continued Process Verification : An industry position paper with example plan 57
Table 10.1. Step 1 CPV variables
10.1 Step 1, Seed culture expansion in disposable vessels – CPV variablesThe CPV plan for process variables in this step are shown in
the following table and align with the rationale in Section 7.
The qualification of new cell banks is beyond the scope of
this CPV plan and subject to change control management
by registered regulatory agreements. Monitoring and
verification of the commercial scale impact of a change in a
medium component presented earlier are included in this
example. In this example, it was assumed the split ratio
for this step did not have PPQ acceptance criteria (VCC, %
viability, and duration ranges employed in PPQ) nor was
there sufficient process data from the A-Mab working cell
bank to adopt initial CPV control limits.
A B C D E F G H I
Variable Class Data treatment
prior to
analysis
Monitoring
tool
Initial baseline
monitoring
(short-term)
Initial
baseline
control
limits
(short-
term)
Periodic
monitoring
(time/cycle-
based)
Lifetime
control
limits
(Long-
term)
For cause
monitoring
(change-based)
Viable Cell Conc., each
passage endKPA
Unadjusted
(raw data)
Individual chart
with long-term
3-sigma limits
Every batch until
long-term limits
set
0.7 to 2.8
x 106 (vc/
mL)
Every batch LT range1
TBD (from
date X
to Y) LT
range2
(from date
Y to Z)
Cell bank or
growth medium
changes
Optional elements
Initial VCC split ratio,
each passageKPP
Converted
(ratio)
Individual Run
chart
Every batch until
long-term limits
set
Character-
ize (No
PPQ limits)
Once annually LT Period1
Range1
TBD LT
Period2
Range2
Cell bank or
growth medium
changes
Culture duration, each
passageKPP
Raw data Individual chart
with long-term
3-sigma limits
Every batch until
long-term limits
set
3 to 4
(days)
While PpK <
1.0, Otherwise
not required
LT range
TBD
(dates:
TBD)
Cell bank or
growth medium
changes
Culture viability, each
passage endKPA
Converted
(ratio)
EWMA chart Every batch until
long-term limits
set
88 to 98
(%)
not required LT range
TBD (from
date X
to Y)
Cell bank or
growth medium
changes

©BioPhorum Operations Group Ltd | April 2020 Continued Process Verification : An industry position paper with example plan 58
Table 10.2. Step 2 CPV variables
10.2 Step 2, Seed culture expansion in bioreactors – CPV variablesThe CPV plan for process variables in this step is shown
in the following table and follows the rationale in Section
7. Monitoring and verification of the commercial scale
impact of a change in a medium component presented
earlier is included in this example. It was assumed the
cell culture split ratio for this step had sufficient data for
the expected bioreactor expansion performance to adopt
initial control limits.
A B C D E F G H I
Variable Class Data treatment
prior to
analysis
Monitoring
tool
Initial baseline
monitoring
(short-term)
Initial
baseline
control
limits
(short-
term)
Periodic
monitoring
(time/cycle-
based)
Lifetime
control
limits
(Long-
term)
For cause
monitoring
(change-based)
Viable Cell Conc., each
passage endKPA
Unadjusted
(raw data)
Individual chart
with long-term
3-sigma limits
Every batch until
long-term limits
set
3.9 to 6.0 x
106
(vc/mL)
Every batch LT range
TBD
(from date
X to Y)
Cell bank or
growth medium
changes
Optional elements
Initial VCC split ratio,
each passageKPP
Converted
(ratio)
Individual Run
chart
Every batch until
long-term limits
set
3.0 to 4.1 Once annually LT range
TBD
(from date
X to Y)
Cell bank or
growth medium
changes
Culture duration, each
passageKPP
Unadjusted (x.x
resolution)
Individual chart
with long-term
3-sigma limits
Every batch until
long-term limits
set
3 to 5
(days)
While PpK
< 1.0,
Otherwise not
required
LT range
TBD
(from date
X to Y)
Cell bank or
growth medium
changes
Culture viability, each
passage endKPA
Converted
(ratio)
Individual chart
with long-term
3-sigma limits
Every batch until
long-term limits
set
90 to 99
(%)
not required LT range
TBD
(from date
X to Y)
Cell bank or
growth medium
changes

©BioPhorum Operations Group Ltd | April 2020 Continued Process Verification : An industry position paper with example plan 59
Table 10.3. Step 3 CPV variables
10.3 Step 3, Production culture bioreactor – CPV variablesTo be consistent with the status of the A-mab case
study when this plan is initiated, the option of creating a
time-dependent multivariate PLS (partial least squares)
bioreactor model is a CPV objective, based on previous
successful experiences25. The A-mab case study [3,
Section 3.10, Page 107-109] describes a principle
components bioreactor model as a predictor of acceptable
oligosaccharide structure and acidic variant CQAs. The
parameter inputs to the model include temperature and
pH, and attribute inputs to the model include titer, VCC,
and viability. All these variables are included individually
for CPV monitoring while the bioreactor model is qualified.
The output of the model for each batch is classified as a
KPA. The potential added value in using the model is in
ensuring internal correlations among different variables
are considered. In the future, the values generated from
this model may provide a multivariate output for trend
monitoring that is predictive of process performance, with
its own alert and action limits.
A fixed volume of nutrient feed is added at a
defined time under automation and routine batch
document controls, therefore trending the amount
and timing of the nutrient feed addition does
not provide value because they are not subject
to random variation. Production cultures are
harvested within an acceptable duration based on
viability and titer considerations.
Temperature and pH are continuously feedback
controlled to set points, during the 16 to 18 day
culture but measured values are dynamic over that
time period. Therefore, 3SD tunnels (the range
defined by the mean + 3 standard deviations) for the
parameter profiles will be developed during the initial
CPV period, to generate an expected ’conduit’ for
results when tracking consistent control of the CPP.
A B C D E F G H I
Variable Class Data treatment
prior to
analysis
Monitoring
tool
Initial baseline
monitoring
(short-term)
Initial
baseline
control
limits
(short-
term)
Periodic
monitoring
(time/cycle-
based)
Lifetime
control
limits
(Long-
term)
For cause
monitoring
(change-based)
Culture durationCPP
Unadjusted
(x.x resolution)
Individual chart
with long-term
3-sigma limits
Every batch until
long-term limits
set
16 to 18
(days)
Every batch LT range
TBD
(dates:
TBD)
Change in cell
bank, culture
medium,
or process
setpoint
Maximum pCO2CPP
Unadjusted
(raw data)
Individual chart
with long-term
3-sigma limits
Every batch
until long-term
limits set, also
correlate w/
IVCA
45 to 140
(mmHg)
Every batch LT range
TBD
(dates:
TBD)
Change in cell
bank, culture
medium,
or process
setpoint

©BioPhorum Operations Group Ltd | April 2020 Continued Process Verification : An industry position paper with example plan 60
Table 10.3. Step 3 CPV variables
A B C D E F G H I
Variable Class Data
treatment
prior to
analysis
Monitoring
tool
Initial baseline
monitoring
(short-term)
Initial
baseline
control limits
(short-term)
Periodic
monitoring
(time/cycle-
based)
Lifetime
control
limits
(Long-term)
For cause
monitoring
(change-based)
Culture durationCPP
Unadjusted
(x.x
resolution)
Individual chart
with long-term
3-sigma limits
Every batch until
long-term limits
set
16 to 18
(days)
Every batch LT range
TBD (dates:
TBD)
Change in cell
bank, culture
medium,
or process
setpoint
Bioreactor pHCPP
Unadjusted
(raw data)
3SD tunnel Every batch until
long-term limits
set for reference
6.75 to 6.95
(-log [H+])
Not required,
included in
PLS model
See PLS
model, LT
range TBD
(dates:
TBD)
Change in cell
bank, culture
medium,
or process
setpoint
Afucosylated glycansCQA
Unadjusted
(raw results)
Individual chart
with long-term
3-sigma limits
Required
for model
qualification only
5 to 10 (%) Once annually
(time 0
of annual
stability
batch)
LT range 5
to 10 Initial
to current
date
Change in cell
bank, culture
medium,
or process
setpoint
Galactosylated glycansCQA
Unadjusted
(raw results)
Individual chart
with long-term
3-sigma limits
Required
for model
qualification only
15 to 35 (%) Once annually
(time 0
of annual
stability
batch)
LT range 15
to 35 Initial
to current
date
Change in cell
bank, culture
medium,
or process
setpoint
PLS model employing
pH, DO, temperature,
pressure, gas rates,
weight, VCC, viability,
titer, glucose, lactate
KPAConverted &
transformed
Custom
PLS model
PCA t1
Every batch until
model is > 95%
predictive
Trajectory
versus time
± 3 StDev
Every batch LT range
TBD
(dates: TBD
Change in cell
bank,
culture medium,
or
process
setpoint
Product yield (titer) at
HarvestKPA
Unadjusted
(raw data)
Individual chart
with long-term
3-sigma limits
Every batch until
long-term limits
set
and PpK >1.0
4.0 to 5.5
(g/L)
Not required,
included in
PLS model
See PLS
model,
LT range
TBD
(dates:
TBD)
Change in cell
bank,
culture medium,
or
process
setpoint
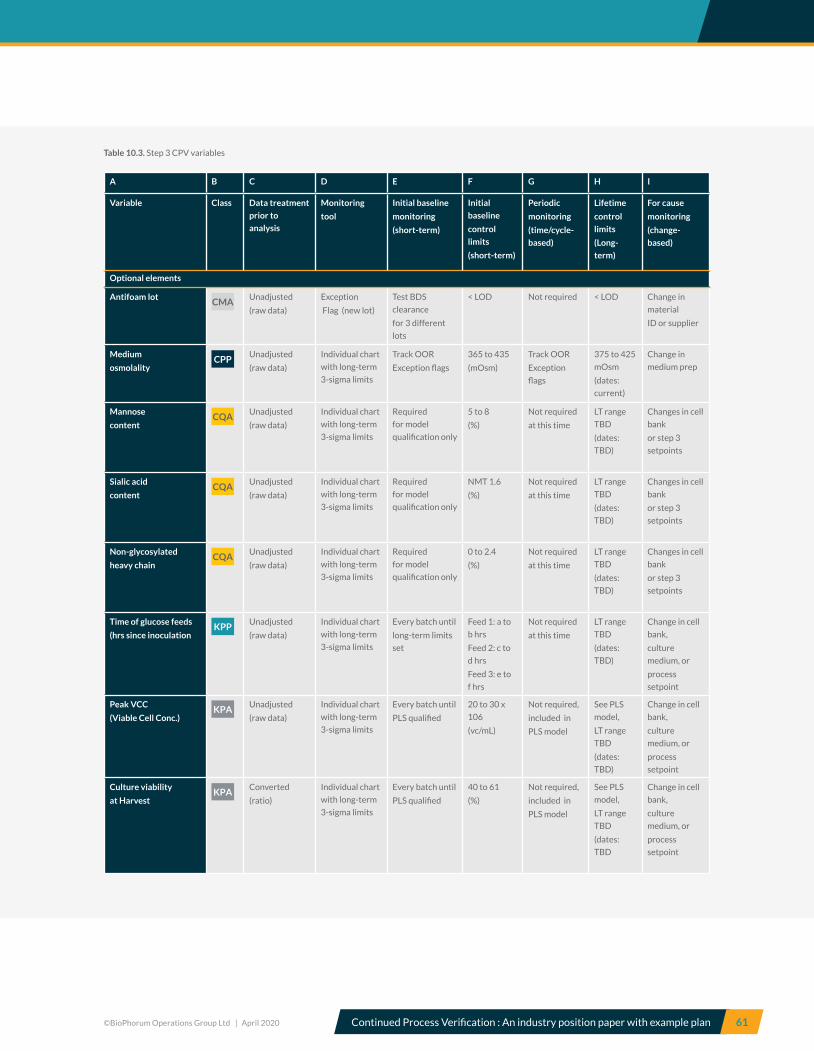
©BioPhorum Operations Group Ltd | April 2020 Continued Process Verification : An industry position paper with example plan 61
Table 10.3. Step 3 CPV variables
A B C D E F G H I
Variable Class Data treatment
prior to
analysis
Monitoring
tool
Initial baseline
monitoring
(short-term)
Initial
baseline
control
limits
(short-term)
Periodic
monitoring
(time/cycle-
based)
Lifetime
control
limits
(Long-
term)
For cause
monitoring
(change-
based)
Optional elements
Antifoam lotCMA
Unadjusted
(raw data)
Exception
Flag (new lot)
Test BDS
clearance
for 3 different
lots
< LOD Not required < LOD Change in
material
ID or supplier
Medium
osmolalityCPP
Unadjusted
(raw data)
Individual chart
with long-term
3-sigma limits
Track OOR
Exception flags
365 to 435
(mOsm)
Track OOR
Exception
flags
375 to 425
mOsm
(dates:
current)
Change in
medium prep
Mannose
contentCQA
Unadjusted
(raw data)
Individual chart
with long-term
3-sigma limits
Required
for model
qualification only
5 to 8
(%)
Not required
at this time
LT range
TBD
(dates:
TBD)
Changes in cell
bank
or step 3
setpoints
Sialic acid
contentCQA
Unadjusted
(raw data)
Individual chart
with long-term
3-sigma limits
Required
for model
qualification only
NMT 1.6
(%)
Not required
at this time
LT range
TBD
(dates:
TBD)
Changes in cell
bank
or step 3
setpoints
Non-glycosylated
heavy chainCQA
Unadjusted
(raw data)
Individual chart
with long-term
3-sigma limits
Required
for model
qualification only
0 to 2.4
(%)
Not required
at this time
LT range
TBD
(dates:
TBD)
Changes in cell
bank
or step 3
setpoints
Time of glucose feeds
(hrs since inoculationKPP
Unadjusted
(raw data)
Individual chart
with long-term
3-sigma limits
Every batch until
long-term limits
set
Feed 1: a to
b hrs
Feed 2: c to
d hrs
Feed 3: e to
f hrs
Not required
at this time
LT range
TBD
(dates:
TBD)
Change in cell
bank,
culture
medium, or
process
setpoint
Peak VCC
(Viable Cell Conc.) KPA
Unadjusted
(raw data)
Individual chart
with long-term
3-sigma limits
Every batch until
PLS qualified
20 to 30 x
106
(vc/mL)
Not required,
included in
PLS model
See PLS
model,
LT range
TBD
(dates:
TBD)
Change in cell
bank,
culture
medium, or
process
setpoint
Culture viability
at HarvestKPA
Converted
(ratio)
Individual chart
with long-term
3-sigma limits
Every batch until
PLS qualified
40 to 61
(%)
Not required,
included in
PLS model
See PLS
model,
LT range
TBD
(dates:
TBD
Change in cell
bank,
culture
medium, or
process
setpoint
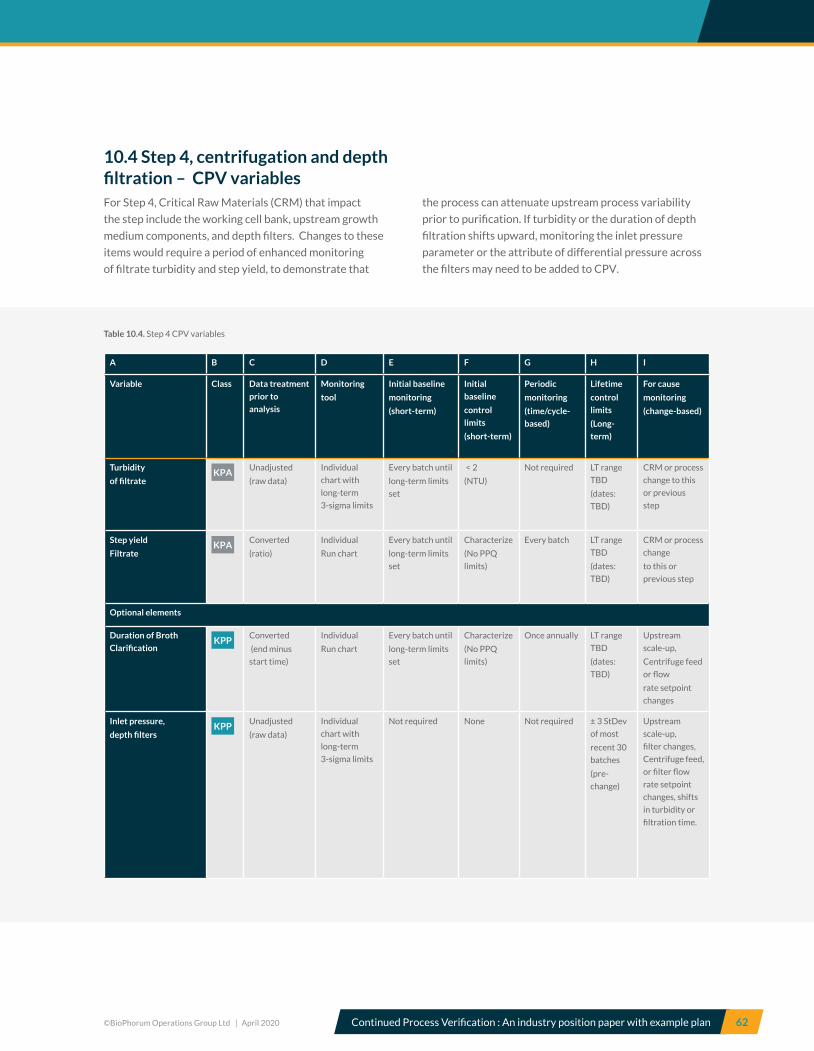
©BioPhorum Operations Group Ltd | April 2020 Continued Process Verification : An industry position paper with example plan 62
Table 10.4. Step 4 CPV variables
10.4 Step 4, centrifugation and depth filtration – CPV variablesFor Step 4, Critical Raw Materials (CRM) that impact
the step include the working cell bank, upstream growth
medium components, and depth filters. Changes to these
items would require a period of enhanced monitoring
of filtrate turbidity and step yield, to demonstrate that
the process can attenuate upstream process variability
prior to purification. If turbidity or the duration of depth
filtration shifts upward, monitoring the inlet pressure
parameter or the attribute of differential pressure across
the filters may need to be added to CPV.
A B C D E F G H I
Variable Class Data treatment
prior to
analysis
Monitoring
tool
Initial baseline
monitoring
(short-term)
Initial
baseline
control
limits
(short-term)
Periodic
monitoring
(time/cycle-
based)
Lifetime
control
limits
(Long-
term)
For cause
monitoring
(change-based)
Turbidity
of filtrateKPA
Unadjusted
(raw data)
Individual
chart with
long-term
3-sigma limits
Every batch until
long-term limits
set
< 2
(NTU)
Not required LT range
TBD
(dates:
TBD)
CRM or process
change to this
or previous
step
Step yield
FiltrateKPA
Converted
(ratio)
Individual
Run chart
Every batch until
long-term limits
set
Characterize
(No PPQ
limits)
Every batch LT range
TBD
(dates:
TBD)
CRM or process
change
to this or
previous step
Optional elements
Duration of Broth
ClarificationKPP
Converted
(end minus
start time)
Individual
Run chart
Every batch until
long-term limits
set
Characterize
(No PPQ
limits)
Once annually LT range
TBD
(dates:
TBD)
Upstream
scale-up,
Centrifuge feed
or flow
rate setpoint
changes
Inlet pressure,
depth filtersKPP
Unadjusted
(raw data)
Individual
chart with
long-term
3-sigma limits
Not required None Not required ± 3 StDev
of most
recent 30
batches
(pre-
change)
Upstream
scale-up,
filter changes,
Centrifuge feed,
or filter flow
rate setpoint
changes, shifts
in turbidity or
filtration time.

©BioPhorum Operations Group Ltd | April 2020 Continued Process Verification : An industry position paper with example plan 63
10.5 Step 5, Protein A chromatography – CPV variablesInitial control limits for load ratio and elution buffer pH
are assumed, based on a simulated normal range within
the DOE PAR provided in the A-Mab case study. Likewise,
the short-term residual protein A control limits are based
on the outcome of a fictional study done after PPQ at
small scale, which examined the capacity for high cycle
count AEX resin to clear protein A (spiking study) and,
characterization of potential Protein A leachate from both
high and low use cycle counts with respect to resin storage
time. Note that elution buffer pH data is included while
the limits for the HCP model are generated.
Table 10.5. Step 5 CPV variables
A B C D E F G H I
Variable Class Data treatment
prior to
analysis
Monitoring
tool
Initial baseline
monitoring
(short-term)
Initial
baseline
control
limits
(short-term)
Periodic
monitoring
(time/cycle-
based)
Lifetime
control
limits
(Long-
term)
For cause
monitoring
(change-
based)
Protein Load Ratio
(in HCP model)
Each sub-batch
CPPConverted
(ratio)
Individual chart
with long-term
3-sigma limits
Every batch until
long-term limits
set
15 to 40
(g A-mAb/L
resin)
Every batch LT range
TBD
(dates:
TBD)
Resin, or
process
change to this
or previous
step
Elution buffer
pH (in HCP model)CPP
Unadjusted
(x.xx resolution)
Individual chart
with long-term
3-sigma limits
Every batch until
HCP model
limits set
3.4 to 3.8
(-log [H+])
Track OOR
Exception
flags
LT range
3.4 to 3.8
(dates:
initial to
current)
Buffer
formulation
scale-up
Residual Protein A
in eluate poolCQA
Unadjusted
(raw data)
w/ upper limit,
& correlation
vs. storage age
Every batch until
long-term limits
set
≤ 1234
(ng/mg
A-mAb)
Per resin/
column
lifetime
protocol
LT range
TBD
(dates:
TBD)
First two
cycles after
extended
storage
(≥ 3 months)
Step durationKPP
Converted
(elapsed)
Individual
Run chart
Every batch until
long-term limits
set
Characterize
(No PPQ
limits)
Once annually LT range
TBD
(dates:
TBD
Scale
increases
Step yieldKPA
Converted
(ratio)
Individual chart
with long-term
3-sigma limits
Every batch until
long-term limits
set
68 to 88
(%)
Every batch LT range
TBD
(dates:
TBD)
Reset range
for process
change to
this or
previous step

©BioPhorum Operations Group Ltd | April 2020 Continued Process Verification : An industry position paper with example plan 64
10.6 Step 6, Low pH treatment – CPV variablesThe viral safety risk CQA (inactivation of particular AVA)
for the A-Mab process has been validated in the small scale
model during Stage 1 process validation. Initial control
limits for inactivation time and pH are assumed, based on
a fictitious normal range within the DOE PAR provided in
the A-Mab case study. 3SD tunnel monitoring of pH during
inactivation ensures the parameter remains in range
throughout the inactivation time and it is not monitored
as a single point measurement. Aggregate results are
assumed to include a sum of all quantifiable non-monomer
SEC peaks (dimer, trimer, etc). Yield is not expected to
be impacted by this step and variability around 100% has
been associated with measurement uncertainty, therefore
it does not merit CPV trending or monitoring. The basis of
yield for the next step (7, CEX) begins from the eluate pool
of the previous step (5, Protein A).
Table 10.6. Step 6 CPV variables
A B C D E F G H I
Variable Class Data treatment
prior to
analysis
Monitoring
tool
Initial baseline
monitoring
(short-term)
Initial
baseline
control
limits
(short-term)
Periodic
monitoring
(time/cycle-
based)
Lifetime
control
limits
(Long-
term)
For cause
monitoring
(change-
based)
pH during
inactivationCPP
Unadjusted
(raw data)
3SD tunnel Every batch until
long-term tunnel
set
3.4 to 3.8
(-log [H+])
Every batch LT range
TBD
(dates:
TBD)
Scale
increases
Post inactivation
aggregatesCQA
Converted
(additive)
Individual chart
with long-term
3-sigma limits
Every batch until
long-term limits
end and PpK
>1.3
≤ 3.0
(%)
Once annually LT range
TBD
(dates:
TBD
Process
change
to this or
previous step
Optional elements
Inactivation
timeCPP
Converted
(elapsed)
Individual chart
with long-term
3-sigma limits
Every batch
until a
long-term sigma
set
80 to 120
(minutes)
Track OOR
Exception
flags
LT range
TBD
(dates:
TBD)
No known risk
events
Quantity of
acid addedKPP
Unadjusted
(raw data)
Individual chart
with long-term
3-sigma limits
Every batch
until a
long-term sigma
set
Characterize
(No PPQ
limits)
Not required LT range
TBD
(dates:
TBD)
Scale
increases

©BioPhorum Operations Group Ltd | April 2020 Continued Process Verification : An industry position paper with example plan 65
Table 10.7. Step 7 CPV variables
10.7 Step 7, Cation exchange chromatography – CPV variablesInitial control limits provided in the table below are
assumed, based on a fictitious normal range within
the DOE PAR provided in the A-Mab case study. Step
duration has a batch document control limit based on
platform experience, but for A-Mab CPV a typical range
will be determined for historical reference. Aggregate
results are assumed to include all quantifiable non-
monomer SEC peaks (dimer, trimer, etc).
A B C D E F G H I
Variable Class Data treatment
prior to
analysis
Monitoring
tool
Initial baseline
monitoring
(short-term)
Initial
baseline
control
limits
(short-term)
Periodic
monitoring
(time/cycle-
based)
Lifetime
control
limits
(Long-
term)
For cause
monitoring
(change-
based)
Protein Load Ratio
(in HCP model)CPP
Converted
(ratio)
Individual chart
with long-term
3-sigma limits
Every batch until
long-term limits
set
15 to 25
(g A-mAb/L
resin)
Every batch LT range
TBD
(dates:
TBD)
Process
change
to this or
previous step
Wash Conductivity
(in HCP model)CPP
Unadjusted
(x.x resolution)
Individual chart
with long-term
3-sigma limits
Every batch until
long-term limits
set
4 to 6
(mS/cm)
Track OOR
Exception
flags
LT range
TBD
(dates:
TBD)
Buffer
formulation
scale-up
Elution pHCPP
Unadjusted
(x.xx resolution)
3SD tunnel Every batch until
long-term tunnel
set
5.9 to 6.1
(-log [H+])
Every batch LT range
TBD
(dates:
TBD)
Process
change to
this or
previous step
Aggregates
in CEX eluate poolCQA
Converted
(additive)
Individual chart
with long-term
3-sigma limits
Every batch until
long term limits
set
and PpK >1.3
≤ 1.0
(%)
Per resin/
column
lifetime
protocol
LT range
TBD
(dates:
TBD)
Process
change to
this or
previous step
HCP content
in CEX eluate poolCQA
Unadjusted
(raw data)
Individual chart
with long-term
3-sigma limits
Every batch
until a
long-term sigma
set
≤ 130
(ppm)
Per resin/
column
lifetime
protocol
LT range
TBD
(dates:
TBD)
Process
change to
this or
previous step
CEX eluate volume
(each sub-batch)KPA
Unadjusted
(raw data)
Individual chart
with long-term
3-sigma limits
Every batch until
long-term limits
set
3.7 to 4.7
(CV)
Not Required LT range
TBD
(dates:
TBD)
Column pack
or repack
Step yieldKPA
Converted
(ratio)
Individual chart
with long-term
3-sigma limits
Every batch
until a
long-term sigma
set
83 to 97
(%)
Every batch LT range
TBD
(dates:
TBD)
Process
change to step
Optional elements
Step durationKPP
Converted
(elapsed
Individual
Run chart
Every batch until
long-term limits
set
Characterize
(No PPQ
limits)
Not Required LT range
TBD
(dates:
TBD)
Process
change to step
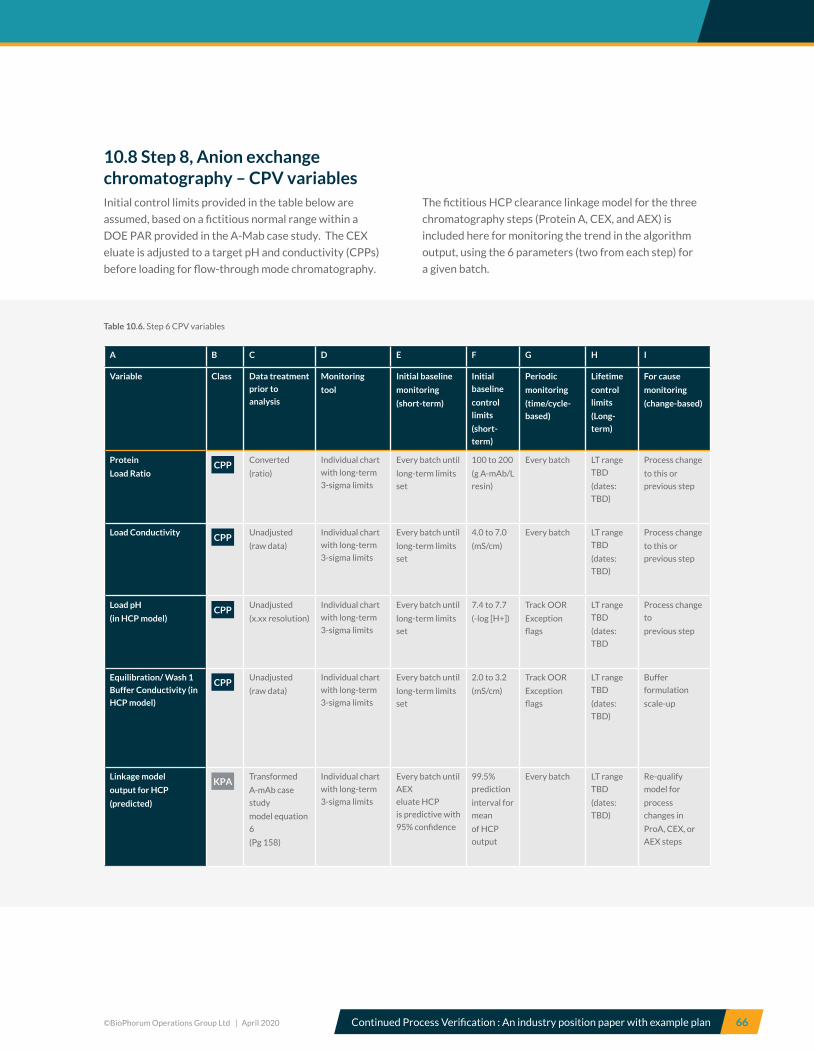
©BioPhorum Operations Group Ltd | April 2020 Continued Process Verification : An industry position paper with example plan 66
10.8 Step 8, Anion exchange chromatography – CPV variablesInitial control limits provided in the table below are
assumed, based on a fictitious normal range within a
DOE PAR provided in the A-Mab case study. The CEX
eluate is adjusted to a target pH and conductivity (CPPs)
before loading for flow-through mode chromatography.
The fictitious HCP clearance linkage model for the three
chromatography steps (Protein A, CEX, and AEX) is
included here for monitoring the trend in the algorithm
output, using the 6 parameters (two from each step) for
a given batch.
Table 10.6. Step 6 CPV variables
A B C D E F G H I
Variable Class Data treatment
prior to
analysis
Monitoring
tool
Initial baseline
monitoring
(short-term)
Initial
baseline
control
limits
(short-
term)
Periodic
monitoring
(time/cycle-
based)
Lifetime
control
limits
(Long-
term)
For cause
monitoring
(change-based)
Protein
Load Ratio CPP
Converted
(ratio)
Individual chart
with long-term
3-sigma limits
Every batch until
long-term limits
set
100 to 200
(g A-mAb/L
resin)
Every batch LT range
TBD
(dates:
TBD)
Process change
to this or
previous step
Load ConductivityCPP
Unadjusted
(raw data)
Individual chart
with long-term
3-sigma limits
Every batch until
long-term limits
set
4.0 to 7.0
(mS/cm)
Every batch LT range
TBD
(dates:
TBD)
Process change
to this or
previous step
Load pH
(in HCP model) CPP
Unadjusted
(x.xx resolution)
Individual chart
with long-term
3-sigma limits
Every batch until
long-term limits
set
7.4 to 7.7
(-log [H+])
Track OOR
Exception
flags
LT range
TBD
(dates:
TBD
Process change
to
previous step
Equilibration/ Wash 1
Buffer Conductivity (in
HCP model)
CPPUnadjusted
(raw data)
Individual chart
with long-term
3-sigma limits
Every batch until
long-term limits
set
2.0 to 3.2
(mS/cm)
Track OOR
Exception
flags
LT range
TBD
(dates:
TBD)
Buffer
formulation
scale-up
Linkage model
output for HCP
(predicted)
KPATransformed
A-mAb case
study
model equation
6
(Pg 158)
Individual chart
with long-term
3-sigma limits
Every batch until
AEX
eluate HCP
is predictive with
95% confidence
99.5%
prediction
interval for
mean
of HCP
output
Every batch LT range
TBD
(dates:
TBD)
Re-qualify
model for
process
changes in
ProA, CEX, or
AEX steps
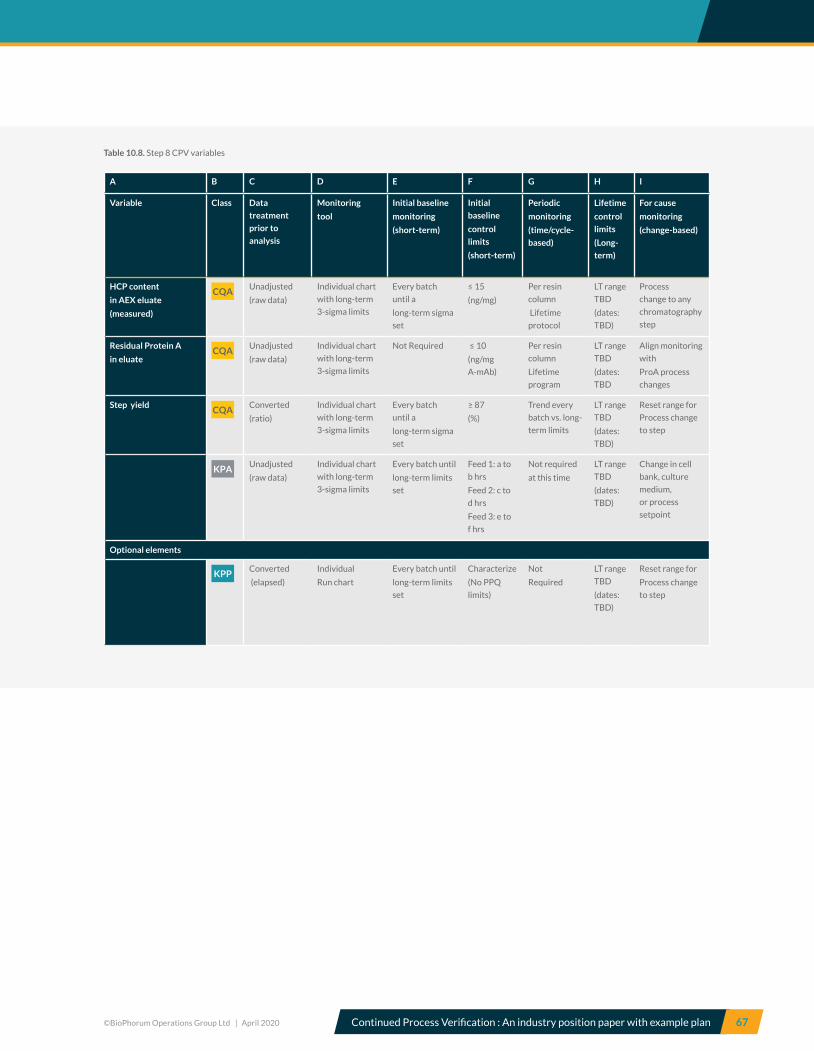
©BioPhorum Operations Group Ltd | April 2020 Continued Process Verification : An industry position paper with example plan 67
Table 10.8. Step 8 CPV variables
A B C D E F G H I
Variable Class Data
treatment
prior to
analysis
Monitoring
tool
Initial baseline
monitoring
(short-term)
Initial
baseline
control
limits
(short-term)
Periodic
monitoring
(time/cycle-
based)
Lifetime
control
limits
(Long-
term)
For cause
monitoring
(change-based)
HCP content
in AEX eluate
(measured)
CQAUnadjusted
(raw data)
Individual chart
with long-term
3-sigma limits
Every batch
until a
long-term sigma
set
≤ 15
(ng/mg)
Per resin
column
Lifetime
protocol
LT range
TBD
(dates:
TBD)
Process
change to any
chromatography
step
Residual Protein A
in eluateCQA
Unadjusted
(raw data)
Individual chart
with long-term
3-sigma limits
Not Required ≤ 10
(ng/mg
A-mAb)
Per resin
column
Lifetime
program
LT range
TBD
(dates:
TBD
Align monitoring
with
ProA process
changes
Step yieldCQA
Converted
(ratio)
Individual chart
with long-term
3-sigma limits
Every batch
until a
long-term sigma
set
≥ 87
(%)
Trend every
batch vs. long-
term limits
LT range
TBD
(dates:
TBD)
Reset range for
Process change
to step
KPAUnadjusted
(raw data)
Individual chart
with long-term
3-sigma limits
Every batch until
long-term limits
set
Feed 1: a to
b hrs
Feed 2: c to
d hrs
Feed 3: e to
f hrs
Not required
at this time
LT range
TBD
(dates:
TBD)
Change in cell
bank, culture
medium,
or process
setpoint
Optional elements
KPPConverted
(elapsed)
Individual
Run chart
Every batch until
long-term limits
set
Characterize
(No PPQ
limits)
Not
Required
LT range
TBD
(dates:
TBD)
Reset range for
Process change
to step
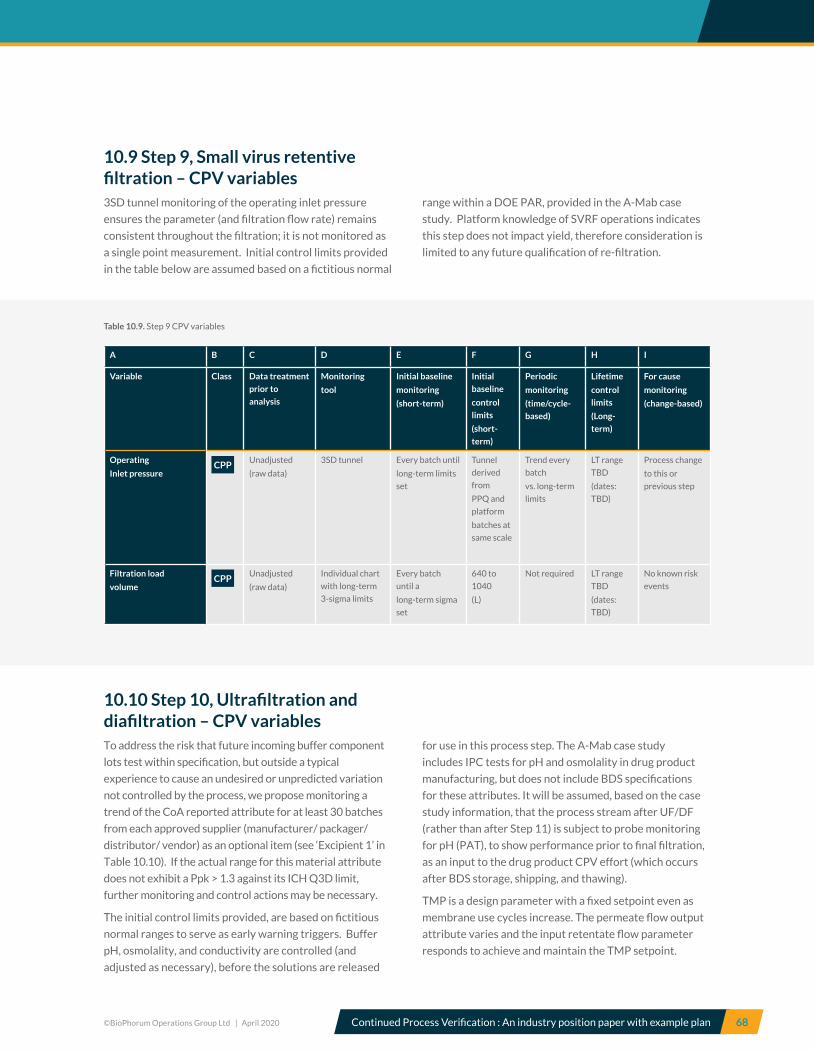
©BioPhorum Operations Group Ltd | April 2020 Continued Process Verification : An industry position paper with example plan 68
10.9 Step 9, Small virus retentive filtration – CPV variables3SD tunnel monitoring of the operating inlet pressure
ensures the parameter (and filtration flow rate) remains
consistent throughout the filtration; it is not monitored as
a single point measurement. Initial control limits provided
in the table below are assumed based on a fictitious normal
range within a DOE PAR, provided in the A-Mab case
study. Platform knowledge of SVRF operations indicates
this step does not impact yield, therefore consideration is
limited to any future qualification of re-filtration.
Table 10.9. Step 9 CPV variables
A B C D E F G H I
Variable Class Data treatment
prior to
analysis
Monitoring
tool
Initial baseline
monitoring
(short-term)
Initial
baseline
control
limits
(short-
term)
Periodic
monitoring
(time/cycle-
based)
Lifetime
control
limits
(Long-
term)
For cause
monitoring
(change-based)
Operating
Inlet pressureCPP
Unadjusted
(raw data)
3SD tunnel Every batch until
long-term limits
set
Tunnel
derived
from
PPQ and
platform
batches at
same scale
Trend every
batch
vs. long-term
limits
LT range
TBD
(dates:
TBD)
Process change
to this or
previous step
Filtration load
volumeCPP
Unadjusted
(raw data)
Individual chart
with long-term
3-sigma limits
Every batch
until a
long-term sigma
set
640 to
1040
(L)
Not required LT range
TBD
(dates:
TBD)
No known risk
events
10.10 Step 10, Ultrafiltration and diafiltration – CPV variablesTo address the risk that future incoming buffer component
lots test within specification, but outside a typical
experience to cause an undesired or unpredicted variation
not controlled by the process, we propose monitoring a
trend of the CoA reported attribute for at least 30 batches
from each approved supplier (manufacturer/ packager/
distributor/ vendor) as an optional item (see ‘Excipient 1’ in
Table 10.10). If the actual range for this material attribute
does not exhibit a Ppk > 1.3 against its ICH Q3D limit,
further monitoring and control actions may be necessary.
The initial control limits provided, are based on fictitious
normal ranges to serve as early warning triggers. Buffer
pH, osmolality, and conductivity are controlled (and
adjusted as necessary), before the solutions are released
for use in this process step. The A-Mab case study
includes IPC tests for pH and osmolality in drug product
manufacturing, but does not include BDS specifications
for these attributes. It will be assumed, based on the case
study information, that the process stream after UF/DF
(rather than after Step 11) is subject to probe monitoring
for pH (PAT), to show performance prior to final filtration,
as an input to the drug product CPV effort (which occurs
after BDS storage, shipping, and thawing).
TMP is a design parameter with a fixed setpoint even as
membrane use cycles increase. The permeate flow output
attribute varies and the input retentate flow parameter
responds to achieve and maintain the TMP setpoint.
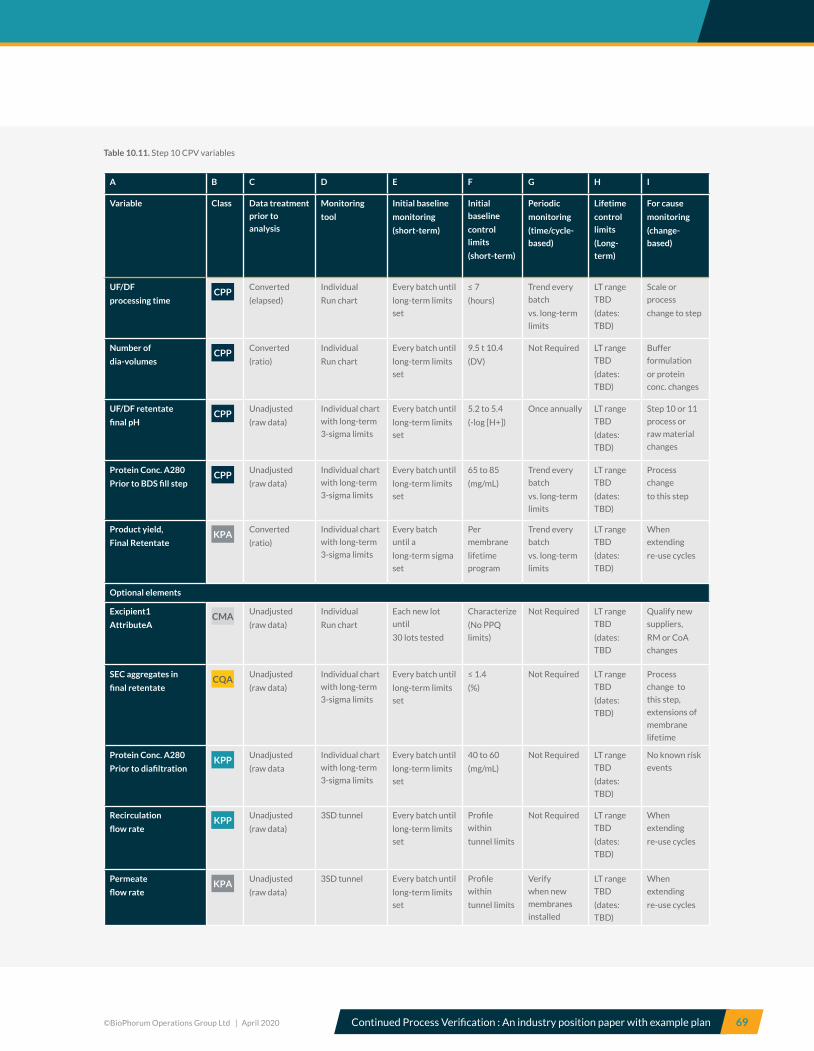
©BioPhorum Operations Group Ltd | April 2020 Continued Process Verification : An industry position paper with example plan 69
Table 10.11. Step 10 CPV variables
A B C D E F G H I
Variable Class Data treatment
prior to
analysis
Monitoring
tool
Initial baseline
monitoring
(short-term)
Initial
baseline
control
limits
(short-term)
Periodic
monitoring
(time/cycle-
based)
Lifetime
control
limits
(Long-
term)
For cause
monitoring
(change-
based)
UF/DF
processing timeCPP
Converted
(elapsed)
Individual
Run chart
Every batch until
long-term limits
set
≤ 7
(hours)
Trend every
batch
vs. long-term
limits
LT range
TBD
(dates:
TBD)
Scale or
process
change to step
Number of
dia-volumesCPP
Converted
(ratio)
Individual
Run chart
Every batch until
long-term limits
set
9.5 t 10.4
(DV)
Not Required LT range
TBD
(dates:
TBD)
Buffer
formulation
or protein
conc. changes
UF/DF retentate
final pHCPP
Unadjusted
(raw data)
Individual chart
with long-term
3-sigma limits
Every batch until
long-term limits
set
5.2 to 5.4
(-log [H+])
Once annually LT range
TBD
(dates:
TBD)
Step 10 or 11
process or
raw material
changes
Protein Conc. A280
Prior to BDS fill stepCPP
Unadjusted
(raw data)
Individual chart
with long-term
3-sigma limits
Every batch until
long-term limits
set
65 to 85
(mg/mL)
Trend every
batch
vs. long-term
limits
LT range
TBD
(dates:
TBD)
Process
change
to this step
Product yield,
Final RetentateKPA
Converted
(ratio)
Individual chart
with long-term
3-sigma limits
Every batch
until a
long-term sigma
set
Per
membrane
lifetime
program
Trend every
batch
vs. long-term
limits
LT range
TBD
(dates:
TBD)
When
extending
re-use cycles
Optional elements
Excipient1
AttributeACMA
Unadjusted
(raw data)
Individual
Run chart
Each new lot
until
30 lots tested
Characterize
(No PPQ
limits)
Not Required LT range
TBD
(dates:
TBD
Qualify new
suppliers,
RM or CoA
changes
SEC aggregates in
final retentateCQA
Unadjusted
(raw data)
Individual chart
with long-term
3-sigma limits
Every batch until
long-term limits
set
≤ 1.4
(%)
Not Required LT range
TBD
(dates:
TBD)
Process
change to
this step,
extensions of
membrane
lifetime
Protein Conc. A280
Prior to diafiltrationKPP
Unadjusted
(raw data
Individual chart
with long-term
3-sigma limits
Every batch until
long-term limits
set
40 to 60
(mg/mL)
Not Required LT range
TBD
(dates:
TBD)
No known risk
events
Recirculation
flow rate KPP
Unadjusted
(raw data)
3SD tunnel Every batch until
long-term limits
set
Profile
within
tunnel limits
Not Required LT range
TBD
(dates:
TBD)
When
extending
re-use cycles
Permeate
flow rateKPA
Unadjusted
(raw data)
3SD tunnel Every batch until
long-term limits
set
Profile
within
tunnel limits
Verify
when new
membranes
installed
LT range
TBD
(dates:
TBD)
When
extending
re-use cycles
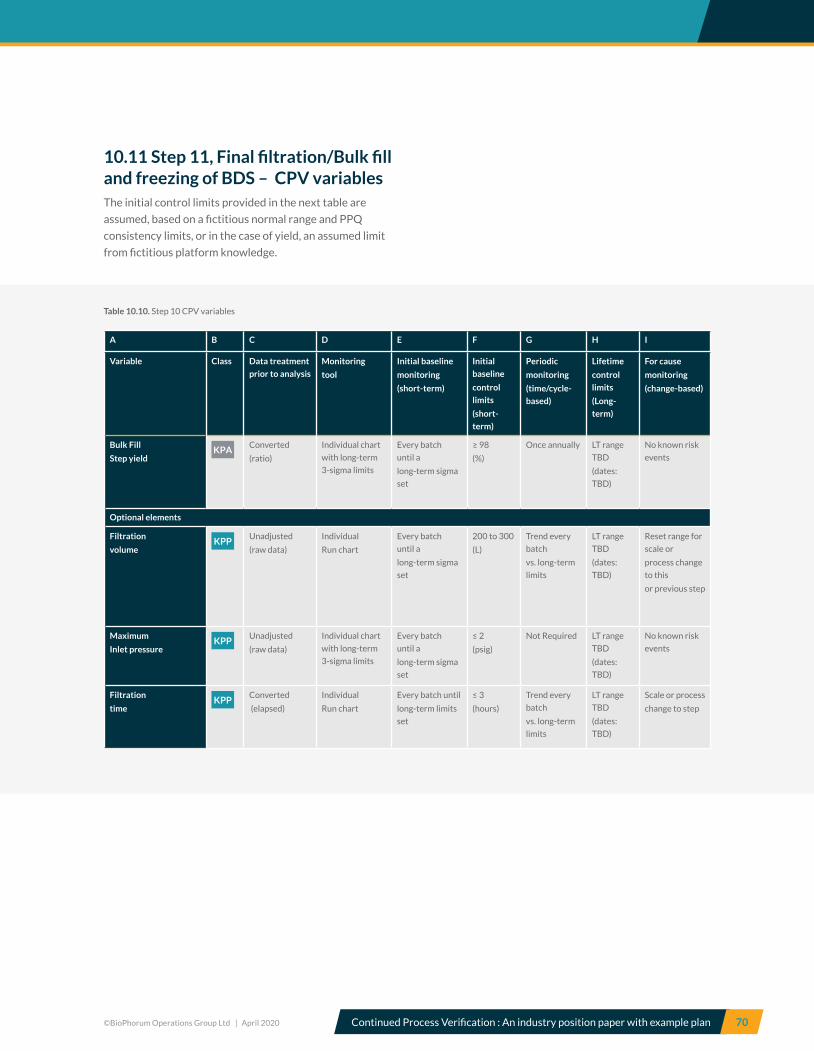
©BioPhorum Operations Group Ltd | April 2020 Continued Process Verification : An industry position paper with example plan 70
10.11 Step 11, Final filtration/Bulk fill and freezing of BDS – CPV variablesThe initial control limits provided in the next table are
assumed, based on a fictitious normal range and PPQ
consistency limits, or in the case of yield, an assumed limit
from fictitious platform knowledge.
Table 10.10. Step 10 CPV variables
A B C D E F G H I
Variable Class Data treatment
prior to analysis
Monitoring
tool
Initial baseline
monitoring
(short-term)
Initial
baseline
control
limits
(short-
term)
Periodic
monitoring
(time/cycle-
based)
Lifetime
control
limits
(Long-
term)
For cause
monitoring
(change-based)
Bulk Fill
Step yieldKPA
Converted
(ratio)
Individual chart
with long-term
3-sigma limits
Every batch
until a
long-term sigma
set
≥ 98
(%)
Once annually LT range
TBD
(dates:
TBD)
No known risk
events
Optional elements
Filtration
volumeKPP
Unadjusted
(raw data)
Individual
Run chart
Every batch
until a
long-term sigma
set
200 to 300
(L)
Trend every
batch
vs. long-term
limits
LT range
TBD
(dates:
TBD)
Reset range for
scale or
process change
to this
or previous step
Maximum
Inlet pressureKPP
Unadjusted
(raw data)
Individual chart
with long-term
3-sigma limits
Every batch
until a
long-term sigma
set
≤ 2
(psig)
Not Required LT range
TBD
(dates:
TBD)
No known risk
events
Filtration
timeKPP
Converted
(elapsed)
Individual
Run chart
Every batch until
long-term limits
set
≤ 3
(hours)
Trend every
batch
vs. long-term
limits
LT range
TBD
(dates:
TBD)
Scale or process
change to step

©BioPhorum Operations Group Ltd | April 2020 Continued Process Verification : An industry position paper with example plan 71
Table 10.12. Step 12 CPV variables
10.12 CPV monitoring of bulk drug substance lot dataAs with the process steps, BR depends on a rational assessment of lot data. This is shown in the next table.
A B C D E F G H I
Variable Class Data treatment
prior to
analysis
Monitoring
tool
Initial baseline
monitoring
(short-term)
Initial
baseline
control
limits
(short-
term)
Periodic
monitoring
(time/cycle-
based)
Lifetime
control
limits
(Long-
term)
For cause
monitoring
(change-based)
Monomer
by SECCQA
Peak
integration
(raw data
Individual chart
with long-term
3-sigma limits
Every batch
until a
long-term sigma
set
NLT 98
(%)
Trend every
batch
vs. long-term
limits
LT range
TBD
(dates:
TBD
Per BDS
stability
monitoring
protocol
Aggregates
by SECCQA
Converted
(additive)
Individual chart
with long-term
3-sigma limits
Every batch
until a
long-term sigma
set
NMT 2
(%)
Trend every
batch
vs. long-term
limits
LT range
TBD
(dates:
TBD)
Per BDS
stability
monitoring
protocol
Galactosylated
GlycansCQA
Unadjusted
(raw data)
Individual chart
with long-term
3-sigma limits
Every batch until
long-term limits
set
and PpK >1.0
15 to 35
(%)
Not required,
Not
stability
indicating
LT range
TBD
(dates:
TBD
Confirm
comparability
for
changes in cell
bank or
step 3 setpoints
Afucosylated
GlycansCQA
Unadjusted
(raw data)
Individual chart
with long-term
3-sigma limits
Every batch until
long-term limits
set
and PpK >1.0
5 to 10
(%)
Not required,
Not
stability
indicating
LT range
TBD
(dates:
TBD)
Confirm
comparability
for
changes in cell
bank or
step 3 setpoints
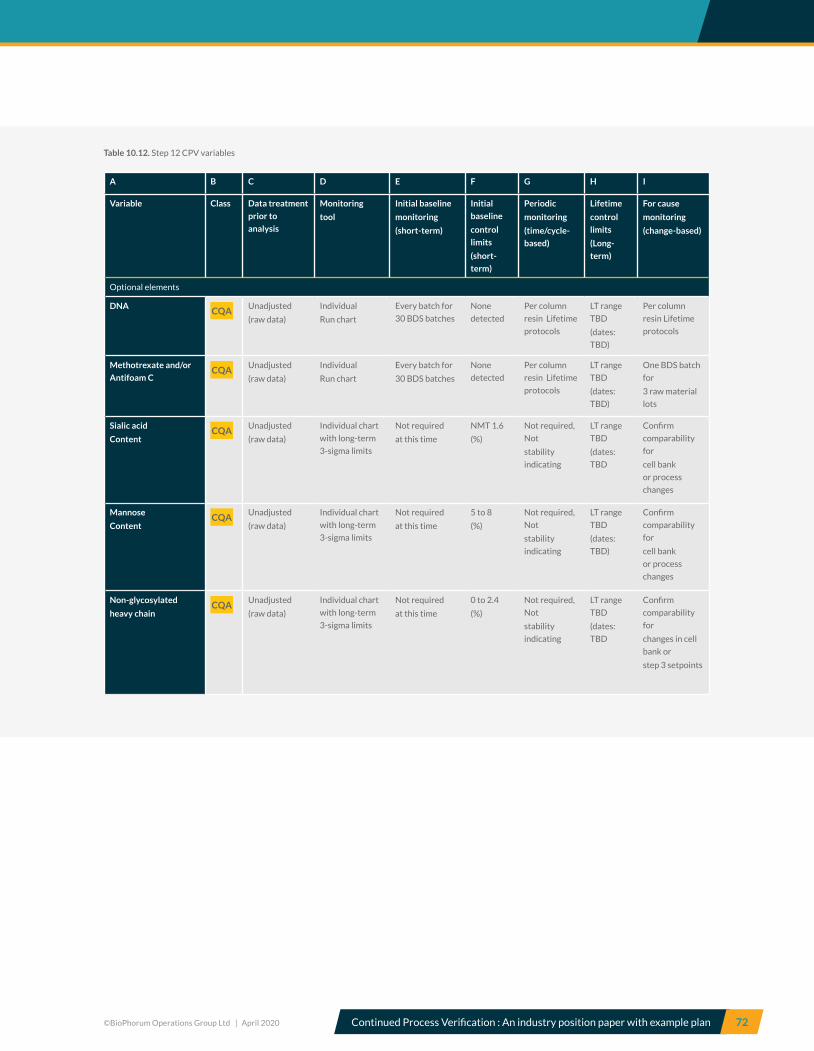
©BioPhorum Operations Group Ltd | April 2020 Continued Process Verification : An industry position paper with example plan 72
Table 10.12. Step 12 CPV variables
A B C D E F G H I
Variable Class Data treatment
prior to
analysis
Monitoring
tool
Initial baseline
monitoring
(short-term)
Initial
baseline
control
limits
(short-
term)
Periodic
monitoring
(time/cycle-
based)
Lifetime
control
limits
(Long-
term)
For cause
monitoring
(change-based)
Optional elements
DNACQA
Unadjusted
(raw data)
Individual
Run chart
Every batch for
30 BDS batches
None
detected
Per column
resin Lifetime
protocols
LT range
TBD
(dates:
TBD)
Per column
resin Lifetime
protocols
Methotrexate and/or
Antifoam CCQA
Unadjusted
(raw data)
Individual
Run chart
Every batch for
30 BDS batches
None
detected
Per column
resin Lifetime
protocols
LT range
TBD
(dates:
TBD)
One BDS batch
for
3 raw material
lots
Sialic acid
ContentCQA
Unadjusted
(raw data)
Individual chart
with long-term
3-sigma limits
Not required
at this time
NMT 1.6
(%)
Not required,
Not
stability
indicating
LT range
TBD
(dates:
TBD
Confirm
comparability
for
cell bank
or process
changes
Mannose
ContentCQA
Unadjusted
(raw data)
Individual chart
with long-term
3-sigma limits
Not required
at this time
5 to 8
(%)
Not required,
Not
stability
indicating
LT range
TBD
(dates:
TBD)
Confirm
comparability
for
cell bank
or process
changes
Non-glycosylated
heavy chainCQA
Unadjusted
(raw data)
Individual chart
with long-term
3-sigma limits
Not required
at this time
0 to 2.4
(%)
Not required,
Not
stability
indicating
LT range
TBD
(dates:
TBD
Confirm
comparability
for
changes in cell
bank or
step 3 setpoints

©BioPhorum Operations Group Ltd | April 2020 Continued Process Verification : An industry position paper with example plan 73
11.0
CPV sampling plan A sampling plan makes it clear which samples need to be taken to meet the data acquisition requirements of CPV. This section shows how this might be done giving examples and using templates. A sampling plan matrix is presented in Table 11.0.1. Please note, this table is not intended to be complete, or entirely consistent with information contained previously. It is an example of a visual tool that can usefully summarize an otherwise complex plan, making it easier to develop and communicate.
Considerations for non-routine sampling
and testing include:
• Sample plan for routine monitoring, baseline
monitoring, time-based periodic monitoring, or
special event / change based monitoring;
• Sample frequency (e.g. every day during a reactor
run, every batch, or every 5 batches, etc);
• Specific sampling location within the process.
Provide specific and clear instructions for collection
of the required sample, e.g. BRc, BRc step number,
sampling device such as manual sample valve or
automated sample valve. It is critical to ensure that
samples collected at the selected sampling points
are representative of the drug substance or process
intermediates;
• Sample container and container size (e.g.
polypropylene tubes);
• Sample volume, number of aliquots, and retains;
• Sample labelling (may be driven by site SOP);
• Sample storage temperature and transport
conditions;
• Tests to be performed (including any additional
sampling due to assay needs (e.g. a blank solution
as reference for the test);
• Testing acceptance criteria.
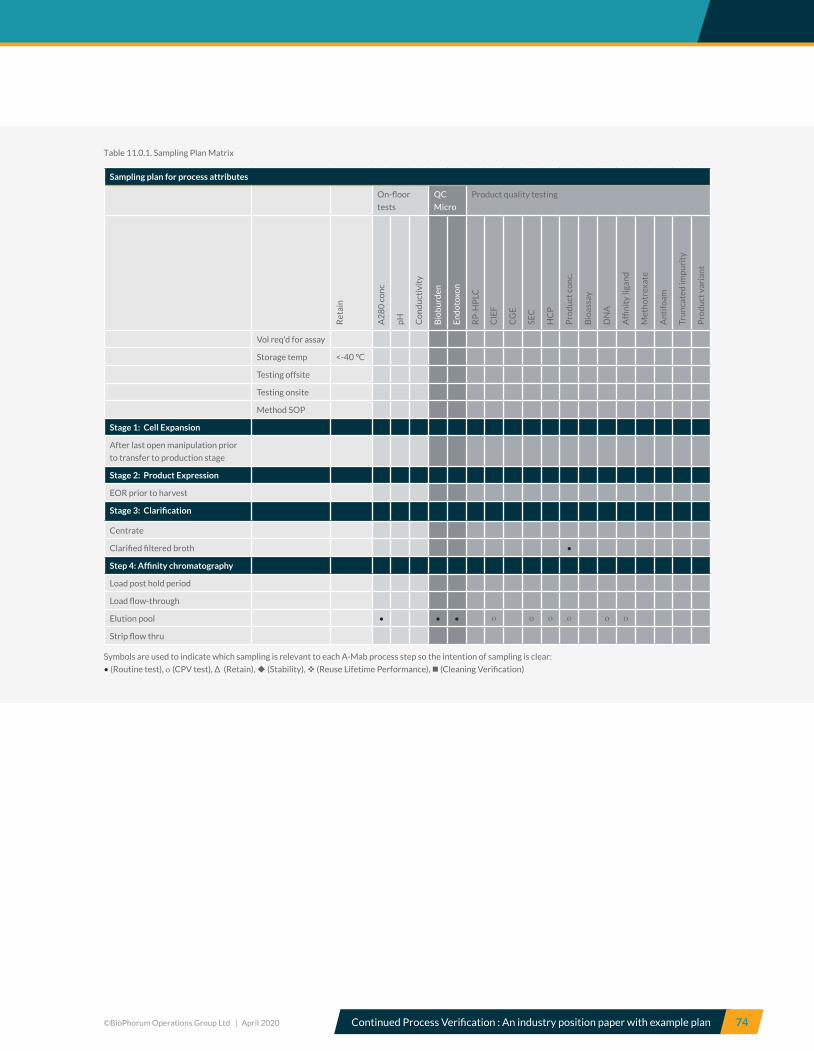
©BioPhorum Operations Group Ltd | April 2020 Continued Process Verification : An industry position paper with example plan 74
Table 11.0.1. Sampling Plan Matrix
Sampling plan for process attributes
On-floor
tests
QC
Micro
Product quality testing
Ret
ain
A2
80
co
nc
pH
Co
nd
uct
ivit
y
Bio
bu
rden
En
do
toxo
n
RP
-HP
LC
CIE
F
CG
E
SEC
HC
P
Pro
du
ct c
on
c.
Bio
assa
y
DN
A
Affi
nit
y lig
and
Met
ho
trex
ate
An
tifo
am
Tru
nca
ted
imp
uri
ty
Pro
du
ct v
aria
nt
Vol req'd for assay
Storage temp <-40 °C
Testing offsite
Testing onsite
Method SOP
Stage 1: Cell Expansion
After last open manipulation prior
to transfer to production stage
Stage 2: Product Expression
EOR prior to harvest
Stage 3: Clarification
Centrate
Clarified filtered broth •
Step 4: Affinity chromatography
Load post hold period
Load flow-through
Elution pool • • • ο ο ο ο ο ο
Strip flow thru
Symbols are used to indicate which sampling is relevant to each A-Mab process step so the intention of sampling is clear:
• (Routine test), ο (CPV test), ∆ (Retain), (Stability), (Reuse Lifetime Performance), (Cleaning Verification)

©BioPhorum Operations Group Ltd | April 2020 Continued Process Verification : An industry position paper with example plan 75
Table 11.0.1. Sampling Plan Matrix
Sampling plan for process attributes
On-floor
tests
QC
Micro
Product quality testing
Ret
ain
A2
80
co
nc
pH
Co
nd
uct
ivit
y
Bio
bu
rden
En
do
toxo
n
RP
-HP
LC
CIE
F
CG
E
SEC
HC
P
pro
du
ct c
on
c.
Bio
assa
y
DN
A
Affi
nit
y lig
and
Met
ho
trex
ate
An
tifo
am
Tru
nca
ted
imp
uri
ty
Pro
du
ct v
aria
nt
Step 5: CEX chromatography
Load post hold period
Load flow-through
Elution pool • • • ο ο
Strip flow thru
Step 6: IEX chromatography
Load post hold period
Load flow-through
Elution pool • • • ο ο ο
Strip flow thru
Step 9: UFDF
Load pool post hold period
Permeate during concentration
Retentate pool post diafiltration • • ο
Step 10: BDS filtration and Freezing
Post hold period, prior to filter
BDS sample prior to freeze • • • • • • •
Symbols are used to indicate which sampling is relevant to each A-Mab process step so the intention of sampling is clear:
• (Routine test), ο (CPV test), ∆ (Retain), (Stability), (Reuse Lifetime Performance), (Cleaning Verification)
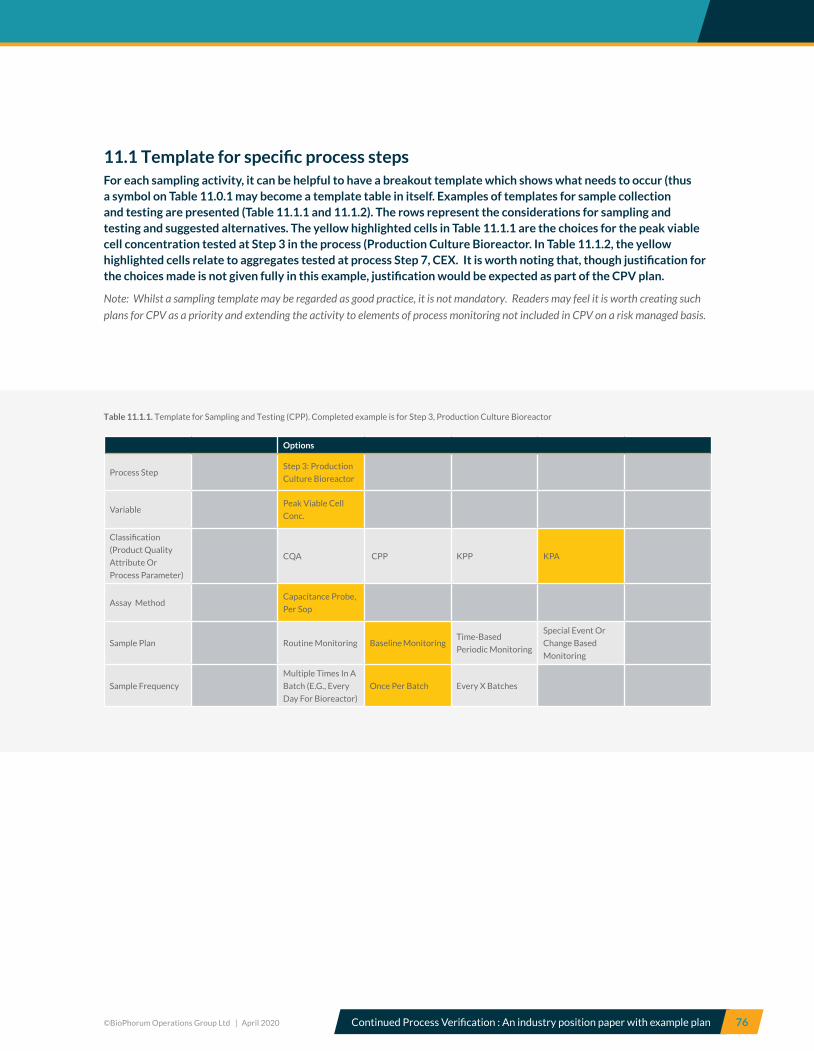
©BioPhorum Operations Group Ltd | April 2020 Continued Process Verification : An industry position paper with example plan 76
11.1 Template for specific process steps For each sampling activity, it can be helpful to have a breakout template which shows what needs to occur (thus a symbol on Table 11.0.1 may become a template table in itself. Examples of templates for sample collection and testing are presented (Table 11.1.1 and 11.1.2). The rows represent the considerations for sampling and testing and suggested alternatives. The yellow highlighted cells in Table 11.1.1 are the choices for the peak viable cell concentration tested at Step 3 in the process (Production Culture Bioreactor. In Table 11.1.2, the yellow highlighted cells relate to aggregates tested at process Step 7, CEX. It is worth noting that, though justification for the choices made is not given fully in this example, justification would be expected as part of the CPV plan.
Note: Whilst a sampling template may be regarded as good practice, it is not mandatory. Readers may feel it is worth creating such
plans for CPV as a priority and extending the activity to elements of process monitoring not included in CPV on a risk managed basis.
Table 11.1.1. Template for Sampling and Testing (CPP). Completed example is for Step 3, Production Culture Bioreactor
Options
Process StepStep 3: Production
Culture Bioreactor
Variable Peak Viable Cell
Conc.
Classification
(Product Quality
Attribute Or
Process Parameter)
CQA CPP KPP KPA
Assay MethodCapacitance Probe,
Per Sop
Sample Plan Routine Monitoring Baseline MonitoringTime-Based
Periodic Monitoring
Special Event Or
Change Based
Monitoring
Sample Frequency
Multiple Times In A
Batch (E.G., Every
Day For Bioreactor)
Once Per Batch Every X Batches
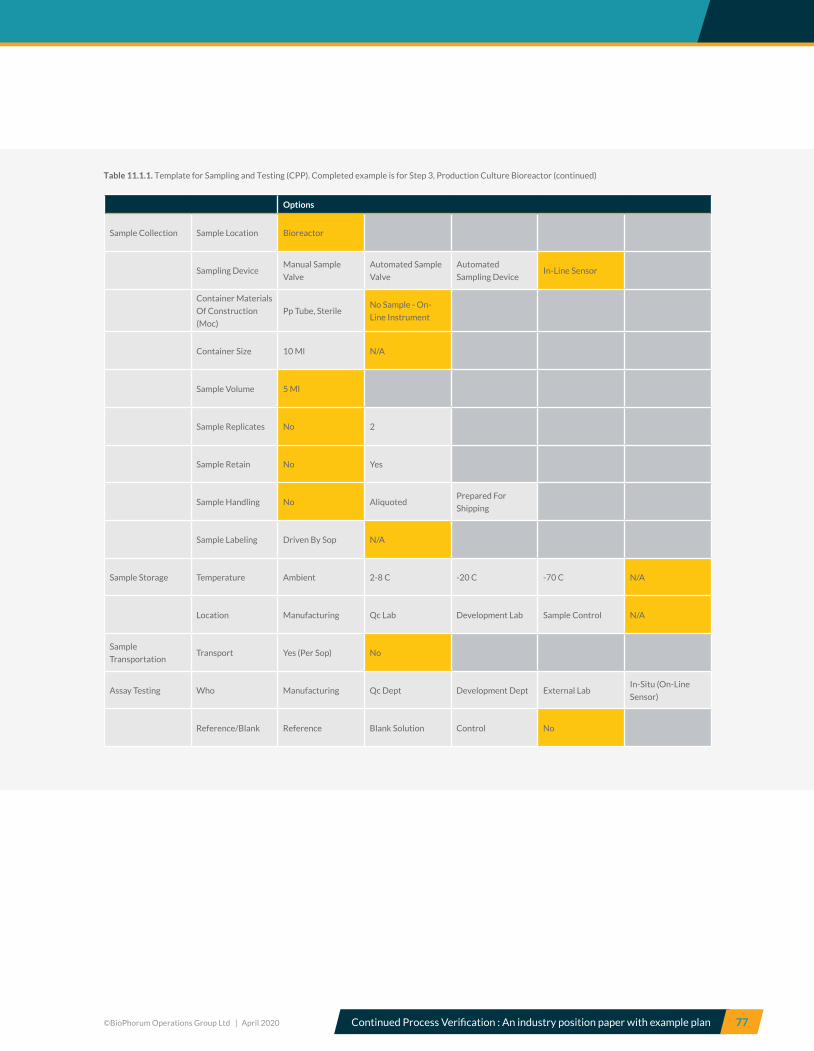
©BioPhorum Operations Group Ltd | April 2020 Continued Process Verification : An industry position paper with example plan 77
Table 11.1.1. Template for Sampling and Testing (CPP). Completed example is for Step 3, Production Culture Bioreactor (continued)
Options
Sample Collection Sample Location Bioreactor
Sampling DeviceManual Sample
Valve
Automated Sample
Valve
Automated
Sampling DeviceIn-Line Sensor
Container Materials
Of Construction
(Moc)
Pp Tube, SterileNo Sample - On-
Line Instrument
Container Size 10 Ml N/A
Sample Volume 5 Ml
Sample Replicates No 2
Sample Retain No Yes
Sample Handling No AliquotedPrepared For
Shipping
Sample Labeling Driven By Sop N/A
Sample Storage Temperature Ambient 2-8 C -20 C -70 C N/A
Location Manufacturing Qc Lab Development Lab Sample Control N/A
Sample
TransportationTransport Yes (Per Sop) No
Assay Testing Who Manufacturing Qc Dept Development Dept External LabIn-Situ (On-Line
Sensor)
Reference/Blank Reference Blank Solution Control No
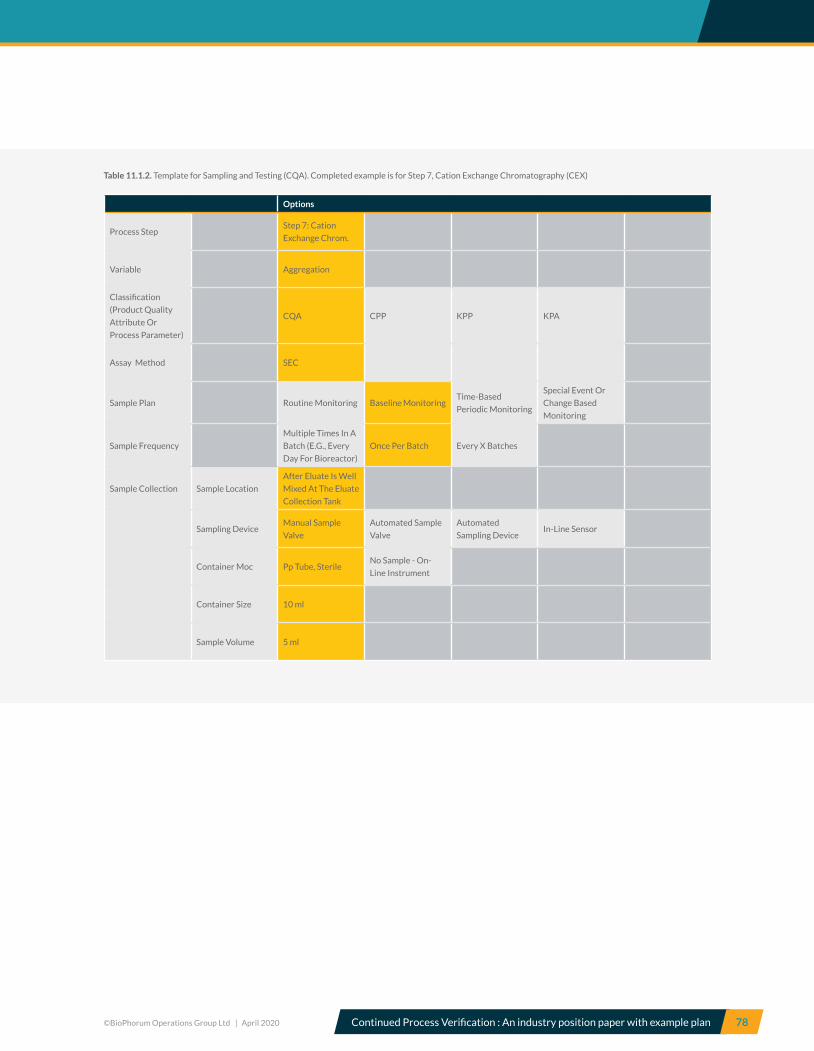
©BioPhorum Operations Group Ltd | April 2020 Continued Process Verification : An industry position paper with example plan 78
Table 11.1.2. Template for Sampling and Testing (CQA). Completed example is for Step 7, Cation Exchange Chromatography (CEX)
Options
Process StepStep 7: Cation
Exchange Chrom.
Variable Aggregation
Classification
(Product Quality
Attribute Or
Process Parameter)
CQA CPP KPP KPA
Assay Method SEC
Sample Plan Routine Monitoring Baseline MonitoringTime-Based
Periodic Monitoring
Special Event Or
Change Based
Monitoring
Sample Frequency
Multiple Times In A
Batch (E.G., Every
Day For Bioreactor)
Once Per Batch Every X Batches
Sample Collection Sample Location
After Eluate Is Well
Mixed At The Eluate
Collection Tank
Sampling DeviceManual Sample
Valve
Automated Sample
Valve
Automated
Sampling DeviceIn-Line Sensor
Container Moc Pp Tube, SterileNo Sample - On-
Line Instrument
Container Size 10 ml
Sample Volume 5 ml

©BioPhorum Operations Group Ltd | April 2020 Continued Process Verification : An industry position paper with example plan 79
Table 11.1.2. Template for Sampling and Testing (CQA). Completed example is for Step 7, Cation Exchange Chromatography (CEX)
Options
Sample Collection Sample Replicates No 2
Sample Retain No Yes
Sample Handling No AliquottedPrepared For
Shipping
Sample Labeling Driven By Sop
Sample Storage Temperature Ambient 2-8 C -20 C -70 C N/A
Location Manufacturing Qc Lab Development Lab Sample Control N/A
Sample
TransportationTransport Yes (Per Sop) No
Assay Testing Who Manufacturing Qc Dept Development Dept External LabIn-situ (on-line
sensor)
Reference/Blank Reference Blank Solution Control No
©BioPhorum Operations Group Ltd | April 2020 Continued Process Verification : An industry position paper with example plan 80
12.0
How data will be analyzed Fundamentally, the aim of setting values for capability criteria and analyzing data against those criteria is to establish a plan that provides sound rationale for decision making. This section provides a basic introduction to the statistical tools likely to be used in support of analytical elements of a CPV plan.
Statistics is a mature though complex mathematical
discipline and it is recommended that specialists are
consulted when applying the approaches described in
this section. A number of references are provided, but
given the maturity of the subject, the authors recognize
this list is far from exhaustive. The focus here is on recent
regulatory guidance and what might be regarded as a few
useful, standard texts.
Note: In this paper we are describing some ways in which data
can be analysed, but these are not intended to be exclusive of
any others. Other analytical methods may be better suited to
particular data sets.
CPV Reports focus on quantitative attributes and
parameters which can be monitored using statistical
process control charts, to identify shifts, trends, and
unusual results. Typical practice is that the attributes and
parameters in a CPV Report include all the quantitative
attributes and parameters which are included in the
APR. CPV Reports can also include additional attributes
or parameters, which are useful for building process
understanding and identifying sources of variation. Whilst
the scope of quantitative attributes included in CPV is
equal to, or broader than, the scope included in APR, the
APR includes additional sections not required for CPV.
The APR will provide comprehensive assessments of
product performance that are only made once a year.
12.1 Identifying softwareSoftware supporting CPV should make it as easy as
possible for CPV reports to be consistent with the APR,
in order to avoid redundant effort by the technical and
quality staff. The charts of quantitative results included in
CPV should meet all requirements of the APR, such that
the CPV charts may be copied and pasted directly into the
APR or included as attachments. The APR would provide
context and tie together the information brought forward
from the CPV Reports.
The CPV analysis may be performed using well established
software such as MINITAB, JMP, Discoverant or Statistica.
The software vendor should provide documentation of
their quality and validation procedures if data is used to
support GMP functions18-20.
‘Homegrown’ analysis routines should be similarly
validated if used to support GMP functions. If specific
calculations outside the base software packages are used
to support GMP functions, they should be validated also.

©BioPhorum Operations Group Ltd | April 2020 Continued Process Verification : An industry position paper with example plan 81
12.2 Description of tools to trend and evaluate dataTools to trend and assist in the evaluation of CPV data
include types of charts and mathematical treatments.
The rationale and approaches to evaluation should
be documented in a standardized way. The three key
documents are a Risk Assessment justification, CPV
Plan and CPV Report. Process Risk Assessments that
support CPV plan development and implementation
have the important purpose of justifying the scope and
frequency with which CPV reports are required. They
are performed at the start of CPV plan preparation. For
new processes they should draw on the outcomes of
PPQ and it is recommended they also take into account a
Process Failure Mode Effects Analysis (FMEA), which may
have been conducted during Stage 1 process design and
updated after the Stage 2 PPQ experience.
For legacy products, risk assessments should include
the following sets of data: process capability, analysis of
campaign trends, historical causes of discards, customer
complaints and failure investigations.
A CPV Plan should be written with the purpose of
specifying what must be monitored to provide for CPV and
how data should be interpreted. Interpretation should
involve: how data will be collected, transformed, and
evaluated. It is strongly recommended that data driven
rules by which decisions will be made, and the expected
outcomes, are recorded in the Plan. A CPV plan should be
created and issued following the risk assessment and before
the start of Stage 3. As stated previously, the definition of an
initial phase and long-term phase of CPV Plan development
may be helpful. This approach is designed to ensure that
variation in process performance is understood before long-
term control limits are established in the control strategy.
Regular assessments of process performance should be
documented in CPV Reports. The frequency with which
these are created will depend on the assessment of risk
as described previously. CPV Reports should detail
any control alerts, as defined by the CPV Plan, whether
these have led to a formal Quality investigation or not.
Justification supporting the response made to these alerts
should be given, including any outcomes for the control
strategy. Typically, CPV Reports will contain calculations of
process capability, statistical process control (SPC) charts,
any other chosen charts, control limits and alerts arising
from the data.
In combination, these tools help make any changes in
the performance of the process obvious, revealing any
non-random patterns. The following sections expand on
these tools.

©BioPhorum Operations Group Ltd | April 2020 Continued Process Verification : An industry position paper with example plan 82
12.3 Process capability indexProcess capability assessment evaluates the risk that an
attribute will fail to meet specifications; in other words,
it quantifies the likelihood that an attribute will routinely
meet specifications.
Any assessment of process capability requires the
assumption that the same sources of variation that affected
previous results will continue to affect future results, and
the expected range of variability does not change.
There are many indices that measure process capability,
but two are especially popular: Ppk and Cpk . Both indices
compare the width of the specification range to the width
of the typical variation range. The key difference is that Cpk
uses a short-term estimate of variation, whereas Ppk uses
a long-term estimate of variation [13, Chapter 7]. These
indices take into account the centering of the process
within the specification range, and higher values of either
index indicates higher process capability (or lower risk of
missing specifications).
The short-term estimate of sigma is a best-case value that
represents the minimum variation that could be achieved if
all longer-term sources of variation were eliminated from
the process. The long-term estimate of sigma includes both
the short-term and the longer-term sources of variation.
For many manufacturing processes, these longer-term
sources of variation are an expected part of the total,
routine process variation.
Cpk provides a more optimistic estimate of the potential
process capability if all longer-term sources of variation
are removed; Ppk provides a more realistic estimate of
the process capability that has been achieved in routine
production. For this reason, Ppk is preferred here over Cpk
as an indicator of expected process capability; although
either measure could be used, depending on process
circumstances. Table 12.3 contains guidelines rating the
level of control over the process based on Ppk values.
In this paper, we recommend an initial period in which
control limits are estimated from Stage 1 and Stage 2
and experience with similar processes. Given the nature
of Ppk, it becomes most useful as actual manufacturing
experience develops and robust control limits are
established for the long term.
In cases where longer-term variation exceeds short-term
variation, and the longer-term shifts cannot be tolerated,
Cpk can be used. However, Cpk should not be calculated
until the SPC charts provide evidence that the process is
in a state of statistical control, such that no signals of non-
random variation are present. This means there should be
no evidence of shifts, trends, or results outside of control
limits. This is a prerequisite to calculate a meaningful
Cpk. Ppk can be calculated even when some non-random
signals are present, as long as those signals are considered
to be part of the routine, expected, longer-term variation
inherent to a process.
The index also assumes the data follow a normal
distribution. Transformations are sometimes needed
to enable non-normal data to be analyzed in a rigorous
statistical manner. A common source of non-normal
data is where negative values cannot arise, and the most
frequent values are close to zero. Such data sets may be
termed ‘log-normal’ and taking the logarithm of the data
can transform it into a normal distribution. There is more
discussion on this topic in Section 12.4 that follows, but in
the context of this paper, we refer the reader to Reference
13, recognize there are many other texts on this topic and
recommend consulting a trained statistician.
When reporting process capability, a control chart of the
same data should always be constructed to provide a visual
check that the index is reasonable.
For discussion of frequency and scope of CPV analysis see
Section 8.

©BioPhorum Operations Group Ltd | April 2020 Continued Process Verification : An industry position paper with example plan 83
Table 12.3. Rating of PpK Index
Note: Ppk values are recognized indicators of process
capability. Although quantitative ranges have been
selected and matched with the potential for improvement
opportunities, these ranges should not replace reasonable
investigation efforts to determine the factors influencing
the Ppk value obtained. The levels presented in Table 12.3
reflect one example of a commonly accepted set of ranges for a
monoclonal antibody manufacturing process.
Other approaches to both assessing process capability as well
as matching this assessment to the potential improvement
opportunity may be more suitable for specific processes.
Ppk Index Rating
>1.33 Limited Opportunity:
Attribute meets specifications with a very high
level of consistency. It may be more valuable
to look for opportunities in other areas of the
process or other processes.
1 - 1.33 Some Opportunity:
Attribute is routinely meeting specifications but
there are indications that it might not always do
so consistently.
0.68 – 1.00 Considerable Opportunity:
Attribute typically meets specifications, but does
not do so to the extent that might be expected.
≤ 0.67 Significant Opportunity:
Attribute/process cannot be expected to
routinely meet specifications.
©BioPhorum Operations Group Ltd | April 2020 Continued Process Verification : An industry position paper with example plan 84
12.4 Control chartsControl charts consist of a few simple elements:
• Results plotted in time order;
• A centerline, usually at the average of the results;
• Statistical control limits.
There are many varieties of control charts. The type of
chart should be selected based on the type of data to be
plotted [13, Chapter 11]. Most attributes plotted for CPV
are individual continuous measurements.
One important consideration for control charts is the
choice of time order. Results may be plotted in date of
manufacturing order (upstream or downstream) or in
date of test order. Any of these orders can be informative,
since each order highlights sources of variation that occur
in the related process steps. When processes are carried
out in strict first-in, first-out sequence from upstream to
downstream to assay, the time order will be the same and
the choice of time variable has no impact on the charts.
For CPV, generally one time order will be selected and
used; other time orders may be plotted as needed for
investigations and process understanding.
Another important consideration is the method for
calculating control limits. Control limits should always be
set at plus and minus three sigma (standard deviations),
but sigma may be estimated using either a short-term
formula or a long-term formula, the same as for Cpk and
Ppk. For most charts, the long-term estimate of sigma is
recommended; this corresponds to the use of Ppk rather
than Cpk. Control limits based on the long-term estimate
of sigma will encompass the longer-term sources of
variation that are an expected part of total routine process
variation; short-term estimates will generally be narrower,
and may produce false statistical signals when longer-term
variation impacts process results.
Standard Shewhart control charts are simple to set up,
easy to understand and explain, and good at detecting
large shifts quickly. However, the Shewhart charts
are not as good at detecting small shifts (relative to
variation), and do not build any memory of previous
observations. For quick detection of small shifts, EWMA
and Cumulative Sum (CUSUM) control charts are
recommended. These are easy to set up using software,
and have the advantage of using previous observations
to filter noise and detect small shifts more quickly.
However, they are slower than Shewhart charts to detect
large shifts, and are more difficult to explain to shop floor
personnel and business leaders.
Statistical control charts are based on some assumptions
about the process results. When these assumptions
are not met, the probability of false signals can rise
dramatically. The most important assumptions are that the
results are independent over time and that the underlying
results are approximately normally distributed.
In real manufacturing processes, results are rarely
independent over time. Instead, there is some correlation
across sequential results (autocorrelation). This can be a
natural result of operating conditions, such as raw material
lots that are used for several upstream lots in sequence.
The presence of autocorrelation can produce many small
shifts and trends within the control limits; the science
and technology process support and statistical personnel
should document in the CPV Plan whether these types of
shifts and trends will be addressed as signals of unusual
variation, or treated as expected routine variation.
The assumption of normally distributed data is also
important, and should be checked using a histogram,
box plot, and normal quartile plot. Statistical tests for
normality are not generally recommended, since they will
be triggered by other issues in the data, such as occasional
outliers, or the very shifts and trends that the control chart
is intended to identify.
One common violation of the normality assumption is
proportional variance. Proportional variance is variability
that is proportional to the level of results. For example,
measurements of concentration often have higher
variability at higher concentrations, and lower variability
at lower concentrations. When variation is expressed as a
percentage or Relative Standard Deviation, RSD) instead
of a simple standard deviation, this is an indication that the
variance may be proportional, and should be checked.
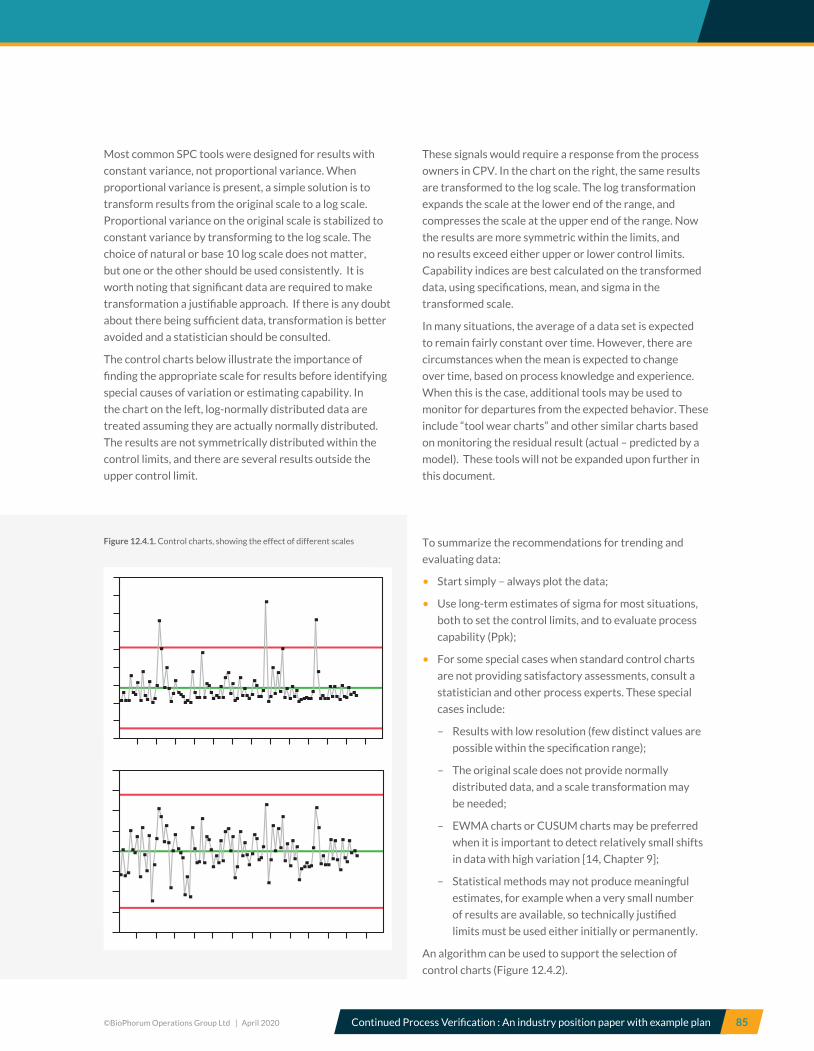
©BioPhorum Operations Group Ltd | April 2020 Continued Process Verification : An industry position paper with example plan 85
Figure 12.4.1. Control charts, showing the effect of different scales
Most common SPC tools were designed for results with
constant variance, not proportional variance. When
proportional variance is present, a simple solution is to
transform results from the original scale to a log scale.
Proportional variance on the original scale is stabilized to
constant variance by transforming to the log scale. The
choice of natural or base 10 log scale does not matter,
but one or the other should be used consistently. It is
worth noting that significant data are required to make
transformation a justifiable approach. If there is any doubt
about there being sufficient data, transformation is better
avoided and a statistician should be consulted.
The control charts below illustrate the importance of
finding the appropriate scale for results before identifying
special causes of variation or estimating capability. In
the chart on the left, log-normally distributed data are
treated assuming they are actually normally distributed.
The results are not symmetrically distributed within the
control limits, and there are several results outside the
upper control limit.
These signals would require a response from the process
owners in CPV. In the chart on the right, the same results
are transformed to the log scale. The log transformation
expands the scale at the lower end of the range, and
compresses the scale at the upper end of the range. Now
the results are more symmetric within the limits, and
no results exceed either upper or lower control limits.
Capability indices are best calculated on the transformed
data, using specifications, mean, and sigma in the
transformed scale.
In many situations, the average of a data set is expected
to remain fairly constant over time. However, there are
circumstances when the mean is expected to change
over time, based on process knowledge and experience.
When this is the case, additional tools may be used to
monitor for departures from the expected behavior. These
include “tool wear charts” and other similar charts based
on monitoring the residual result (actual – predicted by a
model). These tools will not be expanded upon further in
this document.
To summarize the recommendations for trending and
evaluating data:
• Start simply – always plot the data;
• Use long-term estimates of sigma for most situations,
both to set the control limits, and to evaluate process
capability (Ppk);
• For some special cases when standard control charts
are not providing satisfactory assessments, consult a
statistician and other process experts. These special
cases include:
– Results with low resolution (few distinct values are
possible within the specification range);
– The original scale does not provide normally
distributed data, and a scale transformation may
be needed;
– EWMA charts or CUSUM charts may be preferred
when it is important to detect relatively small shifts
in data with high variation [14, Chapter 9];
– Statistical methods may not produce meaningful
estimates, for example when a very small number
of results are available, so technically justified
limits must be used either initially or permanently.
An algorithm can be used to support the selection of
control charts (Figure 12.4.2).
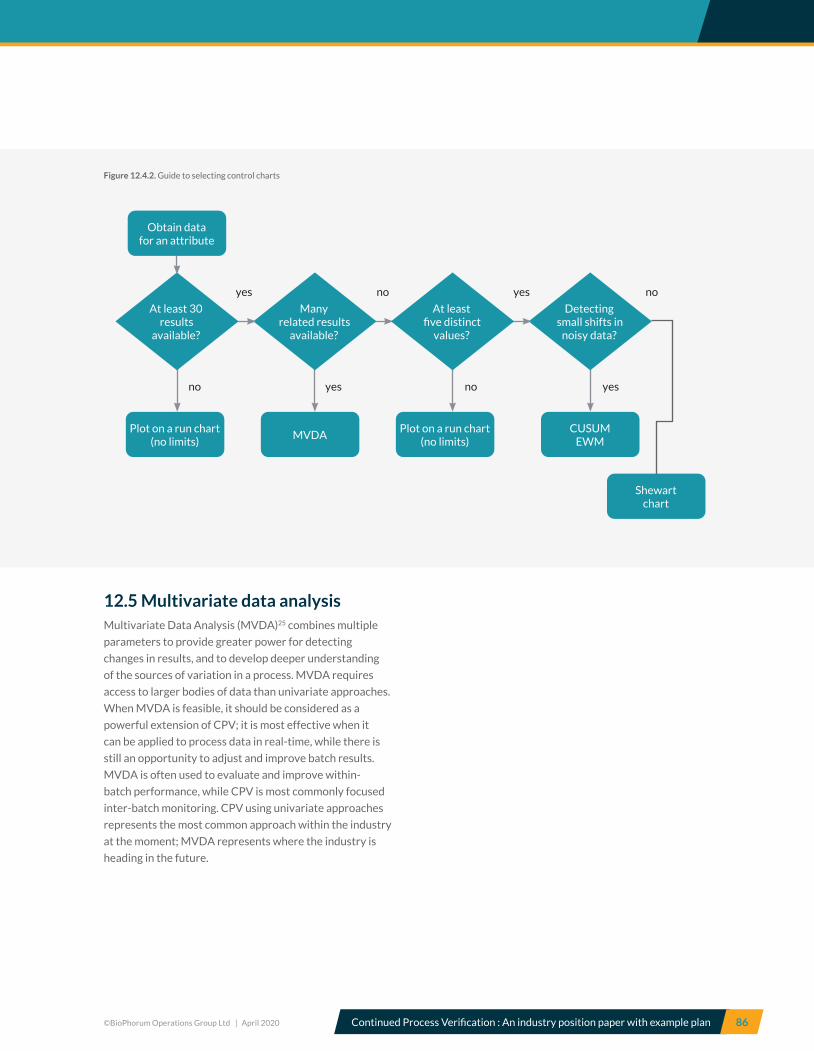
©BioPhorum Operations Group Ltd | April 2020 Continued Process Verification : An industry position paper with example plan 86
Figure 12.4.2. Guide to selecting control charts
12.5 Multivariate data analysisMultivariate Data Analysis (MVDA)25 combines multiple
parameters to provide greater power for detecting
changes in results, and to develop deeper understanding
of the sources of variation in a process. MVDA requires
access to larger bodies of data than univariate approaches.
When MVDA is feasible, it should be considered as a
powerful extension of CPV; it is most effective when it
can be applied to process data in real-time, while there is
still an opportunity to adjust and improve batch results.
MVDA is often used to evaluate and improve within-
batch performance, while CPV is most commonly focused
inter-batch monitoring. CPV using univariate approaches
represents the most common approach within the industry
at the moment; MVDA represents where the industry is
heading in the future.
Plot on a run chart (no limits)
Plot on a run chart (no limits)
MVDACUSUM
EWM
Detecting small shifts in
noisy data?
Many related results
available?
At least five distinct
values?
At least 30 results
available?
Obtain datafor an attribute
Shewartchart
yes no yes no
no yes no yes

©BioPhorum Operations Group Ltd | April 2020 Continued Process Verification : An industry position paper with example plan 87
12.6 Responses to shifts and trendsCPV is only one part of an overall CS. It is envisaged to
function at a supervisory level and is not typically tied
directly to lot release. There are other basal level control
elements such as alarms and alerts, in-process testing and
release analytics that are designed to be more immediate
controls of product quality. Any result that is Out Of
Specification (OOS) should be investigated under existing
Quality procedures for handling deviations.
CPV is intended to serve as an ‘early warning system’
where process drift can be detected before it can cause an
OOS or failure that could otherwise have product quality
impact. Thus, responses to shifts and trends discovered
during CPV typically include those that remain within
specifications. Investigations or other activities may be
triggered to identify the root cause of the process and/
or quality shift or perturbation; however, closure of the
investigation triggered in this way, is not typically tied to
lot release; unless an ‘out-of-specification’ (OOS) situation
has also occurred.
Shifts and trends that remain within specifications should
be evaluated by trained personnel who are most familiar
with the process and assay; typically floor support
engineers and laboratory scientists. The response to the
shift or trend may be determined by the local engineering
or technology function, with consultation from the
quality, operations, and statistical functions. These
investigations form part of the CPV Plan and in most
cases, a formal quality investigation/deviation will not
be required, as an OOS situation will not normally have
occurred alongside a CPV trend.
A typical path for root cause analysis in response to a
signal includes:
• Establish that the results are valid;
• Check for any indications of inconsistency,
e.g. within a laboratory, during the timeframe
the result was obtained;
• Evaluate any other attributes that typically
correlate with the result, to determine if all
attributes trended together as expected, or if
the particular result was exceptional;
• Walk the process upstream from the sample
point, and collect process performance
data to understand any unusual patterns in
process operations during the timeframe the
result was obtained.
The explanation of within-specification shifts and trends
should be documented in the routine CPV Report. If the
reason for a shift or trend cannot be identified during
CPV, it may be escalated to the status of an official quality
deviation, for further investigation. It may be advantageous
to define a ‘tiered’, risk-based approach linked to anticipated
actions when a shift or trend is observed. This approach
could be developed over time.
©BioPhorum Operations Group Ltd | April 2020 Continued Process Verification : An industry position paper with example plan 88
12.7 Establishing initial limitsNote: Establishing initial control limits and the choice of
analysis tools is also discussed in Sections 9 and 10. This section
provides further thoughts on their application to CPV, given the
importance of establishing them as part of a CPV Plan.
In general, statistical control limits should be set at the
centerline plus and minus 3 sigma (standard deviation).
Sigma may be estimated from short-term variation [13,
Chapter 11] or long-term variation, using the formula for
standard deviation.
Long-term variation is preferred for two reasons. The
most important is that long-term sigma includes all the
sources of variation that are expected to be inherent to
the process. This provides more realistic control limits,
which will be better able to distinguish between expected
and unusual instances of variation in results. The second
reason is that during initial production, when fewer than
30 results are available for calculating sigma, the long-
term estimate stabilizes more quickly than the short-term
estimate. For independent, normally distributed results,
the long-term and short-term formulas for sigma will
provide very similar values.
During initial production or after a process change, when
fewer than 30 results are available to estimate sigma, it
is recommended that limits are set, based on technical
knowledge of the process. If statistical approaches must be
used to set initial limits, use the long-term sigma formula.
Set temporary limits to be updated once 30 or more results
are available. If longer-term sources of variation occur
over extended timeframes, more than 30 results may be
needed to capture typical long-term variation within sigma
and the control limit values.
12.8 Establishing long-term limitsOnce sufficient process history is established, long-term
control limits should be established against which the
performance of the process can be assessed. Long-term
control limits are sometimes said to be ‘fixed’ meaning
they should not be changed without a sound, recorded
justification. Fixed limits should be based on a minimum
of 30 batches, and should reflect all expected sources
of variation. If there are potential sources of significant
longer term variation, such as a change of raw material lot,
it is important to gather data over a sufficient time period
to account for that variation.
Initial OOS results which are determined to be invalid
may be excluded when setting limits. Examples of invalid
results may include laboratory errors. Such data points
should be excluded from sigma calculations and charts.
However, if the root cause is unknown or representative
of the process or testing method, the data points should be
retained in the sigma calculation and chart.
When a process change or improvement shifts the mean
or changes the variability, control limits should be re-set
based on a minimum of 30 results following the change.

©BioPhorum Operations Group Ltd | April 2020 Continued Process Verification : An industry position paper with example plan 89
12.9 Finding signals of special cause variationAdditional rules may be applied to a control chart to
increase the sensitivity of detecting shifts and trends
that may remain within the control limits. The Western
Electric15 and Nelson16 rules are implemented in
commercially available SPC software. Note that these
tests were designed on the assumptions of independent
successive results (no autocorrelation) and a normal
distribution. The possibility of false alarms may rise
dramatically when either of these assumptions is violated.
Low-resolution data in particular will generate many false
alarms, and the rules should not be applied for data not
meeting these assumptions. Also, the number of rules
applied should be limited, at least in the initial phase of
CPV, since the probability of false alarms increases with
each additional test applied.
Low resolution results occur frequently in regulated
processes, often because results have been rounded
before they are charted. Whenever possible, use the
unrounded result for SPC charting and estimation of
sigma. It is recommended that the validation procedure
and history of measuring systems is checked for
repeatability and reproducibility. Such data helps
decide whether rounding is appropriate and to what
extent. If in doubt, a statistician should be consulted.
When low resolution data is to be evaluated, the
recommended approach is to plot the data on a run
chart in time order, but avoid setting statistical control
limits. Limits may be set using technical judgment and
process experience17, 18.

©BioPhorum Operations Group Ltd | April 2020 Continued Process Verification : An industry position paper with example plan 90
13.0
Change management Good change management is critical to getting the greatest possible benefits from a CPV system. Some important general principles of change management are presented here, along with some more specific scenarios related to CPV observations.
Change management is complementary to effective
CPV. Product and process-related changes may impact
the CPV plan (including any CPV limits document that
might exist separately from the plan), and the RA and CS
documents that form the basis for the CPV plan. Changes
to these controlled documents should proceed per the
company’s normal change control procedures, which should
include the description, rationale and justification for all
significant changes. Changes that do not impact monitored
parameters, sampling points or control limits do not require
revision of the CPV plan; however the change control
should consider whether evaluation of normal process
variability for a particular parameter should start again at
the initial CPV phase for analysis. After noting in the change
control documentation, this may be noted in the next CPV
analysis / report.
Process changes or experience with special or common
cause variation may require investigations and a revision
of the CPV execution plan during the lifetime of a process.
Adjustments to the frequency of periodic monitoring, or
a return to collecting baseline data before setting (or re-
setting) future long-term control limits may be necessary
to manage control of changes to reduce variability or
achieve an improved outcome. A deviation which leads
to a corrective or preventative action to begin monitoring
a new variable trend not previously monitored, or to re-
activate monitoring a trend discontinued for CPV may also
need to be added to the plan.
Changes to the control strategy need to consider the
potential impact to the current status of the CPV plan.
Facility, process, equipment, field measurements, or
analytical laboratory method changes (examples of normal
change controls) require a review of the CS, any related
risk assessments, and the current monitoring plan for
the steps being changed as well as the downstream steps
that have linked parameters or attributes. If a process
variable is re-classified in the CS based on new process
understanding, changes to the CPV monitoring plan
may also be needed and any impact to registered details
of regulatory licenses need to be addressed. Below, a
decision flow outlines a process for managing changes
needed due to ongoing CPV monitoring (Figure 10.13).
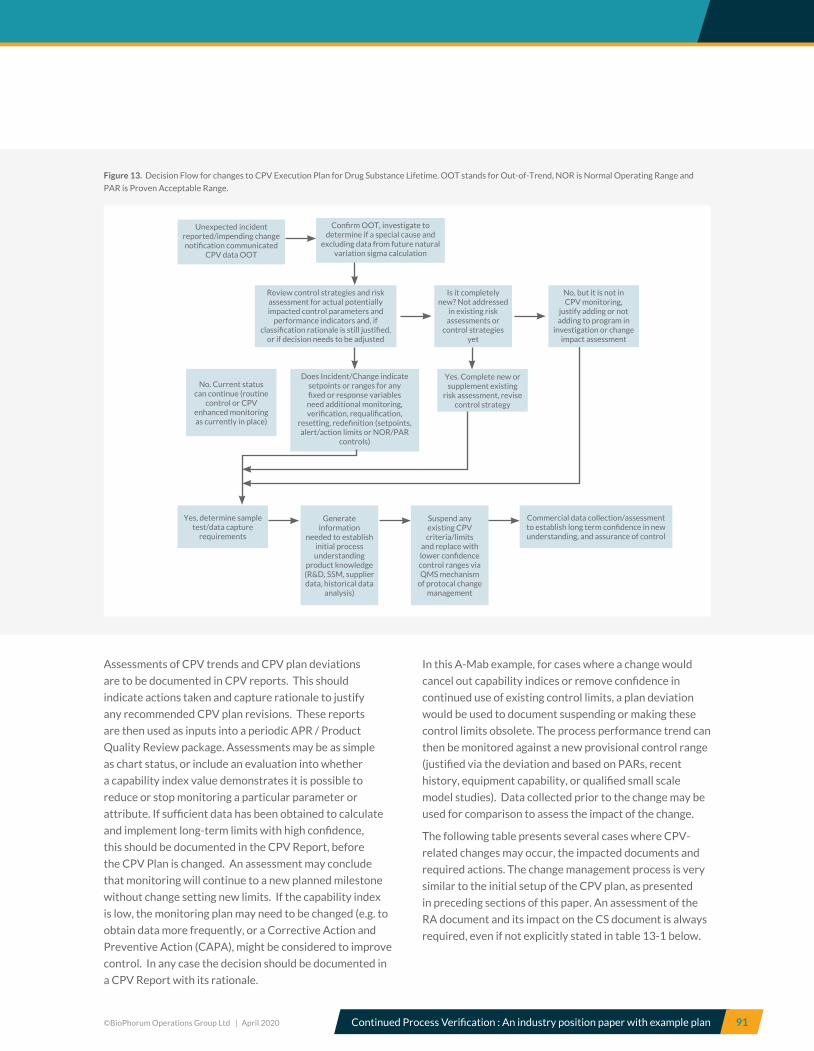
©BioPhorum Operations Group Ltd | April 2020 Continued Process Verification : An industry position paper with example plan 91
Figure 13. Decision Flow for changes to CPV Execution Plan for Drug Substance Lifetime. OOT stands for Out-of-Trend, NOR is Normal Operating Range and
PAR is Proven Acceptable Range.
Assessments of CPV trends and CPV plan deviations
are to be documented in CPV reports. This should
indicate actions taken and capture rationale to justify
any recommended CPV plan revisions. These reports
are then used as inputs into a periodic APR / Product
Quality Review package. Assessments may be as simple
as chart status, or include an evaluation into whether
a capability index value demonstrates it is possible to
reduce or stop monitoring a particular parameter or
attribute. If sufficient data has been obtained to calculate
and implement long-term limits with high confidence,
this should be documented in the CPV Report, before
the CPV Plan is changed. An assessment may conclude
that monitoring will continue to a new planned milestone
without change setting new limits. If the capability index
is low, the monitoring plan may need to be changed (e.g. to
obtain data more frequently, or a Corrective Action and
Preventive Action (CAPA), might be considered to improve
control. In any case the decision should be documented in
a CPV Report with its rationale.
In this A-Mab example, for cases where a change would
cancel out capability indices or remove confidence in
continued use of existing control limits, a plan deviation
would be used to document suspending or making these
control limits obsolete. The process performance trend can
then be monitored against a new provisional control range
(justified via the deviation and based on PARs, recent
history, equipment capability, or qualified small scale
model studies). Data collected prior to the change may be
used for comparison to assess the impact of the change.
The following table presents several cases where CPV-
related changes may occur, the impacted documents and
required actions. The change management process is very
similar to the initial setup of the CPV plan, as presented
in preceding sections of this paper. An assessment of the
RA document and its impact on the CS document is always
required, even if not explicitly stated in table 13-1 below.
Unexpected incident reported/impending changenotification communicated
CPV data OOT
Confirm OOT, investigate to determine if a special cause and
excluding data from future natural variation sigma calculation
Review control strategies and risk assessment for actual potentially impacted control parameters and
performance indicators and, if classification rationale is still justified,
or if decision needs to be adjusted
Does Incident/Change indicate setpoints or ranges for any fixed or response variables need additional monitoring, verification, requalification,
resetting, redefinition (setpoints, alert/action limits or NOR/PAR
controls)
Is it completely new? Not addressed
in existing risk assessments or
control strategies yet
Yes, determine sample test/data capture
requirements
Commercial data collection/assessment to establish long term confidence in new understanding, and assurance of control
No. Current status can continue (routine
control or CPV enhanced monitoring as currently in place)
Suspend any existing CPV criteria/limits
and replace with lower confidence control ranges via QMS mechanism
of protocal change management
Generate information
needed to establish initial process understanding
product knowledge (R&D, SSM, supplier data, historical data
analysis)
Yes. Complete new or supplement existing
risk assessment, revise control strategy
No, but it is not in CPV monitoring,
justify adding or not adding to program in
investigation or change impact assessment

©BioPhorum Operations Group Ltd | April 2020 Continued Process Verification : An industry position paper with example plan 92
Table 13-1. Change Management Examples
Reason for ChangeImpacted
Document(s)Actions
Changes within CPV Plan
Transition from initial control limits to long-term limitsEnough
data available (e.g. n = 30) to establish statistically based
control limits
CPV Plan / Limits
Document
Document (e.g. in a CPV limits document) how statistically based
control limits (CL) were determined. Start routine monitoring with
CL’s and run rules
OOT results (e.g. control limit or run rule violations) due to
newly experienced, but normal, variability (e.g. due to a new
raw material lot)
CPV Limits Document Justify removal of current CPV limits (if applicable), and continue to
collect data until sufficient to recalculate new control limits. During
the extended data collection period, continue to monitor for trends
(e.g. average ± 3 SD), but without run rules.
Shift in mean or a change in variability (e.g. due to a process
improvement)
CPV Limits Document Justify removal of current CPV limits, and reset counter for the
number of runs required to set new control limits for the impacted
attribute / parameter. Continue to monitor for trends (e.g. average
± 3 SD).
Add / Remove control elements based on process knowledge
gained through CPV, e.g. after periodic monitoring. This data
could point to ways to improve the product or optimize the
process. Elements may be deleted (or have reduced sampling
frequency) if their process capability index is high and
variability is well controlled. Elements may be added if a new
source of process variability is discovered.
RA / CS Update to reflect the new knowledge
CPV Plan / Limits
Document
Update. New elements may be monitored (e.g. using average ± 3 SD)
until statistically based control limits can be established (n ≥ 30).
Changes external to CPV Plan
• Add or Remove control elements based on new process
knowledge, e.g. from lab scale studies, CAPA’s, complaints, etc.
• Process changes (e.g. new raw material)
• Change or add manufacturing site
• New equipment (excluding like-for-like changes)
PPQ Perform PPQ run(s) if deemed necessary (consult with QA and
Regulatory Affairs).
RA/ CS See “Add/Remove control elements” above
CPV Plan / Limits
Document
See “Add/Remove control elements” above
New or changed analytical capabilities RA/ CS Only if impacted

©BioPhorum Operations Group Ltd | April 2020 Continued Process Verification : An industry position paper with example plan 93
14.0
Data verificationThis section describes in general the types of data sources in a CPV reporting system. It goes on to make recommendations as to how data in these systems should be verified and hence how the systems should be validated.
Three major sources of data are used for CPV:
1. Process data e.g. viable cell concentration in the
bioreactor26, offline pH / conductivity measurements
or process volumes which are recorded in either
paper or electronic BRcs.
2. Analytical data generated in QC laboratories which
are typically recorded in a LIMS or Data Historian.
3. Data recorded by inline instruments e.g. pH of
bioreactor, or buffer flow rates for chromatography
operations. These data are archived and managed
by the data historian component of the plant control
system. Examples of data archival systems include
Plant Information (PI_System) by OSISoft and
InfoPlus 21 by Aspentech.
Data recorded on paper-based systems require
transcribing into a secure electronic archiving system (e.g.
a database) so that it can be retrieved in the future for
data analysis, control charting and CPV. The manual data
entry process is prone to human error. Several options
are available to ensure data integrity during the data
transcription process. These are described below.
1. Blinded data entry: Data are independently entered
into the data archival system by two different
operators. The data archival system prompts the
operators if there is a discrepancy noted between
the two separate entries for a process parameter or
attribute so corrections can be made. However there
is a remote possibility that both data entry operators
can make the same mistake.
2. Single data entry and independent verification: The
data are entered from the original data source by
one operator and independently verified by a second
operator using the source documents. This process
is used in many companies, but cannot completely
eliminate errors because the data verifier may not
always catch all data entry errors.
3. SMART Data entry / Error proofing: for a parameter
or attribute being transcribed, the data archival
system can limit the allowable values that can be
entered, thus any errors can be readily pointed out
and corrections can be made, for example:
• Offline pH measurements can be restricted to
values from 0.0 to 14.0;
• Viable cell concentration data can be restricted
to the expected range of values26.
Alternatively, the data archival system can generate a
report of observed minimum and maximum values for
a process parameter or attribute. Any discrepant result
outside of the normally observed range can be readily
detected.
While a SMART Data entry system can detect some errors,
it is also not foolproof. Suppose the observed values for
chromatography step yield vary from 50.2 to 80.4 %. For
a particular batch, if the yield recorded in the source BRc
is 62.6%; this could be wrongly entered as 66.2% which
would still fall within the expected observed values and
may remain undetected.

©BioPhorum Operations Group Ltd | April 2020 Continued Process Verification : An industry position paper with example plan 94
In summary, there are hidden sources of error in
transcribing data from paper to electronic data archival
systems. It is important to recognize that verification
is critical for some parameters (e.g. CPPs) but may not
be necessary for other process parameters. Therefore
verification depends on purpose and criticality of the
parameter being measured. The intention should to reduce
data entry errors to zero. This may require continuous
improvement and it is important to know the extent to
which any error impacts the process parameter.
Transcribing data from electronic sources e.g. electronic
BRcs or plant information into data archival systems, is
not likely to introduce errors provided the data transfer
system is designed robustly and the ability to transfer
data is validated. For either paper or electronic sources,
the ability to retrieve data from the data archival system
should undergo an initial validation. Similarly if the
data from the data archival system is used routinely
for generating control charts or data tables for process
monitoring and CPV, the procedure for generating
control charts or data tables should be validated or as
recommended in section 12 of this document, established
software should be used. A number of software suppliers
will provide a quality statements regarding the validation
of their statistical software [e.g. 19, 20, 21].
Whether the source data are from paper systems
or electronic systems, a record should be kept (and
continually updated) of the BRc step number or the Tag
ID for electronic sources. It is recommended (although
not an absolute requirement) for the data archival system
to have the ability to record data entry operator ID /
time stamp, any corrections made; i.e. an audit trail of all
entries and changes.
Finally it would be good practice for any process
parameter or quality attribute observed to be out of
controllable range (trend) or for observed shifts and
trends to be independently verified by re-examining the
source data.
Thus in conclusion, it is recommended that robust systems
and procedures are designed and developed in order to
archive data and validate the accuracy of data retrieval in
order to minimize errors during CPV. It is of course, the
responsibility of each individual organization to apply the
recommendations in this section as they see fit.

Continued Process Verification : An industry position paper with example plan©BioPhorum Operations Group Ltd | April 2020 95
15.0
Discretionary elements of a CPV program
The Table below shows some elements that may be included within a CPV program based upon the needs and decisions of the individual operating company. The following elements are not considered mandatory for inclusion in CPV, but may provide the operating company with information valuable to the manufacturing of drug substances.
Element Description
Operational or Performance Elements Process performance attributes (i.e., bioreactor titer, column elution volumes) or input parameters linked
to process performance attributes.
Multivariate Data Analysis MVDA, particularly Partial least squares (PLS) regression or Principal component analysis (PCA) may be
useful to identify latent variables within the CPV data set and increase an understanding of the design
space of the drug substance manufacturing process.
Column/Resin/UF Membrane Cleaning and
Performance Lifetime Verification
The full scale verification of column and/or ultra-filtration membrane cleaning and performance, out to
established lifetime limits, may be included within the scope of the operating company’s CPV program.
Table 15.1. Discretionary Elements of CPV
Continued Process Verification : An industry position paper with example plan©BioPhorum Operations Group Ltd | April 2020 96
1 Technical Report No. 60. Process Validation: A Lifecycle Approach. PDA, Inc. 2013
2 ISPE PQLI Guidance Series Part 4
3 A-Mab: A case study in Bioprocess Development. CMC Biotech Working Group. 2009
4 FDA Code of Federal Regulations 21 Part 211, Jan. 2013
5 Process Validation: General Principles and Practices, guidance for industry, FDA (CDER, CBER, and CVM), January 2011
6 A-Mab study; Pharmaceutical Quality by Design: Product and Process Development, Understanding, and Control; By Lawrence X. Yu,
Ph. D.; Director for Science; Office of Generic Drugs; Food and Drug Administration
7 ICH Q8 Pharmaceutical Development: http://www.ich.org/fileadmin/Public_Web_Site/ICH_Products/Guidelines/Quality/
Q8_R1/Step4/Q8_R2_Guideline.pdf
8 ICH Q9 Quality Risk Management: http://www.ema.europa.eu/docs/en_GB/document_library/Scientific_guideline/2009/09/
WC500002873.pdf
9 ICH Q10 Pharmaceutical Quality System: http://www.ema.europa.eu/docs/en_GB/document_library/Scientific_
guideline/2009/09/WC500002871.pdf
10 Technical Report No. 15. Validation of Tangential Flow Filtration in Biopharmaceutical applications. PDA, Inc. 2009
11 Technical Report No. 14. Validation of column-based chromatography processes for purification of proteins. PDA, Inc. 2008
12 Biopharmaceutical Manufacturing Facilities- Volume 6. ISPE Baseline Pharmaceutical Engineering Guide. June 2004
13 Pena-Rodriguez, ME. Statistical Process Control for the FDA-Regulated Industry, 2013. ASQ Press: Milwaukee, WI
14 Montgomery DC. Introduction to Statistical Quality Control, 2013. 7th edition, Wiley: Hoboken, NJ
15 Western Electric. Statistical Quality Control Handbook 1956, Western Electric Corporation, Indianapolis, IN
16 Nelson, LS. The Shewhart Control Chart – Tests for Special Causes, Journal of Quality Technology 1984; 16: 237-239
17 Woodall, WH. Controversies and Contradictions in Statistical Process Control, Journal of Quality Technology 2000; 32: 341-350
18 Limpert, E, Stahel, WA, Abbt, M, Log-normal Distributions across the Sciences: Keys and Clues. BioScience 2001; Vol. 51 No. 5
19 www.jmp.com/software/qualitystatement.shtml
20 www.minitab.com/en-US/support/documentation/software-validation.aspx?langType=1033
21 www.statsoft.com/services/validation-services/
22 ICH Q11 Development and Manufacture of drug substances (Chemical Entities and Biotechnological/Biological Entities)
23 http://www.ema.europa.eu/docs/en_GB/document_library/Other/2013/08/WC500148215.pdf
24 ISPE Discussion Paper: Applying Continued Process Verification Expectations to New and Existing Products”, D. Bika, P.
Butterell, J. Walsh, K. Epp and J. Barrick, 2012. https://www.google.com/url?sa=t&rct=j&q=&esrc=s&frm=1&source=w
eb&cd=1&cad=rja&ved=0CCkQFjAA&url=https%3A%2F%2Fwww.ispe.org%2Fdiscussion-papers%2Fstage-3-process-
validation.pdf&ei=FIEXU8z1Gurx0wGftoGIBg&usg=AFQjCNFvOl1WjtGX-vPHZjFsPq8n44cI3Q&sig2=QzSLW0X3-
cQvbUnwYDGYDA&bvm=bv.62286460,d.dmQ
25 Guidance for Industry Analytical Procedures and Methods Validation for Drugs and Biologics, Draft, February 2014 http://www.fda.
gov/downloads/Drugs/GuidanceComplianceRegulatoryInformation/Guidances/UCM386366.pdf
26 European Pharmacopoeia, 2.7.29. Nucleated cell count and viability, p233
References
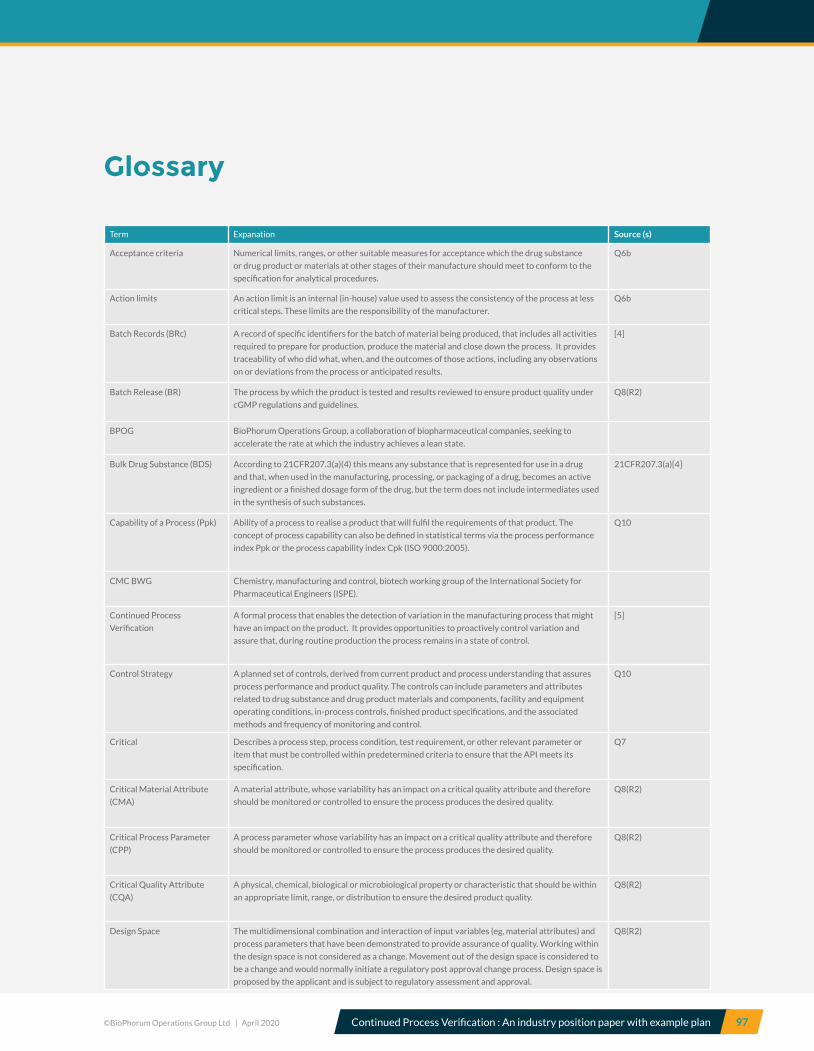
Continued Process Verification : An industry position paper with example plan©BioPhorum Operations Group Ltd | April 2020 97
Term Expanation Source (s)
Acceptance criteria Numerical limits, ranges, or other suitable measures for acceptance which the drug substance
or drug product or materials at other stages of their manufacture should meet to conform to the
specification for analytical procedures.
Q6b
Action limits An action limit is an internal (in-house) value used to assess the consistency of the process at less
critical steps. These limits are the responsibility of the manufacturer.
Q6b
Batch Records (BRc) A record of specific identifiers for the batch of material being produced, that includes all activities
required to prepare for production, produce the material and close down the process. It provides
traceability of who did what, when, and the outcomes of those actions, including any observations
on or deviations from the process or anticipated results.
[4]
Batch Release (BR) The process by which the product is tested and results reviewed to ensure product quality under
cGMP regulations and guidelines.
Q8(R2)
BPOG BioPhorum Operations Group, a collaboration of biopharmaceutical companies, seeking to
accelerate the rate at which the industry achieves a lean state.
Bulk Drug Substance (BDS) According to 21CFR207.3(a)(4) this means any substance that is represented for use in a drug
and that, when used in the manufacturing, processing, or packaging of a drug, becomes an active
ingredient or a finished dosage form of the drug, but the term does not include intermediates used
in the synthesis of such substances.
21CFR207.3(a)[4]
Capability of a Process (Ppk) Ability of a process to realise a product that will fulfil the requirements of that product. The
concept of process capability can also be defined in statistical terms via the process performance
index Ppk or the process capability index Cpk (ISO 9000:2005).
Q10
CMC BWG Chemistry, manufacturing and control, biotech working group of the International Society for
Pharmaceutical Engineers (ISPE).
Continued Process
Verification
A formal process that enables the detection of variation in the manufacturing process that might
have an impact on the product. It provides opportunities to proactively control variation and
assure that, during routine production the process remains in a state of control.
[5]
Control Strategy A planned set of controls, derived from current product and process understanding that assures
process performance and product quality. The controls can include parameters and attributes
related to drug substance and drug product materials and components, facility and equipment
operating conditions, in-process controls, finished product specifications, and the associated
methods and frequency of monitoring and control.
Q10
Critical Describes a process step, process condition, test requirement, or other relevant parameter or
item that must be controlled within predetermined criteria to ensure that the API meets its
specification.
Q7
Critical Material Attribute
(CMA)
A material attribute, whose variability has an impact on a critical quality attribute and therefore
should be monitored or controlled to ensure the process produces the desired quality.
Q8(R2)
Critical Process Parameter
(CPP)
A process parameter whose variability has an impact on a critical quality attribute and therefore
should be monitored or controlled to ensure the process produces the desired quality.
Q8(R2)
Critical Quality Attribute
(CQA)
A physical, chemical, biological or microbiological property or characteristic that should be within
an appropriate limit, range, or distribution to ensure the desired product quality.
Q8(R2)
Design Space The multidimensional combination and interaction of input variables (eg, material attributes) and
process parameters that have been demonstrated to provide assurance of quality. Working within
the design space is not considered as a change. Movement out of the design space is considered to
be a change and would normally initiate a regulatory post approval change process. Design space is
proposed by the applicant and is subject to regulatory assessment and approval.
Q8(R2)
Glossary

Continued Process Verification : An industry position paper with example plan©BioPhorum Operations Group Ltd | April 2020 98
Term Expanation Source (s)
Detect-ability The ability to discover or determine the existence, presence, or fact of a hazard. Detect-ability is a
component of a Failure Modes Effects Analysis (FMEA).
Q9
Drug product (Dosage form;
Finished product)
A pharmaceutical product type that contains a drug substance, generally in association
with excipients. Drug substance (Bulk material): The drug substance is the material which is
subsequently formulated with excipients to produce the drug product. It can be composed of the
desired product, product-related substances, and product- and process-related impurities. It may
also contain excipients and other components, such as buffers.
Q6b
Failure Modes Effects
Analysis (FMEA)
One of the first systematic techniques for failure analysis. It was developed by reliability engineers
in the 1950s to study problems that might arise from malfunctions of military systems. A FMEA
is often the first step of a system reliability study. It involves reviewing as many components,
assemblies, and subsystems as possible to identify failure modes, and their causes and effects.
For each component, the failure modes and their resulting effects on the rest of the system are
recorded in a specific FMEA worksheet. There are numerous variations of such worksheets.
Q8, IEC 60812 Analysis
techniques for system
reliability—Procedure
for failure mode and
effects analysis (FMEA).
General process parameter
(GPP)
An adjustable parameter (variable) of the process that does not have a critical effect on product
quality or process performance. Ranges for GPPs are established during process development, and
changes to operating ranges will be managed within the quality system.
CMC-BWG
Impurity Any component present in the drug substance or drug product that is not the desired product, a
product-related substance, or an excipient (including added buffer components). It may be either
process- or product-related.
Q6b
In-process quality attributes
(IPQA)
Parameters used in the A-Mab Case Study model of a control strategy, to provide a link between
KPPs and KPAs
[3]
In-Process Control also called
Process Control
Checks performed during production in order to monitor and if necessary to adjust the process
and/or to ensure that the intermediate or API conforms to its specifications.
Q7
In-process test In-process inspection and testing should be performed by monitoring the process or by actual
sample analysis at defined locations and times. The results should conform to established process
parameters or acceptable tolerances. Work instructions should delineate the procedure to follow
and how to use the inspection and test data to control the process.
WHO Portal
http://apps.who.
int/medicinedocs
/en/d/Jh1792e/
20.7.3.3.html
In-process tests Tests which may be performed during the manufacture of either the drug substance or drug
product, rather than as part of the formal battery of tests which are conducted prior to release.
Q6a
Intermediate For biotechnological/ biological products, a material produced during a manufacturing process
that is not the drug substance or the drug product but for which manufacture is critical to the
successful production of the drug substance or the drug product. Generally, an intermediate will
be quantifiable and specifications will be established to determine the successful completion of
the manufacturing step before continuation of the manufacturing process. This includes material
that may undergo further molecular modification or be held for an extended period before further
processing.
Q5c
Key Process Attribute (KPA) An important attribute or output measure of the process used in this paper to maintain consistency
with the language used in the A-MaB case study. N.B. It is important not to confuse a KPA, which is
a measure of process consistency with measures of quality such as CQAs.
N.B. at the time of writing, the European Medicines Agency (EMA) draft guidance on Process
Validation is out for consultation, referring to KPAs as 'performance indicators'.
A-MaB Case Study [3]
Key Process Parameter (KPP) An adjustable parameter (variable) of the process that, when maintained within a narrow range,
ensures optimum process performance. A key process parameter does not meaningfully affect
critical product quality attributes. Ranges for KPPs are established during process development,
and changes to operating ranges will be managed within the quality system. N.B. this category of
parameter is not recognised by the FDA or the EMA for use in formal submissions and reports,
though they do not oppose its use internally. The agencies see all parameters that may have an
impact on CQAs as Critical and hence CPPs [23].
CMC BWG
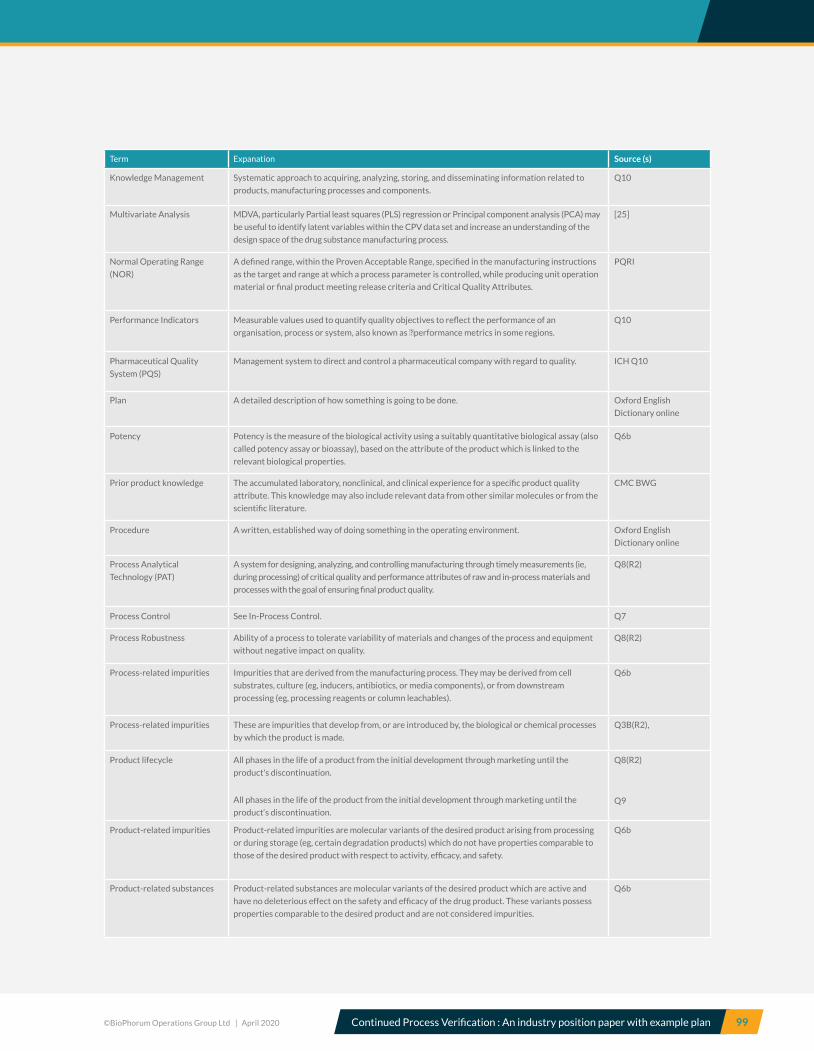
Continued Process Verification : An industry position paper with example plan©BioPhorum Operations Group Ltd | April 2020 99
Term Expanation Source (s)
Knowledge Management Systematic approach to acquiring, analyzing, storing, and disseminating information related to
products, manufacturing processes and components.
Q10
Multivariate Analysis MDVA, particularly Partial least squares (PLS) regression or Principal component analysis (PCA) may
be useful to identify latent variables within the CPV data set and increase an understanding of the
design space of the drug substance manufacturing process.
[25]
Normal Operating Range
(NOR)
A defined range, within the Proven Acceptable Range, specified in the manufacturing instructions
as the target and range at which a process parameter is controlled, while producing unit operation
material or final product meeting release criteria and Critical Quality Attributes.
PQRI
Performance Indicators Measurable values used to quantify quality objectives to reflect the performance of an
organisation, process or system, also known as ―performance metrics in some regions.
Q10
Pharmaceutical Quality
System (PQS)
Management system to direct and control a pharmaceutical company with regard to quality. ICH Q10
Plan A detailed description of how something is going to be done. Oxford English
Dictionary online
Potency Potency is the measure of the biological activity using a suitably quantitative biological assay (also
called potency assay or bioassay), based on the attribute of the product which is linked to the
relevant biological properties.
Q6b
Prior product knowledge The accumulated laboratory, nonclinical, and clinical experience for a specific product quality
attribute. This knowledge may also include relevant data from other similar molecules or from the
scientific literature.
CMC BWG
Procedure A written, established way of doing something in the operating environment. Oxford English
Dictionary online
Process Analytical
Technology (PAT)
A system for designing, analyzing, and controlling manufacturing through timely measurements (ie,
during processing) of critical quality and performance attributes of raw and in-process materials and
processes with the goal of ensuring final product quality.
Q8(R2)
Process Control See In-Process Control. Q7
Process Robustness Ability of a process to tolerate variability of materials and changes of the process and equipment
without negative impact on quality.
Q8(R2)
Process-related impurities Impurities that are derived from the manufacturing process. They may be derived from cell
substrates, culture (eg, inducers, antibiotics, or media components), or from downstream
processing (eg, processing reagents or column leachables).
Q6b
Process-related impurities These are impurities that develop from, or are introduced by, the biological or chemical processes
by which the product is made.
Q3B(R2),
Product lifecycle All phases in the life of a product from the initial development through marketing until the
product's discontinuation.
All phases in the life of the product from the initial development through marketing until the
product‘s discontinuation.
Q8(R2)
Q9
Product-related impurities Product-related impurities are molecular variants of the desired product arising from processing
or during storage (eg, certain degradation products) which do not have properties comparable to
those of the desired product with respect to activity, efficacy, and safety.
Q6b
Product-related substances Product-related substances are molecular variants of the desired product which are active and
have no deleterious effect on the safety and efficacy of the drug product. These variants possess
properties comparable to the desired product and are not considered impurities.
Q6b

Continued Process Verification : An industry position paper with example plan©BioPhorum Operations Group Ltd | April 2020 100
Term Expanation Source (s)
Protocol Method for carrying out an experiment and/or creating an official record of scientific or
experimental observations. Written GMP Protocols define prospectively the conditions which will
be tested, sample testing plan, and acceptance criteria for results.
Oxford English
Dictionary online
Proven Acceptable Range A characterized range of a process parameter for which operation within this range, while keeping
other parameters constant, will result in producing a material meeting relevant quality criteria.
Q8(R2)
Quality The degree to which a set of inherent properties of a product, system or process fulfils
requirements.
Q9
Quality Attribute (QA) A molecular or product characteristic that is selected for its ability to help indicate the quality
of the product. Collectively, the quality attributes define the adventitious agent safety, purity,
potency, identity, and stability of the product. Specifications measure a selected subset of the
quality attributes.
Q5e
Quality by Design A systematic approach to development that begins with predefined objectives and emphasizes
product and process understanding and process control, based on sound science and quality risk
management.
Q8(R2)
Quality Control (QC) Checking or testing, that specifications are met. Q7
Quality Target Product Profile
(QTPP)
A prospective summary of the quality characteristics of a drug product that ideally will be achieved
to ensure the desired quality, taking into account safety and efficacy of the drug product.
Q8 (R2)
Quality risk management A systematic process for the assessment, control, communication, and review of risks to the quality
of the drug product across the product lifecycle.
Q9
Raw material Raw material is a collective name for substances or components used in the manufacture of the
drug substance or drug product.
Q6b
Reference standards/
materials
In addition to the existing international/national standards, it is usually necessary to create in-
house reference materials.
In-house primary reference material: a primary reference material is an appropriately
characterized material prepared by the manufacturer from a representative lot(s) for the purpose
of biological assay and physicochemical testing of subsequent lots, and against which in-house
working reference material is calibrated.
Q6b
Risk The combination of the probability of occurrence of harm and the severity of that harm (ISO/IEC
Guide 51).
Q9
Risk analysis The estimation of the risk associated with the identified hazards. Q9
Risk assessment A systematic process of organizing information to support a risk decision to be made within a risk
management process. It consists of the identification of hazards and the analysis and evaluation of
risks associated with exposure to those hazards.
Q9
Risk evaluation The comparison of the estimated risk to given risk criteria using a quantitative or qualitative scale
to determine the significance of the risk.
Q9
Severity A measure of the possible consequences of a hazard, which is a component of a Failure Modes
Effects Analysis (FMEA).
Q9
Specification A specification is a list of tests, references to analytical procedures, and appropriate acceptance
criteria with numerical limits, ranges, or other criteria for the tests described, which establishes
the set of criteria to which a drug substance or drug product or materials at other stages of their
manufacture should conform to be considered acceptable for its intended use.
Q6b
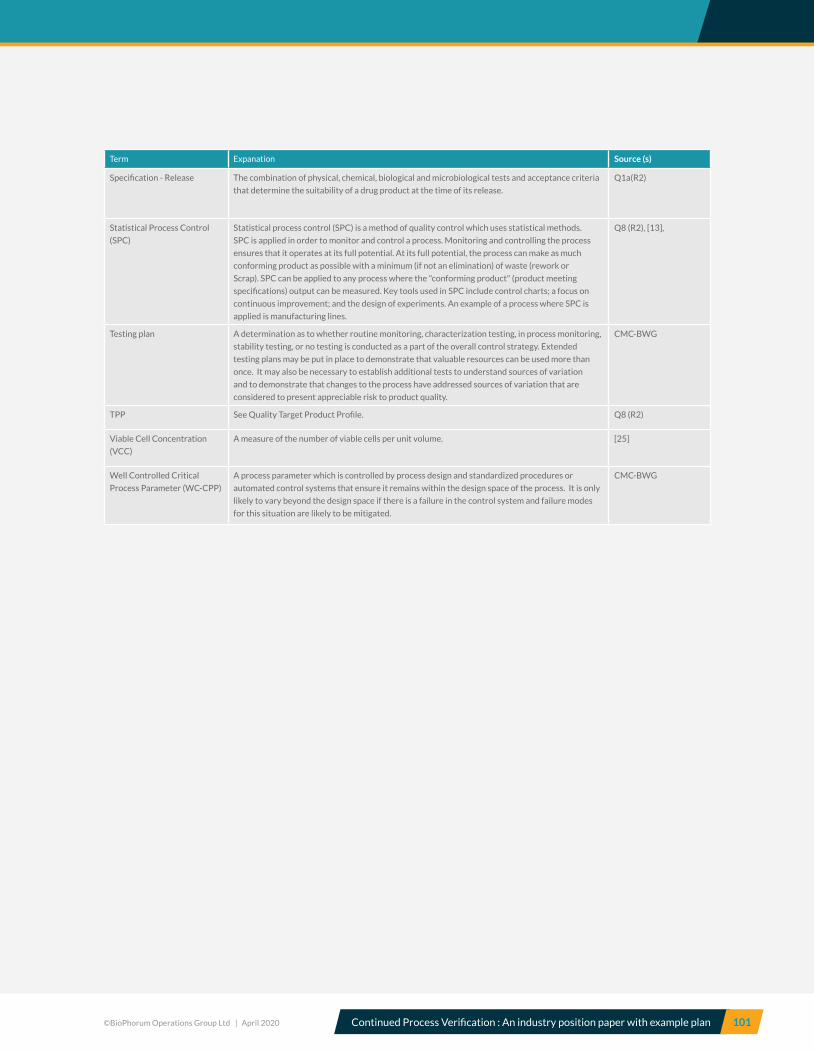
Continued Process Verification : An industry position paper with example plan©BioPhorum Operations Group Ltd | April 2020 101
Term Expanation Source (s)
Specification - Release The combination of physical, chemical, biological and microbiological tests and acceptance criteria
that determine the suitability of a drug product at the time of its release.
Q1a(R2)
Statistical Process Control
(SPC)
Statistical process control (SPC) is a method of quality control which uses statistical methods.
SPC is applied in order to monitor and control a process. Monitoring and controlling the process
ensures that it operates at its full potential. At its full potential, the process can make as much
conforming product as possible with a minimum (if not an elimination) of waste (rework or
Scrap). SPC can be applied to any process where the "conforming product" (product meeting
specifications) output can be measured. Key tools used in SPC include control charts; a focus on
continuous improvement; and the design of experiments. An example of a process where SPC is
applied is manufacturing lines.
Q8 (R2), [13],
Testing plan A determination as to whether routine monitoring, characterization testing, in process monitoring,
stability testing, or no testing is conducted as a part of the overall control strategy. Extended
testing plans may be put in place to demonstrate that valuable resources can be used more than
once. It may also be necessary to establish additional tests to understand sources of variation
and to demonstrate that changes to the process have addressed sources of variation that are
considered to present appreciable risk to product quality.
CMC-BWG
TPP See Quality Target Product Profile. Q8 (R2)
Viable Cell Concentration
(VCC)
A measure of the number of viable cells per unit volume. [25]
Well Controlled Critical
Process Parameter (WC-CPP)
A process parameter which is controlled by process design and standardized procedures or
automated control systems that ensure it remains within the design space of the process. It is only
likely to vary beyond the design space if there is a failure in the control system and failure modes
for this situation are likely to be mitigated.
CMC-BWG

Continued Process Verification : An industry position paper with example plan©BioPhorum Operations Group Ltd | April 2020 102
Permission to useThe contents of this report may be used unaltered as long as the copyright is acknowledged appropriately with correct source citation, as follows “Entity, Author(s), Editor, Title, Location: Year”
DisclaimerThis document represents a consensus view, and as such it does not represent fully the internal policies of the contributing companies.
Neither BioPhorum nor any of the contributing companies accept any liability to any person arising from their use of this document.
The views and opinions contained herein are that of the individual authors and should not be attributed to the authors’ employers.